As filed with the Securities and Exchange Commission on March 6, 2009
UNITED STATES
SECURITIES AND EXCHANGE COMMISSION
Washington, D.C. 20549
FORM N-CSR
CERTIFIED SHAREHOLDER REPORT OF
REGISTERED MANAGEMENT INVESTMENT COMPANIES
Investment Company Act File Number: 811-4255
NEUBERGER BERMAN ADVISERS MANAGEMENT TRUST
(Exact Name of the Registrant as Specified in Charter)
605 Third Avenue, 2nd Floor
New York, New York 10158-0180
(Address of Principal Executive Offices - Zip Code)
Robert Conti, Chief Executive Officer
Neuberger Berman Advisers Management Trust
605 Third Avenue, 2nd Floor
New York, New York 10158-0180
Jeffrey S. Puretz, Esq.
Dechert LLP
1775 I Street, N.W.
Washington, D.C. 20006
(Names and Addresses of agents for service)
Registrant's Telephone Number, including area code: (212) 476-8800
Date of fiscal year end: December 31
Date of reporting period: December 31, 2008
Form N-CSR is to be used by management investment companies to file reports with the Commission not later than 10 days after the transmission to stockholders of any report that is required to be transmitted to stockholders under Rule 30e-1 under the Investment Company Act of 1940 (the "Act") (17 CFR 270.30e-1). The Commission may use the information provided on Form N-CSR in its regulatory, disclosure review, inspection, and policymaking roles.
A registrant is required to disclose the information specified by Form N-CSR, and the Commission will make this information public. A registrant is not required to respond to the collection of information contained in Form N-CSR unless the Form displays a currently valid
Office of Management and Budget ("OMB") control number. Please direct comments concerning the accuracy of the information collection burden estimate and any suggestions for reducing the burden to Secretary, Securities and Exchange Commission, 100 F Street, NE, Washington, DC 20549. The OMB has reviewed this collection of information under the clearance requirements of 44 U.S.C. Section 3507.
ITEM 1. | REPORTS TO SHAREHOLDERS |
| | |
The following are copies of the annual reports transmitted to shareholders pursuant to Rule 30e-1 under the Act.

Neuberger Berman
Advisers Management Trust
Balanced Portfolio
I Class Shares
Annual Report
December 31, 2008
B1014 02/09
Balanced Portfolio Managers' Commentary
In a difficult market environment, the Neuberger Berman Advisers Management Trust (AMT) Balanced Portfolio posted a negative return for 2008. The Portfolio's equity component outperformed the Russell Midcap(R) Growth Index while its fixed income component trailed the Merrill Lynch 1-3 Year Treasury Index.
Equities
The past year was characterized by tremendous rotation -- among the sectors, capitalization ranges and fundamental characteristics of the stocks that moved in and out of favor. For the full year, other than micro-caps, mid-cap stocks were the poorest performers by market capitalization. Growth stocks underperformed value stocks for the year and, within growth, the types of stocks we favor -- the higher quality, highest growth rate names --were out of favor.
Sectors that were most positive for the Portfolio's equity component included Industrials, Materials and Energy. Avoiding Utilities was also beneficial relative to the Russell Midcap Growth Index.
Within Industrials our high quality names, with good earnings visibility and cash flows, and self-sustaining business models, contributed to relative return for the year. Within Materials, strong stock selection was also a benefit. Although Energy was one of the worst performing market sectors for the year, our Energy holdings were helpful on a relative basis overall. Oil and gas holdings with good earnings visibility have continued to do fairly well even as commodities prices have dropped. Services companies -- among our poorest performers -- did not perform as well, as their margins began to erode as oil prices deteriorated.
Sectors that negatively impacted performance included Financials, Health Care and Telecommunications. In Financials, especially within banking, changes over the past year have meant that there are now fewer stocks to choose from within the mid-cap market. Many companies are now either too small or have been acquired by companies that are too large. Currently, our focus in the sector is asset management.
As we move into 2009, we are selectively shifting the Portfolio's equity component away from last year's defensive stance and beginning to position it for a more constructive market environment. As such, within Consumer Discretionary, we may move some focus away from our successful secondary education theme in favor of the more aggressive gaming, lodging and retail sectors. We are likely to add to Telecommunications as well. Within Information Technology, where our focus was primarily defensive during the year, we currently plan to add beta through areas that tend to move with the market, such as semiconductors.
Despite performance runs seen in lower quality stocks, we continue to believe that, longer term, stock selection will be highly important and that the market will reward companies that possess strong fundamentals and quality growth characteristics. The companies that meet our fundamental criteria generally have strong balance sheets in that they possess good cash flow characteristics and are underleveraged and, therefore, do not have to go to the market for financing - -- which should benefit them on a competitive basis longer term. We continue to monitor credit spreads for indications that the various rescue packages are beginning to positively influence the economic situation. We are also looking for indications that the stimulus packages are beginning to positively impact the consumer, creating jobs, spurring consumer spending and, finally, restoring consumer confidence. As we see these developments, we intend to move the Portfolio's equity component from its current relatively defensive positioning.
Fixed Income
As is typical during times of stress, investors flocked to ultra-safe short-term Treasuries during 2008, driving their yields lower and their prices higher. During the year, the yield on the two-year Treasury fell from 3.05% to 0.76%. Meanwhile, many fixed income sectors that in normal times are considered safe havens saw their spreads widen dramatically relative to Treasuries. Even higher rated securities with strong underlying credit fundamentals performed poorly during periods of indiscriminate selling over the course of the year.
1
Given this backdrop, the relative underperformance by the Portfolio's fixed income component versus the Merrill Lynch 1-3 Year Treasury Index was not surprising, given that the index is comprised entirely of Treasury securities. Although we built a modest Treasury position during the year, the vast majority of the Portfolio component's assets were in spread products (non-Treasury securities) such as mortgage-related securities and investment grade corporate bonds. During the year, we maintained our high quality bias throughout the year, with holdings rated AA+ on average as of December 31, 2008.
Despite current negative economic data, we are encouraged that the Federal Reserve, Treasury and other government agencies continue to work aggressively to stimulate the economy, unfreeze the credit markets and restore confidence in the financial system. During 2008, the Fed lowered the Fed Funds rate seven times, bringing the rate from 4.25% to a range of 0% to 0.25%, an historic low. In terms of policy intervention, the government has introduced numerous programs such the Troubled Asset Relief Program, which included a direct capital infusion into certain financial institutions, as well as the Term Asset-Backed Securities Loan Facility to facilitate the purchase of certain asset-backed securities.
It is important to note that it will take some time for these initiatives to work their way through the economy. In addition, the transition to the new administration in Washington could result in periods of heightened volatility in the financial markets. That said, toward the end of 2008, we began to see some thawing of the credit markets, increased liquidity and improved performance by the spread sectors, which led to better performance for the Portfolio's fixed income component in December.
While we are disappointed with our fixed income performance for 2008, we remain confident in our disciplined investment process. We also believe that emphasizing spread product is appropriate in seeking to generate the highest available current income, consistent with liquidity and low risk to principal.
Sincerely,


Kenneth J. Turek, Thomas Sontag
Michael Foster and Richard Grau
Portfolio Co-Managers
2
Balanced Portfolio
ASSET DIVERSIFICATION
| (% of Market Value) | |
| Asset Backed | | | 3.8 | % | |
| Common Stock | | | 65.5 | | |
| Mortgage-Backed Securities | | | 23.5 | | |
| U.S. Government Agency Securities | | | 2.2 | | |
| Short-Term Investments | | | 2.0 | | |
| Repurchase Agreements | | | 3.0 | | |
AVERAGE ANNUAL TOTAL RETURN1
| | | Inception
Date | | 1 Year | | 5 Year | | 10 Year | | Life of
Fund* | |
| Balanced Portfolio | | 02/28/89 | | | (39.15 | %) | | | (1.46 | %) | | | (0.11 | %) | | | 5.39 | % | |
Merrill Lynch 1-3 Year
Treasury Index2 | | | | | 6.61 | % | | | 4.06 | % | | | 4.71 | % | | | 6.04 | % | |
| Russell Midcap(R) Growth2 | | | | | (44.32 | %) | | | (2.33 | %) | | | (0.19 | %) | | | 8.00 | % | |
| Russell Midcap(R)2 | | | | | (41.46 | %) | | | (0.71 | %) | | | 3.18 | % | | | 9.49 | % | |
Performance data quoted represent past performance, which is no guarantee of future results. The investment return and principal value of an investment will fluctuate so that an investor's shares, when redeemed may be worth more or less than their original cost. Results are shown on a "total return" basis and include reinvestment of all dividends and capital gain distributions.
Current performance may be lower or higher than the performance data quoted. For performance data current to the most recent month end, please visit https://www.nb.com.
* Index returns are as of the inception date 02/28/89.
As stated in the Portfolio's most recent prospectus, the total annual fund operating expense ratio for fiscal year 2007 was 1.17% for Class I shares (prior to any fee waivers or expense reimbursements). Neuberger Berman Management LLC has contractually agreed to limit certain expenses of the Portfolio through 12/31/2011.
COMPARISON OF A $10,000 INVESTMENT
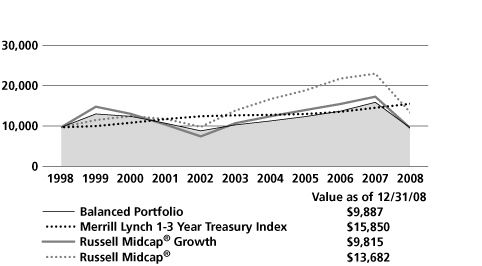
The chart shows the value of a hypothetical $10,000 investment in the Portfolio over the past 10 fiscal years, or since the Portfolio's inception, if it has not operated for 10 years. The result is compared with benchmarks, which may include a broad-based market index and/or a narrower index. Please note that market indexes do not include expenses. All results include the reinvestment of dividends and capital gain distributions. Results represent past performance and do not indicate future results. The chart and table do not reflect the deduction of taxes that a shareholder would pay on Portfolio distributions or the redemption of Portfolio shares.
Please see Endnotes for additional information.
3
Endnotes
1 "Total Return" includes reinvestment of all income dividends and capital gain distributions. Results represent past performance and do not indicate future results. The value of an investment in the Portfolio and the return on the investment both will fluctuate, and redemption process may be higher or lower than an investor's original cost. The performance information does not reflect fees and expenses of the variable annuity and variable life insurance policies or the pension plans whose proceeds are invested in the Portfolio. Neuberger Berman Management LLC ("NBM LLC") has agreed to absorb certain expenses of the AMT Portfolios, including the Portfolio. Without this arrangement, which is subject to change, the total returns of the Portfolio may have been less.
2 The Russell Midcap(R) Growth Index measures the performance of those Russell Midcap(R) Index companies with higher price-to-book ratios and higher forecasted growth values. The Russell Midcap Index measures the performance of the 800 smallest companies in the Russell 1000(R) Index, which represents approximately 31% of the total market capitalization of the Russell 1000(R) Index (which, in turn, consists of the 1,000 largest U.S. companies, based on the market capitalization). The Merrill Lynch 1-3 Year Treasury Index is an unmanaged total return market value index consisting of all coupon-bearing U.S. Treasury publicly placed debt securities with maturities between 1 to 3 years. Please note that indices do not take into account any fees and expenses of investing in the individual securities that they track and that individuals cannot invest directly in any index. Data about the performance of these indices are prepared or obtained by NBM LLC and include reinvestment of all dividends and capital gain distributions. The Portfolio may invest in many securities not included in the above described indices.
Any ratios or other measurements using a factor of forecasted earnings of a company discussed herein are based on consensus estimates, not NBM LLC's own projections, and they may or may not be realized. In addition, any revision to a forecast could affect the market price of a security. By quoting them herein, NBM LLC does not offer an opinion as to the accuracy of and does not guarantee these forecasted numbers. The investments for the Portfolio are managed by the same portfolio manager(s) who manage one or more other mutual funds that have similar names, investment objectives and investment styles as the Portfolio. You should be aware that the Portfolio is likely to differ from the other mutual funds in size, cash flow pattern and tax matters.
Accordingly, the holdings and performance of the Portfolio can be expected to vary from those of the other mutual funds. The composition, industries and holdings of the Portfolio are subject to change. Shares of the separate AMT Portfolios are sold only through the currently effective prospectus and are not available to the general public. Shares of this Portfolio may be purchased only by life insurance companies to be used with their separate accounts that fund variable annuity and variable life insurance policies and by certain qualified pension and retirement plans.
(c) 2009 Neuberger Berman Management LLC, distributor. All rights reserved.
4
Information About Your Fund's Expenses
This table is designed to provide information regarding costs related to your investments. All mutual funds incur operating expenses, which include management fees, fees for administrative services and costs of shareholder reports, among others. The following examples are based on an investment of $1,000 made at the beginning of the six month period ended December 31, 2008 and held for the entire period. The table illustrates the fund's costs in two ways:
| Actual Expenses and Performance: | | The first section of the table provides information about actual account values and actual expenses in dollars, based on the fund's actual performance during the period. You may use the information in this line, together with the amount you invested, to estimate the expenses you paid over the period. Simply divide your account value by $1,000 (for example, an $8,600 account value divided by $1,000 = 8.6), then multiply the result by the number in the first section of the table under the heading entitled "Expenses Paid During the Period" to estimate the expenses you paid over the period. | |
|
Hypothetical Example for
Comparison Purposes: | | The second section of the table provides information about hypothetical account values and hypothetical expenses based on the fund's actual expense ratio and an assumed rate of return at 5% per year before expenses. This return is not the fund's actual return. The hypothetical account values and expenses may not be used to estimate the actual ending account balance or expenses you paid for the period. You may use this information to compare the ongoing costs of investing in this fund versus other funds. To do so, compare the expenses shown in this 5% hypothetical example with the 5% hypothetical examples that appear in the shareholder reports of other funds. | |
|
Please note that the expenses in the table are meant to highlight your ongoing costs only. The table and the expense example do not include any transactional costs, such as fees and expenses that are, or may be, imposed under your variable contract or qualified pension plan. Therefore, the information under the heading "Hypothetical (5% annual return before expenses)" is useful in comparing ongoing costs only, and will not help you determine the relative total costs of owning different funds. In addition, if these transactional costs were included, your costs would have been higher.
Expense Information as of 12/31/08 (Unaudited)
NEUBERGER BERMAN ADVISERS MANAGEMENT TRUST BALANCED PORTFOLIO
| Actual | | Beginning Account
Value
7/1/08 | | Ending Account
Value
12/31/08 | | Expenses Paid During
the Period*
7/1/08 - 12/31/08 | |
| Class I | | $ | 1,000.00 | | | $ | 667.20 | | | $ | 6.54 | | |
| Hypothetical (5% annual return before expenses)** | |
| Class I | | $ | 1,000.00 | | | $ | 1,017.29 | | | $ | 7.91 | | |
* Expenses are equal to the annualized expense ratio of 1.56%, multiplied by the average account value over the period, multiplied by 184/366 (to reflect the one-half year period shown).
** Hypothetical 5% annual return before expenses is calculated by multiplying the number of days in the most recent half year divided by 366.
5
Schedule of Investments Balanced Portfolio
| NUMBER OF SHARES | | | | MARKET VALUEt | |
| Common Stocks (65.1%) | | | |
| Aerospace & Defense (0.5%) | | | |
| | 1,400 | | | Precision Castparts | | $ | 83,272 | | |
| Air Freight & Logistics (1.8%) | | | |
| | 3,400 | | | C.H. Robinson Worldwide | | | 187,102 | | |
| | 2,900 | | | Expeditors International | | | 96,483 | | |
| | | | 283,585 | | |
| Beverages (0.2%) | | | |
| | 1,350 | | | Central European Distribution | | | 26,595 | * | |
| Biotechnology (2.9%) | | | |
| | 1,800 | | | Alexion Pharmaceuticals Inc. | | | 65,142 | * | |
| | 1,350 | | | Cephalon, Inc. | | | 104,004 | * | |
| | 2,800 | | | Myriad Genetics | | | 185,528 | * | |
| | 650 | | | United Therapeutics | | | 40,657 | * | |
| | 1,900 | | | Vertex Pharmaceuticals | | | 57,722 | * | |
| | | | 453,053 | | |
| Capital Markets (2.4%) | | | |
| | 650 | | | BlackRock, Inc. | | | 87,198 | | |
| | 5,300 | | | Lazard Ltd. | | | 157,622 | oo | |
| | 2,400 | | | Northern Trust | | | 125,136 | | |
| | | | 369,956 | | |
| Chemicals (2.1%) | | | |
| | 4,300 | | | Airgas, Inc. | | | 167,657 | oo | |
| | 4,300 | | | Ecolab Inc. | | | 151,145 | oo | |
| | | | 318,802 | | |
| Commercial Services & Supplies (5.5%) | | | |
| | 1,500 | | | Clean Harbors | | | 95,160 | * | |
| | 1,500 | | | Copart, Inc. | | | 40,785 | * | |
| | 6,000 | | | Corrections Corporation of
America | | | 98,160 | * | |
| | 2,400 | | | CoStar Group | | | 79,056 | * | |
| | 4,800 | | | Covanta Holding | | | 105,408 | * | |
| | 6,700 | | | Iron Mountain | | | 165,691 | * | |
| | 3,800 | | | Stericycle, Inc. | | | 197,904 | *oo | |
| | 2,300 | | | Waste Connections | | | 72,611 | * | |
| | | | 854,775 | | |
| Communications Equipment (1.8%) | | | |
| | 4,500 | | | Harris Corp. | | | 171,225 | oo | |
| | 5,800 | | | Juniper Networks | | | 101,558 | * | |
| | | | 272,783 | | |
| Construction & Engineering (0.8%) | | | |
| | 2,500 | | | Jacobs Engineering Group | | | 120,250 | * | |
| NUMBER OF SHARES | | | | MARKET VALUEt | |
| Construction Materials (0.2%) | | | |
| | 350 | | | Martin Marietta Materials | | $ | 33,978 | | |
| Containers & Packaging (0.4%) | | | |
| | 2,500 | | | Pactiv Corp. | | | 62,200 | * | |
| Diversified Consumer Services (3.0%) | | | |
| | 1,500 | | | American Public Education | | | 55,785 | * | |
| | 3,500 | | | DeVry, Inc. | | | 200,935 | | |
| | 1,000 | | | Strayer Education | | | 214,410 | | |
| | | | 471,130 | | |
| Diversified Financial Services (0.9%) | | | |
| | 1,100 | | | IntercontinentalExchange Inc. | | | 90,684 | * | |
| | 2,000 | | | Nasdaq OMX Group | | | 49,420 | * | |
| | | | 140,104 | | |
| Electrical Equipment (0.8%) | | | |
| | 3,800 | | | AMETEK, Inc. | | | 114,798 | | |
Electronic Equipment, Instruments &
Components (3.7%) | | | |
| | 4,800 | | | Dolby Laboratories | | | 157,248 | * | |
| | 4,000 | | | FLIR Systems | | | 122,720 | * | |
| | 1,400 | | | Itron, Inc. | | | 89,236 | * | |
| | 500 | | | Mettler-Toledo International | | | 33,700 | * | |
| | 2,200 | | | National Instruments | | | 53,592 | | |
| | 5,500 | | | Trimble Navigation | | | 118,855 | * | |
| | | | 575,351 | | |
| Energy Equipment & Services (1.7%) | | | |
| | 2,400 | | | CARBO Ceramics | | | 85,272 | | |
| | 1,150 | | | Core Laboratories N.V. | | | 68,839 | | |
| | 2,900 | | | IHS Inc. | | | 108,518 | * | |
| | | | 262,629 | | |
| Food & Staples Retailing (1.7%) | | | |
| | 1,900 | | | BJ's Wholesale Club | | | 65,094 | * | |
| | 5,300 | | | Shoppers Drug Mart | | | 197,423 | | |
| | | | 262,517 | | |
| Food Products (1.4%) | | | |
| | 3,800 | | | Ralcorp Holdings | | | 221,920 | *oo | |
| Health Care Equipment & Supplies (4.9%) | | | |
| | 1,800 | | | C.R. Bard | | | 151,668 | | |
| | 2,900 | | | Gen-Probe | | | 124,236 | * | |
| | 2,400 | | | IDEXX Laboratories | | | 86,592 | * | |
| | 800 | | | Intuitive Surgical | | | 101,592 | * | |
| | 2,900 | | | Masimo Corp. | | | 86,507 | * | |
| | 1,750 | | | NuVasive, Inc. | | | 60,637 | * | |
| | 7,200 | | | Wright Medical Group | | | 147,096 | * | |
| | | | 758,328 | | |
See Notes to Schedule of Investments 6
| NUMBER OF SHARES | | | | MARKET VALUEt | |
| Health Care Providers & Services (2.4%) | | | |
| | 2,400 | | | Express Scripts | | $ | 131,952 | * | |
| | 1,200 | | | HMS Holdings | | | 37,824 | * | |
| | 3,000 | | | Psychiatric Solutions | | | 83,550 | * | |
| | 5,800 | | | VCA Antech | | | 115,304 | * | |
| | | | 368,630 | | |
| Hotels, Restaurants & Leisure (2.4%) | | | |
| | 3,750 | | | Penn National Gaming | | | 80,175 | * | |
| | 8,600 | | | WMS Industries | | | 231,340 | *oo | |
| | 1,550 | | | Wynn Resorts | | | 65,503 | * | |
| | | | 377,018 | | |
| Household Products (0.5%) | | | |
| | 1,450 | | | Church & Dwight | | | 81,374 | | |
| Insurance (1.1%) | | | |
| | 2,000 | | | Aon Corp. | | | 91,360 | | |
| | 300 | | | Everest Re Group | | | 22,842 | | |
| | 1,750 | | | Fidelity National Financial Class A | | | 31,063 | | |
| | 1,000 | | | W.R. Berkley | | | 31,000 | | |
| | | | 176,265 | | |
| Internet Software & Services (0.9%) | | | |
| | 1,500 | | | Equinix, Inc. | | | 79,785 | * | |
| | 3,500 | | | VistaPrint Ltd. | | | 65,135 | * | |
| | | | 144,920 | | |
| IT Services (2.6%) | | | |
| | 3,000 | | | Alliance Data Systems | | | 139,590 | *oo | |
| | 6,000 | | | Cognizant Technology Solutions | | | 108,360 | * | |
| | 450 | | | MasterCard, Inc. Class A | | | 64,318 | | |
| | 4,500 | | | SAIC Inc. | | | 87,660 | * | |
| | | | 399,928 | | |
| Life Science Tools & Services (0.5%) | | | |
| | 3,000 | | | Illumina, Inc. | | | 78,150 | * | |
| Machinery (0.9%) | | | |
| | 2,400 | | | Danaher Corp. | | | 135,864 | oo | |
| Metals & Mining (0.3%) | | | |
| | 1,000 | | | Agnico-Eagle Mines | | | 51,330 | | |
| Multiline Retail (0.3%) | | | |
| | 1,400 | | | Kohl's Corp. | | | 50,680 | * | |
| Oil, Gas & Consumable Fuels (3.3%) | | | |
| | 5,300 | | | Concho Resources | | | 120,946 | * | |
| | 1,900 | | | Continental Resources | | | 39,349 | * | |
| | 2,900 | | | Range Resources | | | 99,731 | | |
| | 5,800 | | | Southwestern Energy | | | 168,026 | *oo | |
| | 2,400 | | | XTO Energy | | | 84,648 | | |
| | | | 512,700 | | |
| Personal Products (0.2%) | |
| | 500 | | | Chattem, Inc. | | | 35,765 | * | |
| NUMBER OF SHARES | | | | MARKET VALUEt | |
| Pharmaceuticals (1.1%) | | | |
| | 5,300 | | | Perrigo Co. | | $ | 171,243 | | |
| Professional Services (0.6%) | | | |
| | 2,000 | | | FTI Consulting | | | 89,360 | * | |
| Road & Rail (0.6%) | | | |
| | 3,400 | | | J.B. Hunt Transport Services | | | 89,318 | | |
| Semiconductors (0.3%) | | | |
| | 2,000 | | | Lam Research | | | 42,560 | * | |
Semiconductors & Semiconductor
Equipment (1.2%) | | | |
| | 4,050 | | | Microchip Technology | | | 79,097 | | |
| | 4,000 | | | Microsemi Corp. | | | 50,560 | * | |
| | 2,250 | | | Silicon Laboratories | | | 55,755 | * | |
| | | | 185,412 | | |
| Software (2.5%) | | | |
| | 14,000 | | | Activision Blizzard | | | 120,960 | * | |
| | 4,800 | | | ANSYS, Inc. | | | 133,872 | * | |
| | 2,200 | | | Blackboard Inc. | | | 57,706 | * | |
| | 2,350 | | | Salesforce.com, Inc. | | | 75,224 | * | |
| | | | 387,762 | | |
| Specialty Retail (2.8%) | | | |
| | 3,800 | | | GameStop Corp. Class A | | | 82,308 | * | |
| | 3,000 | | | Gap Inc. | | | 40,170 | | |
| | 4,300 | | | Ross Stores | | | 127,839 | | |
| | 2,000 | | | Staples, Inc. | | | 35,840 | | |
| | 2,000 | | | TJX Cos. | | | 41,140 | | |
| | 6,700 | | | Urban Outfitters | | | 100,366 | * | |
| | | | 427,663 | | |
| Trading Companies & Distributors (0.8%) | | | |
| | 3,400 | | | Fastenal Co. | | | 118,490 | | |
| Wireless Telecommunication Services (3.1%) | | | |
| | 6,500 | | | American Tower | | | 190,580 | * | |
| | 2,000 | | | Metropcs Communications | | | 29,700 | * | |
| | 6,500 | | | NII Holdings | | | 118,170 | * | |
| | 9,000 | | | SBA Communications | | | 146,880 | * | |
| | | | 485,330 | | |
| |
| | | Total Common Stocks
(Cost $10,920,287) | | | 10,095,788 | | |
See Notes to Schedule of Investments 7
| PRINCIPAL AMOUNT | | | | MARKET VALUEt | |
| Mortgage-Backed Securities (25.5%) | | | |
| Adjustable Alt-A Conforming Balance (1.6%) | | | |
| $ | 535,549 | | | Countrywide Home Loans Mortgage Pass-Through Trust, Ser. 2007-HYB2, Class 2A1,
5.38%, due 1/2/09 | | $ | 254,505 | m | |
| Adjustable Alt-A Mixed Balance (6.1%) | | | |
| | 534,218 | | | Bear Stearns ALT-A Trust, Ser. 2007-2, Class 2A1, 5.57%, due 1/2/09 | | | 264,884 | m | |
| | 542,913 | | | Bear Stearns ALT-A Trust, Ser. 2006-4, Class 32A1, 6.47%, due 1/2/09 | | | 267,292 | moo | |
| | 306,007 | | | First Horizon Alternative Mortgage Securities Trust, Ser. 2006-AA7, Class A1,
6.52%, due 1/2/09 | | | 143,767 | m | |
| | 555,596 | | | Nomura Asset Acceptance Corp., Ser. 2006-AR2, Class 2A2, 6.56%, due 1/2/09 | | | 264,468 | moo | |
| | | | 940,411 | | |
| Adjustable Alt-B Mixed Balance (0.6%) | | | |
| | 150,304 | | | Lehman XS Trust, Floating Rate, Ser. 2005-1, Class 2A1, 1.97%, due 1/2/09 | | | 89,057 | m | |
| Adjustable Conforming Balance (2.1%) | | | |
| | 287,282 | | | Adjustable Rate Mortgage Trust, Ser. 2005-10, Class 4A1, 5.37%, due 1/2/09 | | | 179,088 | m | |
| | 262,399 | | | IndyMac INDX Mortgage Loan Trust, Ser. 2005-AR23, Class 2A1, 5.48%, due 1/2/09 | | | 140,745 | m | |
| | | | 319,833 | | |
| Adjustable Jumbo Balance (2.5%) | | | |
| | 118,142 | | | Banc of America Funding Corp., Ser. 2005-F, Class 4A1, 5.33%, due 1/2/09 | | | 68,046 | m | |
| | 321,431 | | | Banc of America Funding Corp., Ser. 2006-H, Class 2A3, 6.68%, due 1/2/09 | | | 180,902 | moo | |
| | 287,152 | | | Harborview Mortgage Loan Trust, Ser. 2006-3, Class 1A1A, 6.34%, due 1/2/09 | | | 138,014 | m | |
| | | | 386,962 | | |
| Adjustable Mixed Balance (8.1%) | | | |
| | 275,078 | | | Banc of America Funding Corp., Ser. 2005-H, Class 7A1, 5.66%, due 1/2/09 | | | 155,874 | m | |
| | 200,419 | | | Banc of America Funding Corp., Ser. 2006-A, Class 3A2, 5.85%, due 1/2/09 | | | 106,522 | m | |
| | 422,964 | | | Countrywide Home Loan Mortgage Pass-Through Trust, Ser. 2006-HYB3, Class 1A1A,
5.31%, due 1/2/09 | | | 195,355 | m | |
| | 329,134 | | | Credit Suisse First Boston Mortgage Securities Corp., Ser. 2004-AR4, Class 2A1,
4.77%, due 1/2/09 | | | 201,048 | m | |
| | 315,991 | | | First Horizon Mortgage Pass-Through Trust, Ser. 2005-AR5, Class 2A1, 5.45%, due 1/2/09 | | | 225,167 | m | |
| | 279,053 | | | GMAC Mortgage Corp. Loan Trust, Ser. 2006-AR1, Class 1A1, 5.60%, due 1/2/09 | | | 140,986 | m | |
| | 17,967 | | | Harborview Mortgage Loan Trust, Ser. 2004-4, Class 3A, 2.65%, due 1/2/09 | | | 8,218 | m | |
| | 520,963 | | | IndyMac INDX Mortgage Loan Trust, Ser. 2006-AR3, Class 2A1A, 6.30%, due 1/2/09 | | | 231,665 | moo | |
| | | | 1,264,835 | | |
| Mortgage-Backed Non-Agency (1.3%) | | | |
| | 143,287 | | | Countrywide Home Loans, Ser. 2005-R2, Class 2A4, 8.50%, due 6/25/35 | | | 139,122 | noo | |
| | 58,649 | | | GSMPS Mortgage Loan Trust, Ser. 2005-RP3, Class 1A4, 8.50%, due 9/25/35 | | | 53,187 | n | |
| | | | 192,309 | | |
| Fannie Mae (1.0%) | | | |
| | 143,527 | | | Whole Loan, Ser. 2004-W8, Class PT, 10.42%, due 1/2/09 | | | 158,183 | moo | |
See Notes to Schedule of Investments 8
| PRINCIPAL AMOUNT | | | | MARKET VALUEt | |
| Freddie Mac (2.2%) | | | |
| $ | 186,756 | | | Pass-Through Certificates, 8.00%, due 11/1/26 | | $ | 197,833 | oo | |
| | 129,902 | | | Pass-Through Certificates, 8.50%, due 10/1/30 | | | 140,175 | oo | |
| | | | 338,008 | | |
| | | | | Total Mortgage-Backed Securities (Cost $7,007,272) | | | 3,944,103 | | |
| Asset-Backed Securities (3.9%) | | | |
| | 250,000 | | | ACE Securities Corp. Home Equity Loan Trust, Ser. 2006-ASP5, Class A2B,
0.60%, due 1/26/09 | | | 183,996 | moo | |
| | 100,000 | | | ACE Securities Corp. Home Equity Loan Trust, Ser. 2006-OP1, Class A2C,
0.62%, due 1/26/09 | | | 65,582 | moo | |
| | 200,000 | | | Carrington Mortgage Loan Trust, Ser. 2007-FRE1, Class A3, 0.73%, due 1/26/09 | | | 84,772 | moo | |
| | 113,596 | | | Impac Secured Assets Corp., Ser. 2006-3, Class A4, 0.56%, due 1/26/09 | | | 99,566 | m | |
| | 185,687 | | | Residential Asset Mortgage Products, Inc., Ser. 2006-RS1, Class AI2, 0.70%, due 1/26/09 | | | 144,877 | moo | |
| | 75,000 | | | Securitized Asset Backed Receivables LLC Trust, Ser. 2006-WM4, Class A2C,
0.63%, due 1/26/09 | | | 20,341 | m | |
| | | | | Total Asset-Backed Securities (Cost $907,740) | | | 599,134 | | |
| Repurchase Agreements (3.0%) | | | |
| | 470,000 | | | Repurchase Agreement with Fixed Income Clearing Corp., 0.01%, due 1/2/09,
dated 12/31/08, Maturity Value $470,000 Collateralized by $470,000 Fannie Mae,
4.33%, due 7/28/11 (Collateral Value $488,213) (Cost $470,000) | | | 470,000 | # | |
| NUMBER OF SHARES | | | | | |
| Short-Term Investments (2.0%) | | | |
| | 313,321 | | | Neuberger Berman Prime Money Fund Trust Class (Cost $313,321) | | | 313,321 | a | |
| | | | | Total Investments (99.5%) (Cost $19,618,620) | | | 15,422,346 | ## | |
| | | | | Cash, receivables and other assets, less liabilities (0.5%) | | | 82,511 | | |
| | | | | Total Net Assets (100.0%) | | $ | 15,504,857 | | |
See Notes to Schedule of Investments 9
Notes to Schedule of Investments Balanced Portfolio
t Investments in equity securities by Neuberger Berman Advisers Management Trust Balanced Portfolio (the "Fund") are valued by obtaining valuations from an independent pricing service. The independent pricing service values equity securities at the latest sale price when that price is readily available. Securities traded primarily on the NASDAQ Stock Market are normally valued by the Fund at the NASDAQ Official Closing Price ("NOCP") provided by NASDAQ each business day. The NOCP is the most recently reported price as of 4:00:02 p.m., Eastern time, unless that price is outside the range of the "inside" bid and asked prices (i.e., the bid and asked prices that dealers quote to each other when trading for their own accounts); in that case, NASDAQ will adjust the price to equal the inside bid or asked price, whichever is closer. Because of delays in reporting trades, the NOCP may not be based on the price of the last trade to occur before the market closes. If there is no reported sale of a security on a particular day, the independent pricing service may value the security based on reported market quotations. If a valuation is not available from an independent pricing service, the Fund seeks to obtain quotations from principal market makers. Investments in debt securities are valued daily by obtaining valuations from independent pricing services based on readily available bid quotations, or if quotations are not available, by methods which include considerations such as: yields or prices of securities of comparable quality, coupon, maturity and type; indications as to values from dealers; and general market conditions. If a valuation is not available from an independent pricing service, the Fund seeks to obtain quotations from principal market makers. For both debt and equity securities, if such quotations are not readily available, securities are valued using methods the Board of Trustees of Neuberger Berman Advisers Management Trust (the "Board") has approved on the belief that they reflect fair value. Numerous factors may be considered when determining the fair value of a security, including available analyst, media or other reports, trading in futures or ADRs and whether the issuer of the security being fair valued has other securities outstanding. Foreign security prices are furnished by independent quotation services and expressed in local currency values. Foreign security prices are currently translated from the local currency into U.S. dollars using the exchange rate as of 4:00 p.m., Eastern time. The Board has approved the use of Interactive Data Pricing and Reference Data, Inc. ("Interactive") to assist in determining the fair value of the Fund's foreign equity securities when changes in the value of a certain index suggest that the closing prices on the foreign exchanges may no longer represent the amount that the Fund could expect to receive for those securities. In this event, Interactive will provide adjusted prices for certain foreign equity securities using a statistical analysis of historical correlations of multiple factors. In the absence of precise information about the market values of these foreign securities as of the close of the New York Stock Exchange, the Board has determined on the basis of available data that prices adjusted in this way are likely to be closer to the prices the Fund could realize on a current sale than are the prices of those securities established at the close of the foreign markets in which the securities primarily trade. Fair value prices are necessarily estimates, and there is no assurance that such a price will be at or close to the price at which the security is next quoted or next trades. Short-term debt securities with less than 60 days until maturity may be valued at cost which, when combined with interest earned, approximates market value.
The Fund adopted Financial Accounting Standards Board ("FASB") Statement of Financial Accounting Standards No. 157, Fair Value Measurements ("FAS 157"), effective January 1, 2008. In accordance with FAS 157, "fair value" is defined as the price that a Fund would receive upon selling an investment in an orderly transaction to an independent buyer in the principal or most advantageous market for the investment. Various inputs are used in determining the value of the Fund's investments.
In addition to defining fair value, FAS 157 established a three-tier hierarchy of inputs to establish a classification of fair value measurements for disclosure purposes. The three-tier hierarchy of inputs is summarized in the three broad Levels listed below.
. Level 1 - quoted prices in active markets for identical investments
. Level 2 - other significant observable inputs (including quoted prices for similar investments, interest rates, prepayment speeds, credit risk, amortized cost, etc.)
. Level 3 - significant unobservable inputs (including the Fund's own assumptions in determining the fair value of investments)
See Notes to Financial Statements10
Notes to Schedule of Investments Balanced Portfolio (cont'd)
The inputs or methodology used for valuing an investment are not necessarily an indication of the risk associated with investing in those securities.
The following is a summary of the inputs used to value the Fund's investments as of December 31, 2008:
| Valuation Inputs | | Investments in
Securities | | Other Financial
Instruments** | |
| Level 1 - Quoted Prices | | $ | 10,095,788 | | | $ | 20,672 | | |
| Level 2 - Other Significant Observable Inputs | | | 5,326,558 | | | | -- | | |
| Level 3 - Significant Unobservable Inputs | | | -- | | | | -- | | |
| Total | | $ | 15,422,346 | | | $ | 20,672 | | |
Following is a reconciliation between the beginning and ending balances of investments in which significant unobservable inputs (Level 3) were used in determining value:
| | | Investments
in Securities | |
| Beginning balance, as of 1/1/08 | | $ | 23,725 | | |
| Accrued discounts/premiums | | | -- | | |
| Realized gain/loss and change in unrealized appreciation/depreciation | | | 4,385 | | |
| Net purchases/sales | | | (28,110 | ) | |
| Net transfers in and/or out of Level 3 | | | -- | | |
| Balance, as of 12/31/08 | | $ | -- | | |
| Net change in unrealized appreciation/depreciation from investments still held as of 12/31/08 | | $ | -- | | |
** Other financial instruments include financial futures contracts.
# At cost, which approximates market value.
## At December 31, 2008, the cost of investments for U.S. federal income tax purposes was $19,723,448. Gross unrealized appreciation of investments was $971,722, and gross unrealized depreciation of investments was $5,272,824, resulting in net unrealized depreciation of $4,301,102, based on cost for U.S. federal income tax purposes.
* Security did not produce income during the last twelve months.
n Restricted security subject to restrictions on resale under federal securities laws. These securities may be resold in transactions exempt from registration, normally to qualified institutional buyers under Rule 144A under the Securities Act of 1933, as amended, and have been deemed by the investment manager to be liquid. At December 31, 2008, these securities amounted to $192,309 or 1.2% of net assets for the Fund.
oo All or a portion of this security is segregated as collateral for financial futures contracts.
m Floating rate securities are securities whose yields vary with a designated market index or market rate. These securities are shown at their current rates as of December 31, 2008.
a Neuberger Berman Prime Money Fund ("Prime Money") is also managed by Neuberger Berman Management LLC and may be considered an affiliate since it has the same officers, Board members, and investment manager as the Fund and because, at times, the Fund may own 5% or more of the outstanding voting securities of Prime Money (see Notes A & F of Notes to Financial Statements).
See Notes to Financial Statements11
Statement of Assets and Liabilities
Neuberger Berman Advisers Management Trust
| | | BALANCED
PORTFOLIO | |
| | | December 31, 2008 | |
| Assets | |
| Investments in securities, at market value* (Notes A & F)-see Schedule of Investments: | |
| Unaffiliated issuers | | $ | 15,109,025 | | |
| Affiliated issuers | | | 313,321 | | |
| | | | 15,422,346 | | |
| Cash | | | 11,199 | | |
| Foreign currency | | | 8,617 | | |
| Dividends and interest receivable | | | 39,762 | | |
| Receivable for securities sold | | | 137,158 | | |
| Receivable for Fund shares sold | | | 149 | | |
| Prepaid expenses and other assets | | | 1,299 | | |
| Total Assets | | | 15,620,530 | | |
| Liabilities | |
| Payable for securities purchased | | | 43,788 | | |
| Payable for Fund shares redeemed | | | 1,164 | | |
| Payable to investment manager-net (Notes A & B) | | | 6,942 | | |
| Payable to administrator (Note B) | | | 3,798 | | |
| Payable for variation margin on open futures contracts (Note A) | | | 281 | | |
| Accrued expenses and other payables | | | 59,700 | | |
| Total Liabilities | | | 115,673 | | |
| Net Assets at value | | $ | 15,504,857 | | |
| Net Assets consist of: | |
| Paid-in capital | | $ | 36,235,362 | | |
| Undistributed net investment income (loss) | | | 498,378 | | |
| Accumulated net realized gains (losses) on investments | | | (17,034,641 | ) | |
| Net unrealized appreciation (depreciation) in value of investments | | | (4,194,242 | ) | |
| Net Assets at value | | $ | 15,504,857 | | |
| Shares Outstanding ($.001 par value; unlimited shares authorized) | | | 2,045,692 | | |
| Net Asset Value, offering and redemption price per share | | $ | 7.58 | | |
| *Cost of Investments: | |
| Unaffiliated issuers | | $ | 19,305,299 | | |
| Affiliated issuers | | | 313,321 | | |
| Total cost of investments | | $ | 19,618,620 | | |
| Total cost of foreign currency | | $ | 10,348 | | |
See Notes to Financial Statements 12
Statement of Operations
Neuberger Berman Advisers Management Trust
| | | BALANCED
PORTFOLIO | |
| | | For the
Year Ended
December 31, 2008 | |
| Investment Income: | |
| Income (Note A): | |
| Dividend income-unaffiliated issuers | | $ | 100,617 | | |
| Interest income-unaffiliated issuers | | | 971,637 | | |
| Income from investments in affiliated issuers (Note F) | | | 25,648 | | |
| Foreign taxes withheld | | | (1,963 | ) | |
| Total income | | $ | 1,095,939 | | |
| Expenses: | |
| Investment management fees (Notes A & B) | | | 286,989 | | |
| Administration fees (Note B) | | | 156,540 | | |
| Shareholder servicing agent fees | | | 1,661 | | |
| Audit fees | | | 40,493 | | |
| Custodian fees (Note B) | | | 73,496 | | |
| Insurance expense | | | 1,978 | | |
| Legal fees | | | 12,967 | | |
| Registration and filing fees | | | 24,675 | | |
| Shareholder reports | | | 27,275 | | |
| Trustees' fees and expenses | | | 38,132 | | |
| Miscellaneous | | | 9,585 | | |
| Total expenses | | | 673,791 | | |
| Investment management fees waived (Note A) | | | (712 | ) | |
| Expenses reduced by custodian fee expense offset and commission recapture arrangements (Note B) | | | (2,354 | ) | |
| Total net expenses | | | 670,725 | | |
| Net investment income (loss) | | $ | 425,214 | | |
| Realized and Unrealized Gain (Loss) on Investments (Note A) | |
| Net realized gain (loss) on: | |
| Sales of investment securities of unaffiliated issuers | | | 3,116,174 | | |
| Financial futures contracts | | | 203,053 | | |
| Foreign currency | | | 403 | | |
| Change in net unrealized appreciation (depreciation) in value of: | |
| Unaffiliated investment securities | | | (20,259,886 | ) | |
| Financial futures contracts | | | 18,687 | | |
| Foreign currency | | | (19,662 | ) | |
| Net gain (loss) on investments | | | (16,941,231 | ) | |
| Net increase (decrease) in net assets resulting from operations | | $ | (16,516,017 | ) | |
See Notes to Financial Statements 13
Statements of Changes in Net Assets
Neuberger Berman Advisers Management Trust
| | | BALANCED PORTFOLIO | |
| | | Year Ended
December 31,
2008 | | Year Ended
December 31,
2007 | |
| Increase (Decrease) in Net Assets: | |
| From Operations: | |
| Net investment income (loss) | | $ | 425,214 | | | $ | 755,304 | | |
| Net realized gain (loss) on investments | | | 3,319,630 | | | | 9,353,619 | | |
| Change in net unrealized appreciation (depreciation) of investments | | | (20,260,861 | ) | | | 751,870 | | |
| Net increase (decrease) in net assets resulting from operations | | | (16,516,017 | ) | | | 10,860,793 | | |
| Distributions to Shareholders From (Note A): | |
| Net Investment Income | | | (836,556 | ) | | | (875,654 | ) | |
| From Fund Share Transactions (Note D): | |
| Proceeds from shares sold | | | 5,241,056 | | | | 8,058,112 | | |
| Proceeds from reinvestment of dividends and distributions | | | 836,556 | | | | 875,654 | | |
| Payments for shares redeemed | | | (51,583,340 | ) | | | (12,821,907 | ) | |
| Net increase (decrease) from Fund share transactions | | | (45,505,728 | ) | | | (3,888,141 | ) | |
| Net Increase (Decrease) in Net Assets | | | (62,858,301 | ) | | | 6,096,998 | | |
| Net Assets: | |
| Beginning of year | | | 78,363,158 | | | | 72,266,160 | | |
| End of year | | $ | 15,504,857 | | | $ | 78,363,158 | | |
| Undistributed net investment income (loss) at end of year | | $ | 498,378 | | | $ | 835,933 | | |
See Notes to Financial Statements 14
Notes to Financial Statements Balanced Portfolio
Note A--Summary of Significant Accounting Policies:
1 General: Balanced Portfolio (the "Fund") is a separate operating series of Neuberger Berman Advisers Management Trust (the "Trust"), a Delaware statutory trust organized pursuant to a Trust Instrument dated May 23, 1994. The Trust is currently comprised of ten separate operating series (each a "Series," collectively, the "Funds") each of which is diversified. The Trust is registered as an open-end management investment company under the Investment Company Act of 1940, as amended (the "1940 Act"), and its shares are registered under the Securities Act of 1933, as amended. The Fund currently offers only Class I shares. The Board of Trustees of the Trust (the "Board") may establish additional series or classes of shares without the approval of shareholders.
The assets of each Series belong only to that Series, and the liabilities of each Series are borne solely by that Series and no other.
The preparation of financial statements in accordance with U.S. generally accepted accounting principles requires Neuberger Berman Management LLC ("Management") to make estimates and assumptions at the date of the financial statements. Actual results could differ from those estimates.
Management, the investment manager of the Fund, and Neuberger Berman, LLC ("Neuberger"), the Fund's sub-adviser, are wholly owned subsidiaries of Lehman Brothers Holdings Inc. ("Lehman Brothers"), a publicly owned holding company. On September 15, 2008, Lehman Brothers filed a voluntary petition under Chapter 11 of the U.S. Bankruptcy Code. On December 3, 2008, NBSH Acquisition, LLC ("NBSH"), an entity organized by key members of Neuberger Berman's senior management, was selected as the successful bidder in the public auction to acquire a majority interest in Neuberger Berman's business and the fixed income and certain alternative asset management businesses of Lehman Brothers' Investment Management Division (together with Neuberger Berman, the "Acquired Businesses") (the "Proposed Acquisition"). On December 22, 2008, the bankruptcy court having jurisdiction over the Lehman Brothers matter approved the sale of the Acquired Businesses to NBSH (or its successor or assign), as the successful bidder. At the closing of the Proposed Acquisition, a majority interest in the Acquired Businesses will be directly or indirectly owned by portfolio managers, Neuberger Berman's management team and certain key members and senior professionals of the former Investment Management Division, as well as by Lehman Brothers and certain affiliates of Lehman Brothers. The transaction is subject to certain conditions and approvals.
These events, while affecting Lehman Brothers, have not had a material impact on the Fund or its operations. Management and Neuberger will continue to operate in the ordinary course of business as the investment manager and sub-adviser of the Fund.
Included in the Acquired Businesses are Management and Neuberger. The consummation of the Proposed Acquisition has been deemed to result in an "assignment" of the Fund's Management and Sub-Advisory Agreements which would, by law, automatically terminate those agreements. Accordingly, the Board, including the Trustees who are not "interested persons" of the Fund's investment manager and its affiliates or the Fund, has approved the new Management Agreements and Sub-Advisory Agreements for the Fund. The new agreements also will require the approval of the Fund's shareholders.
2 Portfolio valuation: Investment securities are valued as indicated in the notes following the Schedule of Investments.
3 Foreign currency translation: The accounting records of the Fund are maintained in U.S. dollars. Foreign currency amounts are currently translated into U.S. dollars using the exchange rates as of 4:00 p.m., Eastern time, to determine the value of investments, other assets and liabilities. Purchase and sale prices of securities, and income and expenses, are translated into U.S. dollars at the prevailing rate of exchange on the respective dates of such transactions. Net unrealized foreign currency gain (loss) arises from changes in the value of assets and liabilities, other than investments in securities, as a result of changes in exchange rates and is stated separately in the Statement of Operations.
15
4 Securities transactions and investment income: Securities transactions are recorded on trade date for financial reporting purposes. Dividend income is recorded on the ex-dividend date or, for certain foreign dividends, as soon as the Fund becomes aware of the dividends. Non-cash dividends included in dividend income, if any, are recorded at the fair market value of the securities received. Interest income, including accretion of discount (adjusted for original issue discount, where applicable), and accretion of market discount on long-term bonds and short-term investments, is recorded on the accrual basis. Realized gains and losses from securities transactions and foreign currency transactions, if any, are recorded on the basis of identified cost and stated separately in the Statement of Operations. Included in net realized gain (loss) on investments are proceeds from the settlements of class action litigation in which the Fund participated as a plaintiff. The amount of such proceeds for the year ended December 31, 2008 was $36,687.
5 Forward foreign currency contracts: The Fund may enter into forward foreign currency contracts ("contracts") in connection with planned purchases or sales of securities to hedge the U.S. dollar value of portfolio securities denominated in a foreign currency. The gain or loss arising from the difference between the original contract price and the closing price of such contract is included in net realized gains or losses on foreign currency transactions on settlement date. Fluctuations in the value of such contracts are recorded for financial reporting purposes as unrealized gains or losses by the Fund until the contractual settlement date. The Fund could be exposed to risks if a counter party to a contract were unable to meet the terms of its contract or if the value of the foreign currency changes unfavorably. The U.S. dollar value of foreign currency underlying all contractual commitments held by the Fund is determined using forward foreign currency exchange rates supplied by an independent pricing service.
6 Income tax information: The Funds are treated as separate entities for U.S. federal income tax purposes. It is the policy of the Fund to continue to qualify as a regulated investment company by complying with the requirements of Subchapter M of the Internal Revenue Code applicable to regulated investment companies and to distribute substantially all of its earnings to its shareholders. Therefore, no federal income or excise tax provision is required.
The Fund has adopted the provisions of Financial Accounting Standards Board Interpretation No. 48 ("FIN 48") "Accounting for Uncertainty in Income Taxes -- an interpretation of FASB Statement No. 109". FIN 48 sets forth a minimum threshold for financial statement recognition of the benefit of a tax position taken, or expected to be taken, in a tax return. The Fund recognizes interest and penalties, if any, related to unrecognized tax benefits as an income tax expense in the Statement of Operations. The Fund is subject to examination by U.S. federal and state tax authorities for returns filed for the prior three fiscal years 2005 - 2007. As of December 31, 2008, the Fund did not have any unrecognized tax benefits.
Income distributions and capital gain distributions are determined in accordance with income tax regulations, which may differ from U.S. generally accepted accounting principles. These differences are primarily due to differing treatments of income and gains on various investment securities held by the Fund, timing differences and differing characterization of distributions made by the Fund as a whole. The Fund may also utilize earnings and profits distributed to shareholders on redemption of shares as a part of the dividends paid deduction for income tax purposes.
As determined on December 31, 2008, permanent differences resulting primarily from different book and tax accounting for foreign currency gains and losses, paydown gains and losses, amortization of bond premium and partnership basis adjustments, were reclassified at fiscal year-end. These reclassifications had no effect on net income, net asset value or net asset value per share of the Fund.
The tax character of distributions paid during the years ended December 31, 2008 and December 31, 2007 was as follows:
| Ordinary Income | | Total | |
| 2008 | | 2007 | | 2008 | | 2007 | |
| $ | 836,556 | | | $ | 875,654 | | | $ | 836,556 | | | $ | 875,654 | | |
16
As of December 31, 2008, the components of distributable earnings (accumulated losses) on a U.S. federal income tax basis were as follows:
Undistributed
Ordinary
Income | | Unrealized
Appreciation
(Depreciation) | | Loss
Carryforwards
and Deferrals | | Total | |
| $ | 498,378 | | | $ | (4,319,738 | ) | | $ | (16,909,145 | ) | | $ | (20,730,505 | ) | |
The difference between book basis and tax basis distributable earnings is attributable primarily to timing differences of wash sales, mark to market on certain futures contracts, amortization of bond premium, partnership basis adjustments, capital loss carryforwards and post October loss deferral.
To the extent the Fund's net realized capital gains, if any, can be offset by capital loss carryforwards, it is the policy of the Fund not to distribute such gains. As determined at December 31, 2008, the Fund had unused capital loss carryforwards available for federal income tax purposes to offset net realized capital gains, if any, as follows:
| | | Expiring in: | |
| | | | 2009 | | | | 2010 | | |
| | | $ | 2,806,578 | | | $ | 13,734,011 | | |
Under current tax law, the use of these losses to offset future gains may be limited in a given year.
During the year ended December 31, 2008, the Fund utilized capital loss carryforwards of $3,649,862.
Under current tax law, certain net capital and net foreign currency losses realized after October 31 within the taxable year may be deferred and treated as occurring on the first day of the following tax year. For the year ended December 31, 2008, the Fund elected to defer $368,556 of net capital losses arising between November 1, 2008 and December 31, 2008.
7 Distributions to shareholders: The Fund may earn income, net of expenses, daily on its investments. Distributions from net investment income and net realized capital gains, if any, generally are distributed in October. Income distributions and capital gain distributions to shareholders are recorded on the ex-date.
8 Foreign taxes: Foreign taxes withheld represent amounts withheld by foreign tax authorities, net of refunds recoverable.
9 Expense allocation: Certain expenses are applicable to multiple funds. Expenses directly attributable to a Series are charged to that Series. Expenses of the Trust that are not directly attributed to a Series are allocated among the Funds, on the basis of relative net assets, except where a more appropriate allocation of expenses to each of the Funds can otherwise be made fairly. Expenses borne by the complex of related investment companies, which includes open-end and closed-end investment companies for which Management serves as investment manager, that are not directly attributed to a Series or the Trust are allocated among the Fund and the other investment companies in the complex or series thereof on the basis of relative net assets, except where a more appropriate allocation of expenses to each investment company in the complex or series thereof can otherwise be made fairly.
10 Financial futures contracts: The Fund may buy and sell financial futures contracts to hedge against changes in securities prices resulting from changes in prevailing interest rates. At the time the Fund enters into a financial futures contract, it is required to deposit with the futures commission merchant a specified amount of cash or liquid securities, known as "initial margin," ranging upward from 1.1% of the value of the financial futures contract being traded. Each day, the futures contract is valued at the official settlement price of the board of trade or U.S. commodity exchange on which such futures contract is traded. Subsequent payments, known as "variation margin," to and from the broker are made on a daily basis as the market price of the financial futures contract fluctuates. Daily variation margin adjustments, arising from this "mark to market," are recorded by the Fund as unrealized gains or losses.
Although some financial futures contracts by their terms call for actual delivery or acceptance of financial instruments, in most cases the contracts are closed out prior to delivery by offsetting purchases or sales of matching
17
financial futures contracts. When the contracts are closed, the Fund recognizes a gain or loss. Risks of entering into futures contracts include the possibility there may be an illiquid market, possibly at a time of rapidly declining prices, and/or a change in the value of the contract may not correlate with changes in the value of the underlying securities.
For U.S. federal income tax purposes, the futures transactions undertaken by the Fund may cause the Fund to recognize gains or losses from marking contracts to market even though its positions have not been sold or terminated, may affect the character of the gains or losses recognized as long-term or short-term, and may affect the timing of some capital gains and losses realized by the Fund. Also, the Fund's losses on transactions involving futures contracts may be deferred rather than being taken into account currently in calculating the Fund's taxable income.
During the year ended December 31, 2008, the Fund entered into financial futures contracts. At December 31, 2008, open positions in financial futures contracts were:
| Expiration | | Open Contracts | | Position | | Unrealized
Appreciation | |
| March 2009 | | 9 U.S. Treasury Notes, 2 Year | | Long | | $ | 20,672 | | |
At December 31, 2008, the Fund had deposited $65,955 in Fannie Mae Whole Loan, 10.42%, due 1/2/09, to cover margin requirements on open financial futures contracts.
11 Security lending: A third party, eSecLending, has assisted the Fund in conducting a bidding process to identify agents/principals that would pay a guaranteed amount to the Fund in consideration of the Fund entering into an exclusive securities lending arrangement.
For part of the year, eSecLending served as exclusive lending agent for the Fund. The Fund was not guaranteed any particular level of income from the lending program.
12 Repurchase agreements: The Fund may enter into repurchase agreements with institutions that Management has determined are creditworthy. Each repurchase agreement is recorded at cost. The Fund requires that the securities purchased in a repurchase agreement be transferred to the custodian in a manner sufficient to enable the Fund to assert a perfected security interest in those securities in the event of a default under the repurchase agreement. The Fund monitors, on a daily basis, the value of the securities transferred to ensure that their value, including accrued interest, is greater than amounts owed to the Fund under each such repurchase agreement.
13 Transactions with other funds managed by Neuberger Berman Management LLC: Pursuant to an Exemptive Order issued by the Securities and Exchange Commission, the Fund may invest in a money market fund managed by Management or an affiliate. The Fund invests in Neuberger Berman Prime Money Fund ("Prime Money"), as approved by the Board. Prime Money seeks to provide the highest available current income consistent with safety and liquidity. For any cash that the Fund invests in Prime Money, Management waives a portion of its management fee equal to the management fee it receives from Prime Money on those assets (the "Arrangement"). For the year ended December 31, 2008, management fees waived under this Arrangement amounted to $712 and are reflected in the Statement of Operations under the caption "Investment management fees waived." For the year ended December 31, 2008, income earned under this Arrangement amounted to $25,648 and is reflected in the Statement of Operations under the caption "Income from investments in affiliated issuers."
14 Dollar rolls: The Fund may enter into dollar roll transactions with respect to mortgage-backed securities. In a dollar roll transaction, the Fund sells securities for delivery in the current month and simultaneously agrees to repurchase substantially similar (i.e., same type and coupon) securities on a specified future date from the same party. During the period before the repurchase, the Fund foregoes principal and interest payments on the securities. The Fund is compensated by the difference between the current sales price and the forward price for the future purchase (often referred to as the "drop"), as well as by the interest earned on the cash proceeds of the initial sale. Dollar rolls may increase fluctuations in the Fund's net asset value and may be viewed as a form of leverage. There is a risk that the counter party will be unable or unwilling to complete the transaction as scheduled, which may result in losses to the Fund.
18
15 Indemnifications: Like many other companies, the Trust's organizational documents provide that its officers and trustees are indemnified against certain liabilities arising out of the performance of their duties to the Trust. In addition, both in some of its principal service contracts and in the normal course of its business, the Trust enters into contracts that provide indemnifications to other parties for certain types of losses or liabilities. The Trust's maximum exposure under these arrangements is unknown as this could involve future claims against the Trust.
Note B--Management Fees, Administration Fees, Distribution Arrangements, and Other Transactions With Affiliates:
Fund shares are issued and redeemed in connection with investments in and payments under certain variable annuity contracts and variable life insurance policies issued through separate accounts of life insurance companies and are also offered directly to qualified pension and retirement plans.
The Fund retains Management as its investment manager under a Management Agreement. For such investment management services, the Fund pays Management a fee at the annual rate of 0.55% of the first $250 million of the Fund's average daily net assets, 0.525% of the next $250 million, 0.50% of the next $250 million, 0.475% of the next $250 million, 0.45% of the next $500 million, 0.425% of the next $2.5 billion, and 0.40% of average daily net assets in excess of $4 billion.
The Fund retains Management as its administrator under an Administration Agreement. The Fund pays Management an administration fee at the annual rate of 0.30% of its average daily net assets under this agreement. Additionally, Management retains State Street Bank and Trust Company ("State Street") as its sub-administrator under a Sub-Administration Agreement. Management pays State Street a fee for all services received under this agreement.
The Board adopted a non-fee distribution plan for the Fund.
Management has contractually undertaken through December 31, 2011 to forgo current payment of fees and/or reimburse the Fund for its operating expenses (excluding the fees payable to Management, interest, taxes, brokerage commissions, extraordinary expenses, and transaction costs) ("Operating Expenses") which exceed, in the aggregate, 1.00% per annum of the Fund's average daily net assets (the "Expense Limitation"). For the year ended December 31, 2008, no reimbursement to the Fund was required. The Fund has agreed to repay Management through December 31, 2014 for fees and expenses foregone and/or its excess Operating Expenses previously reimbursed by Management, so long as its annual Operating Expenses during that period do not exceed its Expense Limitation, and the repayment is made within three years after the year in which Management issued the reimbursement or waived fees. During the year ended December 31, 2008, there was no repayment to Management under this agreement. At December 31, 2008, the Fund had no contingent liability to Management under this agreement.
Neuberger is retained by Management to furnish it with investment recommendations and research information without added cost to the Fund. Several individuals who are officers and/or trustees of the Trust are also employees of Neuberger and/or Management.
The Fund had entered into a commission recapture program, which enabled it to pay some of its operational expenses by recouping a portion of the commissions it paid to a broker that was not a related party of the Fund. Pursuant to the agreement, brokers paid recaptured commissions to the Fund's custodian and the custodian directed these amounts toward payment of expenses such as custodial, transfer agency or accounting services. Effective April 1, 2008, this commission recapture program was terminated. For the period ended March 31, 2008, the impact of this arrangement was a reduction of expenses of $2,073.
The Fund has an expense offset arrangement in connection with its custodian contract. For the year ended December 31, 2008, the impact of this arrangement was a reduction of expenses of $281.
19
Note C--Securities Transactions:
Cost of purchases and proceeds of sales and maturities of long-term securities (excluding short-term securities, financial futures contracts and foreign currency contracts) for the year ended December 31, 2008 were as follows:
Purchases of
U.S. Government
and Agency
Obligations | | Purchases excluding
U.S. Government
and Agency
Obligations | | Sales and Maturities
of U.S. Government
and Agency
Obligations | | Sales and Maturities
excluding
U.S. Government
and Agency
Obligations | |
| $ | 4,121,287 | | | $ | 23,735,176 | | | $ | 5,466,047 | | | $ | 65,600,335 | | |
During the year ended December 31, 2008, brokerage commissions on securities transactions paid to affiliated brokers were as follows: Neuberger received $0 and Lehman Brothers Inc. received $2,692.
Note D--Fund Share Transactions:
Share activity for the years ended December 31, 2008 and December 31, 2007 was as follows:
| | | For the Year Ended December 31, | |
| | | 2008 | | 2007 | |
| Shares Sold | | | 436,916 | | | | 632,711 | | |
| Shares Issued on Reinvestment of Dividends and Distributions | | | 99,828 | | | | 65,250 | | |
| Shares Redeemed | | | (4,480,615 | ) | | | (1,025,707 | ) | |
| Total | | | (3,943,871 | ) | | | (327,746 | ) | |
Note E--Line of Credit:
At December 31, 2008, the Fund was a participant in a single committed, unsecured $150,000,000 line of credit with State Street, to be used only for temporary or emergency purposes. Other investment companies managed by Management also participate in this line of credit on the same terms. Interest is charged on borrowings under this line of credit at the overnight Federal Funds Rate plus 0.50% per annum. A facility fee of 0.07% (as of September 19, 2008, 0.09%) per annum of the available line of credit is charged, of which the Fund has agreed to pay its pro rata share, based on the ratio of its individual net assets to the net assets of all participants at the time the fee is due and payable. The fee is paid quarterly in arrears. Because several investment companies participate, there is no assurance that an individual Fund will have access to all or any part of the $150,000,000 at any particular time. There were no loans outstanding pursuant to this line of credit at December 31, 2008. During the year ended December 31, 2008, the Fund did not utilize this line of credit.
Note F--Investments in Affiliates:
| Name of Issuer | | Balance of
Shares
Held
December 31,
2007 | | Gross
Purchases
and
Additions | | Gross
Sales
and
Reductions | | Balance of
Shares
Held
December 31,
2008 | | Value
December 31,
2008 | | Income from
Investments in
Affiliated
Issuers
Included in
Total Income | |
Neuberger Berman Prime
Money Fund Trust Class* | | | 1,561,262 | | | | 10,001,742 | | | | 11,249,683 | | | | 313,321 | | | $ | 313,321 | | | $ | 25,648 | | |
* Prime Money is also managed by Management and may be considered an affiliate since it has the same officers, Board members, and investment manager as the Fund and because, at times, the Fund may own 5% or more of the outstanding voting securities of Prime Money.
20
Note G--Recent Accounting Pronouncement:
In March 2008, Statement of Financial Accounting Standards No. 161, "Disclosures about Derivative Instruments and Hedging Activities - an amendment of FASB Statement No. 133" ("FAS 161"), was issued. FAS 161 is intended to improve financial reporting for derivative instruments by requiring enhanced disclosure that enables investors to understand how and why an entity uses derivatives, how derivatives are accounted for, and how derivative instruments affect an entity's results of operations and financial position. In September 2008, FASB Staff Position No. 133-1 and FASB Interpretation No. 45-4 (the "FSP"), "Disclosures about Credit Derivatives and Certain Guarantees: An Amendment of FASB Statement No. 133 and FASB Interpretation No. 45; and Clarification of the Effective Date of FASB Statement No. 161" was issued. Certain provisions of the FSP amend FASB Statement No. 133, "Accounting for Derivative Instruments and Hedging Activities," to require disclosures by sellers of credit derivatives, including credit derivatives embedded in hybrid instruments. These FSP provisions are effective for fiscal years and interim periods ending after November 15, 2008. At this time, Management has assessed the implication of these FSP provisions and determined there is no impact to the Fund's financial statements. The FSP also clarifies the effective date of FAS 161, whereby disclosures required by FAS 161 are effective for financial statements issued for fiscal years and interim periods beginning after November 15, 2008. The impact of FAS 161 on the Fund's financial statement disclosures, if any, is currently being assessed.
Note H--Recent Market Events:
The year covered by this report witnessed an unusually high degree of volatility in the financial markets and the net asset values of many mutual funds, including to some extent the Fund. Both domestic and international equity markets have been experiencing heightened volatility and turmoil, with issuers that have exposure to the real estate, mortgage and credit markets particularly affected. In addition to the recent turbulence in financial markets, the reduced liquidity in credit and fixed income markets has negatively affected many issuers worldwide. The Fund's investments in certain issuers, as reflected in the Fund's schedule of investments, and the financial markets in general, expose investors to the volatile performance resulting from these market conditions and related events.
21
Financial Highlights
Balanced Portfolio
The following table includes selected data for a share outstanding throughout each year and other performance information derived from the Financial Statements.
| | | Year Ended December 31, | |
| | | 2008 | | 2007 | | 2006 | | 2005 | | 2004 | |
| Net Asset Value, Beginning of Year | | $ | 13.08 | | | $ | 11.44 | | | $ | 10.42 | | | $ | 9.64 | | | $ | 8.93 | | |
| Income From Investment Operations: | |
| Net Investment Income (Loss)t | | | .09 | | | | .12 | | | | .11 | | | | .04 | | | | .05 | | |
Net Gains or Losses on Securities
(both realized and unrealized) | | | (5.17 | ) | | | 1.67 | | | | 1.00 | | | | .84 | | | | .77 | | |
| Total From Investment Operations | | | (5.08 | ) | | | 1.79 | | | | 1.11 | | | | .88 | | | | .82 | | |
| Less Distributions From: | |
| Net Investment Income | | | (.42 | ) | | | (.15 | ) | | | (.09 | ) | | | (.10 | ) | | | (.11 | ) | |
| Net Asset Value, End of Year | | $ | 7.58 | | | $ | 13.08 | | | $ | 11.44 | | | $ | 10.42 | | | $ | 9.64 | | |
| Total Returntt | | | (39.15 | )% | | | 15.60 | % | | | 10.67 | % | | | 9.18 | % | | | 9.31 | % | |
| Ratios/Supplemental Data | |
| Net Assets, End of Year (in millions) | | $ | 15.5 | | | $ | 78.4 | | | $ | 72.3 | | | $ | 73.7 | | | $ | 81.1 | | |
| Ratio of Gross Expenses to Average Net Assets# | | | 1.29 | % | | | 1.16 | % | | | 1.19 | % | | | 1.14 | % | | | 1.10 | % | |
| Ratio of Net Expenses to Average Net AssetsS | | | 1.29 | % | | | 1.16 | % | | | 1.18 | % | | | 1.13 | % | | | 1.09 | % | |
Ratio of Net Investment Income (Loss) to Average
Net Assets | | | .81 | % | | | 1.00 | % | | | 1.01 | % | | | .41 | % | | | .56 | % | |
| Portfolio Turnover Rate | | | 57 | % | | | 54 | % | | | 62 | % | | | 82 | % | | | 110 | % | |
See Notes to Financial Highlights 22
Notes to Financial Highlights Balanced Portfolio
tt Total return based on per share net asset value reflects the effects of changes in net asset value on the performance of the Fund during each fiscal period and assumes dividends and other distributions, if any, were reinvested. Results represent past performance and do not guarantee future results. Current returns may be lower or higher than the performance data quoted. Investment returns and principal may fluctuate and shares when redeemed may be worth more or less than original cost. Total return would have been lower if Management had not waived certain expenses. The total return information shown does not reflect charges and other expenses that apply to the separate account or the related insurance policies, and the inclusion of these charges and other expenses would reduce the total return for all fiscal periods shown. For the year ended December 31, 2006, Management reimbursed the Fund for losses incurred in connection with the disposition of foreign currency contracts, which had no impact on total return.
# The Fund is required to calculate an expense ratio without taking into consideration any expense reductions related to expense offset arrangements.
t Calculated based on the average number of shares outstanding during each fiscal period.
S After waiver of a portion of the investment management fee by Management. Had Management not undertaken such action, the annualized ratios of net expenses to average daily net assets would have been:
| | | Year Ended December 31, | |
| | | 2008 | | 2007 | | 2006 | | 2005 | | 2004 | |
| | | | 1.29 | % | | | 1.16 | % | | | 1.18 | % | | | 1.13 | % | | | 1.09 | % | |
23
Report of Independent Registered Public Accounting Firm
To the Board of Trustees of
Neuberger Berman Advisers Management Trust and
Shareholders of Balanced Portfolio
We have audited the accompanying statement of assets and liabilities, including the schedule of investments, of Balanced Portfolio, one of the series constituting Neuberger Berman Advisers Management Trust (the "Trust"), as of December 31, 2008, and the related statement of operations for the year then ended, the statement of changes in net assets for each of the two years in the period then ended, and the financial highlights for each of the five years in the period then ended. These financial statements and financial highlights are the responsibility of the Trust's management. Our responsibility is to express an opinion on these financial statements and financial highlights based on our audits.
We conducted our audits in accordance with the standards of the Public Company Accounting Oversight Board (United States). Those standards require that we plan and perform the audit to obtain reasonable assurance about whether the financial statements and financial highlights are free of material misstatement. We were not engaged to perform an audit of the Trust's internal control over financial reporting. Our audits included consideration of internal control over financial reporting as a basis for designing audit procedures that are appropriate in the circumstances, but not for the purpose of expressing an opinion on the effectiveness of the Trust's internal control over financial reporting. Accordingly, we express no such opinion. An audit also includes examining, on a test basis, evidence supporting the amounts and disclosures in the financial statements and financial highlights, assessing the accounting principles used and significant estimates made by management, and evaluating the overall financial statement presentation. Our procedures included confirmation of securities owned as of December 31, 2008 by correspondence with the custodian and brokers or by other appropriate auditing procedures where replies from brokers were not received. We believe that our audits provide a reasonable basis for our opinion.
In our opinion, the financial statements and financial highlights referred to above present fairly, in all material respects, the financial position of Balanced Portfolio, a series of Neuberger Berman Advisers Management Trust, at December 31, 2008, the results of its operations for the year then ended, the changes in its net assets for each of the two years in the period then ended, and the financial highlights for each of the five years in the period then ended, in conformity with U.S. generally accepted accounting principles.

Boston, Massachusetts
February 9, 2009
24
Trustee and Officer Information
The following tables set forth information concerning the trustees and officers of the Trust. All persons named as trustees and officers also serve in similar capacities for other funds administered or managed by Neuberger Berman Management LLC ("NB Management") and Neuberger Berman, LLC ("Neuberger Berman"). The Statement of Additional Information includes additional information about fund trustees and is available upon request, without charge, by calling (800) 877-9700.
Information about the Board of Trustees
Name, (Year of Birth),
and Address(1) | | Position and
Length of
Time Served(2) | | Principal Occupation(s)(3) | | Number of
Funds in Fund
Complex
Overseen by
Fund Trustee | | Other Directorships
Held Outside Fund
Complex by Fund
Trustee | |
| Independent Fund Trustees | |
|
| John Cannon (1930) | | Trustee since 2000 | | Consultant; formerly, Chairman, CDC Investment Advisers (registered investment adviser), 1993 to January 1999; formerly, President and Chief Executive Officer, AMA Investment Advisors, an affiliate of the American Medical Association. | | | 56 | | | Independent Trustee or Director of three series of Oppenheimer Funds: Oppenheimer Limited Term New York Municipal Fund, Rochester Fund Municipals, and Oppenheimer Convertible Securities Fund since 1992. | |
|
| Faith Colish (1935) | | Trustee since 1982 | | Counsel, Carter Ledyard & Milburn LLP (law firm) since October 2002; formerly, Attorney-at-Law and President, Faith Colish, A Professional Corporation, 1980 to 2002. | | | 56 | | | Formerly, Director (1997 to 2003) and Advisory Director (2003 to 2006), ABA Retirement Funds (formerly, American Bar Retirement Association) (not-for-profit membership corporation). | |
|
| Martha C. Goss (1949) | | Trustee since 2007 | | President, Woodhill Enterprises Inc./Chase Hollow Associates LLC (personal investment vehicle), since 2006; Chief Operating and Financial Officer, Hopewell Holdings LLC/ Amwell Holdings, LLC (a holding company for a healthcare reinsurance company start-up), since 2003; formerly, Consultant, Resources Connection (temporary staffing), 2002 to 2006. | | | 56 | | | Director, Ocwen Financial Corporation (mortgage servicing), since 2005; Director, American Water (water utility), since 2003; Director, Channel Reinsurance (financial guaranty reinsurance), since 2006; Advisory Board Member, Attensity (software developer), since 2005; Director, Allianz Life of New York (insurance), since 2005; Director, Financial Women's Association of New York (not for profit association), since 2003; Trustee Emerita, Brown University, since 1998. | |
|
25
Name, (Year of Birth),
and Address(1) | | Position and
Length of
Time Served(2) | | Principal Occupation(s)(3) | | Number of
Funds in Fund
Complex
Overseen by
Fund Trustee | | Other Directorships
Held Outside Fund
Complex by Fund
Trustee | |
| C. Anne Harvey (1937) | | Trustee since 1998 | | President, C.A. Harvey Associates, since October 2001; formerly, Director, AARP, 1978 to December 2001. | | | 56 | | | Formerly, President, Board of Associates to The National Rehabilitation Hospital's Board of Directors, 2001 to 2002; formerly, Member, Individual Investors Advisory Committee to the New York Stock Exchange Board of Directors, 1998 to June 2002. | |
|
| Robert A. Kavesh (1927) | | Trustee since 2000 | | Retired; Marcus Nadler Professor Emeritus of Finance and Economics, New York University Stern School of Business; formerly, Executive Secretary-Treasurer, American Finance Association, 1961 to 1979. | | | 56 | | | Formerly, Director, The Caring Community (not-for-profit), 1997 to 2006; formerly, Director, DEL Laboratories, Inc. (cosmetics and pharmaceuticals), 1978 to 2004; formerly, Director, Apple Bank for Savings, 1979 to 1990; formerly, Director, Western Pacific Industries, Inc., 1972 to 1986 (public company). | |
|
| Michael M. Knetter (1960) | | Trustee since 2007 | | Dean, School of Business, University of Wisconsin - Madison; formerly, Professor of International Economics and Associate Dean, Amos Tuck School of Business - Dartmouth College, 1998 to 2002. | | | 56 | | | Trustee, Northwestern Mutual Series Fund, Inc., since February 2007; Director, Wausau Paper, since 2005; Director, Great Wolf Resorts, since 2004. | |
|
| Howard A. Mileaf (1937) | | Trustee since 1999 | | Retired; formerly, Vice President and General Counsel, WHX Corporation (holding company), 1993 to 2001. | | | 56 | | | Formerly, Director, Webfinancial Corporation (holding company), 2002 to 2008; formerly, Director WHX Corporation (holding company), January 2002 to June 2005; formerly, Director, State Theatre of New Jersey (not-for-profit theater), 2000 to 2005. | |
|
26
Name, (Year of Birth),
and Address(1) | | Position and
Length of
Time Served(2) | | Principal Occupation(s)(3) | | Number of
Funds in Fund
Complex
Overseen by
Fund Trustee | | Other Directorships
Held Outside Fund
Complex by Fund
Trustee | |
| George W. Morriss (1947) | | Trustee since 2007 | | Retired; formerly, Executive Vice President and Chief Financial Officer, People's Bank, Connecticut (a financial services company), 1991 to 2001. | | | 56 | | | Manager, Old Mutual 2100 fund complex (consisting of six funds) since October 2006 for four funds and since February 2007 for two funds; formerly, Member NASDAQ Issuers' Affairs Committee, 1995 to 2003. | |
|
| Edward I. O'Brien (1928) | | Trustee since 2000 | | Retired; formerly, Member, Investment Policy Committee, Edward Jones, 1993 to 2001; President, Securities Industry Association ("SIA") (securities industry's representative in government relations and regulatory matters at the federal and state levels), 1974 to 1992; Adviser to SIA, November 1992 to November 1993. | | | 56 | | | Formerly, Director, Legg Mason, Inc. (financial services holding company), 1993 to July 2008; formerly, Director, Boston Financial Group (real estate and tax shelters), 1993 to 1999. | |
|
| William E. Rulon (1932) | | Trustee since 2000 | | Retired; formerly, Senior Vice President, Foodmaker, Inc. (operator and franchiser of restaurants), until January 1997. | | | 56 | | | Formerly, Director, Pro-Kids Golf and Learning Academy (teach golf and computer usage to "at risk" children), 1998 to 2006; formerly, Director, Prandium, Inc. (restaurants), March 2001 to July 2002. | |
|
| Cornelius T. Ryan (1931) | | Trustee since 2000 | | Founding General Partner, Oxford Partners and Oxford Bioscience Partners (venture capital investing) and President, Oxford Venture Corporation, since 1981. | | | 56 | | | None. | |
|
27
Name, (Year of Birth),
and Address(1) | | Position and
Length of
Time Served(2) | | Principal Occupation(s)(3) | | Number of
Funds in Fund
Complex
Overseen by
Fund Trustee | | Other Directorships
Held Outside Fund
Complex by Fund
Trustee | |
| Tom D. Seip (1950) | | Trustee since 2000; Chairman of the Board since 2008; Lead Independent Trustee from 2006 to 2008 | | General Partner, Seip Investments LP (a private investment partnership); formerly, President and CEO, Westaff, Inc. (temporary staffing), May 2001 to January 2002; formerly, Senior Executive at the Charles Schwab Corporation, 1983 to 1998, including Chief Executive Officer, Charles Schwab Investment Management, Inc., and Trustee, Schwab Family of Funds and Schwab Investments, 1997 to 1998, and Executive Vice President-Retail Brokerage, Charles Schwab & Co., Inc., 1994 to 1997. | | | 56 | | | Director, H&R Block, Inc. (financial services company), since May 2001; Chairman, Compensation Committee, H&R Block, Inc., since 2006; formerly, Director, Forward Management, Inc. (asset management company), 1999 to 2006. | |
|
| Candace L. Straight (1947) | | Trustee since 1999 | | Private investor and consultant specializing in the insurance industry; formerly, Advisory Director, Securitas Capital LLC (a global private equity investment firm dedicated to making investments in the insurance sector), 1998 to December 2003. | | | 56 | | | Director, Montpelier Re (reinsurance company), since 2006; formerly, Director, National Atlantic Holdings Corporation (property and casualty insurance company), 2004 to 2008; formerly, Director, The Proformance Insurance Company (property and casualty insurance company), 2004 to 2008; formerly, Director, Providence Washington Insurance Company (property and casualty insurance company), December 1998 to March 2006; formerly, Director, Summit Global Partners (insurance brokerage firm), 2000 to 2005. | |
|
| Peter P. Trapp (1944) | | Trustee since 1984 | | Retired; formerly, Regional Manager for Mid-Southern Region, Ford Motor Credit Company, September 1997 to 2007; formerly, President, Ford Life Insurance Company, April 1995 to August 1997. | | | 56 | | | None. | |
|
28
Name, (Year of Birth),
and Address(1) | | Position and
Length of
Time Served(2) | | Principal Occupation(s)(3) | | Number of
Funds in Fund
Complex
Overseen by
Fund Trustee | | Other Directorships
Held Outside Fund
Complex by Fund
Trustee | |
| Fund Trustees who are "Interested Persons" | |
|
| Jack L. Rivkin* (1940) | | Trustee since 2002; President from 2002 to 2008 | | Formerly, Executive Vice President and Chief Investment Officer, Neuberger Berman Holdings LLC (holding company), 2002 to August 2008 and 2003 to August 2008, respectively; formerly, Managing Director and Chief Investment Officer, Neuberger Berman, December 2005 to August 2008 and 2003 to August 2008, respectively; formerly, Executive Vice President, Neuberger Berman, December 2002 to 2005; formerly, Director and Chairman, NB Management, December 2002 to August 2008; formerly, Executive Vice President, Citigroup Investments, Inc., September 1995 to February 2002; formerly, Executive Vice President, Citigroup Inc., September 1995 to February 2002. | | | 56 | | | Director, Dale Carnegie and Associates, Inc. (private company), since 1998; Director, Solbright, Inc. (private company), since 1998. | |
|
29
Name, (Year of Birth),
and Address(1) | | Position and
Length of
Time Served(2) | | Principal Occupation(s)(3) | | Number of
Funds in Fund
Complex
Overseen by
Fund Trustee | | Other Directorships
Held Outside Fund
Complex by Fund
Trustee | |
| Robert Conti* (1956) | | Chief Executive Officer, President and Director since 2008; prior thereto, Executive Vice President in 2008 and Vice President 2000 to 2008 | | Managing Director, Neuberger Berman, since 2007; formerly, Senior Vice President, Neuberger Berman, 2003 to 2006; formerly, Vice President, Neuberger Berman, 1999 to 2003; President and Chief Executive Officer, NB Management, since 2008; formerly, Senior Vice President, NB Management, 2000 to 2008. | | | 56 | | | Chairman of the Board, Staten Island Mental Health Society since 2008. | |
|
(1) The business address of each listed person is 605 Third Avenue, New York, New York 10158.
(2) Pursuant to the Trust's Trust Instrument, each Fund Trustee shall hold office for life or until his or her successor is elected or the Trust terminates; except that (a) any Fund Trustee may resign by delivering a written resignation; (b) any Fund Trustee may be removed with or without cause at any time by a written instrument signed by at least two-thirds of the other Fund Trustees; (c) any Fund Trustee who requests to be retired, or who has become unable to serve, may be retired by a written instrument signed by a majority of the other Fund Trustees; and (d) any Fund Trustee may be removed at any shareholder meeting by a vote of at least two-thirds of the outstanding shares.
(3) Except as otherwise indicated, each individual has held the positions shown for at least the last five years.
* Indicates a Fund Trustee who is an "interested person" within the meaning of the 1940 Act. Mr. Conti is an interested person of the Trust by virtue of the fact that he is an officer of NB Management and Neuberger Berman. Mr. Rivkin may be deemed an interested person of the Trust by virtue of the fact that, until August 2008, he was a director of NB Management and an officer of Neuberger Berman.
30
Information about the Officers of the Trust
Name, (Year of Birth),
and Address(1) | | Position and
Served(2) | | Principal Occupation(s)(3)
Length of Time | |
| Andrew B. Allard (1961) | | Anti-Money Laundering Compliance Officer since 2002 | | Senior Vice President, Neuberger Berman, since 2006; Deputy General Counsel, Neuberger Berman, since 2004; formerly, Vice President, Neuberger Berman, 2000 to 2005; formerly, Associate General Counsel, Neuberger Berman, 1999 to 2004; Anti-Money Laundering Compliance Officer, eleven registered investment companies for which NB Management acts as investment manager and administrator (six since 2002, two since 2003, two since 2004 and one since 2006). | |
|
| Michael J. Bradler (1970) | | Assistant Treasurer since 2005 | | Vice President, Neuberger Berman, since 2006; Employee, NB Management, since 1997; Assistant Treasurer, eleven registered investment companies for which NB Management acts as investment manager and administrator (ten since 2005 and one since 2006). | |
|
| Claudia A. Brandon (1956) | | Executive Vice President since 2008 and Secretary since 1985 | | Senior Vice President, Neuberger Berman, since 2007 and Employee since 1999; formerly, Vice President, Neuberger Berman, 2002 to 2006; Senior Vice President, NB Management, since 2008 and Assistant Secretary since 2004; formerly, Vice President-Mutual Fund Board Relations, NB Management, 2000 to 2008; Executive Vice President, eleven registered investment companies for which NB Management acts as investment manager and administrator (eleven since 2008); Secretary, eleven registered investment companies for which NB Management acts as investment manager and administrator (three since 1985, three since 2002, two since 2003, two since 2004 and one since 2006). | |
|
| Maxine L. Gerson (1950) | | Executive Vice President since 2008 and Chief Legal Officer since 2005 (only for purposes of sections 307 and 406 of the Sarbanes-Oxley Act of 2002) | | Senior Vice President, Neuberger Berman, since 2002; Deputy General Counsel and Assistant Secretary, Neuberger Berman, since 2001; Senior Vice President, NB Management, since 2006; Secretary and General Counsel, NB Management, since 2004; Executive Vice President, eleven registered investment companies for which NB Management acts as investment manager and administrator (eleven since 2008); Chief Legal Officer (only for purposes of sections 307 and 406 of the Sarbanes-Oxley Act of 2002), eleven registered investment companies for which NB Management acts as investment manager and administrator (ten since 2005 and one since 2006). | |
|
| Sheila R. James (1965) | | Assistant Secretary since 2002 | | Vice President, Neuberger Berman, since 2008 and Employee since 1999; formerly, Assistant Vice President, Neuberger Berman, 2007; Assistant Secretary, eleven registered investment companies for which NB Management acts as investment manager and administrator (six since 2002, two since 2003, two since 2004 and one since 2006). | |
|
| Brian Kerrane (1969) | | Vice President since 2008 | | Senior Vice President, Neuberger Berman, since 2006; formerly, Vice President, Neuberger Berman, 2002 to 2006; Vice President, NB Management, since 2008 and Employee since 1991; Vice President, eleven registered investment companies for which NB Management acts as investment manager and administrator (eleven since 2008). | |
|
31
Name, (Year of Birth),
and Address(1) | | Position and
Served(2) | | Principal Occupation(s)(3)
Length of Time | |
| Kevin Lyons (1955) | | Assistant Secretary since 2003 | | Assistant Vice President, Neuberger Berman, since 2008 and Employee since 1999; Assistant Secretary, eleven registered investment companies for which NB Management acts as investment manager and administrator (eight since 2003, two since 2004 and one since 2006). | |
|
| Owen F. McEntee, Jr. (1961) | | Vice President since 2008 | | Vice President, Neuberger Berman, since 2006; Employee, NB Management, since 1992; Vice President, eleven registered investment companies for which NB Management acts as investment manager and administrator (eleven since 2008). | |
|
| John M. McGovern (1970) | | Treasurer and Principal Financial and Accounting Officer since 2005; prior thereto, Assistant Treasurer since 2002 | | Senior Vice President, Neuberger Berman, since 2007; formerly, Vice President, Neuberger Berman, 2004 to 2006; Employee, NB Management, since 1993; Treasurer and Principal Financial and Accounting Officer, eleven registered investment companies for which NB Management acts as investment manager and administrator (ten since 2005 and one since 2006); formerly, Assistant Treasurer, eleven registered investment companies for which NB Management acts as investment manager and administrator, 2002 to 2005. | |
|
| Andrew Provencher (1965) | | Vice President since 2008 | | Managing Director, NB Management, since 2008; Managing Director, Neuberger Berman, since 2005; formerly, Senior Vice President, Neuberger Berman, 2003 to 2005; formerly, Vice President, Neuberger Berman, 1999 to 2003; Vice President, eleven registered investment companies for which NB Management acts as investment manager and administrator (eleven since 2008). | |
|
| Frank Rosato (1971) | | Assistant Treasurer since 2005 | | Vice President, Neuberger Berman, since 2006; Employee, NB Management, since 1995; Assistant Treasurer, eleven registered investment companies for which NB Management acts as investment manager and administrator (ten since 2005 and one since 2006). | |
|
| Neil S. Siegel (1967) | | Vice President since 2008 | | Managing Director, NB Management, since 2008; Managing Director, Neuberger Berman, since 2006; formerly, Senior Vice President, Neuberger Berman, 2004 to 2006; Vice President, eleven registered investment companies for which NB Management acts as investment manager and administrator (eleven since 2008); formerly, Head of Institutional Marketing, Morgan Stanley Investment Management, 1993 to 2004. | |
|
32
Name, (Year of Birth),
and Address(1) | | Position and
Served(2) | | Principal Occupation(s)(3)
Length of Time | |
| Chamaine Williams (1971) | | Chief Compliance Officer since 2005 | | Senior Vice President, Neuberger Berman, since 2007; Chief Compliance Officer, NB Management, since 2006; Senior Vice President, Lehman Brothers Inc., since 2007; formerly, Vice President, Lehman Brothers Inc., 2003 to 2006; Chief Compliance Officer, eleven registered investment companies for which NB Management acts as investment manager and administrator (ten since 2005 and one since 2006); formerly, Chief Compliance Officer, Lehman Brothers Asset Management Inc., 2003 to 2007; formerly, Chief Compliance Officer, Lehman Brothers Alternative Investment Management LLC, 2003 to 2007; formerly, Vice President, UBS Global Asset Management (US) Inc. (formerly, Mitchell Hutchins Asset Management, a wholly-owned subsidiary of PaineWebber Inc.), 1997 to 2003. | |
|
(1) The business address of each listed person is 605 Third Avenue, New York, New York 10158.
(2) Pursuant to the By-Laws of the Trust, each officer elected by the Fund Trustees shall hold office until his or her successor shall have been elected and qualified or until his or her earlier death, inability to serve, or resignation. Officers serve at the pleasure of the Fund Trustees and may be removed at any time with or without cause.
(3) Except as otherwise indicated, each individual has held the positions shown for at least the last five years.
33
Proxy Voting Policies and Procedures
A description of the policies and procedures that the Trust uses to determine how to vote proxies relating to portfolio securities is available, without charge, by calling 1-800-877-9700 (toll-free) and on the website of the Securities and Exchange Commission, at www.sec.gov. Information regarding how the Trust voted proxies relating to portfolio securities during the most recent 12-month period ended June 30 is also available, without charge, by calling 1-800-877-9700 (toll-free), on the website of the Securities and Exchange Commission at www.sec.gov, and on Management's website at www.nb.com.
Quarterly Portfolio Schedule
The Trust files a complete schedule of portfolio holdings for the Fund with the Securities and Exchange Commission for the first and third quarters of each fiscal year on Form N-Q. The Trust's Forms N-Q are available on the Securities and Exchange Commission's website at www.sec.gov and may be reviewed and copied at the Securities and Exchange Commission's Public Reference Room in Washington, DC. Information on the operation of the Public Reference Room may be obtained by calling 1-800-SEC-0330. The information on Form N-Q is available upon request, without charge, by calling 1-800-877-9700 (toll free).
Notice to Shareholders (Unaudited)
16.47% of the dividends distributed during the fiscal year ended December 31, 2008 qualifies for the dividends received deduction for corporate shareholders.
Board Consideration of the Management and Sub-Advisory Agreements
At a meeting held on September 25, 2008, the Board of Trustees of Neuberger Berman Advisers Management Trust ("Board"), including the Trustees who are not "interested persons" of Neuberger Berman Management LLC ("Management") or Neuberger Berman Advisers Management Trust ("Independent Fund Trustees"), approved the continuance of the Management and Sub-Advisory Agreements ("Agreements") between Management and Balanced Portfolio ("Fund").
In evaluating the Agreements, the Board, including the Independent Fund Trustees, reviewed materials furnished by Management and Neuberger Berman, LLC ("Neuberger") in response to questions submitted by counsel to the Independent Fund Trustees, and met with senior representatives of Management and Neuberger regarding their personnel and operations. The Independent Fund Trustees were advised by counsel that is experienced in Investment Company Act of 1940 matters and that is independent of Management and Neuberger. The Independent Fund Trustees received a memorandum from independent counsel discussing the legal standards for their consideration of the proposed continuance of the Agreements. They met with such counsel separately from representatives of Management to discuss the annual contract review. The annual contract review extends over two regular meetings of the Board to ensure that Management and Neuberger have time to respond to any questions the Independent Fund Trustees may have on their initial review of the report and that the Independent Fund Trustees have time to consider those responses. In addition, during this process, the Board held a separate meeting devoted primarily to reviewing and discussing Fund performance.
The Board considered the following factors, among others, in connection with its approval of the continuance of the Agreements: (1) the nature, extent, and quality of the services provided by Management and Neuberger; (2) the performance of the Fund compared to a relevant market index and a peer group of investment companies; (3) the costs of the services provided and profits or losses realized by Management and its affiliates from their relationship with the Fund; (4) the extent to which economies of scale might be realized as the Fund grows; and (5) whether fee levels reflect any such potential economies of scale for the benefit of investors in the Fund. In their deliberations, the Board members did not
34
identify any particular information that was all-important or controlling, and each Trustee may have attributed different weights to the various factors.
The Board considered the continued integrity of Management and Neuberger as organizations, despite the bankruptcy filing by Lehman Brothers Holdings Inc. The Board discussed the efforts made by Management and Neuberger to retain employees, and the reported likelihood that such employees would be retained. The Board discussed the provisions that were being made for ancillary services by Management, Neuberger and their affiliates.
The Board evaluated the terms of the Agreements, the overall fairness of the Agreements to the Fund and whether the Agreements were in the best interests of the Fund and its shareholders.
With respect to the nature, extent and quality of the services provided, the Board considered the performance of the Fund and the experience and staffing of the portfolio management and investment research personnel who perform services for the Fund. The Board noted that Management also provides certain administrative services, including fund accounting and compliance oversight. The Board also considered Management's and Neuberger's policies and practices regarding brokerage. The Board considered the quality of brokerage execution obtained by Management. The Board's Portfolio Transactions and Pricing Committee from time to time reviewed the quality of the brokerage services that Neuberger and Lehman Brothers Inc. had provided, and periodically reviews studies by an independent firm engaged to review and evaluate the quality of brokerage execution received by the Fund. The Board also reviewed whether Management and Neuberger used brokers to execute Fund transactions that provide research and other services to Management and Neuberger, and the types of benefits potentially derived from such services by Management, Neuberger, the Fund and other clients of Management and Neuberger. In addition, the Board noted the positive compliance history of Management and Neuberger, as each firm has been free of significant compliance problems.
The Board considered the performance of the Fund relative to its benchmark and a peer group of investment companies dedicated to insurance products pursuing broadly similar strategies. The Board also considered performance in relation to the degree of risk undertaken by the portfolio managers. The Board discussed the Fund's performance with Management and discussed steps that Management had taken, or intended to take, to improve the Fund's performance. The Board also considered Management's resources and responsiveness with respect to the Fund.
With respect to the overall fairness of the Agreements, the Board considered the fee structure for the Fund under the Agreements as compared to a peer group of comparable funds dedicated to insurance products and any fall-out benefits likely to accrue to Management or Neuberger or their affiliates from their relationship with the Fund. The Board also considered the profitability of Management and its affiliates from their association with the Fund.
The Board reviewed a comparison of the Fund's management fee and overall expense ratio to a peer group of broadly comparable funds dedicated to insurance products. The Board considered the mean and median of the management fees and expense ratios of the peer group. The Board noted that the Fund's management fee was higher than the peer group mean and median. The Board considered whether specific portfolio management or administration needs contributed to the higher fee. With regard to the sub-advisory fee paid to Neuberger, the Board noted that this fee is "at cost." In addition, the Board considered the contractual limit on Fund expenses undertaken by Management.
The Board considered whether there were other funds that were advised or sub-advised by Management or its affiliates or separate accounts managed by Management or its affiliates with similar investment objectives, policies and strategies to the Fund. The Board noted that there were no comparable advised or sub-advised funds. The Board considered the appropriateness and reasonableness of any differences between the fees charged to the Fund and the separate accounts and determined that the differences in fees were consistent with the management and other services provided.
The Board also evaluated any apparent or anticipated economies of scale in relation to the services Management provides to the Fund. The Board considered that the Fund's fee structure which provides for a reduction of payments resulting from the use of breakpoints and whether those breakpoints are set at appropriate asset levels.
In concluding that the benefits accruing to Management and its affiliates by virtue of their relationship to the Fund were reasonable in comparison with the costs of providing the investment advisory services and the benefits accruing to the Fund, the Board reviewed specific data as to Management's profit on the Fund for a recent period and the trend in profit
35
or loss over recent years. The Board also carefully examined Management's cost allocation methodology and in recent years had an independent consultant review the methodology. It also reviewed an analysis from an independent data service on profitability margins in the investment management industry. The Board recognized that Management should be entitled to earn a reasonable level of profits for services it provides to the Fund and, based on its review, concluded that Management's level of profitability was not excessive.
Conclusions
In approving the Agreements, the Board concluded that the terms of each Agreement are fair and reasonable and that approval of the Agreements is in the best interests of the Fund and its shareholders. In reaching this determination, the Board considered that Management and Neuberger could be expected to provide a high level of service to the Fund; that it retained confidence in Management's and Neuberger's capabilities to manage the Fund; that the Fund's fee structure appeared to the Board to be reasonable given the nature and quality of services provided; and that the benefits accruing to Management and its affiliates by virtue of their relationship to the Fund were reasonable in comparison with the benefits accruing to the Fund.
Board Consideration of New and Interim Management and Sub-Advisory Agreements
Lehman Brothers Holdings Inc. ("Lehman Brothers") has entered into an agreement to sell a controlling interest in the Fund's investment adviser. Under the agreement, Lehman Brothers would sell substantially all of the Neuberger Berman business and the fixed income business and certain alternative asset management businesses of Lehman Brother's Investment Management Division (collectively, the "Acquired Businesses") to NBSH Acquisition, LLC (the "Proposed Acquisition"). NBSH Acquisition, LLC ("NBSH") was organized by key members of Neuberger Berman's management for the purpose of facilitating the acquisition of the Acquired Businesses. At the closing of the Proposed Acquisition, a majority interest in the Acquired Businesses will be directly or indirectly owned by portfolio managers, Neuberger Berman's management team and certain key members and senior professionals of the former Investment Management Division ("Management Members"), as well as by Lehman Brothers and certain affiliates of Lehman Brothers.
The Acquired Businesses include Neuberger Berman Management LLC ("Management") and Neuberger Berman, LLC ("Neuberger"), the adviser and sub-adviser to the Fund, respectively. The Proposed Acquisition has been deemed to result in an "assignment" of the Fund's existing Management Agreement and Sub-Advisory Agreement (the "Existing Agreements") under the 1940 Act. As required by the 1940 Act, the Fund's Existing Agreements provide for their automatic termination in the event of an assignment, and each will terminate upon the consummation of the Proposed Acquisition. Accordingly, on December 17, 2008, the Board approved new Management and Sub-Advisory Agreements with Management and Neuberger, respectively, or their successors (together, the "Advisers"), on the same terms and with the same compensation structure as are currently in effect (together, "New Agreements"), which would take effect upon consummation of the Proposed Acquisition if approved by the Fund's shareholders.
If shareholders of the Fund do not approve the New Agreements before the Proposed Acquisition is completed, the Board has approved interim Management and Sub-Advisory Agreements with Management and Neuberger, respectively, or their successors (together, "Interim Agreements") pending approval of the New Agreements by shareholders of the Fund. Compensation earned by the Advisers under the Interim Agreements would be held in an interest-bearing escrow account pending shareholder approval of the New Agreements. If shareholders approve the New Agreements within 150 days from the termination of the Existing Agreements, the amount held in the escrow account, including interest, will be paid to the Advisers, as appropriate. If shareholders of the Fund do not approve the New Agreements, the Advisers will be paid the lesser of the costs incurred in performing their services under the Interim Agreements or the total amount in the escrow account, including interest earned. If at the end of 150 days following termination of a Fund's Existing Agreements the Fund's shareholders still have not approved the New Agreements, the Trustees would take such actions as they deem to be in the best interests of the Fund and its shareholders, which may include negotiating a new Management Agreement and/or new Sub-Advisory Agreement with an advisory organization selected by the Board of Trustees or making other arrangements.
36
The Trustees of the Trust discussed the Proposed Acquisition on December 17, 2008. Prior to submitting its bid to public auction, Management met telephonically with the Independent Trustees to brief them on the Proposed Acquisition. Following the public auction wherein NBSH was determined to be the successful bidder, the Independent Trustees again met telephonically with Management to obtain additional information about the Proposed Acquisition. The Independent Trustees, with the assistance of independent counsel, prepared due diligence requests that were presented to Management and appointed a Task Force of Independent Trustees to lead the due diligence effort ("Task Force").
Management provided written responses to the due diligence requests. After extensive review and analysis and discussions during a telephonic and in person meeting of the Independent Trustees, the Task Force submitted clarifying questions. The Independent Trustees met as a body in person to receive the report of the Task Force and consider the New Agreements. Throughout the process, the Task Force and the Independent Trustees were advised by experienced 1940 Act counsel that is independent of Management and NBSH. In addition, the Independent Trustees received a memorandum from independent counsel discussing the legal standards for their consideration of the New Agreements.
Consideration of the New Agreements followed shortly on the heels of the Independent Trustees' annual consideration of whether to renew the Existing Agreements, carried out pursuant to Section 15(c) of the 1940 Act. In that process, which began prior to the June 2008 quarterly meeting of the Board and was concluded at the September 2008 quarterly meeting, the Independent Trustees, following an extensive review of materials submitted by Management and a report from an independent data service, unanimously determined that the Existing Agreements were fair and reasonable and that their renewal would be in the best interests of the Fund and its shareholders. Accordingly, in considering the New Agreements, the Independent Trustees took into account the fact that the terms of the New Agreements would be identical to those of the Existing Agreements in every respect except for the term and termination date and potentially the name of the investment adviser. The Board considerations in connection with the New Agreements and the Existing Agreements also entered into the decision by the Board to approve the Interim Agreements, which would take effect if the shareholders of the Fund do not approve the New Agreements before the Proposed Acquisition is completed. The Independent Trustees' consideration of the Existing Agreements is described above.
In evaluating the proposed New Agreements, the Independent Trustees considered that they have generally been satisfied with the nature and quality of the services provided to the Fund by Management and Neuberger, including investment advisory, administrative and support services, and that the Fund would be best served by an arrangement that appeared likely to maintain the continuity and stability of the providers of these services. Accordingly, the Independent Trustees considered very carefully the intentions of NBSH (including its successors or assign) regarding capitalization, management structure, staffing, compensation and staff retention and whether these seemed designed to provide the desired continuity and stability. They inquired specifically about staffing and resources in the areas of portfolio management, investment research, trading, fund accounting, legal and compliance, internal audit, and senior executive staff. Although at the time the Board considered the New Agreements no final decisions had been reached as to the distribution of equity interests in NBSH (or its successor or assign), the Trustees were advised that senior members of management, including the Fund Trustee and nominee for Fund Trustee who are employed by the Advisers, would receive equity interests in NBSH. Because of these interests, as well as any future employment arrangements with the Advisers, these persons, individually or in the aggregate, could have a material interest in the Proposed Acquisition and in shareholder approval of the New Agreements. In considering the New Agreements, the Trustees were aware of these interests.
The Independent Trustees inquired whether NBSH (or its successors or assign) had specific plans for the future structure of the Neuberger Berman Funds, whether they plan to propose to eliminate any Funds, and whether they intend to continue or alter certain expansion plans that are already underway. They also inquired whether there are plans to change the fees or expense structure of any of the Funds. The Independent Trustees inquired about the long-term plans for the Advisers, including any expectations for cost savings or expense reductions. They also inquired about the capital structure and working capital likely to be available to NBSH (or its successors or assign).
The Independent Trustees considered the following factors, in addition to the factors discussed above, among others, in connection with their consideration of the New Agreements: (1) the nature, extent, and quality of the services provided by Management and Neuberger; (2) the performance of the Fund compared to a relevant market index and a peer group
37
of investment companies; (3) the costs of the services provided and profits or losses realized by Management and its affiliates from their relationship with the Fund; (4) the extent to which economies of scale might be realized as the Fund grows; and (5) whether fee levels reflect any such potential economies of scale for the benefit of investors in the Fund. In their deliberations, the Independent Trustees did not identify any particular information that was all important or controlling, and each Trustee may have attributed different weights to the various factors.
In unanimously approving and recommending the New Agreements, the Independent Trustees concluded that the terms of each New Agreement are fair and reasonable and that approval of the New Agreements is in the best interests of the Fund and its shareholders. In reaching this determination, the Independent Trustees considered the following factors, among others:
(1) that the terms of the New Agreements are identical in all material respects to those of the Existing Agreements;
(2) that the Advisers will maintain operational autonomy and continuity of management following the Proposed Acquisition;
(3) the favorable history, reputation, qualification, and background of Management and Neuberger, as well as the qualifications of each entity's personnel and each entity's respective financial condition;
(4) the commitment of NBSH (or its successors or assign) to retain key personnel currently employed by Management and Neuberger who currently provide services to the Fund;
(5) the commitment of NBSH (or its successors or assign) to maintaining the current level and quality of Fund services;
(6) the proposed division of equity in NBSH (or its successor or assign) among Management Members and other personnel upon consummation of the Proposed Acquisition;
(7) the fees and expense ratio of the Fund relative to comparable mutual funds;
(8) that the fees are identical to those paid under the Existing Agreements;
(9) that the fees and expense ratios of the Fund appear to the Board to be reasonable given the quality of services expected to be provided;
(10) the commitment of Management to maintaining the Fund's current contractual expense limitation agreements to ensure that Fund shareholders of funds that have such arrangements in place do not face an increase in expenses upon consummation of the Proposed Acquisition;
(11) the performance of the Fund relative to comparable mutual funds and unmanaged indices;
(12) the commitment of Management (or its successor) to pay the expenses of the Fund in connection with the Proposed Acquisition, including all expenses in connection with the solicitation of proxies, so that shareholders of the Fund would not have to bear such expenses;
(13) the actual and potential effects on the Advisers of the bankruptcy of Lehman Brothers, and the effects of the Lehman Brothers bankruptcy on the information considered by the Independent Trustees in their prior analyses of the principal service contracts;
(14) the provisions made to continue providing to the Advisers certain services that were previously provided to them by or through Lehman Brothers or its other affiliates;
(15) the possible benefits that may be realized by the Fund and by the Advisers as a result of the Proposed Acquisition; and
(16) that the Proposed Acquisition is expected to maintain continuity of management of the Fund and may reduce the potential for future vulnerability to changes in control of the Advisers that could be adverse to the Fund's interests and that could affect the retention of key employees providing services to the Fund.
38

Neuberger Berman
Advisers Management Trust
Guardian Portfolio
I Class Shares
S Class Shares
Annual Report
December 31, 2008
B1016 02/09
Guardian Portfolio Manager's Commentary
During 2008, there was virtually no place to hide in the stock market. All 10 S&P 500 sectors declined, with nine of 10 losing more than 20%. The Financials sector dropped by more than 55%. Even traditionally defensive groups such as Consumer Staples, Health Care and Utilities closed the year with double-digit percentage losses. For the year, the Neuberger Berman Advisers Management Trust (AMT) Guardian Portfolio slightly trailed its S&P 500 benchmark.
In terms of stock selection, the Portfolio outperformed in four of the eight sectors in which it was invested - one of our lower stock picking batting averages in recent years. We believe this is in large part due to indiscriminate selling, including forced liquidations by highly leveraged hedge funds faced with margin calls, mutual funds raising cash to meet redemption requests, and panic selling by investors abandoning equities for the safety of U.S. government securities.
Our research driven process, focused on company fundamentals and valuations, did not provide an advantage in 2008. As was the case for the broader market, the Portfolio failed to generate positive returns in any sector. However, holdings in Industrials, Materials and Financials outperformed corresponding S&P 500 sector components. In the Industrials sector, a positive return for trash hauler Waste Management, one of our larger holdings, enhanced relative returns. In the Materials sector, the performance of industrial gas company Praxair, our sole investment in this sector, also helped relative performance. In Financials, we benefited from superior relative returns from leading financial transaction processor State Street (which was sold in July 2008) and the world's largest futures and options exchange, CME Group. In general, we believe our strategy since 2006 of avoiding more credit sensitive financial companies worked to the Portfolio's advantage.
Relative performance was penalized by positions in the Energy and Consumer Discretionary sectors. The Portfolio was underweighted in Energy, but performance suffered due to our concentration in exploration, production and services companies, which were hit much harder than the more diversified integrated oils as energy prices collapsed from mid-summer highs. Oil services giant Schlumberger and exploration and production company Newfield Exploration were among our disappointments in this sector. Consumer Discretionary investments underperformed by a smaller margin, but the Portfolio's substantial overweighting in this sector was a drag on returns. Auto parts manufacturer BorgWarner and media companies Liberty Global and Scripps Networks Interactive were among our losing positions. The Portfolio was also hurt by what it didn't own -- namely Consumer Staples stocks - the S&P 500's best performing sector.
The turmoil in the credit markets has undermined virtually every economy in the world. We currently believe the global economy is likely to slow into early 2009 with a gradual period of stabilization to follow. Eventually, we think lower food and fuel costs may offset some of the pressures on consumer budgets, and lower commodity costs may provide some relief to companies experiencing a decline in demand for their products. Finally, we believe that aggressive efforts by U.S. and international authorities to stimulate economic growth could take root in the latter part of 2009.
The economic and market shocks of 2008 have shaken investor confidence, especially in equities. We believe the economic turmoil will bring about changes that could be a long-term benefit to certain businesses. In addition, the market drop provides an opportunity to invest in such advantaged businesses at compelling valuations.
1
Although the near-term prospects for the economy and corporate earnings growth remain clouded by the turmoil in the financial markets, we note that, following the last three recessions, we saw extended periods of nominal GDP growth ranging from approximately 40% to more than 70%. While the timing of an economic turn is hard to predict, the longer term opportunity therefore is, as we currently see it, attractive for good quality businesses. We continue to focus our time and attention on identifying financially strong companies well positioned to increase market share in their respective businesses and grow earnings faster than their peers across stock market cycles. Today, more of the stocks of such "advantaged growth" companies conform to our value discipline, giving us greater confidence that our investment methodology will add value in the years ahead.
Sincerely,

Arthur Moretti
Portfolio Manager
2
Guardian Portfolio
SECTOR ALLOCATION
| (% of Equity Market Value) | |
| Energy | | | 10.6 | % | |
| Materials | | | 3.1 | | |
| Industrials | | | 18.8 | | |
| Consumer Discretionary | | | 20.8 | | |
| Health Care | | | 7.7 | | |
| Financials | | | 15.0 | | |
| Information Technology | | | 19.4 | | |
| Utilities | | | 4.6 | | |
| Total | | | 100.0 | % | |
>
AVERAGE ANNUAL TOTAL RETURN1
| | | Inception
Date | | 1 Year | | 5 Year | | 10 Year | | Life of
Fund* | |
| Guardian Portfolio Class I | | 11/03/97 | | | (37.24 | %) | | | (0.83 | %) | | | 0.62 | % | | | 3.53 | % | |
| Guardian Portfolio Class S2 | | 08/02/02 | | | (37.36 | %) | | | (1.07 | %) | | | 0.47 | % | | | 3.39 | % | |
| S&P 5003 | | | | | (37.00 | %) | | | (2.19 | %) | | | (1.38 | %) | | | 1.57 | % | |
>
Performance data quoted represent past performance, which is no guarantee of future results. The investment return and principal value of an investment will fluctuate so that an investor's shares, when redeemed may be worth more or less than their original cost. Results are shown on a "total return" basis and include reinvestment of all dividends and capital gain distributions.
Current performance may be lower or higher than the performance data quoted. For performance data current to the most recent month end, please visit https://www.nb.com.
* Index returns are as of the inception date 11/03/97.
As stated in the Portfolio's most recent prospectus, the total annual fund operating expense ratio for fiscal year 2007 was 1.00% and 1.25% for Class I and Class S shares, respectively (prior to any fee waivers or expense reimbursements). Neuberger Berman Management LLC has contractually agreed to limit certain expenses of the Portfolio through 12/31/2011.
COMPARISON OF A $10,000 INVESTMENT
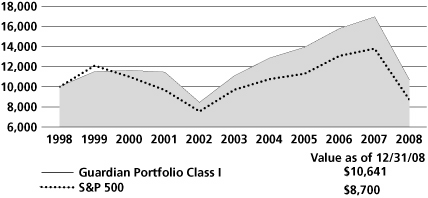
The chart shows the value of a hypothetical $10,000 investment in the Portfolio over the past 10 fiscal years, or since the Portfolio's inception, if it has not operated for 10 years. The graphs are based on Class I shares only; performance of other classes will vary due to differences in fee structures (see Average Annual Total Return chart above). The results are compared with benchmarks, which may include a broad-based market index and/or a narrower index. Please note that market indexes do not include expenses. All results include the reinvestment of dividends and capital gain distributions. Results represent past performance and do not indicate future results. The chart and table do not reflect the deduction of taxes that a shareholder would pay on Portfolio distributions or the redemption of Portfolio shares.
Please see Endnotes for additional information.
3
Endnotes
1 "Total Return" includes reinvestment of all income dividends and capital gain distributions. Results represent past performance and do not indicate future results. The value of an investment in the Portfolio and the return on the investment both will fluctuate, and redemption process may be higher or lower than an investor's original cost. The performance information does not reflect fees and expenses of the variable annuity and variable life insurance policies or the pension plans whose proceeds are invested in the Portfolio. Neuberger Berman Management LLC ("NBM LLC") has agreed to absorb certain expenses of the AMT Portfolios, including the Portfolio. Without this arrangement, which is subject to change, the total returns of the Portfolio may have been less.
2 Performance shown prior to August 2, 2002 for the Class S shares is of the Class I shares, which has lower expenses and correspondingly higher returns than Class S shares.
3 The S&P 500 Index is widely regarded as the standard for measuring large-cap U.S. stock market performance and includes a representative sample of leading companies in leading industries. Please note that indices do not take into account any fees and expenses of investing in the individual securities that they track and that individuals cannot invest directly in any index. Data about the performance of this index is prepared or obtained by NBM LLC and include reinvestment of all dividends and capital gain distributions. The Portfolio may invest directly in many securities not included in the above-described index.
Any ratios or other measurements using a factor of forecasted earnings of a company discussed herein are based on consensus estimates, not NBM LLC's own projections, and they may or may not be realized. In addition, any revision to a forecast could affect the market price of a security. By quoting them herein, NBM LLC does not offer an opinion as to the accuracy of and does not guarantee these forecasted numbers.
The investments for the Portfolio are managed by the same portfolio manager(s) who manage one or more other mutual funds that have similar names, investment objectives and investment styles as the Portfolio. You should be aware that the Portfolio is likely to differ from the other mutual funds in size, cash flow pattern and tax matters.
Accordingly, the holdings and performance of the Portfolio can be expected to vary from those of the other mutual funds.
The composition, industries and holdings of the Portfolio are subject to change.
Shares of the separate AMT Portfolios are sold only through the currently effective prospectus and are not available to the general public. Shares of this Portfolio may be purchased only by life insurance companies to be used with their separate accounts that fund variable annuity and variable life insurance policies and by qualified pension and retirement plans.
(c)2009 Neuberger Berman Management LLC distributor. All rights reserved.
4
Information About Your Fund's Expenses
This table is designed to provide information regarding costs related to your investments. All mutual funds incur operating expenses, which include management fees, fees for administrative services and costs of shareholder reports, among others. The following examples are based on an investment of $1,000 made at the beginning of the six month period ended December 31, 2008 and held for the entire period. The table illustrates the fund's costs in two ways:
| Actual Expenses and Performance: | | The first section of the table provides information about actual account values and actual expenses in dollars, based on the fund's actual performance during the period. You may use the information in this line, together with the amount you invested, to estimate the expenses you paid over the period. Simply divide your account value by $1,000 (for example, an $8,600 account value divided by $1,000 = 8.6), then multiply the result by the number in the first section of the table under the heading entitled "Expenses Paid During the Period" to estimate the expenses you paid over the period. | |
|
Hypothetical Example for
Comparison Purposes: | | The second section of the table provides information about hypothetical account values and hypothetical expenses based on the fund's actual expense ratio and an assumed rate of return at 5% per year before expenses. This return is not the fund's actual return. The hypothetical account values and expenses may not be used to estimate the actual ending account balance or expenses you paid for the period. You may use this information to compare the ongoing costs of investing in this fund versus other funds. To do so, compare the expenses shown in this 5% hypothetical example with the 5% hypothetical examples that appear in the shareholder reports of other funds. | |
|
>
Please note that the expenses in the table are meant to highlight your ongoing costs only. The table and expense example do not include any transactional costs, such as fees and expenses that are, or may be, imposed under your variable contract or qualified pension plan. Therefore, the information under the heading "Hypothetical (5% annual return before expenses)" is useful in comparing ongoing costs only, and will not help you determine the relative total costs of owning different funds. In addition, if these transactional costs were included, your costs would have been higher.
Expense Information as of 12/31/08 (Unaudited)
NEUBERGER BERMAN ADVISERS MANAGEMENT TRUST GUARDIAN PORTFOLIO
| Actual | | Beginning Account
Value
7/1/08 | | Ending Account
Value
12/31/08 | | Expenses Paid
During the Period*
7/1/08 - 12/31/08 | | Expense
Ratio | |
| Class I | | $ | 1,000.00 | | | $ | 690.70 | | | $ | 4.42 | | | | 1.04 | % | |
| Class S | | $ | 1,000.00 | | | $ | 690.10 | | | $ | 5.35 | | | | 1.26 | % | |
| Hypothetical (5% annual return before expenses)** | |
| Class I | | $ | 1,000.00 | | | $ | 1,019.91 | | | $ | 5.28 | | | | 1.04 | % | |
| Class S | | $ | 1,000.00 | | | $ | 1,018.80 | | | $ | 6.39 | | | | 1.26 | % | |
>
* For each class of the fund, expenses are equal to the annualized expense ratio for the class, multiplied by the average account value over the period, multiplied by 184/366 (to reflect the one-half year period shown).
** Hypothetical 5% annual return before expenses is calculated by multiplying the number of days in the most recent half year divided by 366.
5
Schedule of Investments Guardian Portfolio
| NUMBER OF SHARES | | | | MARKET VALUEt | |
| Common Stocks (97.1%) | | | |
| Auto Components (2.0%) | | | |
| | 109,260 | | | BorgWarner, Inc. | | $ | 2,378,590 | | |
| Automobiles (2.0%) | | | |
| | 34,625 | | | Toyota Motor ADR | | | 2,265,860 | | |
| Biotechnology (4.5%) | | | |
| | 72,100 | | | Genzyme Corp. | | | 4,785,277 | *E | |
| | 80,000 | | | Medarex, Inc. | | | 446,400 | * | |
| | | | 5,231,677 | | |
| Capital Markets (5.2%) | | | |
| | 130,715 | | | Bank of New York Mellon | | | 3,703,156 | | |
| | 140,936 | | | Charles Schwab | | | 2,278,935 | | |
| | | | 5,982,091 | | |
| Commercial Services & Supplies (6.6%) | | | |
| | 112,650 | | | Republic Services | | | 2,792,594 | E | |
| | 146,360 | | | Waste Management | | | 4,850,370 | | |
| | | | 7,642,964 | | |
| Diversified Financial Services (3.4%) | | | |
| | 4,600 | | | CME Group | | | 957,306 | | |
| | 35,700 | | | IntercontinentalExchange Inc. | | | 2,943,108 | *E | |
| | | | 3,900,414 | | |
Electronic Equipment, Instruments &
Components (7.8%) | | | |
| | 129,895 | | | Anixter International | | | 3,912,437 | *E | |
| | 209,750 | | | National Instruments | | | 5,109,510 | | |
| | | | 9,021,947 | | |
| Energy Equipment & Services (3.0%) | | | |
| | 82,575 | | | Schlumberger Ltd. | | | 3,495,400 | | |
| Health Care Providers & Services (2.0%) | | | |
| | 88,195 | | | UnitedHealth Group | | | 2,345,987 | | |
| Industrial Conglomerates (3.5%) | | | |
| | 69,860 | | | 3M Co. | | | 4,019,744 | | |
| Industrial Gases (3.0%) | | | |
| | 58,370 | | | Praxair, Inc. | | | 3,464,843 | | |
| Insurance (6.0%) | | | |
| | 220,875 | | | Progressive Corp. | | | 3,271,159 | | |
| | 148,100 | | | Willis Group Holdings | | | 3,684,728 | | |
| | | | 6,955,887 | | |
>
| NUMBER OF SHARES | | | | MARKET VALUEt | |
| Life Science Tools & Services (1.0%) | | | |
| | 21,600 | | | Millipore Corp. | | $ | 1,112,832 | * | |
| Machinery (4.9%) | | | |
| | 100,690 | | | Danaher Corp. | | | 5,700,061 | | |
| Media (16.2%) | | | |
| | 347,075 | | | Comcast Corp. Class A
Special | | | 5,605,261 | | |
| | 158,430 | | | Liberty Global Class A | | | 2,522,206 | *E | |
| | 34,345 | | | Liberty Global Class C | | | 521,357 | * | |
| | 224,125 | | | Scripps Networks
Interactive | | | 4,930,750 | E | |
| | 13,097 | | | Washington Post | | | 5,111,104 | E | |
| | | | 18,690,678 | | |
| Multi-Utilities (4.4%) | | | |
| | 522,653 | | | National Grid | | | 5,139,881 | | |
| Oil, Gas & Consumable Fuels (7.3%) | | | |
| | 186,945 | | | BG Group PLC | | | 2,572,227 | | |
| | 48,275 | | | Cimarex Energy | | | 1,292,805 | E | |
| | 134,800 | | | Newfield Exploration | | | 2,662,300 | * | |
| | 76,450 | | | Petroleo Brasileiro ADR | | | 1,872,260 | | |
| | | | 8,399,592 | | |
| Road & Rail (3.3%) | | | |
| | 102,675 | | | Canadian National
Railway | | | 3,774,333 | | |
Semiconductors & Semiconductor
Equipment (8.1%) | | | |
| | 379,175 | | | Altera Corp. | | | 6,336,014 | E | |
| | 192,595 | | | Texas Instruments | | | 2,989,075 | E | |
| | | | 9,325,089 | | |
| Software (2.9%) | | | |
| | 143,400 | | | Intuit Inc. | | | 3,411,486 | *E | |
| | | | | Total Common Stocks
(Cost $133,618,091) | | | 112,259,356 | | |
| Short-Term Investments (25.3%) | | | |
| | 4,338,662 | | | Neuberger Berman Prime
Money Fund Trust Class | | | 4,338,662 | a | |
| | 24,866,639 | | | Neuberger Berman
Securities Lending
Quality Fund, LLC | | | 24,866,639 | tt | |
| | | | | Total Short-Term Investments
(Cost $29,205,301) | | | 29,205,301 | | |
| | | | | Total Investments (122.4%)
(Cost $162,823,392) | | | 141,464,657 | ## | |
| | | | | Liabilities, less cash, receivables
and other assets [(22.4%)] | | | (25,865,158 | ) | |
| | | | | Total Net Assets (100.0%) | | $ | 115,599,499 | | |
>
See Notes to Schedule of Investments 6
Notes to Schedule of Investments Guardian Portfolio
t Investments in equity securities by Neuberger Berman Advisers Management Trust Guardian Portfolio (the "Fund") are valued by obtaining valuations from an independent pricing service. The independent pricing service values equity securities at the latest sale price when that price is readily available. Securities traded primarily on the NASDAQ Stock Market are normally valued by the Fund at the NASDAQ Official Closing Price ("NOCP") provided by NASDAQ each business day. The NOCP is the most recently reported price as of 4:00:02 p.m., Eastern time, unless that price is outside the range of the "inside" bid and asked prices (i.e., the bid and asked prices that dealers quote to each other when trading for their own accounts); in that case, NASDAQ will adjust the price to equal the inside bid or asked price, whichever is closer. Because of delays in reporting trades, the NOCP may not be based on the price of the last trade to occur before the market closes. If there is no reported sale of a security on a particular day, the independent pricing service may value the security based on reported market quotations. If a valuation is not available from an independent pricing service, the Fund seeks to obtain quotations from principal market makers. If such quotations are not readily available, securities are valued using methods the Board of Trustees of Neuberger Berman Advisers Management Trust (the "Board") has approved on the belief that they reflect fair value. Numerous factors may be considered when determining the fair value of a security, including available analyst, media or other reports, trading in futures or ADRs and whether the issuer of the security being fair valued has other securities outstanding. Foreign security prices are furnished by independent quotation services and expressed in local currency values. Foreign security prices are currently translated from the local currency into U.S. dollars using the exchange rate as of 4:00 p.m., Eastern time. The Board has approved the use of Interactive Data Pricing and Reference Data, Inc. ("Interactive") to assist in determining the fair value of the Fund's foreign equity securities when changes in the value of a certain index suggest that the closing prices on the foreign exchanges may no longer represent the amount that the Fund could expect to receive for those securities. In this event, Interactive will provide adjusted prices for certain foreign equity securities using a statistical analysis of historical correlations of multiple factors. In the absence of precise information about the market values of these foreign securities as of the close of the New York Stock Exchange, the Board has determined on the basis of available data that prices adjusted in this way are likely to be closer to the prices the Fund could realize on a current sale than are the prices of those securities established at the close of the foreign markets in which the securities primarily trade. Fair value prices are necessarily estimates, and there is no assurance that such a price will be at or close to the price at which the security next trades. Short-term debt securities with less than 60 days until maturity may be valued at cost which, when combined with interest earned, approximates market value.
The Fund adopted Financial Accounting Standards Board ("FASB") Statement of Financial Accounting Standards No. 157, Fair Value Measurements ("FAS 157"), effective January 1, 2008. In accordance with FAS 157, "fair value" is defined as the price that a Fund would receive upon selling an investment in an orderly transaction to an independent buyer in the principal or most advantageous market for the investment. Various inputs are used in determining the value of the Fund's investments.
In addition to defining fair value, FAS 157 established a three-tier hierarchy of inputs to establish a classification of fair value measurements for disclosure purposes. The three-tier hierarchy of inputs is summarized in the three broad Levels listed below.
. Level 1 - quoted prices in active markets for identical investments
. Level 2 - other significant observable inputs (including quoted prices for similar investments, interest rates, prepayment speeds, credit risk, amortized cost, etc.)
. Level 3 - significant unobservable inputs (including the Fund's own assumptions in determining the fair value of investments)
The inputs or methodology used for valuing an investment are not necessarily an indication of the risk associated with investing in those securities.
See Notes to Financial Statements 7
Notes to Schedule of Investments Guardian Portfolio (cont'd)
The following is a summary of the inputs used to value the Fund's investments as of December 31, 2008:
Investments in
Valuation Inputs | | Securities | |
| Level 1 - Quoted Prices | | $ | 112,259,356 | | |
| Level 2 - Other Significant Observable Inputs | | | 29,205,301 | | |
| Level 3 - Significant Unobservable Inputs | | | - | | |
| Total | | $ | 141,464,657 | | |
>
## At December 31, 2008, the cost of investments for U.S. federal income tax purposes was $163,542,177. Gross unrealized appreciation of investments was $5,195,232 and gross unrealized depreciation of investments was $27,272,752, resulting in net unrealized depreciation of $22,077,520, based on cost for U.S. federal income tax purposes.
* Security did not produce income during the last twelve months.
E All or a portion of this security is on loan (see Note A of Notes to Financial Statements).
t Managed by an affiliate of Neuberger Berman Management LLC and could be deemed an affiliate of the Fund (see Notes A & F of Notes to Financial Statements).
a Neuberger Berman Prime Money Fund ("Prime Money") is also managed by Neuberger Berman Management LLC and may be considered an affiliate since it has the same officers, Board members, and investment manager as the Fund and because, at times, the Fund may own 5% or more of the outstanding voting securities of Prime Money (see Notes A & F of Notes to Financial Statements).
See Notes to Financial Statements 8
Statement of Assets and Liabilities
Neuberger Berman Advisers Management Trust
| | | GUARDIAN
PORTFOLIO | |
| | | December 31, 2008 | |
| Assets | |
| Investments in securities, at market value*t (Notes A & F)-see Schedule of Investments: | |
| Unaffiliated issuers | | $ | 112,259,356 | | |
| Affiliated issuers | | | 29,205,301 | | |
| | | | 141,464,657 | | |
| Cash | | | 16,454 | | |
| Dividends and interest receivable | | | 234,046 | | |
| Receivable for Fund shares sold | | | 138,613 | | |
| Receivable for securities lending income (Note A) | | | 13,826 | | |
| Prepaid expenses and other assets | | | 328 | | |
| Total Assets | | | 141,867,924 | | |
| Liabilities | |
| Due to custodian | | | 738 | | |
| Payable for collateral on securities loaned (Note A) | | | 24,845,721 | | |
| Payable for Fund shares redeemed | | | 1,253,221 | | |
| Payable to investment manager-net (Notes A & B) | | | 51,255 | | |
| Payable to administrator-net (Note B) | | | 31,394 | | |
| Payable for securities lending fees (Note A) | | | 29,222 | | |
| Accrued expenses and other payables | | | 56,874 | | |
| Total Liabilities | | | 26,268,425 | | |
| Net Assets at value | | $ | 115,599,499 | | |
| Net Assets consist of: | |
| Paid-in capital | | $ | 142,528,380 | | |
| Undistributed net investment income (loss) | | | 764,274 | | |
| Accumulated net realized gains (losses) on investments | | | (6,331,817 | ) | |
| Net unrealized appreciation (depreciation) in value of investments | | | (21,361,338 | ) | |
| Net Assets at value | | $ | 115,599,499 | | |
| Net Assets | |
| Class I | | $ | 67,019,893 | | |
| Class S | | | 48,579,606 | | |
| Shares Outstanding ($.001 par value; unlimited shares authorized) | |
| Class I | | | 5,382,863 | | |
| Class S | | | 3,925,134 | | |
| Net Asset Value, offering and redemption price per share | |
| Class I | | $ | 12.45 | | |
| Class S | | | 12.38 | | |
| t Securities on loan, at market value: | |
| Unaffiliated issuers | | $ | 24,311,667 | | |
| * Cost of Investments: | |
| Unaffiliated issuers | | $ | 133,618,091 | | |
| Affiliated issuers | | | 29,205,301 | | |
| Total cost of investments | | $ | 162,823,392 | | |
>
See Notes to Financial Statements 9
Statement of Operations
Neuberger Berman Advisers Management Trust
| | | GUARDIAN
PORTFOLIO | |
| | | For the
Year Ended
December 31, 2008 | |
| Investment Income: | |
| Income (Note A): | |
| Dividend income-unaffiliated issuers | | $ | 2,388,334 | | |
| Income from securities loaned-net (Note F) | | | 12,266 | | |
| Income from investments in affiliated issuers (Note F) | | | 126,025 | | |
| Foreign taxes withheld | | | (37,233 | ) | |
| Total income | | $ | 2,489,392 | | |
| Expenses: | |
| Investment management fees (Notes A & B) | | | 814,259 | | |
| Administration fees (Note B): | |
| Class I | | | 308,421 | | |
| Class S | | | 135,720 | | |
| Distribution fees (Note B): | |
| Class S | | | 113,100 | | |
| Audit fees | | | 40,493 | | |
| Custodian fees (Note B) | | | 88,448 | | |
| Insurance expense | | | 4,094 | | |
| Legal fees | | | 27,636 | | |
| Shareholder reports | | | 44,785 | | |
| Trustees' fees and expenses | | | 38,134 | | |
| Miscellaneous | | | 5,673 | | |
| Total expenses | | | 1,620,763 | | |
| Expenses reimbursed by administrator (Note B) | | | (10,820 | ) | |
| Investment management fees waived (Note A) | | | (4,039 | ) | |
| Expenses reduced by custodian fee expense offset and commission recapture arrangements (Note B) | | | (5,837 | ) | |
| Total net expenses | | | 1,600,067 | | |
| Net investment income (loss) | | $ | 889,325 | | |
| Realized and Unrealized Gain (Loss) on Investments (Note A) | |
| Net realized gain (loss) on: | |
| Sales of investment securities of unaffiliated issuers | | | (6,308,370 | ) | |
| Sales of investment securities of affiliated issuers | | | (21,689 | ) | |
| Foreign currency | | | (16,652 | ) | |
| Change in net unrealized appreciation (depreciation) in value of: | |
| Unaffiliated investment securities | | | (60,371,902 | ) | |
| Foreign currency | | | 1,130 | | |
| Net gain (loss) on investments | | | (66,717,483 | ) | |
| Net increase (decrease) in net assets resulting from operations | | $ | (65,828,158 | ) | |
>
See Notes to Financial Statements 10
Statements of Changes in Net Assets
Neuberger Berman Advisers Management Trust
| | | GUARDIAN PORTFOLIO | |
| | | Year Ended
December 31,
2008 | | Year Ended
December 31,
2007 | |
| Increase (Decrease) in Net Assets: | |
| From Operations: | |
| Net investment income (loss) | | $ | 889,325 | | | $ | 853,243 | | |
| Net realized gain (loss) on investments | | | (6,346,711 | ) | | | 14,887,665 | | |
| Change in net unrealized appreciation (depreciation) of investments | | | (60,370,772 | ) | | | (5,064,959 | ) | |
| Net increase (decrease) in net assets resulting from operations | | | (65,828,158 | ) | | | 10,675,949 | | |
| Distributions to Shareholders From (Note A): | |
| Net investment income: | |
| Class I | | | (546,055 | ) | | | (390,689 | ) | |
| Class S | | | (299,501 | ) | | | (62,076 | ) | |
| Net realized gain on investments: | |
| Class I | | | (3,740,998 | ) | | | - | | |
| Class S | | | (2,289,506 | ) | | | - | | |
| Total distributions to shareholders | | | (6,876,060 | ) | | | (452,765 | ) | |
| From Fund Share Transactions (Note D): | |
| Proceeds from shares sold: | |
| Class I | | | 16,825,253 | | | | 18,503,529 | | |
| Class S | | | 40,133,729 | | | | 31,107,831 | | |
| Proceeds from reinvestment of dividends and distributions: | |
| Class I | | | 4,287,053 | | | | 390,689 | | |
| Class S | | | 2,589,007 | | | | 62,076 | | |
| Payments for shares redeemed: | |
| Class I | | | (35,390,290 | ) | | | (54,758,765 | ) | |
| Class S | | | (1,813,712 | ) | | | (357,627 | ) | |
| Net increase (decrease) from Fund share transactions | | | 26,631,040 | | | | (5,052,267 | ) | |
| Net Increase (Decrease) in Net Assets | | | (46,073,178 | ) | | | 5,170,917 | | |
| Net Assets: | |
| Beginning of year | | | 161,672,677 | | | | 156,501,760 | | |
| End of year | | $ | 115,599,499 | | | $ | 161,672,677 | | |
| Undistributed net investment income (loss) at end of year | | $ | 764,274 | | | $ | 844,917 | | |
>
See Notes to Financial Statements 11
Notes to Financial Statements Guardian Portfolio
Note A-Summary of Significant Accounting Policies:
1 General: Guardian Portfolio (the "Fund") is a separate operating series of Neuberger Berman Advisers Management Trust (the "Trust"), a Delaware statutory trust organized pursuant to a Trust Instrument dated May 23, 1994. The Trust is currently comprised of ten separate operating series (each a "Series," collectively, the "Funds") each of which is diversified. The Trust is registered as an open-end management investment company under the Investment Company Act of 1940, as amended (the "1940 Act"), and its shares are registered under the Securities Act of 1933, as amended. The Fund currently offers Class I and Class S shares. The Board of Trustees of the Trust (the "Board") may establish additional series or classes of shares without the approval of shareholders.
The assets of each Series belong only to that Series, and the liabilities of each Series are borne solely by that Series and no other.
The preparation of financial statements in accordance with U.S. generally accepted accounting principles requires Neuberger Berman Management LLC ("Management") to make estimates and assumptions at the date of the financial statements. Actual results could differ from those estimates.
Management, the investment manager of the Fund, and Neuberger Berman, LLC ("Neuberger"), the Fund's sub-adviser, are wholly owned subsidiaries of Lehman Brothers Holdings Inc. ("Lehman Brothers"), a publicly owned holding company. On September 15, 2008, Lehman Brothers filed a voluntary petition under Chapter 11 of the U.S. Bankruptcy Code. On December 3, 2008, NBSH Acquisition, LLC ("NBSH"), an entity organized by key members of Neuberger Berman's senior management, was selected as the successful bidder in the public auction to acquire a majority interest in Neuberger Berman's business and the fixed income and certain alternative asset management businesses of Lehman Brothers' Investment Management Division (together with Neuberger Berman, the "Acquired Businesses") (the "Proposed Acquisition"). On December 22, 2008, the bankruptcy court having jurisdiction over the Lehman Brothers matter approved the sale of the Acquired Businesses to NBSH (or its successor or assign), as the successful bidder. At the closing of the Proposed Acquisition, a majority interest in the Acquired Businesses will be directly or indirectly owned by portfolio managers, Neuberger Berman's management team and certain key members and senior professionals of the former Investment Management Division, as well as by Lehman Brothers and certain affiliates of Lehman Brothers. The transaction is subject to certain conditions and approvals.
These events, while affecting Lehman Brothers, have not had a material impact on the Fund or its operations. Management and Neuberger will continue to operate in the ordinary course of business as the investment manager and sub-adviser of the Fund.
Included in the Acquired Businesses are Management and Neuberger. The consummation of the Proposed Acquisition has been deemed to result in an "assignment" of the Fund's Management and Sub-Advisory Agreements which would, by law, automatically terminate those agreements. Accordingly, the Board, including the Trustees who are not "interested persons" of the Fund's investment manager and its affiliates or the Fund, has approved the new Management Agreements and Sub-Advisory Agreements for the Fund. The new agreements also will require the approval of the Fund's shareholders.
2 Portfolio valuation: Investment securities are valued as indicated in the notes following the Schedule of Investments.
3 Foreign currency translation: The accounting records of the Fund are maintained in U.S. dollars. Foreign currency amounts are currently translated into U.S. dollars using the exchange rates as of 4:00 p.m., Eastern time, to determine the value of investments, other assets and liabilities. Purchase and sale prices of securities, and income and expenses, are translated into U.S. dollars at the prevailing rate of exchange on the respective dates of such transactions. Net unrealized foreign currency gain (loss), if any, arises from changes in the value of assets and liabilities, other than investments in securities, as a result of changes in exchange rates and is stated separately in the Statement of Operation.
12
4 Securities transactions and investment income: Securities transactions are recorded on trade date for financial reporting purposes. Dividend income is recorded on the ex-dividend date or, for certain foreign dividends, as soon as the Fund becomes aware of the dividends. Non-cash dividends included in dividend income, if any, are recorded at the fair market value of the securities received. Interest income, including accretion of original issue discount, where applicable, and accretion of discount on short-term investments, is recorded on the accrual basis. Realized gains and losses from securities transactions and foreign currency transactions, if any, are recorded on the basis of identified cost and stated separately in the Statement of Operations. Included in net realized gain (loss) on investments are proceeds from the settlements of class action litigation in which the Fund participated as a plaintiff. The amount of such proceeds for the year ended December 31, 2008 was $177,257.
5 Income tax information: The Funds are treated as separate entities for U.S. federal income tax purposes. It is the policy of the Fund to continue to qualify as a regulated investment company by complying with the requirements of Subchapter M of the Internal Revenue Code applicable to regulated investment companies and to distribute substantially all of its earnings to its shareholders. Therefore, no federal income or excise tax provision is required.
The Fund has adopted the provisions of Financial Accounting Standards Board Interpretation No. 48 ("FIN 48") "Accounting for Uncertainty in Income Taxes-an interpretation of FASB Statement No. 109". FIN 48 sets forth a minimum threshold for financial statement recognition of the benefit of a tax position taken, or expected to be taken, in a tax return. The Fund recognizes interest and penalties, if any, related to unrecognized tax benefits as an income tax expense in the Statement of Operations. The Fund is subject to examination by U.S. federal and state tax authorities for returns filed for the prior three fiscal years 2005 - 2007. As of December 31, 2008, the Fund did not have any unrecognized tax benefits.
Income distributions and capital gain distributions are determined in accordance with income tax regulations, which may differ from U.S. generally, accepted accounting principles. These differences are primarily due to differing treatments of income and gains on various investment securities held by the Fund, timing differences and differing characterization of distributions made by the Fund as a whole. The Fund may also utilize earnings and profits distributed to shareholders on redemption of shares as a part of the dividends paid deduction for income tax purposes.
As determined on December 31, 2008, permanent differences resulting primarily from different book and tax accounting for foreign currency gains and losses and capital gain distributions from real estate investment trusts were reclassified at fiscal year-end. These reclassifications had no effect on net income, net asset value or net asset value per share of the Fund.
The tax character of distributions paid during the years ended December 31, 2008 and December 31, 2007 was as follows:
| Distributions Paid From: | |
| Ordinary Income | | Long-Term Gain | | Total | |
| 2008 | | 2007 | | 2008 | | 2007 | | 2008 | | 2007 | |
| $ | 845,556 | | | $ | 452,765 | | | $ | 6,030,504 | | | $ | - | | | $ | 6,876,060 | | | $ | 452,765 | | |
>
As of December 31, 2008, the components of distributable earnings (accumulated losses) on a U.S. federal income tax basis were as follows:
Undistributed
Ordinary
Income | | Undistributed
Long-Term
Gain | | Unrealized
Appreciation
(Depreciation) | | Loss
Carryforwards
and Deferrals | | Total | |
| $ | 764,274 | | | $ | - | | | $ | (22,080,120 | ) | | $ | (5,613,035 | ) | | $ | (26,928,881 | ) | |
>
The difference between book basis and tax basis distributable earnings is attributable primarily to timing differences of wash sales, partnership basis adjustments, capital loss carryforwards and post October loss deferral.
13
To the extent the Fund's net realized capital gains, if any, can be offset by capital loss carryforwards, it is the policy of the Fund not to distribute such gains. As determined at December 31, 2008, the Fund had unused capital loss carryforwards available for federal income tax purposes to offset net realized capital gains, if any, as follows:
| Expiring In: | |
| 2016 | |
| $ | 2,513,391 | | |
>
Under current tax law, certain net capital and net foreign currency losses realized after October 31 within the taxable year may be deferred and treated as occurring on the first day of the following tax year. For the year ended December 31, 2008, the Fund elected to defer $3,099,644 net capital losses arising between November 1, 2008 and December 31, 2008.
6 Distributions to shareholders: The Fund may earn income, net of expenses, daily on its investments. Distributions from net investment income and net realized capital gains, if any, generally are distributed in October. Income distributions and capital gain distributions to shareholders are recorded on the ex-date.
7 Foreign taxes: Foreign taxes withheld represent amounts withheld by foreign tax authorities, net of refunds recoverable.
8 Expense allocation: Certain expenses are applicable to multiple funds. Expenses directly attributable to a Series are charged to that Series. Expenses of the Trust that are not directly attributed to a Series are allocated among the Funds, on the basis of relative net assets, except where a more appropriate allocation of expenses to each of the Funds can otherwise be made fairly. Expenses borne by the complex of related investment companies, which includes open-end and closed-end investment companies for which Management serves as investment manager, that are not directly attributed to a Series or the Trust are allocated among the Fund and the other investment companies in the complex or series thereof on the basis of relative net assets, except where a more appropriate allocation of expenses to each investment company in the complex or series thereof can otherwise be made fairly. The Fund's expenses (other than those specific to each class) are allocated proportionally each day between the classes based upon the relative net assets of each class.
9 Security lending: A third party, eSecLending, has assisted the Fund in conducting a bidding process to identify agents/principals that would pay a guaranteed amount to the Fund in consideration of the Fund entering into an exclusive securities lending arrangement.
eSecLending currently serves as exclusive lending agent for the Fund. Under the securities lending arrangement, the Fund receives cash collateral at the beginning of each transaction equal to at least 102% of the prior day's market value of the loaned securities (105% in the case of international securities). The Fund may invest all the cash collateral in Neuberger Berman Securities Lending Quality Fund, LLC ("Quality Fund"), a fund managed by Lehman Brothers Asset Management LLC ("LBAM"), an affiliate of Management.
At various times during the course of the Fund's fiscal year ended December 31, 2008, the Quality Fund's NAV was below $1.00 per share, which could have affected the NAV of the Fund with securities loans outstanding during the period. The Quality Fund's price per share on December 31, 2008 was $1.00. The market value of the Fund's investments in the Quality Fund as of that date, if any, is reflected in the Fund's Schedule of Investments. If it were necessary to liquidate assets in the Quality Fund to meet returns on outstanding securities loans at a time when the Quality Fund's price per share was less than $1.00, the Fund may not receive an amount from the Quality Fund that is equal in amount to the collateral the Fund would be required to return to the borrower of the securities and the Fund would be required to make up for this shortfall. In addition, as a result of recent reduced liquidity in the credit and fixed income markets, it may be difficult to dispose quickly of some securities in the Quality Fund at the price at which the Quality Fund is carrying them. The Quality Fund is not a money market fund that operates in accordance with Rule 2a-7 under the 1940 Act and there is no assurance that it will maintain a $1.00 share price.
14
Net income from the lending program represents the guaranteed amount received from a principal plus income earned on the cash collateral invested in Quality Fund or in other investments, less cash collateral fees and other expenses associated with the loans. For the fiscal year ended December 31, 2008, the Fund received net income under the securities lending arrangement of $12,266, which is reflected in the Statement of Operations under the caption "Income from securities loaned-net." For the fiscal year ended December 31, 2008, "Income from securities loaned-net" consisted of $171,808 in income earned on cash collateral and guaranteed amounts (including $135,353 of interest income earned from the Quality Fund), less fees and expenses paid of $159,542.
10 Repurchase agreements: The Fund may enter into repurchase agreements with institutions that Management has determined are creditworthy. Each repurchase agreement is recorded at cost. The Fund requires that the securities purchased in a repurchase agreement be transferred to the custodian in a manner sufficient to enable the Fund to assert a perfected security interest in those securities in the event of a default under the repurchase agreement. The Fund monitors, on a daily basis, the value of the securities transferred to ensure that their value, including accrued interest, is greater than amounts owed to the Fund under each such repurchase agreement.
11 Transactions with other funds managed by Neuberger Berman Management LLC: Pursuant to an Exemptive Order issued by the Securities and Exchange Commission, the Fund may invest in a money market fund managed by Management or an affiliate. The Fund invests in Neuberger Berman Prime Money Fund ("Prime Money"), as approved by the Board. Prime Money seeks to provide the highest available current income consistent with safety and liquidity. For any cash that the Fund invests in Prime Money, Management waives a portion of its management fee equal to the management fee it receives from Prime Money on those assets (the "Arrangement"). For the year ended December 31, 2008, management fees waived under this Arrangement amounted to $4,039 and are reflected in the Statement of Operations under the caption "Investment management fees waived." For the year ended December 31, 2008, income earned under this Arrangement amounted to $126,025 and is reflected in the Statement of Operations under the caption "Income from investments in affiliated issuers."
12 Indemnifications: Like many other companies, the Trust's organizational documents provide that its officers and trustees are indemnified against certain liabilities arising out of the performance of their duties to the Trust. In addition, both in some of its principal service contracts and in the normal course of its business, the Trust enters into contracts that provide indemnifications to other parties for certain types of losses or liabilities. The Trust's maximum exposure under these arrangements is unknown as this could involve future claims against the Trust.
13 Other: All net investment income and realized and unrealized capital gains and losses of the Fund are allocated, on the basis of relative net assets, pro rata among its respective classes.
Note B-Management Fees, Administration Fees, Distribution Arrangements, and Other Transactions With Affiliates:
Fund shares are issued and redeemed in connection with investments in and payments under certain variable annuity contracts and variable life insurance policies issued through separate accounts of life insurance companies and are also offered directly to qualified pension and retirement plans.
The Fund retains Management as its investment manager under a Management Agreement. For such investment management services, the Fund pays Management a fee at the annual rate of 0.55% of the first $250 million of the Fund's average daily net assets, 0.525% of the next $250 million, 0.50% of the next $250 million, 0.475% of the next $250 million, 0.45% of the next $500 million, 0.425% of the next $2.5 billion, and 0.40% of average daily net assets in excess of $4 billion.
The Fund retains Management as its administrator under an Administration Agreement. Each class pays Management an administration fee at the annual rate of 0.30% of its average daily net assets under this agreement. Additionally, Management retains State Street Bank and Trust Company ("State Street") as its sub-administrator under a Sub-Administration Agreement. Management pays State Street a fee for all services received under this agreement.
15
The Board adopted a non-fee distribution plan for the Fund's Class I.
For the Fund's Class S, Management acts as agent in arranging for the sale of class shares without commission and bears advertising and promotion expenses. The Board has adopted a distribution plan (the "Plan") with respect to this class, pursuant to Rule 12b-1 under the 1940 Act. The Plan provides that, as compensation for administrative and other services provided to this class, Management's activities and expenses related to the sale and distribution of this class of shares, and ongoing services provided to investors in this class, Management receives from this class a fee at the annual rate of 0.25% of Class S's average daily net assets. Management receives this amount to provide distribution and shareholder servicing for this class and pays a portion of it to institutions that provide such services. Those institutions may use the payments for, among other purposes, compensating employees engaged in sales and/or shareholder servicing. The amount of fees paid by this class during any year may be more or less than the cost of distribution and other services provided to this class. FINRA rules limit the amount of annual distribution fees that may be paid by a mutual fund and impose a ceiling on the cumulative distribution fees paid. The Trust's Plan complies with those rules.
Management has contractually undertaken to forgo current payment of fees and/or reimburse the Fund's Class I and Class S shares for their operating expenses (excluding the fees payable to Management (including the fees payable to Management with respect to the Fund's Class S shares), but excluding interest, taxes, brokerage commissions, extraordinary expenses, and transaction costs) ("Operating Expenses") which exceed the expense limitation as detailed in the following table:
| | | Expense Limitation(1) | | Expiration | | Reimbursement from
Management for the
Year Ended
December 31, 2008 | |
| Class I | | | 1.00 | % | | | 12/31/11 | | | $ | - | | |
| Class S | | | 1.25 | % | | | 12/31/11 | | | | 10,820 | | |
>
(1) Expense limitation per annum of the respective class' average daily net assets.
Each respective class has agreed to repay Management through December 31, 2014 for fees and expenses foregone and/or its excess Operating Expenses previously reimbursed by Management, so long as their annual Operating Expenses during that period do not exceed their expense limitation, and the repayment is made within three years after the year in which Management issued the reimbursement or waived fees. During the year ended December 31, 2008, there was no repayment to Management under these agreements. At December 31, 2008, the Fund's Class I shares had no contingent liability to Management under this agreement. At December 31, 2008, the Fund's Class S shares contingent liabilities to Management under this agreement were as follows:
| | | Expiring in: | |
| | | 2011 | | Total | |
| Class S | | $ | 10,820 | | | $ | 10,820 | | |
>
Neuberger is retained by Management to furnish it with investment recommendations and research information without added cost to the Fund. Several individuals who are officers and/or trustees of the Trust are also employees of Neuberger and/or Management.
The Fund had entered into a commission recapture program, which enabled it to pay some of its operational expenses by recouping a portion of the commissions it paid to a broker that was not a related party of the Fund. Pursuant to the agreement, brokers paid recaptured commissions to the Fund's custodian and the custodian directed these amounts toward payment of expenses such as custodial, transfer agency or accounting services. Effective April 1, 2008, this commission recapture program was terminated. For the period ended March 31, 2008, the impact of this arrangement was a reduction of expenses of $5,645.
The Fund has an expense offset arrangement in connection with its custodian contract. For the year ended December 31, 2008, the impact of this arrangement was a reduction of expenses of $192.
16
Note C-Securities Transactions:
During the year ended December 31, 2008, there were purchase and sale transactions (excluding short-term securities) of $69,092,462 and $46,563,280, respectively.
During the year ended December 31, 2008, brokerage commissions on securities transactions paid to affiliated brokers were as follows: Neuberger received $0 and Lehman Brothers Inc. received $11,502.
Note D-Fund Share Transactions:
Share activity for the years ended December 31, 2008 and December 31, 2007 was as follows:
For the Year Ended December 31, 2008
| | | Shares Sold | | Shares Issued on
Reinvestment of
Dividends and
Distributions | | Shares
Redeemed | | Total | |
| Class I | | | 941,626 | | | | 335,976 | | | | (2,013,210 | ) | | | (735,608 | ) | |
| Class S | | | 2,301,202 | | | | 203,858 | | | | (127,244 | ) | | | 2,377,816 | | |
>
For the Year Ended December 31, 2007
| | | Shares Sold | | Shares Issued on
Reinvestment of
Dividends and
Distributions | | Shares
Redeemed | | Total | |
| Class I | | | 882,413 | | | | 18,062 | | | | (2,646,923 | ) | | | (1,746,448 | ) | |
| Class S | | | 1,485,688 | | | | 2,879 | | | | (17,595 | ) | | | 1,470,972 | | |
>
Note E-Line of Credit:
At December 31, 2008, the Fund was a participant in a single committed, unsecured $150,000,000 line of credit with State Street, to be used only for temporary or emergency purposes. Other investment companies managed by Management also participate in this line of credit on the same terms. Interest is charged on borrowings under this line of credit at the overnight Federal Funds Rate plus 0.50% per annum. A facility fee of 0.07% (as of September 19, 2008, 0.09%) per annum of the available line of credit is charged, of which the Fund has agreed to pay its pro rata share, based on the ratio of its individual net assets to the net assets of all participants at the time the fee is due and payable. The fee is paid quarterly in arrears. Because several investment companies participate, there is no assurance that an individual Fund will have access to all or any part of the $150,000,000 at any particular time. There were no loans outstanding pursuant to this line of credit at December 31, 2008. During the year ended December 31, 2008, the Fund did not utilize this line of credit.
17
Note F-Investments in Affiliates:
| Name of Issuer | | Balance of
Shares Held
December 31,
2007 | | Gross
Purchases
and
Additions | | Gross
Sales
and
Reductions | | Balance of
Shares Held
December 31,
2008 | | Value
December 31,
2008 | | Income from
Investments
in Affiliated
Issuers
Included in
Total Income | |
Neuberger Berman Prime
Money Fund Trust Class* | | | 6,339,058 | | | | 45,125,110 | | | | 47,125,506 | | | | 4,338,662 | | | $ | 4,338,662 | | | $ | 126,025 | | |
Neuberger Berman Securities
Lending Quality Fund, LLC** | | | - | | | | 168,692,771 | | | | 143,826,132 | | | | 24,866,639 | | | | 24,866,639 | | | | 135,353 | | |
| Total | | | | | | | | | | $ | 29,205,301 | | | $ | 261,378 | | |
>
* Prime Money is also managed by Management and may be considered an affiliate since it has the same officers, Board members, and investment manager as the Fund and because, at times, the Fund may own 5% or more of the outstanding voting securities of Prime Money.
** Quality Fund, a fund managed by LBAM, an affiliate of Management, is used to invest cash the Fund receives as collateral for securities loaned as approved by the Board. Because all shares of Quality Fund are held by funds in the related investment management complex, Quality Fund may be considered an affiliate of the Fund.
Note G-Recent Accounting Pronouncement:
In March 2008, Statement of Financial Accounting Standards No. 161, "Disclosures about Derivative Instruments and Hedging Activities-an amendment of FASB Statement No. 133" ("FAS 161"), was issued. FAS 161 is intended to improve financial reporting for derivative instruments by requiring enhanced disclosure that enables investors to understand how and why an entity uses derivatives, how derivatives are accounted for, and how derivative instruments affect an entity's results of operations and financial position. In September 2008, FASB Staff Position No. 133-1 and FASB Interpretation No. 45-4 (the "FSP"), "Disclosures about Credit Derivatives and Certain Guarantees: An Amendment of FASB Statement No. 133 and FASB Interpretation No. 45; and Clarification of the Effective Date of FASB Statement No. 161" was issued. Certain provisions of the FSP amend FASB Statement No. 133, "Accounting for Derivative Instruments and Hedging Activities," to require disclosures by sellers of credit derivatives, including credit derivatives embedded in hybrid instruments. These FSP provisions are effective for fiscal years and interim periods ending after November 15, 2008. At this time, Management has assessed the implication of these FSP provisions and determined there is no impact to the Fund's financial statements. The FSP also clarifies the effective date of FAS 161, whereby disclosures required by FAS 161 are effective for financial statements issued for fiscal years and interim periods beginning after November 15, 2008. The impact of FAS 161 on the Fund's financial statement disclosures, if any, is currently being assessed.
Note H-Recent Market Events
The year covered by this report witnessed an unusually high degree of volatility in the financial markets and the net asset values of many mutual funds, including to some extent the Fund. Both domestic and international equity markets have been experiencing heightened volatility and turmoil, with issuers that have exposure to the real estate, mortgage and credit markets particularly affected. In addition to the recent turbulence in financial markets, the reduced liquidity in credit and fixed income markets has negatively affected many issuers worldwide. The Fund's investments in certain issuers, as reflected in the Fund's schedule of investments, and the financial markets in general, expose investors to the volatile performance resulting from these market conditions and related events.
18
Financial Highlights
Guardian Portfolio
The following tables include selected data for a share outstanding throughout each year and other performance information derived from the Financial Statements.
Class I
| | | Year Ended December 31, | |
| | | 2008 | | 2007 | | 2006 | | 2005 | | 2004 | |
| Net Asset Value, Beginning of Year | | $ | 21.11 | | | $ | 19.71 | | | $ | 17.50 | | | $ | 16.17 | | | $ | 13.98 | | |
| Income From Investment Operations: | |
| Net Investment Income (Loss)t | | | .12 | | | | .11 | | | | .05 | | | | .12 | | | | .04 | | |
Net Gains or Losses on Securities
(both realized and unrealized) | | | (7.97 | ) | | | 1.35 | | | | 2.29 | | | | 1.24 | | | | 2.17 | | |
| Total From Investment Operations | | | (7.85 | ) | | | 1.46 | | | | 2.34 | | | | 1.36 | | | | 2.21 | | |
| Less Distributions From: | |
| Net Investment Income | | | (.10 | ) | | | (.06 | ) | | | (.13 | ) | | | (.03 | ) | | | (.02 | ) | |
| Net Capital Gains | | | (.71 | ) | | | - | | | | - | | | | - | | | | - | | |
| Total Distributions | | | (.81 | ) | | | (.06 | ) | | | (.13 | ) | | | (.03 | ) | | | (.02 | ) | |
| Net Asset Value, End of Year | | $ | 12.45 | | | $ | 21.11 | | | $ | 19.71 | | | $ | 17.50 | | | $ | 16.17 | | |
| Total Returntt | | | (37.24 | )% | | | 7.39 | % | | | 13.38 | % | | | 8.39 | % | | | 15.81 | % | |
| Ratios/Supplemental Data | |
| Net Assets, End of Year (in millions) | | $ | 67.0 | | | $ | 129.1 | | | $ | 155.0 | | | $ | 175.3 | | | $ | 177.3 | | |
| Ratio of Gross Expenses to Average Net Assets# | | | 1.01 | % | | | .99 | % | | | .99 | % | | | 1.00 | % | | | .98 | % | |
| Ratio of Net Expenses to Average Net AssetsS | | | 1.01 | % | | | .99 | % | | | .99 | % | | | 1.00 | % | | | .97 | % | |
Ratio of Net Investment Income (Loss) to
Average Net Assets | | | .65 | % | | | .55 | % | | | .29 | % | | | .71 | % | | | .25 | % | |
| Portfolio Turnover Rate | | | 32 | % | | | 38 | % | | | 23 | % | | | 32 | % | | | 24 | % | |
>
See Notes to Financial Highlights 19
Financial Highlights (cont'd)
Class S
| | | Year Ended December 31, | |
| | | 2008 | | 2007 | | 2006 | | 2005 | | 2004 | |
| Net Asset Value, Beginning of Year | | $ | 21.02 | | | $ | 19.67 | | | $ | 17.52 | | | $ | 16.20 | | | $ | 14.02 | | |
| Income From Investment Operations: | |
| Net Investment Income (Loss)t | | | .08 | | | | .09 | | | | .02 | | | | .09 | | | | .00 | | |
Net Gains or Losses on Securities
(both realized and unrealized) | | | (7.92 | ) | | | 1.32 | | | | 2.26 | | | | 1.23 | | | | 2.18 | | |
| Total From Investment Operations | | | (7.84 | ) | | | 1.41 | | | | 2.28 | | | | 1.32 | | | | 2.18 | | |
| Less Distributions From: | |
| Net Investment Income | | | (.09 | ) | | | (.06 | ) | | | (.13 | ) | | | - | | | | - | | |
| Net Capital Gains | | | (.71 | ) | | | - | | | | - | | | | - | | | | - | | |
| Total Distributions | | | (.80 | ) | | | (.06 | ) | | | (.13 | ) | | | - | | | | - | | |
| Net Asset Value, End of Year | | $ | 12.38 | | | $ | 21.02 | | | $ | 19.67 | | | $ | 17.52 | | | $ | 16.20 | | |
| Total Returntt | | | (37.36 | )% | | | 7.14 | % | | | 13.02 | % | | | 8.15 | % | | | 15.55 | % | |
| Ratios/Supplemental Data | |
| Net Assets, End of Year (in millions) | | $ | 48.6 | | | $ | 32.5 | | | $ | 1.5 | | | $ | 0.4 | | | $ | 0.3 | | |
| Ratio of Gross Expenses to Average Net Assets# | | | 1.25 | % | | | 1.24 | % | | | 1.25 | % | | | 1.25 | % | | | 1.23 | % | |
| Ratio of Net Expenses to Average Net Assetss | | | 1.25 | % | | | 1.24 | % | | | 1.25 | % | | | 1.24 | % | | | 1.22 | % | |
Ratio of Net Investment Income (Loss) to
Average Net Assets | | | .48 | % | | | .42 | % | | | .11 | % | | | .53 | % | | | .03 | % | |
| Portfolio Turnover Rate | | | 32 | % | | | 38 | % | | | 23 | % | | | 32 | % | | | 24 | % | |
>
See Notes to Financial Highlights 20
Notes to Financial Highlights Guardian Portfolio
tt Total return based on per share net asset value reflects the effects of changes in net asset value on the performance of the Fund during each fiscal period and assumes dividends and other distributions, if any, were reinvested. Results represent past performance and do not guarantee future results. Current returns may be lower or higher than the performance data quoted. Investment returns and principal may fluctuate and shares when redeemed may be worth more or less than original cost. Total return would have been lower if Management had not reimbursed and/or waived certain expenses. Total return would have been higher if Management had not recouped previously reimbursed expenses. The total return information shown does not reflect charges and other expenses that apply to the separate account or the related insurance policies, and the inclusion of these charges and other expenses would reduce the total return for all fiscal periods shown.
# The Fund is required to calculate an expense ratio without taking into consideration any expense reductions related to expense offset arrangements.
S After reimbursement of expenses and/or waiver of a portion of the investment management fee by Management. Had Management not undertaken such actions, the annualized ratios of net expenses to average daily net assets would have been:
| | | Year Ended December 31, | |
| | | 2008 | | 2007 | | 2006 | | 2005 | | 2004 | |
| Guardian Portfolio Class I | | | 1.01 | % | | | .99 | % | | | .99 | % | | | 1.00 | % | | | .97 | % | |
| Guardian Portfolio Class S | | | 1.27 | % | | | 1.24 | % | | | 1.25 | % | | | 1.26 | % | | | 1.22 | % | |
>
After reimbursement of expenses previously paid by Management and/or waiver of a portion of the investment management fee by Management. Had the Fund not made such reimbursements or Management not undertaken such actions, the annualized ratio of net expenses to average daily net assets would have been:
| | | Year Ended December 31,
2007 | |
| Guardian Portfolio Class S | | | 1.24 | % | |
>
t Calculated based on the average number of shares outstanding during each fiscal period.
21
Report of Independent Registered Public Accounting Firm
To the Board of Trustees of
Neuberger Berman Advisers Management Trust and
Shareholders of Guardian Portfolio
We have audited the accompanying statement of assets and liabilities, including the schedule of investments, of Guardian Portfolio, one of the series constituting Neuberger Berman Advisers Management Trust (the "Trust"), as of December 31, 2008, and the related statement of operations for the year then ended, the statement of changes in net assets for each of the two years in the period then ended, and the financial highlights for each of the five years in the period then ended. These financial statements and financial highlights are the responsibility of the Trust's management. Our responsibility is to express an opinion on these financial statements and financial highlights based on our audits.
We conducted our audits in accordance with the standards of the Public Company Accounting Oversight Board (United States). Those standards require that we plan and perform the audit to obtain reasonable assurance about whether the financial statements and financial highlights are free of material misstatement. We were not engaged to perform an audit of the Trust's internal control over financial reporting. Our audits included consideration of internal control over financial reporting as a basis for designing audit procedures that are appropriate in the circumstances, but not for the purpose of expressing an opinion on the effectiveness of the Trust's internal control over financial reporting. Accordingly, we express no such opinion. An audit also includes examining, on a test basis, evidence supporting the amounts and disclosures in the financial statements and financial highlights, assessing the accounting principles used and significant estimates made by management, and evaluating the overall financial statement presentation. Our procedures included confirmation of securities owned as of December 31, 2008 by correspondence with the custodian and brokers. We believe that our audits provide a reasonable basis for our opinion.
In our opinion, the financial statements and financial highlights referred to above present fairly, in all material respects, the financial position of Guardian Portfolio, a series of Neuberger Berman Advisers Management Trust, at December 31, 2008, the results of its operations for the year then ended, the changes in its net assets for each of the two years in the period then ended, and the financial highlights for each of the five years in the period then ended, in conformity with U.S. generally accepted accounting principles.

Boston, Massachusetts
February 9, 2009
22
Trustee and Officer Information
The following tables set forth information concerning the trustees and officers of the Trust. All persons named as trustees and officers also serve in similar capacities for other funds administered or managed by Neuberger Berman Management LLC ("NB Management") and Neuberger Berman, LLC ("Neuberger Berman"). The Statement of Additional Information includes additional information about fund trustees and is available upon request, without charge, by calling (800) 877-9700.
Information about the Board of Trustees
Name, (Year of Birth),
and Address(1) | | Position and
Length of
Time Served(2) | | Principal Occupation(s)(3) | | Number of
Funds in Fund
Complex
Overseen by
Fund Trustee | | Other Directorships
Held Outside Fund
Complex by Fund
Trustee | |
| Independent Fund Trustees | |
|
| John Cannon (1930) | | Trustee since 2000 | | Consultant; formerly, Chairman, CDC Investment Advisers (registered investment adviser), 1993 to January 1999; formerly, President and Chief Executive Officer, AMA Investment Advisors, an affiliate of the American Medical Association. | | | 56 | | | Independent Trustee or Director of three series of Oppenheimer Funds: Oppenheimer Limited Term New York Municipal Fund, Rochester Fund Municipals, and Oppenheimer Convertible Securities Fund since 1992. | |
|
| Faith Colish (1935) | | Trustee since 1982 | | Counsel, Carter Ledyard & Milburn LLP (law firm) since October 2002; formerly, Attorney-at-Law and President, Faith Colish, A Professional Corporation, 1980 to 2002. | | | 56 | | | Formerly, Director (1997 to 2003) and Advisory Director (2003 to 2006), ABA Retirement Funds (formerly, American Bar Retirement Association) (not-for-profit membership corporation). | |
|
| Martha C. Goss (1949) | | Trustee since 2007 | | President, Woodhill Enterprises Inc./Chase Hollow Associates LLC (personal investment vehicle), since 2006; Chief Operating and Financial Officer, Hopewell Holdings LLC/ Amwell Holdings, LLC (a holding company for a healthcare reinsurance company start-up), since 2003; formerly, Consultant, Resources Connection (temporary staffing), 2002 to 2006. | | | 56 | | | Director, Ocwen Financial Corporation (mortgage servicing), since 2005; Director, American Water (water utility), since 2003; Director, Channel Reinsurance (financial guaranty reinsurance), since 2006; Advisory Board Member, Attensity (software developer), since 2005; Director, Allianz Life of New York (insurance), since 2005; Director, Financial Women's Association of New York (not for profit association), since 2003; Trustee Emerita, Brown University, since 1998. | |
|
>
23
Name, (Year of Birth),
and Address(1) | | Position and
Length of
Time Served(2) | | Principal Occupation(s)(3) | | Number of
Funds in Fund
Complex
Overseen by
Fund Trustee | | Other Directorships
Held Outside Fund
Complex by Fund
Trustee | |
| C. Anne Harvey (1937) | | Trustee since 1998 | | President, C.A. Harvey Associates, since October 2001; formerly, Director, AARP, 1978 to December 2001. | | | 56 | | | Formerly, President, Board of Associates to The National Rehabilitation Hospital's Board of Directors, 2001 to 2002; formerly, Member, Individual Investors Advisory Committee to the New York Stock Exchange Board of Directors, 1998 to June 2002. | |
|
| Robert A. Kavesh (1927) | | Trustee since 2000 | | Retired; Marcus Nadler Professor Emeritus of Finance and Economics, New York University Stern School of Business; formerly, Executive Secretary-Treasurer, American Finance Association, 1961 to 1979. | | | 56 | | | Formerly, Director, The Caring Community (not-for-profit), 1997 to 2006; formerly, Director, DEL Laboratories, Inc. (cosmetics and pharmaceuticals), 1978 to 2004; formerly, Director, Apple Bank for Savings, 1979 to 1990; formerly, Director, Western Pacific Industries, Inc., 1972 to 1986 (public company). | |
|
| Michael M. Knetter (1960) | | Trustee since 2007 | | Dean, School of Business, University of Wisconsin - Madison; formerly, Professor of International Economics and Associate Dean, Amos Tuck School of Business - Dartmouth College, 1998 to 2002. | | | 56 | | | Trustee, Northwestern Mutual Series Fund, Inc., since February 2007; Director, Wausau Paper, since 2005; Director, Great Wolf Resorts, since 2004. | |
|
| Howard A. Mileaf (1937) | | Trustee since 1999 | | Retired; formerly, Vice President and General Counsel, WHX Corporation (holding company), 1993 to 2001. | | | 56 | | | Formerly, Director, Webfinancial Corporation (holding company), 2002 to 2008; formerly, Director WHX Corporation (holding company), January 2002 to June 2005; formerly, Director, State Theatre of New Jersey (not-for-profit theater), 2000 to 2005. | |
|
>
24
Name, (Year of Birth),
and Address(1) | | Position and
Length of
Time Served(2) | | Principal Occupation(s)(3) | | Number of
Funds in Fund
Complex
Overseen by
Fund Trustee | | Other Directorships
Held Outside Fund
Complex by Fund
Trustee | |
| George W. Morriss (1947) | | Trustee since 2007 | | Retired; formerly, Executive Vice President and Chief Financial Officer, People's Bank, Connecticut (a financial services company), 1991 to 2001. | | | 56 | | | Manager, Old Mutual 2100 fund complex (consisting of six funds) since October 2006 for four funds and since February 2007 for two funds; formerly, Member NASDAQ Issuers' Affairs Committee, 1995 to 2003. | |
|
| Edward I. O'Brien (1928) | | Trustee since 2000 | | Retired; formerly, Member, Investment Policy Committee, Edward Jones, 1993 to 2001; President, Securities Industry Association ("SIA") (securities industry's representative in government relations and regulatory matters at the federal and state levels), 1974 to 1992; Adviser to SIA, November 1992 to November 1993. | | | 56 | | | Formerly, Director, Legg Mason, Inc. (financial services holding company), 1993 to July 2008; formerly, Director, Boston Financial Group (real estate and tax shelters), 1993 to 1999. | |
|
| William E. Rulon (1932) | | Trustee since 2000 | | Retired; formerly, Senior Vice President, Foodmaker, Inc. (operator and franchiser of restaurants), until January 1997. | | | 56 | | | Formerly, Director, Pro-Kids Golf and Learning Academy (teach golf and computer usage to "at risk" children), 1998 to 2006; formerly, Director, Prandium, Inc. (restaurants), March 2001 to July 2002. | |
|
| Cornelius T. Ryan (1931) | | Trustee since 2000 | | Founding General Partner, Oxford Partners and Oxford Bioscience Partners (venture capital investing) and President, Oxford Venture Corporation, since 1981. | | | 56 | | | None. | |
|
>
25
Name, (Year of Birth),
and Address(1) | | Position and
Length of
Time Served(2) | | Principal Occupation(s)(3) | | Number of
Funds in Fund
Complex
Overseen by
Fund Trustee | | Other Directorships
Held Outside Fund
Complex by Fund
Trustee | |
| Tom D. Seip (1950) | | Trustee since 2000; Chairman of the Board since 2008; Lead Independent Trustee from 2006 to 2008 | | General Partner, Seip Investments LP (a private investment partnership); formerly, President and CEO, Westaff, Inc. (temporary staffing), May 2001 to January 2002; formerly, Senior Executive at the Charles Schwab Corporation, 1983 to 1998, including Chief Executive Officer, Charles Schwab Investment Management, Inc., and Trustee, Schwab Family of Funds and Schwab Investments, 1997 to 1998, and Executive Vice President-Retail Brokerage, Charles Schwab & Co., Inc., 1994 to 1997. | | | 56 | | | Director, H&R Block, Inc. (financial services company), since May 2001; Chairman, Compensation Committee, H&R Block, Inc., since 2006; formerly, Director, Forward Management, Inc. (asset management company), 1999 to 2006. | |
|
| Candace L. Straight (1947) | | Trustee since 1999 | | Private investor and consultant specializing in the insurance industry; formerly, Advisory Director, Securitas Capital LLC (a global private equity investment firm dedicated to making investments in the insurance sector), 1998 to December 2003. | | | 56 | | | Director, Montpelier Re (reinsurance company), since 2006; formerly, Director, National Atlantic Holdings Corporation (property and casualty insurance company), 2004 to 2008; formerly, Director, The Proformance Insurance Company (property and casualty insurance company), 2004 to 2008; formerly, Director, Providence Washington Insurance Company (property and casualty insurance company), December 1998 to March 2006; formerly, Director, Summit Global Partners (insurance brokerage firm), 2000 to 2005. | |
|
| Peter P. Trapp (1944) | | Trustee since 1984 | | Retired; formerly, Regional Manager for Mid-Southern Region, Ford Motor Credit Company, September 1997 to 2007; formerly, President, Ford Life Insurance Company, April 1995 to August 1997. | | | 56 | | | None. | |
|
>
26
Name, (Year of Birth),
and Address(1) | | Position and
Length of
Time Served(2) | | Principal Occupation(s)(3) | | Number of
Funds in Fund
Complex
Overseen by
Fund Trustee | | Other Directorships
Held Outside Fund
Complex by Fund
Trustee | |
| Fund Trustees who are "Interested Persons" | |
|
| Jack L. Rivkin* (1940) | | Trustee since 2002; President from 2002 to 2008 | | Formerly, Executive Vice President and Chief Investment Officer, Neuberger Berman Holdings LLC (holding company), 2002 to August 2008 and 2003 to August 2008, respectively; formerly, Managing Director and Chief Investment Officer, Neuberger Berman, December 2005 to August 2008 and 2003 to August 2008, respectively; formerly, Executive Vice President, Neuberger Berman, December 2002 to 2005; formerly, Director and Chairman, NB Management, December 2002 to August 2008; formerly, Executive Vice President, Citigroup Investments, Inc., September 1995 to February 2002; formerly, Executive Vice President, Citigroup Inc., September 1995 to February 2002. | | | 56 | | | Director, Dale Carnegie and Associates, Inc. (private company), since 1998; Director, Solbright, Inc. (private company), since 1998. | |
|
>
27
Name, (Year of Birth),
and Address(1) | | Position and
Length of
Time Served(2) | | Principal Occupation(s)(3) | | Number of
Funds in Fund
Complex
Overseen by
Fund Trustee | | Other Directorships
Held Outside Fund
Complex by Fund
Trustee | |
| Robert Conti* (1956) | | Chief Executive Officer, President and Director since 2008; prior thereto, Executive Vice President in 2008 and Vice President 2000 to 2008 | | Managing Director, Neuberger Berman, since 2007; formerly, Senior Vice President, Neuberger Berman, 2003 to 2006; formerly, Vice President, Neuberger Berman, 1999 to 2003; President and Chief Executive Officer, NB Management, since 2008; formerly, Senior Vice President, NB Management, 2000 to 2008. | | | 56 | | | Chairman of the Board, Staten Island Mental Health Society since 2008. | |
|
>
(1) The business address of each listed person is 605 Third Avenue, New York, New York 10158.
(2) Pursuant to the Trust's Trust Instrument, each Fund Trustee shall hold office for life or until his or her successor is elected or the Trust terminates; except that (a) any Fund Trustee may resign by delivering a written resignation; (b) any Fund Trustee may be removed with or without cause at any time by a written instrument signed by at least two-thirds of the other Fund Trustees; (c) any Fund Trustee who requests to be retired, or who has become unable to serve, may be retired by a written instrument signed by a majority of the other Fund Trustees; and (d) any Fund Trustee may be removed at any shareholder meeting by a vote of at least two-thirds of the outstanding shares.
(3) Except as otherwise indicated, each individual has held the positions shown for at least the last five years.
* Indicates a Fund Trustee who is an "interested person" within the meaning of the 1940 Act. Mr. Conti is an interested person of the Trust by virtue of the fact that he is an officer of NB Management and Neuberger Berman. Mr. Rivkin may be deemed an interested person of the Trust by virtue of the fact that, until August 2008, he was a director of NB Management and an officer of Neuberger Berman.
28
Information about the Officers of the Trust
Name, (Year of Birth),
and Address(1) | | Position and
Length of Time
Served(2) | | Principal Occupation(s)(3) | |
| Andrew B. Allard (1961) | | Anti-Money Laundering Compliance Officer since 2002 | | Senior Vice President, Neuberger Berman, since 2006; Deputy General Counsel, Neuberger Berman, since 2004; formerly, Vice President, Neuberger Berman, 2000 to 2005; formerly, Associate General Counsel, Neuberger Berman, 1999 to 2004; Anti-Money Laundering Compliance Officer, eleven registered investment companies for which NB Management acts as investment manager and administrator (six since 2002, two since 2003, two since 2004 and one since 2006). | |
|
| Michael J. Bradler (1970) | | Assistant Treasurer since 2005 | | Vice President, Neuberger Berman, since 2006; Employee, NB Management, since 1997; Assistant Treasurer, eleven registered investment companies for which NB Management acts as investment manager and administrator (ten since 2005 and one since 2006). | |
|
| Claudia A. Brandon (1956) | | Executive Vice President since 2008 and Secretary since 1985 | | Senior Vice President, Neuberger Berman, since 2007 and Employee since 1999; formerly, Vice President, Neuberger Berman, 2002 to 2006; Senior Vice President, NB Management, since 2008 and Assistant Secretary since 2004; formerly, Vice President-Mutual Fund Board Relations, NB Management, 2000 to 2008; Executive Vice President, eleven registered investment companies for which NB Management acts as investment manager and administrator (eleven since 2008); Secretary, eleven registered investment companies for which NB Management acts as investment manager and administrator (three since 1985, three since 2002, two since 2003, two since 2004 and one since 2006). | |
|
| Maxine L. Gerson (1950) | | Executive Vice President since 2008 and Chief Legal Officer since 2005 (only for purposes of sections 307 and 406 of the Sarbanes-Oxley Act of 2002) | | Senior Vice President, Neuberger Berman, since 2002; Deputy General Counsel and Assistant Secretary, Neuberger Berman, since 2001; Senior Vice President, NB Management, since 2006; Secretary and General Counsel, NB Management, since 2004; Executive Vice President, eleven registered investment companies for which NB Management acts as investment manager and administrator (eleven since 2008); Chief Legal Officer (only for purposes of sections 307 and 406 of the Sarbanes-Oxley Act of 2002), eleven registered investment companies for which NB Management acts as investment manager and administrator (ten since 2005 and one since 2006). | |
|
| Sheila R. James (1965) | | Assistant Secretary since 2002 | | Vice President, Neuberger Berman, since 2008 and Employee since 1999; formerly, Assistant Vice President, Neuberger Berman, 2007; Assistant Secretary, eleven registered investment companies for which NB Management acts as investment manager and administrator (six since 2002, two since 2003, two since 2004 and one since 2006). | |
|
| Brian Kerrane (1969) | | Vice President since 2008 | | Senior Vice President, Neuberger Berman, since 2006; formerly, Vice President, Neuberger Berman, 2002 to 2006; Vice President, NB Management, since 2008 and Employee since 1991; Vice President, eleven registered investment companies for which NB Management acts as investment manager and administrator (eleven since 2008). | |
|
>
29
Name, (Year of Birth),
and Address(1) | | Position and
Length of Time
Served(2) | | Principal Occupation(s)(3) | |
| Kevin Lyons (1955) | | Assistant Secretary since 2003 | | Assistant Vice President, Neuberger Berman, since 2008 and Employee since 1999; Assistant Secretary, eleven registered investment companies for which NB Management acts as investment manager and administrator (eight since 2003, two since 2004 and one since 2006). | |
|
| Owen F. McEntee, Jr. (1961) | | Vice President since 2008 | | Vice President, Neuberger Berman, since 2006; Employee, NB Management, since 1992; Vice President, eleven registered investment companies for which NB Management acts as investment manager and administrator (eleven since 2008). | |
|
| John M. McGovern (1970) | | Treasurer and Principal Financial and Accounting Officer since 2005; prior thereto, Assistant Treasurer since 2002 | | Senior Vice President, Neuberger Berman, since 2007; formerly, Vice President, Neuberger Berman, 2004 to 2006; Employee, NB Management, since 1993; Treasurer and Principal Financial and Accounting Officer, eleven registered investment companies for which NB Management acts as investment manager and administrator (ten since 2005 and one since 2006); formerly, Assistant Treasurer, eleven registered investment companies for which NB Management acts as investment manager and administrator, 2002 to 2005. | |
|
| Andrew Provencher (1965) | | Vice President since 2008 | | Managing Director, NB Management, since 2008; Managing Director, Neuberger Berman, since 2005; formerly, Senior Vice President, Neuberger Berman, 2003 to 2005; formerly, Vice President, Neuberger Berman, 1999 to 2003; Vice President, eleven registered investment companies for which NB Management acts as investment manager and administrator (eleven since 2008). | |
|
| Frank Rosato (1971) | | Assistant Treasurer since 2005 | | Vice President, Neuberger Berman, since 2006; Employee, NB Management, since 1995; Assistant Treasurer, eleven registered investment companies for which NB Management acts as investment manager and administrator (ten since 2005 and one since 2006). | |
|
| Neil S. Siegel (1967) | | Vice President since 2008 | | Managing Director, NB Management, since 2008; Managing Director, Neuberger Berman, since 2006; formerly, Senior Vice President, Neuberger Berman, 2004 to 2006; Vice President, eleven registered investment companies for which NB Management acts as investment manager and administrator (eleven since 2008); formerly, Head of Institutional Marketing, Morgan Stanley Investment Management, 1993 to 2004. | |
|
>
30
Name, (Year of Birth),
and Address(1) | | Position and
Length of Time
Served(2) | | Principal Occupation(s)(3) | |
| Chamaine Williams (1971) | | Chief Compliance Officer since 2005 | | Senior Vice President, Neuberger Berman, since 2007; Chief Compliance Officer, NB Management, since 2006; Senior Vice President, Lehman Brothers Inc., since 2007; formerly, Vice President, Lehman Brothers Inc., 2003 to 2006; Chief Compliance Officer, eleven registered investment companies for which NB Management acts as investment manager and administrator (ten since 2005 and one since 2006); formerly, Chief Compliance Officer, Lehman Brothers Asset Management Inc., 2003 to 2007; formerly, Chief Compliance Officer, Lehman Brothers Alternative Investment Management LLC, 2003 to 2007; formerly, Vice President, UBS Global Asset Management (US) Inc. (formerly, Mitchell Hutchins Asset Management, a wholly-owned subsidiary of PaineWebber Inc.), 1997 to 2003. | |
|
>
(1) The business address of each listed person is 605 Third Avenue, New York, New York 10158.
(2) Pursuant to the By-Laws of the Trust, each officer elected by the Fund Trustees shall hold office until his or her successor shall have been elected and qualified or until his or her earlier death, inability to serve, or resignation. Officers serve at the pleasure of the Fund Trustees and may be removed at any time with or without cause.
(3) Except as otherwise indicated, each individual has held the positions shown for at least the last five years.
31
Proxy Voting Policies and Procedures
A description of the policies and procedures that the Trust uses to determine how to vote proxies relating to portfolio securities is available, without charge, by calling 1-800-877-9700 (toll-free) and on the website of the Securities and Exchange Commission, at www.sec.gov. Information regarding how the Trust voted proxies relating to portfolio securities during the most recent 12-month period ended June 30 is also available, without charge, by calling 1-800-877-9700 (toll-free), on the website of the Securities and Exchange Commission at www.sec.gov, and on Management's website at www.nb.com.
Quarterly Portfolio Schedule
The Trust files a complete schedule of portfolio holdings for the Fund with the Securities and Exchange Commission for the first and third quarters of each fiscal year on Form N-Q. The Trust's Forms N-Q are available on the Securities and Exchange Commission's website at www.sec.gov and may be reviewed and copied at the Securities and Exchange Commission's Public Reference Room in Washington, DC. Information on the operation of the Public Reference Room may be obtained by calling 1-800-SEC-0330. The information on Form N-Q is available upon request, without charge, by calling 1-800-877-9700 (toll free).
Notice to Shareholders (Unaudited)
The Fund hereby designates $6,030,504 as a capital gain distribution.
100.00% of the dividends distributed during the fiscal year ended December 31, 2008 qualifies for the dividends received deduction for corporate shareholders.
Board Consideration of the Management and Sub-Advisory Agreements
At a meeting held on September 25, 2008, the Board of Trustees of Neuberger Berman Advisers Management Trust ("Board"), including the Trustees who are not "interested persons" of Neuberger Berman Management LLC ("Management") or Neuberger Berman Advisers Management Trust ("Independent Fund Trustees"), approved the continuance of the Management and Sub-Advisory Agreements ("Agreements") between Management and Guardian Portfolio ("Fund").
In evaluating the Agreements, the Board, including the Independent Fund Trustees, reviewed materials furnished by Management and Neuberger Berman, LLC ("Neuberger") in response to questions submitted by counsel to the Independent Fund Trustees, and met with senior representatives of Management and Neuberger regarding their personnel and operations. The Independent Fund Trustees were advised by counsel that is experienced in Investment Company Act of 1940 matters and that is independent of Management and Neuberger. The Independent Fund Trustees received a memorandum from independent counsel discussing the legal standards for their consideration of the proposed continuance of the Agreements. They met with such counsel separately from representatives of Management to discuss the annual contract review. The annual contract review extends over two regular meetings of the Board to ensure that Management and Neuberger have time to respond to any questions the Independent Fund Trustees may have on their initial review of the report and that the Independent Fund Trustees have time to consider those responses. In addition, during this process, the Board held a separate meeting devoted primarily to reviewing and discussing Fund performance.
The Board considered the following factors, among others, in connection with its approval of the continuance of the Agreements: (1) the nature, extent, and quality of the services provided by Management and Neuberger; (2) the performance of the Fund compared to a relevant market index and a peer group of investment companies; (3) the costs of the services provided and profits or losses realized by Management and its affiliates from their relationship with the Fund; (4) the extent to which economies of scale might be realized as the Fund grows; and (5) whether fee levels reflect any such
32
potential economies of scale for the benefit of investors in the Fund. In their deliberations, the Board members did not identify any particular information that was all-important or controlling, and each Trustee may have attributed different weights to the various factors.
The Board considered the continued integrity of Management and Neuberger as organizations, despite the bankruptcy filing by Lehman Brothers Holdings Inc. The Board discussed the efforts made by Management and Neuberger to retain employees, and the reported likelihood that such employees would be retained. The Board discussed the provisions that were being made for ancillary services by Management, Neuberger and their affiliates.
The Board evaluated the terms of the Agreements, the overall fairness of the Agreements to the Fund and whether the Agreements were in the best interests of the Fund and its shareholders.
With respect to the nature, extent and quality of the services provided, the Board considered the performance of the Fund and the experience and staffing of the portfolio management and investment research personnel who perform services for the Fund. The Board noted that Management also provides certain administrative services, including fund accounting and compliance oversight. The Board also considered Management's and Neuberger's policies and practices regarding brokerage. The Board considered the quality of brokerage execution obtained by Management. The Board's Portfolio Transactions and Pricing Committee from time to time reviewed the quality of the brokerage services that Neuberger and Lehman Brothers Inc. had provided, and periodically reviews studies by an independent firm engaged to review and evaluate the quality of brokerage execution received by the Fund. The Board also reviewed whether Management and Neuberger used brokers to execute Fund transactions that provide research and other services to Management and Neuberger, and the types of benefits potentially derived from such services by Management, Neuberger, the Fund and other clients of Management and Neuberger. In addition, the Board noted the positive compliance history of Management and Neuberger, as each firm has been free of significant compliance problems.
The Board considered the performance of the Fund relative to its benchmark and a peer group of investment companies dedicated to insurance products pursuing broadly similar strategies. The Board also considered performance in relation to the degree of risk undertaken by the portfolio managers.
With respect to the overall fairness of the Agreements, the Board considered the fee structure for the Fund under the Agreements as compared to a peer group of comparable funds dedicated to insurance products and any fall-out benefits likely to accrue to Management or Neuberger or their affiliates from their relationship with the Fund. The Board also considered the profitability of Management and its affiliates from their association with the Fund.
The Board reviewed a comparison of the Fund's management fee and overall expense ratio to a peer group of broadly comparable funds dedicated to insurance products. The Board considered the mean and median of the management fees and expense ratios of the peer group. The Board noted that the Fund's management fee was higher than the peer group mean and median. The Board considered whether specific portfolio management or administration needs contributed to the higher fee. With regard to the sub-advisory fee paid to Neuberger, the Board noted that this fee is "at cost." In addition, the Board considered the contractual limit on Fund expenses undertaken by Management.
The Board considered whether there were other funds that were advised or sub-advised by Management or its affiliates or separate accounts managed by Management or its affiliates with similar investment objectives, policies and strategies to the Fund. The Board noted that there were no comparable sub-advised funds. The Board compared the fees charged to the Fund at various asset levels to the fees charged to an advised fund and a separate account, each managed in a similar style to the Fund. The Board considered the appropriateness and reasonableness of any differences between the fees charged to the Fund and the other fund and accounts and determined that the differences in fees were consistent with the management and other services provided.
The Board also evaluated any apparent or anticipated economies of scale in relation to the services Management provides to the Fund. The Board considered that the Fund's fee structure which provides for a reduction of payments resulting from the use of breakpoints and whether those breakpoints are set at appropriate asset levels.
In concluding that the benefits accruing to Management and its affiliates by virtue of their relationship to the Fund were reasonable in comparison with the costs of providing the investment advisory services and the benefits accruing to the
33
Fund, the Board reviewed specific data as to Management's profit on the Fund for a recent period and the trend in profit or loss over recent years. The Board also carefully examined Management's cost allocation methodology and in recent years had an independent consultant review the methodology. It also reviewed an analysis from an independent data service on profitability margins in the investment management industry. The Board recognized that Management should be entitled to earn a reasonable level of profits for services it provides to the Fund and, based on its review, concluded that Management's level of profitability was not excessive.
Conclusions
In approving the Agreements, the Board concluded that the terms of each Agreement are fair and reasonable and that approval of the Agreements is in the best interests of the Fund and its shareholders. In reaching this determination, the Board considered that Management and Neuberger could be expected to provide a high level of service to the Fund; that the performance of the Fund was satisfactory over time; that the Fund's fee structure appeared to the Board to be reasonable given the nature and quality of services provided; and that the benefits accruing to Management and its affiliates by virtue of their relationship to the Fund were reasonable in comparison with the benefits accruing to the Fund.
Board Consideration of New and Interim Management and Sub-Advisory Agreements
Lehman Brothers Holdings Inc. ("Lehman Brothers") has entered into an agreement to sell a controlling interest in the Fund's investment adviser. Under the agreement, Lehman Brothers would sell substantially all of the Neuberger Berman business and the fixed income business and certain alternative asset management businesses of Lehman Brother's Investment Management Division (collectively, the "Acquired Businesses") to NBSH Acquisition, LLC (the "Proposed Acquisition"). NBSH Acquisition, LLC ("NBSH") was organized by key members of Neuberger Berman's management for the purpose of facilitating the acquisition of the Acquired Businesses. At the closing of the Proposed Acquisition, a majority interest in the Acquired Businesses will be directly or indirectly owned by portfolio managers, Neuberger Berman's management team and certain key members and senior professionals of the former Investment Management Division ("Management Members"), as well as by Lehman Brothers and certain affiliates of Lehman Brothers.
The Acquired Businesses include Neuberger Berman Management LLC ("Management") and Neuberger Berman, LLC ("Neuberger"), the adviser and sub-adviser to the Fund, respectively. The Proposed Acquisition has been deemed to result in an "assignment" of the Fund's existing Management Agreement and Sub-Advisory Agreement (the "Existing Agreements") under the 1940 Act. As required by the 1940 Act, the Fund's Existing Agreements provide for their automatic termination in the event of an assignment, and each will terminate upon the consummation of the Proposed Acquisition. Accordingly, on December 17, 2008, the Board approved new Management and Sub-Advisory Agreements with Management and Neuberger, respectively, or their successors (together, the "Advisers"), on the same terms and with the same compensation structure as are currently in effect (together, "New Agreements"), which would take effect upon consummation of the Proposed Acquisition if approved by the Fund's shareholders.
If shareholders of the Fund do not approve the New Agreements before the Proposed Acquisition is completed, the Board has approved interim Management and Sub-Advisory Agreements with Management and Neuberger, respectively, or their successors (together, "Interim Agreements") pending approval of the New Agreements by shareholders of the Fund. Compensation earned by the Advisers under the Interim Agreements would be held in an interest-bearing escrow account pending shareholder approval of the New Agreements. If shareholders approve the New Agreements within 150 days from the termination of the Existing Agreements, the amount held in the escrow account, including interest, will be paid to the Advisers, as appropriate. If shareholders of the Fund do not approve the New Agreements, the Advisers will be paid the lesser of the costs incurred in performing their services under the Interim Agreements or the total amount in the escrow account, including interest earned. If at the end of 150 days following termination of a Fund's Existing Agreements the Fund's shareholders still have not approved the New Agreements, the Trustees would take such actions as they deem to be in the best interests of the Fund and its shareholders, which may include negotiating a new Management Agreement and/or new Sub-Advisory Agreement with an advisory organization selected by the Board of Trustees or making other arrangements.
34
The Trustees of the Trust discussed the Proposed Acquisition on December 17, 2008. Prior to submitting its bid to public auction, Management met telephonically with the Independent Trustees to brief them on the Proposed Acquisition. Following the public auction wherein NBSH was determined to be the successful bidder, the Independent Trustees again met telephonically with Management to obtain additional information about the Proposed Acquisition. The Independent Trustees, with the assistance of independent counsel, prepared due diligence requests that were presented to Management and appointed a Task Force of Independent Trustees to lead the due diligence effort ("Task Force").
Management provided written responses to the due diligence requests. After extensive review and analysis and discussions during a telephonic and in person meeting of the Independent Trustees, the Task Force submitted clarifying questions. The Independent Trustees met as a body in person to receive the report of the Task Force and consider the New Agreements. Throughout the process, the Task Force and the Independent Trustees were advised by experienced 1940 Act counsel that is independent of Management and NBSH. In addition, the Independent Trustees received a memorandum from independent counsel discussing the legal standards for their consideration of the New Agreements.
Consideration of the New Agreements followed shortly on the heels of the Independent Trustees' annual consideration of whether to renew the Existing Agreements, carried out pursuant to Section 15(c) of the 1940 Act. In that process, which began prior to the June 2008 quarterly meeting of the Board and was concluded at the September 2008 quarterly meeting, the Independent Trustees, following an extensive review of materials submitted by Management and a report from an independent data service, unanimously determined that the Existing Agreements were fair and reasonable and that their renewal would be in the best interests of the Fund and its shareholders. Accordingly, in considering the New Agreements, the Independent Trustees took into account the fact that the terms of the New Agreements would be identical to those of the Existing Agreements in every respect except for the term and termination date and potentially the name of the investment adviser. The Board considerations in connection with the New Agreements and the Existing Agreements also entered into the decision by the Board to approve the Interim Agreements, which would take effect if the shareholders of the Fund do not approve the New Agreements before the Proposed Acquisition is completed. The Independent Trustees' consideration of the Existing Agreements is described above.
In evaluating the proposed New Agreements, the Independent Trustees considered that they have generally been satisfied with the nature and quality of the services provided to the Fund by Management and Neuberger, including investment advisory, administrative and support services, and that the Fund would be best served by an arrangement that appeared likely to maintain the continuity and stability of the providers of these services. Accordingly, the Independent Trustees considered very carefully the intentions of NBSH (including its successors or assign) regarding capitalization, management structure, staffing, compensation and staff retention and whether these seemed designed to provide the desired continuity and stability. They inquired specifically about staffing and resources in the areas of portfolio management, investment research, trading, fund accounting, legal and compliance, internal audit, and senior executive staff. Although at the time the Board considered the New Agreements no final decisions had been reached as to the distribution of equity interests in NBSH (or its successor or assign), the Trustees were advised that senior members of management, including the Fund Trustee and nominee for Fund Trustee who are employed by the Advisers, would receive equity interests in NBSH. Because of these interests, as well as any future employment arrangements with the Advisers, these persons, individually or in the aggregate, could have a material interest in the Proposed Acquisition and in shareholder approval of the New Agreements. In considering the New Agreements, the Trustees were aware of these interests.
The Independent Trustees inquired whether NBSH (or its successors or assign) had specific plans for the future structure of the Neuberger Berman Funds, whether they plan to propose to eliminate any Funds, and whether they intend to continue or alter certain expansion plans that are already underway. They also inquired whether there are plans to change the fees or expense structure of any of the Funds. The Independent Trustees inquired about the long-term plans for the Advisers, including any expectations for cost savings or expense reductions. They also inquired about the capital structure and working capital likely to be available to NBSH (or its successors or assign).
The Independent Trustees considered the following factors, in addition to the factors discussed above, among others, in connection with their consideration of the New Agreements: (1) the nature, extent, and quality of the services provided by Management and Neuberger; (2) the performance of the Fund compared to a relevant market index and a peer group
35
of investment companies; (3) the costs of the services provided and profits or losses realized by Management and its affiliates from their relationship with the Fund; (4) the extent to which economies of scale might be realized as the Fund grows; and (5) whether fee levels reflect any such potential economies of scale for the benefit of investors in the Fund. In their deliberations, the Independent Trustees did not identify any particular information that was all important or controlling, and each Trustee may have attributed different weights to the various factors.
In unanimously approving and recommending the New Agreements, the Independent Trustees concluded that the terms of each New Agreement are fair and reasonable and that approval of the New Agreements is in the best interests of the Fund and its shareholders. In reaching this determination, the Independent Trustees considered the following factors, among others:
(1) that the terms of the New Agreements are identical in all material respects to those of the Existing Agreements;
(2) that the Advisers will maintain operational autonomy and continuity of management following the Proposed Acquisition;
(3) the favorable history, reputation, qualification, and background of Management and Neuberger, as well as the qualifications of each entity's personnel and each entity's respective financial condition;
(4) the commitment of NBSH (or its successors or assign) to retain key personnel currently employed by Management and Neuberger who currently provide services to the Fund;
(5) the commitment of NBSH (or its successors or assign) to maintaining the current level and quality of Fund services;
(6) the proposed division of equity in NBSH (or its successor or assign) among Management Members and other personnel upon consummation of the Proposed Acquisition;
(7) the fees and expense ratio of the Fund relative to comparable mutual funds;
(8) that the fees are identical to those paid under the Existing Agreements;
(9) that the fees and expense ratios of the Fund appear to the Board to be reasonable given the quality of services expected to be provided;
(10) the commitment of Management to maintaining the Fund's current contractual expense limitation agreements to ensure that Fund shareholders of funds that have such arrangements in place do not face an increase in expenses upon consummation of the Proposed Acquisition;
(11) the performance of the Fund relative to comparable mutual funds and unmanaged indices;
(12) the commitment of Management (or its successor) to pay the expenses of the Fund in connection with the Proposed Acquisition, including all expenses in connection with the solicitation of proxies, so that shareholders of the Fund would not have to bear such expenses;
(13) the actual and potential effects on the Advisers of the bankruptcy of Lehman Brothers, and the effects of the Lehman Brothers bankruptcy on the information considered by the Independent Trustees in their prior analyses of the principal service contracts;
(14) the provisions made to continue providing to the Advisers certain services that were previously provided to them by or through Lehman Brothers or its other affiliates;
(15) the possible benefits that may be realized by the Fund and by the Advisers as a result of the Proposed Acquisition; and
(16) that the Proposed Acquisition is expected to maintain continuity of management of the Fund and may reduce the potential for future vulnerability to changes in control of the Advisers that could be adverse to the Fund's interests and that could affect the retention of key employees providing services to the Fund.
36

Neuberger Berman
Advisers Management Trust
Growth Portfolio
I Class Shares
Annual Report
December 31, 2008
B1015 02/09
Growth Portfolio Manager's Commentary
In 2008, one of the most difficult years on record for the equity markets, the Neuberger Berman Advisers Management Trust (AMT) Growth Portfolio outperformed its benchmark, the Russell Midcap(R) Growth Index, but posted a negative return.
The past year was characterized by tremendous rotation -- among the sectors, capitalization ranges and fundamental characteristics of the stocks that moved in and out of favor. For the full year, other than micro-caps, mid-cap stocks were the poorest performers by market capitalization. Growth stocks underperformed value stocks for the year and, within growth, the types of stocks we favor -- the higher quality, highest growth rate names -- were out of favor. While we are pleased to have outperformed our benchmark, this factor in particular was a headwind for the Portfolio.
Sectors that were most positive for the Portfolio's relative performance in 2008 included Industrials, Materials and Energy. Avoiding Utilities also benefited the Portfolio versus the benchmark.
Within Industrials, C.H. Robinson Worldwide, a trucking firm, performed well on continued strong margins despite a slowing economy. We also continue to hold names like Stericycle, AMETEK, Danaher and Fastenal, which although contributors to relative performance did not perform as well. In our opinion, these are high quality names with good earnings potential and cash flows, and self-sustaining business models. We think these factors are competitive advantages, and that such companies will be particularly well positioned as the economy begins to turn around.
Within Materials, strong stock selection was a benefit. We own companies like Airgas and Ecolab, which, like our Industrials holdings, we consider as being very high quality names with good earnings potential and cash flows.
Although Energy was one of the worst performing market sectors for the year, our Energy holdings outperformed sector constituents overall. Concho and Continental Resources were among our top performers, as oil and gas stocks with good earnings visibility have continued to do fairly well even as commodities prices have dropped. Services companies such as Smith International (among our poorest performers) did not fare as well in the sector, as their margins began to erode as oil prices deteriorated.
Sectors that negatively impacted performance included Financials, Health Care and Telecommunication Services.
In Financials, especially within banking, changes over the past year have meant that there are now fewer stocks to choose from within the mid-cap market. Many companies are either too small or have been acquired by companies that are too large. Within Financials, our focus has been on asset management. We prefer asset managers to banks or brokerage companies in the current climate. Stocks we own include companies like Blackrock, a relatively new addition to the Portfolio, and our longer-term holding, Lazard Ltd.
Within Health Care, one of our themes is medical diagnostics, with holdings such as Myriad Genetics continuing to do well. Intuitive Surgical, on the other hand, a robotic surgery equipment firm, performed poorly. This stock suffered as economic pressures limited hospitals' ability to purchase equipment. However, we believe that the stock is positioned to perform well as the economic environment improves.
Telecommunication Services holdings hurt the Portfolio during 2008; however, we continue to believe in the companies we own. Names like SBA Communications, a cell tower company, and NII Holdings, a wireless provider, were among our weakest performers. These companies underperformed due to concerns about financing needs. However, we believe that their needs are distant enough that current credit illiquidity will not be an issue, and that such well-run businesses will have access to credit.
As we move into 2009, we are selectively shifting the Portfolio away from last year's defensive stance and beginning to position the Portfolio for a more constructive market environment. As such, within Consumer Discretionary, we may move some focus away from our successful secondary education theme -- with strong performers like Strayer Education and DeVry -- in favor of the more aggressive gaming, lodging and retail sectors. We may also add to Telecommunications
1
as well. Within Information Technology, where our focus was primarily defensive during the year, we plan to add beta through areas that tend to move with the market, such as semiconductors.
Despite performance runs we have seen in lower quality stocks, we continue to believe that, longer term, stock selection will be a key and that the market will reward companies that possess strong fundamentals and quality growth characteristics. The companies that meet our fundamental criteria generally have strong balance sheets in that they possess good cash flow characteristics and are underleveraged and, therefore, do not have to go to the market for financing - which should benefit them on a competitive basis longer term. We continue to monitor credit spreads for indications that the various rescue packages are beginning to positively influence the economic situation. We are also looking for indications that the stimulus packages are beginning to positively impact the consumer, creating jobs, spurring consumer spending and, finally, restoring consumer confidence. As we see these developments, we intend to move the Portfolio from its current relatively defensive positioning.
Sincerely,

Kenneth J. Turek
Portfolio Manager
2
Growth Portfolio
SECTOR ALLOCATION
| (% of Equity Market Value) | |
| Energy | | | 7.1 | % | |
| Materials | | | 4.0 | | |
| Industrials | | | 19.3 | | |
| Consumer Discretionary | | | 13.2 | | |
| Consumer Staples | | | 5.9 | | |
| Health Care | | | 18.3 | | |
| Financials | | | 6.6 | | |
| Information Technology | | | 20.0 | | |
| Telecomm Service | | | 5.6 | | |
| Total | | | 100.0 | % | |
AVERAGE ANNUAL TOTAL RETURN1
| | | Inception
Date | | 1 Year | | 5 Year | | 10 Year | | Life of
Fund* | |
| Growth Portfolio Class I | | 09/10/84 | | | (43.68 | %) | | | 0.85 | % | | | (1.35 | %) | | | 7.45 | % | |
| Russell Midcap(R) Growth2 | | | | | (44.32 | %) | | | (2.33 | %) | | | (0.19 | %) | | | N/A | | |
| Russell Midcap(R)2 | | | | | (41.46 | %) | | | (0.71 | %) | | | 3.18 | % | | | 10.90 | % | |
Performance data quoted represent past performance, which is no guarantee of future results. The investment return and principal value of an investment will fluctuate so that an investor's shares, when redeemed may be worth more or less than their original cost. Results are shown on a "total return" basis and include reinvestment of all dividends and capital gain distributions.
Current performance may be higher or lower than the performance data quoted. For performance data current to the most recent month end, please visit https://www.nb.com.
* Index returns are as of the inception date 9/10/84.
As stated in the Portfolio's most recent prospectus, the total annual fund operating expense ratio for fiscal year 2007 was 1.00% for Class I shares (prior to any fee waivers or expense reimbursements). Neuberger Berman Management LLC has contractually agreed to limit certain expenses of the Portfolio through 12/31/2011.
COMPARISON OF A $10,000 INVESTMENT

The chart shows the value of a hypothetical $10,000 investment in the Portfolio over the past 10 fiscal years. The result is compared with benchmarks, which may include a broad-based market index and/or a narrower index. Please note that market indexes do not include expenses. All results include the reinvestment of dividends and capital gain distributions. Results represent past performance and do not indicate future results. The chart and table do not reflect the deduction of taxes that a shareholder would pay on Portfolio distributions or the redemption of Portfolio shares.
Please see Endnotes for additional information.
3
Endnotes
1. "Total Return" includes reinvestment of all income dividends and capital gain distributions. Results represent past performance and do not indicate future results. The value of an investment in the Portfolio and the return on the investment both will fluctuate, and redemption process may be higher or lower than an investor's original cost. The performance information does not reflect fees and expenses of the variable annuity and variable life insurance policies or the pension plans whose proceeds are invested in the Portfolio. Neuberger Berman Management LLC ("NBM LLC") has agreed to absorb certain expenses of the AMT Portfolios, including the Portfolio. Without this arrangement, which is subject to change, the total returns of the Portfolio may have been less.
2. The Russell Midcap(R) Growth Index measures the performance of those Russell Midcap(R) Index companies with higher price-to-book ratios and higher forecasted growth values. The Russell Midcap Index measures the performance of the 800 smallest companies in the Russell 1000(R) Index, which represents approximately 31% of the total market capitalization of the Russell 1000 Index (which, in turn, consists of the 1,000 largest U.S. companies, based on market capitalization). Please note that indices do not take into account any fees and expenses of investing in the individual securities that they track and that individuals cannot invest directly in any index. Data about the performance of these indices are prepared or obtained by NBM LLC and include reinvestment of all dividends and capital gain distributions. The Portfolio may invest in many securities not included in the above-described indices.
Any ratios or other measurements using a factor of forecasted earnings of a company discussed herein are based on consensus estimates, not NBM LLC's own projections, and they may or may not be realized. In addition, any revision to a forecast could affect the market price of a security. By quoting them herein, NBM LLC does not offer an opinion as to the accuracy of and does not guarantee these forecasted numbers.
The investments for the Portfolio are managed by the same portfolio manager(s) who manage one or more other mutual funds that have similar names, investment objectives and investment styles as the Portfolio. You should be aware that the Portfolio is likely to differ from the other mutual funds in size, cash flow pattern and tax matters. Accordingly, the holdings and performance of the Portfolio can be expected to vary from those of the other mutual funds.
The composition, industries and holdings of the Portfolio are subject to change.
Shares of the separate AMT Portfolios are sold only through the currently effective prospectus and are not available to the general public. Shares of this Portfolio may be purchased only by life insurance companies to be used with their separate accounts that fund variable annuity and variable life insurance policies and by qualified pension and retirement plans.
(c) 2009 Neuberger Berman Management LLC distributor. All rights reserved.
4
Information About Your Fund's Expenses
This table is designed to provide information regarding costs related to your investments. All mutual funds incur operating expenses, which include management fees, fees for administrative services and costs of shareholder reports, among others. The following examples are based on an investment of $1,000 made at the beginning of the six month period ended December 31, 2008 and held for the entire period. The table illustrates the fund's costs in two ways:
| Actual Expenses and Performance: | | The first section of the table provides information about actual account values and actual expenses in dollars, based on the fund's actual performance during the period. You may use the information in this line, together with the amount you invested, to estimate the expenses you paid over the period. Simply divide your account value by $1,000 (for example, an $8,600 account value divided by $1,000 = 8.6), then multiply the result by the number in the first section of the table under the heading entitled "Expenses Paid During the Period" to estimate the expenses you paid over the period. | |
|
| Hypothetical Example for Comparison Purposes: | | The second section of the table provides information about hypothetical account values and hypothetical expenses based on the fund's actual expense ratio and an assumed rate of return at 5% per year before expenses. This return is not the fund's actual return. The hypothetical account values and expenses may not be used to estimate the actual ending account balance or expenses you paid for the period. You may use this information to compare the ongoing costs of investing in this fund versus other funds. To do so, compare the expenses shown in this 5% hypothetical example with the 5% hypothetical examples that appear in the shareholder reports of other funds. | |
|
Please note that the expenses in the table are meant to highlight your ongoing costs only. The table and the expense example do not include any transactional costs, such as fees and expenses that are, or may be, imposed under your variable contract or qualified pension plan. Therefore, the information under the heading "Hypothetical (5% annual return before expenses)" is useful in comparing ongoing costs only, and will not help you determine the relative total costs of owning different funds. In addition, if these transactional costs were included, your costs would have been higher.
Expense Information as of 12/31/08 (Unaudited)
NEUBERGER BERMAN ADVISERS MANAGEMENT TRUST GROWTH PORTFOLIO
| Actual | | Beginning Account
Value
7/1/08 | | Ending Account
Value
12/31/08 | | Expenses Paid
During the Period*
7/1/08-12/31/08 | |
| Class I | | $ | 1,000.00 | | | $ | 638.70 | | | $ | 4.45 | | |
| Hypothetical (5% annual return before expenses)** | | | | | |
| Class I | | $ | 1,000.00 | | | $ | 1,019.71 | | | $ | 5.48 | | |
* Expenses are equal to the annualized expense ratio of 1.08%, multiplied by the average account value over the period, multiplied by 184/366 (to reflect the one-half year period shown).
** Hypothetical 5% annual return before expenses is calculated by multiplying the number of days in the most recent half year divided by 366.
5
Schedule of Investments Growth Portfolio
| NUMBER OF SHARES | | | | MARKET VALUEt | |
| Common Stocks (99.7%) | | | |
| Aerospace & Defense (1.0%) | | | |
| | 13,400 | | | Precision Castparts | | $ | 797,032 | | |
| Air Freight & Logistics (2.9%) | | | |
| | 32,200 | | | C.H. Robinson Worldwide | | | 1,771,966 | | |
| | 18,700 | | | Expeditors International | | | 622,149 | E | |
| | | | 2,394,115 | | |
| Beverages (0.3%) | | | |
| | 11,000 | | | Central European Distribution | | | 216,700 | * | |
| Biotechnology (4.6%) | | | |
| | 15,000 | | | Alexion Pharmaceuticals | | | 542,850 | *E | |
| | 11,000 | | | Cephalon, Inc. | | | 847,440 | *E | |
| | 23,000 | | | Myriad Genetics | | | 1,523,980 | * | |
| | 6,350 | | | United Therapeutics | | | 397,192 | *E | |
| | 14,900 | | | Vertex Pharmaceuticals | | | 452,662 | *E | |
| | | | 3,764,124 | | |
| Capital Markets (3.6%) | | | |
| | 5,200 | | | BlackRock, Inc. | | | 697,580 | E | |
| | 43,200 | | | Lazard Ltd. | | | 1,284,768 | | |
| | 19,000 | | | Northern Trust | | | 990,660 | | |
| | | | 2,973,008 | | |
| Chemicals (2.7%) | | | |
| | 35,000 | | | Airgas, Inc. | | | 1,364,650 | | |
| | 23,500 | | | Ecolab Inc. | | | 826,025 | | |
| | | | 2,190,675 | | |
| Commercial Services & Supplies (8.2%) | | | |
| | 10,000 | | | Clean Harbors | | | 634,400 | * | |
| | 13,000 | | | Copart, Inc. | | | 353,470 | *E | |
| | 48,000 | | | Corrections Corporation
of America | | | 785,280 | * | |
| | 19,700 | | | CoStar Group | | | 648,918 | *E | |
| | 39,900 | | | Covanta Holding | | | 876,204 | * | |
| | 56,200 | | | Iron Mountain | | | 1,389,826 | *E | |
| | 28,800 | | | Stericycle, Inc. | | | 1,499,904 | * | |
| | 18,000 | | | Waste Connections | | | 568,260 | * | |
| | | | 6,756,262 | | |
| Communications Equipment (2.6%) | | | |
| | 35,000 | | | Harris Corp. | | | 1,331,750 | | |
| | 48,000 | | | Juniper Networks | | | 840,480 | *E | |
| | | | 2,172,230 | | |
| Construction & Engineering (1.2%) | | | |
| | 20,500 | | | Jacobs Engineering Group | | | 986,050 | * | |
| NUMBER OF SHARES | | | | MARKET VALUEt | |
| Construction Materials (0.3%) | | | |
| | 2,500 | | | Martin Marietta Materials | | $ | 242,700 | | |
| Containers & Packaging (0.6%) | | | |
| | 19,500 | | | Pactiv Corp. | | | 485,160 | * | |
| Diversified Consumer Services (5.0%) | | | |
| | 11,000 | | | American Public Education | | | 409,090 | * | |
| | 32,500 | | | DeVry, Inc. | | | 1,865,825 | | |
| | 8,500 | | | Strayer Education | | | 1,822,485 | | |
| | | | 4,097,400 | | |
| Diversified Financial Services (1.3%) | | | |
| | 8,500 | | | IntercontinentalExchange Inc. | | | 700,740 | * | |
| | 15,250 | | | Nasdaq OMX Group | | | 376,828 | * | |
| | | | 1,077,568 | | |
| Electrical & Electronics (0.5%) | | | |
| | 18,000 | | | Silicon Laboratories | | | 446,040 | * | |
| Electrical Equipment (1.2%) | | | |
| | 33,100 | | | AMETEK, Inc. | | | 999,951 | | |
Electronic Equipment,
Instruments & Components (5.8%) | | | |
| | 42,700 | | | Dolby Laboratories | | | 1,398,852 | * | |
| | 34,000 | | | FLIR Systems | | | 1,043,120 | *E | |
| | 10,600 | | | Itron, Inc. | | | 675,644 | * | |
| | 4,800 | | | Mettler-Toledo International | | | 323,520 | * | |
| | 16,500 | | | National Instruments | | | 401,940 | | |
| | 43,000 | | | Trimble Navigation | | | 929,230 | * | |
| | | | 4,772,306 | | |
| Energy Equipment & Services (2.7%) | | | |
| | 20,600 | | | CARBO Ceramics | | | 731,918 | | |
| | 8,450 | | | Core Laboratories N.V. | | | 505,817 | | |
| | 25,000 | | | IHS Inc. | | | 935,500 | * | |
| | | | 2,173,235 | | |
| Food & Staples Retailing (3.0%) | | | |
| | 17,800 | | | BJ's Wholesale Club | | | 609,828 | * | |
| | 46,600 | | | Shoppers Drug Mart Corp. | | | 1,813,795 | | |
| | | | 2,423,623 | | |
| Food Products (1.4%) | | | |
| | 19,200 | | | Ralcorp Holdings | | | 1,121,280 | *E | |
See Notes to Schedule of Investments 6
| NUMBER OF SHARES | | | | MARKET VALUEt | |
| Health Care Equipment & Supplies (7.3%) | | | |
| | 15,000 | | | C.R. Bard | | $ | 1,263,900 | E | |
| | 25,400 | | | Gen-Probe | | | 1,088,136 | * | |
| | 18,700 | | | IDEXX Laboratories | | | 674,696 | * | |
| | 5,600 | | | Intuitive Surgical | | | 711,144 | * | |
| | 22,100 | | | Masimo Corp. | | | 659,243 | * | |
| | 13,500 | | | NuVasive, Inc. | | | 467,775 | * | |
| | 54,700 | | | Wright Medical Group | | | 1,117,521 | * | |
| | | | 5,982,415 | | |
| Health Care Providers & Services (3.9%) | | | |
| | 18,700 | | | Express Scripts | | | 1,028,126 | *E | |
| | 9,000 | | | HMS Holdings | | | 283,680 | * | |
| | 22,500 | | | Psychiatric Solutions | | | 626,625 | * | |
| | 62,900 | | | VCA Antech | | | 1,250,452 | * | |
| | | | 3,188,883 | | |
| Hotels, Restaurants & Leisure (3.2%) | | | |
| | 30,000 | | | Penn National Gaming | | | 641,400 | * | |
| | 57,600 | | | WMS Industries | | | 1,549,440 | * | |
| | 11,000 | | | Wynn Resorts | | | 464,860 | *E | |
| | | | 2,655,700 | | |
| Household Products (0.8%) | | | |
| | 12,000 | | | Church & Dwight | | | 673,440 | | |
| Insurance (1.6%) | | | |
| | 14,500 | | | Aon Corp. | | | 662,360 | | |
| | 2,500 | | | Everest Re Group | | | 190,350 | | |
| | 13,500 | | | Fidelity National
Financial Class A | | | 239,625 | | |
| | 7,250 | | | W.R. Berkley | | | 224,750 | | |
| | | | 1,317,085 | | |
| Internet Software & Services (1.5%) | | | |
| | 12,000 | | | Equinix, Inc. | | | 638,280 | * | |
| | 30,000 | | | VistaPrint Ltd. | | | 558,300 | * | |
| | | | 1,196,580 | | |
| IT Services (4.0%) | | | |
| | 25,500 | | | Alliance Data Systems | | | 1,186,515 | * | |
| | 50,000 | | | Cognizant
Technology Solutions | | | 903,000 | * | |
| | 3,400 | | | MasterCard, Inc. Class A | | | 485,962 | E | |
| | 37,000 | | | SAIC Inc. | | | 720,760 | * | |
| | | | 3,296,237 | | |
| Life Science Tools & Services (0.8%) | | | |
| | 25,000 | | | Illumina, Inc. | | | 651,250 | *E | |
| Machinery (1.7%) | | | |
| | 24,000 | | | Danaher Corp. | | | 1,358,640 | | |
| Metals & Mining (0.5%) | | | |
| | 7,500 | | | Agnico-Eagle Mines | | | 384,975 | E | |
| NUMBER OF SHARES | | | | MARKET VALUEt | |
| Multiline Retail (0.6%) | | | |
| | 13,000 | | | Kohl's Corp. | | $ | 470,600 | * | |
| Oil, Gas & Consumable Fuels (4.4%) | | | |
| | 43,200 | | | Concho Resources | | | 985,824 | * | |
| | 15,400 | | | Continental Resources | | | 318,934 | * | |
| | 23,500 | | | Range Resources | | | 808,165 | | |
| | 28,900 | | | Southwestern Energy | | | 837,233 | * | |
| | 19,200 | | | XTO Energy | | | 677,184 | | |
| | | | 3,627,340 | | |
| Personal Products (0.4%) | | | |
| | 5,000 | | | Chattem, Inc. | | | 357,650 | *E | |
| Pharmaceuticals (1.7%) | | | |
| | 43,200 | | | Perrigo Co. | | | 1,395,792 | | |
| Professional Services (0.9%) | | | |
| | 17,000 | | | FTI Consulting | | | 759,560 | * | |
| Road & Rail (0.8%) | | | |
| | 26,200 | | | J.B. Hunt Transport Services | | | 688,274 | | |
| Semiconductors (0.4%) | | | |
| | 14,500 | | | Lam Research | | | 308,560 | * | |
Semiconductors & Semiconductor
Equipment (1.3%) | | | |
| | 33,600 | | | Microchip Technology | | | 656,208 | E | |
| | 31,500 | | | Microsemi Corp. | | | 398,160 | * | |
| | | | 1,054,368 | | |
| Software (3.8%) | | | |
| | 110,000 | | | Activision Blizzard | | | 950,400 | * | |
| | 40,300 | | | ANSYS, Inc. | | | 1,123,967 | * | |
| | 17,800 | | | Blackboard Inc. | | | 466,894 | * | |
| | 19,000 | | | Salesforce.com, Inc. | | | 608,190 | *E | |
| | | | 3,149,451 | | |
| Specialty Retail (4.4%) | | | |
| | 32,650 | | | GameStop Corp. Class A | | | 707,199 | * | |
| | 23,000 | | | Gap Inc. | | | 307,970 | E | |
| | 37,000 | | | Ross Stores | | | 1,100,010 | | |
| | 16,500 | | | Staples, Inc. | | | 295,680 | | |
| | 17,000 | | | TJX Cos. | | | 349,690 | | |
| | 54,700 | | | Urban Outfitters | | | 819,406 | * | |
| | | | 3,579,955 | | |
| Trading Companies & Distributors (1.2%) | | | |
| | 28,800 | | | Fastenal Co. | | | 1,003,680 | E | |
See Notes to Schedule of Investments 7
| NUMBER OF SHARES | | | | MARKET VALUEt | |
| Wireless Telecommunication Services (5.6%) | | | |
| | 74,400 | | | American Tower | | $ | 2,181,408 | * | |
| | 17,000 | | | Metropcs Communications | | | 252,450 | * | |
| | 51,000 | | | NII Holdings | | | 927,180 | *E | |
| | 74,500 | | | SBA Communications | | | 1,215,840 | * | |
| | | | 4,576,878 | | |
| | Total Common Stocks | | | (Cost $88,153,720) | | | 81,766,772 | | |
| Short-Term Investments (13.2%) | | | |
| | 367,842 | | | Neuberger Berman Prime
Money Fund Trust Class | | | 367,842 | aoo | |
| | 10,488,504 | | | Neuberger Berman
Securities Lending
Quality Fund, LLC | | | 10,488,504 | t | |
| |
| | | Total Short-Term Investments
(Cost $10,856,346) | | | 10,856,346 | | |
| |
| | | Total Investments (112.9%)
(Cost $99,010,066) | | | 92,623,118## | | |
| | | | | Liabilities, less cash, receivables
and other assets [(12.9%)] | | | (10,593,012 | ) | |
| | | | | Total Net Assets (100.0%) | | $ | 82,030,106 | | |
See Notes to Schedule of Investments 8
Notes to Schedule of Investments Growth Portfolio
t Investments in equity securities by Neuberger Berman Advisers Management Trust Growth Portfolio (the "Fund") are valued by an independent pricing service. The independent pricing service values equity securities at the latest sale price where that price is readily available. Securities traded primarily on the NASDAQ Stock Market are normally valued by the Fund at the NASDAQ Official Closing Price ("NOCP") provided by NASDAQ each business day. The NOCP is the most recently reported price as of 4:00:02 p.m., Eastern time, unless that price is outside the range of the "inside" bid and asked prices (i.e., the bid and asked prices that dealers quote to each other when trading for their own accounts); in that case, NASDAQ will adjust the price to equal the inside bid or asked price, whichever is closer. Because of delays in reporting trades, the NOCP may not be based on the price of the last trade to occur before the market closes. If there is no reported sale of a security on a particular day, the independent pricing service may value the security based on reported market quotations. If a valuation is not available from an independent pricing service, the Fund seeks to obtain quotations from principal market makers. If such quotations are not readily available, securities are valued using methods the Board of Trustees of Neuberger Berman Advisers Management Trust (the "Board") has approved on the belief that they reflect fair value. Numerous factors may be considered when determining the fair value of a security, including available analyst, media or other reports, trading in futures or ADRs and whether the issuer of the security being fair valued has other securities outstanding. Foreign security prices are furnished by independent quotation services and expressed in local currency values. Foreign security prices are currently translated from the local currency into U.S. dollars using the exchange rate as of 4:00 p.m., Eastern time. The Board has approved the use of Interactive Data Pricing and Reference Data, Inc. ("Interactive") to assist in determining the fair value of the Fund's foreign equity securities when changes in the value of a certain index suggest that the closing prices on the foreign exchanges may no longer represent the amount that the Fund could expect to receive for those securities. In this event, Interactive will provide adjusted prices for certain foreign equity securities using a statistical analysis of historical correlations of multiple factors. In the absence of precise information about the market values of these foreign securities as of the close of the New York Stock Exchange, the Board has determined on the basis of available data that prices adjusted in this way are likely to be closer to the prices the Fund could realize on a current sale than are the prices of those securities established at the close of the foreign markets in which the securities primarily trade. Fair value prices are necessarily estimates, and there is no assurance that such a price will be at or close to the price at which the security next trades. Short-term debt securities with less than 60 days until maturity may be valued at cost which, when combined with interest earned, approximates market value.
The Fund adopted Financial Accounting Standards Board ("FASB") Statement of Financial Accounting Standards No. 157, Fair Value Measurements ("FAS 157"), effective January 1, 2008. In accordance with FAS 157, "fair value" is defined as the price that a Fund would receive upon selling an investment in an orderly transaction to an independent buyer in the principal or most advantageous market for the investment. Various inputs are used in determining the value of the Fund's investments.
In addition to defining fair value, FAS 157 established a three-tier hierarchy of inputs to establish a classification of fair value measurements for disclosure purposes. The three-tier hierarchy of inputs is summarized in the three broad Levels listed below.
. Level 1 - quoted prices in active markets for identical investments
. Level 2 - other significant observable inputs (including quoted prices for similar investments, interest rates, prepayment speeds, credit risk, amortized cost, etc.)
. Level 3 - significant unobservable inputs (including the Fund's own assumptions in determining the fair value of investments)
The inputs or methodology used for valuing an investment are not necessarily an indication of the risk associated with investing in those securities.
See Notes to Financial Statements 9
Notes to Schedule of Investments Growth Portfolio (cont'd)
The following is a summary of the inputs used to value the Fund's investments as of December 31, 2008:
| Valuation Inputs | | Investments in
Securities | |
| Level 1 - Quoted Prices | | $ | 81,766,772 | | |
| Level 2 - Other Significant Observable Inputs | | | 10,856,346 | | |
| Level 3 - Significant Unobservable Inputs | | | -- | | |
| Total | | $ | 92,623,118 | | |
## At December 31, 2008, the cost of investments for U.S. federal income tax purposes was $99,663,067. Gross unrealized appreciation of investments was $8,691,589 and gross unrealized depreciation of investments was $15,731,538, resulting in net unrealized depreciation of $7,039,949, based on cost for U.S. federal income tax purposes.
* Security did not produce income during the last twelve months.
E All or a portion of this security is on loan (see Note A of Notes to Financial Statements).
t Managed by an affiliate of Neuberger Berman Management LLC and could be deemed an affiliate of the Fund and is segregated in connection with obligations for security lending (see Notes A & F of Notes to Financial Statements).
a Neuberger Berman Prime Money Fund ("Prime Money") is also managed by Neuberger Berman Management LLC and may be considered an affiliate since it has the same officers, Board members, and investment manager as the Fund and because, at times, the Fund may own 5% or more of the outstanding voting securities of Prime Money (see Notes A & F of Notes to Financial Statements).
oo All or a portion of this security is segregated in connection with obligations for security lending.
See Notes to Financial Statements 10
Statement of Assets and Liabilities
Neuberger Berman Advisers Management Trust
| | | GROWTH
PORTFOLIO | |
| | | December 31, 2008 | |
| Assets | |
| Investments in securities, at market value*t (Notes A & F)-see Schedule of Investments: | |
| Unaffiliated issuers | | $ | 81,766,772 | | |
| Affiliated issuers | | | 10,856,346 | | |
| | | | 92,623,118 | | |
| Foreign currency | | | 34,659 | | |
| Dividends and interest receivable | | | 42,641 | | |
| Receivable for securities sold | | | 371,048 | | |
| Receivable for Fund shares sold | | | 512 | | |
| Receivable for securities lending income (Note A) | | | 14,663 | | |
| Prepaid expenses and other assets | | | 4,696 | | |
| Total Assets | | | 93,091,337 | | |
| Liabilities | |
| Payable for collateral on securities loaned (Note A) | | | 10,563,001 | | |
| Payable for securities purchased | | | 334,840 | | |
| Payable for Fund shares redeemed | | | 25,774 | | |
| Payable to investment manager-net (Notes A & B) | | | 36,826 | | |
| Payable to administrator (Note B) | | | 20,101 | | |
| Payable for securities lending fees (Note A) | | | 20,731 | | |
| Accrued expenses and other payables | | | 59,958 | | |
| Total Liabilities | | | 11,061,231 | | |
| Net Assets at value | | $ | 82,030,106 | | |
| Net Assets consist of: | |
| Paid-in capital | | $ | 285,215,680 | | |
| Accumulated net realized gains (losses) on investments | | | (196,791,898 | ) | |
| Net unrealized appreciation (depreciation) in value of investments | | | (6,393,676 | ) | |
| Net Assets at value | | $ | 82,030,106 | | |
| Shares Outstanding ($.001 par value; unlimited shares authorized) | | | 7,546,167 | | |
| Net Asset Value, offering and redemption price per share | | $ | 10.87 | | |
| tSecurities on loan, at market value: | |
| Unaffiliated issuers | | $ | 10,340,626 | | |
| *Cost of Investments: | |
| Unaffiliated issuers | | $ | 88,153,720 | | |
| Affiliated issuers | | | 10,856,346 | | |
| Total cost of investments | | $ | 99,010,066 | | |
| Total cost of foreign currency | | $ | 41,287 | | |
See Notes to Financial Statements 11
Statement of Operations
Neuberger Berman Advisers Management Trust
| | | GROWTH
PORTFOLIO | |
| | | For the
Year Ended
December 31, 2008 | |
| Investment Income: | |
| Income (Note A): | |
| Dividend income--unaffiliated issuers | | $ | 444,030 | | |
| Interest income--unaffiliated issuers | | | 81 | | |
| Income from securities loaned--net (Note F) | | | 52,863 | | |
| Income from investments in affiliated issuers (Note F) | | | 28,452 | | |
| Foreign taxes withheld | | | (8,738 | ) | |
| Total income | | $ | 516,688 | | |
| Expenses: | |
| Investment management fees (Notes A & B) | | | 704,408 | | |
| Administration fees (Note B) | | | 384,222 | | |
| Audit fees | | | 40,493 | | |
| Custodian fees (Note B) | | | 86,702 | | |
| Insurance expense | | | 4,366 | | |
| Legal fees | | | 28,848 | | |
| Shareholder reports | | | 38,336 | | |
| Trustees' fees and expenses | | | 38,134 | | |
| Miscellaneous | | | 9,771 | | |
| Total expenses | | | 1,335,280 | | |
| Investment management fees waived (Note A) | | | (851 | ) | |
| Expenses reduced by custodian fee expense offset and commission recapture arrangements (Note B) | | | (8,815 | ) | |
| Total net expenses | | | 1,325,614 | | |
| Net investment income (loss) | | $ | (808,926 | ) | |
| Realized and Unrealized Gain (Loss) on Investments (Note A) | |
| Net realized gain (loss) on: | |
| Sales of investment securities of unaffiliated issuers | | | (3,194,664 | ) | |
| Sales of investment securities of affiliated issuers | | | (74,497 | ) | |
| Foreign currency | | | 1,785 | | |
| Change in net unrealized appreciation (depreciation) in value of: | |
| Unaffiliated investment securities | | | (64,846,265 | ) | |
| Foreign currency | | | (9,704 | ) | |
| Net gain (loss) on investments | | | (68,123,345 | ) | |
| Net increase (decrease) in net assets resulting from operations | | $ | (68,932,271 | ) | |
See Notes to Financial Statements 12
Statements of Changes in Net Assets
Neuberger Berman Advisers Management Trust
| | | GROWTH PORTFOLIO | |
| | | Year Ended
December 31,
2008 | | Year Ended
December 31,
2007 | |
| Increase (Decrease) in Net Assets: | |
| From Operations: | |
| Net investment income (loss) | | $ | (808,926 | ) | | $ | (1,070,933 | ) | |
| Net realized gain (loss) on investments | | | (3,267,376 | ) | | | 37,533,442 | | |
| Change in net unrealized appreciation (depreciation) of investments | | | (64,855,969 | ) | | | (810,193 | ) | |
| Net increase (decrease) in net assets resulting from operations | | | (68,932,271 | ) | | | 35,652,316 | | |
| From Fund Share Transactions (Note D): | |
| Proceeds from shares sold | | | 1,232,995 | | | | 2,818,408 | | |
| Payments for shares redeemed | | | (22,837,977 | ) | | | (33,603,676 | ) | |
| Net increase (decrease) from Fund share transactions | | | (21,604,982 | ) | | | (30,785,268 | ) | |
| Net Increase (Decrease) in Net Assets | | | (90,537,253 | ) | | | 4,867,048 | | |
| Net Assets: | |
| Beginning of year | | | 172,567,359 | | | | 167,700,311 | | |
| End of year | | $ | 82,030,106 | | | $ | 172,567,359 | | |
| Undistributed net investment income (loss) at end of year | | $ | -- | | | $ | -- | | |
See Notes to Financial Statements 13
Notes to Financial Statements Growth Portfolio
Note A--Summary of Significant Accounting Policies:
1 General: Growth Portfolio (the "Fund") is a separate operating series of Neuberger Berman Advisers Management Trust (the "Trust"), a Delaware statutory trust organized pursuant to a Trust Instrument dated May 23, 1994. The Trust is currently comprised of ten separate operating series (each a "Series," collectively, the "Funds") each of which is diversified. The Trust is registered as an open-end management investment company under the Investment Company Act of 1940, as amended (the "1940 Act"), and its shares are registered under the Securities Act of 1933, as amended. The Fund currently offers only Class I shares. The Board of Trustees of the Trust (the "Board") may establish additional series or classes of shares without the approval of shareholders.
The assets of each Series belong only to that Series, and the liabilities of each Series are borne solely by that Series and no other.
The preparation of financial statements in accordance with U.S. generally accepted accounting principles requires Neuberger Berman Management LLC ("Management") to make estimates and assumptions at the date of the financial statements. Actual results could differ from those estimates.
Management, the investment manager of the Fund, and Neuberger Berman, LLC ("Neuberger"), the Fund's sub-adviser, are wholly owned subsidiaries of Lehman Brothers Holdings Inc. ("Lehman Brothers"), a publicly owned holding company. On September 15, 2008, Lehman Brothers filed a voluntary petition under Chapter 11 of the U.S. Bankruptcy Code. On December 3, 2008, NBSH Acquisition, LLC ("NBSH"), an entity organized by key members of Neuberger Berman's senior management, was selected as the successful bidder in the public auction to acquire a majority interest in Neuberger Berman's business and the fixed income and certain alternative asset management businesses of Lehman Brothers' Investment Management Division (together with Neuberger Berman, the "Acquired Businesses") (the "Proposed Acquisition"). On December 22, 2008, the bankruptcy court having jurisdiction over the Lehman Brothers matter approved the sale of the Acquired Business to NBSH (or its successor or assign), as the successful bidder. At the closing of the Proposed Acquisition, a majority interest in the Acquired Businesses will be directly or indirectly owned by portfolio managers, Neuberger Berman's management team and certain key members and senior professionals of the former Investment Management Division, as well as by Lehman Brothers and certain affiliates of Lehman Brothers. The transaction is subject to certain conditions and approvals.
These events, while affecting Lehman Brothers, have not had a material impact on the Fund or its operations. Management and Neuberger will continue to operate in the ordinary course of business as the investment manager and sub-adviser of the Fund.
Included in the Acquired Businesses are Management and Neuberger. The consummation of the Proposed Acquisition has been deemed to result in an "assignment" of the Fund's Management and Sub-Advisory Agreements which would, by law, automatically terminate those agreements. Accordingly, the Board, including the Trustees who are not "interested persons" of the Fund's investment manager and its affiliates or the Fund, has approved the new Management Agreements and Sub-Advisory Agreements for the Fund. The new agreements also will require the approval of the Fund's shareholders.
2 Portfolio valuation: Investment securities are valued as indicated in the notes following the Schedule of Investments.
3 Foreign currency translation: The accounting records of the Fund are maintained in U.S. dollars. Foreign currency amounts are currently translated into U.S. dollars using the exchange rates as of 4:00 p.m., Eastern time, to determine the value of investments, other assets and liabilities. Purchase and sale prices of securities, and income and expenses, are translated into U.S. dollars at the prevailing rate of exchange on the respective dates of such transactions. Net unrealized foreign currency gain (loss) arises from changes in the value of assets and liabilities, other than investments in securities, as a result of changes in exchange rates and is stated separately in the Statement of Operations.
14
4 Securities transactions and investment income: Securities transactions are recorded on trade date for financial reporting purposes. Dividend income is recorded on the ex-dividend date or, for certain foreign dividends, as soon as the Fund becomes aware of the dividends. Non-cash dividends included in dividend income, if any, are recorded at the fair market value of the securities received. Interest income, including accretion of original issue discount, where applicable, and accretion of discount on short-term investments, is recorded on the accrual basis. Realized gains and losses from securities transactions and foreign currency transactions, if any, are recorded on the basis of identified cost and stated separately in the Statement of Operations. Included in net realized gain (loss) on investments are proceeds from the settlements of class action litigation in which the Fund participated as a plaintiff. The amount of such proceeds for the year ended December 31, 2008 was $125,231.
5 Income tax information: The Funds are treated as separate entities for U.S. federal income tax purposes. It is the policy of the Fund to continue to qualify as a regulated investment company by complying with the requirements of Subchapter M of the Internal Revenue Code applicable to regulated investment companies and to distribute substantially all of its earnings to shareholders. Therefore, no federal income or excise tax provision is required.
The Fund has adopted the provisions of Financial Accounting Standards Board Interpretation No. 48 ("FIN 48") "Accounting for Uncertainty in Income Taxes -- an interpretation of FASB Statement No. 109". FIN 48 sets forth a minimum threshold for financial statement recognition of the benefit of a tax position taken, or expected to be taken, in a tax return. The Fund recognizes interest and penalties, if any, related to unrecognized tax benefits as an income tax expense in the Statement of Operations. The Fund is subject to examination by U.S. federal and state tax authorities for returns filed for the prior three fiscal years 2005 - 2007. As of December 31, 2008, the Fund did not have any unrecognized tax benefits.
Income distributions and capital gain distributions are determined in accordance with income tax regulations, which may differ from U.S. generally accepted accounting principles. These differences are primarily due to differing treatments of income and gains on various investment securities held by the Fund, timing differences and differing characterization of distributions made by the Fund as a whole. The Fund may also utilize earnings and profits distributed to shareholders on redemption of shares as a part of the dividends paid deduction for income tax purposes.
As determined on December 31, 2008, permanent differences resulting primarily from different book and tax accounting for net operating losses, foreign currency gains and losses and partnership holding adjustments, were reclassified at fiscal year-end. These reclassifications had no effect on net income, net asset value or net asset value per share of the Fund.
As of December 31, 2008, the components of distributable earnings (accumulated losses) on a U.S. federal income tax basis were as follows:
Undistributed
Ordinary
Income (Loss) | | Unrealized
Appreciation
(Depreciation) | | Loss
Carryforwards
and Deferrals | | Total | |
| $ | -- | | | $ | (7,046,675 | ) | | $ | (196,138,899 | ) | | $ | (203,185,574 | ) | |
The difference between book basis and tax basis distributable earnings is attributable primarily to timing differences of wash sales, capital loss carryforwards, post October loss deferral and partnership basis adjustments.
To the extent the Fund's net realized capital gains, if any, can be offset by capital loss carryforwards, it is the policy of the Fund not to distribute such gains. As determined at December 31, 2008, the Fund had unused capital loss carryforwards available for federal income tax purposes to offset net realized capital gains, if any, as follows:
| | | Expiring in: | |
| | | 2009 | | 2010 | |
| | | $ | 122,643,722 | | | $ | 70,119,797 | | |
15
During the year ended December 31, 2008, the Fund utilized capital loss carryforwards of $634,791.
Under current tax law, certain net capital and net foreign currency losses realized after October 31 within the taxable year may be deferred and treated as occurring on the first day of the following tax year. For the year ended December 31, 2008, the Fund elected to defer $3,375,380 net capital losses arising between November 1, 2008 and December 31, 2008.
6 Distributions to shareholders: The Fund may earn income, net of expenses, daily on its investments. Distributions from net investment income and net realized capital gains, if any, generally are distributed in October. Income distributions and capital gain distributions to shareholders are recorded on the ex-date.
7 Foreign taxes: Foreign taxes withheld represent amounts withheld by foreign tax authorities, net of refunds recoverable.
8 Expense allocation: Certain expenses are applicable to multiple funds. Expenses directly attributable to a Series are charged to that Series. Expenses of the Trust that are not directly attributed to a Series are allocated among the Funds, on the basis of relative net assets, except where a more appropriate allocation of expenses to each of the Funds can otherwise be made fairly. Expenses borne by the complex of related investment companies, which includes open-end and closed-end investment companies for which Management serves as investment manager, that are not directly attributed to a Series or the Trust are allocated among the Fund and the other investment companies in the complex or series thereof on the basis of relative net assets, except where a more appropriate allocation of expenses to each investment company in the complex or series thereof can otherwise be made fairly.
9 Security lending: A third party, eSecLending, has assisted the Fund in conducting a bidding process to identify agents/principals that would pay a guaranteed amount to the Fund in consideration of the Fund entering into an exclusive securities lending arrangement.
eSecLending currently serves as exclusive lending agent for the Fund. Under the securities lending arrangement, the Fund receives cash collateral at the beginning of each transaction equal to at least 102% of the prior day's market value of the loaned securities (105% in the case of international securities). The Fund may invest all the cash collateral in Neuberger Berman Securities Lending Quality Fund, LLC ("Quality Fund"), a fund managed by Lehman Brothers Asset Management LLC ("LBAM"), an affiliate of Management.
At various times during the course of the Fund's fiscal year ended December 31, 2008, the Quality Fund's NAV was below $1.00 per share, which could have affected the NAV of the Fund with securities loans outstanding during the period. The Quality Fund's price per share on December 31, 2008 was $1.00. The market value of the Fund's investments in the Quality Fund as of that date, if any, is reflected in the Fund's Schedule of Investments. If it were necessary to liquidate assets in the Quality Fund to meet returns on outstanding securities loans at a time when the Quality Fund's price per share was less than $1.00, the Fund may not receive an amount from the Quality Fund that is equal in amount to the collateral the Fund would be required to return to the borrower of the securities and the Fund would be required to make up for this shortfall. In addition, as a result of recent reduced liquidity in the credit and fixed income markets, it may be difficult to dispose quickly of some securities in the Quality Fund at the price at which the Quality Fund is carrying them. The Quality Fund is not a money market fund that operates in accordance with Rule 2a-7 under the 1940 Act and there is no assurance that it will maintain a $1.00 share price.
Net income from the lending program represents the guaranteed amount received from a principal plus income earned on the cash collateral invested in Quality Fund or in other investments, less cash collateral fees and other expenses associated with the loans. For the fiscal year ended December 31, 2008, the Fund received net income under the securities lending arrangement of $52,863, which is reflected in the Statement of Operations under the caption "Income from securities loaned -- net." For the fiscal year ended December 31, 2008, "Income from securities loaned -- net" consisted of $475,934 in income earned on cash collateral and guaranteed amounts (including $402,923 of interest income earned from the Quality Fund), less fees and expenses paid of $423,071.
10 Repurchase agreements: The Fund may enter into repurchase agreements with institutions that Management has determined are creditworthy. Each repurchase agreement is recorded at cost. The Fund requires that the securities purchased in a repurchase agreement be transferred to the custodian in a manner sufficient to enable the Fund to
16
assert a perfected security interest in those securities in the event of a default under the repurchase agreement. The Fund monitors, on a daily basis, the value of the securities transferred to ensure that their value, including accrued interest, is greater than amounts owed to the Fund under each such repurchase agreement.
11 Transactions with other funds managed by Neuberger Berman Management LLC: Pursuant to an Exemptive Order issued by the Securities and Exchange Commission, the Fund may invest in a money market fund managed by Management or an affiliate. The Fund invests in Neuberger Berman Prime Money Fund ("Prime Money"), as approved by the Board. Prime Money seeks to provide the highest available current income consistent with safety and liquidity. For any cash that the Fund invests in Prime Money, Management waives a portion of its management fee equal to the management fee it receives from Prime Money on those assets (the "Arrangement"). For the year ended December 31, 2008, management fees waived under this Arrangement amounted to $851 and are reflected in the Statement of Operations under the caption "Investment management fees waived." For the year ended December 31, 2008, income earned under this Arrangement amounted to $28,452 and is reflected in the Statement of Operations under the caption "Income from investments in affiliated issuers."
12 Indemnifications: Like many other companies, the Trust's organizational documents provide that its officers and trustees are indemnified against certain liabilities arising out of the performance of their duties to the Trust. In addition, both in some of its principal service contracts and in the normal course of its business, the Trust enters into contracts that provide indemnifications to other parties for certain types of losses or liabilities. The Trust's maximum exposure under these arrangements is unknown as this could involve future claims against the Trust.
Note B--Management Fees, Administration Fees, Distribution Arrangements, and Other Transactions With Affiliates:
Fund shares are issued and redeemed in connection with investments in and payments under certain variable annuity contracts and variable life insurance policies issued through separate accounts of life insurance companies and are also offered directly to qualified pension and retirement plans.
The Fund retains Management as its investment manager under a Management Agreement. For such investment management services, the Fund pays Management a fee at the annual rate of 0.55% of the first $250 million of the Fund's average daily net assets, 0.525% of the next $250 million, 0.50% of the next $250 million, 0.475% of the next $250 million, 0.45% of the next $500 million, 0.425% of the next $2.5 billion, and 0.40% of average daily net assets in excess of $4 billion.
The Fund retains Management as its administrator under an Administration Agreement. The Fund pays Management an administration fee at the annual rate of 0.30% of its average daily net assets under this agreement. Additionally, Management retains State Street Bank and Trust Company ("State Street") as its sub-administrator under a Sub-Administration Agreement. Management pays State Street a fee for all services received under this agreement.
The Board adopted a non-fee distribution plan for the Fund.
Management has contractually undertaken through December 31, 2011 to forgo current payment of fees and/or reimburse the Fund for its operating expenses (excluding the fees payable to Management, interest, taxes, brokerage commissions, extraordinary expenses, and transaction costs) ("Operating Expenses") which exceed, in the aggregate, 1.00% per annum of the Fund's average daily net assets (the "Expense Limitation"). For the year ended December 31, 2008, no reimbursement to the Fund was required. The Fund has agreed to repay Management through December 31, 2014 for fees and expenses foregone and/or its excess Operating Expenses previously reimbursed by Management, so long as its annual Operating Expenses during that period do not exceed its Expense Limitation, and the repayment is made within three years after the year in which Management issued the reimbursement or waived fees. During the year ended December 31, 2008, there was no repayment to Management under this agreement. At December 31, 2008, the Fund had no contingent liability to Management under this agreement.
17
Neuberger is retained by Management to furnish it with investment recommendations and research information without added cost to the Fund. Several individuals who are officers and/or trustees of the Trust are also employees of Neuberger and/or Management.
The Fund had entered into a commission recapture program, which enabled it to pay some of its operational expenses by recouping a portion of the commissions it paid to a broker that was not a related party of the Fund. Pursuant to the agreement, brokers paid recaptured commissions to the Fund's custodian and the custodian directed these amounts toward payment of expenses such as custodial, transfer agency or accounting services. Effective April 1, 2008, this commission recapture program was terminated. For the period ended March 31, 2008, the impact of this arrangement was a reduction of expenses of $8,527.
The Fund has an expense offset arrangement in connection with its custodian contract. For the year ended December 31, 2008, the impact of this arrangement was a reduction of expenses of $288.
Note C--Securities Transactions:
During the year ended December 31, 2008, there were purchase and sale transactions (excluding short-term securities) of $81,547,788 and $103,818,813, respectively.
During the year ended December 31, 2008, brokerage commissions on securities transactions paid to affiliated brokers were as follows: Neuberger received $0 and Lehman Brothers Inc. received $11,278.
Note D--Fund Share Transactions:
Share activity for the years ended December 31, 2008 and December 31, 2007 was as follows:
| | | For the Year Ended December 31, | |
| | | 2008 | | 2007 | |
| Shares Sold | | | 83,656 | | | | 152,805 | | |
| Shares Redeemed | | | (1,478,574 | ) | | | (1,875,128 | ) | |
| Total | | | (1,394,918 | ) | | | (1,722,323 | ) | |
Note E--Line of Credit:
At December 31, 2008, the Fund was a participant in a single committed, unsecured $150,000,000 line of credit with State Street, to be used only for temporary or emergency purposes. Other investment companies managed by Management also participate in this line of credit on the same terms. Interest is charged on borrowings under this line of credit at the overnight Federal Funds Rate plus 0.50% per annum. A facility fee of 0.07% (as of September 19, 2008, 0.09%) per annum of the available line of credit is charged, of which the Fund has agreed to pay its pro rata share, based on the ratio of its individual net assets to the net assets of all participants at the time the fee is due and payable. The fee is paid quarterly in arrears. Because several investment companies participate, there is no assurance that an individual Fund will have access to all or any part of the $150,000,000 at any particular time. There were no loans outstanding pursuant to this line of credit at December 31, 2008. During the year ended December 31, 2008, the Fund did not utilize this line of credit.
18
Note F-Investments in Affiliates:
| Name of Issuer | | Balance of
Shares Held
December 31,
2007 | | Gross
Purchases
and Additions | | Gross
Sales and
Reductions | | Balance of
Shares Held
December 31,
2008 | | Value
December 31,
2008 | | Income from
Investments
in Affiliated
Issuers Included
in Total Income | |
Neuberger Berman Prime
Money Fund Trust Class* | | | - | | | | 30,633,748 | | | | 30,265,906 | | | | 367,842 | | | $ | 367,842 | | | $ | 28,452 | | |
Neuberger Berman
Securities Lending
Quality Fund, LLC** | | | 21,865,112 | | | | 165,326,916 | | | | 176,703,524 | | | | 10,488,504 | | | | 10,488,504 | | | | 402,923 | | |
| Total | | | | | | | | | | $ | 10,856,346 | | | $ | 431,375 | | |
* Prime Money is also managed by Management and may be considered an affiliate since it has the same officers, Board members, and investment manager as the Fund and because, at times, the Fund may own 5% or more of the outstanding voting securities of Prime Money.
** Quality Fund, a fund managed by LBAM, an affiliate of Management, is used to invest cash the Fund receives as collateral for securities loaned as approved by the Board. Because all shares of Quality Fund are held by funds in the related investment management complex, Quality Fund may be considered an affiliate of the Fund.
Note G--Recent Accounting Pronouncement:
In March 2008, Statement of Financial Accounting Standards No. 161, "Disclosures about Derivative Instruments and Hedging Activities -- an amendment of FASB Statement No. 133" ("FAS 161"), was issued. FAS 161 is intended to improve financial reporting for derivative instruments by requiring enhanced disclosure that enables investors to understand how and why an entity uses derivatives, how derivatives are accounted for, and how derivative instruments affect an entity's results of operations and financial position. In September 2008, FASB Staff Position No. 133-1 and FASB Interpretation No. 45-4 (the "FSP"), "Disclosures about Credit Derivatives and Certain Guarantees: An Amendment of FASB Statement No. 133 and FASB Interpretation No. 45; and Clarification of the Effective Date of FASB Statement No. 161" was issued. Certain provisions of the FSP amend FASB Statement No. 133, "Accounting for Derivative Instruments and Hedging Activities," to require disclosures by sellers of credit derivatives, including credit derivatives embedded in hybrid instruments. These FSP provisions are effective for fiscal years and interim periods ending after November 15, 2008. At this time, Management has assessed the implication of these FSP provisions and determined there is no impact to the Fund's financial statements. The FSP also clarifies the effective date of FAS 161, whereby disclosures required by FAS 161 are effective for financial statements issued for fiscal years and interim periods beginning after November 15, 2008. The impact of FAS 161 on the Fund's financial statement disclosures, if any, is currently being assessed.
Note H--Recent Market Events
The year covered by this report witnessed an unusually high degree of volatility in the financial markets and the net asset values of many mutual funds, including to some extent the Fund. Both domestic and international equity markets have been experiencing heightened volatility and turmoil, with issuers that have exposure to the real estate, mortgage and credit markets particularly affected. In addition to the recent turbulence in financial markets, the reduced liquidity in credit and fixed income markets has negatively affected many issuers worldwide. The Fund's investments in certain issuers, as reflected in the Fund's schedule of investments, and the financial markets in general, expose investors to the volatile performance resulting from these market conditions and related events.
19
Financial Highlights
Growth Portfolio
The following table includes selected data for a share outstanding throughout each year and other performance information derived from the Financial Statements.
| | | Year Ended December 31, | |
| | | 2008 | | 2007 | | 2006 | | 2005 | | 2004 | |
| Net Asset Value, Beginning of Year | | $ | 19.30 | | | $ | 15.73 | | | $ | 13.79 | | | $ | 12.15 | | | $ | 10.42 | | |
| Income From Investment Operations: | |
| Net Investment Income (Loss)t | | | (.10 | ) | | | (.11 | ) | | | (.05 | ) | | | (.07 | ) | | | (.06 | ) | |
Net Gains or Losses on Securities
(both realized and unrealized) | | | (8.33 | ) | | | 3.68 | | | | 1.99 | | | | 1.71 | | | | 1.79 | | |
| Total From Investment Operations | | | (8.43 | ) | | | 3.57 | | | | 1.94 | | | | 1.64 | | | | 1.73 | | |
| Net Asset Value, End of Year | | $ | 10.87 | | | $ | 19.30 | | | $ | 15.73 | | | $ | 13.79 | | | $ | 12.15 | | |
| Total Returntt | | | (43.68 | )% | | | 22.70 | % | | | 14.07 | % | | | 13.50 | % | | | 16.60 | % | |
| Ratios/Supplemental Data | |
| Net Assets, End of Year (in millions) | | $ | 82.0 | | | $ | 172.6 | | | $ | 167.7 | | | $ | 196.5 | | | $ | 208.1 | | |
| Ratio of Gross Expenses to Average Net Assets# | | | 1.04 | % | | | 1.00 | % | | | 1.00 | % | | | 1.00 | % | | | .96 | % | |
| Ratio of Net Expenses to Average Net AssetsS | | | 1.04 | % | | | .99 | % | | | .99 | % | | | .99 | % | | | .94 | % | |
Ratio of Net Investment Income (Loss) to
Average Net Assets | | | (.63 | )% | | | (.61 | )% | | | (.35 | )% | | | (.55 | )% | | | (.51 | )% | |
| Portfolio Turnover Rate | | | 63 | % | | | 48 | % | | | 40 | % | | | 53 | % | | | 83 | % | |
See Notes to Financial Highlights 20
Notes to Financial Highlights Growth Portfolio
tt Total return based on per share net asset value reflects the effects of changes in net asset value on the performance of the Fund during each fiscal period and assumes dividends and other distributions, if any, were reinvested. Results represent past performance and do not guarantee future results. Current returns may be lower or higher than the performance data quoted. Investment returns and principal may fluctuate and shares when redeemed may be worth more or less than original cost. Total return would have been lower if Management had not waived certain expenses. The total return information shown does not reflect charges and other expenses that apply to the separate account or the related insurance policies, and the inclusion of these charges and other expenses would reduce the total return for all fiscal periods shown.
# The Fund is required to calculate an expense ratio without taking into consideration any expense reductions related to expense offset arrangements.
t Calculated based on the average number of shares outstanding during each fiscal period.
S After waiver of a portion of the investment management fee by Management. Had Management not undertaken such action, the annualized ratios of net expenses to average daily net assets would have been:
| Year Ended December 31, | |
| 2008 | | 2007 | | 2006 | | 2005 | | 2004 | |
| | 1.04 | % | | | .99 | % | | | .99 | % | | | .99 | % | | | .94 | % | |
21
Report of Independent Registered Public Accounting Firm
To the Board of Trustees of
Neuberger Berman Advisers Management Trust and
Shareholders of Growth Portfolio
We have audited the accompanying statement of assets and liabilities, including the schedule of investments, of Growth Portfolio, one of the series constituting Neuberger Berman Advisers Management Trust (the "Trust"), as of December 31, 2008, and the related statement of operations for the year then ended, the statement of changes in net assets for each of the two years in the period then ended, and the financial highlights for each of the five years in the period then ended. These financial statements and financial highlights are the responsibility of the Trust's management. Our responsibility is to express an opinion on these financial statements and financial highlights based on our audits.
We conducted our audits in accordance with the standards of the Public Company Accounting Oversight Board (United States). Those standards require that we plan and perform the audit to obtain reasonable assurance about whether the financial statements and financial highlights are free of material misstatement. We were not engaged to perform an audit of the Trust's internal control over financial reporting. Our audits included consideration of internal control over financial reporting as a basis for designing audit procedures that are appropriate in the circumstances, but not for the purpose of expressing an opinion on the effectiveness of the Trust's internal control over financial reporting. Accordingly, we express no such opinion. An audit also includes examining, on a test basis, evidence supporting the amounts and disclosures in the financial statements and financial highlights, assessing the accounting principles used and significant estimates made by management, and evaluating the overall financial statement presentation. Our procedures included confirmation of securities owned as of December 31, 2008 by correspondence with the custodian and brokers or by other appropriate auditing procedures where replies from brokers were not received. We believe that our audits provide a reasonable basis for our opinion.
In our opinion, the financial statements and financial highlights referred to above present fairly, in all material respects, the financial position of Growth Portfolio, a series of Neuberger Berman Advisers Management Trust, at December 31, 2008, the results of its operations for the year then ended, the changes in its net assets for each of the two years in the period then ended, and the financial highlights for each of the five years in the period then ended, in conformity with U.S. generally accepted accounting principles.

Boston, Massachusetts
February 9, 2009
22
Trustee and Officer Information
The following tables set forth information concerning the trustees and officers of the Trust. All persons named as trustees and officers also serve in similar capacities for other funds administered or managed by Neuberger Berman Management LLC ("NB Management") and Neuberger Berman, LLC ("Neuberger Berman"). The Statement of Additional Information includes additional information about fund trustees and is available upon request, without charge, by calling (800) 877-9700.
Information about the Board of Trustees
Name, (Year of Birth),
and Address(1) | | Position and
Length of
Time Served(2) | | Principal Occupation(s)(3) | | Number of
Funds in Fund
Complex
Overseen by
Fund Trustee | | Other Directorships
Held Outside Fund
Complex by Fund
Trustee | |
| Independent Fund Trustees | |
|
| John Cannon (1930) | | Trustee since 2000 | | Consultant; formerly, Chairman, CDC Investment Advisers (registered investment adviser), 1993 to January 1999; formerly, President and Chief Executive Officer, AMA Investment Advisors, an affiliate of the American Medical Association. | | | 56 | | | Independent Trustee or Director of three series of Oppenheimer Funds: Oppenheimer Limited Term New York Municipal Fund, Rochester Fund Municipals, and Oppenheimer Convertible Securities Fund since 1992. | |
|
| Faith Colish (1935) | | Trustee since 1982 | | Counsel, Carter Ledyard & Milburn LLP (law firm) since October 2002; formerly, Attorney-at-Law and President, Faith Colish, A Professional Corporation, 1980 to 2002. | | | 56 | | | Formerly, Director (1997 to 2003) and Advisory Director (2003 to 2006), ABA Retirement Funds (formerly, American Bar Retirement Association) (not-for-profit membership corporation). | |
|
| Martha C. Goss (1949) | | Trustee since 2007 | | President, Woodhill Enterprises Inc./Chase Hollow Associates LLC (personal investment vehicle), since 2006; Chief Operating and Financial Officer, Hopewell Holdings LLC/ Amwell Holdings, LLC (a holding company for a healthcare reinsurance company start-up), since 2003; formerly, Consultant, Resources Connection (temporary staffing), 2002 to 2006. | | | 56 | | | Director, Ocwen Financial Corporation (mortgage servicing), since 2005; Director, American Water (water utility), since 2003; Director, Channel Reinsurance (financial guaranty reinsurance), since 2006; Advisory Board Member, Attensity (software developer), since 2005; Director, Allianz Life of New York (insurance), since 2005; Director, Financial Women's Association of New York (not for profit association), since 2003; Trustee Emerita, Brown University, since 1998. | |
|
23
Name, (Year of Birth),
and Address(1) | | Position and
Length of
Time Served(2) | | Principal Occupation(s)(3) | | Number of
Funds in Fund
Complex
Overseen by
Fund Trustee | | Other Directorships
Held Outside Fund
Complex by Fund
Trustee | |
| C. Anne Harvey (1937) | | Trustee since 1998 | | President, C.A. Harvey Associates, since October 2001; formerly, Director, AARP, 1978 to December 2001. | | | 56 | | | Formerly, President, Board of Associates to The National Rehabilitation Hospital's Board of Directors, 2001 to 2002; formerly, Member, Individual Investors Advisory Committee to the New York Stock Exchange Board of Directors, 1998 to June 2002. | |
|
| Robert A. Kavesh (1927) | | Trustee since 2000 | | Retired; Marcus Nadler Professor Emeritus of Finance and Economics, New York University Stern School of Business; formerly, Executive Secretary-Treasurer, American Finance Association, 1961 to 1979. | | | 56 | | | Formerly, Director, The Caring Community (not-for-profit), 1997 to 2006; formerly, Director, DEL Laboratories, Inc. (cosmetics and pharmaceuticals), 1978 to 2004; formerly, Director, Apple Bank for Savings, 1979 to 1990; formerly, Director, Western Pacific Industries, Inc., 1972 to 1986 (public company). | |
|
| Michael M. Knetter (1960) | | Trustee since 2007 | | Dean, School of Business, University of Wisconsin - Madison; formerly, Professor of International Economics and Associate Dean, Amos Tuck School of Business - Dartmouth College, 1998 to 2002. | | | 56 | | | Trustee, Northwestern Mutual Series Fund, Inc., since February 2007; Director, Wausau Paper, since 2005; Director, Great Wolf Resorts, since 2004. | |
|
| Howard A. Mileaf (1937) | | Trustee since 1999 | | Retired; formerly, Vice President and General Counsel, WHX Corporation (holding company), 1993 to 2001. | | | 56 | | | Formerly, Director, Webfinancial Corporation (holding company), 2002 to 2008; formerly, Director WHX Corporation (holding company), January 2002 to June 2005; formerly, Director, State Theatre of New Jersey (not-for-profit theater), 2000 to 2005. | |
|
24
Name, (Year of Birth),
and Address(1) | | Position and
Length of
Time Served(2) | | Principal Occupation(s)(3) | | Number of
Funds in Fund
Complex
Overseen by
Fund Trustee | | Other Directorships
Held Outside Fund
Complex by Fund
Trustee | |
| George W. Morriss (1947) | | Trustee since 2007 | | Retired; formerly, Executive Vice President and Chief Financial Officer, People's Bank, Connecticut (a financial services company), 1991 to 2001. | | | 56 | | | Manager, Old Mutual 2100 fund complex (consisting of six funds) since October 2006 for four funds and since February 2007 for two funds; formerly, Member NASDAQ Issuers' Affairs Committee, 1995 to 2003. | |
|
| Edward I. O'Brien (1928) | | Trustee since 2000 | | Retired; formerly, Member, Investment Policy Committee, Edward Jones, 1993 to 2001; President, Securities Industry Association ("SIA") (securities industry's representative in government relations and regulatory matters at the federal and state levels), 1974 to 1992; Adviser to SIA, November 1992 to November 1993. | | | 56 | | | Formerly, Director, Legg Mason, Inc. (financial services holding company), 1993 to July 2008; formerly, Director, Boston Financial Group (real estate and tax shelters), 1993 to 1999. | |
|
| William E. Rulon (1932) | | Trustee since 2000 | | Retired; formerly, Senior Vice President, Foodmaker, Inc. (operator and franchiser of restaurants), until January 1997. | | | 56 | | | Formerly, Director, Pro-Kids Golf and Learning Academy (teach golf and computer usage to "at risk" children), 1998 to 2006; formerly, Director, Prandium, Inc. (restaurants), March 2001 to July 2002. | |
|
| Cornelius T. Ryan (1931) | | Trustee since 2000 | | Founding General Partner, Oxford Partners and Oxford Bioscience Partners (venture capital investing) and President, Oxford Venture Corporation, since 1981. | | | 56 | | | None. | |
|
25
Name, (Year of Birth),
and Address(1) | | Position and
Length of
Time Served(2) | | Principal Occupation(s)(3) | | Number of
Funds in Fund
Complex
Overseen by
Fund Trustee | | Other Directorships
Held Outside Fund
Complex by Fund
Trustee | |
| Tom D. Seip (1950) | | Trustee since 2000; Chairman of the Board since 2008; Lead Independent Trustee from 2006 to 2008 | | General Partner, Seip Investments LP (a private investment partnership); formerly, President and CEO, Westaff, Inc. (temporary staffing), May 2001 to January 2002; formerly, Senior Executive at the Charles Schwab Corporation, 1983 to 1998, including Chief Executive Officer, Charles Schwab Investment Management, Inc., and Trustee, Schwab Family of Funds and Schwab Investments, 1997 to 1998, and Executive Vice President-Retail Brokerage, Charles Schwab & Co., Inc., 1994 to 1997. | | | 56 | | | Director, H&R Block, Inc. (financial services company), since May 2001; Chairman, Compensation Committee, H&R Block, Inc., since 2006; formerly, Director, Forward Management, Inc. (asset management company), 1999 to 2006. | |
|
| Candace L. Straight (1947) | | Trustee since 1999 | | Private investor and consultant specializing in the insurance industry; formerly, Advisory Director, Securitas Capital LLC (a global private equity investment firm dedicated to making investments in the insurance sector), 1998 to December 2003. | | | 56 | | | Director, Montpelier Re (reinsurance company), since 2006; formerly, Director, National Atlantic Holdings Corporation (property and casualty insurance company), 2004 to 2008; formerly, Director, The Proformance Insurance Company (property and casualty insurance company), 2004 to 2008; formerly, Director, Providence Washington Insurance Company (property and casualty insurance company), December 1998 to March 2006; formerly, Director, Summit Global Partners (insurance brokerage firm), 2000 to 2005. | |
|
| Peter P. Trapp (1944) | | Trustee since 1984 | | Retired; formerly, Regional Manager for Mid-Southern Region, Ford Motor Credit Company, September 1997 to 2007; formerly, President, Ford Life Insurance Company, April 1995 to August 1997. | | | 56 | | | None. | |
|
26
Name, (Year of Birth),
and Address(1) | | Position and
Length of
Time Served(2) | | Principal Occupation(s)(3) | | Number of
Funds in Fund
Complex
Overseen by
Fund Trustee | | Other Directorships
Held Outside Fund
Complex by Fund
Trustee | |
| Fund Trustees who are "Interested Persons" | |
|
| Jack L. Rivkin* (1940) | | Trustee since 2002; President from 2002 to 2008 | | Formerly, Executive Vice President and Chief Investment Officer, Neuberger Berman Holdings LLC (holding company), 2002 to August 2008 and 2003 to August 2008, respectively; formerly, Managing Director and Chief Investment Officer, Neuberger Berman, December 2005 to August 2008 and 2003 to August 2008, respectively; formerly, Executive Vice President, Neuberger Berman, December 2002 to 2005; formerly, Director and Chairman, NB Management, December 2002 to August 2008; formerly, Executive Vice President, Citigroup Investments, Inc., September 1995 to February 2002; formerly, Executive Vice President, Citigroup Inc., September 1995 to February 2002. | | | 56 | | | Director, Dale Carnegie and Associates, Inc. (private company), since 1998; Director, Solbright, Inc. (private company), since 1998. | |
|
27
Name, (Year of Birth),
and Address(1) | | Position and
Length of
Time Served(2) | | Principal Occupation(s)(3) | | Number of
Funds in Fund
Complex
Overseen by
Fund Trustee | | Other Directorships
Held Outside Fund
Complex by Fund
Trustee | |
| Robert Conti* (1956) | | Chief Executive Officer, President and Director since 2008; prior thereto, Executive Vice President in 2008 and Vice President 2000 to 2008 | | Managing Director, Neuberger Berman, since 2007; formerly, Senior Vice President, Neuberger Berman, 2003 to 2006; formerly, Vice President, Neuberger Berman, 1999 to 2003; President and Chief Executive Officer, NB Management, since 2008; formerly, Senior Vice President, NB Management, 2000 to 2008. | | | 56 | | | Chairman of the Board, Staten Island Mental Health Society since 2008. | |
|
(1) The business address of each listed person is 605 Third Avenue, New York, New York 10158.
(2) Pursuant to the Trust's Trust Instrument, each Fund Trustee shall hold office for life or until his or her successor is elected or the Trust terminates; except that (a) any Fund Trustee may resign by delivering a written resignation; (b) any Fund Trustee may be removed with or without cause at any time by a written instrument signed by at least two-thirds of the other Fund Trustees; (c) any Fund Trustee who requests to be retired, or who has become unable to serve, may be retired by a written instrument signed by a majority of the other Fund Trustees; and (d) any Fund Trustee may be removed at any shareholder meeting by a vote of at least two-thirds of the outstanding shares.
(3) Except as otherwise indicated, each individual has held the positions shown for at least the last five years.
* Indicates a Fund Trustee who is an "interested person" within the meaning of the 1940 Act. Mr. Conti is an interested person of the Trust by virtue of the fact that he is an officer of NB Management and Neuberger Berman. Mr. Rivkin may be deemed an interested person of the Trust by virtue of the fact that, until August 2008, he was a director of NB Management and an officer of Neuberger Berman.
28
Information about the Officers of the Trust
Name, (Year of Birth),
and Address(1) | | Position and
Length of Time
Served(2) | | Principal Occupation(s)(3) | |
| Andrew B. Allard (1961) | | Anti-Money Laundering Compliance Officer since 2002 | | Senior Vice President, Neuberger Berman, since 2006; Deputy General Counsel, Neuberger Berman, since 2004; formerly, Vice President, Neuberger Berman, 2000 to 2005; formerly, Associate General Counsel, Neuberger Berman, 1999 to 2004; Anti-Money Laundering Compliance Officer, eleven registered investment companies for which NB Management acts as investment manager and administrator (six since 2002, two since 2003, two since 2004 and one since 2006). | |
|
| Michael J. Bradler (1970) | | Assistant Treasurer since 2005 | | Vice President, Neuberger Berman, since 2006; Employee, NB Management, since 1997; Assistant Treasurer, eleven registered investment companies for which NB Management acts as investment manager and administrator (ten since 2005 and one since 2006). | |
|
| Claudia A. Brandon (1956) | | Executive Vice President since 2008 and Secretary since 1985 | | Senior Vice President, Neuberger Berman, since 2007 and Employee since 1999; formerly, Vice President, Neuberger Berman, 2002 to 2006; Senior Vice President, NB Management, since 2008 and Assistant Secretary since 2004; formerly, Vice President-Mutual Fund Board Relations, NB Management, 2000 to 2008; Executive Vice President, eleven registered investment companies for which NB Management acts as investment manager and administrator (eleven since 2008); Secretary, eleven registered investment companies for which NB Management acts as investment manager and administrator (three since 1985, three since 2002, two since 2003, two since 2004 and one since 2006). | |
|
| Maxine L. Gerson (1950) | | Executive Vice President since 2008 and Chief Legal Officer since 2005 (only for purposes of sections 307 and 406 of the Sarbanes-Oxley Act of 2002) | | Senior Vice President, Neuberger Berman, since 2002; Deputy General Counsel and Assistant Secretary, Neuberger Berman, since 2001; Senior Vice President, NB Management, since 2006; Secretary and General Counsel, NB Management, since 2004; Executive Vice President, eleven registered investment companies for which NB Management acts as investment manager and administrator (eleven since 2008); Chief Legal Officer (only for purposes of sections 307 and 406 of the Sarbanes-Oxley Act of 2002), eleven registered investment companies for which NB Management acts as investment manager and administrator (ten since 2005 and one since 2006). | |
|
| Sheila R. James (1965) | | Assistant Secretary since 2002 | | Vice President, Neuberger Berman, since 2008 and Employee since 1999; formerly, Assistant Vice President, Neuberger Berman, 2007; Assistant Secretary, eleven registered investment companies for which NB Management acts as investment manager and administrator (six since 2002, two since 2003, two since 2004 and one since 2006). | |
|
| Brian Kerrane (1969) | | Vice President since 2008 | | Senior Vice President, Neuberger Berman, since 2006; formerly, Vice President, Neuberger Berman, 2002 to 2006; Vice President, NB Management, since 2008 and Employee since 1991; Vice President, eleven registered investment companies for which NB Management acts as investment manager and administrator (eleven since 2008). | |
|
29
Name, (Year of Birth),
and Address(1) | | Position and
Length of Time
Served(2) | | Principal Occupation(s)(3) | |
| Kevin Lyons (1955) | | Assistant Secretary since 2003 | | Assistant Vice President, Neuberger Berman, since 2008 and Employee since 1999; Assistant Secretary, eleven registered investment companies for which NB Management acts as investment manager and administrator (eight since 2003, two since 2004 and one since 2006). | |
|
| Owen F. McEntee, Jr. (1961) | | Vice President since 2008 | | Vice President, Neuberger Berman, since 2006; Employee, NB Management, since 1992; Vice President, eleven registered investment companies for which NB Management acts as investment manager and administrator (eleven since 2008). | |
|
| John M. McGovern (1970) | | Treasurer and Principal Financial and Accounting Officer since 2005; prior thereto, Assistant Treasurer since 2002 | | Senior Vice President, Neuberger Berman, since 2007; formerly, Vice President, Neuberger Berman, 2004 to 2006; Employee, NB Management, since 1993; Treasurer and Principal Financial and Accounting Officer, eleven registered investment companies for which NB Management acts as investment manager and administrator (ten since 2005 and one since 2006); formerly, Assistant Treasurer, eleven registered investment companies for which NB Management acts as investment manager and administrator, 2002 to 2005. | |
|
| Andrew Provencher (1965) | | Vice President since 2008 | | Managing Director, NB Management, since 2008; Managing Director, Neuberger Berman, since 2005; formerly, Senior Vice President, Neuberger Berman, 2003 to 2005; formerly, Vice President, Neuberger Berman, 1999 to 2003; Vice President, eleven registered investment companies for which NB Management acts as investment manager and administrator (eleven since 2008). | |
|
| Frank Rosato (1971) | | Assistant Treasurer since 2005 | | Vice President, Neuberger Berman, since 2006; Employee, NB Management, since 1995; Assistant Treasurer, eleven registered investment companies for which NB Management acts as investment manager and administrator (ten since 2005 and one since 2006). | |
|
| Neil S. Siegel (1967) | | Vice President since 2008 | | Managing Director, NB Management, since 2008; Managing Director, Neuberger Berman, since 2006; formerly, Senior Vice President, Neuberger Berman, 2004 to 2006; Vice President, eleven registered investment companies for which NB Management acts as investment manager and administrator (eleven since 2008); formerly, Head of Institutional Marketing, Morgan Stanley Investment Management, 1993 to 2004. | |
|
30
Name, (Year of Birth),
and Address(1) | | Position and
Length of Time
Served(2) | | Principal Occupation(s)(3) | |
| Chamaine Williams (1971) | | Chief Compliance Officer since 2005 | | Senior Vice President, Neuberger Berman, since 2007; Chief Compliance Officer, NB Management, since 2006; Senior Vice President, Lehman Brothers Inc., since 2007; formerly, Vice President, Lehman Brothers Inc., 2003 to 2006; Chief Compliance Officer, eleven registered investment companies for which NB Management acts as investment manager and administrator (ten since 2005 and one since 2006); formerly, Chief Compliance Officer, Lehman Brothers Asset Management Inc., 2003 to 2007; formerly, Chief Compliance Officer, Lehman Brothers Alternative Investment Management LLC, 2003 to 2007; formerly, Vice President, UBS Global Asset Management (US) Inc. (formerly, Mitchell Hutchins Asset Management, a wholly-owned subsidiary of PaineWebber Inc.), 1997 to 2003. | |
|
(1) The business address of each listed person is 605 Third Avenue, New York, New York 10158.
(2) Pursuant to the By-Laws of the Trust, each officer elected by the Fund Trustees shall hold office until his or her successor shall have been elected and qualified or until his or her earlier death, inability to serve, or resignation. Officers serve at the pleasure of the Fund Trustees and may be removed at any time with or without cause.
(3) Except as otherwise indicated, each individual has held the positions shown for at least the last five years.
31
Proxy Voting Policies and Procedures
A description of the policies and procedures that the Trust uses to determine how to vote proxies relating to portfolio securities is available, without charge, by calling 1-800-877-9700 (toll-free) and on the website of the Securities and Exchange Commission, at www.sec.gov. Information regarding how the Trust voted proxies relating to portfolio securities during the most recent 12-month period ended June 30 is also available, without charge, by calling 1-800-877-9700 (toll-free), on the website of the Securities and Exchange Commission at www.sec.gov, and on Management's website at www.nb.com.
Quarterly Portfolio Schedule
The Trust files a complete schedule of portfolio holdings for the Fund with the Securities and Exchange Commission for the first and third quarters of each fiscal year on Form N-Q. The Trust's Forms N-Q are available on the Securities and Exchange Commission's website at www.sec.gov and may be reviewed and copied at the Securities and Exchange Commission's Public Reference Room in Washington, DC. Information on the operation of the Public Reference Room may be obtained by calling 1-800-SEC-0330. The information on Form N-Q is available upon request, without charge, by calling 1-800-877-9700 (toll free).
Board Consideration of the Management and Sub-Advisory Agreements
At a meeting held on September 25, 2008, the Board of Trustees of Neuberger Berman Advisers Management Trust ("Board"), including the Trustees who are not "interested persons" of Neuberger Berman Management LLC ("Management") or Neuberger Berman Advisers Management Trust ("Independent Fund Trustees"), approved the continuance of the Management and Sub-Advisory Agreements ("Agreements") between Management and Growth Portfolio ("Fund").
In evaluating the Agreements, the Board, including the Independent Fund Trustees, reviewed materials furnished by Management and Neuberger Berman, LLC ("Neuberger") in response to questions submitted by counsel to the Independent Fund Trustees, and met with senior representatives of Management and Neuberger regarding their personnel and operations. The Independent Fund Trustees were advised by counsel that is experienced in Investment Company Act of 1940 matters and that is independent of Management and Neuberger. The Independent Fund Trustees received a memorandum from independent counsel discussing the legal standards for their consideration of the proposed continuance of the Agreements. They met with such counsel separately from representatives of Management to discuss the annual contract review. The annual contract review extends over two regular meetings of the Board to ensure that Management and Neuberger have time to respond to any questions the Independent Fund Trustees may have on their initial review of the report and that the Independent Fund Trustees have time to consider those responses. In addition, during this process, the Board held a separate meeting devoted primarily to reviewing and discussing Fund performance.
The Board considered the following factors, among others, in connection with its approval of the continuance of the Agreements: (1) the nature, extent, and quality of the services provided by Management and Neuberger; (2) the performance of the Fund compared to a relevant market index and a peer group of investment companies; (3) the costs of the services provided and profits or losses realized by Management and its affiliates from their relationship with the Fund; (4) the extent to which economies of scale might be realized as the Fund grows; and (5) whether fee levels reflect any such potential economies of scale for the benefit of investors in the Fund. In their deliberations, the Board members did not identify any particular information that was all-important or controlling, and each Trustee may have attributed different weights to the various factors.
The Board considered the continued integrity of Management and Neuberger as organizations, despite the bankruptcy filing by Lehman Brothers Holdings Inc. The Board discussed the efforts made by Management and Neuberger to retain
32
employees, and the reported likelihood that such employees would be retained. The Board discussed the provisions that were being made for ancillary services by Management, Neuberger and their affiliates.
The Board evaluated the terms of the Agreements, the overall fairness of the Agreements to the Fund and whether the Agreements were in the best interests of the Fund and its shareholders.
With respect to the nature, extent and quality of the services provided, the Board considered the performance of the Fund and the experience and staffing of the portfolio management and investment research personnel who perform services for the Fund. The Board noted that Management also provides certain administrative services, including fund accounting and compliance oversight. The Board also considered Management's and Neuberger's policies and practices regarding brokerage. The Board considered the quality of brokerage execution obtained by Management. The Board's Portfolio Transactions and Pricing Committee from time to time reviewed the quality of the brokerage services that Neuberger and Lehman Brothers Inc. had provided, and periodically reviews studies by an independent firm engaged to review and evaluate the quality of brokerage execution received by the Fund. The Board also reviewed whether Management and Neuberger used brokers to execute Fund transactions that provide research and other services to Management and Neuberger, and the types of benefits potentially derived from such services by Management, Neuberger, the Fund and other clients of Management and Neuberger. In addition, the Board noted the positive compliance history of Management and Neuberger, as each firm has been free of significant compliance problems.
The Board considered the performance of the Fund relative to its benchmark and a peer group of investment companies dedicated to insurance products pursuing broadly similar strategies. The Board also considered performance in relation to the degree of risk undertaken by the portfolio manager.
With respect to the overall fairness of the Agreements, the Board considered the fee structure for the Fund under the Agreements as compared to a peer group of comparable funds dedicated to insurance products and any fall-out benefits likely to accrue to Management or Neuberger or their affiliates from their relationship with the Fund. The Board also considered the profitability of Management and its affiliates from their association with the Fund.
The Board reviewed a comparison of the Fund's management fee and overall expense ratio to a peer group of broadly comparable funds dedicated to insurance products. The Board considered the mean and median of the management fees and expense ratios of the peer group. The Board noted that the Fund's management fee was higher than the peer group mean and median. The Board considered whether specific portfolio management or administration needs contributed to the higher fee. With regard to the sub-advisory fee paid to Neuberger, the Board noted that this fee is "at cost." In addition, the Board considered the contractual limit on Fund expenses undertaken by Management.
The Board considered whether there were other funds that were advised or sub-advised by Management or its affiliates or separate accounts managed by Management or its affiliates with similar investment objectives, policies and strategies to the Fund. The Board compared the fees charged to the Fund at various asset levels to the fees charged to an advised fund, a sub-advised fund and a separate account, each managed in a similar style to the Fund. The Board considered the appropriateness and reasonableness of any differences between the fees charged to the Fund and the other funds and account and determined that the differences in fees were consistent with the management and other services provided.
The Board also evaluated any apparent or anticipated economies of scale in relation to the services Management provides to the Fund. The Board considered that the Fund's fee structure which provides for a reduction of payments resulting from the use of breakpoints and whether those breakpoints are set at appropriate asset levels.
In concluding that the benefits accruing to Management and its affiliates by virtue of their relationship to the Fund were reasonable in comparison with the costs of providing the investment advisory services and the benefits accruing to the Fund, the Board reviewed specific data as to Management's profit on the Fund for a recent period and the trend in profit or loss over recent years. The Board also carefully examined Management's cost allocation methodology and in recent years had an independent consultant review the methodology. It also reviewed an analysis from an independent data service on profitability margins in the investment management industry. The Board recognized that Management should be entitled to earn a reasonable level of profits for services it provides to the Fund and, based on its review, concluded that Management's level of profitability was not excessive.
33
Conclusions
In approving the Agreements, the Board concluded that the terms of each Agreement are fair and reasonable and that approval of the Agreements is in the best interests of the Fund and its shareholders. In reaching this determination, the Board considered that Management and Neuberger could be expected to provide a high level of service to the Fund; that the performance of the Fund was satisfactory over time; that the Fund's fee structure appeared to the Board to be reasonable given the nature and quality of services provided; and that the benefits accruing to Management and its affiliates by virtue of their relationship to the Fund were reasonable in comparison with the benefits accruing to the Fund.
Board Consideration of New and Interim Management and Sub-Advisory Agreements
Lehman Brothers Holdings Inc. ("Lehman Brothers") has entered into an agreement to sell a controlling interest in the Fund's investment adviser. Under the agreement, Lehman Brothers would sell substantially all of the Neuberger Berman business and the fixed income business and certain alternative asset management businesses of Lehman Brother's Investment Management Division (collectively, the "Acquired Businesses") to NBSH Acquisition, LLC (the "Proposed Acquisition"). NBSH Acquisition, LLC ("NBSH") was organized by key members of Neuberger Berman's management for the purpose of facilitating the acquisition of the Acquired Businesses. At the closing of the Proposed Acquisition, a majority interest in the Acquired Businesses will be directly or indirectly owned by portfolio managers, Neuberger Berman's management team and certain key members and senior professionals of the former Investment Management Division ("Management Members"), as well as by Lehman Brothers and certain affiliates of Lehman Brothers.
The Acquired Businesses include Neuberger Berman Management LLC ("Management") and Neuberger Berman, LLC ("Neuberger"), the adviser and sub-adviser to the Fund, respectively. The Proposed Acquisition has been deemed to result in an "assignment" of the Fund's existing Management Agreement and Sub-Advisory Agreement (the "Existing Agreements") under the 1940 Act. As required by the 1940 Act, the Fund's Existing Agreements provide for their automatic termination in the event of an assignment, and each will terminate upon the consummation of the Proposed Acquisition. Accordingly, on December 17, 2008, the Board approved new Management and Sub-Advisory Agreements with Management and Neuberger, respectively, or their successors (together, the "Advisers"), on the same terms and with the same compensation structure as are currently in effect (together, "New Agreements"), which would take effect upon consummation of the Proposed Acquisition if approved by the Fund's shareholders.
If shareholders of the Fund do not approve the New Agreements before the Proposed Acquisition is completed, the Board has approved interim Management and Sub-Advisory Agreements with Management and Neuberger, respectively, or their successors (together, "Interim Agreements") pending approval of the New Agreements by shareholders of the Fund. Compensation earned by the Advisers under the Interim Agreements would be held in an interest-bearing escrow account pending shareholder approval of the New Agreements. If shareholders approve the New Agreements within 150 days from the termination of the Existing Agreements, the amount held in the escrow account, including interest, will be paid to the Advisers, as appropriate. If shareholders of the Fund do not approve the New Agreements, the Advisers will be paid the lesser of the costs incurred in performing their services under the Interim Agreements or the total amount in the escrow account, including interest earned. If at the end of 150 days following termination of a Fund's Existing Agreements the Fund's shareholders still have not approved the New Agreements, the Trustees would take such actions as they deem to be in the best interests of the Fund and its shareholders, which may include negotiating a new Management Agreement and/or new Sub-Advisory Agreement with an advisory organization selected by the Board of Trustees or making other arrangements.
The Trustees of the Trust discussed the Proposed Acquisition on December 17, 2008. Prior to submitting its bid to public auction, Management met telephonically with the Independent Trustees to brief them on the Proposed Acquisition. Following the public auction wherein NBSH was determined to be the successful bidder, the Independent Trustees again met telephonically with Management to obtain additional information about the Proposed Acquisition. The Independent Trustees, with the assistance of independent counsel, prepared due diligence requests that were presented to Management and appointed a Task Force of Independent Trustees to lead the due diligence effort ("Task Force").
34
Management provided written responses to the due diligence requests. After extensive review and analysis and discussions during a telephonic and in person meeting of the Independent Trustees, the Task Force submitted clarifying questions. The Independent Trustees met as a body in person to receive the report of the Task Force and consider the New Agreements. Throughout the process, the Task Force and the Independent Trustees were advised by experienced 1940 Act counsel that is independent of Management and NBSH. In addition, the Independent Trustees received a memorandum from independent counsel discussing the legal standards for their consideration of the New Agreements.
Consideration of the New Agreements followed shortly on the heels of the Independent Trustees' annual consideration of whether to renew the Existing Agreements, carried out pursuant to Section 15(c) of the 1940 Act. In that process, which began prior to the June 2008 quarterly meeting of the Board and was concluded at the September 2008 quarterly meeting, the Independent Trustees, following an extensive review of materials submitted by Management and a report from an independent data service, unanimously determined that the Existing Agreements were fair and reasonable and that their renewal would be in the best interests of the Fund and its shareholders. Accordingly, in considering the New Agreements, the Independent Trustees took into account the fact that the terms of the New Agreements would be identical to those of the Existing Agreements in every respect except for the term and termination date and potentially the name of the investment adviser. The Board considerations in connection with the New Agreements and the Existing Agreements also entered into the decision by the Board to approve the Interim Agreements, which would take effect if the shareholders of the Fund do not approve the New Agreements before the Proposed Acquisition is completed. The Independent Trustees' consideration of the Existing Agreements is described above.
In evaluating the proposed New Agreements, the Independent Trustees considered that they have generally been satisfied with the nature and quality of the services provided to the Fund by Management and Neuberger, including investment advisory, administrative and support services, and that the Fund would be best served by an arrangement that appeared likely to maintain the continuity and stability of the providers of these services. Accordingly, the Independent Trustees considered very carefully the intentions of NBSH (including its successors or assign) regarding capitalization, management structure, staffing, compensation and staff retention and whether these seemed designed to provide the desired continuity and stability. They inquired specifically about staffing and resources in the areas of portfolio management, investment research, trading, fund accounting, legal and compliance, internal audit, and senior executive staff. Although at the time the Board considered the New Agreements no final decisions had been reached as to the distribution of equity interests in NBSH (or its successor or assign), the Trustees were advised that senior members of management, including the Fund Trustee and nominee for Fund Trustee who are employed by the Advisers, would receive equity interests in NBSH. Because of these interests, as well as any future employment arrangements with the Advisers, these persons, individually or in the aggregate, could have a material interest in the Proposed Acquisition and in shareholder approval of the New Agreements. In considering the New Agreements, the Trustees were aware of these interests.
The Independent Trustees inquired whether NBSH (or its successors or assign) had specific plans for the future structure of the Neuberger Berman Funds, whether they plan to propose to eliminate any Funds, and whether they intend to continue or alter certain expansion plans that are already underway. They also inquired whether there are plans to change the fees or expense structure of any of the Funds. The Independent Trustees inquired about the long-term plans for the Advisers, including any expectations for cost savings or expense reductions. They also inquired about the capital structure and working capital likely to be available to NBSH (or its successors or assign).
The Independent Trustees considered the following factors, in addition to the factors discussed above, among others, in connection with their consideration of the New Agreements: (1) the nature, extent, and quality of the services provided by Management and Neuberger; (2) the performance of the Fund compared to a relevant market index and a peer group of investment companies; (3) the costs of the services provided and profits or losses realized by Management and its affiliates from their relationship with the Fund; (4) the extent to which economies of scale might be realized as the Fund grows; and (5) whether fee levels reflect any such potential economies of scale for the benefit of investors in the Fund. In their deliberations, the Independent Trustees did not identify any particular information that was all important or controlling, and each Trustee may have attributed different weights to the various factors.
In unanimously approving and recommending the New Agreements, the Independent Trustees concluded that the terms of each New Agreement are fair and reasonable and that approval of the New Agreements is in the best interests of the
35
Fund and its shareholders. In reaching this determination, the Independent Trustees considered the following factors, among others:
(1) that the terms of the New Agreements are identical in all material respects to those of the Existing Agreements;
(2) that the Advisers will maintain operational autonomy and continuity of management following the Proposed Acquisition;
(3) the favorable history, reputation, qualification, and background of Management and Neuberger, as well as the qualifications of each entity's personnel and each entity's respective financial condition;
(4) the commitment of NBSH (or its successors or assign) to retain key personnel currently employed by Management and Neuberger who currently provide services to the Fund;
(5) the commitment of NBSH (or its successors or assign) to maintaining the current level and quality of Fund services;
(6) the proposed division of equity in NBSH (or its successor or assign) among Management Members and other personnel upon consummation of the Proposed Acquisition;
(7) the fees and expense ratio of the Fund relative to comparable mutual funds;
(8) that the fees are identical to those paid under the Existing Agreements;
(9) that the fees and expense ratios of the Fund appear to the Board to be reasonable given the quality of services expected to be provided;
(10) the commitment of Management to maintaining the Fund's current contractual expense limitation agreements to ensure that Fund shareholders of funds that have such arrangements in place do not face an increase in expenses upon consummation of the Proposed Acquisition;
(11) the performance of the Fund relative to comparable mutual funds and unmanaged indices;
(12) the commitment of Management (or its successor) to pay the expenses of the Fund in connection with the Proposed Acquisition, including all expenses in connection with the solicitation of proxies, so that shareholders of the Fund would not have to bear such expenses;
(13) the actual and potential effects on the Advisers of the bankruptcy of Lehman Brothers, and the effects of the Lehman Brothers bankruptcy on the information considered by the Independent Trustees in their prior analyses of the principal service contracts;
(14) the provisions made to continue providing to the Advisers certain services that were previously provided to them by or through Lehman Brothers or its other affiliates;
(15) the possible benefits that may be realized by the Fund and by the Advisers as a result of the Proposed Acquisition; and
(16) that the Proposed Acquisition is expected to maintain continuity of management of the Fund and may reduce the potential for future vulnerability to changes in control of the Advisers that could be adverse to the Fund's interests and that could affect the retention of key employees providing services to the Fund.
36

Neuberger Berman
Advisers Management Trust
International Portfolio
S Class Shares
Annual Report
December 31, 2008
F0509 02/09
International Portfolio Manager's Commentary
International stocks trailed U.S. equities in 2008, with the MSCI EAFE Index declining 43.1% versus a 37.0% loss for the S&P 500. Small-cap stocks underperformed large caps in the international markets. This had a negative impact on the "all cap" Neuberger Berman Advisers Management Trust (AMT) International Portfolio, which lagged its MSCI EAFE benchmark.
Data on sector and individual country performance reflect the depth and breadth of this year's global bear market. All 10 EAFE sectors declined, with eight of 10 losing 30% or more and five of 10 falling by more than 40%. Even traditionally defensive sectors such as Consumer Staples, Health Care and Utilities failed to protect investors. All 21 national stock markets represented in EAFE had negative returns, with 19 declining by 40% or more. In short, there was simply no place to hide in this unforgiving equity market.
The AMT International Portfolio's significant underweighting in Financials and Materials, the EAFE's two worst performing sectors, benefited relative returns. The Portfolio was underweighted in Financials primarily because financial institutions' profitability tends to suffer during periods of economic weakness. Secondary considerations included the lack of transparency of financial assets and, therefore, the potential for additional write-downs, and the massive deleveraging of financial company balance sheets, which would, in our view, result in declining returns on equity (ROE). The underweighting in Materials resulted from the elimination of positions in the most economically sensitive materials companies. After this year's big declines, on the surface, Financials and Materials stocks may look cheap. However, due to ongoing economic uncertainty, we remain cautious about these sectors.
Investments in the Energy and Information Technology sectors underperformed their corresponding EAFE sector components. The Portfolio's average weighting in Energy was approximately double that of the EAFE. However, over the course of the year, we substantially reduced our exposure to Energy in response to flagging global demand and falling energy prices. At year-end, our Energy allocation was in line with the EAFE's. Elsewhere, our tilt toward smaller companies and the poor performance of several of our largest positions were responsible for lagging returns in the Information Technology sector.
The Portfolio's exposure to non-EAFE markets, on average a 15.9% weighting over the course of the year, also negatively impacted returns as emerging market stocks under-performed. By the close of the year, non-EAFE market investments were 11.8% of assets, the result of trimming of Energy and Materials sector holdings in Brazil and Canada and declines in the value of our holdings.
With the credit crisis and turmoil in the financial markets obscuring the near-term outlook for the global economy and corporate profits, we remain cautious. Recent recessions have been short lived, with the consumer holding up reasonably well. However, we believe that recent history may not repeat itself during the current economic downturn. Against this backdrop, we are more defensively positioned, having added Consumer Staples and Health Care names over the course of the year while decreasing our exposure to companies in the more economically sensitive Energy, Financials and Materials sectors.
Across sectors, we are focusing on high quality, more nimble companies with minimal near-term refinancing needs. We continue to remain focused on our QUARP - quality at a reasonable price - discipline of investing in high quality, financially strong companies with good organic growth opportunities. In spite of this year's performance shortfall, we are confident this approach has the potential to deliver superior returns over the long run.
Sincerely,

Benjamin Segal
Portfolio Manager
1
International Portfolio
SECTOR ALLOCATION
| (% of Equity Market Value) | |
| Energy | | | 7.6 | % | |
| Materials | | | 4.5 | | |
| Industrials | | | 14.8 | | |
| Consumer Discretionary | | | 6.7 | | |
| Consumer Staples | | | 16.5 | | |
| Health Care | | | 21.1 | | |
| Financials | | | 11.0 | | |
| Information Technology | | | 9.8 | | |
| Telecomm Service | | | 8.0 | | |
| Total | | | 100.0 | % | |
AVERAGE ANNUAL TOTAL RETURN1
| | | Inception
Date | | 1 Year | | Life of
Fund* | |
| International Portfolio | | | 04/29/05 | | | | (46.44 | %) | | | (5.82 | %) | |
| MSCI EAFE Index2 | | | | | | | (43.06 | %) | | | (1.54 | %) | |
Performance data quoted represent past performance, which is no guarantee of future results. The investment return and principal value of an investment will fluctuate so that an investor's shares, when redeemed may be worth more or less than their original cost. Results are shown on a "total return" basis and include reinvestment of all dividends and capital gain distributions.
Current performance may be lower or higher than the performance data quoted. For performance data current to the most recent month end, please visit https://www.nb.com.
*Index returns are as of the inception date 04/29/05.
As stated in the Portfolio's most recent prospectus, the total annual fund operating expense ratio for fiscal year 2007 was 1.56% for Class S shares (prior to any fee waivers or expense reimbursements). Neuberger Berman Management LLC has contractually agreed to limit certain expenses of the Portfolio through 12/31/2011.
COMPARISON OF A $10,000 INVESTMENT
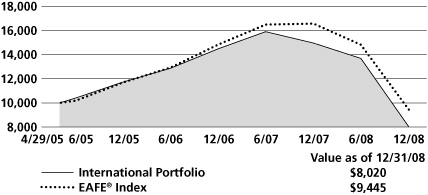
The chart shows the value of a hypothetical $10,000 investment in the Portfolio over the past 10 fiscal years, or since the Portfolio's inception, if it has not operated for 10 years. The result is compared with benchmarks, which may include a broad-based market index and/or a narrower index. Please note that market indexes do not include expenses. All results include the reinvestment of dividends and capital gain distributions. Results represent past performance and do not indicate future results. The chart and table do not reflect the deduction of taxes that a shareholder would pay on Portfolio distributions or the redemption of Portfolio shares.
Please see Endnotes for additional information.
2
Endnotes
1 "Total Return" includes reinvestment of all income dividends and capital gain distributions. Results represent past performance and do not indicate future results. The value of an investment in the Portfolio and the return on the investment both will fluctuate, and redemption process may be higher or lower than an investor's original cost. The performance information does not reflect fees and expenses of the variable annuity and variable life insurance policies or the pension plans whose proceeds are invested in the Portfolio. Neuberger Berman Management LLC ("NBM LLC") has agreed to absorb certain expenses of the AMT Portfolios, including the Portfolio. Without this arrangement, which is subject to change, the total returns of the Portfolio may have been less.
2 The MSCI EAFE Index, also known as the Morgan Stanley Capital International Europe, Australasia, Far East Index, is an unmanaged index of over 1,000 foreign stock prices. The index is translated into U.S. dollars.
Any ratios or other measurements using a factor of forecasted earnings of a company discussed herein are based on consensus estimates, not NBM LLC's own projections, and they may or may not be realized. In addition, any revision to a forecast could affect the market price of a security. By quoting them herein, NBM LLC does not offer an opinion as to the accuracy of and does not guarantee these forecasted numbers.
The investments for the Portfolio are managed by the same portfolio manager(s) who manage one or more other mutual funds that have similar names, investment objectives and investment styles as the Portfolio. You should be aware that the Portfolio is likely to differ from the other mutual funds in size, cash flow pattern and tax matters.
Accordingly, the holdings and performance of the Portfolio can be expected to vary from those of the other mutual funds.
The composition, industries and holdings of the Portfolio are subject to change.
Shares of the separate AMT Portfolios are sold only through the currently effective prospectus and are not available to the general public. Shares of this Portfolio may be purchased only by life insurance companies to be used with their separate accounts that fund variable annuity and variable life insurance policies and by certain qualified pension and retirement plans.
(c) 2009 Neuberger Berman Management LLC, distributor. All rights reserved.
3
Information About Your Fund's Expenses
This table is designed to provide information regarding costs related to your investments. All mutual funds incur operating expenses, which include management fees, fees for administrative services and costs of shareholder reports, among others. The following examples are based on an investment of $1,000 made at the beginning of the six month period ended December 31, 2008 and held for the entire period. The table illustrates the fund's costs in two ways:
| Actual Expenses and Performance: | | The first section of the table provides information about actual account values and actual expenses in dollars, based on the fund's actual performance during the period. You may use the information in this line, together with the amount you invested, to estimate the expenses you paid over the period. Simply divide your account value by $1,000 (for example, an $8,600 account value divided by $1,000 = 8.6), then multiply the result by the number in the first section of the table under the heading entitled "Expenses Paid During the Period" to estimate the expenses you paid over the period. | |
|
| Hypothetical Example for Comparison Purposes: | | The second section of the table provides information about hypothetical account values and hypothetical expenses based on the fund's actual expense ratio and an assumed rate of return at 5% per year before expenses. This return is not the fund's actual return. The hypothetical account values and expenses may not be used to estimate the actual ending account balance or expenses you paid for the period. You may use this information to compare the ongoing costs of investing in this fund versus other funds. To do so, compare the expenses shown in this 5% hypothetical example with the 5% hypothetical examples that appear in the shareholder reports of other funds. | |
|
Please note that the expenses in the table are meant to highlight your ongoing costs only. The table and the expense example do not include any transactional costs, such as fees and expenses that are, or may be, imposed under your variable contract or qualified pension plan. Therefore, the information under the heading "Hypothetical (5% annual return before expenses)" is useful in comparing ongoing costs only, and will not help you determine the relative total costs of owning different funds. In addition, if these transactional costs were included, your costs would have been higher.
Expense Information as of 12/31/08 (Unaudited)
NEUBERGER BERMAN ADVISERS MANAGEMENT TRUST INTERNATIONAL PORTFOLIO
| Actual | | Beginning Account
Value
7/1/08 | | Ending Account
Value
12/31/08 | | Expenses Paid During
the Period*
7/1/08 - 12/31/08 | |
| Class S | | $ | 1,000.00 | | | $ | 585.50 | | | $ | 6.46 | | |
| Hypothetical (5% annual return before expenses)** | |
| Class S | | $ | 1,000.00 | | | $ | 1,016.99 | | | $ | 8.21 | | |
* Expenses are equal to the annualized expense ratio of 1.62%, multiplied by the average account value over the period, multiplied by 184/366 (to reflect the one-half year period shown).
** Hypothetical 5% annual return before expenses is calculated by multiplying the number of days in the most recent half year divided by 366.
4
Schedule of Investments International Portfolio
| NUMBER OF SHARES | | | | MARKET VALUEt | |
| Common Stocks (87.3%) | | | |
| Belgium (3.9%) | | | |
| | 166,702 | | | Anheuser-Busch InBev | | $ | 3,841,984 | | |
| | 102,584 | | | Anheuser-Busch InBev
VVPR Strip | | | 570 | * | |
| | 15,942 | | | Colruyt SA | | | 3,407,125 | | |
| | 77,560 | | | Fortis VVPR Strip | | | 108 | * | |
| | 185,595 | | | Option NV | | | 490,174 | *n | |
| | 114,840 | | | Telenet Group Holding | | | 1,963,489 | * | |
| | | | 9,703,450 | | |
| Brazil (1.2%) | | | |
| | 433,435 | | | Amil Participacoes | | | 1,338,221 | | |
| | 81,943 | | | Petroleo Brasileiro ADR | | | 1,672,457 | | |
| | | | 3,010,678 | | |
| Canada (4.4%) | | | |
| | 107,135 | | | Addax Petroleum | | | 1,830,277 | | |
| | 54,100 | | | Barrick Gold | | | 1,959,345 | | |
| | 99,810 | | | Cameco Corp. | | | 1,701,904 | | |
| | 216,283 | | | MacDonald Dettwiler | | | 3,819,335 | * | |
| | 145,150 | | | Talisman Energy | | | 1,432,100 | | |
| | | | 10,742,961 | | |
| Chile (0.7%) | | | |
| | 72,710 | | | Sociedad Quimica y Minera
de Chile ADR, B Shares | | | 1,773,397 | | |
| China (0.6%) | | | |
| | 3,789,000 | | | Want Want China Holdings | | | 1,569,339 | | |
| Denmark (1.0%) | | | |
| | 46,100 | | | Novo Nordisk Class B | | | 2,333,131 | | |
| Finland (0.8%) | | | |
| | 121,415 | | | Nokia Oyj | | | 1,873,378 | | |
| France (8.3%) | | | |
| | 37,364 | | | Euler Hermes | | | 1,821,459 | | |
| | 89,019 | | | Ipsen SA | | | 3,463,505 | | |
| | 135,542 | | | Ipsos | | | 3,631,604 | | |
| | 28,520 | | | Pernod Ricard | | | 2,099,953 | | |
| | 103,625 | | | Teleperformance | | | 2,869,353 | | |
| | 65,015 | | | Total SA ADR | | | 3,595,330 | | |
| | 26,237 | | | Vallourec SA | | | 2,954,128 | | |
| | | | 20,435,332 | | |
| NUMBER OF SHARES | | | | MARKET VALUEt | |
| Germany (9.2%) | | | |
| | 12,044 | | | Continental AG | | $ | 1,223,320 | * | |
| | 14,945 | | | Deutsche Boerse | | | 1,055,334 | | |
| | 57,365 | | | Fresenius Medical Care | | | 2,656,145 | | |
| | 150,875 | | | GEA Group | | | 2,548,143 | | |
| | 136,015 | | | Gerresheimer AG | | | 3,686,817 | | |
| | 4,015 | | | Pfeiffer Vacuum Technology | | | 261,918 | | |
| | 65,010 | | | SAP AG | | | 2,354,662 | | |
| | 181,414 | | | Tognum AG | | | 2,269,569 | | |
| | 26,060 | | | Wacker Chemie | | | 2,706,346 | | |
| | 82,288 | | | Wincor Nixdorf | | | 3,855,897 | | |
| | | | 22,618,151 | | |
| Hong Kong (3.4%) | | | |
| | 53,850 | | | China Mobile ADR | | | 2,738,272 | | |
| | 946,825 | | | HengAn International Group | | | 3,041,979 | | |
| | 103,200 | | | Willis Group Holdings | | | 2,567,616 | | |
| | | | 8,347,867 | | |
| India (0.7%) | | | |
| | 33,075 | | | State Bank of India GDR | | | 1,819,125 | | |
| Ireland (1.3%) | | | |
| | 157,030 | | | DCC PLC | | | 2,248,504 | | |
| | 441,966 | | | Dragon Oil | | | 1,013,522 | *n | |
| | | | 3,262,026 | | |
| Israel (1.3%) | | | |
| | 298,725 | | | Makhteshim-Agan Industries | | | 971,232 | | |
| | 53,045 | | | Teva Pharmaceutical
Industries ADR | | | 2,258,125 | | |
| | | | 3,229,357 | | |
| Italy (1.5%) | | | |
| | 663,945 | | | Milano Assicurazioni | | | 2,032,723 | | |
| | 117,478 | | | UBI Banca | | | 1,680,359 | | |
| | | | 3,713,082 | | |
| Japan (16.3%) | | | |
| | 66,800 | | | Alfresa Holdings | | | 3,153,933 | | |
| | 437 | | | East Japan Railway | | | 3,321,489 | | |
| | 36,400 | | | FANUC Ltd. | | | 2,525,714 | | |
| | 83,000 | | | Hisamitsu Pharmaceutical | | | 3,351,131 | | |
| | 45,800 | | | Hogy Medical | | | 3,117,330 | | |
| | 308,400 | | | Nihon Kohden | | | 7,161,412 | | |
| | 77,235 | | | Nintendo Co. ADR | | | 3,687,971 | | |
| | 60,800 | | | NITTO DENKO | | | 1,144,234 | | |
| | 59,300 | | | Sankyo Co. | | | 2,943,740 | | |
| | 85,000 | | | Shiseido Co. | | | 1,711,252 | | |
| | 61,290 | | | Takeda Pharmaceutical | | | 3,137,182 | | |
| | 53,100 | | | TERUMO Corp. | | | 2,442,659 | | |
| | 37,820 | | | Toyota Motor ADR | | | 2,474,941 | | |
| | | | 40,172,988 | | |
See Notes to Schedule of Investments 5
| NUMBER OF SHARES | | | | MARKET VALUEt | |
| Netherlands (6.9%) | | | |
| | 69,846 | | | ASML Holding | | $ | 1,237,889 | | |
| | 80,980 | | | Fugro NV | | | 2,305,918 | | |
| | 57,915 | | | Heineken NV | | | 1,763,053 | | |
| | 77,370 | | | Nutreco Holding | | | 2,528,994 | | |
| | 112,588 | | | Sligro Food Group | | | 2,331,893 | | |
| | 171,302 | | | TNT NV | | | 3,276,506 | | |
| | 151,235 | | | Unilever NV | | | 3,645,286 | | |
| | | | 17,089,539 | | |
| Norway (1.7%) | | | |
| | 651,668 | | | DnB NOR | | | 2,512,823 | | |
| | 474,734 | | | Prosafe ASA | | | 1,762,769 | * | |
| | | | 4,275,592 | | |
| Singapore (0.9%) | | | |
| | 244,000 | | | United Overseas Bank | | | 2,188,083 | | |
| Spain (2.1%) | | | |
| | 240,128 | | | Telefonica SA ADR | | | 5,290,567 | | |
| Sweden (1.2%) | | | |
| | 252,661 | | | Getinge AB, B Shares | | | 2,980,274 | | |
| Switzerland (6.1%) | | | |
| | 4,285 | | | Barry Callebaut | | | 2,773,867 | | |
| | 91,385 | | | Logitech International | | | 1,405,527 | * | |
| | 118,870 | | | Nestle SA | | | 4,646,020 | | |
| | 16,145 | | | Roche Holding | | | 2,464,943 | | |
| | 78,140 | | | Swiss Re | | | 3,692,810 | | |
| | | | 14,983,167 | | |
| United Kingdom (13.8%) | | | |
| | 642,873 | | | Amlin PLC | | | 3,304,340 | | |
| | 138,160 | | | Chemring Group | | | 3,873,472 | | |
| | 88,100 | | | De La Rue | | | 1,147,592 | | |
| | 204,025 | | | Diageo PLC | | | 2,818,969 | | |
| | 496,695 | | | Experian Group | | | 3,085,013 | | |
| | 81,662 | | | GlaxoSmithKline PLC | | | 1,508,126 | | |
| | 496,878 | | | Halma PLC | | | 1,446,633 | | |
| | 559,228 | | | Informa PLC | | | 1,979,925 | | |
| | 583,105 | | | Laird Group | | | 1,165,320 | | |
| | 979,971 | | | RPS Group | | | 1,972,535 | | |
| | 314,121 | | | Sepura Ltd. | | | 154,683 | n | |
| | 379,810 | | | SSL International | | | 2,703,056 | | |
| | 145,295 | | | Tullow Oil | | | 1,377,682 | | |
| | 3,799,887 | | | Vodafone Group | | | 7,593,972 | | |
| | | | 34,131,318 | | |
| | Total Common Stocks | | | (Cost $270,507,364) | | | 215,542,802 | | |
| NUMBER OF SHARES | | | | MARKET VALUEt | |
| Preferred Stocks (1.5%) | | | |
| Brazil (1.5%) | | | |
| | 125,435 | | | Companhia Vale do Rio
Doce ADR | | $ | 1,335,883 | | |
| | 108,645 | | | Ultrapar Participacoes ADR | | | 2,443,426 | | |
| | Total Preferred Stocks | | | (Cost $5,505,273) | | | 3,779,309 | | |
| Short-Term Investments (10.9%) | | | |
| | 26,810,816 | | | Neuberger Berman Prime
Money Fund Trust Class
(Cost $26,810,816) | | | 26,810,816 | @ | |
| | | | | Total Investments (99.7%)
(Cost $302,823,453) | | | 246,132,927## | | |
| | | | | Cash, receivables and other assets,
less liabilities (0.3%) | | | 800,660 | | |
| | | | | Total Net Assets (100.0%) | | $ | 246,933,587 | | |
See Notes to Schedule of Investments 6
SUMMARY SCHEDULE OF INVESTMENTS BY INDUSTRY INTERNATIONAL PORTFOLIO
| Industry | | Market Valuet | | Percentage of
Net Assets | |
| Health Care Equipment & Supplies | | $ | 18,404,731 | | | | 7.5 | % | |
| Food Products | | | 15,163,506 | | | | 6.1 | % | |
| Oil, Gas & Consumable Fuels | | | 15,066,698 | | | | 6.1 | % | |
| Pharmaceuticals | | | 14,971,570 | | | | 6.1 | % | |
| Insurance | | | 14,757,169 | | | | 6.0 | % | |
| Beverages | | | 10,524,529 | | | | 4.3 | % | |
| Wireless Telecommunication Services | | | 10,332,244 | | | | 4.2 | % | |
| Software | | | 9,861,968 | | | | 4.0 | % | |
| Media | | | 8,480,882 | | | | 3.4 | % | |
| Machinery | | | 8,289,903 | | | | 3.4 | % | |
| Commercial Banks | | | 8,200,390 | | | | 3.3 | % | |
| Diversified Telecommunication | | | 7,254,056 | | | | 2.9 | % | |
| Chemicals | | | 6,595,209 | | | | 2.7 | % | |
| Pharmaceuticals & Biotechnology | | | 6,488,313 | | | | 2.6 | % | |
| Commercial Services & Supplies | | | 6,205,140 | | | | 2.5 | % | |
| Food & Staples Retailing | | | 5,739,018 | | | | 2.3 | % | |
| Computers & Peripherals | | | 5,261,424 | | | | 2.1 | % | |
| Personal Products | | | 4,753,231 | | | | 1.9 | % | |
| Energy Equipment & Services | | | 4,068,687 | | | | 1.7 | % | |
| Aerospace & Defense | | | 3,873,472 | | | | 1.6 | % | |
| Life Science Tools & Services | | | 3,686,817 | | | | 1.5 | % | |
| Road & Rail | | | 3,321,489 | | | | 1.3 | % | |
| Metals & Mining | | | 3,295,228 | | | | 1.3 | % | |
| Air Freight & Logistics | | | 3,276,506 | | | | 1.3 | % | |
| Health Products & Services | | | 3,153,933 | | | | 1.3 | % | |
| Health Care Providers & Services | | | 2,656,145 | | | | 1.1 | % | |
| Electronic Equipment & Instruments | | | 2,611,953 | | | | 1.1 | % | |
| Communications Equipment | | | 2,518,235 | | | | 1.0 | % | |
| Automobiles | | | 2,474,941 | | | | 1.0 | % | |
| Electrical Equipment | | | 2,269,569 | | | | 0.9 | % | |
| Industrial Conglomerates | | | 2,248,504 | | | | 0.9 | % | |
| Semiconductors & Semiconductor Equipment | | | 1,237,889 | | | | 0.5 | % | |
| Auto Components | | | 1,223,320 | | | | 0.5 | % | |
| Diversified Financial Services | | | 1,055,442 | | | | 0.4 | % | |
| Other Assets--Net | | | 27,611,476 | | | | 11.2 | % | |
| | | $ | 246,933,587 | | | | 100.0 | % | |
See Notes to Schedule of Investments 7
Notes to Schedule of Investments International Portfolio
t Investments in equity securities by Neuberger Berman Advisers Management Trust International Portfolio (the "Fund") are valued by obtaining valuations from an independent pricing service. The independent pricing service values equity securities at the latest sale price when that price is readily available. Securities traded primarily on the NASDAQ Stock Market are normally valued by the Fund at the NASDAQ Official Closing Price ("NOCP") provided by NASDAQ each business day. The NOCP is the most recently reported price as of 4:00:02 p.m., Eastern time, unless that price is outside the range of the "inside" bid and asked prices (i.e., the bid and asked prices that dealers quote to each other when trading for their own accounts); in that case, NASDAQ will adjust the price to equal the inside bid or asked price, whichever is closer. Because of delays in reporting trades, the NOCP may not be based on the price of the last trade to occur before the market closes. If there is no reported sale of a security on a particular day, the independent pricing service may value the security based on reported market quotations. If a valuation is not available from an independent pricing service, the Fund seeks to obtain quotations from principal market makers. If such quotations are not readily available, securities are valued using methods the Board of Trustees of Neuberger Berman Advisers Management Trust (the "Board") has approved on the belief that they reflect fair value. Numerous factors may be considered when determining the fair value of a security, including available analyst, media or other reports, trading in futures or ADRs and whether the issuer of the security being fair valued has other securities outstanding. Foreign security prices are furnished by independent quotation services and expressed in local currency values. Foreign security prices are currently translated from the local currency into U.S. dollars using the exchange rate as of 4:00 p.m., Eastern time. The Board has approved the use of Interactive Data Pricing and Reference Data, Inc. ("Interactive") to assist in determining the fair value of the Fund's foreign equity securities when changes in the value of a certain index suggest that the closing prices on the foreign exchanges may no longer represent the amount that the Fund could expect to receive for those securities. In this event, Interactive will provide adjusted prices for certain foreign equity securities using a statistical analysis of historical correlations of multiple factors. In the absence of precise information about the market values of these foreign securities as of the close of the New York Stock Exchange, the Board has determined on the basis of available data that prices adjusted in this way are likely to be closer to the prices the Fund could realize on a current sale than are the prices of those securities established at the close of the foreign markets in which the securities primarily trade. Fair value prices are necessarily estimates, and there is no assurance that such a price will be at or close to the price at which the security next trades. Short-term debt securities with less than 60 days until maturity may be valued at cost which, when combined with interest earned, approximates market value.
The Fund adopted Financial Accounting Standards Board ("FASB") Statement of Financial Accounting Standards No. 157, Fair Value Measurements ("FAS 157"), effective January 1, 2008. In accordance with FAS 157, "fair value" is defined as the price that a Fund would receive upon selling an investment in an orderly transaction to an independent buyer in the principal or most advantageous market for the investment. Various inputs are used in determining the value of the Fund's investments.
In addition to defining fair value, FAS 157 established a three-tier hierarchy of inputs to establish a classification of fair value measurements for disclosure purposes. The three-tier hierarchy of inputs is summarized in the three broad Levels listed below.
. Level 1 - quoted prices in active markets for identical investments
. Level 2 - other significant observable inputs (including quoted prices for similar investments, interest rates, prepayment speeds, credit risk, amortized cost, etc.)
. Level 3 - significant unobservable inputs (including the Fund's own assumptions in determining the fair value of investments)
The inputs or methodology used for valuing an investment are not necessarily an indication of the risk associated with investing in those securities.
See Notes to Financial Statements 8
Notes to Schedule of Investments International Portfolio (cont'd)
The following is a summary of the inputs used to value the Fund's investments as of December 31, 2008:
| Valuation Inputs | | Investments in
Securities | |
| Level 1 - Quoted Prices | | $ | 217,663,732 | | |
| Level 2 - Other Significant Observable Inputs | | | 28,469,195 | | |
| Level 3 - Significant Unobservable Inputs | | | -- | | |
| Total | | $ | 246,132,927 | | |
## At December 31, 2008, the cost of investments for U.S. federal income tax purposes was $313,392,413. Gross unrealized appreciation of investments was $6,044,617 and gross unrealized depreciation of investments was $73,304,103, resulting in net unrealized depreciation of $67,259,486 based on cost for U.S. federal income tax purposes.
* Security did not produce income during the last twelve months.
a Neuberger Berman Prime Money Fund ("Prime Money") is also managed by Neuberger Berman Management LLC and may be considered an affiliate since it has the same officers, Board members, and investment manager as the Fund and because, at times, the Fund may own 5% or more of the outstanding voting securities of Prime Money (see Notes A & F of Notes to Financial Statements).
n These securities have been deemed by the investment manager to be illiquid because of low daily trade volume. At December 31, 2008, these securities amounted to $1,658,379 or 0.67% of net assets.
See Notes to Financial Statements 9
Statement of Assets and Liabilities
Neuberger Berman Advisers Management Trust
| | | INTERNATIONAL
PORTFOLIO | |
| | | December 31, 2008 | |
| Assets | |
| Investments in securities, at market value* (Notes A & F)-see Schedule of Investments: | |
| Unaffiliated issuers | | $ | 219,322,111 | | |
| Affiliated issuers | | | 26,810,816 | | |
| | | | 246,132,927 | | |
| Cash | | | 42,654 | | |
| Foreign currency | | | 179,201 | | |
| Dividends and interest receivable | | | 400,333 | | |
| Receivable for securities sold | | | 739,792 | | |
| Receivable for Fund shares sold | | | 108,053 | | |
| Receivable for securities lending income (Note A) | | | 17,411 | | |
| Prepaid expenses and other assets | | | 45 | | |
| Total Assets | | | 247,620,416 | | |
| Liabilities | |
| Payable for securities purchased | | | 295,948 | | |
| Payable for Fund shares redeemed | | | 83,751 | | |
| Payable to investment manager-net (Notes A & B) | | | 167,280 | | |
| Payable to administrator-net (Note B) | | | 10,625 | | |
| Payable for securities lending fees (Note A) | | | 20,803 | | |
| Accrued expenses and other payables | | | 108,422 | | |
| Total Liabilities | | | 686,829 | | |
| Net Assets at value | | $ | 246,933,587 | | |
| Net Assets consist of: | |
| Paid-in capital | | $ | 438,648,095 | | |
| Undistributed net investment income (loss) | | | 10,083,082 | | |
| Accumulated net realized gains (losses) on investments | | | (145,116,096 | ) | |
| Net unrealized appreciation (depreciation) in value of investments | | | (56,681,494 | ) | |
| Net Assets at value | | $ | 246,933,587 | | |
| Shares Outstanding ($.001 par value; unlimited shares authorized) | | | 33,857,103 | | |
| Net Asset Value, offering and redemption price per share | | $ | 7.29 | | |
| *Cost of Investments: | |
| Unaffiliated issuers | | $ | 276,012,637 | | |
| Affiliated issuers | | | 26,810,816 | | |
| Total cost of investments | | $ | 302,823,453 | | |
| Total cost of foreign currency | | $ | 164,250 | | |
See Notes to Financial Statements 10
Statement of Operations
Neuberger Berman Advisers Management Trust
| | | INTERNATIONAL
PORTFOLIO | |
| | | For the
Year Ended
December 31, 2008 | |
| Investment Income: | |
| Income (Note A): | |
| Dividend income-unaffiliated issuers | | $ | 20,201,394 | | |
| Interest income-unaffiliated issuers | | | 11,973 | | |
| Income from securities loaned-net (Note F) | | | 536,288 | | |
| Income from investments in affiliated issuers (Note F) | | | 1,093,237 | | |
| Foreign taxes withheld | | | (1,472,634 | ) | |
| Total income | | $ | 20,370,258 | | |
| Expenses: | |
| Investment management fees (Notes A & B) | | | 3,940,325 | | |
| Administration fees (Note B) | | | 1,420,096 | | |
| Distribution fees (Note B) | | | 1,183,413 | | |
| Audit fees | | | 40,494 | | |
| Custodian fees (Note B) | | | 395,617 | | |
| Insurance expense | | | 16,402 | | |
| Legal fees | | | 111,870 | | |
| Shareholder reports | | | 233,749 | | |
| Trustees' fees and expenses | | | 38,150 | | |
| Miscellaneous | | | 151,602 | | |
| Total expenses | | | 7,531,718 | | |
| Expenses reimbursed by administrator (Note B) | | | (269,738 | ) | |
| Investment management fees waived (Note A) | | | (31,580 | ) | |
| Expenses reduced by custodian fee expense offset and commission recapture arrangements (Note B) | | | (9,208 | ) | |
| Total net expenses | | | 7,221,192 | | |
| Net investment income (loss) | | $ | 13,149,066 | | |
| Realized and Unrealized Gain (Loss) on Investments (Note A) | |
| Net realized gain (loss) on: | |
| Sales of investment securities of unaffiliated issuers | | | (137,508,358 | ) | |
| Sales of investment securities of affiliated issuers | | | 199,867 | | |
| Foreign currency | | | (1,536,003 | ) | |
| Change in net unrealized appreciation (depreciation) in value of: | |
| Unaffiliated investment securities | | | (55,625,573 | ) | |
| Foreign currency | | | 33,642 | | |
| Net gain (loss) on investments | | | (194,436,425 | ) | |
| Net increase (decrease) in net assets resulting from operations | | $ | (181,287,359 | ) | |
See Notes to Financial Statements 11
Statements of Changes in Net Assets
Neuberger Berman Advisers Management Trust
| | | INTERNATIONAL PORTFOLIO | |
| | | Year Ended
December 31, | | Year Ended
December 31, | |
| | | 2008 | | 2007 | |
| Increase (Decrease) in Net Assets: | |
| From Operations: | |
| Net investment income (loss) | | $ | 13,149,066 | | | $ | 4,187,323 | | |
| Net realized gain (loss) on investments | | | (138,844,494 | ) | | | 32,845,155 | | |
| Change in net unrealized appreciation (depreciation) of investments | | | (55,591,931 | ) | | | (34,882,316 | ) | |
| Net increase (decrease) in net assets resulting from operations | | | (181,287,359 | ) | | | 2,150,162 | | |
| Distributions to Shareholders From (Note A): | |
| Net Investment Income | | | - | | | | (10,714,415 | ) | |
| Net realized gain on investments | | | - | | | | (37,835,250 | ) | |
| Total distributions to shareholders | | | - | | | | (48,549,665 | ) | |
| From Fund Share Transactions (Note D): | |
| Proceeds from shares sold | | | 224,924,016 | | | | 358,159,233 | | |
| Proceeds from reinvestment of dividends and distributions | | | - | | | | 48,549,665 | | |
| Payments for shares redeemed | | | (450,401,653 | ) | | | (45,301,221 | ) | |
| Redemption fees retained | | | 6,959 | | | | 36,159 | | |
| Net increase (decrease) from Fund share transactions | | | (225,470,678 | ) | | | 361,443,836 | | |
| Net Increase (Decrease) in Net Assets | | | (406,758,037 | ) | | | 315,044,333 | | |
| Net Assets: | |
| Beginning of year | | | 653,691,624 | | | | 338,647,291 | | |
| End of year | | $ | 246,933,587 | | | $ | 653,691,624 | | |
| Undistributed net investment income (loss) at end of year | | $ | 10,083,082 | | | $ | - | | |
| Distributions in excess of net investment income at end of year | | $ | - | | | $ | (3,424,749 | ) | |
See Notes to Financial Statements 12
Notes to Financial Statements International Portfolio
Note A--Summary of Significant Accounting Policies:
1 General: International Portfolio (the "Fund") is a separate operating series of Neuberger Berman Advisers Management Trust (the "Trust"), a Delaware statutory trust organized pursuant to a Trust Instrument dated May 23, 1994. The Trust is currently comprised of ten separate operating series (each a "Series," collectively, the "Funds") each of which is diversified. The Trust is registered as an open-end management investment company under the Investment Company Act of 1940, as amended (the "1940 Act"), and its shares are registered under the Securities Act of 1933, as amended. The Fund currently offers only Class S shares. The Board of Trustees of the Trust (the "Board") may establish additional series or classes of shares without the approval of shareholders.
The assets of each Series belong only to that Series, and the liabilities of each Series are borne solely by that Series and no other.
The preparation of financial statements in accordance with U.S. generally accepted accounting principles requires Neuberger Berman Management LLC ("Management") to make estimates and assumptions at the date of the financial statements. Actual results could differ from those estimates.
Management, the investment manager of the Fund, and Neuberger Berman, LLC ("Neuberger"), the Fund's sub-adviser, are wholly owned subsidiaries of Lehman Brothers Holdings Inc. ("Lehman Brothers"), a publicly owned holding company. On September 15, 2008, Lehman Brothers filed a voluntary petition under Chapter 11 of the U.S. Bankruptcy Code. On December 3, 2008, NBSH Acquisition, LLC ("NBSH"), an entity organized by key members of Neuberger Berman's senior management, was selected as the successful bidder in the public auction to acquire a majority interest in Neuberger Berman's business and the fixed income and certain alternative asset management businesses of Lehman Brothers' Investment Management Division (together with Neuberger Berman, the "Acquired Businesses") (the "Proposed Acquisition"). On December 22, 2008, the bankruptcy court having jurisdiction over the Lehman Brothers matter approved the sale of the Acquired Businesses to NBSH (or its successor or assign), as the successful bidder. At the closing of the Proposed Acquisition, a majority interest in the Acquired Businesses will be directly or indirectly owned by portfolio managers, Neuberger Berman's management team and certain key members and senior professionals of the former Investment Management Division, as well as by Lehman Brothers and certain affiliates of Lehman Brothers. The transaction is subject to certain conditions and approvals.
These events, while affecting Lehman Brothers, have not had a material impact on the Fund or its operations. Management and Neuberger will continue to operate in the ordinary course of business as the investment manager and sub-adviser of the Fund.
Included in the Acquired Businesses are Management and Neuberger. The consummation of the Proposed Acquisition has been deemed to result in an "assignment" of the Fund's Management and Sub-Advisory Agreements which would, by law, automatically terminate those agreements. Accordingly, the Board, including the Trustees who are not "interested persons" of the Fund's investment manager and its affiliates or the Fund, has approved the new Management Agreements and Sub-Advisory Agreements for the Fund. The new agreements also will require the approval of the Fund's shareholders.
2 Portfolio valuation: Investment securities are valued as indicated in the notes following the Schedule of Investments.
3 Foreign currency translation: The accounting records of the Fund are maintained in U.S. dollars. Foreign currency amounts are currently translated into U.S. dollars using the exchange rates as of 4:00 p.m., Eastern time, to determine the value of investments, other assets and liabilities. Purchase and sale prices of securities, and income and expenses, are translated into U.S. dollars at the prevailing rate of exchange on the respective dates of such transactions. Net unrealized foreign currency gain (loss), if any, arises from changes in the value of assets and liabilities, other than investments in securities, as a result of changes in exchange rates and is stated separately in the Statement of Operations.
13
4 Securities transactions and investment income: Securities transactions are recorded on trade date for financial reporting purposes. Dividend income is recorded on the ex-date or, for certain foreign dividends, as soon as the Fund becomes aware of the dividends. Non-cash dividends included in dividend income, if any, are recorded at the fair market value of the securities received. Interest income, including accretion of original issue discount, where applicable, and accretion of discount on short-term investments, is recorded on the accrual basis. Realized gains and losses from securities transactions and foreign currency transactions are recorded on the basis of identified cost and stated separately in the Statement of Operations.
5 Income tax information: The Funds are treated as separate entities for U.S. federal income tax purposes. It is the policy of the Fund to continue to qualify as a regulated investment company by complying with the requirements of Subchapter M of the Internal Revenue Code applicable to regulated investment companies and to distribute substantially all of its earnings to its shareholders. Therefore, no federal income or excise tax provision is required.
The Fund has adopted the provisions of Financial Accounting Standards Board Interpretation No. 48 ("FIN 48") "Accounting for Uncertainty in Income Taxes-an interpretation of FASB Statement No. 109". FIN 48 sets forth a minimum threshold for financial statement recognition of the benefit of a tax position taken, or expected to be taken, in a tax return. The Fund recognizes interest and penalties, if any, related to unrecognized tax benefits as an income tax expense in the Statement of Operations. The Fund is subject to examination by U.S. federal and state tax authorities for returns filed for the prior three fiscal years 2005 - 2007. As of December 31, 2008, the Fund did not have any unrecognized tax benefits.
Income distributions and capital gain distributions are determined in accordance with income tax regulations, which may differ from U.S. generally accepted accounting principles. These differences are primarily due to differing treatments of income and gains on various investment securities held by the Fund, timing differences and differing characterization of distributions made by the Fund as a whole. The Fund may also utilize earnings and profits distributed to shareholders on redemption of shares as a part of the dividends paid deduction for income tax purposes.
As determined on December 31, 2008, permanent differences resulting primarily from different book and tax accounting for foreign currency gains and losses and passive foreign investment company gains and losses were reclassified at fiscal year-end. These reclassifications had no effect on the net income, net asset value or net asset value per share of the Fund.
The tax character of distributions paid during the years ended December 31, 2008 and December 31, 2007 was as follows:
| Distributions Paid From: | |
| Ordinary Income | | Long-Term Capital Gain | | Total | |
| 2008 | | 2007 | | 2008 | | 2007 | | 2008 | | 2007 | |
| $ | - | | | $ | 32,827,380 | | | $ | - | | | $ | 15,722,285 | | | $ | - | | | $ | 48,549,665 | | |
As of December 31, 2008, the components of distributable earnings (accumulated losses) on a U.S. federal income tax basis were as follows:
Undistributed
Ordinary
Income | | Unrealized
Appreciation
(Depreciation) | | Loss
Carryforwards
and Deferrals | | Total | |
| $ | 10,083,032 | | | $ | (67,250,402 | ) | | $ | (134,547,138 | ) | | $ | (191,714,508 | ) | |
The difference between book basis and tax basis distributable earnings is attributable primarily to timing differences of wash sales, partnership basis adjustments, forward contracts mark to market, capital loss carryforwards and post October loss deferral.
14
To the extent the Fund's net realized capital gains, if any, can be offset by capital loss carryforwards, it is the policy of the Fund not to distribute such gains. As determined at December 31, 2008, the Fund had unused capital loss carryforwards available for federal income tax purposes to offset net realized capital gains, if any, as follows:
Expiring In:
2016 | |
| $ | 100,624,928 | | |
Under current tax law, certain net capital and net foreign currency losses realized after October 31 within the taxable year may be deferred and treated as occurring on the first day of the following tax year. For the year ended December 31, 2008, the Fund elected to defer $33,922,210 of net capital losses arising between November 1, 2008 and December 31, 2008.
6 Distributions to shareholders: The Fund may earn income, net of expenses, daily on its investments. Distributions from net investment income and net realized capital gains, if any, generally are distributed in October. Income distributions and capital gain distributions to shareholders are recorded on the ex-date.
7 Foreign taxes: Foreign taxes withheld represent amounts withheld by foreign tax authorities, net of refunds recoverable.
8 Expense allocation: Certain expenses are applicable to multiple funds. Expenses directly attributable to a Series are charged to that Series. Expenses of the Trust that are not directly attributed to a Series are allocated among the Funds, on the basis of relative net assets, except where a more appropriate allocation of expenses to each of the Funds can otherwise be made fairly. Expenses borne by the complex of related investment companies, which includes open-end and closed-end investment companies for which Management serves as investment manager, that are not directly attributed to a Series or the Trust are allocated among the Fund and the other investment companies in the complex or series thereof on the basis of relative net assets, except where a more appropriate allocation of expenses to each investment company in the complex or series thereof can otherwise be made fairly.
9 Security lending: A third party, eSecLending, has assisted the Fund in conducting a bidding process to identify agents/principals that would pay a guaranteed amount to the Fund in consideration of the Fund entering into an exclusive securities lending arrangement.
eSecLending currently serves as exclusive lending agent for the Fund. The Fund is not currently guaranteed any particular level of income from the lending program. In addition, for part of the fiscal year, Neuberger, an affiliate of the Fund, served as exclusive lending agent for the Fund. The Fund selected Neuberger through a bidding process in accordance with an Exemptive Order issued by the Securities and Exchange Commission.
Under the securities lending arrangement, the Fund receives cash collateral at the beginning of each transaction equal to at least 102% of the prior day's market value of the loaned securities (105% in the case of international securities). The Fund may invest all the cash collateral in Neuberger Berman Securities Lending Quality Fund, LLC ("Quality Fund"), a fund managed by Lehman Brothers Asset Management LLC ("LBAM"), an affiliate of Management.
At various times during the course of the Fund's fiscal year ended December 31, 2008, the Quality Fund's NAV was below $1.00 per share, which could have affected the NAV of the Fund with securities loans outstanding during the period. The Quality Fund's price per share on December 31, 2008 was $1.00. The market value of the Fund's investments in the Quality Fund as of that date, if any, is reflected in the Fund's Schedule of Investments. If it were necessary to liquidate assets in the Quality Fund to meet returns on outstanding securities loans at a time when the Quality Fund's price per share was less than $1.00, the Fund may not receive an amount from the Quality Fund that is equal in amount to the collateral the Fund would be required to return to the borrower of the securities and the Fund would be required to make up for this shortfall. In addition, as a result of recent reduced liquidity in the credit and fixed income markets, it may be difficult to dispose quickly of some securities in the Quality Fund at the price at which the Quality Fund is carrying them. The Quality Fund is not a money market fund that operates in accordance with Rule 2a-7 under the 1940 Act and there is no assurance that it will maintain a $1.00 share price.
15
Net income from the lending program represents the guaranteed amount received from Neuberger plus income earned on the cash collateral invested in Quality Fund or in other investments, less cash collateral fees and other expenses associated with the loans. For the fiscal year ended December 31, 2008, the Fund received net income under the securities lending arrangement of $536,288, which is reflected in the Statement of Operations under the caption "Income from securities loaned--net." For the fiscal year ended December 31, 2008, "Income from securities loaned--net" consisted of $1,398,080 in income earned on cash collateral and guaranteed amounts (including $874,019 of interest income earned from the Quality Fund and $524,061 in guaranteed amounts received from Neuberger), less fees and expenses paid of $861,792 (including $0 retained by Neuberger).
10 Repurchase agreements: The Fund may enter into repurchase agreements with institutions that Management has determined are creditworthy. Each repurchase agreement is recorded at cost. The Fund requires that the securities purchased in a repurchase agreement be transferred to the custodian in a manner sufficient to enable the Fund to assert a perfected security interest in those securities in the event of a default under the repurchase agreement. The Fund monitors, on a daily basis, the value of the securities transferred to ensure that their value, including accrued interest, is greater than amounts owed to the Fund under each such repurchase agreement.
11 Redemption of fund shares: The Fund charges a redemption fee of 2% on shares redeemed or exchanged for shares of another fund within 60 days or less of the purchase date. All redemption fees are paid to and recorded by the Fund as Paid-in capital. For the year ended December 31, 2008, the Fund received $6,959 in redemption fees.
12 Transactions with other funds managed by Neuberger Berman Management LLC: Pursuant to an Exemptive Order issued by the Securities and Exchange Commission, the Fund may invest in a money market fund managed by Management or an affiliate. The Fund invests in Neuberger Berman Prime Money Fund ("Prime Money"), as approved by the Board. Prime Money seeks to provide the highest available current income consistent with safety and liquidity. For any cash that the Fund invests in Prime Money, Management waives a portion of its management fee equal to the management fee it receives from Prime Money on those assets (the "Arrangement"). For the year ended December 31, 2008, management fees waived under this Arrangement amounted to $31,580 and are reflected in the Statement of Operations under the caption "Investment management fees waived." For the year ended December 31, 2008, income earned under this Arrangement amounted to $1,093,237 and is reflected in the Statement of Operations under the caption "Income from investments in affiliated issuers."
13 Indemnifications: Like many other companies, the Trust's organizational documents provide that its officers and trustees are indemnified against certain liabilities arising out of the performance of their duties to the Trust. In addition, both in some of its principal service contracts and in the normal course of its business, the Trust enters into contracts that provide indemnifications to other parties for certain types of losses or liabilities. The Trust's maximum exposure under these arrangements is unknown as this could involve future claims against the Trust.
Note B--Management Fees, Administration Fees, Distribution Arrangements, and Other Transactions With Affiliates:
Fund shares are issued and redeemed in connection with investments in and payments under certain variable annuity contracts and variable life insurance policies issued through separate accounts of life insurance companies and are also offered directly to qualified pension and retirement plans.
The Fund retains Management as its investment manager under a Management Agreement. For such investment management services, the Fund pays Management a fee at the annual rate of 0.85% of the first $250 million of the Fund's average daily net assets, 0.825% of the next $250 million, 0.80% of the next $250 million, 0.775% of the next $250 million, 0.75% of the next $500 million, 0.725% of the next $1 billion, and 0.70% of average daily net assets in excess of $2.5 billion.
The Fund retains Management as its administrator under an Administration Agreement. The Fund pays Management an administration fee at the annual rate of 0.30% of its average daily net assets under this agreement. Additionally,
16
Management retains State Street Bank and Trust Company ("State Street") as its sub-administrator under a Sub-Administration Agreement. Management pays State Street a fee for all services received under this agreement.
Management acts as agent in arranging for the sale of Fund shares without commission and bears advertising and promotion expenses. The Board has adopted a distribution plan (the "Plan") with respect to the Fund, pursuant to Rule 12b-1 under the 1940 Act. The Plan provides that, as compensation for administrative and other services provided to the Fund, Management's activities and expenses related to the sale and distribution of the Fund's shares, and ongoing services provided to investors in the Fund, Management receives from the Fund a fee at the annual rate of 0.25% of the Fund's average daily net assets. Management receives this amount to provide distribution and shareholder servicing for the Fund and pays a portion of it to institutions that provide such services. Those institutions may use the payments for, among other purposes, compensating employees engaged in sales and/or shareholder servicing. The amount of fees paid by the Fund during any year may be more or less than the cost of distribution and other services provided to the Fund. FINRA rules limit the amount of annual distribution fees that may be paid by a mutual fund and impose a ceiling on the cumulative distribution fees paid. The Trust's Plan complies with those rules.
Management has contractually undertaken through December 31, 2011 to forgo current payment of fees and/or reimburse the Fund for its operating expenses (including the fees payable to Management but excluding interest, taxes, brokerage commissions, extraordinary expenses, and transaction costs) ("Operating Expenses") which exceed, in the aggregate, 2.00% per annum of the Fund's average daily net assets (the "Expense Limitation"). Moreover, Management has voluntarily committed to reimburse certain expenses, as stated above, for an additional 0.50% per annum of the Fund's average daily net assets to maintain the Fund's Operating Expense at 1.50%. Management may, at its sole discretion, terminate this voluntary reimbursement commitment without notice. For the year ended December 31, 2008, Management voluntarily reimbursed the Fund $269,738. The Fund has agreed to repay Management through December 31, 2014 for fees and expenses foregone and/or its excess Operating Expenses previously reimbursed by Management under the contractual Expense Limitation, so long as its annual Operating Expenses during that period do not exceed its Expense Limitation, and the repayment is made within three years after the year in which Management issued the reimbursement or waived fees. During the year ended December 31, 2008, there was no repayment to Management under this agreement. At December 31, 2008, the Fund had no contingent liabilities to Management under this agreement.
Neuberger is retained by Management to furnish it with investment recommendations and research information without added cost to the Fund. Several individuals who are officers and/or trustees of the Trust are also employees of Neuberger and/or Management.
The Fund had entered into a commission recapture program, which enabled it to pay some of its operational expenses by recouping a portion of the commissions it paid to a broker that was not a related party of the Fund. Pursuant to the agreement, brokers paid recaptured commissions to the Fund's custodian and the custodian directed these amounts toward payment of expenses such as custodial, transfer agency or accounting services. Effective April 1, 2008, this commission recapture program was terminated. For the period ended March 31, 2008, the impact of this arrangement was a reduction of expenses of $8,448.
The Fund has an expense offset arrangement in connection with its custodian contract. For the year ended December 31, 2008, the impact of this arrangement was a reduction of expenses of $760.
Note C--Securities Transactions:
During the year ended December 31, 2008, there were purchase and sale transactions (excluding short-term securities) of $666,835,337 and $831,801,040, respectively.
During the year ended December 31, 2008, brokerage commissions on securities transactions paid to affiliated brokers were as follows: Neuberger received $0 and Lehman Brothers Inc. received $239,603.
17
Note D--Fund Share Transactions:
Share activity for the years ended December 31, 2008 and December 31, 2007 was as follows:
| | | For the Year Ended December 31, | |
| | | 2008 | | 2007 | |
| Shares Sold | | | 22,555,823 | | | | 23,752,913 | | |
| Shares Issued on Reinvestment of Dividends and Distributions | | | -- | | | | 3,653,649 | | |
| Shares Redeemed | | | (36,732,197 | ) | | | (3,068,124 | ) | |
| Total | | | (14,176,374 | ) | | | 24,338,438 | | |
Note E--Line of Credit:
At December 31, 2008, the Fund was a participant in a single committed, unsecured $150,000,000 line of credit with State Street, to be used only for temporary or emergency purposes. Other investment companies managed by Management also participate in this line of credit on the same terms. Interest is charged on borrowings under this line of credit at the overnight Federal Funds Rate plus 0.50% per annum. A facility fee of 0.07% (as of September 19, 2008, 0.09%) per annum of the available line of credit is charged, of which the Fund has agreed to pay its pro rata share, based on the ratio of its individual net assets to the net assets of all participants at the time the fee is due and payable. The fee is paid quarterly in arrears. Because several investment companies participate, there is no assurance that an individual Fund will have access to all or any part of the $150,000,000 at any particular time.
At December 31, 2008, the Fund was one of five holders of a single $100,000,000 uncommitted, secured line of credit with State Street to be used only for temporary or emergency purposes or for leverage. Other investment companies managed by Management also participate in this line of credit on the same terms. Interest is charged at LIBOR, or the overnight Federal Funds Rate, plus a spread to be determined at the time of borrowing. Because several investment companies participate, there is no assurance that the Fund will have access to the entire $100,000,000 at any particular time.
The Fund had no loans outstanding pursuant to these lines of credit at December 31, 2008. During the year ended December 31, 2008, the Fund did not utilize these lines of credit.
Note F--Investments In Affiliates:
| Name of Issuer | | Balance of
Shares
Held
December 31,
2007 | | Gross
Purchases
and
Additions | | Gross
Sales
and
Reductions | | Balance of
Shares
Held
December 31,
2008 | | Value
December 31,
2008 | | Income from
Investments in
Affiliated
Issuers
Included in
Total Income | |
Neuberger Berman Prime
Money Fund Trust Class* | | | 64,225,422 | | | | 353,270,115 | | | | 390,684,721 | | | | 26,810,816 | | | $ | 26,810,816 | | | $ | 1,093,237 | | |
Neuberger Berman Securities
Lending Quality Fund, LLC** | | | 22,147,183 | | | | 323,321,470 | | | | 345,468,653 | | | | - | | | | - | | | | 874,019 | | |
| Total | | | | | | | | | | $ | 26,810,816 | | | $ | 1,967,256 | | |
* Prime Money is also managed by Management and may be considered an affiliate since it has the same officers, Board members, and investment manager as the Fund and because, at times, the Fund may own 5% or more of the outstanding voting securities of Prime Money.
18
** Quality Fund, a fund managed by LBAM, an affiliate of Management, is used to invest cash the Fund receives as collateral for securities loans as approved by the Board. Because all shares of Quality Fund are held by funds in the related investment management complex, Quality Fund may be considered an affiliate of the Fund.
Note G--Recent Accounting Pronouncement:
In March 2008, Statement of Financial Accounting Standards No. 161, "Disclosures about Derivative Instruments and Hedging Activities-an amendment of FASB Statement No. 133" ("FAS 161"), was issued. FAS 161 is intended to improve financial reporting for derivative instruments by requiring enhanced disclosure that enables investors to understand how and why an entity uses derivatives, how derivatives are accounted for, and how derivative instruments affect an entity's results of operations and financial position. In September 2008, FASB Staff Position No. 133-1 and FASB Interpretation No. 45-4 (the "FSP"), "Disclosures about Credit Derivatives and Certain Guarantees: An Amendment of FASB Statement No. 133 and FASB Interpretation No. 45; and Clarification of the Effective Date of FASB Statement No. 161" was issued. Certain provisions of the FSP amend FASB Statement No. 133, "Accounting for Derivative Instruments and Hedging Activities," to require disclosures by sellers of credit derivatives, including credit derivatives embedded in hybrid instruments. These FSP provisions are effective for fiscal years and interim periods ending after November 15, 2008. At this time, Management has assessed the implication of these FSP provisions and determined there is no impact to the Fund's financial statements. The FSP also clarifies the effective date of FAS 161, whereby disclosures required by FAS 161 are effective for financial statements issued for fiscal years and interim periods beginning after November 15, 2008. The impact of FAS 161 on the Fund's financial statement disclosures, if any, is currently being assessed.
Note H--Recent Market Events:
The year covered by this report witnessed an unusually high degree of volatility in the financial markets and the net asset values of many mutual funds, including to some extent the Fund. Both domestic and international equity markets have been experiencing heightened volatility and turmoil, with issuers that have exposure to the real estate, mortgage and credit markets particularly affected. In addition to the recent turbulence in financial markets, the reduced liquidity in credit and fixed income markets has negatively affected many issuers worldwide. The Fund's investments in certain issuers, as reflected in the Fund's schedule of investments, and the financial markets in general, expose investors to the volatile performance resulting from these market conditions and related events.
19
Financial Highlights
International Portfolio
The following table includes selected data for a share outstanding throughout each period and other performance information derived from the Financial Statements.
| | | Year Ended December 31, | | Period from
April 29, 2005^
to December 31, | |
| | | 2008 | | 2007 | | 2006 | | 2005 | |
| Net Asset Value, Beginning of Period | | $ | 13.61 | | | $ | 14.29 | | | $ | 11.68 | | | $ | 10.00 | | |
| Income From Investment Operations: | |
| Net Investment Income (Loss)a | | | .32 | | | | .13 | | | | .10 | | | | .07 | | |
Net Gains or Losses on Securities
(both realized and unrealized) | | | (6.64 | ) | | | .30 | | | | 2.64 | | | | 1.67 | | |
| Total From Investment Operations | | | (6.32 | ) | | | .43 | | | | 2.74 | | | | 1.74 | | |
| Less Distributions From: | |
| Net Investment Income | | | - | | | | (.24 | ) | | | (.03 | ) | | | (.01 | ) | |
| Net Capital Gains | | | - | | | | (.87 | ) | | | (.10 | ) | | | (.06 | ) | |
| Total Distributions | | | - | | | | (1.11 | ) | | | (.13 | ) | | | (.07 | ) | |
| Redemption Feesa | | | .00 | | | | .00 | | | | .00 | | | | .01 | | |
| Net Asset Value, End of Period | | $ | 7.29 | | | $ | 13.61 | | | $ | 14.29 | | | $ | 11.68 | | |
| Total Returntt | | | (46.44 | )% | | | 3.21 | % | | | 23.45 | % | | | 17.50 | %** | |
| Ratios/Supplemental Data | |
| Net Assets, End of Period (in millions) | | $ | 246.9 | | | $ | 653.7 | | | $ | 338.6 | | | $ | 12.6 | | |
| Ratio of Gross Expenses to Average Net Assets# | | | 1.53 | % | | | 1.51 | % | | | 1.50 | % | | | 1.51 | %* | |
| Ratio of Net Expenses to Average Net Assetst | | | 1.53 | % | | | 1.50 | % | | | 1.50 | % | | | 1.50 | %* | |
Ratio of Net Investment Income (Loss) to
Average Net Assets | | | 2.78 | % | | | .85 | % | | | .75 | % | | | .91 | %* | |
| Portfolio Turnover Rate | | | 149 | % | | | 43 | % | | | 39 | % | | | 29 | %** | |
See Notes to Financial Highlights 20
Notes to Financial Highlights International Portfolio
tt Total return based on per share net asset value reflects the effects of changes in net asset value on the performance of the Fund during each fiscal period and assumes dividends and other distributions, if any, were reinvested. Results represent past performance and do not guarantee future results. Current returns may be lower or higher than the performance data quoted. Investment returns and principal may fluctuate and shares when redeemed may be worth more or less than original cost. Total return would have been lower if Management had not reimbursed and/or waived certain expenses. Total return would have been higher if Management had not recouped previously reimbursed expenses. The total return information shown does not reflect charges and other expenses that apply to the separate account or the related insurance policies, and the inclusion of these charges and other expenses would reduce the total return for all fiscal periods shown.
# The Fund is required to calculate an expense ratio without taking into consideration any expense reductions related to expense offset arrangements.
t After reimbursement of expenses and/or waiver of a portion of the investment management fee by Management. Had Management not undertaken such actions, the annualized ratios of net expenses to average daily net assets would have been:
| Year Ended December 31, | | Period from
April 29, 2005^ to
December 31, | |
| 2008 | | 2007 | | 2006 | | 2005 | |
| | 1.59 | % | | | 1.53 | % | | | 1.67 | % | | | 5.84 | % | |
^ The date investment operations commenced.
a Calculated based on the average number of shares outstanding during the fiscal period.
* Annualized.
** Not annualized.
21
Report of Independent Registered Public Accounting Firm
To the Board of Trustees of
Neuberger Berman Advisers Management Trust and
Shareholders of International Portfolio
We have audited the accompanying statement of assets and liabilities, including the schedule of investments, of International Portfolio, one of the series constituting Neuberger Berman Advisers Management Trust (the "Trust"), as of December 31, 2008, and the related statement of operations for the year then ended, the statement of changes in net assets for each of the two years in the period then ended, and the financial highlights for each of the periods indicated therein. These financial statements and financial highlights are the responsibility of the Trust's management. Our responsibility is to express an opinion on these financial statements and financial highlights based on our audits.
We conducted our audits in accordance with the standards of the Public Company Accounting Oversight Board (United States). Those standards require that we plan and perform the audit to obtain reasonable assurance about whether the financial statements and financial highlights are free of material misstatement. We were not engaged to perform an audit of the Trust's internal control over financial reporting. Our audits included consideration of internal control over financial reporting as a basis for designing audit procedures that are appropriate in the circumstances, but not for the purpose of expressing an opinion on the effectiveness of the Trust's internal control over financial reporting. Accordingly, we express no such opinion. An audit also includes examining, on a test basis, evidence supporting the amounts and disclosures in the financial statements and financial highlights, assessing the accounting principles used and significant estimates made by management, and evaluating the overall financial statement presentation. Our procedures included confirmation of securities owned as of December 31, 2008 by correspondence with the custodian and brokers or by other appropriate auditing procedures where replies from brokers were not received. We believe that our audits provide a reasonable basis for our opinion.
In our opinion, the financial statements and financial highlights referred to above present fairly, in all material respects, the financial position of International Portfolio, a series of Neuberger Berman Advisers Management Trust, at December 31, 2008, the results of its operations for the year then ended, the changes in its net assets for each of the two years in the period then ended, and the financial highlights for each of the periods indicated therein, in conformity with U.S. generally accepted accounting principles.

Boston, Massachusetts
February 9, 2009
22
Trustee and Officer Information
The following tables set forth information concerning the trustees and officers of the Trust. All persons named as trustees and officers also serve in similar capacities for other funds administered or managed by Neuberger Berman Management LLC ("NB Management") and Neuberger Berman, LLC ("Neuberger Berman"). The Statement of Additional Information includes additional information about fund trustees and is available upon request, without charge, by calling (800) 877-9700.
Information about the Board of Trustees
Name, (Year of Birth),
and Address(1) | | Position and
Length of
Time Served(2) | | Principal Occupation(s)(3) | | Number of
Funds in Fund
Complex
Overseen by
Fund Trustee | | Other Directorships
Held Outside Fund
Complex by Fund
Trustee | |
| Independent Fund Trustees | |
|
| John Cannon (1930) | | Trustee since 2000 | | Consultant; formerly, Chairman, CDC Investment Advisers (registered investment adviser), 1993 to January 1999; formerly, President and Chief Executive Officer, AMA Investment Advisors, an affiliate of the American Medical Association. | | | 56 | | | Independent Trustee or Director of three series of Oppenheimer Funds: Oppenheimer Limited Term New York Municipal Fund, Rochester Fund Municipals, and Oppenheimer Convertible Securities Fund since 1992. | |
|
| Faith Colish (1935) | | Trustee since 1982 | | Counsel, Carter Ledyard & Milburn LLP (law firm) since October 2002; formerly, Attorney-at-Law and President, Faith Colish, A Professional Corporation, 1980 to 2002. | | | 56 | | | Formerly, Director (1997 to 2003) and Advisory Director (2003 to 2006), ABA Retirement Funds (formerly, American Bar Retirement Association) (not-for-profit membership corporation). | |
|
| Martha C. Goss (1949) | | Trustee since 2007 | | President, Woodhill Enterprises Inc./Chase Hollow Associates LLC (personal investment vehicle), since 2006; Chief Operating and Financial Officer, Hopewell Holdings LLC/ Amwell Holdings, LLC (a holding company for a healthcare reinsurance company start-up), since 2003; formerly, Consultant, Resources Connection (temporary staffing), 2002 to 2006. | | | 56 | | | Director, Ocwen Financial Corporation (mortgage servicing), since 2005; Director, American Water (water utility), since 2003; Director, Channel Reinsurance (financial guaranty reinsurance), since 2006; Advisory Board Member, Attensity (software developer), since 2005; Director, Allianz Life of New York (insurance), since 2005; Director, Financial Women's Association of New York (not for profit association), since 2003; Trustee Emerita, Brown University, since 1998. | |
|
23
Name, (Year of Birth),
and Address(1) | | Position and
Length of
Time Served(2) | | Principal Occupation(s)(3) | | Number of
Funds in Fund
Complex
Overseen by
Fund Trustee | | Other Directorships
Held Outside Fund
Complex by Fund
Trustee | |
| C. Anne Harvey (1937) | | Trustee since 1998 | | President, C.A. Harvey Associates, since October 2001; formerly, Director, AARP, 1978 to December 2001. | | | 56 | | | Formerly, President, Board of Associates to The National Rehabilitation Hospital's Board of Directors, 2001 to 2002; formerly, Member, Individual Investors Advisory Committee to the New York Stock Exchange Board of Directors, 1998 to June 2002. | |
|
| Robert A. Kavesh (1927) | | Trustee since 2000 | | Retired; Marcus Nadler Professor Emeritus of Finance and Economics, New York University Stern School of Business; formerly, Executive Secretary-Treasurer, American Finance Association, 1961 to 1979. | | | 56 | | | Formerly, Director, The Caring Community (not-for-profit), 1997 to 2006; formerly, Director, DEL Laboratories, Inc. (cosmetics and pharmaceuticals), 1978 to 2004; formerly, Director, Apple Bank for Savings, 1979 to 1990; formerly, Director, Western Pacific Industries, Inc., 1972 to 1986 (public company). | |
|
| Michael M. Knetter (1960) | | Trustee since 2007 | | Dean, School of Business, University of Wisconsin - Madison; formerly, Professor of International Economics and Associate Dean, Amos Tuck School of Business - Dartmouth College, 1998 to 2002. | | | 56 | | | Trustee, Northwestern Mutual Series Fund, Inc., since February 2007; Director, Wausau Paper, since 2005; Director, Great Wolf Resorts, since 2004. | |
|
| Howard A. Mileaf (1937) | | Trustee since 1999 | | Retired; formerly, Vice President and General Counsel, WHX Corporation (holding company), 1993 to 2001. | | | 56 | | | Formerly, Director, Webfinancial Corporation (holding company), 2002 to 2008; formerly, Director WHX Corporation (holding company), January 2002 to June 2005; formerly, Director, State Theatre of New Jersey (not-for-profit theater), 2000 to 2005. | |
|
24
Name, (Year of Birth),
and Address(1) | | Position and
Length of
Time Served(2) | | Principal Occupation(s)(3) | | Number of
Funds in Fund
Complex
Overseen by
Fund Trustee | | Other Directorships
Held Outside Fund
Complex by Fund
Trustee | |
| George W. Morriss (1947) | | Trustee since 2007 | | Retired; formerly, Executive Vice President and Chief Financial Officer, People's Bank, Connecticut (a financial services company), 1991 to 2001. | | | 56 | | | Manager, Old Mutual 2100 fund complex (consisting of six funds) since October 2006 for four funds and since February 2007 for two funds; formerly, Member NASDAQ Issuers' Affairs Committee, 1995 to 2003. | |
|
| Edward I. O'Brien (1928) | | Trustee since 2000 | | Retired; formerly, Member, Investment Policy Committee, Edward Jones, 1993 to 2001; President, Securities Industry Association ("SIA") (securities industry's representative in government relations and regulatory matters at the federal and state levels), 1974 to 1992; Adviser to SIA, November 1992 to November 1993. | | | 56 | | | Formerly, Director, Legg Mason, Inc. (financial services holding company), 1993 to July 2008; formerly, Director, Boston Financial Group (real estate and tax shelters), 1993 to 1999. | |
|
| William E. Rulon (1932) | | Trustee since 2000 | | Retired; formerly, Senior Vice President, Foodmaker, Inc. (operator and franchiser of restaurants), until January 1997. | | | 56 | | | Formerly, Director, Pro-Kids Golf and Learning Academy (teach golf and computer usage to "at risk" children), 1998 to 2006; formerly, Director, Prandium, Inc. (restaurants), March 2001 to July 2002. | |
|
| Cornelius T. Ryan (1931) | | Trustee since 2000 | | Founding General Partner, Oxford Partners and Oxford Bioscience Partners (venture capital investing) and President, Oxford Venture Corporation, since 1981. | | | 56 | | | None. | |
|
25
Name, (Year of Birth),
and Address(1) | | Position and
Length of
Time Served(2) | | Principal Occupation(s)(3) | | Number of
Funds in Fund
Complex
Overseen by
Fund Trustee | | Other Directorships
Held Outside Fund
Complex by Fund
Trustee | |
| Tom D. Seip (1950) | | Trustee since 2000; Chairman of the Board since 2008; Lead Independent Trustee from 2006 to 2008 | | General Partner, Seip Investments LP (a private investment partnership); formerly, President and CEO, Westaff, Inc. (temporary staffing), May 2001 to January 2002; formerly, Senior Executive at the Charles Schwab Corporation, 1983 to 1998, including Chief Executive Officer, Charles Schwab Investment Management, Inc., and Trustee, Schwab Family of Funds and Schwab Investments, 1997 to 1998, and Executive Vice President-Retail Brokerage, Charles Schwab & Co., Inc., 1994 to 1997. | | | 56 | | | Director, H&R Block, Inc. (financial services company), since May 2001; Chairman, Compensation Committee, H&R Block, Inc., since 2006; formerly, Director, Forward Management, Inc. (asset management company), 1999 to 2006. | |
|
| Candace L. Straight (1947) | | Trustee since 1999 | | Private investor and consultant specializing in the insurance industry; formerly, Advisory Director, Securitas Capital LLC (a global private equity investment firm dedicated to making investments in the insurance sector), 1998 to December 2003. | | | 56 | | | Director, Montpelier Re (reinsurance company), since 2006; formerly, Director, National Atlantic Holdings Corporation (property and casualty insurance company), 2004 to 2008; formerly, Director, The Proformance Insurance Company (property and casualty insurance company), 2004 to 2008; formerly, Director, Providence Washington Insurance Company (property and casualty insurance company), December 1998 to March 2006; formerly, Director, Summit Global Partners (insurance brokerage firm), 2000 to 2005. | |
|
| Peter P. Trapp (1944) | | Trustee since 1984 | | Retired; formerly, Regional Manager for Mid-Southern Region, Ford Motor Credit Company, September 1997 to 2007; formerly, President, Ford Life Insurance Company, April 1995 to August 1997. | | | 56 | | | None. | |
|
26
Name, (Year of Birth),
and Address(1) | | Position and
Length of
Time Served(2) | | Principal Occupation(s)(3) | | Number of
Funds in Fund
Complex
Overseen by
Fund Trustee | | Other Directorships
Held Outside Fund
Complex by Fund
Trustee | |
| Fund Trustees who are "Interested Persons" | |
|
| Jack L. Rivkin* (1940) | | Trustee since 2002; President from 2002 to 2008 | | Formerly, Executive Vice President and Chief Investment Officer, Neuberger Berman Holdings LLC (holding company), 2002 to August 2008 and 2003 to August 2008, respectively; formerly, Managing Director and Chief Investment Officer, Neuberger Berman, December 2005 to August 2008 and 2003 to August 2008, respectively; formerly, Executive Vice President, Neuberger Berman, December 2002 to 2005; formerly, Director and Chairman, NB Management, December 2002 to August 2008; formerly, Executive Vice President, Citigroup Investments, Inc., September 1995 to February 2002; formerly, Executive Vice President, Citigroup Inc., September 1995 to February 2002. | | | 56 | | | Director, Dale Carnegie and Associates, Inc. (private company), since 1998; Director, Solbright, Inc. (private company), since 1998. | |
|
27
Name, (Year of Birth),
and Address(1) | | Position and
Length of
Time Served(2) | | Principal Occupation(s)(3) | | Number of
Funds in Fund
Complex
Overseen by
Fund Trustee | | Other Directorships
Held Outside Fund
Complex by Fund
Trustee | |
| Robert Conti* (1956) | | Chief Executive Officer, President and Director since 2008; prior thereto, Executive Vice President in 2008 and Vice President 2000 to 2008 | | Managing Director, Neuberger Berman, since 2007; formerly, Senior Vice President, Neuberger Berman, 2003 to 2006; formerly, Vice President, Neuberger Berman, 1999 to 2003; President and Chief Executive Officer, NB Management, since 2008; formerly, Senior Vice President, NB Management, 2000 to 2008. | | | 56 | | | Chairman of the Board, Staten Island Mental Health Society since 2008. | |
|
(1) The business address of each listed person is 605 Third Avenue, New York, New York 10158.
(2) Pursuant to the Trust's Trust Instrument, each Fund Trustee shall hold office for life or until his or her successor is elected or the Trust terminates; except that (a) any Fund Trustee may resign by delivering a written resignation; (b) any Fund Trustee may be removed with or without cause at any time by a written instrument signed by at least two-thirds of the other Fund Trustees; (c) any Fund Trustee who requests to be retired, or who has become unable to serve, may be retired by a written instrument signed by a majority of the other Fund Trustees; and (d) any Fund Trustee may be removed at any shareholder meeting by a vote of at least two-thirds of the outstanding shares.
(3) Except as otherwise indicated, each individual has held the positions shown for at least the last five years.
* Indicates a Fund Trustee who is an "interested person" within the meaning of the 1940 Act. Mr. Conti is an interested person of the Trust by virtue of the fact that he is an officer of NB Management and Neuberger Berman. Mr. Rivkin may be deemed an interested person of the Trust by virtue of the fact that, until August 2008, he was a director of NB Management and an officer of Neuberger Berman.
28
Information about the Officers of the Trust
Name, (Year of Birth),
and Address(1) | | Position and
Length of Time
Served(2) | | Principal Occupation(s)(3) | |
| Andrew B. Allard (1961) | | Anti-Money Laundering Compliance Officer since 2002 | | Senior Vice President, Neuberger Berman, since 2006; Deputy General Counsel, Neuberger Berman, since 2004; formerly, Vice President, Neuberger Berman, 2000 to 2005; formerly, Associate General Counsel, Neuberger Berman, 1999 to 2004; Anti-Money Laundering Compliance Officer, eleven registered investment companies for which NB Management acts as investment manager and administrator (six since 2002, two since 2003, two since 2004 and one since 2006). | |
|
| Michael J. Bradler (1970) | | Assistant Treasurer since 2005 | | Vice President, Neuberger Berman, since 2006; Employee, NB Management, since 1997; Assistant Treasurer, eleven registered investment companies for which NB Management acts as investment manager and administrator (ten since 2005 and one since 2006). | |
|
| Claudia A. Brandon (1956) | | Executive Vice President since 2008 and Secretary since 1985 | | Senior Vice President, Neuberger Berman, since 2007 and Employee since 1999; formerly, Vice President, Neuberger Berman, 2002 to 2006; Senior Vice President, NB Management, since 2008 and Assistant Secretary since 2004; formerly, Vice President-Mutual Fund Board Relations, NB Management, 2000 to 2008; Executive Vice President, eleven registered investment companies for which NB Management acts as investment manager and administrator (eleven since 2008); Secretary, eleven registered investment companies for which NB Management acts as investment manager and administrator (three since 1985, three since 2002, two since 2003, two since 2004 and one since 2006). | |
|
| Maxine L. Gerson (1950) | | Executive Vice President since 2008 and Chief Legal Officer since 2005 (only for purposes of sections 307 and 406 of the Sarbanes-Oxley Act of 2002) | | Senior Vice President, Neuberger Berman, since 2002; Deputy General Counsel and Assistant Secretary, Neuberger Berman, since 2001; Senior Vice President, NB Management, since 2006; Secretary and General Counsel, NB Management, since 2004; Executive Vice President, eleven registered investment companies for which NB Management acts as investment manager and administrator (eleven since 2008); Chief Legal Officer (only for purposes of sections 307 and 406 of the Sarbanes-Oxley Act of 2002), eleven registered investment companies for which NB Management acts as investment manager and administrator (ten since 2005 and one since 2006). | |
|
| Sheila R. James (1965) | | Assistant Secretary since 2002 | | Vice President, Neuberger Berman, since 2008 and Employee since 1999; formerly, Assistant Vice President, Neuberger Berman, 2007; Assistant Secretary, eleven registered investment companies for which NB Management acts as investment manager and administrator (six since 2002, two since 2003, two since 2004 and one since 2006). | |
|
| Brian Kerrane (1969) | | Vice President since 2008 | | Senior Vice President, Neuberger Berman, since 2006; formerly, Vice President, Neuberger Berman, 2002 to 2006; Vice President, NB Management, since 2008 and Employee since 1991; Vice President, eleven registered investment companies for which NB Management acts as investment manager and administrator (eleven since 2008). | |
|
29
Name, (Year of Birth),
and Address(1) | | Position and
Length of Time
Served(2) | | Principal Occupation(s)(3) | |
| Kevin Lyons (1955) | | Assistant Secretary since 2003 | | Assistant Vice President, Neuberger Berman, since 2008 and Employee since 1999; Assistant Secretary, eleven registered investment companies for which NB Management acts as investment manager and administrator (eight since 2003, two since 2004 and one since 2006). | |
|
| Owen F. McEntee, Jr. (1961) | | Vice President since 2008 | | Vice President, Neuberger Berman, since 2006; Employee, NB Management, since 1992; Vice President, eleven registered investment companies for which NB Management acts as investment manager and administrator (eleven since 2008). | |
|
| John M. McGovern (1970) | | Treasurer and Principal Financial and Accounting Officer since 2005; prior thereto, Assistant Treasurer since 2002 | | Senior Vice President, Neuberger Berman, since 2007; formerly, Vice President, Neuberger Berman, 2004 to 2006; Employee, NB Management, since 1993; Treasurer and Principal Financial and Accounting Officer, eleven registered investment companies for which NB Management acts as investment manager and administrator (ten since 2005 and one since 2006); formerly, Assistant Treasurer, eleven registered investment companies for which NB Management acts as investment manager and administrator, 2002 to 2005. | |
|
| Andrew Provencher (1965) | | Vice President since 2008 | | Managing Director, NB Management, since 2008; Managing Director, Neuberger Berman, since 2005; formerly, Senior Vice President, Neuberger Berman, 2003 to 2005; formerly, Vice President, Neuberger Berman, 1999 to 2003; Vice President, eleven registered investment companies for which NB Management acts as investment manager and administrator (eleven since 2008). | |
|
| Frank Rosato (1971) | | Assistant Treasurer since 2005 | | Vice President, Neuberger Berman, since 2006; Employee, NB Management, since 1995; Assistant Treasurer, eleven registered investment companies for which NB Management acts as investment manager and administrator (ten since 2005 and one since 2006). | |
|
| Neil S. Siegel (1967) | | Vice President since 2008 | | Managing Director, NB Management, since 2008; Managing Director, Neuberger Berman, since 2006; formerly, Senior Vice President, Neuberger Berman, 2004 to 2006; Vice President, eleven registered investment companies for which NB Management acts as investment manager and administrator (eleven since 2008); formerly, Head of Institutional Marketing, Morgan Stanley Investment Management, 1993 to 2004. | |
|
30
Name, (Year of Birth),
and Address(1) | | Position and
Length of Time
Served(2) | | Principal Occupation(s)(3) | |
| Chamaine Williams (1971) | | Chief Compliance Officer since 2005 | | Senior Vice President, Neuberger Berman, since 2007; Chief Compliance Officer, NB Management, since 2006; Senior Vice President, Lehman Brothers Inc., since 2007; formerly, Vice President, Lehman Brothers Inc., 2003 to 2006; Chief Compliance Officer, eleven registered investment companies for which NB Management acts as investment manager and administrator (ten since 2005 and one since 2006); formerly, Chief Compliance Officer, Lehman Brothers Asset Management Inc., 2003 to 2007; formerly, Chief Compliance Officer, Lehman Brothers Alternative Investment Management LLC, 2003 to 2007; formerly, Vice President, UBS Global Asset Management (US) Inc. (formerly, Mitchell Hutchins Asset Management, a wholly-owned subsidiary of PaineWebber Inc.), 1997 to 2003. | |
|
(1) The business address of each listed person is 605 Third Avenue, New York, New York 10158.
(2) Pursuant to the By-Laws of the Trust, each officer elected by the Fund Trustees shall hold office until his or her successor shall have been elected and qualified or until his or her earlier death, inability to serve, or resignation. Officers serve at the pleasure of the Fund Trustees and may be removed at any time with or without cause.
(3) Except as otherwise indicated, each individual has held the positions shown for at least the last five years.
31
Proxy Voting Policies and Procedures
A description of the policies and procedures that the Trust uses to determine how to vote proxies relating to portfolio securities is available, without charge, by calling 1-800-877-9700 (toll-free) and on the website of the Securities and Exchange Commission, at www.sec.gov. Information regarding how the Trust voted proxies relating to portfolio securities during the most recent 12-month period ended June 30 is also available, without charge, by calling 1-800-877-9700 (toll-free), on the website of the Securities and Exchange Commission at www.sec.gov, and on Management's website at www.nb.com.
Quarterly Portfolio Schedule
The Trust files a complete schedule of portfolio holdings for the Fund with the Securities and Exchange Commission for the first and third quarters of each fiscal year on Form N-Q. The Trust's Forms N-Q are available on the Securities and Exchange Commission's website at www.sec.gov and may be reviewed and copied at the Securities and Exchange Commission's Public Reference Room in Washington, DC. Information on the operation of the Public Reference Room may be obtained by calling 1-800-SEC-0330. The information on Form N-Q is available upon request, without charge, by calling 1-800-877-9700 (toll free).
Notice to Shareholders (Unaudited)
The Fund has elected to pass through to its shareholders the credits for taxes paid to foreign countries. For the fiscal year ended December 31, 2008, the Fund designates $1,397,782, or $0.04 per share outstanding, foreign taxes paid and $20,233,483, or $0.60 per share outstanding, foreign source income earned for Federal income tax purposes.
Board Consideration of the Management and Sub-Advisory Agreements
At a meeting held on September 25, 2008, the Board of Trustees of Neuberger Berman Advisers Management Trust ("Board"), including the Trustees who are not "interested persons" of Neuberger Berman Management LLC ("Management") or Neuberger Berman Advisers Management Trust ("Independent Fund Trustees"), approved the continuance of the Management and Sub-Advisory Agreements ("Agreements") between Management and International Portfolio ("Fund").
In evaluating the Agreements, the Board, including the Independent Fund Trustees, reviewed materials furnished by Management and Neuberger Berman, LLC ("Neuberger") in response to questions submitted by counsel to the Independent Fund Trustees, and met with senior representatives of Management and Neuberger regarding their personnel and operations. The Independent Fund Trustees were advised by counsel that is experienced in Investment Company Act of 1940 matters and that is independent of Management and Neuberger. The Independent Fund Trustees received a memorandum from independent counsel discussing the legal standards for their consideration of the proposed continuance of the Agreements. They met with such counsel separately from representatives of Management to discuss the annual contract review. The annual contract review extends over two regular meetings of the Board to ensure that Management and Neuberger have time to respond to any questions the Independent Fund Trustees may have on their initial review of the report and that the Independent Fund Trustees have time to consider those responses. In addition, during this process, the Board held a separate meeting devoted primarily to reviewing and discussing Fund performance.
The Board considered the following factors, among others, in connection with its approval of the continuance of the Agreements: (1) the nature, extent, and quality of the services provided by Management and Neuberger; (2) the performance of the Fund compared to a relevant market index and a peer group of investment companies; (3) the costs of the services provided and profits or losses realized by Management and its affiliates from their relationship with the Fund; (4) the extent to which economies of scale might be realized as the Fund grows; and (5) whether fee levels reflect any such potential economies of scale for the benefit of investors in the Fund. In their deliberations, the Board members did not
32
identify any particular information that was all-important or controlling, and each Trustee may have attributed different weights to the various factors.
The Board considered the continued integrity of Management and Neuberger as organizations, despite the bankruptcy filing by Lehman Brothers Holdings Inc. The Board discussed the efforts made by Management and Neuberger to retain employees, and the reported likelihood that such employees would be retained. The Board discussed the provisions that were being made for ancillary services by Management, Neuberger and their affiliates.
The Board evaluated the terms of the Agreements, the overall fairness of the Agreements to the Fund and whether the Agreements were in the best interests of the Fund and its shareholders.
With respect to the nature, extent and quality of the services provided, the Board considered the performance of the Fund and the experience and staffing of the portfolio management and investment research personnel who perform services for the Fund. The Board noted that Management also provides certain administrative services, including fund accounting and compliance oversight. The Board also considered Management's and Neuberger's policies and practices regarding brokerage. The Board considered the quality of brokerage execution obtained by Management. The Board's Portfolio Transactions and Pricing Committee from time to time reviewed the quality of the brokerage services that Neuberger and Lehman Brothers Inc. had provided, and periodically reviews studies by an independent firm engaged to review and evaluate the quality of brokerage execution received by the Fund. The Board also reviewed whether Management and Neuberger used brokers to execute Fund transactions that provide research and other services to Management and Neuberger, and the types of benefits potentially derived from such services by Management, Neuberger, the Fund and other clients of Management and Neuberger. In addition, the Board noted the positive compliance history of Management and Neuberger, as each firm has been free of significant compliance problems.
The Board considered the performance of the Fund relative to its benchmark and a peer group of investment companies dedicated to insurance products pursuing broadly similar strategies. The Board also considered performance in relation to the degree of risk undertaken by the portfolio managers. The Board discussed the Fund's performance with Management and discussed steps that Management had taken, or intended to take, to improve the Fund's performance. The Board also considered Management's resources and responsiveness with respect to the Fund.
With respect to the overall fairness of the Agreements, the Board considered the fee structure for the Fund under the Agreements as compared to a peer group of comparable funds dedicated to insurance products and any fall-out benefits likely to accrue to Management or Neuberger or their affiliates from their relationship with the Fund. The Board also considered the profitability of Management and its affiliates from their association with the Fund.
The Board reviewed a comparison of the Fund's management fee and overall expense ratio to a peer group of broadly comparable funds dedicated to insurance products. The Board considered the mean and median of the management fees and expense ratios of the peer group. The Board noted that the Fund's management fee was higher than the peer group mean and median. The Board considered whether specific portfolio management or administration needs contributed to the higher fee. With regard to the sub-advisory fee paid to Neuberger, the Board noted that this fee is "at cost." In addition, the Board considered the contractual and voluntary limits on Fund expenses undertaken by Management for the Fund. The Board noted that Management incurred a loss on the Fund in 2005.
The Board considered whether there were other funds that were advised or sub-advised by Management or its affiliates or separate accounts managed by Management or its affiliates with similar investment objectives, policies and strategies to the Fund. The Board compared the fees charged to the Fund at various asset levels to the fees charged to advised funds, a sub-advised fund and a separate account, each managed in a similar style to the Fund. The Board considered the appropriateness and reasonableness of any differences between the fees charged to the Fund and the other funds and account and determined that the differences in fees were consistent with the management and other services provided.
The Board also evaluated any apparent or anticipated economies of scale in relation to the services Management provides to the Fund. The Board considered that the Fund's fee structure which provides for a reduction of payments resulting from the use of breakpoints and whether those breakpoints are set at appropriate asset levels.
33
In concluding that the benefits accruing to Management and its affiliates by virtue of their relationship to the Fund were reasonable in comparison with the costs of providing the investment advisory services and the benefits accruing to the Fund, the Board reviewed specific data as to Management's profit or loss on the Fund since the Fund's inception. The Board also carefully examined Management's cost allocation methodology and in recent years had an independent consultant review the methodology. It also reviewed an analysis from an independent data service on profitability margins in the investment management industry. The Board recognized that Management should be entitled to earn a reasonable level of profits for services it provides to the Fund and, based on its review, concluded that Management's level of profitability was not excessive.
Conclusions
In approving the Agreements, the Board concluded that the terms of each Agreement are fair and reasonable and that approval of the Agreements is in the best interests of the Fund and its shareholders. In reaching this determination, the Board considered that Management and Neuberger could be expected to provide a high level of service to the Fund; that it retained confidence in Management's and Neuberger's capabilities to manage the Fund; that the Fund's fee structure appeared to the Board to be reasonable given the nature and quality of services provided; and that the benefits accruing to Management and its affiliates by virtue of their relationship to the Fund were reasonable in comparison with the benefits accruing to the Fund.
Board Consideration of New and Interim Management and Sub-Advisory Agreements
Lehman Brothers Holdings Inc. ("Lehman Brothers") has entered into an agreement to sell a controlling interest in the Fund's investment adviser. Under the agreement, Lehman Brothers would sell substantially all of the Neuberger Berman business and the fixed income business and certain alternative asset management businesses of Lehman Brother's Investment Management Division (collectively, the "Acquired Businesses") to NBSH Acquisition, LLC (the "Proposed Acquisition"). NBSH Acquisition, LLC ("NBSH") was organized by key members of Neuberger Berman's management for the purpose of facilitating the acquisition of the Acquired Businesses. At the closing of the Proposed Acquisition, a majority interest in the Acquired Businesses will be directly or indirectly owned by portfolio managers, Neuberger Berman's management team and certain key members and senior professionals of the former Investment Management Division ("Management Members"), as well as by Lehman Brothers and certain affiliates of Lehman Brothers.
The Acquired Businesses include Neuberger Berman Management LLC ("Management") and Neuberger Berman, LLC ("Neuberger"), the adviser and sub-adviser to the Fund, respectively. The Proposed Acquisition has been deemed to result in an "assignment" of the Fund's existing Management Agreement and Sub-Advisory Agreement (the "Existing Agreements") under the 1940 Act. As required by the 1940 Act, the Fund's Existing Agreements provide for their automatic termination in the event of an assignment, and each will terminate upon the consummation of the Proposed Acquisition. Accordingly, on December 17, 2008, the Board approved new Management and Sub-Advisory Agreements with Management and Neuberger, respectively, or their successors (together, the "Advisers"), on the same terms and with the same compensation structure as are currently in effect (together, "New Agreements"), which would take effect upon consummation of the Proposed Acquisition if approved by the Fund's shareholders.
If shareholders of the Fund do not approve the New Agreements before the Proposed Acquisition is completed, the Board has approved interim Management and Sub-Advisory Agreements with Management and Neuberger, respectively, or their successors (together, "Interim Agreements") pending approval of the New Agreements by shareholders of the Fund. Compensation earned by the Advisers under the Interim Agreements would be held in an interest-bearing escrow account pending shareholder approval of the New Agreements. If shareholders approve the New Agreements within 150 days from the termination of the Existing Agreements, the amount held in the escrow account, including interest, will be paid to the Advisers, as appropriate. If shareholders of the Fund do not approve the New Agreements, the Advisers will be paid the lesser of the costs incurred in performing their services under the Interim Agreements or the total amount in the escrow account, including interest earned. If at the end of 150 days following termination of a Fund's Existing Agreements the Fund's shareholders still have not approved the New Agreements, the Trustees would take such actions as they deem to be
34
in the best interests of the Fund and its shareholders, which may include negotiating a new Management Agreement and/or new Sub-Advisory Agreement with an advisory organization selected by the Board of Trustees or making other arrangements.
The Trustees of the Trust discussed the Proposed Acquisition on December 17, 2008. Prior to submitting its bid to public auction, Management met telephonically with the Independent Trustees to brief them on the Proposed Acquisition. Following the public auction wherein NBSH was determined to be the successful bidder, the Independent Trustees again met telephonically with Management to obtain additional information about the Proposed Acquisition. The Independent Trustees, with the assistance of independent counsel, prepared due diligence requests that were presented to Management and appointed a Task Force of Independent Trustees to lead the due diligence effort ("Task Force").
Management provided written responses to the due diligence requests. After extensive review and analysis and discussions during a telephonic and in person meeting of the Independent Trustees, the Task Force submitted clarifying questions. The Independent Trustees met as a body in person to receive the report of the Task Force and consider the New Agreements. Throughout the process, the Task Force and the Independent Trustees were advised by experienced 1940 Act counsel that is independent of Management and NBSH. In addition, the Independent Trustees received a memorandum from independent counsel discussing the legal standards for their consideration of the New Agreements.
Consideration of the New Agreements followed shortly on the heels of the Independent Trustees' annual consideration of whether to renew the Existing Agreements, carried out pursuant to Section 15(c) of the 1940 Act. In that process, which began prior to the June 2008 quarterly meeting of the Board and was concluded at the September 2008 quarterly meeting, the Independent Trustees, following an extensive review of materials submitted by Management and a report from an independent data service, unanimously determined that the Existing Agreements were fair and reasonable and that their renewal would be in the best interests of the Fund and its shareholders. Accordingly, in considering the New Agreements, the Independent Trustees took into account the fact that the terms of the New Agreements would be identical to those of the Existing Agreements in every respect except for the term and termination date and potentially the name of the investment adviser. The Board considerations in connection with the New Agreements and the Existing Agreements also entered into the decision by the Board to approve the Interim Agreements, which would take effect if the shareholders of the Fund do not approve the New Agreements before the Proposed Acquisition is completed. The Independent Trustees' consideration of the Existing Agreements is described above.
In evaluating the proposed New Agreements, the Independent Trustees considered that they have generally been satisfied with the nature and quality of the services provided to the Fund by Management and Neuberger, including investment advisory, administrative and support services, and that the Fund would be best served by an arrangement that appeared likely to maintain the continuity and stability of the providers of these services. Accordingly, the Independent Trustees considered very carefully the intentions of NBSH (including its successors or assign) regarding capitalization, management structure, staffing, compensation and staff retention and whether these seemed designed to provide the desired continuity and stability. They inquired specifically about staffing and resources in the areas of portfolio management, investment research, trading, fund accounting, legal and compliance, internal audit, and senior executive staff. Although at the time the Board considered the New Agreements no final decisions had been reached as to the distribution of equity interests in NBSH (or its successor or assign), the Trustees were advised that senior members of management, including the Fund Trustee and nominee for Fund Trustee who are employed by the Advisers, would receive equity interests in NBSH. Because of these interests, as well as any future employment arrangements with the Advisers, these persons, individually or in the aggregate, could have a material interest in the Proposed Acquisition and in shareholder approval of the New Agreements. In considering the New Agreements, the Trustees were aware of these interests.
The Independent Trustees inquired whether NBSH (or its successors or assign) had specific plans for the future structure of the Neuberger Berman Funds, whether they plan to propose to eliminate any Funds, and whether they intend to continue or alter certain expansion plans that are already underway. They also inquired whether there are plans to change the fees or expense structure of any of the Funds. The Independent Trustees inquired about the long-term plans for the Advisers, including any expectations for cost savings or expense reductions. They also inquired about the capital structure and working capital likely to be available to NBSH (or its successors or assign).
35
The Independent Trustees considered the following factors, in addition to the factors discussed above, among others, in connection with their consideration of the New Agreements: (1) the nature, extent, and quality of the services provided by Management and Neuberger; (2) the performance of the Fund compared to a relevant market index and a peer group of investment companies; (3) the costs of the services provided and profits or losses realized by Management and its affiliates from their relationship with the Fund; (4) the extent to which economies of scale might be realized as the Fund grows; and (5) whether fee levels reflect any such potential economies of scale for the benefit of investors in the Fund. In their deliberations, the Independent Trustees did not identify any particular information that was all important or controlling, and each Trustee may have attributed different weights to the various factors.
In unanimously approving and recommending the New Agreements, the Independent Trustees concluded that the terms of each New Agreement are fair and reasonable and that approval of the New Agreements is in the best interests of the Fund and its shareholders. In reaching this determination, the Independent Trustees considered the following factors, among others:
(1) that the terms of the New Agreements are identical in all material respects to those of the Existing Agreements;
(2) that the Advisers will maintain operational autonomy and continuity of management following the Proposed Acquisition;
(3) the favorable history, reputation, qualification, and background of Management and Neuberger, as well as the qualifications of each entity's personnel and each entity's respective financial condition;
(4) the commitment of NBSH (or its successors or assign) to retain key personnel currently employed by Management and Neuberger who currently provide services to the Fund;
(5) the commitment of NBSH (or its successors or assign) to maintaining the current level and quality of Fund services;
(6) the proposed division of equity in NBSH (or its successor or assign) among Management Members and other personnel upon consummation of the Proposed Acquisition;
(7) the fees and expense ratio of the Fund relative to comparable mutual funds;
(8) that the fees are identical to those paid under the Existing Agreements;
(9) that the fees and expense ratios of the Fund appear to the Board to be reasonable given the quality of services expected to be provided;
(10) the commitment of Management to: (a) maintaining the Fund's current contractual expense limitation agreements to ensure that Fund shareholders of funds that have such arrangements in place do not face an increase in expenses upon consummation of the Proposed Acquisition; and (b) not change any voluntary expense limitation or waiver so as to increase the expenses the Fund would pay without the prior approval of the Board;
(11) the performance of the Fund relative to comparable mutual funds and unmanaged indices;
(12) the commitment of Management (or its successor) to pay the expenses of the Fund in connection with the Proposed Acquisition, including all expenses in connection with the solicitation of proxies, so that shareholders of the Fund would not have to bear such expenses;
(13) the actual and potential effects on the Advisers of the bankruptcy of Lehman Brothers, and the effects of the Lehman Brothers bankruptcy on the information considered by the Independent Trustees in their prior analyses of the principal service contracts;
(14) the provisions made to continue providing to the Advisers certain services that were previously provided to them by or through Lehman Brothers or its other affiliates;
(15) the possible benefits that may be realized by the Fund and by the Advisers as a result of the Proposed Acquisition; and
(16) that the Proposed Acquisition is expected to maintain continuity of management of the Fund and may reduce the potential for future vulnerability to changes in control of the Advisers that could be adverse to the Fund's interests and that could affect the retention of key employees providing services to the Fund.
36
Neuberger Berman
Advisers Management Trust
Mid-Cap Growth Portfolio
I Class Shares
S Class Shares
Annual Report
December 31, 2008
B1013 02/09
Mid-Cap Growth Portfolio Manager's Commentary
In 2008, one of the most difficult years on record for the equity markets, the Neuberger Berman Advisers Management Trust (AMT) Mid-Cap Growth Portfolio outperformed its benchmark, the Russell Midcap(R) Growth Index, but posted a negative return.
The past year was characterized by tremendous rotation - among the sectors, capitalization ranges and fundamental characteristics of the stocks that moved in and out of favor. For the full year, other than micro-caps, mid-cap stocks were the poorest performers by market capitalization. Growth stocks underperformed value stocks for the year and, within growth, the types of stocks we favor - the higher quality, highest growth rate names - were out of favor. While we are pleased to have outperformed our benchmark, this factor in particular was a headwind for the Portfolio.
Sectors that were most positive for the Portfolio's relative performance in 2008 included Industrials, Materials and Energy. Avoiding Utilities also benefited the Portfolio versus the benchmark.
Within Industrials, C.H. Robinson Worldwide, a trucking firm, performed well on continued strong margins despite a slowing economy. We also continue to hold names like Stericycle, AMETEK, Danaher and Fastenal, which although contributors to relative performance did not perform as well. In our opinion, these are high quality names with good earnings potential and cash flows, and self-sustaining business models. We think these factors are competitive advantages, and that such companies will be particularly well positioned as the economy begins to turn around.
Within Materials, strong stock selection was a benefit. We own companies like Airgas and Ecolab, which, like our Industrials holdings, we consider to be very high quality names with good earnings potential and cash flows.
Although Energy was one of the worst performing market sectors for the year, our Energy holdings outperformed sector constituents. Concho and Continental Resources were among our top performers, as oil and gas stocks with good earnings visibility have continued to do fairly well even as commodities prices have dropped. Services companies, such as Smith International (among our poorest performers) did not fare as well in the sector, as their margins began to erode as oil prices deteriorated.
Sectors that negatively impacted performance included Financials, Health Care and Telecommunication Services.
In Financials, especially within banking, changes over the past year have meant that there are now fewer stocks to choose from within the mid-cap market. Many companies are either too small or have been acquired by companies that are too large. Within Financials, our focus has been on asset management. We prefer asset managers to banks or brokerage companies in the current climate. Stocks we own include companies like Blackrock, a relatively new addition to the Portfolio, and our longer-term holding, Lazard Ltd.
Within Health Care, one of our themes is medical diagnostics, with holdings such as Myriad Genetics continuing to do well. Intuitive Surgical, on the other hand, a robotic surgery equipment firm, performed poorly. This stock suffered as economic pressures limited hospitals' ability to purchase equipment. However, we believe that the stock is positioned to perform well as the economic environment improves.
Telecommunication Services holdings hurt the Portfolio during 2008; however, we continue to believe in the companies we own. Names like SBA Communications, a cell tower company, and NII Holdings, a wireless provider, were among our weakest performers. These companies underperformed due to concerns about financing needs. However, we believe that their needs are distant enough that current credit illiquidity will not be an issue, and that such well-run businesses will have access to credit.
As we move into 2009, we are selectively shifting the Portfolio away from last year's defensive stance and beginning to position the Portfolio for a more constructive market environment. As such, within Consumer Discretionary, we may move some focus away from our successful secondary education theme - with strong performers like Strayer Education and DeVry - - in favor of the more aggressive Gaming, Lodging and Retail sectors. We may also add to Telecommunications as
1
well. Within Information Technology, where our focus was primarily defensive during the year, we plan to add beta through areas that tend to move with the market, such as semiconductors.
Despite performance runs we have seen in lower quality stocks, we continue to believe that, longer term, stock selection will be highly important and that the market will reward companies that possess strong fundamentals and quality growth characteristics. The companies that meet our fundamental criteria generally have strong balance sheets in that they possess good cash flow characteristics and are underleveraged and, therefore, do not have to go to the market for financing - - which should benefit them on a competitive basis longer term. We continue to monitor credit spreads for indications that the various rescue packages are beginning to positively influence the economic situation. We are also looking for indications that the stimulus packages are beginning to positively impact the consumer, creating jobs, spurring consumer spending and, finally, restoring consumer confidence. As we see these developments, we intend to move the Portfolio from its current relatively defensive positioning.
Sincerely,

Kenneth J. Turek
Portfolio Manager
2
Mid-Cap Growth Portfolio
SECTOR ALLOCATION
| (% of Equity Market Value) | |
| Energy | | | 7.1 | % | |
| Materials | | | 4.9 | | |
| Industrials | | | 19.4 | | |
| Consumer Discretionary | | | 13.3 | | |
| Consumer Staples | | | 5.7 | | |
| Health Care | | | 18.4 | | |
| Financials | | | 6.6 | | |
| Information Technology | | | 20.1 | | |
| Telecomm Service | | | 4.5 | | |
| Total | | | 100.0 | % | |
AVERAGE ANNUAL TOTAL RETURN1
| | | Inception
Date | | 1 Year | | 5 Year | | 10 Year | | Life of
Fund* | |
| Mid-Cap Growth Portfolio Class I | | 11/03/97 | | | (43.37 | %) | | | 1.04 | % | | | 0.22 | % | | | 4.69 | % | |
| Mid-Cap Growth Portfolio Class S2 | | 02/18/03 | | | (43.51 | %) | | | 0.79 | % | | | 0.07 | % | | | 4.55 | % | |
| Russell Midcap(R) Growth3 | | | | | (44.32 | %) | | | (2.33 | %) | | | (0.19 | %) | | | 1.53 | % | |
| Russell Midcap(R) | | | | | (41.46 | %) | | | (0.71 | %) | | | 3.18 | % | | | 4.21 | % | |
Performance data quoted represent past performance, which is no guarantee of future results. The investment return and principal value of an investment will fluctuate so that an investor's shares, when redeemed may be worth more or less than their original cost. Results are shown on a "total return" basis and include reinvestment of all dividends and capital gain distributions.
Current performance may be lower or higher than the performance data quoted. For performance data current to the most recent month end, please visit https://www.nb.com.
* Index returns are as of the inception date 11/03/97.
As stated in the Portfolio's most recent prospectus, the total annual fund operating expense ratio for fiscal year 2007 was 0.89% and 1.14% for Class I and Class S shares, respectively (prior to any fee waivers or expense reimbursements). Neuberger Berman Management LLC has contractually agreed to limit certain expenses of the Portfolio through 12/31/2011.
COMPARISON OF A $10,000 INVESTMENT
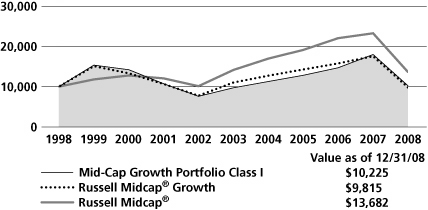
The chart shows the value of a hypothetical $10,000 investment in the Portfolio over the past 10 fiscal years, or since the Portfolio's inception, if it has not operated for 10 years. The graphs are based on Class I shares only; performance of other classes will vary due to differences in fee structures (see Average Annual Total Return chart above). The result is compared with benchmarks, which may include a broad-based market index and/or a narrower index. Please note that market indexes do not include expenses. All results include the reinvestment of dividends and capital gain distributions. Results represent past performance and do not indicate future results. The chart and table do not reflect the deduction of taxes that a shareholder would pay on Portfolio distributions or the redemption of Portfolio shares.
Please see Endnotes for additional information.
3
Endnotes
1 "Total Return" includes reinvestment of all income dividends and capital gain distributions. Results represent past performance and do not indicate future results. The value of an investment in the Portfolio and the return on the investment both will fluctuate, and redemption process may be higher or lower than an investor's original cost. The performance information does not reflect fees and expenses of the variable annuity and variable life insurance policies or the pension plans whose proceeds are invested in the AMT Mid-Cap Growth Portfolio. Neuberger Berman Management LLC ("NBM LLC") has agreed to absorb certain expenses of the AMT Portfolios, including the Portfolio. Without this arrangement, which is subject to change, the total returns of the Portfolio may have been less.
2 Performance shown prior to February 18, 2003 for the Class S shares is of the Class I shares, which has lower expenses and correspondingly higher returns than the Class S shares.
3 The Russell Midcap(R) Growth Index measures the performance of those Russell Midcap(R) Index companies with higher price-to-book ratios and higher forecasted growth values. The Russell Midcap Index measures the performance of the 800 smallest companies in the Russell 1000(R) Index, which represents approximately 31% of the total market capitalization of the Russell 1000 Index (which, in turn, consists of the 1,000 largest U.S. companies, based on market capitalization). Please note that indices do not take into account any fees and expenses of investing in the individual securities that they track and that individuals cannot invest directly in any index. Data about the performance of these indices are prepared or obtained by NBM LLC and include reinvestment of all dividends and capital gain distributions. The Portfolio may invest in many securities not included in the above-described indices.
Any ratios or other measurements using a factor of forecasted earnings of a company discussed herein are based on consensus estimates, not NBM LLC's own projections, and they may or may not be realized. In addition, any revision to a forecast could affect the market price of a security. By quoting them herein, NBM LLC does not offer an opinion as to the accuracy of and does not guarantee these forecasted numbers.
The investments for the Portfolio are managed by the same portfolio manager(s) who manage one or more other mutual funds that have similar names, investment objectives and investment styles as the Portfolio. You should be aware that the Portfolio is likely to differ from the other mutual funds in size, cash flow pattern and tax matters. Accordingly, the holdings and performance of the Portfolio can be expected to vary from those of the other mutual funds.
The composition, industries and holdings of the Portfolio are subject to change.
Shares of the separate AMT Portfolios are sold only through the currently effective prospectus and are not available to the general public. Shares of this Portfolio may be purchased only by life insurance companies to be used with their separate accounts that fund variable annuity and variable life insurance policies and by qualified pension and retirement plans.
(c) 2009 Neuberger Berman Management LLC distributor. All rights reserved.
4
Information About Your Fund's Expenses
This table is designed to provide information regarding costs related to your investments. All mutual funds incur operating expenses, which include management fees, fees for administrative services and costs of shareholder reports, among others. The following examples are based on an investment of $1,000 made at the beginning of the six month period ended December 31, 2008 and held for the entire period. The table illustrates the fund's costs in two ways:
| Actual Expenses and Performance: | | The first section of the table provides information about actual account values and actual expenses in dollars, based on the fund's actual performance during the period. You may use the information in this line, together with the amount you invested, to estimate the expenses you paid over the period. Simply divide your account value by $1,000 (for example, an $8,600 account value divided by $1,000 = 8.6), then multiply the result by the number in the first section of the table under the heading entitled "Expenses Paid During the Period" to estimate the expenses you paid over the period. | |
|
Hypothetical Example for
Comparison Purposes: | | The second section of the table provides information about hypothetical account values and hypothetical expenses based on the fund's actual expense ratio and an assumed rate of return at 5% per year before expenses. This return is not the fund's actual return. The hypothetical account values and expenses may not be used to estimate the actual ending account balance or expenses you paid for the period. You may use this information to compare the ongoing costs of investing in this fund versus other funds. To do so, compare the expenses shown in this 5% hypothetical example with the 5% hypothetical examples that appear in the shareholder reports of other funds. | |
|
Please note that the expenses in the table are meant to highlight your ongoing costs only. The table and expense example do not include any transactional costs, such as fees and expenses that are, or may be, imposed under your variable contract or qualified pension plan. Therefore, the information under the heading "Hypothetical (5% annual return before expenses)" is useful in comparing ongoing costs only, and will not help you determine the relative total costs of owning different funds. In addition, if these transactional costs were included, your costs would have been higher.
Expense Information as of 12/31/08 (Unaudited)
NEUBERGER BERMAN ADVISERS MANAGEMENT TRUST MID-CAP GROWTH PORTFOLIO
| Actual | | Beginning Account
Value
7/1/08 | | Ending Account
Value
12/31/08 | | Expenses Paid
During the Period*
7/1/08 - 12/31/08 | | Expense
Ratio | |
| Class I | | $ | 1,000.00 | | | $ | 641.50 | | | $ | 3.92 | | | | .95 | % | |
| Class S | | $ | 1,000.00 | | | $ | 640.50 | | | $ | 4.99 | | | | 1.21 | % | |
| Hypothetical (5% annual return before expenses)** | |
| Class I | | $ | 1,000.00 | | | $ | 1,020.36 | | | $ | 4.82 | | | | .95 | % | |
| Class S | | $ | 1,000.00 | | | $ | 1,019.05 | | | $ | 6.14 | | | | 1.21 | % | |
* For each class of the fund, expenses are equal to the annualized expense ratio for the class, multiplied by the average account value over the period, multiplied by 184/366 (to reflect the one-half year period shown).
** Hypothetical 5% annual return before expenses is calculated by multiplying the number of days in the most recent half year divided by 366.
5
Schedule of Investments Mid-Cap Growth Portfolio
| NUMBER OF SHARES | | | | MARKET VALUEt | |
| Common Stocks (98.9%) | | | |
| Aerospace & Defense (1.0%) | | | |
| | 63,900 | | | Precision Castparts | | $ | 3,800,772 | | |
| Air Freight & Logistics (2.9%) | | | |
| | 128,200 | | | C.H. Robinson Worldwide | | | 7,054,846 | E | |
| | 117,600 | | | Expeditors International | | | 3,912,552 | E | |
| | | | 10,967,398 | | |
| Beverages (0.3%) | | | |
| | 52,500 | | | Central European Distribution | | | 1,034,250 | *E | |
| Biotechnology (4.5%) | | | |
| | 70,000 | | | Alexion Pharmaceuticals | | | 2,533,300 | *E | |
| | 50,000 | | | Cephalon, Inc. | | | 3,852,000 | *E | |
| | 107,500 | | | Myriad Genetics | | | 7,122,950 | *E | |
| | 30,000 | | | United Therapeutics | | | 1,876,500 | *E | |
| | 69,100 | | | Vertex Pharmaceuticals | | | 2,099,258 | *E | |
| | | | 17,484,008 | | |
| Capital Markets (3.6%) | | | |
| | 25,000 | | | BlackRock, Inc. | | | 3,353,750 | E | |
| | 197,800 | | | Lazard Ltd. | | | 5,882,572 | | |
| | 90,000 | | | Northern Trust | | | 4,692,600 | E | |
| | | | 13,928,922 | | |
| Chemicals (3.5%) | | | |
| | 165,200 | | | Airgas, Inc. | | | 6,441,148 | E | |
| | 197,800 | | | Ecolab Inc. | | | 6,952,670 | E | |
| | | | 13,393,818 | | |
| Commercial Services & Supplies (7.6%) | | | |
| | 45,000 | | | Clean Harbors | | | 2,854,800 | *E | |
| | 50,000 | | | Copart, Inc. | | | 1,359,500 | *E | |
| | 230,000 | | | Corrections Corporation
of America | | | 3,762,800 | * | |
| | 187,300 | | | Covanta Holding | | | 4,113,108 | * | |
| | 264,100 | | | Iron Mountain | | | 6,531,193 | *E | |
| | 153,600 | | | Stericycle, Inc. | | | 7,999,488 | *E | |
| | 84,000 | | | Waste Connections | | | 2,651,880 | *E | |
| | | | 29,272,769 | | |
| Communications Equipment (2.4%) | | | |
| | 145,000 | | | Harris Corp. | | | 5,517,250 | E | |
| | 219,400 | | | Juniper Networks | | | 3,841,694 | *E | |
| | | | 9,358,944 | | |
| Construction & Engineering (1.2%) | | | |
| | 97,500 | | | Jacobs Engineering Group | | | 4,689,750 | *E | |
| NUMBER OF SHARES | | | | MARKET VALUEt | |
| Construction Materials (0.3%) | | | |
| | 12,500 | | | Martin Marietta Materials | | $ | 1,213,500 | E | |
| Containers & Packaging (0.6%) | | | |
| | 90,000 | | | Pactiv Corp. | | | 2,239,200 | * | |
| Diversified Consumer Services (5.2%) | | | |
| | 50,500 | | | American Public Education | | | 1,878,095 | * | |
| | 157,500 | | | DeVry, Inc. | | | 9,042,075 | E | |
| | 42,000 | | | Strayer Education | | | 9,005,220 | E | |
| | | | 19,925,390 | | |
| Diversified Financial Services (1.3%) | | | |
| | 40,000 | | | IntercontinentalExchange Inc. | | | 3,297,600 | *E | |
| | 70,500 | | | Nasdaq OMX Group | | | 1,742,055 | *E | |
| | | | 5,039,655 | | |
| Electrical Equipment (1.2%) | | | |
| | 153,600 | | | AMETEK, Inc. | | | 4,640,256 | | |
Electronic Equipment, Instruments &
Components (5.8%) | | | |
| | 196,900 | | | Dolby Laboratories | | | 6,450,444 | *E | |
| | 160,000 | | | FLIR Systems | | | 4,908,800 | *E | |
| | 49,900 | | | Itron, Inc. | | | 3,180,626 | *E | |
| | 21,600 | | | Mettler-Toledo International | | | 1,455,840 | *E | |
| | 80,000 | | | National Instruments | | | 1,948,800 | E | |
| | 205,000 | | | Trimble Navigation | | | 4,430,050 | * | |
| | | | 22,374,560 | | |
| Energy Equipment & Services (2.6%) | | | |
| | 94,100 | | | CARBO Ceramics | | | 3,343,373 | | |
| | 37,000 | | | Core Laboratories N.V. | | | 2,214,820 | | |
| | 115,200 | | | IHS Inc. | | | 4,310,784 | * | |
| | | | 9,868,977 | | |
| Food & Staples Retailing (2.6%) | | | |
| | 83,100 | | | BJ's Wholesale Club | | | 2,847,006 | * | |
| | 180,100 | | | Shoppers Drug Mart | | | 7,009,967 | | |
| | | | 9,856,973 | | |
| Food Products (1.5%) | | | |
| | 96,000 | | | Ralcorp Holdings | | | 5,606,400 | *E | |
| Health Care Equipment & Supplies (7.5%) | | | |
| | 70,000 | | | C.R. Bard | | | 5,898,200 | E | |
| | 121,500 | | | Gen-Probe | | | 5,205,060 | *E | |
| | 85,500 | | | IDEXX Laboratories | | | 3,084,840 | * | |
| | 34,100 | | | Intuitive Surgical | | | 4,330,359 | *E | |
| | 105,600 | | | Masimo Corp. | | | 3,150,048 | * | |
| | 60,000 | | | NuVasive, Inc. | | | 2,079,000 | * | |
| | 254,500 | | | Wright Medical Group | | | 5,199,435 | *E | |
| | | | 28,946,942 | | |
See Notes to Schedule of Investments 6
| NUMBER OF SHARES | | | | MARKET VALUEt | |
| Health Care Providers & Services (3.6%) | | | |
| | 108,000 | | | Express Scripts | | $ | 5,937,840 | * | |
| | 44,150 | | | HMS Holdings | | | 1,391,608 | * | |
| | 105,000 | | | Psychiatric Solutions | | | 2,924,250 | *E | |
| | 182,500 | | | VCA Antech | | | 3,628,100 | *E | |
| | | | 13,881,798 | | |
| Hotels, Restaurants & Leisure (3.1%) | | | |
| | 140,000 | | | Penn National Gaming | | | 2,993,200 | *E | |
| | 249,700 | | | WMS Industries | | | 6,716,930 | * | |
| | 49,000 | | | Wynn Resorts | | | 2,070,740 | *E | |
| | | | 11,780,870 | | |
| Household Products (0.8%) | | | |
| | 55,000 | | | Church & Dwight | | | 3,086,600 | | |
| Insurance (1.6%) | | | |
| | 67,500 | | | Aon Corp. | | | 3,083,400 | E | |
| | 11,500 | | | Everest Re Group | | | 875,610 | | |
| | 61,500 | | | Fidelity National Financial
Class A | | | 1,091,625 | | |
| | 33,000 | | | W. R. Berkley | | | 1,023,000 | | |
| | | | 6,073,635 | | |
| Internet Software & Services (1.5%) | | | |
| | 56,000 | | | Equinix, Inc. | | | 2,978,640 | *E | |
| | 140,000 | | | VistaPrint Ltd. | | | 2,605,400 | *E | |
| | | | 5,584,040 | | |
| IT Services (4.1%) | | | |
| | 118,000 | | | Alliance Data Systems | | | 5,490,540 | *E | |
| | 230,000 | | | Cognizant Technology
Solutions | | | 4,153,800 | *E | |
| | 16,800 | | | MasterCard, Inc. Class A | | | 2,401,224 | E | |
| | 185,000 | | | SAIC Inc. | | | 3,603,800 | * | |
| | | | 15,649,364 | | |
| Life Science Tools & Services (0.8%) | | | |
| | 115,500 | | | Illumina, Inc. | | | 3,008,775 | *E | |
| Machinery (1.4%) | | | |
| | 98,400 | | | Danaher Corp. | | | 5,570,424 | E | |
| Metals & Mining (0.4%) | | | |
| | 33,500 | | | Agnico-Eagle Mines | | | 1,719,555 | E | |
| Multiline Retail (0.6%) | | | |
| | 60,500 | | | Kohl's Corp. | | | 2,190,100 | *E | |
| Oil, Gas & Consumable Fuels (4.4%) | | | |
| | 201,700 | | | Concho Resources | | | 4,602,794 | *E | |
| | 68,700 | | | Continental Resources | | | 1,422,777 | *E | |
| | 105,000 | | | Range Resources | | | 3,610,950 | E | |
| | 135,000 | | | Southwestern Energy | | | 3,910,950 | * | |
| | 96,000 | | | XTO Energy | | | 3,385,920 | | |
| | | | 16,933,391 | | |
| NUMBER OF SHARES | | | | MARKET VALUEt | |
| Personal Products (0.6%) | | | |
| | 30,000 | | | Chattem, Inc. | | $ | 2,145,900 | *E | |
| Pharmaceuticals (1.7%) | | | |
| | 199,300 | | | Perrigo Co. | | | 6,439,383 | | |
| Professional Services (1.7%) | | | |
| | 89,800 | | | CoStar Group | | | 2,958,012 | *E | |
| | 80,000 | | | FTI Consulting | | | 3,574,400 | *E | |
| | | | 6,532,412 | | |
| Road & Rail (0.9%) | | | |
| | 126,500 | | | J.B. Hunt Transport Services | | | 3,323,155 | E | |
Semiconductors & Semiconductor
Equipment (2.2%) | | | |
| | 70,000 | | | Lam Research | | | 1,489,600 | *E | |
| | 148,800 | | | Microchip Technology | | | 2,906,064 | E | |
| | 150,000 | | | Microsemi Corp. | | | 1,896,000 | * | |
| | 84,500 | | | Silicon Laboratories | | | 2,093,910 | *E | |
| | | | 8,385,574 | | |
| Software (3.8%) | | | |
| | 520,000 | | | Activision Blizzard | | | 4,492,800 | *E | |
| | 188,200 | | | ANSYS, Inc. | | | 5,248,898 | *E | |
| | 83,100 | | | Blackboard Inc. | | | 2,179,713 | * | |
| | 88,500 | | | Salesforce.com, Inc. | | | 2,832,885 | *E | |
| | | | 14,754,296 | | |
| Specialty Retail (4.3%) | | | |
| | 152,200 | | | GameStop Corp. Class A | | | 3,296,652 | *E | |
| | 107,500 | | | Gap Inc. | | | 1,439,425 | E | |
| | 172,800 | | | Ross Stores | | | 5,137,344 | E | |
| | 75,000 | | | Staples, Inc. | | | 1,344,000 | | |
| | 77,500 | | | TJX Cos. | | | 1,594,175 | E | |
| | 259,300 | | | Urban Outfitters | | | 3,884,314 | *E | |
| | | | 16,695,910 | | |
| Trading Companies & Distributors (1.3%) | | | |
| | 139,200 | | | Fastenal Co. | | | 4,851,120 | E | |
| Wireless Telecommunication Services (4.5%) | | | |
| | 203,100 | | | American Tower | | | 5,954,892 | *E | |
| | 75,000 | | | Metropcs Communications | | | 1,113,750 | * | |
| | 245,000 | | | NII Holdings | | | 4,454,100 | *E | |
| | 345,500 | | | SBA Communications | | | 5,638,560 | *E | |
| | | | 17,161,302 | | |
| | Total Common Stocks | | | (Cost $411,002,172) | | | 379,410,088 | | |
See Notes to Schedule of Investments 7
| NUMBER OF SHARES | | | | MARKET VALUEt | |
| Short-Term Investments (36.0%) | |
| | 4,810,992 | | | Neuberger Berman Prime
Money Fund Trust Class | | $ | 4,810,992 | aoo | |
| | 133,436,828 | | | Neuberger Berman
Securities Lending
Quality Fund, LLC | | | 133,436,828 | t | |
| | Total Short-Term Investments
(Cost $138,247,820) | | | 138,247,820 | | |
| | Total Investments (134.9%)
(Cost $549,249,992) | | | 517,657,908## | | |
| | | Liabilities, less cash, receivables
and other assets [(34.9%)] | | | (133,807,243 | ) | |
| | | Total Net Assets (100.0%) | | $ | 383,850,665 | | |
See Notes to Schedule of Investments 8
Notes to Schedule of Investments Mid-Cap Growth Portfolio
t Investments in equity securities by Neuberger Berman Advisers Management Trust Mid-Cap Growth Portfolio (the "Fund") are valued by obtaining valuations from an independent pricing service. The independent pricing service values equity securities at the latest sale price when that price is readily available. Securities traded primarily on the NASDAQ Stock Market are normally valued by the Fund at the NASDAQ Official Closing Price ("NOCP") provided by NASDAQ each business day. The NOCP is the most recently reported price as of 4:00:02 p.m., Eastern time, unless that price is outside the range of the "inside" bid and asked prices (i.e., the bid and asked prices that dealers quote to each other when trading for their own accounts); in that case, NASDAQ will adjust the price to equal the inside bid or asked price, whichever is closer. Because of delays in reporting trades, the NOCP may not be based on the price of the last trade to occur before the market closes. If there is no reported sale of a security on a particular day, the independent pricing service may value the security based on reported market quotations. If a valuation is not available from an independent pricing service, the Fund seeks to obtain quotations from principal market makers. If such quotations are not readily available, securities are valued using methods the Board of Trustees of Neuberger Berman Advisers Management Trust (the "Board") has approved on the belief that they reflect fair value. Numerous factors may be considered when determining the fair value of a security, including available analyst, media or other reports, trading in futures or ADRs and whether the issuer of the security being fair valued has other securities outstanding. Foreign security prices are furnished by independent quotation services and expressed in local currency values. Foreign security prices are currently translated from the local currency into U.S. dollars using the exchange rate as of 4:00 p.m., Eastern time. The Board has approved the use of Interactive Data Pricing and Reference Data, Inc. ("Interactive") to assist in determining the fair value of the Fund's foreign equity securities when changes in the value of a certain index suggest that the closing prices on the foreign exchanges may no longer represent the amount that the Fund could expect to receive for those securities. In this event, Interactive will provide adjusted prices for certain foreign equity securities using a statistical analysis of historical correlations of multiple factors. In the absence of precise information about the market values of these foreign securities as of the close of the New York Stock Exchange, the Board has determined on the basis of available data that prices adjusted in this way are likely to be closer to the prices the Fund could realize on a current sale than are the prices of those securities established at the close of the foreign markets in which the securities primarily trade. Fair value prices are necessarily estimates, and there is no assurance that such a price will be at or close to the price at which the security next trades. Short-term debt securities with less than 60 days until maturity may be valued at cost which, when combined with interest earned, approximates market value.
The Fund adopted Financial Accounting Standards Board ("FASB") Statement of Financial Accounting Standards No. 157, Fair Value Measurements ("FAS 157"), effective January 1, 2008. In accordance with FAS 157, "fair value" is defined as the price that a Fund would receive upon selling an investment in an orderly transaction to an independent buyer in the principal or most advantageous market for the investment. Various inputs are used in determining the value of the Fund's investments.
In addition to defining fair value, FAS 157 established a three-tier hierarchy of inputs to establish a classification of fair value measurements for disclosure purposes. The three-tier hierarchy of inputs is summarized in the three broad Levels listed below.
. Level 1 - quoted prices in active markets for identical investments
. Level 2 - other significant observable inputs (including quoted prices for similar investments, interest rates, prepayment speeds, credit risk, amortized cost, etc.)
. Level 3 - significant unobservable inputs (including the Fund's own assumptions in determining the fair value of investments)
The inputs or methodology used for valuing an investment are not necessarily an indication of the risk associated with investing in those securities.
See Notes to Financial Statements 9
Notes to Schedule of Investments Mid-Cap Growth Portfolio (cont'd)
The following is a summary of the inputs used to value the Fund's investments as of December 31, 2008:
| Valuation Inputs | | Investments
in Securities | |
| Level 1 - Quoted Prices | | $ | 379,410,088 | | |
| Level 2 - Other Significant Observable Inputs | | | 138,247,820 | | |
| Level 3 - Significant Unobservable Inputs | | | - | | |
| Total | | $ | 517,657,908 | | |
## At December 31, 2008, the cost of investments for U.S. federal income tax purposes was $552,684,379. Gross unrealized appreciation of investments was $39,896,550 and gross unrealized depreciation of investments was $74,923,021, resulting in net unrealized depreciation of $35,026,471, based on cost for U.S. federal income tax purposes.
* Security did not produce income during the last twelve months.
E All or a portion of this security is on loan (see Note A of Notes to Financial Statements).
t Managed by an affiliate of Neuberger Berman Management LLC and could be deemed an affiliate of the Fund (see Notes A & F of Notes to Financial Statements).
a Neuberger Berman Prime Money Fund ("Prime Money") is also managed by Neuberger Berman Management LLC and may be considered an affiliate since it has the same officers, Board members, and investment manager as the Fund and because, at times, the Fund may own 5% or more of the outstanding voting securities of Prime Money (see Notes A & F of Notes to Financial Statements).
oo All or a portion of this security is segregated in connection with obligations for security lending.
See Notes to Financial Statements 10
Statement of Assets and Liabilities
Neuberger Berman Advisers Management Trust
| | | MID-CAP
GROWTH
PORTFOLIO | |
| | | December 31, 2008 | |
| Assets | |
| Investments in securities, at market value*t (Notes A & F)-see Schedule of Investments: | |
| Unaffiliated issuers | | $ | 379,410,088 | | |
| Affiliated issuers | | | 138,247,820 | | |
| | | | 517,657,908 | | |
| Foreign currency | | | 26,447 | | |
| Dividends and interest receivable | | | 167,593 | | |
| Receivable for securities sold | | | 1,746,106 | | |
| Receivable for Fund shares sold | | | 1,020,120 | | |
| Receivable for securities lending income (Note A) | | | 224,351 | | |
| Prepaid expenses and other assets | | | 96 | | |
| Total Assets | | | 520,842,621 | | |
| Liabilities | |
| Due to custodian | | | 160,137 | | |
| Payable for collateral on securities loaned (Note A) | | | 133,745,236 | | |
| Payable for securities purchased | | | 1,645,841 | | |
| Payable for Fund shares redeemed | | | 763,932 | | |
| Payable to investment manager-net (Notes A & B) | | | 169,338 | | |
| Payable to administrator (Note B) | | | 101,764 | | |
| Payable for securities lending fees (Note A) | | | 328,223 | | |
| Accrued expenses and other payables | | | 77,485 | | |
| Total Liabilities | | | 136,991,956 | | |
| Net Assets at value | | $ | 383,850,665 | | |
| Net Assets consist of: | |
| Paid-in capital | | $ | 582,052,608 | | |
| Undistributed net investment income (loss) | | | (7,876 | ) | |
| Accumulated net realized gains (losses) on investments | | | (166,602,108 | ) | |
| Net unrealized appreciation (depreciation) in value of investments | | | (31,591,959 | ) | |
| Net Assets at value | | $ | 383,850,665 | | |
| Net Assets | |
| Class I | | $ | 345,124,071 | | |
| Class S | | | 38,726,594 | | |
| Shares Outstanding ($.001 par value; unlimited shares authorized) | |
| Class I | | | 21,387,354 | | |
| Class S | | | 2,437,245 | | |
| Net Asset Value, offering and redemption price per share | |
| Class I | | $ | 16.14 | | |
| Class S | | | 15.89 | | |
| tSecurities on loan, at market value: | |
| Unaffiliated issuers | | $ | 130,919,993 | | |
| *Cost of Investments: | |
| Unaffiliated issuers | | $ | 411,002,172 | | |
| Affiliated issuers | | | 138,247,820 | | |
| Total cost of investments | | $ | 549,249,992 | | |
| Total cost of foreign currency | | $ | 25,935 | | |
See Notes to Financial Statements 11
Statement of Operations
Neuberger Berman Advisers Management Trust
| | | MID-CAP
GROWTH
PORTFOLIO | |
| | | For the
Year Ended
December 31, 2008 | |
| Investment Income: | |
| Income (Note A): | |
| Dividend income-unaffiliated issuers | | $ | 2,157,862 | | |
| Interest income-unaffiliated issuers | | | 1,173 | | |
| Income from securities loaned-net (Note F) | | | 206,543 | | |
| Income from investments in affiliated issuers (Note F) | | | 232,192 | | |
| Foreign taxes withheld | | | (37,503 | ) | |
| Total income | | $ | 2,560,267 | | |
| Expenses: | |
| Investment management fees (Notes A & B) | | | 3,349,902 | | |
| Administration fees (Note B): | |
| Class I | | | 1,733,397 | | |
| Class S | | | 168,979 | | |
| Distribution fees (Note B): | |
| Class S | | | 140,816 | | |
| Audit fees | | | 40,493 | | |
| Custodian fees (Note B) | | | 185,335 | | |
| Insurance expense | | | 22,432 | | |
| Legal fees | | | 147,316 | | |
| Shareholder reports | | | 134,422 | | |
| Trustees' fees and expenses | | | 38,149 | | |
| Miscellaneous | | | 43,818 | | |
| Total expenses | | | 6,005,059 | | |
| Investment management fees waived (Note A) | | | (6,182 | ) | |
| Expenses reduced by custodian fee expense offset and commission recapture arrangements (Note B) | | | (33,844 | ) | |
| Total net expenses | | | 5,965,033 | | |
| Net investment income (loss) | | $ | (3,404,766 | ) | |
| Realized and Unrealized Gain (Loss) on Investments (Note A) | |
| Net realized gain (loss) on: | |
| Sales of investment securities of unaffiliated issuers | | | (40,003,376 | ) | |
| Sales of investment securities of affiliated issuers | | | (308,407 | ) | |
| Foreign currency | | | (6,330 | ) | |
| Change in net unrealized appreciation (depreciation) in value of: | |
| Unaffiliated investment securities | | | (291,958,747 | ) | |
| Foreign currency | | | 572 | | |
| Net gain (loss) on investments | | | (332,276,288 | ) | |
| Net increase (decrease) in net assets resulting from operations | | $ | (335,681,054 | ) | |
See Notes to Financial Statements 12
Statements of Changes in Net Assets
Neuberger Berman Advisers Management Trust
| | | MID-CAP GROWTH PORTFOLIO | |
| | | Year Ended
December 31,
2008 | | Year Ended
December 31,
2007 | |
| Increase (Decrease) in Net Assets: | |
| From Operations: | |
| Net investment income (loss) | | $ | (3,404,766 | ) | | $ | (1,799,856 | ) | |
| Net realized gain (loss) on investments | | | (40,318,113 | ) | | | 123,783,011 | | |
| Change in net unrealized appreciation (depreciation) of investments | | | (291,958,175 | ) | | | 34,022,885 | | |
| Net increase (decrease) in net assets resulting from operations | | | (335,681,054 | ) | | | 156,006,040 | | |
| From Fund Share Transactions (Note D): | |
| Proceeds from shares sold: | |
| Class I | | | 22,276,953 | | | | 210,481,316 | | |
| Class S | | | 18,104,007 | | | | 37,959,934 | | |
| Payments for shares redeemed: | |
| Class I | | | (191,291,779 | ) | | | (206,624,016 | ) | |
| Class S | | | (17,524,090 | ) | | | (13,565,655 | ) | |
| Net increase (decrease) from Fund share transactions | | | (168,434,909 | ) | | | 28,251,579 | | |
| Net Increase (Decrease) in Net Assets | | | (504,115,963 | ) | | | 184,257,619 | | |
| Net Assets: | |
| Beginning of year | | | 887,966,628 | | | | 703,709,009 | | |
| End of year | | $ | 383,850,665 | | | $ | 887,966,628 | | |
| Undistributed net investment income (loss) at end of year | | $ | (7,876 | ) | | $ | - | | |
See Notes to Financial Statements 13
Notes to Financial Statements Mid-Cap Growth Portfolio
Note A-Summary of Significant Accounting Policies:
1 General: Mid-Cap Growth Portfolio (the "Fund") is a separate operating series of Neuberger Berman Advisers Management Trust (the "Trust"), a Delaware statutory trust organized pursuant to a Trust Instrument dated May 23, 1994. The Trust is currently comprised of ten separate operating series (each a "Series," collectively, the "Funds") each of which is diversified. The Trust is registered as an open-end management investment company under the Investment Company Act of 1940, as amended (the "1940 Act"), and its shares are registered under the Securities Act of 1933, as amended. The Fund currently offers Class I and Class S shares. The Board of Trustees of the Trust (the "Board") may establish additional series or classes of shares without the approval of shareholders.
The assets of each Series belong only to that Series, and the liabilities of each Series are borne solely by that Series and no other.
The preparation of financial statements in accordance with U.S. generally accepted accounting principles requires Neuberger Berman Management LLC ("Management") to make estimates and assumptions at the date of the financial statements. Actual results could differ from those estimates.
Management, the investment manager of the Fund, and Neuberger Berman, LLC ("Neuberger"), the Fund's sub-adviser, are wholly owned subsidiaries of Lehman Brothers Holdings Inc. ("Lehman Brothers"), a publicly owned holding company. On September 15, 2008, Lehman Brothers filed a voluntary petition under Chapter 11 of the U.S. Bankruptcy Code. On December 3, 2008, NBSH Acquisition, LLC ("NBSH"), an entity organized by key members of Neuberger Berman's senior management, was selected as the successful bidder in the public auction to acquire a majority interest in Neuberger Berman's business and the fixed income and certain alternative asset management businesses of Lehman Brothers' Investment Management Division (together with Neuberger Berman, the "Acquired Businesses") (the "Proposed Acquisition"). On December 22, 2008, the bankruptcy court having jurisdiction over the Lehman Brothers matter approved the sale of the Acquired Businesses to NBSH (or its successor or assign), as the successful bidder. At the closing of the Proposed Acquisition, a majority interest in the Acquired Businesses will be directly or indirectly owned by portfolio managers, Neuberger Berman's management team and certain key members and senior professionals of the former Investment Management Division, as well as by Lehman Brothers and certain affiliates of Lehman Brothers. The transaction is subject to certain conditions and approvals.
These events, while affecting Lehman Brothers, have not had a material impact on the Fund or its operations. Management and Neuberger will continue to operate in the ordinary course of business as the investment manager and sub-adviser of the Fund.
Included in the Acquired Businesses are Management and Neuberger. The consummation of the Proposed Acquisition has been deemed to result in an "assignment" of the Fund's Management and Sub-Advisory Agreements which would, by law, automatically terminate those agreements. Accordingly, the Board, including the Trustees who are not "interested persons" of the Fund's investment manager and its affiliates or the Fund, has approved the new Management Agreements and Sub-Advisory Agreements for the Fund. The new agreements also will require the approval of the Fund's shareholders.
2 Portfolio valuation: Investment securities are valued as indicated in the notes following the Schedule of Investments.
3 Foreign currency translation: The accounting records of the Fund are maintained in U.S. dollars. Foreign currency amounts are currently translated into U.S. dollars using the exchange rates as of 4:00 p.m., Eastern time, to determine the value of investments, other assets and liabilities. Purchase and sale prices of securities, and income and expenses, are translated into U.S. dollars at the prevailing rate of exchange on the respective dates of such
14
transactions. Net unrealized foreign currency gain (loss) arises from changes in the value of assets and liabilities, other than investments in securities, as a result of changes in exchange rates and is stated separately in the Statement of Operations.
4 Securities transactions and investment income: Securities transactions are recorded on trade date for financial reporting purposes. Dividend income is recorded on the ex-dividend date or, for certain foreign dividends, as soon as the Fund becomes aware of the dividends. Non-cash dividends included in dividend income, if any, are recorded at the fair market value of the securities received. Interest income, including accretion of original issue discount, where applicable, and accretion of discount on short-term investments, is recorded on the accrual basis. Realized gains and losses from securities transactions and foreign currency transactions, if any, are recorded on the basis of identified cost and stated separately in the Statement of Operations. Included in net realized gain (loss) on investments are proceeds from the settlements of class action litigation in which the Fund participated as a plaintiff. The amount of such proceeds for the year ended December 31, 2008 was $159,236.
5 Income tax information: The Funds are treated as separate entities for U.S. federal income tax purposes. It is the policy of the Fund to continue to qualify as a regulated investment company by complying with the requirements of Subchapter M of the Internal Revenue Code applicable to regulated investment companies and to distribute substantially all of its earnings to its shareholders. Therefore, no federal income or excise tax provision is required.
The Fund has adopted the provisions of Financial Accounting Standards Board Interpretation No. 48 ("FIN 48") "Accounting for Uncertainty in Income Taxes-an interpretation of FASB Statement No. 109". FIN 48 sets forth a minimum threshold for financial statement recognition of the benefit of a tax position taken, or expected to be taken, in a tax return. The Fund recognizes interest and penalties, if any, related to unrecognized tax benefits as an income tax expense in the Statement of Operations. The Fund is subject to examination by U.S. federal and state tax authorities for returns filed for the prior three fiscal years 2005 - 2007. As of December 31, 2008, the Fund did not have any unrecognized tax benefits.
Income distributions and capital gain distributions are determined in accordance with income tax regulations, which may differ from U.S. generally accepted accounting principles. These differences are primarily due to differing treatments of income and gains on various investment securities held by the Fund, timing differences and differing characterization of distributions made by the Fund as a whole. The Fund may also utilize earnings and profits distributed to shareholders on redemption of shares as a part of the dividends paid deduction for income tax purposes.
As determined on December 31, 2008, permanent differences resulting primarily from different book and tax accounting for net operating losses, foreign currency gains and losses, return of capital distributions from investment and partnership holding adjustments were reclassified at fiscal year-end. These reclassifications had no effect on net income, net asset value or net asset value per share of the Fund.
As of December 31, 2008, the components of distributable earnings (accumulated losses) on a U.S. federal income tax basis were as follows:
Unrealized
Appreciation
(Depreciation) | | Loss
Carryforwards
and Deferrals | | Total | |
| $ | (35,026,342 | ) | | $ | (163,175,601 | ) | | $ | (198,201,943 | ) | |
The difference between book basis and tax basis distributable earnings is attributable primarily to timing differences of wash sales, partnership basis adjustments, capital loss carryforwards, and post October loss deferral.
15
To the extent the Fund's net realized capital gains, if any, can be offset by capital loss carryforwards, it is the policy of the Fund not to distribute such gains. As determined at December 31, 2008, the Fund had unused capital loss carryforwards available for federal income tax purposes to offset net realized capital gains, if any, as follows:
| | | Expiring In: | |
| | | 2009 | | 2010 | | 2011 | | 2016 | |
| | | $ | 1,485,097 | | | $ | 113,423,118 | | | $ | 11,059,422 | | | $ | 21,770,564 | | |
Under current tax law, certain net capital and net foreign currency losses realized after October 31 within the taxable year may be deferred and treated as occurring on the first day of the following tax year. For the year ended December 31, 2008, the Fund elected to defer $15,429,524 of net capital losses and $7,876 of foreign currency losses arising between November 1, 2008 and December 31, 2008.
6 Distributions to shareholders: The Fund may earn income, net of expenses, daily on its investments. Distributions from net investment income and net realized capital gains, if any, generally are distributed in October. Income distributions and capital gain distributions to shareholders are recorded on the ex-date.
7 Foreign taxes: Foreign taxes withheld represent amounts withheld by foreign tax authorities, net of refunds recoverable.
8 Expense allocation: Certain expenses are applicable to multiple funds. Expenses directly attributable to a Series are charged to that Series. Expenses of the Trust that are not directly attributed to a Series are allocated among the Funds, on the basis of relative net assets, except where a more appropriate allocation of expenses to each of the Funds can otherwise be made fairly. Expenses borne by the complex of related investment companies, which includes open-end and closed-end investment companies for which Management serves as investment manager, that are not directly attributed to a Series or the Trust are allocated among the Fund and the other investment companies in the complex or series thereof on the basis of relative net assets, except where a more appropriate allocation of expenses to each investment company in the complex or series thereof can otherwise be made fairly. The Fund's expenses (other than those specific to each class) are allocated proportionally each day between the classes based upon the relative net assets of each class.
9 Security lending: A third party, eSecLending, has assisted the Fund in conducting a bidding process to identify agents/principals that would pay a guaranteed amount to the Fund in consideration of the Fund entering into an exclusive securities lending arrangement.
eSecLending currently serves as exclusive lending agent for the Fund. Under the securities lending arrangement, the Fund receives cash collateral at the beginning of each transaction equal to at least 102% of the prior day's market value of the loaned securities (105% in the case of international securities). The Fund may invest all the cash collateral in Neuberger Berman Securities Lending Quality Fund, LLC ("Quality Fund"), a fund managed by Lehman Brothers Asset Management LLC ("LBAM"), an affiliate of Management.
At various times during the course of the Fund's fiscal year ended December 31, 2008, the Quality Fund's NAV was below $1.00 per share, which could have affected the NAV of the Fund with securities loans outstanding during the period. The Quality Fund's price per share on December 31, 2008 was $1.00. The market value of the Fund's investments in the Quality Fund as of that date, if any, is reflected in the Fund's Schedule of Investments. If it were necessary to liquidate assets in the Quality Fund to meet returns on outstanding securities loans at a time when the Quality Fund's price per share was less than $1.00, the Fund may not receive an amount from the Quality Fund that is equal in amount to the collateral the Fund would be required to return to the borrower of the securities and the Fund would be required to make up for this shortfall. In addition, as a result of recent reduced liquidity in the credit and fixed income markets, it may be difficult to dispose quickly of some securities in the Quality Fund at the price at which the Quality Fund is carrying them. The Quality Fund is not a money market fund that operates in accordance with Rule 2a-7 under the 1940 Act and there is no assurance that it will maintain a $1.00 share price.
16
Net income from the lending program represents the guaranteed amount received from a principal plus income earned on the cash collateral invested in Quality Fund or in other investments, less cash collateral fees and other expenses associated with the loans. For the fiscal year ended December 31, 2008, the Fund received net income under the securities lending arrangement of $206,543, which is reflected in the Statement of Operations under the caption "Income from securities loaned-net." For the fiscal year ended December 31, 2008, "Income from securities loaned-net" consisted of $4,690,631 in income earned on cash collateral and guaranteed amounts (including $4,330,879 of interest income earned from the Quality Fund), less fees and expenses paid of $4,484,088.
10 Repurchase agreements: The Fund may enter into repurchase agreements with institutions that Management has determined are creditworthy. Each repurchase agreement is recorded at cost. The Fund requires that the securities purchased in a repurchase agreement be transferred to the custodian in a manner sufficient to enable the Fund to assert a perfected security interest in those securities in the event of a default under the repurchase agreement. The Fund monitors, on a daily basis, the value of the securities transferred to ensure that their value, including accrued interest, is greater than amounts owed to the Fund under each such repurchase agreement.
11 Transactions with other funds managed by Neuberger Berman Management LLC: Pursuant to an Exemptive Order issued by the Securities and Exchange Commission, the Fund may invest in a money market fund managed by Management or an affiliate. The Fund invests in Neuberger Berman Prime Money Fund ("Prime Money"), as approved by the Board. Prime Money seeks to provide the highest available current income consistent with safety and liquidity. For any cash that the Fund invests in Prime Money, Management waives a portion of its management fee equal to the management fee it receives from Prime Money on those assets (the "Arrangement"). For the year ended December 31, 2008, management fees waived under this Arrangement amounted to $6,182 and are reflected in the Statement of Operations under the caption "Investment management fees waived." For the year ended December 31, 2008, income earned under this Arrangement amounted to $232,192 and is reflected in the Statement of Operations under the caption "Income from investments in affiliated issuers."
12 Indemnifications: Like many other companies, the Trust's organizational documents provide that its officers and trustees are indemnified against certain liabilities arising out of the performance of their duties to the Trust. In addition, both in some of its principal service contracts and in the normal course of its business, the Trust enters into contracts that provide indemnifications to other parties for certain types of losses or liabilities. The Trust's maximum exposure under these arrangements is unknown as this could involve future claims against the Trust.
13 Other: All net investment income and realized and unrealized capital gains and losses of the Fund are allocated, on the basis of relative net assets, pro rata among its respective classes.
Note B-Management Fees, Administration Fees, Distribution Arrangements, and Other Transactions With Affiliates:
Fund shares are issued and redeemed in connection with investments in and payments under certain variable annuity contracts and variable life insurance policies issued through separate accounts of life insurance companies and are also offered directly to qualified pension and retirement plans.
The Fund retains Management as its investment manager under a Management Agreement. For such investment management services, the Fund pays Management a fee at the annual rate of 0.55% of the first $250 million of the Fund's average daily net assets, 0.525% of the next $250 million, 0.50% of the next $250 million, 0.475% of the next $250 million, 0.45% of the next $500 million, 0.425% of the next $2.5 billion, and 0.40% of average daily net assets in excess of $4 billion.
The Fund retains Management as its administrator under an Administration Agreement. Each class pays Management an administration fee at the annual rate of 0.30% of its average daily net assets under this agreement. Additionally, Management retains State Street Bank and Trust Company ("State Street") as its sub-administrator under a Sub-Administration Agreement. Management pays State Street a fee for all services received under this agreement.
17
The Board adopted a non-fee distribution plan for the Fund's Class I.
For the Fund's Class S, Management acts as agent in arranging for the sale of class shares without commission and bears advertising and promotion expenses. The Board has adopted a distribution plan (the "Plan") with respect to this class, pursuant to Rule 12b-1 under the 1940 Act. The Plan provides that, as compensation for administrative and other services provided to this class, Management's activities and expenses related to the sale and distribution of this class of shares, and ongoing services provided to investors in this class, Management receives from this class a fee at the annual rate of 0.25% of Class S's average daily net assets. Management receives this amount to provide distribution and shareholder servicing for this class and pays a portion of it to institutions that provide such services. Those institutions may use the payments for, among other purposes, compensating employees engaged in sales and/or shareholder servicing. The amount of fees paid by this class during any year may be more or less than the cost of distribution and other services provided to this class. FINRA rules limit the amount of annual distribution fees that may be paid by a mutual fund and impose a ceiling on the cumulative distribution fees paid. The Trust's Plan complies with those rules.
Management has contractually undertaken through December 31, 2011 to forgo current payment of fees and/or reimburse the Fund's Class I and Class S shares for their operating expenses (excluding fees payable to Management (including the fees payable to Management with respect to the Fund's Class S shares), interest, taxes, brokerage commissions, extraordinary expenses, and transaction costs) ("Operating Expenses") which exceed, in the aggregate, 1.00% and 1.25%, respectively, per annum of the Fund's average daily net assets (the "Expense Limitation"). For the year ended December 31, 2008, no reimbursement to the Fund's Class I and Class S shares was required. The Fund's Class I and Class S shares each have agreed to repay Management through December 31, 2014 for fees and expenses foregone and/or their excess Operating Expenses previously reimbursed by Management, so long as their annual Operating Expenses during that period do not exceed their Expense Limitation, and the repayments are made within three years after the year in which Management issued the reimbursement or waived fees. During the year ended December 31, 2008, there was no repayment to Management under these agreements. At December 31, 2008, the Fund's Class I and Class S shares had no contingent liability to Management under these agreements.
Neuberger is retained by Management to furnish it with investment recommendations and research information without added cost to the Fund. Several individuals who are officers and/or trustees of the Trust are also employees of Neuberger and/or Management.
The Fund had entered into a commission recapture program, which enabled it to pay some of its operational expenses by recouping a portion of the commissions it paid to a broker that was not a related party of the Fund. Pursuant to the agreement, brokers paid recaptured commissions to the Fund's custodian and the custodian directed these amounts toward payment of expenses such as custodial, transfer agency or accounting services. Effective April 1, 2008, this commission recapture program was terminated. For the period ended March 31, 2008, the impact of this arrangement was a reduction of expenses of $32,423.
The Fund has an expense offset arrangement in connection with its custodian contract. For the year ended December 31, 2008, the impact of this arrangement was a reduction of expenses of $1,421.
Note C-Securities Transactions:
During the year ended December 31, 2008, there were purchase and sale transactions (excluding short-term securities) of $393,665,287 and $551,454,434, respectively.
During the year ended December 31, 2008, brokerage commissions on securities transactions paid to affiliated brokers were as follows: Neuberger received $0 and Lehman Brothers Inc. received $48,190.
18
Note D-Fund Share Transactions:
Share activity for the years ended December 31, 2008 and December 31, 2007 was as follows:
| | | For the Year
Ended December 31, 2008 | | For the Year
Ended December 31, 2007 | |
| | | Shares
Sold | | Shares
Redeemed | | Total | | Shares
Sold | | Shares
Redeemed | | Total | |
| Class I | | | 986,584 | | | | (8,337,898 | ) | | | (7,351,314 | ) | | | 7,624,618 | | | | (7,602,868 | ) | | | 21,750 | | |
| Class S | | | 764,631 | | | | (778,104 | ) | | | (13,473 | ) | | | 1,411,673 | | | | (508,098 | ) | | | 903,575 | | |
Note E-Line of Credit:
At December 31, 2008, the Fund was a participant in a single committed, unsecured $150,000,000 line of credit with State Street, to be used only for temporary or emergency purposes. Other investment companies managed by Management also participate in this line of credit on the same terms. Interest is charged on borrowings under this line of credit at the overnight Federal Funds Rate plus 0.50% per annum. A facility fee of 0.07% (as of September 19, 2008, 0.09%) per annum of the available line of credit is charged, of which the Fund has agreed to pay its pro rata share, based on the ratio of its individual net assets to the net assets of all participants at the time the fee is due and payable. The fee is paid quarterly in arrears. Because several investment companies participate, there is no assurance that an individual Fund will have access to all or any part of the $150,000,000 at any particular time. There were no loans outstanding pursuant to this line of credit at December 31, 2008. During the year ended December 31, 2008, the Fund did not utilize this line of credit.
Note F-Investments in Affiliates:
| Name of Issuer | | Balance of
Shares Held
December 31,
2007 | | Gross
Purchases
and Additions | | Gross
Sales and
Reductions | | Balance of
Shares Held
December 31,
2008 | | Value
December 31,
2008 | | Income from
Investments
in Affiliated
Issuers Included
in Total Income | |
Neuberger Berman Prime
Money Fund Trust Class* | | | 21,503,231 | | | | 156,971,216 | | | | 173,663,455 | | | | 4,810,992 | | | $ | 4,810,992 | | | $ | 232,192 | | |
Neuberger Berman
Securities Lending
Quality Fund, LLC** | | | 166,219,972 | | | | 1,042,524,005 | | | | 1,075,307,149 | | | | 133,436,828 | | | | 133,436,828 | | | | 4,330,879 | | |
| Total | | | | | | | | | | $ | 138,247,820 | | | $ | 4,563,071 | | |
* Prime Money is also managed by Management and may be considered an affiliate since it has the same officers, Board members, and investment manager as the Fund and because, at times, the Fund may own 5% or more of the outstanding voting securities of Prime Money.
** Quality Fund, a fund managed by LBAM, an affiliate of Management, is used to invest cash the Fund receives as collateral for securities loans as approved by the Board. Because all shares of Quality Fund are held by funds in the related investment management complex, Quality Fund may be considered an affiliate of the Fund.
Note G-Recent Accounting Pronouncement:
In March 2008, Statement of Financial Accounting Standards No. 161, "Disclosures about Derivative Instruments and Hedging Activities-an amendment of FASB Statement No. 133" ("FAS 161"), was issued. FAS 161 is intended to improve financial reporting for derivative instruments by requiring enhanced disclosure that enables investors to
19
understand how and why an entity uses derivatives, how derivatives are accounted for, and how derivative instruments affect an entity's results of operations and financial position. In September 2008, FASB Staff Position No. 133-1 and FASB Interpretation No. 45-4 (the "FSP"), "Disclosures about Credit Derivatives and Certain Guarantees: An Amendment of FASB Statement No. 133 and FASB Interpretation No. 45; and Clarification of the Effective Date of FASB Statement No. 161" was issued. Certain provisions of the FSP amend FASB Statement No. 133, "Accounting for Derivative Instruments and Hedging Activities," to require disclosures by sellers of credit derivatives, including credit derivatives embedded in hybrid instruments. These FSP provisions are effective for fiscal years and interim periods ending after November 15, 2008. At this time, Management has assessed the implication of these FSP provisions and determined there is no impact to the Fund's financial statements. The FSP also clarifies the effective date of FAS 161, whereby disclosures required by FAS 161 are effective for financial statements issued for fiscal years and interim periods beginning after November 15, 2008. The impact of FAS 161 on the Fund's financial statement disclosures, if any, is currently being assessed.
Note H-Recent Market Events
The year covered by this report witnessed an unusually high degree of volatility in the financial markets and the net asset values of many mutual funds, including to some extent the Fund. Both domestic and international equity markets have been experiencing heightened volatility and turmoil, with issuers that have exposure to the real estate, mortgage and credit markets particularly affected. In addition to the recent turbulence in financial markets, the reduced liquidity in credit and fixed income markets has negatively affected many issuers worldwide. The Fund's investments in certain issuers, as reflected in the Fund's schedule of investments, and the financial markets in general, expose investors to the volatile performance resulting from these market conditions and related events.
20
Financial Highlights
Mid-Cap Growth Portfolio
The following tables include selected data for a share outstanding throughout each year and other performance information derived from the Financial Statements.
Class I
| | | Year Ended December 31, | |
| | | 2008 | | 2007 | | 2006 | | 2005 | | 2004 | |
| Net Asset Value, Beginning of Year | | $ | 28.50 | | | $ | 23.26 | | | $ | 20.28 | | | $ | 17.83 | | | $ | 15.33 | | |
| Income From Investment Operations: | |
| Net Investment Income (Loss)t | | | (.12 | ) | | | (.05 | ) | | | (.02 | ) | | | (.07 | ) | | | (.07 | ) | |
Net Gains or Losses on Securities
(both realized and unrealized) | | | (12.24 | ) | | | 5.29 | | | | 3.00 | | | | 2.52 | | | | 2.57 | | |
| Total From Investment Operations | | | (12.36 | ) | | | 5.24 | | | | 2.98 | | | | 2.45 | | | | 2.50 | | |
| Net Asset Value, End of Year | | $ | 16.14 | | | $ | 28.50 | | | $ | 23.26 | | | $ | 20.28 | | | $ | 17.83 | | |
| Total Returntt | | | (43.37 | )% | | | 22.53 | % | | | 14.69 | % | | | 13.74 | % | | | 16.31 | % | |
| Ratios/Supplemental Data | |
| Net Assets, End of Year (in millions) | | $ | 345.1 | | | $ | 819.0 | | | $ | 668.1 | | | $ | 622.0 | | | $ | 543.3 | | |
| Ratio of Gross Expenses to Average Net Assets# | | | .92 | % | | | .88 | % | | | .90 | % | | | .92 | % | | | .92 | % | |
| Ratio of Net Expenses to Average Net AssetsS | | | .92 | % | | | .88 | % | | | .90 | % | | | .91 | % | | | .90 | % | |
| Ratio of Net Investment Income (Loss) to Average Net Assets | | | (.51 | )% | | | (.20 | )% | | | (.10 | )% | | | (.36 | )% | | | (.45 | )% | |
| Portfolio Turnover Rate | | | 62 | % | | | 56 | % | | | 48 | % | | | 64 | % | | | 92 | % | |
See Notes to Financial Highlights 21
Financial Highlights (cont'd)
Class S
| | | Year Ended December 31, | |
| | | 2008 | | 2007 | | 2006 | | 2005 | | 2004 | |
| Net Asset Value, Beginning of Year | | $ | 28.13 | | | $ | 23.02 | | | $ | 20.11 | | | $ | 17.73 | | | $ | 15.28 | | |
| Income From Investment Operations: | |
| Net Investment Income (Loss)t | | | (.17 | ) | | | (.12 | ) | | | (.08 | ) | | | (.11 | ) | | | (.11 | ) | |
Net Gains or Losses on Securities
(both realized and unrealized) | | | (12.07 | ) | | | 5.23 | | | | 2.99 | | | | 2.49 | | | | 2.56 | | |
| Total From Investment Operations | | | (12.24 | ) | | | 5.11 | | | | 2.91 | | | | 2.38 | | | | 2.45 | | |
| Net Asset Value, End of Year | | $ | 15.89 | | | $ | 28.13 | | | $ | 23.02 | | | $ | 20.11 | | | $ | 17.73 | | |
| Total Returntt | | | (43.51 | )% | | | 22.20 | % | | | 14.47 | % | | | 13.42 | % | | | 16.03 | % | |
| Ratios/Supplemental Data | |
| Net Assets, End of Year (in millions) | | $ | 38.7 | | | $ | 68.9 | | | $ | 35.6 | | | $ | 22.8 | | | $ | 15.0 | | |
| Ratio of Gross Expenses to Average Net Assets# | | | 1.18 | % | | | 1.14 | % | | | 1.15 | % | | | 1.18 | % | | | 1.17 | % | |
| Ratio of Net Expenses to Average Net AssetsS | | | 1.17 | % | | �� | 1.13 | % | | | 1.15 | % | | | 1.16 | % | | | 1.15 | % | |
| Ratio of Net Investment Income (Loss) to Average Net Assets | | | (.77 | )% | | | (.47 | )% | | | (.36 | )% | | | (.61 | )% | | | (.70 | )% | |
| Portfolio Turnover Rate | | | 62 | % | | | 56 | % | | | 48 | % | | | 64 | % | | | 92 | % | |
See Notes to Financial Highlights 22
Notes to Financial Highlights
Mid-Cap Growth Portfolio
tt Total return based on per share net asset value reflects the effects of changes in net asset value on the performance of the Fund during each fiscal period and assumes dividends and other distributions, if any, were reinvested. Results represent past performance and do not guarantee future results. Current returns may be lower or higher than the performance data quoted. Investment returns and principal may fluctuate and shares when redeemed may be worth more or less than original cost. Total return would have been lower if Management had not waived certain expenses. The total return information shown does not reflect charges and other expenses that apply to the separate account or the related insurance policies, and the inclusion of these charges and other expenses would reduce the total return for all fiscal periods shown.
# The Fund is required to calculate an expense ratio without taking into consideration any expense reductions related to expense offset arrangements.
S After waiver of a portion of the investment management fee by Management. Had Management not undertaken such action, the annualized ratios of net expenses to average daily net assets would have been:
| | | Year Ended December 31, | |
| | | 2008 | | 2007 | | 2006 | | 2005 | | 2004 | |
| Mid-Cap Growth Portfolio Class I | | | .92 | % | | | .88 | % | | | .90 | % | | | .92 | % | | | .90 | % | |
| Mid-Cap Growth Portfolio Class S | | | 1.17 | % | | | 1.13 | % | | | 1.15 | % | | | 1.17 | % | | | 1.16 | % | |
t Calculated based on the average number of shares outstanding during each fiscal period.
23
Report of Independent Registered Public Accounting Firm
To the Board of Trustees of
Neuberger Berman Advisers Management Trust and
Shareholders of Mid-Cap Growth Portfolio
We have audited the accompanying statement of assets and liabilities, including the schedule of investments, of Mid-Cap Growth Portfolio, one of the series constituting Neuberger Berman Advisers Management Trust (the "Trust"), as of December 31, 2008, and the related statement of operations for the year then ended, the statement of changes in net assets for each of the two years in the period then ended, and the financial highlights for each of the five years in the period then ended. These financial statements and financial highlights are the responsibility of the Trust's management. Our responsibility is to express an opinion on these financial statements and financial highlights based on our audits.
We conducted our audits in accordance with the standards of the Public Company Accounting Oversight Board (United States). Those standards require that we plan and perform the audit to obtain reasonable assurance about whether the financial statements and financial highlights are free of material misstatement. We were not engaged to perform an audit of the Trust's internal control over financial reporting. Our audits included consideration of internal control over financial reporting as a basis for designing audit procedures that are appropriate in the circumstances, but not for the purpose of expressing an opinion on the effectiveness of the Trust's internal control over financial reporting. Accordingly, we express no such opinion. An audit also includes examining, on a test basis, evidence supporting the amounts and disclosures in the financial statements and financial highlights, assessing the accounting principles used and significant estimates made by management, and evaluating the overall financial statement presentation. Our procedures included confirmation of securities owned as of December 31, 2008 by correspondence with the custodian and brokers or by other appropriate auditing procedures where replies from brokers were not received. We believe that our audits provide a reasonable basis for our opinion.
In our opinion, the financial statements and financial highlights referred to above present fairly, in all material respects, the financial position of Mid-Cap Growth Portfolio, a series of Neuberger Berman Advisers Management Trust, at December 31, 2008, the results of its operations for the year then ended, the changes in its net assets for each of the two years in the period then ended, and the financial highlights for each of the five years in the period then ended, in conformity with U.S. generally accepted accounting principles.
Boston, Massachusetts
February 9, 2009
24
Trustee and Officer Information
The following tables set forth information concerning the trustees and officers of the Trust. All persons named as trustees and officers also serve in similar capacities for other funds administered or managed by Neuberger Berman Management LLC ("NB Management") and Neuberger Berman, LLC ("Neuberger Berman"). The Statement of Additional Information includes additional information about fund trustees and is available upon request, without charge, by calling (800) 877-9700.
Information about the Board of Trustees
Name, (Year of Birth),
and Address(1) | | Position and
Length of
Time Served(2) | | Principal Occupation(s)(3) | | Number of
Funds in Fund
Complex
Overseen by
Fund Trustee | | Other Directorships
Held Outside Fund
Complex by Fund
Trustee | |
| Independent Fund Trustees | |
|
| John Cannon (1930) | | Trustee since 2000 | | Consultant; formerly, Chairman, CDC Investment Advisers (registered investment adviser), 1993 to January 1999; formerly, President and Chief Executive Officer, AMA Investment Advisors, an affiliate of the American Medical Association. | | | 56 | | | Independent Trustee or Director of three series of Oppenheimer Funds: Oppenheimer Limited Term New York Municipal Fund, Rochester Fund Municipals, and Oppenheimer Convertible Securities Fund since 1992. | |
|
| Faith Colish (1935) | | Trustee since 1982 | | Counsel, Carter Ledyard & Milburn LLP (law firm) since October 2002; formerly, Attorney-at-Law and President, Faith Colish, A Professional Corporation, 1980 to 2002. | | | 56 | | | Formerly, Director (1997 to 2003) and Advisory Director (2003 to 2006), ABA Retirement Funds (formerly, American Bar Retirement Association) (not-for-profit membership corporation). | |
|
| Martha C. Goss (1949) | | Trustee since 2007 | | President, Woodhill Enterprises Inc./Chase Hollow Associates LLC (personal investment vehicle), since 2006; Chief Operating and Financial Officer, Hopewell Holdings LLC/ Amwell Holdings, LLC (a holding company for a healthcare reinsurance company start-up), since 2003; formerly, Consultant, Resources Connection (temporary staffing), 2002 to 2006. | | | 56 | | | Director, Ocwen Financial Corporation (mortgage servicing), since 2005; Director, American Water (water utility), since 2003; Director, Channel Reinsurance (financial guaranty reinsurance), since 2006; Advisory Board Member, Attensity (software developer), since 2005; Director, Allianz Life of New York (insurance), since 2005; Director, Financial Women's Association of New York (not for profit association), since 2003; Trustee Emerita, Brown University, since 1998. | |
|
25
Name, (Year of Birth),
and Address(1) | | Position and
Length of
Time Served(2) | | Principal Occupation(s)(3) | | Number of
Funds in Fund
Complex
Overseen by
Fund Trustee | | Other Directorships
Held Outside Fund
Complex by Fund
Trustee | |
| C. Anne Harvey (1937) | | Trustee since 1998 | | President, C.A. Harvey Associates, since October 2001; formerly, Director, AARP, 1978 to December 2001. | | | 56 | | | Formerly, President, Board of Associates to The National Rehabilitation Hospital's Board of Directors, 2001 to 2002; formerly, Member, Individual Investors Advisory Committee to the New York Stock Exchange Board of Directors, 1998 to June 2002. | |
|
| Robert A. Kavesh (1927) | | Trustee since 2000 | | Retired; Marcus Nadler Professor Emeritus of Finance and Economics, New York University Stern School of Business; formerly, Executive Secretary-Treasurer, American Finance Association, 1961 to 1979. | | | 56 | | | Formerly, Director, The Caring Community (not-for-profit), 1997 to 2006; formerly, Director, DEL Laboratories, Inc. (cosmetics and pharmaceuticals), 1978 to 2004; formerly, Director, Apple Bank for Savings, 1979 to 1990; formerly, Director, Western Pacific Industries, Inc., 1972 to 1986 (public company). | |
|
| Michael M. Knetter (1960) | | Trustee since 2007 | | Dean, School of Business, University of Wisconsin - Madison; formerly, Professor of International Economics and Associate Dean, Amos Tuck School of Business - Dartmouth College, 1998 to 2002. | | | 56 | | | Trustee, Northwestern Mutual Series Fund, Inc., since February 2007; Director, Wausau Paper, since 2005; Director, Great Wolf Resorts, since 2004. | |
|
| Howard A. Mileaf (1937) | | Trustee since 1999 | | Retired; formerly, Vice President and General Counsel, WHX Corporation (holding company), 1993 to 2001. | | | 56 | | | Formerly, Director, Webfinancial Corporation (holding company), 2002 to 2008; formerly, Director WHX Corporation (holding company), January 2002 to June 2005; formerly, Director, State Theatre of New Jersey (not-for-profit theater), 2000 to 2005. | |
|
26
Name, (Year of Birth),
and Address(1) | | Position and
Length of
Time Served(2) | | Principal Occupation(s)(3) | | Number of
Funds in Fund
Complex
Overseen by
Fund Trustee | | Other Directorships
Held Outside Fund
Complex by Fund
Trustee | |
| George W. Morriss (1947) | | Trustee since 2007 | | Retired; formerly, Executive Vice President and Chief Financial Officer, People's Bank, Connecticut (a financial services company), 1991 to 2001. | | | 56 | | | Manager, Old Mutual 2100 fund complex (consisting of six funds) since October 2006 for four funds and since February 2007 for two funds; formerly, Member NASDAQ Issuers' Affairs Committee, 1995 to 2003. | |
|
| Edward I. O'Brien (1928) | | Trustee since 2000 | | Retired; formerly, Member, Investment Policy Committee, Edward Jones, 1993 to 2001; President, Securities Industry Association ("SIA") (securities industry's representative in government relations and regulatory matters at the federal and state levels), 1974 to 1992; Adviser to SIA, November 1992 to November 1993. | | | 56 | | | Formerly, Director, Legg Mason, Inc. (financial services holding company), 1993 to July 2008; formerly, Director, Boston Financial Group (real estate and tax shelters), 1993 to 1999. | |
|
| William E. Rulon (1932) | | Trustee since 2000 | | Retired; formerly, Senior Vice President, Foodmaker, Inc. (operator and franchiser of restaurants), until January 1997. | | | 56 | | | Formerly, Director, Pro-Kids Golf and Learning Academy (teach golf and computer usage to "at risk" children), 1998 to 2006; formerly, Director, Prandium, Inc. (restaurants), March 2001 to July 2002. | |
|
| Cornelius T. Ryan (1931) | | Trustee since 2000 | | Founding General Partner, Oxford Partners and Oxford Bioscience Partners (venture capital investing) and President, Oxford Venture Corporation, since 1981. | | | 56 | | | None. | |
|
27
Name, (Year of Birth),
and Address(1) | | Position and
Length of
Time Served(2) | | Principal Occupation(s)(3) | | Number of
Funds in Fund
Complex
Overseen by
Fund Trustee | | Other Directorships
Held Outside Fund
Complex by Fund
Trustee | |
| Tom D. Seip (1950) | | Trustee since 2000; Chairman of the Board since 2008; Lead Independent Trustee from 2006 to 2008 | | General Partner, Seip Investments LP (a private investment partnership); formerly, President and CEO, Westaff, Inc. (temporary staffing), May 2001 to January 2002; formerly, Senior Executive at the Charles Schwab Corporation, 1983 to 1998, including Chief Executive Officer, Charles Schwab Investment Management, Inc., and Trustee, Schwab Family of Funds and Schwab Investments, 1997 to 1998, and Executive Vice President-Retail Brokerage, Charles Schwab & Co., Inc., 1994 to 1997. | | | 56 | | | Director, H&R Block, Inc. (financial services company), since May 2001; Chairman, Compensation Committee, H&R Block, Inc., since 2006; formerly, Director, Forward Management, Inc. (asset management company), 1999 to 2006. | |
|
| Candace L. Straight (1947) | | Trustee since 1999 | | Private investor and consultant specializing in the insurance industry; formerly, Advisory Director, Securitas Capital LLC (a global private equity investment firm dedicated to making investments in the insurance sector), 1998 to December 2003. | | | 56 | | | Director, Montpelier Re (reinsurance company), since 2006; formerly, Director, National Atlantic Holdings Corporation (property and casualty insurance company), 2004 to 2008; formerly, Director, The Proformance Insurance Company (property and casualty insurance company), 2004 to 2008; formerly, Director, Providence Washington Insurance Company (property and casualty insurance company), December 1998 to March 2006; formerly, Director, Summit Global Partners (insurance brokerage firm), 2000 to 2005. | |
|
| Peter P. Trapp (1944) | | Trustee since 1984 | | Retired; formerly, Regional Manager for Mid-Southern Region, Ford Motor Credit Company, September 1997 to 2007; formerly, President, Ford Life Insurance Company, April 1995 to August 1997. | | | 56 | | | None. | |
|
28
Name, (Year of Birth),
and Address(1) | | Position and
Length of
Time Served(2) | | Principal Occupation(s)(3) | | Number of
Funds in Fund
Complex
Overseen by
Fund Trustee | | Other Directorships
Held Outside Fund
Complex by Fund
Trustee | |
| Fund Trustees who are "Interested Persons" | |
|
| Jack L. Rivkin* (1940) | | Trustee since 2002; President from 2002 to 2008 | | Formerly, Executive Vice President and Chief Investment Officer, Neuberger Berman Holdings LLC (holding company), 2002 to August 2008 and 2003 to August 2008, respectively; formerly, Managing Director and Chief Investment Officer, Neuberger Berman, December 2005 to August 2008 and 2003 to August 2008, respectively; formerly, Executive Vice President, Neuberger Berman, December 2002 to 2005; formerly, Director and Chairman, NB Management, December 2002 to August 2008; formerly, Executive Vice President, Citigroup Investments, Inc., September 1995 to February 2002; formerly, Executive Vice President, Citigroup Inc., September 1995 to February 2002. | | | 56 | | | Director, Dale Carnegie and Associates, Inc. (private company), since 1998; Director, Solbright, Inc. (private company), since 1998. | |
|
29
Name, (Year of Birth),
and Address(1) | | Position and
Length of
Time Served(2) | | Principal Occupation(s)(3) | | Number of
Funds in Fund
Complex
Overseen by
Fund Trustee | | Other Directorships
Held Outside Fund
Complex by Fund
Trustee | |
| Robert Conti* (1956) | | Chief Executive Officer, President and Director since 2008; prior thereto, Executive Vice President in 2008 and Vice President 2000 to 2008 | | Managing Director, Neuberger Berman, since 2007; formerly, Senior Vice President, Neuberger Berman, 2003 to 2006; formerly, Vice President, Neuberger Berman, 1999 to 2003; President and Chief Executive Officer, NB Management, since 2008; formerly, Senior Vice President, NB Management, 2000 to 2008. | | | 56 | | | Chairman of the Board, Staten Island Mental Health Society since 2008. | |
|
(1) The business address of each listed person is 605 Third Avenue, New York, New York 10158.
(2) Pursuant to the Trust's Trust Instrument, each Fund Trustee shall hold office for life or until his or her successor is elected or the Trust terminates; except that (a) any Fund Trustee may resign by delivering a written resignation; (b) any Fund Trustee may be removed with or without cause at any time by a written instrument signed by at least two-thirds of the other Fund Trustees; (c) any Fund Trustee who requests to be retired, or who has become unable to serve, may be retired by a written instrument signed by a majority of the other Fund Trustees; and (d) any Fund Trustee may be removed at any shareholder meeting by a vote of at least two-thirds of the outstanding shares.
(3) Except as otherwise indicated, each individual has held the positions shown for at least the last five years.
* Indicates a Fund Trustee who is an "interested person" within the meaning of the 1940 Act. Mr. Conti is an interested person of the Trust by virtue of the fact that he is an officer of NB Management and Neuberger Berman. Mr. Rivkin may be deemed an interested person of the Trust by virtue of the fact that, until August 2008, he was a director of NB Management and an officer of Neuberger Berman.
30
Information about the Officers of the Trust
Name, (Year of Birth),
and Address(1) | | Position and
Served(2) | | Principal Occupation(s)(3)
Length of Time | |
| Andrew B. Allard (1961) | | Anti-Money Laundering Compliance Officer since 2002 | | Senior Vice President, Neuberger Berman, since 2006; Deputy General Counsel, Neuberger Berman, since 2004; formerly, Vice President, Neuberger Berman, 2000 to 2005; formerly, Associate General Counsel, Neuberger Berman, 1999 to 2004; Anti-Money Laundering Compliance Officer, eleven registered investment companies for which NB Management acts as investment manager and administrator (six since 2002, two since 2003, two since 2004 and one since 2006). | |
|
| Michael J. Bradler (1970) | | Assistant Treasurer since 2005 | | Vice President, Neuberger Berman, since 2006; Employee, NB Management, since 1997; Assistant Treasurer, eleven registered investment companies for which NB Management acts as investment manager and administrator (ten since 2005 and one since 2006). | |
|
| Claudia A. Brandon (1956) | | Executive Vice President since 2008 and Secretary since 1985 | | Senior Vice President, Neuberger Berman, since 2007 and Employee since 1999; formerly, Vice President, Neuberger Berman, 2002 to 2006; Senior Vice President, NB Management, since 2008 and Assistant Secretary since 2004; formerly, Vice President-Mutual Fund Board Relations, NB Management, 2000 to 2008; Executive Vice President, eleven registered investment companies for which NB Management acts as investment manager and administrator (eleven since 2008); Secretary, eleven registered investment companies for which NB Management acts as investment manager and administrator (three since 1985, three since 2002, two since 2003, two since 2004 and one since 2006). | |
|
| Maxine L. Gerson (1950) | | Executive Vice President since 2008 and Chief Legal Officer since 2005 (only for purposes of sections 307 and 406 of the Sarbanes-Oxley Act of 2002) | | Senior Vice President, Neuberger Berman, since 2002; Deputy General Counsel and Assistant Secretary, Neuberger Berman, since 2001; Senior Vice President, NB Management, since 2006; Secretary and General Counsel, NB Management, since 2004; Executive Vice President, eleven registered investment companies for which NB Management acts as investment manager and administrator (eleven since 2008); Chief Legal Officer (only for purposes of sections 307 and 406 of the Sarbanes-Oxley Act of 2002), eleven registered investment companies for which NB Management acts as investment manager and administrator (ten since 2005 and one since 2006). | |
|
| Sheila R. James (1965) | | Assistant Secretary since 2002 | | Vice President, Neuberger Berman, since 2008 and Employee since 1999; formerly, Assistant Vice President, Neuberger Berman, 2007; Assistant Secretary, eleven registered investment companies for which NB Management acts as investment manager and administrator (six since 2002, two since 2003, two since 2004 and one since 2006). | |
|
| Brian Kerrane (1969) | | Vice President since 2008 | | Senior Vice President, Neuberger Berman, since 2006; formerly, Vice President, Neuberger Berman, 2002 to 2006; Vice President, NB Management, since 2008 and Employee since 1991; Vice President, eleven registered investment companies for which NB Management acts as investment manager and administrator (eleven since 2008). | |
|
31
Name, (Year of Birth),
and Address(1) | | Position and
Served(2) | | Principal Occupation(s)(3)
Length of Time | |
| Kevin Lyons (1955) | | Assistant Secretary since 2003 | | Assistant Vice President, Neuberger Berman, since 2008 and Employee since 1999; Assistant Secretary, eleven registered investment companies for which NB Management acts as investment manager and administrator (eight since 2003, two since 2004 and one since 2006). | |
|
| Owen F. McEntee, Jr. (1961) | | Vice President since 2008 | | Vice President, Neuberger Berman, since 2006; Employee, NB Management, since 1992; Vice President, eleven registered investment companies for which NB Management acts as investment manager and administrator (eleven since 2008). | |
|
| John M. McGovern (1970) | | Treasurer and Principal Financial and Accounting Officer since 2005; prior thereto, Assistant Treasurer since 2002 | | Senior Vice President, Neuberger Berman, since 2007; formerly, Vice President, Neuberger Berman, 2004 to 2006; Employee, NB Management, since 1993; Treasurer and Principal Financial and Accounting Officer, eleven registered investment companies for which NB Management acts as investment manager and administrator (ten since 2005 and one since 2006); formerly, Assistant Treasurer, eleven registered investment companies for which NB Management acts as investment manager and administrator, 2002 to 2005. | |
|
| Andrew Provencher (1965) | | Vice President since 2008 | | Managing Director, NB Management, since 2008; Managing Director, Neuberger Berman, since 2005; formerly, Senior Vice President, Neuberger Berman, 2003 to 2005; formerly, Vice President, Neuberger Berman, 1999 to 2003; Vice President, eleven registered investment companies for which NB Management acts as investment manager and administrator (eleven since 2008). | |
|
| Frank Rosato (1971) | | Assistant Treasurer since 2005 | | Vice President, Neuberger Berman, since 2006; Employee, NB Management, since 1995; Assistant Treasurer, eleven registered investment companies for which NB Management acts as investment manager and administrator (ten since 2005 and one since 2006). | |
|
| Neil S. Siegel (1967) | | Vice President since 2008 | | Managing Director, NB Management, since 2008; Managing Director, Neuberger Berman, since 2006; formerly, Senior Vice President, Neuberger Berman, 2004 to 2006; Vice President, eleven registered investment companies for which NB Management acts as investment manager and administrator (eleven since 2008); formerly, Head of Institutional Marketing, Morgan Stanley Investment Management, 1993 to 2004. | |
|
32
Name, (Year of Birth),
and Address(1) | | Position and
Served(2) | | Principal Occupation(s)(3)
Length of Time | |
| Chamaine Williams (1971) | | Chief Compliance Officer since 2005 | | Senior Vice President, Neuberger Berman, since 2007; Chief Compliance Officer, NB Management, since 2006; Senior Vice President, Lehman Brothers Inc., since 2007; formerly, Vice President, Lehman Brothers Inc., 2003 to 2006; Chief Compliance Officer, eleven registered investment companies for which NB Management acts as investment manager and administrator (ten since 2005 and one since 2006); formerly, Chief Compliance Officer, Lehman Brothers Asset Management Inc., 2003 to 2007; formerly, Chief Compliance Officer, Lehman Brothers Alternative Investment Management LLC, 2003 to 2007; formerly, Vice President, UBS Global Asset Management (US) Inc. (formerly, Mitchell Hutchins Asset Management, a wholly-owned subsidiary of PaineWebber Inc.), 1997 to 2003. | |
|
(1) The business address of each listed person is 605 Third Avenue, New York, New York 10158.
(2) Pursuant to the By-Laws of the Trust, each officer elected by the Fund Trustees shall hold office until his or her successor shall have been elected and qualified or until his or her earlier death, inability to serve, or resignation. Officers serve at the pleasure of the Fund Trustees and may be removed at any time with or without cause.
(3) Except as otherwise indicated, each individual has held the positions shown for at least the last five years.
33
Proxy Voting Policies and Procedures
A description of the policies and procedures that the Trust uses to determine how to vote proxies relating to portfolio securities is available, without charge, by calling 1-800-877-9700 (toll-free) and on the website of the Securities and Exchange Commission, at www.sec.gov. Information regarding how the Trust voted proxies relating to portfolio securities during the most recent 12-month period ended June 30 is also available, without charge, by calling 1-800-877-9700 (toll-free), on the website of the Securities and Exchange Commission at www.sec.gov, and on Management's website at www.nb.com.
Quarterly Portfolio Schedule
The Trust files a complete schedule of portfolio holdings for the Fund with the Securities and Exchange Commission for the first and third quarters of each fiscal year on Form N-Q. The Trust's Forms N-Q are available on the Securities and Exchange Commission's website at www.sec.gov and may be reviewed and copied at the Securities and Exchange Commission's Public Reference Room in Washington, DC. Information on the operation of the Public Reference Room may be obtained by calling 1-800-SEC-0330. The information on Form N-Q is available upon request, without charge, by calling 1-800-877-9700 (toll free).
Board Consideration of the Management and Sub-Advisory Agreements
At a meeting held on September 25, 2008, the Board of Trustees of Neuberger Berman Advisers Management Trust ("Board"), including the Trustees who are not "interested persons" of Neuberger Berman Management LLC ("Management") or Neuberger Berman Advisers Management Trust ("Independent Fund Trustees"), approved the continuance of the Management and Sub-Advisory Agreements ("Agreements") between Management and Mid-Cap Growth Portfolio ("Fund").
In evaluating the Agreements, the Board, including the Independent Fund Trustees, reviewed materials furnished by Management and Neuberger Berman, LLC ("Neuberger") in response to questions submitted by counsel to the Independent Fund Trustees, and met with senior representatives of Management and Neuberger regarding their personnel and operations. The Independent Fund Trustees were advised by counsel that is experienced in Investment Company Act of 1940 matters and that is independent of Management and Neuberger. The Independent Fund Trustees received a memorandum from independent counsel discussing the legal standards for their consideration of the proposed continuance of the Agreements. They met with such counsel separately from representatives of Management to discuss the annual contract review. The annual contract review extends over two regular meetings of the Board to ensure that Management and Neuberger have time to respond to any questions the Independent Fund Trustees may have on their initial review of the report and that the Independent Fund Trustees have time to consider those responses. In addition, during this process, the Board held a separate meeting devoted primarily to reviewing and discussing Fund performance.
The Board considered the following factors, among others, in connection with its approval of the continuance of the Agreements: (1) the nature, extent, and quality of the services provided by Management and Neuberger; (2) the performance of the Fund compared to a relevant market index and a peer group of investment companies; (3) the costs of the services provided and profits or losses realized by Management and its affiliates from their relationship with the Fund; (4) the extent to which economies of scale might be realized as the Fund grows; and (5) whether fee levels reflect any such potential economies of scale for the benefit of investors in the Fund. In their deliberations, the Board members did not identify any particular information that was all-important or controlling, and each Trustee may have attributed different weights to the various factors.
The Board considered the continued integrity of Management and Neuberger as organizations, despite the bankruptcy filing by Lehman Brothers Holdings Inc. The Board discussed the efforts made by Management and Neuberger to retain employees, and the reported likelihood that such employees would be retained. The Board discussed the provisions that were being made for ancillary services by Management, Neuberger and their affiliates.
34
The Board evaluated the terms of the Agreements, the overall fairness of the Agreements to the Fund and whether the Agreements were in the best interests of the Fund and its shareholders.
With respect to the nature, extent and quality of the services provided, the Board considered the performance of the Fund and the experience and staffing of the portfolio management and investment research personnel who perform services for the Fund. The Board noted that Management also provides certain administrative services, including fund accounting and compliance oversight. The Board also considered Management's and Neuberger's policies and practices regarding brokerage. The Board considered the quality of brokerage execution obtained by Management. The Board's Portfolio Transactions and Pricing Committee from time to time reviewed the quality of the brokerage services that Neuberger and Lehman Brothers Inc. had provided, and periodically reviews studies by an independent firm engaged to review and evaluate the quality of brokerage execution received by the Fund. The Board also reviewed whether Management and Neuberger used brokers to execute Fund transactions that provide research and other services to Management and Neuberger, and the types of benefits potentially derived from such services by Management, Neuberger, the Fund and other clients of Management and Neuberger. In addition, the Board noted the positive compliance history of Management and Neuberger, as each firm has been free of significant compliance problems.
The Board considered the performance of the Fund relative to its benchmark and a peer group of investment companies dedicated to insurance products pursuing broadly similar strategies. The Board also considered performance in relation to the degree of risk undertaken by the portfolio manager.
With respect to the overall fairness of the Agreements, the Board considered the fee structure for the Fund under the Agreements as compared to a peer group of comparable funds dedicated to insurance products and any fall-out benefits likely to accrue to Management or Neuberger or their affiliates from their relationship with the Fund. The Board also considered the profitability of Management and its affiliates from their association with the Fund.
The Board reviewed a comparison of the Fund's management fee and overall expense ratio to a peer group of broadly comparable funds dedicated to insurance products. The Board considered the mean and median of the management fees and expense ratios of the peer group. The Board noted that the Fund's management fee was higher than the peer group mean and median. The Board considered whether specific portfolio management or administration needs contributed to the higher fee. With regard to the sub-advisory fee paid to Neuberger, the Board noted that this fee is "at cost." In addition, the Board considered the contractual limit on Fund expenses undertaken by Management. The Board noted that Management incurred a loss on the Fund on an after-tax basis in 2005.
The Board considered whether there were other funds that were advised or sub-advised by Management or its affiliates or separate accounts managed by Management or its affiliates with similar investment objectives, policies and strategies to the Fund. The Board compared the fees charged to the Fund at various asset levels to the fees charged to an advised fund, a sub-advised fund and a separate account, each managed in a similar style to the Fund. The Board considered the appropriateness and reasonableness of any differences between the fees charged to the Fund and the other funds and account and determined that the differences in fees were consistent with the management and other services provided.
The Board also evaluated any apparent or anticipated economies of scale in relation to the services Management provides to the Fund. The Board considered that the Fund's fee structure which provides for a reduction of payments resulting from the use of breakpoints and whether those breakpoints are set at appropriate asset levels.
In concluding that the benefits accruing to Management and its affiliates by virtue of their relationship to the Fund were reasonable in comparison with the costs of providing the investment advisory services and the benefits accruing to the Fund, the Board reviewed specific data as to Management's profit on the Fund for a recent period and the trend in profit or loss over recent years. The Board also carefully examined Management's cost allocation methodology and in recent years had an independent consultant review the methodology. It also reviewed an analysis from an independent data service on profitability margins in the investment management industry. The Board recognized that Management should be entitled to earn a reasonable level of profits for services it provides to the Fund and, based on its review, concluded that Management's level of profitability was not excessive.
35
Conclusions
In approving the Agreements, the Board concluded that the terms of each Agreement are fair and reasonable and that approval of the Agreements is in the best interests of the Fund and its shareholders. In reaching this determination, the Board considered that Management and Neuberger could be expected to provide a high level of service to the Fund; that the performance of the Fund was satisfactory over time; that the Fund's fee structure appeared to the Board to be reasonable given the nature and quality of services provided; and that the benefits accruing to Management and its affiliates by virtue of their relationship to the Fund were reasonable in comparison with the benefits accruing to the Fund.
Board Consideration of New and Interim Management and Sub-Advisory Agreements
Lehman Brothers Holdings Inc. ("Lehman Brothers") has entered into an agreement to sell a controlling interest in the Fund's investment adviser. Under the agreement, Lehman Brothers would sell substantially all of the Neuberger Berman business and the fixed income business and certain alternative asset management businesses of Lehman Brother's Investment Management Division (collectively, the "Acquired Businesses") to NBSH Acquisition, LLC (the "Proposed Acquisition"). NBSH Acquisition, LLC ("NBSH") was organized by key members of Neuberger Berman's management for the purpose of facilitating the acquisition of the Acquired Businesses. At the closing of the Proposed Acquisition, a majority interest in the Acquired Businesses will be directly or indirectly owned by portfolio managers, Neuberger Berman's management team and certain key members and senior professionals of the former Investment Management Division ("Management Members"), as well as by Lehman Brothers and certain affiliates of Lehman Brothers.
The Acquired Businesses include Neuberger Berman Management LLC ("Management") and Neuberger Berman, LLC ("Neuberger"), the adviser and sub-adviser to the Fund, respectively. The Proposed Acquisition has been deemed to result in an "assignment" of the Fund's existing Management Agreement and Sub-Advisory Agreement (the "Existing Agreements") under the 1940 Act. As required by the 1940 Act, the Fund's Existing Agreements provide for their automatic termination in the event of an assignment, and each will terminate upon the consummation of the Proposed Acquisition. Accordingly, on December 17, 2008, the Board approved new Management and Sub-Advisory Agreements with Management and Neuberger, respectively, or their successors (together, the "Advisers"), on the same terms and with the same compensation structure as are currently in effect (together, "New Agreements"), which would take effect upon consummation of the Proposed Acquisition if approved by the Fund's shareholders.
If shareholders of the Fund do not approve the New Agreements before the Proposed Acquisition is completed, the Board has approved interim Management and Sub-Advisory Agreements with Management and Neuberger, respectively, or their successors (together, "Interim Agreements") pending approval of the New Agreements by shareholders of the Fund. Compensation earned by the Advisers under the Interim Agreements would be held in an interest-bearing escrow account pending shareholder approval of the New Agreements. If shareholders approve the New Agreements within 150 days from the termination of the Existing Agreements, the amount held in the escrow account, including interest, will be paid to the Advisers, as appropriate. If shareholders of the Fund do not approve the New Agreements, the Advisers will be paid the lesser of the costs incurred in performing their services under the Interim Agreements or the total amount in the escrow account, including interest earned. If at the end of 150 days following termination of a Fund's Existing Agreements the Fund's shareholders still have not approved the New Agreements, the Trustees would take such actions as they deem to be in the best interests of the Fund and its shareholders, which may include negotiating a new Management Agreement and/or new Sub-Advisory Agreement with an advisory organization selected by the Board of Trustees or making other arrangements.
The Trustees of the Trust discussed the Proposed Acquisition on December 17, 2008. Prior to submitting its bid to public auction, Management met telephonically with the Independent Trustees to brief them on the Proposed Acquisition. Following the public auction wherein NBSH was determined to be the successful bidder, the Independent Trustees again met telephonically with Management to obtain additional information about the Proposed Acquisition. The Independent Trustees, with the assistance of independent counsel, prepared due diligence requests that were presented to Management and appointed a Task Force of Independent Trustees to lead the due diligence effort ("Task Force").
36
Management provided written responses to the due diligence requests. After extensive review and analysis and discussions during a telephonic and in person meeting of the Independent Trustees, the Task Force submitted clarifying questions. The Independent Trustees met as a body in person to receive the report of the Task Force and consider the New Agreements. Throughout the process, the Task Force and the Independent Trustees were advised by experienced 1940 Act counsel that is independent of Management and NBSH. In addition, the Independent Trustees received a memorandum from independent counsel discussing the legal standards for their consideration of the New Agreements.
Consideration of the New Agreements followed shortly on the heels of the Independent Trustees' annual consideration of whether to renew the Existing Agreements, carried out pursuant to Section 15(c) of the 1940 Act. In that process, which began prior to the June 2008 quarterly meeting of the Board and was concluded at the September 2008 quarterly meeting, the Independent Trustees, following an extensive review of materials submitted by Management and a report from an independent data service, unanimously determined that the Existing Agreements were fair and reasonable and that their renewal would be in the best interests of the Fund and its shareholders. Accordingly, in considering the New Agreements, the Independent Trustees took into account the fact that the terms of the New Agreements would be identical to those of the Existing Agreements in every respect except for the term and termination date and potentially the name of the investment adviser. The Board considerations in connection with the New Agreements and the Existing Agreements also entered into the decision by the Board to approve the Interim Agreements, which would take effect if the shareholders of the Fund do not approve the New Agreements before the Proposed Acquisition is completed. The Independent Trustees' consideration of the Existing Agreements is described above.
In evaluating the proposed New Agreements, the Independent Trustees considered that they have generally been satisfied with the nature and quality of the services provided to the Fund by Management and Neuberger, including investment advisory, administrative and support services, and that the Fund would be best served by an arrangement that appeared likely to maintain the continuity and stability of the providers of these services. Accordingly, the Independent Trustees considered very carefully the intentions of NBSH (including its successors or assign) regarding capitalization, management structure, staffing, compensation and staff retention and whether these seemed designed to provide the desired continuity and stability. They inquired specifically about staffing and resources in the areas of portfolio management, investment research, trading, fund accounting, legal and compliance, internal audit, and senior executive staff. Although at the time the Board considered the New Agreements no final decisions had been reached as to the distribution of equity interests in NBSH (or its successor or assign), the Trustees were advised that senior members of management, including the Fund Trustee and nominee for Fund Trustee who are employed by the Advisers, would receive equity interests in NBSH. Because of these interests, as well as any future employment arrangements with the Advisers, these persons, individually or in the aggregate, could have a material interest in the Proposed Acquisition and in shareholder approval of the New Agreements. In considering the New Agreements, the Trustees were aware of these interests.
The Independent Trustees inquired whether NBSH (or its successors or assign) had specific plans for the future structure of the Neuberger Berman Funds, whether they plan to propose to eliminate any Funds, and whether they intend to continue or alter certain expansion plans that are already underway. They also inquired whether there are plans to change the fees or expense structure of any of the Funds. The Independent Trustees inquired about the long-term plans for the Advisers, including any expectations for cost savings or expense reductions. They also inquired about the capital structure and working capital likely to be available to NBSH (or its successors or assign).
The Independent Trustees considered the following factors, in addition to the factors discussed above, among others, in connection with their consideration of the New Agreements: (1) the nature, extent, and quality of the services provided by Management and Neuberger; (2) the performance of the Fund compared to a relevant market index and a peer group of investment companies; (3) the costs of the services provided and profits or losses realized by Management and its affiliates from their relationship with the Fund; (4) the extent to which economies of scale might be realized as the Fund grows; and (5) whether fee levels reflect any such potential economies of scale for the benefit of investors in the Fund. In their deliberations, the Independent Trustees did not identify any particular information that was all important or controlling, and each Trustee may have attributed different weights to the various factors.
37
In unanimously approving and recommending the New Agreements, the Independent Trustees concluded that the terms of each New Agreement are fair and reasonable and that approval of the New Agreements is in the best interests of the Fund and its shareholders. In reaching this determination, the Independent Trustees considered the following factors, among others:
(1) that the terms of the New Agreements are identical in all material respects to those of the Existing Agreements;
(2) that the Advisers will maintain operational autonomy and continuity of management following the Proposed Acquisition;
(3) the favorable history, reputation, qualification, and background of Management and Neuberger, as well as the qualifications of each entity's personnel and each entity's respective financial condition;
(4) the commitment of NBSH (or its successors or assign) to retain key personnel currently employed by Management and Neuberger who currently provide services to the Fund;
(5) the commitment of NBSH (or its successors or assign) to maintaining the current level and quality of Fund services;
(6) the proposed division of equity in NBSH (or its successor or assign) among Management Members and other personnel upon consummation of the Proposed Acquisition;
(7) the fees and expense ratio of the Fund relative to comparable mutual funds;
(8) that the fees are identical to those paid under the Existing Agreements;
(9) that the fees and expense ratios of the Fund appear to the Board to be reasonable given the quality of services expected to be provided;
(10) the commitment of Management to maintaining the Fund's current contractual expense limitation agreements to ensure that Fund shareholders of funds that have such arrangements in place do not face an increase in expenses upon consummation of the Proposed Acquisition;
(11) the performance of the Fund relative to comparable mutual funds and unmanaged indices;
(12) the commitment of Management (or its successor) to pay the expenses of the Fund in connection with the Proposed Acquisition, including all expenses in connection with the solicitation of proxies, so that shareholders of the Fund would not have to bear such expenses;
(13) the actual and potential effects on the Advisers of the bankruptcy of Lehman Brothers, and the effects of the Lehman Brothers bankruptcy on the information considered by the Independent Trustees in their prior analyses of the principal service contracts;
(14) the provisions made to continue providing to the Advisers certain services that were previously provided to them by or through Lehman Brothers or its other affiliates;
(15) the possible benefits that may be realized by the Fund and by the Advisers as a result of the Proposed Acquisition; and
(16) that the Proposed Acquisition is expected to maintain continuity of management of the Fund and may reduce the potential for future vulnerability to changes in control of the Advisers that could be adverse to the Fund's interests and that could affect the retention of key employees providing services to the Fund.
38

Neuberger Berman
Advisers Management Trust
Partners Portfolio
I Class Shares
Annual Report
December 31, 2008
B1010 02/09
Partners Portfolio Manager's Commentary
The Neuberger Berman Advisers Management Trust (AMT) Partners Portfolio significantly outperformed both the Russell 1000(R) Value Index and the S&P 500 Index in the first half of 2008. However, the Portfolio posted a negative return during that period as stocks were pressured by the ongoing housing slump, skyrocketing oil prices, continued write-offs at leading financial institutions, and diminished consumer confidence. In the second half of 2008, economic and market conditions deteriorated even further as the collapse of Bear Stearns (in March) and Lehman Brothers (in September) and the accompanying credit crisis turned a smoldering U.S. recession into a serious global economic slowdown. Forced liquidation by highly leveraged hedge funds faced with margin calls and broad based selling by mutual funds to meet rising redemptions further undermined stocks. Due primarily to lagging performance in the Energy, Materials and Industrials sectors, the Portfolio finished 2008 trailing both the Russell 1000 Value Index and the S&P 500 Index.
Within the stock market, there was virtually no place to escape the broad based declines of 2008. All 10 of the Russell 1000 Value Index sectors posted double-digit losses and six of 10 sectors declined by 30% or more. Even traditionally defensive sectors such as Consumer Staples, Health Care and Utilities fell sharply. We failed to anticipate the collapse of Lehman Brothers on September 15, 2008 and underestimated how swiftly and severely it would impact the economy and the stock market. Other than maintaining our course, the only option would have been to sell high quality companies with good long-term prospects at fire sale prices - - a strategy we believe would have further penalized shareholders.
Only a handful of portfolio companies managed to post positive returns in this dismal market, including Switzerland-based power and automation equipment manufacturer ABB Ltd., which primarily serves the utilities industry. In addition, we took a good profit on video game software producer Take-Two Interactive before its proposed acquisition by Electronic Arts fell through. The Portfolio's largest performance detractors were troubled financial giant Citigroup, energy infrastructure construction firm Chicago Bridge & Iron, and industrial metals company Freeport-McMoRan Copper & Gold.
Relative to the Russell 1000 Value Index, the Portfolio was overweighted in Energy and portfolio holdings, primarily oil-oriented exploration and production companies and oil services firms, declined sharply as energy prices collapsed in the fourth quarter. Our modest exposure to the major integrated oils, although they held up relative to other energy stocks as energy prices plummeted, also penalized returns versus this index. Materials sector investments, primarily metals and mining stocks, also underperformed as materials prices cratered in anticipation of the global economic slowdown. Our Industrials sector investments were concentrated in secular growth businesses, most notably energy infrastructure. With falling energy prices and constrained infrastructure spending threatening to delay projects, these holdings were hit particularly hard.
Information Technology was our only significant relative performance bright spot. The Portfolio was materially overweighted in the sector and our holdings declined only half as much as the corresponding benchmark sector.
We remain constructive on Energy because we believe that, over the longer term, demand will outpace supply growth constrained by the relatively high decline rates of existing wells, the lack of major new discoveries, the rising cost of exploration and production, and ongoing political instability in major energy producing nations. We make a similar case for Materials sector holdings. While demand in emerging market economies (in our view, the real underpinning of global materials demand) has slowed temporarily, we currently believe government stimulus packages and essential infrastructure spending will eventually result in a substantial increase in materials prices from currently depressed levels. Over the intermediate term, the building of refineries, pipelines, liquefied natural gas processing facilities, and power generation plants may temporarily be put on hold. However, when the global economy regains traction, we currently believe the well positioned portfolio companies in these businesses should quickly regain earnings momentum, especially those with a significant percentage of revenue coming from developing nations.
It is difficult to predict precisely when the U.S. and global economies will begin to firm. However, we note that the November 24 rescue of Citigroup along with the Treasury Department and Federal Reserve's moves to lower interest rates, promote inter-bank lending and narrow credit spreads are beginning to have a positive impact on the credit markets. Also, we think that the economy has yet to receive the full benefit of much cheaper energy prices, the equivalent of a
1
major tax break for consumers. Finally, we expect that a substantial federal fiscal stimulus package will be put into effect shortly.
While there might be more negative economic headlines in the months ahead, we currently believe the stage is set for the U.S. and global economies to emerge from recession in the second half of 2009. If past is prologue, the stock market could begin anticipating better economic news six to nine months ahead of its arrival. With high quality stocks in most market sectors trading at historically low valuations, we think equities may have already bottomed and are poised to begin regaining lost ground in the quarters ahead.
With unprecedented fundamental bargains abounding in the severely depressed Energy, Materials and Industrials sectors, we feel that the AMT Partners Portfolio is well positioned to benefit when the stock market regains traction. While one month does not a trend make, we are pleased that the AMT Partners Portfolio materially outperformed the Russell 1000 Value Index during December, as stocks posted a modest recovery.
Sincerely,

S. Basu Mullick
Portfolio Manager
2
Partners Portfolio
SECTOR ALLOCATION
| (% of Equity Market Value) | |
| Energy | | | 20.6 | % | |
| Materials | | | 5.0 | | |
| Industrials | | | 9.7 | | |
| Consumer Discretionary | | | 9.4 | | |
| Consumer Staples | | | 8.2 | | |
| Health Care | | | 9.6 | | |
| Financials | | | 21.4 | | |
| Information Technology | | | 10.0 | | |
| Telecomm Service | | | 2.5 | | |
| Utilities | | | 3.6 | | |
| Total | | | 100.0 | % | |
AVERAGE ANNUAL TOTAL RETURN1
| | | Inception
Date | | 1 Year | | 5 Year | | 10 Year | | Life of
Fund* | |
| Partners Portfolio Class I | | 03/22/94 | | | (52.37 | %) | | | (3.88 | %) | | | (1.23 | %) | | | 5.10 | % | |
| Russell 1000(R) Value2 | | | | | (36.85 | %) | | | (0.79 | %) | | | 1.36 | % | | | 7.50 | % | |
| S&P 5002 | | | | | (37.00 | %) | | �� | (2.19 | %) | | | (1.38 | %) | | | 6.48 | % | |
Performance data quoted represent past performance, which is no guarantee of future results. The investment return and principal value of an investment will fluctuate so that an investor's shares, when redeemed may be worth more or less than their original cost. Results are shown on a "total return" basis and include reinvestment of all dividends and capital gain distributions.
Current performance may be lower or higher than the performance data quoted. For performance data current to the most recent month end, please visit https://www.nb.com.
* Index returns are as of inception date 3/22/94.
As stated in the Portfolio's most recent prospectus, the total annual fund operating expense ratio for fiscal year 2007 was 0.91% for Class I shares (prior to any fee waivers or expense reimbursements). Neuberger Berman Management LLC has contractually agreed to limit certain expenses of the Portfolio through 12/31/2011.
COMPARISON OF A $10,000 INVESTMENT
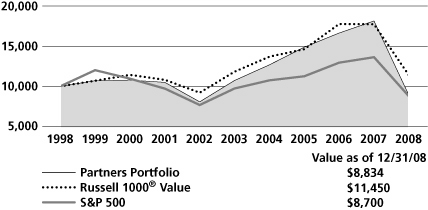
The chart shows the value of a hypothetical $10,000 investment in the Portfolio over the past 10 fiscal years, or since the Portfolio's inception, if it has not operated for 10 years. The result is compared with benchmarks, which may include a broadbased market index and/or a narrower index.
Please note that market indexes do not include expenses. All results include the reinvestment of dividends and capital gain distributions. Results represent past performance and do not indicate future results. The chart and table do not reflect the deduction of taxes that a shareholder would pay on Portfolio distributions or the redemption of Portfolio shares.
Please see Endnotes for additional information.
3
Endnotes
1 "Total Return" includes reinvestment of all income dividends and capital gain distributions. Results represent past performance and do not indicate future results. The value of an investment in the Portfolio and the return on the investment both will fluctuate, and redemption process may be higher or lower than an investor's original cost. The performance information does not reflect fees and expenses of the variable annuity and variable life insurance policies or the pension plans whose proceeds are invested in the Portfolio. Neuberger Berman Management LLC ("NBM LLC") has agreed to absorb certain expenses of the AMT Portfolios, including the Portfolio. Without this arrangement, which is subject to change, the total returns of the Portfolio may have been less.
2 The S&P 500 Index is widely regarded as the standard for measuring large-cap U.S. stock market performance and includes a representative sample of the leading companies in leading industries. The Russell 1000(R) Index measures the performance of the 1,000 largest companies in the Russell 3000(R) Index (which measures the performance of the 3,000 largest U.S. companies based on total market capitalization). The Russell 1000 Index represents approximately 92% of the total market capitalization of the Russell 3000 Index. The Russell 1000(R) Value Index measures the performance of those Russell 1000 companies with lower price-to-book ratios and lower forecasted growth values. Please note that indices do not take into account any fees and expenses of investing in the individual securities that they track and that individuals cannot invest directly in any index. Data about the performance of these indices are prepared or obtained by NBM LLC and include reinvestment of all dividends and capital gain distributions. The Portfolio may invest in many securities not included in the above-described indices.
Any ratios or other measurements using a factor of forecasted earnings of a company discussed herein are based on consensus estimates, not NBM LLC's own projections, and they may or may not be realized. In addition, any revision to a forecast could affect the market price of a security. By quoting them herein, NBM LLC does not offer an opinion as to the accuracy of and does not guarantee these forecasted numbers.
The investments for the Portfolio are managed by the same portfolio manager(s) who manage one or more other mutual funds that have similar names, investment objectives and investment styles as the Portfolio. You should be aware that the Portfolio is likely to differ from the other mutual funds in size, cash flow pattern and tax matters.
Accordingly, the holdings and performance of the Portfolio can be expected to vary from those of the other mutual funds.
The composition, industries and holdings of the Portfolio are subject to change.
Shares of the separate AMT Portfolios are sold only through the currently effective prospectus and are not available to the general public. Shares of this Portfolio may be purchased only by life insurance companies to be used with their separate accounts that fund variable annuity and variable life insurance policies and by qualified pension and retirement plans.
(c)2009 Neuberger Berman Management LLC distributor. All rights reserved.
4
Information About Your Fund's Expenses
This table is designed to provide information regarding costs related to your investments. All mutual funds incur operating expenses, which include management fees, fees for administrative services and costs of shareholder reports, among others. The following examples are based on an investment of $1,000 made at the beginning of the six month period ended December 31, 2008 and held for the entire period. The table illustrates the fund's costs in two ways:
| Actual Expenses and Performance: | | The first section of the table provides information about actual account values and actual expenses in dollars, based on the fund's actual performance during the period. You may use the information in this line, together with the amount you invested, to estimate the expenses you paid over the period. Simply divide your account value by $1,000 (for example, an $8,600 account value divided by $1,000 = 8.6), then multiply the result by the number in the first section of the table under the heading entitled "Expenses Paid During the Period" to estimate the expenses you paid over the period. | |
|
Hypothetical Example for
Comparison Purposes: | | The second section of the table provides information about hypothetical account values and hypothetical expenses based on the fund's actual expense ratio and an assumed rate of return at 5% per year before expenses. This return is not the fund's actual return. The hypothetical account values and expenses may not be used to estimate the actual ending account balance or expenses you paid for the period. You may use this information to compare the ongoing costs of investing in this fund versus other funds. To do so, compare the expenses shown in this 5% hypothetical example with the 5% hypothetical examples that appear in the shareholder reports of other funds. | |
|
Please note that the expenses in the table are meant to highlight your ongoing costs only. The table and the expense example do not include any transactional costs, such as fees and expenses that are, or may be, imposed under your variable contract or qualified pension plan. Therefore, the information under the heading "Hypothetical (5% annual return before expenses)" is useful in comparing ongoing costs only, and will not help you determine the relative total costs of owning different funds. In addition, if these transactional costs were included, your costs would have been higher.
Expense Information As of 12/31/08 (Unaudited)
NEUBERGER BERMAN ADVISERS MANAGEMENT TRUST PARTNERS PORTFOLIO
| Actual | | Beginning Account
Value 7/1/08 | | Ending Account
Value 12/31/08 | | Expenses Paid During
the Period* 7/1/08 - 12/31/08 | |
| Class I | | $ | 1,000.00 | | | $ | 500.20 | | | $ | 3.66 | | |
| Hypothetical (5% annual return before expenses) ** | |
| Class I | | $ | 1,000.00 | | | $ | 1,020.26 | | | $ | 4.93 | | |
* Expenses are equal to the annualized expense ratio of .97%, multiplied by the average account value over the period, multiplied by 184/366 (to reflect the one-half year period shown).
** Hypothetical 5% annual return before expenses is calculated by multiplying the number of days in the most recent half year divided by 366.
5
Schedule of Investments Partners Portfolio
| NUMBER OF SHARES | | | | MARKET VALUEt | |
| Common Stocks (96.7%) | | | |
| Aerospace & Defense (1.8%) | | | |
| | 52,300 | | | L-3 Communications
Holdings | | $ | 3,858,694 | | |
| Automobiles (0.3%) | | | |
| | 45,700 | | | Harley-Davidson | | | 775,529 | | |
| Beverages (3.8%) | | | |
| | 347,900 | | | Constellation Brands | | | 5,486,383 | *E | |
| | 174,600 | | | Dr. Pepper Snapple Group | | | 2,837,250 | * | |
| | | | 8,323,633 | | |
| Capital Markets (6.3%) | | | |
| | 69,000 | | | Bank of New York Mellon | | | 1,954,770 | | |
| | 55,700 | | | Goldman Sachs Group | | | 4,700,523 | E | |
| | 350,900 | | | Invesco Ltd. | | | 5,066,996 | E | |
| | 126,900 | | | Morgan Stanley | | | 2,035,476 | | |
| | | | 13,757,765 | | |
| Construction & Engineering (2.6%) | | | |
| | 298,400 | | | Chicago Bridge & Iron | | | 2,998,920 | | |
| | 179,400 | | | KBR, Inc. | | | 2,726,880 | | |
| | | | 5,725,800 | | |
| Consumer Finance (1.6%) | | | |
| | 189,200 | | | American Express | | | 3,509,660 | | |
| Diversified Financial Services (2.9%) | | | |
| | 77,400 | | | Bank of America | | | 1,089,792 | | |
| | 258,400 | | | Moody's Corp. | | | 5,191,256 | E | |
| | | | 6,281,048 | | |
| Electric Utilities (1.5%) | | | |
| | 68,200 | | | FirstEnergy Corp. | | | 3,313,156 | | |
| Electrical Equipment (1.5%) | | | |
| | 218,700 | | | ABB Ltd. | | | 3,282,687 | | |
| Energy Equipment & Services (4.0%) | | | |
| | 176,300 | | | Halliburton Co. | | | 3,205,134 | E | |
| | 116,900 | | | National Oilwell Varco | | | 2,857,036 | *E | |
| | 118,700 | | | Noble Corp. | | | 2,622,083 | | |
| | | | 8,684,253 | | |
| Financial Services (1.3%) | | | |
| | 431,800 | | | Citigroup Inc. | | | 2,897,378 | | |
| NUMBER OF SHARES | | | | MARKET VALUEt | |
| Health Care Equipment & Supplies (1.3%) | | | |
| | 32,500 | | | Covidien Ltd. | | $ | 1,177,800 | | |
| | 39,900 | | | Zimmer Holdings | | | 1,612,758 | * | |
| | | | 2,790,558 | | |
| Health Care Providers & Services (5.4%) | | | |
| | 175,000 | | | Aetna Inc. | | | 4,987,500 | | |
| | 71,400 | | | Cardinal Health | | | 2,461,158 | | |
| | 102,300 | | | WellPoint Inc. | | | 4,309,899 | * | |
| | | | 11,758,557 | | |
| Household Durables (1.4%) | | | |
| | 6,600 | | | NVR, Inc. | | | 3,011,250 | *E | |
| Household Products (2.3%) | | | |
| | 91,700 | | | Energizer Holdings | | | 4,964,638 | * | |
Independent Power Producers &
Energy Traders (2.0%) | | | |
| | 183,300 | | | NRG Energy | | | 4,276,389 | *E | |
| Industrial Conglomerates (1.6%) | | | |
| | 192,800 | | | McDermott International | | | 1,904,864 | * | |
| | 96,100 | | | Walter Industries | | | 1,682,711 | | |
| | | | 3,587,575 | | |
| Insurance (6.5%) | | | |
| | 124,300 | | | Assurant, Inc. | | | 3,729,000 | E | |
| | 2,400 | | | Berkshire Hathaway Class B | | | 7,713,600 | * | |
| | 77,700 | | | MetLife, Inc. | | | 2,708,622 | | |
| | | | 14,151,222 | | |
| IT Services (5.3%) | | | |
| | 90,100 | | | Affiliated Computer Services | | | 4,140,095 | *E | |
| | 248,700 | | | Fidelity National
Information Services | | | 4,046,349 | | |
| | 116,100 | | | Lender Processing Services | | | 3,419,145 | E | |
| | | | 11,605,589 | | |
| Machinery (2.0%) | | | |
| | 246,100 | | | Terex Corp. | | | 4,262,452 | * | |
| Marine (0.6%) | | | |
| | 126,000 | | | DryShips Inc. | | | 1,343,160 | E | |
| Media (2.4%) | | | |
| | 41,100 | | | Cablevision Systems | | | 692,124 | | |
| | 201,000 | | | McGraw-Hill Cos. | | | 4,661,190 | | |
| | | | 5,353,314 | | |
See Notes to Schedule of Investments 6
| NUMBER OF SHARES | | | | MARKET VALUEt | |
| Metals & Mining (4.8%) | | | |
| | 60,300 | | | Cliffs Natural Resources | | $ | 1,544,283 | | |
| | 118,500 | | | Freeport-McMoRan
Copper & Gold | | | 2,896,140 | E | |
| | 204,600 | | | Sterlite Industries (India) ADR | | | 1,129,392 | | |
| | 316,200 | | | Teck Cominco Class B | | | 1,555,704 | | |
| | 52,000 | | | United States Steel | | | 1,934,400 | | |
| | 163,900 | | | Xstrata PLC | | | 1,508,143 | | |
| | | | 10,568,062 | | |
| Multiline Retail (3.4%) | | | |
| | 183,200 | | | J.C. Penney | | | 3,609,040 | E | |
| | 369,300 | | | Macy's Inc. | | | 3,822,255 | E | |
| | | | 7,431,295 | | |
| Oil, Gas & Consumable Fuels (15.2%) | | | |
| | 117,100 | | | Canadian Natural Resources | | | 4,681,658 | | |
| | 209,200 | | | Denbury Resources | | | 2,284,464 | *E | |
| | 60,000 | | | EOG Resources | | | 3,994,800 | | |
| | 500 | | | Exxon Mobil | | | 39,915 | | |
| | 50,600 | | | Frontline Ltd. | | | 1,445,281 | E | |
| | 97,300 | | | Peabody Energy | | | 2,213,575 | | |
| | 212,000 | | | Petroleo Brasileiro ADR | | | 5,191,880 | | |
| | 147,947 | | | Ship Finance International | | | 1,634,814 | E | |
| | 146,600 | | | Southwestern Energy | | | 4,247,002 | * | |
| | 132,690 | | | Suncor Energy | | | 2,587,455 | | |
| | 201,745 | | | Talisman Energy | | | 2,015,433 | | |
| | 77,916 | | | XTO Energy | | | 2,748,097 | | |
| | | | 33,084,374 | | |
| Personal Products (1.8%) | | | |
| | 251,500 | | | NBTY, Inc. | | | 3,935,975 | * | |
| Pharmaceuticals (2.6%) | | | |
| | 124,600 | | | Shire Limited ADR | | | 5,579,588 | | |
| Real Estate Investment Trusts (2.1%) | | | |
| | 247,200 | | | Annaly Capital Management | | | 3,923,064 | | |
| | 9,500 | | | Vornado Realty Trust | | | 573,325 | | |
| | | | 4,496,389 | | |
Semiconductors &
Semiconductor Equipment (0.9%) | | | |
| | 139,800 | | | International Rectifier | | | 1,887,300 | *E | |
| Software (3.5%) | | | |
| | 78,200 | | | Check Point Software
Technologies | | | 1,485,018 | * | |
| | 107,500 | | | Microsoft Corp. | | | 2,089,800 | | |
| | 102,300 | | | Oracle Corp. | | | 1,813,779 | * | |
| | 164,557 | | | Symantec Corp. | | | 2,224,810 | * | |
| | | | 7,613,407 | | |
| Specialty Retail (1.6%) | | | |
| | 125,300 | | | Best Buy | | | 3,522,183 | E | |
| NUMBER OF SHARES | | | | MARKET VALUEt | |
| Wireless Telecommunication Services (2.4%) | | | |
| | 102,000 | | | China Mobile ADR | | $ | 5,186,700 | | |
| | | | | Total Common Stocks
(Cost $314,022,373) | | | 210,819,580 | | |
| Short-Term Investments (18.1%) | | | |
| | 6,515,863 | | | Neuberger Berman Prime
Money Fund Trust Class | | | 6,515,863 | aoo | |
| | 32,858,620 | | | Neuberger Berman Securities
Lending Quality Fund, LLC | | | 32,858,620 | t | |
| | | | | Total Short-Term Investments
(Cost $39,374,483) | | | 39,374,483 | | |
| | | | | Total Investments (114.8%)
(Cost $353,396,856) | | | 250,194,063 | ## | |
| | | | | Liabilities, less cash, receivables
and other assets [(14.8%)] | | | (32,314,841 | ) | |
| | | | | Total Net Assets (100.0%) | | $ | 217,879,222 | | |
See Notes to Schedule of Investments 7
Notes to Schedule of Investments Partners Portfolio
t Investments in equity securities by Neuberger Berman Advisers Management Trust Partners Portfolio (the "Fund") are valued by obtaining valuations from an independent pricing service. The independent pricing service values equity securities at the latest sale price when that price is readily available. Securities traded primarily on the NASDAQ Stock Market are normally valued by the Fund at the NASDAQ Official Closing Price ("NOCP") provided by NASDAQ each business day. The NOCP is the most recently reported price as of 4:00:02 p.m., Eastern time, unless that price is outside the range of the "inside" bid and asked prices (i.e., the bid and asked prices that dealers quote to each other when trading for their own accounts); in that case, NASDAQ will adjust the price to equal the inside bid or asked price, whichever is closer. Because of delays in reporting trades, the NOCP may not be based on the price of the last trade to occur before the market closes. If there is no reported sale of a security on a particular day, the independent pricing service may value the security based on reported market quotations. If a valuation is not available from an independent pricing service, the Fund seeks to obtain quotations from principal market makers. If such quotations are not readily available, securities are valued using methods the Board of Trustees of Neuberger Berman Advisers Management Trust (the "Board") has approved on the belief that they reflect fair value. Numerous factors may be considered when determining the fair value of a security, including available analyst, media or other reports, trading in futures or ADRs and whether the issuer of the security being fair valued has other securities outstanding. Foreign security prices are furnished by independent quotation services and expressed in local currency values. Foreign security prices are currently translated from the local currency into U.S. dollars using the exchange rate as of 4:00 p.m., Eastern time. The Board has approved the use of Interactive Data Pricing and Reference Data, Inc. ("Interactive") to assist in determining the fair value of the Fund's foreign equity securities when changes in the value of a certain index suggest that the closing prices on the foreign exchanges may no longer represent the amount that the Fund could expect to receive for those securities. In this event, Interactive will provide adjusted prices for certain foreign equity securities using a statistical analysis of historical correlations of multiple factors. In the absence of precise information about the market values of these foreign securities as of the close of the New York Stock Exchange, the Board has determined on the basis of available data that prices adjusted in this way are likely to be closer to the prices the Fund could realize on a current sale than are the prices of those securities established at the close of the foreign markets in which the securities primarily trade. Fair value prices are necessarily estimates, and there is no assurance that such a price will be at or close to the price at which the security next trades. Short-term debt securities with less than 60 days until maturity may be valued at cost which, when combined with interest earned, approximates market value.
The Fund adopted Financial Accounting Standards Board ("FASB") Statement of Financial Accounting Standards No. 157, Fair Value Measurements ("FAS 157"), effective January 1, 2008. In accordance with FAS 157, "fair value" is defined as the price that a Fund would receive upon selling an investment in an orderly transaction to an independent buyer in the principal or most advantageous market for the investment. Various inputs are used in determining the value of the Fund's investments.
In addition to defining fair value, FAS 157 established a three-tier hierarchy of inputs to establish a classification of fair value measurements for disclosure purposes. The three-tier hierarchy of inputs is summarized in the three broad Levels listed below.
. Level 1 - quoted prices in active markets for identical investments
. Level 2 - other significant observable inputs (including quoted prices for similar investments, interest rates, prepayment speeds, credit risk, amortized cost, etc.)
. Level 3 - significant unobservable inputs (including the Fund's own assumptions in determining the fair value of investments)
The inputs or methodology used for valuing an investment are not necessarily an indication of the risk associated with investing in those securities.
See Notes to Financial Statements 8
Notes to Schedule of Investments Partners Portfolio (cont'd)
The following is a summary of the inputs used to value the Fund's investments as of December 31, 2008:
| Valuation Inputs | | Investments in
Securities | |
| Level 1 - Quoted Prices | | $ | 210,819,580 | | |
| Level 2 - Other Significant Observable Inputs | | | 39,374,483 | | |
| Level 3 - Significant Unobservable Inputs | | | - | | |
| Total | | $ | 250,194,063 | | |
## At December 31, 2008, the cost of investments for U.S. federal income tax purposes was $354,684,422. Gross unrealized appreciation of investments was $18,833,614 and gross unrealized depreciation of investments was $123,323,973, resulting in net unrealized depreciation of $104,490,359, based on cost for U.S. federal income tax purposes.
* Security did not produce income during the last twelve months.
E All or a portion of this security is on loan (see Note A of Notes to Financial Statements).
t Managed by an affiliate of Neuberger Berman Management LLC and could be deemed an affiliate of the Fund (see Notes A & F of Notes to Financial Statements).
a Neuberger Berman Prime Money Fund ("Prime Money") is also managed by Neuberger Berman Management LLC and may be considered an affiliate since it has the same officers, Board members, and investment manager as the Fund and because, at times, the Fund may own 5% or more of the outstanding voting securities of Prime Money (see Notes A & F of Notes to Financial Statements).
oo All or a portion of this security is segregated in connection with obligations for security lending.
See Notes to Financial Statements 9
Statement of Assets and Liabilities
Neuberger Berman Advisers Management Trust
| | | PARTNERS
PORTFOLIO | |
| | | December 31, 2008 | |
| Assets | |
| Investments in securities, at market value *t (Notes A & F)-see Schedule of Investments: | |
| Unaffiliated issuers | | $ | 210,819,580 | | |
| Affiliated issuers | | | 39,374,483 | | |
| | | | 250,194,063 | | |
| Cash | |
| Foreign currency | | | 318,146 | | |
| Dividends and interest receivable | | | 508,103 | | |
| Receivable for securities sold | | | 2,810,591 | | |
| Receivable for Fund shares sold | | | 527,367 | | |
| Receivable for securities lending income (Note A) | | | 66,928 | | |
| Prepaid expenses and other assets | | | 13,928 | | |
| Total Assets | | | 254,439,126 | | |
| Liabilities | |
| Due to custodian | | | 10,899 | | |
| Payable for collateral on securities loaned (Note A) | | | 33,314,341 | | |
| Payable for securities purchased | | | 2,842,175 | | |
| Payable for Fund shares redeemed | | | 91,472 | | |
| Payable to investment manager-net (Notes A & B) | | | 95,652 | | |
| Payable to administrator (Note B) | | | 52,330 | | |
| Payable for securities lending fees (Note A) | | | 79,743 | | |
| Accrued expenses and other payables | | | 73,292 | | |
| Total Liabilities | | | 36,559,904 | | |
| Net Assets at value | | $ | 217,879,222 | | |
| Net Assets consist of: | |
| Paid-in capital | | $ | 317,871,380 | | |
| Undistributed net investment income (loss) | | | 2,063,696 | | |
| Accumulated net realized gains (losses) on investments | | | 1,142,659 | | |
| Net unrealized appreciation (depreciation) in value of investments | | | (103,198,513 | ) | |
| Net Assets at value | | $ | 217,879,222 | | |
| Shares Outstanding ($.001 par value; unlimited shares authorized) | | | 30,647,477 | | |
| Net Asset Value, offering and redemption price per share | | $ | 7.11 | | |
| tSecurities on loan, at market value: | |
| Unaffiliated issuers | | $ | 32,539,856 | | |
| *Cost of Investments: | |
| Unaffiliated issuers | | $ | 314,022,373 | | |
| Affiliated issuers | | | 39,374,483 | | |
| Total cost of investments | | $ | 353,396,856 | | |
| Total cost of foreign currency | | $ | 314,003 | | |
See Notes to Financial Statements 10
Statement of Operations
Neuberger Berman Advisers Management Trust
| | | PARTNERS
PORTFOLIO | |
| | | For the Year Ended
December 31, 2008 | |
| Investment Income: | |
| Income (Note A): | |
| Dividend income-unaffiliated issuers | | $ | 5,769,814 | | |
| Interest income-unaffiliated issuers | | | 489 | | |
| Income from securities loaned-net (Note F) | | | 142,783 | | |
| Income from investments in affiliated issuers (Note F) | | | 105,164 | | |
| Foreign taxes withheld | | | (46,134 | ) | |
| Total income | | $ | 5,972,116 | | |
| Expenses: | |
| Investment management fees (Notes A & B) | | | 2,189,292 | | |
| Administration fees (Note B) | | | 1,216,755 | | |
| Audit fees | | | 40,493 | | |
| Custodian fees (Note B) | | | 158,833 | | |
| Insurance expense | | | 13,401 | | |
| Legal fees | | | 84,717 | | |
| Shareholder reports | | | 77,564 | | |
| Trustees' fees and expenses | | | 38,157 | | |
| Miscellaneous | | | 20,291 | | |
| Total expenses | | | 3,839,503 | | |
| Investment management fees waived (Note A) | | | (3,210 | ) | |
| Expenses reduced by custodian fee expense offset and commission recapture arrangements (Note B) | | | (29,372 | ) | |
| Total net expenses | | | 3,806,921 | | |
| Net investment income (loss) | | $ | 2,165,195 | | |
| Realized and Unrealized Gain (Loss) on Investments (Note A) | |
| Net realized gain (loss) on: | |
| Sales of investment securities of unaffiliated issuers | | | 2,363,532 | | |
| Sales of investment securities of affiliated issuers | | | (455,721 | ) | |
| Foreign currency | | | (99,190 | ) | |
| Change in net unrealized appreciation (depreciation) in value of: | |
| Unaffiliated investment securities | | | (260,930,599 | ) | |
| Foreign currency | | | 2,437 | | |
| Net gain (loss) on investments | | | (259,119,541 | ) | |
| Net increase (decrease) in net assets resulting from operations | | $ | (256,954,346 | ) | |
See Notes to Financial Statements 11
Statements of Changes in Net Assets
Neuberger Berman Advisers Management Trust
| | | PARTNERS PORTFOLIO | |
| | | Year Ended
December 31, 2008 | | Year Ended
December 31, 2007 | |
| Increase (Decrease) in Net Assets: | |
| From Operations: | |
| Net investment income (loss) | | $ | 2,165,195 | | | $ | 2,000,409 | | |
| Net realized gain (loss) on investments | | | 1,808,621 | | | | 65,506,442 | | |
| Change in net unrealized appreciation (depreciation) of investments | | | (260,928,162 | ) | | | (12,182,786 | ) | |
| Net increase (decrease) in net assets resulting from operations | | | (256,954,346 | ) | | | 55,324,065 | | |
| Distributions to Shareholders From (Note A): | |
| Net Investment Income | | | (2,046,204 | ) | | | (3,816,492 | ) | |
| Net realized gain on investments | | | (64,539,060 | ) | | | (59,722,441 | ) | |
| Total distributions to shareholders | | | (66,585,264 | ) | | | (63,538,933 | ) | |
| From Fund Share Transactions (Note D): | |
| Proceeds from shares sold | | | 63,374,984 | | | | 62,067,752 | | |
| Proceeds from reinvestment of dividends and distributions | | | 66,585,264 | | | | 63,538,933 | | |
| Payments for shares redeemed | | | (115,216,858 | ) | | | (221,919,367 | ) | |
| Net increase (decrease) from Fund share transactions | | | 14,743,390 | | | | (96,312,682 | ) | |
| Net Increase (Decrease) in Net Assets | | | (308,796,220 | ) | | | (104,527,550 | ) | |
| Net Assets: | |
| Beginning of year | | | 526,675,442 | | | | 631,202,992 | | |
| End of year | | $ | 217,879,222 | | | $ | 526,675,442 | | |
| Undistributed net investment income (loss) at end of year | | $ | 2,063,696 | | | $ | 2,043,895 | | |
See Notes to Financial Statements 12
Notes to Financial Statements Partners Portfolio
Note A-Summary of Significant Accounting Policies:
1 General: Partners Portfolio (the "Fund") is a separate operating series of Neuberger Berman Advisers Management Trust (the "Trust"), a Delaware statutory trust organized pursuant to a Trust Instrument dated May 23, 1994. The Trust is currently comprised of ten separate operating series (each a "Series," collectively, the "Funds") each of which is diversified. The Trust is registered as an open-end management investment company under the Investment Company Act of 1940, as amended (the "1940 Act"), and its shares are registered under the Securities Act of 1933, as amended. The Fund currently offers only Class I shares. The Board of Trustees of the Trust (the "Board") may establish additional series or classes of shares without the approval of shareholders.
The assets of each Series belong only to that Series, and the liabilities of each Series are borne solely by that Series and no other.
The preparation of financial statements in accordance with U.S. generally accepted accounting principles requires Neuberger Berman Management LLC ("Management") to make estimates and assumptions at the date of the financial statements. Actual results could differ from those estimates.
Management, the investment manager of the Fund, and Neuberger Berman, LLC ("Neuberger"), the Fund's sub-adviser, are wholly owned subsidiaries of Lehman Brothers Holdings Inc. ("Lehman Brothers"), a publicly owned holding company. On September 15, 2008, Lehman Brothers filed a voluntary petition under Chapter 11 of the U.S. Bankruptcy Code. On December 3, 2008, NBSH Acquisition, LLC ("NBSH"), an entity organized by key members of Neuberger Berman's senior management, was selected as the successful bidder in the public auction to acquire a majority interest in Neuberger Berman's business and the fixed income and certain alternative asset management businesses of Lehman Brothers' Investment Management Division (together with Neuberger Berman, the "Acquired Businesses") (the "Proposed Acquisition"). On December 22, 2008, the bankruptcy court having jurisdiction over the Lehman Brothers matter approved the sale of the Acquired Businesses to NBSH (or its successor or assign), as the successful bidder. At the closing of the Proposed Acquisition, a majority interest in the Acquired Businesses will be directly or indirectly owned by portfolio managers, Neuberger Berman's management team and certain key members and senior professionals of the former Investment Management Division, as well as by Lehman Brothers and certain affiliates of Lehman Brothers. The transaction is subject to certain conditions and approvals.
These events, while affecting Lehman Brothers, have not had a material impact on the Fund or its operations. Management and Neuberger will continue to operate in the ordinary course of business as the investment manager and sub-adviser of the Fund.
Included in the Acquired Businesses are Management and Neuberger. The consummation of the Proposed Acquisition has been deemed to result in an "assignment" of the Fund's Management and Sub-Advisory Agreements which would, by law, automatically terminate those agreements. Accordingly, the Board, including the Trustees who are not "interested persons" of the Fund's investment manager and its affiliates or the Fund, has approved the new Management Agreements and Sub-Advisory Agreements for the Fund. The new agreements also will require the approval of the Fund's shareholders.
2 Portfolio valuation: Investment securities are valued as indicated in the notes following the Schedule of Investments.
3 Foreign currency translation: The accounting records of the Fund are maintained in U.S. dollars. Foreign currency amounts are currently translated into U.S. dollars using the exchange rates as of 4:00 p.m., Eastern time, to determine the value of investments, other assets and liabilities. Purchase and sale prices of securities, and income and expenses, are translated into U.S. dollars at the prevailing rate of exchange on the respective dates of such transactions. Net unrealized foreign currency gain (loss), if any, arises from changes in the value of assets and
13
liabilities, other than investments in securities, as a result of changes in exchange rates and is stated separately in the Statement of Operations.
4 Securities transactions and investment income: Securities transactions are recorded on trade date for financial reporting purposes. Dividend income is recorded on the ex-dividend date or, for certain foreign dividends, as soon as the Fund becomes aware of the dividends. Non-cash dividends included in dividend income, if any, are recorded at the fair market value of the securities received. Interest income, including accretion of original issue discount, where applicable, and accretion of discount on short-term investments, is recorded on the accrual basis. Realized gains and losses from securities transactions and foreign currency transactions, if any, are recorded on the basis of identified cost and stated separately in the Statement of Operations. Included in net realized gain (loss) on investments are proceeds from the settlements of class action litigation in which the Fund participated as a plaintiff. The amount of such proceeds for the year ended December 31, 2008 was $180,146.
5 Income tax information: The Funds are treated as separate entities for U.S. federal income tax purposes. It is the policy of the Fund to continue to qualify as a regulated investment company by complying with the requirements of Subchapter M of the Internal Revenue Code applicable to regulated investment companies and to distribute substantially all of its earnings to its shareholders. Therefore, no federal income or excise tax provision is required.
The Fund has adopted the provisions of Financial Accounting Standards Board Interpretation No. 48 ("FIN 48") "Accounting for Uncertainty in Income Taxes-an interpretation of FASB Statement No. 109". FIN 48 sets forth a minimum threshold for financial statement recognition of the benefit of a tax position taken, or expected to be taken, in a tax return. The Fund recognizes interest and penalties, if any, related to unrecognized tax benefits as an income tax expense in the Statement of Operations. The Fund is subject to examination by U.S. federal and state tax authorities for returns filed for the prior three fiscal years 2005 - 2007. As of December 31, 2008, the Fund did not have any unrecognized tax benefits.
Income distributions and capital gain distributions are determined in accordance with income tax regulations, which may differ from U.S. generally accepted accounting principles. These differences are primarily due to differing treatments of income and gains on various investment securities held by the Fund, timing differences and differing characterization of distributions made by the Fund as a whole. The Fund may also utilize earnings and profits distributed to shareholders on redemption of shares as a part of the dividends paid deduction for income tax purposes.
As determined on December 31, 2008, permanent differences resulting primarily from different book and tax accounting for foreign currency gains and losses were reclassified at fiscal year-end. These reclassifications had no effect on net income, net asset value or net asset value per share of the Fund.
The tax character of distributions paid during the years ended December 31, 2008 and December 31, 2007 was as follows:
| Ordinary Income | | Long-Term
Capital Gain | | Total | |
| 2008 | | 2007 | | 2008 | | 2007 | | 2008 | | 2007 | |
| $ | 2,583,312 | | | $ | 5,797,070 | | | $ | 64,001,952 | | | $ | 57,741,863 | | | $ | 66,585,264 | | | $ | 63,538,933 | | |
As of December 31, 2008, the components of distributable earnings (accumulated losses) on a U.S. federal income tax basis were as follows:
Undistributed
Ordinary
Income | | Undistributed
Long-Term
Gain | | Unrealized
Appreciation
(Depreciation) | | Loss
Carryforwards
and Deferrals | | Total | |
| $ | 2,063,696 | | | $ | 9,167,082 | | | $ | (104,486,074 | ) | | $ | (6,736,862 | ) | | $ | (99,992,158 | ) | |
The difference between book basis and tax basis distributable earnings is attributable primarily to timing differences of wash sales, partnership basis adjustments and post October loss deferral.
14
Under current tax law, certain net capital and net foreign currency losses realized after October 31 within the taxable year may be deferred and treated as occurring on the first day of the following tax year. For the year ended December 31, 2008, the Fund elected to defer $6,736,862 of net capital losses arising between November 1, 2008 and December 31, 2008.
6 Distributions to shareholders: The Fund may earn income, net of expenses, daily on its investments. Distributions from net investment income and net realized capital gains, if any, generally are distributed in October. Income distributions and capital gain distributions to shareholders are recorded on the ex-date.
7 Foreign taxes: Foreign taxes withheld represent amounts withheld by foreign tax authorities, net of refunds recoverable.
8 Expense allocation: Certain expenses are applicable to multiple funds. Expenses directly attributable to a Series are charged to that Series. Expenses of the Trust that are not directly attributed to a Series are allocated among the Funds, on the basis of relative net assets, except where a more appropriate allocation of expenses to each of the Funds can otherwise be made fairly. Expenses borne by the complex of related investment companies, which includes open-end and closed-end investment companies for which Management serves as investment manager, that are not directly attributed to a Series or the Trust are allocated among the Fund and the other investment companies in the complex or series thereof on the basis of relative net assets, except where a more appropriate allocation of expenses to each investment company in the complex or series thereof can otherwise be made fairly.
9 Repurchase agreements: The Fund may enter into repurchase agreements with institutions that Management has determined are creditworthy. Each repurchase agreement is recorded at cost. The Fund requires that the securities purchased in a repurchase agreement be transferred to the custodian in a manner sufficient to enable the Fund to assert a perfected security interest in those securities in the event of a default under the repurchase agreement. The Fund monitors, on a daily basis, the value of the securities transferred to ensure that their value, including accrued interest, is greater than amounts owed to the Fund under each such repurchase agreement.
10 Security lending: A third party, eSecLending, has assisted the Fund in conducting a bidding process to identify agents/principals that would pay a guaranteed amount to the Fund in consideration of the Fund entering into an exclusive securities lending arrangement.
eSecLending currently serves as exclusive lending agent for the Fund. Under the securities lending arrangement, the Fund receives cash collateral at the beginning of each transaction equal to at least 102% of the prior day's market value of the loaned securities (105% in the case of international securities). The Fund may invest all the cash collateral in Neuberger Berman Securities Lending Quality Fund, LLC ("Quality Fund"), a fund managed by Lehman Brothers Asset Management LLC ("LBAM"), an affiliate of Management.
At various times during the course of the Fund's fiscal year ended December 31, 2008, the Quality Fund's NAV was below $1.00 per share, which could have affected the NAV of the Fund with securities loans outstanding during the period. The Quality Fund's price per share on December 31, 2008 was $1.00. The market value of the Fund's investments in the Quality Fund as of that date, if any, is reflected in the Fund's Schedule of Investments. If it were necessary to liquidate assets in the Quality Fund to meet returns on outstanding securities loans at a time when the Quality Fund's price per share was less than $1.00, the Fund may not receive an amount from the Quality Fund that is equal in amount to the collateral the Fund would be required to return to the borrower of the securities and the Fund would be required to make up for this shortfall. In addition, as a result of recent reduced liquidity in the credit and fixed income markets, it may be difficult to dispose quickly of some securities in the Quality Fund at the price at which the Quality Fund is carrying them. The Quality Fund is not a money market fund that operates in accordance with Rule 2a-7 under the 1940 Act and there is no assurance that it will maintain a $1.00 share price.
Net income from the lending program represents the guaranteed amount received from a principal plus income earned on the cash collateral invested in Quality Fund or in other investments, less cash collateral fees and other expenses associated with the loans. For the fiscal year ended December 31, 2008, the Fund received net income under the securities lending arrangement of $142,783, which is reflected in the Statement of Operations under the
15
caption "Income from securities loaned-net." For the fiscal year ended December 31, 2008, "Income from securities loaned-net" consisted of $1,634,954 in income earned on cash collateral and guaranteed amounts (including $1,418,017 of interest income earned from the Quality Fund), less fees and expenses paid of $1,492,171.
11 Transactions with other funds managed by Neuberger Berman Management LLC: Pursuant to an Exemptive Order issued by the Securities and Exchange Commission, the Fund may invest in a money market fund managed by Management or an affiliate. The Fund invests in the Neuberger Berman Prime Money Fund ("Prime Money"), as approved by the Board. Prime Money seeks to provide the highest available current income consistent with safety and liquidity. For any cash that the Fund invests in Prime Money, Management waives a portion of its management fee equal to the management fee it receives from Prime Money on those assets (the "Arrangement"). For the year ended December 31, 2008, management fees waived under this Arrangement amounted to $3,210 and are reflected in the Statement of Operations under the caption "Investment management fees waived." For the year ended December 31, 2008, income earned under this Arrangement amounted to $105,164 and is reflected in the Statement of Operations under the caption "Income from investments in affiliated issuers."
12 Indemnifications: Like many other companies, the Trust's organizational documents provide that its officers and trustees are indemnified against certain liabilities arising out of the performance of their duties to the Trust. In addition, both in some of its principal service contracts and in the normal course of its business, the Trust enters into contracts that provide indemnifications to other parties for certain types of losses or liabilities. The Trust's maximum exposure under these arrangements is unknown as this could involve future claims against the Trust.
Note B-Management Fees, Administration Fees, Distribution Arrangements, and Other Transactions With Affiliates:
Fund shares are issued and redeemed in connection with investments in and payments under certain variable annuity contracts and variable life insurance policies issued through separate accounts of life insurance companies and are also offered directly to qualified pension and retirement plans.
The Fund retains Management as its investment manager under a Management Agreement. For such investment management services, the Fund pays Management a fee at the annual rate of 0.55% of the first $250 million of the Fund's average daily net assets, 0.525% of the next $250 million, 0.50% of the next $250 million, 0.475% of the next $250 million, 0.45% of the next $500 million, 0.425% of the next $2.5 billion, and 0.40% of average daily net assets in excess of $4 billion.
The Fund retains Management as its administrator under an Administration Agreement. The Fund pays Management an administration fee at the annual rate of 0.30% of its average daily net assets under this agreement. Additionally, Management retains State Street Bank and Trust Company ("State Street") as its sub-administrator under a Sub-Administration Agreement. Management pays State Street a fee for all services received under this agreement.
The Board adopted a non-fee distribution plan for the Fund.
Management has contractually undertaken through December 31, 2011 to forgo current payment of fees and/or reimburse the Fund for its operating expenses (excluding fees payable to Management, interest, taxes, brokerage commissions, extraordinary expenses, and transaction costs) ("Operating Expenses") which exceed, in the aggregate, 1.00% per annum of the Fund's average daily net assets (the "Expense Limitation"). For the year ended December 31, 2008, no reimbursement to the Fund was required. The Fund has agreed to repay Management through December 31, 2014 for fees and expenses foregone and/or its excess Operating Expenses previously reimbursed by Management, so long as its annual Operating Expenses during that period do not exceed its Expense Limitation, and the repayment is made within three years after the year in which Management issued the reimbursement or waived fees. During the year ended December 31, 2008, there was no repayment to Management under this agreement. At December 31, 2008, the Fund had no contingent liability to Management under this agreement.
16
Neuberger is retained by Management to furnish it with investment recommendations and research information without added cost to the Fund. Several individuals who are officers and/or trustees of the Trust are also employees of Neuberger and/or Management.
The Fund had entered into a commission recapture program, which enabled it to pay some of its operational expenses by recouping a portion of the commissions it paid to a broker that was not a related party of the Fund. Pursuant to the agreement, brokers paid recaptured commissions to the Fund's custodian and the custodian directed these amounts toward payment of expenses such as custodial, transfer agency or accounting services. Effective April 1, 2008, this commission recapture program was terminated. For the period ended March 31, 2008, the impact of this arrangement was a reduction of expenses of $28,809.
The Fund has an expense offset arrangement in connection with its custodian contract. For the year ended December 31, 2008, the impact of this arrangement was a reduction of expenses of $563.
Note C-Securities Transactions:
During the year ended December 31, 2008, there were purchase and sale transactions (excluding short-term securities) of $155,893,763 and $207,397,040, respectively.
During the year ended December 31, 2008, brokerage commissions on securities transactions paid to affiliated brokers were as follows: Neuberger received $0 and Lehman Brothers Inc. received $20,469.
Note D-Fund Share Transactions:
Share activity for the years ended December 31, 2008 and December 31, 2007 was as follows:
| | | For the Year Ended
December 31, | |
| | | 2008 | | 2007 | |
| Shares Sold | | | 3,800,349 | | | | 2,789,611 | | |
| Shares Issued on Reinvestment of Dividends and Distributions | | | 8,830,937 | | | | 2,995,706 | | |
| Shares Redeemed | | | (7,347,792 | ) | | | (10,251,527 | ) | |
| Total | | | 5,283,494 | | | | (4,466,210 | ) | |
Note E-Line of Credit:
At December 31, 2008, the Fund was a participant in a single committed, unsecured $150,000,000 line of credit with State Street, to be used only for temporary or emergency purposes. Other investment companies managed by Management also participate in this line of credit on the same terms. Interest is charged on borrowings under this line of credit at the overnight Federal Funds Rate plus 0.50% per annum. A facility fee of 0.07% (as of September 19, 2008, 0.09%) per annum of the available line of credit is charged, of which the Fund has agreed to pay its pro rata share, based on the ratio of its individual net assets to the net assets of all participants at the time the fee is due and payable. The fee is paid quarterly in arrears. Because several investment companies participate, there is no assurance that an individual Fund will have access to all or any part of the $150,000,000 at any particular time. There were no loans outstanding pursuant to this line of credit at December 31, 2008. During the year ended December 31, 2008, the Fund did not utilize this line of credit.
17
Note F-Investments in Affiliates:
| Name of Issuer | | Balance of
Shares Held
December 31,
2007 | | Gross
Purchases
and Additions | | Gross
Sales and
Reductions | | Balance of
Shares Held
December 31,
2008 | | Value
December 31,
2008 | | Income from
Investments
in Affiliated
Issuers Included
in Total Income | |
Neuberger Berman Prime
Money Fund Trust Class* | | | 7,360,019 | | | | 104,624,726 | | | | 105,468,882 | | | | 6,515,863 | | | $ | 6,515,863 | | | $ | 105,164 | | |
Neuberger Berman Securities
Lending Quality Fund, LLC ** | | | 97,152,704 | | | | 406,914,212 | | | | 471,208,296 | | | | 32,858,620 | | | | 32,858,620 | | | | 1,418,017 | | |
| Total | | | | | | | | | | $ | 39,374,483 | | | $ | 1,523,181 | | |
* Prime Money is also managed by Management and may be considered an affiliate since it has the same officers, Board members, and investment manager as the Fund and because, at times, the Fund may own 5% or more of the outstanding voting securities of Prime Money.
** Quality Fund, a fund managed by LBAM, an affiliate of Management, is used to invest cash the Fund receives as collateral for securities loaned as approved by the Board. Because all shares of Quality Fund are held by funds in the related investment management complex, Quality Fund may be considered an affiliate of the Fund.
Note G-Recent Accounting Pronouncement:
In March 2008, Statement of Financial Accounting Standards No. 161, "Disclosures about Derivative Instruments and Hedging Activities-an amendment of FASB Statement No. 133" ("FAS 161"), was issued. FAS 161 is intended to improve financial reporting for derivative instruments by requiring enhanced disclosure that enables investors to understand how and why an entity uses derivatives, how derivatives are accounted for, and how derivative instruments affect an entity's results of operations and financial position. In September 2008, FASB Staff Position No. 133-1 and FASB Interpretation No. 45-4 (the "FSP"), "Disclosures about Credit Derivatives and Certain Guarantees: An Amendment of FASB Statement No. 133 and FASB Interpretation No. 45; and Clarification of the Effective Date of FASB Statement No. 161" was issued. Certain provisions of the FSP amend FASB Statement No. 133, "Accounting for Derivative Instruments and Hedging Activities," to require disclosures by sellers of credit derivatives, including credit derivatives embedded in hybrid instruments. These FSP provisions are effective for fiscal years and interim periods ending after November 15, 2008. At this time, Management has assessed the implication of these FSP provisions and determined there is no impact to the Fund's financial statements. The FSP also clarifies the effective date of FAS 161, whereby disclosures required by FAS 161 are effective for financial statements issued for fiscal years and interim periods beginning after November 15, 2008. The impact of FAS 161 on the Fund's financial statement disclosures, if any, is currently being assessed.
Note H-Recent Market Events
The year covered by this report witnessed an unusually high degree of volatility in the financial markets and the net asset values of many mutual funds, including to some extent the Fund. Both domestic and international equity markets have been experiencing heightened volatility and turmoil, with issuers that have exposure to the real estate, mortgage and credit markets particularly affected. In addition to the recent turbulence in financial markets, the reduced liquidity in credit and fixed income markets has negatively affected many issuers worldwide. The Fund's investments in certain issuers, as reflected in the Fund's schedule of investments, and the financial markets in general, expose investors to the volatile performance resulting from these market conditions and related events.
18
Financial Highlights
Partners Portfolio
The following table includes selected data for a share outstanding throughout each year and other performance information derived from the Financial Statements.
| | | Year Ended December 31, | |
| | | 2008 | | 2007 | | 2006 | | 2005 | | 2004 | |
| Net Asset Value, Beginning of Year | | $ | 20.76 | | | $ | 21.16 | | | $ | 21.41 | | | $ | 18.32 | | | $ | 15.40 | | |
| Income From Investment Operations: | |
| Net Investment Income (Loss)t | | | .08 | | | | .07 | | | | .12 | | | | .14 | | | | .17 | | |
Net Gains or Losses on Securities
(both realized and unrealized) | | | (10.78 | ) | | | 1.95 | | | | 2.33 | | | | 3.15 | | | | 2.75 | | |
| Total From Investment Operations | | | (10.70 | ) | | | 2.02 | | | | 2.45 | | | | 3.29 | | | | 2.92 | | |
| Less Distributions From: | |
| Net Investment Income | | | (.09 | ) | | | (.15 | ) | | | (.16 | ) | | | (.19 | ) | | | (.00 | ) | |
| Net Capital Gains | | | (2.86 | ) | | | (2.27 | ) | | | (2.54 | ) | | | (.01 | ) | | | - | | |
| Total Distributions | | | (2.95 | ) | | | (2.42 | ) | | | (2.70 | ) | | | (.20 | ) | | | (.00 | ) | |
| Net Asset Value, End of Year | | $ | 7.11 | | | $ | 20.76 | | | $ | 21.16 | | | $ | 21.41 | | | $ | 18.32 | | |
| Total Returntt | | | (52.37 | %) | | | 9.28 | % | | | 12.24 | % | | | 18.04 | % | | | 18.98 | % | |
| Ratios/Supplemental Data | |
| Net Assets, End of Year (in millions) | | $ | 217.9 | | | $ | 526.7 | | | $ | 631.2 | | | $ | 732.0 | | | $ | 589.8 | | |
| Ratio of Gross Expenses to Average Net Assets# | | | .95 | % | | | .91 | % | | | .91 | % | | | .90 | % | | | .91 | % | |
| Ratio of Net Expenses to Average Net AssetsS | | | .94 | % | | | .90 | % | | | .91 | % | | | .89 | % | | | .89 | % | |
Ratio of Net Investment Income (Loss) to
Average Net Assets | | | .53 | % | | | .33 | % | | | .57 | % | | | .70 | % | | | 1.05 | % | |
| Portfolio Turnover Rate | | | 38 | % | | | 43 | % | | | 36 | % | | | 58 | % | | | 71 | % | |
See Notes to Financial Highlights 19
Notes to Financial Highlights Partners Portfolio
tt Total return based on per share net asset value reflects the effects of changes in net asset value on the performance of the Fund during each fiscal period and assumes dividends and other distributions, if any, were reinvested. Results represent past performance and do not guarantee future results. Current returns may be lower or higher than the performance data quoted. Investment returns and principal may fluctuate and shares when redeemed may be worth more or less than original cost. Total return would have been lower if Management had not waived certain expenses. The total return information shown does not reflect charges and other expenses that apply to the separate account or the related insurance policies, and the inclusion of these charges and other expenses would reduce the total return for all fiscal periods shown.
# The Fund is required to calculate an expense ratio without taking into consideration any expense reductions related to expense offset arrangements.
t Calculated based on the average number of shares outstanding during each fiscal period.
S After utilization of the Line of Credit (2007) and/or waiver of a portion of the investment management fee by Management. Had Management not undertaken such actions, and the Fund had not utilized the Line of Credit the annualized ratios of net expenses to average daily net assets would have been:
| | | Year Ended December 31, | |
| | | 2008 | | 2007 | | 2006 | | 2005 | | 2004 | |
| | | | .94 | % | | | .90 | % | | | .91 | % | | | .89 | % | | | .90 | % | |
20
Report of Independent Registered Public Accounting Firm
To the Board of Trustees of
Neuberger Berman Advisers Management Trust and
Shareholders of Partners Portfolio
We have audited the accompanying statement of assets and liabilities, including the schedule of investments, of Partners Portfolio, one of the series constituting Neuberger Berman Advisers Management Trust (the "Trust"), as of December 31, 2008, and the related statement of operations for the year then ended, the statement of changes in net assets for each of the two years in the period then ended, and the financial highlights for each of the five years in the period then ended. These financial statements and financial highlights are the responsibility of the Trust's management. Our responsibility is to express an opinion on these financial statements and financial highlights based on our audits.
We conducted our audits in accordance with the standards of the Public Company Accounting Oversight Board (United States). Those standards require that we plan and perform the audit to obtain reasonable assurance about whether the financial statements and financial highlights are free of material misstatement. We were not engaged to perform an audit of the Trust's internal control over financial reporting. Our audits included consideration of internal control over financial reporting as a basis for designing audit procedures that are appropriate in the circumstances, but not for the purpose of expressing an opinion on the effectiveness of the Trust's internal control over financial reporting. Accordingly, we express no such opinion. An audit also includes examining, on a test basis, evidence supporting the amounts and disclosures in the financial statements and financial highlights, assessing the accounting principles used and significant estimates made by management, and evaluating the overall financial statement presentation. Our procedures included confirmation of securities owned as of December 31, 2008 by correspondence with the custodian and brokers or by other appropriate auditing procedures where replies from brokers were not received. We believe that our audits provide a reasonable basis for our opinion.
In our opinion, the financial statements and financial highlights referred to above present fairly, in all material respects, the financial position of Partners Portfolio, a series of Neuberger Berman Advisers Management Trust, at December 31, 2008, the results of its operations for the year then ended, the changes in its net assets for each of the two years in the period then ended, and the financial highlights for each of the five years in the period then ended, in conformity with U.S. generally accepted accounting principles.

Boston, Massachusetts
February 9, 2009
21
Trustee and Officer Information
The following tables set forth information concerning the trustees and officers of the Trust. All persons named as trustees and officers also serve in similar capacities for other funds administered or managed by Neuberger Berman Management LLC ("NB Management") and Neuberger Berman, LLC ("Neuberger Berman"). The Statement of Additional Information includes additional information about fund trustees and is available upon request, without charge, by calling (800) 877-9700.
Information about the Board of Trustees
Name, (Year of Birth),
and Address(1) | | Position and
Length of
Time Served(2) | | Principal Occupation(s)(3) | | Number of
Funds in Fund
Complex
Overseen by
Fund Trustee | | Other Directorships
Held Outside Fund
Complex by Fund
Trustee | |
| Independent Fund Trustees | |
|
| John Cannon (1930) | | Trustee since 2000 | | Consultant; formerly, Chairman, CDC Investment Advisers (registered investment adviser), 1993 to January 1999; formerly, President and Chief Executive Officer, AMA Investment Advisors, an affiliate of the American Medical Association. | | | 56 | | | Independent Trustee or Director of three series of Oppenheimer Funds: Oppenheimer Limited Term New York Municipal Fund, Rochester Fund Municipals, and Oppenheimer Convertible Securities Fund since 1992. | |
|
| Faith Colish (1935) | | Trustee since 1982 | | Counsel, Carter Ledyard & Milburn LLP (law firm) since October 2002; formerly, Attorney-at-Law and President, Faith Colish, A Professional Corporation, 1980 to 2002. | | | 56 | | | Formerly, Director (1997 to 2003) and Advisory Director (2003 to 2006), ABA Retirement Funds (formerly, American Bar Retirement Association) (not-for-profit membership corporation). | |
|
| Martha C. Goss (1949) | | Trustee since 2007 | | President, Woodhill Enterprises Inc./Chase Hollow Associates LLC (personal investment vehicle), since 2006; Chief Operating and Financial Officer, Hopewell Holdings LLC/ Amwell Holdings, LLC (a holding company for a healthcare reinsurance company start-up), since 2003; formerly, Consultant, Resources Connection (temporary staffing), 2002 to 2006. | | | 56 | | | Director, Ocwen Financial Corporation (mortgage servicing), since 2005; Director, American Water (water utility), since 2003; Director, Channel Reinsurance (financial guaranty reinsurance), since 2006; Advisory Board Member, Attensity (software developer), since 2005; Director, Allianz Life of New York (insurance), since 2005; Director, Financial Women's Association of New York (not for profit association), since 2003; Trustee Emerita, Brown University, since 1998. | |
|
22
Name, (Year of Birth),
and Address(1) | | Position and
Length of
Time Served(2) | | Principal Occupation(s)(3) | | Number of
Funds in Fund
Complex
Overseen by
Fund Trustee | | Other Directorships
Held Outside Fund
Complex by Fund
Trustee | |
| C. Anne Harvey (1937) | | Trustee since 1998 | | President, C.A. Harvey Associates, since October 2001; formerly, Director, AARP, 1978 to December 2001. | | | 56 | | | Formerly, President, Board of Associates to The National Rehabilitation Hospital's Board of Directors, 2001 to 2002; formerly, Member, Individual Investors Advisory Committee to the New York Stock Exchange Board of Directors, 1998 to June 2002. | |
|
| Robert A. Kavesh (1927) | | Trustee since 2000 | | Retired; Marcus Nadler Professor Emeritus of Finance and Economics, New York University Stern School of Business; formerly, Executive Secretary-Treasurer, American Finance Association, 1961 to 1979. | | | 56 | | | Formerly, Director, The Caring Community (not-for-profit), 1997 to 2006; formerly, Director, DEL Laboratories, Inc. (cosmetics and pharmaceuticals), 1978 to 2004; formerly, Director, Apple Bank for Savings, 1979 to 1990; formerly, Director, Western Pacific Industries, Inc., 1972 to 1986 (public company). | |
|
| Michael M. Knetter (1960) | | Trustee since 2007 | | Dean, School of Business, University of Wisconsin - Madison; formerly, Professor of International Economics and Associate Dean, Amos Tuck School of Business - Dartmouth College, 1998 to 2002. | | | 56 | | | Trustee, Northwestern Mutual Series Fund, Inc., since February 2007; Director, Wausau Paper, since 2005; Director, Great Wolf Resorts, since 2004. | |
|
| Howard A. Mileaf (1937) | | Trustee since 1999 | | Retired; formerly, Vice President and General Counsel, WHX Corporation (holding company), 1993 to 2001. | | | 56 | | | Formerly, Director, Webfinancial Corporation (holding company), 2002 to 2008; formerly, Director WHX Corporation (holding company), January 2002 to June 2005; formerly, Director, State Theatre of New Jersey (not-for-profit theater), 2000 to 2005. | |
|
23
Name, (Year of Birth),
and Address(1) | | Position and
Length of
Time Served(2) | | Principal Occupation(s)(3) | | Number of
Funds in Fund
Complex
Overseen by
Fund Trustee | | Other Directorships
Held Outside Fund
Complex by Fund
Trustee | |
| George W. Morriss (1947) | | Trustee since 2007 | | Retired; formerly, Executive Vice President and Chief Financial Officer, People's Bank, Connecticut (a financial services company), 1991 to 2001. | | | 56 | | | Manager, Old Mutual 2100 fund complex (consisting of six funds) since October 2006 for four funds and since February 2007 for two funds; formerly, Member NASDAQ Issuers' Affairs Committee, 1995 to 2003. | |
|
| Edward I. O'Brien (1928) | | Trustee since 2000 | | Retired; formerly, Member, Investment Policy Committee, Edward Jones, 1993 to 2001; President, Securities Industry Association ("SIA") (securities industry's representative in government relations and regulatory matters at the federal and state levels), 1974 to 1992; Adviser to SIA, November 1992 to November 1993. | | | 56 | | | Formerly, Director, Legg Mason, Inc. (financial services holding company), 1993 to July 2008; formerly, Director, Boston Financial Group (real estate and tax shelters), 1993 to 1999. | |
|
| William E. Rulon (1932) | | Trustee since 2000 | | Retired; formerly, Senior Vice President, Foodmaker, Inc. (operator and franchiser of restaurants), until January 1997. | | | 56 | | | Formerly, Director, Pro-Kids Golf and Learning Academy (teach golf and computer usage to "at risk" children), 1998 to 2006; formerly, Director, Prandium, Inc. (restaurants), March 2001 to July 2002. | |
|
| Cornelius T. Ryan (1931) | | Trustee since 2000 | | Founding General Partner, Oxford Partners and Oxford Bioscience Partners (venture capital investing) and President, Oxford Venture Corporation, since 1981. | | | 56 | | | None. | |
|
24
Name, (Year of Birth),
and Address(1) | | Position and
Length of
Time Served(2) | | Principal Occupation(s)(3) | | Number of
Funds in Fund
Complex
Overseen by
Fund Trustee | | Other Directorships
Held Outside Fund
Complex by Fund
Trustee | |
| Tom D. Seip (1950) | | Trustee since 2000; Chairman of the Board since 2008; Lead Independent Trustee from 2006 to 2008 | | General Partner, Seip Investments LP (a private investment partnership); formerly, President and CEO, Westaff, Inc. (temporary staffing), May 2001 to January 2002; formerly, Senior Executive at the Charles Schwab Corporation, 1983 to 1998, including Chief Executive Officer, Charles Schwab Investment Management, Inc., and Trustee, Schwab Family of Funds and Schwab Investments, 1997 to 1998, and Executive Vice President-Retail Brokerage, Charles Schwab & Co., Inc., 1994 to 1997. | | | 56 | | | Director, H&R Block, Inc. (financial services company), since May 2001; Chairman, Compensation Committee, H&R Block, Inc., since 2006; formerly, Director, Forward Management, Inc. (asset management company), 1999 to 2006. | |
|
| Candace L. Straight (1947) | | Trustee since 1999 | | Private investor and consultant specializing in the insurance industry; formerly, Advisory Director, Securitas Capital LLC (a global private equity investment firm dedicated to making investments in the insurance sector), 1998 to December 2003. | | | 56 | | | Director, Montpelier Re (reinsurance company), since 2006; formerly, Director, National Atlantic Holdings Corporation (property and casualty insurance company), 2004 to 2008; formerly, Director, The Proformance Insurance Company (property and casualty insurance company), 2004 to 2008; formerly, Director, Providence Washington Insurance Company (property and casualty insurance company), December 1998 to March 2006; formerly, Director, Summit Global Partners (insurance brokerage firm), 2000 to 2005. | |
|
| Peter P. Trapp (1944) | | Trustee since 1984 | | Retired; formerly, Regional Manager for Mid-Southern Region, Ford Motor Credit Company, September 1997 to 2007; formerly, President, Ford Life Insurance Company, April 1995 to August 1997. | | | 56 | | | None. | |
|
25
Name, (Year of Birth),
and Address(1) | | Position and
Length of
Time Served(2) | | Principal Occupation(s)(3) | | Number of
Funds in Fund
Complex
Overseen by
Fund Trustee | | Other Directorships
Held Outside Fund
Complex by Fund
Trustee | |
| Fund Trustees who are "Interested Persons" | |
|
| Jack L. Rivkin* (1940) | | Trustee since 2002; President from 2002 to 2008 | | Formerly, Executive Vice President and Chief Investment Officer, Neuberger Berman Holdings LLC (holding company), 2002 to August 2008 and 2003 to August 2008, respectively; formerly, Managing Director and Chief Investment Officer, Neuberger Berman, December 2005 to August 2008 and 2003 to August 2008, respectively; formerly, Executive Vice President, Neuberger Berman, December 2002 to 2005; formerly, Director and Chairman, NB Management, December 2002 to August 2008; formerly, Executive Vice President, Citigroup Investments, Inc., September 1995 to February 2002; formerly, Executive Vice President, Citigroup Inc., September 1995 to February 2002. | | | 56 | | | Director, Dale Carnegie and Associates, Inc. (private company), since 1998; Director, Solbright, Inc. (private company), since 1998. | |
|
26
Name, (Year of Birth),
and Address(1) | | Position and
Length of
Time Served(2) | | Principal Occupation(s)(3) | | Number of
Funds in Fund
Complex
Overseen by
Fund Trustee | | Other Directorships
Held Outside Fund
Complex by Fund
Trustee | |
| Robert Conti* (1956) | | Chief Executive Officer, President and Director since 2008; prior thereto, Executive Vice President in 2008 and Vice President 2000 to 2008 | | Managing Director, Neuberger Berman, since 2007; formerly, Senior Vice President, Neuberger Berman, 2003 to 2006; formerly, Vice President, Neuberger Berman, 1999 to 2003; President and Chief Executive Officer, NB Management, since 2008; formerly, Senior Vice President, NB Management, 2000 to 2008. | | | 56 | | | Chairman of the Board, Staten Island Mental Health Society since 2008. | |
|
(1) The business address of each listed person is 605 Third Avenue, New York, New York 10158.
(2) Pursuant to the Trust's Trust Instrument, each Fund Trustee shall hold office for life or until his or her successor is elected or the Trust terminates; except that (a) any Fund Trustee may resign by delivering a written resignation; (b) any Fund Trustee may be removed with or without cause at any time by a written instrument signed by at least two-thirds of the other Fund Trustees; (c) any Fund Trustee who requests to be retired, or who has become unable to serve, may be retired by a written instrument signed by a majority of the other Fund Trustees; and (d) any Fund Trustee may be removed at any shareholder meeting by a vote of at least two-thirds of the outstanding shares.
(3) Except as otherwise indicated, each individual has held the positions shown for at least the last five years.
* Indicates a Fund Trustee who is an "interested person" within the meaning of the 1940 Act. Mr. Conti is an interested person of the Trust by virtue of the fact that he is an officer of NB Management and Neuberger Berman. Mr. Rivkin may be deemed an interested person of the Trust by virtue of the fact that, until August 2008, he was a director of NB Management and an officer of Neuberger Berman.
27
Information about the Officers of the Trust
Name, (Year of Birth),
and Address(1) | | Position and
Served(2) | | Principal Occupation(s)(3)
Length of Time | |
| Andrew B. Allard (1961) | | Anti-Money Laundering Compliance Officer since 2002 | | Senior Vice President, Neuberger Berman, since 2006; Deputy General Counsel, Neuberger Berman, since 2004; formerly, Vice President, Neuberger Berman, 2000 to 2005; formerly, Associate General Counsel, Neuberger Berman, 1999 to 2004; Anti-Money Laundering Compliance Officer, eleven registered investment companies for which NB Management acts as investment manager and administrator (six since 2002, two since 2003, two since 2004 and one since 2006). | |
|
| Michael J. Bradler (1970) | | Assistant Treasurer since 2005 | | Vice President, Neuberger Berman, since 2006; Employee, NB Management, since 1997; Assistant Treasurer, eleven registered investment companies for which NB Management acts as investment manager and administrator (ten since 2005 and one since 2006). | |
|
| Claudia A. Brandon (1956) | | Executive Vice President since 2008 and Secretary since 1985 | | Senior Vice President, Neuberger Berman, since 2007 and Employee since 1999; formerly, Vice President, Neuberger Berman, 2002 to 2006; Senior Vice President, NB Management, since 2008 and Assistant Secretary since 2004; formerly, Vice President-Mutual Fund Board Relations, NB Management, 2000 to 2008; Executive Vice President, eleven registered investment companies for which NB Management acts as investment manager and administrator (eleven since 2008); Secretary, eleven registered investment companies for which NB Management acts as investment manager and administrator (three since 1985, three since 2002, two since 2003, two since 2004 and one since 2006). | |
|
| Maxine L. Gerson (1950) | | Executive Vice President since 2008 and Chief Legal Officer since 2005 (only for purposes of sections 307 and 406 of the Sarbanes-Oxley Act of 2002) | | Senior Vice President, Neuberger Berman, since 2002; Deputy General Counsel and Assistant Secretary, Neuberger Berman, since 2001; Senior Vice President, NB Management, since 2006; Secretary and General Counsel, NB Management, since 2004; Executive Vice President, eleven registered investment companies for which NB Management acts as investment manager and administrator (eleven since 2008); Chief Legal Officer (only for purposes of sections 307 and 406 of the Sarbanes-Oxley Act of 2002), eleven registered investment companies for which NB Management acts as investment manager and administrator (ten since 2005 and one since 2006). | |
|
| Sheila R. James (1965) | | Assistant Secretary since 2002 | | Vice President, Neuberger Berman, since 2008 and Employee since 1999; formerly, Assistant Vice President, Neuberger Berman, 2007; Assistant Secretary, eleven registered investment companies for which NB Management acts as investment manager and administrator (six since 2002, two since 2003, two since 2004 and one since 2006). | |
|
| Brian Kerrane (1969) | | Vice President since 2008 | | Senior Vice President, Neuberger Berman, since 2006; formerly, Vice President, Neuberger Berman, 2002 to 2006; Vice President, NB Management, since 2008 and Employee since 1991; Vice President, eleven registered investment companies for which NB Management acts as investment manager and administrator (eleven since 2008). | |
|
28
Name, (Year of Birth),
and Address(1) | | Position and
Served(2) | | Principal Occupation(s)(3)
Length of Time | |
| Kevin Lyons (1955) | | Assistant Secretary since 2003 | | Assistant Vice President, Neuberger Berman, since 2008 and Employee since 1999; Assistant Secretary, eleven registered investment companies for which NB Management acts as investment manager and administrator (eight since 2003, two since 2004 and one since 2006). | |
|
| Owen F. McEntee, Jr. (1961) | | Vice President since 2008 | | Vice President, Neuberger Berman, since 2006; Employee, NB Management, since 1992; Vice President, eleven registered investment companies for which NB Management acts as investment manager and administrator (eleven since 2008). | |
|
| John M. McGovern (1970) | | Treasurer and Principal Financial and Accounting Officer since 2005; prior thereto, Assistant Treasurer since 2002 | | Senior Vice President, Neuberger Berman, since 2007; formerly, Vice President, Neuberger Berman, 2004 to 2006; Employee, NB Management, since 1993; Treasurer and Principal Financial and Accounting Officer, eleven registered investment companies for which NB Management acts as investment manager and administrator (ten since 2005 and one since 2006); formerly, Assistant Treasurer, eleven registered investment companies for which NB Management acts as investment manager and administrator, 2002 to 2005. | |
|
| Andrew Provencher (1965) | | Vice President since 2008 | | Managing Director, NB Management, since 2008; Managing Director, Neuberger Berman, since 2005; formerly, Senior Vice President, Neuberger Berman, 2003 to 2005; formerly, Vice President, Neuberger Berman, 1999 to 2003; Vice President, eleven registered investment companies for which NB Management acts as investment manager and administrator (eleven since 2008). | |
|
| Frank Rosato (1971) | | Assistant Treasurer since 2005 | | Vice President, Neuberger Berman, since 2006; Employee, NB Management, since 1995; Assistant Treasurer, eleven registered investment companies for which NB Management acts as investment manager and administrator (ten since 2005 and one since 2006). | |
|
| Neil S. Siegel (1967) | | Vice President since 2008 | | Managing Director, NB Management, since 2008; Managing Director, Neuberger Berman, since 2006; formerly, Senior Vice President, Neuberger Berman, 2004 to 2006; Vice President, eleven registered investment companies for which NB Management acts as investment manager and administrator (eleven since 2008); formerly, Head of Institutional Marketing, Morgan Stanley Investment Management, 1993 to 2004. | |
|
29
Name, (Year of Birth),
and Address(1) | | Position and
Served(2) | | Principal Occupation(s)(3)
Length of Time | |
| Chamaine Williams (1971) | | Chief Compliance Officer since 2005 | | Senior Vice President, Neuberger Berman, since 2007; Chief Compliance Officer, NB Management, since 2006; Senior Vice President, Lehman Brothers Inc., since 2007; formerly, Vice President, Lehman Brothers Inc., 2003 to 2006; Chief Compliance Officer, eleven registered investment companies for which NB Management acts as investment manager and administrator (ten since 2005 and one since 2006); formerly, Chief Compliance Officer, Lehman Brothers Asset Management Inc., 2003 to 2007; formerly, Chief Compliance Officer, Lehman Brothers Alternative Investment Management LLC, 2003 to 2007; formerly, Vice President, UBS Global Asset Management (US) Inc. (formerly, Mitchell Hutchins Asset Management, a wholly-owned subsidiary of PaineWebber Inc.), 1997 to 2003. | |
|
(1) The business address of each listed person is 605 Third Avenue, New York, New York 10158.
(2) Pursuant to the By-Laws of the Trust, each officer elected by the Fund Trustees shall hold office until his or her successor shall have been elected and qualified or until his or her earlier death, inability to serve, or resignation. Officers serve at the pleasure of the Fund Trustees and may be removed at any time with or without cause.
(3) Except as otherwise indicated, each individual has held the positions shown for at least the last five years.
30
Proxy Voting Policies and Procedures
A description of the policies and procedures that the Trust uses to determine how to vote proxies relating to portfolio securities is available, without charge, by calling 1-800-877-9700 (toll-free) and on the website of the Securities and Exchange Commission, at www.sec.gov. Information regarding how the Trust voted proxies relating to portfolio securities during the most recent 12-month period ended June 30 is also available, without charge, by calling 1-800-877-9700 (toll-free), on the website of the Securities and Exchange Commission at www.sec.gov, and on Management's website at www.nb.com.
Quarterly Portfolio Schedule
The Trust files a complete schedule of portfolio holdings for the Fund with the Securities and Exchange Commission for the first and third quarters of each fiscal year on Form N-Q. The Trust's Forms N-Q are available on the Securities and Exchange Commission's website at www.sec.gov and may be reviewed and copied at the Securities and Exchange Commission's Public Reference Room in Washington, DC. Information on the operation of the Public Reference Room may be obtained by calling 1-800-SEC-0330. The information on Form N-Q is available upon request, without charge, by calling 1-800-877-9700 (toll-free).
Notice to Shareholders (Unaudited)
The Fund hereby designates $64,001,952 as a capital gain distribution.
100.00% of the dividends distributed during the fiscal year ended December 31, 2008 qualifies for the dividends received deduction for corporate shareholders.
Board Consideration of the Management and Sub-Advisory Agreements
At a meeting held on September 25, 2008, the Board of Trustees of Neuberger Berman Advisers Management Trust ("Board"), including the Trustees who are not "interested persons" of Neuberger Berman Management LLC ("Management") or Neuberger Berman Advisers Management Trust ("Independent Fund Trustees"), approved the continuance of the Management and Sub-Advisory Agreements ("Agreements") between Management and Partners Portfolio ("Fund").
In evaluating the Agreements, the Board, including the Independent Fund Trustees, reviewed materials furnished by Management and Neuberger Berman, LLC ("Neuberger") in response to questions submitted by counsel to the Independent Fund Trustees, and met with senior representatives of Management and Neuberger regarding their personnel and operations. The Independent Fund Trustees were advised by counsel that is experienced in Investment Company Act of 1940 matters and that is independent of Management and Neuberger. The Independent Fund Trustees received a memorandum from independent counsel discussing the legal standards for their consideration of the proposed continuance of the Agreements. They met with such counsel separately from representatives of Management to discuss the annual contract review. The annual contract review extends over two regular meetings of the Board to ensure that Management and Neuberger have time to respond to any questions the Independent Fund Trustees may have on their initial review of the report and that the Independent Fund Trustees have time to consider those responses. In addition, during this process, the Board held a separate meeting devoted primarily to reviewing and discussing Fund performance.
The Board considered the following factors, among others, in connection with its approval of the continuance of the Agreements: (1) the nature, extent, and quality of the services provided by Management and Neuberger; (2) the performance of the Fund compared to a relevant market index and a peer group of investment companies; (3) the costs of the services provided and profits or losses realized by Management and its affiliates from their relationship with the Fund; (4) the extent to which economies of scale might be realized as the Fund grows; and (5) whether fee levels reflect any such potential economies of scale for the benefit of investors in the Fund. In their deliberations, the Board members did not identify any particular information that was all-important or controlling, and each Trustee may have attributed different weights to the various factors.
31
The Board considered the continued integrity of Management and Neuberger as organizations, despite the bankruptcy filing by Lehman Brothers Holdings Inc. The Board discussed the efforts made by Management and Neuberger to retain employees, and the reported likelihood that such employees would be retained. The Board discussed the provisions that were being made for ancillary services by Management, Neuberger and their affiliates.
The Board evaluated the terms of the Agreements, the overall fairness of the Agreements to the Fund and whether the Agreements were in the best interests of the Fund and its shareholders.
With respect to the nature, extent and quality of the services provided, the Board considered the performance of the Fund and the experience and staffing of the portfolio management and investment research personnel who perform services for the Fund. The Board noted that Management also provides certain administrative services, including fund accounting and compliance oversight. The Board also considered Management's and Neuberger's policies and practices regarding brokerage. The Board considered the quality of brokerage execution obtained by Management. The Board's Portfolio Transactions and Pricing Committee from time to time reviewed the quality of the brokerage services that Neuberger and Lehman Brothers Inc. had provided, and periodically reviews studies by an independent firm engaged to review and evaluate the quality of brokerage execution received by the Fund. The Board also reviewed whether Management and Neuberger used brokers to execute Fund transactions that provide research and other services to Management and Neuberger, and the types of benefits potentially derived from such services by Management, Neuberger, the Fund and other clients of Management and Neuberger. In addition, the Board noted the positive compliance history of Management and Neuberger, as each firm has been free of significant compliance problems.
The Board considered the performance of the Fund relative to its benchmark and a peer group of investment companies dedicated to insurance products pursuing broadly similar strategies. The Board also considered performance in relation to the degree of risk undertaken by the portfolio manager.
With respect to the overall fairness of the Agreements, the Board considered the fee structure for the Fund under the Agreements as compared to a peer group of comparable funds dedicated to insurance products and any fall-out benefits likely to accrue to Management or Neuberger or their affiliates from their relationship with the Fund. The Board also considered the profitability of Management and its affiliates from their association with the Fund.
The Board reviewed a comparison of the Fund's management fee and overall expense ratio to a peer group of broadly comparable funds dedicated to insurance products. The Board considered the mean and median of the management fees and expense ratios of the peer group. The Board noted that the Fund's management fee was higher than the peer group mean and median. The Board considered whether specific portfolio management or administration needs contributed to the higher fee. With regard to the sub-advisory fee paid to Neuberger, the Board noted that this fee is "at cost." In addition, the Board considered the contractual limit on Fund expenses undertaken by Management.
The Board considered whether there were other funds that were advised or sub-advised by Management or its affiliates or separate accounts managed by Management or its affiliates with similar investment objectives, policies and strategies to the Fund. The Board noted that there were no comparable separate accounts. The Board compared the fees charged to the Fund at various asset levels to the fees charged to an advised fund and a sub-advised fund, each managed in a similar style to the Fund. The Board considered the appropriateness and reasonableness of any differences between the fees charged to the Fund and the other funds and determined that the differences in fees were consistent with the management and other services provided.
The Board also evaluated any apparent or anticipated economies of scale in relation to the services Management provides to the Fund. The Board considered that the Fund's fee structure which provides for a reduction of payments resulting from the use of breakpoints and whether those breakpoints are set at appropriate asset levels.
In concluding that the benefits accruing to Management and its affiliates by virtue of their relationship to the Fund were reasonable in comparison with the costs of providing the investment advisory services and the benefits accruing to the Fund, the Board reviewed specific data as to Management's profit on the Fund for a recent period and the trend in profit or loss over recent years. The Board also carefully examined Management's cost allocation methodology and in recent years had an independent consultant review the methodology. It also reviewed an analysis from an independent data service on
32
profitability margins in the investment management industry. The Board recognized that Management should be entitled to earn a reasonable level of profits for services it provides to the Fund and, based on its review, concluded that Management's level of profitability was not excessive.
Conclusions
In approving the Agreements, the Board concluded that the terms of each Agreement are fair and reasonable and that approval of the Agreements is in the best interests of the Fund and its shareholders. In reaching this determination, the Board considered that Management and Neuberger could be expected to provide a high level of service to the Fund; that the performance of the Fund was satisfactory over time; that the Fund's fee structure appeared to the Board to be reasonable given the nature and quality of services provided; and that the benefits accruing to Management and its affiliates by virtue of their relationship to the Fund were reasonable in comparison with the benefits accruing to the Fund.
Board Consideration of New and Interim Management and Sub-Advisory Agreements
Lehman Brothers Holdings Inc. ("Lehman Brothers") has entered into an agreement to sell a controlling interest in the Fund's investment adviser. Under the agreement, Lehman Brothers would sell substantially all of the Neuberger Berman business and the fixed income business and certain alternative asset management businesses of Lehman Brother's Investment Management Division (collectively, the "Acquired Businesses") to NBSH Acquisition, LLC (the "Proposed Acquisition"). NBSH Acquisition, LLC ("NBSH") was organized by key members of Neuberger Berman's management for the purpose of facilitating the acquisition of the Acquired Businesses. At the closing of the Proposed Acquisition, a majority interest in the Acquired Businesses will be directly or indirectly owned by portfolio managers, Neuberger Berman's management team and certain key members and senior professionals of the former Investment Management Division ("Management Members"), as well as by Lehman Brothers and certain affiliates of Lehman Brothers.
The Acquired Businesses include Neuberger Berman Management LLC ("Management") and Neuberger Berman, LLC ("Neuberger"), the adviser and sub-adviser to the Fund, respectively. The Proposed Acquisition has been deemed to result in an "assignment" of the Fund's existing Management Agreement and Sub-Advisory Agreement (the "Existing Agreements") under the 1940 Act. As required by the 1940 Act, the Fund's Existing Agreements provide for their automatic termination in the event of an assignment, and each will terminate upon the consummation of the Proposed Acquisition. Accordingly, on December 17, 2008, the Board approved new Management and Sub-Advisory Agreements with Management and Neuberger, respectively, or their successors (together, the "Advisers"), on the same terms and with the same compensation structure as are currently in effect (together, "New Agreements"), which would take effect upon consummation of the Proposed Acquisition if approved by the Fund's shareholders.
If shareholders of the Fund do not approve the New Agreements before the Proposed Acquisition is completed, the Board has approved interim Management and Sub-Advisory Agreements with Management and Neuberger, respectively, or their successors (together, "Interim Agreements") pending approval of the New Agreements by shareholders of the Fund. Compensation earned by the Advisers under the Interim Agreements would be held in an interest-bearing escrow account pending shareholder approval of the New Agreements. If shareholders approve the New Agreements within 150 days from the termination of the Existing Agreements, the amount held in the escrow account, including interest, will be paid to the Advisers, as appropriate. If shareholders of the Fund do not approve the New Agreements, the Advisers will be paid the lesser of the costs incurred in performing their services under the Interim Agreements or the total amount in the escrow account, including interest earned. If at the end of 150 days following termination of a Fund's Existing Agreements the Fund's shareholders still have not approved the New Agreements, the Trustees would take such actions as they deem to be in the best interests of the Fund and its shareholders, which may include negotiating a new Management Agreement and/or new Sub-Advisory Agreement with an advisory organization selected by the Board of Trustees or making other arrangements.
The Trustees of the Trust discussed the Proposed Acquisition on December 17, 2008. Prior to submitting its bid to public auction, Management met telephonically with the Independent Trustees to brief them on the Proposed Acquisition. Following the public auction wherein NBSH was determined to be the successful bidder, the Independent Trustees again
33
met telephonically with Management to obtain additional information about the Proposed Acquisition. The Independent Trustees, with the assistance of independent counsel, prepared due diligence requests that were presented to Management and appointed a Task Force of Independent Trustees to lead the due diligence effort ("Task Force").
Management provided written responses to the due diligence requests. After extensive review and analysis and discussions during a telephonic and in person meeting of the Independent Trustees, the Task Force submitted clarifying questions. The Independent Trustees met as a body in person to receive the report of the Task Force and consider the New Agreements. Throughout the process, the Task Force and the Independent Trustees were advised by experienced 1940 Act counsel that is independent of Management and NBSH. In addition, the Independent Trustees received a memorandum from independent counsel discussing the legal standards for their consideration of the New Agreements.
Consideration of the New Agreements followed shortly on the heels of the Independent Trustees' annual consideration of whether to renew the Existing Agreements, carried out pursuant to Section 15(c) of the 1940 Act. In that process, which began prior to the June 2008 quarterly meeting of the Board and was concluded at the September 2008 quarterly meeting, the Independent Trustees, following an extensive review of materials submitted by Management and a report from an independent data service, unanimously determined that the Existing Agreements were fair and reasonable and that their renewal would be in the best interests of the Fund and its shareholders. Accordingly, in considering the New Agreements, the Independent Trustees took into account the fact that the terms of the New Agreements would be identical to those of the Existing Agreements in every respect except for the term and termination date and potentially the name of the investment adviser. The Board considerations in connection with the New Agreements and the Existing Agreements also entered into the decision by the Board to approve the Interim Agreements, which would take effect if the shareholders of the Fund do not approve the New Agreements before the Proposed Acquisition is completed. The Independent Trustees' consideration of the Existing Agreements is described above.
In evaluating the proposed New Agreements, the Independent Trustees considered that they have generally been satisfied with the nature and quality of the services provided to the Fund by Management and Neuberger, including investment advisory, administrative and support services, and that the Fund would be best served by an arrangement that appeared likely to maintain the continuity and stability of the providers of these services. Accordingly, the Independent Trustees considered very carefully the intentions of NBSH (including its successors or assign) regarding capitalization, management structure, staffing, compensation and staff retention and whether these seemed designed to provide the desired continuity and stability. They inquired specifically about staffing and resources in the areas of portfolio management, investment research, trading, fund accounting, legal and compliance, internal audit, and senior executive staff. Although at the time the Board considered the New Agreements no final decisions had been reached as to the distribution of equity interests in NBSH (or its successor or assign), the Trustees were advised that senior members of management, including the Fund Trustee and nominee for Fund Trustee who are employed by the Advisers, would receive equity interests in NBSH. Because of these interests, as well as any future employment arrangements with the Advisers, these persons, individually or in the aggregate, could have a material interest in the Proposed Acquisition and in shareholder approval of the New Agreements. In considering the New Agreements, the Trustees were aware of these interests.
The Independent Trustees inquired whether NBSH (or its successors or assign) had specific plans for the future structure of the Neuberger Berman Funds, whether they plan to propose to eliminate any Funds, and whether they intend to continue or alter certain expansion plans that are already underway. They also inquired whether there are plans to change the fees or expense structure of any of the Funds. The Independent Trustees inquired about the long-term plans for the Advisers, including any expectations for cost savings or expense reductions. They also inquired about the capital structure and working capital likely to be available to NBSH (or its successors or assign).
The Independent Trustees considered the following factors, in addition to the factors discussed above, among others, in connection with their consideration of the New Agreements: (1) the nature, extent, and quality of the services provided by Management and Neuberger; (2) the performance of the Fund compared to a relevant market index and a peer group of investment companies; (3) the costs of the services provided and profits or losses realized by Management and its affiliates from their relationship with the Fund; (4) the extent to which economies of scale might be realized as the Fund grows; and (5) whether fee levels reflect any such potential economies of scale for the benefit of investors in the Fund. In
34
their deliberations, the Independent Trustees did not identify any particular information that was all important or controlling, and each Trustee may have attributed different weights to the various factors.
In unanimously approving and recommending the New Agreements, the Independent Trustees concluded that the terms of each New Agreement are fair and reasonable and that approval of the New Agreements is in the best interests of the Fund and its shareholders. In reaching this determination, the Independent Trustees considered the following factors, among others:
(1) that the terms of the New Agreements are identical in all material respects to those of the Existing Agreements;
(2) that the Advisers will maintain operational autonomy and continuity of management following the Proposed Acquisition;
(3) the favorable history, reputation, qualification, and background of Management and Neuberger, as well as the qualifications of each entity's personnel and each entity's respective financial condition;
(4) the commitment of NBSH (or its successors or assign) to retain key personnel currently employed by Management and Neuberger who currently provide services to the Fund;
(5) the commitment of NBSH (or its successors or assign) to maintaining the current level and quality of Fund services;
(6) the proposed division of equity in NBSH (or its successor or assign) among Management Members and other personnel upon consummation of the Proposed Acquisition;
(7) the fees and expense ratio of the Fund relative to comparable mutual funds;
(8) that the fees are identical to those paid under the Existing Agreements;
(9) that the fees and expense ratios of the Fund appear to the Board to be reasonable given the quality of services expected to be provided;
(10) the commitment of Management to maintaining the Fund's current contractual expense limitation agreements to ensure that Fund shareholders of funds that have such arrangements in place do not face an increase in expenses upon consummation of the Proposed Acquisition;
(11) the performance of the Fund relative to comparable mutual funds and unmanaged indices;
(12) the commitment of Management (or its successor) to pay the expenses of the Fund in connection with the Proposed Acquisition, including all expenses in connection with the solicitation of proxies, so that shareholders of the Fund would not have to bear such expenses;
(13) the actual and potential effects on the Advisers of the bankruptcy of Lehman Brothers, and the effects of the Lehman Brothers bankruptcy on the information considered by the Independent Trustees in their prior analyses of the principal service contracts;
(14) the provisions made to continue providing to the Advisers certain services that were previously provided to them by or through Lehman Brothers or its other affiliates;
(15) the possible benefits that may be realized by the Fund and by the Advisers as a result of the Proposed Acquisition; and
(16) that the Proposed Acquisition is expected to maintain continuity of management of the Fund and may reduce the potential for future vulnerability to changes in control of the Advisers that could be adverse to the Fund's interests and that could affect the retention of key employees providing services to the Fund.
35

Neuberger Berman
Advisers Management Trust
Regency Portfolio
I Class Shares
S Class Shares
Annual Report
December 31, 2008
B1012 02/09
Regency Portfolio Manager's Commentary
The Neuberger Berman Advisers Management Trust (AMT) Regency Portfolio significantly outperformed its Russell Midcap(R) Value Index benchmark in the first half of 2008. However, the Portfolio posted a negative return during that period as stocks were pressured by the ongoing housing slump, skyrocketing oil prices, continued write-offs from leading financial institutions, and diminished consumer confidence. In the second half of 2008, economic and market conditions deteriorated even further as the collapse of Bear Stearns (in March) and Lehman Brothers (in September) and the ensuing credit crisis turned a smoldering U.S. recession into a serious global economic slowdown. Forced liquidation by highly leveraged hedge funds faced with margin calls and broad-based selling by mutual funds to meet rising redemptions further undermined stocks. Due primarily to lagging performance in the Materials, Industrials and Health Care sectors, the AMT Regency Portfolio finished 2008 trailing the Russell Midcap Value Index.
During 2008, there was virtually no place in the stock market to escape the broad-based declines. All 10 of the Russell Midcap Value Index sectors posted double-digit losses and seven of 10 sectors declined by 30% or more. Even traditionally defensive sectors such as Consumer Staples, Health Care and Utilities posted double-digit percentage losses.
We failed to anticipate the collapse of Lehman Brothers on September 15, 2008 and underestimated how swiftly and severely it would impact the economy and the stock market. Other than to maintain our course, however, the only option would have been to sell high quality companies with good long-term prospects at fire sale prices - a strategy we believe would have further penalized shareholders.
Industrials sector investments hurt portfolio performance most severely for the year. We thought our strategy of owning industrial companies in secular growth businesses, most notably energy infrastructure, would insulate the Portfolio from the potential damage to traditional cyclicals as the economy weakened. However, cascading energy prices along with the credit crunch are expected to cause delays and/or postponements in energy infrastructure projects, dimming the near-term outlook for several of our holdings. Materials sector holdings, especially metals and mining companies, were also hit hard as the prospect of a global economic slowdown sent materials prices lower. Returns in Health Care were primarily the result of the generally poor performance of the HMOs in the Portfolio.
Information Technology was our only significant relative performance bright spot. The Portfolio was materially overweighted in the sector and our holdings declined much less than the corresponding benchmark sector.
Relatively few portfolio holdings performed well in this ugly market. Property and casualty insurer W.R. Berkley and reinsurer PartnerRe benefited from reduced underwriting capacity and firmer pricing. Mortgage REIT Annaly Capital Management, which deals exclusively in GSE guaranteed conforming mortgages, was roughly flat for the year. Major performance detractors included energy infrastructure construction firm Chicago Bridge and Iron, which had trouble with a major contract, and metals and mining firms Teck Cominco and Freeport-McMoRan Copper & Gold, whose share prices fell sharply along with metals prices.
We remain constructive on Energy because we still believe that, over the longer term, demand will outpace supply growth constrained by the relatively high decline rates of existing wells, the lack of major new discoveries, the rising cost of exploration and production, and ongoing political instability in major energy producing nations. We make a similar case for Materials sector holdings. While demand in emerging market economies (in our view, the real underpinning of global materials demand) has slowed temporarily, we currently believe government stimulus packages and essential infrastructure spending will eventually result in a substantial increase in materials prices from currently depressed levels. Over the intermediate term, the building of refineries, pipelines, liquefied natural gas processing facilities, and power generation plants may temporarily be put on hold. However, when the global economy regains traction, we currently believe the well positioned portfolio companies in these businesses should quickly regain earnings momentum, especially those with a significant percentage of revenue coming from developing nations.
It is difficult to predict precisely when the U.S. and global economies will begin to firm. However, we note that the November 24 rescue of Citigroup along with the Treasury Department and Federal Reserve's moves to lower interest rates, promote inter-bank lending and narrow credit spreads are beginning to have a positive impact on the credit markets.
1
Also, we think that the economy has yet to receive the full benefit of much cheaper energy prices, which are the equivalent of a major tax break for consumers. Finally, we anticipate that a substantial federal fiscal stimulus package will be put into effect shortly.
While there might be more negative economic headlines in the months ahead, we believe the stage is set for the U.S. and global economies to emerge from recession in the second half of 2009. If past is prologue, the stock market should begin anticipating better economic news six to nine months ahead of its arrival. With high quality stocks in most market sectors trading at historically low valuations, we think equities may have already bottomed and are poised to begin regaining lost ground in the quarters ahead.
With unprecedented fundamental bargains abounding in the severely depressed Energy, Materials and Industrials sectors, we feel that the AMT Regency Portfolio is well positioned to benefit when the stock market regains traction. While one month does not a trend make, we are pleased that the Portfolio materially outperformed the Russell Midcap Value Index in December when stocks posted a modest recovery.
Sincerely,

S. Basu Mullick
Portfolio Manager
2
Regency Portfolio
SECTOR ALLOCATION
| (% of Equity Market Value) | |
| Energy | | | 11.6 | % | |
| Materials | | | 4.4 | | |
| Industrials | | | 9.3 | | |
| Consumer Discretionary | | | 11.0 | | |
| Consumer Staples | | | 8.0 | | |
| Health Care | | | 10.2 | | |
| Financials | | | 25.7 | | |
| Information Technology | | | 8.7 | | |
| Utilities | | | 11.1 | | |
| Total | | | 100.0 | % | |
AVERAGE ANNUAL TOTAL RETURN1
| | | Inception
Date | | 1 Year | | 5 Year | | Life of
Fund* | |
| Regency Portfolio Class I | | 08/22/01 | | | (45.82 | %) | | | (3.14 | %) | | | 0.44 | % | |
| Regency Portfolio Class S2 | | 04/29/05 | | | (45.95 | %) | | | (3.28 | %) | | | 0.34 | % | |
| Russell Midcap(R) Value3 | | | | | (38.44 | %) | | | 0.33 | % | | | 3.31 | % | |
| Russell Midcap(R) | | | | | (41.46 | %) | | | (0.71 | %) | | | 2.07 | % | |
Performance data quoted represent past performance, which is no guarantee of future results. The investment return and principal value of an investment will fluctuate so that an investor's shares, when redeemed may be worth more or less than their original cost. Results are shown on a "total return" basis and include reinvestment of all dividends and capital gain distributions.
Current performance may be lower or higher than the performance data quoted. For performance data current to the most recent month end, please visit https://www.nb.com.
* Index returns are as of inception date 08/22/01.
As stated in the Portfolio's most recent prospectus, the total annual fund operating expense ratio for fiscal year 2007 was 0.95% and 1.20% for Class I and Class S shares, respectively (prior to any fee waivers or expense reimbursements). Neuberger Berman Management LLC has contractually agreed to limit certain expenses of the Portfolio through 12/31/2011 for Class I shares and through 12/31/2018 for Class S shares.
COMPARISON OF A $10,000 INVESTMENT
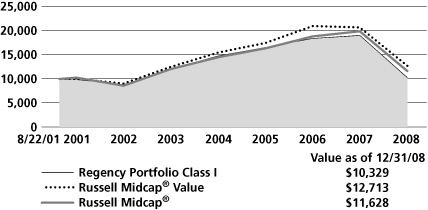
The chart shows the value of a hypothetical $10,000 investment in the Portfolio over the past 10 fiscal years, or since the Portfolio's inception, if it has not operated for 10 years. The graphs are based on Class I shares only; performance of other classes will vary due to differences in fee structures (see Average Annual Total Return chart above). The result is compared with benchmarks, which may include a broad-based market index and/or a narrower index. Please note that market indexes do not include expenses. All results include the reinvestment of dividends and capital gain distributions.
Results represent past performance and do not indicate future results. The chart and table do not reflect the deduction of taxes that a shareholder would pay on Portfolio distributions or the redemption of Portfolio shares.
Please see Endnotes for additional information.
3
Endnotes
1 "Total Return" includes reinvestment of all income dividends and capital gain distributions. Results represent past performance and do not indicate future results. The value of an investment in the Portfolio and the return on the investment both will fluctuate, and redemption process may be higher or lower than an investor's original cost. The performance information does not reflect fees and expenses of the variable annuity and variable life insurance policies or the pension plans whose proceeds are invested in the Portfolio. Neuberger Berman Management LLC ("NBM LLC") has agreed to absorb certain expenses of the AMT Portfolios, including the Portfolio. Without this arrangement, which is subject to change, the total returns of the Portfolio may have been less.
2 Performance shown prior to April 29, 2005, for the Class S shares is that of the Class I shares, which has lower expenses and correspondingly higher returns than Class S shares.
3 The Russell Midcap(R) Value Index measures the performance of those Russell Midcap(R) Index companies with lower price-to-book ratios and lower forecasted growth values. The Russell Midcap Index measures the performance of the 800 smallest companies in the Russell 1000(R) Index, which represents approximately 31% of the total market capitalization of the Russell 1000 Index (which, in turn, consists of the 1,000 largest U.S. companies, based on market capitalization). Please note that indices do not take into account any fees and expenses of investing in the individual securities that they track and that individuals cannot invest directly in any index. Data about the performance of these indices are prepared or obtained by NBM LLC and include reinvestment of all dividends and capital gain distributions. The Portfolio may invest in many securities not included in the above-described indices.
Any ratios or other measurements using a factor of forecasted earnings of a company discussed herein are based on consensus estimates, not NBM LLC's own projections, and they may or may not be realized. In addition, any revision to a forecast could affect the market price of a security. By quoting them herein, NBM LLC does not offer an opinion as to the accuracy of and does not guarantee these forecasted numbers.
The investments for the Portfolio are managed by the same portfolio manager(s) who manage one or more other mutual funds that have similar names, investment objectives and investment styles as the Portfolio. You should be aware that the Portfolio is likely to differ from the other mutual funds in size, cash flow pattern and tax matters. Accordingly, the holdings and performance of the Portfolio can be expected to vary from those of the other mutual funds.
The composition, industries and holdings of the Portfolio are subject to change.
Shares of the separate AMT Portfolios are sold only through the currently effective prospectus and are not available to the general public. Shares of this Portfolio may be purchased only by life insurance companies to be used with their separate accounts that fund variable annuity and variable life insurance policies and by qualified pension and retirement plans.
(c)2009 Neuberger Berman Management LLC distributor. All rights reserved.
4
Information About Your Fund's Expenses
This table is designed to provide information regarding costs related to your investments. All mutual funds incur operating expenses, which include management fees, fees for administrative services and costs of shareholder reports, among others. The following examples are based on an investment of $1,000 made at the beginning of the six month period ended December 31, 2008 and held for the entire period. The table illustrates the fund's costs in two ways:
| Actual Expenses and Performance: | | The first section of the table provides information about actual account values and actual expenses in dollars, based on the fund's actual performance during the period. You may use the information in this line, together with the amount you invested, to estimate the expenses you paid over the period. Simply divide your account value by $1,000 (for example, an $8,600 account value divided by $1,000 = 8.6), then multiply the result by the number in the first section of the table under the heading entitled "Expenses Paid During the Period" to estimate the expenses you paid over the period. | |
|
Hypothetical Example for
Comparison Purposes: | | The second section of the table provides information about hypothetical account values and hypothetical expenses based on the fund's actual expense ratio and an assumed rate of return at 5% per year before expenses. This return is not the fund's actual return. The hypothetical account values and expenses may not be used to estimate the actual ending account balance or expenses you paid for the period. You may use this information to compare the ongoing costs of investing in this fund versus other funds. To do so, compare the expenses shown in this 5% hypothetical example with the 5% hypothetical examples that appear in the shareholder reports of other funds. | |
|
Please note that the expenses in the table are meant to highlight your ongoing costs only. The table and the expense example do not include any transactional costs, such as fees and expenses that are, or may be, imposed under your variable contract or qualified pension plan. Therefore, the information under the heading "Hypothetical (5% annual return before expenses)" is useful in comparing ongoing costs only, and will not help you determine the relative total costs of owning different funds. In addition, if these transactional costs were included, your costs would have been higher.
Expense Information As of 12/31/08 (Unaudited)
NEUBERGER BERMAN ADVISERS MANAGEMENT TRUST REGENCY PORTFOLIO
| Actual | | Beginning Account
Value 7/1/08 | | Ending Account
Value 12/31/08 | | Expenses Paid During
the Period*
7/1/08 - 12/31/08 | | Expense
Ratio | |
| Class I | | $ | 1,000.00 | | | $ | 579.70 | | | $ | 4.01 | | | | 1.01 | % | |
| Class S | | $ | 1,000.00 | | | $ | 579.20 | | | $ | 5.00 | | | | 1.26 | % | |
| Hypothetical (5% annual return before expenses)** | |
| Class I | | $ | 1,000.00 | | | $ | 1,020.06 | | | $ | 5.13 | | | | 1.01 | % | |
| Class S | | $ | 1,000.00 | | | $ | 1,018.80 | | | $ | 6.39 | | | | 1.26 | % | |
* For each class of the fund, expenses are equal to the annualized expense ratio for the class, multiplied by the average account value over the period, multiplied by 184/366 (to reflect the one-half year period shown).
** Hypothetical 5% annual return before expenses is calculated by multiplying the number of days in the most recent half year divided by 366.
5
Schedule of Investments Regency Portfolio
| NUMBER OF SHARES | | | | MARKET VALUEt | |
| Common Stocks (90.6%) | | | |
| Aerospace & Defense (2.6%) | | | |
| | 134,600 | | | Embraer-Empresa Brasileira
de Aeronautica ADR | | $ | 2,181,866 | | |
| | 38,700 | | | L-3 Communications Holdings | | | 2,855,286 | | |
| | | | 5,037,152 | | |
| Auto Components (1.1%) | | | |
| | 129,700 | | | WABCO Holdings | | | 2,047,963 | | |
| Automobiles (1.1%) | | | |
| | 121,500 | | | Harley-Davidson | | | 2,061,855 | E | |
| Beverages (2.8%) | | | |
| | 230,500 | | | Constellation Brands | | | 3,634,985 | * | |
| | 116,800 | | | Dr. Pepper Snapple Group | | | 1,898,000 | * | |
| | | | 5,532,985 | | |
| Capital Markets (6.3%) | | | |
| | 260,400 | | | Invesco Ltd. | | | 3,760,176 | | |
| | 239,300 | | | Jefferies Group | | | 3,364,558 | | |
| | 145,900 | | | Legg Mason | | | 3,196,669 | E | |
| | 126,700 | | | Morgan Stanley | | | 2,032,268 | | |
| | | | 12,353,671 | | |
| Commercial Banks (3.1%) | | | |
| | 207,238 | | | First Horizon National | | | 2,190,506 | E | |
| | 198,400 | | | KeyCorp | | | 1,690,368 | E | |
| | 91,700 | | | Zions Bancorp | | | 2,247,567 | E | |
| | | | 6,128,441 | | |
| Construction & Engineering (1.1%) | | | |
| | 216,300 | | | Chicago Bridge & Iron | | | 2,173,815 | | |
| Diversified Financial Services (0.9%) | | | |
| | 84,700 | | | Moody's Corp. | | | 1,701,623 | E | |
| Electric Utilities (6.5%) | | | |
| | 174,300 | | | DPL Inc. | | | 3,981,012 | E | |
| | 28,600 | | | Entergy Corp. | | | 2,377,518 | E | |
| | 62,400 | | | FirstEnergy Corp. | | | 3,031,392 | | |
| | 148,200 | | | NV Energy | | | 1,465,698 | | |
| | 60,400 | | | PPL Corp. | | | 1,853,676 | | |
| | | | 12,709,296 | | |
Electronic Equipment,
Instruments & Components (2.5%) | | | |
| | 83,700 | | | Anixter International | | | 2,521,044 | * | |
| | 129,800 | | | Avnet, Inc. | | | 2,363,658 | * | |
| | | | 4,884,702 | | |
| NUMBER OF SHARES | | | | MARKET VALUEt | |
| Energy Equipment & Services (2.2%) | | | |
| | 66,100 | | | National Oilwell Varco | | $ | 1,615,484 | * | |
| | 52,300 | | | Noble Corp. | | | 1,155,307 | | |
| | 48,400 | | | Oceaneering International | | | 1,410,376 | * | |
| | | | 4,181,167 | | |
| Food Products (2.5%) | | | |
| | 129,100 | | | ConAgra, Inc. | | | 2,130,150 | E | |
| | 38,800 | | | J. M. Smucker | | | 1,682,368 | | |
| | 69,500 | | | Smithfield Foods | | | 977,865 | * | |
| | | | 4,790,383 | | |
| Health Care Equipment & Supplies (0.7%) | | | |
| | 39,300 | | | Covidien Ltd. | | | 1,424,232 | | |
| Health Care Providers & Services (5.2%) | | | |
| | 99,100 | | | Aetna Inc. | | | 2,824,350 | | |
| | 51,000 | | | AmerisourceBergen Corp. | | | 1,818,660 | | |
| | 88,500 | | | CIGNA Corp. | | | 1,491,225 | E | |
| | 123,400 | | | Coventry Health Care | | | 1,836,192 | * | |
| | 70,200 | | | Pediatrix Medical Group | | | 2,225,340 | * | |
| | | | 10,195,767 | | |
| Health Care Technology (1.1%) | | | |
| | 141,600 | | | IMS Health | | | 2,146,656 | | |
| Hotels, Restaurants & Leisure (0.2%) | | | |
| | 10,300 | | | Darden Restaurants | | | 290,254 | | |
| Household Durables (2.7%) | | | |
| | 7,400 | | | NVR, Inc. | | | 3,376,250 | * | |
| | 43,500 | | | Whirlpool Corp. | | | 1,798,725 | E | |
| | | | 5,174,975 | | |
| Household Products (0.4%) | | | |
| | 13,500 | | | Energizer Holdings | | | 730,890 | * | |
Independent Power Producers &
Energy Traders (2.4%) | | | |
| | 563,100 | | | Dynegy Inc. | | | 1,126,200 | *E | |
| | 153,400 | | | NRG Energy | | | 3,578,822 | *E | |
| | | | 4,705,022 | | |
| Industrial Conglomerates (0.4%) | | | |
| | 87,800 | | | McDermott International | | | 867,464 | * | |
| Insurance (7.3%) | | | |
| | 142,200 | | | Assurant, Inc. | | | 4,266,000 | | |
| | 39,300 | | | PartnerRe Ltd. | | | 2,800,911 | E | |
| | 96,200 | | | StanCorp Financial Group | | | 4,018,274 | | |
| | 102,700 | | | W. R. Berkley | | | 3,183,700 | | |
| | | | 14,268,885 | | |
See Notes to Schedule of Investments 6
| NUMBER OF SHARES | | | | MARKET VALUEt | |
| IT Services (4.3%) | | | |
| | 81,670 | | | Affiliated Computer Services | | $ | 3,752,737 | * | |
| | 76,100 | | | Fidelity National Information
Services | | | 1,238,147 | | |
| | 113,200 | | | Lender Processing Services | | | 3,333,740 | | |
| | | | 8,324,624 | | |
| Machinery (3.6%) | | | |
| | 47,800 | | | Eaton Corp. | | | 2,376,138 | E | |
| | 23,200 | | | Kennametal Inc. | | | 514,808 | | |
| | 30,900 | | | SPX Corp. | | | 1,252,995 | | |
| | 169,200 | | | Terex Corp. | | | 2,930,544 | * | |
| | | | 7,074,485 | | |
| Marine (0.7%) | | | |
| | 194,100 | | | Eagle Bulk Shipping | | | 1,323,762 | | |
| Media (2.1%) | | | |
| | 69,700 | | | Cablevision Systems | | | 1,173,748 | | |
| | 128,700 | | | McGraw-Hill Cos. | | | 2,984,553 | | |
| | | | 4,158,301 | | |
| Metals & Mining (3.9%) | | | |
| | 74,200 | | | Cliffs Natural Resources | | | 1,900,262 | | |
| | 72,200 | | | Freeport-McMoRan
Copper & Gold | | | 1,764,568 | E | |
| | 150,500 | | | Sterlite Industries (India) ADR | | | 830,760 | | |
| | 300,900 | | | Teck Cominco Class B | | | 1,480,428 | | |
| | 43,100 | | | United States Steel | | | 1,603,320 | | |
| | | | 7,579,338 | | |
| Multi-Utilities (1.1%) | | | |
| | 221,100 | | | CMS Energy | | | 2,235,321 | E | |
| Multiline Retail (2.9%) | | | |
| | 137,100 | | | J.C. Penney | | | 2,700,870 | | |
| | 275,400 | | | Macy's Inc. | | | 2,850,390 | | |
| | | | 5,551,260 | | |
| Oil, Gas & Consumable Fuels (8.4%) | | | |
| | 21,900 | | | Apache Corp. | | | 1,632,207 | E | |
| | 154,300 | | | Denbury Resources | | | 1,684,956 | * | |
| | 66,500 | | | Noble Energy | | | 3,273,130 | E | |
| | 97,250 | | | Ship Finance International | | | 1,074,612 | E | |
| | 96,100 | | | Southwestern Energy | | | 2,784,017 | * | |
| | 312,965 | | | Talisman Energy | | | 3,126,521 | | |
| | 81,900 | | | Whiting Petroleum | | | 2,740,374 | * | |
| | | | 16,315,817 | | |
| Personal Products (1.6%) | | | |
| | 200,200 | | | NBTY, Inc. | | | 3,133,130 | * | |
| Pharmaceuticals (2.2%) | | | |
| | 94,300 | | | Shire Limited ADR | | | 4,222,754 | | |
| NUMBER OF SHARES | | | | MARKET VALUEt | |
| Real Estate Investment Trusts (5.6%) | | | |
| | 14,800 | | | Alexandria Real
Estate Equities | | $ | 893,032 | | |
| | 216,300 | | | Annaly Capital Management | | | 3,432,681 | | |
| | 49,326 | | | Boston Properties | | | 2,712,930 | E | |
| | 105,600 | | | Developers Diversified Realty | | | 515,328 | E | |
| | 54,100 | | | Vornado Realty Trust | | | 3,264,935 | E | |
| | | | 10,818,906 | | |
Semiconductors & Semiconductor
Equipment (1.1%) | | | |
| | 155,400 | | | International Rectifier | | | 2,097,900 | * | |
| |
| | | Total Common Stocks
(Cost $263,829,431) | | | 176,242,796 | | |
| Short-Term Investments (19.6%) | | | |
| | 8,861,526 | | | Neuberger Berman Prime
Money Fund Trust Class | | | 8,861,526 | aoo | |
| | 29,396,850 | | | Neuberger Berman Securities
Lending Quality Fund, LLC | | | 29,396,850 | t | |
| |
| | | Total Short-Term Investments
(Cost $38,258,376) | | | 38,258,376 | | |
| |
| | | Total Investments (110.2%)
(Cost $302,087,807) | | | 214,501,172## | | |
| | | | | Liabilities, less cash, receivables
and other assets [(10.2%)] | | | (19,916,520 | ) | |
| | | | | Total Net Assets (100.0%) | | $ | 194,584,652 | | |
See Notes to Schedule of Investments 7
Notes to Schedule of Investments Regency Portfolio
t Investments in equity securities by Neuberger Berman Advisers Management Trust Regency Portfolio (the "Fund") are valued by obtaining valuations from an independent pricing service. The independent pricing service values equity securities at the latest sale price when that price is readily available. Securities traded primarily on the NASDAQ Stock Market are normally valued by the Fund at the NASDAQ Official Closing Price ("NOCP") provided by NASDAQ each business day. The NOCP is the most recently reported price as of 4:00:02 p.m., Eastern time, unless that price is outside the range of the "inside" bid and asked prices (i.e., the bid and asked prices that dealers quote to each other when trading for their own accounts); in that case, NASDAQ will adjust the price to equal the inside bid or asked price, whichever is closer. Because of delays in reporting trades, the NOCP may not be based on the price of the last trade to occur before the market closes. If there is no reported sale of a security on a particular day, the independent pricing service may value the security based on reported market quotations. If a valuation is not available from an independent pricing service, the Fund seeks to obtain quotations from principal market makers. If such quotations are not readily available, securities are valued using methods the Board of Trustees of Neuberger Berman Advisers Management Trust (the "Board") has approved on the belief that they reflect fair value. Numerous factors may be considered when determining the fair value of a security, including available analyst, media or other reports, trading in futures or ADRs and whether the issuer of the security being fair valued has other securities outstanding. Foreign security prices are furnished by independent quotation services and expressed in local currency values. Foreign security prices are currently translated from the local currency into U.S. dollars using the exchange rate as of 4:00 p.m., Eastern time. The Board has approved the use of Interactive Data Pricing and Reference Data, Inc. ("Interactive") to assist in determining the fair value of the Fund's foreign equity securities when changes in the value of a certain index suggest that the closing prices on the foreign exchanges may no longer represent the amount that the Fund could expect to receive for those securities. In this event, Interactive will provide adjusted prices for certain foreign equity securities using a statistical analysis of historical correlations of multiple factors. In the absence of precise information about the market values of these foreign securities as of the close of the New York Stock Exchange, the Board has determined on the basis of available data that prices adjusted in this way are likely to be closer to the prices the Fund could realize on a current sale than are the prices of those securities established at the close of the foreign markets in which the securities primarily trade. Fair value prices are necessarily estimates, and there is no assurance that such a price will be at or close to the price at which the security next trades. Short-term debt securities with less than 60 days until maturity may be valued at cost which, when combined with interest earned, approximates market value.
The Fund adopted Financial Accounting Standards Board ("FASB") Statement of Financial Accounting Standards No. 157, Fair Value Measurements ("FAS 157"), effective January 1, 2008. In accordance with FAS 157, "fair value" is defined as the price that a Fund would receive upon selling an investment in an orderly transaction to an independent buyer in the principal or most advantageous market for the investment. Various inputs are used in determining the value of the Fund's investments.
In addition to defining fair value, FAS 157 established a three-tier hierarchy of inputs to establish a classification of fair value measurements for disclosure purposes. The three-tier hierarchy of inputs is summarized in the three broad Levels listed below.
. Level 1 - quoted prices in active markets for identical investments
. Level 2 - other significant observable inputs (including quoted prices for similar investments, interest rates, prepayment speeds, credit risk, amortized cost, etc.)
. Level 3 - significant unobservable inputs (including the Fund's own assumptions in determining the fair value of investments)
The inputs or methodology used for valuing an investment are not necessarily an indication of the risk associated with investing in those securities.
See Notes to Financial Statements 8
Notes to Schedule of Investments Regency Portfolio (cont'd)
The following is a summary of the inputs used to value the Fund's investments as of December 31, 2008:
| Valuation Inputs | | Investments in
Securities | |
| Level 1 - Quoted Prices | | $ | 176,242,796 | | |
| Level 2 - Other Significant Observable Inputs | | | 38,258,376 | | |
| Level 3 - Significant Unobservable Inputs | | | - | | |
| Total | | $ | 214,501,172 | | |
## At December 31, 2008, the cost of investments for U.S. federal income tax purposes was $310,027,904. Gross unrealized appreciation of investments was $5,584,092 and gross unrealized depreciation of investments was $101,110,824, resulting in net unrealized depreciation of $95,526,732, based on cost for U.S. federal income tax purposes.
* Security did not produce income during the last twelve months.
E All or a portion of this security is on loan (see Note A of Notes to Financial Statements).
t Managed by an affiliate of Neuberger Berman Management LLC and could be deemed an affiliate of the Fund and is segregated in connection with obligations for security lending (see Notes A & F of Notes to Financial Statements).
a Neuberger Berman Prime Money Fund ("Prime Money") is also managed by Neuberger Berman Management LLC and may be considered an affiliate since it has the same officers, Board members, and investment manager as the Fund and because, at times, the Fund may own 5% or more of the outstanding voting securities of Prime Money (see Notes A & F of Notes to Financial Statements).
oo All or a portion of this security is segregated in connection with obligations for security lending.
See Notes to Financial Statements 9
Statement of Assets and Liabilities
Neuberger Berman Advisers Management Trust
| | | REGENCY
PORTFOLIO | |
| | | December 31, 2008 | |
| Assets | |
| Investments in securities, at market value *t (Notes A & F)-see Schedule of Investments: | |
| Unaffiliated issuers | | $ | 176,242,796 | | |
| Affiliated issuers | | | 38,258,376 | | |
| | | | 214,501,172 | | |
| Dividends and interest receivable | | | 333,534 | | |
| Receivable for securities sold | | | 348,049 | | |
| Receivable for Fund shares sold | | | 10,116,598 | | |
| Receivable for securities lending income (Note A) | | | 75,531 | | |
| Total Assets | | | 225,374,884 | | |
| Liabilities | |
| Due to custodian | | | 23,518 | | |
| Payable for collateral on securities loaned (Note A) | | | 29,734,050 | | |
| Payable for securities purchased | | | 451,930 | | |
| Payable for Fund shares redeemed | | | 267,483 | | |
| Payable to investment manager-net (Notes A & B) | | | 78,296 | | |
| Payable to administrator (Note B) | | | 64,221 | | |
| Payable for securities lending fees (Note A) | | | 102,319 | | |
| Accrued expenses and other payables | | | 68,415 | | |
| Total Liabilities | | | 30,790,232 | | |
| Net Assets at value | | $ | 194,584,652 | | |
| Net Assets consist of: | |
| Paid-in capital | | $ | 297,557,018 | | |
| Undistributed net investment income (loss) | | | 1,829,594 | | |
| Accumulated net realized gains (losses) on investments | | | (17,215,325 | ) | |
| Net unrealized appreciation (depreciation) in value of investments | | | (87,586,635 | ) | |
| Net Assets at value | | $ | 194,584,652 | | |
| Net Assets | |
| Class I | | $ | 74,848,197 | | |
| Class S | | | 119,736,455 | | |
| Shares Outstanding ($.001 par value; unlimited shares authorized) | |
| Class I | | | 8,700,364 | | |
| Class S | | | 12,990,393 | | |
| Net Asset Value, offering and redemption price per share | |
| Class I | | $ | 8.60 | | |
| Class S | | | 9.22 | | |
| t Securities on loan, at market value: | |
| Unaffiliated issuers | | $ | 29,055,359 | | |
| * Cost of Investments: | |
| Unaffiliated issuers | | $ | 263,829,431 | | |
| Affiliated issuers | | | 38,258,376 | | |
| Total cost of investments | | $ | 302,087,807 | | |
See Notes to Financial Statements 10
Statement of Operations
Neuberger Berman Advisers Management Trust
| | | REGENCY
PORTFOLIO | |
| | | For the
Year Ended
December 31, 2008 | |
| Investment Income: | |
| Income (Note A): | |
| Dividend income-unaffiliated issuers | | $ | 4,695,348 | | |
| Interest income-unaffiliated issuers | | | 6,766 | | |
| Income from securities loaned-net (Note F) | | | 69,713 | | |
| Income from investments in affiliated issuers (Note F) | | | 233,779 | | |
| Foreign taxes withheld | | | (42,119 | ) | |
| Total income | | $ | 4,963,487 | | |
| Expenses: | |
| Investment management fees (Notes A & B) | | | 1,538,309 | | |
| Administration fees (Note B): | |
| Class I | | | 427,929 | | |
| Class S | | | 418,041 | | |
| Distribution fees (Note B): | |
| Class S | | | 348,368 | | |
| Audit fees | | | 40,494 | | |
| Custodian fees (Note B) | | | 128,026 | | |
| Insurance expense | | | 9,309 | | |
| Legal fees | | | 63,053 | | |
| Shareholder reports | | | 66,249 | | |
| Trustees' fees and expenses | | | 38,140 | | |
| Miscellaneous | | | 14,917 | | |
| Total expenses | | | 3,092,835 | | |
| Investment management fees waived (Note A) | | | (7,687 | ) | |
| Expenses reduced by custodian fee expense offset and commission recapture arrangements (Note B) | | | (19,694 | ) | |
| Total net expenses | | | 3,065,454 | | |
| Net investment income (loss) | | $ | 1,898,033 | | |
| Realized and Unrealized Gain (Loss) on Investments (Note A) | |
| Net realized gain (loss) on: | |
| Sales of investment securities of unaffiliated issuers | | | (10,437,555 | ) | |
| Sales of investment securities of affiliated issuers | | | (337,200 | ) | |
| Foreign currency | | | (810 | ) | |
| Change in net unrealized appreciation (depreciation) in value of: | |
| Unaffiliated investment securities | | | (138,913,736 | ) | |
| Foreign currency | | | (1,468 | ) | |
| Net gain (loss) on investments | | | (149,690,769 | ) | |
| Net increase (decrease) in net assets resulting from operations | | $ | (147,792,736 | ) | |
See Notes to Financial Statements 11
Statements of Changes in Net Assets
Neuberger Berman Advisers Management Trust
| | | REGENCY PORTFOLIO | |
| | | Year Ended
December 31,
2008 | | Year Ended
December 31,
2007 | |
| Increase (Decrease) in Net Assets: | |
| From Operations: | |
| Net investment income (loss) | | $ | 1,898,033 | | | $ | 3,377,918 | | |
| Net realized gain (loss) on investments | | | (10,775,565 | ) | | | (5,743,341 | ) | |
| Change in net unrealized appreciation (depreciation) of investments | | | (138,915,204 | ) | | | 10,343,523 | | |
| Net increase (decrease) in net assets resulting from operations | | | (147,792,736 | ) | | | 7,978,100 | | |
| Distributions to Shareholders From (Note A): | |
| Net investment income: | |
| Class I | | | (1,421,903 | ) | | | (1,030,430 | ) | |
| Class S | | | (1,552,353 | ) | | | (546,819 | ) | |
| Net realized gain on investments: | |
| Class I | | | (262,715 | ) | | | (6,192,881 | ) | |
| Class S | | | (337,659 | ) | | | (3,546,956 | ) | |
| Total distributions to shareholders | | | (3,574,630 | ) | | | (11,317,086 | ) | |
| From Fund Share Transactions (Note D): | |
| Proceeds from shares sold: | |
| Class I | | | 13,908,918 | | | | 25,739,510 | | |
| Class S | | | 89,442,140 | | | | 122,716,525 | | |
| Proceeds from reinvestment of dividends and distributions: | |
| Class I | | | 1,684,618 | | | | 7,223,311 | | |
| Class S | | | 1,890,012 | | | | 4,093,775 | | |
| Payments for shares redeemed: | |
| Class I | | | (89,444,987 | ) | | | (59,013,936 | ) | |
| Class S | | | (40,038,322 | ) | | | (26,671,243 | ) | |
| Net increase (decrease) from Fund share transactions | | | (22,557,621 | ) | | | 74,087,942 | | |
| Net Increase (Decrease) in Net Assets | | | (173,924,987 | ) | | | 70,748,956 | | |
| Net Assets: | |
| Beginning of year | | | 368,509,639 | | | | 297,760,683 | | |
| End of year | | $ | 194,584,652 | | | $ | 368,509,639 | | |
| Undistributed net investment income (loss) at end of year | | $ | 1,829,594 | | | $ | 2,973,387 | | |
See Notes to Financial Statements 12
Notes to Financial Statements Regency Portfolio
Note A-Summary of Significant Accounting Policies:
1 General: Regency Portfolio (the "Fund") is a separate operating series of Neuberger Berman Advisers Management Trust (the "Trust"), a Delaware statutory trust organized pursuant to a Trust Instrument dated May 23, 1994. The Trust is currently comprised of ten separate operating series (each a "Series," collectively, the "Funds") each of which is diversified. The Trust is registered as an open-end management investment company under the Investment Company Act of 1940, as amended (the "1940 Act"), and its shares are registered under the Securities Act of 1933, as amended (the "1933 Act"). The Fund currently offers Class I and Class S shares. The Board of Trustees of the Trust (the "Board") may establish additional series or classes of shares without the approval of shareholders.
The assets of each Series belong only to that Series, and the liabilities of each Series are borne solely by that Series and no other.
The preparation of financial statements in accordance with U.S. generally accepted accounting principles requires Neuberger Berman Management LLC ("Management") to make estimates and assumptions at the date of the financial statements. Actual results could differ from those estimates.
Management, the investment manager of the Fund, and Neuberger Berman, LLC ("Neuberger"), the Fund's sub-adviser, are wholly owned subsidiaries of Lehman Brothers Holdings Inc. ("Lehman Brothers"), a publicly owned holding company. On September 15, 2008, Lehman Brothers filed a voluntary petition under Chapter 11 of the U.S. Bankruptcy Code. On December 3, 2008, NBSH Acquisition, LLC ("NBSH"), an entity organized by key members of Neuberger Berman's senior management, was selected as the successful bidder in the public auction to acquire a majority interest in Neuberger Berman's business and the fixed income and certain alternative asset management businesses of Lehman Brothers' Investment Management Division (together with Neuberger Berman, the "Acquired Businesses") (the "Proposed Acquisition"). On December 22, 2008, the bankruptcy court having jurisdiction over the Lehman Brothers matter approved the sale of the Acquired Businesses to NBSH (or its successor or assigned), as the successful bidder. At the closing of the Proposed Acquisition, a majority interest in the Acquired Businesses will be directly or indirectly owned by portfolio managers, Neuberger Berman's management team and certain key members and senior professionals of the former Investment Management Division, as well as by Lehman Brothers and certain affiliates of Lehman Brothers. The transaction is subject to certain conditions and approvals.
These events, while affecting Lehman Brothers, have not had a material impact on the Fund or its operations. Management and Neuberger will continue to operate in the ordinary course of business as the investment manager and sub-adviser of the Fund.
Included in the Acquired Businesses are Management and Neuberger. The consummation of the Proposed Acquisition has been deemed to result in an "assignment" of the Fund's Management and Sub-Advisory Agreements which would, by law, automatically terminate those agreements. Accordingly, the Board, including the Trustees who are not "interested persons" of the Fund's investment manager and its affiliates or the Fund, has approved the new Management Agreements and Sub-Advisory Agreements for the Fund. The new agreements also will require the approval of the Fund's shareholders.
2 Portfolio valuation: Investment securities are valued as indicated in the notes following the Schedule of Investments.
3 Foreign currency translation: The accounting records of the Fund are maintained in U.S. dollars. Foreign currency amounts are currently translated into U.S. dollars using the exchange rates as of 4:00 p.m., Eastern time, to determine the value of investments, other assets and liabilities. Purchase and sale prices of securities, and income and expenses, are translated into U.S. dollars at the prevailing rate of exchange on the respective dates of such
13
transactions. Net unrealized foreign currency gain (loss) arises from changes in the value of assets and liabilities, other than investments in securities, as a result of changes in exchange rates and is stated separately in the Statement of Operations.
4 Securities transactions and investment income: Securities transactions are recorded on trade date for financial reporting purposes. Dividend income is recorded on the ex-dividend date or, for certain foreign dividends, as soon as the Fund becomes aware of the dividends. Non-cash dividends included in dividend income, if any, are recorded at the fair market value of the securities received. Interest income, including accretion of original issue discount, where applicable, and accretion of discount on short-term investments, is recorded on the accrual basis. Realized gains and losses from securities transactions and foreign currency transactions, if any, are recorded on the basis of identified cost and stated separately in the Statement of Operations. Included in net realized gain (loss) on investments are proceeds from the settlements of class action litigation in which the Fund participated as a plaintiff. The amount of such proceeds for the year ended December 31, 2008 was $8,849.
5 Income tax information: The Funds are treated as separate entities for U.S. federal income tax purposes. It is the policy of the Fund to continue to qualify as a regulated investment company by complying with the requirements of Subchapter M of the Internal Revenue Code applicable to regulated investment companies and to distribute substantially all of its earnings to its shareholders. Therefore, no federal income or excise tax provision is required.
The Fund has adopted the provisions of Financial Accounting Standards Board Interpretation No. 48 ("FIN 48") "Accounting for Uncertainty in Income Taxes-an interpretation of FASB Statement No. 109". FIN 48 sets forth a minimum threshold for financial statement recognition of the benefit of a tax position taken, or expected to be taken, in a tax return. The Fund recognizes interest and penalties, if any, related to unrecognized tax benefits as an income tax expense in the Statement of Operations. The Fund is subject to examination by U.S. federal and state tax authorities for returns filed for the prior three fiscal years 2005 - 2007. As of December 31, 2008, the Fund did not have any unrecognized tax benefits.
Income distributions and capital gain distributions are determined in accordance with income tax regulations, which may differ from U.S. generally accepted accounting principles. These differences are primarily due to differing treatments of income and gains on various investment securities held by the Fund, timing differences and differing characterization of distributions made by the Fund as a whole. The Fund may also utilize earnings and profits distributed to shareholders on redemption of shares as a part of the dividends paid deduction for income tax purposes.
As determined on December 31, 2008, permanent differences resulting primarily from different book and tax accounting for foreign currency gains and losses and characterization of distributions from real estate investment trusts were reclassified at fiscal year-end. These reclassifications had no effect on net income, net asset value or net asset value per share of the Fund.
The tax character of distributions paid during the years ended December 31, 2008 and December 31, 2007 was as follows:
| Distributions Paid From: | |
| Ordinary Income | | Long-Term Capital Gain | | Total | |
| 2008 | | 2007 | | 2008 | | 2007 | | 2008 | | 2007 | |
| $ | 2,974,256 | | | $ | 3,255,576 | | | $ | 600,374 | | | $ | 8,061,510 | | | $ | 3,574,630 | | | $ | 11,317,086 | | |
As of December 31, 2008, components of distributable earnings (accumulated losses) on a U.S. federal income tax basis were as follows:
Undistributed
Ordinary
Income | | Undistributed
Long-Term
Gain | | Unrealized
Appreciation
(Depreciation) | | Loss
Carryforwards
and Deferrals | | Total | |
| $ | 1,829,594 | | | $ | 1,837,245 | | | $ | (95,526,736 | ) | | $ | (11,112,469 | ) | | $ | (102,972,366 | ) | |
14
The difference between book basis and tax basis distributable earnings is attributable primarily to timing differences of wash sales, post October loss deferral, partnership basis adjustments, and basis adjustments for real estate investments trusts.
Under current tax law, certain net capital and foreign currency losses realized after October 31 within the taxable year may be deferred and treated as occurring on the first day of the following tax year. For the year ended December 31, 2008, the Fund elected to defer $11,112,469 of net capital losses arising between November 1, 2008 and December 31, 2008.
6 Distributions to shareholders: The Fund may earn income, net of expenses, daily on its investments. Distributions from net investment income and net realized capital gains, if any, generally are distributed in October. Income distributions and capital gain distributions to shareholders are recorded on the ex-date.
7 Foreign taxes: Foreign taxes withheld represent amounts withheld by foreign tax authorities, net of refunds recoverable.
8 Expense allocation: Certain expenses are applicable to multiple funds. Expenses directly attributable to a Series are charged to that Series. Expenses of the Trust that are not directly attributed to a Series are allocated among the Funds, on the basis of relative net assets, except where a more appropriate allocation of expenses to each of the Funds can otherwise be made fairly. Expenses borne by the complex of related investment companies, which includes open-end and closed-end investment companies for which Management serves as investment manager, that are not directly attributed to a Series or the Trust are allocated among the Fund and the other investment companies in the complex or series thereof on the basis of relative net assets, except where a more appropriate allocation of expenses to each investment company in the complex or series thereof can otherwise be made fairly. The Fund's expenses (other than those specific to each class) are allocated proportionally each day between the classes based upon the relative net assets of each class.
9 Security lending: A third party, eSecLending, assists the Fund in conducting a bidding process to identify agents/principals that would pay a guaranteed amount to the Fund in consideration of the Fund entering into an exclusive securities lending arrangement.
eSecLending currently serves as exclusive lending agent for the Fund. Under the securities lending arrangement, the Fund receives cash collateral at the beginning of each transaction equal to at least 102% of the prior day's market value of the loaned securities (105% in the case of international securities). The Fund may invest all the cash collateral in Neuberger Berman Securities Lending Quality Fund, LLC ("Quality Fund"), a fund managed by Lehman Brothers Asset Management LLC ("LBAM"), an affiliate of Management.
At various times during the course of the Fund's fiscal year ended December 31, 2008, the Quality Fund's NAV was below $1.00 per share, which could have affected the NAV of the Fund with securities loans outstanding during the period. The Quality Fund's price per share on December 31, 2008 was $1.00. The market value of the Fund's investments in the Quality Fund as of that date, if any, is reflected in the Fund's Schedule of Investments. If it were necessary to liquidate assets in the Quality Fund to meet returns on outstanding securities loans at a time when the Quality Fund's price per share was less than $1.00, the Fund may not receive an amount from the Quality Fund that is equal in amount to the collateral the Fund would be required to return to the borrower of the securities and the Fund would be required to make up for this shortfall. In addition, as a result of recent reduced liquidity in the credit and fixed income markets, it may be difficult to dispose quickly of some securities in the Quality Fund at the price at which the Quality Fund is carrying them. The Quality Fund is not a money market fund that operates in accordance with Rule 2a-7 under the 1940 Act and there is no assurance that it will maintain a $1.00 share price.
Net income from the lending program represents the guaranteed amount received from a principal plus income earned on the cash collateral invested in Quality Fund or in other investments, less cash collateral fees and other expenses associated with the loans. For the fiscal year ended December 31, 2008, the Fund received net income under the securities lending arrangement of $69,713, which is reflected in the Statement of Operations under the caption "Income from securities loaned-net." For the fiscal year ended December 31, 2008, "Income from
15
securities loaned-net" consisted of $1,483,203 in income earned on cash collateral and guaranteed amounts (including $1,358,990 of interest income earned from the Quality Fund), less fees and expenses paid of $1,413,490.
10 Repurchase agreements: The Fund may enter into repurchase agreements with institutions that Management has determined are creditworthy. Each repurchase agreement is recorded at cost. The Fund requires that the securities purchased in a repurchase agreement be transferred to the custodian in a manner sufficient to enable the Fund to assert a perfected security interest in those securities in the event of a default under the repurchase agreement. The Fund monitors, on a daily basis, the value of the securities transferred to ensure that their value, including accrued interest, is greater than amounts owed to the Fund under each such repurchase agreement.
11 Transactions with other funds managed by Neuberger Berman Management LLC: Pursuant to an Exemptive Order issued by the Securities and Exchange Commission, the Fund may invest in a money market fund managed by Management or an affiliate. The Fund invests in Neuberger Berman Prime Money Fund ("Prime Money"), as approved by the Board. Prime Money seeks to provide the highest available current income consistent with safety and liquidity. For any cash that the Fund invests in Prime Money, Management waives a portion of its management fee equal to the management fee it receives from Prime Money on those assets (the "Arrangement"). For the year ended December 31, 2008, management fees waived under this Arrangement amounted to $7,687 and are reflected in the Statement of Operations under the caption "Investment management fees waived." For the year ended December 31, 2008, income earned under this Arrangement amounted to $233,779 and is reflected in the Statement of Operations under the caption "Income from investments in affiliated issuers."
12 Indemnifications: Like many other companies, the Trust's organizational documents provide that its officers and trustees are indemnified against certain liabilities arising out of the performance of their duties to the Trust. In addition, both in some of its principal service contracts and in the normal course of its business, the Trust enters into contracts that provide indemnifications to other parties for certain types of losses or liabilities. The Trust's maximum exposure under these arrangements is unknown as this could involve future claims against the Trust.
13 Other: All net investment income and realized and unrealized capital gains and losses of the Fund are allocated, on the basis of relative net assets, pro rata among its respective classes.
Note B-Management Fees, Administration Fees, Distribution Arrangements, and Other Transactions With Affiliates:
Fund shares are issued and redeemed in connection with investments in and payments under certain variable annuity contracts and variable life insurance policies issued through separate accounts of life insurance companies and are also offered directly to qualified pension and retirement plans.
The Fund retains Management as its investment manager under a Management Agreement. For such investment management services, the Fund pays Management a fee at the annual rate of 0.55% of the first $250 million of the Fund's average daily net assets, 0.525% of the next $250 million, 0.50% of the next $250 million, 0.475% of the next $250 million, 0.45% of the next $500 million, 0.425% of the next $2.5 billion, and 0.40% of average daily net assets in excess of $4 billion.
The Fund retains Management as its administrator under an Administration Agreement. Each class pays Management an administration fee at the annual rate of 0.30% of its average daily net assets under this agreement. Additionally, Management retains State Street Bank and Trust Company ("State Street") as its sub-administrator under a Sub-Administration Agreement. Management pays State Street a fee for all services received under this agreement.
The Board adopted a non-fee distribution plan for the Fund's Class I.
For the Fund's Class S, Management acts as agent in arranging for the sale of class shares without commission and bears advertising and promotion expenses. The Board has adopted a distribution plan (the "Plan") with respect to this class, pursuant to Rule 12b-1 under the 1940 Act. The Plan provides that, as compensation for administrative and other services provided to this class, Management's activities and expenses related to the sale and distribution
16
of this class of shares, and ongoing services provided to investors in this class, Management receives from this class a fee at the annual rate of 0.25% of Class S's average daily net assets. Management receives this amount to provide distribution and shareholder servicing for this class and pays a portion of it to institutions that provide such services. Those institutions may use the payments for, among other purposes, compensating employees engaged in sales and/or shareholder servicing. The amount of fees paid by this class during any year may be more or less than the cost of distribution and other services provided to this class. FINRA rules limit the amount of annual distribution fees that may be paid by a mutual fund and impose a ceiling on the cumulative distribution fees paid. The Trust's Plan complies with those rules.
Management has contractually undertaken to forgo current payment of fees and/or reimburse the Fund's Class I and Class S shares for their operating expenses (including the fees payable to Management but excluding interest, taxes, brokerage commissions, extraordinary expenses, and transaction costs) ("Operating Expenses") which exceed the expense limitation as detailed in the following table:
| | | Expense Limitation (1) | | Expiration | | Reimbursement from
Management for the
Year Ended
December 31, 2008 | |
| Class I | | | 1.50 | % | | | 12/31/11 | | | $ | - | | |
| Class S | | | 1.25 | % | | | 12/31/18 | | | | - | | |
(1) Expense limitation per annum of the respective class' average daily net assets.
Each respective class has agreed to repay Management for fees and expenses foregone and/or its excess Operating Expenses previously reimbursed by Management, so long as its annual Operating Expenses during that period do not exceed its Expense Limitation, and the repayment is made within three years after the year in which Management issued the reimbursement or waived fees. During the year ended December 31, 2008, there was no repayment to Management under this agreement. At December 31, 2008, the Fund's Class I and Class S shares had no contingent liability to Management under this agreement.
Neuberger is retained by Management to furnish it with investment recommendations and research information without added cost to the Fund. Several individuals who are officers and/or trustees of the Trust are also employees of Neuberger and/or Management.
The Fund had entered into a commission recapture program, which enabled it to pay some of its operational expenses by recouping a portion of the commissions it paid to a broker that was not a related party of the Fund. Pursuant to the agreement, brokers paid recaptured commissions to the Fund's custodian and the custodian directed these amounts toward payment of expenses such as custodial, transfer agency or accounting services. Effective April 1, 2008, this commission recapture program was terminated. For the period ended March 31, 2008, the impact of this arrangement was a reduction of expenses of $19,368.
The Fund has an expense offset arrangement in connection with its custodian contract. For the year ended December 31, 2008, the impact of this arrangement was a reduction of expenses of $326.
Note C-Securities Transactions:
During the year ended December 31, 2008, there were purchase and sale transactions (excluding short-term securities) of $181,666,623, and $221,330,359, respectively.
During the year ended December 31, 2008, brokerage commissions on securities transactions paid to affiliated brokers were as follows: Neuberger received $0 and Lehman Brothers Inc. received $29,574.
17
Note D-Fund Share Transactions:
Share activity for the years ended December 31, 2008 and December 31, 2007 was as follows:
For the Year Ended December 31, 2008
| | | Shares Sold | | Shares Issued on
Reinvestment of
Dividends and
Distributions | | Shares
Redeemed | | Total | |
| Class I | | | 1,159,506 | | | | 192,089 | | | | (6,033,868 | ) | | | (4,682,273 | ) | |
| Class S | | | 6,827,317 | | | | 201,065 | | | | (2,747,630 | ) | | | 4,280,752 | | |
For the Year Ended December 31, 2007
| | | Shares Sold | | Shares Issued on
Reinvestment of
Dividends and
Distributions | | Shares
Redeemed | | Total | |
| Class I | | | 1,517,433 | | | | 429,959 | | | | (3,491,909 | ) | | | (1,544,517 | ) | |
| Class S | | | 6,762,754 | | | | 227,685 | | | | (1,493,254 | ) | | | 5,497,185 | | |
Note E-Line of Credit:
At December 31, 2008, the Fund was a participant in a single committed, unsecured $150,000,000 line of credit with State Street, to be used only for temporary or emergency purposes. Other investment companies managed by Management also participate in this line of credit on the same terms. Interest is charged on borrowings under this line of credit at the overnight Federal Funds Rate plus 0.50% per annum. A facility fee of 0.07% (as of September 19, 2008, 0.09%) per annum of the available line of credit is charged, of which the Fund has agreed to pay its pro rata share, based on the ratio of its individual net assets to the net assets of all participants at the time the fee is due and payable. The fee is paid quarterly in arrears. Because several investment companies participate, there is no assurance that an individual Fund will have access to all or any part of the $150,000,000 at any particular time. There were no loans outstanding pursuant to this line of credit at December 31, 2008. During the year ended December 31, 2008, the Fund did not utilize this line of credit.
Note F-Investments in Affiliates:
| Name of Issuer | | Balance of
Shares
Held
December 31,
2007 | | Gross
Purchases
and
Additions | | Gross
Sales
and
Reductions | | Balance of
Shares
Held
December 31,
2008 | | Value
December 31,
2008 | | Income from
Investments in
Affiliated
Issuers
Included in
Total Income | |
Neuberger Berman Prime
Money Fund Trust Class* | | | 4,655,750 | | | | 109,246,879 | | | | 105,041,103 | | | | 8,861,526 | | | $ | 8,861,526 | | | $ | 233,779 | | |
Neuberger Berman Securities
Lending Quality Fund, LLC** | | | 79,528,420 | | | | 324,073,046 | | | | 374,204,616 | | | | 29,396,850 | | | | 29,396,850 | | | | 1,358,990 | | |
| Total | | | | | | | | | | $ | 38,258,376 | | | $ | 1,592,769 | | |
* Prime Money is also managed by Management and may be considered an affiliate since it has the same officers, Board members, and investment manager as the Fund and because, at times, the Fund may own 5% or more of the outstanding voting securities of Prime Money.
18
** Quality Fund, a fund managed by LBAM, an affiliate of Management, is used to invest cash the Fund receives as collateral for securities loaned as approved by the Board. Because all shares of Quality Fund are held by funds in the related investment management complex, Quality Fund may be considered an affiliate of the Fund.
Note G-Recent Accounting Pronouncement:
In March 2008, Statement of Financial Accounting Standards No. 161, "Disclosures about Derivative Instruments and Hedging Activities-an amendment of FASB Statement No. 133" ("FAS 161"), was issued. FAS 161 is intended to improve financial reporting for derivative instruments by requiring enhanced disclosure that enables investors to understand how and why an entity uses derivatives, how derivatives are accounted for, and how derivative instruments affect an entity's results of operations and financial position. In September 2008, FASB Staff Position No. 133-1 and FASB Interpretation No. 45-4 (the "FSP"), "Disclosures about Credit Derivatives and Certain Guarantees: An Amendment of FASB Statement No. 133 and FASB Interpretation No. 45; and Clarification of the Effective Date of FASB Statement No. 161" was issued. Certain provisions of the FSP amend FASB Statement No. 133, "Accounting for Derivative Instruments and Hedging Activities," to require disclosures by sellers of credit derivatives, including credit derivatives embedded in hybrid instruments. These FSP provisions are effective for fiscal years and interim periods ending after November 15, 2008. At this time, Management has assessed the implication of these FSP provisions and determined there is no impact to the Fund's financial statements. The FSP also clarifies the effective date of FAS 161, whereby disclosures required by FAS 161 are effective for financial statements issued for fiscal years and interim periods beginning after November 15, 2008. The impact of FAS 161 on the Fund's financial statement disclosures, if any, is currently being assessed.
Note H-Recent Market Events:
The year covered by this report witnessed an unusually high degree of volatility in the financial markets and the net asset values of many mutual funds, including to some extent the Fund. Both domestic and international equity markets have been experiencing heightened volatility and turmoil, with issuers that have exposure to the real estate, mortgage and credit markets particularly affected. In addition to the recent turbulence in financial markets, the reduced liquidity in credit and fixed income markets has negatively affected many issuers worldwide. The Fund's investments in certain issuers, as reflected in the Fund's schedule of investments, and the financial markets in general, expose investors to the volatile performance resulting from these market conditions and related events.
19
Financial Highlights
Regency Portfolio
The following tables include selected data for a share outstanding throughout each period and other performance information derived from the Financial Statements.
Class I
| | | Year Ended December 31, | |
| | | 2008 | | 2007 | | 2006 | | 2005 | | 2004 | |
| Net Asset Value, Beginning of Year | | $ | 16.23 | | | $ | 16.21 | | | $ | 15.50 | | | $ | 14.79 | | | $ | 12.09 | | |
| Income From Investment Operations: | |
| Net Investment Income (Loss)t | | | .10 | | | | .17 | | | | .13 | | | | .09 | | | | .02 | | |
Net Gains or Losses on Securities
(both realized and unrealized) | | | (7.53 | ) | | | .39 | | | | 1.55 | | | | 1.59 | | | | 2.68 | | |
| Total From Investment Operations | | | (7.43 | ) | | | .56 | | | | 1.68 | | | | 1.68 | | | | 2.70 | | |
| Less Distributions From: | |
| Net Investment Income | | | (.17 | ) | | | (.08 | ) | | | (.07 | ) | | | (.01 | ) | | | (.00 | ) | |
| Net Capital Gains | | | (.03 | ) | | | (.46 | ) | | | (.90 | ) | | | (.96 | ) | | | - | | |
| Total Distributions | | | (.20 | ) | | | (.54 | ) | | | (.97 | ) | | | (.97 | ) | | | (.00 | ) | |
| Net Asset Value, End of Year | | $ | 8.60 | | | $ | 16.23 | | | $ | 16.21 | | | $ | 15.50 | | | $ | 14.79 | | |
| Total Returntt | | | (45.82 | )% | | | 3.30 | % | | | 11.17 | % | | | 12.00 | % | | | 22.36 | % | |
| Ratios/Supplemental Data | |
| Net Assets, End of Year (in millions) | | $ | 74.8 | | | $ | 217.3 | | | $ | 242.0 | | | $ | 220.6 | | | $ | 138.5 | | |
Ratio of Gross Expenses to Average Net
Assets# | | | .97 | % | | | .93 | % | | | .96 | % | | | 1.01 | % | | | 1.04 | % | |
| Ratio of Net Expenses to Average Net AssetsS | | | .96 | % | | | .92 | % | | | .95 | % | | | 1.00 | % | | | 1.02 | % | |
Ratio of Net Investment Income (Loss) to
Average Net Assets | | | .76 | % | | | 1.03 | % | | | .80 | % | | | .56 | % | | | .19 | % | |
| Portfolio Turnover Rate | | | 66 | % | | | 58 | % | | | 53 | % | | | 83 | % | | | 68 | % | |
See Notes to Financial Highlights 20
Financial Highlights (cont'd)
| Class S | |
| | | Year Ended December 31, | | Period from
April 29, 2005^
to December 31, | |
| | | 2008 | | 2007 | | 2006 | | 2005 | |
| Net Asset Value, Beginning of Period | | $ | 17.37 | | | $ | 17.35 | | | $ | 16.56 | | | $ | 14.02 | | |
| Income From Investment Operations: | |
| Net Investment Income (Loss)t | | | .08 | | | | .14 | | | | .10 | | | | .08 | | |
Net Gains or Losses on Securities
(both realized and unrealized) | | | (8.06 | ) | | | .41 | | | | 1.66 | | | | 2.46 | | |
| Total From Investment Operations | | | (7.98 | ) | | | .55 | | | | 1.76 | | | | 2.54 | | |
| Less Distributions From: | |
| Net Investment Income | | | (.14 | ) | | | (.07 | ) | | | (.07 | ) | | | - | | |
| Net Capital Gains | | | (.03 | ) | | | (.46 | ) | | | (.90 | ) | | | - | | |
| Total Distributions | | | (.17 | ) | | | (.53 | ) | | | (.97 | ) | | | - | | |
| Net Asset Value, End of Period | | $ | 9.22 | | | $ | 17.37 | | | $ | 17.35 | | | $ | 16.56 | | |
| Total Returntt | | | (45.95 | )% | | | 3.05 | % | | | 10.94 | % | | | 18.12 | %** | |
| Ratios/Supplemental Data | |
| Net Assets, End of Period (in millions) | | $ | 119.7 | | | $ | 151.3 | | | $ | 55.7 | | | $ | 4.7 | | |
| Ratio of Gross Expenses to Average Net Assets# | | | 1.23 | % | | | 1.19 | % | | | 1.23 | % | | | 1.25 | %* | |
| Ratio of Net Expenses to Average Net AssetsS | | | 1.22 | % | | | 1.18 | % | | | 1.23 | % | | | 1.23 | %* | |
Ratio of Net Investment Income (Loss) to
Average Net Assets | | | .58 | % | | | .80 | % | | | .56 | % | | | .72 | %* | |
| Portfolio Turnover Rate | | | 66 | % | | | 58 | % | | | 53 | % | | | 83 | %o | |
See Notes to Financial Highlights 21
Notes to Financial Highlights Regency Portfolio
tt Total return based on per share net asset value reflects the effects of changes in net asset value on the performance of the Fund during each fiscal period and assumes dividends and other distributions, if any, were reinvested. Results represent past performance and do not guarantee future results. Current returns may be lower or higher than the performance data quoted. Investment returns and principal may fluctuate and shares when redeemed may be worth more or less than original cost. Total return would have been lower if Management had not reimbursed and/or waived certain expenses. Total return would have been higher if Management had not recouped previously reimbursed expenses. The total return information shown does not reflect charges and other expenses that apply to the separate account or the related insurance policies, and the inclusion of these charges and other expenses would reduce the total return for all fiscal periods shown.
# The Fund is required to calculate an expense ratio without taking into consideration any expense reductions related to expense offset arrangements.
S After reimbursement of expenses by Management. Had Management not undertaken such action, the annualized ratios of net expenses to average daily net assets would have been:
| | | Period from
April 29, 2005x to
December 31, 2005 | |
| Regency Portfolio Class S | | | 1.32 | % | |
After reimbursement of expenses previously paid by Management. Had Management not been reimbursed, the ratios of net expenses to average daily net assets would have been:
| | | Year Ended
December 31, | |
| | | 2006 | |
| Regency Portfolio Class I | | | - | | |
| Regency Portfolio Class S | | | 1.22 | % | |
After waiver of a portion of the investment management fee by Management. Had Management not undertaken such action, the annualized ratios of net expenses to average daily net assets would have been:
| | | Year Ended December 31, | | Period
Ended
December 31, | | Year
Ended
December 31, | |
| | | 2008 | | 2007 | | 2006 | | 2005xx | | 2004 | |
| Regency Portfolio Class I | | | .96 | % | | | .93 | % | | | .95 | % | | | 1.01 | % | | | 1.02 | % | |
| Regency Portfolio Class S | | | 1.22 | % | | | 1.18 | % | | | 1.23 | % | | | 1.24 | % | | | - | | |
xx For the year ended December 31, 2005 for Class I. For the period from April 29, 2005 (commencement of operations) to December 31, 2005 for Class S.
x The date investment operations commenced.
t Calculated based on the average number of shares outstanding during each fiscal period.
o Portfolio turnover is calculated at the Fund level. Percentage indicated was calculated for the year ended December 31, 2005.
* Annualized.
** Not annualized.
22
Report of Independent Registered Public Accounting Firm
To the Board of Trustees of
Neuberger Berman Advisers Management Trust and
Shareholders of Regency Portfolio
We have audited the accompanying statement of assets and liabilities, including the schedule of investments, of Regency Portfolio, one of the series constituting Neuberger Berman Advisers Management Trust (the "Trust"), as of December 31, 2008, and the related statement of operations for the year then ended, the statement of changes in net assets for each of the two years in the period then ended, and the financial highlights for each of the five years in the period then ended. These financial statements and financial highlights are the responsibility of the Trust's management. Our responsibility is to express an opinion on these financial statements and financial highlights based on our audits.
We conducted our audits in accordance with the standards of the Public Company Accounting Oversight Board (United States). Those standards require that we plan and perform the audit to obtain reasonable assurance about whether the financial statements and financial highlights are free of material misstatement. We were not engaged to perform an audit of the Trust's internal control over financial reporting. Our audits included consideration of internal control over financial reporting as a basis for designing audit procedures that are appropriate in the circumstances, but not for the purpose of expressing an opinion on the effectiveness of the Trust's internal control over financial reporting. Accordingly, we express no such opinion. An audit also includes examining, on a test basis, evidence supporting the amounts and disclosures in the financial statements and financial highlights, assessing the accounting principles used and significant estimates made by management, and evaluating the overall financial statement presentation. Our procedures included confirmation of securities owned as of December 31, 2008 by correspondence with the custodian and brokers or by other appropriate auditing procedures where replies from brokers were not received. We believe that our audits provide a reasonable basis for our opinion.
In our opinion, the financial statements and financial highlights referred to above present fairly, in all material respects, the financial position of Regency Portfolio, a series of Neuberger Berman Advisers Management Trust, at December 31, 2008, the results of its operations for the year then ended, the changes in its net assets for each of the two years in the period then ended, and the financial highlights for each of the five years in the period then ended, in conformity with U.S. generally accepted accounting principles.

Boston, Massachusetts
February 9, 2009
23
Trustee and Officer Information
The following tables set forth information concerning the trustees and officers of the Trust. All persons named as trustees and officers also serve in similar capacities for other funds administered or managed by Neuberger Berman Management LLC ("NB Management") and Neuberger Berman, LLC ("Neuberger Berman"). The Statement of Additional Information includes additional information about fund trustees and is available upon request, without charge, by calling (800) 877-9700.
Information about the Board of Trustees
Name, (Year of Birth),
and Address(1) | | Position and
Length of
Time Served(2) | | Principal Occupation(s)(3) | | Number of
Funds in Fund
Complex
Overseen by
Fund Trustee | | Other Directorships
Held Outside Fund
Complex by Fund
Trustee | |
| Independent Fund Trustees | |
|
| John Cannon (1930) | | Trustee since 2000 | | Consultant; formerly, Chairman, CDC Investment Advisers (registered investment adviser), 1993 to January 1999; formerly, President and Chief Executive Officer, AMA Investment Advisors, an affiliate of the American Medical Association. | | | 56 | | | Independent Trustee or Director of three series of Oppenheimer Funds: Oppenheimer Limited Term New York Municipal Fund, Rochester Fund Municipals, and Oppenheimer Convertible Securities Fund since 1992. | |
|
| Faith Colish (1935) | | Trustee since 1982 | | Counsel, Carter Ledyard & Milburn LLP (law firm) since October 2002; formerly, Attorney-at-Law and President, Faith Colish, A Professional Corporation, 1980 to 2002. | | | 56 | | | Formerly, Director (1997 to 2003) and Advisory Director (2003 to 2006), ABA Retirement Funds (formerly, American Bar Retirement Association) (not-for-profit membership corporation). | |
|
| Martha C. Goss (1949) | | Trustee since 2007 | | President, Woodhill Enterprises Inc./Chase Hollow Associates LLC (personal investment vehicle), since 2006; Chief Operating and Financial Officer, Hopewell Holdings LLC/ Amwell Holdings, LLC (a holding company for a healthcare reinsurance company start-up), since 2003; formerly, Consultant, Resources Connection (temporary staffing), 2002 to 2006. | | | 56 | | | Director, Ocwen Financial Corporation (mortgage servicing), since 2005; Director, American Water (water utility), since 2003; Director, Channel Reinsurance (financial guaranty reinsurance), since 2006; Advisory Board Member, Attensity (software developer), since 2005; Director, Allianz Life of New York (insurance), since 2005; Director, Financial Women's Association of New York (not for profit association), since 2003; Trustee Emerita, Brown University, since 1998. | |
|
24
Name, (Year of Birth),
and Address(1) | | Position and
Length of
Time Served(2) | | Principal Occupation(s)(3) | | Number of
Funds in Fund
Complex
Overseen by
Fund Trustee | | Other Directorships
Held Outside Fund
Complex by Fund
Trustee | |
| C. Anne Harvey (1937) | | Trustee since 1998 | | President, C.A. Harvey Associates, since October 2001; formerly, Director, AARP, 1978 to December 2001. | | | 56 | | | Formerly, President, Board of Associates to The National Rehabilitation Hospital's Board of Directors, 2001 to 2002; formerly, Member, Individual Investors Advisory Committee to the New York Stock Exchange Board of Directors, 1998 to June 2002. | |
|
| Robert A. Kavesh (1927) | | Trustee since 2000 | | Retired; Marcus Nadler Professor Emeritus of Finance and Economics, New York University Stern School of Business; formerly, Executive Secretary-Treasurer, American Finance Association, 1961 to 1979. | | | 56 | | | Formerly, Director, The Caring Community (not-for-profit), 1997 to 2006; formerly, Director, DEL Laboratories, Inc. (cosmetics and pharmaceuticals), 1978 to 2004; formerly, Director, Apple Bank for Savings, 1979 to 1990; formerly, Director, Western Pacific Industries, Inc., 1972 to 1986 (public company). | |
|
| Michael M. Knetter (1960) | | Trustee since 2007 | | Dean, School of Business, University of Wisconsin - Madison; formerly, Professor of International Economics and Associate Dean, Amos Tuck School of Business - Dartmouth College, 1998 to 2002. | | | 56 | | | Trustee, Northwestern Mutual Series Fund, Inc., since February 2007; Director, Wausau Paper, since 2005; Director, Great Wolf Resorts, since 2004. | |
|
| Howard A. Mileaf (1937) | | Trustee since 1999 | | Retired; formerly, Vice President and General Counsel, WHX Corporation (holding company), 1993 to 2001. | | | 56 | | | Formerly, Director, Webfinancial Corporation (holding company), 2002 to 2008; formerly, Director WHX Corporation (holding company), January 2002 to June 2005; formerly, Director, State Theatre of New Jersey (not-for-profit theater), 2000 to 2005. | |
|
25
Name, (Year of Birth),
and Address(1) | | Position and
Length of
Time Served(2) | | Principal Occupation(s)(3) | | Number of
Funds in Fund
Complex
Overseen by
Fund Trustee | | Other Directorships
Held Outside Fund
Complex by Fund
Trustee | |
| George W. Morriss (1947) | | Trustee since 2007 | | Retired; formerly, Executive Vice President and Chief Financial Officer, People's Bank, Connecticut (a financial services company), 1991 to 2001. | | | 56 | | | Manager, Old Mutual 2100 fund complex (consisting of six funds) since October 2006 for four funds and since February 2007 for two funds; formerly, Member NASDAQ Issuers' Affairs Committee, 1995 to 2003. | |
|
| Edward I. O'Brien (1928) | | Trustee since 2000 | | Retired; formerly, Member, Investment Policy Committee, Edward Jones, 1993 to 2001; President, Securities Industry Association ("SIA") (securities industry's representative in government relations and regulatory matters at the federal and state levels), 1974 to 1992; Adviser to SIA, November 1992 to November 1993. | | | 56 | | | Formerly, Director, Legg Mason, Inc. (financial services holding company), 1993 to July 2008; formerly, Director, Boston Financial Group (real estate and tax shelters), 1993 to 1999. | |
|
| William E. Rulon (1932) | | Trustee since 2000 | | Retired; formerly, Senior Vice President, Foodmaker, Inc. (operator and franchiser of restaurants), until January 1997. | | | 56 | | | Formerly, Director, Pro-Kids Golf and Learning Academy (teach golf and computer usage to "at risk" children), 1998 to 2006; formerly, Director, Prandium, Inc. (restaurants), March 2001 to July 2002. | |
|
| Cornelius T. Ryan (1931) | | Trustee since 2000 | | Founding General Partner, Oxford Partners and Oxford Bioscience Partners (venture capital investing) and President, Oxford Venture Corporation, since 1981. | | | 56 | | | None. | |
|
26
Name, (Year of Birth),
and Address(1) | | Position and
Length of
Time Served(2) | | Principal Occupation(s)(3) | | Number of
Funds in Fund
Complex
Overseen by
Fund Trustee | | Other Directorships
Held Outside Fund
Complex by Fund
Trustee | |
| Tom D. Seip (1950) | | Trustee since 2000; Chairman of the Board since 2008; Lead Independent Trustee from 2006 to 2008 | | General Partner, Seip Investments LP (a private investment partnership); formerly, President and CEO, Westaff, Inc. (temporary staffing), May 2001 to January 2002; formerly, Senior Executive at the Charles Schwab Corporation, 1983 to 1998, including Chief Executive Officer, Charles Schwab Investment Management, Inc., and Trustee, Schwab Family of Funds and Schwab Investments, 1997 to 1998, and Executive Vice President-Retail Brokerage, Charles Schwab & Co., Inc., 1994 to 1997. | | | 56 | | | Director, H&R Block, Inc. (financial services company), since May 2001; Chairman, Compensation Committee, H&R Block, Inc., since 2006; formerly, Director, Forward Management, Inc. (asset management company), 1999 to 2006. | |
|
| Candace L. Straight (1947) | | Trustee since 1999 | | Private investor and consultant specializing in the insurance industry; formerly, Advisory Director, Securitas Capital LLC (a global private equity investment firm dedicated to making investments in the insurance sector), 1998 to December 2003. | | | 56 | | | Director, Montpelier Re (reinsurance company), since 2006; formerly, Director, National Atlantic Holdings Corporation (property and casualty insurance company), 2004 to 2008; formerly, Director, The Proformance Insurance Company (property and casualty insurance company), 2004 to 2008; formerly, Director, Providence Washington Insurance Company (property and casualty insurance company), December 1998 to March 2006; formerly, Director, Summit Global Partners (insurance brokerage firm), 2000 to 2005. | |
|
| Peter P. Trapp (1944) | | Trustee since 1984 | | Retired; formerly, Regional Manager for Mid-Southern Region, Ford Motor Credit Company, September 1997 to 2007; formerly, President, Ford Life Insurance Company, April 1995 to August 1997. | | | 56 | | | None. | |
|
27
Name, (Year of Birth),
and Address(1) | | Position and
Length of
Time Served(2) | | Principal Occupation(s)(3) | | Number of
Funds in Fund
Complex
Overseen by
Fund Trustee | | Other Directorships
Held Outside Fund
Complex by Fund
Trustee | |
| Fund Trustees who are "Interested Persons" | |
|
| Jack L. Rivkin* (1940) | | Trustee since 2002; President from 2002 to 2008 | | Formerly, Executive Vice President and Chief Investment Officer, Neuberger Berman Holdings LLC (holding company), 2002 to August 2008 and 2003 to August 2008, respectively; formerly, Managing Director and Chief Investment Officer, Neuberger Berman, December 2005 to August 2008 and 2003 to August 2008, respectively; formerly, Executive Vice President, Neuberger Berman, December 2002 to 2005; formerly, Director and Chairman, NB Management, December 2002 to August 2008; formerly, Executive Vice President, Citigroup Investments, Inc., September 1995 to February 2002; formerly, Executive Vice President, Citigroup Inc., September 1995 to February 2002. | | | 56 | | | Director, Dale Carnegie and Associates, Inc. (private company), since 1998; Director, Solbright, Inc. (private company), since 1998. | |
|
28
Name, (Year of Birth),
and Address(1) | | Position and
Length of
Time Served(2) | | Principal Occupation(s)(3) | | Number of
Funds in Fund
Complex
Overseen by
Fund Trustee | | Other Directorships
Held Outside Fund
Complex by Fund
Trustee | |
| Robert Conti* (1956) | | Chief Executive Officer, President and Director since 2008; prior thereto, Executive Vice President in 2008 and Vice President 2000 to 2008 | | Managing Director, Neuberger Berman, since 2007; formerly, Senior Vice President, Neuberger Berman, 2003 to 2006; formerly, Vice President, Neuberger Berman, 1999 to 2003; President and Chief Executive Officer, NB Management, since 2008; formerly, Senior Vice President, NB Management, 2000 to 2008. | | | 56 | | | Chairman of the Board, Staten Island Mental Health Society since 2008. | |
|
(1) The business address of each listed person is 605 Third Avenue, New York, New York 10158.
(2) Pursuant to the Trust's Trust Instrument, each Fund Trustee shall hold office for life or until his or her successor is elected or the Trust terminates; except that (a) any Fund Trustee may resign by delivering a written resignation; (b) any Fund Trustee may be removed with or without cause at any time by a written instrument signed by at least two-thirds of the other Fund Trustees; (c) any Fund Trustee who requests to be retired, or who has become unable to serve, may be retired by a written instrument signed by a majority of the other Fund Trustees; and (d) any Fund Trustee may be removed at any shareholder meeting by a vote of at least two-thirds of the outstanding shares.
(3) Except as otherwise indicated, each individual has held the positions shown for at least the last five years.
* Indicates a Fund Trustee who is an "interested person" within the meaning of the 1940 Act. Mr. Conti is an interested person of the Trust by virtue of the fact that he is an officer of NB Management and Neuberger Berman. Mr. Rivkin may be deemed an interested person of the Trust by virtue of the fact that, until August 2008, he was a director of NB Management and an officer of Neuberger Berman.
29
Information about the Officers of the Trust
Name, (Year of Birth),
and Address(1) | | Position and
Served(2) | | Principal Occupation(s)(3)
Length of Time | |
| Andrew B. Allard (1961) | | Anti-Money Laundering Compliance Officer since 2002 | | Senior Vice President, Neuberger Berman, since 2006; Deputy General Counsel, Neuberger Berman, since 2004; formerly, Vice President, Neuberger Berman, 2000 to 2005; formerly, Associate General Counsel, Neuberger Berman, 1999 to 2004; Anti-Money Laundering Compliance Officer, eleven registered investment companies for which NB Management acts as investment manager and administrator (six since 2002, two since 2003, two since 2004 and one since 2006). | |
|
| Michael J. Bradler (1970) | | Assistant Treasurer since 2005 | | Vice President, Neuberger Berman, since 2006; Employee, NB Management, since 1997; Assistant Treasurer, eleven registered investment companies for which NB Management acts as investment manager and administrator (ten since 2005 and one since 2006). | |
|
| Claudia A. Brandon (1956) | | Executive Vice President since 2008 and Secretary since 1985 | | Senior Vice President, Neuberger Berman, since 2007 and Employee since 1999; formerly, Vice President, Neuberger Berman, 2002 to 2006; Senior Vice President, NB Management, since 2008 and Assistant Secretary since 2004; formerly, Vice President-Mutual Fund Board Relations, NB Management, 2000 to 2008; Executive Vice President, eleven registered investment companies for which NB Management acts as investment manager and administrator (eleven since 2008); Secretary, eleven registered investment companies for which NB Management acts as investment manager and administrator (three since 1985, three since 2002, two since 2003, two since 2004 and one since 2006). | |
|
| Maxine L. Gerson (1950) | | Executive Vice President since 2008 and Chief Legal Officer since 2005 (only for purposes of sections 307 and 406 of the Sarbanes-Oxley Act of 2002) | | Senior Vice President, Neuberger Berman, since 2002; Deputy General Counsel and Assistant Secretary, Neuberger Berman, since 2001; Senior Vice President, NB Management, since 2006; Secretary and General Counsel, NB Management, since 2004; Executive Vice President, eleven registered investment companies for which NB Management acts as investment manager and administrator (eleven since 2008); Chief Legal Officer (only for purposes of sections 307 and 406 of the Sarbanes-Oxley Act of 2002), eleven registered investment companies for which NB Management acts as investment manager and administrator (ten since 2005 and one since 2006). | |
|
| Sheila R. James (1965) | | Assistant Secretary since 2002 | | Vice President, Neuberger Berman, since 2008 and Employee since 1999; formerly, Assistant Vice President, Neuberger Berman, 2007; Assistant Secretary, eleven registered investment companies for which NB Management acts as investment manager and administrator (six since 2002, two since 2003, two since 2004 and one since 2006). | |
|
| Brian Kerrane (1969) | | Vice President since 2008 | | Senior Vice President, Neuberger Berman, since 2006; formerly, Vice President, Neuberger Berman, 2002 to 2006; Vice President, NB Management, since 2008 and Employee since 1991; Vice President, eleven registered investment companies for which NB Management acts as investment manager and administrator (eleven since 2008). | |
|
30
Name, (Year of Birth),
and Address(1) | | Position and
Served(2) | | Principal Occupation(s)(3)
Length of Time | |
| Kevin Lyons (1955) | | Assistant Secretary since 2003 | | Assistant Vice President, Neuberger Berman, since 2008 and Employee since 1999; Assistant Secretary, eleven registered investment companies for which NB Management acts as investment manager and administrator (eight since 2003, two since 2004 and one since 2006). | |
|
| Owen F. McEntee, Jr. (1961) | | Vice President since 2008 | | Vice President, Neuberger Berman, since 2006; Employee, NB Management, since 1992; Vice President, eleven registered investment companies for which NB Management acts as investment manager and administrator (eleven since 2008). | |
|
| John M. McGovern (1970) | | Treasurer and Principal Financial and Accounting Officer since 2005; prior thereto, Assistant Treasurer since 2002 | | Senior Vice President, Neuberger Berman, since 2007; formerly, Vice President, Neuberger Berman, 2004 to 2006; Employee, NB Management, since 1993; Treasurer and Principal Financial and Accounting Officer, eleven registered investment companies for which NB Management acts as investment manager and administrator (ten since 2005 and one since 2006); formerly, Assistant Treasurer, eleven registered investment companies for which NB Management acts as investment manager and administrator, 2002 to 2005. | |
|
| Andrew Provencher (1965) | | Vice President since 2008 | | Managing Director, NB Management, since 2008; Managing Director, Neuberger Berman, since 2005; formerly, Senior Vice President, Neuberger Berman, 2003 to 2005; formerly, Vice President, Neuberger Berman, 1999 to 2003; Vice President, eleven registered investment companies for which NB Management acts as investment manager and administrator (eleven since 2008). | |
|
| Frank Rosato (1971) | | Assistant Treasurer since 2005 | | Vice President, Neuberger Berman, since 2006; Employee, NB Management, since 1995; Assistant Treasurer, eleven registered investment companies for which NB Management acts as investment manager and administrator (ten since 2005 and one since 2006). | |
|
| Neil S. Siegel (1967) | | Vice President since 2008 | | Managing Director, NB Management, since 2008; Managing Director, Neuberger Berman, since 2006; formerly, Senior Vice President, Neuberger Berman, 2004 to 2006; Vice President, eleven registered investment companies for which NB Management acts as investment manager and administrator (eleven since 2008); formerly, Head of Institutional Marketing, Morgan Stanley Investment Management, 1993 to 2004. | |
|
31
Name, (Year of Birth),
and Address(1) | | Position and
Served(2) | | Principal Occupation(s)(3)
Length of Time | |
| Chamaine Williams (1971) | | Chief Compliance Officer since 2005 | | Senior Vice President, Neuberger Berman, since 2007; Chief Compliance Officer, NB Management, since 2006; Senior Vice President, Lehman Brothers Inc., since 2007; formerly, Vice President, Lehman Brothers Inc., 2003 to 2006; Chief Compliance Officer, eleven registered investment companies for which NB Management acts as investment manager and administrator (ten since 2005 and one since 2006); formerly, Chief Compliance Officer, Lehman Brothers Asset Management Inc., 2003 to 2007; formerly, Chief Compliance Officer, Lehman Brothers Alternative Investment Management LLC, 2003 to 2007; formerly, Vice President, UBS Global Asset Management (US) Inc. (formerly, Mitchell Hutchins Asset Management, a wholly-owned subsidiary of PaineWebber Inc.), 1997 to 2003. | |
|
(1) The business address of each listed person is 605 Third Avenue, New York, New York 10158.
(2) Pursuant to the By-Laws of the Trust, each officer elected by the Fund Trustees shall hold office until his or her successor shall have been elected and qualified or until his or her earlier death, inability to serve, or resignation. Officers serve at the pleasure of the Fund Trustees and may be removed at any time with or without cause.
(3) Except as otherwise indicated, each individual has held the positions shown for at least the last five years.
32
Proxy Voting Policies and Procedures
A description of the policies and procedures that the Trust uses to determine how to vote proxies relating to portfolio securities is available, without charge, by calling 1-800-877-9700 (toll-free) and on the website of the Securities and Exchange Commission, at www.sec.gov. Information regarding how the Trust voted proxies relating to portfolio securities during the most recent 12-month period ended June 30 is also available, without charge, by calling 1-800-877-9700 (toll-free), on the website of the Securities and Exchange Commission at www.sec.gov, and on Management's website at www.nb.com.
Quarterly Portfolio Schedule
The Trust files a complete schedule of portfolio holdings for the Fund with the Securities and Exchange Commission for the first and third quarters of each fiscal year on Form N-Q. The Trust's Forms N-Q are available on the Securities and Exchange Commission's website at www.sec.gov and may be reviewed and copied at the Securities and Exchange Commission's Public Reference Room in Washington, DC. Information on the operation of the Public Reference Room may be obtained by calling 1-800-SEC-0330. The information on Form N-Q is available upon request, without charge, by calling 1-800-877-9700 (toll free).
Notice to Shareholders (Unaudited)
The Fund hereby designates $600,374 as a capital gain distribution.
100.00% of the dividends distributed during the fiscal year ended December 31, 2008 qualifies for the dividends received deduction for corporate shareholders.
Board Consideration of the Management and Sub-Advisory Agreements
At a meeting held on September 25, 2008, the Board of Trustees of Neuberger Berman Advisers Management Trust ("Board"), including the Trustees who are not "interested persons" of Neuberger Berman Management LLC ("Management") or Neuberger Berman Advisers Management Trust ("Independent Fund Trustees"), approved the continuance of the Management and Sub-Advisory Agreements ("Agreements") between Management and Regency Portfolio ("Fund").
In evaluating the Agreements, the Board, including the Independent Fund Trustees, reviewed materials furnished by Management and Neuberger Berman, LLC ("Neuberger") in response to questions submitted by counsel to the Independent Fund Trustees, and met with senior representatives of Management and Neuberger regarding their personnel and operations. The Independent Fund Trustees were advised by counsel that is experienced in Investment Company Act of 1940 matters and that is independent of Management and Neuberger. The Independent Fund Trustees received a memorandum from independent counsel discussing the legal standards for their consideration of the proposed continuance of the Agreements. They met with such counsel separately from representatives of Management to discuss the annual contract review. The annual contract review extends over two regular meetings of the Board to ensure that Management and Neuberger have time to respond to any questions the Independent Fund Trustees may have on their initial review of the report and that the Independent Fund Trustees have time to consider those responses. In addition, during this process, the Board held a separate meeting devoted primarily to reviewing and discussing Fund performance.
The Board considered the following factors, among others, in connection with its approval of the continuance of the Agreements: (1) the nature, extent, and quality of the services provided by Management and Neuberger; (2) the performance of the Fund compared to a relevant market index and a peer group of investment companies; (3) the costs of the services provided and profits or losses realized by Management and its affiliates from their relationship with the Fund; (4) the extent to which economies of scale might be realized as the Fund grows; and (5) whether fee levels reflect any such
33
potential economies of scale for the benefit of investors in the Fund. In their deliberations, the Board members did not identify any particular information that was all-important or controlling, and each Trustee may have attributed different weights to the various factors.
The Board considered the continued integrity of Management and Neuberger as organizations, despite the bankruptcy filing by Lehman Brothers Holdings Inc. The Board discussed the efforts made by Management and Neuberger to retain employees, and the reported likelihood that such employees would be retained. The Board discussed the provisions that were being made for ancillary services by Management, Neuberger and their affiliates.
The Board evaluated the terms of the Agreements, the overall fairness of the Agreements to the Fund and whether the Agreements were in the best interests of the Fund and its shareholders.
With respect to the nature, extent and quality of the services provided, the Board considered the performance of the Fund and the experience and staffing of the portfolio management and investment research personnel who perform services for the Fund. The Board noted that Management also provides certain administrative services, including fund accounting and compliance oversight. The Board also considered Management's and Neuberger's policies and practices regarding brokerage. The Board considered the quality of brokerage execution obtained by Management. The Board's Portfolio Transactions and Pricing Committee from time to time reviewed the quality of the brokerage services that Neuberger and Lehman Brothers Inc. had provided, and periodically review studies by an independent firm engaged to review and evaluate the quality of brokerage execution received by the Fund. The Board also reviewed whether Management and Neuberger used brokers to execute Fund transactions that provide research and other services to Management and Neuberger, and the types of benefits potentially derived from such services by Management, Neuberger, the Fund and other clients of Management and Neuberger. In addition, the Board noted the positive compliance history of Management and Neuberger, as each firm has been free of significant compliance problems.
The Board considered the performance of the Fund relative to its benchmark and a peer group of investment companies dedicated to insurance products pursuing broadly similar strategies. The Board also considered performance in relation to the degree of risk undertaken by the portfolio manager.
With respect to the overall fairness of the Agreements, the Board considered the fee structure for the Fund under the Agreements as compared to a peer group of comparable funds dedicated to insurance products and any fall-out benefits likely to accrue to Management or Neuberger or their affiliates from their relationship with the Fund. The Board also considered the profitability of Management and its affiliates from their association with the Fund.
The Board reviewed a comparison of the Fund's management fee and overall expense ratio to a peer group of broadly comparable funds dedicated to insurance products. The Board considered the mean and median of the management fees and expense ratios of the peer group. The Board noted that the Fund's management fee was higher than the peer group mean and median. The Board considered whether specific portfolio management or administration needs contributed to the higher fee. With regard to the sub-advisory fee paid to Neuberger, the Board noted that this fee is "at cost." In addition, the Board considered the contractual limit on Fund expenses undertaken by Management.
The Board considered whether there were other funds that were advised or sub-advised by Management or its affiliates or separate accounts managed by Management or its affiliates with similar investment objectives, policies and strategies to the Fund. The Board compared the fees charged to the Fund at various asset levels to the fees charged to an advised fund, a sub-advised fund and a separate account, each managed in a similar style to the Fund. The Board considered the appropriateness and reasonableness of any differences between the fees charged to the Fund and the other funds and account and determined that the differences in fees were consistent with the management and other services provided.
The Board also evaluated any apparent or anticipated economies of scale in relation to the services Management provides to the Fund. The Board considered that the Fund's fee structure which provides for a reduction of payments resulting from the use of breakpoints and whether those breakpoints are set at appropriate asset levels.
In concluding that the benefits accruing to Management and its affiliates by virtue of their relationship to the Fund were reasonable in comparison with the costs of providing the investment advisory services and the benefits accruing to the Fund, the Board reviewed specific data as to Management's profit on the Fund for a recent period and the trend in profit
34
or loss over recent years. The Board also carefully examined Management's cost allocation methodology and in recent years had an independent consultant review the methodology. It also reviewed an analysis from an independent data service on profitability margins in the investment management industry. The Board recognized that Management should be entitled to earn a reasonable level of profits for services it provides to the Fund and, based on its review, concluded that Management's level of profitability was not excessive.
Conclusions
In approving the Agreements, the Board concluded that the terms of each Agreement are fair and reasonable and that approval of the Agreements is in the best interests of the Fund and its shareholders. In reaching this determination, the Board considered that Management and Neuberger could be expected to provide a high level of service to the Fund; that the performance of the Fund was satisfactory over time; that the Fund's fee structure appeared to the Board to be reasonable given the nature and quality of services provided; and that the benefits accruing to Management and its affiliates by virtue of their relationship to the Fund were reasonable in comparison with the benefits accruing to the Fund.
Board Consideration of New and Interim Management and Sub-Advisory Agreements
Lehman Brothers Holdings Inc. ("Lehman Brothers") has entered into an agreement to sell a controlling interest in the Fund's investment adviser. Under the agreement, Lehman Brothers would sell substantially all of the Neuberger Berman business and the fixed income business and certain alternative asset management businesses of Lehman Brother's Investment Management Division (collectively, the "Acquired Businesses") to NBSH Acquisition, LLC (the "Proposed Acquisition"). NBSH Acquisition, LLC ("NBSH") was organized by key members of Neuberger Berman's management for the purpose of facilitating the acquisition of the Acquired Businesses. At the closing of the Proposed Acquisition, a majority interest in the Acquired Businesses will be directly or indirectly owned by portfolio managers, Neuberger Berman's management team and certain key members and senior professionals of the former Investment Management Division ("Management Members"), as well as by Lehman Brothers and certain affiliates of Lehman Brothers.
The Acquired Businesses include Neuberger Berman Management LLC ("Management") and Neuberger Berman LLC ("Neuberger"), the adviser and sub-adviser to the Fund, respectively. The Proposed Acquisition has been deemed to result in an "assignment" of the Fund's existing Management Agreement and Sub-Advisory Agreement (the "Existing Agreements") under the 1940 Act. As required by the 1940 Act, the Fund's Existing Agreements provide for their automatic termination in the event of an assignment, and each will terminate upon the consummation of the Proposed Acquisition. Accordingly, on December 17, 2008, the Board approved new Management and Sub-Advisory Agreements with Management and Neuberger, respectively, or their successors (together, the "Advisers"), on the same terms and with the same compensation structure as are currently in effect (together, "New Agreements"), which would take effect upon consummation of the Proposed Acquisition if approved by the Fund's shareholders.
If shareholders of the Fund do not approve the New Agreements before the Proposed Acquisition is completed, the Board has approved interim Management and Sub-Advisory Agreements with Management and Neuberger, respectively, or their successors (together, "Interim Agreements") pending approval of the New Agreements by shareholders of the Fund. Compensation earned by the Advisers under the Interim Agreements would be held in an interest-bearing escrow account pending shareholder approval of the New Agreements. If shareholders approve the New Agreements within 150 days from the termination of the Existing Agreements, the amount held in the escrow account, including interest, will be paid to the Advisers, as appropriate. If shareholders of the Fund do not approve the New Agreements, the Advisers will be paid the lesser of the costs incurred in performing their services under the Interim Agreements or the total amount in the escrow account, including interest earned. If at the end of 150 days following termination of a Fund's Existing Agreements the Fund's shareholders still have not approved the New Agreements, the Trustees would take such actions as they deem to be in the best interests of the Fund and its shareholders, which may include negotiating a new Management Agreement and/or new Sub-Advisory Agreement with an advisory organization selected by the Board of Trustees or making other arrangements.
35
The Trustees of the Trust discussed the Proposed Acquisition on December 17, 2008. Prior to submitting its bid to public auction, Management met telephonically with the Independent Trustees to brief them on the Proposed Acquisition. Following the public auction wherein NBSH was determined to be the successful bidder, the Independent Trustees again met telephonically with Management to obtain additional information about the Proposed Acquisition. The Independent Trustees, with the assistance of independent counsel, prepared due diligence requests that were presented to Management and appointed a Task Force of Independent Trustees to lead the due diligence effort ("Task Force").
Management provided written responses to the due diligence requests. After extensive review and analysis and discussions during a telephonic and in person meeting of the Independent Trustees, the Task Force submitted clarifying questions. The Independent Trustees met as a body in person to receive the report of the Task Force and consider the New Agreements. Throughout the process, the Task Force and the Independent Trustees were advised by experienced 1940 Act counsel that is independent of Management and NBSH. In addition, the Independent Trustees received a memorandum from independent counsel discussing the legal standards for their consideration of the New Agreements.
Consideration of the New Agreements followed shortly on the heels of the Independent Trustees' annual consideration of whether to renew the Existing Agreements, carried out pursuant to Section 15(c) of the 1940 Act. In that process, which began prior to the June 2008 quarterly meeting of the Board and was concluded at the September 2008 quarterly meeting, the Independent Trustees, following an extensive review of materials submitted by Management and a report from an independent data service, unanimously determined that the Existing Agreements were fair and reasonable and that their renewal would be in the best interests of the Fund and its shareholders. Accordingly, in considering the New Agreements, the Independent Trustees took into account the fact that the terms of the New Agreements would be identical to those of the Existing Agreements in every respect except for the term and termination date and potentially the name of the investment adviser. The Board considerations in connection with the New Agreements and the Existing Agreements also entered into the decision by the Board to approve the Interim Agreements, which would take effect if the shareholders of the Fund do not approve the New Agreements before the Proposed Acquisition is completed. The Independent Trustees' consideration of the Existing Agreements is described above.
In evaluating the proposed New Agreements, the Independent Trustees considered that they have generally been satisfied with the nature and quality of the services provided to the Fund by Management and Neuberger, including investment advisory, administrative and support services, and that the Fund would be best served by an arrangement that appeared likely to maintain the continuity and stability of the providers of these services. Accordingly, the Independent Trustees considered very carefully the intentions of NBSH (including its successors or assign) regarding capitalization, management structure, staffing, compensation and staff retention and whether these seemed designed to provide the desired continuity and stability. They inquired specifically about staffing and resources in the areas of portfolio management, investment research, trading, fund accounting, legal and compliance, internal audit, and senior executive staff. Although at the time the Board considered the New Agreements no final decisions had been reached as to the distribution of equity interests in NBSH (or its successor or assign), the Trustees were advised that senior members of management, including the Fund Trustee and nominee for Fund Trustee who are employed by the Advisers, would receive equity interests in NBSH. Because of these interests, as well as any future employment arrangements with the Advisers, these persons, individually or in the aggregate, could have a material interest in the Proposed Acquisition and in shareholder approval of the New Agreements. In considering the New Agreements, the Trustees were aware of these interests.
The Independent Trustees inquired whether NBSH (or its successors or assign) had specific plans for the future structure of the Neuberger Berman Funds, whether they plan to propose to eliminate any Funds, and whether they intend to continue or alter certain expansion plans that are already underway. They also inquired whether there are plans to change the fees or expense structure of any of the Funds. The Independent Trustees inquired about the long-term plans for the Advisers, including any expectations for cost savings or expense reductions. They also inquired about the capital structure and working capital likely to be available to NBSH (or its successors or assign).
The Independent Trustees considered the following factors, in addition to the factors discussed above, among others, in connection with their consideration of the New Agreements: (1) the nature, extent, and quality of the services provided by Management and Neuberger; (2) the performance of the Fund compared to a relevant market index and a peer group
36
of investment companies; (3) the costs of the services provided and profits or losses realized by Management and its affiliates from their relationship with the Fund; (4) the extent to which economies of scale might be realized as the Fund grows; and (5) whether fee levels reflect any such potential economies of scale for the benefit of investors in the Fund. In their deliberations, the Independent Trustees did not identify any particular information that was all important or controlling, and each Trustee may have attributed different weights to the various factors.
In unanimously approving and recommending the New Agreements, the Independent Trustees concluded that the terms of each New Agreement are fair and reasonable and that approval of the New Agreements is in the best interests of the Fund and its shareholders. In reaching this determination, the Independent Trustees considered the following factors, among others:
(1) that the terms of the New Agreements are identical in all material respects to those of the Existing Agreements;
(2) that the Advisers will maintain operational autonomy and continuity of management following the Proposed Acquisition;
(3) the favorable history, reputation, qualification, and background of Management and Neuberger, as well as the qualifications of each entity's personnel and each entity's respective financial condition;
(4) the commitment of NBSH (or its successors or assign) to retain key personnel currently employed by Management and Neuberger who currently provide services to the Fund;
(5) the commitment of NBSH (or its successors or assign) to maintaining the current level and quality of Fund services;
(6) the proposed division of equity in NBSH (or its successor or assign) among Management Members and other personnel upon consummation of the Proposed Acquisition;
(7) the fees and expense ratio of the Fund relative to comparable mutual funds;
(8) that the fees are identical to those paid under the Existing Agreements;
(9) that the fees and expense ratios of the Fund appear to the Board to be reasonable given the quality of services expected to be provided;
(10) the commitment of Management to maintaining the Fund's current contractual expense limitation agreements to ensure that Fund shareholders of funds that have such arrangements in place do not face an increase in expenses upon consummation of the Proposed Acquisition;
(11) the performance of the Fund relative to comparable mutual funds and unmanaged indices;
(12) the commitment of Management (or its successor) to pay the expenses of the Fund in connection with the Proposed Acquisition, including all expenses in connection with the solicitation of proxies, so that shareholders of the Fund would not have to bear such expenses;
(13) the actual and potential effects on the Advisers of the bankruptcy of Lehman Brothers, and the effects of the Lehman Brothers bankruptcy on the information considered by the Independent Trustees in their prior analyses of the principal service contracts;
(14) the provisions made to continue providing to the Advisers certain services that were previously provided to them by or through Lehman Brothers or its other affiliates;
(15) the possible benefits that may be realized by the Fund and by the Advisers as a result of the Proposed Acquisition; and
(16) that the Proposed Acquisition is expected to maintain continuity of management of the Fund and may reduce the potential for future vulnerability to changes in control of the Advisers that could be adverse to the Fund's interests and that could affect the retention of key employees providing services to the Fund.
37

Neuberger Berman
Advisers Management Trust
Short Duration Bond Portfolio
I Class Shares
Annual Report
December 31, 2008
B1011 02/09
Short Duration Bond Portfolio Managers' Commentary
During 2008, Neuberger Berman Advisers Management Trust (AMT) Short Duration Bond Portfolio posted a negative return and underperformed its benchmark, the Merrill Lynch 1-3 Year Treasury Index.
The year was characterized by periods of extreme volatility and upheaval in the financial markets. These factors, combined with a lack of liquidity and the rapidly weakening economy, served to undermine investor confidence and led to periods of extreme risk aversion. As is typical during times of stress, investors flocked to ultra-safe short-term Treasuries, driving their yields lower and their prices higher. During the year, the yield on the two-year Treasury fell from 3.05% to 0.76%. Meanwhile, many fixed income sectors that in normal times are considered safe havens saw their spreads widen dramatically relative to Treasuries. Even higher rated securities with strong underlying credit fundamentals performed poorly during periods of indiscriminate selling over the course of the year.
Given this backdrop, the Portfolio's relative underperformance was not unexpected, as its benchmark is comprised entirely of Treasury securities. Although we built a Treasury position of approximately 15% by the end of the year, the vast majority of the Portfolio's assets were in spread products (non-Treasury securities) such as mortgage-related securities and investment grade corporate bonds.
Looking at the year as a whole, the Portfolio's mortgage securities were its weakest performers. The bursting of the housing bubble continued, with prices falling and the inventory of unsold homes remaining elevated. As the period progressed, the weakness in the residential housing market extended to the commercial mortgage market as well. This was, in part, due to the weakening economy and fears that commercial mortgages would also be adversely affected.
The Portfolio's highly rated investment grade corporate bonds were not immune from the market's sell-off. Late in the year, spreads on these securities reached all-time wide levels versus Treasuries. While our corporate holdings were not immune to this weakness, our emphasis on larger, highly diversified banks and brokerage companies held up relatively well during this later period. We believe this was partially due to the Treasury's direct capital infusion into certain financial institutions through the Troubled Asset Relief Program (TARP).
While we are disappointed with the Portfolio's performance in 2008, we remain confident in our disciplined investment process. We also believe that emphasizing spread product is appropriate in seeking to meet the Portfolio's investment objective of generating the highest available current income, consistent with liquidity and low risk to principal.
We would also like to assure shareholders that we maintained the Portfolio's high quality bias throughout the year, with holdings rated AA+ on average. We also continued to diversify among a wide array of fixed income securities. Prior to purchasing any security, we conduct our own extensive fundamental research so that we can be confident in its quality rating and valuation. Risk management is also paramount in constructing and actively managing the Portfolio.
Despite current negative economic data, we are encouraged on a number of fronts. The Federal Reserve, Treasury and other government agencies continue to aggressively work to stimulate the economy, unfreeze the credit markets and restore confidence in the financial system. During 2008, the Fed lowered the Fed Funds rate seven times, bringing the rate from 4.25% to a range of 0% to 0.25%, an historic low. In terms of policy intervention, the government has introduced numerous programs such as the previously mentioned TARP, as well as the Term Asset-Backed Securities Loan Facility (TALF) to facilitate the purchase of certain asset-backed securities.
It is important to note that it will take some time for these initiatives to work their way through the economy. In addition, the transition to the new administration in Washington could result in periods of heightened volatility in the financial markets. That said, toward the end of 2008, we began to see some thawing of the credit markets, increased liquidity and improved performance by the spread sectors. We are also pleased to report that this led to better results for the Portfolio, as it gained 3.08% in December 2008, significantly outperforming the Merrill Lynch 1-3 Year Treasury Index, which returned 0.57% over the same period.
1
With regard to the Portfolio's structured products, our analysis indicates that we have a substantial amount of subordination within the structure to protect our holdings. It is our belief that these holdings, which have been hurt by deleveraging and a lack of liquidity, are currently mispriced. We continue to receive principal payments at par (face value) on a monthly basis on these securities and feel that their prices will recover once the deleveraging in the financial system is complete. Looking at the investment grade corporate bond market, we believe certain industries are extremely attractive given what we believe to be overly pessimistic default expectations and unsustainably wide spread levels. To seek to capitalize on this situation, we will continue to conduct extensive research to identify individual securities that have compelling valuations and solid credit fundamentals.
Sincerely,


Thomas Sontag, Michael Foster and Richard Grau
Portfolio Co-Managers
2
Short Duration Bond Portfolio
RATING SUMMARY
| AAA/Government/Government Agency | | | 81.2 | % | |
| AA | | | 9.1 | | |
| A | | | 0.1 | | |
| BBB | | | 0.6 | | |
| Not Rated | | | 0.9 | | |
| Short Term | | | 8.1 | | |
AVERAGE ANNUAL TOTAL RETURN1
| | | Inception
Date | | 1 Year | | 5 Year | | 10 Year | | Life of
Fund* | |
Short Duration Bond Portfolio
Class I | | | 09/10/84 | | | | (13.43%) | | | | (0.68%) | | | | 2.08% | | | | 5.47% | | |
| Merrill Lynch 1-3 Year Treasury Index2 | | | | | | | 6.61 | % | | | 4.06 | % | | | 4.71 | % | | | 6.75 | % | |
Performance data quoted represent past performance, which is no guarantee of future results. The investment return and principal value of an investment will fluctuate so that an investor's shares, when redeemed may be worth more or less than their original cost. Results are shown on a "total return" basis and include reinvestment of all dividends and capital gain distributions.
Current performance may be lower or higher than the performance data quoted. For performance data current to the most recent month end, please visit https://www.nb.com.
* Index returns are as of the inception date 09/10/1984.
As stated in the Portfolio's most recent prospectus, the total annual fund operating expense ratio for fiscal year 2007 was 0.73% for Class I shares (prior to any fee waivers or expense reimbursements). Neuberger Berman Management LLC has contractually agreed to limit certain expenses of the Portfolio through 12/31/2011.
COMPARISON OF A $10,000 INVESTMENT
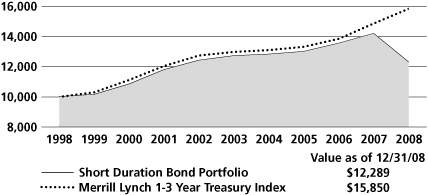
The chart shows the value of a hypothetical $10,000 investment in the Portfolio over the past 10 fiscal years, or since the Portfolio's inception, if it has not operated for 10 years. The result is compared with benchmarks, which may include a broadbased market index and/or a narrower index. Please note that market indexes do not include expenses. All results include the reinvestment of dividends and capital gain distributions. Results represent past performance and do not indicate future results. The chart and table do not reflect the deduction of taxes that a shareholder would pay on Portfolio distributions or the redemption of Portfolio shares.
Please see Endnotes for additional information.
3
Endnotes
1 "Total Return" includes reinvestment of all income dividends and capital gain distributions. Results represent past performance and do not indicate future results. The value of an investment in the Portfolio and the return on the investment both will fluctuate, and redemption process may be higher or lower than an investor's original cost. The performance information does not reflect fees and expenses of the variable annuity and variable life insurance policies or the pension plans whose proceeds are invested in the Portfolio. Neuberger Berman Management LLC ("NBM LLC") has agreed to absorb certain expenses of the AMT Portfolios, including the Portfolio. Without this arrangement, which is subject to change, the total returns of the Portfolio may have been less.
2 The Merrill Lynch 1-3 Year Treasury Index is an unmanaged total return market value index consisting of all coupon bearing U.S. Treasury publicly placed debt securities with maturities between 1 to 3 years. Please note that indices do not take into account any fees and expenses of investing in the individual securities that they track and that individuals cannot invest directly in any index. Data about the performance of this index are prepared or obtained by NBM LLC and include reinvestment of all dividends and capital gain distributions. The Portfolio may invest in many securities not included in the above-described index.
Any ratios or other measurements using a factor of forecasted earnings of a company discussed herein are based on consensus estimates, not NBM LLC's own projections, and they may or may not be realized. In addition, any revision to a forecast could affect the market price of a security. By quoting them herein, NBM LLC does not offer an opinion as to the accuracy of and does not guarantee these forecasted numbers.
The investments for the Portfolio are managed by the same portfolio manager(s) who manage one or more other mutual funds that have similar names, investment objectives and investment styles as the Portfolio. You should be aware that the Portfolio is likely to differ from the other mutual funds in size, cash flow pattern and tax matters. Accordingly, the holdings and performance of the Portfolio can be expected to vary from those of the other mutual funds.
The composition, industries and holdings of the Portfolio are subject to change.
Shares of the separate AMT Portfolios are sold only through the currently effective prospectus and are not available to the general public. Shares of this Portfolio may be purchased only by life insurance companies to be used in their separate accounts that fund variable annuity and variable life insurance policies and by qualified pension and retirement plans.
(c) 2009 Neuberger Berman Management LLC distributor. All rights reserved.
4
Information About Your Fund's Expenses
This table is designed to provide information regarding costs related to your investments. All mutual funds incur operating expenses, which include management fees, fees for administrative services and costs of shareholder reports, among others. The following examples are based on an investment of $1,000 made at the beginning of the six months ended December 31, 2008 and held for the entire period. The table illustrates the fund's costs in two ways:
| Actual Expenses and Performance: | | The first section of the table provides information about actual account values and actual expenses in dollars, based on the fund's actual performance during the period. You may use the information in this line, together with the amount you invested, to estimate the expenses you paid over the period. Simply divide your account value by $1,000 (for example, an $8,600 account value divided by $1,000 = 8.6), then multiply the result by the number in the first section of the table under the heading entitled "Expenses Paid During the Period" to estimate the expenses you paid over the period. | |
|
Hypothetical Example for
Comparison Purposes: | | The second section of the table provides information about hypothetical account values and hypothetical expenses based on the fund's actual expense ratio and an assumed rate of return at 5% per year before expenses. This return is not the fund's actual return. The hypothetical account values and expenses may not be used to estimate the actual ending account balance or expenses you paid for the period. You may use this information to compare the ongoing costs of investing in this fund versus other funds. To do so, compare the expenses shown in this 5% hypothetical example with the 5% hypothetical examples that appear in the shareholder reports of other funds. | |
|
Please note that the expenses in the table are meant to highlight your ongoing costs only. The table and the expense example do not include any transactional costs, such as fees and expenses that are, or may be, imposed under your variable contract or qualified pension plan. Therefore, the information under the heading "Hypothetical (5% annual return before expenses)" is useful in comparing ongoing costs only, and will not help you determine the relative total costs of owning different funds. In addition, if these transactional costs were included, your costs would have been higher.
Expense Information as of 12/31/08 (Unaudited)
NEUBERGER BERMAN ADVISERS MANAGEMENT TRUST SHORT DURATION BOND PORTFOLIO
| Actual | | Beginning Account
Value
7/1/08 | | Ending Account
Value
12/31/08 | | Expenses Paid During
the Period*
7/1/08 - 12/31/08 | |
| Class I | | $ | 1,000.00 | | | $ | 895.30 | | | $ | 3.67 | | |
| Hypothetical (5% annual return before expenses)** | |
| Class I | | $ | 1,000.00 | | | $ | 1,021.27 | | | $ | 3.91 | | |
* Expenses are equal to the annualized expense ratio of .77%, multiplied by the average account value over the period, multiplied by 184/366 (to reflect the one-half year period shown).
** Hypothetical 5% annual return before expenses is calculated by multiplying the number of days in the most recent half year divided by 366.
5
Schedule of Investments Short Duration Bond Portfolio
| PRINCIPAL AMOUNT | | | | MARKET VALUEt | |
| U.S. Treasury Securities-Backed by the Full Faith and Credit of the U.S. Government (15.7%) | |
| $ | 12,000,000 | | | U.S. Treasury Notes, 2.13%, due 1/31/10 | | $ | 12,219,840 | | |
| | 32,975,000 | | | U.S. Treasury Notes, 4.50%, due 11/15/10 | | | 35,404,334 | oo | |
| | 20,500,000 | | | U.S. Treasury Notes, 4.75%, due 3/31/11 | | | 22,324,172 | | |
| | | | | Total U.S. Treasury Securities-Backed by the Full Faith and Credit of the U.S. Government
(Cost $67,987,773) | | | 69,948,346 | | |
| Mortgage-Backed Securities (47.9%) | | | |
| Adjustable Alt-A Conforming Balance (1.4%) | | | |
| | 13,388,724 | | | Countrywide Home Loans Mortgage Pass-Through Trust, Ser. 2007-HYB2, Class 2A1,
5.38%, due 1/2/09 | | | 6,362,636 | moo | |
| Adjustable Alt-A Jumbo Balance (2.0%) | |
| | 13,125,194 | | | Bear Stearns ALT-A Trust, Ser. 2007-1, Class 21A1, 5.70%, due 1/2/09 | | | 6,251,799 | m | |
| | 4,825,438 | | | JP Morgan Alternative Loan Trust, Ser. 2006-A2, Class 3A1, 5.94%, due 1/2/09 | | | 2,477,055 | m | |
| | | | 8,728,854 | | |
| Adjustable Alt-A Mixed Balance (7.4%) | |
| | 8,361,321 | | | Bear Stearns ALT-A Trust, Ser. 2007-2, Class 2A1, 5.57%, due 1/2/09 | | | 4,145,836 | m | |
| | 8,979,774 | | | Bear Stearns ALT-A Trust, Ser. 2006-4, Class 32A1, 6.47%, due 1/2/09 | | | 4,421,002 | m | |
| | 13,924,944 | | | Countrywide Home Loans Mortgage Pass-Through Trust, Ser. 2007-HYB1, Class 2A1,
5.63%, due 1/2/09 | | | 6,212,491 | m | |
| | 13,940,558 | | | First Horizon Alternative Mortgage Securities Trust, Ser. 2006-AA3, Class A1, 6.30%, due 1/2/09 | | | 7,500,697 | m | |
| | 8,568,192 | | | First Horizon Alternative Mortgage Securities Trust, Ser. 2006-AA7, Class A1, 6.52%, due 1/2/09 | | | 4,025,489 | m | |
| | 6,501,780 | | | Nomura Asset Acceptance Corp., Ser. 2006-AR2, Class 2A2, 6.56%, due 1/2/09 | | | 3,094,895 | m | |
| | 3,875,356 | | | Residential Accredit Loans, Inc., Ser. 2005-QA10, Class A31, 5.60%, due 1/2/09 | | | 2,119,129 | m | |
| | 2,608,155 | | | Residential Accredit Loans, Inc., Ser. 2006-QA1, Class A21, 5.95%, due 1/2/09 | | | 1,231,327 | m | |
| | | | 32,750,866 | | |
| Adjustable Alt-B Mixed Balance (0.3%) | |
| | 2,355,681 | | | Lehman XS Trust, Floating Rate, Ser. 2005-1, Class 2A1, 1.97%, due 1/2/09 | | | 1,395,760 | m | |
| Adjustable Conforming Balance (1.0%) | |
| | 4,021,951 | | | Adjustable Rate Mortgage Trust, Ser. 2005-10, Class 4A1, 5.37%, due 1/2/09 | | | 2,507,228 | moo | |
| | 3,667,995 | | | IndyMac INDX Mortgage Loan Trust, Ser. 2005-AR23, Class 2A1, 5.48%, due 1/2/09 | | | 1,967,432 | m | |
| | | | 4,474,660 | | |
| Adjustable Jumbo Balance (4.8%) | |
| | 1,681,962 | | | Banc of America Funding Corp., Ser. 2005-F, Class 4A1, 5.33%, due 1/2/09 | | | 968,762 | moo | |
| | 4,374,523 | | | Banc of America Funding Corp., Ser. 2006-H, Class 2A3, 6.68%, due 1/2/09 | | | 2,461,990 | m | |
| | 7,978,344 | | | Harborview Mortgage Loan Trust, Ser. 2006-3, Class 1A1A, 6.34%, due 1/2/09 | | | 3,834,633 | moo | |
| | 6,251,555 | | | IndyMac INDX Mortgage Loan Trust, Ser. 2006-AR7, Class 3A1, 6.00%, due 1/2/09 | | | 3,535,497 | m | |
| | 4,965,012 | | | Merrill Lynch Mortgage Investors Trust, Ser. 2005-A1, Class 2A1, 4.54%, due 1/2/09 | | | 2,977,460 | m | |
| | 18,000,000 | | | Wells Fargo Mortgage Backed Securities Trust, Ser. 2005-AR16, Class 4A2, 4.99%, due 10/25/35 | | | 7,773,800 | oo | |
| | | | 21,552,142 | | |
| Adjustable Mixed Balance (5.9%) | |
| | 3,851,088 | | | Banc of America Funding Corp., Ser. 2005-H, Class 7A1, 5.66%, due 1/2/09 | | | 2,182,236 | m | |
| | 3,018,701 | | | Banc of America Funding Corp., Ser. 2006-A, Class 3A2, 5.85%, due 1/2/09 | | | 1,604,424 | m | |
| | 3,336,719 | | | Countrywide Home Loan Mortgage Pass-Through Trust, Ser. 2006-HYB3, Class 1A1A,
5.31%, due 1/2/09 | | | 1,541,135 | m | |
See Notes to Schedule of Investments 6
| PRINCIPAL AMOUNT | | | | MARKET VALUEt | |
| $ | 4,432,590 | | | Countrywide Home Loan Mortgage Pass-Through Trust, Ser. 2006-HYB5, Class 2A1,
5.80%, due 1/2/09 | | $ | 2,036,527 | m | |
| | 3,827,353 | | | Credit Suisse First Boston Mortgage Securities Corp., Ser. 2004-AR4, Class 2A1,
4.77%, due 1/2/09 | | | 2,337,901 | m | |
| | 4,406,315 | | | First Horizon Mortgage Pass-Through Trust, Ser. 2005-AR5, Class 2A1, 5.45%, due 1/2/09 | | | 3,139,834 | m | |
| | 5,039,368 | | | GMAC Mortgage Corp. Loan Trust, Ser. 2006-AR1, Class 1A1, 5.60%, due 1/2/09 | | | 2,546,038 | m | |
| | 894,275 | | | Harborview Mortgage Loan Trust, Ser. 2004-4, Class 3A, 2.65%, due 1/2/09 | | | 409,015 | m | |
| | 8,419,885 | | | IndyMac INDX Mortgage Loan Trust, Ser. 2006-AR3, Class 2A1A, 6.30%, due 1/2/09 | | | 3,744,216 | moo | |
| | 7,225,000 | | | WaMu Mortgage Pass-Through Certificates, Ser. 2004-AR9, Class A7, 4.14%, due 1/2/09 | | | 6,943,622 | m | |
| | | | 26,484,948 | | |
| Commercial Mortgage-Backed (21.9%) | |
| | 7,908,433 | | | Banc of America Commercial Mortgage, Inc., Ser. 2006-3, Class A1, 5.69%, due 7/10/44 | | | 7,728,388 | oo | |
| | 3,500,281 | | | Banc of America Commercial Mortgage, Inc., Ser. 2005-6, Class A1, 5.00%, due 9/10/47 | | | 3,395,150 | oo | |
| | 7,842,048 | | | Bear Stearns Commercial Mortgage Securities, Inc., Ser. 2006-PW14, Class A1,
5.04%, due 12/11/38 | | | 7,308,266 | oo | |
| | 7,216,699 | | | Credit Suisse Mortgage Capital Certificates, Ser. 2007-C5, Class A1, 5.10%, due 9/15/40 | | | 6,562,670 | oo | |
| | 8,576,447 | | | GE Capital Commercial Mortgage Corp., Ser. 2002-2A, Class A2, 4.97%, due 8/11/36 | | | 8,216,533 | oo | |
| | 6,900,000 | | | GE Capital Commercial Mortgage Corp., Ser. 2005-C3, Class A2, 4.85%, due 7/10/45 | | | 6,360,430 | | |
| | 1,632,533 | | | GMAC Commercial Mortgage Securities, Inc., Ser. 2006-C1, Class A1, 4.98%, due 11/10/45 | | | 1,570,185 | | |
| | 2,322,665 | | | Greenwich Capital Commercial Funding Corp., Ser. 2002-C1, Class A3, 4.50%, due 1/11/17 | | | 2,190,697 | oo | |
| | 4,430,316 | | | JP Morgan Chase Commercial Mortgage Securities Corp., Ser. 2006-LDP7, Class A1,
5.83%, due 1/2/09 | | | 4,298,305 | m | |
| | 2,032,133 | | | JP Morgan Chase Commercial Mortgage Securities Corp., Ser. 2004-C2, Class A1,
4.28%, due 5/15/41 | | | 2,018,827 | | |
| | 13,259,922 | | | JP Morgan Chase Commercial Mortgage Securities Corp., Ser. 2005-LDP5, Class A1,
5.04%, due 12/15/44 | | | 13,127,704 | | |
| | 6,465,150 | | | JP Morgan Chase Commercial Mortgage Securities Corp., Ser. 2007-LD11, Class A1,
5.65%, due 6/15/49 | | | 6,131,296 | | |
| | 3,255,169 | | | LB-UBS Commercial Mortgage Trust, Ser. 2006-C3, Class A1, 5.48%, due 3/15/32 | | | 3,145,604 | | |
| | 8,571,661 | | | Merrill Lynch/Countrywide Commercial Mortgage Trust, Ser. 2007-5, Class A1,
4.28%, due 8/12/48 | | | 7,957,761 | oo | |
| | 9,296,184 | | | Morgan Stanley Capital I, Ser. 2005-HQ5, Class A2, 4.81%, due 1/14/42 | | | 9,007,452 | | |
| | 1,965,268 | | | Morgan Stanley Capital I, Ser. 2005-HQ6, Class A1, 4.65%, due 8/13/42 | | | 1,907,792 | | |
| | 3,504,709 | | | Morgan Stanley Capital I, Ser. 2006-T21, Class A1, 4.93%, due 10/12/52 | | | 3,339,574 | | |
| | 3,353,914 | | | Wachovia Bank Commercial Mortgage Trust, Ser. 2003-C7, Class A1, 4.24%, due 10/15/35 | | | 3,191,394 | n | |
| | | | 97,458,028 | | |
| Mortgage-Backed Non-Agency (1.6%) | |
| | 1,880,640 | | | Countrywide Home Loans, Ser. 2005-R2, Class 2A4, 8.50%, due 6/25/35 | | | 1,825,980 | noo | |
| | 4,359,851 | | | GSMPS Mortgage Loan Trust, Ser. 2005-RP2, Class 1A4, 8.50%, due 3/25/35 | | | 4,325,733 | n | |
| | 785,483 | | | GSMPS Mortgage Loan Trust, Ser. 2005-RP3, Class 1A4, 8.50%, due 9/25/35 | | | 712,329 | n | |
| | | | 6,864,042 | | |
| Fannie Mae (0.5%) | |
| | 2,093,343 | | | Whole Loan, Ser. 2004-W8, Class PT, 10.42%, due 1/2/09 | | | 2,307,105 | moo | |
| Freddie Mac (1.1%) | |
| | 11,203 | | | Mortgage Participation Certificates, 10.00%, due 4/1/20 | | | 12,806 | | |
| | 2,820,452 | | | Pass-Through Certificates, 8.00%, due 11/1/26 | | | 2,987,733 | | |
| | 1,828,535 | | | Pass-Through Certificates, 8.50%, due 10/1/30 | | | 1,973,150 | | |
| | | | 4,973,689 | | |
| | | | | Total Mortgage-Backed Securities (Cost $311,438,687) | | | 213,352,730 | | |
See Notes to Schedule of Investments 7
| PRINCIPAL AMOUNT | | | | MARKET VALUEt | |
| Corporate Debt Securities (11.9%) | |
| Banks (4.3%) | | | |
| $ | 9,000,000 | | | Bank of America Corp., Senior Subordinated Unsecured Notes, 7.80%, due 2/15/10 | | $ | 9,220,860 | oo | |
| | 6,350,000 | | | Wachovia Corp., Senior Unsecured Notes, 3.63%, due 2/17/09 | | | 6,323,952 | oo | |
| | 3,500,000 | | | Wells Fargo & Co., Senior Unsecured Notes, 3.13%, due 4/1/09 | | | 3,505,824 | oo | |
| | | | 19,050,636 | | |
| Diversified Financial Services (7.0%) | |
| | 3,000,000 | | | Citigroup, Inc., Senior Unsecured Notes, 4.25%, due 7/29/09 | | | 2,964,150 | oo | |
| | 10,200,000 | | | General Electric Capital Corp., Senior Unsecured Medium-Term Notes, Ser. A,
4.25%, due 9/13/10 | | | 10,236,027 | oo | |
| | 11,800,000 | | | Goldman Sachs Group, Inc., Senior Unsecured Notes, 6.88%, due 1/15/11 | | | 11,886,199 | oo | |
| | 6,500,000 | | | Morgan Stanley, Senior Unsecured Notes, 4.00%, due 1/15/10 | | | 6,311,214 | oo | |
| | | | 31,397,590 | | |
| Media (0.6%) | |
| | 2,735,000 | | | British Sky Broadcasting Group PLC, Guaranteed Senior Unsecured Notes, 8.20%, due 7/15/09 | | | 2,780,245 | oo | |
| | | | | Total Corporate Debt Securities (Cost $53,847,418) | | | 53,228,471 | | |
| Asset-Backed Securities (15.9%) | |
| | 2,565,592 | | | ACE Securities Corp. Home Equity Loan Trust, Ser. 2006-FM1, Class A2A, 0.51%, due 1/26/09 | | | 2,475,409 | m | |
| | 4,750,000 | | | ACE Securities Corp. Home Equity Loan Trust, Ser. 2006-ASP5, Class A2B, 0.60%, due 1/26/09 | | | 3,495,930 | m | |
| | 2,000,000 | | | ACE Securities Corp. Home Equity Loan Trust, Ser. 2006-OP1, Class A2C, 0.62%, due 1/26/09 | | | 1,311,647 | m | |
| | 1,753,000 | | | Bear Stearns Asset Backed Securities Trust, Ser. 2006-HE9, Class 1A2, 0.62%, due 1/26/09 | | | 839,146 | m | |
| | 7,000,000 | | | Capital Auto Receivables Asset Trust, Ser. 2008-2, Class A2B, 2.12%, due 1/15/09 | | | 6,777,011 | m | |
| | 4,082,946 | | | Carrington Mortgage Loan Trust, Ser. 2006-OPT1, Class A3, 0.65%, due 1/26/09 | | | 3,039,789 | m | |
| | 4,000,000 | | | Carrington Mortgage Loan Trust, Ser. 2007-FRE1, Class A3, 0.73%, due 1/26/09 | | | 1,695,447 | m | |
| | 4,000,000 | | | Chase Issuance Trust, Ser. 2005-A9, Class A9, 1.22%, due 1/15/09 | | | 3,855,828 | m | |
| | 5,000,000 | | | Chase Issuance Trust, Ser. 2008-A7, Class A7, 1.85%, due 1/15/09 | | | 4,786,624 | moo | |
| | 4,000,000 | | | Citibank Credit Card Master Trust I, Ser. 1997-4, Class A, 2.30%, due 3/10/09 | | | 3,964,295 | m | |
| | 3,276,399 | | | Countrywide Asset-Backed Certificates Trust, Ser. 2006-3, Class 2A2, 0.65%, due 1/26/09 | | | 2,583,453 | m | |
| | 1,795,541 | | | Countrywide Asset-Backed Certificates Trust, Ser. 2006-5, Class 2A2, 0.65%, due 1/26/09 | | | 1,499,154 | m | |
| | 3,252,889 | | | Countrywide Asset-Backed Certificates Trust, Ser. 2006-6, Class 2A2, 0.65%, due 1/26/09 | | | 2,581,177 | m | |
| | 6,500,000 | | | DaimlerChrysler Auto Trust, Ser. 2008-B, Class A2B, 2.81%, due 1/8/09 | | | 6,281,702 | m | |
| | 5,000,000 | | | Discover Card Master Trust, Ser. 2008-A1, Class A1, 1.75%, due 1/15/09 | | | 4,590,121 | moo | |
| | 2,964,753 | | | Fieldstone Mortgage Investment Corp., Ser. 2006-2, Class 2A1, 0.56%, due 1/26/09 | | | 2,849,057 | moo | |
| | 2,196,190 | | | Impac Secured Assets Corp., Ser. 2006-3, Class A4, 0.56%, due 1/26/09 | | | 1,924,937 | m | |
| | 2,042,761 | | | Knollwood CDO Ltd., Ser. 2006-2A, Class A2J, 5.17%, due 1/13/09 | | | 5,107 | nm | |
| | 1,201,538 | | | Merrill Lynch Mortgage Investors Trust, Ser. 2006-MLN1, Class A2A, 0.54%, due 1/26/09 | | | 1,133,100 | m | |
| | 1,126,229 | | | Morgan Stanley Capital I, Inc., Mortgage Pass-Through Certificates, Ser. 2007-HE5, Class A2A,
0.58%, due 1/26/09 | | | 1,016,571 | m | |
| | 3,477,410 | | | Residential Asset Mortgage Products, Inc., Ser. 2006-RS1, Class AI2, 0.70%, due 1/26/09 | | | 2,713,156 | m | |
| | 1,384,882 | | | Resmae Mortgage Loan Trust, Ser. 2006-1, Class A2A, 0.57%, due 1/26/09 | | | 1,349,795 | nm | |
| | 1,475,000 | | | Securitized Asset Backed Receivables LLC Trust, Ser. 2006-WM4, Class A2C, 0.63%, due 1/26/09 | | | 400,027 | m | |
| | 5,175,000 | | | Soundview Home Equity Loan Trust, Ser. 2006-OPT3, Class 2A3, 0.64%, due 1/26/09 | | | 3,619,677 | moo | |
| | 6,370,000 | | | Structured Asset Investment Loan Trust, Ser. 2006-3, Class A4, 0.56%, due 1/26/09 | | | 5,853,232 | moo | |
| | | | | Total Asset-Backed Securities (Cost $84,548,741) | | | 70,641,392 | | |
| Repurchase Agreements (8.1%) | |
| | 36,020,000 | | | Repurchase Agreement with Fixed Income Clearing Corp., 0.01%, due 1/2/09,
dated 12/31/08, Maturity Value $36,020,020, Collateralized by $35,720,000,
Fannie Mae, 4.33%, due 7/28/11 (Collateral Value $37,104,150)
(Cost $36,020,000) | | | 36,020,000 | # | |
| | | | | Total Investments (99.5%) (Cost $553,842,619) | | | 443,190,939 | ## | |
| | | | | Cash, receivables and other assets, less liabilities (0.5%) | | | 2,286,960 | | |
| | | | | Total Net Assets (100.0%) | | $ | 445,477,899 | | |
See Notes to Schedule of Investments 8
Notes to Schedule of Investments Short Duration Bond Portfolio
t Investments in securities by Neuberger Berman Advisers Management Trust Short Duration Bond Portfolio (the "Fund") are valued daily by obtaining valuations from independent pricing services based on readily available bid quotations, or if quotations are not available, by methods which include considerations such as: yields or prices of securities of comparable quality, coupon, maturity and type; indications as to values from dealers; and general market conditions. If a valuation is not available from an independent pricing service, the Fund seeks to obtain quotations from principal market makers. If such quotations are not available, securities are valued using methods the Board of Trustees of Neuberger Berman Advisers Management Trust has approved on the belief that they reflect fair value. Numerous factors may be considered when determining the fair value of a security, including available analyst, media or other reports, trading in futures or ADRs and whether the issuer of the security being fair valued has other securities outstanding. Foreign security prices are furnished by independent quotation services and expressed in local currency values. Foreign security prices are currently translated from the local currency into U.S. dollars using the exchange rate as of 4:00 p.m., Eastern time. Fair value prices are necessarily estimates, and there is no assurance that such a price will be at or close to the price at which the security is next quoted. Short-term debt securities with less than 60 days until maturity may be valued at cost which, when combined with interest earned, approximates market value.
The Fund adopted Financial Accounting Standards Board ("FASB") Statement of Financial Accounting Standards No. 157, Fair Value Measurements ("FAS 157"), effective January 1, 2008. In accordance with FAS 157, "fair value" is defined as the price that a Fund would receive upon selling an investment in an orderly transaction to an independent buyer in the principal or most advantageous market for the investment. Various inputs are used in determining the value of the Fund's investments.
In addition to defining fair value, FAS 157 established a three-tier hierarchy of inputs to establish a classification of fair value measurements for disclosure purposes. The three-tier hierarchy of inputs is summarized in the three broad Levels listed below.
. Level 1 - quoted prices in active markets for identical investments
. Level 2 - other significant observable inputs (including quoted prices for similar investments, interest rates, prepayment speeds, credit risk, amortized cost, etc.)
. Level 3 - significant unobservable inputs (including the Fund's own assumptions in determining the fair value of investments)
The inputs or methodology used for valuing an investment are not necessarily an indication of the risk associated with investing in those securities.
The following is a summary of the inputs used to value the Fund's investments as of December 31, 2008:
| Valuation Inputs | | Investments
in Securities | | Other Financial
Instruments* | |
| Level 1 - Quoted Prices | | $ | -- | | | $ | 1,378,124 | | |
| Level 2 - Other Significant Observable Inputs | | | 443,185,832 | | | | -- | | |
| Level 3 - Significant Unobservable Inputs | | | 5,107 | | | | -- | | |
| Total | | $ | 443,190,939 | | | $ | 1,378,124 | | |
See Notes to Financial Statements 9
Notes to Schedule of Investments Short Duration Bond Portfolio (cont'd)
Following is a reconciliation between the beginning and ending balances of investments in which significant unobservable inputs (Level 3) were used in determining value:
| | | Investments
in Securities | |
| Beginning balance, as of 1/1/08 | | $ | 8,949,191 | | |
| Accrued discounts/premiums | | | -- | | |
| Realized gain/loss and change in unrealized appreciation/depreciation | | | (1,013,455 | ) | |
| Net purchases/sales | | | (1,367,959 | ) | |
| Net transfers in and/or out of Level 3 | | | (6,562,670 | ) | |
| Balance, as of 12/31/08 | | $ | 5,107 | | |
Net change in unrealized appreciation/depreciation from
investments still held as of 12/31/08 | | $ | (403,445 | ) | |
*Other financial instruments include financial futures contracts.
# At cost, which approximates market value.
## At December 31, 2008, the cost of investments for U.S. federal income tax purposes was $555,680,359. Gross unrealized appreciation of investments was $1,351,126 and gross unrealized depreciation of investments was $113,840,546, resulting in net unrealized depreciation of $112,489,420 based on cost for U.S. federal income tax purposes.
n Restricted security subject to restrictions on resale under federal securities laws. These securities may be resold in transactions exempt from registration, normally to qualified institutional buyers under Rule 144A under the Securities Act of 1933, as amended, and have been deemed by the investment manager to be liquid. At December 31, 2008, these securities amounted to $11,410,338 or 2.6% of net assets for the Fund.
oo All or a portion of this security is segregated in connection with obligations for financial futures contracts.
m Floating rate securities are securities whose yields vary with a designated market index or market rate. These securities are shown at their current rates as of December 31, 2008.
See Notes to Financial Statements 10
Statement of Assets and Liabilities
Neuberger Berman Advisers Management Trust
| | | SHORT DURATION
BOND PORTFOLIO | |
| | | December 31, 2008 | |
| Assets | |
| Investments in securities, at market value* (Note A)-see Schedule of Investments: | |
| Unaffiliated issuers | | $ | 443,190,939 | | |
| Interest receivable | | | 3,234,600 | | |
| Receivable for Fund shares sold | | | 48,502 | | |
| Receivable for securities lending income (Note A) | | | 3,921 | | |
| Prepaid expenses and other assets | | | 1,911 | | |
| Total Assets | | | 446,479,873 | | |
| Liabilities | |
| Due to custodian | | | 11,528 | | |
| Payable for Fund shares redeemed | | | 644,660 | | |
| Payable to investment manager (Note B) | | | 92,944 | | |
| Payable to administrator (Note B) | | | 148,736 | | |
| Payable for securities lending fees (Note A) | | | 294 | | |
| Payable for variation margin (Note A) | | | 18,750 | | |
| Accrued expenses and other payables | | | 85,062 | | |
| Total Liabilities | | | 1,001,974 | | |
| Net Assets at value | | $ | 445,477,899 | | |
| Net Assets consist of: | |
| Paid-in capital | | $ | 542,715,655 | | |
| Undistributed net investment income (loss) | | | 26,929,953 | | |
| Accumulated net realized gains (losses) on investments | | | (14,894,153 | ) | |
| Net unrealized appreciation (depreciation) in value of investments | | | (109,273,556 | ) | |
| Net Assets at value | | $ | 445,477,899 | | |
| Shares Outstanding ($.001 par value; unlimited shares authorized) | | | 41,575,888 | | |
| Net Asset Value, offering and redemption price per share | | $ | 10.71 | | |
| *Cost of Investments: | |
| Unaffiliated issuers | | $ | 553,842,619 | | |
See Notes to Financial Statements 11
Statement of Operations
Neuberger Berman Advisers Management Trust
| | | SHORT DURATION
BOND PORTFOLIO | |
| | | For the Year Ended
December 31, 2008 | |
| Investment Income: | |
| Income (Note A): | |
| Interest income-unaffiliated issuers | | $ | 28,802,257 | | |
| Income from securities loaned-net | | | 43,473 | | |
| Total income | | $ | 28,845,730 | | |
| Expenses: | |
| Investment management fees (Note B) | | | 1,399,998 | | |
| Administration fees (Note B) | | | 2,270,345 | | |
| Audit fees | | | 40,494 | | |
| Custodian fees (Note B) | | | 161,669 | | |
| Insurance expense | | | 15,663 | | |
| Legal fees | | | 121,033 | | |
| Shareholder reports | | | 106,262 | | |
| Trustees' fees and expenses | | | 38,146 | | |
| Miscellaneous | | | 22,287 | | |
| Total expenses | | | 4,175,897 | | |
| Expenses reduced by custodian fee expense offset arrangement (Note B) | | | (4,033 | ) | |
| Total net expenses | | | 4,171,864 | | |
| Net investment income (loss) | | $ | 24,673,866 | | |
| Realized and Unrealized Gain (Loss) on Investments (Note A) | |
| Net realized gain (loss) on: | |
| Sales of investment securities of unaffiliated issuers | | | (494,713 | ) | |
| Financial futures contracts | | | 6,148,833 | | |
| Foreign currency | | | (290 | ) | |
| Change in net unrealized appreciation (depreciation) in value of: | |
| Unaffiliated investment securities | | | (107,936,789 | ) | |
| Financial futures contracts | | | 1,346,717 | | |
| Foreign currency | | | 206 | | |
| Net gain (loss) on investments | | | (100,936,036 | ) | |
| Net increase (decrease) in net assets resulting from operations | | $ | (76,262,170 | ) | |
See Notes to Financial Statements 12
Statements of Changes in Net Assets
Neuberger Berman Advisers Management Trust
| | | SHORT DURATION BOND PORTFOLIO | |
| | | Year Ended
December 31,
2008 | | Year Ended
December 31,
2007 | |
| Increase (Decrease) in Net Assets: | |
| From Operations: | |
| Net investment income (loss) | | $ | 24,673,866 | | | $ | 23,226,638 | | |
| Net realized gain (loss) on investments | | | 5,653,830 | | | | 1,787,905 | | |
| Change in net unrealized appreciation (depreciation) of investments | | | (106,589,866 | ) | | | (1,190,494 | ) | |
| Net increase (decrease) in net assets resulting from operations | | | (76,262,170 | ) | | | 23,824,049 | | |
| Distributions to Shareholders From (Note A): | |
| Net Investment Income | | | (24,383,220 | ) | | | (15,865,930 | ) | |
| From Fund Share Transactions (Note D): | |
| Proceeds from shares sold | | | 88,862,576 | | | | 245,375,568 | | |
| Proceeds from reinvestment of dividends and distributions | | | 24,383,220 | | | | 15,865,930 | | |
| Payments for shares redeemed | | | (190,113,580 | ) | | | (64,896,462 | ) | |
| Net increase (decrease) from Fund share transactions | | | (76,867,784 | ) | | | 196,345,036 | | |
| Net Increase (Decrease) in Net Assets | | | (177,513,174 | ) | | | 204,303,155 | | |
| Net Assets: | |
| Beginning of year | | | 622,991,073 | | | | 418,687,918 | | |
| End of year | | $ | 445,477,899 | | | $ | 622,991,073 | | |
| Undistributed net investment income (loss) at end of year | | $ | 26,929,953 | | | $ | 24,382,346 | | |
See Notes to Financial Statements 13
Notes to Financial Statements Short Duration Bond Portfolio
Note A--Summary of Significant Accounting Policies:
1 General: Short Duration Bond Portfolio (the "Fund") (formerly, Lehman Brothers Short Duration Bond Portfolio) is a separate operating series of Neuberger Berman Advisers Management Trust (the "Trust"), a Delaware statutory trust organized pursuant to a Trust Instrument dated May 23, 1994. The Trust is currently comprised of ten separate operating series (each a "Series," collectively, the "Funds") each of which is diversified. The Trust is registered as an open-end management investment company under the Investment Company Act of 1940, as amended (the "1940 Act"), and its shares are registered under the Securities Act of 1933, as amended. The Fund currently offers only Class I shares. The Board of Trustees of the Trust (the "Board") may establish additional series or classes of shares without the approval of shareholders.
The assets of each Series belong only to that Series, and the liabilities of each Series are borne solely by that Series and no other.
The preparation of financial statements in accordance with U.S. generally accepted accounting principles requires Neuberger Berman Management LLC ("Management") to make estimates and assumptions at the date of the financial statements. Actual results could differ from those estimates.
Management, the investment manager of the Fund, and Lehman Brothers Asset Management LLC ("LBAM"), the Fund's sub-adviser, are wholly owned subsidiaries of Lehman Brothers Holdings Inc. ("Lehman Brothers"), a publicly owned holding company. On September 15, 2008, Lehman Brothers filed a voluntary petition under Chapter 11 of the U.S. Bankruptcy Code. On December 3, 2008, NBSH Acquisition, LLC ("NBSH"), an entity organized by key members of Neuberger Berman's senior management was selected as the successful bidder in the public auction to acquire a majority interest in Neuberger Berman's business and the fixed income and certain alternative asset management businesses of Lehman Brothers' Investment Management Division (together with Neuberger Berman, the "Acquired Businesses") (the "Proposed Acquisition"). On December 22, 2008, the bankruptcy court having jurisdiction over the Lehman Brothers matter approved the sale of the Acquired Businesses to NBSH (or its successor or assign), as the successful bidder. At the closing of the Proposed Acquisition, a majority interest in the Acquired Businesses will be directly or indirectly owned by portfolio managers, Neuberger Berman's management team and certain key members and senior professionals of the former Investment Management Division, as well as by Lehman Brothers and certain affiliates of Lehman Brothers. The transaction is subject to certain conditions and approvals.
These events, while affecting Lehman Brothers, have not had a material impact on the Fund or its operations. Management and LBAM will continue to operate in the ordinary course of business as the investment manager and sub-adviser of the Fund.
Included in the Acquired Businesses are Management and LBAM. The consummation of the Proposed Acquisition has been deemed to result in an "assignment" of the Fund's Management and Sub-Advisory Agreements which would, by law, automatically terminate those agreements. Accordingly, the Board, including the Trustees who are not "interested persons" of the Fund's investment manager and its affiliates or the Fund, has approved the new Management Agreements and Sub-Advisory Agreements for the Fund. The new agreements also will require the approval of the Fund's shareholders.
2 Portfolio valuation: Investment securities are valued as indicated in the notes following the Schedule of Investments.
3 Foreign currency translation: The accounting records of the Fund are maintained in U.S. dollars. Foreign currency amounts are currently translated into U.S. dollars using the exchange rates as of 4:00 p.m., Eastern time, to determine the value of investments, other assets and liabilities. Purchase and sale prices of securities, and income and expenses, are translated into U.S. dollars at the prevailing rate of exchange on the respective dates of such transactions. Net unrealized foreign currency gain (loss), if any, arises from changes in the value of assets and
14
liabilities, other than investments in securities, as a result of changes in exchange rates and is stated separately in the Statement of Operations.
4 Securities transactions and investment income: Securities transactions are recorded on trade date for financial reporting purposes. Interest income, including accretion of discount (adjusted for original issue discount, where applicable) is recorded on the accrual basis. Realized gains and losses from securities transactions and foreign currency transactions, if any, are recorded on the basis of identified cost and stated separately in the Statement of Operations. Included in net realized gain (loss) on investments are proceeds from the settlements of class action litigation in which the Fund participated as a plaintiff. The amount of such proceeds for the year ended December 31, 2008 was $79,190.
5 Forward foreign currency contracts: The Fund may enter into forward foreign currency contracts ("contracts") in connection with planned purchases or sales of securities to hedge the U.S. dollar value of portfolio securities denominated in a foreign currency. The gain or loss arising from the difference between the original contract price and the closing price of such contract is included in net realized gains or losses on foreign currency transactions on settlement date. Fluctuations in the value of forward foreign currency contracts are recorded for financial reporting purposes as unrealized gains or losses by the Fund until the contractual settlement date. The Fund could be exposed to risks if a counter party to a contract were unable to meet the terms of its contract or if the value of the foreign currency changes unfavorably. The U.S. dollar value of foreign currency underlying all contractual commitments held by the Fund is determined using forward foreign currency exchange rates supplied by an independent pricing service.
6 Financial futures contracts: The Fund may buy and sell financial futures contracts to hedge against changes in securities prices resulting from changes in prevailing interest rates. At the time the Fund enters into a financial futures contract, it is required to deposit with the futures commission merchant a specified amount of cash or liquid securities, known as "initial margin," ranging upward from 1.1% of the value of the financial futures contract being traded. Each day, the futures contract is valued at the official settlement price of the board of trade or U.S. commodity exchange on which such futures contract is traded. Subsequent payments, known as "variation margin," to and from the broker are made on a daily basis as the market price of the financial futures contract fluctuates. Daily variation margin adjustments, arising from this "mark to market," are recorded by the Fund as unrealized gains or losses.
Although some financial futures contracts by their terms call for actual delivery or acceptance of financial instruments, in most cases the contracts are closed out prior to delivery by offsetting purchases or sales of matching financial futures contracts. When the contracts are closed, the Fund recognizes a gain or loss. Risks of entering into futures contracts include the possibility there may be an illiquid market, possibly at a time of rapidly declining prices, and/or a change in the value of the contract may not correlate with changes in the value of the underlying securities.
For U.S. federal income tax purposes, the futures transactions undertaken by the Fund may cause the Fund to recognize gains or losses from marking contracts to market even though its positions have not been sold or terminated, may affect the character of the gains or losses recognized as long-term or short-term, and may affect the timing of some capital gains and losses realized by the Fund. Also, the Fund's losses on transactions involving futures contracts may be deferred rather than being taken into account currently in calculating the Fund's taxable income.
During the year ended December 31, 2008, the Fund entered into financial futures contracts. At December 31, 2008, open positions in financial futures contracts were:
| Expiration | | Open Contracts | | Position | | Unrealized
Appreciation | |
| March 2009 | | 600 U.S. Treasury Notes, 2 Year | | Long | | $ | 1,378,124 | | |
At December 31, 2008, the Fund had deposited $1,395,024 in Fannie Mae Whole Loan, 10.42%, due 1/2/09, to cover margin requirements on open financial futures contracts.
15
7 Income tax information: The Funds are treated as separate entities for U.S. federal income tax purposes. It is the policy of the Fund to continue to qualify as a regulated investment company by complying with the requirements of Subchapter M of the Internal Revenue Code applicable to regulated investment companies and to distribute substantially all of its earnings to its shareholders. Therefore, no federal income or excise tax provision is required.
The Fund has adopted the provisions of Financial Accounting Standards Board Interpretation No. 48 ("FIN 48") "Accounting for Uncertainty in Income Taxes--an interpretation of FASB Statement No. 109". FIN 48 sets forth a minimum threshold for financial statement recognition of the benefit of a tax position taken, or expected to be taken, in a tax return. The Fund recognizes interest and penalties, if any, related to unrecognized tax benefits as an income tax expense in the Statement of Operations. The Fund is subject to examination by U.S. federal and state tax authorities for returns filed for the prior three fiscal years 2005 - 2007. As of December 31, 2008, the Fund did not have any unrecognized tax benefits.
Income distributions and capital gain distributions are determined in accordance with income tax regulations, which may differ from U.S. generally accepted accounting principles. These differences are primarily due to differing treatments of income and gains on various investment securities held by the Fund, timing differences and differing characterization of distributions made by the Fund as a whole. The Fund may also utilize earnings and profits distributed to shareholders on redemption of shares as a part of the dividends paid deduction for income tax purposes.
As determined on December 31, 2008, permanent differences resulting primarily from different book and tax accounting for foreign currency gains and losses, paydown gains and losses, amortization of bond premium, and the expiration of capital loss carryforwards were reclassified at fiscal year-end. These reclassifications had no effect on net income, net asset value or net asset value per share of the Fund.
The tax character of distributions paid during the years ended December 31, 2008 and December 31, 2007 was as follows:
| Ordinary Income | | Total | |
| 2008 | | 2007 | | 2008 | | 2007 | |
| $ | 24,383,220 | | | $ | 15,865,930 | | | $ | 24,383,220 | | | $ | 15,865,930 | | |
As of December 31, 2008, the components of distributable earnings (accumulated losses) on a U.S. federal income tax basis were as follows:
Undistributed
Ordinary Income | | Unrealized
Appreciation
(Depreciation) | | Loss
Carryforwards
and Deferrals | | Total | |
| $ | 26,929,953 | | | $ | (112,489,421 | ) | | $ | (11,678,288 | ) | | $ | (97,237,756 | ) | |
The difference between book basis and tax basis distributable earnings is attributable primarily to timing differences of wash sales, amortization of bond premium, capital loss carryforwards and mark to market on certain futures contracts.
To the extent the Fund's net realized capital gains, if any, can be offset by capital loss carryforwards, it is the policy of the Fund not to distribute such gains. As determined at December 31, 2008, the Fund had unused capital loss carryforwards available for federal income tax purposes to offset net realized capital gains, if any, as follows:
| | | Expiring in | |
| 2012 | | 2013 | | 2014 | | 2015 | |
| $ | 2,710,070 | | | $ | 4,632,986 | | | $ | 3,820,726 | | | $ | 514,506 | | |
During the year ended December 31, 2008, the Fund utilized capital loss carryforwards of $5,807,026.
At December 31, 2008, capital loss carryforwards of $579,598 expired.
16
8 Distributions to shareholders: The Fund earns income, net of expenses, daily on its investments. Distributions from net investment income and net realized capital gains, if any, generally are distributed in October. Income distributions and capital gain distributions to shareholders are recorded on the ex-date.
9 Foreign taxes: Foreign taxes withheld represent amounts withheld by foreign tax authorities, net of refunds recoverable.
10 Expense allocation: Certain expenses are applicable to multiple funds. Expenses directly attributable to a Series are charged to that Series. Expenses of the Trust that are not directly attributed to a Series are allocated among the Funds, on the basis of relative net assets, except where a more appropriate allocation of expenses to each of the Funds can otherwise be made fairly. Expenses borne by the complex of related investment companies, which includes open-end and closed-end investment companies for which Management serves as investment manager, that are not directly attributed to a Series or the Trust are allocated among the Fund and the other investment companies in the complex or series thereof on the basis of relative net assets, except where a more appropriate allocation of expenses to each investment company in the complex or series thereof can otherwise be made fairly.
11 Security Lending: A third party, eSecLending, has assisted the Fund in conducting a bidding process to identify agents/principals that would pay a guaranteed amount to the Fund in consideration of the Fund entering into an exclusive securities lending arrangement.
For part of the fiscal year, Neuberger Berman, LLC ("Neuberger"), an affiliate of the Fund, served as exclusive lending agent for the Fund. The Fund selected Neuberger through a bidding process in accordance with an Exemptive Order issued by the Securities and Exchange Commission. Under the securities lending arrangement, the Fund received cash collateral at the beginning of each transaction equal to at least 102% of the prior day's market value of the loaned securities (105% in the case of international securities). The Fund could invest all the cash collateral in Neuberger Berman Securities Lending Quality Fund, LLC ("Quality Fund"), a fund managed by LBAM, an affiliate of Management. The Fund does not currently have a lending agent.
At various times during the course of the Fund's fiscal year ended December 31, 2008, the Quality Fund's NAV was below $1.00 per share, which could have affected the NAV of the Fund with securities loans outstanding during the period. The Quality Fund's price per share on December 31, 2008 was $1.00. The market value of the Fund's investments in the Quality Fund as of that date, if any, is reflected in the Fund's Schedule of Investments. If it were necessary to liquidate assets in the Quality Fund to meet returns on outstanding securities loans at a time when the Quality Fund's price per share was less than $1.00, the Fund may not receive an amount from the Quality Fund that is equal in amount to the collateral the Fund would be required to return to the borrower of the securities and the Fund would be required to make up for this shortfall. In addition, as a result of recent reduced liquidity in the credit and fixed income markets, it may be difficult to dispose quickly of some securities in the Quality Fund at the price at which the Quality Fund is carrying them. The Quality Fund is not a money market fund that operates in accordance with Rule 2a-7 under the 1940 Act and there is no assurance that it will maintain a $1.00 share price.
Net income from the lending program represents the guaranteed amount received from Neuberger plus income earned on the cash collateral invested in Quality Fund or in other investments, less cash collateral fees and other expenses associated with the loans. For the fiscal year ended December 31, 2008, the Fund received net income under the securities lending arrangement of $43,473, which is reflected in the Statement of Operations under the caption "Income from securities loaned-net." For the fiscal year ended December 31, 2008, "Income from securities loaned-net" consisted of $46,998 in income earned on cash collateral and guaranteed amounts (including $0 of interest income earned from the Quality Fund and $46,998 in guaranteed amounts received from Neuberger), less fees and expenses paid of $3,525 (including $0 retained by Neuberger).
12 Repurchase agreements: The Fund may enter into repurchase agreements with institutions that Management has determined are creditworthy. Each repurchase agreement is recorded at cost. The Fund requires that the securities purchased in a repurchase agreement be transferred to the custodian in a manner sufficient to enable the Fund to assert a perfected security interest in those securities in the event of a default under the repurchase agreement. The
17
Fund monitors, on a daily basis, the value of the securities transferred to ensure that their value, including accrued interest, is greater than amounts owed to the Fund under each such repurchase agreement.
13 Dollar rolls: The Fund may enter into dollar roll transactions with respect to mortgage-backed securities. In a dollar roll transaction, the Fund sells securities for delivery in the current month and simultaneously agrees to repurchase substantially similar (i.e., same type and coupon) securities on a specified future date from the same party. During the period before the repurchase, the Fund foregoes principal and interest payments on the securities. The Fund is compensated by the difference between the current sales price and the forward price for the future purchase (often referred to as the "drop"), as well as by the interest earned on the cash proceeds of the initial sale. Dollar rolls may increase fluctuations in the Fund's net asset value and may be viewed as a form of leverage. There is a risk that the counter party will be unable or unwilling to complete the transaction as scheduled, which may result in losses to the Fund.
14 Indemnifications: Like many other companies, the Trust's organizational documents provide that its officers and trustees are indemnified against certain liabilities arising out of the performance of their duties to the Trust. In addition, both in some of its principal service contracts and in the normal course of its business, the Trust enters into contracts that provide indemnifications to other parties for certain types of losses or liabilities. The Trust's maximum exposure under these arrangements is unknown as this could involve future claims against the Trust.
Note B--Management Fees, Administration Fees, Distribution Arrangements, and Other Transactions With Affiliates:
Fund shares are issued and redeemed in connection with investments in and payments under certain variable annuity contracts and variable life insurance policies issued through separate accounts of life insurance companies and are also offered directly to qualified pension and retirement plans.
The Fund retains Management as its investment manager under a Management Agreement. For such investment management services, the Fund pays Management a fee at the annual rate of 0.25% of the first $500 million of the Fund's average daily net assets, 0.225% of the next $500 million, 0.20% of the next $500 million, 0.175% of the next $500 million, and 0.15% of average daily net assets in excess of $2 billion. LBAM became sub-adviser for the Fund effective May 1, 2007. LBAM receives a monthly fee paid by Management. The Fund does not pay a fee directly to LBAM for such services. Prior to May 1, 2007, Neuberger served as sub-adviser to the Fund.
The Fund retains Management as its administrator under an Administration Agreement. The Fund pays Management an administration fee at the annual rate of 0.40% of its average daily net assets under this agreement. Additionally, Management retains State Street Bank and Trust Company ("State Street") as its sub-administrator under a Sub-Administration Agreement. Management pays State Street a fee for all services received under this agreement.
The Board adopted a non-fee distribution plan for the Fund.
Management has contractually undertaken through December 31, 2011 to forgo current payment of fees and/or reimburse the Fund for its operating expenses (excluding the fees payable to Management, interest, taxes, brokerage commissions, extraordinary expenses, and transaction costs) ("Operating Expenses") which exceed, in the aggregate, 1.00% per annum of the Fund's average daily net assets (the "Expense Limitation"). For the year ended December 31, 2008, no reimbursement to the Fund was required. The Fund has agreed to repay Management through December 31, 2014 for fees and expenses foregone and/or its excess Operating Expenses previously reimbursed by Management, so long as its annual Operating Expenses during that period do not exceed its Expense Limitation, and the repayment is made within three years after the year in which Management issued the reimbursement or waived fees. During the year ended December 31, 2008, there was no repayment to Management under this agreement. At December 31, 2008, the Fund had no contingent liability to Management under this agreement.
18
LBAM, sub-adviser to the Fund, is retained by Management to furnish it with investment recommendations and research information without added cost to the Fund. Several individuals who are officers and/or trustees of the Trust are also employees of LBAM and/or Management.
The Fund has an expense offset arrangement in connection with its custodian contract. For the year ended December 31, 2008, the impact of this arrangement was a reduction of expenses of $4,033.
Note C--Securities Transactions:
Cost of purchases and proceeds of sales and maturities of long-term securities (excluding short-term securities, financial futures contracts and foreign currency contracts) for the year ended December 31, 2008 were as follows:
Purchases of
U.S. Government
and Agency
Obligations | | Purchases excluding
U.S. Government
and Agency
Obligations | | Sales and Maturities
of U.S. Government
and Agency
Obligations | | Sales and Maturities
excluding
U.S. Government
and Agency
Obligations | |
| $ | 144,412,219 | | | $ | 103,084,679 | | | $ | 114,648,035 | | | $ | 189,141,977 | | |
Note D--Fund Share Transactions:
Share activity for the years ended December 31, 2008 and December 31, 2007 was as follows:
| | | For the Year Ended December 31, | |
| | | 2008 | | 2007 | |
| Shares Sold | | | 7,033,514 | | | | 18,872,474 | | |
| Shares Issued on Reinvestment of Dividends and Distributions | | | 2,105,632 | | | | 1,230,871 | | |
| Shares Redeemed | | | (15,489,592 | ) | | | (4,989,548 | ) | |
| Total | | | (6,350,446 | ) | | | 15,113,797 | | |
Note E--Line of Credit:
At December 31, 2008, the Fund was a participant in a single committed, unsecured $150,000,000 line of credit with State Street, to be used only for temporary or emergency purposes. Other investment companies managed by Management also participate in this line of credit on the same terms. Interest is charged on borrowings under this line of credit at the overnight Federal Funds Rate plus 0.50% per annum. A facility fee of 0.07% (as of September 19, 2008, 0.09%) per annum of the available line of credit is charged, of which the Fund has agreed to pay its pro rata share, based on the ratio of its individual net assets to the net assets of all participants at the time the fee is due and payable. The fee is paid quarterly in arrears. Because several investment companies participate, there is no assurance that an individual Fund will have access to all or any part of the $150,000,000 at any particular time. There were no loans outstanding pursuant to this line of credit at December 31, 2008. During the year ended December 31, 2008, the Fund did not utilize this line of credit.
Note F--Recent Accounting Pronouncement:
In March 2008, Statement of Financial Accounting Standards No. 161, "Disclosures about Derivative Instruments and Hedging Activities-an amendment of FASB Statement No. 133" ("FAS 161"), was issued. FAS 161 is intended to improve financial reporting for derivative instruments by requiring enhanced disclosure that enables investors to understand how and why an entity uses derivatives, how derivatives are accounted for, and how derivative instruments affect an entity's results of operations and financial position. In September 2008, FASB Staff Position No. 133-1 and FASB Interpretation No. 45-4 (the "FSP"), "Disclosures about Credit Derivatives and Certain Guarantees: An Amendment of FASB Statement No. 133 and FASB Interpretation No. 45; and Clarification of the
19
Effective Date of FASB Statement No. 161" was issued. Certain provisions of the FSP amend FASB Statement No. 133, "Accounting for Derivative Instruments and Hedging Activities," to require disclosures by sellers of credit derivatives, including credit derivatives embedded in hybrid instruments. These FSP provisions are effective for fiscal years and interim periods ending after November 15, 2008. At this time, Management has assessed the implication of these FSP provisions and determined there is no impact to the Fund's financial statements. The FSP also clarifies the effective date of FAS 161, whereby disclosures required by FAS 161 are effective for financial statements issued for fiscal years and interim periods beginning after November 15, 2008. The impact of FAS 161 on the Fund's financial statement disclosures, if any, is currently being assessed.
Note G--Recent Market Events
The year covered by this report witnessed an unusually high degree of volatility in the fixed income markets so that certain fixed income instruments experienced liquidity issues, increased priced volatility, credit downgrades, and an increase in default rates. Due to the market turbulence, there was increased demand for securities issued or guaranteed by the U.S. Treasury, causing the prices of these securities to rise and their yields to decline to very low levels. The U.S. federal government and certain foreign governments have acted to calm credit markets and increase confidence in the U.S. and world economies. The U.S. government has assisted certain large financial services companies and has established programs to purchase troubled assets and certain money market instruments. Certain debt securities held by the Fund during the reporting period were affected by the volatility in the fixed income markets and may have been affected by governmental actions. The Fund's investments in certain issuers, as reflected in the Fund's schedule of investments, and the financial markets in general, expose investors to the volatile performance resulting from these market conditions and related events.
20
Financial Highlights
Short Duration Bond Portfolio
The following table includes selected data for a share outstanding throughout each year and other performance information derived from the Financial Statements.
| | | Year Ended December 31, | |
| | | 2008 | | 2007 | | 2006 | | 2005 | | 2004 | |
| Net Asset Value, Beginning of Year | | $ | 13.00 | | | $ | 12.76 | | | $ | 12.64 | | | $ | 12.82 | | | $ | 13.20 | | |
| Income From Investment Operations: | |
| Net Investment Income (Loss)t | | | .53 | | | | .59 | | | | .51 | | | | .35 | | | | .30 | | |
Net Gains or Losses on Securities
(both realized and unrealized) | | | (2.23 | ) | | | .02 | | | | .02 | | | | (.17 | ) | | | (.20 | ) | |
| Total From Investment Operations | | | (1.70 | ) | | | .61 | | | | .53 | | | | .18 | | | | .10 | | |
| Less Distributions From: | |
| Net Investment Income | | | (.59 | ) | | | (.37 | ) | | | (.41 | ) | | | (.36 | ) | | | (.48 | ) | |
| Net Asset Value, End of Year | | $ | 10.71 | | | $ | 13.00 | | | $ | 12.76 | | | $ | 12.64 | | | $ | 12.82 | | |
| Total Returntt | | | (13.43 | )% | | | 4.77 | % | | | 4.20 | % | | | 1.44 | % | | | .78 | % | |
| Ratios/Supplemental Data | |
| Net Assets, End of Year (in millions) | | $ | 445.5 | | | $ | 623.0 | | | $ | 418.7 | | | $ | 341.3 | | | $ | 323.4 | | |
| Ratio of Gross Expenses to Average Net Assets# | | | .74 | % | | | .73 | % | | | .75 | % | | | .75 | % | | | .73 | % | |
| Ratio of Net Expenses to Average Net Assets | | | .74 | % | | | .73 | % | | | .75 | %S | | | .75 | % | | | .73 | % | |
Ratio of Net Investment Income (Loss) to
Average Net Assets | | | 4.35 | % | | | 4.51 | % | | | 3.97 | % | | | 2.77 | % | | | 2.28 | % | |
| Portfolio Turnover Rate | | | 46 | % | | | 69 | % | | | 86 | % | | | 133 | % | | | 132 | % | |
See Notes to Financial Highlights 21
Notes to Financial Highlights Short Duration Bond Portfolio
tt Total return based on per share net asset value reflects the effects of changes in net asset value on the performance of the Fund during each fiscal period and assumes dividends and other distributions, if any, were reinvested. Results represent past performance and do not guarantee future results. Current returns may be lower or higher than the performance data quoted. Investment returns and principal may fluctuate and shares when redeemed may be worth more or less than original cost. The total return information shown does not reflect charges and other expenses that apply to the separate account or the related insurance policies, and the inclusion of these charges and other expenses would reduce the total return for all fiscal periods shown. For the year ended December 31, 2006 Management reimbursed the Fund for losses incurred in connection with the disposition of foreign currency contracts, which had no impact on total return.
# The Fund is required to calculate an expense ratio without taking into consideration any expense reductions related to expense offset arrangements.
t Calculated based on the average number of shares outstanding during each fiscal period.
S Had the Fund not utilized the Line of Credit, the annualized expense ratio of net expenses to average daily net assets would have been:
Year Ended December 31,
2006 | |
| | .75 | % | |
22
Report of Independent Registered Public Accounting Firm
To the Board of Trustees of
Neuberger Berman Advisers Management Trust and
Shareholders of Short Duration Bond Portfolio
We have audited the accompanying statement of assets and liabilities, including the schedule of investments, of Short Duration Bond Portfolio (formerly, Lehman Brothers Short Duration Bond Portfolio, one of the series constituting Neuberger Berman Advisers Management Trust (the "Trust"), as of December 31, 2008, and the related statement of operations for the year then ended, the statement of changes in net assets for each of the two years in the period then ended, and the financial highlights for each of the five years in the period then ended. These financial statements and financial highlights are the responsibility of the Trust's management. Our responsibility is to express an opinion on these financial statements and financial highlights based on our audits.
We conducted our audits in accordance with the standards of the Public Company Accounting Oversight Board (United States). Those standards require that we plan and perform the audit to obtain reasonable assurance about whether the financial statements and financial highlights are free of material misstatement. We were not engaged to perform an audit of the Trust's internal control over financial reporting. Our audits included consideration of internal control over financial reporting as a basis for designing audit procedures that are appropriate in the circumstances, but not for the purpose of expressing an opinion on the effectiveness of the Trust's internal control over financial reporting. Accordingly, we express no such opinion. An audit also includes examining, on a test basis, evidence supporting the amounts and disclosures in the financial statements and financial highlights, assessing the accounting principles used and significant estimates made by management, and evaluating the overall financial statement presentation. Our procedures included confirmation of securities owned as of December 31, 2008 by correspondence with the custodian and brokers. We believe that our audits provide a reasonable basis for our opinion.
In our opinion, the financial statements and financial highlights referred to above present fairly, in all material respects, the financial position of Short Duration Bond Portfolio, a series of Neuberger Berman Advisers Management Trust, at December 31, 2008, the results of its operations for the year then ended, the changes in its net assets for each of the two years in the period then ended, and the financial highlights for each of the five years in the period then ended, in conformity with U.S. generally accepted accounting principles.

Boston, Massachusetts
February 9, 2009
23
Trustee and Officer Information
The following tables set forth information concerning the trustees and officers of the Trust. All persons named as trustees and officers also serve in similar capacities for other funds administered or managed by Neuberger Berman Management LLC ("NB Management") and Neuberger Berman, LLC ("Neuberger Berman"). The Statement of Additional Information includes additional information about fund trustees and is available upon request, without charge, by calling (800) 877-9700.
Information about the Board of Trustees
Name, (Year of Birth),
and Address(1) | | Position and
Length of
Time Served(2) | | Principal Occupation(s)(3) | | Number of
Funds in Fund
Complex
Overseen by
Fund Trustee | | Other Directorships
Held Outside Fund
Complex by Fund
Trustee | |
| Independent Fund Trustees | |
|
| John Cannon (1930) | | Trustee since 2000 | | Consultant; formerly, Chairman, CDC Investment Advisers (registered investment adviser), 1993 to January 1999; formerly, President and Chief Executive Officer, AMA Investment Advisors, an affiliate of the American Medical Association. | | | 56 | | | Independent Trustee or Director of three series of Oppenheimer Funds: Oppenheimer Limited Term New York Municipal Fund, Rochester Fund Municipals, and Oppenheimer Convertible Securities Fund since 1992. | |
|
| Faith Colish (1935) | | Trustee since 1982 | | Counsel, Carter Ledyard & Milburn LLP (law firm) since October 2002; formerly, Attorney-at-Law and President, Faith Colish, A Professional Corporation, 1980 to 2002. | | | 56 | | | Formerly, Director (1997 to 2003) and Advisory Director (2003 to 2006), ABA Retirement Funds (formerly, American Bar Retirement Association) (not-for-profit membership corporation). | |
|
| Martha C. Goss (1949) | | Trustee since 2007 | | President, Woodhill Enterprises Inc./Chase Hollow Associates LLC (personal investment vehicle), since 2006; Chief Operating and Financial Officer, Hopewell Holdings LLC/Amwell Holdings, LLC (a holding company for a healthcare reinsurance company start-up), since 2003; formerly, Consultant, Resources Connection (temporary staffing), 2002 to 2006. | | | 56 | | | Director, Ocwen Financial Corporation (mortgage servicing), since 2005; Director, American Water (water utility), since 2003; Director, Channel Reinsurance (financial guaranty reinsurance), since 2006; Advisory Board Member, Attensity (software developer), since 2005; Director, Allianz Life of New York (insurance), since 2005; Director, Financial Women's Association of New York (not for profit association), since 2003; Trustee Emerita, Brown University, since 1998. | |
|
24
Name, (Year of Birth),
and Address(1) | | Position and
Length of
Time Served(2) | | Principal Occupation(s)(3) | | Number of
Funds in Fund
Complex
Overseen by
Fund Trustee | | Other Directorships
Held Outside Fund
Complex by Fund
Trustee | |
| C. Anne Harvey (1937) | | Trustee since 1998 | | President, C.A. Harvey Associates, since October 2001; formerly, Director, AARP, 1978 to December 2001. | | | 56 | | | Formerly, President, Board of Associates to The National Rehabilitation Hospital's Board of Directors, 2001 to 2002; formerly, Member, Individual Investors Advisory Committee to the New York Stock Exchange Board of Directors, 1998 to June 2002. | |
|
| Robert A. Kavesh (1927) | | Trustee since 2000 | | Retired; Marcus Nadler Professor Emeritus of Finance and Economics, New York University Stern School of Business; formerly, Executive Secretary-Treasurer, American Finance Association, 1961 to 1979. | | | 56 | | | Formerly, Director, The Caring Community (not-for-profit), 1997 to 2006; formerly, Director, DEL Laboratories, Inc. (cosmetics and pharmaceuticals), 1978 to 2004; formerly, Director, Apple Bank for Savings, 1979 to 1990; formerly, Director, Western Pacific Industries, Inc., 1972 to 1986 (public company). | |
|
| Michael M. Knetter (1960) | | Trustee since 2007 | | Dean, School of Business, University of Wisconsin - Madison; formerly, Professor of International Economics and Associate Dean, Amos Tuck School of Business - Dartmouth College, 1998 to 2002. | | | 56 | | | Trustee, Northwestern Mutual Series Fund, Inc., since February 2007; Director, Wausau Paper, since 2005; Director, Great Wolf Resorts, since 2004. | |
|
| Howard A. Mileaf (1937) | | Trustee since 1999 | | Retired; formerly, Vice President and General Counsel, WHX Corporation (holding company), 1993 to 2001. | | | 56 | | | Formerly, Director, Webfinancial Corporation (holding company), 2002 to 2008; formerly, Director WHX Corporation (holding company), January 2002 to June 2005; formerly, Director, State Theatre of New Jersey (not-for-profit theater), 2000 to 2005. | |
|
25
Name, (Year of Birth),
and Address(1) | | Position and
Length of
Time Served(2) | | Principal Occupation(s)(3) | | Number of
Funds in Fund
Complex
Overseen by
Fund Trustee | | Other Directorships
Held Outside Fund
Complex by Fund
Trustee | |
| George W. Morriss (1947) | | Trustee since 2007 | | Retired; formerly, Executive Vice President and Chief Financial Officer, People's Bank, Connecticut (a financial services company), 1991 to 2001. | | | 56 | | | Manager, Old Mutual 2100 fund complex (consisting of six funds) since October 2006 for four funds and since February 2007 for two funds; formerly, Member NASDAQ Issuers' Affairs Committee, 1995 to 2003. | |
|
| Edward I. O'Brien (1928) | | Trustee since 2000 | | Retired; formerly, Member, Investment Policy Committee, Edward Jones, 1993 to 2001; President, Securities Industry Association ("SIA") (securities industry's representative in government relations and regulatory matters at the federal and state levels), 1974 to 1992; Adviser to SIA, November 1992 to November 1993. | | | 56 | | | Formerly, Director, Legg Mason, Inc. (financial services holding company), 1993 to July 2008; formerly, Director, Boston Financial Group (real estate and tax shelters), 1993 to 1999. | |
|
| William E. Rulon (1932) | | Trustee since 2000 | | Retired; formerly, Senior Vice President, Foodmaker, Inc. (operator and franchiser of restaurants), until January 1997. | | | 56 | | | Formerly, Director, Pro-Kids Golf and Learning Academy (teach golf and computer usage to "at risk" children), 1998 to 2006; formerly, Director, Prandium, Inc. (restaurants), March 2001 to July 2002. | |
|
| Cornelius T. Ryan (1931) | | Trustee since 2000 | | Founding General Partner, Oxford Partners and Oxford Bioscience Partners (venture capital investing) and President, Oxford Venture Corporation, since 1981. | | | 56 | | | None. | |
|
26
Name, (Year of Birth),
and Address(1) | | Position and
Length of
Time Served(2) | | Principal Occupation(s)(3) | | Number of
Funds in Fund
Complex
Overseen by
Fund Trustee | | Other Directorships
Held Outside Fund
Complex by Fund
Trustee | |
| Tom D. Seip (1950) | | Trustee since 2000; Chairman of the Board since 2008; Lead Independent Trustee from 2006 to 2008 | | General Partner, Seip Investments LP (a private investment partnership); formerly, President and CEO, Westaff, Inc. (temporary staffing), May 2001 to January 2002; formerly, Senior Executive at the Charles Schwab Corporation, 1983 to 1998, including Chief Executive Officer, Charles Schwab Investment Management, Inc., and Trustee, Schwab Family of Funds and Schwab Investments, 1997 to 1998, and Executive Vice President-Retail Brokerage, Charles Schwab & Co., Inc., 1994 to 1997. | | | 56 | | | Director, H&R Block, Inc. (financial services company), since May 2001; Chairman, Compensation Committee, H&R Block, Inc., since 2006; formerly, Director, Forward Management, Inc. (asset management company), 1999 to 2006. | |
|
| Candace L. Straight (1947) | | Trustee since 1999 | | Private investor and consultant specializing in the insurance industry; formerly, Advisory Director, Securitas Capital LLC (a global private equity investment firm dedicated to making investments in the insurance sector), 1998 to December 2003. | | | 56 | | | Director, Montpelier Re (reinsurance company), since 2006; formerly, Director, National Atlantic Holdings Corporation (property and casualty insurance company), 2004 to 2008; formerly, Director, The Proformance Insurance Company (property and casualty insurance company), 2004 to 2008; formerly, Director, Providence Washington Insurance Company (property and casualty insurance company), December 1998 to March 2006; formerly, Director, Summit Global Partners (insurance brokerage firm), 2000 to 2005. | |
|
| Peter P. Trapp (1944) | | Trustee since 1984 | | Retired; formerly, Regional Manager for Mid-Southern Region, Ford Motor Credit Company, September 1997 to 2007; formerly, President, Ford Life Insurance Company, April 1995 to August 1997. | | | 56 | | | None. | |
|
27
Name, (Year of Birth),
and Address(1) | | Position and
Length of
Time Served(2) | | Principal Occupation(s)(3) | | Number of
Funds in Fund
Complex
Overseen by
Fund Trustee | | Other Directorships
Held Outside Fund
Complex by Fund
Trustee | |
| Fund Trustees who are "Interested Persons" | |
|
| Jack L. Rivkin* (1940) | | Trustee since 2002; President from 2002 to 2008 | | Formerly, Executive Vice President and Chief Investment Officer, Neuberger Berman Holdings LLC (holding company), 2002 to August 2008 and 2003 to August 2008, respectively; formerly, Managing Director and Chief Investment Officer, Neuberger Berman, December 2005 to August 2008 and 2003 to August 2008, respectively; formerly, Executive Vice President, Neuberger Berman, December 2002 to 2005; formerly, Director and Chairman, NB Management, December 2002 to August 2008; formerly, Executive Vice President, Citigroup Investments, Inc., September 1995 to February 2002; formerly, Executive Vice President, Citigroup Inc., September 1995 to February 2002. | | | 56 | | | Director, Dale Carnegie and Associates, Inc. (private company), since 1998; Director, Solbright, Inc. (private company), since 1998. | |
|
28
Name, (Year of Birth),
and Address(1) | | Position and
Length of
Time Served(2) | | Principal Occupation(s)(3) | | Number of
Funds in Fund
Complex
Overseen by
Fund Trustee | | Other Directorships
Held Outside Fund
Complex by Fund
Trustee | |
| Robert Conti* (1956) | | Chief Executive Officer, President and Director since 2008; prior thereto, Executive Vice President in 2008 and Vice President 2000 to 2008 | | Managing Director, Neuberger Berman, since 2007; formerly, Senior Vice President, Neuberger Berman, 2003 to 2006; formerly, Vice President, Neuberger Berman, 1999 to 2003; President and Chief Executive Officer, NB Management, since 2008; formerly, Senior Vice President, NB Management, 2000 to 2008. | | | 56 | | | Chairman of the Board, Staten Island Mental Health Society since 2008. | |
|
(1) The business address of each listed person is 605 Third Avenue, New York, New York 10158.
(2) Pursuant to the Trust's Trust Instrument, each Fund Trustee shall hold office for life or until his or her successor is elected or the Trust terminates; except that (a) any Fund Trustee may resign by delivering a written resignation; (b) any Fund Trustee may be removed with or without cause at any time by a written instrument signed by at least two-thirds of the other Fund Trustees; (c) any Fund Trustee who requests to be retired, or who has become unable to serve, may be retired by a written instrument signed by a majority of the other Fund Trustees; and (d) any Fund Trustee may be removed at any shareholder meeting by a vote of at least two-thirds of the outstanding shares.
(3) Except as otherwise indicated, each individual has held the positions shown for at least the last five years.
* Indicates a Fund Trustee who is an "interested person" within the meaning of the 1940 Act. Mr. Conti is an interested person of the Trust by virtue of the fact that he is an officer of NB Management and Neuberger Berman. Mr. Rivkin may be deemed an interested person of the Trust by virtue of the fact that, until August 2008, he was a director of NB Management and an officer of Neuberger Berman.
29
Information about the Officers of the Trust
Name, (Year of Birth),
and Address(1) | | Position and
Served(2) | | Principal Occupation(s)(3)
Length of Time | |
| Andrew B. Allard (1961) | | Anti-Money Laundering Compliance Officer since 2002 | | Senior Vice President, Neuberger Berman, since 2006; Deputy General Counsel, Neuberger Berman, since 2004; formerly, Vice President, Neuberger Berman, 2000 to 2005; formerly, Associate General Counsel, Neuberger Berman, 1999 to 2004; Anti-Money Laundering Compliance Officer, eleven registered investment companies for which NB Management acts as investment manager and administrator (six since 2002, two since 2003, two since 2004 and one since 2006). | |
|
| Michael J. Bradler (1970) | | Assistant Treasurer since 2005 | | Vice President, Neuberger Berman, since 2006; Employee, NB Management, since 1997; Assistant Treasurer, eleven registered investment companies for which NB Management acts as investment manager and administrator (ten since 2005 and one since 2006). | |
|
| Claudia A. Brandon (1956) | | Executive Vice President since 2008 and Secretary since 1985 | | Senior Vice President, Neuberger Berman, since 2007 and Employee since 1999; formerly, Vice President, Neuberger Berman, 2002 to 2006; Senior Vice President, NB Management, since 2008 and Assistant Secretary since 2004; formerly, Vice President-Mutual Fund Board Relations, NB Management, 2000 to 2008; Executive Vice President, eleven registered investment companies for which NB Management acts as investment manager and administrator (eleven since 2008); Secretary, eleven registered investment companies for which NB Management acts as investment manager and administrator (three since 1985, three since 2002, two since 2003, two since 2004 and one since 2006). | |
|
| Maxine L. Gerson (1950) | | Executive Vice President since 2008 and Chief Legal Officer since 2005 (only for purposes of sections 307 and 406 of the Sarbanes-Oxley Act of 2002) | | Senior Vice President, Neuberger Berman, since 2002; Deputy General Counsel and Assistant Secretary, Neuberger Berman, since 2001; Senior Vice President, NB Management, since 2006; Secretary and General Counsel, NB Management, since 2004; Executive Vice President, eleven registered investment companies for which NB Management acts as investment manager and administrator (eleven since 2008); Chief Legal Officer (only for purposes of sections 307 and 406 of the Sarbanes-Oxley Act of 2002), eleven registered investment companies for which NB Management acts as investment manager and administrator (ten since 2005 and one since 2006). | |
|
| Sheila R. James (1965) | | Assistant Secretary since 2002 | | Vice President, Neuberger Berman, since 2008 and Employee since 1999; formerly, Assistant Vice President, Neuberger Berman, 2007; Assistant Secretary, eleven registered investment companies for which NB Management acts as investment manager and administrator (six since 2002, two since 2003, two since 2004 and one since 2006). | |
|
| Brian Kerrane (1969) | | Vice President since 2008 | | Senior Vice President, Neuberger Berman, since 2006; formerly, Vice President, Neuberger Berman, 2002 to 2006; Vice President, NB Management, since 2008 and Employee since 1991; Vice President, eleven registered investment companies for which NB Management acts as investment manager and administrator (eleven since 2008). | |
|
30
Name, (Year of Birth),
and Address(1) | | Position and
Served(2) | | Principal Occupation(s)(3)
Length of Time | |
| Kevin Lyons (1955) | | Assistant Secretary since 2003 | | Assistant Vice President, Neuberger Berman, since 2008 and Employee since 1999; Assistant Secretary, eleven registered investment companies for which NB Management acts as investment manager and administrator (eight since 2003, two since 2004 and one since 2006). | |
|
| Owen F. McEntee, Jr. (1961) | | Vice President since 2008 | | Vice President, Neuberger Berman, since 2006; Employee, NB Management, since 1992; Vice President, eleven registered investment companies for which NB Management acts as investment manager and administrator (eleven since 2008). | |
|
| John M. McGovern (1970) | | Treasurer and Principal Financial and Accounting Officer since 2005; prior thereto, Assistant Treasurer since 2002 | | Senior Vice President, Neuberger Berman, since 2007; formerly, Vice President, Neuberger Berman, 2004 to 2006; Employee, NB Management, since 1993; Treasurer and Principal Financial and Accounting Officer, eleven registered investment companies for which NB Management acts as investment manager and administrator (ten since 2005 and one since 2006); formerly, Assistant Treasurer, eleven registered investment companies for which NB Management acts as investment manager and administrator, 2002 to 2005. | |
|
| Andrew Provencher (1965) | | Vice President since 2008 | | Managing Director, NB Management, since 2008; Managing Director, Neuberger Berman, since 2005; formerly, Senior Vice President, Neuberger Berman, 2003 to 2005; formerly, Vice President, Neuberger Berman, 1999 to 2003; Vice President, eleven registered investment companies for which NB Management acts as investment manager and administrator (eleven since 2008). | |
|
| Frank Rosato (1971) | | Assistant Treasurer since 2005 | | Vice President, Neuberger Berman, since 2006; Employee, NB Management, since 1995; Assistant Treasurer, eleven registered investment companies for which NB Management acts as investment manager and administrator (ten since 2005 and one since 2006). | |
|
| Neil S. Siegel (1967) | | Vice President since 2008 | | Managing Director, NB Management, since 2008; Managing Director, Neuberger Berman, since 2006; formerly, Senior Vice President, Neuberger Berman, 2004 to 2006; Vice President, eleven registered investment companies for which NB Management acts as investment manager and administrator (eleven since 2008); formerly, Head of Institutional Marketing, Morgan Stanley Investment Management, 1993 to 2004. | |
|
31
Name, (Year of Birth),
and Address(1) | | Position and
Served(2) | | Principal Occupation(s)(3)
Length of Time | |
| Chamaine Williams (1971) | | Chief Compliance Officer since 2005 | | Senior Vice President, Neuberger Berman, since 2007; Chief Compliance Officer, NB Management, since 2006; Senior Vice President, Lehman Brothers Inc., since 2007; formerly, Vice President, Lehman Brothers Inc., 2003 to 2006; Chief Compliance Officer, eleven registered investment companies for which NB Management acts as investment manager and administrator (ten since 2005 and one since 2006); formerly, Chief Compliance Officer, Lehman Brothers Asset Management Inc., 2003 to 2007; formerly, Chief Compliance Officer, Lehman Brothers Alternative Investment Management LLC, 2003 to 2007; formerly, Vice President, UBS Global Asset Management (US) Inc. (formerly, Mitchell Hutchins Asset Management, a wholly-owned subsidiary of PaineWebber Inc.), 1997 to 2003. | |
|
(1) The business address of each listed person is 605 Third Avenue, New York, New York 10158.
(2) Pursuant to the By-Laws of the Trust, each officer elected by the Fund Trustees shall hold office until his or her successor shall have been elected and qualified or until his or her earlier death, inability to serve, or resignation. Officers serve at the pleasure of the Fund Trustees and may be removed at any time with or without cause.
(3) Except as otherwise indicated, each individual has held the positions shown for at least the last five years.
32
Proxy Voting Policies and Procedures
A description of the policies and procedures that the Trust uses to determine how to vote proxies relating to portfolio securities is available, without charge, by calling 1-800-877-9700 (toll-free) and on the website of the Securities and Exchange Commission, at www.sec.gov. Information regarding how the Trust voted proxies relating to portfolio securities during the most recent 12-month period ended June 30 is also available, without charge, by calling 1-800-877-9700 (toll-free), on the website of the Securities and Exchange Commission at www.sec.gov, and on Management's website at www.nb.com.
Quarterly Portfolio Schedule
The Trust files a complete schedule of portfolio holdings for the Fund with the Securities and Exchange Commission for the first and third quarters of each fiscal year on Form N-Q. The Trust's Forms N-Q are available on the Securities and Exchange Commission's website at www.sec.gov and may be reviewed and copied at the Securities and Exchange Commission's Public Reference Room in Washington, DC. Information on the operation of the Public Reference Room may be obtained by calling 1-800-SEC-0330. The information on Form N-Q is available upon request, without charge, by calling 1-800-877-9700 (toll free).
Board Consideration of the Management and Sub-Advisory Agreements
At a meeting held on September 25, 2008, the Board of Trustees of Neuberger Berman Advisers Management Trust ("Board"), including the Trustees who are not "interested persons" of Neuberger Berman Management LLC ("Management") or Neuberger Berman Advisers Management Trust ("Independent Fund Trustees"), approved the continuance of the Management and Sub-Advisory Agreements ("Agreements") between Management and Short Duration Bond Portfolio ("Fund").
In evaluating the Agreements, the Board, including the Independent Fund Trustees, reviewed materials furnished by Management and Lehman Brothers Asset Management LLC ("LBAM") in response to questions submitted by counsel to the Independent Fund Trustees, and met with senior representatives of Management and LBAM regarding their personnel and operations. The Independent Fund Trustees were advised by counsel that is experienced in Investment Company Act of 1940 matters and that is independent of Management and LBAM. The Independent Fund Trustees received a memorandum from independent counsel discussing the legal standards for their consideration of the proposed continuance of the Agreements. They met with such counsel separately from representatives of Management to discuss the annual contract review. The annual contract review extends over two regular meetings of the Board to ensure that Management and LBAM have time to respond to any questions the Independent Fund Trustees may have on their initial review of the report and that the Independent Fund Trustees have time to consider those responses. In addition, during this process, the Board held a separate meeting devoted primarily to reviewing and discussing Fund performance.
The Board considered the following factors, among others, in connection with its approval of the continuance of the Agreements: (1) the nature, extent, and quality of the services provided by Management and LBAM; (2) the performance of the Fund compared to a relevant market index and a peer group of investment companies; (3) the costs of the services provided and profits or losses realized by Management and its affiliates from their relationship with the Fund; (4) the extent to which economies of scale might be realized as the Fund grows; and (5) whether fee levels reflect any such potential economies of scale for the benefit of investors in the Fund. In their deliberations, the Board members did not identify any particular information that was all-important or controlling, and each Trustee may have attributed different weights to the various factors.
The Board considered the continued integrity of Management and Neuberger as organizations, despite the bankruptcy filing by Lehman Brothers Holdings Inc. The Board discussed the efforts made by Management and Neuberger to retain employees, and the reported likelihood that such employees would be retained. The Board discussed the provisions that were being made for ancillary services by Management, Neuberger and their affiliates.
33
The Board evaluated the terms of the Agreements, the overall fairness of the Agreements to the Fund and whether the Agreements were in the best interests of the Fund and its shareholders.
With respect to the nature, extent and quality of the services provided, the Board considered the performance of the Fund and the experience and staffing of the portfolio management and investment research personnel who perform services for the Fund. The Board noted that Management also provides certain administrative services, including fund accounting and compliance oversight. In addition, the Board noted the positive compliance history of Management, as the firm has been free of significant compliance problems.
The Board considered the performance of the Fund relative to its benchmark and a peer group of investment companies dedicated to insurance products pursuing broadly similar strategies. The Board also considered performance in relation to the degree of risk undertaken by the portfolio managers.
With respect to the overall fairness of the Agreements, the Board considered the fee structure for the Fund under the Agreements as compared to a peer group of comparable funds dedicated to insurance products and any fall-out benefits likely to accrue to Management or LBAM or their affiliates from their relationship with the Fund. The Board also considered the profitability of Management and its affiliates from their association with the Fund.
The Board reviewed a comparison of the Fund's management fee and overall expense ratio to a peer group of broadly comparable funds dedicated to insurance products. The Board considered the mean and median of the management fees and expense ratios of the peer group. The Board noted that the Fund's management fee was higher than the peer group mean and median. The Board considered whether specific portfolio management or administration needs contributed to the higher fee. With regard to the sub-advisory fee paid to LBAM, the Board noted that this fee is "at cost." In addition, the Board considered the contractual limit on Fund expenses undertaken by Management.
The Board considered whether there were other funds that were advised or sub-advised by Management or its affiliates or separate accounts managed by Management or its affiliates with similar investment objectives, policies and strategies to the Fund. The Board noted that there were no comparable sub-advised funds. The Board compared the fees charged to the Fund at various asset levels to the fees charged to an advised fund and/or a separate account, each managed in a similar style to the Fund. The Board considered the appropriateness and reasonableness of any differences between the fees charged to the Fund and the other funds and/or the separate account and determined that the differences in fees were consistent with the management and other services provided.
The Board also evaluated any apparent or anticipated economies of scale in relation to the services Management provides to the Fund. The Board considered whether the Fund's fee structure provides for a reduction of payments resulting from the use of breakpoints and whether those breakpoints are set at appropriate asset levels.
In concluding that the benefits accruing to Management and its affiliates by virtue of their relationship to the Fund were reasonable in comparison with the costs of providing the investment advisory services and the benefits accruing to the Fund, the Board reviewed specific data as to Management's profit on the Fund for a recent period and the trend in profit or loss over recent years. The Board also carefully examined Management's cost allocation methodology and in recent years had an independent consultant review the methodology. It also reviewed an analysis from an independent data service on profitability margins in the investment management industry. The Board recognized that Management should be entitled to earn a reasonable level of profits for services it provides to the Fund and, based on its review, concluded that Management's level of profitability was not excessive.
Conclusions
In approving the Agreements, the Board concluded that the terms of each Agreement are fair and reasonable and that approval of the Agreements is in the best interests of the Fund and its shareholders. In reaching this determination, the Board considered that Management and LBAM could be expected to provide a high level of service to the Fund; that the performance of the Fund was satisfactory over time; that the Fund's fee structure appeared to the Board to be reasonable given the nature and quality of services provided; and that the benefits accruing to Management and its affiliates by virtue of their relationship to the Fund were reasonable in comparison with the benefits accruing to the Fund.
34
Board Consideration of New and Interim Management and Sub-Advisory Agreements
Lehman Brothers Holdings Inc. ("Lehman Brothers") has entered into an agreement to sell a controlling interest in the Fund's investment adviser. Under the agreement, Lehman Brothers would sell substantially all of the Neuberger Berman business and the fixed income business and certain alternative asset management businesses of Lehman Brother's Investment Management Division (collectively, the "Acquired Businesses") to NBSH Acquisition, LLC (the "Proposed Acquisition"). NBSH Acquisition, LLC ("NBSH") was organized by key members of Neuberger Berman's management for the purpose of facilitating the acquisition of the Acquired Businesses. At the closing of the Proposed Acquisition, a majority interest in the Acquired Businesses will be directly or indirectly owned by portfolio managers, Neuberger Berman's management team and certain key members and senior professionals of the former Investment Management Division ("Management Members"), as well as by Lehman Brothers and certain affiliates of Lehman Brothers.
The Acquired Businesses include Neuberger Berman Management LLC ("Management") and Lehman Brothers Asset Management LLC ("LBAM"), the adviser and sub-adviser to the Fund, respectively. The Proposed Acquisition has been deemed to result in an "assignment" of the Fund's existing Management Agreement and Sub-Advisory Agreement (the "Existing Agreements") under the 1940 Act. As required by the 1940 Act, the Fund's Existing Agreements provide for their automatic termination in the event of an assignment, and each will terminate upon the consummation of the Proposed Acquisition. Accordingly, on December 17, 2008, the Board approved new Management and Sub-Advisory Agreements with Management and LBAM, respectively, or their successors (together, the "Advisers"), on the same terms and with the same compensation structure as are currently in effect (together, "New Agreements"), which would take effect upon consummation of the Proposed Acquisition if approved by the Fund's shareholders.
If shareholders of the Fund do not approve the New Agreements before the Proposed Acquisition is completed, the Board has approved interim Management and Sub-Advisory Agreements with Management and LBAM, respectively, or their successors (together, "Interim Agreements") pending approval of the New Agreements by shareholders of the Fund. Compensation earned by the Advisers under the Interim Agreements would be held in an interest-bearing escrow account pending shareholder approval of the New Agreements. If shareholders approve the New Agreements within 150 days from the termination of the Existing Agreements, the amount held in the escrow account, including interest, will be paid to the Advisers, as appropriate. If shareholders of the Fund do not approve the New Agreements, the Advisers will be paid the lesser of the costs incurred in performing their services under the Interim Agreements or the total amount in the escrow account, including interest earned. If at the end of 150 days following termination of a Fund's Existing Agreements the Fund's shareholders still have not approved the New Agreements, the Trustees would take such actions as they deem to be in the best interests of the Fund and its shareholders, which may include negotiating a new Management Agreement and/or new Sub-Advisory Agreement with an advisory organization selected by the Board of Trustees or making other arrangements.
The Trustees of the Trust discussed the Proposed Acquisition on December 17, 2008. Prior to submitting its bid to public auction, Management met telephonically with the Independent Trustees to brief them on the Proposed Acquisition. Following the public auction wherein NBSH was determined to be the successful bidder, the Independent Trustees again met telephonically with Management to obtain additional information about the Proposed Acquisition. The Independent Trustees, with the assistance of independent counsel, prepared due diligence requests that were presented to Management and appointed a Task Force of Independent Trustees to lead the due diligence effort ("Task Force").
Management provided written responses to the due diligence requests. After extensive review and analysis and discussions during a telephonic and in person meeting of the Independent Trustees, the Task Force submitted clarifying questions. The Independent Trustees met as a body in person to receive the report of the Task Force and consider the New Agreements. Throughout the process, the Task Force and the Independent Trustees were advised by experienced 1940 Act counsel that is independent of Management and NBSH. In addition, the Independent Trustees received a memorandum from independent counsel discussing the legal standards for their consideration of the New Agreements.
Consideration of the New Agreements followed shortly on the heels of the Independent Trustees' annual consideration of whether to renew the Existing Agreements, carried out pursuant to Section 15(c) of the 1940 Act. In that process, which began prior to the June 2008 quarterly meeting of the Board and was concluded at the September 2008 quarterly meeting, the Independent Trustees, following an extensive review of materials submitted by Management and a report from an
35
independent data service, unanimously determined that the Existing Agreements were fair and reasonable and that their renewal would be in the best interests of the Fund and its shareholders. Accordingly, in considering the New Agreements, the Independent Trustees took into account the fact that the terms of the New Agreements would be identical to those of the Existing Agreements in every respect except for the term and termination date and potentially the name of the investment adviser. The Board considerations in connection with the New Agreements and the Existing Agreements also entered into the decision by the Board to approve the Interim Agreements, which would take effect if the shareholders of the Fund do not approve the New Agreements before the Proposed Acquisition is completed. The Independent Trustees' consideration of the Existing Agreements is described above.
In evaluating the proposed New Agreements, the Independent Trustees considered that they have generally been satisfied with the nature and quality of the services provided to the Fund by Management and LBAM, including investment advisory, administrative and support services, and that the Fund would be best served by an arrangement that appeared likely to maintain the continuity and stability of the providers of these services. Accordingly, the Independent Trustees considered very carefully the intentions of NBSH (including its successors or assign) regarding capitalization, management structure, staffing, compensation and staff retention and whether these seemed designed to provide the desired continuity and stability. They inquired specifically about staffing and resources in the areas of portfolio management, investment research, trading, fund accounting, legal and compliance, internal audit, and senior executive staff. Although at the time the Board considered the New Agreements no final decisions had been reached as to the distribution of equity interests in NBSH (or its successor or assign), the Trustees were advised that senior members of management, including the Fund Trustee and nominee for Fund Trustee who are employed by the Advisers, would receive equity interests in NBSH. Because of these interests, as well as any future employment arrangements with the Advisers, these persons, individually or in the aggregate, could have a material interest in the Proposed Acquisition and in shareholder approval of the New Agreements. In considering the New Agreements, the Trustees were aware of these interests.
The Independent Trustees inquired whether NBSH (or its successors or assign) had specific plans for the future structure of the Neuberger Berman Funds, whether they plan to propose to eliminate any Funds, and whether they intend to continue or alter certain expansion plans that are already underway. They also inquired whether there are plans to change the fees or expense structure of any of the Funds. The Independent Trustees inquired about the long-term plans for the Advisers, including any expectations for cost savings or expense reductions. They also inquired about the capital structure and working capital likely to be available to NBSH (or its successors or assign).
The Independent Trustees considered the following factors, in addition to the factors discussed above, among others, in connection with their consideration of the New Agreements: (1) the nature, extent, and quality of the services provided by Management and LBAM; (2) the performance of the Fund compared to a relevant market index and a peer group of investment companies; (3) the costs of the services provided and profits or losses realized by Management and its affiliates from their relationship with the Fund; (4) the extent to which economies of scale might be realized as the Fund grows; and (5) whether fee levels reflect any such potential economies of scale for the benefit of investors in the Fund. In their deliberations, the Independent Trustees did not identify any particular information that was all important or controlling, and each Trustee may have attributed different weights to the various factors.
In unanimously approving and recommending the New Agreements, the Independent Trustees concluded that the terms of each New Agreement are fair and reasonable and that approval of the New Agreements is in the best interests of the Fund and its shareholders. In reaching this determination, the Independent Trustees considered the following factors, among others:
(1) that the terms of the New Agreements are identical in all material respects to those of the Existing Agreements;
(2) that the Advisers will maintain operational autonomy and continuity of management following the Proposed Acquisition;
(3) the favorable history, reputation, qualification, and background of Management and LBAM, as well as the qualifications of each entity's personnel and each entity's respective financial condition;
(4) the commitment of NBSH (or its successors or assign) to retain key personnel currently employed by Management and LBAM who currently provide services to the Fund;
36
(5) the commitment of NBSH (or its successors or assign) to maintaining the current level and quality of Fund services;
(6) the proposed division of equity in NBSH (or its successor or assign) among Management Members and other personnel upon consummation of the Proposed Acquisition;
(7) the fees and expense ratio of the Fund relative to comparable mutual funds;
(8) that the fees are identical to those paid under the Existing Agreements;
(9) that the fees and expense ratios of the Fund appear to the Board to be reasonable given the quality of services expected to be provided;
(10) the commitment of Management to maintaining the Fund's current contractual expense limitation agreements to ensure that Fund shareholders of funds that have such arrangements in place do not face an increase in expenses upon consummation of the Proposed Acquisition;
(11) the performance of the Fund relative to comparable mutual funds and unmanaged indices;
(12) the commitment of Management (or its successor) to pay the expenses of the Fund in connection with the Proposed Acquisition, including all expenses in connection with the solicitation of proxies, so that shareholders of the Fund would not have to bear such expenses;
(13) the actual and potential effects on the Advisers of the bankruptcy of Lehman Brothers, and the effects of the Lehman Brothers bankruptcy on the information considered by the Independent Trustees in their prior analyses of the principal service contracts;
(14) the provisions made to continue providing to the Advisers certain services that were previously provided to them by or through Lehman Brothers or its other affiliates;
(15) the possible benefits that may be realized by the Fund and by the Advisers as a result of the Proposed Acquisition; and
(16) that the Proposed Acquisition is expected to maintain continuity of management of the Fund and may reduce the potential for future vulnerability to changes in control of the Advisers that could be adverse to the Fund's interests and that could affect the retention of key employees providing services to the Fund.
37

Neuberger Berman
Advisers Management Trust
Small-Cap Growth Portfolio
S Class Shares
Annual Report
December 31, 2008
D0081 02/09
Small-Cap Growth Portfolio Manager's Commentary
The Neuberger Berman Advisers Management Trust (AMT) Small-Cap Growth Portfolio posted a decline in 2008, underperforming its benchmark, the Russell 2000 Growth Index, which also lost ground. During what was the worst year on record for small-cap stocks since 1973, and a year in which value significantly outperformed growth, it was the quality bias in our Portfolio -- which we believe is a key long-term advantage for our strategy -- that held us back versus the index.
During the year, stocks with long-term growth rates over 20% were the worst performers, whereas the slowest growers handed in better results. This growth-rate-based performance differential was a trend that was seen for most of 2008. Our Portfolio slightly outperformed the index during the fourth quarter, but it was not enough to erase the deficit for the year. Still, while disappointing, our overall performance is comparable to that of our small-cap growth peers, who on average underperformed the index by more than 350 basis points, as measured by the Lipper Small Cap Growth Index.
Our strongest performance came from the Energy and Industrials sectors. Within Industrials, Bucyrus, a mining equipment firm, performed well early in the year, and Allegiant Travel, a low-cost leisure air travel company focused on smaller markets, performed well in the second half. Aerovironment also did well. Aerovironment designs and develops fuel-efficient unmanned aircraft used for surveillance, intelligence gathering and reconnaissance. We continue to believe in the longer-term prospects of our prison services theme, which includes companies such as Geo Group and Cornell. Unfortunately, their performance disappointed this year as the weakening economy put public sector projects on hold.
Within Energy, Alpha Natural Resources, an Appalachian coal producer, performed extremely well. Comstock Resources and Plains Exploration and Production, two oil and gas properties companies, also benefited the Portfolio. Looking forward, to avoid being too directly attached to volatile commodity price movements, we are planning to remain sector-neutral in Energy, focusing on well-run companies with good earnings visibility.
Among the biggest detriments to performance was the Information Technology (IT) sector. Negative earnings surprises during the first quarter (before the current team began managing the Portfolio) from certain companies were primarily responsible for our poor performance within IT.
Telecommunication Services was another area of weakness this past year, but because it is an area we currently believe will perform well as the climate begins to improve, we have been selectively adding to holdings within the sector. Among our holdings is SBA Communications, a cell tower company whose performance was poor as a result of what we think are overblown concerns about the company's access to financing.
Within Consumer Staples, typically a defensive area, Central European Distribution, an importer and distributor of alcoholic beverages, was among our poorest performers. We sold the stock after the reporting period.
The Consumer Discretionary sector was also detrimental during the period. We continued to invest in our secondary education theme, but consolidated holdings, selling weaker performers like American Public Education and Capella. However, we continue to hold Strayer Education and ITT Educational Services, both of which performed well. Another segment of the Consumer Discretionary sector we currently find interesting is Gaming, with companies such as WMS Industries, a manufacturer of casino and lottery game terminals. While there is a perceived Gaming industry downturn, casinos must continue to spend on new machines and equipment to remain competitive with one another. We believe WMS Industries will continue to exceed expectations moving forward.
As we look at the coming year, we are more constructive on the outlook for small-cap growth stocks. As such, we have begun selectively shifting the Portfolio away from last year's defensive stance, and beginning to position the Portfolio for a more typical market environment. We are looking for opportunities to add beta to the Portfolio, through investments in companies and sectors that tend to move with the market.
We think the market will turn on positive changes in credit and housing, and we hope to see improvement by the second half of 2009. We believe that once the financial rescue package begins to loosen credit, and as fiscal stimulus begins to flow through the economy, the headwind that impacted small-cap growth stocks in 2008 will begin to dissipate. Despite runs
1
in performance by lower quality stocks, we continue to believe that, longer term, stock selection will be a highly important and that the market will reward companies that possess strong fundamentals and quality growth characteristics. The companies that meet our fundamental criteria generally have strong balance sheets in that they possess good cash flow characteristics and are underleveraged and, therefore, do not have to go to the market for financing; this, we believe, should benefit them on a competitive basis longer term.
Sincerely,

David H. Burshtan
Portfolio Manager
2
Small-Cap Growth Portfolio
SECTOR ALLOCATION
| (% of Equity Market Value) | |
| Energy | | | 6.4 | % | |
| Industrials | | | 14.0 | | |
| Consumer Discretionary | | | 14.3 | | |
| Consumer Staples | | | 6.2 | | |
| Health Care | | | 26.3 | | |
| Financials | | | 6.9 | | |
| Information Technology | | | 19.8 | | |
| Telecomm Service | | | 6.1 | | |
| Total | | | 100.0 | % | |
AVERAGE ANNUAL TOTAL RETURN1
| | | Inception
Date | | 1 Year | | 5 Year | | Life of
Fund* | |
| Small Cap Growth Portfolio Class S | | 07/12/02 | | | (39.47 | %) | | | (5.92 | %) | | | (1.37 | %) | |
| Russell 2000(R)2 | | | | | (33.79 | %) | | | (0.93 | %) | | | 4.15 | % | |
| Russell 2000(R) Growth2 | | | | | (38.54 | %) | | | (2.35 | %) | | | 3.47 | % | |
Performance data quoted represent past performance, which is no guarantee of future results. The investment return and principal value of an investment will fluctuate so that an investor's shares, when redeemed may be worth more or less than their original cost. Results are shown on a "total return" basis and include reinvestment of all dividends and capital gain distributions.
Current performance may be lower or higher than the performance data quoted. For performance data current to the most recent month end, please visit https://www.nb.com.
* Index returns are as of the inception date 7/12/02.
As stated in the Portfolio's most recent prospectus, the total annual fund operating expense ratio for fiscal year 2007 was 1.89% for Class S shares (prior to any fee waivers or expense reimbursements). The net expense ratio was 1.42%. Neuberger Berman Management LLC has contractually agreed to limit certain expenses of the Portfolio through 12/31/2011.
COMPARISON OF A $10,000 INVESTMENT
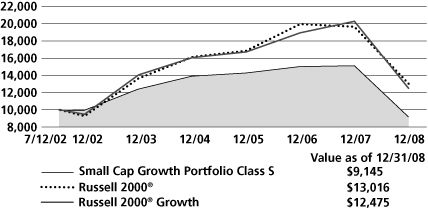
The chart shows the value of a hypothetical $10,000 investment in the Portfolio over the past 10 fiscal years, or since the Portfolio inception, if it has not operated for 10 years. The result is compared with benchmarks, which may include a broad-based market index and/or a narrower index. Please note that market indexes do not include expenses. All results include the reinvestment of dividends and capital gain distributions. Results represent past performance and do not indicate future results. The chart and table do not reflect the deduction of taxes that a shareholder would pay on Portfolio distributions or the redemption of Portfolio shares.
Please see Endnotes for additional information.
3
Endnotes
1 "Total Return" includes reinvestment of all income dividends and capital gain distributions. Results represent past performance and do not indicate future results. The value of an investment in the Portfolio and the return on the investment both will fluctuate, and redemption process may be higher or lower than an investor's original cost. The performance information does not reflect fees and expenses of the variable annuity and variable life insurance policies or the pension plans whose proceeds are invested in the Portfolio. Neuberger Berman Management LLC ("NBM LLC") has agreed to absorb certain expenses of the AMT Portfolios, including the Portfolio. Without this arrangement, which is subject to change, the total returns of the Portfolio may have been less.
2 The Russell 2000(R) Growth Index measures the performance of those Russell 2000(R) Index companies with higher price-to-book ratios and higher forecasted growth values. The Russell 2000(R) Index is an unmanaged index consisting of the securities of the 2000 issuers having the smallest capitalization in the Russell 3000(R) Index, representing approximately 10% of the Russell 3000 total market capitalization. The smallest company's market capitalization was roughly $167 million. The Lipper Variable Annuity Small-Cap Growth Funds Index measures the performance of the thirty largest variable annuity insurance product funds classified as small-cap growth and tracked by Lipper. Lipper classifies funds as small-cap growth if they, by portfolio practice, invest at least 75% of their equity assets in companies with market capitalizations (on a three-year weighted basis) below Lipper's USDE small-cap ceiling. Small-cap growth funds typically have an above-average price-to-earnings ratio, price-to-book ratio, and three-year sales-per-share growth value, compared to the S&P SmallCap 600 Index. Please note that indices do not take into account any fees and expenses of investing in the individual securities that they track and that individuals cannot invest directly in any index. Data about the performance of these indices are prepared or obtained by NBM LLC and include reinvestment of all dividends and capital gain distributions. The Portfolio may invest in many securities not included in the above described indices.
Any ratios or other measurements using a factor of forecasted earnings of a company discussed herein are based on consensus estimates, not NBM LLC's own projections, and they may or may not be realized. In addition, any revision to a forecast could affect the market price of a security. By quoting them herein, NBM LLC does not offer an opinion as to the accuracy of and does not guarantee these forecasted numbers.
The investments for the Portfolio are managed by the same portfolio manager(s) who manage one or more other mutual funds that have similar names, investment objectives and investment styles as the Portfolio. You should be aware that the Portfolio is likely to differ from the other mutual funds in size, cash flow pattern and tax matters.
Accordingly, the holdings and performance of the Portfolio can be expected to vary from those of the other mutual funds.
The composition, industries and holdings of the Portfolio are subject to change.
Shares of the separate AMT Portfolios are sold only through the currently effective prospectus and are not available to the general public. Shares of this Portfolio may be purchased only by life insurance companies to be used with their separate accounts that fund variable annuity and variable life insurance policies and by qualified pension and retirement plans.
(c) 2009 Neuberger Berman Management LLC distributor. All rights reserved.
4
Information About Your Fund's Expenses
This table is designed to provide information regarding costs related to your investments. All mutual funds incur operating expenses, which include management fees, fees for administrative services and costs of shareholder reports, among others. The following examples are based on an investment of $1,000 made at the beginning of the six month period ended December 31, 2008 and held for the entire period. The table illustrates the fund's costs in two ways:
| Actual Expenses and Performance: | | The first section of the table provides information about actual account values and actual expenses in dollars, based on the fund's actual performance during the period. You may use the information in this line, together with the amount you invested, to estimate the expenses you paid over the period. Simply divide your account value by $1,000 (for example, an $8,600 account value divided by $1,000 = 8.6), then multiply the result by the number in the first section of the table under the heading entitled "Expenses Paid During the Period" to estimate the expenses you paid over the period. | |
|
Hypothetical Example for
Comparison Purposes: | | The second section of the table provides information about hypothetical account values and hypothetical expenses based on the fund's actual expense ratio and an assumed rate of return at 5% per year before expenses. This return is not the fund's actual return. The hypothetical account values and expenses may not be used to estimate the actual ending account balance or expenses you paid for the period. You may use this information to compare the ongoing costs of investing in this fund versus other funds. To do so, compare the expenses shown in this 5% hypothetical example with the 5% hypothetical examples that appear in the shareholder reports of other funds. | |
|
Please note that the expenses in the table are meant to highlight your ongoing costs only. The table and the expense example do not include any transactional costs, such as fees and expenses that are, or may be, imposed under your variable contract or qualified pension plan. Therefore, the information under the heading "Hypothetical (5% annual return before expenses)" is useful in comparing ongoing costs only, and will not help you determine the relative total costs of owning different funds. In addition, if these transactional costs were included, your costs would have been higher.
Expense Information as of 12/31/08 (Unaudited)
NEUBERGER BERMAN ADVISERS MANAGEMENT TRUST SMALL-CAP GROWTH PORTFOLIO
| Actual | | Beginning Account
Value
7/1/08 | | Ending Account
Value
12/31/08 | | Expenses Paid During
the Period*
7/1/08 -
12/31/08 | |
| Class S | | $ | 1,000.00 | | | $ | 642.00 | | | $ | 5.86 | | |
| Hypothetical (5% annual return before expenses)** | |
| Class S | | $ | 1,000.00 | | | $ | 1,018.00 | | | $ | 7.20 | | |
* Expenses are equal to the annualized expense ratio of 1.42%, multiplied by the average account value over the period, multiplied by 184/366 (to reflect the one-half year period shown).
** Hypothetical 5% annual return before expenses is calculated by multiplying the number of days in the most recent half year divided by 366.
5
Schedule of Investments Small-Cap Growth Portfolio
| NUMBER OF SHARES | | | | MARKET VALUEt | |
| Common Stocks (99.1%) | | | |
| Aerospace & Defense (4.5%) | | | |
| | 5,400 | | | Aerovironment Inc. | | $ | 198,774 | *E | |
| | 3,800 | | | Axsys Technologies | | | 208,468 | * | |
| | 4,000 | | | HEICO Corp. | | | 155,320 | | |
| | | | 562,562 | | |
| Airlines (2.4%) | | | |
| | 3,900 | | | Allegiant Travel | | | 189,423 | * | |
| | 6,400 | | | Continental Airlines Class B | | | 115,584 | * | |
| | | | 305,007 | | |
| Beverages (1.6%) | | | |
| | 10,200 | | | Central European Distribution | | | 200,940 | * | |
| Biotechnology (6.0%) | | | |
| | 5,300 | | | Cubist Pharmaceuticals | | | 128,048 | * | |
| | 7,700 | | | Emergent Biosolutions | | | 201,047 | * | |
| | 5,800 | | | Martek Biosciences | | | 175,798 | * | |
| | 3,700 | | | Myriad Genetics | | | 245,162 | * | |
| | | | 750,055 | | |
| Capital Markets (5.3%) | | | |
| | 2,600 | | | Greenhill & Co. | | | 181,402 | E | |
| | 8,000 | | | KBW Inc. | | | 184,000 | *E | |
| | 13,200 | | | Riskmetrics Group | | | 196,548 | * | |
| | 2,300 | | | Stifel Financial | | | 105,455 | * | |
| | | | 667,405 | | |
| Commercial Banks (1.5%) | | | |
| | 6,000 | | | PrivateBancorp, Inc. | | | 194,760 | E | |
| Commercial Services & Supplies (4.5%) | | | |
| | 2,800 | | | Clean Harbors | | | 177,632 | * | |
| | 9,500 | | | Cornell Companies | | | 176,605 | * | |
| | 11,500 | | | Geo Group | | | 207,345 | * | |
| | | | 561,582 | | |
| Communications Equipment (3.0%) | | | |
| | 10,800 | | | Avocent Corp. | | | 193,428 | * | |
| | 7,900 | | | F5 Networks | | | 180,594 | * | |
| | | | 374,022 | | |
| Diversified Consumer Services (6.0%) | | | |
| | 4,200 | | | DeVry, Inc. | | | 241,122 | | |
| | 2,700 | | | ITT Educational Services | | | 256,446 | * | |
| | 1,200 | | | Strayer Education | | | 257,292 | | |
| | | | 754,860 | | |
| NUMBER OF SHARES | | | | MARKET VALUEt | |
Electronic Equipment,
Instruments & Components (1.5%) | | | |
| | 13,500 | | | Cogent Inc. | | $ | 183,195 | * | |
| Food & Staples Retailing (1.3%) | | | |
| | 4,700 | | | BJ's Wholesale Club | | | 161,022 | * | |
| Food Products (1.7%) | | | |
| | 4,400 | | | Diamond Foods | | | 88,660 | | |
| | 5,200 | | | Flowers Foods | | | 126,672 | | |
| | | | 215,332 | | |
| Health Care Equipment & Supplies (8.7%) | | | |
| | 5,600 | | | Greatbatch, Inc. | | | 148,176 | * | |
| | 6,100 | | | Immucor Inc. | | | 162,138 | * | |
| | 6,700 | | | Masimo Corp. | | | 199,861 | * | |
| | 7,100 | | | Meridian Bioscience | | | 180,837 | | |
| | 5,600 | | | NuVasive, Inc. | | | 194,040 | * | |
| | 5,500 | | | ResMed Inc. | | | 206,140 | * | |
| | | | 1,091,192 | | |
| Health Care Providers & Services (4.2%) | | | |
| | 3,500 | | | Almost Family | | | 157,430 | * | |
| | 4,300 | | | athenahealth Inc. | | | 161,766 | * | |
| | 5,700 | | | LHC Group | | | 205,200 | * | |
| | | | 524,396 | | |
| Health Care Technology (1.5%) | | | |
| | 12,600 | | | MedAssets Inc. | | | 183,960 | * | |
| Hotels, Restaurants & Leisure (4.4%) | | | |
| | 6,700 | | | Bally Technologies | | | 161,001 | * | |
| | 2,300 | | | Panera Bread | | | 120,152 | *E | |
| | 10,100 | | | WMS Industries | | | 271,690 | * | |
| | | | 552,843 | | |
| Internet Software & Services (5.9%) | | | |
| | 4,500 | | | Equinix, Inc. | | | 239,355 | *E | |
| | 11,200 | | | IAC/ InterActiveCorp | | | 176,176 | * | |
| | 15,800 | | | Omniture, Inc. | | | 168,112 | * | |
| | 8,500 | | | Vocus, Inc. | | | 154,785 | * | |
| | | | 738,428 | | |
| IT Services (1.2%) | | | |
| | 3,200 | | | Alliance Data Systems | | | 148,896 | * | |
| Life Science Tools & Services (1.5%) | | | |
| | 2,960 | | | Techne Corp. | | | 190,979 | | |
See Notes to Schedule of Investments 6
| NUMBER OF SHARES | | | | MARKET VALUEt | |
| Oil, Gas & Consumable Fuels (6.3%) | | | |
| | 7,300 | | | Arena Resources | | $ | 205,057 | * | |
| | 5,400 | | | Comstock Resources | | | 255,150 | * | |
| | 9,000 | | | Concho Resources | | | 205,380 | * | |
| | 5,600 | | | Plains Exploration &
Production | | | 130,144 | * | |
| | | | 795,731 | | |
| Personal Products (1.5%) | | | |
| | 2,700 | | | Chattem, Inc. | | | 193,131 | *E | |
| Pharmaceuticals (4.2%) | | | |
| | 17,800 | | | Optimer Pharmaceuticals | | | 215,558 | * | |
| | 4,800 | | | Perrigo Co. | | | 155,088 | | |
| | 11,900 | | | ViroPharma Incorporated | | | 154,938 | * | |
| | | | 525,584 | | |
| Road & Rail (1.1%) | | | |
| | 4,800 | | | Old Dominion Freight Line | | | 136,608 | *E | |
Semiconductors & Semiconductor
Equipment (4.0%) | | | |
| | 5,300 | | | Hittite Microwave | | | 156,138 | * | |
| | 5,300 | | | Silicon Laboratories | | | 131,334 | * | |
| | 11,600 | | | Varian Semiconductor
Equipment | | | 210,192 | * | |
| | | | 497,664 | | |
| Software (4.1%) | | | |
| | 6,000 | | | ANSYS, Inc. | | | 167,340 | * | |
| | 5,300 | | | Concur Technologies | | | 173,946 | *E | |
| | 16,900 | | | Nuance Communications | | | 175,084 | * | |
| | | | 516,370 | | |
| Specialty Retail (3.7%) | | | |
| | 8,500 | | | GameStop Corp. Class A | | | 184,110 | * | |
| | 4,500 | | | Gymboree Corp. | | | 117,405 | * | |
| | 4,700 | | | Tractor Supply | | | 169,858 | *E | |
| | | | 471,373 | | |
| Trading Companies & Distributors (1.4%) | | | |
| | 12,700 | | | Beacon Roofing Supply | | | 176,276 | * | |
| Wireless Telecommunication Services (6.1%) | | | |
| | 10,100 | | | Leap Wireless International | | | 271,589 | * | |
| | 30,100 | | | SBA Communications | | | 491,232 | * | |
| | | | 762,821 | | |
| |
| | | Total Common Stocks
(Cost $12,787,221) | | | 12,436,994 | | |
| NUMBER OF SHARES | | | | MARKET VALUEt | |
| Short-Term Investments (14.4%) | |
| | 539,539 | | | Neuberger Berman Prime
Money Fund Trust Class | | $ | 539,539 | aoo | |
| | 1,274,335 | | | Neuberger Berman Securities
Lending Quality Fund, LLC | | | 1,274,335 | t | |
| | Total Short-Term Investments
(Cost $1,813,874) | | | 1,813,874 | | |
| | Total Investments (113.5%)
(Cost $14,601,095) | | | 14,250,868 | ## | |
| | | Liabilities, less cash, receivables
and other assets [(13.5%)] | | | (1,695,408 | ) | |
| | | Total Net Assets (100.0%) | | $ | 12,555,460 | | |
See Notes to Schedule of Investments 7
Notes to Schedule of Investments Small-Cap Growth Portfolio
t Investments in equity securities by Neuberger Berman Advisers Management Trust Small-Cap Growth Portfolio (the "Fund") are valued by an independent pricing service. The independent pricing service values equity securities at the latest sale price where that price is readily available. Securities traded primarily on the NASDAQ Stock Market are normally valued by the Fund at the NASDAQ Official Closing Price ("NOCP") provided by NASDAQ each business day. The NOCP is the most recently reported price as of 4:00:02 p.m., Eastern time, unless that price is outside the range of the "inside" bid and asked prices (i.e., the bid and asked prices that dealers quote to each other when trading for their own accounts); in that case, NASDAQ will adjust the price to equal the inside bid or asked price, whichever is closer. Because of delays in reporting trades, the NOCP may not be based on the price of the last trade to occur before the market closes. If there is no reported sale of a security on a particular day, the independent pricing service may value the security based on reported market quotations. If a valuation is not available from an independent pricing service, the Fund seeks to obtain quotations from principal market makers. If such quotations are not readily available, securities are valued using methods the Board of Trustees of Neuberger Berman Advisers Management Trust (the "Board") has approved on the belief that they reflect fair value. Numerous factors may be considered when determining the fair value of a security, including available analyst, media or other reports, trading in futures or ADRs and whether the issuer of the security being fair valued has other securities outstanding. Foreign security prices are furnished by independent quotation services and expressed in local currency values. Foreign security prices are currently translated from the local currency into U.S. dollars using the exchange rate as of 4:00 p.m., Eastern time. The Board has approved the use of Interactive Data Pricing and Reference Data, Inc. ("Interactive") to assist in determining the fair value of the Fund's foreign equity securities when changes in the value of a certain index suggest that the closing prices on the foreign exchanges may no longer represent the amount that the Fund could expect to receive for those securities. In this event, Interactive will provide adjusted prices for certain foreign equity securities using a statistical analysis of historical correlations of multiple factors. In the absence of precise information about the market values of these foreign securities as of the close of the New York Stock Exchange, the Board has determined on the basis of available data that prices adjusted in this way are likely to be closer to the prices the Fund could realize on a current sale than are the prices of those securities established at the close of the foreign markets in which the securities primarily trade. Fair value prices are necessarily estimates, and there is no assurance that such a price will be at or close to the price at which the security next trades. Short-term debt securities with less than 60 days until maturity may be valued at cost which, when combined with interest earned, approximates market value.
The Fund adopted Financial Accounting Standards Board ("FASB") Statement of Financial Accounting Standards No. 157, Fair Value Measurements ("FAS 157"), effective January 1, 2008. In accordance with FAS 157, "fair value" is defined as the price that a Fund would receive upon selling an investment in an orderly transaction to an independent buyer in the principal or most advantageous market for the investment. Various inputs are used in determining the value of the Fund's investments.
In addition to defining fair value, FAS 157 established a three-tier hierarchy of inputs to establish a classification of fair value measurements for disclosure purposes. The three-tier hierarchy of inputs is summarized in the three broad Levels listed below.
. Level 1 - quoted prices in active markets for identical investments
. Level 2 - other significant observable inputs (including quoted prices for similar investments, interest rates, prepayment speeds, credit risk, amortized cost, etc.)
. Level 3 - significant unobservable inputs (including the Fund's own assumptions in determining the fair value of investments)
The inputs or methodology used for valuing an investment are not necessarily an indication of the risk associated with investing in those securities.
See Notes to Financial Statements 8
Notes to Schedule of Investments Small-Cap Growth Portfolio (cont'd)
The following is a summary of the inputs used to value the Fund's investments as of December 31, 2008:
| Valuation Inputs | | Investments in
Securities | |
| Level 1 - Quoted Prices | | $ | 14,250,868 | | |
| Level 2 - Other Significant Observable Inputs | | | -- | | |
| Level 3 - Significant Unobservable Inputs | | | -- | | |
| Total | | $ | 14,250,868 | | |
## At December 31, 2008, the cost of investments for U.S. federal income tax purposes was $15,667,968. Gross unrealized appreciation of investments was $846,508 and gross unrealized depreciation of investments was $2,263,608, resulting in net unrealized depreciation of $1,417,100 based on cost for U.S. federal income tax purposes.
* Security did not produce income during the last twelve months.
E All or a portion of this security is on loan (see Note A of Notes to Financial Statements).
t Managed by an affiliate of Neuberger Berman Management LLC and could be deemed an affiliate of the Fund and is segregated in connection with obligations for security lending (see Notes A & F of Notes to Financial Statements).
a Neuberger Berman Prime Money Fund ("Prime Money") is also managed by Neuberger Berman Management LLC and may be considered an affiliate since it has the same officers, Board members, and investment manager as the Fund and because, at times, the Fund may own 5% or more of the outstanding voting securities of Prime Money (see Notes A & F of Notes to Financial Statements).
oo All or a portion of this security is segregated in connection with obligations for security lending.
See Notes to Financial Statements 9
Statement of Assets and Liabilities
Neuberger Berman Advisers Management Trust
| | | SMALL-CAP
GROWTH
PORTFOLIO | |
| | | December 31, 2008 | |
| Assets | |
| Investments in securities, at market value *t(Notes A & F)-see Schedule of Investments: | |
| Unaffiliated issuers | | $ | 12,436,994 | | |
| Affiliated issuers | | | 1,813,874 | | |
| | | | 14,250,868 | | |
| Dividends and interest receivable | | | 780 | | |
| Receivable for securities sold | | | 201,043 | | |
| Receivable for Fund shares sold | | | 77,745 | | |
| Receivable from administrator-net (Note B) | | | 11,127 | | |
| Receivable for securities lending income (Note A) | | | 2,635 | | |
| Total Assets | | | 14,544,198 | | |
| Liabilities | |
| Payable for collateral on securities loaned (Note A) | | | 1,292,471 | | |
| Payable for securities purchased | | | 391,190 | | |
| Payable for Fund shares redeemed | | | 242,617 | | |
| Payable to investment manager-net (Notes A & B) | | | 9,375 | | |
| Payable for securities lending fees (Note A) | | | 3,612 | | |
| Accrued expenses and other payables | | | 49,473 | | |
| Total Liabilities | | | 1,988,738 | | |
| Net Assets at value | | $ | 12,555,460 | | |
| Net Assets consist of: | |
| Paid-in capital | | $ | 21,525,904 | | |
| Accumulated net realized gains (losses) on investments | | | (8,620,217 | ) | |
| Net unrealized appreciation (depreciation) in value of investments | | | (350,227 | ) | |
| Net Assets at value | | $ | 12,555,460 | | |
| Shares Outstanding ($.001 par value; unlimited shares authorized) | | | 1,503,231 | | |
| Net Asset Value, offering and redemption price per share | | $ | 8.35 | | |
| tSecurities on loan, at market value: | |
| Unaffiliated issuers | | $ | 1,265,603 | | |
| *Cost of Investments: | |
| Unaffiliated issuers | | $ | 12,787,221 | | |
| Affiliated issuers | | | 1,813,874 | | |
| Total cost of investments | | $ | 14,601,095 | | |
See Notes to Financial Statements 10
Statement of Operations
Neuberger Berman Advisers Management Trust
| | | SMALL-CAP
GROWTH
PORTFOLIO | |
| | | For the
Year Ended
December 31, 2008 | |
| Investment Income: | |
| Income (Note A): | |
| Dividend income--unaffiliated issuers | | $ | 81,592 | | |
| Interest income--unaffiliated issuers | | | 5 | | |
| Income from securities loaned--net (Note F) | | | 10,442 | | |
| Income from investments in affiliated issuers (Note F) | | | 26,864 | | |
| Foreign taxes withheld | | | (453 | ) | |
| Total income | | $ | 118,450 | | |
| Expenses: | |
| Investment management fees (Notes A & B) | | | 199,813 | | |
| Administration fees (Note B) | | | 70,522 | | |
| Distribution fees (Note B) | | | 58,768 | | |
| Audit fees | | | 40,493 | | |
| Custodian fees (Note B) | | | 26,712 | | |
| Insurance expense | | | 672 | | |
| Legal fees | | | 4,707 | | |
| Shareholder reports | | | 18,275 | | |
| Trustees' fees and expenses | | | 38,131 | | |
| Miscellaneous | | | 7,470 | | |
| Total expenses | | | 465,563 | | |
| Expenses reimbursed by administrator (Note B) | | | (129,472 | ) | |
| Investment management fees waived (Note A) | | | (727 | ) | |
| Expenses reduced by custodian fee expense offset and commission recapture arrangements (Note B) | | | (1,777 | ) | |
| Total net expenses | | | 333,587 | | |
| Net investment income (loss) | | $ | (215,137 | ) | |
| Realized and Unrealized Gain (Loss) on Investments (Note A) | |
| Net realized gain (loss) on: | |
| Sales of investment securities of unaffiliated issuers | | | (8,172,787 | ) | |
| Sales of investment securities of affiliated issuers | | | (18,136 | ) | |
| Foreign currency | | | (15 | ) | |
| Net increase from payments by affiliates (Note B) | | | 6,628 | | |
| Change in net unrealized appreciation (depreciation) in value of: | |
| Unaffiliated investment securities | | | (3,032,887 | ) | |
| Net gain (loss) on investments | | | (11,217,197 | ) | |
| Net increase (decrease) in net assets resulting from operations | | $ | (11,432,334 | ) | |
See Notes to Financial Statements 11
Statements of Changes in Net Assets
Neuberger Berman Advisers Management Trust
| | | SMALL-CAP GROWTH PORTFOLIO | |
| | | Year Ended
December 31,
2008 | | Year Ended
December 31,
2007 | |
| Increase (Decrease) in Net Assets: | |
| From Operations: | |
| Net investment income (loss) | | $ | (215,137 | ) | | $ | (113,191 | ) | |
| Net realized gain (loss) on investments | | | (8,190,938 | ) | | | 381,368 | | |
| Net increase from payments by affiliates (Note B) | | | 6,628 | | | | - | | |
| Change in net unrealized appreciation (depreciation) of investments | | | (3,032,887 | ) | | | (311,118 | ) | |
| Net increase (decrease) in net assets resulting from operations | | | (11,432,334 | ) | | | (42,941 | ) | |
| Distributions to Shareholders From (Note A): | |
| Net realized gain on investments | | | (805,076 | ) | | | (213,518 | ) | |
| Tax return of capital | | | (161 | ) | | | - | | |
| Total distributions to shareholders | | | (805,237 | ) | | | (213,518 | ) | |
| From Fund Share Transactions (Note D): | |
| Proceeds from shares sold | | | 16,597,016 | | | | 13,199,395 | | |
| Proceeds from reinvestment of dividends and distributions | | | 805,237 | | | | 213,518 | | |
| Payments for shares redeemed | | | (19,344,752 | ) | | | (10,618,749 | ) | |
| Net increase (decrease) from Fund share transactions | | | (1,942,499 | ) | | | 2,794,164 | | |
| Net Increase (Decrease) in Net Assets | | | (14,180,070 | ) | | | 2,537,705 | | |
| Net Assets: | |
| Beginning of year | | | 26,735,530 | | | | 24,197,825 | | |
| End of year | | $ | 12,555,460 | | | $ | 26,735,530 | | |
| Undistributed net investment income (loss) at end of year | | $ | - | | | $ | - | | |
See Notes to Financial Statements 12
Notes to Financial Statements Small-Cap Growth Portfolio
Note A--Summary of Significant Accounting Policies:
1 General: Small-Cap Growth Portfolio (formerly, Fasciano Portfolio) (the "Fund") is a separate operating series of Neuberger Berman Advisers Management Trust (the "Trust"), a Delaware statutory trust organized pursuant to a Trust Instrument dated May 23, 1994. The Trust is currently comprised of ten separate operating series (each a "Series," collectively, the "Funds") each of which is diversified. The Trust is registered as an open-end management investment company under the Investment Company Act of 1940, as amended (the "1940 Act"), and its shares are registered under the Securities Act of 1933, as amended. The Fund currently offers only Class S shares. The Board of Trustees of the Trust (the "Board") may establish additional series or classes of shares without the approval of shareholders.
The assets of each Series belong only to that Series, and the liabilities of each Series are borne solely by that Series and no other.
The preparation of financial statements in accordance with U.S. generally accepted accounting principles requires Neuberger Berman Management LLC ("Management") to make estimates and assumptions at the date of the financial statements. Actual results could differ from those estimates.
Management, the investment manager of the Fund, and Neuberger Berman, LLC ("Neuberger"), the Fund's sub-adviser, are wholly owned subsidiaries of Lehman Brothers Holdings Inc. ("Lehman Brothers"), a publicly owned holding company. On September 15, 2008, Lehman Brothers filed a voluntary petition under Chapter 11 of the U.S. Bankruptcy Code. On December 3, 2008, NBSH Acquisition, LLC ("NBSH"), an entity organized by key members of Neuberger Berman's senior management, was selected as the successful bidder in the public auction to acquire a majority interest in Neuberger Berman's business and the fixed income and certain alternative asset management businesses of Lehman Brothers' Investment Management Division (together with Neuberger Berman, the "Acquired Businesses") (the "Proposed Acquisition"). On December 22, 2008, the bankruptcy court having jurisdiction over the Lehman Brothers matter approved the sale of the Acquired Businesses to NBSH (or its successor or assign), as the successful bidder. At the closing of the Proposed Acquisition, a majority interest in the Acquired Businesses will be directly or indirectly owned by portfolio managers, Neuberger Berman's management team and certain key members and senior professionals of the former Investment Management Division, as well as by Lehman Brothers and certain affiliates of Lehman Brothers. The transaction is subject to certain conditions and approvals.
These events, while affecting Lehman Brothers, have not had a material impact on the Fund or its operations. Management and Neuberger will continue to operate in the ordinary course of business as the investment manager and sub-adviser of the Fund.
Included in the Acquired Businesses are Management and Neuberger. The consummation of the Proposed Acquisition has been deemed to result in an "assignment" of the Fund's Management and Sub-Advisory Agreements which would, by law, automatically terminate those agreements. Accordingly, the Board, including the Trustees who are not "interested persons" of the Fund's investment manager and its affiliates or the Fund, has approved the new Management Agreements and Sub-Advisory Agreements for the Fund. The new agreements also will require the approval of the Fund's shareholders.
2 Portfolio valuation: Investment securities are valued as indicated in the notes following the Schedule of Investments.
3 Foreign currency translation: The accounting records of the Fund are maintained in U.S. dollars. Foreign currency amounts are currently translated into U.S. dollars using the exchange rates as of 4:00 p.m., Eastern time, to determine the value of investments, assets and liabilities. Purchase and sale prices of securities, and income and expenses, are translated into U.S. dollars at the prevailing rate of exchange on the respective dates of such transactions. Net unrealized foreign currency gain (loss) arises from changes in the value of assets and liabilities,
13
other than investments in securities, as a result of changes in exchange rates and is stated separately in the Statement of Operations. Included in net realized gain (loss) on investments are proceeds from the settlements of class action litigation in which the Fund participated as a plaintiff. The amount of such proceeds for the year ended December 31, 2008 was $238.
4 Securities transactions and investment income: Securities transactions are recorded on trade date for financial reporting purposes. Dividend income is recorded on the ex-dividend date or, for certain foreign dividends, as soon as the Fund becomes aware of the dividends. Non-cash dividends included in dividend income, if any, are recorded at the fair market value of the securities received. Interest income, including accretion of original issue discount, where applicable, and accretion of discount on short-term investments, is recorded on the accrual basis. Realized gains and losses from securities transactions and foreign currency transactions, if any, are recorded on the basis of identified cost and stated separately in the Statement of Operations.
5 Income tax information: The Funds are treated as separate entities for U.S. federal income tax purposes. It is the policy of the Fund to continue to qualify as a regulated investment company by complying with the requirements of Subchapter M of the Internal Revenue Code applicable to regulated investment companies and to distribute substantially all of its earnings to its shareholders. Therefore, no federal income or excise tax provision is required.
The Fund has adopted the provisions of Financial Accounting Standards Board Interpretation No. 48 ("FIN 48") "Accounting for Uncertainty in Income Taxes - an interpretation of FASB Statement No. 109". FIN 48 sets forth a minimum threshold for financial statement recognition of the benefit of a tax position taken, or expected to be taken, in a tax return. The Fund recognizes interest and penalties, if any, related to unrecognized tax benefits as an income tax expense in the Statement of Operations. The Fund is subject to examination by U.S. federal and state tax authorities for returns filed for the prior three fiscal years 2005 - 2007. As of December 31, 2008, the Fund did not have any unrecognized tax benefits.
Income distributions and capital gain distributions are determined in accordance with income tax regulations, which may differ from U.S. generally accepted accounting principles. These differences are primarily due to differing treatments of income and gains on various investment securities held by the Fund, timing differences and differing characterization of distributions made by the Fund as a whole. The Fund may also utilize earnings and profits distributed to shareholders on redemption of shares as a part of the dividends paid deduction for income tax purposes.
As determined on December 31, 2008, permanent differences resulting primarily from different book and tax accounting for net operating losses and foreign currency gains and losses were reclassified at fiscal year-end. These reclassifications had no effect on net income, net asset value or net asset value per share of the Fund.
The tax character of distributions paid during the years ended December 31, 2008 and December 31, 2007 was as follows:
| Ordinary Income | | Long-Term Capital Gain | | Return of Capital | | Total | |
| 2008 | | 2007 | | 2008 | | 2007 | | 2008 | | 2007 | | 2008 | | 2007 | |
| $ | -- | | | $ | -- | | | $ | 805,076 | | | $ | 213,518 | | | $ | 161 | | | $ | -- | | | $ | 805,237 | | | $ | 213,518 | | |
As of December 31, 2008, the components of distributable earnings (accumulated losses) on a U.S. federal income tax basis were as follows:
Unrealized
Appreciation
(Depreciation) | | Loss Carryforwards
and Deferrals | | Total | |
| $ | (1,417,100 | ) | | $ | (7,553,344 | ) | | $ | (8,970,444 | ) | |
The difference between book basis and tax basis distributable earnings is attributable primarily to timing differences of wash sales, partnership basis adjustments, capital loss carryforwards and post October loss deferral.
14
To the extent the Fund's net realized capital gains, if any, can be offset by capital loss carryforwards, it is the policy of the Fund not to distribute such gains. As determined at December 31, 2008, the Fund had unused capital loss carryforwards available for federal income tax purposes to offset net realized capital gains, if any, as follows:
| Expiring In: | |
| 2016 | |
| $ | 4,974,217 | | |
Under current tax law, certain net capital and net foreign currency losses realized after October 31 within the taxable year may be deferred and treated as occurring on the first day of the following tax year. For the year ended December 31, 2008, the Fund elected to defer $2,579,127 of net capital losses.
6 Distributions to shareholders: The Fund may earn income, net of expenses, daily on its investments. Distributions from net investment income and net realized capital gains, if any, generally are distributed in October. Income distributions and capital gain distributions to shareholders are recorded on the ex-date.
7 Foreign taxes: Foreign taxes withheld represent amounts withheld by foreign tax authorities, net of refunds recoverable.
8 Expense allocation: Certain expenses are applicable to multiple funds. Expenses directly attributable to a Series are charged to that Series. Expenses of the Trust that are not directly attributed to a Series are allocated among the Funds, on the basis of relative net assets, except where a more appropriate allocation of expenses to each of the Funds can otherwise be made fairly. Expenses borne by the complex of related investment companies, which includes open-end and closed-end investment companies for which Management serves as investment manager, that are not directly attributed to a Series or the Trust are allocated among the Fund and the other investment companies in the complex or series thereof on the basis of relative net assets, except where a more appropriate allocation of expenses to each investment company in the complex or series thereof can otherwise be made fairly.
9 Security lending: A third party, eSecLending, has assisted the Fund in conducting a bidding process to identify agents/principals that would pay a guaranteed amount to the Fund in consideration of the Fund entering into an exclusive securities lending arrangement.
eSecLending currently serves as exclusive lending agent for the Fund. Under the securities lending arrangement, the Fund receives cash collateral at the beginning of each transaction equal to at least 102% of the prior day's market value of the loaned securities (105% in the case of international securities). The Fund may invest all the cash collateral in Neuberger Berman Securities Lending Quality Fund, LLC ("Quality Fund"), a fund managed by Lehman Brothers Asset Management LLC ("LBAM"), an affiliate of Management.
At various times during the course of the Fund's fiscal year ended December 31, 2008, the Quality Fund's NAV was below $1.00 per share, which could have affected the NAV of the Fund with securities loans outstanding during the period. The Quality Fund's price per share on December 31, 2008 was $1.00. The market value of the Fund's investments in the Quality Fund as of that date, if any, is reflected in the Fund's Schedule of Investments. If it were necessary to liquidate assets in the Quality Fund to meet returns on outstanding securities loans at a time when the Quality Fund's price per share was less than $1.00, the Fund may not receive an amount from the Quality Fund that is equal in amount to the collateral the Fund would be required to return to the borrower of the securities and the Fund would be required to make up for this shortfall. In addition, as a result of recent reduced liquidity in the credit and fixed income markets, it may be difficult to dispose quickly of some securities in the Quality Fund at the price at which the Quality Fund is carrying them. The Quality Fund is not a money market fund that operates in accordance with Rule 2a-7 under the 1940 Act and there is no assurance that it will maintain a $1.00 share price.
Net income from the lending program represents the guaranteed amount received from a principal plus income earned on the cash collateral invested in Quality Fund or in other investments, less cash collateral fees and other expenses associated with the loans. For the fiscal year ended December 31, 2008, the Fund received net income under the securities lending arrangement of $10,442, which is reflected in the Statement of Operations under the caption "Income from securities loaned-net." For the fiscal year ended December 31, 2008, "Income from
15
securities loaned--net" consisted of $98,899 in income earned on cash collateral and guaranteed amounts (including $85,501 of interest income earned from the Quality Fund), less fees and expenses paid of $88,457.
10 Repurchase agreements: The Fund may enter into repurchase agreements with institutions that Management has determined are creditworthy. Each repurchase agreement is recorded at cost. The Fund requires that the securities purchased in a repurchase agreement be transferred to the custodian in a manner sufficient to enable the Fund to assert a perfected security interest in those securities in the event of a default under the repurchase agreement. The Fund monitors, on a daily basis, the value of the securities transferred to ensure that their value, including accrued interest, is greater than amounts owed to the Fund under each such repurchase agreement.
11 Transactions with other funds managed by Neuberger Berman Management LLC: Pursuant to an Exemptive Order issued by the Securities and Exchange Commission, the Fund may invest in a money market fund managed by Management or an affiliate. The Fund invests in Neuberger Berman Prime Money Fund ("Prime Money"), as approved by the Board. Prime Money seeks to provide the highest available current income consistent with safety and liquidity. For any cash that the Fund invests in Prime Money, Management waives a portion of its management fee equal to the management fee it receives from Prime Money on those assets (the "Arrangement"). For the year ended December 31, 2008, management fees waived under this Arrangement amounted to $727 and are reflected in the Statement of Operations under the caption "Investment management fees waived." For the year ended December 31, 2008, income earned under this Arrangement amounted to $26,864 and is reflected in the Statement of Operations under the caption "Income from investments in affiliated issuers."
12 Indemnifications: Like many other companies, the Trust's organizational documents provide that its officers and trustees are indemnified against certain liabilities arising out of the performance of their duties to the Trust. In addition, both in some of its principal service contracts and in the normal course of its business, the Trust enters into contracts that provide indemnifications to other parties for certain types of losses or liabilities. The Trust's maximum exposure under these arrangements is unknown as this could involve future claims against the Trust.
Note B--Management Fees, Administration Fees, Distribution Arrangements, and Other Transactions With Affiliates:
Fund shares are issued and redeemed in connection with investments in and payments under certain variable annuity contracts and variable life insurance policies issued through separate accounts of life insurance companies and are also offered directly to qualified pension and retirement plans.
The Fund retains Management as its investment manager under a Management Agreement. For such investment management services, the Fund pays Management a fee at the annual rate of 0.85% of the first $500 million of the Fund's average daily net assets, 0.825% of the next $500 million, 0.80% of the next $500 million, 0.775% of the next $500 million, 0.75% of the next $500 million, and 0.725% of average daily net assets in excess of $2.5 billion.
The Fund retains Management as its administrator under an Administration Agreement. The Fund pays Management an administration fee at the annual rate of 0.30% of its average daily net assets under this agreement. Additionally, Management retains State Street Bank and Trust Company ("State Street") as its sub-administrator under a Sub-Administration Agreement. Management pays State Street a fee for all services received under this agreement.
Management acts as agent in arranging for the sale of Fund shares without commission and bears advertising and promotion expenses. The Board has adopted a distribution plan (the "Plan") with respect to the Fund, pursuant to Rule 12b-1 under the 1940 Act. The Plan provides that, as compensation for administrative and other services provided to the Fund, Management's activities and expenses related to the sale and distribution of the Fund's shares, and ongoing services provided to investors in the Fund, Management receives from the Fund a fee at the annual rate of 0.25% of the Fund's average daily net assets. Management receives this amount to provide distribution and shareholder servicing for the Fund and pays a portion of it to institutions that provide such services. Those institutions may use the payments for, among other purposes, compensating employees engaged in sales and/or shareholder servicing. The amount of fees paid by the Fund during any year may be more or less than
16
the cost of distribution and other services provided to the Fund. FINRA rules limit the amount of annual distribution fees that may be paid by a mutual fund and impose a ceiling on the cumulative distribution fees paid. The Trust's Plan complies with those rules.
Management has contractually undertaken through December 31, 2011 to forgo current payment of fees and/or reimburse the Fund for its operating expenses (including the fees payable to Management but excluding interest, taxes, brokerage commissions, extraordinary expenses, and transaction costs) ("Operating Expenses") which exceed, in the aggregate, 1.40% per annum of the Fund's average daily net assets (the "Expense Limitation"). For the year ended December 31, 2008, such excess expenses amounted to $129,472. The Fund has agreed to repay Management through December 31, 2014 for fees and expenses foregone and/or its excess Operating Expenses previously reimbursed by Management, so long as its annual Operating Expenses during that period do not exceed its Expense Limitation, and the repayment is made within three years after the year in which Management issued the reimbursement or waived fees. During the year ended December 31, 2008, there was no repayment to Management under this agreement. At December 31, 2008, contingent liabilities to Management under this agreement were as follows:
| | | Expiring in: | |
| | | 2009 | | 2010 | | 2011 | | Total | |
| | | $ | 131,004 | | | $ | 126,509 | | | $ | 129,472 | | | $ | 386,985 | | |
Neuberger is retained by Management to furnish it with investment recommendations and research information without added cost to the Fund. Several individuals who are officers and/or trustees of the Trust are also employees of Neuberger and/or Management.
The Fund had entered into a commission recapture program, which enabled it to pay some of its operational expenses by recouping a portion of the commissions it paid to a broker that was not a related party of the Fund. Pursuant to the agreement, brokers paid recaptured commissions to the Fund's custodian and the custodian directed these amounts toward payment of expenses such as custodial, transfer agency or accounting services. Effective April 1, 2008, this commission recapture program was terminated. For the period ended March 31, 2008, the impact of this arrangement was a reduction of expenses of $1,691.
The Fund has an expense offset arrangement in connection with its custodian contract. For the year ended December 31, 2008, the impact of this arrangement was a reduction of expenses of $86.
On March 25, 2008, Management voluntarily agreed to reimburse the Fund for all brokerage commissions from March 25, 2008 to April 15, 2008, to facilitate a restructuring of the portfolio following a change in the Fund's portfolio manager. The amount of this voluntary reimbursement was $6,628.
Note C--Securities Transactions:
During the year ended December 31, 2008, there were purchase and sale transactions (excluding short-term securities) of $73,848,449 and $75,931,861, respectively.
During the year ended December 31, 2008, brokerage commissions on securities transactions paid to affiliated brokers were as follows: Neuberger received $0 and Lehman Brothers Inc. received $5,217.
17
Note D--Fund Share Transactions:
Share activity for the years ended December 31, 2008 and December 31, 2007 was as follows:
| | | For the Year Ended December 31, | |
| | | 2008 | | 2007 | |
| Shares Sold | | | 1,291,580 | | | | 869,760 | | |
| Shares Issued on Reinvestment of Dividends and Distributions | | | 93,632 | | | | 13,775 | | |
| Shares Redeemed | | | (1,725,324 | ) | | | (706,094 | ) | |
| Total | | | (340,112 | ) | | | 177,441 | | |
Note E--Line of Credit:
At December 31, 2008, the Fund was a participant in a single committed, unsecured $150,000,000 line of credit with State Street, to be used only for temporary or emergency purposes. Other investment companies managed by Management also participate in this line of credit on the same terms. Interest is charged on borrowings under this line of credit at the overnight Federal Funds Rate plus 0.50% per annum. A facility fee of 0.07% (as of September 19, 2008, 0.09%) per annum of the available line of credit is charged, of which the Fund has agreed to pay its pro rata share, based on the ratio of its individual net assets to the net assets of all participants at the time the fee is due and payable. The fee is paid quarterly in arrears. Because several investment companies participate, there is no assurance that an individual Fund will have access to all or any part of the $150,000,000 at any particular time. There were no loans outstanding pursuant to this line of credit at December 31, 2008. During the year ended December 31, 2008, the Fund did not utilize this line of credit.
Note F--Investments in Affiliates
| Name of Issuer | | Balance of
Shares Held
December 31, 2007 | | Gross
Purchases
and Additions | | Gross
Sales and
Reductions | | Balance of
Shares Held
December 31, 2008 | | Value
December 31, 2008 | | Income from
Investments
in Affiliated
Issuers Included
in Total Income | |
Neuberger Berman
Prime Money Fund
Trust Class* | | | 935,300 | | | | 27,291,758 | | | | 27,687,519 | | | | 539,539 | | | $ | 539,539 | | | $ | 26,864 | | |
Neuberger Berman
Securities Lending
Quality Fund, LLC** | | | 5,794,305 | | | | 41,205,705 | | | | 45,725,675 | | | | 1,274,335 | | | | 1,274,335 | | | | 85,501 | | |
| Total | | | | | | | | | | $ | 1,813,874 | | | $ | 112,365 | | |
* Prime Money is also managed by Management and may be considered an affiliate since it has the same officers, Board members, and investment manager as the Fund and because, at times, the Fund may own 5% or more of the outstanding voting securities of Prime Money.
** Quality Fund, a fund managed by LBAM, an affiliate of Management, is used to invest cash the Fund receives as collateral for securities loaned as approved by the Board. Because all shares of Quality Fund are held by funds in the related investment management complex, Quality Fund may be considered an affiliate of the Fund.
18
Note G--Recent Accounting Pronouncement:
In March 2008, Statement of Financial Accounting Standards No. 161, "Disclosures about Derivative Instruments and Hedging Activities-an amendment of FASB Statement No. 133" ("FAS 161"), was issued. FAS 161 is intended to improve financial reporting for derivative instruments by requiring enhanced disclosure that enables investors to understand how and why an entity uses derivatives, how derivatives are accounted for, and how derivative instruments affect an entity's results of operations and financial position. In September 2008, FASB Staff Position No. 133-1 and FASB Interpretation No. 45-4 (the "FSP"), "Disclosures about Credit Derivatives and Certain Guarantees: An Amendment of FASB Statement No. 133 and FASB Interpretation No. 45; and Clarification of the Effective Date of FASB Statement No. 161" was issued. Certain provisions of the FSP amend FASB Statement No. 133, "Accounting for Derivative Instruments and Hedging Activities," to require disclosures by sellers of credit derivatives, including credit derivatives embedded in hybrid instruments. These FSP provisions are effective for fiscal years and interim periods ending after November 15, 2008. At this time, Management has assessed the implication of these FSP provisions and determined there is no impact to the Fund's financial statements. The FSP also clarifies the effective date of FAS 161, whereby disclosures required by FAS 161 are effective for financial statements issued for fiscal years and interim periods beginning after November 15, 2008. The impact of FAS 161 on the Fund's financial statement disclosures, if any, is currently being assessed.
Note H--Recent Market Events
The year covered by this report witnessed an unusually high degree of volatility in the financial markets and the net asset values of many mutual funds, including to some extent the Fund. Both domestic and international equity markets have been experiencing heightened volatility and turmoil, with issuers that have exposure to the real estate, mortgage and credit markets particularly affected. In addition to the recent turbulence in financial markets, the reduced liquidity in credit and fixed income markets has negatively affected many issuers worldwide. The Fund's investments in certain issuers, as reflected in the Fund's schedule of investments, and the financial markets in general, expose investors to the volatile performance resulting from these market conditions and related events.
19
Financial Highlights
Small-Cap Growth Portfolio
The following table includes selected data for a share outstanding throughout each year and other performance information derived from the Financial Statements.
| | | Year Ended December 31, | |
| | | 2008 | | 2007 | | 2006 | | 2005 | | 2004 | |
| Net Asset Value, Beginning of Year | | $ | 14.50 | | | $ | 14.53 | | | $ | 14.16 | | | $ | 13.84 | | | $ | 12.40 | | |
| Income From Investment Operations: | |
| Net Investment Income (Loss)t | | | (.11 | ) | | | (.06 | ) | | | (.05 | ) | | | (.04 | ) | | | (.08 | ) | |
Net Gains or Losses on Securities
(both realized and unrealized) | | | (5.60 | )SS | | | .14 | | | | .79 | | | | .43 | | | | 1.56 | | |
| Total From Investment Operations | | | (5.71 | ) | | | .08 | | | | .74 | | | | .39 | | | | 1.48 | | |
| Less Distributions From: | |
| Net Capital Gains | | | (.44 | ) | | | (.11 | ) | | | (.37 | ) | | | (.07 | ) | | | (.04 | ) | |
| Tax Return of Capital | | | (.00 | ) | | | -- | | | | -- | | | | -- | | | | -- | | |
| Total Distributions | | | (.44 | ) | | | (.11 | ) | | | (.37 | ) | | | (.07 | ) | | | (.04 | ) | |
| Net Asset Value, End of Year | | $ | 8.35 | | | $ | 14.50 | | | $ | 14.53 | | | $ | 14.16 | | | $ | 13.84 | | |
| Total Returntt | | | (39.47 | )% | | | .52 | % | | | 5.25 | % | | | 2.82 | % | | | 11.96 | % | |
| Ratios/Supplemental Data | |
| Net Assets, End of Year (in millions) | | $ | 12.6 | | | $ | 26.7 | | | $ | 24.2 | | | $ | 18.9 | | | $ | 15.9 | | |
| Ratio of Gross Expenses to Average Net Assets# | | | 1.43 | % | | | 1.40 | % | | | 1.40 | % | | | 1.40 | % | | | 1.41 | % | |
| Ratio of Net Expenses to Average Net AssetsS | | | 1.42 | % | | | 1.39 | % | | | 1.40 | % | | | 1.40 | % | | | 1.40 | % | |
Ratio of Net Investment Income (Loss) to
Average Net Assets | | | (.92 | )% | | | (.42 | )% | | | (.33 | )% | | | (.32 | )% | | | (.60 | )% | |
| Portfolio Turnover Rate | | | 323 | % | | | 38 | % | | | 30 | % | | | 42 | % | | | 10 | % | |
See Notes to Financial Highlights20
Notes to Financial Highlights Small-Cap Growth Portfolio
tt Total return based on per share net asset value reflects the effects of changes in net asset value on the performance of the Fund during each fiscal period and assumes dividends and other distributions, if any, were reinvested. Results represent past performance and do not guarantee future results. Current returns may be lower or higher than the performance data quoted. Investment returns and principal may fluctuate and shares when redeemed may be worth more or less than original cost. Total return would have been lower if Management had not reimbursed and/or waived certain expenses. The total return information shown does not reflect charges and other expenses that apply to the separate account or the related insurance policies, and the inclusion of these charges and other expenses would reduce the total return for all fiscal periods shown. For the year ended December 31, 2008, there was no impact on total return as a result of the payment by affiliate.
# The Fund is required to calculate an expense ratio without taking into consideration any expense reductions related to expense offset arrangements.
S After reimbursement of expenses and/or waiver of a portion of the investment management fee by Management. Had Management not undertaken such actions, the annualized ratios of net expenses to average daily net assets would have been:
| | | Year Ended December 31, | |
| | | 2008 | | 2007 | | 2006 | | 2005 | | 2004 | |
| | | | 1.97 | % | | | 1.87 | % | | | 2.00 | % | | | 2.09 | % | | | 2.56 | % | |
SS Included in this net loss is a reimbursement from Management as described in Note B of Notes to Financial Statements.
t Calculated based on the average number of shares outstanding during each fiscal period.
21
Report of Independent Registered Public Accounting Firm
To the Board of Trustees of
Neuberger Berman Advisers Management Trust and
Shareholders of Small-Cap Growth Portfolio
We have audited the accompanying statement of assets and liabilities, including the schedule of investments, of Small-Cap Growth Portfolio (formerly, Fasciano Portfolio), one of the series constituting Neuberger Berman Advisers Management Trust (the "Trust"), as of December 31, 2008, and the related statement of operations for the year then ended, the statement of changes in net assets for each of the two years in the period then ended, and the financial highlights for each of the five years in the period then ended. These financial statements and financial highlights are the responsibility of the Trust's management. Our responsibility is to express an opinion on these financial statements and financial highlights based on our audits.
We conducted our audits in accordance with the standards of the Public Company Accounting Oversight Board (United States). Those standards require that we plan and perform the audit to obtain reasonable assurance about whether the financial statements and financial highlights are free of material misstatement. We were not engaged to perform an audit of the Trust's internal control over financial reporting. Our audits included consideration of internal control over financial reporting as a basis for designing audit procedures that are appropriate in the circumstances, but not for the purpose of expressing an opinion on the effectiveness of the Trust's internal control over financial reporting. Accordingly, we express no such opinion. An audit also includes examining, on a test basis, evidence supporting the amounts and disclosures in the financial statements and financial highlights, assessing the accounting principles used and significant estimates made by management, and evaluating the overall financial statement presentation. Our procedures included confirmation of securities owned as of December 31, 2008 by correspondence with the custodian and brokers or by other appropriate auditing procedures where replies from brokers were not received. We believe that our audits provide a reasonable basis for our opinion.
In our opinion, the financial statements and financial highlights referred to above present fairly, in all material respects, the financial position of Small-Cap Growth Portfolio, a series of Neuberger Berman Advisers Management Trust, at December 31, 2008, the results of its operations for the year then ended, the changes in its net assets for each of the two years in the period then ended, and the financial highlights for each of the five years in the period then ended, in conformity with U.S. generally accepted accounting principles.

Boston, Massachusetts
February 9, 2009
22
Trustee and Officer Information
The following tables set forth information concerning the trustees and officers of the Trust. All persons named as trustees and officers also serve in similar capacities for other funds administered or managed by Neuberger Berman Management LLC ("NB Management") and Neuberger Berman, LLC ("Neuberger Berman"). The Statement of Additional Information includes additional information about fund trustees and is available upon request, without charge, by calling (800) 877-9700.
Information about the Board of Trustees
Name, (Year of Birth),
and Address(1) | | Position and
Length of
Time Served(2) | | Principal Occupation(s)(3) | | Number of
Funds in Fund
Complex
Overseen by
Fund Trustee | | Other Directorships
Held Outside Fund
Complex by Fund
Trustee | |
| Independent Fund Trustees | |
|
| John Cannon (1930) | | Trustee since 2000 | | Consultant; formerly, Chairman, CDC Investment Advisers (registered investment adviser), 1993 to January 1999; formerly, President and Chief Executive Officer, AMA Investment Advisors, an affiliate of the American Medical Association. | | | 56 | | | Independent Trustee or Director of three series of Oppenheimer Funds: Oppenheimer Limited Term New York Municipal Fund, Rochester Fund Municipals, and Oppenheimer Convertible Securities Fund since 1992. | |
|
| Faith Colish (1935) | | Trustee since 1982 | | Counsel, Carter Ledyard & Milburn LLP (law firm) since October 2002; formerly, Attorney-at-Law and President, Faith Colish, A Professional Corporation, 1980 to 2002. | | | 56 | | | Formerly, Director (1997 to 2003) and Advisory Director (2003 to 2006), ABA Retirement Funds (formerly, American Bar Retirement Association) (not-for-profit membership corporation). | |
|
| Martha C. Goss (1949) | | Trustee since 2007 | | President, Woodhill Enterprises Inc./Chase Hollow Associates LLC (personal investment vehicle), since 2006; Chief Operating and Financial Officer, Hopewell Holdings LLC/ Amwell Holdings, LLC (a holding company for a healthcare reinsurance company start-up), since 2003; formerly, Consultant, Resources Connection (temporary staffing), 2002 to 2006. | | | 56 | | | Director, Ocwen Financial Corporation (mortgage servicing), since 2005; Director, American Water (water utility), since 2003; Director, Channel Reinsurance (financial guaranty reinsurance), since 2006; Advisory Board Member, Attensity (software developer), since 2005; Director, Allianz Life of New York (insurance), since 2005; Director, Financial Women's Association of New York (not for profit association), since 2003; Trustee Emerita, Brown University, since 1998. | |
|
23
Name, (Year of Birth),
and Address(1) | | Position and
Length of
Time Served(2) | | Principal Occupation(s)(3) | | Number of
Funds in Fund
Complex
Overseen by
Fund Trustee | | Other Directorships
Held Outside Fund
Complex by Fund
Trustee | |
| C. Anne Harvey (1937) | | Trustee since 1998 | | President, C.A. Harvey Associates, since October 2001; formerly, Director, AARP, 1978 to December 2001. | | | 56 | | | Formerly, President, Board of Associates to The National Rehabilitation Hospital's Board of Directors, 2001 to 2002; formerly, Member, Individual Investors Advisory Committee to the New York Stock Exchange Board of Directors, 1998 to June 2002. | |
|
| Robert A. Kavesh (1927) | | Trustee since 2000 | | Retired; Marcus Nadler Professor Emeritus of Finance and Economics, New York University Stern School of Business; formerly, Executive Secretary-Treasurer, American Finance Association, 1961 to 1979. | | | 56 | | | Formerly, Director, The Caring Community (not-for-profit), 1997 to 2006; formerly, Director, DEL Laboratories, Inc. (cosmetics and pharmaceuticals), 1978 to 2004; formerly, Director, Apple Bank for Savings, 1979 to 1990; formerly, Director, Western Pacific Industries, Inc., 1972 to 1986 (public company). | |
|
| Michael M. Knetter (1960) | | Trustee since 2007 | | Dean, School of Business, University of Wisconsin - Madison; formerly, Professor of International Economics and Associate Dean, Amos Tuck School of Business - Dartmouth College, 1998 to 2002. | | | 56 | | | Trustee, Northwestern Mutual Series Fund, Inc., since February 2007; Director, Wausau Paper, since 2005; Director, Great Wolf Resorts, since 2004. | |
|
| Howard A. Mileaf (1937) | | Trustee since 1999 | | Retired; formerly, Vice President and General Counsel, WHX Corporation (holding company), 1993 to 2001. | | | 56 | | | Formerly, Director, Webfinancial Corporation (holding company), 2002 to 2008; formerly, Director WHX Corporation (holding company), January 2002 to June 2005; formerly, Director, State Theatre of New Jersey (not-for-profit theater), 2000 to 2005. | |
|
24
Name, (Year of Birth),
and Address(1) | | Position and
Length of
Time Served(2) | | Principal Occupation(s)(3) | | Number of
Funds in Fund
Complex
Overseen by
Fund Trustee | | Other Directorships
Held Outside Fund
Complex by Fund
Trustee | |
| George W. Morriss (1947) | | Trustee since 2007 | | Retired; formerly, Executive Vice President and Chief Financial Officer, People's Bank, Connecticut (a financial services company), 1991 to 2001. | | | 56 | | | Manager, Old Mutual 2100 fund complex (consisting of six funds) since October 2006 for four funds and since February 2007 for two funds; formerly, Member NASDAQ Issuers' Affairs Committee, 1995 to 2003. | |
|
| Edward I. O'Brien (1928) | | Trustee since 2000 | | Retired; formerly, Member, Investment Policy Committee, Edward Jones, 1993 to 2001; President, Securities Industry Association ("SIA") (securities industry's representative in government relations and regulatory matters at the federal and state levels), 1974 to 1992; Adviser to SIA, November 1992 to November 1993. | | | 56 | | | Formerly, Director, Legg Mason, Inc. (financial services holding company), 1993 to July 2008; formerly, Director, Boston Financial Group (real estate and tax shelters), 1993 to 1999. | |
|
| William E. Rulon (1932) | | Trustee since 2000 | | Retired; formerly, Senior Vice President, Foodmaker, Inc. (operator and franchiser of restaurants), until January 1997. | | | 56 | | | Formerly, Director, Pro-Kids Golf and Learning Academy (teach golf and computer usage to "at risk" children), 1998 to 2006; formerly, Director, Prandium, Inc. (restaurants), March 2001 to July 2002. | |
|
| Cornelius T. Ryan (1931) | | Trustee since 2000 | | Founding General Partner, Oxford Partners and Oxford Bioscience Partners (venture capital investing) and President, Oxford Venture Corporation, since 1981. | | | 56 | | | None. | |
|
25
Name, (Year of Birth),
and Address(1) | | Position and
Length of
Time Served(2) | | Principal Occupation(s)(3) | | Number of
Funds in Fund
Complex
Overseen by
Fund Trustee | | Other Directorships
Held Outside Fund
Complex by Fund
Trustee | |
| Tom D. Seip (1950) | | Trustee since 2000; Chairman of the Board since 2008; Lead Independent Trustee from 2006 to 2008 | | General Partner, Seip Investments LP (a private investment partnership); formerly, President and CEO, Westaff, Inc. (temporary staffing), May 2001 to January 2002; formerly, Senior Executive at the Charles Schwab Corporation, 1983 to 1998, including Chief Executive Officer, Charles Schwab Investment Management, Inc., and Trustee, Schwab Family of Funds and Schwab Investments, 1997 to 1998, and Executive Vice President-Retail Brokerage, Charles Schwab & Co., Inc., 1994 to 1997. | | | 56 | | | Director, H&R Block, Inc. (financial services company), since May 2001; Chairman, Compensation Committee, H&R Block, Inc., since 2006; formerly, Director, Forward Management, Inc. (asset management company), 1999 to 2006. | |
|
| Candace L. Straight (1947) | | Trustee since 1999 | | Private investor and consultant specializing in the insurance industry; formerly, Advisory Director, Securitas Capital LLC (a global private equity investment firm dedicated to making investments in the insurance sector), 1998 to December 2003. | | | 56 | | | Director, Montpelier Re (reinsurance company), since 2006; formerly, Director, National Atlantic Holdings Corporation (property and casualty insurance company), 2004 to 2008; formerly, Director, The Proformance Insurance Company (property and casualty insurance company), 2004 to 2008; formerly, Director, Providence Washington Insurance Company (property and casualty insurance company), December 1998 to March 2006; formerly, Director, Summit Global Partners (insurance brokerage firm), 2000 to 2005. | |
|
| Peter P. Trapp (1944) | | Trustee since 1984 | | Retired; formerly, Regional Manager for Mid-Southern Region, Ford Motor Credit Company, September 1997 to 2007; formerly, President, Ford Life Insurance Company, April 1995 to August 1997. | | | 56 | | | None. | |
|
26
Name, (Year of Birth),
and Address(1) | | Position and
Length of
Time Served(2) | | Principal Occupation(s)(3) | | Number of
Funds in Fund
Complex
Overseen by
Fund Trustee | | Other Directorships
Held Outside Fund
Complex by Fund
Trustee | |
| Fund Trustees who are "Interested Persons" | |
|
| Jack L. Rivkin* (1940) | | Trustee since 2002; President from 2002 to 2008 | | Formerly, Executive Vice President and Chief Investment Officer, Neuberger Berman Holdings LLC (holding company), 2002 to August 2008 and 2003 to August 2008, respectively; formerly, Managing Director and Chief Investment Officer, Neuberger Berman, December 2005 to August 2008 and 2003 to August 2008, respectively; formerly, Executive Vice President, Neuberger Berman, December 2002 to 2005; formerly, Director and Chairman, NB Management, December 2002 to August 2008; formerly, Executive Vice President, Citigroup Investments, Inc., September 1995 to February 2002; formerly, Executive Vice President, Citigroup Inc., September 1995 to February 2002. | | | 56 | | | Director, Dale Carnegie and Associates, Inc. (private company), since 1998; Director, Solbright, Inc. (private company), since 1998. | |
|
27
Name, (Year of Birth),
and Address(1) | | Position and
Length of
Time Served(2) | | Principal Occupation(s)(3) | | Number of
Funds in Fund
Complex
Overseen by
Fund Trustee | | Other Directorships
Held Outside Fund
Complex by Fund
Trustee | |
| Robert Conti* (1956) | | Chief Executive Officer, President and Director since 2008; prior thereto, Executive Vice President in 2008 and Vice President 2000 to 2008 | | Managing Director, Neuberger Berman, since 2007; formerly, Senior Vice President, Neuberger Berman, 2003 to 2006; formerly, Vice President, Neuberger Berman, 1999 to 2003; President and Chief Executive Officer, NB Management, since 2008; formerly, Senior Vice President, NB Management, 2000 to 2008. | | | 56 | | | Chairman of the Board, Staten Island Mental Health Society since 2008. | |
|
(1) The business address of each listed person is 605 Third Avenue, New York, New York 10158.
(2) Pursuant to the Trust's Trust Instrument, each Fund Trustee shall hold office for life or until his or her successor is elected or the Trust terminates; except that (a) any Fund Trustee may resign by delivering a written resignation; (b) any Fund Trustee may be removed with or without cause at any time by a written instrument signed by at least two-thirds of the other Fund Trustees; (c) any Fund Trustee who requests to be retired, or who has become unable to serve, may be retired by a written instrument signed by a majority of the other Fund Trustees; and (d) any Fund Trustee may be removed at any shareholder meeting by a vote of at least two-thirds of the outstanding shares.
(3) Except as otherwise indicated, each individual has held the positions shown for at least the last five years.
* Indicates a Fund Trustee who is an "interested person" within the meaning of the 1940 Act. Mr. Conti is an interested person of the Trust by virtue of the fact that he is an officer of NB Management and Neuberger Berman. Mr. Rivkin may be deemed an interested person of the Trust by virtue of the fact that, until August 2008, he was a director of NB Management and an officer of Neuberger Berman.
28
Information about the Officers of the Trust
Name, (Year of Birth),
and Address(1) | | Position and
Served(2) | | Principal Occupation(s)(3)
Length of Time | |
| Andrew B. Allard (1961) | | Anti-Money Laundering Compliance Officer since 2002 | | Senior Vice President, Neuberger Berman, since 2006; Deputy General Counsel, Neuberger Berman, since 2004; formerly, Vice President, Neuberger Berman, 2000 to 2005; formerly, Associate General Counsel, Neuberger Berman, 1999 to 2004; Anti-Money Laundering Compliance Officer, eleven registered investment companies for which NB Management acts as investment manager and administrator (six since 2002, two since 2003, two since 2004 and one since 2006). | |
|
| Michael J. Bradler (1970) | | Assistant Treasurer since 2005 | | Vice President, Neuberger Berman, since 2006; Employee, NB Management, since 1997; Assistant Treasurer, eleven registered investment companies for which NB Management acts as investment manager and administrator (ten since 2005 and one since 2006). | |
|
| Claudia A. Brandon (1956) | | Executive Vice President since 2008 and Secretary since 1985 | | Senior Vice President, Neuberger Berman, since 2007 and Employee since 1999; formerly, Vice President, Neuberger Berman, 2002 to 2006; Senior Vice President, NB Management, since 2008 and Assistant Secretary since 2004; formerly, Vice President-Mutual Fund Board Relations, NB Management, 2000 to 2008; Executive Vice President, eleven registered investment companies for which NB Management acts as investment manager and administrator (eleven since 2008); Secretary, eleven registered investment companies for which NB Management acts as investment manager and administrator (three since 1985, three since 2002, two since 2003, two since 2004 and one since 2006). | |
|
| Maxine L. Gerson (1950) | | Executive Vice President since 2008 and Chief Legal Officer since 2005 (only for purposes of sections 307 and 406 of the Sarbanes-Oxley Act of 2002) | | Senior Vice President, Neuberger Berman, since 2002; Deputy General Counsel and Assistant Secretary, Neuberger Berman, since 2001; Senior Vice President, NB Management, since 2006; Secretary and General Counsel, NB Management, since 2004; Executive Vice President, eleven registered investment companies for which NB Management acts as investment manager and administrator (eleven since 2008); Chief Legal Officer (only for purposes of sections 307 and 406 of the Sarbanes-Oxley Act of 2002), eleven registered investment companies for which NB Management acts as investment manager and administrator (ten since 2005 and one since 2006). | |
|
| Sheila R. James (1965) | | Assistant Secretary since 2002 | | Vice President, Neuberger Berman, since 2008 and Employee since 1999; formerly, Assistant Vice President, Neuberger Berman, 2007; Assistant Secretary, eleven registered investment companies for which NB Management acts as investment manager and administrator (six since 2002, two since 2003, two since 2004 and one since 2006). | |
|
| Brian Kerrane (1969) | | Vice President since 2008 | | Senior Vice President, Neuberger Berman, since 2006; formerly, Vice President, Neuberger Berman, 2002 to 2006; Vice President, NB Management, since 2008 and Employee since 1991; Vice President, eleven registered investment companies for which NB Management acts as investment manager and administrator (eleven since 2008). | |
|
29
Name, (Year of Birth),
and Address(1) | | Position and
Served(2) | | Principal Occupation(s)(3)
Length of Time | |
| Kevin Lyons (1955) | | Assistant Secretary since 2003 | | Assistant Vice President, Neuberger Berman, since 2008 and Employee since 1999; Assistant Secretary, eleven registered investment companies for which NB Management acts as investment manager and administrator (eight since 2003, two since 2004 and one since 2006). | |
|
| Owen F. McEntee, Jr. (1961) | | Vice President since 2008 | | Vice President, Neuberger Berman, since 2006; Employee, NB Management, since 1992; Vice President, eleven registered investment companies for which NB Management acts as investment manager and administrator (eleven since 2008). | |
|
| John M. McGovern (1970) | | Treasurer and Principal Financial and Accounting Officer since 2005; prior thereto, Assistant Treasurer since 2002 | | Senior Vice President, Neuberger Berman, since 2007; formerly, Vice President, Neuberger Berman, 2004 to 2006; Employee, NB Management, since 1993; Treasurer and Principal Financial and Accounting Officer, eleven registered investment companies for which NB Management acts as investment manager and administrator (ten since 2005 and one since 2006); formerly, Assistant Treasurer, eleven registered investment companies for which NB Management acts as investment manager and administrator, 2002 to 2005. | |
|
| Andrew Provencher (1965) | | Vice President since 2008 | | Managing Director, NB Management, since 2008; Managing Director, Neuberger Berman, since 2005; formerly, Senior Vice President, Neuberger Berman, 2003 to 2005; formerly, Vice President, Neuberger Berman, 1999 to 2003; Vice President, eleven registered investment companies for which NB Management acts as investment manager and administrator (eleven since 2008). | |
|
| Frank Rosato (1971) | | Assistant Treasurer since 2005 | | Vice President, Neuberger Berman, since 2006; Employee, NB Management, since 1995; Assistant Treasurer, eleven registered investment companies for which NB Management acts as investment manager and administrator (ten since 2005 and one since 2006). | |
|
| Neil S. Siegel (1967) | | Vice President since 2008 | | Managing Director, NB Management, since 2008; Managing Director, Neuberger Berman, since 2006; formerly, Senior Vice President, Neuberger Berman, 2004 to 2006; Vice President, eleven registered investment companies for which NB Management acts as investment manager and administrator (eleven since 2008); formerly, Head of Institutional Marketing, Morgan Stanley Investment Management, 1993 to 2004. | |
|
30
Name, (Year of Birth),
and Address(1) | | Position and
Served(2) | | Principal Occupation(s)(3)
Length of Time | |
| Chamaine Williams (1971) | | Chief Compliance Officer since 2005 | | Senior Vice President, Neuberger Berman, since 2007; Chief Compliance Officer, NB Management, since 2006; Senior Vice President, Lehman Brothers Inc., since 2007; formerly, Vice President, Lehman Brothers Inc., 2003 to 2006; Chief Compliance Officer, eleven registered investment companies for which NB Management acts as investment manager and administrator (ten since 2005 and one since 2006); formerly, Chief Compliance Officer, Lehman Brothers Asset Management Inc., 2003 to 2007; formerly, Chief Compliance Officer, Lehman Brothers Alternative Investment Management LLC, 2003 to 2007; formerly, Vice President, UBS Global Asset Management (US) Inc. (formerly, Mitchell Hutchins Asset Management, a wholly-owned subsidiary of PaineWebber Inc.), 1997 to 2003. | |
|
(1) The business address of each listed person is 605 Third Avenue, New York, New York 10158.
(2) Pursuant to the By-Laws of the Trust, each officer elected by the Fund Trustees shall hold office until his or her successor shall have been elected and qualified or until his or her earlier death, inability to serve, or resignation. Officers serve at the pleasure of the Fund Trustees and may be removed at any time with or without cause.
(3) Except as otherwise indicated, each individual has held the positions shown for at least the last five years.
31
Proxy Voting Policies and Procedures
A description of the policies and procedures that the Trust uses to determine how to vote proxies relating to portfolio securities is available, without charge, by calling 1-800-877-9700 (toll-free) and on the website of the Securities and Exchange Commission, at www.sec.gov. Information regarding how the Trust voted proxies relating to portfolio securities during the most recent 12-month period ended June 30 is also available, without charge, by calling 1-800-877-9700 (toll-free), on the website of the Securities and Exchange Commission at www.sec.gov, and on Management's website at www.nb.com.
Quarterly Portfolio Schedule
The Trust files a complete schedule of portfolio holdings for the Fund with the Securities and Exchange Commission for the first and third quarters of each fiscal year on Form N-Q. The Trust's Forms N-Q are available on the Securities and Exchange Commission's website at www.sec.gov and may be reviewed and copied at the Securities and Exchange Commission's Public Reference Room in Washington, DC. Information on the operation of the Public Reference Room may be obtained by calling 1-800-SEC-0330. The information on Form N-Q is available upon request, without charge, by calling 1-800-877-9700 (toll free).
Notice to Shareholders (Unaudited)
The Fund hereby designates $805,076 as a capital gain distribution.
Board Consideration of the Management and Sub-Advisory Agreements
At a meeting held on September 25, 2008, the Board of Trustees of Neuberger Berman Advisers Management Trust ("Board"), including the Trustees who are not "interested persons" of Neuberger Berman Management LLC ("Management") or Neuberger Berman Advisers Management Trust ("Independent Fund Trustees"), approved the continuance of the Management and Sub-Advisory Agreements ("Agreements") between Management and Small Cap Growth Portfolio ("Fund").
In evaluating the Agreements, the Board, including the Independent Fund Trustees, reviewed materials furnished by Management and Neuberger Berman, LLC ("Neuberger") in response to questions submitted by counsel to the Independent Fund Trustees, and met with senior representatives of Management and Neuberger regarding their personnel and operations. The Independent Fund Trustees were advised by counsel that is experienced in Investment Company Act of 1940 matters and that is independent of Management and Neuberger. The Independent Fund Trustees received a memorandum from independent counsel discussing the legal standards for their consideration of the proposed continuance of the Agreements. They met with such counsel separately from representatives of Management to discuss the annual contract review. The annual contract review extends over two regular meetings of the Board to ensure that Management and Neuberger have time to respond to any questions the Independent Fund Trustees may have on their initial review of the report and that the Independent Fund Trustees have time to consider those responses. In addition, during this process, the Board held a separate meeting devoted primarily to reviewing and discussing Fund performance.
The Board considered the following factors, among others, in connection with its approval of the continuance of the Agreements: (1) the nature, extent, and quality of the services provided by Management and Neuberger; (2) the performance of the Fund compared to a relevant market index and a peer group of investment companies; (3) the costs of the services provided and profits or losses realized by Management and its affiliates from their relationship with the Fund; (4) the extent to which economies of scale might be realized as the Fund grows; and (5) whether fee levels reflect any such potential economies of scale for the benefit of investors in the Fund. In their deliberations, the Board members did not identify any particular information that was all-important or controlling, and each Trustee may have attributed different weights to the various factors.
32
The Board considered the continued integrity of Management and Neuberger as organizations, despite the bankruptcy filing by Lehman Brothers Holdings Inc. The Board discussed the efforts made by Management and Neuberger to retain employees, and the reported likelihood that such employees would be retained. The Board discussed the provisions that were being made for ancillary services by Management, Neuberger and their affiliates.
The Board evaluated the terms of the Agreements, the overall fairness of the Agreements to the Fund and whether the Agreements were in the best interests of the Fund and its shareholders.
With respect to the nature, extent and quality of the services provided, the Board considered the performance of the Fund and the experience and staffing of the portfolio management and investment research personnel who perform services for the Fund. The Board noted that Management also provides certain administrative services, including fund accounting and compliance oversight. The Board also considered Management's and Neuberger's policies and practices regarding brokerage. The Board considered the quality of brokerage execution obtained by Management. The Board's Portfolio Transactions and Pricing Committee from time to time reviewed the quality of the brokerage services that Neuberger and Lehman Brothers Inc. had provided, and periodically reviews studies by an independent firm engaged to review and evaluate the quality of brokerage execution received by the Fund. The Board also reviewed whether Management and Neuberger used brokers to execute Fund transactions that provide research and other services to Management and Neuberger, and the types of benefits potentially derived from such services by Management, Neuberger, the Fund and other clients of Management and Neuberger. In addition, the Board noted the positive compliance history of Management and Neuberger, as each firm has been free of significant compliance problems.
The Board considered the performance of the Fund relative to its benchmark and a peer group of investment companies dedicated to insurance products pursuing broadly similar strategies. The Board also considered performance in relation to the degree of risk undertaken by the portfolio manager. The Board discussed the Fund's performance with Management and discussed steps that Management had taken, or intended to take, to improve the Fund's performance. The Board also considered Management's resources and responsiveness with respect to the Fund.
With respect to the overall fairness of the Agreements, the Board considered the fee structure for the Fund under the Agreements as compared to a peer group of comparable funds dedicated to insurance products and any fall-out benefits likely to accrue to Management or Neuberger or their affiliates from their relationship with the Fund. The Board also considered the profitability of Management and its affiliates from their association with the Fund.
The Board reviewed a comparison of the Fund's management fee and overall expense ratio to a peer group of broadly comparable funds dedicated to insurance products. The Board considered the mean and median of the management fees and expense ratios of the peer group. The Board noted that the Fund's management fee was higher than the peer group mean and median. The Board considered whether specific portfolio management or administration needs contributed to the higher fee. With regard to the sub-advisory fee paid to Neuberger, the Board noted that this fee is "at cost." In addition, the Board considered the contractual limit on Fund expenses undertaken by Management. The Board noted that Management incurred a loss on the Fund in each of the last three years.
The Board considered whether there were other funds that were advised or sub-advised by Management or its affiliates or separate accounts managed by Management or its affiliates with similar investment objectives, policies and strategies to the Fund. The Board noted that there were no comparable separate accounts. The Board compared the fees charged to the Fund at various asset levels to the fees charged to an advised fund and sub-advised funds, each managed in a similar style to the Fund. The Board considered the appropriateness and reasonableness of any differences between the fees charged to the Fund and the other funds and determined that the differences in fees were consistent with the management and other services provided.
The Board also evaluated any apparent or anticipated economies of scale in relation to the services Management provides to the Fund. The Board considered that the Fund's fee structure which provides for a reduction of payments resulting from the use of breakpoints and whether those breakpoints are set at appropriate asset levels.
In concluding that the benefits accruing to Management and its affiliates by virtue of their relationship to the Fund were reasonable in comparison with the costs of providing the investment advisory services and the benefits accruing to the
33
Fund, the Board reviewed specific data as to Management's loss on the Fund for a recent period and the trend in profit or loss over recent years. The Board also carefully examined Management's cost allocation methodology and in recent years had an independent consultant review the methodology. It also reviewed an analysis from an independent data service on profitability margins in the investment management industry. The Board recognized that Management should be entitled to earn a reasonable level of profits for services it provides to the Fund and, based on its review, concluded that Management's level of profitability was not excessive.
Conclusions
In approving the Agreements, the Board concluded that the terms of each Agreement are fair and reasonable and that approval of the Agreements is in the best interests of the Fund and its shareholders. In reaching this determination, the Board considered that Management and Neuberger could be expected to provide a high level of service to the Fund; that it retained confidence in Management's and Neuberger's capabilities to manage the Fund; that the Fund's fee structure appeared to the Board to be reasonable given the nature and quality of services provided; and that the benefits accruing to Management and its affiliates by virtue of their relationship to the Fund were reasonable in comparison with the benefits accruing to the Fund.
Board Consideration of New and Interim Management and Sub-Advisory Agreements
Lehman Brothers Holdings Inc. ("Lehman Brothers") has entered into an agreement to sell a controlling interest in the Fund's investment adviser. Under the agreement, Lehman Brothers would sell substantially all of the Neuberger Berman business and the fixed income business and certain alternative asset management businesses of Lehman Brother's Investment Management Division (collectively, the "Acquired Businesses") to NBSH Acquisition, LLC (the "Proposed Acquisition"). NBSH Acquisition, LLC ("NBSH") was organized by key members of Neuberger Berman's management for the purpose of facilitating the acquisition of the Acquired Businesses. At the closing of the Proposed Acquisition, a majority interest in the Acquired Businesses will be directly or indirectly owned by portfolio managers, Neuberger Berman's management team and certain key members and senior professionals of the former Investment Management Division ("Management Members"), as well as by Lehman Brothers and certain affiliates of Lehman Brothers.
The Acquired Businesses include Neuberger Berman Management LLC ("Management") and Neuberger Berman, LLC ("Neuberger"), the adviser and sub-adviser to the Fund, respectively. The Proposed Acquisition has been deemed to result in an "assignment" of the Fund's existing Management Agreement and Sub-Advisory Agreement (the "Existing Agreements") under the 1940 Act. As required by the 1940 Act, the Fund's Existing Agreements provide for their automatic termination in the event of an assignment, and each will terminate upon the consummation of the Proposed Acquisition. Accordingly, on December 17, 2008, the Board approved new Management and Sub-Advisory Agreements with Management and Neuberger, respectively, or their successors (together, the "Advisers"), on the same terms and with the same compensation structure as are currently in effect (together, "New Agreements"), which would take effect upon consummation of the Proposed Acquisition if approved by the Fund's shareholders.
If shareholders of the Fund do not approve the New Agreements before the Proposed Acquisition is completed, the Board has approved interim Management and Sub-Advisory Agreements with Management and Neuberger, respectively, or their successors (together, "Interim Agreements") pending approval of the New Agreements by shareholders of the Fund. Compensation earned by the Advisers under the Interim Agreements would be held in an interest-bearing escrow account pending shareholder approval of the New Agreements. If shareholders approve the New Agreements within 150 days from the termination of the Existing Agreements, the amount held in the escrow account, including interest, will be paid to the Advisers, as appropriate. If shareholders of the Fund do not approve the New Agreements, the Advisers will be paid the lesser of the costs incurred in performing their services under the Interim Agreements or the total amount in the escrow account, including interest earned. If at the end of 150 days following termination of a Fund's Existing Agreements the Fund's shareholders still have not approved the New Agreements, the Trustees would take such actions as they deem to be in the best interests of the Fund and its shareholders, which may include negotiating a new Management Agreement and/or new Sub-Advisory Agreement with an advisory organization selected by the Board of Trustees or making other arrangements.
34
The Trustees of the Trust discussed the Proposed Acquisition on December 17, 2008. Prior to submitting its bid to public auction, Management met telephonically with the Independent Trustees to brief them on the Proposed Acquisition. Following the public auction wherein NBSH was determined to be the successful bidder, the Independent Trustees again met telephonically with Management to obtain additional information about the Proposed Acquisition. The Independent Trustees, with the assistance of independent counsel, prepared due diligence requests that were presented to Management and appointed a Task Force of Independent Trustees to lead the due diligence effort ("Task Force").
Management provided written responses to the due diligence requests. After extensive review and analysis and discussions during a telephonic and in person meeting of the Independent Trustees, the Task Force submitted clarifying questions. The Independent Trustees met as a body in person to receive the report of the Task Force and consider the New Agreements. Throughout the process, the Task Force and the Independent Trustees were advised by experienced 1940 Act counsel that is independent of Management and NBSH. In addition, the Independent Trustees received a memorandum from independent counsel discussing the legal standards for their consideration of the New Agreements.
Consideration of the New Agreements followed shortly on the heels of the Independent Trustees' annual consideration of whether to renew the Existing Agreements, carried out pursuant to Section 15(c) of the 1940 Act. In that process, which began prior to the June 2008 quarterly meeting of the Board and was concluded at the September 2008 quarterly meeting, the Independent Trustees, following an extensive review of materials submitted by Management and a report from an independent data service, unanimously determined that the Existing Agreements were fair and reasonable and that their renewal would be in the best interests of the Fund and its shareholders. Accordingly, in considering the New Agreements, the Independent Trustees took into account the fact that the terms of the New Agreements would be identical to those of the Existing Agreements in every respect except for the term and termination date and potentially the name of the investment adviser. The Board considerations in connection with the New Agreements and the Existing Agreements also entered into the decision by the Board to approve the Interim Agreements, which would take effect if the shareholders of the Fund do not approve the New Agreements before the Proposed Acquisition is completed. The Independent Trustees' consideration of the Existing Agreements is described above.
In evaluating the proposed New Agreements, the Independent Trustees considered that they have generally been satisfied with the nature and quality of the services provided to the Fund by Management and Neuberger, including investment advisory, administrative and support services, and that the Fund would be best served by an arrangement that appeared likely to maintain the continuity and stability of the providers of these services. Accordingly, the Independent Trustees considered very carefully the intentions of NBSH (including its successors or assign) regarding capitalization, management structure, staffing, compensation and staff retention and whether these seemed designed to provide the desired continuity and stability. They inquired specifically about staffing and resources in the areas of portfolio management, investment research, trading, fund accounting, legal and compliance, internal audit, and senior executive staff. Although at the time the Board considered the New Agreements no final decisions had been reached as to the distribution of equity interests in NBSH (or its successor or assign), the Trustees were advised that senior members of management, including the Fund Trustee and nominee for Fund Trustee who are employed by the Advisers, would receive equity interests in NBSH. Because of these interests, as well as any future employment arrangements with the Advisers, these persons, individually or in the aggregate, could have a material interest in the Proposed Acquisition and in shareholder approval of the New Agreements. In considering the New Agreements, the Trustees were aware of these interests.
The Independent Trustees inquired whether NBSH (or its successors or assign) had specific plans for the future structure of the Neuberger Berman Funds, whether they plan to propose to eliminate any Funds, and whether they intend to continue or alter certain expansion plans that are already underway. They also inquired whether there are plans to change the fees or expense structure of any of the Funds. The Independent Trustees inquired about the long-term plans for the Advisers, including any expectations for cost savings or expense reductions. They also inquired about the capital structure and working capital likely to be available to NBSH (or its successors or assign).
The Independent Trustees considered the following factors, in addition to the factors discussed above, among others, in connection with their consideration of the New Agreements: (1) the nature, extent, and quality of the services provided by Management and Neuberger; (2) the performance of the Fund compared to a relevant market index and a peer group
35
of investment companies; (3) the costs of the services provided and profits or losses realized by Management and its affiliates from their relationship with the Fund; (4) the extent to which economies of scale might be realized as the Fund grows; and (5) whether fee levels reflect any such potential economies of scale for the benefit of investors in the Fund. In their deliberations, the Independent Trustees did not identify any particular information that was all important or controlling, and each Trustee may have attributed different weights to the various factors.
In unanimously approving and recommending the New Agreements, the Independent Trustees concluded that the terms of each New Agreement are fair and reasonable and that approval of the New Agreements is in the best interests of the Fund and its shareholders. In reaching this determination, the Independent Trustees considered the following factors, among others:
(1) that the terms of the New Agreements are identical in all material respects to those of the Existing Agreements;
(2) that the Advisers will maintain operational autonomy and continuity of management following the Proposed Acquisition;
(3) the favorable history, reputation, qualification, and background of Management and Neuberger, as well as the qualifications of each entity's personnel and each entity's respective financial condition;
(4) the commitment of NBSH (or its successors or assign) to retain key personnel currently employed by Management and Neuberger who currently provide services to the Fund;
(5) the commitment of NBSH (or its successors or assign) to maintaining the current level and quality of Fund services;
(6) the proposed division of equity in NBSH (or its successor or assign) among Management Members and other personnel upon consummation of the Proposed Acquisition;
(7) the fees and expense ratio of the Fund relative to comparable mutual funds;
(8) that the fees are identical to those paid under the Existing Agreements;
(9) that the fees and expense ratios of the Fund appear to the Board to be reasonable given the quality of services expected to be provided;
(10) the commitment of Management to maintaining the Fund's current contractual expense limitation agreements to ensure that Fund shareholders of funds that have such arrangements in place do not face an increase in expenses upon consummation of the Proposed Acquisition;
(11) the performance of the Fund relative to comparable mutual funds and unmanaged indices;
(12) the commitment of Management (or its successor) to pay the expenses of the Fund in connection with the Proposed Acquisition, including all expenses in connection with the solicitation of proxies, so that shareholders of the Fund would not have to bear such expenses;
(13) the actual and potential effects on the Advisers of the bankruptcy of Lehman Brothers, and the effects of the Lehman Brothers bankruptcy on the information considered by the Independent Trustees in their prior analyses of the principal service contracts;
(14) the provisions made to continue providing to the Advisers certain services that were previously provided to them by or through Lehman Brothers or its other affiliates;
(15) the possible benefits that may be realized by the Fund and by the Advisers as a result of the Proposed Acquisition; and
(16) that the Proposed Acquisition is expected to maintain continuity of management of the Fund and may reduce the potential for future vulnerability to changes in control of the Advisers that could be adverse to the Fund's interests and that could affect the retention of key employees providing services to the Fund.
36

Neuberger Berman
Advisers Management Trust
Socially Responsive Portfolio
I Class Shares
S Class Shares
Annual Report
December 31, 2008
B1017 02/09
Socially Responsive Portfolio Managers' Commentary
During 2008, there was virtually no place to hide in the stock market. During one of the worst years in market history, all 10 S&P 500 sectors posted losses, with nine of 10 falling more than 20%; Financials stocks dropped by more than 55%. Even traditionally defensive groups such as Consumer Staples, Health Care and Utilities failed to preserve investor capital.
Our research process is based on business fundamentals, and provided limited defense in an environment of indiscriminate selling by highly leveraged hedge funds faced with margin calls, mutual funds forced to meet redemptions, and panicked individual investors. While the Neuberger Berman Advisers Management Trust (AMT) Socially Responsive Portfolio managed to outperform in four of the eight sectors in which it was invested, it experienced an overall decline that trailed its S&P 500 benchmark.
Like the broader market, the AMT Socially Responsive Portfolio failed to generate positive returns in any sector. However, investments in the Industrials, Materials and Financials sectors performed better than corresponding benchmark sector components. In Industrials, the comparatively moderate decline of Canadian National Railway enhanced relative returns. In Materials, our only sector holding, industrial gases producer Praxair, held up relatively well. In Financials, leading transaction processor State Street (sold in July 2008) and property and casualty insurer Progressive Corp. outperformed. In general, our strategy since 2006 of avoiding more credit sensitive financial companies benefited relative performance.
Investments in the Energy and Consumer Discretionary sectors penalized relative returns. The Portfolio was underweighted in Energy, but our bias toward exploration, production and services companies, which sustained much more damage than the more diversified integrated oils as energy prices collapsed from mid-summer highs, hurt relative performance. Oil services company Smith International and exploration and production company Newfield Exploration were among our poorer performers in this sector. Consumer Discretionary investments underperformed by a relatively small margin, but the Portfolio's substantial overweighting in this sector penalized returns. Auto parts manufacturer BorgWarner and media companies Liberty Global and Scripps Networks Interactive were among our disappointments. The Portfolio was also disadvantaged by not owning any Consumer Staples stocks - the S&P 500's best performing sector.
The credit crisis and volatile financial markets have negatively impacted virtually every economy in the world. We currently believe that the global economic malaise could likely extend into 2009 before we see some improvement in the second half as aggressive efforts to stimulate economic growth by U.S. and international authorities begin to take root. Lower food and fuel costs should take some pressure off household budgets, and lower commodity costs may help cushion profit margins for companies experiencing a decline in demand for their products.
The damage sustained in 2008 has shaken investor confidence in equities and the near-term economic outlook remains clouded by ongoing financial market turmoil. Taking a longer view, we believe business prospects over the three- to five-year time horizon encompassed in our investment approach are likely to improve. Following the last three recessions, the economy expanded by 40 - 70% over extended periods of time. Companies with the right customer value proposition and thoughtful managements have disproportionately benefited in such cycles.
We can't be certain when the global economy will begin to stabilize or when the stock market will begin to reflect an improving economic climate. The potential for positive growth drives us to continue to search for high quality, good corporate citizens capable of building market share and growing earnings faster than their peers across economic and market cycles. Following 2008's dramatic decline in the equity market, many equities of such "growth advantaged" companies are trading at prices that conform to our value and investment criteria. This gives us confidence that the AMT Socially Responsive Portfolio can reward shareholders in the years ahead.
Sincerely,

Arthur Moretti and Ingrid Dyott
Portfolio Co-Managers
1
Socially Responsive Portfolio
SECTOR ALLOCATION
| (% of Equity Market Value) | |
| Energy | | | 9.6 | % | |
| Materials | | | 3.1 | | |
| Industrials | | | 15.2 | | |
| Consumer Discretionary | | | 20.3 | | |
| Health Care | | | 11.8 | | |
| Financials | | | 15.1 | | |
| Information Technology | | | 20.2 | | |
| Utilities | | | 4.7 | | |
| Total | | | 100.0 | % | |
AVERAGE ANNUAL TOTAL RETURN1
| | | Inception
Date | | 1 Year | | 5 Year | | Life of
Fund* | |
| Socially Responsive Portfolio Class I | | 02/18/99 | | | (39.44 | %) | | | (2.15 | %) | | | 1.20 | % | |
| Socially Responsive Portfolio Class S2 | | 05/01/06 | | | (39.43 | %) | | | (2.21 | %) | | | 1.17 | % | |
| S&P 5003 | | | | | (37.00 | %) | | | (2.19 | %) | | | (1.37 | %) | |
Performance data quoted represent past performance, which is no guarantee of future results. The investment return and principal value of an investment will fluctuate so that an investor's shares, when redeemed may be worth more or less than their original cost. Results are shown on a "total return" basis and include reinvestment of all dividends and capital gain distributions.
Current performance may be lower or higher than the performance data quoted. For performance data current to the most recent month end, please visit https://www.nb.com.
* Index returns are as of inception date 2/18/99.
As stated in the Portfolio's most recent prospectus, the total annual fund operating expense ratio for fiscal year 2007 was 0.92% and 1.17% for Class I and Class S shares, respectively (prior to any fee waivers or expense reimbursements). Neuberger Berman Management LLC has contractually agreed to limit certain expenses of the Portfolio through 12/31/2011.
COMPARISON OF A $10,000 INVESTMENT

The chart shows the value of a hypothetical $10,000 investment in the Portfolio over the past 10 fiscal years, or since the Portfolio's inception, if it has not operated for 10 years. The graphs are based on Class I shares only; performance of other classes will vary due to differences in fee structures (see Average Annual Total Return chart above). The result is compared with benchmarks, which may include a broad-based market index and/or a narrower index. Please note that market indexes do not include expenses. All results include the reinvestment of dividends and capital gain distributions. Results represent past performance and do not indicate future results. The chart and table do not reflect the deduction of taxes that a shareholder would pay on Portfolio distributions or the redemption of Portfolio shares.
Please see Endnotes for additional information.
2
Endnotes
1 "Total Return" includes reinvestment of all income dividends and capital gain distributions. Results represent past performance and do not indicate future results. The value of an investment in the Portfolio and the return on the investment both will fluctuate, and redemption process may be higher or lower than an investor's original cost. The performance information does not reflect fees and expenses of the variable annuity and variable life insurance policies or the pension plans whose proceeds are invested in the Portfolio. Neuberger Berman Management LLC ("NBM LLC") has agreed to absorb certain expenses of the AMT Portfolios, including the Portfolio. Without this arrangement, which is subject to change, the total returns of the Portfolio may have been less.
2 Performance shown prior to May 1, 2006, for the Class S shares is that of the Class I shares, which has lower expenses than Class S shares and correspondingly higher returns.
3 The S&P 500 Index is widely regarded as the standard for measuring large-cap U.S. stock market performance and includes a representative sample of leading companies in leading industries. Please note that indices do not take into account any fees and expenses of investing in the individual securities that they track, and that individuals cannot invest directly in any index. Data about the performance of this index is prepared or obtained by NBM LLC and include reinvestment of all dividends and capital gain distributions. The Portfolio may invest directly in many securities not included in the above-described index.
Any ratios or other measurements using a factor of forecasted earnings of a company discussed herein are based on consensus estimates, not NBM LLC's own projections, and they may or may not be realized. In addition, any revision to a forecast could affect the market price of a security. By quoting them herein, NBM LLC does not offer an opinion as to the accuracy of and does not guarantee these forecasted numbers.
The investments for the Portfolio are managed by the same portfolio manager(s) who manage one or more other mutual funds that have similar names, investment objectives and investment styles as the Portfolio. You should be aware that the Portfolio is likely to differ from the other mutual funds in size, cash flow pattern and tax matters.
Accordingly, the holdings and performance of the Portfolio can be expected to vary from those of the other mutual funds.
The composition, industries and holdings of the Portfolio are subject to change.
Shares of the separate AMT Portfolios are sold only through the currently effective prospectus and are not available to the general public. Shares of this Portfolio may be purchased only by life insurance companies to be used with their separate accounts that fund variable annuity and variable life insurance policies and by qualified pension and retirement plans.
(c)2009 Neuberger Berman Management LLC distributor. All rights reserved.
3
Information About Your Fund's Expenses
This table is designed to provide information regarding costs related to your investments. All mutual funds incur operating expenses, which include management fees, fees for administrative services and costs of shareholder reports, among others. The following examples are based on an investment of $1,000 made at the beginning of the six month period ended December 31, 2008. The table illustrates the fund's costs in two ways:
| Actual Expenses and Performance: | | The first section of the table provides information about actual account values and actual expenses in dollars, based on the fund's actual performance during the period. You may use the information in this line, together with the amount you invested, to estimate the expenses you paid over the period. Simply divide your account value by $1,000 (for example, an $8,600 account value divided by $1,000 = 8.6), then multiply the result by the number in the first section of the table under the heading entitled "Expenses Paid During the Period" to estimate the expenses you paid over the period. | |
|
Hypothetical Example for
Comparison Purposes: | | The second section of the table provides information about hypothetical account values and hypothetical expenses based on the fund's actual expense ratio and an assumed rate of return at 5% per year before expenses. This return is not the fund's actual return. The hypothetical account values and expenses may not be used to estimate the actual ending account balance or expenses you paid for the period. You may use this information to compare the ongoing costs of investing in this fund versus other funds. To do so, compare the expenses shown in this 5% hypothetical example with the 5% hypothetical examples that appear in the shareholder reports of other funds. | |
|
Please note that the expenses in the table are meant to highlight your ongoing costs only. The table and expense example do not include any transactional costs, such as fees and expenses that are, or may be, imposed under your variable contract or qualified pension plan. Therefore, the information under the heading "Hypothetical (5% annual return before expenses)" is useful in comparing ongoing costs only, and will not help you determine the relative total costs of owning different funds. In addition, if these transactional costs were included, your costs would have been higher.
Expense Information as of 12/31/08 (Unaudited)
NEUBERGER BERMAN ADVISERS MANAGEMENT TRUST SOCIALLY RESPONSIVE PORTFOLIO
| Actual | | Beginning Account
Value 7/1/08 | | Ending Account
Value 12/31/08 | | Expenses Paid During
the Period*
7/1/08 - 12/31/08 | | Expense
Ratio | |
| Class I | | $ | 1,000.00 | | | $ | 667.90 | | | $ | 4.23 | | | | 1.01 | % | |
| Class S | | $ | 1,000.00 | | | $ | 669.00 | | | $ | 4.99 | | | | 1.19 | % | |
| Hypothetical (5% annual return before expenses)** | |
| Class I | | $ | 1,000.00 | | | $ | 1,020.06 | | | $ | 5.13 | | | | 1.01 | % | |
| Class S | | $ | 1,000.00 | | | $ | 1,019.15 | | | $ | 6.04 | | | | 1.19 | % | |
* For each class of the fund, expenses are equal to the annualized expense ratio for the class, multiplied by the average account value over the period, multiplied by 184/366 (to reflect the one-half year period shown).
** Hypothetical 5% annual return before expenses is calculated by multiplying the number of days in the most recent half year divided by 366.
4
Schedule of Investments Socially Responsive Portfolio
| NUMBER OF SHARES | | | | MARKET VALUEt | |
| Common Stocks (97.3%) | | | |
| Auto Components (2.0%) | | | |
| | 94,030 | | | BorgWarner, Inc. | | $ | 2,047,033 | | |
| Automobiles (2.0%) | | | |
| | 30,820 | | | Toyota Motor ADR | | | 2,016,861 | | |
| Biotechnology (4.6%) | | | |
| | 63,570 | | | Genzyme Corp. | | | 4,219,141 | * | |
| | 82,850 | | | Medarex, Inc. | | | 462,303 | * | |
| | | | 4,681,444 | | |
| Capital Markets (5.2%) | | | |
| | 115,835 | | | Bank of New York Mellon | | | 3,281,605 | | |
| | 123,729 | | | Charles Schwab | | | 2,000,698 | | |
| | | | 5,282,303 | | |
| Commercial Services & Supplies (2.8%) | | | |
| | 84,385 | | | Manpower Inc. | | | 2,868,246 | | |
| Diversified Financial Services (3.4%) | | | |
| | 4,065 | | | CME Group | | | 845,967 | | |
| | 32,250 | | | IntercontinentalExchange Inc. | | | 2,658,690 | * | |
| | | | 3,504,657 | | |
Electronic Equipment, Instruments &
Components (8.2%) | | | |
| | 115,825 | | | Anixter International | | | 3,488,649 | * | |
| | 199,875 | | | National Instruments | | | 4,868,955 | | |
| | | | 8,357,604 | | |
| Energy Equipment & Services (1.8%) | | | |
| | 79,250 | | | Smith International | | | 1,814,033 | | |
| Health Care Providers & Services (2.6%) | | | |
| | 99,020 | | | UnitedHealth Group | | | 2,633,932 | | |
| Industrial Conglomerates (3.6%) | | | |
| | 63,515 | | | 3M Co. | | | 3,654,653 | | |
| Industrial Gases (3.0%) | | | |
| | 51,390 | | | Praxair, Inc. | | | 3,050,510 | | |
| Insurance (6.1%) | | | |
| | 194,375 | | | Progressive Corp. | | | 2,878,694 | | |
| | 132,355 | | | Willis Group Holdings | | | 3,292,992 | | |
| | | | 6,171,686 | | |
| NUMBER OF SHARES | | | | MARKET VALUEt | |
| Life Science Tools & Services (1.0%) | | | |
| | 20,765 | | | Millipore Corp. | | $ | 1,069,813 | * | |
| Machinery (4.9%) | | | |
| | 88,790 | | | Danaher Corp. | | | 5,026,402 | | |
| Media (15.9%) | | | |
| | 308,177 | | | Comcast Corp. Class A Special | | | 4,977,059 | | |
| | 139,600 | | | Liberty Global Class A | | | 2,222,432 | * | |
| | 24,051 | | | Liberty Global Class C | | | 365,094 | * | |
| | 195,825 | | | Scripps Networks Interactive | | | 4,308,150 | | |
| | 11,059 | | | Washington Post | | | 4,315,775 | | |
| | | | 16,188,510 | | |
| Multi-Utilities (4.6%) | | | |
| | 472,334 | | | National Grid | | | 4,645,033 | | |
| Oil, Gas & Consumable Fuels (7.5%) | | | |
| | 179,563 | | | BG Group PLC | | | 2,470,656 | | |
| | 80,675 | | | Cimarex Energy | | | 2,160,477 | | |
| | 153,010 | | | Newfield Exploration | | | 3,021,947 | * | |
| | | | 7,653,080 | | |
| Pharmaceuticals (3.2%) | | | |
| | 5,186 | | | Novo Nordisk A/S ADR | | | 266,508 | | |
| | 59,539 | | | Novo Nordisk A/S Class B | | | 3,013,282 | | |
| | | | 3,279,790 | | |
| Road & Rail (3.4%) | | | |
| | 94,985 | | | Canadian National Railway | | | 3,491,649 | | |
Semiconductors & Semiconductor
Equipment (8.5%) | | | |
| | 336,355 | | | Altera Corp. | | | 5,620,492 | | |
| | 192,750 | | | Texas Instruments | | | 2,991,480 | | |
| | | | 8,611,972 | | |
| Software (3.0%) | | | |
| | 126,650 | | | Intuit Inc. | | | 3,013,004 | * | |
| |
| | | Total Common Stocks
(Cost $138,166,993) | | | 99,062,215 | | |
See Notes to Schedule of Investments 5
| PRINCIPAL AMOUNT | | | | MARKET VALUEt | |
| Repurchase Agreements (2.2%) | | | |
| $ | 2,247,000 | | | Repurchase Agreement
with Fixed Income
Clearing Corp., 0.01%,
due 1/2/09, dated 12/31/08,
Maturity Value $2,247,001,
Collateralized by $2,230,000,
Fannie Mae, 4.33%,
due 7/28/11
(Collateral Value $2,316,413)
(Cost $2,247,000) | | $ | 2,247,000 | # | |
| Certificates of Deposit (0.2%) | | | |
| | 100,000 | | | Shorebank Chicago, 2.00%,
due 3/15/09 | | | 100,000 | | |
| | 100,000 | | | Shorebank Pacific, 1.28%,
due 2/7/09 | | | 100,000 | | |
| |
| | | Total Certificates of Deposit
(Cost $200,000) | | | 200,000 | # | |
| |
| | | Total Investments (99.7%)
(Cost $140,613,993) | | | 101,509,215 | ## | |
| | | | | Cash, receivables and other assets,
less liabilities (0.3%) | | | 271,515 | | |
| | | | | Total Net Assets (100.0%) | | $ | 101,780,730 | | |
See Notes to Schedule of Investments 6
Notes to Schedule of Investments Socially Responsive Portfolio
t Investments in equity securities by Neuberger Berman Advisers Management Trust Socially Responsive Portfolio (the "Fund") are valued by obtaining valuations from an independent pricing service. The independent pricing service values equity securities at the latest sale price when that price is readily available. Securities traded primarily on the NASDAQ Stock Market are normally valued by the Fund at the NASDAQ Official Closing Price ("NOCP") provided by NASDAQ each business day. The NOCP is the most recently reported price as of 4:00:02 p.m., Eastern time, unless that price is outside the range of the "inside" bid and asked prices (i.e., the bid and asked prices that dealers quote to each other when trading for their own accounts); in that case, NASDAQ will adjust the price to equal the inside bid or asked price, whichever is closer. Because of delays in reporting trades, the NOCP may not be based on the price of the last trade to occur before the market closes. If there is no reported sale of a security on a particular day, the independent pricing service may value the security based on reported market quotations. If a valuation is not available from an independent pricing service, the Fund seeks to obtain quotations from principal market makers. If such quotations are not readily available, securities are valued using methods the Board of Trustees of Neuberger Berman Advisers Management Trust (the "Board") has approved on the belief that they reflect fair value. Numerous factors may be considered when determining the fair value of a security, including available analyst, media or other reports, trading in futures or ADRs and whether the issuer of the security being fair valued has other securities outstanding. Foreign security prices are furnished by independent quotation services and expressed in local currency values. Foreign security prices are currently translated from the local currency into U.S. dollars using the exchange rate as of 4:00 p.m., Eastern time. The Board has approved the use of Interactive Data Pricing and Reference Data, Inc. ("Interactive") to assist in determining the fair value of the Fund's foreign equity securities when changes in the value of a certain index suggest that the closing prices on the foreign exchanges may no longer represent the amount that the Fund could expect to receive for those securities. In this event, Interactive will provide adjusted prices for certain foreign equity securities using a statistical analysis of historical correlations of multiple factors. In the absence of precise information about the market values of these foreign securities as of the close of the New York Stock Exchange, the Board has determined on the basis of available data that prices adjusted in this way are likely to be closer to the prices the Fund could realize on a current sale than are the prices of those securities established at the close of the foreign markets in which the securities primarily trade. Fair value prices are necessarily estimates, and there is no assurance that such a price will be at or close to the price at which the security next trades. Short-term debt securities with less than 60 days until maturity may be valued at cost which, when combined with interest earned, approximates market value.
The Fund adopted Financial Accounting Standards Board ("FASB") Statement of Financial Accounting Standards No. 157, Fair Value Measurements ("FAS 157"), effective January 1, 2008. In accordance with FAS 157, "fair value" is defined as the price that a Fund would receive upon selling an investment in an orderly transaction to an independent buyer in the principal or most advantageous market for the investment. Various inputs are used in determining the value of the Fund's investments.
In addition to defining fair value, FAS 157 established a three-tier hierarchy of inputs to establish a classification of fair value measurements for disclosure purposes. The three-tier hierarchy of inputs is summarized in the three broad Levels listed below.
. Level 1 - quoted prices in active markets for identical investments
. Level 2 - other significant observable inputs (including quoted prices for similar investments, interest rates, prepayment speeds, credit risk, amortized cost, etc.)
. Level 3 - significant unobservable inputs (including the Fund's own assumptions in determining the fair value of investments)
See Notes to Financial Statements 7
Notes to Schedule of Investments Socially Responsive Portfolio (cont'd)
The inputs or methodology used for valuing an investment are not necessarily an indication of the risk associated with investing in those securities.
The following is a summary of the inputs used to value the Fund's investments as of December 31, 2008:
| Valuation Inputs | | Investments in
Securities | |
| Level 1 - Quoted Prices | | $ | 99,062,215 | | |
| Level 2 - Other Significant Observable Inputs | | | 2,447,000 | | |
| Level 3 - Significant Unobservable Inputs | | | - | | |
| Total | | $ | 101,509,215 | | |
# At cost, which approximates market value.
## At December 31, 2008, the cost of investments for U.S. federal income tax purposes was $143,676,429. Gross unrealized appreciation of investments was $1,200,961 and gross unrealized depreciation of investments was $43,368,175, resulting in net unrealized depreciation of $42,167,214, based on cost for U.S. federal income tax purposes.
* Security did not produce income during the last twelve months.
See Notes to Financial Statements 8
Statement of Assets and Liabilities
Neuberger Berman Advisers Management Trust
| | | SOCIALLY
RESPONSIVE
PORTFOLIO | |
| | | December 31, 2008 | |
| Assets | |
| Investments in securities, at market value* (Note A)-see Schedule of Investments: | |
| Unaffiliated issuers | | $ | 101,509,215 | | |
| Cash | | | 13,083 | | |
| Foreign currency | | | 50 | | |
| Dividends and interest receivable | | | 143,486 | | |
| Receivable for Fund shares sold | | | 305,131 | | |
| Receivable for securities lending income (Note A) | | | 1,007 | | |
| Prepaid expenses and other assets | | | 39 | | |
| Total Assets | | | 101,972,011 | | |
| Liabilities | |
| Payable for Fund shares redeemed | | | 65,774 | | |
| Payable to investment manager (Notes A & B) | | | 45,257 | | |
| Payable to administrator-net (Note B) | | | 8,951 | | |
| Accrued expenses and other payables | | | 71,299 | | |
| Total Liabilities | | | 191,281 | | |
| Net Assets at value | | $ | 101,780,730 | | |
| Net Assets consist of: | |
| Paid-in capital | | $ | 153,993,632 | | |
| Undistributed net investment income (loss) | | | 2,218,992 | | |
| Accumulated net realized gains (losses) on investments | | | (15,324,736 | ) | |
| Net unrealized appreciation (depreciation) in value of investments | | | (39,107,158 | ) | |
| Net Assets at value | | $ | 101,780,730 | | |
| Net Assets | |
| Class I | | $ | 51,636,425 | | |
| Class S | | | 50,144,305 | | |
| Shares Outstanding ($.001 par value; unlimited shares authorized) | |
| Class I | | | 5,497,641 | | |
| Class S | | | 5,331,411 | | |
| Net Asset Value, offering and redemption price per share | |
| Class I | | $ | 9.39 | | |
| Class S | | | 9.41 | | |
| *Cost of Investments: | |
| Unaffiliated issuers | | $ | 140,613,993 | | |
| Total cost of foreign currency | | $ | 57 | | |
See Notes to Financial Statements 9
Statement of Operations
Neuberger Berman Advisers Management Trust
| | | SOCIALLY
RESPONSIVE
PORTFOLIO | |
| | | For the
Year Ended
December 31, 2008 | |
| Investment Income: | |
| Income (Note A): | |
| Dividend income-unaffiliated issuers | | $ | 6,491,936 | | |
| Interest income-unaffiliated issuers | | | 235,421 | | |
| Income from securities loaned-net (Note F) | | | 55,582 | | |
| Foreign taxes withheld | | | (135,997 | ) | |
| Total income | | $ | 6,646,942 | | |
| Expenses: | |
| Investment management fees (Notes A & B) | | | 2,209,487 | | |
| Administration fees (Note B): | |
| Class I | | | 1,018,771 | | |
| Class S | | | 223,668 | | |
| Distribution fees (Note B): | |
| Class S | | | 186,390 | | |
| Audit fees | | | 40,493 | | |
| Custodian fees (Note B) | | | 135,937 | | |
| Insurance expense | | | 16,275 | | |
| Legal fees | | | 98,358 | | |
| Shareholder reports | | | 93,368 | | |
| Trustees' fees and expenses | | | 38,147 | | |
| Miscellaneous | | | 23,800 | | |
| Total expenses | | | 4,084,694 | | |
| Expenses reimbursed by administrator (Note B) | | | (71,032 | ) | |
| Expenses reduced by custodian fee expense offset and commission recapture arrangements (Note B) | | | (29,295 | ) | |
| Total net expenses | | | 3,984,367 | | |
| Net investment income (loss) | | $ | 2,662,575 | | |
| Realized and Unrealized Gain (Loss) on Investments (Note A) | |
| Net realized gain (loss) on: | |
| Sales of investment securities of unaffiliated issuers | | | (12,311,535 | ) | |
| Sales of investment securities of affiliated issuers | | | (462,545 | ) | |
| Redemption in-kind | | | 5,365,827 | | |
| Foreign currency | | | (136,744 | ) | |
| Change in net unrealized appreciation (depreciation) in value of: | |
| Unaffiliated investment securities | | | (95,753,828 | ) | |
| Foreign currency | | | (7,524 | ) | |
| Net gain (loss) on investments | | | (103,306,349 | ) | |
| Net increase (decrease) in net assets resulting from operations | | $ | (100,643,774 | ) | |
See Notes to Financial Statements 10
Statements of Changes in Net Assets
Neuberger Berman Advisers Management Trust
| | | SOCIALLY RESPONSIVE PORTFOLIO | |
| | | Year Ended
December 31,
2008 | | Year Ended
December 31,
2007 | |
| Increase (Decrease) in Net Assets: | |
| From Operations: | |
| Net investment income (loss) | | $ | 2,662,575 | | | $ | 3,004,933 | | |
| Net realized gain (loss) on investments | | | (7,544,997 | ) | | | 8,746,817 | | |
| Change in net unrealized appreciation (depreciation) of investments | | | (95,761,352 | ) | | | 18,142,679 | | |
| Net increase (decrease) in net assets resulting from operations | | | (100,643,774 | ) | | | 29,894,429 | | |
| Distributions to Shareholders From (Note A): | |
| Net investment income: | |
| Class I | | | (1,623,563 | ) | | | (427,951 | ) | |
| Class S | | | (1,370,229 | ) | | | (17,131 | ) | |
| Net realized gain on investments: | |
| Class I | | | (5,548,809 | ) | | | (1,609,650 | ) | |
| Class S | | | (5,503,467 | ) | | | (302,640 | ) | |
| Total distributions to shareholders | | | (14,046,068 | ) | | | (2,357,372 | ) | |
| From Fund Share Transactions (Note D): | |
| Proceeds from shares sold: | |
| Class I | | | 68,378,900 | | | | 296,255,440 | | |
| Class S | | | 5,844,369 | | | | 8,865,625 | | |
| Proceeds from reinvestment of dividends and distributions: | |
| Class I | | | 7,172,372 | | | | 2,037,601 | | |
| Class S | | | 6,873,696 | | | | 319,771 | | |
| Payments for shares redeemed: | |
| Class I | | | (508,016,238 | ) | | | (24,274,098 | ) | |
| Class S | | | (11,960,896 | ) | | | (16,760,067 | ) | |
| Net increase (decrease) from Fund share transactions | | | (431,707,797 | ) | | | 266,444,272 | | |
| Net Increase (Decrease) in Net Assets | | | (546,397,639 | ) | | | 293,981,329 | | |
| Net Assets: | |
| Beginning of year | | | 648,178,369 | | | | 354,197,040 | | |
| End of year | | $ | 101,780,730 | | | $ | 648,178,369 | | |
| Undistributed net investment income (loss) at end of year | | $ | 2,218,992 | | | $ | 2,992,750 | | |
See Notes to Financial Statements 11
Notes to Financial Statements Socially Responsive Portfolio
Note A-Summary of Significant Accounting Policies:
1 General: Socially Responsive Portfolio (the "Fund") is a separate operating series of Neuberger Berman Advisers Management Trust (the "Trust"), a Delaware statutory trust organized pursuant to a Trust Instrument dated May 23, 1994. The Trust is currently comprised of ten separate operating series (each a "Series," collectively, the "Funds") each of which is diversified. The Trust is registered as an open-end management investment company under the Investment Company Act of 1940, as amended (the "1940 Act"), and its shares are registered under the Securities Act of 1933, as amended (the "1933 Act"). The Fund currently offers Class I and Class S shares. The Board of Trustees of the Trust (the "Board") may establish additional series or classes of shares without the approval of shareholders.
The assets of each Series belong only to that Series, and the liabilities of each Series are borne solely by that Series and no other.
The preparation of financial statements in accordance with U.S. generally accepted accounting principles requires Neuberger Berman Management LLC ("Management") to make estimates and assumptions at the date of the financial statements. Actual results could differ from those estimates.
Management, the investment manager of the Fund, and Neuberger Berman, LLC ("Neuberger"), the Fund's sub-adviser, are wholly owned subsidiaries of Lehman Brothers Holdings Inc. ("Lehman Brothers"), a publicly owned holding company. On September 15, 2008, Lehman Brothers filed a voluntary petition under Chapter 11 of the U.S. Bankruptcy Code. On December 3, 2008, NBSH Acquisition, LLC ("NBSH"), an entity organized by key members of Neuberger Berman's senior management, was selected as the successful bidder in the public auction to acquire a majority interest in Neuberger Berman's business and the fixed income and certain alternative asset management businesses of Lehman Brothers' Investment Management Division (together with Neuberger Berman, the "Acquired Businesses") (the "Proposed Acquisition"). On December 22, 2008, the bankruptcy court having jurisdiction over the Lehman Brothers matter approved the sale of the Acquired Businesses to NBSH (or its successor or assign), as the successful bidder. At the closing of the Proposed Acquisition, a majority interest in the Acquired Businesses will be directly or indirectly owned by portfolio managers, Neuberger Berman's management team and certain key members and senior professionals of the former Investment Management Division, as well as by Lehman Brothers and certain affiliates of Lehman Brothers. The transaction is subject to certain conditions and approvals.
These events, while affecting Lehman Brothers, have not had a material impact on the Fund or its operations. Management and Neuberger will continue to operate in the ordinary course of business as the investment manager and sub-adviser of the Fund.
Included in the Acquired Businesses are Management and Neuberger. The consummation of the Proposed Acquisition has been deemed to result in an "assignment" of the Fund's Management and Sub-Advisory Agreements which would, by law, automatically terminate those agreements. Accordingly, the Board, including the Trustees who are not "interested persons" of the Fund's investment manager and its affiliates or the Fund, has approved the new Management Agreements and Sub-Advisory Agreements for the Fund. The new agreements also will require the approval of the Fund's shareholders.
2 Portfolio valuation: Investment securities are valued as indicated in the notes following the Schedule of Investments.
3 Foreign currency translation: The accounting records of the Fund are maintained in U.S. dollars. Foreign currency amounts are currently translated into U.S. dollars using the exchange rates as of 4:00 p.m., Eastern time, to determine the value of investments, other assets and liabilities. Purchase and sale prices of securities, and income and expenses, are translated into U.S. dollars at the prevailing rate of exchange on the respective dates of such
12
transactions. Net unrealized foreign currency gain (loss) arises from changes in the value of assets and liabilities, other than investments in securities, as a result of changes in exchange rates and is stated separately in the Statement of Operations.
4 Securities transactions and investment income: Securities transactions are recorded on trade date for financial reporting purposes. Dividend income is recorded on the ex-dividend date or, for certain foreign dividends, as soon as the Fund becomes aware of the dividends. Non-cash dividends included in dividend income, if any, are recorded at the fair market value of the securities received. Interest income, including accretion of original issue discount, where applicable, and accretion of discount on short-term investments, is recorded on the accrual basis. Realized gains and losses from securities transactions and foreign currency transactions, if any, are recorded on the basis of identified cost and stated separately in the Statement of Operations. Included in net realized gain (loss) on investments are proceeds from the settlements of class action litigation in which the Fund participated as a plaintiff. The amount of such proceeds for the year ended December 31, 2008 was $309,838.
5 Income tax information: The Funds are treated as separate entities for U.S. federal income tax purposes. It is the policy of the Fund to continue to qualify as a regulated investment company by complying with the requirements of Subchapter M of the Internal Revenue Code applicable to regulated investment companies and to distribute substantially all of its earnings to shareholders. Therefore, no federal income or excise tax provision is required.
The Fund has adopted the provisions of Financial Accounting Standards Board Interpretation No. 48 ("FIN 48") "Accounting for Uncertainty in Income Taxes-an interpretation of FASB Statement No. 109". FIN 48 sets forth a minimum threshold for financial statement recognition of the benefit of a tax position taken, or expected to be taken, in a tax return. The Fund recognizes interest and penalties, if any, related to unrecognized tax benefits as an income tax expense in the Statement of Operations. The Fund is subject to examination by U.S. federal and state tax authorities for returns filed for the prior three fiscal years 2005 - 2007. As of December 31, 2008, the Fund did not have any unrecognized tax benefits.
Income distributions and capital gain distributions are determined in accordance with income tax regulations, which may differ from U.S. generally accepted accounting principles. These differences are primarily due to differing treatments of income and gains on various investment securities held by the Fund, timing differences and differing characterization of distributions made by the Fund as a whole. The Fund may also utilize earnings and profits distributed to shareholders on redemption of shares as a part of the dividends paid deduction for income tax purposes.
As determined on December 31, 2008, permanent differences resulting primarily from different book and tax accounting for foreign currency gains and losses, capital gain distributions from real estate investment trusts and redemptions in kind were reclassified at fiscal year-end. These reclassifications had no effect on net income, net asset value or net asset value per share of the Fund.
The tax character of distributions paid during the years ended December 31, 2008 and December 31, 2007 was as follows:
| Distributions Paid From: | |
| Ordinary Income | | Long-Term
Capital Gain | | Total | |
| 2008 | | 2007 | | 2008 | | 2007 | | 2008 | | 2007 | |
| $ | 4,101,032 | | | $ | 2,357,372 | | | $ | 9,945,036 | | | $ | - | | | $ | 14,046,068 | | | $ | 2,357,372 | | |
As of December 31, 2008, the components of distributable earnings (accumulated losses) on a U.S. federal income tax basis were as follows:
Undistributed
Ordinary
Income | | Undistributed
Long-Term
Gain | | Unrealized
Appreciation
(Depreciation) | | Loss
Carryforwards
and Deferrals | | Total | |
| $ | 2,218,992 | | | $ | - | | | $ | (42,169,595 | ) | | $ | (12,262,299 | ) | | $ | (52,212,902 | ) | |
13
The difference between book basis and tax basis distributable earnings is attributable primarily to timing differences of wash sales, partnership basis adjustment, capital loss carryforwards and post October loss deferral.
To the extent the Fund's net realized capital gains, if any, can be offset by capital loss carryforwards, it is the policy of the Fund not to distribute such gains. As determined at December 31, 2008, the Fund had unused capital loss carryforwards available for federal income tax purposes to offset net realized capital gains, if any, as follows:
| Expiring In: | |
| 2016 | |
| $ | 7,357,742 | | |
Under current tax law, the use of these losses to offset future gains may be limited in a given year. Under current tax law, certain net capital and net foreign currency losses realized after October 31 within the taxable year may be deferred and treated as occurring on the first day of the following tax year. For the year ended December 31, 2008, the Fund elected to defer $4,904,557 net capital losses arising between November 1, 2008 and December 31, 2008.
6 Distributions to shareholders: The Fund may earn income, net of expenses, daily on its investments. Distributions from net investment income and net realized capital gains, if any, generally are distributed in October. Income distributions and capital gain distributions to shareholders are recorded on the ex-date.
7 Foreign taxes: Foreign taxes withheld represent amounts withheld by foreign tax authorities, net of refunds recoverable.
8 Expense allocation: Certain expenses are applicable to multiple funds. Expenses directly attributable to a Series are charged to that Series. Expenses of the Trust that are not directly attributed to a Series are allocated among the Funds, on the basis of relative net assets, except where a more appropriate allocation of expenses to each of the Funds can otherwise be made fairly. Expenses borne by the complex of related investment companies, which includes open-end and closed-end investment companies for which Management serves as investment manager, that are not directly attributed to a Series or the Trust are allocated among the Fund and the other investment companies in the complex or series thereof on the basis of relative net assets, except where a more appropriate allocation of expenses to each investment company in the complex or series thereof can otherwise be made fairly. The Fund's expenses (other than those specific to each class) are allocated proportionally each day between the classes based upon the relative net assets of each class.
9 Security lending: A third party, eSecLending, has assisted the Fund in conducting a bidding process to identify agents/principals that would pay a guaranteed amount to the Fund in consideration of the Fund entering into an exclusive securities lending arrangement.
eSecLending currently serves as exclusive lending agent for the Fund. Under the securities lending arrangement, the Fund receives cash collateral at the beginning of each transaction equal to at least 102% of the prior day's market value of the loaned securities (105% in the case of international securities). The Fund may invest all the cash collateral in Neuberger Berman Securities Lending Quality Fund, LLC ("Quality Fund"), a fund managed by Lehman Brothers Asset Management LLC ("LBAM"), an affiliate of Management.
At various times during the course of the Fund's fiscal year ended December 31, 2008, the Quality Fund's NAV was below $1.00 per share, which could have affected the NAV of the Fund with securities loans outstanding during the period. The Quality Fund's price per share on December 31, 2008 was $1.00. The market value of the Fund's investments in the Quality Fund as of that date, if any, is reflected in the Fund's Schedule of Investments. If it were necessary to liquidate assets in the Quality Fund to meet returns on outstanding securities loans at a time when the Quality Fund's price per share was less than $1.00, the Fund may not receive an amount from the Quality Fund that is equal in amount to the collateral the Fund would be required to return to the borrower of the securities and the Fund would be required to make up for this shortfall. In addition, as a result of recent reduced liquidity in the credit and fixed income markets, it may be difficult to dispose quickly of some securities in the Quality Fund at the price at which the Quality Fund is carrying them. The Quality Fund is not a money market fund that operates in accordance with Rule 2a-7 under the 1940 Act and there is no assurance that it will maintain a $1.00 share price.
14
Net income from the lending program represents the guaranteed amount received from a principal plus income earned on the cash collateral invested in Quality Fund or in other investments, less cash collateral fees and other expenses associated with the loans. For the fiscal year ended December 31, 2008, the Fund received net income under the securities lending arrangement of $55,582, which is reflected in the Statement of Operations under the caption "Income from securities loaned-net." For the fiscal year ended December 31, 2008, "Income from securities loaned-net" consisted of $570,817 in income earned on cash collateral and guaranteed amounts (including $502,402 of interest income earned from the Quality Fund), less fees and expenses paid of $515,235.
10 Repurchase agreements: The Fund may enter into repurchase agreements with institutions that Management has determined are creditworthy. Each repurchase agreement is recorded at cost. The Fund requires that the securities purchased in a repurchase agreement be transferred to the custodian in a manner sufficient to enable the Fund to assert a perfected security interest in those securities in the event of a default under the repurchase agreement. The Fund monitors, on a daily basis, the value of the securities transferred to ensure that their value, including accrued interest, is greater than amounts owed to the Fund under each such repurchase agreement.
11 Indemnifications: Like many other companies, the Trust's organizational documents provide that its officers and trustees are indemnified against certain liabilities arising out of the performance of their duties to the Trust. In addition, both in some of its principal service contracts and in the normal course of its business, the Trust enters into contracts that provide indemnifications to other parties for certain types of losses or liabilities. The Trust's maximum exposure under these arrangements is unknown as this could involve future claims against the Trust.
12 Other: All net investment income and realized and unrealized capital gains and losses of the Fund are allocated, on the basis of relative net assets, pro rata among its respective classes.
Note B-Management Fees, Administration Fees, Distribution Arrangements, and Other Transactions With Affiliates:
Fund shares are issued and redeemed in connection with investments in and payments under certain variable annuity contracts and variable life insurance policies issued through separate accounts of life insurance companies and are also offered directly to qualified pension and retirement plans.
The Fund retains Management as its investment manager under a Management Agreement. For such investment management services, the Fund pays Management a fee at the annual rate of 0.55% of the first $250 million of the Fund's average daily net assets, 0.525% of the next $250 million, 0.50% of the next $250 million, 0.475% of the next $250 million, 0.45% of the next $500 million, 0.425% of the next $2.5 billion, and 0.40% of average daily net assets in excess of $4 billion.
The Fund retains Management as its administrator under an Administration Agreement. Each class pays Management an administration fee at the annual rate of 0.30% of its average daily net assets under this agreement. Additionally, Management retains State Street Bank and Trust Company ("State Street") as its sub-administrator under a Sub-Administration Agreement. Management pays State Street a fee for all services received under this agreement.
The Board adopted a non-fee distribution plan for the Fund's Class I.
For the Fund's Class S, Management acts as agent in arranging for the sale of class shares without commission and bears advertising and promotion expenses. The Board has adopted a distribution plan (the "Plan") with respect to this class, pursuant to Rule 12b-1 under the 1940 Act. The Plan provides that, as compensation for administrative and other services provided to this class, Management's activities and expenses related to the sale and distribution of this class of shares, and ongoing services provided to investors in this class, Management receives from this class a fee at an annual rate of 0.25% of Class S's average daily net assets. Management receives this amount to provide distribution and shareholder servicing for this class and pays a portion of it to institutions that provide such services. Those institutions may use payments for, among other purposes, compensating employees engaged in
15
sales and/or shareholder servicing. The amount of fees paid by the class during any year may be more or less than the cost of distribution and other services provided to this class. FINRA rules limit the amount of annual distribution fees that may be paid by a mutual fund and impose a ceiling on the cumulative distribution fees paid. The Trust's Plan complies with those rules.
Management has contractually undertaken to forgo current payment of fees and/or reimburse the Fund's Class I and Class S shares for their operating expenses (exclusive of interest, taxes, brokerage commissions, extraordinary expenses, and transaction costs) ("Operating Expenses") which exceed the expense limitation as detailed in the following table:
| | | Expense Limitation (1) | | Expiration | | Reimbursement from
Management for
the Year Ended
December 31, 2008 | |
| Class I | | | 1.30 | % | | | 12/31/11 | | | $ | - | | |
| Class S | | | 1.17 | % | | | 12/31/11 | | | $ | 71,032 | | |
(1) Expense limitation per annum of the respective class' average daily net assets.
Each respective class has agreed to repay Management through December 31, 2014 for fees and expenses foregone and/or its excess Operating Expenses previously reimbursed by Management, so long as its annual Operating Expenses during that period do not exceed its expense limitation, and the repayment is made within three years after the year in which Management issued the reimbursement or waived fees. During the year ended December 31, 2008, there was no repayment to Management under these agreements. At December 31, 2008, the Fund's Class I shares had no contingent liability to Management under this agreement. At December 31, 2008, the Fund's Class S shares contingent liabilities to Management under this agreement were as follows:
| | | Expiring in: | | | |
| | | 2009 | | 2011 | | Total | |
| Class S | | $ | 5,094 | | | $ | 71,032 | | | $ | 76,126 | | |
Neuberger is retained by Management to furnish it with investment recommendations and research information without added cost to the Fund. Several individuals who are officers and/or trustees of the Trust are also employees of Neuberger and/or Management.
The Fund had entered into a commission recapture program, which enabled it to pay some of its operational expenses by recouping a portion of the commissions it paid to a broker that was not a related party of the Fund. Pursuant to the agreement, brokers paid recaptured commissions to the Fund's custodian and the custodian directed these amounts toward payment of expenses such as custodial, transfer agency or accounting services. Effective April 1, 2008, this commission recapture program was terminated. For the period ended March 31, 2008, the impact of this arrangement was a reduction of expenses of $26,520.
The Fund has an expense offset arrangement in connection with its custodian contract. For the year ended December 31, 2008, the impact of this arrangement was a reduction of expenses of $2,775.
Note C-Securities Transactions:
During the year ended December 31, 2008, there were purchase and sale transactions (excluding short-term securities) of $166,504,965 and $580,535,029, respectively.
During the year ended December 31, 2008, brokerage commissions on securities transactions paid to affiliated brokers were as follows: Neuberger received $0 and Lehman Brothers Inc. received $55,044.
16
Note D-Fund Share Transactions:
Share activity for the years ended December 31, 2008 and December 31, 2007 was as follows:
For the Year Ended December 31, 2008
| | | Shares Sold | | Shares Issued on
Reinvestment of
Dividends and
Distributions | | Shares
Redeemed | | Total | |
| Class I | | | 4,171,564 | | | | 740,183 | | | | (30,562,519 | ) | | | (25,650,772 | ) | |
| Class S | | | 388,203 | | | | 708,629 | | | | (818,006 | ) | | | 278,826 | | |
For the Year Ended December 31, 2007
| | | Shares Sold | | Shares Issued on
Reinvestment of
Dividends and
Distributions | | Shares
Redeemed | | Total | |
| Class I | | | 16,651,437 | | | | 111,283 | | | | (1,331,641 | ) | | | 15,431,079 | | |
| Class S | | | 498,048 | | | | 17,502 | | | | (951,011 | ) | | | (435,461 | ) | |
Note E-Line of Credit:
At December 31, 2008, the Fund was a participant in a single committed, unsecured $150,000,000 line of credit with State Street, to be used only for temporary or emergency purposes. Other investment companies managed by Management also participate in this line of credit on the same terms. Interest is charged on borrowings under this line of credit at the overnight Federal Funds Rate plus 0.50% per annum. A facility fee of 0.07% (as of September 19, 2008, 0.09%) per annum of the available line of credit is charged, of which the Fund has agreed to pay its pro rata share, based on the ratio of its individual net assets to the net assets of all participants at the time the fee is due and payable. The fee is paid quarterly in arrears. Because several investment companies participate, there is no assurance that an individual Fund will have access to all or any part of the $150,000,000 at any particular time. There were no loans outstanding pursuant to this line of credit at December 31, 2008. During the year ended December 31, 2008, the Fund did not utilize this line of credit.
Note F-Investments In Affiliates:
| Name of Issuer | | Balance of
Shares Held
December 31,
2007 | | Gross
Purchases
and Additions | | Gross
Sales and
Reductions | | Balance of
Shares Held
December 31,
2008 | | Value
December 31,
2008 | | Income from
Investments
in Affiliated
Issuers
Included in
Total Income | |
Neuberger Berman
Securities Lending
Quality Fund, LLC* | | | 31,645,361 | | | | 171,469,498 | | | | 203,114,859 | | | | - | | | $ | - | | | $ | 502,402 | | |
* Quality Fund, a fund managed by LBAM, an affiliate of Management, is used to invest cash the Fund receives as collateral for securities loans as approved by the Board. Because all shares of Quality Fund are held by funds in the related investment management complex, Quality Fund may be considered an affiliate of the Fund.
17
Note G-Recent Accounting Pronouncement:
In March 2008, Statement of Financial Accounting Standards No. 161, "Disclosures about Derivative Instruments and Hedging Activities-an amendment of FASB Statement No. 133" ("FAS 161"), was issued. FAS 161 is intended to improve financial reporting for derivative instruments by requiring enhanced disclosure that enables investors to understand how and why an entity uses derivatives, how derivatives are accounted for, and how derivative instruments affect an entity's results of operations and financial position. In September 2008, FASB Staff Position No. 133-1 and FASB Interpretation No. 45-4 (the "FSP"), "Disclosures about Credit Derivatives and Certain Guarantees: An Amendment of FASB Statement No. 133 and FASB Interpretation No. 45; and Clarification of the Effective Date of FASB Statement No. 161" was issued. Certain provisions of the FSP amend FASB Statement No. 133, "Accounting for Derivative Instruments and Hedging Activities," to require disclosures by sellers of credit derivatives, including credit derivatives embedded in hybrid instruments. These FSP provisions are effective for fiscal years and interim periods ending after November 15, 2008. At this time, Management has assessed the implication of these FSP provisions and determined there is no impact to the Fund's financial statements. The FSP also clarifies the effective date of FAS 161, whereby disclosures required by FAS 161 are effective for financial statements issued for fiscal years and interim periods beginning after November 15, 2008. The impact of FAS 161 on the Fund's financial statement disclosures, if any, is currently being assessed.
Note H-Recent Market Events:
The year covered by this report witnessed an unusually high degree of volatility in the financial markets and the net asset values of many mutual funds, including to some extent the Fund. Both domestic and international equity markets have been experiencing heightened volatility and turmoil, with issuers that have exposure to the real estate, mortgage and credit markets particularly affected. In addition to the recent turbulence in financial markets, the reduced liquidity in credit and fixed income markets has negatively affected many issuers worldwide. The Fund's investments in certain issuers, as reflected in the Fund's schedule of investments, and the financial markets in general, expose investors to the volatile performance resulting from these market conditions and related events.
18
Financial Highlights
Socially Responsive Portfolio
The following tables include selected data for a share outstanding throughout each period and other performance information derived from the Financial Statements.
Class I
| | | Year Ended December 31, | |
| | | 2008 | | 2007 | | 2006 | | 2005 | | 2004 | |
| Net Asset Value, Beginning of Year | | $ | 17.91 | | | $ | 16.71 | | | $ | 14.91 | | | $ | 13.99 | | | $ | 12.35 | | |
| Income From Investment Operations: | |
| Net Investment Income (Loss)t | | | .11 | | | | .12 | | | | .05 | | | | .08 | | | | (.00 | ) | |
Net Gains or Losses on Securities
(both realized and unrealized) | | | (7.13 | ) | | | 1.16 | | | | 1.98 | | | | .88 | | | | 1.64 | | |
| Total From Investment Operations | | | (7.02 | ) | | | 1.28 | | | | 2.03 | | | | .96 | | | | 1.64 | | |
| Less Distributions From: | |
| Net Investment Income | | | (.34 | ) | | | (.02 | ) | | | (.03 | ) | | | - | | | | - | | |
| Net Capital Gains | | | (1.16 | ) | | | (.06 | ) | | | (.20 | ) | | | (.04 | ) | | | - | | |
| Total Distributions | | | (1.50 | ) | | | (.08 | ) | | | (.23 | ) | | | (.04 | ) | | | - | | |
| Net Asset Value, End of Year | | $ | 9.39 | | | $ | 17.91 | | | $ | 16.71 | | | $ | 14.91 | | | $ | 13.99 | | |
| Total Returntt | | | (39.44 | )% | | | 7.61 | % | | | 13.70 | % | | | 6.86 | % | | | 13.28 | % | |
| Ratios/Supplemental Data | |
| Net Assets, End of Year (in millions) | | $ | 51.6 | | | $ | 557.9 | | | $ | 262.6 | | | $ | 50.5 | | | $ | 21.7 | | |
| Ratio of Gross Expenses to Average Net Assets# | | | .92 | % | | | .92 | % | | | 1.07 | % | | | 1.30 | % | | | 1.31 | % | |
| Ratio of Net Expenses to Average Net Assets | | | .92 | % | | | .91 | % | | | 1.06 | %S | | | 1.29 | %S | | | 1.29 | %S | |
Ratio of Net Investment Income (Loss) to
Average Net Assets | | | .70 | % | | | .65 | % | | | .33 | % | | | .53 | % | | | (.03 | )% | |
| Portfolio Turnover Rate | | | 41 | % | | | 26 | % | | | 56 | % | | | 24 | % | | | 21 | % | |
See Notes to Financial Highlights 19
Financial Highlights (cont'd)
Class S
| | | Year Ended December 31, | | Period from
May 1, 2006^
to December 31, | |
| | | 2008 | | 2007 | | 2006 | |
| Net Asset Value, Beginning of Period | | $ | 17.86 | | | $ | 16.69 | | | $ | 15.59 | | |
| Income From Investment Operations: | |
| Net Investment Income (Loss)t | | | .06 | | | | .06 | | | | .02 | | |
| Net Gains or Losses on Securities (both realized and unrealized) | | | (7.06 | ) | | | 1.17 | | | | 1.08 | | |
| Total From Investment Operations | | | (7.00 | ) | | | 1.23 | | | | 1.10 | | |
| Less Distributions From: | |
| Net Investment Income | | | (.29 | ) | | | (.00 | ) | | | - | | |
| Net Capital Gains | | | (1.16 | ) | | | (.06 | ) | | | - | | |
| Total Distributions | | | (1.45 | ) | | | (.06 | ) | | | - | | |
| Net Asset Value, End of Period | | $ | 9.41 | | | $ | 17.86 | | | $ | 16.69 | | |
| Total Returntt | | | (39.43 | )% | | | 7.37 | % | | | 7.06 | %** | |
| Ratios/Supplemental Data | |
| Net Assets, End of Period (in millions) | | $ | 50.1 | | | $ | 90.2 | | | $ | 91.6 | | |
| Ratio of Gross Expenses to Average Net Assets# | | | 1.17 | % | | | 1.17 | % | | | 1.17 | %* | |
| Ratio of Net Expenses to Average Net AssetsS | | | 1.17 | % | | | 1.16 | % | | | 1.16 | %* | |
| Ratio of Net Investment Income (Loss) to Average Net Assets | | | .40 | % | | | .37 | % | | | .16 | %* | |
| Portfolio Turnover Rate | | | 41 | % | | | 26 | % | | | 56 | %o | |
See Notes to Financial Highlights 20
Notes to Financial Highlights Socially Responsive Portfolio
tt Total return based on per share net asset value reflects the effects of changes in net asset value on the performance of the Fund during each fiscal period and assumes dividends and other distributions, if any, were reinvested. Results represent past performance and do not guarantee future results. Current returns may be lower or higher than the performance data quoted. Investment returns and principal may fluctuate and shares when redeemed may be worth more or less than original cost. Total return would have been lower if Management had not reimbursed certain expenses. Total return would have been higher if Management had not recouped previously reimbursed expenses. The total return information shown does not reflect charges and other expenses that apply to the separate account or the related insurance policies, and the inclusion of these charges and other expenses would reduce the total return for all fiscal periods shown.
# The Fund is required to calculate an expense ratio without taking into consideration any expense reductions related to expense offset arrangements.
S After reimbursement of expenses by Management. Had Management not undertaken such action, the annualized ratios of net expenses to average daily net assets would have been:
| | | Year Ended December 31, | |
| | | 2008 | | 2007 | | 2006 | | 2005 | | 2004 | |
| Socially Responsive Portfolio Class I | | | - | | | | - | | | | - | | | | 1.33 | % | | | 1.73 | % | |
| Socially Responsive Portfolio Class S | | | 1.26 | % | | | - | | | | 1.18 | %(1) | | | - | | | | - | | |
(1) Period from May 1, 2006 to December 31, 2006.
After reimbursement of expenses previously paid by Management. Had Management not been reimbursed, the annualized ratio of net expenses to average daily net assets would have been:
| | | Year Ended December 31, | |
| | | 2007 | | 2006 | |
| Socially Responsive Portfolio Class I | | | - | | | | 0.97 | % | |
| Socially Responsive Portfolio Class S | | | 1.16 | % | | | - | | |
t Calculated based on the average number of shares outstanding during each fiscal period.
x The date investment operations commenced.
O Portfolio turnover is calculated at the Fund level. Percentage indicated was calculated for year ended December 31, 2006.
* Annualized.
** Not annualized.
21
Report of Independent Registered Public Accounting Firm
To the Board of Trustees of
Neuberger Berman Advisers Management Trust and
Shareholders of Socially Responsive Portfolio
We have audited the accompanying statement of assets and liabilities, including the schedule of investments, of Socially Responsive Portfolio, one of the series constituting Neuberger Berman Advisers Management Trust (the "Trust"), as of December 31, 2008, and the related statement of operations for the year then ended, the statement of changes in net assets for each of the two years in the period then ended, and the financial highlights for each of the five years in the period then ended. These financial statements and financial highlights are the responsibility of the Trust's management. Our responsibility is to express an opinion on these financial statements and financial highlights based on our audits.
We conducted our audits in accordance with the standards of the Public Company Accounting Oversight Board (United States). Those standards require that we plan and perform the audit to obtain reasonable assurance about whether the financial statements and financial highlights are free of material misstatement. We were not engaged to perform an audit of the Trust's internal control over financial reporting. Our audits included consideration of internal control over financial reporting as a basis for designing audit procedures that are appropriate in the circumstances, but not for the purpose of expressing an opinion on the effectiveness of the Trust's internal control over financial reporting. Accordingly, we express no such opinion. An audit also includes examining, on a test basis, evidence supporting the amounts and disclosures in the financial statements and financial highlights, assessing the accounting principles used and significant estimates made by management, and evaluating the overall financial statement presentation. Our procedures included confirmation of securities owned as of December 31, 2008 by correspondence with the custodian and brokers. We believe that our audits provide a reasonable basis for our opinion.
In our opinion, the financial statements and financial highlights referred to above present fairly, in all material respects, the financial position of Socially Responsive Portfolio, a series of Neuberger Berman Advisers Management Trust, at December 31, 2008, the results of its operations for the year then ended, the changes in its net assets for each of the two years in the period then ended, and the financial highlights for each of the five years in the period then ended, in conformity with U.S. generally accepted accounting principles.

Boston, Massachusetts
February 9, 2009
22
Trustee and Officer Information
The following tables set forth information concerning the trustees and officers of the Trust. All persons named as trustees and officers also serve in similar capacities for other funds administered or managed by Neuberger Berman Management LLC ("NB Management") and Neuberger Berman, LLC ("Neuberger Berman"). The Statement of Additional Information includes additional information about fund trustees and is available upon request, without charge, by calling (800) 877-9700.
Information about the Board of Trustees
Name, (Year of Birth),
and Address(1) | | Position and
Length of
Time Served(2) | | Principal Occupation(s)(3) | | Number of
Funds in Fund
Complex
Overseen by
Fund Trustee | | Other Directorships
Held Outside Fund
Complex by Fund
Trustee | |
| Independent Fund Trustees | |
|
| John Cannon (1930) | | Trustee since 2000 | | Consultant; formerly, Chairman, CDC Investment Advisers (registered investment adviser), 1993 to January 1999; formerly, President and Chief Executive Officer, AMA Investment Advisors, an affiliate of the American Medical Association. | | | 56 | | | Independent Trustee or Director of three series of Oppenheimer Funds: Oppenheimer Limited Term New York Municipal Fund, Rochester Fund Municipals, and Oppenheimer Convertible Securities Fund since 1992. | |
|
| Faith Colish (1935) | | Trustee since 1982 | | Counsel, Carter Ledyard & Milburn LLP (law firm) since October 2002; formerly, Attorney-at-Law and President, Faith Colish, A Professional Corporation, 1980 to 2002. | | | 56 | | | Formerly, Director (1997 to 2003) and Advisory Director (2003 to 2006), ABA Retirement Funds (formerly, American Bar Retirement Association) (not-for-profit membership corporation). | |
|
| Martha C. Goss (1949) | | Trustee since 2007 | | President, Woodhill Enterprises Inc./Chase Hollow Associates LLC (personal investment vehicle), since 2006; Chief Operating and Financial Officer, Hopewell Holdings LLC/ Amwell Holdings, LLC (a holding company for a healthcare reinsurance company start-up), since 2003; formerly, Consultant, Resources Connection (temporary staffing), 2002 to 2006. | | | 56 | | | Director, Ocwen Financial Corporation (mortgage servicing), since 2005; Director, American Water (water utility), since 2003; Director, Channel Reinsurance (financial guaranty reinsurance), since 2006; Advisory Board Member, Attensity (software developer), since 2005; Director, Allianz Life of New York (insurance), since 2005; Director, Financial Women's Association of New York (not for profit association), since 2003; Trustee Emerita, Brown University, since 1998. | |
|
23
Name, (Year of Birth),
and Address(1) | | Position and
Length of
Time Served(2) | | Principal Occupation(s)(3) | | Number of
Funds in Fund
Complex
Overseen by
Fund Trustee | | Other Directorships
Held Outside Fund
Complex by Fund
Trustee | |
| C. Anne Harvey (1937) | | Trustee since 1998 | | President, C.A. Harvey Associates, since October 2001; formerly, Director, AARP, 1978 to December 2001. | | | 56 | | | Formerly, President, Board of Associates to The National Rehabilitation Hospital's Board of Directors, 2001 to 2002; formerly, Member, Individual Investors Advisory Committee to the New York Stock Exchange Board of Directors, 1998 to June 2002. | |
|
| Robert A. Kavesh (1927) | | Trustee since 2000 | | Retired; Marcus Nadler Professor Emeritus of Finance and Economics, New York University Stern School of Business; formerly, Executive Secretary-Treasurer, American Finance Association, 1961 to 1979. | | | 56 | | | Formerly, Director, The Caring Community (not-for-profit), 1997 to 2006; formerly, Director, DEL Laboratories, Inc. (cosmetics and pharmaceuticals), 1978 to 2004; formerly, Director, Apple Bank for Savings, 1979 to 1990; formerly, Director, Western Pacific Industries, Inc., 1972 to 1986 (public company). | |
|
| Michael M. Knetter (1960) | | Trustee since 2007 | | Dean, School of Business, University of Wisconsin - Madison; formerly, Professor of International Economics and Associate Dean, Amos Tuck School of Business - Dartmouth College, 1998 to 2002. | | | 56 | | | Trustee, Northwestern Mutual Series Fund, Inc., since February 2007; Director, Wausau Paper, since 2005; Director, Great Wolf Resorts, since 2004. | |
|
| Howard A. Mileaf (1937) | | Trustee since 1999 | | Retired; formerly, Vice President and General Counsel, WHX Corporation (holding company), 1993 to 2001. | | | 56 | | | Formerly, Director, Webfinancial Corporation (holding company), 2002 to 2008; formerly, Director WHX Corporation (holding company), January 2002 to June 2005; formerly, Director, State Theatre of New Jersey (not-for-profit theater), 2000 to 2005. | |
|
24
Name, (Year of Birth),
and Address(1) | | Position and
Length of
Time Served(2) | | Principal Occupation(s)(3) | | Number of
Funds in Fund
Complex
Overseen by
Fund Trustee | | Other Directorships
Held Outside Fund
Complex by Fund
Trustee | |
| George W. Morriss (1947) | | Trustee since 2007 | | Retired; formerly, Executive Vice President and Chief Financial Officer, People's Bank, Connecticut (a financial services company), 1991 to 2001. | | | 56 | | | Manager, Old Mutual 2100 fund complex (consisting of six funds) since October 2006 for four funds and since February 2007 for two funds; formerly, Member NASDAQ Issuers' Affairs Committee, 1995 to 2003. | |
|
| Edward I. O'Brien (1928) | | Trustee since 2000 | | Retired; formerly, Member, Investment Policy Committee, Edward Jones, 1993 to 2001; President, Securities Industry Association ("SIA") (securities industry's representative in government relations and regulatory matters at the federal and state levels), 1974 to 1992; Adviser to SIA, November 1992 to November 1993. | | | 56 | | | Formerly, Director, Legg Mason, Inc. (financial services holding company), 1993 to July 2008; formerly, Director, Boston Financial Group (real estate and tax shelters), 1993 to 1999. | |
|
| William E. Rulon (1932) | | Trustee since 2000 | | Retired; formerly, Senior Vice President, Foodmaker, Inc. (operator and franchiser of restaurants), until January 1997. | | | 56 | | | Formerly, Director, Pro-Kids Golf and Learning Academy (teach golf and computer usage to "at risk" children), 1998 to 2006; formerly, Director, Prandium, Inc. (restaurants), March 2001 to July 2002. | |
|
| Cornelius T. Ryan (1931) | | Trustee since 2000 | | Founding General Partner, Oxford Partners and Oxford Bioscience Partners (venture capital investing) and President, Oxford Venture Corporation, since 1981. | | | 56 | | | None. | |
|
25
Name, (Year of Birth),
and Address(1) | | Position and
Length of
Time Served(2) | | Principal Occupation(s)(3) | | Number of
Funds in Fund
Complex
Overseen by
Fund Trustee | | Other Directorships
Held Outside Fund
Complex by Fund
Trustee | |
| Tom D. Seip (1950) | | Trustee since 2000; Chairman of the Board since 2008; Lead Independent Trustee from 2006 to 2008 | | General Partner, Seip Investments LP (a private investment partnership); formerly, President and CEO, Westaff, Inc. (temporary staffing), May 2001 to January 2002; formerly, Senior Executive at the Charles Schwab Corporation, 1983 to 1998, including Chief Executive Officer, Charles Schwab Investment Management, Inc., and Trustee, Schwab Family of Funds and Schwab Investments, 1997 to 1998, and Executive Vice President-Retail Brokerage, Charles Schwab & Co., Inc., 1994 to 1997. | | | 56 | | | Director, H&R Block, Inc. (financial services company), since May 2001; Chairman, Compensation Committee, H&R Block, Inc., since 2006; formerly, Director, Forward Management, Inc. (asset management company), 1999 to 2006. | |
|
| Candace L. Straight (1947) | | Trustee since 1999 | | Private investor and consultant specializing in the insurance industry; formerly, Advisory Director, Securitas Capital LLC (a global private equity investment firm dedicated to making investments in the insurance sector), 1998 to December 2003. | | | 56 | | | Director, Montpelier Re (reinsurance company), since 2006; formerly, Director, National Atlantic Holdings Corporation (property and casualty insurance company), 2004 to 2008; formerly, Director, The Proformance Insurance Company (property and casualty insurance company), 2004 to 2008; formerly, Director, Providence Washington Insurance Company (property and casualty insurance company), December 1998 to March 2006; formerly, Director, Summit Global Partners (insurance brokerage firm), 2000 to 2005. | |
|
| Peter P. Trapp (1944) | | Trustee since 1984 | | Retired; formerly, Regional Manager for Mid-Southern Region, Ford Motor Credit Company, September 1997 to 2007; formerly, President, Ford Life Insurance Company, April 1995 to August 1997. | | | 56 | | | None. | |
|
26
Name, (Year of Birth),
and Address(1) | | Position and
Length of
Time Served(2) | | Principal Occupation(s)(3) | | Number of
Funds in Fund
Complex
Overseen by
Fund Trustee | | Other Directorships
Held Outside Fund
Complex by Fund
Trustee | |
| Fund Trustees who are "Interested Persons" | |
|
| Jack L. Rivkin* (1940) | | Trustee since 2002; President from 2002 to 2008 | | Formerly, Executive Vice President and Chief Investment Officer, Neuberger Berman Holdings LLC (holding company), 2002 to August 2008 and 2003 to August 2008, respectively; formerly, Managing Director and Chief Investment Officer, Neuberger Berman, December 2005 to August 2008 and 2003 to August 2008, respectively; formerly, Executive Vice President, Neuberger Berman, December 2002 to 2005; formerly, Director and Chairman, NB Management, December 2002 to August 2008; formerly, Executive Vice President, Citigroup Investments, Inc., September 1995 to February 2002; formerly, Executive Vice President, Citigroup Inc., September 1995 to February 2002. | | | 56 | | | Director, Dale Carnegie and Associates, Inc. (private company), since 1998; Director, Solbright, Inc. (private company), since 1998. | |
|
27
Name, (Year of Birth),
and Address(1) | | Position and
Length of
Time Served(2) | | Principal Occupation(s)(3) | | Number of
Funds in Fund
Complex
Overseen by
Fund Trustee | | Other Directorships
Held Outside Fund
Complex by Fund
Trustee | |
| Robert Conti* (1956) | | Chief Executive Officer, President and Director since 2008; prior thereto, Executive Vice President in 2008 and Vice President 2000 to 2008 | | Managing Director, Neuberger Berman, since 2007; formerly, Senior Vice President, Neuberger Berman, 2003 to 2006; formerly, Vice President, Neuberger Berman, 1999 to 2003; President and Chief Executive Officer, NB Management, since 2008; formerly, Senior Vice President, NB Management, 2000 to 2008. | | | 56 | | | Chairman of the Board, Staten Island Mental Health Society since 2008. | |
|
(1) The business address of each listed person is 605 Third Avenue, New York, New York 10158.
(2) Pursuant to the Trust's Trust Instrument, each Fund Trustee shall hold office for life or until his or her successor is elected or the Trust terminates; except that (a) any Fund Trustee may resign by delivering a written resignation; (b) any Fund Trustee may be removed with or without cause at any time by a written instrument signed by at least two-thirds of the other Fund Trustees; (c) any Fund Trustee who requests to be retired, or who has become unable to serve, may be retired by a written instrument signed by a majority of the other Fund Trustees; and (d) any Fund Trustee may be removed at any shareholder meeting by a vote of at least two-thirds of the outstanding shares.
(3) Except as otherwise indicated, each individual has held the positions shown for at least the last five years.
* Indicates a Fund Trustee who is an "interested person" within the meaning of the 1940 Act. Mr. Conti is an interested person of the Trust by virtue of the fact that he is an officer of NB Management and Neuberger Berman. Mr. Rivkin may be deemed an interested person of the Trust by virtue of the fact that, until August 2008, he was a director of NB Management and an officer of Neuberger Berman.
28
Information about the Officers of the Trust
Name, (Year of Birth),
and Address(1) | | Position and
Length of Time
Served(2) | | Principal Occupation(s)(3) | |
| Andrew B. Allard (1961) | | Anti-Money Laundering Compliance Officer since 2002 | | Senior Vice President, Neuberger Berman, since 2006; Deputy General Counsel, Neuberger Berman, since 2004; formerly, Vice President, Neuberger Berman, 2000 to 2005; formerly, Associate General Counsel, Neuberger Berman, 1999 to 2004; Anti-Money Laundering Compliance Officer, eleven registered investment companies for which NB Management acts as investment manager and administrator (six since 2002, two since 2003, two since 2004 and one since 2006). | |
|
| Michael J. Bradler (1970) | | Assistant Treasurer since 2005 | | Vice President, Neuberger Berman, since 2006; Employee, NB Management, since 1997; Assistant Treasurer, eleven registered investment companies for which NB Management acts as investment manager and administrator (ten since 2005 and one since 2006). | |
|
| Claudia A. Brandon (1956) | | Executive Vice President since 2008 and Secretary since 1985 | | Senior Vice President, Neuberger Berman, since 2007 and Employee since 1999; formerly, Vice President, Neuberger Berman, 2002 to 2006; Senior Vice President, NB Management, since 2008 and Assistant Secretary since 2004; formerly, Vice President-Mutual Fund Board Relations, NB Management, 2000 to 2008; Executive Vice President, eleven registered investment companies for which NB Management acts as investment manager and administrator (eleven since 2008); Secretary, eleven registered investment companies for which NB Management acts as investment manager and administrator (three since 1985, three since 2002, two since 2003, two since 2004 and one since 2006). | |
|
| Maxine L. Gerson (1950) | | Executive Vice President since 2008 and Chief Legal Officer since 2005 (only for purposes of sections 307 and 406 of the Sarbanes-Oxley Act of 2002) | | Senior Vice President, Neuberger Berman, since 2002; Deputy General Counsel and Assistant Secretary, Neuberger Berman, since 2001; Senior Vice President, NB Management, since 2006; Secretary and General Counsel, NB Management, since 2004; Executive Vice President, eleven registered investment companies for which NB Management acts as investment manager and administrator (eleven since 2008); Chief Legal Officer (only for purposes of sections 307 and 406 of the Sarbanes-Oxley Act of 2002), eleven registered investment companies for which NB Management acts as investment manager and administrator (ten since 2005 and one since 2006). | |
|
| Sheila R. James (1965) | | Assistant Secretary since 2002 | | Vice President, Neuberger Berman, since 2008 and Employee since 1999; formerly, Assistant Vice President, Neuberger Berman, 2007; Assistant Secretary, eleven registered investment companies for which NB Management acts as investment manager and administrator (six since 2002, two since 2003, two since 2004 and one since 2006). | |
|
| Brian Kerrane (1969) | | Vice President since 2008 | | Senior Vice President, Neuberger Berman, since 2006; formerly, Vice President, Neuberger Berman, 2002 to 2006; Vice President, NB Management, since 2008 and Employee since 1991; Vice President, eleven registered investment companies for which NB Management acts as investment manager and administrator (eleven since 2008). | |
|
29
Name, (Year of Birth),
and Address(1) | | Position and
Length of Time
Served(2) | | Principal Occupation(s)(3) | |
| Kevin Lyons (1955) | | Assistant Secretary since 2003 | | Assistant Vice President, Neuberger Berman, since 2008 and Employee since 1999; Assistant Secretary, eleven registered investment companies for which NB Management acts as investment manager and administrator (eight since 2003, two since 2004 and one since 2006). | |
|
| Owen F. McEntee, Jr. (1961) | | Vice President since 2008 | | Vice President, Neuberger Berman, since 2006; Employee, NB Management, since 1992; Vice President, eleven registered investment companies for which NB Management acts as investment manager and administrator (eleven since 2008). | |
|
| John M. McGovern (1970) | | Treasurer and Principal Financial and Accounting Officer since 2005; prior thereto, Assistant Treasurer since 2002 | | Senior Vice President, Neuberger Berman, since 2007; formerly, Vice President, Neuberger Berman, 2004 to 2006; Employee, NB Management, since 1993; Treasurer and Principal Financial and Accounting Officer, eleven registered investment companies for which NB Management acts as investment manager and administrator (ten since 2005 and one since 2006); formerly, Assistant Treasurer, eleven registered investment companies for which NB Management acts as investment manager and administrator, 2002 to 2005. | |
|
| Andrew Provencher (1965) | | Vice President since 2008 | | Managing Director, NB Management, since 2008; Managing Director, Neuberger Berman, since 2005; formerly, Senior Vice President, Neuberger Berman, 2003 to 2005; formerly, Vice President, Neuberger Berman, 1999 to 2003; Vice President, eleven registered investment companies for which NB Management acts as investment manager and administrator (eleven since 2008). | |
|
| Frank Rosato (1971) | | Assistant Treasurer since 2005 | | Vice President, Neuberger Berman, since 2006; Employee, NB Management, since 1995; Assistant Treasurer, eleven registered investment companies for which NB Management acts as investment manager and administrator (ten since 2005 and one since 2006). | |
|
| Neil S. Siegel (1967) | | Vice President since 2008 | | Managing Director, NB Management, since 2008; Managing Director, Neuberger Berman, since 2006; formerly, Senior Vice President, Neuberger Berman, 2004 to 2006; Vice President, eleven registered investment companies for which NB Management acts as investment manager and administrator (eleven since 2008); formerly, Head of Institutional Marketing, Morgan Stanley Investment Management, 1993 to 2004. | |
|
30
Name, (Year of Birth),
and Address(1) | | Position and
Length of Time
Served(2) | | Principal Occupation(s)(3) | |
| Chamaine Williams (1971) | | Chief Compliance Officer since 2005 | | Senior Vice President, Neuberger Berman, since 2007; Chief Compliance Officer, NB Management, since 2006; Senior Vice President, Lehman Brothers Inc., since 2007; formerly, Vice President, Lehman Brothers Inc., 2003 to 2006; Chief Compliance Officer, eleven registered investment companies for which NB Management acts as investment manager and administrator (ten since 2005 and one since 2006); formerly, Chief Compliance Officer, Lehman Brothers Asset Management Inc., 2003 to 2007; formerly, Chief Compliance Officer, Lehman Brothers Alternative Investment Management LLC, 2003 to 2007; formerly, Vice President, UBS Global Asset Management (US) Inc. (formerly, Mitchell Hutchins Asset Management, a wholly-owned subsidiary of PaineWebber Inc.), 1997 to 2003. | |
|
(1) The business address of each listed person is 605 Third Avenue, New York, New York 10158.
(2) Pursuant to the By-Laws of the Trust, each officer elected by the Fund Trustees shall hold office until his or her successor shall have been elected and qualified or until his or her earlier death, inability to serve, or resignation. Officers serve at the pleasure of the Fund Trustees and may be removed at any time with or without cause.
(3) Except as otherwise indicated, each individual has held the positions shown for at least the last five years.
31
Proxy Voting Policies and Procedures
A description of the policies and procedures that the Trust uses to determine how to vote proxies relating to portfolio securities is available, without charge, by calling 1-800-877-9700 (toll-free) and on the website of the Securities and Exchange Commission, at www.sec.gov. Information regarding how the Trust voted proxies relating to portfolio securities during the most recent 12-month period ended June 30 is also available, without charge, by calling 1-800-877-9700 (toll-free), on the website of the Securities and Exchange Commission at www.sec.gov, and on Management's website at www.nb.com.
Quarterly Portfolio Schedule
The Trust files a complete schedule of portfolio holdings for the Fund with the Securities and Exchange Commission for the first and third quarters of each fiscal year on Form N-Q. The Trust's Forms N-Q are available on the Securities and Exchange Commission's website at www.sec.gov and may be reviewed and copied at the Securities and Exchange Commission's Public Reference Room in Washington, DC. Information on the operation of the Public Reference Room may be obtained by calling 1-800-SEC-0330. The information on Form N-Q is available upon request, without charge, by calling 1-800-877-9700 (toll free).
Notice to Shareholders (Unaudited)
The Fund hereby designates $9,945,036 as a capital gain distribution.
100.00% of the dividends distributed during the fiscal year ended December 31, 2008 qualifies for the dividends received deduction for corporate shareholders.
Board Consideration of the Management and Sub-Advisory Agreements
At a meeting held on September 25, 2008, the Board of Trustees of Neuberger Berman Advisers Management Trust ("Board"), including the Trustees who are not "interested persons" of Neuberger Berman Management LLC ("Management") or Neuberger Berman Advisers Management Trust ("Independent Fund Trustees"), approved the continuance of the Management and Sub-Advisory Agreements ("Agreements") between Management and Socially Responsive Portfolio ("Fund").
In evaluating the Agreements, the Board, including the Independent Fund Trustees, reviewed materials furnished by Management and Neuberger Berman, LLC ("Neuberger") in response to questions submitted by counsel to the Independent Fund Trustees, and met with senior representatives of Management and Neuberger regarding their personnel and operations. The Independent Fund Trustees were advised by counsel that is experienced in Investment Company Act of 1940 matters and that is independent of Management and Neuberger. The Independent Fund Trustees received a memorandum from independent counsel discussing the legal standards for their consideration of the proposed continuance of the Agreements. They met with such counsel separately from representatives of Management to discuss the annual contract review. The annual contract review extends over two regular meetings of the Board to ensure that Management and Neuberger have time to respond to any questions the Independent Fund Trustees may have on their initial review of the report and that the Independent Fund Trustees have time to consider those responses. In addition, during this process, the Board held a separate meeting devoted primarily to reviewing and discussing Fund performance.
The Board considered the following factors, among others, in connection with its approval of the continuance of the Agreements: (1) the nature, extent, and quality of the services provided by Management and Neuberger; (2) the performance of the Fund compared to a relevant market index and a peer group of investment companies; (3) the costs of the services provided and profits or losses realized by Management and its affiliates from their relationship with the Fund; (4) the extent to which economies of scale might be realized as the Fund grows; and (5) whether fee levels reflect any such
32
potential economies of scale for the benefit of investors in the Fund. In their deliberations, the Board members did not identify any particular information that was all-important or controlling, and each Trustee may have attributed different weights to the various factors.
The Board considered the continued integrity of Management and Neuberger as organizations, despite the bankruptcy filing by Lehman Brothers Holdings Inc. The Board discussed the efforts made by Management and Neuberger to retain employees, and the reported likelihood that such employees would be retained. The Board discussed the provisions that were being made for ancillary services by Management, Neuberger and their affiliates.
The Board evaluated the terms of the Agreements, the overall fairness of the Agreements to the Fund and whether the Agreements were in the best interests of the Fund and its shareholders.
With respect to the nature, extent and quality of the services provided, the Board considered the performance of the Fund and the experience and staffing of the portfolio management and investment research personnel who perform services for the Fund. The Board noted that Management also provides certain administrative services, including fund accounting and compliance oversight. The Board also considered Management's and Neuberger's policies and practices regarding brokerage. The Board considered the quality of brokerage execution obtained by Management. The Board's Portfolio Transactions and Pricing Committee from time to time reviewed the quality of the brokerage services that Neuberger and Lehman Brothers Inc. had provided, and periodically reviews studies by an independent firm engaged to review and evaluate the quality of brokerage execution received by the Fund. The Board also reviewed whether Management and Neuberger used brokers to execute Fund transactions that provide research and other services to Management and Neuberger, and the types of benefits potentially derived from such services by Management, Neuberger, the Fund and other clients of Management and Neuberger. In addition, the Board noted the positive compliance history of Management and Neuberger, as each firm has been free of significant compliance problems.
The Board considered the performance of the Fund relative to its benchmark and a peer group of investment companies dedicated to insurance products pursuing broadly similar strategies. The Board also considered performance in relation to the degree of risk undertaken by the portfolio managers. The Board discussed the Fund's performance with Management and discussed steps that Management had taken, or intended to take, to improve the Fund's performance. The Board also considered Management's resources and responsiveness with respect to the Fund.
With respect to the overall fairness of the Agreements, the Board considered the fee structure for the Fund under the Agreements as compared to a peer group of comparable funds dedicated to insurance products and any fall-out benefits likely to accrue to Management or Neuberger or their affiliates from their relationship with the Fund. The Board also considered the profitability of Management and its affiliates from their association with the Fund.
The Board reviewed a comparison of the Fund's management fee and overall expense ratio to a peer group of broadly comparable funds dedicated to insurance products. The Board considered the mean and median of the management fees and expense ratios of the peer group. The Board noted that the Fund's management fee was higher than the peer group mean and median. The Board considered whether specific portfolio management or administration needs contributed to the higher fee. With regard to the sub-advisory fee paid to Neuberger, the Board noted that this fee is "at cost." In addition, the Board considered the contractual limit on Fund expenses undertaken by Management. The Board noted that Management incurred a loss on the Fund in 2005.
The Board considered whether there were other funds that were advised or sub-advised by Management or its affiliates or separate accounts managed by Management or its affiliates with similar investment objectives, policies and strategies to the Fund. The Board compared the fees charged to the Fund at various asset levels to the fees charged to an advised fund, a sub-advised fund and a separate account, each managed in a similar style to the Fund. The Board considered the appropriateness and reasonableness of any differences between the fees charged to the Fund and the other funds and account and determined that the differences in fees were consistent with the management and other services provided.
The Board also evaluated any apparent or anticipated economies of scale in relation to the services Management provides to the Fund. The Board considered that the Fund's fee structure which provides for a reduction of payments resulting from the use of breakpoints and whether those breakpoints are set at appropriate asset levels.
33
In concluding that the benefits accruing to Management and its affiliates by virtue of their relationship to the Fund were reasonable in comparison with the costs of providing the investment advisory services and the benefits accruing to the Fund, the Board reviewed specific data as to Management's profit on the Fund for a recent period and the trend in profit or loss over recent years. The Board also carefully examined Management's cost allocation methodology and in recent years had an independent consultant review the methodology. It also reviewed an analysis from an independent data service on profitability margins in the investment management industry. The Board recognized that Management should be entitled to earn a reasonable level of profits for services it provides to the Fund and, based on its review, concluded that Management's level of profitability was not excessive.
Conclusions
In approving the Agreements, the Board concluded that the terms of each Agreement are fair and reasonable and that approval of the Agreements is in the best interests of the Fund and its shareholders. In reaching this determination, the Board considered that Management and Neuberger could be expected to provide a high level of service to the Fund; that it retained confidence in Management's and Neuberger's capabilities to manage the Fund; that the Fund's fee structure appeared to the Board to be reasonable given the nature and quality of services provided; and that the benefits accruing to Management and its affiliates by virtue of their relationship to the Fund were reasonable in comparison with the benefits accruing to the Fund.
Board Consideration of New and Interim Management and Sub-Advisory Agreements
Lehman Brothers Holdings Inc. ("Lehman Brothers") has entered into an agreement to sell a controlling interest in the Fund's investment adviser. Under the agreement, Lehman Brothers would sell substantially all of the Neuberger Berman business and the fixed income business and certain alternative asset management businesses of Lehman Brother's Investment Management Division (collectively, the "Acquired Businesses") to NBSH Acquisition, LLC (the "Proposed Acquisition"). NBSH Acquisition, LLC ("NBSH") was organized by key members of Neuberger Berman's management for the purpose of facilitating the acquisition of the Acquired Businesses. At the closing of the Proposed Acquisition, a majority interest in the Acquired Businesses will be directly or indirectly owned by portfolio managers, Neuberger Berman's management team and certain key members and senior professionals of the former Investment Management Division ("Management Members"), as well as by Lehman Brothers and certain affiliates of Lehman Brothers.
The Acquired Businesses include Neuberger Berman Management LLC ("Management") and Neuberger Berman, LLC ("Neuberger"), the adviser and sub-adviser to the Fund, respectively. The Proposed Acquisition has been deemed to result in an "assignment" of the Fund's existing Management Agreement and Sub-Advisory Agreement (the "Existing Agreements") under the 1940 Act. As required by the 1940 Act, the Fund's Existing Agreements provide for their automatic termination in the event of an assignment, and each will terminate upon the consummation of the Proposed Acquisition. Accordingly, on December 17, 2008, the Board approved new Management and Sub-Advisory Agreements with Management and Neuberger, respectively, or their successors (together, the "Advisers"), on the same terms and with the same compensation structure as are currently in effect (together, "New Agreements"), which would take effect upon consummation of the Proposed Acquisition if approved by the Fund's shareholders.
If shareholders of the Fund do not approve the New Agreements before the Proposed Acquisition is completed, the Board has approved interim Management and Sub-Advisory Agreements with Management and Neuberger, respectively, or their successors (together, "Interim Agreements") pending approval of the New Agreements by shareholders of the Fund. Compensation earned by the Advisers under the Interim Agreements would be held in an interest-bearing escrow account pending shareholder approval of the New Agreements. If shareholders approve the New Agreements within 150 days from the termination of the Existing Agreements, the amount held in the escrow account, including interest, will be paid to the Advisers, as appropriate. If shareholders of the Fund do not approve the New Agreements, the Advisers will be paid the lesser of the costs incurred in performing their services under the Interim Agreements or the total amount in the escrow account, including interest earned. If at the end of 150 days following termination of a Fund's Existing Agreements the Fund's shareholders still have not approved the New Agreements, the Trustees would take such actions as they deem to be in the best interests of the Fund and its shareholders, which may include negotiating a new Management Agreement
34
and/or new Sub-Advisory Agreement with an advisory organization selected by the Board of Trustees or making other arrangements.
The Trustees of the Trust discussed the Proposed Acquisition on December 17, 2008. Prior to submitting its bid to public auction, Management met telephonically with the Independent Trustees to brief them on the Proposed Acquisition. Following the public auction wherein NBSH was determined to be the successful bidder, the Independent Trustees again met telephonically with Management to obtain additional information about the Proposed Acquisition. The Independent Trustees, with the assistance of independent counsel, prepared due diligence requests that were presented to Management and appointed a Task Force of Independent Trustees to lead the due diligence effort ("Task Force").
Management provided written responses to the due diligence requests. After extensive review and analysis and discussions during a telephonic and in person meeting of the Independent Trustees, the Task Force submitted clarifying questions. The Independent Trustees met as a body in person to receive the report of the Task Force and consider the New Agreements. Throughout the process, the Task Force and the Independent Trustees were advised by experienced 1940 Act counsel that is independent of Management and NBSH. In addition, the Independent Trustees received a memorandum from independent counsel discussing the legal standards for their consideration of the New Agreements.
Consideration of the New Agreements followed shortly on the heels of the Independent Trustees' annual consideration of whether to renew the Existing Agreements, carried out pursuant to Section 15(c) of the 1940 Act. In that process, which began prior to the June 2008 quarterly meeting of the Board and was concluded at the September 2008 quarterly meeting, the Independent Trustees, following an extensive review of materials submitted by Management and a report from an independent data service, unanimously determined that the Existing Agreements were fair and reasonable and that their renewal would be in the best interests of the Fund and its shareholders. Accordingly, in considering the New Agreements, the Independent Trustees took into account the fact that the terms of the New Agreements would be identical to those of the Existing Agreements in every respect except for the term and termination date and potentially the name of the investment adviser. The Board considerations in connection with the New Agreements and the Existing Agreements also entered into the decision by the Board to approve the Interim Agreements, which would take effect if the shareholders of the Fund do not approve the New Agreements before the Proposed Acquisition is completed. The Independent Trustees' consideration of the Existing Agreements is described above.
In evaluating the proposed New Agreements, the Independent Trustees considered that they have generally been satisfied with the nature and quality of the services provided to the Fund by Management and Neuberger, including investment advisory, administrative and support services, and that the Fund would be best served by an arrangement that appeared likely to maintain the continuity and stability of the providers of these services. Accordingly, the Independent Trustees considered very carefully the intentions of NBSH (including its successors or assign) regarding capitalization, management structure, staffing, compensation and staff retention and whether these seemed designed to provide the desired continuity and stability. They inquired specifically about staffing and resources in the areas of portfolio management, investment research, trading, fund accounting, legal and compliance, internal audit, and senior executive staff. Although at the time the Board considered the New Agreements no final decisions had been reached as to the distribution of equity interests in NBSH (or its successor or assign), the Trustees were advised that senior members of management, including the Fund Trustee and nominee for Fund Trustee who are employed by the Advisers, would receive equity interests in NBSH. Because of these interests, as well as any future employment arrangements with the Advisers, these persons, individually or in the aggregate, could have a material interest in the Proposed Acquisition and in shareholder approval of the New Agreements. In considering the New Agreements, the Trustees were aware of these interests.
The Independent Trustees inquired whether NBSH (or its successors or assign) had specific plans for the future structure of the Neuberger Berman Funds, whether they plan to propose to eliminate any Funds, and whether they intend to continue or alter certain expansion plans that are already underway. They also inquired whether there are plans to change the fees or expense structure of any of the Funds. The Independent Trustees inquired about the long-term plans for the Advisers, including any expectations for cost savings or expense reductions. They also inquired about the capital structure and working capital likely to be available to NBSH (or its successors or assign).
35
The Independent Trustees considered the following factors, in addition to the factors discussed above, among others, in connection with their consideration of the New Agreements: (1) the nature, extent, and quality of the services provided by Management and Neuberger; (2) the performance of the Fund compared to a relevant market index and a peer group of investment companies; (3) the costs of the services provided and profits or losses realized by Management and its affiliates from their relationship with the Fund; (4) the extent to which economies of scale might be realized as the Fund grows; and (5) whether fee levels reflect any such potential economies of scale for the benefit of investors in the Fund. In their deliberations, the Independent Trustees did not identify any particular information that was all important or controlling, and each Trustee may have attributed different weights to the various factors.
In unanimously approving and recommending the New Agreements, the Independent Trustees concluded that the terms of each New Agreement are fair and reasonable and that approval of the New Agreements is in the best interests of the Fund and its shareholders. In reaching this determination, the Independent Trustees considered the following factors, among others:
(1) that the terms of the New Agreements are identical in all material respects to those of the Existing Agreements;
(2) that the Advisers will maintain operational autonomy and continuity of management following the Proposed Acquisition;
(3) the favorable history, reputation, qualification, and background of Management and Neuberger, as well as the qualifications of each entity's personnel and each entity's respective financial condition;
(4) the commitment of NBSH (or its successors or assign) to retain key personnel currently employed by Management and Neuberger who currently provide services to the Fund;
(5) the commitment of NBSH (or its successors or assign) to maintaining the current level and quality of Fund services;
(6) the proposed division of equity in NBSH (or its successor or assign) among Management Members and other personnel upon consummation of the Proposed Acquisition;
(7) the fees and expense ratio of the Fund relative to comparable mutual funds;
(8) that the fees are identical to those paid under the Existing Agreements;
(9) that the fees and expense ratios of the Fund appear to the Board to be reasonable given the quality of services expected to be provided;
(10) the commitment of Management to maintaining the Fund's current contractual expense limitation agreements to ensure that Fund shareholders of funds that have such arrangements in place do not face an increase in expenses upon consummation of the Proposed Acquisition;
(11) the performance of the Fund relative to comparable mutual funds and unmanaged indices;
(12) the commitment of Management (or its successor) to pay the expenses of the Fund in connection with the Proposed Acquisition, including all expenses in connection with the solicitation of proxies, so that shareholders of the Fund would not have to bear such expenses;
(13) the actual and potential effects on the Advisers of the bankruptcy of Lehman Brothers, and the effects of the Lehman Brothers bankruptcy on the information considered by the Independent Trustees in their prior analyses of the principal service contracts;
(14) the provisions made to continue providing to the Advisers certain services that were previously provided to them by or through Lehman Brothers or its other affiliates;
(15) the possible benefits that may be realized by the Fund and by the Advisers as a result of the Proposed Acquisition; and
(16) that the Proposed Acquisition is expected to maintain continuity of management of the Fund and may reduce the potential for future vulnerability to changes in control of the Advisers that could be adverse to the Fund's interests and that could affect the retention of key employees providing services to the Fund.
36
The Registrant's Board of Trustees ("Board") adopted a code of ethics that applies to the Registrant's principal executive officer, principal financial officer, principal accounting officer or controller, or persons performing similar functions ("Code of Ethics"). For the period covered by this Form N-CSR, there were no amendments to the Code of Ethics and there were no waivers from the Code of Ethics granted to the Registrant's principal executive officer, principal financial officer, principal accounting officer or controller, or persons performing similar functions.
A copy of the Code of Ethics was included as an exhibit to Registrant's Form N-CSR filed on February 28, 2007. The Code of Ethics is also available, without charge, by calling 1-800-877-9700 (toll-free).
ITEM 3. | AUDIT COMMITTEE FINANCIAL EXPERT |
The Board has determined that the Registrant has three audit committee financial experts serving on its audit committee. The Registrant's audit committee financial experts are Martha C. Goss, Howard A. Mileaf and George W. Morriss. Ms. Goss, Mr. Mileaf and Mr. Morriss are independent trustees as defined by Form N-CSR.
ITEM 4. | PRINCIPAL ACCOUNTANT FEES AND SERVICES |
The financial information provided below is that of the Registrant. This Form N-CSR relates only to the Balanced, Small-Cap Growth, Growth, Guardian, International, Short Duration Bond, Mid-Cap Growth, Partners, Regency and Socially Responsive Portfolios (collectively, the "Funds"). Ernst & Young, LLP ("E&Y") serves as the principal accountant for the Funds.
(a)-(d) | Aggregate fees billed to the Registrant for the last two fiscal years for professional services rendered by E&Y for the Funds are listed below. |
| | |
| | 2008 | 2007 |
Audit Fees | $335,000 | $321,000 |
Audit-Related Fees | 0 | 0 |
Tax Fees | 174,000 | 75,000 |
All Other Fees | 0 | 0 |
Audit Fees include amounts related to the audit of the Registrant's annual financial statements and services normally provided by the principal accountant in connection with statutory and
regulatory filings. Audit-Related Fees include amounts for attest services not required by statute or regulation. Tax Fees include amounts related to tax compliance, tax planning, and tax advice. All Other Fees include amounts for products and services not reported in Audit Fees, Audit-Related Fees and Tax Fees.
(e) | (1) | The Audit Committee's pre-approval policies and procedures for the Registrant to engage an accountant to render audit and non-audit services delegate to each member of the Audit Committee the power to pre-approve services between meetings of the Audit Committee. |
| | |
| | (2) | No services included in (b) - (d) above were approved pursuant to paragraph (c)(7)(i)(C) of Rule 2-01 of Regulation S-X. |
| | | |
(f) | Not applicable. |
| | | |
(g) | The aggregate fees billed for the most recent fiscal year and the preceding fiscal year by E&Y for non-audit services rendered to the Registrant, its investment adviser, and any affiliates of its investment adviser that provide ongoing services to the Registrant were $474,000 and $500,000, respectively. |
| | | |
(h) | All non-audit services rendered in (g) above were pre-approved by the Registrant's audit committee pursuant to paragraph (c)(7)(ii) of Rule 2-01 of Regulation S-X. Accordingly, these services were considered by the Registrant's Audit Committee and found to be compatible with maintaining the principal accountant's independence. |
| | | |
ITEM 5. | AUDIT COMMITTEE OF LISTED REGISTRANTS |
| | | |
Not applicable to the Registrant. |
| | | |
ITEM 6. | SCHEDULE OF INVESTMENTS. |
The complete schedule of investments for each series is disclosed in the Registrant's annual reports to shareholders, which are included as Item 1 of this Form N-CSR.
ITEM 7. | DISCLOSURE OF PROXY VOTING POLICIES AND PROCEDURES FOR CLOSED-END MANAGEMENT INVESTMENT COMPANIES. |
| | |
Not applicable to the Registrant. |
| | |
ITEM 8. | PORTFOLIO MANAGERS OF CLOSED-END MANAGEMENT INVESTMENT COMPANIES. |
| | |
Not applicable to the Registrant. |
| | |
ITEM 9. | PURCHASES OF EQUITY SECURITIES BY CLOSED-END MANAGEMENT INVESTMENT COMPANY AND AFFILIATED PURCHASERS. |
| | |
Not applicable to Registrant. |
| | |
ITEM 10. | SUBMISSION OF MATTERS TO A VOTE OF SECURITY HOLDERS. |
| | |
There were no material changes to the procedures by which shareholders may recommend nominees to the Board. |
| | |
ITEM 11. | CONTROLS AND PROCEDURES |
| | |
(a) | Based on an evaluation of the disclosure controls and procedures (as defined in Rule 30a-2(c) under the Act) as of a date within 90 days of the filing date of this report, the Chief Executive Officer and Treasurer of the Registrant have concluded that such disclosure controls and procedures are effectively designed to ensure that information required to be disclosed by the Registrant is accumulated and communicated to the Registrant's management to allow timely decisions regarding required disclosure. |
| | |
(b) | There were no significant changes in the Registrant's internal controls over financial reporting (as defined in Rule 30a-3(d) under the Act) that occurred during the Registrant's second fiscal quarter of the period covered by this report that have materially affected, or are reasonably likely to materially affect, the Registrant's internal control over financial reporting. |
| | |
ITEM 12. | EXHIBITS |
| | |
(a) | (1) A copy of the Code of Ethics was included as an exhibit to Registrant's Form N-CSR filed on February 28, 2007 (Investment Company Act file number 811-4255) and is incorporated herein by reference. |
| | |
| | (2) The certifications required by Rule 30a-2(a) under the Act, are attached hereto. |
| | |
| | (3) Not applicable to the Registrant. |
| | |
(b) | The certification required by Rule 30a-2(b) under the Act, Rule 13a-14(b) or Rule 15d-14(b) under the Securities Exchange Act of 1934 ("Exchange Act"), and Section 1350 of Chapter 63 of Title 18 of the United States Code are attached hereto. |
| | |
SIGNATURES
Pursuant to the requirements of the Securities Exchange Act of 1934 and the Investment Company Act of 1940, the Registrant has duly caused this report to be signed on its behalf by the undersigned, thereunto duly authorized.
NEUBERGER BERMAN ADVISERS MANAGEMENT TRUST |
| | |
| | |
By: | /s/ Robert Conti | |
| | Robert Conti |
| | Chief Executive Officer |
| | |
Date: | March 6, 2009 |
| | |
Pursuant to the requirements of the Securities Exchange Act of 1934 and the Investment Company Act of 1940, this report has been signed below by the following persons on behalf of the Registrant and in the capacities and on the dates indicated. |
| |
| | |
By: | /s/ Robert Conti | |
| | Robert Conti |
| | Chief Executive Officer |
| | |
Date: | March 6, 2009 |
| | |
| | |
By: | /s/ John M. McGovern | |
| | John M. McGovern |
| | Treasurer and Principal Financial |
| | and Accounting Officer |
| | |
Date: | March 6, 2009 |