Neuberger Berman
Advisers Management Trust
Large Cap Value Portfolio
I Class Shares
Annual Report
December 31, 2015
Large Cap Value Portfolio Commentary (Unaudited)
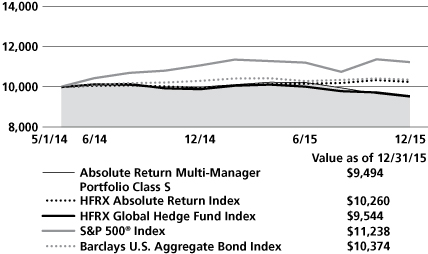
The Neuberger Berman Advisers Management Trust (AMT) Large Cap Value Portfolio (the "Fund") Class I generated a –11.80% total return for the 12 months ended December 31, 2015, underperforming its benchmark, the Russell 1000® Value Index, which returned –3.83% for the same period.
Throughout 2015, the equity market experienced bouts of intense volatility driven by various macro issues such as the softening global economy, falling crude oil prices, a rising dollar and looming U.S. interest rate tightening. A culmination of these factors led to a steep market correction in August, which then reversed into a strong recovery at the beginning of the fourth quarter. The market then bounced between positive and negative territory as the price of oil and other commodities tumbled once again and geopolitical tensions heated up after a wave of international terrorist attacks. While economic data in the U.S. remained largely subdued, a positive U.S. employment report gave the U.S. Federal Reserve enough fodder to raise interest rates in mid-December. The roller-coaster ride in equities over the year resulted in the worst annual return for the broad stock market since 2008.
Among large cap value equities, the Health Care sector was the strongest segment, followed by Telecommunication Services, which also appreciated for the year. Energy was by far the worst performing sector of the broader market, followed by Materials, Consumer Discretionary and Utilities.
Within the Fund, Information Technology gave the largest lift to performance relative to the benchmark. The bulk of the upside came from a data storage holding that rallied late in the year on rumors that it was being acquired, which soon proved to be true and led to another rise in the stock. The Fund also gained some ground versus the benchmark in the Energy sector, as our holdings in aggregate held up better than the benchmark counterparts.
The Materials segment was the greatest source of Fund weakness for the 12-month period due mainly to our exposure to the Metals & Mining industry, which was meaningfully hampered by economic softness in China and eroding commodity prices due to the rising dollar. Industrials also caused a sizeable drawback for the Fund, owing mainly to our Machinery investments. The sluggish global economy, and particularly lower construction activity in China, caused a fall-off in demand for coal, which significantly hampered one of our holdings in this area.
While 2015 proved to be a difficult year for stocks, we believe there is opportunity for positive performance ahead. The U.S. economy appears to be on firmer footing and the improving job market combined with lower fuel costs could continue to boost consumer spending. Companies may also proceed to use the ample amounts of cash on their balance sheets to create value through M&A and share repurchases. Still, there is a great deal of uncertainty as the global economy remains tenuous and the impact of U.S. interest rate tightening has yet to unfold. Furthermore, valuations remain high and U.S. stock multiples are, in our view, becoming increasingly difficult to justify. Yet we believe that we are finding value within the Industrials and Energy complex as well as other select areas of the market. We continue to seek underappreciated stocks with hidden value that we think can be realized if specific catalysts play out over time. Within this tumultuous environment, we believe that our approach could be key to generating favorable returns over the long term.
Sincerely,
ELI M. SALZMANN
PORTFOLIO MANAGER
Information about principal risks of investing in the Fund is set forth in the prospectus and statement of additional information.
The portfolio composition, industries and holdings of the Fund are subject to change without notice.
The opinions expressed are those of the Fund's portfolio manager. The opinions are as of the date of this report, and are subject to change without notice.
1
Large Cap Value Portfolio (Unaudited)SECTOR ALLOCATION
(as a % of Total Investments*) | |
Consumer Discretionary | | | 19.5 | % | |
Consumer Staples | | | 1.1 | | |
Energy | | | 20.0 | | |
Financials | | | 20.0 | | |
Industrials | | | 25.8 | | |
Information Technology | | | 2.4 | | |
Materials | | | 9.1 | | |
Short-Term Investments | | | 2.1 | | |
Total | | | 100.0 | % | |
* Derivatives, if any, are excluded from this chart.
PERFORMANCE HIGHLIGHTS
| | | | | Average Annual Total Return
Ended 12/31/2015 | |
| | | Inception
Date | | 1 Year | | 5 Years | | 10 Years | | Life of Fund | |
Large Cap Value
Portolio Class I | | |
03/22/1994 | | | | –11.80 | % | | | 5.60% | | | | 3.31 | % | | | 7.61 | % | |
Russell 1000®
Value Index1,2 | | | | | | | –3.83 | % | | | 11.27 | % | | | 6.16 | % | | | 9.25 | % | |
The performance data quoted represent past performance and do not indicate future results. Current performance may be lower or higher than the performance data quoted. For performance data current to the most recent month-end, please visit http://www.nb.com/amtportfolios/performance.
The results shown in the table reflect the reinvestment of income dividends and other distributions, if any. The results do not reflect the effect of taxes a shareholder would pay on Fund distributions or on the redemption of Fund shares. The results do not reflect fees and expenses of the variable annuity and variable life insurance policies or the qualified pension and retirement plans whose proceeds are invested in the Fund.
The investment return and principal value of an investment will fluctuate and shares, when redeemed, may be worth more or less than their original cost.
Returns would have been lower if Neuberger Berman Investment Advisers LLC ("Management") had not reimbursed certain expenses and/or waived a portion of the investment management fees during certain of the periods shown. Repayment by a class (of expenses previously reimbursed and/or fees previously waived by Management) will decrease the class's returns. Please see Note B in the Notes to Financial Statements for specific information regarding expense reimbursement and/or fee waiver arrangements.
As stated in the Fund's most recent prospectus, the total annual operating expense ratio for fiscal year 2014 was 1.13% for Class I shares (before expense reimbursements and/or fee waivers, if any). The expense ratios for the annual period ended December 31, 2015 can be found in the Financial Highlights section of this report.
COMPARISON OF A $10,000 INVESTMENT
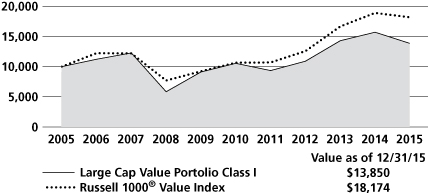
This graph shows the change in value of a hypothetical $10,000 investment in the Fund over the past 10 fiscal years, or since the Fund's inception, if it has not operated for 10 years. The result is compared with benchmarks, which include a broad-based market index and may include a more narrowly based index. Market indices have not been reduced to reflect any of the fees and costs of investing. The results shown in the graph reflect the reinvestment of income dividends and other distributions, if any. The results do not reflect the effect of taxes a shareholder would pay on Fund distributions or on the redemption of Fund shares. The results do not reflect fees and expenses of the variable annuity and variable life insurance policies or the qualified pension and retirement plans whose proceeds are invested in the Fund. Results represent past performance and do not indicate future results.
Please see Endnotes for additional information.
2
1 The date used to calculate Life of Fund performance for the index is March 22, 1994, the Fund's commencement of operations.
2 The Russell 1000® Value Index is a float-adjusted market capitalization-weighted index that measures the performance of the large-cap value segment of the U.S. equity market. It includes those Russell 1000® Index companies with lower price-to-book ratios and lower forecasted growth rates. The index is rebalanced annually in June. The Russell 1000 Index measures the performance of the large-cap segment of the U.S. equity market, and includes approximately 1,000 of the largest securities in the Russell 3000® Index (which measures the performance of the 3,000 largest U.S. public companies based on total market capitalization). The index is rebalanced annually in June. Please note that the indices described in this report do not take into account any fees, expenses or tax consequences of investing in the individual securities that they track, and that investors cannot invest directly in any index. Data about the performance of an index are prepared or obtained by Neuberger Berman Investment Advisers LLC* ("Management") and reflect the reinvestment of income dividends and other distributions, if any. The Fund may invest in securities not included in a described index and generally does not invest in all securities included in a described index.
* On January 1, 2016, Neuberger Berman Management LLC (NBM) and Neuberger Berman LLC (Neuberger) transferred to Neuberger Berman Fixed Income LLC (NBFI) their rights and obligations pertaining to all services they provided to any Fund under any investment management, investment sub-advisory, and/or administration agreement, as applicable (the "Agreements"). Following such transfer, NBFI was renamed Neuberger Berman Investment Advisers LLC ("NBIA" or "Management").
As of December 31, 2015, NBM served as the Fund's investment manager and administrator, and Neuberger served as the Fund's sub-adviser. Following the consolidation, the investment professionals of NBM and Neuberger who provide services to the Fund under the Agreements, continue to provide the same services, except that they provide those services in their new capacities as investment professionals of NBIA. Further, the consolidation did not result in any change in the investment processes currently employed by the Fund, the nature or level of services provided to the Fund, or the fees the Fund pays under its Agreements.
The investments for the Fund are managed by the same portfolio manager(s) who manage(s) one or more other registered funds that have names, investment objectives and investment styles that are similar to those of the Fund. You should be aware that the Fund is likely to differ from those other mutual fund(s) in size, cash flow pattern and tax matters. Accordingly, the holdings and performance of the Fund can be expected to vary from those of the other mutual fund(s).
Shares of the separate Neuberger Berman Advisers Management Trust Portfolios, including the Fund, are not available to the general public. Shares of the Fund may be purchased only by life insurance companies to be held in their separate accounts, which fund variable annuity and variable life insurance policies, and by qualified pension and retirement plans.
Statistics and projections in this report are derived from sources deemed to be reliable but cannot be regarded as a representation of future results of the Fund. This report is prepared for the general information of shareholders and is not an offer of shares of the Fund. Shares are sold only through the currently effective prospectus, which must precede or accompany this report.
The "Neuberger Berman" name and logo are registered service marks of Neuberger Berman Group LLC. "Neuberger Berman Management LLC" and the individual Fund name in this piece are either service marks or registered service marks of Neuberger Berman Management LLC.
© 2016 Neuberger Berman Management LLC, distributor. All rights reserved.
3
Information About Your Fund's Expenses (Unaudited)
As a Fund shareholder, you incur two types of costs: (1) transaction costs such as fees and expenses that are, or may be, imposed under your variable contract or qualified pension plan; and (2) ongoing costs, including management fees, distribution and/or service (12b-1) fees (if applicable), and other Fund expenses. This example is intended to help you understand your ongoing costs (in U.S. dollars) of investing in the Fund and compare these costs with the ongoing costs of investing in other mutual funds.
This table is designed to provide information regarding costs related to your investments. The following examples are based on an investment of $1,000 made at the beginning of the six month period ended December 31, 2015 and held for the entire period. The table illustrates the Fund's costs in two ways:
Actual Expenses and Performance: | | The first section of the table provides information about actual account values and actual expenses in dollars, based on the Fund's actual performance during the period indicated. You may use the information in this line, together with the amount you invested, to estimate the expenses you paid over the period. Simply divide your account value by $1,000 (for example, an $8,600 account value divided by $1,000 = 8.6), then multiply the result by the number in the first section of the table under the heading entitled "Expenses Paid During the Period" to estimate the expenses you paid over the period. | |
Hypothetical Example for
Comparison Purposes: | | The second section of the table provides information about hypothetical account values and hypothetical expenses based on the Fund's actual expense ratio and an assumed rate of return at 5% per year before expenses. This return is not the Fund's actual return. The hypothetical account values and expenses may not be used to estimate the actual ending account balance or expenses you paid for the period. You may use this information to compare the ongoing costs of investing in this Fund versus other funds. To do so, compare the expenses shown in this 5% hypothetical example with the 5% hypothetical examples that appear in the shareholder reports of other funds. | |
Please note that the expenses in the table are meant to highlight your ongoing costs only and do not include any transaction costs, such as fees and expenses that are, or may be imposed under your variable contract or qualified pension plan. Therefore, the information under the heading "Hypothetical (5% annual return before expenses)" is useful in comparing ongoing costs only, and will not help you determine the relative total costs of owning different funds. In addition, if these transaction costs were included, your costs would have been higher.
Expense Information as of 12/31/15
NEUBERGER BERMAN ADVISERS MANAGEMENT TRUST LARGE CAP VALUE PORTFOLIO
Actual | | Beginning Account
Value
7/1/15 | | Ending Account
Value
12/31/15 | | Expenses Paid During
the Period*
7/1/15 – 12/31/15 | |
Class I | | $ | 1,000.00 | | | $ | 898.40 | | | $ | 5.65 | | |
Hypothetical (5% annual return before expenses)** | |
Class I | | $ | 1,000.00 | | | $ | 1,019.26 | | | $ | 6.01 | | |
* Expenses are equal to the annualized expense ratio of 1.18%, multiplied by the average account value over the period, multiplied by 184/365 (to reflect the one-half year period shown).
** Hypothetical expenses are equal to the annualized expense ratio of 1.18%, multiplied by the average account value over the period (assuming a 5% annual return), multiplied by 184/365 (to reflect the one-half year period shown).
4
Schedule of Investments Large Cap Value Portfolio 12/31/15
NUMBER OF SHARES | | | | VALUE† | |
Common Stocks (98.2%) | | | |
Aerospace & Defense (0.7%) | | | |
| | 8,592 | | | Textron, Inc. | | $ | 360,950 | | |
Airlines (3.4%) | | | |
| | 11,176 | | | American Airlines Group, Inc. | | | 473,304 | | |
| | 26,197 | | | Delta Air Lines, Inc. | | | 1,327,926 | | |
| | | | 1,801,230 | | |
Auto Components (5.7%) | | | |
| | 29,687 | | | BorgWarner, Inc. | | | 1,283,369 | | |
| | 10,601 | | | Delphi Automotive PLC | | | 908,824 | | |
| | 22,098 | | | Johnson Controls, Inc. | | | 872,650 | | |
| | | | 3,064,843 | | |
Banks (10.4%) | | | |
| | 46,645 | | | Citigroup, Inc. | | | 2,413,879 | | |
| | 24,415 | | | JPMorgan Chase & Co. | | | 1,612,122 | | |
| | 14,695 | | | Wells Fargo & Co. | | | 798,820 | | |
| | 25,656 | | | Zions Bancorporation | | | 700,409 | | |
| | | | 5,525,230 | | |
Capital Markets (7.3%) | | | |
| | 44,312 | | | Bank of New York Mellon Corp. | | | 1,826,541 | | |
| | 7,720 | | | Goldman Sachs Group, Inc. | | | 1,391,375 | | |
| | 20,842 | | | Morgan Stanley | | | 662,984 | | |
| | | | 3,880,900 | | |
Commercial Services & Supplies (1.5%) | | | |
| | 38,405 | | | Pitney Bowes, Inc. | | | 793,063 | | |
Construction & Engineering (0.4%) | | | |
| | 4,855 | | | Jacobs Engineering Group, Inc. | | | 203,667 | * | |
Diversified Financial Services (1.4%) | | | |
| | 8,495 | | | CME Group, Inc. | | | 769,647 | | |
Electrical Equipment (6.2%) | | | |
| | 51,281 | | | Eaton Corp. PLC | | | 2,668,663 | | |
| | 13,507 | | | Emerson Electric Co. | | | 646,040 | | |
| | | | 3,314,703 | | |
Energy Equipment & Services (3.3%) | | | |
| | 25,571 | | | Schlumberger Ltd. | | | 1,783,577 | | |
Hotels, Restaurants & Leisure (6.5%) | | | |
| | 63,279 | | | Carnival Corp. | | | 3,447,440 | | |
NUMBER OF SHARES | | | | VALUE† | |
Household Products (1.1%) | | | |
| | 7,776 | | | Procter & Gamble Co. | | $ | 617,492 | | |
Industrial Conglomerates (4.9%) | | | |
| | 84,533 | | | General Electric Co. | | | 2,633,203 | | |
Insurance (1.0%) | | | |
| | 179 |
| | American International
Group, Inc. | | | 11,093
| | |
| | 10,486 | | | Lincoln National Corp. | | | 527,026 | | |
| | | | 538,119 | | |
Machinery (8.4%) | | | |
| | 32,894 | | | Caterpillar, Inc. | | | 2,235,476 | | |
| | 6,879 | | | Illinois Tool Works, Inc. | | | 637,546 | | |
| | 78,541 | | | Joy Global, Inc. | | | 990,402 | | |
| | 6,270 | | | Parker Hannifin Corp. | | | 608,065 | | |
| | | | 4,471,489 | | |
Metals & Mining (9.1%) | | | |
| | 21,534 | | | Alcoa, Inc. | | | 212,541 | | |
| | 59,807 | | | BHP Billiton Ltd. ADR | | | 1,540,628 | | |
| | 171,982 | | | Newmont Mining Corp. | | | 3,093,956 | | |
| | | | 4,847,125 | | |
Multiline Retail (1.4%) | | | |
| | 110,428 | | | JC Penney Co., Inc. | | | 735,451 | * | |
Oil, Gas & Consumable Fuels (16.7%) | | | |
| | 1,951 | | | Chevron Corp. | | | 175,512 | | |
| | 35,729 | | | Devon Energy Corp. | | | 1,143,328 | | |
| | 16,751 | | | EOG Resources, Inc. | | | 1,185,803 | | |
| | 43,411 | | | Exxon Mobil Corp. | | | 3,383,887 | | |
| | 45,114 |
| | Memorial Resource
Development Corp. | | | 728,591
| * | |
| | 10,505 | | | Pioneer Natural Resources Co. | | | 1,317,117 | | |
| | 39,947 | | | Range Resources Corp. | | | 983,096 | | |
| | | | 8,917,334 | | |
Road & Rail (0.5%) | | | |
| | 7,065 | | | Avis Budget Group, Inc. | | | 256,389 | * | |
Semiconductors & Semiconductor
Equipment (1.0%) | | | |
| | 9,469 | | | Analog Devices, Inc. | | | 523,825 | | |
Technology Hardware, Storage &
Peripherals (1.4%) | | | |
| | 12,288 | | | Western Digital Corp. | | | 737,895 | | |
See Notes to Schedule of Investments
5
Schedule of Investments Large Cap Value Portfolio (cont'd)
NUMBER OF SHARES | | | | VALUE† | |
Textiles, Apparel & Luxury Goods (5.9%) | | | |
| | 10,236 | | | Coach, Inc. | | $ | 335,024 | | |
| | 25,375 | | | Ralph Lauren Corp. | | | 2,828,805 | | |
| | | | 3,163,829 | | |
| | | | Total Common Stocks
(Cost $54,987,512) | | | 52,387,401 | | |
Short-Term Investments (2.2%) | | | |
| 1,148,545 | | | State Street Institutional
Liquid Reserves
Fund Premier Class, 0.23%
(Cost $1,148,545) | | | 1,148,545 | a | |
| | | | Total Investments (100.4%)
(Cost $56,136,057) | | | 53,535,946 | ## | |
| | | | Liabilities, less cash, receivables
and other assets [(0.4%)] | | | (196,284 | ) | |
| | | | | Total Net Assets (100.0%) | | $ | 53,339,662 | | |
See Notes to Schedule of Investments
6
Notes to Schedule of Investments Large Cap Value Portfolio
† In accordance with Accounting Standards Codification ("ASC") 820 "Fair Value Measurement" ("ASC 820"), all investments held by Neuberger Berman Advisers Management Trust Large Cap Value Portfolio (the "Fund") are carried at the value that Neuberger Berman Investment Advisers LLC ("Management") believes the Fund would receive upon selling an investment in an orderly transaction to an independent buyer in the principal or most advantageous market for the investment under current market conditions. Various inputs, including the volume and level of activity for the asset or liability in the market, are considered in valuing the Fund's investments, some of which are discussed below. Significant Management judgment may be necessary to value investments in accordance with ASC 820.
ASC 820 established a three-tier hierarchy of inputs to create a classification of value measurements for disclosure purposes. The three-tier hierarchy of inputs is summarized in the three broad Levels listed below.
• Level 1 – quoted prices in active markets for identical investments
• Level 2 – other observable inputs (including quoted prices for similar investments, interest rates, prepayment speeds, credit risk, amortized cost, etc.)
• Level 3 – unobservable inputs (including the Fund's own assumptions in determining the fair value of investments)
The inputs or methodology used for valuing an investment are not necessarily an indication of the risk associated with investing in those securities.
The value of the Fund's investments in equity securities, for which market quotations are readily available, is generally determined by Management by obtaining valuations from independent pricing services based on the latest sale price quoted on a principal exchange or market for that security (Level 1 inputs). Securities traded primarily on the NASDAQ Stock Market are normally valued at the NASDAQ Official Closing Price ("NOCP") provided by NASDAQ each business day. The NOCP is the most recently reported price as of 4:00:02 p.m., Eastern Time, unless that price is outside the range of the "inside" bid and asked prices (i.e., the bid and asked prices that dealers quote to each other when trading for their own accounts); in that case, NASDAQ will adjust the price to equal the inside bid or asked price, whichever is closer. Because of delays in reporting trades, the NOCP may not be based on the price of the last trade to occur before the market closes. If there is no sale of a security on a particular day, the independent pricing services may value the security based on market quotations.
Management has developed a process to periodically review information provided by independent pricing services for all types of securities.
Investments in non-exchange traded investment companies are valued using the respective fund's daily calculated net asset value per share (Level 2 inputs).
If a valuation is not available from an independent pricing service, or if Management has reason to believe that the valuation received does not represent the amount the Fund might reasonably expect to receive on a current sale in an orderly transaction, Management seeks to obtain quotations from brokers or dealers (generally considered Level 2 or Level 3 inputs depending on the number of quotes available). If such quotations are not readily available, the security is valued using methods the Neuberger Berman Advisers Management Trust's Board of Trustees (the "Board") has approved in the good-faith belief that the resulting valuation will reflect the fair value of the security. Numerous factors may be considered when determining the fair value of a security based on Level 2 or Level 3 inputs, including available analyst, media or other reports, trading in financial futures or American Depositary Receipts ("ADRs") and whether the issuer of the security being fair valued has other securities outstanding.
The value of the Fund's investments in foreign securities is generally determined using the same valuation methods and inputs as other Fund investments, as discussed above. Foreign security prices expressed in local currency
See Notes to Financial Statements
7
Notes to Schedule of Investments Large Cap Value Portfolio (cont'd)
values are translated from the local currency into U.S. dollars using the exchange rates as of the end of regular trading on the New York Stock Exchange ("NYSE") on business days, usually 4:00 p.m., Eastern Time. The Board has approved the use of Interactive Data Pricing and Reference Data, Inc. ("Interactive") to assist in determining the fair value of foreign equity securities when changes in the value of a certain index suggest that the closing prices on the foreign exchanges may no longer represent the amount that the Fund could expect to receive for those securities or on days when foreign markets are closed and U.S. markets are open. In each of these events, Interactive will provide adjusted prices for certain foreign equity securities using a statistical analysis of historical correlations of multiple factors (Level 2 inputs). In the absence of precise information about the market values of these foreign securities as of the close of the NYSE, the Board has determined on the basis of available data that prices adjusted in this way are likely to be closer to the prices the Fund could realize on a current sale than are the prices of those securities established at the close of the foreign markets in which the securities primarily trade.
Fair value prices are necessarily estimates, and there is no assurance that such a price will be at or close to the price at which the security is next quoted or next trades.
The following is a summary, categorized by Level, of inputs used to value the Fund's investments as of December 31, 2015:
Asset Valuation Inputs | | Level 1 | | Level 2 | | Level 3 | | Total | |
Investments: | |
Common Stocks^ | | $ | 52,387,401 | | | $ | — | | | $ | — | | | $ | 52,387,401 | | |
Short-Term Investments | | | — | | | | 1,148,545 | | | | — | | | | 1,148,545 | | |
Total Investments | | $ | 52,387,401 | | | $ | 1,148,545 | | | $ | — | | | $ | 53,535,946 | | |
^ The Schedule of Investments provides information on the industry categorization for the portfolio.
As of the year ended December 31, 2015, no securities were transferred from one level (as of December 31, 2014) to another.
## At December 31, 2015, the cost of investments for U.S. federal income tax purposes was $57,530,400. Gross unrealized appreciation of investments was $1,622,056 and gross unrealized depreciation of investments was $5,616,510, resulting in net unrealized depreciation of $3,994,454, based on cost for U.S. federal income tax purposes.
* Security did not produce income during the last twelve months.
a The rate shown is the annualized seven day yield as of December 31, 2015.
See Notes to Financial Statements
8
Statement of Assets and Liabilities
Neuberger Berman Advisers Management Trust
| | | LARGE CAP
VALUE
PORTFOLIO | |
| | | December 31, 2015 | |
Assets | |
Investments in securities, at value* (Note A)—see Schedule of Investments: | |
Unaffiliated issuers | | $ | 53,535,946 | | |
Dividends and interest receivable | | | 90,324 | | |
Receivable for securities sold | | | 508,136 | | |
Receivable for Fund shares sold | | | 35,155 | | |
Prepaid expenses and other assets | | | 14,649 | | |
Total Assets | | | 54,184,210 | | |
Liabilities | |
Payable for securities purchased | | | 709,078 | | |
Payable for Fund shares redeemed | | | 38,439 | | |
Payable to investment manager (Note B) | | | 25,430 | | |
Payable to administrator (Note B) | | | 13,871 | | |
Accrued expenses and other payables | | | 57,730 | | |
Total Liabilities | | | 844,548 | | |
Net Assets | | $ | 53,339,662 | | |
Net Assets consist of: | |
Paid-in capital | | $ | 51,632,274 | | |
Undistributed net investment income (loss) | | | 547,474 | | |
Accumulated net realized gains (losses) on investments | | | 3,760,025 | | |
Net unrealized appreciation (depreciation) in value of investments | | | (2,600,111 | ) | |
Net Assets | | $ | 53,339,662 | | |
Shares Outstanding ($.001 par value; unlimited shares authorized) | | | 4,044,855 | | |
Net Asset Value, offering and redemption price per share | | $ | 13.19 | | |
*Cost of Investments | | $ | 56,136,057 | | |
See Notes to Financial Statements
9
Neuberger Berman Advisers Management Trust
| | | LARGE CAP
VALUE
PORTFOLIO | |
| | | For the
Year Ended
December 31, 2015 | |
Investment Income: | |
Income (Note A): | |
Dividend income—unaffiliated issuers | | $ | 1,251,299 | | |
Interest income—unaffiliated issuers | | | 2,122 | | |
Foreign taxes withheld (Note A) | | | (3,440 | ) | |
Total income | | $ | 1,249,981 | | |
Expenses: | |
Investment management fees (Note B) | | | 338,909 | | |
Administration fees (Note B) | | | 184,859 | | |
Audit fees | | | 45,335 | | |
Custodian and accounting fees | | | 32,509 | | |
Insurance expense | | | 2,009 | | |
Legal fees | | | 35,619 | | |
Shareholder reports | | | 22,653 | | |
Trustees' fees and expenses | | | 35,254 | | |
Interest expense | | | 420 | | |
Miscellaneous | | | 4,893 | | |
Total net expenses | | | 702,460 | | |
Net investment income (loss) | | $ | 547,521 | | |
Realized and Unrealized Gain (Loss) on Investments (Note A): | |
Net realized gain (loss) on: | |
Sales of investment securities of unaffiliated issuers | | | 3,909,708 | | |
Change in net unrealized appreciation (depreciation) in value of: | |
Unaffiliated investment securities | | | (11,830,067 | ) | |
Net gain (loss) on investments | | | (7,920,359 | ) | |
Net increase (decrease) in net assets resulting from operations | | $ | (7,372,838 | ) | |
See Notes to Financial Statements
10
Statements of Changes in Net Assets
Neuberger Berman Advisers Management Trust
| | | LARGE CAP VALUE PORTFOLIO | |
| | | Year Ended
December 31,
2015 | | Year Ended
December 31,
2014 | |
Increase (Decrease) in Net Assets: | |
From Operations: | |
Net investment income (loss) (Note A) | | $ | 547,521 | | | $ | 497,614 | | |
Net realized gain (loss) on investments (Note A) | | | 3,909,708 | | | | 7,596,401 | | |
Net increase from payments by affiliates (Note B) | | | — | | | | 4,262 | | |
Change in net unrealized appreciation (depreciation) of investments (Note A) | | | (11,830,067 | ) | | | (1,520,748 | ) | |
Net increase (decrease) in net assets resulting from operations | | | (7,372,838 | ) | | | 6,577,529 | | |
Distributions to Shareholders From (Note A): | |
Net investment income | | | (455,286 | ) | | | (511,067 | ) | |
Net realized gain on investments | | | (4,600,984 | ) | | | — | | |
Total distributions to shareholders | | | (5,056,270 | ) | | | (511,067 | ) | |
From Fund Share Transactions (Note D): | |
Proceeds from shares sold | | | 5,949,491 | | | | 9,917,368 | | |
Proceeds from reinvestment of dividends and distributions | | | 5,056,270 | | | | 511,067 | | |
Payments for shares redeemed | | | (15,513,932 | ) | | | (16,145,924 | ) | |
Net increase (decrease) from Fund share transactions | | | (4,508,171 | ) | | | (5,717,489 | ) | |
Net Increase (Decrease) in Net Assets | | | (16,937,279 | ) | | | 348,973 | | |
Net Assets: | |
Beginning of year | | | 70,276,941 | | | | 69,927,968 | | |
End of year | | $ | 53,339,662 | | | $ | 70,276,941 | | |
Undistributed net investment income (loss) at end of year | | $ | 547,474 | | | $ | 497,578 | | |
See Notes to Financial Statements
11
Notes to Financial Statements Large Cap Value Portfolio
Note A—Summary of Significant Accounting Policies:
1 General: Neuberger Berman Advisers Management Trust (the "Trust") is a Delaware statutory trust organized pursuant to an Amended and Restated Trust Instrument dated March 27, 2014. The Trust is currently comprised of eight separate operating series (each individually a "Fund," and collectively the "Funds") each of which is diversified. The Trust is registered as an open-end management investment company under the Investment Company Act of 1940, as amended (the "1940 Act"), and its shares are registered under the Securities Act of 1933, as amended. The Fund currently offers only Class I shares. The Board may establish additional series or classes of shares without the approval of shareholders.
The assets of each Fund belong only to that Fund, and the liabilities of each Fund are borne solely by that Fund and no other.
The Fund is an investment company and accordingly follows the investment company accounting and reporting guidance of the Financial Accounting Standards Board (FASB) Accounting Standard Codification Topic 946 "Financial Services—Investment Companies."
The preparation of financial statements in accordance with U.S. generally accepted accounting principles ("GAAP") requires Management to make estimates and assumptions at the date of the financial statements. Actual results could differ from those estimates.
Shares of the Fund are not available to the general public and may be purchased only by life insurance companies to be held in their separate accounts, which fund variable annuity and variable life insurance policies, and by qualified pension and retirement plans.
2 Portfolio valuation: Investment securities are valued as indicated in the notes following the Schedule of Investments.
3 Foreign currency translation: The accounting records of the Fund are maintained in U.S. dollars. Foreign currency amounts are translated into U.S. dollars using the exchange rate as of the end of regular trading on the NYSE on business days, usually 4:00 p.m. Eastern Time, to determine the value of investments, other assets and liabilities. Purchase and sale prices of securities, and income and expenses, are translated into U.S. dollars at the prevailing rate of exchange on the respective dates of such transactions. Net unrealized foreign currency gain (loss), if any, arises from changes in the value of assets and liabilities, other than investments in securities, as a result of changes in exchange rates and is stated separately in the Statement of Operations.
4 Securities transactions and investment income: Securities transactions are recorded on trade date for financial reporting purposes. Dividend income is recorded on the ex-dividend date or, for certain foreign dividends, as soon as the Fund becomes aware of the dividends. Non-cash dividends included in dividend income, if any, are recorded at the fair market value of the securities received. Interest income, including accretion of original issue discount, where applicable, and accretion of discount on short-term investments, if any, is recorded on the accrual basis. Realized gains and losses from securities transactions and foreign currency transactions, if any, are recorded on the basis of identified cost and stated separately in the Statement of Operations. Included in net realized gain (loss) on investments are proceeds from the settlements of class action litigation in which the Fund participated as a class member. The amount of such proceeds for the year ended December 31, 2015 was $110,562.
5 Income tax information: Each Fund is treated as a separate entity for U.S. federal income tax purposes. It is the policy of the Fund to continue to qualify for treatment as a regulated investment company ("RIC") by complying with the requirements of the U.S. Internal Revenue Code applicable to RICs and to distribute substantially all of its net investment income and net realized capital gains to its shareholders. To the extent the Fund distributes substantially all of its net investment income and net realized capital gains to shareholders, no federal income or excise tax provision is required.
12
The Fund has adopted the provisions of ASC 740 "Income Taxes" ("ASC 740"). ASC 740 sets forth a minimum threshold for financial statement recognition of a tax position taken, or expected to be taken, in a tax return. The Fund recognizes interest and penalties, if any, related to unrecognized tax positions as an income tax expense in the Statement of Operations. The Fund is subject to examination by U.S. federal and state tax authorities for returns filed for the tax years for which the applicable statutes of limitations have not yet expired. As of December 31, 2015, the Fund did not have any unrecognized tax positions.
Income distributions and capital gain distributions are determined in accordance with income tax regulations, which may differ from GAAP. These differences are primarily due to differing treatments of income and gains on various investment securities held by the Fund, timing differences and differing characterization of distributions made by the Fund. The Fund may also utilize earnings and profits distributed to shareholders on redemption of their shares as a part of the dividends-paid deduction for income tax purposes.
As determined on December 31, 2015, permanent differences resulting primarily from different book and tax accounting were reclassified at year end. Such differences are attributed to the tax treatment of prior year basis and return of capital adjustments. These reclassifications had no effect on net income, net asset value ("NAV") or NAV per share of the Fund. For the year ended December 31, 2015, the Fund recorded the following permanent reclassifications:
| Paid-in Capital | | Undistributed
Net Investment
Income (Loss) | | Accumulated
Net Realized
Gains (Losses)
on Investments | |
| $ | (1 | ) | | $ | (42,339 | ) | | $ | 42,340 | | |
The tax character of distributions paid during the years ended December 31, 2015 and December 31, 2014 was as follows:
Distributions Paid From: | |
Ordinary Income | | Long- Term Capital Gain | | Total | |
| 2015 | | 2014 | | 2015 | | 2014 | | 2015 | | 2014 | |
| $ | 455,286 | | | $ | 511,067 | | | $ | 4,600,984 | | | $ | — | | | $ | 5,056,270 | | | $ | 511,067 | | |
As of December 31, 2015, the components of distributable earnings (accumulated losses) on a U.S. federal income tax basis were as follows:
Undistributed
Ordinary
Income | | Undistributed
Long-Term
Capital Gain | | Unrealized
Appreciation
(Depreciation) | | Loss
Carryforwards
and Deferrals | | Other
Temporary
Differences | | Total | |
| $ | 547,474 | | | $ | 5,154,368 | | | $ | (3,994,454 | ) | | $ | — | | | $ | — | | | $ | 1,707,388 | | |
The differences between book basis and tax basis distributable earnings are primarily due to losses disallowed and recognized on wash sales and return of capital adjustments.
6 Distributions to shareholders: The Fund may earn income, net of expenses, daily on its investments. Distributions from net investment income and net realized capital gains, if any, generally are distributed once a year (usually in October). Income distributions and capital gain distributions to shareholders are recorded on the ex-date.
7 Foreign taxes: Foreign taxes withheld, if any, represent amounts withheld by foreign tax authorities, net of refunds recoverable.
8 Expense allocation: Certain expenses are applicable to multiple funds within the complex of related investment companies. Expenses directly attributable to a Fund are charged to that Fund. Expenses of the Trust that are not directly attributable to a particular series of the Trust (e.g., the Fund) are allocated among the series of the Trust, on the basis of relative net assets, except where a more appropriate allocation of expenses to each of the series can
13
otherwise be made fairly. Expenses borne by the complex of related investment companies, which includes open-end and closed-end investment companies for which Management serves as investment manager, that are not directly attributable to a particular investment company in the complex (e.g., the Trust) or series thereof are allocated among the investment companies in the complex or series thereof on the basis of relative net assets, except where a more appropriate allocation of expenses to each of the investment companies in the complex or series thereof can otherwise be made fairly.
9 Investments in foreign securities: Investing in foreign securities may involve certain sovereign and other risks, in addition to the credit and market risks normally associated with domestic securities. These additional risks include the possibility of adverse political and economic developments (including political instability, nationalization, expropriation, or confiscatory taxation) and the potentially adverse effects of unavailability of public information regarding issuers, less governmental supervision and regulation of financial markets, reduced liquidity of certain financial markets, and the lack of uniform accounting, auditing, and financial reporting standards or the application of standards that are different or less stringent than those applied in the United States. Foreign securities also may experience greater price volatility, higher rates of inflation, and delays in settlement.
10 Indemnifications: Like many other companies, the Trust's organizational documents provide that its officers ("Officers") and trustees ("Trustees") are indemnified against certain liabilities arising out of the performance of their duties to the Trust. In addition, both in some of its principal service contracts and in the normal course of its business, the Trust enters into contracts that provide indemnifications to other parties for certain types of losses or liabilities. The Trust's maximum exposure under these arrangements is unknown as this could involve future claims against the Trust.
Note B—Investment Management Fees, Administration Fees, Distribution Arrangements, and Other Transactions with Affiliates:
The Fund retains Management as its investment manager under a Management Agreement. For such investment management services, the Fund pays Management a fee at the annual rate of 0.55% of the first $250 million of the Fund's average daily net assets, 0.525% of the next $250 million, 0.50% of the next $250 million, 0.475% of the next $250 million, 0.45% of the next $500 million, 0.425% of the next $2.5 billion, and 0.40% of average daily net assets in excess of $4 billion. Accordingly, for the year ended December 31, 2015, the investment management fee pursuant to the Management Agreement was equivalent to an annual effective rate of 0.55% of the Fund's average daily net assets.
The Fund retains Management as its administrator under an Administration Agreement. The Fund pays Management an administration fee at the annual rate of 0.30% of its average daily net assets under this agreement. Additionally, Management retains State Street Bank and Trust Company ("State Street") as its sub-administrator under a Sub-Administration Agreement. Management pays State Street a fee for all services received under this agreement.
The Board adopted a non-fee distribution plan for the Fund.
Management has contractually agreed to waive fees and/or reimburse the Fund so that the total annual operating expenses do not exceed the expense limitations as detailed in the following table. These undertakings exclude fees payable to Management, interest, taxes, brokerage commissions, dividend and interest expenses relating to short sales, acquired fund fees and expenses, extraordinary expenses and transaction costs, if any; consequently, net expenses may exceed the contractual expense limitation. The Fund has agreed that it will repay Management for fees and expenses waived or reimbursed provided that repayment does not cause the annual operating expenses to exceed its contractual expense limitation in place at the time the fees and expenses were waived or reimbursed, or the expense limitation in place at the time the Fund repays Management, whichever is lower. Any such repayment must be made within three years after the year in which Management incurred the expense.
14
During the year ended December 31, 2015, there was no repayment to Management under its contractual expense limitation. At December 31, 2015 the Fund had no contingent liability to Management under its contractual expense limitation.
| | | | | | | Expenses Reimbursed in
Fiscal Year Ending December 31, | |
| | | | | | | 2013 | | 2014 | | 2015 | |
| | | | | | | Subject to Repayment Until December 31, | |
| | | Contractual
Expense
Limitation(1) | | Expiration | | 2016 | | 2017 | | 2018 | |
Class I | | | 1.00 | % | | 12/31/18 | | $ | — | | | $ | — | | | $ | — | | |
(1) Expense limitation per annum of the Fund's average daily net assets.
Neuberger Berman LLC ("Neuberger") was retained by Management through December 31, 2015, pursuant to a Sub-Advisory Agreement to furnish it with investment recommendations and research information without added cost to the Fund. Several individuals who are Officers and/or Trustees of the Trust are also employees of Neuberger and/or Management. As a result of the entity consolidation described on page 3 of this Annual Report, the services previously provided by Neuberger under the Sub-Advisory Agreement are being provided by NBIA as of January 1, 2016.
On June 3, 2014, Management made a voluntary contribution of $4,262 to the Fund in connection with a payment matter related to the Fund's investment in a State Street money market fund.
Note C—Securities Transactions:
During the year ended December 31, 2015, there were purchase and sale transactions (excluding short-term securities) of $91,217,637and $98,803,289, respectively.
During the year ended December 31, 2015, no brokerage commissions on securities transactions were paid to affiliated brokers.
Note D—Fund Share Transactions:
Share activity for the years ended December 31, 2015 and December 31, 2014 was as follows:
| | | For the Year Ended December 31, | |
| | | 2015 | | 2014 | |
Shares Sold | | | 394,307 | | | | 641,582 | | |
Shares Issued on Reinvestment of Dividends and Distributions | | | 360,647 | | | | 34,861 | | |
Shares Redeemed | | | (999,063 | ) | | | (1,036,437 | ) | |
Total | | | (244,109 | ) | | | (359,994 | ) | |
Note E—Lines of Credit:
At December 31, 2015, the Fund was a participant in a syndicated committed, unsecured $700,000,000 line of credit (the "Credit Facility"), to be used only for temporary or emergency purposes. Series of other investment companies managed by Management also participate in this line of credit on substantially the same terms except that some do not have access to the full amount of the Credit Facility. Under the terms of the Credit Facility, the Fund has agreed to pay its share of the annual commitment fee, based on the ratio of its individual net assets to the net assets of all participants at the time the fee is due and payable and the level of its access to the Credit Facility, and interest charged on any borrowing made by the Fund and other costs incurred by the Fund. Because several
15
mutual funds participate in the Credit Facility, there is no assurance that the Fund will have access to all or any part of the $700,000,000 at any particular time. There were no loans outstanding under the Credit Facility at December 31, 2015. During the period from January 9, 2015 (the commencement date of the Credit Facility) through December 31, 2015, the Fund did not utilize this line of credit. The Credit Facility replaced the State Street lines of credit referred to below.
During the reporting period, from January 1, 2015 through January 9, 2015, the Fund was a participant in a committed, unsecured $300,000,000 line of credit with State Street and an uncommitted, unsecured $100,000,000 line of credit with State Street, both to be used only for temporary or emergency purposes. During the period ended December 31, 2015, the Fund did not utilize either line of credit with State Street.
16
Large Cap Value Portfolio
The following table includes selected data for a share outstanding throughout each year and other performance information derived from the Financial Statements. Amounts that do not round to $0.01 or ($0.01) per share are presented as $0.00 or ($0.00), respectively. Ratios that do not round to 0.01% or (0.01)% are presented as 0.00% or (0.00)%, respectively. Net Asset amounts with a zero balance, if any, may reflect actual amounts rounding to less than $0.1 million. A "—" indicates that the line item was not applicable in the corresponding period.
Class I | |
| | | Year Ended December 31, | |
| | | 2015 | | 2014 | | 2013 | | 2012 | | 2011 | |
Net Asset Value, Beginning of Year | | $ | 16.39 | | | $ | 15.04 | | | $ | 11.60 | | | $ | 9.99 | | | $ | 11.27 | | |
Income From Investment Operations: | |
| Net Investment Income (Loss)‡ | | | 0.14 | | | | 0.11 | | | | 0.10 | | | | 0.12 | | | | 0.03 | | |
Net Gains or Losses on Securities
(both realized and unrealized) | | | (2.00 | ) | | | 1.36 | | | | 3.50 | | | | 1.54 | | | | (1.31 | ) | |
Total From Investment Operations | | | (1.86 | ) | | | 1.47 | | | | 3.60 | | | | 1.66 | | | | (1.28 | ) | |
Less Distributions From: | |
Net Investment Income | | | (0.12 | ) | | | (0.12 | ) | | | (0.16 | ) | | | (0.05 | ) | | | — | | |
Net Capital Gains | | | (1.22 | ) | | | — | | | | — | | | | — | | | | — | | |
Total Distributions | | | (1.34 | ) | | | (0.12 | ) | | | (0.16 | ) | | | (0.05 | ) | | | — | | |
Voluntary Contribution from Management | | | — | | | | 0.00 | | | | — | | | | — | | | | — | | |
Net Asset Value, End of Year | | $ | 13.19 | | | $ | 16.39 | | | $ | 15.04 | | | $ | 11.60 | | | $ | 9.99 | | |
| Total Return†† | | | (11.80 | )%b | 9.85 | %ab | 31.14 | %b | 16.60 | % | (11.36 | )% |
Ratios/Supplemental Data | |
Net Assets, End of Year (in millions) | | $ | 53.3 | | | $ | 70.3 | | | $ | 69.9 | | | $ | 61.9 | | | $ | 75.3 | | |
| Ratio of Gross Expenses to Average Net Assets# | | | 1.14 | % | | | 1.10 | % | | | 1.13 | % | | | 1.15 | % | | | 1.13 | % | |
Ratio of Net Expenses to Average Net Assets | | | 1.14 | % | | | 1.10 | % | | | 1.13 | % | | | 1.15 | %§ | 1.13 | %§ |
Ratio of Net Investment Income (Loss) to Average
Net Assets | | | 0.89 | % | | | 0.71 | % | | | 0.78 | % | | | 1.15 | % | | | 0.29 | % | |
Portfolio Turnover Rate | | | 153 | % | | | 130 | % | | | 165 | % | | | 124 | % | | | 102 | % | |
See Notes to Financial Highlights
17
Notes to Financial Highlights Large Cap Value Portfolio
†† Total return based on per share NAV reflects the effects of changes in NAV on the performance of the Fund during each fiscal period. Returns assume income dividends and other distributions, if any, were reinvested. Results represent past performance and do not indicate future results. Current returns may be lower or higher than the performance data quoted. Investment returns and principal may fluctuate and shares when redeemed may be worth more or less than original cost. Total return would have been lower if Management had not reimbursed and/or waived certain expenses. The total return information shown does not reflect charges and other expenses that apply to the separate accounts or the related insurance policies or other qualified pension or retirement plans, and the inclusion of these charges and other expenses would reduce the total return for all fiscal periods shown.
b Had the Fund not received the class action proceeds listed in Note A of the Notes to Financial Statements, total return based on per share NAV for the year ended December 31, 2015 would have been (11.94)%. Had the Fund not received class action proceeds in 2014, total return based on per share NAV for the year ended December 31, 2014 would have been 9.72%. Had the Fund not received class action proceeds in 2013, total return based on per share NAV for the year ended December 31, 2013 would have been 30.61%.
# Represents the annualized ratios of net expenses to average daily net assets if Management had not reimbursed certain expenses and/or waived a portion of the investment management fee. Management did not reimburse or waive fees during the fiscal periods shown.
‡ Calculated based on the average number of shares outstanding during each fiscal period.
§ Prior to January 1, 2013, the Fund had an expense offset arrangement in connection with its custodian contract. The impact of expense reductions related to expense offset arrangements, if any, was less than 0.01%.
a The voluntary contribution listed in Note B of the Notes to Financial Statements had no impact on the Fund's total returns for the year ended December 31, 2014.
18
Report of Independent Registered Public Accounting Firm
To the Board of Trustees of
Neuberger Berman Advisers Management Trust and
Shareholders of Large Cap Value Portfolio
We have audited the accompanying statement of assets and liabilities of Large Cap Value Portfolio, one of the series constituting Neuberger Berman Advisers Management Trust (the "Trust"), including the schedule of investments, as of December 31, 2015, and the related statement of operations for the year then ended, the statements of changes in net assets for each of the two years in the period then ended and the financial highlights for each of the five years in the period then ended. These financial statements and financial highlights are the responsibility of the Trust's management. Our responsibility is to express an opinion on these financial statements and financial highlights based on our audits.
We conducted our audits in accordance with the standards of the Public Company Accounting Oversight Board (United States). Those standards require that we plan and perform the audit to obtain reasonable assurance about whether the financial statements and financial highlights are free of material misstatement. We were not engaged to perform an audit of the Trust's internal control over financial reporting. Our audits included consideration of internal control over financial reporting as a basis for designing audit procedures that are appropriate in the circumstances, but not for the purpose of expressing an opinion on the effectiveness of the Trust's internal control over financial reporting. Accordingly, we express no such opinion. An audit also includes examining, on a test basis, evidence supporting the amounts and disclosures in the financial statements and financial highlights, assessing the accounting principles used and significant estimates made by management, and evaluating the overall financial statement presentation. Our procedures included confirmation of securities owned as of December 31, 2015 by correspondence with the custodian and others or by other appropriate auditing procedures where replies from others were not received. We believe that our audits provide a reasonable basis for our opinion.
In our opinion, the financial statements and financial highlights referred to above present fairly, in all material respects, the financial position of Large Cap Value Portfolio, a series of Neuberger Berman Advisers Management Trust, at December 31, 2015, the results of its operations for the year then ended, the changes in its net assets for each of the two years in the period then ended, and the financial highlights for each of the five years in the period then ended in conformity with U.S. generally accepted accounting principles.

Boston, Massachusetts
February 16, 2016
19
The following tables set forth information concerning the Trustees and Officers of the Fund. All persons named as Trustees and Officers also serve in similar capacities for other funds administered or managed by Management. The Fund's Statement of Additional Information includes additional information about the Trustees as of the time of the Fund's most recent public offering and is available upon request, without charge, by calling (800) 877-9700.
Information about the Board of Trustees
Name, (Year of Birth),
and Address(1) | | Position(s) and
Length of
Time Served(2) | | Principal Occupation(s)(3) | | Number of
Funds in Fund
Complex
Overseen by
Fund Trustee | | Other Directorships Held
Outside Fund Complex by
Fund Trustee(3) | |
Independent Trustees | |
Faith Colish (1935) | | Trustee since 1982 | | Counsel, Carter Ledyard & Milburn LLP (law firm) since October 2002; formerly, Attorney-at-Law and President, Faith Colish, A Professional Corporation, 1980 to 2002. | | | 58 | | | Formerly, Director, 1997 to 2003, and Advisory Director, 2003 to 2006, ABA Retirement Funds (formerly, American Bar Retirement Association) (not-for-profit membership corporation). | |
Michael J. Cosgrove (1949) | | Trustee since 2015 | | President, Carragh Consulting USA, since 2014; formerly, Executive, General Electric Company, 1982 to 2014, including President, Mutual Funds and Global Investment Programs, GE Asset Management, 2011 to 2014, President and Chief Executive Officer, Mutual Funds and Intermediary Business, GE Asset Management, 2007 to 2011, and President, Institutional Sales and Marketing, GE Asset Management, 1998 to 2007. | | | 58 | | | Director, The Gabelli Go Anywhere Trust, since 2015; Director, America Press, Inc. (not-for-profit Jesuit publisher), since 2015; Director, Fordham University, since 2001; Director, Skin Cancer Foundation (not-for-profit), since 2006; formerly, Director, GE Investments Funds, Inc., 1997 to 2014; Trustee, GE Institutional Funds, 1997 to 2014; Director, GE Asset Management, 1988 to 2014; Director, Elfun Trusts, 1988 to 2014. | |
20
Name, (Year of Birth),
and Address(1) | | Position(s) and
Length of
Time Served(2) | | Principal Occupation(s)(3) | | Number of
Funds in Fund
Complex
Overseen by
Fund Trustee | | Other Directorships Held
Outside Fund Complex by
Fund Trustee(3) | |
Marc Gary (1952) | | Trustee since 2015 | | Executive Vice Chancellor and Chief Operating Officer, Jewish Theological Seminary, since 2012; formerly, Executive Vice President and General Counsel, Fidelity Investments, 2007 to 2012; Executive Vice President and General Counsel, BellSouth Corporation, 2004 to 2007; Vice President and Associate General Counsel, BellSouth Corporation, 2000 to 2004; Associate, Partner, and National Litigation Practice Co-Chair, Mayer, Brown LLP, 1981 to 2000; Associate Independent Counsel, Office of Independent Counsel, 1990 to 1992. | | | 58 | | | Trustee, Jewish Theological Seminary, since 2015; Director, Counsel on Call (privately held for-profit company), since 2012; Director, Lawyers Committee for Civil Rights Under Law (not-for-profit), since 2005; formerly, Director, Equal Justice Works (not-for-profit), 2005 to 2014; Director, Corporate Counsel Institute, Georgetown University Law Center, 2007 to 2012; Director, Greater Boston Legal Services (not-for-profit), 2007 to 2012. | |
Martha C. Goss (1949) | | Trustee since 2007 | | President, Woodhill Enterprises Inc./Chase Hollow Associates LLC (personal investment vehicle), since 2006; formerly, Consultant, Resources Global Professionals (temporary staffing), 2002 to 2006. | | | 58 | | | Director, American Water (water utility), since 2003; Director, Allianz Life of New York (insurance), since 2005; Director, Berger Group Holdings, Inc. (engineering consulting firm), since 2013; Director, Financial Women's Association of New York (not-for-profit association), since 2003; Trustee Emerita, Brown University, since 1998; Director, Museum of American Finance (not-for-profit), since 2013; formerly, Non-Executive Chair and Director, Channel Reinsurance (financial guaranty reinsurance), 2006 to 2010; formerly, Director, Ocwen Financial Corporation (mortgage servicing), 2005 to 2010; formerly, Director, Claire's Stores, Inc. (retailer), 2005 to 2007; formerly, Director, Parsons Brinckerhoff Inc. (engineering consulting firm), 2007 to 2010; formerly, Director, Bank Leumi (commercial bank), 2005 to 2007; formerly, Advisory Board Member, Attensity (software developer), 2005 to 2007. | |
21
Name, (Year of Birth),
and Address(1) | | Position(s) and
Length of
Time Served(2) | | Principal Occupation(s)(3) | | Number of
Funds in Fund
Complex
Overseen by
Fund Trustee | | Other Directorships Held
Outside Fund Complex by
Fund Trustee(3) | |
Michael M. Knetter (1960) | | Trustee since 2007 | | President and Chief Executive Officer, University of Wisconsin Foundation, since October 2010; formerly, Dean, School of Business, University of Wisconsin - Madison; formerly, Professor of International Economics and Associate Dean, Amos Tuck School of Business - Dartmouth College, 1998 to 2002. | | | 58 | | | Board Member, American Family Insurance (a mutual company, not publicly traded), since March 2009; formerly, Trustee, Northwestern Mutual Series Fund, Inc., 2007 to 2011; formerly, Director, Wausau Paper, 2005 to 2011; formerly, Director, Great Wolf Resorts, 2004 to 2009. | |
Deborah C. McLean (1954) | | Trustee since 2015 | | Member, Circle Financial Group (private wealth management membership practice), since 2011; Managing Director, Golden Seeds LLC (an angel investing group), since 2009; Adjunct Professor, Columbia University School of International and Public Affairs, since 2008; formerly, Visiting Assistant Professor, Fairfield University, Dolan School of Business, Fall 2007; formerly, Adjunct Associate Professor of Finance, Richmond, The American International University in London, 1999 to 2007. | | | 58 | | | Board member, Norwalk Community College Foundation, since 2014; Dean's Advisory Council, Radcliffe Institute for Advanced Study, since 2014; formerly, Director and Treasurer, At Home in Darien (not-for-profit), 2012 to 2014; Director, National Executive Service Corps (not-for-profit), 2012 to 2013; Trustee, Richmond, The American International University in London, 1999 to 2013. | |
Howard A. Mileaf (1937) | | Trustee since 1999 | | Retired; formerly, Vice President and General Counsel, WHX Corporation (holding company), 1993 to 2001. | | | 58 | | | Formerly, Director, Webfinancial Corporation (holding company), 2002 to 2008; formerly, Director, WHX Corporation (holding company), 2002 to 2005; formerly, Director, State Theatre of New Jersey (not-for-profit theatre), 2000 to 2005. | |
22
Name, (Year of Birth),
and Address(1) | | Position(s) and
Length of
Time Served(2) | | Principal Occupation(s)(3) | | Number of
Funds in Fund
Complex
Overseen by
Fund Trustee | | Other Directorships Held
Outside Fund Complex by
Fund Trustee(3) | |
George W. Morriss (1947) | | Trustee since 2007 | | Adjunct Professor, Columbia University School of International and Public Affairs, since October 2012; formerly, Executive Vice President and Chief Financial Officer, People's Bank, Connecticut (a financial services company), 1991 to 2001. | | | 58 | | | Director and Treasurer, National Association of Corporate Directors, Connecticut Chapter, since 2011; Trustee, Steben Alternative Investment Funds, Steben Select Multi-Strategy Fund, and Steben Select Multi-Strategy Master Fund, since 2013; formerly, Manager, Larch Lane Multi-Strategy Fund complex (which consisted of three funds), 2006 to 2011; formerly, Member, NASDAQ Issuers' Affairs Committee, 1995 to 2003. | |
Tom D. Seip (1950) | | Trustee since 2000; Chairman of the Board since 2008; formerly Lead Independent Trustee from 2006 to 2008 | | General Partner, Ridgefield Farm LLC (a private investment vehicle); formerly, President and CEO, Westaff, Inc. (temporary staffing), May 2001 to January 2002; formerly, Senior Executive, The Charles Schwab Corporation, 1983 to 1998, including Chief Executive Officer, Charles Schwab Investment Management, Inc.; Trustee, Schwab Family of Funds and Schwab Investments, 1997 to 1998; and Executive Vice President-Retail Brokerage, Charles Schwab & Co., Inc., 1994 to 1997. | | | 58 | | | Director, H&R Block, Inc. (financial services company), since May 2001; Chairman, Governance and Nominating Committee, H&R Block, Inc., since 2011; formerly, Chairman, Compensation Committee, H&R Block, Inc., 2006 to 2010; formerly, Director, Forward Management, Inc. (asset management company), 1999 to 2006. | |
James G. Stavridis (1955) | | Trustee since 2015 | | Dean, Fletcher School of Law and Diplomacy, Tufts University since 2013; formerly, Admiral, United States Navy, 2006 to 2013, including Supreme Allied Commander, NATO and Commander, European Command, 2009 to 2013, and Commander, United States Southern Command, 2006 to 2009. | | | 58 | | | Director, Utilidata Inc., since 2015; Director, BMC Software Federal, LLC, since 2014; Director, Vertical Knowledge, LLC, since 2013; formerly, Director, Navy Federal Credit Union, 2000-2002. | |
23
Name, (Year of Birth),
and Address(1) | | Position(s) and
Length of
Time Served(2) | | Principal Occupation(s)(3) | | Number of
Funds in Fund
Complex
Overseen by
Fund Trustee | | Other Directorships Held
Outside Fund Complex by
Fund Trustee(3) | |
Candace L. Straight (1947) | | Trustee since 1999 | | Private investor and consultant specializing in the insurance industry; formerly, Advisory Director, Securitas Capital LLC (a global private equity investment firm dedicated to making investments in the insurance sector), 1998 to 2003. | | | 58 | | | Public Member, Board of Governors and Board of Trustees, Rutgers University, since 2011; Director, Montpelier Re Holdings Ltd. (reinsurance company), since 2006; formerly, Director, National Atlantic Holdings Corporation (property and casualty insurance company), 2004 to 2008; formerly, Director, The Proformance Insurance Company (property and casualty insurance company), 2004 to 2008; formerly, Director, Providence Washington Insurance Company (property and casualty insurance company), 1998 to 2006; formerly, Director, Summit Global Partners (insurance brokerage firm), 2000 to 2005. | |
Peter P. Trapp (1944) | | Trustee since 1984 | | Retired; formerly, Regional Manager for Mid-Southern Region, Ford Motor Credit Company, September 1997 to 2007; formerly, President, Ford Life Insurance Company, April 1995 to August 1997. | | | 58 | | | None. | |
24
Name, (Year of Birth),
and Address(1) | | Position(s) and
Length of
Time Served(2) | | Principal Occupation(s)(3) | | Number of
Funds in Fund
Complex
Overseen by
Fund Trustee | | Other Directorships Held
Outside Fund Complex by
Fund Trustee(3) | |
Trustees who are "Interested Persons" | |
Joseph V. Amato* (1962) | | Trustee since 2009 | | President and Director, Neuberger Berman Group LLC, since 2009; President and Chief Executive Officer, Neuberger and Neuberger Berman Holdings LLC (including its predecessor, Neuberger Berman Inc.), since 2007; Chief Investment Officer (Equities) and Managing Director, Neuberger Berman LLC ("Neuberger Berman"), since 2009; Managing Director of NBIA (formerly Neuberger Berman Fixed Income LLC (NBFI) and including predecessor entities), since 2007; Board member of NBIA, since 2006; formerly, Global Head of Asset Management of Lehman Brothers Holdings Inc.'s ("LBHI") Investment Management Division, 2006 to 2009; formerly, member of LBHI's Investment Management Division's Executive Management Committee, 2006 to 2009; formerly, Managing Director, Lehman Brothers Inc. ("LBI"), 2006 to 2008; formerly, Chief Recruiting and Development Officer, LBI, 2005 to 2006; formerly, Global Head of LBI's Equity Sales and a Member of its Equities Division Executive Committee, 2003 to 2005. | | | 58 | | | Member of Board of Advisors, McDonough School of Business, Georgetown University, since 2001; Member of New York City Board of Advisors, Teach for America, since 2005; Trustee, Montclair Kimberley Academy (private school), since 2007; Member of Board of Regents, Georgetown University, since 2013. | |
25
Name, (Year of Birth),
and Address(1) | | Position(s) and
Length of
Time Served(2) | | Principal Occupation(s)(3) | | Number of
Funds in Fund
Complex
Overseen by
Fund Trustee | | Other Directorships Held
Outside Fund Complex by
Fund Trustee(3) | |
Robert Conti* (1956) | | Chief Executive Officer, President and Trustee since 2008; prior thereto, Executive Vice President in 2008 and Vice President from 2000 to 2008 | | Managing Director, Neuberger, since 2007; President and Chief Executive Officer, Neuberger Berman, since 2008; Managing Director, NBIA, since 2009; formerly, Senior Vice President, Neuberger, 2003 to 2006; formerly, Vice President, Neuberger, 1999 to 2003; formerly, Senior Vice President, Neuberger Berman, 2000 to 2008. | | | 58 | | | Director, Staten Island Mental Health Society, since 1994; formerly, Chairman of the Board, Staten Island Mental Health Society, 2008 to 2011. | |
(1) The business address of each listed person is 605 Third Avenue, New York, New York 10158.
(2) Pursuant to the Trust's Trust Instrument, each of these Trustees shall hold office for life or until his or her successor is elected or the Trust terminates; except that (a) any Trustee may resign by delivering a written resignation; (b) any Trustee may be removed with or without cause at any time by a written instrument signed by at least two-thirds of the other Trustees; (c) any Trustee who requests to be retired, or who has become unable to serve, may be retired by a written instrument signed by a majority of the other Trustees; and (d) any Trustee may be removed at any shareholder meeting by a vote of at least two-thirds of the outstanding shares.
(3) Except as otherwise indicated, each individual has held the positions shown for at least the last five years.
* Indicates a Trustee who is an "interested person" within the meaning of the 1940 Act. Mr. Amato and Mr. Conti are interested persons of the Trust by virtue of the fact that each is an officer of Management and/or its affiliates.
† Table is as of December 31, 2015, but reflects the entity consolidation that became effective on January 1, 2016, as described on page 3 of this Annual Report.
26
Information about the Officers of the Trust†
Name, (Year of Birth),
and Address(1) | | Position(s) and
Length of Time
Served(2) | | Principal Occupation(s)(3) | |
Andrew B. Allard (1961) | | Chief Legal Officer since 2013 (only for purposes of sections 307 and 406 of the Sarbanes-Oxley Act of 2002) and Anti-Money Laundering Compliance Officer since inception | | General Counsel—Mutual Funds, and Senior Vice President, NBIA since 2013; Senior Vice President, Neuberger Berman, since 2006 and Employee since 1999; Deputy General Counsel, Neuberger Berman, since 2004; formerly, Vice President, Neuberger Berman, 2000 to 2005; formerly, Employee, NBIA, 1994 to 1999; Chief Legal Officer since 2013 (only for purposes of sections 307 and 406 of the Sarbanes-Oxley Act of 2002) ,ten registered investment companies for which NBIA acts as investment manager and administrator (ten since 2013); Anti-Money Laundering Compliance Officer, ten registered investment companies for which NBIA acts as investment manager and administrator (six since 2002, one since 2003, one since 2005, one since 2006 and one since 2013). | |
Claudia A. Brandon (1956) | | Executive Vice President since 2008 and Secretary since inception | | Senior Vice President, Neuberger Berman, since 2007 and Employee since 1999; Senior Vice President, NBIA, since 2008 and Assistant Secretary since 2004; formerly, Vice President, Neuberger Berman, 2002 to 2006; formerly, Vice President—Mutual Fund Board Relations, NBIA, 2000 to 2008; formerly, Vice President, NBIA, 1986 to 1999 and Employee 1984 to 1999; Executive Vice President, ten registered investment companies for which NBIA acts as investment manager and administrator (nine since 2008 and one since 2013); Secretary, ten registered investment companies for which NBIA acts as investment manager and administrator (three since 1985, three since 2002, one since 2003, one since 2005, one since 2006 and one since 2013). | |
Agnes Diaz (1971) | | Vice President since 2013 | | Senior Vice President, Neuberger Berman, since 2012; Employee, NBIA, since 1996; formerly, Vice President, Neuberger Berman, 2007 to 2012; Vice President, ten registered investment companies for which NBIA acts as investment manager and administrator (ten since 2013). | |
Anthony DiBernardo (1979) | | Assistant Treasurer since 2011 | | Senior Vice President, Neuberger Berman, since 2014; Employee, NBIA, since 2003; formerly, Vice President, Neuberger Berman, 2009 to 2014; Assistant Treasurer, ten registered investment companies for which NBIA acts as investment manager and administrator (nine since 2011 and one since 2013). | |
Sheila R. James (1965) | | Assistant Secretary since inception | | Vice President, Neuberger Berman, since 2008 and Employee since 1999; formerly, Assistant Vice President, Neuberger Berman, 2007; formerly, Employee, NBIA, 1991 to 1999; Assistant Secretary, ten registered investment companies for which NBIA acts as investment manager and administrator (six since 2002, one since 2003, one since 2005, one since 2006 and one since 2013). | |
27
Name, (Year of Birth),
and Address(1) | | Position(s) and
Length of Time
Served(2) | | Principal Occupation(s)(3) | |
Brian Kerrane (1969) | | Chief Operating Officer since 2015 and Vice President since 2008 | | Managing Director, Neuberger Berman, since 2014; Vice President, NBIA, since 2008 and Employee since 1991; formerly, Senior Vice President, Neuberger Berman, 2006 to 2014; Chief Operating Officer, ten registered investment companies for which NBIA acts as investment manager and administrator (ten since 2015); Vice President, ten registered investment companies for which NBIA acts as investment manager and administrator (nine since 2008 and one since 2013). | |
Kevin Lyons (1955) | | Assistant Secretary since inception | | Assistant Vice President, Neuberger Berman, since 2008 and Employee since 1999; formerly, Employee, NBIA, 1993 to 1999; Assistant Secretary, ten registered investment companies for which NBIA acts as investment manager and administrator (seven since 2003, one since 2005, one since 2006 and one since 2013). | |
Anthony Maltese (1959) | | Vice President since 2015 | | Senior Vice President, Neuberger Berman, since 2014 and Employee since 2000; Vice President, ten registered investment companies for which Management acts as investment manager and administrator (ten since 2015). | |
Owen F. McEntee, Jr. (1961) | | Vice President since 2008 | | Vice President, Neuberger Berman, since 2006; Employee, NBIA, since 1992; Vice President, ten registered investment companies for which NBIA acts as investment manager and administrator (nine since 2008 and one since 2013). | |
John M. McGovern (1970) | | Treasurer and Principal Financial and Accounting Officer since inception | | Senior Vice President, Neuberger Berman, since 2007; Employee, NBIA, since 1993; Treasurer and Principal Financial and Accounting Officer, ten registered investment companies for which NBIA acts as investment manager and administrator (eight since 2005, one since 2006 and one since 2013); formerly, Vice President, Neuberger Berman, 2004 to 2006; formerly, Assistant Treasurer, eight registered investment companies for which NBIA acts as investment manager and administrator, 2002 to 2005. | |
Frank Rosato (1971) | | Assistant Treasurer since inception | | Vice President, Neuberger Berman, since 2006; Employee, NBIA, since 1995; Assistant Treasurer, ten registered investment companies for which NBIA acts as investment manager and administrator (eight since 2005, one since 2006 and one since 2013). | |
Chamaine Williams (1971) | | Chief Compliance Officer since inception | | Senior Vice President, Neuberger Berman, since 2007; Chief Compliance Officer, NBIA, since 2006; Chief Compliance Officer, ten registered investment companies for which NBIA acts as investment manager and administrator (eight since 2005, one since 2006 and one since 2013); formerly, Senior Vice President, LBI, 2007 to 2008; formerly, Vice President, LBI, 2003 to 2006; formerly, Chief Compliance Officer, Lehman Brothers Asset Management Inc., 2003 to 2007; formerly, Chief Compliance Officer, Lehman Brothers Alternative Investment Management LLC, 2003 to 2007. | |
(1) The business address of each listed person is 605 Third Avenue, New York, New York 10158.
(2) Pursuant to the By-Laws of the Trust, each officer elected by the Fund Trustees shall hold office until his or her successor shall have been elected and qualified or until his or her earlier death, inability to serve, or resignation. Officers serve at the pleasure of the Fund Trustees and may be removed at any time with or without cause.
(3) Except as otherwise indicated, each individual has held the positions shown for at least the last five years.
† Table is as of December 31, 2015, but reflects the entity consolidation that became effective on January 1, 2016, as described on page 3 of this Annual Report.
28
Proxy Voting Policies and Procedures
A description of the policies and procedures that the Trust uses to determine how to vote proxies relating to portfolio securities is available, without charge, by calling 800-877-9700 (toll-free) and on the Securities and Exchange Commission's website at www.sec.gov. Information regarding how the Trust voted proxies relating to portfolio securities during the most recent 12-month period ended June 30 is also available upon request, without charge, by calling 800-877-9700 (toll-free), on the Securities and Exchange Commission's website at www.sec.gov, and on Management's website at www.nb.com.
Quarterly Portfolio Schedule
The Trust files a complete schedule of portfolio holdings for the Fund with the Securities and Exchange Commission for the first and third quarters of each fiscal year on Form N-Q. The Trust's Forms N-Q are available on the Securities and Exchange Commission's website at www.sec.gov and may be reviewed and copied at the Securities and Exchange Commission's Public Reference Room in Washington, DC. Information on the operation of the Public Reference Room may be obtained by calling 800-SEC-0330. The information on Form N-Q is available upon request, without charge, by calling 800-877-9700 (toll free).
Board Consideration of the Management and Sub-Advisory Agreements
On an annual basis, the Board of Trustees ("Board") of Neuberger Berman Advisers Management Trust ("Trust"), including the Trustees who are not "interested persons" of Neuberger Berman Management LLC ("Management") (including its affiliates) or the Trust ("Independent Fund Trustees"), considers whether to continue the management agreement with Management (the "Management Agreement") and the separate sub-advisory agreement between Management and Neuberger Berman LLC ("Neuberger") (the "Sub-Advisory Agreement" and collectively with the Management Agreement, the "Agreements") for Large Cap Value Portfolio (the "Fund"). Throughout the process, the Independent Fund Trustees are advised by counsel that is experienced in Investment Company Act of 1940 matters and that is independent of Management ("Independent Counsel"). At a meeting held on September 8, 2015, the Board, including the Independent Fund Trustees, approved the continuation of the Agreements for the Fund.
In evaluating the Agreements, the Board, including the Independent Fund Trustees, reviewed extensive materials provided by Management in response to questions submitted by the Independent Fund Trustees and Independent Counsel, and met with senior representatives of Management regarding its personnel, operations and financial condition as they relate to the Fund. The annual contract review extends over at least two regular meetings of the Board to ensure that Management and Neuberger have time to respond to any questions the Independent Fund Trustees may have on their initial review of the materials and that the Independent Fund Trustees have time to consider those responses.
In connection with its deliberations, the Board also considered the broad range of information relevant to the annual contract review that is provided to the Board (including its various standing committees) at meetings throughout the year, including investment performance reports and related portfolio information for the Fund, as well as periodic reports on, among other matters, pricing and valuation; brokerage and execution; compliance; and shareholder and other services provided by Management, Neuberger, and their affiliates. To assist the Board in its deliberations regarding the annual contract review, the Board has established a Contract Review Committee comprised of Independent Fund Trustees. The Board has also established other committees that focus throughout the year on specific areas relevant to the annual contract review, such as Fund performance or compliance matters, and that are charged with specific responsibilities regarding the annual contract review.
The Independent Fund Trustees received from Independent Counsel a memorandum discussing the legal standards for their consideration of the proposed continuation of the Agreements. During the course of the year and during their deliberations regarding the annual contract review, the Contract Review Committee and the Independent Fund Trustees met with Independent Counsel separately from representatives of Management and Neuberger.
29
In connection with its approval of the continuation of the Agreements, the Board evaluated the terms of the Agreements, the overall fairness of the Agreements to the Fund and whether the Agreements were in the best interests of the Fund and its shareholders. The Board considered all factors it deemed relevant with respect to the Fund, including the following factors: (1) the nature, extent, and quality of the services provided by Management and Neuberger; (2) the investment performance of the Fund compared to an appropriate market index and a peer group of investment companies; (3) the costs of the services provided and the profit or loss realized by Management and its affiliates from their relationship with the Fund; (4) the extent to which economies of scale have been or might be realized as the Fund grows; and (5) whether fee levels reflect any such potential economies of scale for the benefit of the Fund's shareholders. The Board's determination to approve the continuation of the Agreements was based on a comprehensive consideration of all information provided to the Board throughout the year and specifically in connection with the annual contract review. The Board members did not identify any particular information or factor that was all-important or controlling, and each Trustee may have attributed different weights to the various factors. The Board focused on the overall costs and benefits of the Agreements to the Fund and, through the Fund, its shareholders.
With respect to the nature, extent and quality of the services provided, the Board considered the investment philosophy and decision-making processes of Management and Neuberger, and the qualifications, experience, and capabilities of, and the resources available to, the portfolio management personnel of Management and Neuberger who perform services for the Fund. The Board noted that Management also provides certain administrative services, including fund accounting and compliance oversight. The Board also considered Management's and Neuberger's policies and practices regarding brokerage and allocation of portfolio transactions and reviewed the quality of the execution services that Management had provided. The Board also reviewed whether Management and Neuberger used brokers to execute Fund transactions that provide research and other services to Management or Neuberger and the types of benefits potentially derived from such services by Management, Neuberger, the Fund and other clients of Management and Neuberger. The Board also considered that Management's responsibilities include daily management of investment, operational, enterprise, legal, regulatory and compliance risks as they relate to the Fund, and considered information regarding Management's processes for managing risk. In addition, the Board noted the positive compliance history of Management and Neuberger, as no significant compliance problems were reported to the Board with respect to either firm. The Board also considered the general structure of the portfolio manager compensation program and whether this structure provides appropriate incentives to act in the best interests of the Fund.
As in past years, the Board also considered the manner in which Management addressed various non-routine matters that arose during the year, some of them a result of developments in the broader fund industry or the regulations governing it. In addition, the Board considered actions taken by Management and Neuberger in response to recent market conditions, such as regulatory concerns about current trading and market liquidity issues and potential volatility, and considered the overall performance of Management and Neuberger in this context.
The Board factored into its evaluation of the Fund's fees and performance a consideration of the limitations inherent in the methodology for constructing peer groups and determining which investment companies should be included in the peer groups. The Board considered a peer group composed of two types of funds: proprietary funds that are operated by insurance companies or their affiliates, and non-proprietary funds, such as the Fund, operated for insurance company investors by independent investment managers.
With respect to investment performance, the Board considered information regarding the Fund's short, intermediate and long-term performance both on an absolute basis and relative to an appropriate benchmark and the average performance of a composite peer group (as constructed by an independent organization) of investment companies pursuing broadly similar strategies. The Board also reviewed performance in relation to certain measures of the degree of investment risk undertaken by the portfolio manager. The Board considered that as compared to its peer group, the Fund's performance was lower than the median for the one, three, five and ten-year periods. The Board also considered that the Fund's performance was lower than its benchmark for the one, three, five and ten-year periods. The Board discussed with Management the Fund's performance and steps that Management had taken, or intended to take, to improve performance. In this regard, the Board noted that performance, especially short-term performance, is only one of the
30
factors that it deems relevant to its consideration of the Fund's Agreements and that, after considering all relevant factors, it may be appropriate to approve the continuation of the Agreements notwithstanding the Fund's performance.
With respect to the overall fairness of the Agreements, the Board considered the fee structure for the Fund under the Agreements as compared to the peer group. The Board also considered any fall-out benefits likely to accrue to Management, Neuberger or their affiliates from their relationship with the Fund. The Board also considered the profitability of Management and its affiliates from their association with the Fund, and year-over-year changes in each of Management's reported expense categories.
The Board reviewed a comparison of the Fund's management fee and overall expense ratio to the peer group and was aware that non-proprietary insurance product funds generally have higher fee structures than proprietary funds. The Board noted that the comparative management fee analysis includes, in the Fund's management fee, the separate administrative fee paid to Management, but it was not clear whether this was the case for all funds in the peer group. The Board considered the mean and median of the management fees and overall expense ratios of the peer group. In addition, the Board considered the contractual limit on expenses of certain classes of the Fund.
The Board considered that, for the Fund's I Class shares, as compared to its peer group, the Fund's contractual management fee and the actual management fee net of fees waived by Management were both higher than the median. The Board considered whether specific portfolio management, administration or oversight needs contributed to the management fee. The Board also noted that the Fund's size, which impacts its expenses and performance, has been affected by ongoing changes in the insurance market.
The Board also considered whether there were other funds or separate accounts that were advised or sub-advised by Management or its affiliates with investment objectives, policies and strategies that were similar to those of the Fund. The Board compared the fees charged to the Fund to the fees charged to such funds and/or separate accounts. The Board considered the appropriateness and reasonableness of any differences between the fees charged to the Fund and such funds and/or separate accounts, including any breakpoints, and determined that differences in fees and fee structures were consistent with the management and other services provided.
The Board also evaluated any apparent or anticipated economies of scale in relation to the services Management provides to the Fund. The Board considered that the Fund's fee structure provides for a reduction of payments resulting from the use of breakpoints and whether those breakpoints are set at appropriate asset levels. In concluding that the benefits accruing to Management and its affiliates by virtue of their relationship with the Fund were reasonable in light of the costs of providing the investment advisory and other services and the benefits accruing to the Fund, the Board reviewed specific data as to Management's profit on the Fund for a recent period. The Board also considered Management's cost allocation methodology. The Board recognized that Management and Neuberger should be entitled to earn a reasonable level of profits for services they provide to the Fund and, based on its review, concluded that Management's and Neuberger's reported level of profitability on the Fund was reasonable.
Conclusions
In approving the continuation of the Agreements, the Board concluded that the terms of each Agreement are fair and reasonable to the Fund and that approval of the continuation of the Agreements is in the best interests of the Fund and its shareholders. In reaching this determination, the Board considered that Management and Neuberger could be expected to provide a high level of service to the Fund; regarding the Fund's underperformance, that it retained confidence in Management's and Neuberger's capabilities to manage the Fund; that the Fund's fee structure appeared to the Board to be reasonable given the nature, extent and quality of services provided; and that the benefits accruing to Management and its affiliates by virtue of their relationship with the Fund were reasonable in light of the costs of providing the investment advisory and other services and the benefits accruing to the Fund. The Board's conclusions may be based in part on its consideration of materials prepared in connection with the approval or continuance of the Agreements in prior years and on the Board's ongoing regular review of Fund performance and operations throughout the year, in addition to material prepared specifically for the most recent annual review of the Agreements.
31
On December 15, 2015, the Board, including the Independent Trustees, unanimously approved a novation of the Agreements in connection with a reorganization of Management and Neuberger into a new entity, Neuberger Berman Investment Advisers LLC, after receiving assurances that (1) the reorganization would not result in a change of actual control or management of the advisory organizations and (2) the reorganization would not result in a change in the nature or quality of the services provided to the Fund.
Notice to Shareholders
100.00% of the dividends earned during the fiscal year ended December 31, 2015 qualify for the dividends received deduction for corporate shareholders.
The Fund designates $4,600,984 as a capital gain distribution.
32
Neuberger Berman
Advisers Management Trust
Mid Cap Growth Portfolio
I Class Shares
S Class Shares
Annual Report
December 31, 2015
Mid Cap Growth Portfolio Commentary (Unaudited)
The Neuberger Berman Advisers Management Trust Mid Cap Growth Portfolio (the "Fund") Class I generated a 1.28% total return for the 12 months ended December 31, 2015, outperforming its benchmark, the Russell Midcap® Growth Index, which returned -0.20% for the same period. Returns for the Fund's Class I and Class S shares are provided in the table immediately following this letter.
Looking at the 12-month reporting period, 2015 offered investors, in our view, the duality of opportunities for appreciation, composed of generally compelling earnings and robust M&A activity, as well as the challenges associated with persistently slow domestic and global growth, currency fluctuations, continued commodity price deflation and still-restrained consumer and corporate spending. Ultimately, markets proved to be increasingly intertwined and unpredictable with respect to embracing or avoiding risk. One thing that wasn't surprising was the market's acceptance of the U.S. Federal Reserve's (Fed) long awaited and oft-debated interest rate hike. Despite the likely end to nearly eight years of highly accommodative monetary easing, the market generally appreciated the removal of uncertainty, the Fed's intended patience around the scope of future increases and the largely symbolic nature of a 25 basis point increase.
Overall, the year represented a positive environment for our style of investing, as the market, for most of the year, rewarded active management and stocks offering positive differentiation versus their peers, "paying-up" for the higher qualitative competitive characteristics, fundamentals, catalysts and execution that we prize. In the fall, we finally experienced a sustained correction, which served to reset both valuations and expectations. Despite significant year-end volatility that pushed the benchmark into negative territory, the Fund delivered positive attribution from both an allocation and stock selection perspective. During the period, the Fund was materially overweighted to Information Technology (IT), Health Care and Telecommunication Services and underweighted to Consumer Staples, Materials, Financials, Industrials and Consumer Discretionary. Positive stock selection in IT and Consumer Discretionary was able to offset the precipitous reversal in Health Care, which took the brunt of the market's correction.
Drilling down to our holdings, Avago Technologies was the top contributor to performance for the year, while AMAG Pharmaceuticals was the leading detractor. Avago, a semiconductor company, continued to execute at a high level with strong participation in leading "smart" devices. The market was also enthusiastic about its planned acquisition of Broadcom. Given the company's elevated market capitalization and shift to the large cap benchmark, we exited our long-standing position. AMAG Pharmaceuticals, a specialty pharmaceutical company, was primarily pressured by the sharp and broad pull-back in Therapeutics, as well as an FDA request for additional data around a new single dose indication for an existing approved therapy. Given those headwinds, we elected to exit our position.
As we look ahead, there seem to be as many economic, monetary and political question marks as positives. In our view, that potential for uncertainty underscores the importance of fundamentals and execution. We will continue to seek companies with balance sheet strength, consistent top- and bottom-line growth and longer-term strategic capital re-investments aimed at growing their franchises, which we think should prove to be a positive differentiator in a post monetary-easing landscape.
Sincerely,
KENNETH J. TUREK
PORTFOLIO MANAGER
Information about principal risks of investing in the Fund is set forth in the prospectus and statement of additional information.
The portfolio composition, industries and holdings of the Fund are subject to change without notice.
The opinions expressed are those of the Fund's portfolio manager. The opinions are as of the date of this report, and are subject to change without notice.
1
Mid Cap Growth Portfolio (Unaudited)
SECTOR ALLOCATION
(as a % of Total Investments*) | |
Consumer Discretionary | | | 22.0 | % | |
Consumer Staples | | | 3.6 | | |
Energy | | | 1.1 | | |
Financials | | | 8.1 | | |
Health Care | | | 15.3 | | |
Industrials | | | 14.8 | | |
Information Technology | | | 24.4 | | |
Materials | | | 2.3 | | |
Telecommunication Services | | | 2.5 | | |
Other | | | 0.7 | | |
Short-Term Investments | | | 5.2 | | |
Total | | | 100.0 | % | |
* Derivatives, if any, are excluded from this chart.
PERFORMANCE HIGHLIGHTS
| | | Inception Date | | Average Annual Total Return
Ended 12/31/2015 | |
| | | | 1 Year | | 5 Years | | 10 Years | | Life of Fund | |
Mid Cap Growth
Portfolio Class I | | |
11/03/1997 | | | | 1.28 | % | | | 10.29 | % | | | 8.24 | % | | | 8.80 | % | |
Mid Cap Growth
Portfolio Class S2 | | 02/18/2003 | | | 1.00 | % | | | 10.01 | % | | | 7.97 | % | | | 8.60 | % | |
Russell Midcap®
Growth Index1,3 | | | | | | | –0.20 | % | | | 11.54 | % | | | 8.16 | % | | | 7.59 | % | |
Russell Midcap®
Index1,3 | | | | | –2.44 | % | | | 11.44 | % | | | 8.00 | % | | | 9.02 | % | |
The performance data quoted represent past performance and do not indicate future results. Current performance may be lower or higher than the performance data quoted. For performance data current to the most recent month-end, please visit http://www.nb.com/amtportfolios/performance.
The results shown in the table reflect the reinvestment of income dividends and other distributions, if any. The results do not reflect the effect of taxes a shareholder would pay on Fund distributions or on the redemption of Fund shares. The results do not reflect fees and expenses of the variable annuity and variable life insurance policies or the qualified pension and retirement plans whose proceeds are invested in the Fund.
The investment return and principal value of an investment will fluctuate and shares, when redeemed, may be worth more or less than their original cost.
Returns would have been lower if Neuberger Berman Investment Advisers LLC ("Management") had not reimbursed certain expenses and/or waived a portion of the investment management fees during certain of the periods shown. Repayment by a class (of expenses previously reimbursed and/or fees previously waived by Management) will decrease the class's returns. Please see Note B in the Notes to Financial Statements for specific information regarding expense reimbursement and/or fee waiver arrangements.
As stated in the Fund's most recent prospectus, the total annual operating expense ratios for fiscal year 2014 were 1.00% and 1.25% for Class I and Class S shares, respectively (before expense reimbursements and/or fee waivers, if any). The expense ratios for the annual period ended December 31, 2015 can be found in the Financial Highlights section of this report.
COMPARISON OF A $10,000 INVESTMENT
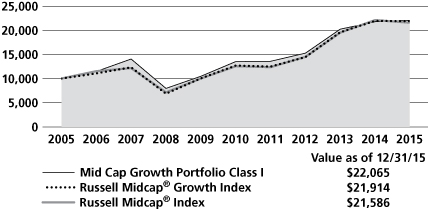
This graph shows the change in value of a hypothetical $10,000 investment in the Fund over the past 10 fiscal years, or since the Fund's inception if it has not operated for 10 years. The graph is based on Class I shares only; the performance of the Fund's share classes will differ primarily due to different class expenses (see Performance Highlights chart above).The result is compared with benchmarks, which include a broad-based market index and may include a more narrowly based index. Market indices have not been reduced to reflect any of the fees and costs of investing. The results shown in the graph reflect the reinvestment of income dividends and other distributions, if any. The results do not reflect the effect of taxes a shareholder would pay on Fund distributions or on the redemption of Fund shares. The results do not reflect fees and expenses of the variable annuity and variable life insurance policies or the qualified pension and retirement plans whose proceeds are invested in the Fund. Results represent past performance and do not indicate future results.
Please see Endnotes for additional information.
2
1 The date used to calculate Life of Fund performance for the index is November 3, 1997, the inception date of the oldest share class.
2 Performance shown prior to February 18, 2003 for Class S shares is that of Class I shares, which has lower expenses and correspondingly higher returns than Class S shares.
3 The Russell Midcap® Growth Index is a float-adjusted market capitalization-weighted index that measures the performance of the mid-cap growth segment of the U.S. equity market. It includes those Russell Midcap® Index companies with higher price-to-book ratios and higher forecasted growth rates. The index is rebalanced annually in June. The Russell Midcap Index measures the performance of the mid-cap segment of the U.S. equity market, and includes approximately 800 of the smallest securities in the Russell 1000® Index (which measures the performance of the 1,000 largest U.S. public companies based on total market capitalization). The index is rebalanced annually in June. Please note that the indices described in this report do not take into account any fees, expenses or tax consequences of investing in the individual securities that they track, and that investors cannot invest directly in any index. Data about the performance of an index are prepared or obtained by Neuberger Berman Investment Advisers LLC* ("Management") and reflect the reinvestment of income dividends and other distributions, if any. The Fund may invest in securities not included in a described index and generally does not invest in all securities included in a described index.
* On January 1, 2016, Neuberger Berman Management LLC (NBM) and Neuberger Berman LLC (Neuberger) transferred to Neuberger Berman Fixed Income LLC (NBFI) their rights and obligations pertaining to all services they provided to any Fund under any investment management, investment sub-advisory, and/or administration agreement, as applicable (the "Agreements"). Following such transfer, NBFI was renamed Neuberger Berman Investment Advisers LLC ("NBIA" or "Management").
As of December 31, 2015, NBM served as the Fund's investment manager and administrator, and Neuberger served as the Fund's sub-adviser. Following the consolidation, the investment professionals of NBM and Neuberger who provide services to the Fund under the Agreements, continue to provide the same services, except that they provide those services in their new capacities as investment professionals of NBIA. Further, the consolidation did not result in any change in the investment processes currently employed by the Fund, the nature or level of services provided to the Fund, or the fees the Fund pays under its Agreements.
The investments for the Fund are managed by the same portfolio manager(s) who manage(s) one or more other registered funds that have names, investment objectives and investment styles that are similar to those of the Fund. You should be aware that the Fund is likely to differ from those other mutual fund(s) in size, cash flow pattern and tax matters. Accordingly, the holdings and performance of the Fund can be expected to vary from those of the other mutual fund(s).
Shares of the separate Neuberger Berman Advisers Management Trust Portfolios, including the Fund, are not available to the general public. Shares of the Fund may be purchased only by life insurance companies to be held in their separate accounts, which fund variable annuity and variable life insurance policies, and by qualified pension and retirement plans.
Statistics and projections in this report are derived from sources deemed to be reliable but cannot be regarded as a representation of future results of the Fund. This report is prepared for the general information of shareholders and is not an offer of shares of the Fund. Shares are sold only through the currently effective prospectus, which must precede or accompany this report.
The "Neuberger Berman" name and logo are registered service marks of Neuberger Berman Group LLC. "Neuberger Berman Management LLC" and the individual Fund name in this piece are either service marks or registered service marks of Neuberger Berman Management LLC.
© 2016 Neuberger Berman Management LLC, distributor. All rights reserved.
3
Information About Your Fund's Expenses (Unaudited)
As a Fund shareholder, you incur two types of costs: (1) transaction costs such as fees and expenses that are, or may be, imposed under your variable contract or qualified pension plan; and (2) ongoing costs, including management fees, distribution and/or service (12b-1) fees (if applicable), and other Fund expenses. This example is intended to help you understand your ongoing costs (in U.S. dollars) of investing in the Fund and compare these costs with the ongoing costs of investing in other mutual funds.
This table is designed to provide information regarding costs related to your investments. The following examples are based on an investment of $1,000 made at the beginning of the six month period ended December 31, 2015 and held for the entire period. The table illustrates the Fund's costs in two ways:
Actual Expenses and Performance: | | The first section of the table provides information about actual account values and actual expenses in dollars, based on the Fund's actual performance during the period indicated. You may use the information in this line, together with the amount you invested, to estimate the expenses you paid over the period. Simply divide your account value by $1,000 (for example, an $8,600 account value divided by $1,000 = 8.6), then multiply the result by the number in the first section of the table under the heading entitled "Expenses Paid During the Period" to estimate the expenses you paid over the period. | |
Hypothetical Example for
Comparison Purposes: | | The second section of the table provides information about hypothetical account values and hypothetical expenses based on the Fund's actual expense ratio and an assumed rate of return at 5% per year before expenses. This return is not the Fund's actual return. The hypothetical account values and expenses may not be used to estimate the actual ending account balance or expenses you paid for the period. You may use this information to compare the ongoing costs of investing in this Fund versus other funds. To do so, compare the expenses shown in this 5% hypothetical example with the 5% hypothetical examples that appear in the shareholder reports of other funds. | |
Please note that the expenses in the table are meant to highlight your ongoing costs only and do not include any transaction costs, such as fees and expenses that are, or may be imposed under your variable contract or qualified pension plan. Therefore, the information under the heading "Hypothetical (5% annual return before expenses)" is useful in comparing ongoing costs only, and will not help you determine the relative total costs of owning different funds. In addition, if these transaction costs were included, your costs would have been higher.
Expense Information as of 12/31/15
NEUBERGER BERMAN ADVISERS MANAGEMENT TRUST MID CAP GROWTH PORTFOLIO
Actual | | Beginning Account
Value
7/1/15 | | Ending Account
Value
12/31/15 | | Expenses Paid
During the Period*
7/1/15 – 12/31/15 | | Expense
Ratio | |
Class I | | $ | 1,000.00 | | | $ | 920.00 | | | $ | 4.74 | | | | 0.98 | % | |
Class S | | $ | 1,000.00 | | | $ | 918.50 | | | $ | 5.95 | | | | 1.23 | % | |
Hypothetical (5% annual return before expenses)** | |
Class I | | $ | 1,000.00 | | | $ | 1,020.27 | | | $ | 4.99 | | | | 0.98 | % | |
Class S | | $ | 1,000.00 | | | $ | 1,019.00 | | | $ | 6.26 | | | | 1.23 | % | |
* For each class, expenses are equal to the annualized expense ratio for the class, multiplied by the average account value over the period, multiplied by 184/365 (to reflect the one-half year period shown).
** Hypothetical expenses are equal to the annualized expense ratios for each class, multiplied by the average account value over the period (assuming a 5% annual return), multiplied by 184/365 (to reflect the one-half year period shown).
4
Schedule of Investments Mid Cap Growth Portfolio 12/31/15
NUMBER OF SHARES | | | | VALUE† | |
Common Stocks (94.2%) | | | |
Airlines (1.9%) | | | |
| | 81,250 | | | Alaska Air Group, Inc. | | $ | 6,541,438 | | |
Banks (2.0%) | | | |
| | 22,500 | | | Signature Bank | | | 3,450,825 | * | |
| | 28,550 | | | SVB Financial Group | | | 3,394,595 | * | |
| | | | 6,845,420 | | |
Biotechnology (2.3%) | | | |
| | 31,000 | | | BioMarin Pharmaceutical, Inc. | | | 3,247,560 | * | |
| | 21,500 | | | Incyte Corp. | | | 2,331,675 | * | |
| | 50,000 | | | Medivation, Inc. | | | 2,417,000 | * | |
| | | | 7,996,235 | | |
Capital Markets (3.0%) | | | |
| | 23,750 | | | Affiliated Managers Group, Inc. | | | 3,794,300 | * | |
| | 105,500 | | | E*TRADE Financial Corp. | | | 3,127,020 | * | |
| | 64,000 | | | Raymond James Financial, Inc. | | | 3,710,080 | | |
| | | | 10,631,400 | | |
Chemicals (1.4%) | | | |
| | 41,500 | | | RPM International, Inc. | | | 1,828,490 | | |
| | 47,250 | | | Sensient Technologies Corp. | | | 2,968,245 | | |
| | | | 4,796,735 | | |
Commercial Services & Supplies (1.8%) | | | |
| | 35,250 | | | Stericycle, Inc. | | | 4,251,150 | * | |
| | 38,000 | | | Waste Connections, Inc. | | | 2,140,160 | | |
| | | | 6,391,310 | | |
Communications Equipment (1.5%) | | | |
| | 180,000 | | | Infinera Corp. | | | 3,261,600 | * | |
| | 12,050 | | | Palo Alto Networks, Inc. | | | 2,122,487 | * | |
| | | | 5,384,087 | | |
Containers & Packaging (0.9%) | | | |
| | 50,500 | | | Packaging Corp. of America | | | 3,184,025 | | |
Distributors (1.0%) | | | |
| | 123,500 | | | LKQ Corp. | | | 3,659,305 | * | |
Diversified Consumer Services (1.8%) | | | |
| 51,550 | | | Bright Horizons Family
Solutions, Inc. | | | 3,443,540 | * | |
| | 109,250 | | | Service Corp. International | | | 2,842,685 | | |
| | | | 6,286,225 | | |
NUMBER OF SHARES | | | | VALUE† | |
Diversified Financial Services (1.0%) | | | |
| | 54,050 | | | CBOE Holdings, Inc. | | $ | 3,507,845 | | |
Electrical Equipment (3.0%) | | | |
| | 25,000 | | | Acuity Brands, Inc. | | | 5,845,000 | | |
| | 84,500 | | | AMETEK, Inc. | | | 4,528,355 | | |
| | | | 10,373,355 | | |
Electronic Equipment, Instruments &
Components (2.8%) | | | |
| | 60,500 | | | Amphenol Corp. Class A | | | 3,159,915 | | |
| | 90,000 | | | CDW Corp. | | | 3,783,600 | | |
| 42,350 | | | Zebra Technologies
Corp. Class A | | | 2,949,678 | * | |
| | | | 9,893,193 | | |
Food & Staples Retailing (0.9%) | | | |
| | 2,300 | | | Casey's General Stores, Inc. | | | 277,035 | | |
| | 356,500 | | | Rite Aid Corp. | | | 2,794,960 | * | |
| | | | 3,071,995 | | |
Food Products (2.3%) | | | |
| | 23,650 | | | Mead Johnson Nutrition Co. | | | 1,867,168 | | |
| | 68,500 | | | Pinnacle Foods, Inc. | | | 2,908,510 | | |
| | 85,250 | | | WhiteWave Foods Co. | | | 3,317,077 | * | |
| | | | 8,092,755 | | |
Health Care Equipment & Supplies (5.3%) | | | |
| | 19,000 | | | C.R. Bard, Inc. | | | 3,599,360 | | |
| | 58,050 | | | DENTSPLY International, Inc. | | | 3,532,342 | | |
| | 38,950 | | | DexCom, Inc. | | | 3,190,005 | * | |
| 22,500 | | | Integra LifeSciences
Holdings Corp. | | | 1,525,050 | * | |
| | 62,000 | | | NuVasive, Inc. | | | 3,354,820 | * | |
| | 23,250 | | | Teleflex, Inc. | | | 3,056,213 | | |
| | 4,700 | | | Zeltiq Aesthetics, Inc. | | | 134,091 | * | |
| | | | 18,391,881 | | |
Health Care Providers & Services (5.5%) | | | |
| | 90,500 | | | Acadia Healthcare Co., Inc. | | | 5,652,630 | * | |
| | 52,500 | | | Centene Corp. | | | 3,455,025 | * | |
| 132,500 | | | Envision Healthcare
Holdings, Inc. | | | 3,441,025 | * | |
| | 36,000 | | | HealthSouth Corp. | | | 1,253,160 | | |
| | 27,250 | | | Quest Diagnostics, Inc. | | | 1,938,565 | | |
| 28,350 | | | Universal Health Services,
Inc. Class B | | | 3,387,541 | | |
| | | | 19,127,946 | | |
See Notes to Schedule of Investments
5
Schedule of Investments Mid Cap Growth Portfolio (cont'd)
NUMBER OF SHARES | | | | VALUE† | |
Hotels, Restaurants & Leisure (2.5%) | | | |
| | 57,000 | | | Aramark | | $ | 1,838,250 | | |
| | 16,550 | | | Buffalo Wild Wings, Inc. | | | 2,642,208 | * | |
| 67,650 | | | Norwegian Cruise Line
Holdings Ltd. | | | 3,964,290 | * | |
| | 2,700 | | | Vail Resorts, Inc. | | | 345,573 | | |
| | | | 8,790,321 | | |
Household Durables (1.9%) | | | |
| | 65,000 | | | Jarden Corp. | | | 3,712,800 | * | |
| | 62,500 | | | Newell Rubbermaid, Inc. | | | 2,755,000 | | |
| | | | 6,467,800 | | |
Industrial Conglomerates (1.7%) | | | |
| | 32,000 | | | Roper Technologies, Inc. | | | 6,073,280 | | |
Insurance (1.0%) | | | |
| | 41,550 | | | Assurant, Inc. | | | 3,346,437 | | |
Internet & Catalog Retail (1.4%) | | | |
| | 16,500 | | | Expedia, Inc. | | | 2,050,950 | | |
| 100,000 | | | Liberty Interactive Corp.
QVC Group Class A | | | 2,732,000 | * | |
| | | | 4,782,950 | | |
Internet Software & Services (1.4%) | | | |
| | 23,500 | | | CoStar Group, Inc. | | | 4,857,215 | * | |
IT Services (5.2%) | | | |
| | 19,500 | | | Alliance Data Systems Corp. | | | 5,393,115 | * | |
| | 22,500 | | | Euronet Worldwide, Inc. | | | 1,629,675 | * | |
| | 35,750 | | | Fiserv, Inc. | | | 3,269,695 | * | |
| | 21,500 | | | FleetCor Technologies, Inc. | | | 3,072,995 | * | |
| | 59,000 | | | Sabre Corp. | | | 1,650,230 | | |
| | 67,450 | | | Vantiv, Inc. Class A | | | 3,198,479 | * | |
| | | | 18,214,189 | | |
Life Sciences Tools & Services (0.4%) | | | |
| | 36,500 | | | Agilent Technologies, Inc. | | | 1,526,065 | | |
Machinery (2.6%) | | | |
| | 26,000 | | | IDEX Corp. | | | 1,991,860 | | |
| | 59,250 | | | Milacron Holdings Corp. | | | 741,218 | * | |
| | 31,000 | | | Stanley Black & Decker, Inc. | | | 3,308,630 | | |
| | 40,500 | | | Wabtec Corp. | | | 2,880,360 | | |
| | | | 8,922,068 | | |
NUMBER OF SHARES | | | | VALUE† | |
Media (1.3%) | | | |
| | 71,900 | | | Starz Class A | | $ | 2,408,650 | * | |
| | 85,000 | | | TEGNA, Inc. | | | 2,169,200 | | |
| | | | 4,577,850 | | |
Multiline Retail (2.2%) | | | |
| | 74,500 | | | Burlington Stores, Inc. | | | 3,196,050 | * | |
| | 59,050 | | | Dollar Tree, Inc. | | | 4,559,841 | * | |
| | | | 7,755,891 | | |
Oil, Gas & Consumable Fuels (1.1%) | | | |
| | 25,000 | | | Concho Resources, Inc. | | | 2,321,500 | * | |
| | 21,000 | | | Diamondback Energy, Inc. | | | 1,404,900 | * | |
| | | | 3,726,400 | | |
Personal Products (0.4%) | | | |
| | 19,500 | | | Edgewell Personal Care Co. | | | 1,528,215 | | |
Pharmaceuticals (1.8%) | | | |
| | 14,000 | | | Jazz Pharmaceuticals PLC | | | 1,967,840 | * | |
| | 90,450 | | | Zoetis, Inc. | | | 4,334,364 | | |
| | | | 6,302,204 | | |
Professional Services (2.0%) | | | |
| | 54,750 | | | Nielsen Holdings PLC | | | 2,551,350 | | |
| | 4,100 | | | On Assignment, Inc. | | | 184,295 | * | |
| | 25,000 | | | Verisk Analytics, Inc. | | | 1,922,000 | * | |
| | 53,500 | | | WageWorks, Inc. | | | 2,427,295 | * | |
| | | | 7,084,940 | | |
Real Estate Management &
Development (1.2%) | | | |
| | 25,500 | | | Jones Lang LaSalle, Inc. | | | 4,076,430 | | |
Road & Rail (1.9%) | | | |
| 43,050 | | | J.B. Hunt Transport
Services, Inc. | | | 3,158,148 | | |
| 56,200 | | | Old Dominion Freight
Line, Inc. | | | 3,319,734 | * | |
| | | | 6,477,882 | | |
Semiconductors & Semiconductor
Equipment (4.5%) | | | |
| | 56,500 | | | Cavium, Inc. | | | 3,712,615 | * | |
| | 39,000 | | | Lam Research Corp. | | | 3,097,380 | | |
| | 63,500 | | | Monolithic Power Systems, Inc. | | | 4,045,585 | | |
| | 43,500 | | | NXP Semiconductors NV | | | 3,664,875 | * | |
| | 16,000 | | | Skyworks Solutions, Inc. | | | 1,229,280 | | |
| | | | 15,749,735 | | |
See Notes to Schedule of Investments
6
Schedule of Investments Mid Cap Growth Portfolio (cont'd)
NUMBER OF SHARES | | | | VALUE† | |
Software (8.9%) | | | |
| | 93,250 | | | Activision Blizzard, Inc. | | $ | 3,609,707 | | |
| | 45,500 | | | Electronic Arts, Inc. | | | 3,126,760 | * | |
| | 60,000 | | | Fortinet, Inc. | | | 1,870,200 | * | |
| | 61,500 | | | Mobileye NV | | | 2,600,220 | * | |
| | 59,050 | | | ServiceNow, Inc. | | | 5,111,368 | * | |
| | 31,650 | | | Splunk, Inc. | | | 1,861,337 | * | |
| | 67,250 | | | Synchronoss Technologies, Inc. | | | 2,369,217 | * | |
| | 36,000 | | | Tableau Software, Inc. Class A | | | 3,391,920 | * | |
| | 24,000 | | | Tyler Technologies, Inc. | | | 4,183,680 | * | |
| | 15,500 | | | Ultimate Software Group, Inc. | | | 3,030,405 | * | |
| | | | 31,154,814 | | |
Specialty Retail (7.0%) | | | |
| | 37,550 | | | Lithia Motors, Inc. Class A | | | 4,005,458 | | |
| | 27,850 | | | O'Reilly Automotive, Inc. | | | 7,057,747 | * | |
| | 87,500 | | | Ross Stores, Inc. | | | 4,708,375 | | |
| | 21,000 | | | Signet Jewelers Ltd. | | | 2,597,490 | | |
| | 50,500 | | | Tractor Supply Co. | | | 4,317,750 | | |
| | 30,500 | | | Williams-Sonoma, Inc. | | | 1,781,505 | | |
| | | | 24,468,325 | | |
Textiles, Apparel & Luxury Goods (2.9%) | | | |
| | 161,250 | | | Hanesbrands, Inc. | | | 4,745,587 | | |
| | 14,000 | | | Ralph Lauren Corp. | | | 1,560,720 | | |
| | 48,250 | | | Under Armour, Inc. Class A | | | 3,889,433 | * | |
| | | | 10,195,740 | | |
Wireless Telecommunication Services (2.5%) | | | |
| 43,000 | | | SBA Communications
Corp. Class A | | | 4,518,010 | * | |
| | 110,500 | | | T-Mobile US, Inc. | | | 4,322,760 | * | |
| | | | 8,840,770 | | |
| | | | Total Common Stocks
(Cost $279,637,631) | | | 329,094,671 | | |
NUMBER OF SHARES | | | | VALUE† | |
Exchange Traded Funds (0.7%) | | | |
| 25,000
| | | iShares Russell Mid-Cap
Growth ETF
(Cost $2,319,418) | | $ | 2,299,250
| | |
Short-Term Investments (5.2%) | | | |
| 18,190,828
| | | State Street Institutional
Liquid Reserves Fund
Premier Class, 0.23%
(Cost $18,190,828) | | | 18,190,828
| a | |
| | | | | Total Investments (100.1%)
(Cost $300,147,877) | | | 349,584,749
| ## | |
| | | | | Liabilities, less cash, receivables
and other assets [(0.1%)] | | | (441,024
| ) | |
| | | | | Total Net Assets (100.0%) | | $ | 349,143,725 | | |
See Notes to Schedule of Investments
7
Notes to Schedule of Investments Mid Cap Growth Portfolio
† In accordance with Accounting Standards Codification ("ASC") 820 "Fair Value Measurement" ("ASC 820"), all investments held by Neuberger Berman Advisers Management Trust Mid Cap Growth Portfolio (the "Fund") are carried at the value that Neuberger Berman Investment Advisers LLC ("Management") believes the Fund would receive upon selling an investment in an orderly transaction to an independent buyer in the principal or most advantageous market for the investment under current market conditions. Various inputs, including the volume and level of activity for the asset or liability in the market, are considered in valuing the Fund's investments, some of which are discussed below. Significant Management judgment may be necessary to value investments in accordance with ASC 820.
ASC 820 established a three-tier hierarchy of inputs to create a classification of value measurements for disclosure purposes. The three-tier hierarchy of inputs is summarized in the three broad Levels listed below.
• Level 1 – quoted prices in active markets for identical investments
• Level 2 – other observable inputs (including quoted prices for similar investments, interest rates, prepayment speeds, credit risk, amortized cost, etc.)
• Level 3 – unobservable inputs (including the Fund's own assumptions in determining the fair value of investments)
The inputs or methodology used for valuing an investment are not necessarily an indication of the risk associated with investing in those securities.
The value of the Fund's investments in equity securities and exchange traded funds, for which market quotations are readily available, is generally determined by Management by obtaining valuations from independent pricing services based on the latest sale price quoted on a principal exchange or market for that security (Level 1 inputs). Securities traded primarily on the NASDAQ Stock Market are normally valued at the NASDAQ Official Closing Price ("NOCP") provided by NASDAQ each business day. The NOCP is the most recently reported price as of 4:00:02 p.m., Eastern Time, unless that price is outside the range of the "inside" bid and asked prices (i.e., the bid and asked prices that dealers quote to each other when trading for their own accounts); in that case, NASDAQ will adjust the price to equal the inside bid or asked price, whichever is closer. Because of delays in reporting trades, the NOCP may not be based on the price of the last trade to occur before the market closes. If there is no sale of a security on a particular day, the independent pricing services may value the security based on market quotations.
Management has developed a process to periodically review information provided by independent pricing services for all types of securities.
Investments in non-exchange traded investment companies are valued using the respective fund's daily calculated net asset value per share (Level 2 inputs).
If a valuation is not available from an independent pricing service, or if Management has reason to believe that the valuation received does not represent the amount the Fund might reasonably expect to receive on a current sale in an orderly transaction, Management seeks to obtain quotations from brokers or dealers (generally considered Level 2 or Level 3 inputs depending on the number of quotes available). If such quotations are not readily available, the security is valued using methods the Neuberger Berman Advisers Management Trust's Board of Trustees (the "Board") has approved in the good-faith belief that the resulting valuation will reflect the fair value of the security. Numerous factors may be considered when determining the fair value of a security based on Level 2 or Level 3 inputs, including available analyst, media or other reports, trading in financial futures or American Depositary Receipts ("ADRs") and whether the issuer of the security being fair valued has other securities outstanding.
See Notes to Financial Statements
8
Notes to Schedule of Investments Mid Cap Growth Portfolio (cont'd)
The value of the Fund's investments in foreign securities is generally determined using the same valuation methods and inputs as other Fund investments, as discussed above. Foreign security prices expressed in local currency values are translated from the local currency into U.S. dollars using the exchange rates as of the end of regular trading on the New York Stock Exchange ("NYSE") on business days, usually 4:00 p.m., Eastern Time. The Board has approved the use of Interactive Data Pricing and Reference Data, Inc. ("Interactive") to assist in determining the fair value of foreign equity securities when changes in the value of a certain index suggest that the closing prices on the foreign exchanges may no longer represent the amount that the Fund could expect to receive for those securities or on days when foreign markets are closed and U.S. markets are open. In each of these events, Interactive will provide adjusted prices for certain foreign equity securities using a statistical analysis of historical correlations of multiple factors (Level 2 inputs). In the absence of precise information about the market values of these foreign securities as of the close of the NYSE, the Board has determined on the basis of available data that prices adjusted in this way are likely to be closer to the prices the Fund could realize on a current sale than are the prices of those securities established at the close of the foreign markets in which the securities primarily trade.
Fair value prices are necessarily estimates, and there is no assurance that such a price will be at or close to the price at which the security is next quoted or next trades.
The following is a summary, categorized by Level, of inputs used to value the Fund's investments as of December 31, 2015:
Asset Valuation Inputs | | Level 1 | | Level 2 | | Level 3 | | Total | |
Investments: | |
Common Stocks^ | | $ | 329,094,671 | | | $ | — | | | $ | — | | | $ | 329,094,671 | | |
Exchange Traded Funds | | | 2,299,250 | | | | — | | | | — | | | | 2,299,250 | | |
Short-Term Investments | | | — | | | | 18,190,828 | | | | — | | | | 18,190,828 | | |
Total Investments | | $ | 331,393,921 | | | $ | 18,190,828 | | | $ | — | | | $ | 349,584,749 | | |
^ The Schedule of Investments provides information on the industry categorization for the portfolio.
As of the year ended December 31, 2015, no securities were transferred from one level (as of December 31, 2014) to another.
## At December 31, 2015, the cost of investments for U.S. federal income tax purposes was $300,283,388. Gross unrealized appreciation of investments was $57,049,174 and gross unrealized depreciation of investments was $7,747,813, resulting in net unrealized appreciation of $49,301,361, based on cost for U.S. federal income tax purposes.
* Security did not produce income during the last twelve months.
a The rate shown is the annualized seven day yield as of December 31, 2015.
See Notes to Financial Statements
9
Statement of Assets and Liabilities
Neuberger Berman Advisers Management Trust
| | | MID CAP
GROWTH
PORTFOLIO | |
| | | December 31, 2015 | |
Assets | |
Investments in securities, at value* (Note A)—see Schedule of Investments: | |
Unaffiliated issuers | | $ | 349,584,749 | | |
Foreign currency* | | | 7,543 | | |
Dividends and interest receivable | | | 138,184 | | |
Receivable for Fund shares sold | | | 76,366 | | |
Prepaid expenses and other assets | | | 8,853 | | |
Total Assets | | | 349,815,695 | | |
Liabilities | |
Payable for Fund shares redeemed | | | 252,138 | | |
Payable to investment manager (Note B) | | | 160,802 | | |
Payable to administrator (Note B) | | | 138,636 | | |
Accrued expenses and other payables | | | 120,394 | | |
Total Liabilities | | | 671,970 | | |
Net Assets | | $ | 349,143,725 | | |
Net Assets consist of: | |
Paid-in capital | | $ | 284,815,089 | | |
Accumulated net realized gains (losses) on investments | | | 14,893,917 | | |
Net unrealized appreciation (depreciation) in value of investments | | | 49,434,719 | | |
Net Assets | | $ | 349,143,725 | | |
Net Assets | |
Class I | | $ | 112,579,842 | | |
Class S | | | 236,563,883 | | |
Shares Outstanding ($.001 par value; unlimited shares authorized) | |
Class I | | | 4,953,813 | | |
Class S | | | 11,079,895 | | |
Net Asset Value, offering and redemption price per share | |
Class I | | $ | 22.73 | | |
Class S | | | 21.35 | | |
*Cost of Investments: | |
Unaffiliated issuers | | $ | 300,147,877 | | |
Total cost of foreign currency | | $ | 9,696 | | |
See Notes to Financial Statements
10
Neuberger Berman Advisers Management Trust
| | | MID CAP
GROWTH
PORTFOLIO | |
| | | For the
Year Ended
December 31, 2015 | |
Investment Income: | |
Income (Note A): | |
Dividend income—unaffiliated issuers | | $ | 1,188,127 | | |
Interest income—unaffiliated issuers | | | 23,682 | | |
Foreign taxes withheld (Note A) | | | (2,398 | ) | |
Total income | | $ | 1,209,411 | | |
Expenses: | |
Investment management fees (Note B) | | | 1,490,870 | | |
Administration fees (Note B): | |
Class I | | | 245,429 | | |
Class S | | | 571,624 | | |
Distribution fees (Note B): | |
Class S | | | 476,353 | | |
Audit fees | | | 45,335 | | |
Custodian and accounting fees | | | 100,050 | | |
Insurance expense | | | 6,913 | | |
Legal fees | | | 146,606 | | |
Repayment to Management of expenses previously assumed by Management (Note B) | | | 6,663 | | |
Shareholder reports | | | 29,951 | | |
Trustees' fees and expenses | | | 35,445 | | |
Miscellaneous | | | 11,874 | | |
Total net expenses | | | 3,167,113 | | |
Net investment income (loss) | | $ | (1,957,702 | ) | |
Realized and Unrealized Gain (Loss) on Investments (Note A): | |
Net realized gain (loss) on: | |
Sales of investment securities of unaffiliated issuers | | | 15,988,521 | | |
Net increase from payments by affiliates | | | 216,506 | | |
Change in net unrealized appreciation (depreciation) in value of: | |
Unaffiliated investment securities | | | (17,787,714 | ) | |
Foreign currency | | | (2,153 | ) | |
Net gain (loss) on investments | | | (1,584,840 | ) | |
Net increase (decrease) in net assets resulting from operations | | $ | (3,542,542 | ) | |
See Notes to Financial Statements
11
Statements of Changes in Net Assets
Neuberger Berman Advisers Management Trust
| | | MID CAP GROWTH PORTFOLIO | |
| | | Year Ended
December 31,
2015 | | Year Ended
December 31,
2014 | |
Increase (Decrease) in Net Assets: | |
From Operations: | |
Net investment income (loss) (Note A) | | $ | (1,957,702 | ) | | $ | (1,390,824 | ) | |
Net realized gain (loss) on investments (Note A) | | | 15,988,521 | | | | 26,382,947 | | |
Net increase from payments by affiliates (Note B) | | | 216,506 | | | | 5,113 | | |
Change in net unrealized appreciation (depreciation) of investments (Note A) | | | (17,789,867 | ) | | | (10,129,270 | ) | |
Net increase (decrease) in net assets resulting from operations | | | (3,542,542 | ) | | | 14,867,966 | | |
Distributions to Shareholders From (Note A): | |
Net realized gain on investments: | |
Class I | | | (8,101,561 | ) | | | (27,830,874 | ) | |
Class S | | | (18,371,016 | ) | | | (58,724,209 | ) | |
Total distributions to shareholders | | | (26,472,577 | ) | | | (86,555,083 | ) | |
From Fund Share Transactions (Note D): | |
Proceeds from shares sold: | |
Class I | | | 41,184,693 | | | | 8,025,034 | | |
Class S | | | 87,920,541 | | | | 19,854,027 | | |
Proceeds from reinvestment of dividends and distributions: | |
Class I | | | 8,101,561 | | | | 27,830,874 | | |
Class S | | | 18,371,016 | | | | 58,724,209 | | |
Proceeds from shares issued in connection with tax-free reorganizations (Note F): | |
Class I | | | 20,675,262 | | | | — | | |
Class S | | | 13,738,256 | | | | — | | |
Payments for shares redeemed: | |
Class I | | | (18,868,871 | ) | | | (11,932,657 | ) | |
Class S | | | (10,919,445 | ) | | | (8,259,756 | ) | |
Net increase (decrease) from Fund share transactions | | | 160,203,013 | | | | 94,241,731 | | |
Net Increase (Decrease) in Net Assets | | | 130,187,894 | | | | 22,554,614 | | |
Net Assets: | |
Beginning of year | | | 218,955,831 | | | | 196,401,217 | | |
End of year | | $ | 349,143,725 | | | $ | 218,955,831 | | |
Undistributed net investment income (loss) at end of year | | $ | — | | | $ | — | | |
See Notes to Financial Statements
12
Notes to Financial Statements Mid Cap Growth Portfolio
Note A—Summary of Significant Accounting Policies:
1 General: Neuberger Berman Advisers Management Trust (the "Trust") is a Delaware statutory trust organized pursuant to an Amended and Restated Trust Instrument dated March 27, 2014. The Trust is currently comprised of eight separate operating series (each individually a "Fund," and collectively the "Funds") each of which is diversified. The Trust is registered as an open-end management investment company under the Investment Company Act of 1940, as amended (the "1940 Act"), and its shares are registered under the Securities Act of 1933, as amended. The Fund currently offers Class I and Class S shares. The Board may establish additional series or classes of shares without the approval of shareholders.
The assets of each Fund belong only to that Fund, and the liabilities of each Fund are borne solely by that Fund and no other.
The Fund is an investment company and accordingly follows the investment company accounting and reporting guidance of the Financial Accounting Standards Board (FASB) Accounting Standard Codification Topic 946 "Financial Services—Investment Companies."
The preparation of financial statements in accordance with U.S. generally accepted accounting principles ("GAAP") requires Management to make estimates and assumptions at the date of the financial statements. Actual results could differ from those estimates.
Shares of the Fund are not available to the general public and may be purchased only by life insurance companies to be held in their separate accounts, which fund variable annuity and variable life insurance policies, and by qualified pension and retirement plans.
2 Portfolio valuation: Investment securities are valued as indicated in the notes following the Schedule of Investments.
3 Foreign currency translation: The accounting records of the Fund are maintained in U.S. dollars. Foreign currency amounts are translated into U.S. dollars using the exchange rate as of the end of regular trading on the NYSE on business days, usually 4:00 p.m. Eastern Time, to determine the value of investments, other assets and liabilities. Purchase and sale prices of securities, and income and expenses, are translated into U.S. dollars at the prevailing rate of exchange on the respective dates of such transactions. Net unrealized foreign currency gain (loss), if any, arises from changes in the value of assets and liabilities, other than investments in securities, as a result of changes in exchange rates and is stated separately in the Statement of Operations.
4 Securities transactions and investment income: Securities transactions are recorded on trade date for financial reporting purposes. Dividend income is recorded on the ex-dividend date or, for certain foreign dividends, as soon as the Fund becomes aware of the dividends. Non-cash dividends included in dividend income, if any, are recorded at the fair market value of the securities received. Interest income, including accretion of original issue discount, where applicable, and accretion of discount on short-term investments, if any, is recorded on the accrual basis. Realized gains and losses from securities transactions and foreign currency transactions, if any, are recorded on the basis of identified cost and stated separately in the Statement of Operations. Included in net realized gain (loss) on investments are proceeds from the settlements of class action litigation in which the Fund participated as a class member. The amount of such proceeds for the year ended December 31, 2015 was $101,732.
5 Income tax information: Each Fund is treated as a separate entity for U.S. federal income tax purposes. It is the policy of the Fund to continue to qualify for treatment as a regulated investment company ("RIC") by complying with the requirements of the U.S. Internal Revenue Code applicable to RICs and to distribute substantially all of its net investment income and net realized capital gains to its shareholders. To the extent the Fund distributes
13
substantially all of its net investment income and net realized capital gains to shareholders, no federal income or excise tax provision is required.
The Fund has adopted the provisions of ASC 740 "Income Taxes" ("ASC 740"). ASC 740 sets forth a minimum threshold for financial statement recognition of a tax position taken, or expected to be taken, in a tax return. The Fund recognizes interest and penalties, if any, related to unrecognized tax positions as an income tax expense in the Statement of Operations. The Fund is subject to examination by U.S. federal and state tax authorities for returns filed for the tax years for which the applicable statutes of limitations have not yet expired. As of December 31, 2015, the Fund did not have any unrecognized tax positions.
Income distributions and capital gain distributions are determined in accordance with income tax regulations, which may differ from GAAP. These differences are primarily due to differing treatments of income and gains on various investment securities held by the Fund, timing differences and differing characterization of distributions made by the Fund. The Fund may also utilize earnings and profits distributed to shareholders on redemption of their shares as a part of the dividends-paid deduction for income tax purposes.
As determined on December 31, 2015, permanent differences resulting primarily from different book and tax accounting were reclassified at year end. Such differences are attributed to the tax treatment of: net operating losses, return of capital adjustments, premium amortization adjustments and merger adjustments. These reclassifications had no effect on net income, net asset value ("NAV") or NAV per share of the Fund. For the year ended December 31, 2015, the Fund recorded the following permanent reclassifications:
Paid-in Capital | | Undistributed
Net Investment
Income (Loss) | | Accumulated
Net Realized
Gains (Losses)
on Investments | |
| $ | (660,541 | ) | | $ | 1,957,702 | | | $ | (1,297,161 | ) | |
The tax character of distributions paid during the years ended December 31, 2015 and December 31, 2014 was as follows:
Distributions Paid From: | |
Ordinary Income | | Long-Term Capital Gain | | Total | |
| 2015 | | 2014 | | 2015 | | 2014 | | 2015 | | 2014 | |
| $ | — | | | $ | — | | | $ | 26,472,577 | | | $ | 86,555,083 | | | $ | 26,472,577 | | | $ | 86,555,083 | | |
As of December 31, 2015, the components of distributable earnings (accumulated losses) on a U.S. federal income tax basis were as follows:
Undistributed
Long-Term
Capital Gain | | Unrealized
Appreciation
(Depreciation) | | Loss
Carryforwards
and Deferrals | | Other
Temporary
Differences | | Total | |
| $ | 15,897,810 | | | $ | 49,299,207 | | | $ | (868,381 | ) | | $ | — | | | $ | 64,328,636 | | |
The difference between book basis and tax basis distributable earnings is primarily due to losses disallowed and recognized on wash sales and return of capital adjustments.
To the extent the Fund's net realized capital gains, if any, can be offset by capital loss carryforwards, it is the policy of the Fund not to distribute such gains. The Regulated Investment Company Modernization Act of 2010 (the "Act") became effective for the Fund on January 1, 2011. The Act modernizes several of the federal income and excise tax provisions related to RICs. Among the changes made are changes to the capital loss carryforward rules allowing for RICs to carry forward capital losses indefinitely and to retain the character of capital loss carryforwards as short-term or long-term ("Post-Enactment"). Rules in effect previously limited the carryforward period to eight years and all carryforwards were considered short-term in character ("Pre-Enactment"). As
14
determined at December 31, 2015, the Fund had unused capital loss carryforwards available for federal income tax purposes to offset net realized capital gains, if any, as follows:
Pre-Enactment | |
Expiring in:
2016 | |
| $ | 868,381 | (1) | |
(1) The capital loss carryforwards shown above include $868,381 expiring in 2016, which were acquired on November 6, 2015 in the merger with Neuberger Berman Advisers Management Trust Growth Portfolio. Future utilization of these losses may be limited under current tax rules.
Post-Enactment capital loss carryforwards must be fully used before Pre-Enactment capital loss carryforwards; therefore, under certain circumstances, Pre-Enactment capital loss carryforwards available as of the report date may expire unused. As of December 31, 2015, the Fund had no Post-Enactment capital loss carryforwards.
During the year ended December 31, 2015, the Fund utilized capital loss carryforwards of $256,628.
6 Distributions to shareholders: The Fund may earn income, net of expenses, daily on its investments. Distributions from net investment income and net realized capital gains, if any, generally are distributed once a year (usually in October). Income distributions and capital gain distributions to shareholders are recorded on the ex-date.
7 Foreign taxes: Foreign taxes withheld, if any, represent amounts withheld by foreign tax authorities, net of refunds recoverable.
8 Expense allocation: Certain expenses are applicable to multiple funds within the complex of related investment companies. Expenses directly attributable to a Fund are charged to that Fund. Expenses of the Trust that are not directly attributable to a particular series of the Trust (e.g., the Fund) are allocated among the series of the Trust, on the basis of relative net assets, except where a more appropriate allocation of expenses to each of the series can otherwise be made fairly. Expenses borne by the complex of related investment companies, which includes open-end and closed-end investment companies for which Management serves as investment manager, that are not directly attributable to a particular investment company in the complex (e.g., the Trust) or series thereof are allocated among the investment companies in the complex or series thereof on the basis of relative net assets, except where a more appropriate allocation of expenses to each of the investment companies in the complex or series thereof can otherwise be made fairly. The Fund's expenses (other than those specific to each class) are allocated proportionally each day among the classes based upon the relative net assets of each class.
9 Investments in foreign securities: Investing in foreign securities may involve certain sovereign and other risks, in addition to the credit and market risks normally associated with domestic securities. These additional risks include the possibility of adverse political and economic developments (including political instability, nationalization, expropriation, or confiscatory taxation) and the potentially adverse effects of unavailability of public information regarding issuers, less governmental supervision and regulation of financial markets, reduced liquidity of certain financial markets, and the lack of uniform accounting, auditing, and financial reporting standards or the application of standards that are different or less stringent than those applied in the United States. Foreign securities also may experience greater price volatility, higher rates of inflation, and delays in settlement.
10 Indemnifications: Like many other companies, the Trust's organizational documents provide that its officers ("Officers") and trustees ("Trustees") are indemnified against certain liabilities arising out of the performance of their duties to the Trust. In addition, both in some of its principal service contracts and in the normal course of its business, the Trust enters into contracts that provide indemnifications to other parties for certain types of losses or liabilities. The Trust's maximum exposure under these arrangements is unknown as this could involve future claims against the Trust.
11 Other: All net investment income and realized and unrealized capital gains and losses of the Fund are allocated, on the basis of relative net assets, pro rata among its respective classes.
15
Note B—Investment Management Fees, Administration Fees, Distribution Arrangements, and Other Transactions with Affiliates:
The Fund retains Management as its investment manager under a Management Agreement. For such investment management services, the Fund pays Management a fee at the annual rate of 0.55% of the first $250 million of the Fund's average daily net assets, 0.525% of the next $250 million, 0.50% of the next $250 million, 0.475% of the next $250 million, 0.45% of the next $500 million, 0.425% of the next $2.5 billion, and 0.40% of average daily net assets in excess of $4 billion. Accordingly, for the year ended December 31, 2015, the investment management fee pursuant to the Management Agreement was equivalent to an annual effective rate of 0.55% of the Fund's average daily net assets.
The Fund retains Management as its administrator under an Administration Agreement. Each class pays Management an administration fee at the annual rate of 0.30% of its average daily net assets under this agreement. Additionally, Management retains State Street Bank and Trust Company ("State Street") as its sub-administrator under a Sub-Administration Agreement. Management pays State Street a fee for all services received under this agreement.
The Board adopted a non-fee distribution plan for the Fund's Class I.
For the Fund's Class S, Management acts as agent in arranging for the sale of class shares without commission and bears advertising and promotion expenses. The Board has adopted a distribution plan (the "Plan") with respect to this class, pursuant to Rule 12b-1under the 1940 Act. The Plan provides that, as compensation for administrative and other services provided to this class, Management's activities and expenses related to the sale and distribution of this class, and ongoing services provided to investors in this class, Management receives from this class a fee at the annual rate of 0.25% of Class S's average daily net assets. Management receives this amount to provide distribution and shareholder servicing for this class and pays a portion of it to institutions that provide such services. Those institutions may use the payments for, among other purposes, compensating employees engaged in sales and/or shareholder servicing. The amount of fees paid by this class during any year may be more or less than the cost of distribution and other services provided to this class. FINRA rules limit the amount of annual distribution fees that may be paid by a mutual fund and impose a ceiling on the cumulative distribution fees paid. The Trust's Plan complies with those rules.
Management has contractually agreed to waive fees and/or reimburse the Fund's Class I and Class S shares so that the total annual operating expenses of those classes do not exceed the expense limitations as detailed in the following table. These undertakings include fees payable to Management for the Fund's Class S shares but exclude such fees payable for the Fund's Class I shares and exclude, for each class, interest, taxes, brokerage commissions, dividend and interest expenses relating to short sales, acquired fund fees and expenses, extraordinary expenses and transaction costs, if any; consequently, net expenses may exceed the contractual expense limitations. The Fund has agreed that each of its classes will repay Management for fees and expenses waived or reimbursed for that class provided that repayment does not cause that class's annual operating expenses to exceed its contractual expense limitation in place at the time the fees and expenses were waived or reimbursed, or the expense limitation in place at the time the Fund repays Management, whichever is lower. Any such repayment must be made within three years after the year in which Management incurred the expense.
During the year ended December 31, 2015, the Fund's Class S shares repaid Management $6,663, under its contractual expense limitation.
16
At December 31, 2015, the Fund's contingent liabilities to Management under its contractual expense limitation were as follows:
| | | | | | | Expenses Reimbursed in
Fiscal Year Ending December 31, | |
| | | | | | | 2013 | | 2014 | | 2015 | |
| | | | | | | Subject to Repayment Until December 31, | |
| | | Contractual
Expense
Limitation(1) | | Expiration | | 2016 | | 2017 | | 2018 | |
Class I | | | 1.00 | % | | 12/31/18 | | $ | — | | | $ | — | | | $ | — | | |
Class S | | | 1.25 | % | | 12/31/18 | | | — | | | | — | | | | — | | |
(1) Expense limitation per annum of the respective class's average daily net assets.
Neuberger Berman LLC ("Neuberger") was retained by Management through December 31, 2015, pursuant to a Sub-Advisory Agreement to furnish it with investment recommendations and research information without added cost to the Fund. Several individuals who are Officers and/or Trustees of the Trust are also employees of Neuberger and/or Management. As a result of the entity consolidation described on page 3 of this Annual Report, the services previously provided by Neuberger under the Sub-Advisory Agreement are being provided by NBIA as of January 1, 2016.
On June 3, 2014, Management made a voluntary contribution of $5,113 to the Fund in connection with a payment matter related to the Fund's investment in a State Street money market fund.
For the year ended December 31, 2015, the Fund recorded a capital contribution from Management in the amount of $216,506. This amount was paid in connection with losses incurred in the execution of a trade.
Note C—Securities Transactions:
During the year ended December 31, 2015, there were purchase and sale transactions (excluding short-term securities) of $239,976,663 and $146,891,367, respectively.
During the year ended December 31, 2015, no brokerage commissions on securities transactions were paid to affiliated brokers.
Note D—Fund Share Transactions:
Share activity for the years ended December 31, 2015 and December 31, 2014 was as follows:
For the Year Ended December 31, 2015
| | | Shares Sold | | Shares Issued on
Reinvestment of
Dividends and
Distributions | | Shares Issued
in Connection
With Tax-Free
Reorganizations
(see Note F) | | Shares
Redeemed | | Total | |
Class I | | | 1,633,736 | | | | 347,259 | | | | 871,902 | | | | (740,441 | ) | | | 2,112,456 | | |
Class S | | | 3,642,482 | | | | 837,712 | | | | 616,453 | | | | (453,361 | ) | | | 4,643,286 | | |
17
For the Year Ended December 31, 2014
| | | Shares Sold | | Shares Issued on
Reinvestment of
Dividends and
Distributions | | Shares Issued
in Connection
With Tax-Free
Reorganizations
(see Note F) | | Shares
Redeemed | | Total | |
Class I | | | 231,678 | | | | 1,280,758 | | | | — | | | | (340,541 | ) | | | 1,171,895 | | |
Class S | | | 612,943 | | | | 2,852,074 | | | | — | | | | (228,435 | ) | | | 3,236,582 | | |
Note E—Lines of Credit:
At December 31, 2015, the Fund was a participant in a syndicated committed, unsecured $700,000,000 line of credit (the "Credit Facility"), to be used only for temporary or emergency purposes. Series of other investment companies managed by Management also participate in this line of credit on substantially the same terms except that some do not have access to the full amount of the Credit Facility. Under the terms of the Credit Facility, the Fund has agreed to pay its share of the annual commitment fee, based on the ratio of its individual net assets to the net assets of all participants at the time the fee is due and payable and the level of its access to the Credit Facility, and interest charged on any borrowing made by the Fund and other costs incurred by the Fund. Because several mutual funds participate in the Credit Facility, there is no assurance that the Fund will have access to all or any part of the $700,000,000 at any particular time. There were no loans outstanding under the Credit Facility at December 31, 2015. During the period from January 9, 2015 (the commencement date of the Credit Facility) through December 31, 2015, the Fund did not utilize this line of credit. The Credit Facility replaced the State Street lines of credit referred to below.
During the reporting period, from January 1, 2015 through January 9, 2015, the Fund was a participant in a committed, unsecured $300,000,000 line of credit with State Street and an uncommitted, unsecured $100,000,000 line of credit with State Street, both to be used only for temporary or emergency purposes. During the period ended December 31, 2015, the Fund did not utilize either line of credit with State Street.
Note F—Reorganizations:
At a meeting held on June 24, 2015, the Board, unanimously approved the tax free reorganization of the Neuberger Berman Advisers Management Trust Balanced Portfolio ("Balanced"), Neuberger Berman Advisers Management Trust Growth Portfolio ("Growth") and Neuberger Berman Advisers Management Trust Small Cap Growth Portfolio ("Small Cap Growth") (the "Target Funds") into the Neuberger Berman Advisers Management Trust Mid Cap Growth Portfolio ("Mid Cap Growth") (the "Acquiring Fund"), each, a separate series of the Trust. On November 6, 2015, the Acquiring Fund acquired all of the net assets of the Target Funds in a tax-free exchange of shares pursuant to an Agreement and Plan of Reorganization and Dissolution approved by the Board. The purpose of the transaction was to combine four portfolios with similar investment objectives, policies and risks.
| Balanced | | Shares Prior to
Reorganization | | Shares Issued by
the Acquiring Fund | | Net Assets Prior
to Reorganization | |
| Class I | | | 1,212,817 | | | | 551,083 | | | $ | 13,067,738 | | |
| Growth | | Shares Prior to
Reorganization | | Shares Issued by
the Acquiring Fund | | Net Assets Prior
to Reorganization | |
| Class I | | | 245,859 | | | | 320,819 | | | $ | 7,607,524 | | |
| Small Cap Growth | | Shares Prior to
Reorganization | | Shares Issued by
the Acquiring Fund | | Net Assets Prior
to Reorganization | |
| Class S | | | 899,619 | | | | 616,453 | | | $ | 13,738,256 | | |
18
The appreciation of Balanced, Growth and Small Cap Growth were $2,555,165, $2,288,793 and $629,431, respectively, as of the date of the reorganization. The combined net assets of the Acquiring Fund immediately after the reorganization were $349,985,854.
Assuming the reorganization had been completed on January 1, 2015, the beginning of the reporting period of the Acquiring Fund, the Acquiring Fund's pro forma results of operations for the period ended December 31, 2015, were as follows:
Net Investment Income (Loss) | | $ | (2,136,312 | ) | |
Net Realized and Unrealized Gains/Losses on Investments and Foreign Currency Transactions | | | (772,285 | ) | |
Net Increase/Decrease in Net Assets resulting from Operations | | $ | (2,908,597 | ) | |
Because the combined investment portfolios have been managed as a single integrated portfolio since the reorganization was completed, it is not practicable to separate the amounts of revenue and earnings of the Target Funds that have been included in the Acquiring Fund's Statement of Operations as of December 31, 2015.
19
Mid Cap Growth Portfolio
The following tables include selected data for a share outstanding throughout each year and other performance information derived from the Financial Statements. Amounts that do not round to $0.01 or ($0.01) per share are presented as $0.00 or ($0.00), respectively. Ratios that do not round to 0.01% or (0.01)% are presented as 0.00% or (0.00)%, respectively. Net Asset amounts with a zero balance, if any, may reflect actual amounts rounding to less than $0.1 million. A "—" indicates that the line item was not applicable in the corresponding period.
Class I | |
| | | Year Ended December 31, | |
| | | 2015 | | 2014 | | 2013 | | 2012 | | 2011 | |
Net Asset Value, Beginning of Year | | $ | 24.50 | | | $ | 41.07 | | | $ | 30.97 | | | $ | 27.55 | | | $ | 27.42 | | |
Income From Investment Operations: | |
| Net Investment Income (Loss)‡ | | | (0.14 | ) | | | (0.19 | ) | | | (0.19 | ) | | | (0.10 | ) | | | (0.15 | ) | |
Net Gains or Losses on Securities
(both realized and unrealized) | | | 0.49 | | | | 1.08 | | | | 10.29 | | | | 3.52 | | | | 0.28 | | |
Total From Investment Operations | | | 0.35 | | | | 0.89 | | | | 10.10 | | | | 3.42 | | | | 0.13 | | |
Less Distributions From: | |
Net Capital Gains | | | (2.14 | ) | | | (17.46 | ) | | | — | | | | — | | | | — | | |
Voluntary Contribution from Management | | | 0.02 | | | | 0.00 | | | | — | | | | — | | | | — | | |
Net Asset Value, End of Year | | $ | 22.73 | | | $ | 24.50 | | | $ | 41.07 | | | $ | 30.97 | | | $ | 27.55 | | |
| Total Return†† | | | 1.28 | %ab | | 7.58 | %a | | 32.61 | %b | | 12.41 | %b | | 0.47 | % | |
Ratios/Supplemental Data | |
Net Assets, End of Year (in millions) | | $ | 112.6 | | | $ | 69.6 | | | $ | 68.6 | | | $ | 229.0 | | | $ | 233.2 | | |
| Ratio of Gross Expenses to Average Net Assets# | | | 0.98 | % | | | 1.00 | % | | | 0.99 | % | | | 0.99 | % | | | 1.01 | % | |
Ratio of Net Expenses to Average Net Assets | | | 0.98 | % | | | 1.00 | % | | | 0.99 | % | | | 0.99 | %§ | | 1.01 | %§ |
Ratio of Net Investment Income (Loss) to Average
Net Assets | | | (0.54 | )% | | | (0.53 | )% | | | (0.57 | )% | | | (0.34 | )% | | | (0.54 | )% | |
Portfolio Turnover Rate | | | 58 | %c | | 64 | % | | | 43 | % | | | 38 | % | | 35 | % | |
See Notes to Financial Highlights
20
Financial Highlights (cont'd)
Class S | |
| | | Year Ended December 31, | |
| | | 2015 | | 2014 | | 2013 | | 2012 | | 2011 | |
Net Asset Value, Beginning of Year | | $ | 23.20 | | | $ | 39.95 | | | $ | 30.21 | | | $ | 26.94 | | | $ | 26.87 | | |
Income From Investment Operations: | |
| Net Investment Income (Loss)‡ | | | (0.19 | ) | | | (0.27 | ) | | | (0.26 | ) | | | (0.17 | ) | | | (0.21 | ) | |
Net Gains or Losses on Securities
(both realized and unrealized) | | | 0.46 | | | | 0.98 | | | | 10.00 | | | | 3.44 | | | | 0.28 | | |
Total From Investment Operations | | | 0.27 | | | | 0.71 | | | | 9.74 | | | | 3.27 | | | | 0.07 | | |
Less Distributions From: | |
Net Capital Gains | | | (2.14 | ) | | | (17.46 | ) | | | — | | | | — | | | | — | | |
Voluntary Contribution from Management | | | 0.02 | | | | 0.00 | | | | — | | | | — | | | | — | | |
Net Asset Value, End of Year | | $ | 21.35 | | | $ | 23.20 | | | $ | 39.95 | | | $ | 30.21 | | | $ | 26.94 | | |
| Total Return†† | | | 1.00 | %ab | | 7.31 | %a | 32.24 | % | | 12.14 | %b | 0.26 | % | |
Ratios/Supplemental Data | |
Net Assets, End of Year (in millions) | | $ | 236.6 | | | $ | 149.3 | | | $ | 127.8 | | | $ | 88.2 | | | $ | 64.2 | | |
Ratio of Gross Expenses to Average Net Assets | | | 1.24 | % | | | 1.25 | % | | | 1.26 | %# | | 1.24 | % | | | 1.26 | %# |
Ratio of Net Expenses to Average Net Assets | | | 1.24 | %Ø | | 1.25 | %Ø | 1.25 | % | | 1.25 | %§Ø | 1.25 | %§ |
Ratio of Net Investment Income (Loss) to Average
Net Assets | | | (0.80 | )% | | | (0.78 | )% | | (0.76 | )% | | | (0.57 | )% | | | (0.78 | )% | |
Portfolio Turnover Rate | | | 58 | %c | | 64 | % | | 43 | % | | | 38 | % | | 35 | % | |
See Notes to Financial Highlights
21
Notes to Financial Highlights Mid Cap Growth Portfolio
†† Total return based on per share NAV reflects the effects of changes in NAV on the performance of the Fund during each fiscal period. Returns assume income dividends and other distributions, if any, were reinvested. Results represent past performance and do not indicate future results. Current returns may be lower or higher than the performance data quoted. Investment returns and principal may fluctuate and shares when redeemed may be worth more or less than original cost. Total return would have been lower if Management had not reimbursed and/or waived certain expenses. Total return would have been higher if Management had not recouped previously reimbursed expenses. The total return information shown does not reflect charges and other expenses that apply to the separate accounts or the related insurance policies or other qualified pension or retirement plans, and the inclusion of these charges and other expenses would reduce the total return for all fiscal periods shown.
b The class action proceeds listed in Note A of the Notes to Financial Statements had no impact on the Fund's total return for the year ended December 31, 2015. Had the Fund not received class action proceeds in 2013, total return based on per share NAV for the year ended December 31, 2013 would have been 32.58% for Class I. Had the Fund not received class action proceeds in 2012, total return based on per share NAV for the year ended December 31, 2012 would have been 12.34% and 12.06% for Class I and Class S, respectively.
# Represents the annualized ratios of net expenses to average daily net assets if Management had not reimbursed certain expenses and/or waived a portion of the investment management fee. Management did not reimburse or waive fees during the fiscal periods shown for Class I.
‡ Calculated based on the average number of shares outstanding during each fiscal period.
§ Prior to January 1, 2013, the Fund had an expense offset arrangement in connection with its custodian contract. The impact of expense reductions related to expense offset arrangements, if any, was less than 0.01%.
Ø After repayment of expenses previously reimbursed by Management. Had the Fund not made such repayments, the annualized ratio of net expenses to average daily net assets would have been:
| | | Year Ended December 31, | |
| | | 2015 | | 2014 | | 2013 | | 2012 | |
Mid Cap Growth Portfolio Class S | | | 1.24 | % | | | 1.25 | % | | | — | | | | 1.24 | % | |
a Had the Fund not received the voluntary contribution listed in Note B of the Notes to Financial Statements, total return based on per share NAV for the year ended December 31, 2015 would have been 1.23% and 0.95% for Class I and Class S, respectively. The voluntary contribution listed in Note B of the Notes to Financial Statements had no impact on the Fund's total returns for the year ended December 31, 2014.
c On November 6, 2015, Mid Cap Growth acquired all of the net assets of Balanced, Growth and Small Cap Growth pursuant to a Plan of Reorganization and Dissolution. Portfolio turnover excludes purchases and sales of securities by Balanced, Growth and Small Cap Growth (acquired funds) prior to the merger date.
22
Report of Independent Registered Public Accounting Firm
To the Board of Trustees of
Neuberger Berman Advisers Management Trust and
Shareholders of Mid Cap Growth Portfolio
We have audited the accompanying statement of assets and liabilities of Mid Cap Growth Portfolio, one of the series constituting Neuberger Berman Advisers Management Trust (the "Trust"), including the schedule of investments, as of December 31, 2015, and the related statement of operations for the year then ended, the statements of changes in net assets for each of the two years in the period then ended and the financial highlights for each of the five years in the period then ended. These financial statements and financial highlights are the responsibility of the Trust's management. Our responsibility is to express an opinion on these financial statements and financial highlights based on our audits.
We conducted our audits in accordance with the standards of the Public Company Accounting Oversight Board (United States). Those standards require that we plan and perform the audit to obtain reasonable assurance about whether the financial statements and financial highlights are free of material misstatement. We were not engaged to perform an audit of the Trust's internal control over financial reporting. Our audits included consideration of internal control over financial reporting as a basis for designing audit procedures that are appropriate in the circumstances, but not for the purpose of expressing an opinion on the effectiveness of the Trust's internal control over financial reporting. Accordingly, we express no such opinion. An audit also includes examining, on a test basis, evidence supporting the amounts and disclosures in the financial statements and financial highlights, assessing the accounting principles used and significant estimates made by management, and evaluating the overall financial statement presentation. Our procedures included confirmation of securities owned as of December 31, 2015 by correspondence with the custodian. We believe that our audits provide a reasonable basis for our opinion.
In our opinion, the financial statements and financial highlights referred to above present fairly, in all material respects, the financial position of Mid Cap Growth Portfolio, a series of Neuberger Berman Advisers Management Trust, at December 31, 2015, the results of its operations for the year then ended, the changes in its net assets for each of the two years in the period then ended, and the financial highlights for each of the five years in the period then ended in conformity with U.S. generally accepted accounting principles.
Boston, Massachusetts
February 16, 2016
23
The following tables set forth information concerning the Trustees and Officers of the Fund. All persons named as Trustees and Officers also serve in similar capacities for other funds administered or managed by Management. The Fund's Statement of Additional Information includes additional information about the Trustees as of the time of the Fund's most recent public offering and is available upon request, without charge, by calling (800) 877-9700.
Information about the Board of Trustees
Name, (Year of Birth),
and Address(1) | | Position(s) and
Length of
Time Served(2) | | Principal Occupation(s)(3) | | Number of
Funds in Fund
Complex
Overseen by Fund Trustee | | Other Directorships Held
Outside Fund Complex by
Fund Trustee(3) | |
Independent Trustees | |
Faith Colish (1935) | | Trustee since 1982 | | Counsel, Carter Ledyard & Milburn LLP (law firm) since October 2002; formerly, Attorney-at-Law and President, Faith Colish, A Professional Corporation, 1980 to 2002. | | | 58 | | | Formerly, Director, 1997 to 2003, and Advisory Director, 2003 to 2006, ABA Retirement Funds (formerly, American Bar Retirement Association) (not-for-profit membership corporation). | |
Michael J. Cosgrove (1949) | | Trustee since 2015 | | President, Carragh Consulting USA, since 2014; formerly, Executive, General Electric Company, 1982 to 2014, including President, Mutual Funds and Global Investment Programs, GE Asset Management, 2011 to 2014, President and Chief Executive Officer, Mutual Funds and Intermediary Business, GE Asset Management, 2007 to 2011, and President, Institutional Sales and Marketing, GE Asset Management, 1998 to 2007. | | | 58 | | | Director, The Gabelli Go Anywhere Trust, since 2015; Director, America Press, Inc. (not-for-profit Jesuit publisher), since 2015; Director, Fordham University, since 2001; Director, Skin Cancer Foundation (not-for-profit), since 2006; formerly, Director, GE Investments Funds, Inc., 1997 to 2014; Trustee, GE Institutional Funds, 1997 to 2014; Director, GE Asset Management, 1988 to 2014; Director, Elfun Trusts, 1988 to 2014. | |
24
Name, (Year of Birth),
and Address(1) | | Position(s) and
Length of
Time Served(2) | | Principal Occupation(s)(3) | | Number of
Funds in Fund
Complex
Overseen by Fund Trustee | | Other Directorships Held
Outside Fund Complex by
Fund Trustee(3) | |
Marc Gary (1952) | | Trustee since 2015 | | Executive Vice Chancellor and Chief Operating Officer, Jewish Theological Seminary, since 2012; formerly, Executive Vice President and General Counsel, Fidelity Investments, 2007 to 2012; Executive Vice President and General Counsel, BellSouth Corporation, 2004 to 2007; Vice President and Associate General Counsel, BellSouth Corporation, 2000 to 2004; Associate, Partner, and National Litigation Practice Co-Chair, Mayer, Brown LLP, 1981 to 2000; Associate Independent Counsel, Office of Independent Counsel, 1990 to 1992. | | | 58 | | | Trustee, Jewish Theological Seminary, since 2015; Director, Counsel on Call (privately held for-profit company), since 2012; Director, Lawyers Committee for Civil Rights Under Law (not-for-profit), since 2005; formerly, Director, Equal Justice Works (not-for-profit), 2005 to 2014; Director, Corporate Counsel Institute, Georgetown University Law Center, 2007 to 2012; Director, Greater Boston Legal Services (not-for-profit), 2007 to 2012. | |
Martha C. Goss (1949) | | Trustee since 2007 | | President, Woodhill Enterprises Inc./Chase Hollow Associates LLC (personal investment vehicle), since 2006; formerly, Consultant, Resources Global Professionals (temporary staffing), 2002 to 2006. | | | 58 | | | Director, American Water (water utility), since 2003; Director, Allianz Life of New York (insurance), since 2005; Director, Berger Group Holdings, Inc. (engineering consulting firm), since 2013; Director, Financial Women's Association of New York (not-for-profit association), since 2003; Trustee Emerita, Brown University, since 1998; Director, Museum of American Finance (not-for-profit), since 2013; formerly, Non-Executive Chair and Director, Channel Reinsurance (financial guaranty reinsurance), 2006 to 2010; formerly, Director, Ocwen Financial Corporation (mortgage servicing), 2005 to 2010; formerly, Director, Claire's Stores, Inc. (retailer), 2005 to 2007; formerly, Director, Parsons Brinckerhoff Inc. (engineering consulting firm), 2007 to 2010; formerly, Director, Bank Leumi (commercial bank), 2005 to 2007; formerly, Advisory Board Member, Attensity (software developer), 2005 to 2007. | |
25
Name, (Year of Birth),
and Address(1) | | Position(s) and
Length of
Time Served(2) | | Principal Occupation(s)(3) | | Number of
Funds in Fund
Complex
Overseen by
Fund Trustee | | Other Directorships Held
Outside Fund Complex by
Fund Trustee(3) | |
Michael M. Knetter (1960) | | Trustee since 2007 | | President and Chief Executive Officer, University of Wisconsin Foundation, since October 2010; formerly, Dean, School of Business, University of Wisconsin - Madison; formerly, Professor of International Economics and Associate Dean, Amos Tuck School of Business - Dartmouth College, 1998 to 2002. | | | 58 | | | Board Member, American Family Insurance (a mutual company, not publicly traded), since March 2009; formerly, Trustee, Northwestern Mutual Series Fund, Inc., 2007 to 2011; formerly, Director, Wausau Paper, 2005 to 2011; formerly, Director, Great Wolf Resorts, 2004 to 2009. | |
Deborah C. McLean (1954) | | Trustee since 2015 | | Member, Circle Financial Group (private wealth management membership practice), since 2011; Managing Director, Golden Seeds LLC (an angel investing group), since 2009; Adjunct Professor, Columbia University School of International and Public Affairs, since 2008; formerly, Visiting Assistant Professor, Fairfield University, Dolan School of Business, Fall 2007; formerly, Adjunct Associate Professor of Finance, Richmond, The American International University in London, 1999 to 2007. | | | 58 | | | Board member, Norwalk Community College Foundation, since 2014; Dean's Advisory Council, Radcliffe Institute for Advanced Study, since 2014; formerly, Director and Treasurer, At Home in Darien (not-for-profit), 2012 to 2014; Director, National Executive Service Corps (not-for-profit), 2012 to 2013; Trustee, Richmond, The American International University in London, 1999 to 2013. | |
Howard A. Mileaf (1937) | | Trustee since 1999 | | Retired; formerly, Vice President and General Counsel, WHX Corporation (holding company), 1993 to 2001. | | | 58 | | | Formerly, Director, Webfinancial Corporation (holding company), 2002 to 2008; formerly, Director, WHX Corporation (holding company), 2002 to 2005; formerly, Director, State Theatre of New Jersey (not-for-profit theatre), 2000 to 2005. | |
26
Name, (Year of Birth),
and Address(1) | | Position(s) and
Length of
Time Served(2) | | Principal Occupation(s)(3) | | Number of
Funds in Fund
Complex
Overseen by Fund Trustee | | Other Directorships Held
Outside Fund Complex by
Fund Trustee(3) | |
George W. Morriss (1947) | | Trustee since 2007 | | Adjunct Professor, Columbia University School of International and Public Affairs, since October 2012; formerly, Executive Vice President and Chief Financial Officer, People's Bank, Connecticut (a financial services company), 1991 to 2001. | | | 58 | | | Director and Treasurer, National Association of Corporate Directors, Connecticut Chapter, since 2011; Trustee, Steben Alternative Investment Funds, Steben Select Multi-Strategy Fund, and Steben Select Multi-Strategy Master Fund, since 2013; formerly, Manager, Larch Lane Multi-Strategy Fund complex (which consisted of three funds), 2006 to 2011; formerly, Member, NASDAQ Issuers' Affairs Committee, 1995 to 2003. | |
Tom D. Seip (1950) | | Trustee since 2000; Chairman of the Board since 2008; formerly Lead Independent Trustee from 2006 to 2008 | | General Partner, Ridgefield Farm LLC (a private investment vehicle); formerly, President and CEO, Westaff, Inc. (temporary staffing), May 2001 to January 2002; formerly, Senior Executive, The Charles Schwab Corporation, 1983 to 1998, including Chief Executive Officer, Charles Schwab Investment Management, Inc.; Trustee, Schwab Family of Funds and Schwab Investments, 1997 to 1998; and Executive Vice President-Retail Brokerage, Charles Schwab & Co., Inc., 1994 to 1997. | | | 58 | | | Director, H&R Block, Inc. (financial services company), since May 2001; Chairman, Governance and Nominating Committee, H&R Block, Inc., since 2011; formerly, Chairman, Compensation Committee, H&R Block, Inc., 2006 to 2010; formerly, Director, Forward Management, Inc. (asset management company), 1999 to 2006. | |
James G. Stavridis (1955) | | Trustee since 2015 | | Dean, Fletcher School of Law and Diplomacy, Tufts University since 2013; formerly, Admiral, United States Navy, 2006 to 2013, including Supreme Allied Commander, NATO and Commander, European Command, 2009 to 2013, and Commander, United States Southern Command, 2006 to 2009. | | | 58 | | | Director, Utilidata Inc., since 2015; Director, BMC Software Federal, LLC, since 2014; Director, Vertical Knowledge, LLC, since 2013; formerly, Director, Navy Federal Credit Union, 2000-2002. | |
27
Name, (Year of Birth),
and Address(1) | | Position(s) and
Length of
Time Served(2) | | Principal Occupation(s)(3) | | Number of
Funds in Fund
Complex
Overseen by Fund Trustee | | Other Directorships Held
Outside Fund Complex by
Fund Trustee(3) | |
Candace L. Straight (1947) | | Trustee since 1999 | | Private investor and consultant specializing in the insurance industry; formerly, Advisory Director, Securitas Capital LLC (a global private equity investment firm dedicated to making investments in the insurance sector), 1998 to 2003. | | | 58 | | | Public Member, Board of Governors and Board of Trustees, Rutgers University, since 2011; Director, Montpelier Re Holdings Ltd. (reinsurance company), since 2006; formerly, Director, National Atlantic Holdings Corporation (property and casualty insurance company), 2004 to 2008; formerly, Director, The Proformance Insurance Company (property and casualty insurance company), 2004 to 2008; formerly, Director, Providence Washington Insurance Company (property and casualty insurance company), 1998 to 2006; formerly, Director, Summit Global Partners (insurance brokerage firm), 2000 to 2005. | |
Peter P. Trapp (1944) | | Trustee since 1984 | | Retired; formerly, Regional Manager for Mid-Southern Region, Ford Motor Credit Company, September 1997 to 2007; formerly, President, Ford Life Insurance Company, April 1995 to August 1997. | | | 58 | | | None. | |
28
Name, (Year of Birth),
and Address(1) | | Position(s) and
Length of
Time Served(2) | | Principal Occupation(s)(3) | | Number of
Funds in Fund
Complex
Overseen by Fund Trustee | | Other Directorships Held
Outside Fund Complex by
Fund Trustee(3) | |
Trustees who are "Interested Persons" | |
Joseph V. Amato* (1962) | | Trustee since 2009 | | President and Director, Neuberger Berman Group LLC, since 2009; President and Chief Executive Officer, Neuberger and Neuberger Berman Holdings LLC (including its predecessor, Neuberger Berman Inc.), since 2007; Chief Investment Officer (Equities) and Managing Director, Neuberger Berman LLC ("Neuberger Berman"), since 2009; Managing Director of NBIA (formerly Neuberger Berman Fixed Income LLC (NBFI) and including predecessor entities), since 2007; Board member of NBIA, since 2006; formerly, Global Head of Asset Management of Lehman Brothers Holdings Inc.'s ("LBHI") Investment Management Division, 2006 to 2009; formerly, member of LBHI's Investment Management Division's Executive Management Committee, 2006 to 2009; formerly, Managing Director, Lehman Brothers Inc. ("LBI"), 2006 to 2008; formerly, Chief Recruiting and Development Officer, LBI, 2005 to 2006; formerly, Global Head of LBI's Equity Sales and a Member of its Equities Division Executive Committee, 2003 to 2005. | | | 58 | | | Member of Board of Advisors, McDonough School of Business, Georgetown University, since 2001; Member of New York City Board of Advisors, Teach for America, since 2005; Trustee, Montclair Kimberley Academy (private school), since 2007; Member of Board of Regents, Georgetown University, since 2013. | |
29
Name, (Year of Birth),
and Address(1) | | Position(s) and
Length of
Time Served(2) | | Principal Occupation(s)(3) | | Number of
Funds in Fund
Complex
Overseen by Fund Trustee | | Other Directorships Held
Outside Fund Complex by
Fund Trustee(3) | |
Robert Conti* (1956) | | Chief Executive Officer, President and Trustee since 2008; prior thereto, Executive Vice President in 2008 and Vice President from 2000 to 2008 | | Managing Director, Neuberger, since 2007; President and Chief Executive Officer, Neuberger Berman, since 2008; Managing Director, NBIA, since 2009; formerly, Senior Vice President, Neuberger, 2003 to 2006; formerly, Vice President, Neuberger, 1999 to 2003; formerly, Senior Vice President, Neuberger Berman, 2000 to 2008. | | | 58 | | | Director, Staten Island Mental Health Society, since 1994; formerly, Chairman of the Board, Staten Island Mental Health Society, 2008 to 2011. | |
(1) The business address of each listed person is 605 Third Avenue, New York, New York 10158.
(2) Pursuant to the Trust's Trust Instrument, each of these Trustees shall hold office for life or until his or her successor is elected or the Trust terminates; except that (a) any Trustee may resign by delivering a written resignation; (b) any Trustee may be removed with or without cause at any time by a written instrument signed by at least two-thirds of the other Trustees; (c) any Trustee who requests to be retired, or who has become unable to serve, may be retired by a written instrument signed by a majority of the other Trustees; and (d) any Trustee may be removed at any shareholder meeting by a vote of at least two-thirds of the outstanding shares.
(3) Except as otherwise indicated, each individual has held the positions shown for at least the last five years.
* Indicates a Trustee who is an "interested person" within the meaning of the 1940 Act. Mr. Amato and Mr. Conti are interested persons of the Trust by virtue of the fact that each is an officer of Management and/or its affiliates.
† Table is as of December 31, 2015, but reflects the entity consolidation that became effective on January 1, 2016, as described on page 3 of this Annual Report.
30
Information about the Officers of the Trust†
Name, (Year of Birth),
and Address(1) | | Position(s) and
Length of Time
Served(2) | | Principal Occupation(s)(3) | |
Andrew B. Allard (1961) | | Chief Legal Officer since 2013 (only for purposes of sections 307 and 406 of the Sarbanes-Oxley Act of 2002) and Anti-Money Laundering Compliance Officer since inception | | General Counsel—Mutual Funds, and Senior Vice President, NBIA since 2013; Senior Vice President, Neuberger Berman, since 2006 and Employee since 1999; Deputy General Counsel, Neuberger Berman, since 2004; formerly, Vice President, Neuberger Berman, 2000 to 2005; formerly, Employee, NBIA, 1994 to 1999; Chief Legal Officer since 2013 (only for purposes of sections 307 and 406 of the Sarbanes-Oxley Act of 2002) ,ten registered investment companies for which NBIA acts as investment manager and administrator (ten since 2013); Anti-Money Laundering Compliance Officer, ten registered investment companies for which NBIA acts as investment manager and administrator (six since 2002, one since 2003, one since 2005, one since 2006 and one since 2013). | |
Claudia A. Brandon (1956) | | Executive Vice President since 2008 and Secretary since inception | | Senior Vice President, Neuberger Berman, since 2007 and Employee since 1999; Senior Vice President, NBIA, since 2008 and Assistant Secretary since 2004; formerly, Vice President, Neuberger Berman, 2002 to 2006; formerly, Vice President—Mutual Fund Board Relations, NBIA, 2000 to 2008; formerly, Vice President, NBIA, 1986 to 1999 and Employee 1984 to 1999; Executive Vice President, ten registered investment companies for which NBIA acts as investment manager and administrator (nine since 2008 and one since 2013); Secretary, ten registered investment companies for which NBIA acts as investment manager and administrator (three since 1985, three since 2002, one since 2003, one since 2005, one since 2006 and one since 2013). | |
Agnes Diaz (1971) | | Vice President since 2013 | | Senior Vice President, Neuberger Berman, since 2012; Employee, NBIA, since 1996; formerly, Vice President, Neuberger Berman, 2007 to 2012; Vice President, ten registered investment companies for which NBIA acts as investment manager and administrator (ten since 2013). | |
Anthony DiBernardo (1979) | | Assistant Treasurer since 2011 | | Senior Vice President, Neuberger Berman, since 2014; Employee, NBIA, since 2003; formerly, Vice President, Neuberger Berman, 2009 to 2014; Assistant Treasurer, ten registered investment companies for which NBIA acts as investment manager and administrator (nine since 2011 and one since 2013). | |
Sheila R. James (1965) | | Assistant Secretary since inception | | Vice President, Neuberger Berman, since 2008 and Employee since 1999; formerly, Assistant Vice President, Neuberger Berman, 2007; formerly, Employee, NBIA, 1991 to 1999; Assistant Secretary, ten registered investment companies for which NBIA acts as investment manager and administrator (six since 2002, one since 2003, one since 2005, one since 2006 and one since 2013). | |
31
Name, (Year of Birth),
and Address(1) | | Position(s) and
Length of Time
Served(2) | | Principal Occupation(s)(3) | |
Brian Kerrane (1969) | | Chief Operating Officer since 2015 and Vice President since 2008 | | Managing Director, Neuberger Berman, since 2014; Vice President, NBIA, since 2008 and Employee since 1991; formerly, Senior Vice President, Neuberger Berman, 2006 to 2014; Chief Operating Officer, ten registered investment companies for which NBIA acts as investment manager and administrator (ten since 2015); Vice President, ten registered investment companies for which NBIA acts as investment manager and administrator (nine since 2008 and one since 2013). | |
Kevin Lyons (1955) | | Assistant Secretary since inception | | Assistant Vice President, Neuberger Berman, since 2008 and Employee since 1999; formerly, Employee, NBIA, 1993 to 1999; Assistant Secretary, ten registered investment companies for which NBIA acts as investment manager and administrator (seven since 2003, one since 2005, one since 2006 and one since 2013). | |
Anthony Maltese (1959) | | Vice President since 2015 | | Senior Vice President, Neuberger Berman, since 2014 and Employee since 2000; Vice President, ten registered investment companies for which Management acts as investment manager and administrator (ten since 2015). | |
Owen F. McEntee, Jr. (1961) | | Vice President since 2008 | | Vice President, Neuberger Berman, since 2006; Employee, NBIA, since 1992; Vice President, ten registered investment companies for which NBIA acts as investment manager and administrator (nine since 2008 and one since 2013). | |
John M. McGovern (1970) | | Treasurer and Principal Financial and Accounting Officer since inception | | Senior Vice President, Neuberger Berman, since 2007; Employee, NBIA, since 1993; Treasurer and Principal Financial and Accounting Officer, ten registered investment companies for which NBIA acts as investment manager and administrator (eight since 2005, one since 2006 and one since 2013); formerly, Vice President, Neuberger Berman, 2004 to 2006; formerly, Assistant Treasurer, eight registered investment companies for which NBIA acts as investment manager and administrator, 2002 to 2005. | |
Frank Rosato (1971) | | Assistant Treasurer since inception | | Vice President, Neuberger Berman, since 2006; Employee, NBIA, since 1995; Assistant Treasurer, ten registered investment companies for which NBIA acts as investment manager and administrator (eight since 2005, one since 2006 and one since 2013). | |
Chamaine Williams (1971) | | Chief Compliance Officer since inception | | Senior Vice President, Neuberger Berman, since 2007; Chief Compliance Officer, NBIA, since 2006; Chief Compliance Officer, ten registered investment companies for which NBIA acts as investment manager and administrator (eight since 2005, one since 2006 and one since 2013); formerly, Senior Vice President, LBI, 2007 to 2008; formerly, Vice President, LBI, 2003 to 2006; formerly, Chief Compliance Officer, Lehman Brothers Asset Management Inc., 2003 to 2007; formerly, Chief Compliance Officer, Lehman Brothers Alternative Investment Management LLC, 2003 to 2007. | |
(1) The business address of each listed person is 605 Third Avenue, New York, New York 10158.
(2) Pursuant to the By-Laws of the Trust, each officer elected by the Fund Trustees shall hold office until his or her successor shall have been elected and qualified or until his or her earlier death, inability to serve, or resignation. Officers serve at the pleasure of the Fund Trustees and may be removed at any time with or without cause.
(3) Except as otherwise indicated, each individual has held the positions shown for at least the last five years.
† Table is as of December 31, 2015, but reflects the entity consolidation that became effective on January 1, 2016, as described on page 3 of this Annual Report.
32
Proxy Voting Policies and Procedures
A description of the policies and procedures that the Trust uses to determine how to vote proxies relating to portfolio securities is available, without charge, by calling 800-877-9700 (toll-free) and on the Securities and Exchange Commission's website, at www.sec.gov. Information regarding how the Trust voted proxies relating to portfolio securities during the most recent 12-month period ended June 30 is also available upon request, without charge, by calling 800-877-9700 (toll-free), on the Securities and Exchange Commission's website at www.sec.gov, and on Management's website at www.nb.com.
Quarterly Portfolio Schedule
The Trust files a complete schedule of portfolio holdings for the Fund with the Securities and Exchange Commission for the first and third quarters of each fiscal year on Form N-Q. The Trust's Forms N-Q are available on the Securities and Exchange Commission's website at www.sec.gov and may be reviewed and copied at the Securities and Exchange Commission's Public Reference Room in Washington, DC. Information on the operation of the Public Reference Room may be obtained by calling 800-SEC-0330. The information on Form N-Q is available upon request, without charge, by calling 800-877-9700 (toll free).
Board Consideration of the Management and Sub-Advisory Agreements
On an annual basis, the Board of Trustees ("Board") of Neuberger Berman Advisers Management Trust ("Trust"), including the Trustees who are not "interested persons" of Neuberger Berman Management LLC ("Management") (including its affiliates) or the Trust ("Independent Fund Trustees"), considers whether to continue the management agreement with Management (the "Management Agreement") and the separate sub-advisory agreement between Management and Neuberger Berman LLC ("Neuberger") (the "Sub-Advisory Agreement" and collectively with the Management Agreement, the "Agreements") for Mid Cap Growth Portfolio (the "Fund"). Throughout the process, the Independent Fund Trustees are advised by counsel that is experienced in Investment Company Act of 1940 matters and that is independent of Management ("Independent Counsel"). At a meeting held on September 8, 2015, the Board, including the Independent Fund Trustees, approved the continuation of the Agreements for the Fund.
In evaluating the Agreements, the Board, including the Independent Fund Trustees, reviewed extensive materials provided by Management in response to questions submitted by the Independent Fund Trustees and Independent Counsel, and met with senior representatives of Management regarding its personnel, operations and financial condition as they relate to the Fund. The annual contract review extends over at least two regular meetings of the Board to ensure that Management and Neuberger have time to respond to any questions the Independent Fund Trustees may have on their initial review of the materials and that the Independent Fund Trustees have time to consider those responses.
In connection with its deliberations, the Board also considered the broad range of information relevant to the annual contract review that is provided to the Board (including its various standing committees) at meetings throughout the year, including investment performance reports and related portfolio information for the Fund, as well as periodic reports on, among other matters, pricing and valuation; brokerage and execution; compliance; and shareholder and other services provided by Management, Neuberger, and their affiliates. To assist the Board in its deliberations regarding the annual contract review, the Board has established a Contract Review Committee comprised of Independent Fund Trustees. The Board has also established other committees that focus throughout the year on specific areas relevant to the annual contract review, such as Fund performance or compliance matters, and that are charged with specific responsibilities regarding the annual contract review.
The Independent Fund Trustees received from Independent Counsel a memorandum discussing the legal standards for their consideration of the proposed continuation of the Agreements. During the course of the year and during their deliberations regarding the annual contract review, the Contract Review Committee and the Independent Fund Trustees met with Independent Counsel separately from representatives of Management and Neuberger.
33
In connection with its approval of the continuation of the Agreements, the Board evaluated the terms of the Agreements, the overall fairness of the Agreements to the Fund and whether the Agreements were in the best interests of the Fund and its shareholders. The Board considered all factors it deemed relevant with respect to the Fund, including the following factors: (1) the nature, extent, and quality of the services provided by Management and Neuberger; (2) the investment performance of the Fund compared to an appropriate market index and a peer group of investment companies; (3) the costs of the services provided and the profit or loss realized by Management and its affiliates from their relationship with the Fund; (4) the extent to which economies of scale have been or might be realized as the Fund grows; and (5) whether fee levels reflect any such potential economies of scale for the benefit of the Fund's shareholders. The Board's determination to approve the continuation of the Agreements was based on a comprehensive consideration of all information provided to the Board throughout the year and specifically in connection with the annual contract review. The Board members did not identify any particular information or factor that was all-important or controlling, and each Trustee may have attributed different weights to the various factors. The Board focused on the overall costs and benefits of the Agreements to the Fund and, through the Fund, its shareholders.
With respect to the nature, extent and quality of the services provided, the Board considered the investment philosophy and decision-making processes of Management and Neuberger, and the qualifications, experience, and capabilities of, and the resources available to, the portfolio management personnel of Management and Neuberger who perform services for the Fund. The Board noted that Management also provides certain administrative services, including fund accounting and compliance oversight. The Board also considered Management's and Neuberger's policies and practices regarding brokerage and allocation of portfolio transactions and reviewed the quality of the execution services that Management had provided. The Board also reviewed whether Management and Neuberger used brokers to execute Fund transactions that provide research and other services to Management or Neuberger and the types of benefits potentially derived from such services by Management, Neuberger, the Fund and other clients of Management and Neuberger. The Board also considered that Management's responsibilities include daily management of investment, operational, enterprise, legal, regulatory and compliance risks as they relate to the Fund, and considered information regarding Management's processes for managing risk. In addition, the Board noted the positive compliance history of Management and Neuberger, as no significant compliance problems were reported to the Board with respect to either firm. The Board also considered the general structure of the portfolio manager compensation program and whether this structure provides appropriate incentives to act in the best interests of the Fund.
As in past years, the Board also considered the manner in which Management addressed various non-routine matters that arose during the year, some of them a result of developments in the broader fund industry or the regulations governing it. In addition, the Board considered actions taken by Management and Neuberger in response to recent market conditions, such as regulatory concerns about current trading and market liquidity issues and potential volatility, and considered the overall performance of Management and Neuberger in this context.
The Board factored into its evaluation of the Fund's fees and performance a consideration of the limitations inherent in the methodology for constructing peer groups and determining which investment companies should be included in the peer groups. The Board considered a peer group composed of two types of funds: proprietary funds that are operated by insurance companies or their affiliates, and non-proprietary funds, such as the Fund, operated for insurance company investors by independent investment managers.
With respect to investment performance, the Board considered information regarding the Fund's short, intermediate and long-term performance both on an absolute basis and relative to an appropriate benchmark and the average performance of a composite peer group (as constructed by an independent organization) of investment companies pursuing broadly similar strategies. The Board also reviewed performance in relation to certain measures of the degree of investment risk undertaken by the portfolio manager. The Board considered that as compared to its peer group, the Fund's performance was lower than the median for the one and three-year periods and higher than the median for the five and ten-year periods. The Board also considered that the Fund's performance was lower than its benchmark for the one, three, five and ten-year periods. The Board discussed with Management the Fund's performance and steps that Management had taken, or intended to take, to improve performance. In this regard, the Board noted that performance, especially short-term performance, is only one of the factors that it deems relevant to its consideration of the Fund's Agreements and that, after
34
considering all relevant factors, it may be appropriate to approve the continuation of the Agreements notwithstanding the Fund's performance.
With respect to the overall fairness of the Agreements, the Board considered the fee structure for the Fund under the Agreements as compared to the peer group. The Board also considered any fall-out benefits likely to accrue to Management, Neuberger or their affiliates from their relationship with the Fund. The Board also considered the profitability of Management and its affiliates from their association with the Fund, and year-over-year changes in each of Management's reported expense categories.
The Board reviewed a comparison of the Fund's management fee and overall expense ratio to the peer group and was aware that non-proprietary insurance product funds generally have higher fee structures than proprietary funds. The Board noted that the comparative management fee analysis includes, in the Fund's management fee, the separate administrative fee paid to Management, but it was not clear whether this was the case for all funds in the peer group. The Board considered the mean and median of the management fees and overall expense ratios of the peer group. In addition, the Board considered the contractual limit on expenses of certain classes of the Fund.
The Board considered that, for the Fund's S Class shares, as compared to its peer group, the Fund's contractual management fee and the actual management fee net of fees waived by Management were both higher than the median. The Board looked at the S Class as a proxy for both of the Fund's classes. The Board considered whether specific portfolio management, administration or oversight needs contributed to the management fee. The Board also noted that the Fund's size, which impacts its expenses and performance, has been affected by ongoing changes in the insurance market.
The Board also considered whether there were other funds or separate accounts that were advised or sub-advised by Management or its affiliates with investment objectives, policies and strategies that were similar to those of the Fund. The Board compared the fees charged to the Fund to the fees charged to such funds and/or separate accounts. The Board considered the appropriateness and reasonableness of any differences between the fees charged to the Fund and such funds and/or separate accounts, including any breakpoints, and determined that differences in fees and fee structures were consistent with the management and other services provided.
The Board also evaluated any apparent or anticipated economies of scale in relation to the services Management provides to the Fund. The Board considered that the Fund's fee structure provides for a reduction of payments resulting from the use of breakpoints and whether those breakpoints are set at appropriate asset levels. In concluding that the benefits accruing to Management and its affiliates by virtue of their relationship with the Fund were reasonable in light of the costs of providing the investment advisory and other services and the benefits accruing to the Fund, the Board reviewed specific data as to Management's profit on the Fund for a recent period. The Board also considered Management's cost allocation methodology. The Board recognized that Management and Neuberger should be entitled to earn a reasonable level of profits for services they provide to the Fund and, based on its review, concluded that Management's and Neuberger's reported level of profitability on the Fund was reasonable.
Conclusions
In approving the continuation of the Agreements, the Board concluded that the terms of each Agreement are fair and reasonable to the Fund and that approval of the continuation of the Agreements is in the best interests of the Fund and its shareholders. In reaching this determination, the Board considered that Management and Neuberger could be expected to provide a high level of service to the Fund; regarding the Fund's underperformance, that it retained confidence in Management's and Neuberger's capabilities to manage the Fund; that the Fund's fee structure appeared to the Board to be reasonable given the nature, extent and quality of services provided; and that the benefits accruing to Management and its affiliates by virtue of their relationship with the Fund were reasonable in light of the costs of providing the investment advisory and other services and the benefits accruing to the Fund. The Board's conclusions may be based in part on its consideration of materials prepared in connection with the approval or continuance of the Agreements in prior years and on the Board's ongoing regular review of Fund performance and operations throughout the year, in addition to material prepared specifically for the most recent annual review of the Agreements.
35
On December 15, 2015, the Board, including the Independent Trustees, unanimously approved a novation of the Agreements in connection with a reorganization of Management and Neuberger into a new entity, Neuberger Berman Investment Advisers LLC, after receiving assurances that (1) the reorganization would not result in a change of actual control or management of the advisory organizations and (2) the reorganization would not result in a change in the nature or quality of the services provided to the Fund.
Notice to Shareholders
The Fund designates $26,472,577 as a capital gain distribution.
36