Arthur C. Delibert, Esq.
1601 K Street, N.W.
Washington, D.C. 20006-1600
Form N-CSR is to be used by management investment companies to file reports with the Commission not later than 10 days after the transmission to stockholders of any report that is required to be transmitted to stockholders under Rule 30e-1 under the Investment Company Act of 1940, as amended (“Act”) (17 CFR 270.30e-1). The Commission may use the information provided on Form N-CSR in its regulatory, disclosure review, inspection, and policymaking roles.
A registrant is required to disclose the information specified by Form N-CSR, and the Commission will make this information public. A registrant is not required to respond to the collection of information contained in Form N-CSR unless the Form displays a currently valid Office of Management and Budget (“OMB”) control number. Please direct comments concerning the accuracy of the information collection burden estimate and any suggestions for reducing the burden to the Secretary, Securities and Exchange Commission, 100 F Street, NE,
Washington, DC 20549 0609. The OMB has reviewed this collection of information under the clearance requirements of 44 U.S.C. §3507.
Item 1. Report to Shareholders.
Following are copies of the annual reports transmitted to shareholders pursuant to Rule 30e-1 under the Act.

Neuberger Berman
Advisers Management Trust
Absolute Return
Multi-Manager Portfolio
S Class Shares
Annual Report
December 31, 2016
Absolute Return Multi-Manager Portfolio Commentary (Unaudited)
The Neuberger Berman Advisers Management Trust Absolute Return Multi-Manager Portfolio Class S posted a –0.65% total return for the 12 months ended December 31, 2016, underperforming its primary benchmark, the HFRX Global Hedge Fund Index, which returned 2.50% for the same period. (Performance for all benchmarks is provided in the table following this letter.)
Equity markets declined sharply to start the year and then rallied strongly, led by the U.S., as developed markets generally outperformed emerging markets. Meanwhile, U.S. Treasury yields followed a similar path, moving higher following the Trump victory. The U.S. dollar materially strengthened in 2016, most notably versus the yen and euro. Energy prices recovered, particularly following the decision by Organization of the Petroleum Exporting Countries (OPEC) to cut output.
Gains from the Portfolio's allocation to merger arbitrage/event driven, credit and long/short equity strategies were offset by losses from the allocation to managed futures strategies.
Gains from the allocation to merger arbitrage/event driven strategies were driven primarily by spread tightening for a number of deals that successfully closed in 2016. This offset smaller losses from a few deals that broke and where, in hindsight, the Portfolio's positions were sized appropriately, in our opinion.
Positive contributions from the corporate credit long/short strategy were driven by long positions in bank loans and bonds, which outpaced losses from short positions and hedges.
The allocation to long/short equity strategies was up for the year despite struggling during the first quarter equity market selloff and the fourth quarter sector rotation. Gains from long positions outpaced losses from short positions.
The managed futures allocation detracted for the year. Gains from interest rate positioning were offset by losses from commodity, equity and currency trading.
The subadvisers' aggregate use of swaps, forwards, futures and options detracted from performance during the reporting period.
Looking ahead, we believe we have positioned the Portfolio to potentially benefit from a number of factors that we anticipate will dominate markets, particularly those related to rising interest rates. Broadly speaking, rising rates have historically been a significant headwind for fixed income and a tailwind for hedge fund strategies we typically utilize. We believe factors such as rising rates and higher growth in the U.S. on the one hand and monetary easing and slow growth in areas of Europe and Asia on the other hand have the potential to induce elevated volatility, if as we expect, these trends continue. This backdrop has historically been beneficial to managed futures strategies. From a spread perspective, if the so-called risk-free rate increases in accordance with policies that the U.S. Federal Reserve recently laid out, we would anticipate seeing wider and therefore more attractive spreads across the board. Finally, we believe that the long/short equity allocation has the potential to benefit from both longs and shorts without taking aggressive directional market views, as we think dispersion may rise in a new political and policy era.
Sincerely,
David Kupperman And Jeff Majit
Portfolio Managers
Information about principal risks of investing in the Fund is set forth in the prospectus and statement of additional information.
The portfolio composition, industries and holdings of the Fund are subject to change without notice.
The opinions expressed are those of the Fund's portfolio managers and subadvisers. The opinions are as of the date of this report, and are subject to change without notice.
1
Absolute Return Multi-Manager Portfolio (Unaudited)
PORTFOLIO BY TYPE OF SECURITY
(as a % of Total Net Assets) | |
| | | Long | | Short | |
Common Stocks | | | 50.6 | % | | | (18.0 | )% | |
Convertible Bonds | | | 1.0 | | | | — | | |
Corporate Bonds | | | 5.3 | | | | (2.5 | ) | |
Exchange Traded Funds | | | — | | | | (2.8 | ) | |
Exchange Traded Note | | | — | | | | (0.3 | ) | |
Loan Assignments | | | 7.4 | | | | — | | |
Master Limited Partnerships | | | 4.6 | | | | (0.8 | ) | |
Options Purchased | | | 0.0 | | | | — | | |
Rights | | | 0.1 | | | | — | | |
U.S. Treasury Obligations | | | 0.2 | | | | — | | |
Warrants | | | 0.0 | | | | — | | |
Short-Term Investments | | | 28.1 | | | | — | | |
Other Assets Less Liabilities | | | 27.1 | * | | | — | | |
Total | | | 124.4 | % | | | (24.4 | )% | |
* Percentage includes appreciation/depreciation from derivatives, if any.
PERFORMANCE HIGHLIGHTS3
| | | Inception | | Average Annual Total Return
Ended 12/31/2016 | |
| | | Date | | 1-Year | | Life of Fund | |
Absolute Return Multi-Manager
Portfolio Class S | | |
05/01/2014 | | | | –0.65 | % | | | –2.16 | % | |
| HFRX Global Hedge Fund Index1,2,* | | | | | 2.50 | % | | | –0.82 | % | |
| HFRX Absolute Return Index1,2 | | | | | 0.31 | % | | | 1.08 | % | |
| S&P 500® Index1,2 | | | | | 11.96 | % | | | 8.97 | % | |
Bloomberg Barclays U.S. Aggregate
Bond Index1,2 | | | | | | | 2.65 | % | | | 2.38 | % | |
The performance data quoted represent past performance and do not indicate future results. Current performance may be lower or higher than the performance data quoted. For performance data current to the most recent month-end, please visit http://www.nb.com/amtportfolios/performance.
The results shown in the table reflect the reinvestment of income dividends and other distributions, if any. The results do not reflect the effect of taxes a shareholder would pay on Fund distributions or on the redemption of Fund shares. The results do not reflect fees and expenses of the variable annuity and variable life insurance policies or the qualified pension and retirement plans whose proceeds are invested in the Fund.
The investment return and principal value of an investment will fluctuate and shares, when redeemed, may be worth more or less than their original cost.
* The Fund's primary benchmark changed during the reporting period; the prior benchmark was the HFRX Absolute Return Index. The benchmark was modified because the HFRX Global Hedge Fund Index is believed to be a fairer representation of the Fund's investment universe.
Returns would have been lower if Neuberger Berman Investment Advisers LLC ("Management") had not reimbursed certain expenses and/or waived a portion of the investment management fees during certain of the periods shown. Repayment by a class
(of expenses previously reimbursed and/or fees previously waived by Management) will decrease the class's returns. Please see Note B in the Notes to Financial Statements for specific information regarding expense reimbursement and/or fee waiver arrangements.
As stated in the Fund's most recent prospectus, the total annual operating expense ratio for fiscal year 2015 was 7.24% for Class S shares (before expense reimbursements and/or fee waivers, if any). The expense ratio was 3.26% for Class S shares after expense reimbursements and/or fee waivers. The expense ratios for the annual period ended December 31, 2016 can be found in the Financial Highlights section of this report.
COMPARISON OF A $10,000 INVESTMENT
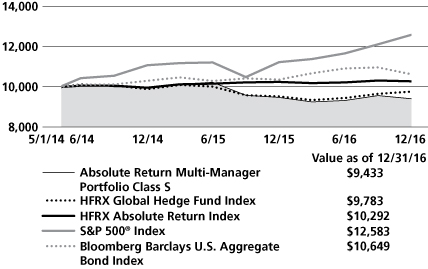
This graph shows the change in value of a hypothetical $10,000 investment in the Fund over the past 10 fiscal years, or since the Fund's inception if it has not operated for 10 years. The result is compared with benchmarks, which include a broad-based market index and may include a more narrowly based index. The S&P 500® and Bloomberg Barclays U.S. Aggregate Bond indices do not take into account any fees, expenses or tax consequences of investing in the individual securities they track. The HFRX Absolute Return Index and HFRX Global Hedge Fund Index do take into account fees and expenses of investing since it is based on the underlying hedge funds' net returns. The results shown in the graph reflect the reinvestment of income dividends and other distributions, if any. The results do not reflect the effect of taxes a shareholder would pay on Fund distributions or on the redemption of Fund shares. The results do not reflect fees and expenses of the variable annuity and variable life insurance policies or the qualified pension and retirement plans whose proceeds are invested in the Fund. Results represent past performance and do not indicate future results.
Please see Endnotes for additional information.
2
1 The date used to calculate Life of Fund performance for the index is May 1, 2014, the Fund's commencement of operations.
2 The HFRX Global Hedge Fund Index is designed to be representative of the overall composition of the hedge fund universe. It is comprised of all eligible hedge fund strategies; including but not limited to convertible arbitrage, distressed securities, equity hedge, equity market neutral, event driven, macro, merger arbitrage, and relative value arbitrage. The strategies are asset weighted based on the distribution of assets in the hedge fund industry. The HFRX Absolute Return Index is designed to be representative of the overall composition of the hedge fund universe. The index comprises all eligible hedge fund strategies including, but not limited to, convertible arbitrage, distressed securities, equity hedge, equity market neutral, event driven, macro, merger arbitrage, and relative value arbitrage. The index employs a constituent weighting methodology that selects constituent funds which characteristically exhibit lower volatilities and lower correlations to standard directional benchmarks of equity market and hedge fund industry performance. Constituent funds for each HFRX Index are selected from an eligible pool of the more than 7,500 funds worldwide that report to the Hedge Fund Research (HFR) Database. Constituent funds must meet all of the following criteria: report monthly; report performance net of all fees; be U.S. dollar-denominated; be active and accepting new investments; have a minimum 24 months track record; and the fund's manager must have at least $50 million in assets under management. Each HFRX Index is rebalanced quarterly. The S&P 500® Index is a float-adjusted market capitalization-weighted index that focuses on the large-cap segment of the U.S. equity market, and includes a significant portion of the total value of the market. The Bloomberg Barclays U.S. Aggregate Bond Index measures the investment grade, U.S. dollar-denominated, fixed-rate, taxable bond market and includes Treasuries, government-related and corporate securities, mortgage-backed securities (MBS) (agency fixed-rate and hybrid adjustable rate mortgage (ARM) pass-throughs), asset-backed securities (ABS), and commercial mortgage-backed securities (CMBS) (agency and non-agency). On August 24, 2016, Bloomberg acquired the Barclays fixed income benchmark indices from Barclays. Barclays and Bloomberg have agreed to co-brand the indices as the Bloomberg Barclays Indices for an initial term of five years. For more information, please visit www.bloombergindices.com/. Please note that individuals cannot invest directly in any index. The S&P 500 and the Bloomberg Barclays U.S. Aggregate Bond indices do not take into account any fees, expenses or tax consequences of investing in the individual securities that they track. The HFRX Absolute Return Index and HFRX Global Hedge Fund Index do take into account fees and expenses of investing since each is based on the underlying hedge funds' net returns. Data about the performance of an index are prepared or obtained by Neuberger Berman Investment Advisers LLC* ("Management") and reflect the reinvestment of income dividends and other distributions, if any. The Fund may invest in securities not included in a described index and generally does not invest in all securities included in a described index.
3 The Fund was relatively small prior to December 31, 2014, which could have impacted Fund performance. The same techniques used to produce returns in a small fund may not work to produce similar returns in a larger fund.
* On January 1, 2016, Neuberger Berman Management LLC ("NBM") transferred to Neuberger Berman Fixed Income LLC ("NBFI") their rights and obligations pertaining to all services they provided to any Fund under any investment management, investment sub-advisory, and/or administration agreement, as applicable (the "Agreements"). Following such transfer, NBFI was renamed Neuberger Berman Investment Advisers LLC ("NBIA" or "Management"). In addition, on the date of the transfer, the services previously provided by NB Alternative Investment Management LLC ("NBAIM") are provided by NBIA. Following the consolidation, the investment professionals of NBM and NBAIM who provided services to any Fund under the Agreements continue to provide the same services, except that they provide those services in their new capacities as investment professionals of NBIA. Further, the consolidation did not result in any change in the investment processes employed by any Fund, the nature or level of services provided to any Fund, or the fees any Fund pays under its Agreements.
3
On July 1, 2016, NBM was reorganized into "Neuberger Berman" (the "Reorganization"). Upon the completion of the Reorganization, Neuberger Berman assumed all rights and obligations pertaining to all services NBM provided to any Fund under any distribution agreement or distribution and services agreement (the "Agreements") or plan adopted pursuant to Rule 12b-1 under the Investment Company Act of 1940, as amended, (the "Plans"). Accordingly, after the Reorganization, Neuberger Berman became each Fund's distributor and the services previously provided by NBM under the Agreements and Plans are provided by Neuberger Berman.
Following the Reorganization, the employees of NBM provide the same services to each Fund under the Agreements and Plans, except that they provide those services in their capacities as employees of Neuberger Berman. Further, the Reorganization did not result in any change in the nature or level of services provided to each Fund, or the fees, if any, each Fund pays under the Agreements or the Plans.
Please note, effective July 1, 2016, Neuberger Berman Management LLC was reorganized with and into Neuberger Berman LLC, a registered broker-dealer, Member FINRA and the Fund's distributor, which changed its name to Neuberger Berman BD LLC on January 1, 2017.
The investments for the Fund are managed by the same portfolio manager(s) and subadvisers who manage one or more other registered funds that have names, investment objectives and investment styles that are similar to those of the Fund.
You should be aware that the Fund is likely to differ from those other mutual fund(s) in size, cash flow pattern and tax matters. Accordingly, the holdings and performance of the Fund can be expected to vary from those of the other mutual fund(s).
Shares of the separate Neuberger Berman Advisers Management Trust Portfolios, including the Fund, are not available to the general public. Shares of the Fund may be purchased only by life insurance companies to be held in their separate accounts, which fund variable annuity and variable life insurance policies, and by qualified pension and retirement plans.
Statistics and projections in this report are derived from sources deemed to be reliable but cannot be regarded as a representation of future results of the Fund. This report is prepared for the general information of shareholders and is not an offer of shares of the Fund. Shares are sold only through the currently effective prospectus, which must precede or accompany this report.
The "Neuberger Berman" name and logo and "Neuberger Berman Investment Advisers LLC" are registered service marks of Neuberger Berman Group LLC. The individual Fund name in this piece is either a service mark or registered service mark of Neuberger Berman Investment Advisers LLC , an affiliate of Neuberger Berman BD LLC, distributor, member FINRA. © 2017 Neuberger Berman BD LLC. All rights reserved.
4
Information About Your Fund's Expenses (Unaudited)
As a Fund shareholder, you incur two types of costs: (1) transaction costs such as fees and expenses that are, or may be, imposed under your variable contract or qualified pension plan; and (2) ongoing costs, including management fees, distribution and/or service (12b-1) fees (if applicable), and other Fund expenses. This example is intended to help you understand your ongoing costs (in U.S. dollars) of investing in the Fund and compare these costs with the ongoing costs of investing in other mutual funds.
This table is designed to provide information regarding costs related to your investments. The following examples are based on an investment of $1,000 made at the beginning of the six month period ended December 31, 2016 and held for the entire period. The table illustrates the Fund's costs in two ways:
Actual Expenses and Performance: | | The first section of the table provides information about actual account values and actual expenses in dollars, based on the Fund's actual performance during the period indicated. You may use the information in this line, together with the amount you invested, to estimate the expenses you paid over the period. Simply divide your account value by $1,000 (for example, an $8,600 account value divided by $1,000 = 8.6), then multiply the result by the number in the first section of the table under the heading entitled "Expenses Paid During the Period" to estimate the expenses you paid over the period. | |
Hypothetical Example for
Comparison Purposes: | | The second section of the table provides information about hypothetical account values and hypothetical expenses based on the Fund's actual expense ratio and an assumed rate of return at 5% per year before expenses. This return is not the Fund's actual return. The hypothetical account values and expenses may not be used to estimate the actual ending account balance or expenses you paid for the period. You may use this information to compare the ongoing costs of investing in this Fund versus other funds. To do so, compare the expenses shown in this 5% hypothetical example with the 5% hypothetical examples that appear in the shareholder reports of other funds. | |
Please note that the expenses in the table are meant to highlight your ongoing costs only and do not include any transaction costs, such as fees and expenses that are, or may be, imposed under your variable contract or qualified pension plan. Therefore, the information under the heading "Hypothetical (5% annual return before expenses)" is useful in comparing ongoing costs only, and will not help you determine the relative total costs of owning different funds. In addition, if these transaction costs were included, your costs would have been higher.
NEUBERGER BERMAN ADVISERS MANAGEMENT TRUST ABSOLUTE RETURN MULTI-MANAGER PORTFOLIO
Actual | | Beginning Account
Value
7/1/2016 | | Ending Account
Value
12/31/2016 | | Expenses Paid
During the Period
7/1/2016 – 12/31/2016 | |
Class S | | $ | 1,000.00 | | | $ | 1,009.70 | | | $ | 16.37 | * | |
Hypothetical (5% annual return before expenses) | |
Class S | | $ | 1,000.00 | | | $ | 1,008.85 | | | $ | 16.36 | ** | |
* Expenses are equal to the annualized expense ratio of 3.24%, multiplied by the average account value over the period, multiplied by 184/366 (to refelect the one-half year period shown).
** Hypothetical expenses are equal to the annualized expense ratio of 3.24%, multiplied by the average account value over the period (assuming a 5% annual return), multiplied by 184/366 (to reflect the one-half year period shown).
5
Schedule of Investments Absolute Return Multi-Manager Portfolio December 31, 2016
SHARES | | | | VALUE | |
Long Positions 97.3% | | | |
Common Stocks 50.6% | | | |
Air Freight & Logistics 0.4% | | | |
| | 325 | | | FedEx Corp.(a) | | $ | 60,515 | | |
Banks 0.5% | | | |
| | 3,842 | | | Barclays plc (United Kingdom)(a) | | | 10,580 | | |
| | 900 | | | Cascade Bancorp* | | | 7,308 | | |
| | 930 | | | PrivateBancorp, Inc.(b) | | | 50,397 | | |
| | 229 | | | Societe Generale SA (France)(a) | | | 11,268 | | |
| | | | 79,553 | | |
Biotechnology 2.5% | | | |
| | 475 | | | Alexion Pharmaceuticals, Inc.*(a) | | | 58,116 | | |
| | 1,574 | | | Clovis Oncology, Inc.*(a) | | | 69,917 | | |
| | 576 | | | Incyte Corp.*(a) | | | 57,756 | | |
| 4,066 | | | Ironwood Pharmaceuticals,
Inc.*(a) | | | 62,169 | | |
| | 329 | | | Shire plc, ADR(a) | | | 56,055 | | |
| | 472 | | | TESARO, Inc.*(a) | | | 63,475 | | |
| | | | 367,488 | | |
Building Products 0.6% | | | |
| 2,199 | | | Johnson Controls
International plc(a) | | | 90,577 | | |
| Capital Markets 0.0%(c) | | | |
| 3,261 | | | Aretec Group, Inc.,
Class A*(d)(e)(f) | | | — | | |
| | 25 | | | Intertrust NV (Netherlands)(a)(g) | | | 440 | | |
| | | | 440 | | |
Chemicals 2.8% | | | |
| | 515 | | | Air Products & Chemicals, Inc.(a) | | | 74,067 | | |
| | 3,040 | | | Canexus Corp. (Canada)* | | | 3,691 | | |
| | 1,282 | | | Chemtura Corp.*(a) | | | 42,562 | | |
| 329 | | | Croda International plc
(United Kingdom)(a) | | | 12,959 | | |
| | 200 | | | Monsanto Co.(b) | | | 21,042 | | |
| | 545 | | | PPG Industries, Inc.(a) | | | 51,644 | | |
| 900 | | | Syngenta AG, ADR
(Switzerland)(b) | | | 71,145 | | |
| | 700 | | | Valspar Corp. (The)(b) | | | 72,527 | | |
| | 755 | | | WR Grace & Co.(a) | | | 51,068 | | |
| | | | 400,705 | | |
Commercial Services & Supplies 0.2% | | | |
| | 275 | | | G&K Services, Inc., Class A | | | 26,524 | | |
Communications Equipment 1.2% | | | |
| 2,400 | | | Brocade Communications
Systems, Inc.(a) | | | 29,976 | | |
SHARES | | | | VALUE | |
| | 100 | | | Digi International, Inc.*(b) | | $ | 1,375 | | |
| | 770 | | | Harris Corp.(a) | | | 78,902 | | |
| | 450 | | | Palo Alto Networks, Inc.*(a) | | | 56,272 | | |
| | | | 166,525 | | |
Construction Materials 0.6% | | | |
| | 2,242 | | | Forterra, Inc.* | | | 48,562 | | |
| | 600 | | | Headwaters, Inc.* | | | 14,112 | | |
| 220 | | | HeidelbergCement AG
(Germany)(a) | | | 20,525 | | |
| | | | 83,199 | | |
Containers & Packaging 0.3% | | | |
| | 175 | | | AEP Industries, Inc.(b) | | | 20,317 | | |
| | 283 | | | Ball Corp.(a) | | | 21,245 | | |
| | | | 41,562 | | |
Diversified Consumer Services 0.5% | | | |
| | 725 | | | Apollo Education Group, Inc.*(b) | | | 7,177 | | |
| | 2,500 | | | LifeLock, Inc.*(b) | | | 59,800 | | |
| | | | 66,977 | | |
Diversified Financial Services 0.5% | | | |
| | 6,200 | | | Pace Holdings Corp.*(a) | | | 66,650 | | |
Diversified Telecommunication
Services 0.2% | | | |
| | 325 | | | Inteliquent, Inc.(b) | | | 7,449 | | |
| | 350 | | | Level 3 Communications, Inc.*(b) | | | 19,726 | | |
| | | | 27,175 | | |
Electric Utilities 1.5% | | | |
| | 198 | | | ALLETE, Inc. | | | 12,710 | | |
| | 497 | | | Great Plains Energy, Inc. | | | 13,593 | | |
| | 912 | | | NextEra Energy, Inc.(a) | | | 108,947 | | |
| | 543 | | | PG&E Corp. | | | 32,998 | | |
| | 800 | | | Westar Energy, Inc.(b) | | | 45,080 | | |
| | | | 213,328 | | |
Electronic Equipment, Instruments &
Components 0.1% | | | |
| 200 | | | Axis Communications AB
(Sweden)(a) | | | 7,477 | | |
| | 600 | | | InvenSense, Inc.* | | | 7,674 | | |
| | | | 15,151 | | |
Energy Equipment & Services 0.1% | | | |
| | 200 | | | Seventy Seven Energy, Inc.*(b) | | | 9,000 | | |
| | 196 | | | US Silica Holdings, Inc. | | | 11,109 | | |
| | | | 20,109 | | |
See Notes to Financial Statements
6
Schedule of Investments Absolute Return Multi-Manager Portfolio (cont'd)
SHARES | | | | VALUE | |
Equity Real Estate Investment
Trusts (REITs) 0.2% | | | |
| | 3,038 | | | New York REIT, Inc.(a) | | $ | 30,745 | | |
Food & Staples Retailing 1.0% | | | |
| 381 | | | Cia Brasileira de Distribuicao,
ADR (Brazil)(a) | | | 6,306 | | |
| | 375 | | | Magnit PJSC, GDR (Russia)(a) | | | 16,556 | | |
| | 9,950 | | | Rite Aid Corp.*(b) | | | 81,988 | | |
| 4,588 | | | Wal-Mart de Mexico SAB de CV
(Mexico)(a) | | | 8,200 | | |
| 942 | | | X5 Retail Group NV, GDR
(Russia)*(a) | | | 30,568 | | |
| | | | 143,618 | | |
Food Products 1.5% | | | |
| | 2,650 | | | Flowers Foods, Inc. | | | 52,920 | | |
| | 717 | | | Mead Johnson Nutrition Co.(a) | | | 50,735 | | |
| | 1,950 | | | WhiteWave Foods Co. (The)*(b) | | | 108,420 | | |
| | | | 212,075 | | |
Gas Utilities 0.1% | | | |
| | 241 | | | Atmos Energy Corp. | | | 17,870 | | |
Health Care Equipment & Supplies 4.1% | | | |
| | 1,625 | | | Alere, Inc.*(a) | | | 63,326 | | |
| | 2,622 | | | Boston Scientific Corp.*(a) | | | 56,714 | | |
| | 276 | | | CR Bard, Inc. | | | 62,006 | | |
| | 542 | | | Edwards Lifesciences Corp.*(a) | | | 50,785 | | |
| | 1,440 | | | Hologic, Inc.* | | | 57,773 | | |
| | 764 | | | ResMed, Inc. | | | 47,406 | | |
| 207 | | | Smith & Nephew plc
(United Kingdom)(a) | | | 3,115 | | |
| | 1,650 | | | St Jude Medical, Inc.(b) | | | 132,314 | | |
| | 665 | | | STERIS plc(a) | | | 44,814 | | |
| | 225 | | | Vascular Solutions, Inc.*(b) | | | 12,623 | | |
| | 620 | | | Zimmer Biomet Holdings, Inc. | | | 63,984 | | |
| | | | 594,860 | | |
Health Care Providers & Services 1.4% | | | |
| | 313 | | | Humana, Inc.(b) | | | 63,861 | | |
| 447 | | | Laboratory Corp. of America
Holdings*(a) | | | 57,386 | | |
| 2,995 | | | Shanghai Pharmaceuticals
Holding Co. Ltd., Class H
(China)(a) | | | 6,836 | | |
| 1,681 | | | Sinopharm Group Co. Ltd.,
Class H (China)(a) | | | 6,889 | | |
| | 1,275 | | | Team Health Holdings, Inc.*(b) | | | 55,399 | | |
| | 1,830 | | | Universal American Corp.*(b) | | | 18,208 | | |
| | | | 208,579 | | |
SHARES | | | | VALUE | |
Hotels, Restaurants & Leisure 1.1% | | | |
| | 3,030 | | | Bloomin' Brands, Inc.(a) | | $ | 54,631 | | |
| | 1,845 | | | Hilton Worldwide Holdings, Inc. | | | 50,184 | | |
| | 315 | | | Vail Resorts, Inc. | | | 50,813 | | |
| | | | 155,628 | | |
Household Durables 0.8% | | | |
| 425 | | | Harman International
Industries, Inc.(b) | | | 47,243 | | |
| | 500 | | | Lennar Corp., Class B(b) | | | 17,250 | | |
| | 200 | | | Mohawk Industries, Inc.*(a) | | | 39,936 | | |
| | 475 | | | WCI Communities, Inc.*(b) | | | 11,139 | | |
| | | | 115,568 | | |
Independent Power & Renewable
Electricity Producers 0.5% | | | |
| | 1,727 | | | Dynegy, Inc.* | | | 14,611 | | |
| | 934 | | | NextEra Energy Partners LP | | | 23,854 | | |
| | 1,628 | | | Pattern Energy Group, Inc.(a) | | | 30,916 | | |
| | | | 69,381 | | |
| Industrial Conglomerates 0.0%(c) | | | |
| 256 | | | Smiths Group plc
(United Kingdom)(a) | | | 4,467 | | |
Insurance 1.4% | | | |
| 273 | | | Admiral Group plc
(United Kingdom)(a) | | | 6,147 | | |
| | 7,786 | | | AIA Group Ltd. (Hong Kong)(a) | | | 43,616 | | |
| 500 | | | Allied World Assurance
Co. Holdings AG | | | 26,855 | | |
| 600 | | | Endurance Specialty
Holdings Ltd.(a) | | | 55,440 | | |
| 1,060 | | | Hartford Financial Services
Group, Inc. (The)(a) | | | 50,509 | | |
| 1,949 | | | RSA Insurance Group plc
(United Kingdom)(a) | | | 14,075 | | |
| | 1,021 | | | Syncora Holdings Ltd.*(a) | | | 1,981 | | |
| | | | 198,623 | | |
Internet & Direct Marketing Retail 0.5% | | | |
| | 12 | | | Amazon.com, Inc.*(a) | | | 8,999 | | |
| | 148 | | | ASOS plc (United Kingdom)*(a) | | | 9,054 | | |
| | 222 | | | Expedia, Inc.(a) | | | 25,148 | | |
| | 18 | | | Priceline Group, Inc. (The)*(a) | | | 26,389 | | |
| | | | 69,590 | | |
Internet Software & Services 2.1% | | | |
| 457 | | | Alibaba Group Holding Ltd.,
ADR (China)*(a) | | | 40,129 | | |
| | 75 | | | Alphabet, Inc., Class A*(a) | | | 59,434 | | |
| | 77 | | | Baidu, Inc., ADR (China)*(a) | | | 12,660 | | |
| | 920 | | | Cornerstone OnDemand, Inc.*(a) | | | 38,925 | | |
| | 250 | | | EarthLink Holdings Corp. | | | 1,410 | | |
See Notes to Financial Statements
7
Schedule of Investments Absolute Return Multi-Manager Portfolio (cont'd)
SHARES | | | | VALUE | |
| | 513 | | | eBay, Inc.*(a) | | $ | 15,231 | | |
| | 387 | | | Facebook, Inc., Class A*(a) | | | 44,524 | | |
| | 150 | | | Intralinks Holdings, Inc.* | | | 2,028 | | |
| 299 | | | Mail.Ru Group Ltd., GDR
(Russia)*(a) | | | 5,487 | | |
| | 112 | | | MercadoLibre, Inc. (Argentina)(a) | | | 17,488 | | |
| | 1,028 | | | Tencent Holdings Ltd. (China)(a) | | | 24,926 | | |
| | 1,038 | | | Yahoo!, Inc.*(b) | | | 40,139 | | |
| | 326 | | | Yandex NV, Class A (Russia)*(a) | | | 6,562 | | |
| | | | 308,943 | | |
IT Services 0.7% | | | |
| | 200 | | | Datalink Corp.* | | | 2,252 | | |
| | 100 | | | Lionbridge Technologies, Inc.*(b) | | | 580 | | |
| | 450 | | | NeuStar, Inc., Class A*(b) | | | 15,030 | | |
| | 511 | | | PayPal Holdings, Inc.*(a) | | | 20,169 | | |
| | 1,170 | | | Total System Services, Inc.(a) | | | 57,365 | | |
| | | | 95,396 | | |
Life Sciences Tools & Services 0.7% | | | |
| | 547 | | | Gerresheimer AG (Germany)(a) | | | 40,663 | | |
| | 2,308 | | | QIAGEN NV*(a) | | | 64,670 | | |
| | | | 105,333 | | |
Machinery 1.0% | | | |
| | 475 | | | CLARCOR, Inc. | | | 39,173 | | |
| | 652 | | | EnPro Industries, Inc.(a) | | | 43,919 | | |
| | 2,050 | | | Joy Global, Inc.(a)(b) | | | 57,400 | | |
| | | | 140,492 | | |
Media 3.2% | | | |
| 1 | | | AMC Entertainment
Holdings, Inc., Class A | | | 25 | | |
| 1,400 | | | CBS Corp. (Non-Voting),
Class B(a) | | | 89,068 | | |
| 1,000 | | | Crown Media Holdings, Inc.,
Class A*(d)(e) | | | 5,050 | | |
| | 639 | | | DISH Network Corp., Class A*(a) | | | 37,017 | | |
| | 2,843 | | | Gray Television, Inc.* | | | 30,847 | | |
| | 10,421 | | | ITV plc (United Kingdom)(a) | | | 26,508 | | |
| 476 | | | Liberty Global plc, Series C
(United Kingdom)*(a) | | | 14,137 | | |
| 65 | | | Liberty Global plc LiLAC,
Series C (United Kingdom)*(a) | | | 1,376 | | |
| 1,100 | | | Loral Space & Communications,
Inc.*(b) | | | 45,155 | | |
| | 2,550 | | | Media General, Inc.*(b) | | | 48,016 | | |
| 239 | | | Nexstar Broadcasting Group,
Inc., Class A | | | 15,129 | | |
| 850 | | | Sirius XM Canada Holdings,
Inc. (Canada)(a) | | | 3,216 | | |
| 1,863 | | | Stroeer SE & Co. KGaA
(Germany)(a) | | | 81,787 | | |
| | 405 | | | Time Warner, Inc.(b) | | | 39,095 | | |
| | 411 | | | Tribune Media Co., Class A | | | 14,377 | | |
SHARES | | | | VALUE | |
| 250 | | | Twenty-First Century Fox, Inc.,
Class B(b) | | $ | 6,812 | | |
| | | | 457,615 | | |
Metals & Mining 0.6% | | | |
| 5,170 | | | Constellium NV, Class A
(Netherlands)*(a) | | | 30,503 | | |
| | 830 | | | Nucor Corp. | | | 49,402 | | |
| | | | 79,905 | | |
Multiline Retail 0.4% | | | |
| | 750 | | | Dollar General Corp.(a) | | | 55,552 | | |
Multi-Utilities 1.2% | | | |
| | 306 | | | Avista Corp. | | | 12,237 | | |
| | 1,523 | | | Black Hills Corp.(a) | | | 93,421 | | |
| | 294 | | | CMS Energy Corp. | | | 12,236 | | |
| | 179 | | | DTE Energy Co. | | | 17,633 | | |
| | 424 | | | Sempra Energy | | | 42,672 | | |
| | | | 178,199 | | |
Oil, Gas & Consumable Fuels 2.8% | | | |
| | 2,435 | | | Callon Petroleum Co.*(a) | | | 37,426 | | |
| | 1,391 | | | Cheniere Energy, Inc.*(a) | | | 57,629 | | |
| | 487 | | | Enbridge, Inc. (Canada) | | | 20,512 | | |
| | 910 | | | Golar LNG Ltd. | | | 20,875 | | |
| | 450 | | | InterOil Corp. (Singapore)*(b) | | | 21,411 | | |
| | 2,251 | | | Kinder Morgan, Inc.(a) | | | 46,618 | | |
| | 679 | | | Midstates Petroleum Co., Inc.* | | | 14,083 | | |
| | 160 | | | Phillips 66 | | | 13,826 | | |
| | 275 | | | Pioneer Natural Resources Co.(a) | | | 49,519 | | |
| | 197 | | | SemGroup Corp., Class A | | | 8,225 | | |
| | 761 | | | Targa Resources Corp.(a) | | | 42,669 | | |
| | 498 | | | TransCanada Corp. (Canada) | | | 22,485 | | |
| | 1,529 | | | Williams Cos., Inc. (The) | | | 47,613 | | |
| | | | 402,891 | | |
Pharmaceuticals 2.0% | | | |
| | 672 | | | Allergan plc*(a) | | | 141,127 | | |
| | 895 | | | Bristol-Myers Squibb Co. | | | 52,304 | | |
| | 1,843 | | | Dermira, Inc.*(a) | | | 55,898 | | |
| 302 | | | Dr Reddy's Laboratories Ltd.,
ADR (India)(a) | | | 13,675 | | |
| 502 | | | Hikma Pharmaceuticals plc
(Jordan)(a) | | | 11,711 | | |
| | 129 | | | Mylan NV*(a) | | | 4,921 | | |
| 165 | | | Teva Pharmaceutical Industries
Ltd., ADR (Israel)(a) | | | 5,981 | | |
| | | | 285,617 | | |
Professional Services 0.5% | | | |
| | 590 | | | Dun & Bradstreet Corp. (The)(a) | | | 71,579 | | |
See Notes to Financial Statements
8
Schedule of Investments Absolute Return Multi-Manager Portfolio (cont'd)
SHARES | | | | VALUE | |
Road & Rail 0.9% | | | |
| 345 | | | Canadian Pacific Railway Ltd.
(Canada)(a) | | $ | 49,256 | | |
| | 790 | | | Norfolk Southern Corp.(a) | | | 85,375 | | |
| | | | 134,631 | | |
Semiconductors & Semiconductor
Equipment 2.7% | | | |
| | 137 | | | Applied Micro Circuits Corp.*(b) | | | 1,130 | | |
| | 309 | | | Broadcom Ltd. (Singapore)(a) | | | 54,622 | | |
| | 1,000 | | | Intersil Corp., Class A(a) | | | 22,300 | | |
| | 1,050 | | | Lattice Semiconductor Corp.*(b) | | | 7,728 | | |
| | 1,050 | | | Linear Technology Corp.(b) | | | 65,467 | | |
| 2,475 | | | NXP Semiconductors NV
(Netherlands)*(b) | | | 242,575 | | |
| | | | 393,822 | | |
Software 0.7% | | | |
| | 1,600 | | | Mentor Graphics Corp.(b) | | | 59,024 | | |
| | 970 | | | PTC, Inc.*(a) | | | 44,882 | | |
| | | | 103,906 | | |
Specialty Retail 2.0% | | | |
| | 102 | | | AutoZone, Inc.*(a) | | | 80,559 | | |
| | 875 | | | Cabela's, Inc.*(a) | | | 51,231 | | |
| | 1,065 | | | CST Brands, Inc.(a) | | | 51,280 | | |
| 1,186 | | | Hennes & Mauritz AB, Class B
(Sweden)(a) | | | 32,987 | | |
| 466 | | | Pets at Home Group plc
(United Kingdom)(a) | | | 1,373 | | |
| 1,200 | | | Restoration Hardware
Holdings, Inc.*(a) | | | 36,840 | | |
| 10,966 | | | Sports Direct International plc
(United Kingdom)*(a) | | | 37,651 | | |
| | | | 291,921 | | |
Technology Hardware, Storage &
Peripherals 1.2% | | | |
| | 463 | | | Apple, Inc.(a) | | | 53,624 | | |
| 4,005 | | | Hewlett Packard
Enterprise Co.(a)(b) | | | 92,676 | | |
| 35 | | | Samsung Electronics Co. Ltd.,
GDR (South Korea)(a) | | | 26,145 | | |
| | | | 172,445 | | |
Textiles, Apparel & Luxury Goods 1.5% | | | |
| 112 | | | Burberry Group plc
(United Kingdom)(a) | | | 2,066 | | |
| | 725 | | | Coach, Inc.(a) | | | 25,390 | | |
| | 875 | | | Deckers Outdoor Corp.*(a) | | | 48,466 | | |
| | 1,385 | | | G-III Apparel Group Ltd.*(a) | | | 40,941 | | |
| | 446 | | | Michael Kors Holdings Ltd.*(a) | | | 19,169 | | |
| | 622 | | | NIKE, Inc., Class B(a) | | | 31,616 | | |
| | 490 | | | PVH Corp.(a) | | | 44,218 | | |
| | | | 211,866 | | |
SHARES | | | | VALUE | |
Thrifts & Mortgage Finance 0.3% | | | |
| | 610 | | | Astoria Financial Corp.(b) | | $ | 11,377 | | |
| | 1,525 | | | EverBank Financial Corp.(a) | | | 29,661 | | |
| | | | 41,038 | | |
Trading Companies & Distributors 0.5% | | | |
| | 1,393 | | | Brenntag AG (Germany)(a) | | | 77,423 | | |
Transportation Infrastructure 0.6% | | | |
| | 1,140 | | | Macquarie Infrastructure Corp.(a) | | | 93,138 | | |
Water Utilities 0.4% | | | |
| | 624 | | | American Water Works Co., Inc. | | | 45,153 | | |
| | 449 | | | Aqua America, Inc. | | | 13,488 | | |
| | | | 58,641 | | |
| | | | | Total Common Stocks
(Cost $7,183,950) | | | 7,307,835
| | |
PRINCIPAL AMOUNT | | | | | |
| Loan Assignments 7.4%(h) | | | |
Auto Components 0.1% | | | |
$ | 14,000 | | | Innovative Xcessories &
Services LLC, Term Loan B
5.75%, 11/22/2022 | | | 14,070 | | |
| Capital Markets 0.0%(c) | | | |
| 5,478 | | | Lightstone Generation LLC,
Term Loan B
12/15/2023(i) | | | 5,540 | | |
| 522 | | | Lightstone Generation LLC,
Term Loan C
12/15/2023(i) | | | 528 | | |
| | | | 6,068 | | |
Chemicals 0.1% | | | |
| 7,000 | | | Huntsman International LLC,
Term Loan B
3.96%, 4/1/2023 | | | 7,067 | | |
Commercial Services & Supplies 0.1% | | | |
| 12,904 | | | GCA Services Group, Inc.,
1st Lien Term Loan
6.25%, 11/25/2020 | | | 12,495 | | |
Containers & Packaging 0.1% | | | |
| 18,000 | | | Flex Acquisition Co., Inc.,
Term Loan
12/29/2023 | | | 18,150 | | |
| 3,636 | | | TricorBraun, Inc., Term Loan
4.75%, 11/30/2023 | | | 3,670 | | |
| | | | 21,820 | | |
See Notes to Financial Statements
9
Schedule of Investments Absolute Return Multi-Manager Portfolio (cont'd)
PRINCIPAL AMOUNT | | | | VALUE | |
Diversified Consumer Services 0.5% | | | |
$ | 77,265 | | | Affinion Group, Inc.,
1st Lien Term Loan B
6.75%, 4/30/2018 | | $ | 76,763 | | |
Diversified Financial Services 0.3% | | | |
| 50,000 | | | Environmental Resources
Management, 1st Lien Term Loan
5.00%, 5/14/2021(e) | | | 44,500 | | |
Diversified Telecommunication
Services 0.7% | | | |
| 18,000 | | | Consolidated Communications,
Inc., Initial Term Loan 10/5/2023 | | | 18,093 | | |
| 30,000 | | | Global Eagle Entertainment,
Inc., Term Loan 12/22/2022(i) | | | 29,400 | | |
| 10,000 | | | Global Telcom Link Corp.,
2nd Lien Term Loan
9.00%, 11/23/2020 | | | 9,687 | | |
| 12,000 | | | Telesat Canada, Term Loan B
4.50%, 11/9/2023 | | | 12,154 | | |
| 23,000 | | | Virgin Media Investment
Holdings Ltd., Term Loan
1/31/2025 | | | 23,089 | | |
| | | | 92,423 | | |
| Electric Utilities 0.0%(c) | | | |
| | 1,629 | | | Texas Competitive Electric
Holdings Co. LLC,
DIP Term Loan B
5.00%, 8/4/2023 | | | 1,647
| | |
| | 371 | | | Texas Competitive Electric
Holdings Co. LLC, Term Loan
5.00%, 8/4/2023 | | | 376
| | |
| | | | 2,023 | | |
Energy Equipment & Services 0.6% | | | |
| 5,000 | | | C&J Energy Services Ltd.,
Initial Tranche Term Loan B-1
3/24/2020(i) | | | 5,666 | | |
| 55,652 | | | CGG Holding US, Inc.,
1st Lien Term Loan
6.50%, 5/15/2019 | | | 50,202 | | |
| 14,992 | | | Pacific Drilling SA, Term Loan
4.50%, 5/18/2018(i) | | | 5,262 | | |
| 29,000 | | | Vertiv Co., Term Loan B
6.00%, 11/30/2023(i) | | | 29,363 | | |
| | | | 90,493 | | |
Health Care Providers & Services 0.7% | | | |
| 28,650 | | | 21st Century Oncology, Inc.,
Term Loan 7.12%, 4/30/2022 | | | 26,286 | | |
| 11,790 | | | Beacon Health Strategies LLC,
Term Loan B 5.00%, 12/23/2021 | | | 11,436 | | |
| 31,000 | | | Highland Acquisition Holdings
LLC, Term Loan B
11/23/2022(i) | | | 29,398 | | |
PRINCIPAL AMOUNT | | | | VALUE | |
$ | 27,741 | | | Quorum Health Corp.,
Term Loan B 6.75%, 4/29/2022 | | $ | 27,139 | | |
| | | | 94,259 | | |
Hotels, Restaurants & Leisure 0.6% | | | |
| 28,928 | | | Bowlmor AMF Corp., 1st Lien
Term Loan 6.00%, 9/19/2023 | | | 28,837 | | |
| 9,000 | | | Bowlmor AMF Corp., 2nd Lien
Term Loan 11.00%, 3/17/2024 | | | 9,158 | | |
| 36,908 | | | Diamond Resorts International,
Inc., Term Loan B
6.62%, 8/17/2023 | | | 36,908 | | |
| | | | 74,903 | | |
| Household Products 0.0%(c) | | | |
| 6,000 | | | Hoffmaster Group, Inc.,
Term Loan B 5.50%, 11/21/2023 | | | 6,060 | | |
Independent Power & Renewable
Electricity Producers 0.1% | | | |
| 15,960 | | | Star West Generation LLC,
Term Loan B 5.75%, 3/13/2020 | | | 13,486 | | |
Insurance 1.1% | | | |
| 15,000 | | | Asurion LLC (Fka Asurion Corp.)
PIK Unsecured Term Loan
10.00%, 8/31/2021 | | | 15,413 | | |
| 44,000 | | | Asurion LLC, 2nd Lien
Term Loan 8.50%, 2/19/2021(i) | | | 44,688 | | |
| 20,000 | | | Confie Seguros Holding II Co.,
2nd Lien Term Loan
10.50%, 5/8/2019 | | | 19,800 | | |
| 28,000 | | | Confie Seguros Holding II Co.,
Term Loan B 5.75%, 4/19/2022 | | | 28,091 | | |
| 47,723 | | | Cunningham Lindsey US, Inc.,
1st Lien Term Loan
5.00%, 12/10/2019(i) | | | 39,920 | | |
| 17,961 | | | Hyperion Insurance Group Ltd.,
Term Loan B 5.50%, 4/29/2022 | | | 17,983 | | |
| | | | 165,895 | | |
Internet Software & Services 0.1% | | | |
| 12,000 | | | Ancestry.com, Inc., Term Loan
5.25%, 10/19/2023 | | | 12,109 | | |
IT Services 0.1% | | | |
| 17,000 | | | Evo Payments International LLC,
1st Lien Term Loan 12/8/2023(i) | | | 17,085 | | |
| Machinery 0.0%(c) | | | |
| 1,995 | | | Crosby Worldwide Ltd.,
1st Lien Term Loan
4.00%, 11/23/2020 | | | 1,782 | | |
See Notes to Financial Statements
10
Schedule of Investments Absolute Return Multi-Manager Portfolio (cont'd)
PRINCIPAL AMOUNT | | | | VALUE | |
Media 0.1% | | | |
$ | 7,000 | | | Cirque du Soleil, Inc., 2nd Lien
Term Loan 9.25%, 7/10/2023 | | $ | 6,807 | | |
| 4,000 | | | Vestcom International, Inc.
(Fka Vector Investment
Holdings, Inc.), Term Loan
12/15/2023 | | | 4,000 | | |
| | | | 10,807 | | |
Oil, Gas & Consumable Fuels 0.1% | | | |
| 16,958 | | | Gulf Finance LLC, Term Loan B
6.25%, 8/25/2023 | | | 17,000 | | |
Pharmaceuticals 0.5% | | | |
| 65,741 | | | Valeant Pharmaceuticals
International, Inc., Term Loan
5.50%, 4/1/2022(i) | | | 65,753 | | |
Professional Services 0.1% | | | |
| 15,750 | | | Duff & Phelps Corp., 2nd Lien
Term Loan 9.50%, 4/23/2021 | | | 15,593 | | |
Semiconductors & Semiconductor
Equipment 0.4% | | | |
| 27,582 | | | SunEdison, Inc., 1st Lien DIP
Term Loan 11.50%, 4/26/2017(i) | | | 27,720 | | |
| 14,000 | | | SunEdison, Inc., 2nd Lien Term
Loan A2 7/2/2018(j) | | | 6,160 | | |
| 29,000 | | | SunEdison, Inc., Initial Tranche
Term Loan A 4/21/2017(i) | | | 29,121 | | |
| | | | 63,001 | | |
Software 0.6% | | | |
| 11,000 | | | Aptean, Inc., 1st Lien Term Loan
12/14/2022 | | | 11,064 | | |
| 3,000 | | | Aptean, Inc., 2nd Lien Term Loan
12/20/2023 | | | 2,985 | | |
| 36,000 | | | Epiq Systems, Inc., Term Loan
6.25%, 9/23/2023 | | | 35,460 | | |
| 7,000 | | | Greeneden U.S. Holdings II LLC,
Term Loan B 11/17/2023(i) | | | 7,118 | | |
| 9,000 | | | Information Resources, Inc.
(Fka Symphonyiri Group),
Term Loan 1/18/2024(i) | | | 9,056 | | |
| | | | 65,683 | | |
Technology Hardware, Storage &
Peripherals 0.4% | | | |
| 59,869 | | | Eastman Kodak Co., Term Loan
7.25%, 9/3/2019 | | | 59,981 | | |
| | | | | Total Loan Assignments | | | 1,051,119
(Cost $1,045,283) | | |
PRINCIPAL AMOUNT | | | | VALUE | |
Corporate Bonds 5.3% | | | |
| Chemicals 0.0%(c) | | | |
$ | 3,000 | | | Momentive Performance
Materials, Inc. Escrow
10.00%, 10/15/2020(d)(e)(j) | | $ | — | (k) | |
Commercial Services & Supplies 0.2% | | | |
| 27,000 | | | Constellis Holdings LLC
9.75%, 5/15/2020(g) | | | 27,675 | | |
Diversified Telecommunication
Services 1.0% | | | |
| 100,000 | | | FairPoint Communications, Inc.
8.75%, 8/15/2019(g) | | | 104,375 | | |
| 26,000 | | | Gogo Intermediate Holdings LLC
12.50%, 7/1/2022(g) | | | 28,210 | | |
| 13,000 | | | Telesat Canada (Canada)
8.88%, 11/15/2024(g) | | | 13,553 | | |
| | | | 146,138 | | |
Food & Staples Retailing 0.1% | | | |
| | 10,000 | | | BI-LO LLC 9.25%, 2/15/2019(g) | | | 8,475 | | |
Independent Power & Renewable
Electricity Producers 0.6% | | | |
| 29,000 | | | Dynegy, Inc. 6.75%, 11/1/2019
GenOn Energy, Inc. | | | 29,508 | | |
| | 22,000 | | | 9.50%, 10/15/2018 | | | 15,551 | | |
| | 54,000 | | | 9.88%, 10/15/2020 | | | 36,855 | | |
| | | | 81,914 | | |
Insurance 0.3% | | | |
| 36,888 | | | Ambac Assurance Corp.
5.10%, 6/7/2020(g) | | | 44,635 | | |
| 481 | | | Syncora Guarantee, Inc.,
5.00% Short-Term Surplus Notes
6/7/2023(a) | | | 452 | | |
| 2,053 | | | Syncora Guarantee, Inc.,
6.00% Long-Term Surplus Notes
6/7/2023 | | | 1,765 | | |
| | | | 46,852 | | |
Internet & Direct Marketing Retail 0.2% | | | |
| 30,000 | | | Netflix, Inc.
4.38%, 11/15/2026(g) | | | 29,100 | | |
Media 0.8% | | | |
| 25,000 | | | Cengage Learning, Inc.
9.50%, 6/15/2024(g) | | | 22,188 | | |
| 108,000 | | | Cenveo Corp.
6.00%, 8/1/2019(g) | | | 96,390 | | |
| | | | 118,578 | | |
See Notes to Financial Statements
11
Schedule of Investments Absolute Return Multi-Manager Portfolio (cont'd)
PRINCIPAL AMOUNT | | | | VALUE | |
Metals & Mining 0.3% | | | |
$ | 44,000 | | | Wise Metals Group LLC
8.75%, 12/15/2018(g) | | $ | | 45,760 | |
Oil, Gas & Consumable Fuels 0.6% | | | |
| | | | | Cobalt International Energy, Inc. | | | | | |
| | 53,000 | | | 10.75%, 12/1/2021(g) | | | 51,118 | | |
| | 14,000 | | | 7.75%, 12/1/2023(g) | | | 7,770 | | |
| 18,000 | | | Midstates Petroleum Co., Inc.
Escrow 10.00%, 6/1/2020(d)(e)(j) | | | — | | |
| 23,000 | | | Niska Gas Storage Ltd.
6.50%, 4/1/2019 | | | 23,115 | | |
| | | | 82,003 | | |
Pharmaceuticals 0.3% | | | |
| | 38,000 | | | Endo Ltd. 6.50%, 2/1/2025(g) | | | 31,635 | | |
| 21,000 | | | Valeant Pharmaceuticals
International, Inc.
6.13%, 4/15/2025(g) | | | 15,776 | | |
| | | | 47,411 | | |
Professional Services 0.6% | | | |
| 80,000 | | | Corporate Risk Holdings LLC
9.50%, 7/1/2019(g) | | | 82,200 | | |
Trading Companies & Distributors 0.3% | | | |
| 44,000 | | | United Rentals North America,
Inc. 4.63%, 7/15/2023 | | | 44,880 | | |
| | | | Total Corporate Bonds
(Cost $752,518) | | | 760,986 | | |
SHARES | | | | | |
Master Limited Partnerships 4.6% | | | |
Energy Equipment & Services 0.1% | | | |
| | 944 | | | USA Compression Partners LP | | | 16,331 | | |
Oil, Gas & Consumable Fuels 4.5% | | | |
| | 1,547 | | | Antero Midstream Partners LP | | | 47,771 | | |
| | 2,677 | | | Boardwalk Pipeline Partners LP | | | 46,473 | | |
| | 95 | | | Buckeye Partners LP | | | 6,285 | | |
| | 607 | | | Enable Midstream Partners LP | | | 9,548 | | |
| | 83 | | | Enbridge Energy Partners LP | | | 2,115 | | |
| | 2,365 | | | Energy Transfer Equity LP(a) | | | 45,668 | | |
| | 1,117 | | | Energy Transfer Partners LP | | | 40,000 | | |
| | 173 | | | EnLink Midstream Partners LP | | | 3,187 | | |
| | 1,652 | | | Enterprise Products Partners LP | | | 44,670 | | |
| | 955 | | | EQT GP Holdings LP | | | 24,076 | | |
| | 348 | | | EQT Midstream Partners LP | | | 26,685 | | |
| | 166 | | | MPLX LP | | | 5,747 | | |
| | 292 | | | Noble Midstream Partners LP* | | | 10,512 | | |
| | 1,027 | | | NuStar GP Holdings LLC(a) | | | 29,680 | | |
| | 602 | | | ONEOK Partners LP | | | 25,892 | | |
| | 1,296 | | | Plains All American Pipeline LP(a) | | | 41,848 | | |
SHARES | | | | VALUE | |
| | 714 | | | Rice Midstream Partners LP(a) | | $ | 17,550 | | |
| | 1,688 | | | Shell Midstream Partners LP | | | 49,104 | | |
| | 99 | | | Summit Midstream Partners LP | | | 2,490 | | |
| | 1,156 | | | Valero Energy Partners LP | | | 51,176 | | |
| | 1,017 | | | Western Gas Equity Partners LP | | | 43,070 | | |
| | 575 | | | Western Gas Partners LP | | | 33,787 | | |
| | 2,048 | | | Western Refining Logistics LP | | | 43,725 | | |
| | 167 | | | Williams Partners LP | | | 6,351 | | |
| | | | 657,410 | | |
| | | | Total Master Limited Partnerships
(Cost $621,901) | | | 673,741 | | |
PRINCIPAL AMOUNT | | | | | |
Convertible Bonds 1.0% | | | |
Capital Markets 0.1% | | | |
$ | 12,000 | | | Walter Investment
Management Corp.
4.50%, 11/1/2019 | | | 8,400 | | |
Diversified Consumer Services 0.1% | | | |
| 24,000 | | | Ascent Capital Group, Inc.
4.00%, 7/15/2020 | | | 18,000 | | |
| Energy Equipment & Services 0.0%(c) | | | |
| 7,000 | | | Hornbeck Offshore Services, Inc.
1.50%, 9/1/2019 | | | 4,966 | | |
Internet Software & Services 0.2% | | | |
| | 33,000 | | | Twitter, Inc. 0.25%, 9/15/2019 | | | 30,855 | | |
Media 0.4% | | | |
| 55,000 | | | DISH Network Corp.
3.38%, 8/15/2026(g) | | | 62,597 | | |
Oil, Gas & Consumable Fuels 0.1% | | | |
| 25,000 | | | Cobalt International Energy, Inc.
3.13%, 5/15/2024 | | | 7,000 | | |
Semiconductors & Semiconductor
Equipment 0.1% | | | |
| 30,000 | | | SunEdison, Inc.
5.00%, 7/2/2018(g)(j) | | | 11,400 | | |
| | | | Total Convertible Bonds
(Cost $144,875) | | | 143,218 | | |
U.S. Treasury Obligations 0.2% | | | |
| 8,000 | | | U.S. Treasury Bond
2.50%, 5/15/2046 | | | 7,092 | | |
| 22,000 | | | U.S. Treasury Note
1.50%, 8/15/2026 | | | 20,201 | | |
| | | | Total U.S. Treasury Obligations
(Cost $29,570) | | | 27,293 | | |
See Notes to Financial Statements
12
Schedule of Investments Absolute Return Multi-Manager Portfolio (cont'd)
NO. OF RIGHTS | | | | VALUE | |
Rights 0.1% | | | |
| Biotechnology 0.0%(c) | | | |
| 500 | | | Chelsea Therapeutics, Inc.
Escrow (H Lundbeck A/S)
(Denmark)*(d)(e) | | $ | 55 | | |
| | 500 | | | Dyax Corp.*(e) | | | 625 | | |
| | 225 | | | Tobira Therapeutics, Inc.*(d)(e) | | | 3,091 | | |
| | | | 3,771 | | |
| Energy Equipment & Services 0.0%(c) | | | |
| 54 | | | C&J Energy Services Ltd.,
expiring 12/31/2017*(d) | | | 733 | | |
| Food & Staples Retailing 0.0%(c) | | | |
| | 1,000 | | | Safeway, Inc. (Casa Ley)*(e) | | | 250 | | |
| 1,000 | | | Safeway, Inc. (Property
Development Centers)*(e) | | | 20 | | |
| | | | 270 | | |
| Health Care Providers & Services 0.0%(c) | | | |
| 204 | | | Community Health Systems,
Inc.*(b) | | | 1 | | |
Semiconductors & Semiconductor
Equipment 0.1% | | | |
| 34,893 | | | SunEdison, Inc., 2nd Lien
DIP Roll Up Rights* | | | 15,702 | | |
| | | | Total Rights
(Cost $10,696) | | | 20,477 | | |
NO. OF CONTRACTS | | | | | |
| Options Purchased 0.0%(c) | | | |
| Call Option 0.0%(c) | | | |
| Food Products 0.0%(c) | | | |
| 5 | | | Mondelez International, Inc.
1/20/2017 @ 45.00 | | | 525 | | |
| Put Options 0.0%(c) | | | |
| Air Freight & Logistics 0.0%(c) | | | |
| 1 | | | FedEx Corp.
1/20/2017 @ 190.00 | | | 565 | | |
| Exchange Traded Funds 0.0%(c) | | | |
| 8 | | | iShares Russell 2000 Fund
6/30/2017 @ 123.00 | | | 3,160 | | |
| 8 | | | iShares Russell 2000 Fund
3/31/2017 @ 126.00 | | | 2,068 | | |
| | | | 5,228 | | |
NO. OF CONTRACTS | | | | VALUE | |
| Industrial Conglomerates 0.0%(c) | | | |
| 2 | | | Icahn Enterprises LP
1/20/2017 @ 60.00 | | $ | 355 | | |
| 1 | | | Icahn Enterprises LP
1/20/2017 @ 50.00(d) | | | 15 | | |
| | | | 370 | | |
| Media 0.0%(c) | | | |
| | 7 | | | CBS Corp. 3/17/2017 @ 60.00 | | | 1,165 | | |
| | | | | Total Put Options | | | 7,328 | | |
| | | | | Total Options Purchased | | | 7,853
(Cost $11,673) | | |
NO. OF WARRANTS | | | | | |
| Warrants 0.0%(c) | | | |
| Biotechnology 0.0%(c) | | | |
| | 11,740 | | | Novelion Therapeutics, Inc. (Canada)*(d)(e)
(Cost $—) | | | — | | |
SHARES | | | | | |
Short-Term Investments 28.1% | | | |
Investment Companies 28.1% | | | |
| 58,018 | | | AQR Managed Futures Strategy
HV Fund Institutional Class(a) | | | 539,563 | | |
| 3,523,065 | | | Morgan Stanley Institutional
Liquidity Fund Treasury
Portfolio Institutional Class,
0.35%(a)(l) | | | 3,523,065 | | |
| | | | Total Investments Companies
(Cost $4,143,139) | | | 4,062,628 | | |
| | | | Total Long Positions
(Cost $13,943,605) | | | 14,055,150 | | |
| Short Positions (24.4)%(m) | | | |
Common Stocks (18.0)% | | | |
Aerospace & Defense (0.2)% | | | |
| | (50 | ) | | TransDigm Group, Inc. | | | (12,448 | ) | |
| | (895 | ) | | Triumph Group, Inc. | | | (23,717 | ) | |
| | | | (36,165 | ) | |
Air Freight & Logistics (0.2)% | | | |
| | (5,060 | ) | | Royal Mail plc (United Kingdom) | | | (28,816 | ) | |
Airlines (0.3)% | | | |
| (2,900 | ) | | Deutsche Lufthansa AG
(Germany) | | | (37,456 | ) | |
See Notes to Financial Statements
13
Schedule of Investments Absolute Return Multi-Manager Portfolio (cont'd)
SHARES | | | | VALUE | |
Auto Components (0.3)% | | | |
| | (308 | ) | | Autoliv, Inc. (Sweden) | | $ | (34,850 | ) | |
| (234 | ) | | Goodyear Tire & Rubber Co.
(The) | | | (7,224 | ) | |
| | | | (42,074 | ) | |
Banks (0.4)% | | | |
| (338 | ) | | Canadian Imperial Bank of
Commerce (Canada) | | | (27,581 | ) | |
| (550 | ) | | Canadian Western Bank
(Canada) | | | (12,428 | ) | |
| (134 | ) | | First Interstate BancSystem,
Inc., Class A | | | (5,702 | ) | |
| (320 | ) | | National Bank of Canada
(Canada) | | | (12,996 | ) | |
| | | | (58,707 | ) | |
Beverages (0.2)% | | | |
| | (687 | ) | | Brown-Forman Corp., Class B | | | (30,860 | ) | |
Biotechnology (0.4)% | | | |
| | (316 | ) | | AbbVie, Inc. | | | (19,788 | ) | |
| | (145 | ) | | Amgen, Inc. | | | (21,200 | ) | |
| | (301 | ) | | Gilead Sciences, Inc. | | | (21,555 | ) | |
| | | | (62,543 | ) | |
Building Products (0.2)% | | | |
| | (470 | ) | | Owens Corning | | | (24,233 | ) | |
Capital Markets (0.2)% | | | |
| | (260 | ) | | Moody's Corp. | | | (24,510 | ) | |
Chemicals (0.6)% | | | |
| (260 | ) | | International Flavors &
Fragrances, Inc. | | | (30,636 | ) | |
| | (210 | ) | | Praxair, Inc. | | | (24,610 | ) | |
| | (100 | ) | | Sherwin-Williams Co. (The) | | | (26,874 | ) | |
| | | | (82,120 | ) | |
Containers & Packaging (0.1)% | | | |
| | (220 | ) | | Berry Plastics Group, Inc.* | | | (10,720 | ) | |
Diversified Consumer Services (0.3)% | | | |
| (1,045 | ) | | ServiceMaster Global
Holdings, Inc.* | | | (39,365 | ) | |
Diversified Telecommunication
Services (0.0)%(c) | | | |
| | (100 | ) | | CenturyLink, Inc. | | | (2,378 | ) | |
SHARES | | | | VALUE | |
Electric Utilities (0.8)% | | | |
| | (647 | ) | | Duke Energy Corp. | | $ | (50,220 | ) | |
| | (269 | ) | | Eversource Energy | | | (14,857 | ) | |
| | (993 | ) | | Southern Co. (The) | | | (48,846 | ) | |
| | (108 | ) | | Xcel Energy, Inc. | | | (4,395 | ) | |
| | | | (118,318 | ) | |
Electrical Equipment (0.4)% | | | |
| | (125 | ) | | Acuity Brands, Inc. | | | (28,857 | ) | |
| | (530 | ) | | Regal Beloit Corp. | | | (36,703 | ) | |
| | | | (65,560 | ) | |
Energy Equipment & Services (0.2)% | | | |
| | (240 | ) | | Helmerich & Payne, Inc. | | | (18,576 | ) | |
| | (354 | ) | | Patterson-UTI Energy, Inc. | | | (9,530 | ) | |
| | | | (28,106 | ) | |
Food & Staples Retailing (0.5)% | | | |
| | (328 | ) | | CVS Health Corp. | | | (25,882 | ) | |
| | (835 | ) | | Metro, Inc. (Canada) | | | (24,976 | ) | |
| | (191 | ) | | Walgreens Boots Alliance, Inc. | | | (15,807 | ) | |
| | | | (66,665 | ) | |
Food Products (0.2)% | | | |
| | (795 | ) | | Hormel Foods Corp. | | | (27,674 | ) | |
Health Care Equipment & Supplies (1.5)% | | | |
| | (1,262 | ) | | Abbott Laboratories | | | (48,473 | ) | |
| | (180 | ) | | ABIOMED, Inc.* | | | (20,282 | ) | |
| | (469 | ) | | Baxter International, Inc. | | | (20,796 | ) | |
| | (115 | ) | | Becton Dickinson and Co. | | | (19,038 | ) | |
| | (191 | ) | | Danaher Corp. | | | (14,867 | ) | |
| | (90 | ) | | ICU Medical, Inc.* | | | (13,262 | ) | |
| | (560 | ) | | LivaNova plc* | | | (25,183 | ) | |
| | (289 | ) | | Medtronic plc | | | (20,586 | ) | |
| | (137 | ) | | Stryker Corp. | | | (16,414 | ) | |
| | (204 | ) | | Zimmer Biomet Holdings, Inc. | | | (21,053 | ) | |
| | | | (219,954 | ) | |
Health Care Providers & Services (1.0)% | | | |
| | (262 | ) | | Aetna, Inc. | | | (32,491 | ) | |
| | (219 | ) | | AmerisourceBergen Corp. | | | (17,124 | ) | |
| | (322 | ) | | Cardinal Health, Inc. | | | (23,174 | ) | |
| | (300 | ) | | Express Scripts Holding Co.* | | | (20,637 | ) | |
| | (161 | ) | | McKesson Corp. | | | (22,612 | ) | |
| | (148 | ) | | UnitedHealth Group, Inc. | | | (23,686 | ) | |
| | | | (139,724 | ) | |
Hotels, Restaurants & Leisure (0.2)% | | | |
| | (355 | ) | | Darden Restaurants, Inc. | | | (25,816 | ) | |
| | (179 | ) | | Hilton Grand Vacations, Inc.* | | | (4,654 | ) | |
| | | | (30,470 | ) | |
See Notes to Financial Statements
14
Schedule of Investments Absolute Return Multi-Manager Portfolio (cont'd)
SHARES | | | | VALUE | |
Household Durables (0.3)% | | | |
| | (400 | ) | | Lennar Corp., Class A | | $ | (17,172 | ) | |
| | (145 | ) | | Whirlpool Corp. | | | (26,357 | ) | |
| | | | (43,529 | ) | |
Household Products (0.2)% | | | |
| | (610 | ) | | Church & Dwight Co., Inc. | | | (26,956 | ) | |
Independent Power & Renewable
Electricity Producers (0.1)% | | | |
| | (656 | ) | | NRG Yield, Inc., Class C | | | (10,365 | ) | |
| | (500 | ) | | TerraForm Power, Inc., Class A* | | | (6,405 | ) | |
| | | | (16,770 | ) | |
Insurance (0.5)% | | | |
| | (300 | ) | | Axis Capital Holdings Ltd. | | | (19,581 | ) | |
| | (90 | ) | | Everest Re Group Ltd. | | | (19,476 | ) | |
| | (685 | ) | | First American Financial Corp. | | | (25,092 | ) | |
| | (222 | ) | | Primerica, Inc. | | | (15,351 | ) | |
| | | | (79,500 | ) | |
| Internet & Direct Marketing Retail (0.0)%(c) | | | |
| | (152 | ) | | Lands' End, Inc.* | | | (2,303 | ) | |
Internet Software & Services (0.3)% | | | |
| (428 | ) | | Alibaba Group Holding Ltd.,
ADR (China)* | | | (37,583 | ) | |
IT Services (0.6)% | | | |
| (230 | ) | | International Business
Machines Corp. | | | (38,178 | ) | |
| | (2,200 | ) | | Xerox Corp.*(n) | | | (12,826 | ) | |
| | (4,110 | ) | | Xerox Corp. | | | (35,880 | ) | |
| | | | (86,884 | ) | |
Leisure Products (0.1)% | | | |
| | (240 | ) | | Hasbro, Inc. | | | (18,670 | ) | |
Life Sciences Tools & Services (0.3)% | | | |
| | (1,165 | ) | | Bruker Corp. | | | (24,675 | ) | |
| | (123 | ) | | Thermo Fisher Scientific, Inc. | | | (17,355 | ) | |
| | | | (42,030 | ) | |
Machinery (0.1)% | | | |
| | (170 | ) | | Stanley Black & Decker, Inc. | | | (19,497 | ) | |
Media (0.4)% | | | |
| (922 | ) | | New Media Investment
Group, Inc. | | | (14,743 | ) | |
| (275 | ) | | Nexstar Broadcasting
Group, Inc., Class A | | | (17,408 | ) | |
SHARES | | | | VALUE | |
| | (649 | ) | | SES SA, FDR (Luxembourg) | | $ | (14,295 | ) | |
| (250 | ) | | Twenty-First Century Fox, Inc.,
Class A | | | (7,010 | ) | |
| | | | (53,456 | ) | |
Metals & Mining (0.2)% | | | |
| | (740 | ) | | Worthington Industries, Inc. | | | (35,106 | ) | |
Multiline Retail (0.7)% | | | |
| | (365 | ) | | Big Lots, Inc. | | | (18,327 | ) | |
| | (28 | ) | | Dillard's, Inc., Class A | | | (1,755 | ) | |
| | (2,393 | ) | | JC Penney Co., Inc.* | | | (19,886 | ) | |
| | (63 | ) | | Kohl's Corp. | | | (3,111 | ) | |
| | (48 | ) | | Macy's, Inc. | | | (1,719 | ) | |
| | (53 | ) | | Nordstrom, Inc. | | | (2,540 | ) | |
| | (690 | ) | | Target Corp. | | | (49,839 | ) | |
| | | | (97,177 | ) | |
Multi-Utilities (0.8)% | | | |
| | (635 | ) | | Ameren Corp. | | | (33,312 | ) | |
| | (1,100 | ) | | Consolidated Edison, Inc. | | | (81,048 | ) | |
| (153 | ) | | Public Service Enterprise
Group, Inc. | | | (6,714 | ) | |
| | | | (121,074 | ) | |
Oil, Gas & Consumable Fuels (0.3)% | | | |
| | (432 | ) | | ONEOK, Inc. | | | (24,801 | ) | |
| | (181 | ) | | Plains GP Holdings LP, Class A | | | (6,263 | ) | |
| | (290 | ) | | Tallgrass Energy GP LP | | | (7,772 | ) | |
| | | | (38,836 | ) | |
Pharmaceuticals (2.0)% | | | |
| | (1,207 | ) | | Endo International plc* | | | (19,879 | ) | |
| | (531 | ) | | Johnson & Johnson | | | (61,177 | ) | |
| | (321 | ) | | Mallinckrodt plc* | | | (15,992 | ) | |
| | (526 | ) | | Mylan NV* | | | (20,067 | ) | |
| | (317 | ) | | Novartis AG, ADR (Switzerland) | | | (23,090 | ) | |
| | (710 | ) | | Pfizer, Inc. | | | (23,061 | ) | |
| | (275 | ) | | Roche Holding AG (Switzerland) | | | (62,816 | ) | |
| | (510 | ) | | Sanofi, ADR (France) | | | (20,624 | ) | |
| (661 | ) | | Teva Pharmaceutical Industries
Ltd., ADR (Israel) | | | (23,961 | ) | |
| | (217 | ) | | UCB SA (Belgium) | | | (13,913 | ) | |
| | | | (284,580 | ) | |
Road & Rail (0.3)% | | | |
| | (395 | ) | | Union Pacific Corp. | | | (40,954 | ) | |
Semiconductors & Semiconductor
Equipment (0.3)% | | | |
| | (234 | ) | | Analog Devices, Inc. | | | (16,993 | ) | |
| (15 | ) | | MACOM Technology Solutions
Holdings, Inc.* | | | (694 | ) | |
See Notes to Financial Statements
15
Schedule of Investments Absolute Return Multi-Manager Portfolio (cont'd)
SHARES | | | | VALUE | |
| | (400 | ) | | QUALCOMM, Inc. | | $ | (26,080 | ) | |
| | | | (43,767 | ) | |
Software (0.5)% | | | |
| | (1,070 | ) | | Fortinet, Inc.* | | | (32,228 | ) | |
| | (550 | ) | | Workday, Inc., Class A* | | | (36,350 | ) | |
| | | | (68,578 | ) | |
Specialty Retail (0.6)% | | | |
| | (44 | ) | | Bed Bath & Beyond, Inc. | | | (1,788 | ) | |
| | (988 | ) | | Best Buy Co., Inc. | | | (42,158 | ) | |
| | (1,650 | ) | | Chico's FAS, Inc. | | | (23,743 | ) | |
| | (47 | ) | | Dick's Sporting Goods, Inc. | | | (2,496 | ) | |
| | (43 | ) | | Foot Locker, Inc. | | | (3,048 | ) | |
| | (133 | ) | | GameStop Corp., Class A | | | (3,360 | ) | |
| | (99 | ) | | Gap, Inc. (The) | | | (2,221 | ) | |
| | (126 | ) | | GNC Holdings, Inc., Class A | | | (1,391 | ) | |
| | (166 | ) | | Hibbett Sports, Inc.* | | | (6,192 | ) | |
| | (26 | ) | | L Brands, Inc. | | | (1,712 | ) | |
| | (33 | ) | | Williams-Sonoma, Inc. | | | (1,597 | ) | |
| | | | (89,706 | ) | |
Textiles, Apparel & Luxury Goods (0.5)% | | | |
| | (710 | ) | | VF Corp. | | | (37,878 | ) | |
| | (1,660 | ) | | Wolverine World Wide, Inc. | | | (36,437 | ) | |
| | | | (74,315 | ) | |
Thrifts & Mortgage Finance (0.5)% | | | |
| | (1,051 | ) | | BofI Holding, Inc.* | | | (30,006 | ) | |
| (260 | ) | | Genworth MI Canada, Inc.
(Canada) | | | (6,518 | ) | |
| (1,064 | ) | | Home Capital Group, Inc.
(Canada) | | | (24,836 | ) | |
| (610 | ) | | New York Community
Bancorp, Inc. | | | (9,705 | ) | |
| | | | (71,065 | ) | |
Trading Companies & Distributors (0.2)% | | | |
| | (425 | ) | | GATX Corp. | | | (26,171 | ) | |
| | | | Total Common Stocks
(Proceeds $(2,598,334)) | | | (2,594,925 | ) | |
Exchange Traded Funds (2.8)% | | | |
| | (6,618 | ) | | Alerian MLP Fund | | | (83,387 | ) | |
| | (700 | ) | | CurrencyShares Euro Trust* | | | (71,582 | ) | |
| | (1,123 | ) | | Energy Select Sector SPDR Fund | | | (84,584 | ) | |
| (650 | ) | | iShares 20+ Year Treasury
Bond Fund | | | (77,434 | ) | |
| | (1,847 | ) | | Utilities Select Sector SPDR Fund | | | (89,709 | ) | |
| | | | Total Exchange Traded Funds
(Proceeds $(393,455)) | | | (406,696 | ) | |
PRINCIPAL AMOUNT | | | | VALUE | |
Corporate Bonds (2.5)% | | | |
Auto Components (0.2)% | | | |
| | $(25,000) Goodyear Tire & Rubber Co. | | | (The) 5.13%, 11/15/2023 | | $ | (26,000 | ) | |
Chemicals (0.1)% | | | |
| (15,000 | ) | | Chemours Co. (The)
6.63%, 5/15/2023 | | | (15,000 | ) | |
Food Products (0.4)% | | | |
| | | | | Flowers Foods, Inc. | | | | | |
| | (26,000 | ) | | 4.38%, 4/1/2022 | | | (27,358 | ) | |
| | (24,000 | ) | | 3.50%, 10/1/2026 | | | (22,904 | ) | |
| | | | (50,262 | ) | |
Hotels, Restaurants & Leisure (0.1)% | | | |
| (13,000 | ) | | Wynn Las Vegas LLC
5.50%, 3/1/2025(g) | | | (12,961 | ) | |
IT Services (0.1)% | | | |
| (21,000 | ) | | Sungard Availability Services
Capital, Inc. 8.75%, 4/1/2022(g) | | | (14,595 | ) | |
Media (0.1)% | | | |
| (20,000 | ) | | Gray Television, Inc.
5.88%, 7/15/2026(g) | | | (19,950 | ) | |
Multiline Retail (0.1)% | | | |
| (15,000 | ) | | Macy's Retail Holdings, Inc.
4.50%, 12/15/2034 | | | (13,469 | ) | |
Pharmaceuticals (0.6)% | | | |
| (38,000 | ) | | Endo Finance LLC
5.75%, 1/15/2022(g) | | | (34,200 | ) | |
| | | | | Valeant Pharmaceuticals
International, Inc. | | | | | |
| | (39,000 | ) | | 6.75%, 8/15/2018(g) | | | (37,343 | ) | |
| | (21,000 | ) | | 5.38%, 3/15/2020(g) | | | (17,955 | ) | |
| | | | (89,498 | ) | |
Specialty Retail (0.3)% | | | |
| (41,000 | ) | | Gap, Inc. (The)
5.95%, 4/12/2021 | | | (43,192 | ) | |
Trading Companies & Distributors (0.5)% | | | |
| (29,000 | ) | | International Lease Finance Corp.
5.88%, 8/15/2022 | | | (31,610 | ) | |
| (43,000 | ) | | United Rentals North America,
Inc. 5.75%, 11/15/2024 | | | (45,580 | ) | |
| | | | (77,190 | ) | |
| | | | Total Corporate Bonds
(Proceeds $(359,494)) | | | (362,117 | ) | |
See Notes to Financial Statements
16
Schedule of Investments Absolute Return Multi-Manager Portfolio (cont'd)
SHARES | | | | VALUE | |
Master Limited Partnerships (0.8)% | | | |
Gas Utilities (0.1)% | | | |
| | (909 | ) | | Ferrellgas Partners LP | | $ | (6,154 | ) | |
Oil, Gas & Consumable Fuels (0.7)% | | | |
| | (92 | ) | | Crestwood Equity Partners LP | | | (2,351 | ) | |
| | (439 | ) | | DCP Midstream Partners LP | | | (16,849 | ) | |
| (388 | ) | | Golar LNG Partners LP
(United Kingdom) | | | (9,327 | ) | |
| | (274 | ) | | Holly Energy Partners LP | | | (8,784 | ) | |
| | (330 | ) | | Magellan Midstream Partners LP | | | (24,958 | ) | |
| | (827 | ) | | Midcoast Energy Partners LP | | | (5,830 | ) | |
| | (396 | ) | | Spectra Energy Partners LP | | | (18,153 | ) | |
| | (346 | ) | | TC PipeLines LP | | | (20,359 | ) | |
| | | | (106,611 | ) | |
| | | | Total Master Limited Partnerships
(Proceeds $(114,369)) | | | (112,765 | ) | |
Exchange Traded Note (0.3)% | | | |
| (1,496 | ) | | JPMorgan Alerian MLP
Index ETN (Proceeds $(43,215)) | | | (47,289 | ) | |
| | | | Total Short Positions
(Proceeds $(3,508,867)) | | | (3,523,792 | ) | |
| | | | Total Investments 72.9%
(Cost $10,434,738) | | | 10,531,358 | | |
| | | | | Other Assets Less Liabilities 27.1%(o) | | | 3,921,672 | | |
| | | | | Net assets 100.0% | | $ | 14,453,030 | | |
* Non-income producing security.
(a) All or a portion of this security is segregated in connection with obligations for futures, swaps, options written, and/or forward foreign currency contracts with a total value of $7,378,365.
(b) All or a portion of this security is pledged with the custodian for securities sold short and options written.
(c) Represents less than 0.05% of net assets.
See Notes to Financial Statements
17
Schedule of Investments Absolute Return Multi-Manager Portfolio (cont'd)
(d) Security fair valued as of December 31, 2016 in accordance with procedures approved by the Board of Trustees. Total value of all such securities at December 31, 2016 amounted to $8,944, which represents 0.1% of net assets of the Fund.
(e) Illiquid security.
(f) Issuer filed for bankruptcy.
(g) Securities were purchased or sold short under Rule 144A of the Securities Act of 1933, as amended (the "1933 Act"), or are otherwise restricted and, unless registered under the 1933 Act or exempted from registration, may only be sold to qualified institutional investors or may have other restrictions on resale. At December 31, 2016, these securities amounted to $683,297 of long positions and $(137,004) of short positions, or 4.7% and (0.9)%, respectively, of net assets for the Fund. Securities denoted with "(g)" but without "(e)" have been deemed by the investment manager to be liquid.
(h) Variable or floating rate security. The interest rate shown was the current rate as of December 31, 2016 and changes periodically.
(i) All or a portion of this security had not settled as of December 31, 2016 and thus may not have an interest rate in effect. Interest rates do not take effect until settlement.
(j) Defaulted security.
(k) Amount less than one dollar.
(l) Represents 7-day effective yield as of December 31, 2016.
(m) At December 31, 2016 the Fund had $3,676,436 deposited in one or more accounts to satisfy collateral requirements for borrowing in connection with securities sold short.
(n) When-issued security. Total value of all such securities at December 31, 2016 amounted to $(12,826), which represents (0.1)% of net assets of the Fund.
(o) Includes the impact of the Fund's open positions in derivatives at December 31, 2016.
Abbreviations
ADR American Depositary Receipt
DIP Debtor-in-Possession
FDR Fiduciary Depositary Receipt
Fka Formerly known as
GDR Global Depositary Receipt
PJSC Public Joint Stock Company
SPDR Standard & Poor's Depositary Receipt
See Notes to Financial Statements
18
Schedule of Investments Absolute Return Multi-Manager Portfolio (cont'd)
Derivative Instruments
Futures contracts ("futures")
At December 31, 2016, open positions in futures for the Fund were as follows:
Expiration | | Open Contracts | | Position | | Unrealized
Appreciation/
(Depreciation) | |
3/17/2017 | | 2 S&P 500 E-Mini Index | | Short | | $ | 1,832 | | |
3/17/2017 | | 9 The EURO STOXX 50 Index | | Short | | | (9,038 | ) | |
Total futures | | | | | | $ | (7,206 | ) | |
At December 31, 2016, the notional value of futures for the Fund was $(534,078) for short positions.
For the year ended December 31, 2016, the average notional value of futures for the Fund was $(342,716) for short positions. The Fund had $32,447 deposited in segregated accounts to cover margin requirements on open futures.
Forward foreign currency contracts ("forward contracts")
At December 31, 2016, open forward contracts for the Fund were as follows:
Contracts to Deliver | | In Exchange For | | Counterparty | | Settlement
Date | | Net
Unrealized
Appreciation/
(Depreciation) | |
| | 9,338 | | | Canadian Dollar | | $ | 6,903 | | | JPMorgan Chase Bank, NA | | 3/30/2017 | | $ | (59 | ) | |
| | 224,337 | | | Euro | | | 235,822 | | | JPMorgan Chase Bank, NA | | 1/13/2017 | | | (473 | ) | |
| | 6,248 | | | Euro | | | 6,561 | | | JPMorgan Chase Bank, NA | | 3/30/2017 | | | (45 | ) | |
| | 760,819 | | | Hong Kong Dollar | | | 98,067 | | | JPMorgan Chase Bank, NA | | 1/13/2017 | | | (49 | ) | |
| | 194,710 | | | Mexican Peso | | | 9,428 | | | JPMorgan Chase Bank, NA | | 1/13/2017 | | | 48 | | |
| | 116,495 | | | Pound Sterling | | | 146,016 | | | JPMorgan Chase Bank, NA | | 1/13/2017 | | | 2,402 | | |
| | 353,137 | | | Swedish Krona | | | 38,057 | | | JPMorgan Chase Bank, NA | | 1/13/2017 | | | (734 | ) | |
| | 68,240 | | | Swedish Krona | | | 7,509 | | | JPMorgan Chase Bank, NA | | 3/30/2017 | | | (19 | ) | |
| | 9,950 | | | Swiss Franc | | | 9,729 | | | JPMorgan Chase Bank, NA | | 1/13/2017 | | | (48 | ) | |
| | 5,000 | | | Turkish Lira | | | 1,414 | | | JPMorgan Chase Bank, NA | | 1/13/2017 | | | (1 | ) | |
Total forward contracts to deliver | | | | | | | | | | $ | 1,022 | | |
For the year ended December 31, 2016, the average notional value of forward contracts for the Fund was $652,306.
Equity swap contracts ("equity swaps")
At December 31, 2016, the outstanding equity swaps* for the Fund were as follows:
Counterparty | | Description | | Expiration
Date(s) | | Value | |
JPMorgan Chase
Bank, NA | | The Fund receives the total return on long positions and pays a specified
LIBOR or Federal Funds floating rate, which is denominated in various foreign
currencies based on the local currencies of the positions. The Fund pays the
total return on short positions and receives a specified LIBOR or Federal Funds
floating rate, which is denominated in various foreign currencies based on
the local currencies of the positions. | | 2/2/2017-
12/27/2017 | | $ | 2,604 | | |
* The following table represents the individual long and short positions and related values of the equity swaps with JPMorgan Chase Bank, NA as of December 31, 2016.
See Notes to Financial Statements
19
Schedule of Investments Absolute Return Multi-Manager Portfolio (cont'd)
Reference Entity | | Shares | | Notional
Value(a)(b) | | Net Unrealized
Appreciation/
(Depreciation) | |
Long Positions | |
Australia | |
Bradken Ltd. | | | 6,258 | | | $ | 14,497 | | | $ | 45 | | |
Cover-More Group Ltd. | | | 3,865 | | | | 5,243 | | | | 140 | | |
| | | | | | | | 185 | | |
Germany | |
KUKA AG | | | 50 | | | | 5,639 | | | | 405 | | |
Ireland | |
Fyffes plc | | | 4,924 | | | | 11,559 | | | | 156 | | |
Italy | |
Buzzi Unicem SpA | | | 1,300 | | | | 13,345 | | | | 2,433 | | |
Netherlands | |
Delta Lloyd NV | | | 2,650 | | | | 14,809 | | | | 23 | | |
United Kingdom | |
Brammer plc | | | 500 | | | | 1,020 | | | | (1 | ) | |
Sky plc | | | 2,150 | | | | 26,125 | | | | 133 | | |
| | | | | | | | 132 | | |
United States | |
Reynolds American, Inc. | | | 200 | | | | 10,845 | | | | 363 | | |
Safeway, Inc. | | | 3,007 | | | | 0 | (d) | | | 752 | (c) | |
Safeway, Inc. | | | 3,007 | | | | 0 | (d) | | | 60 | (c) | |
| | | | | | | | 1,175 | | |
Total Long Positions of Equity Swaps | | | | | | | 4,509 | | |
Short Positions | |
Canada | |
Fairfax Financial Holdings Ltd. | | | (11 | ) | | | (5,242 | ) | | | (71 | ) | |
Italy | |
Buzzi Unicem SpA | | | (702 | ) | | | (13,310 | ) | | | (3,324 | ) | |
United Kingdom | |
British American Tobacco plc | | | (110 | ) | | | (5,953 | ) | | | (312 | ) | |
Total Short Positions of Equity Swaps | | | | | | | (3,707 | ) | |
Total Long and Short Positions of Equity Swaps | | | | | | | 802 | | |
Financing Costs and Other Receivables/(Payables) | | | | | | | 1,802 | | |
Equity Swaps, at value—JPMorgan Chase Bank, NA | | | | | | $ | 2,604 | | |
Counterparty | | Description | | Expiration
Date(s) | | Value | |
| Morgan Stanley
Capital Services LLC
| | | The Fund receives the total return on long positions and pays a specified
LIBOR or Federal Funds floating rate, which is denominated in various foreign
currencies based on the local currencies of the positions. The Fund pays the
total return on short positions and receives a specified LIBOR or Federal Funds
floating rate, which is denominated in various foreign currencies based on
the local currencies of the positions. | | 9/15/2017-
12/12/2017 | | $ | 31,621 | | |
* The following table represents the individual long and short positions and related values of the equity swaps with Morgan Stanley Capital Services LLC as of December 31, 2016.
See Notes to Financial Statements
20
Schedule of Investments Absolute Return Multi-Manager Portfolio (cont'd)
Reference Entity | | Shares | | Notional
Value(a)(b) | | Net Unrealized
Appreciation/
(Depreciation) | |
Long Positions | |
Brazil | |
Hypermarcas SA | | | 1,381 | | | $ | 9,216 | | | $ | 1,871 | | |
France | |
Amundi SA | | | 192 | | | | 8,785 | | | | 1,265 | | |
BNP Paribas SA | | | 551 | | | | 28,756 | | | | 6,364 | | |
Iliad SA | | | 220 | | | | 48,656 | | | | (6,358 | ) | |
JCDecaux SA | | | 187 | | | | 6,786 | | | | (1,288 | ) | |
Publicis Groupe SA | | | 479 | | | | 30,683 | | | | 2,368 | | |
Remy Cointreau SA | | | 305 | | | | 21,876 | | | | 4,136 | | |
Societe Generale SA | | | 438 | | | | 16,669 | | | | 4,884 | | |
| | | | | | | | 11,371 | | |
Ireland | |
Ryanair Holdings plc | | | 3,959 | | | | 57,056 | | | | 3,392 | | |
Jordan | |
Hikma Pharmaceuticals plc | | | 725 | | | | 20,316 | | | | (3,402 | ) | |
Luxembourg | |
Eurofins Scientific SE | | | 58 | | | | 20,562 | | | | 4,164 | | |
South Africa | |
Aspen Pharmacare Holdings Ltd. | | | 535 | | | | 10,728 | | | | 319 | | |
South Korea | |
NAVER Corp. | | | 21 | | | | 12,313 | | | | 1,162 | | |
Switzerland | |
LafargeHolcim Ltd. | | | 915 | | | | 40,567 | | | | 7,641 | | |
Nestle SA | | | 1,095 | | | | 73,006 | | | | 5,546 | | |
Syngenta AG | | | 138 | | | | 52,857 | | | | 1,690 | | |
| | | | | | | | 14,877 | | |
Turkey | |
Migros Ticaret A/S | | | 1,200 | | | | 7,213 | | | | (1,231 | ) | |
United Kingdom | |
Admiral Group plc | | | 395 | | | | 9,167 | | | | (273 | ) | |
Barclays plc | | | 5,547 | | | | 12,814 | | | | 2,462 | | |
Burberry Group plc | | | 163 | | | | 2,507 | | | | 500 | | |
Croda International plc | | | 476 | | | | 18,762 | | | | (14 | ) | |
ITV plc | | | 16,534 | | | | 38,342 | | | | 3,715 | | |
Pets at Home Group plc | | | 466 | | | | 1,644 | | | | (271 | ) | |
RSA Insurance Group plc | | | 2,433 | | | | 14,179 | | | | 3,392 | | |
Smith & Nephew plc | | | 299 | | | | 4,672 | | | | (173 | ) | |
Smiths Group plc | | | 370 | | | | 5,082 | | | | 1,375 | | |
Sports Direct International plc | | | 15,259 | | | | 60,998 | | | | (8,607 | ) | |
| | | | | | | | 2,106 | | |
Total Long Positions of Equity Swaps | | | | | | | 34,629 | | |
See Notes to Financial Statements
21
Schedule of Investments Absolute Return Multi-Manager Portfolio (cont'd)
Reference Entity | | Shares | | Notional
Value(a)(b) | | Net Unrealized
Appreciation/
(Depreciation) | |
Short Positions | |
France | |
Air France-KLM | | | (2,096 | ) | | $ | (14,570 | ) | | $ | 3,154 | | |
Electricite de France SA | | | (633 | ) | | | (8,213 | ) | | | 1,763 | | |
Kering | | | (97 | ) | | | (16,031 | ) | | | (5,749 | ) | |
Lagardere SCA | | | (872 | ) | | | (23,250 | ) | | | (978 | ) | |
LVMH Moet Hennessy Louis Vuitton SE | | | (405 | ) | | | (72,600 | ) | | | (4,735 | ) | |
Orange SA | | | (1,761 | ) | | | (28,166 | ) | | | 1,408 | | |
| | | | | | | | (5,137 | ) | |
Germany | |
adidas AG | | | (200 | ) | | | (33,075 | ) | | | 1,464 | | |
Deutsche Lufthansa AG | | | (1,128 | ) | | | (15,492 | ) | | | 923 | | |
Deutsche Telekom AG | | | (1,660 | ) | | | (27,769 | ) | | | (810 | ) | |
| | | | | | | | 1,577 | | |
Italy | |
Eni SpA | | | (1,558 | ) | | | (22,760 | ) | | | (2,612 | ) | |
Netherlands | |
Koninklijke Ahold Delhaize NV | | | (1,553 | ) | | | (33,865 | ) | | | 1,120 | | |
Spain | |
Industria de Diseno Textil SA | | | (1,178 | ) | | | (38,239 | ) | | | (1,974 | ) | |
Switzerland | |
Givaudan SA | | | (15 | ) | | | (27,464 | ) | | | (23 | ) | |
Roche Holding AG | | | (44 | ) | | | (11,401 | ) | | | 1,351 | | |
| | | | | | | | 1,328 | | |
United Kingdom | |
Bunzl plc | | | (1,162 | ) | | | (27,918 | ) | | | (2,284 | ) | |
GlaxoSmithKline plc | | | (932 | ) | | | (16,227 | ) | | | (1,714 | ) | |
Marks & Spencer Group plc | | | (16,631 | ) | | | (84,724 | ) | | | 12,987 | | |
WPP plc | | | (1,506 | ) | | | (29,406 | ) | | | (4,298 | ) | |
| | | | | | | | 4,691 | | |
United States | |
Merck & Co., Inc. | | | (188 | ) | | | (10,238 | ) | | | (830 | ) | |
Pfizer, Inc. | | | (324 | ) | | | (10,495 | ) | | | (28 | ) | |
| | | | | | | | (858 | ) | |
Total Short Positions of Equity Swaps | | | | | | | (1,865 | ) | |
Total Long and Short Positions of Equity Swaps | | | | | | | 32,764 | | |
Financing Costs and Other Receivables/(Payables) | | | | | | | (1,143 | ) | |
Equity Swaps, at value—Morgan Stanley Capital Services LLC | | | | | | $ | 31,621 | | |
Total Equity Swaps, at value | | | | | | $ | 34,225 | | |
See Notes to Financial Statements
22
Schedule of Investments Absolute Return Multi-Manager Portfolio (cont'd)
(a) Notional value represents the value (including any fees or commissions) of the long and short positions when they were established.
(b) For the year ended December 31, 2016, the average notional value of equity swaps for the Fund was $1,067,903 for long positions and $(491,320) for short positions.
(c) Illiquid security.
(d) Amount less than one dollar.
At December 31, 2016, the Fund had cash collateral of $270,000 deposited in a segregated account for Morgan Stanley Capital Services LLC, to cover collateral requirements on OTC derivatives.
Total return swap contracts ("total return swaps")
For the year ended December 31, 2016, the average notional value of total return swaps for the Fund was $60,841 for long positions and $(34,282) for short positions. At December 31, 2016, the Fund had no total return swaps outstanding.
Written option contracts ("options written")
At December 31, 2016, the Fund had outstanding options written as follows:
Name of Issuer | | Contracts | | Exercise
Price | | Expiration
Date | | Market Value
of Options | |
CBS Corp., Call | | | 7 | | | $ | 65 | | | 3/17/2017 | | $ | (1,701 | ) | |
CBS Corp., Put | | | 7 | | | | 50 | | | 3/17/2017 | | | (196 | ) | |
Hewlett Packard Enterprise Co., Call | | | 1 | | | | 23 | | | 1/20/2017 | | | (63 | ) | |
Hewlett Packard Enterprise Co., Call | | | 2 | | | | 23.5 | | | 1/20/2017 | | | (75 | ) | |
InterOil Corp., Put | | | 9 | | | | 47.5 | | | 1/20/2017 | | | (585 | ) | |
Time Warner, Inc., Call | | | 1 | | | | 95 | | | 4/21/2017 | | | (407 | ) | |
Total options written (Premium received $2,919) | | | | | | | | $ | (3,027 | ) | |
Options written for the Fund for the year ended December 31, 2016 were as follows:
| | Number of
Contracts | | Premium
Received | |
Outstanding 12/31/15 | | | 53 | | | $ | 5,745 | | |
Options written | | | 281 | | | | 21,650 | | |
Options closed | | | (142 | ) | | | (14,313 | ) | |
Options exercised | | | — | | | | — | | |
Options expired | | | (165 | ) | | | (10,163 | ) | |
Outstanding 12/31/16 | | | 27 | | | $ | 2,919 | | |
For the year ended December 31, 2016, the Fund had an average market value of $10,216 in purchased option contracts, and $(3,517) in options written, respectively.
See Notes to Financial Statements
23
Schedule of Investments Absolute Return Multi-Manager Portfolio (cont'd)
The following is a summary, categorized by Level (see Note A of Notes to Financial Statements), of inputs used to value the Fund's investments as of December 31, 2016:
Asset Valuation Inputs | |
| | | Level 1 | | Level 2 | | Level 3* | | Total | |
Investments: | |
Common Stocks | |
Capital Markets | | $ | 440 | | | $ | — | | | $ | — | (b) | | $ | 440 | | |
Health Care Providers & Services | | | 194,854 | | | | 13,725 | | | | — | | | | 208,579 | | |
Insurance | | | 155,007 | | | | 43,616 | | | | — | | | | 198,623 | | |
Internet Software & Services | | | 284,017 | | | | 24,926 | | | | — | | | | 308,943 | | |
Media | | | 452,565 | | | | 5,050 | | | | — | | | | 457,615 | | |
| Other Common Stocks(a) | | | 6,133,635 | | | | — | | | | — | | | | 6,133,635 | | |
Total Common Stocks | | | 7,220,518 | | | | 87,317 | | | | — | | | | 7,307,835 | | |
Loan Assignments | |
Auto Components | | | — | | | | — | | | | 14,070 | | | | 14,070 | | |
Household Products | | | — | | | | — | | | | 6,060 | | | | 6,060 | | |
Independent Power & Renewable Electricity Producers | | | — | | | | — | | | | 13,486 | | | | 13,486 | | |
IT Services | | | — | | | | — | | | | 17,085 | | | | 17,085 | | |
Professional Services | | | — | | | | — | | | | 15,593 | | | | 15,593 | | |
Semiconductors & Semiconductor Equipment | | | — | | | | 35,281 | | | | 27,720 | | | | 63,001 | | |
| Other Loan Assignments(a) | | | — | | | | 921,824 | | | | — | | | | 921,824 | | |
Total Loan Assignments | | | — | | | | 957,105 | | | | 94,014 | | | | 1,051,119 | | |
Corporate Bonds | |
Chemicals | | | — | | | | — | | | | — | (b) | | | — | (b) | |
Insurance | | | — | | | | 44,635 | | | | 2,217 | | | | 46,852 | | |
Oil, Gas & Consumable Fuels | | | — | | | | 82,003 | | | | — | (b) | | | 82,003 | | |
| Other Corporate Bonds(a) | | | — | | | | 632,131 | | | | — | | | | 632,131 | | |
Total Corporate Bonds | | | — | | | | 758,769 | | | | 2,217 | | | | 760,986 | | |
Master Limited Partnerships | | | 673,741 | | | | — | | | | — | | | | 673,741 | | |
Convertible Bonds | |
Semiconductors & Semiconductor Equipment | | | — | | | | — | | | | 11,400 | | | | 11,400 | | |
| Other Convertible Bonds(a) | | | — | | | | 131,818 | | | | — | | | | 131,818 | | |
Total Convertible Bonds | | | — | | | | 131,818 | | | | 11,400 | | | | 143,218 | | |
U.S. Treasury Obligations | | | — | | | | 27,293 | | | | — | | | | 27,293 | | |
Rights | |
Biotechnology | | | — | | | | — | | | | 3,771 | | | | 3,771 | | |
Energy Equipment & Services | | | — | | | | — | | | | 733 | | | | 733 | | |
Food & Staples Retailing | | | — | | | | — | | | | 270 | | | | 270 | | |
Health Care Providers & Services | | | 1 | | | | — | | | | — | | | | 1 | | |
Semiconductors & Semiconductor Equipment | | | — | | | | — | | | | 15,702 | | | | 15,702 | | |
Total Rights | | | 1 | | | | — | | | | 20,476 | | | | 20,477 | | |
See Notes to Financial Statements
24
Schedule of Investments Absolute Return Multi-Manager Portfolio (cont'd)
Asset Valuation Inputs | |
| | | Level 1 | | Level 2 | | Level 3* | | Total | |
Options Purchased | |
Industrial Conglomerates | | $ | 355 | | | $ | — | | | $ | 15 | | | $ | 370 | | |
| Other Options Purchased(a) | | | 7,483 | | | | — | | | | — | | | | 7,483 | | |
Total Options Purchased | | | 7,838 | | | | — | | | | 15 | | | | 7,853 | | |
| Warrants(a) | | | — | | | | — | | | | — | (b) | | | — | (b) | |
Short-Term Investments | | | — | | | | 4,062,628 | | | | — | | | | 4,062,628 | | |
Total Long Positions | | $ | 7,902,098 | | | $ | 6,024,930 | | | $ | 128,122 | | | $ | 14,055,150 | | |
(a) The Schedule of Investments provides information on the industry categorization for the portfolio.
(b) Amount less than one dollar.
* The following is a reconciliation between the beginning and ending balances of investments in which unobservable inputs (Level 3) were used in determining value:
| | | Beginning
balance as
of 1/1/16 | | Accrued
discounts/
(premiums) | | Realized
gain/(loss)
and change
in unrealized
appreciation/
(depreciation) | | Purchases | | Sales | | Transfers
into
Level 3 | | Transfers
out of
Level 3 | | Balance as
of 12/31/16 | | Net change in
unrealized
appreciation/
(depreciation)
from
investments
still held as of
12/31/16 | |
Investments in Securities: | |
| Common Stocks(a) | |
Capital Markets | | $ | — | | | $ | — | | | $ | (993 | ) | | $ | — | | | $ | — | | | $ | 993 | | | $ | — | | | $ | — | (c) | | $ | (993 | ) | |
Health Care
Equipment & Supplies | | | 175 | | | | — | | | | (175 | ) | | | — | | | | — | | | | — | | | | — | | | | — | | | | — | | |
| Loan Assignments(b) | |
Auto Components | | | — | | | | 2 | | | | 208 | | | | 13,860 | | | | — | | | | — | | | | — | �� | | | 14,070 | | | | 208 | | |
Capital Markets | | | 34,464 | | | | 11 | | | | 190 | | | | — | | | | (34,665 | ) | | | — | | | | — | | | | — | | | | — | | |
Commercial
Services & Supplies | | | 11,885 | | | | 14 | | | | 864 | | | | 962 | | | | (13,725 | ) | | | — | | | | — | | | | — | | | | — | | |
Diversified Financial
Services | | | 47,500 | | | | — | | | | — | | | | — | | | | — | | | | — | | | | (47,500 | ) | | | — | | | | — | | |
Diversified
Telecommunications
Services | | | 6,774 | | | | 9 | | | | 112 | | | | — | | | | (6,895 | ) | | | — | | | | — | | | | — | | | | — | | |
Electronic Equipment,
Instruments &
Components | | | 1,800 | | | | 2 | | | | (23 | ) | | | — | | | | (1,779 | ) | | | — | | | | — | | | | — | | | | — | | |
Health Care
Providers & Services | | | 11,315 | | | | — | | | | — | | | | — | | | | — | | | | — | | | | (11,315 | ) | | | — | | | | — | | |
Household Products | | | — | | | | 1 | | | | 245 | | | | 11,880 | | | | (6,066 | ) | | | — | | | | — | | | | 6,060 | | | | 137 | | |
See Notes to Financial Statements
25
Schedule of Investments Absolute Return Multi-Manager Portfolio (cont'd)
| | | Beginning
balance as
of 1/1/16 | | Accrued
discounts/
(premiums) | | Realized
gain/(loss)
and change
in unrealized
appreciation/
(depreciation) | | Purchases | | Sales | | Transfers
into
Level 3 | | Transfers
out of
Level 3 | | Balance as
of 12/31/16 | | Net change in
unrealized
appreciation/
(depreciation)
from
investments
still held as of
12/31/16 | |
Independent
Power & Renewable
Electricity Producers | | $ | — | | | $ | 421 | | | $ | 2,370 | | | $ | 10,720 | | | $ | (25 | ) | | $ | — | | | $ | — | | | $ | 13,486 | | | $ | 2,372 | | |
Internet Software &
Services | | | 57,954 | | | | 54 | | | | 74 | | | | — | | | | (58,082 | ) | | | — | | | | — | | | | — | | | | — | | |
IT Services | | | — | | | | — | | | | 255 | | | | 16,830 | | | | — | | | | — | | | | — | | | | 17,085 | | | | 255 | | |
Media | | | 6,580 | | | | — | | | | — | | | | — | | | | — | | | | — | | | | (6,580 | ) | | | — | | | | — | | |
Professional Services | | | 20,475 | | | | 62 | | | | 411 | | | | — | | | | (5,355 | ) | | | — | | | | — | | | | 15,593 | | | | 216 | | |
Semiconductors &
Semiconductor
Equipment | | | — | | | | (15 | ) | | | 98 | | | | 32,671 | | | | (5,034 | ) | | | — | | | | — | | | | 27,720 | | | | 120 | | |
| Corporate Bonds(b) | |
Chemicals | | | — | (c) | | | — | | | | — | | | | — | | | | — | | | | — | | | | — | | | | — | (c) | | | — | | |
Insurance | | | — | | | | 1 | | | | (299 | ) | | | 2,515 | | | | — | | | | — | | | | — | | | | 2,217 | | | | (297 | ) | |
Oil, Gas &
Consumable Fuels | | | — | | | | — | | | | — | | | | — | (c) | | | — | | | | — | | | | — | | | | — | (c) | | | — | | |
| Convertible Bonds(b) | |
Semiconductors &
Semiconductor
Equipment | | | — | | | | 384 | | | | (3,159 | ) | | | 14,175 | | | | — | | | | — | | | | — | | | | 11,400 | | | | (3,159 | ) | |
Rights | |
| Biotechnology(a) | | | 55 | | | | — | | | | 3,716 | | | | — | | | | — | | | | — | | | | — | | | | 3,771 | | | | 3,716 | | |
Energy
Equipment & Services(a) | | | — | | | | — | | | | — | | | | 733 | | | | — | | | | — | | | | — | | | | 733 | | | | — | | |
Food & Staples
Retailing(b) | | | 400 | | | | — | | | | (130 | ) | | | — | | | | — | | | | — | | | | — | | | | 270 | | | | (130 | ) | |
Semiconductors &
Semiconductor
Equipment(a) | | | — | | | | — | | | | 5,755 | | | | 9,947 | | | | — | | | | — | | | | — | | | | 15,702 | | | | 5,755 | | |
| Options Purchased(a) | |
Industrial
Conglomerates | | | — | | | | — | | | | (546 | ) | | | 561 | | | | — | | | | — | | | | — | | | | 15 | | | | (546 | ) | |
| Warrants(a) | |
Biotechnology | | | — | | | | — | | | | — | | | | — | (c) | | | — | | | | — | | | | — | | | | — | (c) | | | — | | |
Total | | $ | 199,377 | | | $ | 946 | | | $ | 8,973 | | | $ | 114,854 | | | $ | (131,626 | ) | | $ | 993 | | | $ | (65,395 | ) | | $ | 128,122 | | | $ | 7,654 | | |
(a) As of the year ended December 31, 2016, these investments did not have a material impact on the Fund's net assets and, therefore, disclosure of unobservable inputs used in formulating valuations is not presented.
See Notes to Financial Statements
26
Schedule of Investments Absolute Return Multi-Manager Portfolio (cont'd)
(b) These securities are valued based on a single quotation obtained from a dealer. The Fund does not have access to unobservable inputs and therefore cannot disclose such inputs used in formulating such quotation.
(c) Amount less than one dollar.
As of the year ended December 31, 2016, certain securities were transferred from one level (as of December 31, 2015) to another. Based on beginning of period market values as of January 1, 2016, $65,395 was transferred from Level 3 to Level 2. In addition, $993 was transferred from Level 1 to Level 3. Loan assignments and common stocks that transferred in or out of Level 3 were primarily due to the pricing methodology being based on a single broker quote (Level 3) or the pricing methodology being based on dated inputs by Management (Level 3).
The following is a summary, categorized by Level (see Note A of Notes to Financial Statements), of inputs used to value the Fund's short investments as of December 31, 2016:
Liability Valuation Inputs | |
| | | Level 1 | | Level 2 | | Level 3 | | Total | |
Investments: | |
| Common Stocks Sold Short(a) | | $ | (2,594,925 | ) | | $ | — | | | $ | — | | | $ | (2,594,925 | ) | |
Exchange Traded Funds Sold Short | | | (406,696 | ) | | | — | | | | — | | | | (406,696 | ) | |
| Corporate Bonds Sold Short(a) | | | — | | | | (362,117 | ) | | | — | | | | (362,117 | ) | |
Master Limited Partnerships Sold Short | | | (112,765 | ) | | | — | | | | — | | | | (112,765 | ) | |
Exchange Traded Note Sold Short | | | (47,289 | ) | | | — | | | | — | | | | (47,289 | ) | |
Total Short Positions | | $ | (3,161,675 | ) | | $ | (362,117 | ) | | $ | — | | | $ | (3,523,792 | ) | |
(a) The Schedule of Investments provides information on the industry categorization for the portfolio.
The following is a summary, categorized by Level (see Note A of Notes to Financial Statements), of inputs used to value the Fund's derivatives as of December 31, 2016:
Other Financial Instruments | |
| | | Level 1 | | Level 2 | | Level 3* | | Total | |
| Forward contracts(a) | |
Assets | | $ | — | | | $ | 2,450 | | | $ | — | | | $ | 2,450 | | |
Liabilities | | | — | | | | (1,428 | ) | | | — | | | | (1,428 | ) | |
| Futures(a) | |
Assets | | | 1,832 | | | | — | | | | — | | | | 1,832 | | |
Liabilities | | | (9,038 | ) | | | — | | | | — | | | | (9,038 | ) | |
| Swap contracts(a) | |
Assets | | | — | | | | 85,916 | | | | 812 | | | | 86,728 | | |
Liabilities | | | — | | | | (52,503 | ) | | | — | | | | (52,503 | ) | |
Option contracts written | |
Liabilities | | | (3,027 | ) | | | — | | | | — | | | | (3,027 | ) | |
Total | | $ | (10,233 | ) | | $ | 34,435 | | | $ | 812 | | | $ | 25,014 | | |
(a) Forward contracts, futures and swap contracts are reported at the cumulative unrealized appreciation/(depreciation) of the instrument.
See Notes to Financial Statements
27
Schedule of Investments Absolute Return Multi-Manager Portfolio (cont'd)
* The following is a reconciliation between the beginning and ending balances of derivative investments in which unobservable inputs (Level 3) were used in determining value:
| | | Beginning
balance as
of 1/1/16 | | Accrued
discounts/
(premiums) | | Realized
gain/(loss)
and change
in unrealized
appreciation/
(depreciation) | | Purchases | | Sales | | Transfers
into
Level 3 | | Transfers
out of
Level 3 | | Balance as
of 12/31/16 | | Net change in
unrealized
appreciation/
(depreciation)
from
investments
still held as of
12/31/16 | |
Investments in Securities: | |
Equity Swaps(a) | |
United States | | $ | 1,203 | | | $ | — | | | $ | (391 | ) | | $ | — | | | $ | — | | | $ | — | | | $ | — | | | $ | 812 | | | $ | (391 | ) | |
Total | | $ | 1,203 | | | $ | — | | | $ | (391 | ) | | $ | — | | | $ | — | | | $ | — | | | $ | — | | | $ | 812 | | | $ | (391 | ) | |
(a) These securities are valued based on a single quotation obtained from a dealer. The Fund does not have access to unobservable inputs and therefore cannot disclose such inputs used in formulating such quotation.
See Notes to Financial Statements
28
Statement of Assets and Liabilities
Neuberger Berman Advisers Management Trust
| | | ABSOLUTE
RETURN MULTI-
MANAGER
PORTFOLIO | |
| | | December 31, 2016 | |
Assets | | | |
Investments in securities, at value* (Note A)—see Schedule of Investments: | | | |
Unaffiliated issuers | | $ | 14,055,150 | |
Due from custodian | | | 7,652 | |
Foreign currency* | | | 241,381 | |
Cash collateral segregated for short sales (Note A) | | | 3,676,436 | |
Cash collateral segregated for futures contracts (Note A) | | | 32,447 | |
Cash collateral segregated for swap contracts (Note A) | | | 270,000 | |
Dividends and interest receivable | | | 28,792 | |
Receivable for securities sold | | | 519,361 | |
Receivable for Fund shares sold | | | 16,925 | |
Receivable from administrator—net (Note B) | | | 36,957 | |
OTC swap contracts, at value (Note A) | | | 86,728 | |
Receivable for forward foreign currency contracts (Note A) | | | 2,450 | |
Prepaid expenses and other assets | | | 289 | |
Total Assets | | | 18,974,568 | |
Liabilities | |
Investments sold short, at value** (Note A) | | | 3,523,792 | |
Options contracts written, at value*** (Note A) | | | 3,027 | |
Due to custodian | | | 73,935 | |
Dividends and interest payable for short sales | | | 10,374 | |
OTC swap contracts, at value (Note A) | | | 52,503 | |
Payable to investment manager (Note B) | | | 20,843 | |
Payable for securities purchased | | | 693,774 | |
Payable for Fund shares redeemed | | | 2,173 | |
Payable for variation margin on futures contracts (Note A) | | | 943 | |
Payable for forward foreign currency contracts (Note A) | | | 1,428 | |
Accrued expenses and other payables | | | 138,746 | |
Total Liabilities | | | 4,521,538 | |
Net Assets | | $ | 14,453,030 | |
Net Assets consist of: | |
Paid-in capital | | $ | 15,207,536 | |
Undistributed net investment income (loss) | | | (44,681 | ) |
Accumulated net realized gains (losses) on investments | | | (821,277 | ) |
Net unrealized appreciation (depreciation) in value of investments | | | 111,452 | |
Net Assets | | $ | 14,453,030 | |
Shares Outstanding ($.001 par value; unlimited shares authorized) | | | 1,556,767 | |
Net Asset Value, offering and redemption price per share | | | | |
Class S | | $ | 9.28 | |
*Cost of Investments: | | | | |
Unaffiliated issuers | | $ | 13,943,605 | |
Total cost of foreign currency | | $ | 251,486 | |
**Proceeds from investments sold short | | $ | 3,508,867 | |
***Premium received from option contracts written | | $ | 2,919 | |
See Notes to Financial Statements
29
Neuberger Berman Advisers Management Trust
| | | ABSOLUTE
RETURN MULTI-
MANAGER
PORTFOLIO | |
| | | For the
Year Ended
December 31, 2016 | |
Investment Income: | |
Income (Note A): | |
Dividend income—unaffiliated issuers | | $ | 162,567 | | |
Interest and other income—unaffiliated issuers | | | 111,495 | | |
Foreign taxes withheld (Note A) | | | (2,610 | ) | |
Total income | | $ | 271,452 | | |
Expenses: | |
Investment management fees (Note B) | | | 240,688 | | |
Administration fees (Note B) | | | 42,474 | | |
Distribution fees (Note B) | | | 35,395 | | |
Audit fees | | | 81,800 | | |
Custodian and accounting fees (Note A) | | | 295,271 | | |
Legal fees | | | 68,144 | | |
Shareholder reports | | | 28,087 | | |
Trustees' fees and expenses | | | 55,185 | | |
Dividend and interest expense on securities sold short (Note A) | | | 119,508 | | |
Miscellaneous | | | 1,043 | | |
Total expenses | | | 967,595 | | |
Expenses reimbursed by Management (Note B) | | | (508,177 | ) | |
Total net expenses | | | 459,418 | | |
Net investment income (loss) | | $ | (187,966 | ) | |
Realized and Unrealized Gain (Loss) on Investments (Note A): | |
Net realized gain (loss) on: | |
Sales of investment securities of unaffiliated issuers | | | 34,825 | | |
Sales of investment securities of unaffiliated issuers sold short | | | (149,006 | ) | |
Forward foreign currency contracts | | | (5,175 | ) | |
Foreign currency | | | (19,540 | ) | |
Futures contracts | | | (39,631 | ) | |
Option contracts written | | | 10,383 | | |
Swap contracts | | | (13,999 | ) | |
Change in net unrealized appreciation (depreciation) in value of: | |
Unaffiliated investment securities | | | 406,007 | | |
Unaffiliated investment securities sold short | | | (121,659 | ) | |
Unfunded loan commitments | | | 19 | | |
Forward foreign currency contracts | | | 18,290 | | |
Foreign currency | | | (14,244 | ) | |
Futures contracts | | | (5,400 | ) | |
Option contracts written | | | (1,771 | ) | |
Swap contracts | | | 39,407 | | |
Net gain (loss) on investments | | | 138,506 | | |
Net increase (decrease) in net assets resulting from operations | | $ | (49,460 | ) | |
See Notes to Financial Statements
30
Statements of Changes in Net Assets
Neuberger Berman Advisers Management Trust
| | | ABSOLUTE RETURN
MULTI-MANAGER PORTFOLIO | |
| | | Year Ended
December 31,
2016 | | Year Ended
December 31,
2015 | |
Increase (Decrease) in Net Assets: | |
From Operations (Note A): | |
Net investment income (loss) | | $ | (187,966 | ) | | $ | (145,715 | ) | |
Net realized gain (loss) on investments | | | (182,143 | ) | | | (367,443 | ) | |
Change in net unrealized appreciation (depreciation) of investments | | | 320,649 | | | | (202,720 | ) | |
Net increase (decrease) in net assets resulting from operations | | | (49,460 | ) | | | (715,878 | ) | |
Distributions to Shareholders From (Note A): | |
Net realized gain on investments | | | (77,182 | ) | | | (136,289 | ) | |
Total distributions to shareholders | | | (77,182 | ) | | | (136,289 | ) | |
From Fund Share Transactions (Note D): | |
Proceeds from shares sold | | | 4,621,144 | | | | 7,043,699 | | |
Proceeds from reinvestment of dividends and distributions | | | 77,182 | | | | 136,289 | | |
Payments for shares redeemed | | | (3,344,345 | ) | | | (1,572,404 | ) | |
Net increase (decrease) from Fund share transactions | | | 1,353,981 | | | | 5,607,584 | | |
Net Increase (Decrease) in Net Assets | | | 1,227,339 | | | | 4,755,417 | | |
Net Assets: | |
Beginning of year | | | 13,225,691 | | | | 8,470,274 | | |
End of year | | $ | 14,453,030 | | | $ | 13,225,691 | | |
Undistributed net investment income (loss) at end of year | | | (44,681 | ) | | | 6,717 | | |
See Notes to Financial Statements
31
Notes to Financial Statements Absolute Return Multi-Manager Portfolio
Note A—Summary of Significant Accounting Policies:
1 General: Neuberger Berman Advisers Management Trust (the "Trust") is a Delaware statutory trust organized pursuant to an Amended and Restated Trust Instrument dated March 27, 2014. The Trust is currently comprised of eight separate operating series (each individually a "Fund," and collectively the "Funds") each of which is diversified. The Trust is registered as an open-end management investment company under the Investment Company Act of 1940, as amended (the "1940 Act"), and its shares are registered under the 1933 Act. The Fund currently offers only Class S shares. The Trust's Board of Trustees (the "Board") may establish additional series or classes of shares without the approval of shareholders.
The assets of each Fund belong only to that Fund, and the liabilities of each Fund are borne solely by that Fund and no other.
The Fund is an investment company and accordingly follows the investment company accounting and reporting guidance of the Financial Accounting Standards Board ("FASB") Accounting Standard Codification Topic 946 "Financial Services—Investment Companies."
The preparation of financial statements in accordance with U.S. generally accepted accounting principles ("GAAP") requires Neuberger Berman Investment Advisers LLC ("NBIA" or "Management") to make estimates and assumptions at the date of the financial statements. Actual results could differ from those estimates.
Shares of the Fund are not available to the general public and may be purchased only by life insurance companies to serve as an investment vehicle for premiums paid under their variable annuity and variable life insurance contracts and to certain qualified pension and other retirement plans.
2 Portfolio valuation: In accordance with Accounting Standards Codification ("ASC") 820 "Fair Value Measurement" ("ASC 820"), all investments held by the Fund are carried at the value that Management believes the Fund would receive upon selling an investment in an orderly transaction to an independent buyer in the principal or most advantageous market for the investment under current market conditions. Various inputs, including the volume and level of activity for the asset or liability in the market, are considered in valuing the Fund's investments, some of which are discussed below. Significant Management judgment may be necessary to value investments in accordance with ASC 820.
ASC 820 established a three-tier hierarchy of inputs to create a classification of value measurements for disclosure purposes. The three-tier hierarchy of inputs is summarized in the three broad Levels listed below.
• Level 1 – quoted prices in active markets for identical investments
• Level 2 – other observable inputs (including quoted prices for similar investments, interest rates, prepayment speeds, credit risk, amortized cost, etc.)
• Level 3 – unobservable inputs (including the Fund's own assumptions in determining the fair value of investments)
The inputs or methodology used for valuing an investment are not necessarily an indication of the risk associated with investing in those securities.
The value of the Fund's investments (long and short positions) in equity securities, exchange-traded funds, exchange-traded notes, exchange-traded options purchased and options written, master limited partnerships, rights and warrants, for which market quotations are readily available, is generally determined by Management by obtaining valuations from independent pricing services based on the latest sale price quoted on a principal exchange or market for that security (Level 1 inputs). Securities traded primarily on the NASDAQ Stock Market are normally valued at the NASDAQ Official Closing Price ("NOCP") provided by NASDAQ each business day. The
32
NOCP is the most recently reported price as of 4:00:02 p.m., Eastern Time, unless that price is outside the range of the "inside" bid and asked prices (i.e., the bid and asked prices that dealers quote to each other when trading for their own accounts); in that case, NASDAQ will adjust the price to equal the inside bid or asked price, whichever is closer. Because of delays in reporting trades, the NOCP may not be based on the price of the last trade to occur before the market closes. If there is no sale of a security on a particular day, the independent pricing services may value the security based on market quotations.
The value of the Fund's investments for long and short positions in debt securities is determined by Management primarily by obtaining valuations from independent pricing services based on readily available bid or offer quotations, respectively, or if quotations are not available, by methods which include various considerations based on security type (generally Level 2 inputs). In addition to the consideration of yields or prices of securities of comparable quality, coupon, maturity and type, indications as to values from dealers, and general market conditions, the following is a description of other Level 2 inputs and related valuation techniques used by independent pricing services to value certain types of debt securities held by the Fund:
Corporate Bonds. Inputs used to value corporate debt securities generally include relative credit information, observed market movements, sector news, U.S. Treasury yield curve or relevant benchmark curve, and other market information which may include benchmark yields, reported trades, broker-dealer quotes, issuer spreads, benchmark securities, bids, offers, and reference data, such as market research publications, when available ("Other Market Information").
U.S. Treasury Obligations. Inputs used to value U.S. Treasury Securities generally include quotes from several inter-dealer brokers and Other Market Information.
The value of the Fund's investments in convertible bonds is determined by Management primarily by obtaining valuations from independent pricing services based on readily available bid quotations or, if quotations are not available, by methods which include various considerations such as yields or prices of securities of comparable quality, coupon, maturity and type, indications as to values from dealers, and general market conditions (generally Level 2 inputs).
The value of loan assignments is determined by Management primarily by obtaining valuations from independent pricing services based on broker quotes (generally Level 2 or Level 3 inputs depending on the number of quotes available).
The value of futures is determined by Management by obtaining valuations from independent pricing services at the settlement price at the market close (Level 1 inputs).
The value of forward contracts is determined by Management by obtaining valuations from independent pricing services based on actual traded currency rates on independent pricing services' networks, along with other traded and quoted currency rates provided to the pricing services by leading market participants (Level 2 inputs).
The value of equity swaps is determined by Management by obtaining valuations from independent pricing services using the underlying asset and stated London Interbank Offered Rate ("LIBOR") or Federal Funds floating rate (generally Level 2 or Level 3 inputs).
Management has developed a process to periodically review information provided by independent pricing services for all types of securities.
Investments in non-exchange traded investment companies are valued using the respective fund's daily calculated net asset value per share (Level 2 inputs).
If a valuation is not available from an independent pricing service, or if Management has reason to believe that the valuation received does not represent the amount the Fund might reasonably expect to receive on a current sale in an orderly transaction, Management seeks to obtain quotations from brokers or dealers (generally considered Level 2 or Level 3 inputs depending on the number of quotes available). If such quotations are not readily available,
33
the security is valued using methods the Board has approved in the good-faith belief that the resulting valuation will reflect the fair value of the security. Numerous factors may be considered when determining the fair value of a security based on Level 2 or Level 3 inputs, including available analyst, media or other reports, securities within the same industry with recent highly correlated performance, trading in futures or American Depositary Receipts ("ADRs") and whether the issuer of the security being fair valued has other securities outstanding.
The value of the Fund's investments in foreign securities is generally determined using the same valuation methods and inputs as other Fund investments, as discussed above. Foreign security prices expressed in local currency values are normally translated from the local currency into U.S. dollars using the exchange rates as of 4:00 p.m., Eastern Time on days the New York Stock Exchange ("NYSE") is open for business. The Board has approved the use of Interactive Data Pricing and Reference Data LLC ("Interactive") to assist in determining the fair value of foreign equity securities when changes in the value of a certain index suggest that the closing prices on the foreign exchanges may no longer represent the amount that the Fund could expect to receive for those securities or on days when foreign markets are closed and U.S. markets are open. In each of these events, Interactive will provide adjusted prices for certain foreign equity securities using a statistical analysis of historical correlations of multiple factors (Level 2 inputs). The Board has also approved the use of Interactive to evaluate the prices of foreign income debt as of the time as of which a Fund's share price is calculated. Interactive utilizes benchmark spread and yield curves and evaluates available market activity from the local close to the time as of which a Fund's share price is calculated (Level 2 inputs) to assist in determining prices for certain foreign income debt. In the case of both foreign equity and foreign income securities, in the absence of precise information about the market values of these foreign securities as of the time as of which a Fund's share price is calculated, the Board has determined on the basis of available data that prices adjusted or evaluated in this way are likely to be closer to the prices the Fund could realize on a current sale than are the prices of those securities established at the close of the foreign markets in which the securities primarily trade.
Fair value prices are necessarily estimates, and there is no assurance that such a price will be at or close to the price at which the security is next quoted or next trades.
3 Foreign currency translation: The accounting records of the Fund are maintained in U.S. dollars. Foreign currency amounts are normally translated into U.S. dollars using the exchange rate as of 4:00 p.m. Eastern Time, on days the NYSE is open for business, to determine the value of investments, other assets and liabilities. Purchase and sale prices of securities, and income and expenses, are translated into U.S. dollars at the prevailing rate of exchange on the respective dates of such transactions. Net unrealized foreign currency gain (loss), if any, arises from changes in the value of assets and liabilities, other than investments in securities, as a result of changes in exchange rates and is stated separately in the Statement of Operations.
4 Securities transactions and investment income: Securities transactions are recorded on trade date for financial reporting purposes. Dividend income is recorded on the ex-dividend date or, for certain foreign dividends, as soon as the Fund becomes aware of the dividends. Non-cash dividends included in dividend income, if any, are recorded at the fair market value of the securities received. Interest income, including accretion of discount (adjusted for original issue discount, where applicable) and amortization of premium, where applicable, and accretion of discount on short-term investments, if any, is recorded on the accrual basis. Realized gains and losses from securities transactions and foreign currency transactions, if any, are recorded on the basis of identified cost and stated separately in the Statement of Operations. Included in net realized gain (loss) on investments are proceeds from the settlement of a class action litigation in which the Fund participated as a class member. The amount of such proceeds for the year ended December 31, 2016 was $215.
5 Income tax information: Each Fund is treated as a separate entity for U.S. federal income tax purposes. It is the policy of the Fund to continue to qualify for treatment as a regulated investment company ("RIC") by complying with the requirements of the U.S. Internal Revenue Code applicable to RICs and to distribute substantially all of its net investment income and net realized capital gains to its shareholders. To the extent the Fund distributes substantially all of its net investment income and net realized capital gains to shareholders, no federal income or excise tax provision is required.
34
The Fund has adopted the provisions of ASC 740 "Income Taxes" ("ASC 740"). ASC 740 sets forth a minimum threshold for financial statement recognition of a tax position taken, or expected to be taken, in a tax return. The Fund recognizes interest and penalties, if any, related to unrecognized tax positions as an income tax expense in the Statement of Operations. The Fund is subject to examination by U.S. federal and state tax authorities for returns filed for the tax years for which the applicable statutes of limitations have not yet expired. As of December 31, 2016, the Fund did not have any unrecognized tax positions.
At December 31, 2016 the cost of investments for U.S. federal income tax basis was $14,145,209. Gross unrealized appreciation of investments was $517,992 and gross unrealized depreciation of investments was $608,051, resulting in net unrealized depreciation of $90,059 based on cost for U.S. federal income tax purposes.
Income distributions and capital gain distributions are determined in accordance with income tax regulations, which may differ from GAAP. These differences are primarily due to differing treatments of income and gains on various investment securities held by the Fund, timing differences and differing characterization of distributions made by the Fund. The Fund may also utilize earnings and profits distributed to shareholders on redemption of their shares as a part of the dividends-paid deduction for income tax purposes.
As determined on December 31, 2016, permanent differences resulting primarily from different book and tax accounting were reclassified at year end. Such differences are attributed to the tax treatment of: foreign currency gains and losses, net operating losses, partnership basis adjustments, gain and losses from passive foreign investment companies (PFICs), paydown gains and loses, gains and losses from swaps, distributions in excess, tax adjustments related to REITs, tax adjustments related to short sales and gains and losses from equity swap contracts. These reclassifications had no effect on net income, net asset value ("NAV") or NAV per share of the Fund. For the year ended December 31, 2016, the Fund recorded the following permanent reclassifications:
| Paid-in Capital | | Undistributed
Net Investment
Income/(Loss) | | Accumulated
Net Realized
Gains/(Losses)
on Investments | |
| $ | (179,779 | ) | | $ | 136,568 | | | $ | 43,211 | | |
The tax character of distributions paid during the years ended December 31, 2016 and December 31, 2015 was as follows:
| | | Distributions Paid From: | |
Ordinary Income | | Tax-Exempt Income | | Long-Term Capital Gain | | Return of Capital | | Total | |
| 2016 | | 2015 | | 2016 | | 2015 | | 2016 | | 2015 | | 2016 | | 2015 | | 2016 | | 2015 | |
| $ | 77,182 | | | $ | 130,349 | | | $ | — | | | $ | — | | | $ | — | | | $ | 5,940 | | | $ | — | | | $ | — | | | $ | 77,182 | | | $ | 136,289 | | |
As of December 31, 2016, the components of distributable earnings (accumulated losses) on a U.S. federal income tax basis were as follows:
Undistributed
Ordinary
Income | | Undistributed
Long-Term
Capital Gain | | Unrealized
Appreciation/
(Depreciation) | | Loss
Carryforwards
and Deferrals | | Other
Temporary
Differences | | Total | |
| $ | — | | | $ | — | | | $ | (186,376 | ) | | $ | (531,019 | ) | | $ | (37,111 | ) | | $ | (754,506 | ) | |
The temporary differences between book basis and tax basis distributable earnings are primarily due to: losses disallowed and recognized on wash sales, short sales, options and straddles, mark-to-market adjustments on swaps, futures and forwards, unamortized organization expenses, tax adjustments related to PFICs and swap contracts, Non-REIT income adjustments, capital loss carryforwards, partnership basis adjustments and delayed settlement compensation on bank loans.
35
To the extent the Fund's net realized capital gains, if any, can be offset by capital loss carryforwards, if any, it is the policy of the Fund not to distribute such gains.
As determined at December 31, 2016, for federal income tax purposes, the Fund had unused capital loss carryforwards, with no expiration, available to offset net realized capital gains, if any, as follows:
| Long-Term | | Short-Term | |
| $ | 292,622 | | | $ | 238,397 | | |
6 Foreign taxes: Foreign taxes withheld, if any, represent amounts withheld by foreign tax authorities, net of refunds recoverable.
Foreign capital gains on certain foreign securities may be subject to foreign taxes, which are accrued as applicable. At December 31, 2016, there were no outstanding balances of accrued capital gains taxes for the Fund.
7 Distributions to shareholders: The Fund may earn income, net of expenses, daily on its investments. Distributions from net investment income and net realized capital gains, if any, are generally distributed once a year (usually in October). Income distributions and capital gain distributions to shareholders are recorded on the ex-date.
It is the policy the Fund to pass through to its shareholders substantially all Real Estate Investment Trust ("REIT") distributions and other income it receives, less operating expenses. The distributions received from REITs held by the Fund are generally composed of income, capital gains, and/or return of REIT capital, but the REITs do not report this information to the Fund until the following calendar year. At December 31, 2016, the Fund estimated these amounts for the period January 1, 2016 to December 31, 2016 within the financial statements because the 2016 information is not available from the REITs until after the Fund's fiscal year-end. All estimates are based upon REIT information sources available to the Fund together with actual IRS Forms 1099-DIV received to date. For the year ended December 31, 2016, the character of distributions paid to shareholders of the Fund disclosed within the Statement of Changes in Net Assets is based on estimates made at the time. Based on past experience it is possible that a portion of the Fund's distributions during the current fiscal year, if any, will be considered tax return of capital, but the actual amount of the tax return of capital, if any, is not determinable until after the Fund's fiscal year-end. After calendar year-end, when the Fund learns the nature of the distributions paid by REITs during that year, distributions previously identified as income are often recharacterized as return of capital and/or capital gain. After all applicable REITs have informed the Fund of the actual breakdown of distributions paid to the Fund during its fiscal year, estimates previously recorded are adjusted on the books of the Fund to reflect actual results. As a result, the composition of the Fund's distributions as reported herein may differ from the final composition determined after calendar year-end and reported to the Fund shareholders on IRS Form 1099-DIV.
8 Expense allocation: Certain expenses are applicable to multiple funds within the complex of related investment companies. Expenses directly attributable to the Fund are charged to the Fund. Expenses of the Trust that are not directly attributable to a particular series of the Trust (e.g., the Fund) are allocated among the series of the Trust, on the basis of relative net assets, except where a more appropriate allocation of expenses to each of the series can otherwise be made fairly. Expenses borne by the complex of related investment companies, which includes open-end and closed-end investment companies for which Management serves as investment manager, that are not directly attributable to a particular investment company in the complex (e.g., the Trust) or series thereof are allocated among the investment companies or series thereof in the complex on the basis of relative net assets, except where a more appropriate allocation of expenses to each of the investment companies or series thereof in the complex can otherwise be made fairly.
9 Investments in foreign securities: Investing in foreign securities may involve sovereign and other risks, in addition to the credit and market risks normally associated with domestic securities. These additional risks include the possibility of adverse political and economic developments (including political instability, nationalization, expropriation, or confiscatory taxation) and the potentially adverse effects of unavailability of public information regarding issuers, less governmental supervision and regulation of financial markets, reduced liquidity of certain financial markets, and the lack of uniform accounting, auditing, and financial reporting standards or the
36
application of standards that are different or less stringent than those applied in the United States. Foreign securities also may experience greater price volatility, higher rates of inflation, and delays in settlement.
10 Securities sold short: The Fund may engage in short sales, which are sales of securities which have been borrowed from a third party on the expectation that the market price will decline. If the price of the securities decreases, the Fund will make a profit by purchasing the securities in the open market at a price lower than the one at which it sold the securities. If the price of the securities increases, the Fund may have to cover its short positions at a price higher than the short sale price, resulting in a loss. Gains are limited to the price at which the Fund sold the security short, while losses are potentially unlimited in size. The Fund pledges securities and/or other assets, to the lender as collateral. Proceeds received from short sales may be maintained by the lender as collateral or may be released to the Fund and used to purchase additional securities or for any other purpose. Proceeds maintained by the lender are included in "Cash collateral segregated for short sales" on the Statement of Assets and Liabilities. The Fund is required to segregate an amount of cash or liquid securities in an amount at least equal to the current market value of the securities sold short (less any additional collateral pledged to the lender). The Fund is contractually responsible to remit to the lender any dividends and interest payable on securities while those securities are being borrowed by the Fund. The Fund may receive or pay the net of the interest charged by the prime broker on the borrowed securities and a financing charge for the difference in the market value of the short position and the cash collateral deposited with the broker. This income or fee is calculated daily based upon the market value of each borrowed security and a variable rate that is dependent on the availability of the security. These costs related to short sales (i.e., dividend and interest remitted to the lender and interest charged by the prime broker) are recorded as an expense of the Fund and are excluded from the contractual expense limitation. The net amount of fees incurred during the year ended December 31, 2016, were $20,630 and are included in the "Dividend and interest expense on securities sold short" on the Statement of Operations.
At December 31, 2016, the Fund had cash pledged in the amount of $3,676,436 to JPMorgan Chase Bank, NA ("JPM"), as collateral for short sales. In addition, JPM has a perfected security interest in these assets. At December 31, 2016, the Fund had securities pledged in the amount of $1,413,699 to JPM to cover collateral requirements for borrowing in connection with securities sold short and options written.
11 Investment company securities, exchange-traded funds and exchange-traded notes: The Fund may invest in shares of other registered investment companies, including exchange-traded funds ("ETFs"), within the limitations prescribed by the 1940 Act. Some ETFs seek to track the performance of a particular market index. These indices include both broad-based market indices and more narrowly-based indices, including those relating to particular sectors, markets, regions or industries. However, some ETFs have actively-managed investment objectives. ETF shares are traded like traditional equity securities on a national securities exchange or NASDAQ. The Fund will indirectly bear its proportionate share of any management fees and other expenses paid by such other investment companies, which will increase expenses and decrease returns. The Fund may also invest in exchange-traded notes ("ETNs"). ETNs are senior, unsecured, unsubordinated debt securities that are linked to the performance of a particular market index or strategy. The issuer of the ETN pays the Fund an amount based on the returns of the underlying index or strategy, plus principal at maturity. A Fund will bear any applicable fees to the issuer upon redemption or maturity, which will increase expenses and decrease returns.
12 Derivative instruments: The Fund's use of derivatives during the year ended December 31, 2016, is described below. Please see the Schedule of Investments for the Fund's open positions in derivatives, if any, at December 31, 2016. The Fund has adopted the provisions of ASC 815 "Derivatives and Hedging" ("ASC 815"). The disclosure requirements of ASC 815 distinguish between derivatives that qualify for hedge accounting and those that do not. Because investment companies value their derivatives at fair value and recognize changes in fair value through the Statement of Operations, they do not qualify for hedge accounting. Accordingly, even though the Fund's investments in derivatives may represent economic hedges, they are considered non-hedge transactions for purposes of this disclosure.
Futures contracts: During the year ended December 31, 2016, the Fund used futures for economic hedging purposes.
37
At the time the Fund enters into a futures contract, it is required to deposit with the futures commission merchant a specified amount of cash or liquid securities, known as "initial margin," which is a percentage of the value of the futures contract being traded that is set by the exchange upon which the futures contract is traded. Each day, the futures contract is valued at the official settlement price of the board of trade or U.S. commodity exchange on which such futures contract is traded. Subsequent payments, known as "variation margin" to and from the broker are made on a daily basis, or as needed, as the market price of the futures contract fluctuates. Daily variation margin adjustments, arising from this "mark to market," are recorded by the Fund as unrealized gains or losses.
Although some futures by their terms call for actual delivery or acquisition of the underlying securities or currency, in most cases the contracts are closed out prior to delivery by offsetting purchases or sales of matching futures. When the contracts are closed, the Fund recognizes a gain or loss. Risks of entering into futures contracts include the possibility there may be an illiquid market, possibly at a time of rapidly declining prices, and/or a change in the value of the contract may not correlate with changes in the value of the underlying securities. Futures executed on regulated futures exchanges have minimal counterparty risk to a Fund because the exchange's clearinghouse assumes the position of the counterparty in each transaction. Thus, a Fund is exposed to risk only in connection with the clearinghouse and not in connection with the original counterparty to the transaction.
For U.S. federal income tax purposes, the futures transactions undertaken by a Fund may cause the Fund to recognize gains or losses from marking contracts to market even though its positions have not been sold or terminated, may affect the character of the gains or losses recognized as long-term or short-term, and may affect the timing of some capital gains and losses realized by the Fund. Also, the Fund's losses on transactions involving futures contracts may be deferred rather than being taken into account currently in calculating such Fund's taxable income.
Equity swap contracts: During the year ended December 31, 2016, the Fund used equity swaps to provide investment exposure to certain investments, primarily foreign securities.
Equity swaps are two-party contracts in which counterparties exchange the return on a specified reference security, basket of securities, security index or index component for the return based on a fixed or floating interest rate during the period of the swap. Equity swaps are marked to market daily based on the value of the underlying reference entity and the change, if any, is recorded as an unrealized gain or loss. Equity swaps normally do not involve the delivery of securities or other underlying assets. If the other party to an equity swap defaults, the Fund's risk of loss consists of the net amount of payments that the Fund is contractually entitled to receive, if any. Equity swaps are derivatives and their value can be very volatile. To the extent that future market trends, the values of assets or economic factors are not accurately analyzed and predicted, the Fund may suffer a loss, which may exceed the related amounts shown in the Statement of Assets and Liabilities. Periodic payments received or paid by the Fund are recorded as realized gains or losses.
Total return swap contracts: During the year ended December 31, 2016, the Fund used total return swaps to hedge certain indices and provide investment exposure to certain investments, primarily foreign securities. Total return swaps involve commitments to pay fixed or floating rate interest in exchange for a market-linked return based on a notional amount. To the extent the total return of the reference security or index underlying the total return swap exceeds or falls short of the offsetting interest rate obligation, the Fund will receive a payment or make a payment to the counterparty, respectively. Certain risks may arise when entering into total return swap transactions, including counterparty default, liquidity or unfavorable changes in the value of the underlying reference security or index. The value of total return swaps is adjusted daily and the change in value, if any, is recorded as unrealized appreciation or depreciation in the Statement of Assets and Liabilities. Payments received or made at the end of each measurement period are recorded as realized gain or loss in the Statement of Operations.
Forward foreign currency contracts: During the year ended December 31, 2016, the Fund used forward contracts to hedge foreign currency.
38
A forward contract is an agreement between two parties to buy or sell a specific currency for another at a set price on a future date, and is individually negotiated and privately traded by currency traders and their customers in the interbank market. The market value of a forward contract fluctuates with changes in forward currency exchange rates. Forward contracts are marked to market daily, and the change in value is recorded by the Fund as an unrealized gain or loss. At the consummation of a forward contract to purchase or sell currency, the Fund may either exchange the currencies specified at the maturity of the forward contract or enter into a closing transaction involving the purchase or sale of an offsetting forward contract. Closing transactions with respect to forward contracts are usually performed with the counterparty to the original forward contract. The gain or loss arising from the difference between the U.S. dollar cost of the original contract and the value of the foreign currency in U.S. dollars upon closing a contract is included in "Net realized gain (loss) on forward foreign currency contracts" in the Statement of Operations. These contracts may involve market risk in excess of the unrealized gain or loss reflected in the Fund's Statement of Assets and Liabilities. In addition, the Fund could be exposed to risks associated with fluctuations in foreign currency and the risk the counterparty will fail to fulfill its obligation.
Options: During the year ended December 31, 2016, the Fund used options written to generate incremental returns. The Fund used purchased option contracts ("options purchased") to enhance returns and to manage or adjust the risk profile and the investment exposure of the Fund to certain securities.
Premiums paid by the Fund upon purchasing a call or put option are recorded in the asset section of the Fund's Statement of Assets and Liabilities and are subsequently adjusted to the current market value. When an option is exercised, closed, or expired, the Fund realizes a gain or loss and the asset is eliminated.
For purchased call options, the Fund's loss is limited to the amount of the option premium paid.
Premiums received by the Fund upon writing a call option or a put option are recorded in the liability section of the Fund's Statement of Assets and Liabilities and are subsequently adjusted to the current market value. When an option is exercised, closed, or expired, the Fund realizes a gain or loss and the liability is eliminated.
When a Fund writes a call option on an underlying asset it does not own, its exposure on such an option is theoretically unlimited. When writing a covered call option, the Fund, in return for the premium, gives up the opportunity for profit from a price increase in the underlying security above the exercise price, but conversely retains the risk of loss should the price of the security decline. When writing a put option, the Fund, in return for the premium, takes the risk that it must purchase the underlying security at a price that may be higher than the current market price of the security. If a covered call or put option that the Fund has written expires unexercised, the Fund will realize a gain in the amount of the premium.
At December 31, 2016, the Fund had the following derivatives (which did not qualify as hedging instruments under ASC 815), grouped by primary risk exposure:
Asset Derivatives
Derivative Type | | Statement of
Assets and
Liabilities Location | | Currency Risk | | Equity Risk | | Total | |
Forward contracts | | Receivable for forward
foreign currency contracts | | $ | 2,450 | | | $ | — | | | $ | 2,450 | | |
Futures | | Receivable/Payable for variation
margin on futures contracts(1) | | | — | | | | 1,832 | | | | 1,832 | | |
Options purchased | | Investments in securities,
at value | | | — | | | | 7,853 | | | | 7,853 | | |
OTC swap contracts | | OTC swap contracts, at value(2) | | | — | | | | 86,728 | | | | 86,728 | | |
Total Value—Assets | | | | $ | 2,450 | | | $ | 96,413 | | | $ | 98,863 | | |
39
Liability Derivatives
Derivative Type | | Statement of
Assets and
Liabilities Location | | Currency Risk | | Equity Risk | | Total | |
Forward contracts | | Payable for forward
foreign currency contracts | | $ | (1,428 | ) | | $ | — | | | | (1,428 | ) | |
Futures | | Receivable/Payable for variation
margin on futures contracts(1) | | | — | | | | (9,038 | ) | | | (9,038 | ) | |
Options written | | Option contracts written,
at value | | | — | | | | (3,027 | ) | | | (3,027 | ) | |
OTC swap contracts | | OTC swap contracts, at value(2) | | | — | | | | (52,503 | ) | | | (52,503 | ) | |
Total Value—Liabilities | | | | $ | (1,428 | ) | | $ | (64,568 | ) | | $ | (65,996 | ) | |
(1) "Futures" reflects the cumulative appreciation/(depreciation) of futures contracts as of December 31, 2016, which is reflected in the Statement of Assets and Liabilities under the caption "Net unrealized appreciation/(depreciation) in value of investments." The current day's variation margin as of December 31, 2016, if any, is reflected in the Statement of Assets and Liabilities under the caption "Receivable/Payable for variation margin on futures contracts."
(2) "OTC swap contracts" reflects the appreciation/(depreciation) of the OTC swap contracts plus accrued interest as of December 31, 2016, which is reflected in the Statement of Assets and Liabilities under the caption "OTC swap contracts, at value."
The impact of the use of these derivative instruments on the Statement of Operations during the year ended December 31, 2016, was as follows:
Realized Gain/(Loss)
Derivative Type | | Statement of
Operations Location | | Currency Risk | | Equity Risk | | Total | |
Forward contracts | | Net realized gain (loss) on:
Forward foreign currency contracts | | $ | (5,175 | ) | | $ | — | | | $ | (5,175 | ) | |
Futures | | Net realized gain (loss) on:
Futures contracts | | | — | | | | (39,631 | ) | | | (39,631 | ) | |
Options purchased | | Net realized gain
(loss) on: Sales of
investment securities
of unaffiliated issuers | | | — | | | | (58,415 | ) | | | (58,415 | ) | |
Options written | | Net realized gain (loss) on:
Option contracts written | | | — | | | | 10,383 | | | | 10,383 | | |
Swaps | | Net realized gain (loss)
on: Swaps contracts | | | — | | | | (13,999 | ) | | | (13,999 | ) | |
Total Realized Gain/(Loss) | | | | $ | (5,175 | ) | | $ | (101,662 | ) | | $ | (106,837 | ) | |
40
Change in Appreciation/
(Depreciation)
Derivative Type | | Statement of
Operations Location | | Currency Risk | | Equity Risk | | Total | |
Forward contracts | | Change in net unrealized
appreciation (depreciation)
in value of: Forward
foreign currency contracts | | $ | 18,290 | | | $ | — | | | $ | 18,290 | | |
Futures | | Change in net unrealized
appreciation (depreciation)
in value of : Futures contracts | | | — | | | | (5,400 | ) | | | (5,400 | ) | |
Options purchased | | Change in net unrealized
appreciation (depreciation)
in value of: Unaffiliated
investment securities | | | — | | | | 8,867 | | | | 8,867 | | |
Options written | | Change in net unrealized
appreciation (depreciation)
in value of: Option
contracts written | | | — | | | | (1,771 | ) | | | (1,771 | ) | |
Swaps | | Change in net unrealized
appreciation (depreciation)
in value of: Swap contracts | | | — | | | | 39,407 | | | | 39,407 | | |
Total Change in Appreciation/
(Depreciation) | | | | $ | 18,290 | | | $ | 41,103 | | | $ | 59,393 | | |
While the Fund may receive rights and warrants in connection with their investments in securities, these rights and warrants are not considered "derivative instruments" under ASC 815.
The Fund discloses both gross and net information for assets and liabilities related to derivatives, repurchase and reverse repurchase agreements, and securities lending and securities borrowing transactions that are eligible for offset or subject to an enforceable master netting or similar agreement. The Fund's derivative assets and liabilities at fair value by type are reported gross in the Statement of Assets and Liabilities. The following tables present the Fund's derivative assets and liabilities by counterparty, net of amounts available for offset under a master netting agreement and net of the related collateral received by the Fund for assets and pledged by the Fund for liabilities as of December 31, 2016.
Description | | Gross Amounts of
Recognized Assets | | Gross Amounts
Offset in the
Statement of
Assets and
Liabilities | | Net Amounts of Assets Presented in the
Statement of Assets and Liabilities | |
Forward contracts | | $ | 2,450 | | | $ | — | | | $ | 2,450 | | |
OTC swap contracts | | | 86,728 | | | | — | | | | 86,728 | | |
Total | | $ | 89,178 | | | $ | — | | | $ | 89,178 | | |
41
Gross Amounts Not Offset in the Statement of Assets and Liabilities
Counterparty | | Net Amounts of
Assets Presented in
the Statement of
Assets and Liabilities | | Financial
Instruments | | Cash Collateral
Received(a) | | Net Amount(b) | |
JPMorgan Chase Bank, NA | | $ | 8,762 | | | $ | (5,136 | ) | | $ | — | | | $ | 3,626 | | |
Morgan Stanley Capital Services LLC | | | 80,416 | | | | (48,795 | ) | | | — | | | | 31,621 | | |
| | | $ | 89,178 | | | $ | (53,931 | ) | | $ | — | | | $ | 35,247 | | |
Description | | Gross Amounts of
Recognized Liabilites | | Gross Amounts
Offset in the
Statement of
Assets and
Liabilities | | Net Amounts of Liabilities Presented in the
Statement of Assets and Liabilities | |
Forward contracts | | $ | (1,428 | ) | | $ | — | | | $ | (1,428 | ) | |
OTC swap contracts | | | (52,503 | ) | | | — | | | | (52,503 | ) | |
Total | | $ | (53,931 | ) | | $ | — | | | $ | (53,931 | ) | |
Gross Amounts Not Offset in the Statement of Assets and Liabilities
Counterparty | | Net Amounts of
Liabilites Presented in
the Statement of
Assets and Liabilities | | Financial
Instruments | | Cash Collateral
Pledged(a) | | Net Amount(c) | |
JPMorgan Chase Bank, NA | | $ | (5,136 | ) | | $ | 5,136 | | | $ | — | | | $ | — | | |
Morgan Stanley Capital Services LLC | | | (48,795 | ) | | | 48,795 | | | | — | | | | — | | |
| | | $ | (53,931 | ) | | $ | 53,931 | | | $ | — | | | $ | — | | |
(a) Collateral received (or pledged) is limited to an amount not to exceed 100% of the net amount of assets (or liabilities) in the tables presented above, for each respective counterparty.
(b) Net Amount represents amounts subject to loss as of December 31, 2016, in the event of a counterparty failure.
(c) Net Amount represents amounts under-collateralized by the Fund to each counterparty as of December 31, 2016.
13 Indemnifications: Like many other companies, the Trust's organizational documents provide that its officers ("Officers") and trustees ("Trustees") are indemnified against certain liabilities arising out of the performance of their duties to the Trust. In addition, both in some of its principal service contracts and in the normal course of its business, the Trust enters into contracts that provide indemnifications to other parties for certain types of losses or liabilities. The Trust's maximum exposure under these arrangements is unknown as this could involve future claims against the Trust.
14 Unfunded loan commitments: The Fund may enter into certain credit agreements where all or a portion of which may be unfunded. Unfunded commitments may include revolving loan facilities which may obligate the Fund to provide cash to the borrower on demand. The Fund may receive a commitment fee based on the undrawn portion of the underlying loan facility, which is recorded as a component of interest income on the Statement of Operations. As of December 31, 2016, the value of unfunded loan commitments was $367 pursuant to the following loan agreement:
Borrower | | Principal
Amount | | Value | |
TricorBraun, Inc. (Fka Kranson Industries, Inc.), Term Loan | | $ | 364 | | | $ | 367 | | |
42
Note B—Investment Management Fees, Administration Fees, Distribution Arrangements, and Other Transactions with Affiliates:
The Fund retains Management as its investment manager under a Management Agreement. For such investment management services, the Fund pays Management a fee at the annual rate of 1.700% of the first $250 million of the Fund's average daily net assets, 1.675% of the next $250 million, 1.650% of the next $250 million, 1.625% of the next $250 million, 1.600% of the next $500 million, 1.575% of the next $2.5 billion, and 1.550% of average daily net assets in excess of $4 billion. Accordingly, for the year ended December 31, 2016, the investment management fee pursuant to the Management Agreement was equivalent to an annual effective rate of 1.700% of the Fund's average daily net assets.
The Fund retains Management as its administrator under an Administration Agreement. The Fund pays Management an administration fee at the annual rate of 0.30% of its average daily net assets under this agreement. Additionally, Management retains JPM as its sub-administrator under a Sub-Administration Agreement. Management pays JPM a fee for all services received under this agreement.
Management has contractually agreed to waive fees and/or reimburse the Fund for its total annual operating expenses so that the total annual operating expenses do not exceed the expense limitations as detailed in the following table. These undertakings exclude interest, taxes, brokerage commissions, dividend and interest expenses relating to short sales, acquired fund fees and expenses, and extraordinary expenses, if any (commitment fees relating to borrowings are treated as interest for purposes of this exclusion); consequently, net expenses may exceed the contractual expense limitation. The Fund has agreed that it will repay Management for fees and expenses waived or reimbursed provided that repayment does not cause the annual operating expenses to exceed its expense limitation in place at the time the fees and expenses were waived or reimbursed, and the repayment is made within three years after the year in which Management incurred the expense.
During the year ended December 31, 2016, there was no repayment to Management under its contractual expense limitation.
At December 31, 2016, the Fund's contingent liabilities to Management under its contractual expense limitation were as follows:
| | | | | | | Expenses Reimbursed in
Fiscal Year Ending December 31, | |
| | | | | | | 2014(2) | | 2015 | | 2016 | |
| | | | | | | Subject to Repayment until December 31, | |
| | | Contractual
Expense
Limitation(1) | | Expiration | | 2017 | | 2018 | | 2019 | |
Class S | | | 2.40 | % | | 12/31/19 | | $ | 316,564 | | | $ | 446,549 | | | $ | 508,177 | | |
(1) Expense limitation per annum of the Fund's average daily net assets.
(2) Period from May 1, 2014 (Commencement of Operations) to December 31, 2014.
NB Alternative Investment Management LLC ("NBAIM") was retained by Management through December 31, 2015, pursuant to a Sub-Advisory Agreement, to provide day-to-day investment management services, including oversight of the Fund's investments and handling its day-to-day business, including oversight of the subadvisers' investment activities, and received a monthly fee paid by Management. As investment manager, Management was responsible for overseeing the investment activities of NBAIM. Several individuals who are Officers and/or Trustees of the Trust are also employees of NBAIM and/or Management. As a result of the entity consolidation described on page 3 of this Annual Report, the services previously provided by NBAIM under the Sub-Advisory Agreement are being provided by Management as of January 1, 2016.
Management has retained Blue Jay Capital Management, LLC, Cramer Rosenthal McGlynn, LLC, GAMCO Asset Management Inc., Good Hill Partners LP, Lazard Asset Management LLC, Levin Capital Strategies, L.P., Portland
43
Hill Capital LLP, Sound Point Capital Management, L.P., and TPH Asset Management, LP as subadvisers to provide investment management services. Management compensates the subadvisers out of the investment advisory fees it receives from the Fund.
Neuberger Berman BD LLC (the "Distributor") is the Fund's "principal underwriter" within the meaning of the 1940 Act. It acts as agent in arranging for the sale of the Fund's Class S shares. The Board has adopted a distribution and shareholder services plan (the "Plan") for Class S shares pursuant to Rule 12b-1 under the 1940 Act. The Plan provides that, as compensation for administrative and other services related to the sale and distribution of Class S, and ongoing services provided to investors in the class, the Distributor receives from Class S a fee at the annual rate of 0.25% of Class S's average daily net assets. Distributor may pay a portion of the proceeds from the 12b-1 fee to insurance companies or their affiliates and qualified plan administrators ("intermediaries") for services they provide respecting the Fund to current and prospective variable contract owners and qualified plan participants that invest in the Fund through the intermediaries. Those institutions may use the payments for, among other purposes, compensating employees engaged in sales and/or shareholder servicing. The amount of fees paid by the class during any year may be more or less than the cost of distribution and other services provided to the class. FINRA rules limit the amount of annual distribution fees that may be paid by a mutual fund and impose a ceiling on the cumulative distribution fees paid. The Plan complies with those rules.
Note C—Securities Transactions:
During the year ended December 31, 2016, there were purchase and sale transactions of long-term securities (excluding swaps, futures, forward contracts and option contracts) as follows:
Purchases of
U.S. Government
and Agency
Obligations | | Purchases excluding
U.S. Government
and Agency
Obligations | | Securities Sold
Short | | Sales and Maturities
of U.S. Government
and Agency
Obligations | | Sales and Maturities
excluding
U.S. Government
and Agency
Obligations | | Covers on
Securities Sold
Short | |
| $ | 35,881 | | | $ | 74,685,420 | | | $ | 18,991,390 | | | $ | 15,176 | | | $ | 74,031,333 | | | $ | 18,882,015 | | |
During the year ended December 31, 2016, no brokerage commissions on securities transactions were paid to affiliated brokers.
Note D—Fund Share Transactions:
Share activity for the years ended December 31, 2016 and December 31, 2015 was as follows:
| | | For the Year Ended December 31, 2016 | | For the Year Ended December 31, 2015 | |
| | | Shares Sold | | Shares Issued on
Reinvestment of
Dividends and
Distributions | | Shares
Redeemed | | Total | | Shares Sold | | Shares Issued on
Reinvestment of
Dividends and
Distributions | | Shares
Redeemed | | Total | |
Class S | | | 501,360 | | | | 8,272 | | | | (361,056 | ) | | | 148,576 | | | | 707,455 | | | | 14,153 | | | | (159,926 | ) | | | 561,682 | | |
Other: At December 31, 2016, there was an affiliated investor owning 42.4% of the Fund's outstanding shares.
Note E—Line of Credit:
At December 31, 2016, the Fund was a participant in a syndicated committed, unsecured $700,000,000 line of credit (the "Credit Facility"), to be used only for temporary or emergency purposes. The Fund and the two other multi-manager funds in the complex are subject to a separate limitation under the Credit Facility and collectively can only borrow $200,000,000 at any one time. Series of other investment companies managed by Management
44
also participate in this line of credit on substantially the same terms except that they are not subject to that $200,000,000 limitation. Interest is charged on borrowings under this Credit Facility at the higher of (a) a federal funds effective rate plus 1.00% per annum or (b) a Eurodollar rate for a one-month period plus 1.00% per annum. The Credit Facility has an annual commitment fee of 0.15% per annum of the available line of credit, which is paid quarterly. The Fund has agreed to pay its pro rata share of the annual commitment fee, based on the ratio of its individual net assets to the net assets of all participants at the time the fee is due and payable and the level of its access to the Credit Facility, and interest charged on any borrowing made by the Fund and other costs incurred by the Fund. Because several mutual funds participate in the Credit Facility, there is no assurance that the Fund will have access to all or any part of the $700,000,000 at any particular time. There were no loans outstanding under the Credit Facility at December 31, 2016. During the period ended December 31, 2016, the Fund did not utilize the Credit Facility.
Note F—Recent Accounting Pronouncement:
In October 2016, the U.S. Securities and Exchange Commission ("SEC") adopted new rules and forms, and amendments to certain current rules and forms, to modernize reporting and disclosure of information by registered investment companies. The amendments to Regulation S-X will require standardized, enhanced disclosure about derivatives in investment company financial statements, and will also change the rules governing the form and content of such financial statements. The compliance date for the amendments to Regulation S-X is August 1, 2017. Management is currently evaluating the impact that the adoption of the amendments to Regulation S-X will have on the Fund's financial statements and related disclosures.
Note G—Subsequent Event:
Effective on or about May 1, 2017, the Absolute Return Multi-Manager Portfolio will change its name to U.S. Equity Index PutWrite Strategy Portfolio and will offer Class S and Class I shares. The Fund will change from a multi-manager strategy to a strategy of writing put options primarily on U.S. equity indices.
45
Absolute Return Multi-Manager Portfolio
The following table includes selected data for a share outstanding throughout each year and other performance information derived from the Financial Statements. Amounts that do not round to $0.01 or ($0.01) per share are presented as $0.00 or ($0.00), respectively. Ratios that do not round to 0.01% or (0.01)% are presented as 0.00% or (0.00)%, respectively. A "—" indicates that the line item was not applicable in the corresponding period.
Class S | |
| | Year Ended December 31, | | Period from
May 1, 2014^ | |
| | 2016 | | 2015 | | to December 31, 2014 | |
Net Asset Value, Beginning of Year | | $ | 9.39 | | | $ | 10.01 | | | $ | 10.00 | | |
| Net Investment Income (Loss)‡ | | | (0.12 | ) | | | (0.13 | ) | | | (0.08 | ) | |
Net Gains or Losses on Securities (both realized
and unrealized) | | | 0.06 | | | | (0.38 | ) | | | 0.09 | | |
Total From Investment Operations | | | (0.06 | ) | | | (0.51 | ) | | | 0.01 | | |
Less Distributions From: | |
Net Realized Capital Gains | | | (0.05 | ) | | | (0.11 | ) | | | — | | |
Total Distributions | | | (0.05 | ) | | | (0.11 | ) | | | — | | |
Net Asset Value, End of Year | | $ | 9.28 | | | $ | 9.39 | | | $ | 10.01 | | |
| Total Return†† | | | (0.65 | )%µ | | | (5.15 | )% | | | 0.10 | %** | |
Ratios/Supplemental Data | |
Net Assets, End of Year (in millions) | | $ | 14.5 | | | $ | 13.2 | | | $ | 8.5 | | |
| Ratio of Gross Expenses to Average Net Assets# | | | 6.83 | % | | | 7.20 | % | | | 9.43 | %*@ | |
Ratio of Gross Expenses to Average Net Assets#
(excluding dividend and interest expenses relating to
short sales) | | | 5.99 | % | | | 6.38 | % | | | 8.88 | %*@ | |
Ratio of Net Expenses to Average Net Assets | | | 3.24 | % | | | 3.22 | % | | | 3.25 | %*@ | |
Ratio of Net Expenses to Average Net Assets
(excluding dividend and interest expenses relating to
short sales) | | | 2.40 | % | | | 2.40 | % | | | 2.69 | %*@ | |
Ratio of Net Investment Income/(Loss) to Average
Net Assets | | | (1.33 | )% | | | (1.30 | )% | | | (1.21 | )%*@ | |
Portfolio Turnover Rate (including securities sold short) | | | 547 | % | | | 490 | % | | | 264 | %** | |
Portfolio Turnover Rate (excluding securities sold short) | | | 546 | % | | | 517 | % | | | 213 | %** | |
See Notes to Financial Highlights
46
Notes to Financial Highlights Absolute Return Multi-Manager Portfolio
†† Total return based on per share NAV reflects the effects of changes in NAV on the performance of the Fund during each fiscal period. Returns assume income dividends and other distributions, if any, were reinvested. Results represent past performance and do not indicate future results. Current returns may be lower or higher than the performance data quoted. Investment returns and principal may fluctuate and shares when redeemed may be worth more or less than original cost. Total return would have been lower if Management had not reimbursed certain expenses. The total return information shown does not reflect charges and the other expenses that apply to the separate accounts or the related insurance policies or other qualified pension or retirement plans, and the inclusion of these charges and other expenses would reduce the total return for all fiscal periods shown.
‡ Calculated based on the average number of shares outstanding during each fiscal period.
# Represents the annualized ratios of net expenses to average daily net assets if Management had not reimbursed certain expenses and/or waived a portion of the investment management fee.
@ Organization expense, which is a non-recurring expense, is included in these ratios on a non-annualized basis.
* Annualized.
** Not annualized.
^ The date investment operations commenced.
µ The class action proceeds listed in Note A of the Notes to Financial Statements had no impact on the Fund's total return for the year ended December 31, 2016.
47
Report of Independent Registered Public Accounting Firm
To the Board of Trustees of
Neuberger Berman Advisers Management Trust and
Shareholders of Absolute Return Multi-Manager Portfolio
We have audited the accompanying statement of assets and liabilities of Absolute Return Multi-Manager Portfolio, one of the series constituting Neuberger Berman Advisers Management Trust (the "Trust"), including the schedule of investments, as of December 31, 2016, and the related statement of operations for the year then ended, the statements of changes in net assets for each of the two years in the period then ended and the financial highlights for each of the periods indicated therein. These financial statements and financial highlights are the responsibility of the Trust's management. Our responsibility is to express an opinion on these financial statements and financial highlights based on our audits.
We conducted our audits in accordance with the standards of the Public Company Accounting Oversight Board (United States). Those standards require that we plan and perform the audit to obtain reasonable assurance about whether the financial statements and financial highlights are free of material misstatement. We were not engaged to perform an audit of the Trust's internal control over financial reporting. Our audits included consideration of internal control over financial reporting as a basis for designing audit procedures that are appropriate in the circumstances, but not for the purpose of expressing an opinion on the effectiveness of the Trust's internal control over financial reporting. Accordingly, we express no such opinion. An audit also includes examining, on a test basis, evidence supporting the amounts and disclosures in the financial statements and financial highlights, assessing the accounting principles used and significant estimates made by management, and evaluating the overall financial statement presentation. Our procedures included confirmation of securities owned as of December 31, 2016 by correspondence with the custodian and others or by other appropriate auditing procedures where replies from others were not received. We believe that our audits provide a reasonable basis for our opinion.
In our opinion, the financial statements and financial highlights referred to above present fairly, in all material respects, the financial position of Absolute Return Multi-Manager Portfolio, a series of Neuberger Berman Advisers Management Trust, at December 31, 2016, the results of its operations for the year then ended, the changes in its net assets for each of the two years in the period then ended and the financial highlights for each of the periods indicated therein in conformity with U.S. generally accepted accounting principles.

Boston, Massachusetts
February 17, 2017
48
The following tables set forth information concerning the Trustees and Officers of the Fund. All persons named as Trustees and Officers also serve in similar capacities for other funds administered or managed by Management. The Fund's Statement of Additional Information includes additional information about the Trustees as of the time of the Fund's most recent public offering and is available upon request, without charge, by calling (800) 877-9700.
Information about the Board of Trustees
Name, (Year of Birth),
and Address(1) | | Position(s) and
Length of
Time Served(2) | | Principal Occupation(s)(3) | | Number of
Funds in Fund
Complex
Overseen by
Fund Trustee | | Other Directorships Held
Outside Fund Complex by
Fund Trustee(3) |
Independent Trustees |
Michael J. Cosgrove (1949) | | Trustee since 2015 | | President, Carragh Consulting USA, since 2014; formerly, Executive, General Electric Company, 1970 to 2014, including President, Mutual Funds and Global Investment Programs, GE Asset Management, 2011 to 2014, President and Chief Executive Officer, Mutual Funds and Intermediary Business, GE Asset Management, 2007 to 2011, President, Institutional Sales and Marketing, GE Asset Management, 1998 to 2007, and Chief Financial Officer, GE Asset Management, and Deputy Treasurer, GE Company, 1988 to 1993. | | 55 | | | Director, America Press, Inc. (not-for-profit Jesuit publisher), since 2015; Director, Fordham University, since 2001; formerly, Director, The Gabelli Go Anywhere Trust, June 2015 to June 2016; Director, Skin Cancer Foundation (not-for-profit), 2006 to 2015; Director, GE Investments Funds, Inc., 1997 to 2014; Trustee, GE Institutional Funds, 1997 to 2014; Director, GE Asset Management, 1988 to 2014; Director, Elfun Trusts, 1988 to 2014; Trustee, GE Pension & Benefit Plans, 1988 to 2014. |
49
Name, (Year of Birth),
and Address(1) | | Position(s) and
Length of
Time Served(2) | | Principal Occupation(s)(3) | | Number of
Funds in Fund
Complex
Overseen by
Fund Trustee | | Other Directorships Held
Outside Fund Complex by
Fund Trustee(3) |
Marc Gary (1952) | | Trustee since 2015 | | Executive Vice Chancellor and Chief Operating Officer, Jewish Theological Seminary, since 2012; formerly, Executive Vice President and General Counsel, Fidelity Investments, 2007 to 2012; Executive Vice President and General Counsel, BellSouth Corporation, 2004 to 2007; Vice President and Associate General Counsel, BellSouth Corporation, 2000 to 2004; Associate, Partner, and National Litigation Practice Co-Chair, Mayer, Brown LLP, 1981 to 2000; Associate Independent Counsel, Office of Independent Counsel, 1990 to 1992. | | 55 | | | Trustee, Jewish Theological Seminary, since 2015; Director, Counsel on Call (privately held for-profit company), since 2012; Director, Lawyers Committee for Civil Rights Under Law (not-for-profit), since 2005; formerly, Director, Equal Justice Works (not-for-profit), 2005 to 2014; Director, Corporate Counsel Institute, Georgetown University Law Center, 2007 to 2012; Director, Greater Boston Legal Services (not-for-profit), 2007 to 2012. |
50
Name, (Year of Birth),
and Address(1) | | Position(s) and
Length of
Time Served(2) | | Principal Occupation(s)(3) | | Number of
Funds in Fund
Complex
Overseen by
Fund Trustee | | Other Directorships Held
Outside Fund Complex by
Fund Trustee(3) |
Martha C. Goss (1949) | | Trustee since 2007 | | President, Woodhill Enterprises Inc./Chase Hollow Associates LLC (personal investment vehicle), since 2006; formerly, Consultant, Resources Global Professionals (temporary staffing), 2002 to 2006. | | 55 | | | Director, American Water (water utility), since 2003; Director, Allianz Life of New York (insurance), since 2005; Director, Berger Group Holdings, Inc. (engineering consulting firm), since 2013; Director, Financial Women's Association of New York (not-for-profit association), since 2003; Trustee Emerita, Brown University, since 1998; Director, Museum of American Finance (not-for-profit), since 2013; formerly, Non-Executive Chair and Director, Channel Reinsurance (financial guaranty reinsurance), 2006 to 2010; formerly, Director, Ocwen Financial Corporation (mortgage servicing), 2005 to 2010; formerly, Director, Claire's Stores, Inc. (retailer), 2005 to 2007; formerly, Director, Parsons Brinckerhoff Inc. (engineering consulting firm), 2007 to 2010; formerly, Director, Bank Leumi (commercial bank), 2005 to 2007; formerly, Advisory Board Member, Attensity (software developer), 2005 to 2007. |
Michael M. Knetter (1960) | | Trustee since 2007 | | President and Chief Executive Officer, University of Wisconsin Foundation, since October 2010; formerly, Dean, School of Business, University of Wisconsin - Madison; formerly, Professor of International Economics and Associate Dean, Amos Tuck School of Business - Dartmouth College, 1998 to 2002. | | 55 | | | Board Member, American Family Insurance (a mutual company, not publicly traded), since March 2009; formerly, Trustee, Northwestern Mutual Series Fund, Inc., 2007 to 2011; formerly, Director, Wausau Paper, 2005 to 2011; formerly, Director, Great Wolf Resorts, 2004 to 2009. |
51
Name, (Year of Birth),
and Address(1) | | Position(s) and
Length of
Time Served(2) | | Principal Occupation(s)(3) | | Number of
Funds in Fund
Complex
Overseen by
Fund Trustee | | Other Directorships Held
Outside Fund Complex by
Fund Trustee(3) |
Deborah C. McLean (1954) | | Trustee since 2015 | | Member, Circle Financial Group (private wealth management membership practice), since 2011; Managing Director, Golden Seeds LLC (an angel investing group), since 2009; Adjunct Professor, Columbia University School of International and Public Affairs, since 2008; formerly, Visiting Assistant Professor, Fairfield University, Dolan School of Business, Fall 2007; formerly, Adjunct Associate Professor of Finance, Richmond, The American International University in London, 1999 to 2007. | | 55 | | | Board member, Norwalk Community College Foundation, since 2014; Dean's Advisory Council, Radcliffe Institute for Advanced Study, since 2014; formerly, Director and Treasurer, At Home in Darien (not-for-profit), 2012 to 2014; Director, National Executive Service Corps (not-for-profit), 2012 to 2013; Trustee, Richmond, The American International University in London, 1999 to 2013. |
George W. Morriss (1947) | | Trustee since 2007 | | Adjunct Professor, Columbia University School of International and Public Affairs, since October 2012; formerly, Executive Vice President and Chief Financial Officer, People's United Bank, Connecticut (a financial services company), 1991 to 2001. | | 55 | | | Director, National Association of Corporate Directors, Connecticut Chapter, since 2011; Trustee, Steben Alternative Investment Funds, Steben Select Multi-Strategy Fund, and Steben Select Multi-Strategy Master Fund, since 2013; formerly, Treasurer, National Association of Corporate Directors, Connecticut Chapter, 2011 to 2015; formerly, Manager, Larch Lane Multi-Strategy Fund complex (which consisted of three funds), 2006 to 2011; formerly, Member, NASDAQ Issuers' Affairs Committee, 1995 to 2003. |
52
Name, (Year of Birth),
and Address(1) | | Position(s) and
Length of
Time Served(2) | | Principal Occupation(s)(3) | | Number of
Funds in Fund
Complex
Overseen by
Fund Trustee | | Other Directorships Held
Outside Fund Complex by
Fund Trustee(3) |
Tom D. Seip (1950) | | Trustee since 2000; Chairman of the Board since 2008; formerly Lead Independent Trustee from 2006 to 2008 | | General Partner, Ridgefield Farm LLC (a private investment vehicle); formerly, President and CEO, Westaff, Inc. (temporary staffing), May 2001 to January 2002; formerly, Senior Executive, The Charles Schwab Corporation, 1983 to 1998, including Chief Executive Officer, Charles Schwab Investment Management, Inc.; Trustee, Schwab Family of Funds and Schwab Investments, 1997 to 1998; and Executive Vice President-Retail Brokerage, Charles Schwab & Co., Inc., 1994 to 1997. | | 55 | | | Director, H&R Block, Inc. (financial services company), since May 2001; Chairman, Governance and Nominating Committee, H&R Block, Inc., since 2011; formerly, Chairman, Compensation Committee, H&R Block, Inc., 2006 to 2010; formerly, Director, Forward Management, Inc. (asset management company), 1999 to 2006. |
James G. Stavridis (1955) | | Trustee since 2015 | | Dean, Fletcher School of Law and Diplomacy, Tufts University since 2013; formerly, Admiral, United States Navy, 2006 to 2013, including Supreme Allied Commander, NATO and Commander, European Command, 2009 to 2013, and Commander, United States Southern Command, 2006 to 2009. | | 55 | | | Director, Utilidata Inc., since 2015; Director, BMC Software Federal, LLC, since 2014; Director, Vertical Knowledge, LLC, since 2013; formerly, Director, Navy Federal Credit Union, 2000-2002. |
53
Name, (Year of Birth),
and Address(1) | | Position(s) and
Length of
Time Served(2) | | Principal Occupation(s)(3) | | Number of
Funds in Fund
Complex
Overseen by
Fund Trustee | | Other Directorships Held
Outside Fund Complex by
Fund Trustee(3) |
Candace L. Straight (1947) | | Trustee since 1999 | | Private investor and consultant specializing in the insurance industry; formerly, Advisory Director, Securitas Capital LLC (a global private equity investment firm dedicated to making investments in the insurance sector), 1998 to 2003. | | 55 | | | Formerly, Public Member, Board of Governors and Board of Trustees, Rutgers University, 2011 to 2016; formerly, Director, Montpelier Re Holdings Ltd. (reinsurance company), 2006 to 2015; formerly, Director, National Atlantic Holdings Corporation (property and casualty insurance company), 2004 to 2008; formerly, Director, The Proformance Insurance Company (property and casualty insurance company), 2004 to 2008; formerly, Director, Providence Washington Insurance Company (property and casualty insurance company), 1998 to 2006; formerly, Director, Summit Global Partners (insurance brokerage firm), 2000 to 2005. |
Peter P. Trapp (1944) | | Trustee since 1984 | | Retired; formerly, Regional Manager for Mid-Southern Region, Ford Motor Credit Company, September 1997 to 2007; formerly, President, Ford Life Insurance Company, April 1995 to August 1997. | | 55 | | | None. |
54
Name, (Year of Birth),
and Address(1) | | Position(s) and
Length of
Time Served(2) | | Principal Occupation(s)(3) | | Number of
Funds in Fund
Complex
Overseen by
Fund Trustee | | Other Directorships Held
Outside Fund Complex by
Fund Trustee(3) |
Trustees who are "Interested Persons" |
Joseph V. Amato* (1962) | | Trustee since 2009 | | President and Director, Neuberger Berman Group LLC, since 2009; President and Chief Executive Officer, Neuberger Berman BD LLC ("Neuberger Berman") and Neuberger Berman Holdings LLC (including its predecessor, Neuberger Berman Inc.), since 2007; Chief Investment Officer (Equities) and President (Equities), Neuberger Berman Investment Advisers LLC ("NBIA") (formerly, Neuberger Berman Fixed Income LLC ("NBFI") and including predecessor entities), since 2007, and Board Member of NBIA since 2006; formerly, Global Head of Asset Management of Lehman Brothers Holdings Inc.'s ("LBHI") Investment Management Division, 2006 to 2009; formerly, member of LBHI's Investment Management Division's Executive Management Committee, 2006 to 2009; formerly, Managing Director, Lehman Brothers Inc. ("LBI"), 2006 to 2008; formerly, Chief Recruiting and Development Officer, LBI, 2005 to 2006; formerly, Global Head of LBI's Equity Sales and a Member of its Equities Division Executive Committee, 2003 to 2005. | | 55 | | | Member of Board of Advisors, McDonough School of Business, Georgetown University, since 2001; Member of New York City Board of Advisors, Teach for America, since 2005; Trustee, Montclair Kimberley Academy (private school), since 2007; Member of Board of Regents, Georgetown University, since 2013. |
55
Name, (Year of Birth),
and Address(1) | | Position(s) and
Length of
Time Served(2) | | Principal Occupation(s)(3) | | Number of
Funds in Fund
Complex
Overseen by
Fund Trustee | | Other Directorships Held
Outside Fund Complex by
Fund Trustee(3) |
Robert Conti* (1956) | | Chief Executive Officer, President and Trustee since 2008; prior thereto, Executive Vice President in 2008 and Vice President from 2000 to 2008 | | Managing Director, Neuberger Berman, since 2007; President - Mutual Funds, NBIA, since 2008; formerly, Senior Vice President, Neuberger Berman, 2003 to 2006; formerly, Vice President, Neuberger Berman, 1999 to 2003; President and Chief Executive Officer, twenty-eight registered investment companies for which NBIA acts as investment manager and/or administrator. | | 55 | | | Director, Staten Island Mental Health Society, since 1994; formerly, Chairman of the Board, Staten Island Mental Health Society, 2008 to 2011. |
(1) The business address of each listed person is 1290 Avenue of the Americas, New York, NY 10104.
(2) Pursuant to the Trust's Trust Instrument, each of these Trustees shall hold office for life or until his or her successor is elected or the Trust terminates; except that (a) any Trustee may resign by delivering a written resignation; (b) any Trustee may be removed with or without cause at any time by a written instrument signed by at least two-thirds of the other Trustees; (c) any Trustee who requests to be retired, or who has become unable to serve, may be retired by a written instrument signed by a majority of the other Trustees; and (d) any Trustee may be removed at any shareholder meeting by a vote of at least two-thirds of the outstanding shares.
(3) Except as otherwise indicated, each individual has held the positions shown during at least the last five years.
* Indicates a Trustee who is an "interested person" within the meaning of the 1940 Act. Mr. Amato and Mr. Conti are interested persons of the Trust by virtue of the fact that each is an officer of Management, Neuberger Berman and/or their affiliates.
56
Information about the Officers of the Trust
Name, (Year of Birth),
and Address(1) | | Position(s) and
Length of Time
Served(2) | | Principal Occupation(s)(3) | |
Claudia A. Brandon (1956) | | Executive Vice President since 2008 and Secretary since 1985 | | Senior Vice President, Neuberger Berman, since 2007 and Employee since 1999; Senior Vice President, NBIA, since 2008 and Assistant Secretary since 2004; formerly, Vice President, Neuberger Berman, 2002 to 2006; formerly, Vice President—Mutual Fund Board Relations, NBIA, 2000 to 2008; formerly, Vice President, NBIA, 1986 to 1999 and Employee, 1984 to 1999; Executive Vice President, twenty-eight registered investment companies for which NBIA acts as investment manager and/or administrator; Secretary, fifteen registered investment companies for which NBIA acts as investment manager and/or administrator . | |
Agnes Diaz (1971) | | Vice President since 2013 | | Senior Vice President, Neuberger Berman, since 2012; Senior Vice President, NBIA, since 2012 and Employee since 1996; formerly, Vice President, Neuberger Berman, 2007 to 2012; Vice President, twenty-eight registered investment companies for which NBIA acts as investment manager and/or administrator. | |
Anthony DiBernardo (1979) | | Assistant Treasurer since 2011 | | Senior Vice President, NBIA, since 2014, and Employee since 2003; formerly, Vice President, Neuberger Berman, 2009 to 2014; Assistant Treasurer, ten registered investment companies for which NBIA acts as investment manager and/or administrator. | |
Corey A. Issing (1978) | | Chief Legal Officer since 2016 (only for purposes of sections 307 and 406 of the Sarbanes-Oxley Act of 2002) and Anti-Money Laundering Compliance Officer since 2016 | | General Counsel and Head of Compliance—Mutual Funds since 2016 and Senior Vice President, NBIA, since 2013, formerly, Associate General Counsel (2015 to 2016), Counsel (2007 to 2015), Vice President (2009 - 2013); Chief Legal Officer (only for purposes of sections 307 and 406 of the Sarbanes-Oxley Act of 2002), twenty-eight registered investment companies for which NBIA acts as investment manager and/or administrator; Anti-Money Laundering Compliance Officer, twenty-eight registered investment companies for which NBIA acts as investment manager and/or administrator. | |
Sheila R. James (1965) | | Assistant Secretary since 2002 | | Vice President, Neuberger Berman, since 2008 and Employee since 1999; Vice President, NBIA, since 2008; formerly, Assistant Vice President, Neuberger Berman, 2007; Employee, NBIA, 1991 to 1999; Assistant Secretary, twenty-eight registered investment companies for which NBIA acts as investment manager and/or administrator. | |
57
Name, (Year of Birth),
and Address(1) | | Position(s) and
Length of Time
Served(2) | | Principal Occupation(s)(3) | |
Brian Kerrane (1969) | | Chief Operating Officer since 2015 and Vice President since 2008 | | Managing Director, Neuberger Berman, since 2013; Chief Operating Officer—Mutual Funds and Managing Director, NBIA, since 2015 and Employee since 1991; formerly, Senior Vice President, Neuberger Berman, 2006 to 2014; Vice President, NBIA, 2008 to 2015; Chief Operating Officer, ten registered investment companies for which NBIA acts as investment manager and/or administrator; Vice President, twenty-eight registered investment companies for which NBIA acts as investment manager and/or administrator. | |
Kevin Lyons (1955) | | Assistant Secretary since 2003 | | Assistant Vice President, Neuberger Berman, since 2008 and Employee since 1999; Assistant Vice President, NBIA, since 2008; formerly, Employee, NBIA, 1993 to 1999; Assistant Secretary, ten registered investment companies for which NBIA acts as investment manager and/or administrator. | |
Anthony Maltese (1959) | | Vice President since 2015 | | Senior Vice President, Neuberger Berman, since 2014 and Employee since 2000; Senior Vice President, NBIA, since 2014; Vice President, ten registered investment companies for which NBIA acts as investment manager and/or administrator. | |
Owen F. McEntee, Jr. (1961) | | Vice President since 2008 | | Vice President, Neuberger Berman, since 2006; Vice President, NBIA, since 2006 and Employee since 1992; Vice President, ten registered investment companies for which NBIA acts as investment manager and/or administrator. | |
John M. McGovern (1970) | | Treasurer and Principal Financial and Accounting Officer since 2005 | | Senior Vice President, Neuberger Berman, since 2007; Senior Vice President, NBIA, since 2007 and Employee since 1993; formerly, Vice President, Neuberger Berman, 2004 to 2006; formerly, Assistant Treasurer, 2002 to 2005; Treasurer and Principal Financial and Accounting Officer, twenty-eight registered investment companies for which NBIA acts as investment manager and/or administrator. | |
Frank Rosato (1971) | | Assistant Treasurer since 2005 | | Vice President, Neuberger Berman, since 2006; Vice President, NBIA, since 2006 and Employee since 1995; Assistant Treasurer, ten registered investment companies for which NBIA acts as investment manager and/or administrator. | |
Chamaine Williams (1971) | | Chief Compliance Officer since 2005 | | Chief Compliance Officer—Mutual Funds and Senior Vice President, NBIA, since 2006; formerly, Senior Vice President, LBI, 2007 to 2008; formerly, Vice President, LBI, 2003 to 2006; formerly, Chief Compliance Officer, Lehman Brothers Asset Management Inc., 2003 to 2007; formerly, Chief Compliance Officer, Lehman Brothers Alternative Investment Management LLC, 2003 to 2007; Chief Compliance Officer, fifteen registered investment companies for which NBIA acts as investment manager and/or administrator. | |
(1) The business address of each listed person is 1290 Avenue of the Americas, New York, NY 10104.
(2) Pursuant to the By-Laws of the Trust, each officer elected by the Trustees shall hold office until his or her successor shall have been elected and qualified or until his or her earlier death, inability to serve, or resignation. Officers serve at the pleasure of the Trustees and may be removed at any time with or without cause.
(3) Except as otherwise indicated, each individual has held the positions shown during at least the last five years
58
Proxy Voting Policies and Procedures
A description of the policies and procedures that the Trust uses to determine how to vote proxies relating to portfolio securities is available, without charge, by calling 800-877-9700 (toll-free) and on the Securities and Exchange Commission's website, at www.sec.gov. Information regarding how the Trust voted proxies relating to portfolio securities during the most recent 12-month period ended June 30 is also available, without charge, upon request, by calling 800-877-9700 (toll-free), on the Securities and Exchange Commission's website at www.sec.gov, and on Management's website at www.nb.com.
Quarterly Portfolio Schedule
The Trust files a complete schedule of portfolio holdings for each Fund with the Securities and Exchange Commission for the first and third quarters of each fiscal year on Form N-Q. The Trust's Forms N-Q are available on the Securities and Exchange Commission's website at www.sec.gov and may be reviewed and copied at the Securities and Exchange Commission's Public Reference Room in Washington, DC. Information on the operation of the Public Reference Room may be obtained by calling 800-SEC-0330. The information on Form N-Q is available upon request, without charge, by calling 800-877-9700 (toll-free).
Board Consideration of the Management and Sub-Advisory Agreements
On an annual basis, the Board of Trustees (the "Board") of Neuberger Berman Advisers Management Trust (the "Trust"), including the Trustees who are not "interested persons" of Neuberger Berman Investment Advisers LLC ("Management") (including its affiliates) or the Trust ("Independent Fund Trustees"), considers whether to continue the management agreement with Management (the "Management Agreement") and the separate sub-advisory agreements among Management and each of the following sub-advisers (each a "Sub-Adviser"): Blue Jay Capital Management, LLC, Cramer Rosenthal McGlynn, LLC, GAMCO Asset Management Inc., Good Hill Partners LP, Lazard Asset Management LLC, Levin Capital Strategies, L.P., Sound Point Capital Management, L.P., and TPH Asset Management, LLC (each, a "Sub-Advisory Agreement" and collectively with the Management Agreement, the "Agreements") for Absolute Return Multi-Manager Portfolio (the "Fund"). Throughout the process, the Independent Fund Trustees are advised by counsel that is experienced in Investment Company Act of 1940 matters and that is independent of Management ("Independent Counsel"). At a meeting held on October 18, 2016, the Board, including the Independent Fund Trustees, approved the continuation of the Agreements for the Fund.
In evaluating the Agreements, the Board, including the Independent Fund Trustees, reviewed extensive materials provided by Management and each Sub-Adviser in response to questions submitted by the Independent Fund Trustees, Independent Counsel, and (for the Sub-Advisers), by Management, and met with senior representatives of Management regarding its personnel, operations and financial condition as they relate to the Fund. The annual contract review extends over at least three regular meetings of the Board to ensure that Management and each Sub-Adviser have time to respond to any questions the Independent Fund Trustees may have on their initial review of the materials and that the Independent Fund Trustees have time to consider those responses.
In connection with its deliberations, the Board also considered the broad range of information relevant to the annual contract review that is provided to the Board (including its various standing committees) at meetings throughout the year, including investment performance reports and related portfolio information for the Fund, as well as periodic reports on, among other matters, pricing and valuation; brokerage and execution; compliance; and shareholder and other services provided by Management and its affiliates. To assist the Board in its deliberations regarding the annual contract review, the Board has established a Contract Review Committee comprised of Independent Fund Trustees. The Board has also established other committees that focus throughout the year on specific areas relevant to the annual contract review, such as Fund performance or compliance matters, and that are charged with specific responsibilities regarding the annual contract review. Those committees provide reports that feed into the Contract Review Committee, which reviews and takes account of the information. The Ethics and Compliance Committee received each quarter from the Funds' Chief
59
Compliance Officer and reviewed a summary of the quarterly compliance questionnaire completed by each Sub-Adviser. The Board also considered the size and staffing of certain Sub-Advisers, as warranted, and particularly their staffing of the portfolio management and compliance functions.
The Independent Fund Trustees received from Independent Counsel a memorandum discussing the legal standards for their consideration of the proposed continuation of the Agreements. During the course of the year and during their deliberations regarding the annual contract review, the Contract Review Committee and the Independent Fund Trustees met with Independent Counsel separately from representatives of Management and the Sub-Advisers.
In connection with its approval of the continuation of the Agreements, the Board evaluated the terms of the Agreements, the overall fairness of the Agreements to the Fund and whether the Agreements were in the best interests of the Fund and its shareholders. The Board considered all factors it deemed relevant with respect to the Fund, including the following factors: (1) the nature, extent, and quality of the services provided by Management and the Sub-Advisers; (2) the investment performance of the Fund compared to an appropriate market index and a peer group of investment companies, and the contribution of each sleeve to the Fund's overall performance; (3) the costs of the services provided and the profit or loss realized by Management and its affiliates from their relationship with the Fund; (4) the extent to which economies of scale have been or might be realized as the Fund grows; and (5) whether fee levels reflect any such potential economies of scale for the benefit of the Fund's shareholders. The Board also inquired whether there are any other business relationships between Management and the Sub-Advisers that might result in the negotiations between them being less than arms-length. The Board's determination to approve the continuation of the Agreements was based on a comprehensive consideration of all information provided to the Board throughout the year and specifically in connection with the annual contract review. The Board members did not identify any particular information or factor that was all-important or controlling, and each Trustee may have attributed different weights to the various factors. The Board focused on the overall costs and benefits of the Agreements to the Fund and, through the Fund, its shareholders.
With respect to the nature, extent and quality of the services provided, the Board considered the investment philosophy and decision-making processes of Management and each Sub-Adviser, and the qualifications, experience, and capabilities of, and the resources available to, the portfolio management personnel of Management and each Sub-Adviser who perform services for the Fund. The Board noted that Management also provides certain administrative services, including fund accounting and compliance services. The Board noted that Management, together with the Fund, had obtained from the Securities and Exchange Commission an exemptive order that permitted Management to add or replace sub-advisers to the Fund without a shareholder vote, provided the Independent Fund Trustees approve the new sub-adviser and certain other steps are taken. In this context, the Board considered Management's responsibilities for designing an overall investment program for the Fund and then identifying the Sub-Advisers who will carry out the different portions of that program based on Management's due diligence of those Sub-Advisers. The Board noted that under the multi-manager arrangement, Management is continually assessing the need for new sub-advisers and the appropriateness of potential candidates, and noted the likelihood Management would in the future have to due diligence additional sub-advisers. The Board noted that Management is responsible for allocating the Fund's portfolio among the various Sub-Advisers and determining when and how to rebalance the allocations among the Sub-Advisers in the wake of disparate growth and changes in the markets and the broader economy, to make certain other investment decisions and to engage in transactions to hedge or balance risks in the Sub-Adviser's portfolio, subject to its general oversight.
As in past years, the Board also considered the manner in which Management addressed various non-routine matters that arose during the year, some of them a result of developments in the broader fund industry or the regulations governing it. In addition, the Board considered actions taken by Management in response to recent market conditions, such as regulatory concerns about changes in fixed-income market liquidity and potential volatility, and considered the overall performance of Management in this context. The Board considered the policies and practices regarding brokerage and allocation of portfolio transactions of each of the Sub-Advisers and noted that Management monitored the quality of the execution services provided by each Sub-Adviser. The Board also reviewed whether the Sub-Advisers would use brokers to execute Fund transactions that provide research and other services to the Sub-Advisers, and the types of benefits potentially derived from such services by the Sub-Advisers, the Fund and other clients of the Sub-Advisers.
60
The Board factored into its evaluation of the Fund's fees and performance a consideration of the limitations inherent in the methodology for constructing peer groups and determining which investment companies should be included in the peer groups. It also considered that the nature of the Fund makes it difficult to find an appropriate market index or truly comparable peer group. The Board considered a peer group composed of two types of funds: proprietary funds that are operated by insurance companies or their affiliates, and non-proprietary funds, such as the Fund, operated for insurance company investors by independent investment managers.
With respect to investment performance, the Board considered information regarding the Fund's performance both on an absolute basis and relative to an appropriate benchmark index and the average performance of a composite peer group (as constructed by an independent organization) of investment companies pursuing broadly similar strategies. The Board also reviewed the Fund's performance in relation to certain measures of the degree of investment risk undertaken by the Fund. The Board also considered information regarding each Sub-Adviser's performance. In the case of those Sub-Advisers that had underperformed their benchmark indices and/or peer groups, the Board discussed with Management each Sub-Adviser's performance and steps that Management had taken, or intended to take, to improve performance. The Board looked at the Fund's S Class as a proxy for both of the Fund's classes. The Board considered that as compared to its peer group, the Fund's performance was lower than the median for the 1-year period. The Board also considered that the Fund's performance was lower than its benchmark for the 1-year period. The Board also considered Management's responsiveness with respect to the Fund's lagging performance. In this regard, the Board noted that performance, especially short-term performance, is only one of the factors that it deems relevant to its consideration of the Fund's Agreements and that, after considering all relevant factors, it may be appropriate to approve the continuation of the Agreements notwithstanding the Fund's underperformance.
With respect to the overall fairness of the Agreements, the Board considered the fee structure for the Fund under the Agreements as compared to the peer group. The Board also considered any fall-out (i.e. indirect) benefits likely to accrue to Management or its affiliates from their relationship with the Fund. The Board also considered the profitability of Management and its affiliates from their association with the Fund.
The Board reviewed a comparison of the Fund's management fee and total expense ratio to the peer group and was aware that non-proprietary insurance product funds generally have higher fee structures than proprietary funds. The Board noted that the comparative management fee analysis includes, in the Fund's management fee, the separate administrative fee paid to Management, but it was not clear whether this was the case for all funds in the peer group. Management indicated that similar comparative information was not available with respect to the amount paid to each Sub-Adviser. The Board did, however, consider the allocation of duties and responsibilities among Management and the Sub-Advisers and, in light of that, the amount of fees retained by each. The Board noted, however, that Management, and not the Fund, pays the fee to the Sub-Advisers. The Board also monitors throughout the year the potential effect on the profitability of Management resulting from changes in Sub-Advisers and/or their fees. The Board compared the Fund's contractual and actual management fees to the mean and median of the contractual and actual management fees, respectively, of the Fund's peer group. (The actual management fees are the contractual management fees reduced by any fee waivers or other adjustments.) In addition, the Board considered the contractual limit on expenses of the Fund. The Board noted that the overall expense ratio of the Fund's S Class is maintained through expense reimbursements by Management that exceed the fees that Management receives from the Fund. The Board noted that Management incurred a loss on its management of the Fund during the review period.
The Board considered that, for the Fund's S Class shares, as compared to its peer group, the Fund's contractual management fee was higher than the median, but the actual management fee net of fees waived by Management was lower than the median. The Board considered whether specific portfolio management, administration or oversight needs contributed to the management fee. The Board also noted that the Fund's size, which impacts its expenses and performance, has been affected by ongoing changes in the insurance market.
The Board considered the fees the Sub-Advisers charge for similar products, if any. The Board also considered fees charged to Neuberger Berman Absolute Return Multi-Manager Fund, a series of Neuberger Berman Alternative Funds, and in prior years with respect to that series, to an unregistered fund of funds managed by Management, each of which uses some of the same strategies used by the Fund and noted differences that reduced the usefulness of the comparisons.
61
The Board further noted that Management is responsible for overseeing the Sub-Advisers pursuant to the Agreements and related sub-adviser oversight policies and procedures approved by the Board. Under these procedures, Management is responsible for overseeing the investment performance of the Sub-Advisers and evaluating the risk and return of each Sub-Adviser and the Fund as a whole, in addition to other significant oversight responsibilities. The Board also considered that Management's responsibilities include daily management of investment, operational, enterprise, legal, regulatory and compliance risks as they relate to the Fund, and considered information regarding Management's processes for managing risk. The Board also considered the experience and staffing of the portfolio management and investment research personnel of Management, and the general structure of Management's portfolio manager compensation program and whether this structure provides appropriate incentives to act in the best interests of the Fund.
The Board also considered the size and scope of the activities necessary to periodically evaluate the compliance programs and other operational aspects of each Sub-Adviser. In addition, the Board considered the scope and compliance history of the compliance programs of Management and each Sub-Adviser, including the Funds' Chief Compliance Officer's assessment of the compliance programs of the Sub-Advisers. The Board noted the positive compliance history of Management and each Sub-Adviser as no significant compliance problems were reported to the Board with respect to any of the firms. The Board also considered whether there were any pending lawsuits, enforcement proceedings or regulatory investigations involving Management or any Sub-Adviser, and reviewed information regarding their financial condition, history of operations and any conflicts of interests in managing the Fund. The Board discussed that Management's Chief Information Security Officer had evaluated the Sub-Advisers' responses on questions of cybersecurity, business continuity and disaster recovery.
The Board also evaluated any apparent or anticipated economies of scale in relation to the services Management provides to the Fund. The Board considered whether the Fund's fee structure provides for a reduction of payments resulting from the use of breakpoints and whether those breakpoints are set at appropriate asset levels. As in past years, the Board gave careful thought to the size of any breakpoints in the Fund's advisory fees and the asset levels at which they are set. It also considered whether the fees were set at an appropriate level and compared the fee structures to that of the peer group. The Board also considered that Management has provided, at no added cost to the Fund, certain additional services that were required by new regulations or regulatory interpretations, impelled by changes in the securities markets or the business landscape, and/or requested by the Board. In concluding that the benefits accruing to Management and its affiliates by virtue of their relationship with the Fund were reasonable in light of the costs of providing the investment advisory and other services and the benefits accruing to the Fund, the Board reviewed specific data as to Management's profitability on the Fund for a recent period. The Board also considered Management's cost allocation methodology. It also considered whether any of the Sub-Advisory Agreements will provide for breakpoints in the fees and, as a general matter, the way in which such breakpoints should factor into the fees paid by the Fund. The Board considered the profitability of Management, recognized that Management should be entitled to earn a reasonable level of profits for services it provides to the Fund, and based on its review, concluded that Management's reported level of profitability on the Fund was reasonable.
Conclusions
In approving the continuation of the Agreements, the Board concluded that the terms of each Agreement are fair and reasonable to the Fund and that approval of the continuation of the Agreements is in the best interests of the Fund and its shareholders. In reaching this determination, the Board considered that Management and each Sub-Adviser could be expected to provide a high level of service to the Fund; regarding the Fund's underperformance, that it retained confidence in Management's and each Sub-Adviser's capabilities to manage the Fund; that the Fund's fee structure appeared to the Board to be reasonable given the nature, extent and quality of services provided; and that the benefits accruing to Management and its affiliates by virtue of their relationship with the Fund were reasonable in light of the costs of providing the investment advisory and other services and the benefits accruing to the Fund. The Board's conclusions may be based in part on its consideration of materials prepared in connection with the approval or continuance of the Agreements in prior years and on the Board's ongoing regular review of Fund performance and operations throughout the year, in addition to material prepared specifically for the most recent annual review of the Agreements.
62
Notice to Shareholders
85.38% of the dividends earned during the fiscal year ended December 31, 2016 qualify for the dividends received deduction for corporate shareholders.
63
Neuberger Berman
Advisers Management Trust
Guardian Portfolio
I Class Shares
S Class Shares
Annual Report
December 31, 2016
Guardian Portfolio Commentary (Unaudited)
The Neuberger Berman Advisers Management Trust Guardian Portfolio Class I generated a total return of 8.73% for the 12 months ended December 31, 2016, underperforming the 11.96% return of its benchmark, the S&P 500® Index for the same period. (Performance for all share classes is provided in the table immediately following this letter.)
The U.S. stock market was volatile at times, but ultimately generated strong results during the reporting period. The year started off on a weak note due to concerns over moderating growth in China and falling oil prices. After declining sharply through early February, the market then posted positive returns over the next seven months. This turnaround was triggered by improved investor risk appetite given generally positive economic data, continued Federal Reserve policy accommodation and rising oil prices. After a brief setback in October, stocks rallied sharply over the last two months of the year given optimism for improving economic growth in the Trump administration.
The Fund's underperformance during the reporting period was largely driven by sector allocation. In particular, the Fund's cash and cash equivalents position was a headwind for performance given the market's solid results. An overweight to Consumer Staples and an underweight to Financials also detracted from results. In contrast, underweights to Health Care, Real Estate and Information Technology (IT) were the most beneficial for results.
Stock selection, overall, also detracted from performance during the period. From a selection perspective, the Fund's holdings in the Telecommunication Services, IT and Industrials sectors were the largest detractors from relative results. Individual stocks that negatively impacted the Fund's performance included American Express Co., BorgWarner Inc., CVS Health Corp., Alliance Data Systems Corp. and Vipshop Holdings Ltd. All except CVS Health Corp. were sold before year end. Conversely, holdings in the Utilities and Health Care sectors added the most value versus the benchmark. The Fund's positions in Brookfield Infrastructure Partners LP, Enbridge Inc., JPMorgan Chase & Co., WEC Energy Group, Inc. and UnitedHealth Group, Inc. were the largest contributors to performance for the period.
We enter 2017 with a fairly constructive—albeit highly selective—outlook for equity markets, driven by solid recent economic data and the emergence of a more pro-business environment in the U.S. This improvement in business sentiment has been propelled by expectations of reduced regulation, lower corporate tax rates, repatriation of foreign earnings and increased fiscal stimulus which we believe, if executed correctly, will provide a tailwind to growth and earnings. In our opinion, the timing of implementation as well as the actual policies enacted will have a divergent effect on the various subsectors of the market. Thus the policy details will matter. We believe there will be continued heightened volatility in 2017, particularly if implementation falls short of expectations in both magnitude and timing. In our view, the critical market dynamic is the shift from monetary policy to fiscal policy and its effect on growth, earnings, interest rates and the federal deficit. We believe government policy, or lack thereof, will matter a great deal in 2017 and beyond.
Sincerely,
Charles Kantor
Portfolio Manager
Information about principal risks of investing in the Fund is set forth in the prospectus and statement of additional information.
The portfolio composition, industries and holdings of the Fund are subject to change without notice.
The opinions expressed are those of the Fund's portfolio manager. The opinions are as of the date of this report, and are subject to change without notice.
1
Guardian Portfolio (Unaudited)
SECTOR ALLOCATION
(as a % of Total Investments*) | |
Consumer Discretionary | | | 12.2 | % |
Consumer Staples | | | 13.7 | |
Energy | | | 6.4 | |
Financials | | | 12.2 | |
Health Care | | | 12.0 | |
Industrials | | | 15.1 | |
Information Technology | | | 16.0 | |
Materials | | | 3.5 | |
Real Estate | | | 1.0 | |
Telecommunication Services | | | 1.9 | |
Utilities | | | 5.0 | |
Other | | | 0.0 | |
Short-Term Investment | | | 1.0 | |
Total | | | 100.0 | % |
* Derivatives, if any, are excluded from this chart.
PERFORMANCE HIGHLIGHTS4
| Inception Date | | Average Annual Total Return
Ended 12/31/2016 | |
| | 1 Year | | 5 Years | | 10 Years | | Life of Fund | |
Guardian Portfolio
Class I | |
11/03/1997 | | | | 8.73 | % | | | 12.01 | % | | | 5.93 | % | | | 7.35 | % | |
Guardian Portfolio
Class S2 | |
08/02/2002 | | | | 8.75 | % | | | 11.89 | % | | | 5.80 | % | | | 7.21 | % | |
| S&P 500® Index1,3 | | | | | | 11.96 | % | | | 14.66 | % | | | 6.95 | % | | | 6.76 | % | |
The performance data quoted represent past performance and do not indicate future results. Current performance may be lower or higher than the performance data quoted. For performance data current to the most recent month-end, please visit http://www.nb.com/amtportfolios/performance.
The results shown in the table reflect the reinvestment of income dividends and other distributions, if any. The results do not reflect the effect of taxes a shareholder would pay on Fund distributions or on the redemption of Fund shares. The results do not reflect fees and expenses of the variable annuity and variable life insurance policies or the qualified pension and retirement plans whose proceeds are invested in the Fund.
The investment return and principal value of an investment will fluctuate and shares, when redeemed, may be worth more or less than their original cost.
Returns would have been lower if Neuberger Berman Investment Advisers LLC ("Management") had not reimbursed certain expenses and/or waived a portion of the investment management fees during certain of the periods shown. Repayment by a class (of expenses previously reimbursed and/or fees previously waived by Management) will decrease the class's returns. Please see Note B in the Notes to Financial Statements for specific information regarding expense reimbursement and/or fee waiver arrangements.
As stated in the Fund's most recent prospectus, the total annual operating expense ratios for fiscal year 2015 were 1.15% and 1.39% for Class I and Class S shares, respectively (before expense reimbursements and/or fee waivers, if any). The expense ratio was 1.25% for Class S shares after expense reimbursements and/or fee waivers. The expense ratios for the annual period ended December 31, 2016 can be found in the Financial Highlights section of this report.
COMPARISON OF A $10,000 INVESTMENT
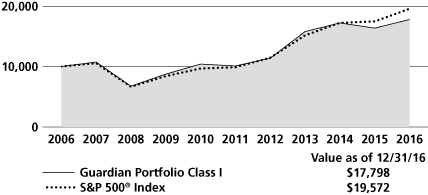
This graph shows the change in value of a hypothetical $10,000 investment in the Fund over the past 10 fiscal years, or since the Fund's inception if it has not operated for 10 years. The graph is based on Class I shares only; the performance of the Fund's share classes will differ primarily due to different class expenses (see Performance Highlights chart above).The result is compared with benchmarks, which include a broad-based market index and may include a more narrowly based index. Market indices have not been reduced to reflect any of the fees and costs of investing. The results shown in the graph reflect the reinvestment of income dividends and other distributions, if any. The results do not reflect the effect of taxes a shareholder would pay on Fund distributions or on the redemption of Fund shares. The results do not reflect fees and expenses of the variable annuity and variable life insurance policies or the qualified pension and retirement plans whose proceeds are invested in the Fund. Results represent past performance and do not indicate future results.
Please see Endnotes for additional information.
2
1 The date used to calculate Life of Fund performance for the index is November 3, 1997, the inception date of the oldest share class.
2 Performance shown prior to August 2, 2002 for Class S shares is that of Class I shares, which has lower expenses and correspondingly higher returns than Class S shares.
3 The S&P 500® Index is a float-adjusted market capitalization-weighted index that focuses on the large-cap segment of the U.S. equity market, and includes a significant portion of the total value of the market. Please note that the index described in this report does not take into account any fees, expenses or tax consequences of investing in the individual securities that it tracks, and that individuals cannot invest directly in any index. Data about the performance of an index are prepared or obtained by Neuberger Berman Investment Advisers LLC* ("Management") and reflect the reinvestment of income dividends and other distributions, if any. The Fund may invest in securities not included in a described index and generally does not invest in all securities included in a described index.
4 The Fund had a policy of investing mainly in large-cap stocks prior to December 2002. Its performance prior to that date might have been different if current policies had been in effect.
* On January 1, 2016, Neuberger Berman Management LLC ("NBM") transferred to Neuberger Berman Fixed Income LLC ("NBFI") their rights and obligations pertaining to all services they provided to any Fund under any investment management, investment sub-advisory, and/or administration agreement, as applicable (the "Agreements"). Following such transfer, NBFI was renamed Neuberger Berman Investment Advisers LLC ("NBIA" or "Management"). Following the consolidation, the investment professionals of NBM who provided services to any Fund under the Agreements continue to provide the same services, except that they provide those services in their new capacities as investment professionals of NBIA. Further, the consolidation did not result in any change in the investment processes employed by any Fund, the nature or level of services provided to any Fund, or the fees any Fund pays under its Agreements.
On July 1, 2016, NBM was reorganized into "Neuberger Berman" (the "Reorganization"). Upon the completion of the Reorganization, Neuberger Berman assumed all rights and obligations pertaining to all services NBM provided to any Fund under any distribution agreement or distribution and services agreement (the "Agreements") or plan adopted pursuant to Rule 12b-1 under the Investment Company Act of 1940, as amended, (the "Plans"). Accordingly, after the Reorganization, Neuberger Berman became each Fund's distributor and the services previously provided by NBM under the Agreements and Plans are provided by Neuberger Berman.
Following the Reorganization, the employees of NBM provide the same services to each Fund under the Agreements and Plans, except that they provide those services in their capacities as employees of Neuberger Berman. Further, the Reorganization did not result in any change in the nature or level of services provided to each Fund, or the fees, if any, each Fund pays under the Agreements or the Plans.
Please note, effective July 1, 2016, Neuberger Berman Management LLC was reorganized with and into Neuberger Berman LLC, a registered broker-dealer, Member FINRA and the Fund's distributor, which changed its name to Neuberger Berman BD LLC on January 1, 2017.
The investments for the Fund are managed by the same portfolio manager(s) who manage(s) one or more other registered funds that have names, investment objectives and investment styles that are similar to those of the Fund. You should be aware that the Fund is likely to differ from those other mutual fund(s) in size, cash flow pattern and tax matters. Accordingly, the holdings and performance of the Fund can be expected to vary from those of the other mutual fund(s).
Shares of the separate Neuberger Berman Advisers Management Trust Portfolios, including the Fund, are not available to the general public. Shares of the Fund may be purchased only by life insurance companies to be held in their separate accounts, which fund variable annuity and variable life insurance policies, and by qualified pension and retirement plans.
Statistics and projections in this report are derived from sources deemed to be reliable but cannot be regarded as a representation of future results of the Fund. This report is prepared for the general information of shareholders and is not an offer of shares of the Fund. Shares are sold only through the currently effective prospectus, which must precede or accompany this report.
The "Neuberger Berman" name and logo and "Neuberger Berman Investment Advisers LLC" name are registered service marks of Neuberger Berman Group LLC. The individual Fund names in this piece are either service marks or registered service marks of Neuberger Berman Investment Advisers LLC, an affiliate of Neuberger Berman BD LLC, distributor, member FINRA.
© 2017 Neuberger Berman BD LLC, distributor. All rights reserved.
3
Information About Your Fund's Expenses (Unaudited)
As a Fund shareholder, you incur two types of costs: (1) transaction costs such as fees and expenses that are, or may be, imposed under your variable contract or qualified pension plan; and (2) ongoing costs, including management fees, distribution and/or service (12b-1) fees (if applicable), and other Fund expenses. This example is intended to help you understand your ongoing costs (in U.S. dollars) of investing in the Fund and compare these costs with the ongoing costs of investing in other mutual funds.
This table is designed to provide information regarding costs related to your investments. The following examples are based on an investment of $1,000 made at the beginning of the six month period ended December 31, 2016 and held for the entire period. The table illustrates the Fund's costs in two ways:
Actual Expenses and Performance: | | The first section of the table provides information about actual account values and actual expenses in dollars, based on the Fund's actual performance during the period indicated. You may use the information in this line, together with the amount you invested, to estimate the expenses you paid over the period. Simply divide your account value by $1,000 (for example, an $8,600 account value divided by $1,000 = 8.6), then multiply the result by the number in the first section of the table under the heading entitled "Expenses Paid During the Period" to estimate the expenses you paid over the period. | |
Hypothetical Example for Comparison Purposes: | | The second section of the table provides information about hypothetical account values and hypothetical expenses based on the Fund's actual expense ratio and an assumed rate of return at 5% per year before expenses. This return is not the Fund's actual return. The hypothetical account values and expenses may not be used to estimate the actual ending account balance or expenses you paid for the period. You may use this information to compare the ongoing costs of investing in this Fund versus other funds. To do so, compare the expenses shown in this 5% hypothetical example with the 5% hypothetical examples that appear in the shareholder reports of other funds. | |
Please note that the expenses in the table are meant to highlight your ongoing costs only and do not include any transaction costs, such as fees and expenses that are, or may be imposed under your variable contract or qualified pension plan. Therefore, the information under the heading "Hypothetical (5% annual return before expenses)" is useful in comparing ongoing costs only, and will not help you determine the relative total costs of owning different funds. In addition, if these transaction costs were included, your costs would have been higher.
NEUBERGER BERMAN ADVISERS MANAGEMENT TRUST GUARDIAN PORTFOLIO
Actual | | Beginning Account
Value
7/1/16 | | Ending Account
Value
12/31/16 | | Expenses Paid
During the Period
7/1/16 – 12/31/16 | | Expense
Ratio | |
Class I | | $ | 1,000.00 | | | $ | 1,058.20 | | | $ | 6.42 | * | | | 1.24 | % | |
Class S | | $ | 1,000.00 | | | $ | 1,058.70 | | | $ | 6.52 | * | | | 1.26 | % | |
Hypothetical (5% annual return before expenses) | |
Class I | | $ | 1,000.00 | | | $ | 1,018.90 | | | $ | 6.29 | ** | | | 1.24 | % | |
Class S | | $ | 1,000.00 | | | $ | 1,018.80 | | | $ | 6.39 | ** | | | 1.26 | % | |
* For each class, expenses are equal to the annualized expense ratio for the class, multiplied by the average account value over the period, multiplied by 184/366 (to reflect the one-half year period shown).
** Hypothetical expenses are equal to the annualized expense ratios for each class, multiplied by the average account value over the period (assuming a 5% annual return), multiplied by 184/366 (to reflect the one-half year period shown).
4
Schedule of Investments Guardian Portfolio 12/31/16
NUMBER OF SHARES | | | | VALUE | |
| | | | | | |
Common Stocks 98.2% | | | |
Aerospace & Defense 3.9% | | | |
| | 8,660 | | | General Dynamics Corp. | | $ | 1,495,236 | | |
| | 5,400 | | | Raytheon Co. | | | 766,800 | | |
| | | | 2,262,036 | | |
Airlines 2.1% | | | |
| | 24,685 | | | Delta Air Lines, Inc. | | | 1,214,255 | | |
Banks 4.9% | | | |
| | 14,195 | | | JPMorgan Chase & Co. | | | 1,224,887 | | |
| | 30,785 | | | U.S. Bancorp | | | 1,581,425 | | |
| | | | 2,806,312 | | |
Beverages 3.1% | | | |
| | 7,300 | | | Anheuser-Busch InBev NV ADR | | | 769,712 | | |
| | 9,440 | | | PepsiCo, Inc. | | | 987,707 | | |
| | | | 1,757,419 | | |
Biotechnology 3.2% | | | |
| | 9,250 | | | Celgene Corp. | | | 1,070,687 | * | |
| | 10,355 | | | Gilead Sciences, Inc. | | | 741,522 | | |
| | | | 1,812,209 | | |
Capital Markets 5.3% | | | |
| | 2,035 | | | BlackRock, Inc. | | | 774,399 | | |
| | 44,465 | | | Brookfield Asset
Management, Inc. Class A | | | 1,467,790 | | |
| | 7,015 | | | CME Group, Inc. | | | 809,180 | | |
| | | | 3,051,369 | | |
Chemicals 2.9% | | | |
| | 11,490 | | | Ashland Global Holdings, Inc. | | | 1,255,742 | | |
| | 1,500 | | | Sherwin-Williams Co. | | | 403,110 | | |
| | | | 1,658,852 | | |
Commercial Services & Supplies 1.7% | | | |
| | 13,015 | | | Stericycle, Inc. | | | 1,002,676 | * | |
Consumer Finance 1.7% | | | |
| | 27,630 | | | Synchrony Financial | | | 1,002,140 | | |
Containers & Packaging 0.6% | | | |
| | 6,495 | | | International Paper Co. | | | 344,625 | | |
Diversified Telecommunication Services 1.9% | | | |
| | 10,300 | | | SBA Communications Corp.
Class A | | | 1,063,578 | *(a) | |
NUMBER OF SHARES | | | | VALUE | |
| | | | | | |
Electric Utilities 2.8% | | | |
| | 48,800 | | | Brookfield Infrastructure
Partners LP | | $ | 1,633,336 | | |
Electronic Equipment, Instruments &
Components 2.1% | | | |
| | 23,400 | | | CDW Corp. | | | 1,218,906 | | |
Energy Equipment & Services 2.4% | | | |
| | 16,533 | | | Schlumberger Ltd. | | | 1,387,945 | | |
Equity Real Estate Investment Trust 1.0% | | | |
| | 19,200 | | | Weyerhaeuser Co. | | | 577,728 | | |
Food & Staples Retailing 7.7% | | | |
| | 5,750 | | | Costco Wholesale Corp. | | | 920,633 | | |
| | 18,300 | | | CVS Health Corp. | | | 1,444,053 | | |
| | 8,800 | | | Kroger Co. | | | 303,688 | | |
| | 58,000 | | | Whole Foods Market, Inc. | | | 1,784,080 | (a) | |
| | | | 4,452,454 | | |
Food Products 2.9% | | | |
| | 32,600 | | | Conagra Brands, Inc. | | | 1,289,330 | | |
| | 10,121 | | | Lamb Weston Holdings, Inc. | | | 383,080 | * | |
| | | | 1,672,410 | | |
Health Care Equipment & Supplies 2.6% | | | |
| | 25,655 | | | Dentsply Sirona, Inc. | | | 1,481,063 | | |
Health Care Providers & Services 4.7% | | | |
| | 24,600 | | | DaVita, Inc. | | | 1,579,320 | * | |
| | 7,120 | | | UnitedHealth Group, Inc. | | | 1,139,485 | | |
| | | | 2,718,805 | | |
Hotels, Restaurants & Leisure 2.4% | | | |
| | 7,560 | | | McDonald's Corp. | | | 920,203 | | |
| | 8,700 | | | Starbucks Corp. | | | 483,024 | | |
| | | | 1,403,227 | | |
Industrial Conglomerates 2.3% | | | |
| | 7,400 | | | 3M Co. | | | 1,321,418 | | |
Insurance 0.3% | | | |
| | 3,600 | | | Athene Holding Ltd. Class A | | | 172,764 | * | |
Internet & Catalog Retail 2.9% | | | |
| | 1,470 | | | Amazon.com, Inc. | | | 1,102,309 | * | |
| | 390 | | | Priceline Group, Inc. | | | 571,763 | * | |
| | | | 1,674,072 | | |
See Notes to Financial Statements
5
Schedule of Investments Guardian Portfolio (cont'd)
NUMBER OF SHARES | | | | VALUE | |
| | | | | | |
Internet Software & Services 5.7% | | | |
| | 2,160 | | | Alphabet, Inc. Class A | | $ | 1,711,692 | * | |
| | 53,000 | | | eBay, Inc. | | | 1,573,570 | * | |
| | | | 3,285,262 | | |
IT Services 2.2% | | | |
| | 2,375 | | | Nets A/S | | | 41,565 | (b)* | |
| | 15,530 | | | Visa, Inc. Class A | | | 1,211,650 | | |
| | | | 1,253,215 | | |
Machinery 1.4% | | | |
| | 23,010 | | | Allison Transmission
Holdings, Inc. | | | 775,207 | | |
Multi-Utilities 2.2% | | | |
| | 21,100 | | | WEC Energy Group, Inc. | | | 1,237,515 | | |
Oil, Gas & Consumable Fuels 4.0% | | | |
| | 39,170 | | | Enbridge, Inc. | | | 1,649,840 | | |
| | 32,005 | | | Kinder Morgan, Inc. | | | 662,824 | | |
| | | | 2,312,664 | | |
Pharmaceuticals 0.8% | | | |
| | 7,415 | | | Bristol-Myers Squibb Co. | | | 433,333 | | |
Professional Services 2.6% | | | |
| | 39,000 | | | IHS Markit Ltd. | | | 1,380,990 | * | |
| | 2,735 | | | Nielsen Holdings PLC | | | 114,733 | | |
| | | | 1,495,723 | | |
Road & Rail 1.1% | | | |
| | 6,000 | | | Norfolk Southern Corp. | | | 648,420 | | |
Semiconductors & Semiconductor
Equipment 1.0% | | | |
| | 8,200 | | | Texas Instruments, Inc. | | | 598,354 | | |
Software 2.4% | | | |
| | 21,900 | | | Microsoft Corp. | | | 1,360,866 | | |
Specialty Retail 5.3% | | | |
| | 10,500 | | | Home Depot, Inc. | | | 1,407,840 | | |
| | 10,200 | | | TJX Cos., Inc. | | | 766,326 | | |
| | 11,800 | | | Tractor Supply Co. | | | 894,558 | | |
| | | | 3,068,724 | | |
Technology Hardware, Storage &
Peripherals 2.6% | | | |
| | 13,065 | | | Apple, Inc. | | | 1,513,188 | (c) | |
NUMBER OF SHARES | | | | VALUE | |
| | | | | | |
Textiles, Apparel & Luxury Goods 1.5% | | | |
| | 9,755 | | | PVH Corp. | | $ | 880,291 | (a) | |
| | | | Total Common Stocks
(Cost $49,788,823) | | | 56,552,361 | | |
Preferred Stock 0.8% | | | |
Health Care 0.8% | | | |
| | 54,100 | | | Moderna Therapeutics Ser. F
(Cost $474,998) | | | 474,998 | (d)(g) | |
CONTRACTS | | | | | |
Options Purchased 0.0% | | | |
Call Options 0.0% | | | |
Food & Staples Retailing 0.0% | | | |
| 15 | | | Whole Foods Market, Inc.
2/17/17 @ 31
(Cost $1,894) | | | 1,905 | | |
NUMBER OF SHARES | | | | | |
Short-Term Investment 1.0% | | | |
Investment Company 1.0% | | | |
| 581,566 | | | State Street Institutional
Treasury Money Market Fund
Premier Class, 0.39%
(Cost $581,566) | | | 581,566 | (c)(e) | |
| | | | Total Investments 100.0%
(Cost $50,847,281) | | | 57,610,830 | | |
| | | | | Other Assets Less Liabilities (0.0)% | | | (2,903 | )(f) | |
| | | | | Net Assets 100.0% | | $ | 57,607,927 | | |
See Notes to Financial Statements
6
Schedule of Investments Guardian Portfolio (cont'd)
* Non-income producing security.
(a) All or a portion of the security is pledged as collateral for options written.
(b) Securities were purchased under Rule 144A of the Securities Act of 1933, as amended (the "1933 Act"), or are otherwise restricted and, unless registered under the 1933 Act or exempted from registration, may only be sold to qualified institutional investors or may have other restrictions on resale. At 12/31/2016, these securities amounted to $41,565 or 0.1% of net assets for the Fund. These securities have been deemed by the investment manager to be liquid.
(c) All or a portion of this security is segregated in connection with obligations for options written with a total value of $871,116.
(d) Security fair valued as of 12/31/2016 in accordance with procedures approved by the Board of Trustees. Total value of all such securities at 12/31/2016 amounted to $474,998, which represents 0.8% of net assets of the Fund.
(e) Represents 7-day effective yield as of 12/31/2016.
(f) Includes the impact of the Fund's open positions in derivatives at 12/31/2016.
(g) This security has been deemed by the investment manager to be illiquid, and is subject to restrictions on resale.
At 12/31/2016, this security amounted to $474,998, which represents 0.8% of net assets of the Fund.
Restricted Security | | Acquisition
Date | | Acquisition
Cost | | Acquisition Cost
Percentage of
Net Assets | | Value
as of
12/31/2016 | | Fair Value
Percentage of
Net Assets
as of
12/31/2016 | |
Moderna Therapeutics
(Ser. F Preferred Shares) | | 8/10/2016 | | $ | 474,998 | | | | 0.8 | % | | $ | 474,998 | | | | 0.8 | % | |
Derivative Instruments
Written option contracts ("options written"): | |
At December 31, 2016, the Fund had outstanding options written as follows:
Name of Issuer | | Contracts | | Exercise
Price | | Expiration
Date | | Market Value
of Options | |
PVH Corp., Call | | | 5 | | | $ | 105 | | | 3/17/2017 | | $ | (600 | ) | |
Whole Foods Market, Inc., Put | | | 25 | | | | 25 | | | 1/20/2017 | | | (75 | )(a) | |
Total (premium received: $2,651) | | | | | | | | $ | (675 | ) | |
(a) Security fair valued as of 12/31/2016 in accordance with procedures approved by the Fund's Board of Trustees.
At December 31, 2016, the Fund had $1,059 deposited in a segregated account to cover requirements on options written.
See Notes to Financial Statements
7
Schedule of Investments Guardian Portfolio (cont'd)
Options written for the Fund for the year ended December 31, 2016 were as follows:
| | | Number of
Contracts | | Premium
Received | |
Outstanding 12/31/2015 | | | — | | | $ | — | | |
Options written | | | 58 | | | | 7,657 | | |
Options expired | | | (20 | ) | | | (2,697 | ) | |
Options exercised | | | (7 | ) | | | (654 | ) | |
Options closed | | | (1 | ) | | | (1,655 | ) | |
Outstanding 12/31/2016 | | | 30 | | | $ | 2,651 | | |
For the year ended December 31, 2016, the Fund had an average market value of $2,723 in options purchased, and $(2,025) in options written, respectively. At December 31, 2016 the Fund had pledged securities in the amount of $445,908 to cover collateral requirements for options written.
The following is a summary, categorized by Level (see Note A of Notes to Financial Statements), of inputs used to value the Fund's investments as of December 31, 2016:
Asset Valuation Inputs | | Level 1 | | Level 2 | | Level 3(b) | | Total | |
Investments: | |
Common Stocks(a) | | $ | 56,552,361 | | | $ | — | | | $ | — | | | $ | 56,552,361 | | |
Preferred Stock(a) | | | — | | | | — | | | | 474,998 | | | | 474,998 | | |
Options Purchased(a) | | | 1,905 | | | | — | | | | — | | | | 1,905 | | |
Short-Term Investment | | | — | | | | 581,566 | | | | — | | | | 581,566 | | |
Total Investments | | $ | 56,554,266 | | | $ | 581,566 | | | $ | 474,998 | | | $ | 57,610,830 | | |
(a) The Schedule of Investments provides information on the industry categorization for the portfolio.
(b) The following is a reconciliation between the beginning and ending balances of investments in which unobservable inputs (Level 3) were used in determining value:
Investments in
Securities: | | Beginning
balance, as
of 1/1/2016 | | Accrued
discounts/
(premiums) | | Realized
gain/(loss) | | Change in
unrealized
appreciation/
(depreciation) | | Purchases | | Sales | | Transfers
into
Level 3 | | Transfers
out of
Level 3 | | Balance,
as of
12/31/2016 | | Net change in
unrealized
appreciation/
(depreciation)
from
investments
still held as of
12/31/2016 | |
Preferred Stock | |
Health Care | | $ | — | | | $ | — | | | $ | — | | | $ | — | | | $ | 474,998 | | | $ | — | | | $ | — | | | $ | — | | | $ | 474,998 | | | $ | — | | |
Total | | $ | — | | | $ | — | | | $ | — | | | $ | — | | | $ | 474,998 | | | $ | — | | | $ | — | | | $ | — | | | $ | 474,998 | | | $ | — | | |
See Notes to Financial Statements
8
Schedule of Investments Guardian Portfolio (cont'd)
The following table presents additional information about valuation techniques and inputs used for investments that are measured at fair value and categorized within Level 3 as of December 31, 2016.
Asset class | | Fair value
at 12/31/2016 | | Valuation
techniques | | Unobservable
input | | Amount or
range
per unit | | Input value
per unit | | Impact to
valuation
from decrease
in input(c) | |
Preferred Stock
| | $ | 474,998
| | | Market Transaction
Method | | Transaction
Price | | $ | 8.78 | | | $ | 8.78 | | | Decrease | |
(c) Represents the expected directional change in the fair value of the Level 3 investments that would result from a decrease in the corresponding input. An increase to the unobservable input would have the opposite effect. Significant changes in these inputs could result in significantly higher or lower fair value measurements.
As of the year ended December 31, 2016, no securities were transferred from one level (as of December 31, 2015) to another.
The following is a summary, categorized by Level (see Note A of Notes to Financial Statements), of inputs used to value the Fund's derivatives as of December 31, 2016:
Other Financial Instruments | | Level 1 | | Level 2 | | Level 3(d) | | Total | |
Options written | |
Liabilities | | $ | (600 | ) | | $ | — | | | $ | (75 | ) | | $ | (675 | ) | |
Total | | $ | (600 | ) | | $ | — | | | $ | (75 | ) | | $ | (675 | ) | |
(d) The following is a reconciliation between the beginning and ending balances of investments in which unobservable inputs (Level 3) were used in determining value:
Other
Financial
Instruments | | Beginning
balance, as
of 1/1/2016 | | Accrued
discounts/
(premiums) | | Realized
gain/(loss) | | Change in
unrealized
appreciation/
(depreciation) | | Purchases | | Sales | | Transfers
into
Level 3 | | Transfers
out of
Level 3 | | Balance,
as of
12/31/2016 | | Net change in
unrealized
appreciation/
(depreciation)
from
investments
still held as of
12/31/2016 | |
Options Written(e) | | $ | — | | | $ | — | | | $ | — | | | $ | 1,751 | | | $ | — | | | $ | (1,826 | ) | | $ | — | | | $ | — | | | $ | (75 | ) | | $ | 1,751 | | |
Total | | $ | — | | | $ | — | | | $ | — | | | $ | 1,751 | | | $ | — | | | $ | (1,826 | ) | | $ | — | | | $ | — | | | $ | (75 | ) | | $ | 1,751 | | |
(e) As of the year ended December 31, 2016, these investments did not have a material impact on the Fund's net assets and, therefore, disclosure of unobservable inputs used in formulating valuations is not presented.
See Notes to Financial Statements
9
Statement of Assets and Liabilities
Neuberger Berman Advisers Management Trust
| | | GUARDIAN
PORTFOLIO | |
| | | December 31, 2016 | |
Assets | |
Investments in securities, at value* (Note A)—see Schedule of Investments: | |
Unaffiliated issuers | | $ | 57,610,830 | | |
Cash | | | 18,973 | | |
Cash collateral segregated for option contracts (Note A) | | | 1,059 | | |
Dividends and interest receivable | | | 101,378 | | |
Receivable for securities sold | | | 128,083 | | |
Receivable for Fund shares sold | | | 24,744 | | |
Prepaid expenses and other assets | | | 1,048 | | |
Total Assets | | | 57,886,115 | | |
Liabilities | |
Option contracts written, at value** (Note A) | | | 675 | | |
Payable for securities purchased | | | 138,467 | | |
Payable for Fund shares redeemed | | | 20,364 | | |
Payable to investment manager (Note B) | | | 27,120 | | |
Payable to administrator—net (Note B) | | | 23,216 | | |
Accrued expenses and other payables | | | 68,346 | | |
Total Liabilities | | | 278,188 | | |
Net Assets | | $ | 57,607,927 | | |
Net Assets consist of: | |
Paid-in capital | | $ | 43,634,077 | | |
Undistributed net investment income (loss) | | | 188,392 | | |
Accumulated net realized gains (losses) on investments | | | 7,023,970 | | |
Net unrealized appreciation (depreciation) in value of investments | | | 6,761,488 | | |
Net Assets | | $ | 57,607,927 | | |
Net Assets | |
Class I | | $ | 11,410,755 | | |
Class S | | | 46,197,172 | | |
Shares Outstanding ($.001 par value; unlimited shares authorized) | |
Class I | | | 778,161 | | |
Class S | | | 3,170,736 | | |
Net Asset Value, offering and redemption price per share | |
Class I | | $ | 14.66 | | |
Class S | | | 14.57 | | |
*Cost of Investments | | | $50,847,281 | | |
**Premium received from option contracts written | | | $2,651 | | |
See Notes to Financial Statements
10
Neuberger Berman Advisers Management Trust
| | | GUARDIAN
PORTFOLIO | |
| | | For the
Year Ended
December 31, 2016 | |
Investment Income: | |
Income (Note A): | |
Dividend income—unaffiliated issuers | | $ | 948,131 | | |
Interest income—unaffiliated issuers | | | 5,884 | | |
Foreign taxes withheld (Note A) | | | (21,743 | ) | |
Total income | | $ | 932,272 | | |
Expenses: | |
Investment management fees (Note B) | | | 327,401 | | |
Administration fees (Note B): | |
Class I | | | 34,212 | | |
Class S | | | 144,371 | | |
Distribution fees (Note B): | |
Class S | | | 120,308 | | |
Audit fees | | | 46,560 | | |
Custodian and accounting fees | | | 39,780 | | |
Insurance expense | | | 2,220 | | |
Legal fees | | | 51,657 | | |
Shareholder reports | | | 13,302 | | |
Trustees' fees and expenses | | | 54,951 | | |
Interest expense | | | 59 | | |
Miscellaneous | | | 5,607 | | |
Total expenses | | | 840,428 | | |
Expenses reimbursed by Management (Note B) | | | (99,487 | ) | |
Total net expenses | | | 740,941 | | |
Net investment income (loss) | | $ | 191,331 | | |
Realized and Unrealized Gain (Loss) on Investments (Note A): | |
Net realized gain (loss) on: | |
Sales of investment securities of unaffiliated issuers | | | 7,498,743 | | |
Foreign currency | | | (2,873 | ) | |
Option contracts written | | | 3,321 | | |
Change in net unrealized appreciation (depreciation) in value of: | |
Unaffiliated investment securities | | | (2,786,037 | ) | |
Foreign currency | | | (701 | ) | |
Option contracts written | | | 1,976 | | |
Net gain (loss) on investments | | | 4,714,429 | | |
Net increase (decrease) in net assets resulting from operations | | $ | 4,905,760 | | |
See Notes to Financial Statements
11
Statements of Changes in Net Assets
Neuberger Berman Advisers Management Trust
| | | GUARDIAN PORTFOLIO | |
| | | Year Ended
December 31,
2016 | | Year Ended
December 31,
2015 | |
Increase (Decrease) in Net Assets: | |
From Operations: | |
Net investment income (loss) (Note A) | | $ | 191,331 | | | $ | 249,828 | | |
Net realized gain (loss) on investments (Note A) | | | 7,499,191 | | | | 10,755,872 | | |
Change in net unrealized appreciation (depreciation) of investments (Note A) | | | (2,784,762 | ) | | | (14,654,402 | ) | |
Net increase (decrease) in net assets resulting from operations | | | 4,905,760 | | | | (3,648,702 | ) | |
Distributions to Shareholders From (Note A): | |
Net investment income: | |
Class I | | | (61,819 | ) | | | (94,448 | ) | |
Class S | | | (181,616 | ) | | | (255,409 | ) | |
Net realized gain on investments: | |
Class I | | | (2,128,017 | ) | | | (3,296,726 | ) | |
Class S | | | (8,809,885 | ) | | | (14,198,361 | ) | |
Total distributions to shareholders | | | (11,181,337 | ) | | | (17,844,944 | ) | |
From Fund Share Transactions (Note D): | |
Proceeds from shares sold: | |
Class I | | | 1,079,417 | | | | 2,468,359 | | |
Class S | | | 351,280 | | | | 356,770 | | |
Proceeds from reinvestment of dividends and distributions: | |
Class I | | | 2,189,836 | | | | 3,391,174 | | |
Class S | | | 8,991,501 | | | | 14,453,770 | | |
Payments for shares redeemed: | |
Class I | | | (2,430,602 | ) | | | (3,926,539 | ) | |
Class S | | | (9,412,883 | ) | | | (13,898,883 | ) | |
Net increase (decrease) from Fund share transactions | | | 768,549 | | | | 2,844,651 | | |
Net Increase (Decrease) in Net Assets | | | (5,507,028 | ) | | | (18,648,995 | ) | |
Net Assets: | |
Beginning of year | | | 63,114,955 | | | | 81,763,950 | | |
End of year | | $ | 57,607,927 | | | $ | 63,114,955 | | |
Undistributed net investment income (loss) at end of year | | $ | 188,392 | | | $ | 243,369 | | |
See Notes to Financial Statements
12
Notes to Financial Statements Guardian Portfolio
Note A—Summary of Significant Accounting Policies:
1 General: Neuberger Berman Advisers Management Trust (the "Trust") is a Delaware statutory trust organized pursuant to an Amended and Restated Trust Instrument dated March 27, 2014. The Trust is currently comprised of eight separate operating series (each individually a "Fund," and collectively the "Funds") each of which is diversified. The Trust is registered as an open-end management investment company under the Investment Company Act of 1940, as amended (the "1940 Act"), and its shares are registered under the Securities Act of 1933, as amended. Neuberger Berman Advisers Management Trust Guardian Portfolio (the "Fund") currently offers Class I and Class S shares. The Trust's Board of Trustees (the "Board") may establish additional series or classes of shares without the approval of shareholders.
The assets of each Fund belong only to that Fund, and the liabilities of each Fund are borne solely by that Fund and no other.
The Fund is an investment company and accordingly follows the investment company accounting and reporting guidance of the Financial Accounting Standards Board ("FASB") Accounting Standard Codification Topic 946 "Financial Services—Investment Companies."
The preparation of financial statements in accordance with U.S. generally accepted accounting principles ("GAAP") requires Neuberger Berman Investment Advisers LLC ("NBIA" or "Management") to make estimates and assumptions at the date of the financial statements. Actual results could differ from those estimates.
Shares of the Fund are not available to the general public and may be purchased only by life insurance companies to serve as an investment vehicle for premiums paid under their variable annuity and variable life insurance contracts and to certain qualified pension and other retirement plans.
2 Portfolio valuation: In accordance with Accounting Standards Codification ("ASC") 820 "Fair Value Measurement" ("ASC 820"), all investments held by the Fund are carried at the value that Management believes the Fund would receive upon selling an investment in an orderly transaction to an independent buyer in the principal or most advantageous market for the investment under current market conditions. Various inputs, including the volume and level of activity for the asset or liability in the market, are considered in valuing the Fund's investments, some of which are discussed below. Significant Management judgment may be necessary to value investments in accordance with ASC 820.
ASC 820 established a three-tier hierarchy of inputs to create a classification of value measurements for disclosure purposes. The three-tier hierarchy of inputs is summarized in the three broad Levels listed below.
| | • | Level 1—quoted prices in active markets for identical investments |
| | • | Level 2���other observable inputs (including quoted prices for similar investments, interest rates, prepayment speeds, credit risk, amortized cost, etc.) |
| | • | Level 3—unobservable inputs (including the Fund's own assumptions in determining the fair value of investments) |
The inputs or methodology used for valuing an investment are not necessarily an indication of the risk associated with investing in those securities.
The value of the Fund's investments in equity securities, preferred stocks, exchange-traded options purchased and options written, for which market quotations are readily available, is generally determined by Management by obtaining valuations from independent pricing services based on the latest sale price quoted on a principal exchange or market for that security (Level 1 inputs). Securities traded primarily on the NASDAQ Stock Market are normally valued at the NASDAQ Official Closing Price ("NOCP") provided by NASDAQ each business day. The NOCP is the most recently reported price as of 4:00:02 p.m., Eastern Time, unless that price is outside the range of
13
the "inside" bid and asked prices (i.e., the bid and asked prices that dealers quote to each other when trading for their own accounts); in that case, NASDAQ will adjust the price to equal the inside bid or asked price, whichever is closer. Because of delays in reporting trades, the NOCP may not be based on the price of the last trade to occur before the market closes. If there is no sale of a security on a particular day, the independent pricing services may value the security based on market quotations.
Management has developed a process to periodically review information provided by independent pricing services for all types of securities.
Investments in non-exchange traded investment companies are valued using the respective fund's daily calculated net asset value per share (Level 2 inputs).
If a valuation is not available from an independent pricing service, or if Management has reason to believe that the valuation received does not represent the amount the Fund might reasonably expect to receive on a current sale in an orderly transaction, Management seeks to obtain quotations from brokers or dealers (generally considered Level 2 or Level 3 inputs depending on the number of quotes available). If such quotations are not readily available, the security is valued using methods the Board has approved in the good-faith belief that the resulting valuation will reflect the fair value of the security. Numerous factors may be considered when determining the fair value of a security based on Level 2 or Level 3 inputs, including available analyst, media or other reports, securities within the same industry with recent highly correlated performance, trading in futures or American Depositary Receipts ("ADRs") and whether the issuer of the security being fair valued has other securities outstanding.
The value of the Fund's investments in foreign securities is generally determined using the same valuation methods and inputs as other Fund investments, as discussed above. Foreign security prices expressed in local currency values are normally translated from the local currency into U.S. dollars using the exchange rates as of 4:00 p.m. Eastern Time on days the New York Stock Exchange ("NYSE") is open for business. The Board has approved the use of Interactive Data Pricing and Reference Data LLC ("Interactive") to assist in determining the fair value of foreign equity securities when changes in the value of a certain index suggest that the closing prices on the foreign exchanges may no longer represent the amount that the Fund could expect to receive for those securities or on days when foreign markets are closed and U.S. markets are open. In each of these events, Interactive will provide adjusted prices for certain foreign equity securities using a statistical analysis of historical correlations of multiple factors (Level 2 inputs). In the absence of precise information about the market values of these foreign securities as of the time as of which a Fund's share price is calculated, the Board has determined on the basis of available data that prices adjusted in this way are likely to be closer to the prices the Fund could realize on a current sale than are the prices of those securities established at the close of the foreign markets in which the securities primarily trade.
Fair value prices are necessarily estimates, and there is no assurance that such a price will be at or close to the price at which the security is next quoted or next trades.
3 Foreign currency translation: The accounting records of the Fund are maintained in U.S. dollars. Foreign currency amounts are normally translated into U.S. dollars using the exchange rate as of 4:00 p.m. Eastern Time, on days the NYSE is open for business to determine the value of investments, other assets and liabilities. Purchase and sale prices of securities, and income and expenses, are translated into U.S. dollars at the prevailing rate of exchange on the respective dates of such transactions. Net unrealized foreign currency gain (loss), if any, arises from changes in the value of assets and liabilities, other than investments in securities, as a result of changes in exchange rates and is stated separately in the Statement of Operations.
4 Securities transactions and investment income: Securities transactions are recorded on trade date for financial reporting purposes. Dividend income is recorded on the ex-dividend date or, for certain foreign dividends, as soon as the Fund becomes aware of the dividends. Non-cash dividends included in dividend income, if any, are recorded at the fair market value of the securities received. Interest income, including accretion of original issue discount, where applicable, and accretion of discount on short-term investments, if any, is recorded on the accrual basis. Realized gains and losses from securities transactions and foreign currency transactions, if any, are recorded on the basis of identified cost and stated separately in the Statement of Operations. Included in net realized gain (loss) on
14
investments are proceeds from the settlements of class action litigation in which the Fund participated as a class member. The amount of such proceeds for the year ended December 31, 2016 was $521.
5 Income tax information: Each Fund is treated as a separate entity for U.S. federal income tax purposes. It is the policy of the Fund to continue to qualify for treatment as a regulated investment company ("RIC") by complying with the requirements of the U.S. Internal Revenue Code applicable to RICs and to distribute substantially all of its net investment income and net realized capital gains to its shareholders. To the extent the Fund distributes substantially all of its net investment income and net realized capital gains to shareholders, no federal income or excise tax provision is required.
The Fund has adopted the provisions of ASC 740 "Income Taxes" ("ASC 740"). ASC 740 sets forth a minimum threshold for financial statement recognition of a tax position taken, or expected to be taken, in a tax return. The Fund recognizes interest and penalties, if any, related to unrecognized tax positions as an income tax expense in the Statement of Operations. The Fund is subject to examination by U.S. federal and state tax authorities for returns filed for the tax years for which the applicable statutes of limitations have not yet expired. As of December 31, 2016, the Fund did not have any unrecognized tax positions.
At December 31, 2016, the cost of investments for U.S. federal income tax basis was $50,919,957. Gross unrealized appreciation of investments was $7,675,362 and gross unrealized depreciation of investments was $984,489 resulting in net unrealized appreciation of $6,690,873 based on cost for U.S. federal income tax purposes.
Income distributions and capital gain distributions are determined in accordance with income tax regulations, which may differ from GAAP. These differences are primarily due to differing treatments of income and gains on various investment securities held by the Fund, timing differences and differing characterization of distributions made by the Fund. The Fund may also utilize earnings and profits distributed to shareholders on redemption of their shares as a part of the dividends-paid deduction for income tax purposes.
As determined on December 31, 2016, permanent differences resulting primarily from different book and tax accounting were reclassified at year end. Such differences are attributed to the tax treatment of foreign currency gains and losses. These reclassifications had no effect on net income, net asset value ("NAV") or NAV per share of the Fund. For the year ended December 31, 2016, the Fund recorded the following permanent reclassifications:
| Paid-in Capital | | Undistributed
Net Investment
Income (Loss) | | Accumulated
Net Realized
Gains (Losses)
on Investments | |
| $— | | | $(2,873 | ) | | $2,873 | | |
The tax character of distributions paid during the years ended December 31, 2016 and December 31, 2015 was as follows:
| Distributions Paid From: | |
Ordinary Income | | Long-Term Capital Gains | | Total | |
| 2016 | | 2015 | | 2016 | | 2015 | | 2016 | | 2015 | |
| $243,435 | | | $634,403 | | | $10,937,902 | | | $17,210,541 | | | $11,181,337 | | | $17,844,944 | | |
As of December 31, 2016, the components of distributable earnings (accumulated losses) on a U.S. federal income tax basis were as follows:
Undistributed
Ordinary
Income | | Undistributed
Long-Term
Capital Gain | | Unrealized
Appreciation/
(Depreciation) | | Other
Temporary
Differences | | Total | |
| $394,653 | | | $6,890,385 | | | $6,688,812 | | | $— | | | $13,973,850 | | |
15
The temporary differences between book basis and tax basis distributable earnings are primarily due to losses disallowed and recognized on wash sales.
6 Distributions to shareholders: The Fund may earn income, net of expenses, daily on its investments. Distributions from net investment income and net realized capital gains, if any, are generally distributed once a year (usually in October). Income distributions and capital gain distributions to shareholders are recorded on the ex-date.
It is the policy of the Fund to pass through to its shareholders substantially all real estate investment trust ("REIT") distributions and other income it receives, less operating expenses. The distributions the Fund receives from REITs are generally composed of income, capital gains, and/or return of REIT capital, but the REITs do not report this information to the Fund until the following calendar year. At December 31, 2016, the Fund estimated these amounts within the financial statements because the information is not available from the REITs until after the Fund's fiscal period. For the year ended December 31, 2016, the character of distributions paid to shareholders disclosed within the Statements of Changes in Net Assets is based on estimates made at that time. All estimates are based upon REIT information sources available to the Fund together with actual IRS Forms 1099-DIV received to date. Based on past experience it is possible that a portion of the Fund's distributions during the current fiscal year will be considered tax return of capital, but the actual amount of the tax return of capital, if any, is not determinable until after the Fund's fiscal year-end. After calendar year-end, when the Fund learns the nature of the distributions paid by REITs during that year, distributions previously identified as income are often re-characterized as return of capital and/or capital gain. After all applicable REITs have informed the Fund of the actual breakdown of distributions paid to the Fund during its fiscal year, estimates previously recorded are adjusted on the books of the Fund to reflect actual results. As a result, the composition of the Fund's distributions as reported herein may differ from the final composition determined after calendar year-end and reported to Fund shareholders on IRS Form 1099-DIV.
7 Foreign taxes: Foreign taxes withheld, if any, represent amounts withheld by foreign tax authorities, net of refunds recoverable.
8 Expense allocation: Certain expenses are applicable to multiple funds within the complex of related investment companies. Expenses directly attributable to a Fund are charged to that Fund. Expenses of the Trust that are not directly attributable to a particular series of the Trust (e.g., the Fund) are allocated among the series of the Trust, on the basis of relative net assets, except where a more appropriate allocation of expenses to each of the series can otherwise be made fairly. Expenses borne by the complex of related investment companies, which includes open-end and closed-end investment companies for which Management serves as investment manager, that are not directly attributable to a particular investment company in the complex (e.g., the Trust) or series thereof are allocated among the investment companies in the complex or series thereof on the basis of relative net assets, except where a more appropriate allocation of expenses to each of the investment companies in the complex or series thereof can otherwise be made fairly. The Fund's expenses (other than those specific to each class) are allocated proportionally each day among the classes based upon the relative net assets of each class.
9 Investments in foreign securities: Investing in foreign securities may involve sovereign and other risks, in addition to the credit and market risks normally associated with domestic securities. These additional risks include the possibility of adverse political and economic developments (including political instability, nationalization, expropriation, or confiscatory taxation) and the potentially adverse effects of unavailability of public information regarding issuers, less governmental supervision and regulation of financial markets, reduced liquidity of certain financial markets, and the lack of uniform accounting, auditing, and financial reporting standards or the application of standards that are different or less stringent than those applied in the United States. Foreign securities also may experience greater price volatility, higher rates of inflation, and delays in settlement.
10 Indemnifications: Like many other companies, the Trust's organizational documents provide that its officers ("Officers") and trustees ("Trustees") are indemnified against certain liabilities arising out of the performance of their duties to the Trust. In addition, both in some of its principal service contracts and in the normal course of its business, the Trust enters into contracts that provide indemnifications to other parties for certain types of losses or
16
liabilities. The Trust's maximum exposure under these arrangements is unknown as this could involve future claims against the Trust.
11 Derivative instruments: The Fund's use of derivatives during the year ended December 31, 2016, is described below. Please see the Schedule of Investments for the Fund's open position in derivatives at December 31, 2016. The Fund has adopted the provisions of ASC 815 "Derivatives and Hedging" ("ASC 815"). The disclosure requirements of ASC 815 distinguish between derivatives that qualify for hedge accounting and those that do not. Because investment companies value their derivatives at fair value and recognize changes in fair value through the Statement of Operations, they do not qualify for hedge accounting. Accordingly, even though the Fund's investments in derivatives may represent economic hedges, they are considered non-hedge transactions for purposes of this disclosure.
Options: During the year ended December 31, 2016, the Fund used options written to generate incremental returns and to reduce risks.
Premiums received by the Fund upon writing a call option or a put option are recorded in the liability section of the Fund's Statement of Assets and Liabilities and are subsequently adjusted to the current market value. When an option is exercised, closed, or expired, the Fund realizes a gain or loss and the liability is eliminated.
When the Fund writes a call option on an underlying asset it does not own, its exposure on such an option is theoretically unlimited. When writing a covered call option, the Fund, in return for the premium, gives up the opportunity for profit from a price increase in the underlying security above the exercise price, but conversely retains the risk of loss should the price of the security decline. When writing a put option, the Fund, in return for the premium, takes the risk that it must purchase the underlying security at a price that may be higher than the current market price of the security. If a covered call or put option that the Fund has written expires unexercised, the Fund will realize a gain in the amount of the premium. All securities covering outstanding written options are held in escrow by the custodian bank.
Premiums paid by the Fund upon purchasing a call or put option are recorded in the asset section of the Fund's Statement of Assets and Liabilities and are subsequently adjusted to the current market value. When an option is exercised, closed, or expired, a Fund realizes a gain or loss and the asset is eliminated.
For purchased call options, the Fund's loss is limited to the amount of the option premium paid.
During the year ended December 31, 2016, the Fund used purchased option contracts "options purchased" to gain exposure more efficiently than through a direct purchase of the underlying security, to gain exposure to securities, markets, sectors or geographical areas, or to manage or adjust the risk profile of the Fund or the risk of individual positions.
At December 31, 2016, the Fund had the following derivatives (which did not qualify as hedging instruments under ASC 815), grouped by primary risk exposure:
Asset Derivatives
Derivative Type | | Statement of
Assets and
Liabilities Location | | Equity Risk | | Total | |
Options purchased | | Investments in securities, at value | | $ | 1,905 | | | $ | 1,905 | | |
Total Value—Assets | | | | $ | 1,905 | | | $ | 1,905 | | |
Liability Derivatives
Derivative Type | | Statement of
Assets and
Liabilities Location | | Equity Risk | | Total | |
Options written | | Option contracts written, at value | | $ | (675 | ) | | $ | (675 | ) | |
Total Value—Liabilities | | | | $ | (675 | ) | | $ | (675 | ) | |
17
The impact of the use of these derivative instruments on the Statement of Operations during the year ended December 31, 2016, was as follows:
Realized Gain (Loss)
Derivative Type | | Statement of
Operations Location | | Equity Risk | | Total | |
Options purchased | | Net realized gain (loss) on:
sales of investment securities
of unaffiliated issuers | | $ | 599 | | | $ | 599 | | |
Options written | | Net realized gain (loss) on:
option contracts written | | | 3,321 | | | | 3,321 | | |
Total Realized Gain (Loss) | | | | $ | 3,920 | | | $ | 3,920 | | |
Change in Appreciation/(Depreciation)
Derivative Type | | Statement of
Operations Location | | Equity Risk | | Total | |
Options purchased | | Change in net unrealized
appreciation/(depreciation) in
value of: unaffiliated
investment securities | | $ | 11 | | | $ | 11 | | |
Options written | | Change in net unrealized
appreciation/(depreciation) in
value of: option
contracts written | | | 1,976 | | | | 1,976 | | |
Total Change in Appreciation/
(Depreciation) | | | | $ | 1,987 | | | $ | 1,987 | | |
The Fund adopted the provisions of Accounting Standards Update 2011-11 Disclosures about Offsetting Assets and Liabilities ("ASU 2011-11"). ASU 2011-11 is intended to enhance disclosure requirements on the offsetting of financial assets and liabilities. Pursuant to ASU 2011-11, an entity is required to disclose both gross and net information for assets and liabilities related to derivatives, repurchase and reverse repurchase agreements, and securities lending and securities borrowing transactions that are eligible for offset or subject to an enforceable master netting or similar agreement. At December 31, 2016, the Fund had no derivatives eligible for offset or subject to an enforceable master netting or similar agreement.
13 Other: All net investment income and realized and unrealized capital gains and losses of the Fund are allocated, on the basis of relative net assets, pro rata among its respective classes.
Note B—Investment Management Fees, Administration Fees, Distribution Arrangements, and Other Transactions with Affiliates:
The Fund retains Management as its investment manager under a Management Agreement. For such investment management services, the Fund pays Management a fee at the annual rate of 0.55% of the first $250 million of the Fund's average daily net assets, 0.525% of the next $250 million, 0.50% of the next $250 million, 0.475% of the next $250 million, 0.45% of the next $500 million, 0.425% of the next $2.5 billion, and 0.40% of average daily net assets in excess of $4 billion. Accordingly, for the year ended December 31, 2016, the investment management fee pursuant to the Management Agreement was equivalent to an annual effective rate of 0.55% of the Fund's average daily net assets.
18
The Fund retains Management as its administrator under an Administration Agreement. Each class pays Management an administration fee at the annual rate of 0.30% of its average daily net assets under this agreement. Additionally, Management retains State Street Bank and Trust Company ("State Street") as its sub-administrator under a Sub-Administration Agreement. Management pays State Street a fee for all services received under this agreement.
Neuberger Berman BD LLC (the "Distributor") is the Fund's "principal underwriter" within the meaning of the 1940 Act. It acts as agent in arranging for the sale of the Fund's Class I shares without sales commission or other compensation and bears all advertising and promotion expenses incurred in the sale of those shares. The Board adopted a non-fee distribution plan for the Fund's Class I.
The Board has adopted a distribution and shareholder services plan (the "Plan") for Class S shares pursuant to Rule 12b-1 under the 1940 Act. The Plan provides that, for its activities and expenses related to the sale and distribution of Class S, and ongoing services provided to investors in the class, the Distributor receives from Class S a fee at the annual rate of 0.25% of Class S's average daily net assets. Distributor may pay a portion of the proceeds from the 12b-1 fee to insurance companies or their affiliates and qualified plan administrators ("intermediaries") for services they provide respecting the Fund to current and prospective variable contract owners and qualified plan participants that invest in the Fund through the intermediaries. Those institutions may use the payments for, among other purposes, compensating employees engaged in sales and/or shareholder servicing. The amount of fees paid by the class during any year may be more or less than the cost of distribution and other services provided to the class. FINRA rules limit the amount of annual distribution fees that may be paid by a mutual fund and impose a ceiling on the cumulative distribution fees paid. The Plan complies with those rules.
Management has contractually agreed to waive fees and/or reimburse the Fund's Class I and Class S shares so that the total annual operating expenses of those classes do not exceed the expense limitations as detailed in the following table. These undertakings include fees payable to Management for the Fund's Class S shares but exclude such fees payable for the Fund's Class I shares and exclude, for each class, interest (commitment fees relating to borrowings are treated as interest for purposes of this exclusion), taxes, transaction costs, brokerage commissions, dividend and interest expenses relating to short sales, acquired fund fees and expenses and extraordinary expenses, if any; consequently, net expenses may exceed the contractual expense limitations. The Fund has agreed that each of its classes will repay Management for fees and expenses waived or reimbursed for that class provided that repayment does not cause that class's annual operating expenses to exceed its contractual expense limitation in place at the time the fees and expenses were waived or reimbursed, or the expense limitation in place at the time the Fund repays Management, whichever is lower. Any such repayment must be made within three years after the year in which Management incurred the expense.
During the year ended December 31, 2016, there was no repayment to Management under its contractual expense limitation.
At December 31, 2016, the Fund's contingent liabilities to Management under its contractual expense limitation were as follows:
| | | | | | | Expenses Reimbursed in
Fiscal Year Ending December 31, | |
| | | | | | | 2014 | | 2015 | | 2016 | |
| | | | | | | Subject to Repayment Until December 31, | |
| | | Contractual
Expense
Limitation(a) | | Expiration | | 2017 | | 2018 | | 2019 | |
Class I | | | 1.00 | % | | 12/31/19 | | $ | — | | | $ | — | | | $ | — | | |
Class S | | | 1.25 | % | | 12/31/19 | | | 60,850 | | | | 85,080 | | | | 99,487 | | |
(a) Expense limitation per annum of the respective class's average daily net assets.
19
Neuberger Berman LLC ("Neuberger") was retained by Management through December 31, 2015, pursuant to a Sub-Advisory Agreement to furnish it with investment recommendations and research information without added cost to the Fund. Several individuals who are Officers and/or Trustees of the Trust are also employees of Neuberger and/or Management. As a result of the entity consolidation described on page 3 of this Annual Report, the services previously provided by Neuberger under the Sub-Advisory Agreement are being provided by NBIA as of January 1, 2016.
Note C—Securities Transactions:
During the year ended December 31, 2016, there were purchase and sale transactions (excluding short-term securities and option contracts) of $40,796,804 and $45,471,941, respectively.
During the year ended December 31, 2016, no brokerage commissions on securities transactions were paid to affiliated brokers.
Note D—Fund Share Transactions:
Share activity for the years ended December 31, 2016 and December 31, 2015 was as follows:
For the Year Ended December 31, 2016
| | | Shares Sold | | Shares Issued on
Reinvestment of
Dividends and
Distributions | | Shares
Redeemed | | Total | |
Class I | | | 65,395 | | | | 154,649 | | | | (149,815 | ) | | | 70,229 | | |
Class S | | | 21,659 | | | | 639,055 | | | | (581,821 | ) | | | 78,893 | | |
For the Year Ended December 31, 2015
| | | Shares Sold | | Shares Issued on
Reinvestment of
Dividends and
Distributions | | Shares
Redeemed | | Total | |
Class I | | | 107,923 | | | | 202,700 | | | | (182,192 | ) | | | 128,431 | | |
Class S | | | 16,284 | | | | 869,138 | | | | (626,322 | ) | | | 259,100 | | |
Note E—Line of Credit:
At December 31, 2016, the Fund was a participant in a syndicated committed, unsecured $700,000,000 line of credit (the "Credit Facility"), to be used only for temporary or emergency purposes. Series of other investment companies managed by Management also participate in this line of credit on substantially the same terms except that some do not have access to the full amount of the Credit Facility. Interest is charged on borrowings under this Credit Facility at the higher of (a) a federal funds effective rate plus 1.00% per annum or (b) a Eurodollar rate for a one-month period plus 1.00% per annum. The Credit Facility has an annual commitment fee of 0.15% per annum of the available line of credit, which is paid quarterly. The Fund has agreed to pay its pro rata share of the annual commitment fee, based on the ratio of its individual net assets to the net assets of all participants at the time the fee is due and payable and the level of its access to the Credit Facility, and interest charged on any borrowing made by the Fund and other costs incurred by the Fund. Because several mutual funds participate in the Credit Facility, there is no assurance that the Fund will have access to all or any part of the $700,000,000 at any particular time. There were no loans outstanding under the Credit Facility at December 31, 2016. During the period ended December 31, 2016, the Fund did not utilize the Credit Facility.
20
Note F—Recent Accounting Pronouncement:
In October 2016, the U.S. Securities and Exchange Commission ("SEC") adopted new rules and forms, and amendments to certain current rules and forms, to modernize reporting and disclosure of information by registered investment companies. The amendments to Regulation S-X will require standardized, enhanced disclosure about derivatives in investment company financial statements, and will also change the rules governing the form and content of such financial statements. The compliance date for the amendments to Regulation S-X is August 1, 2017. Management is currently evaluating the impact that the adoption of the amendments to Regulation S-X will have on the Fund's financial statements and related disclosures.
21
Guardian Portfolio
The following tables include selected data for a share outstanding throughout each year and other performance information derived from the Financial Statements. Amounts that do not round to $0.01 or $(0.01) per share are presented as $0.00 or $(0.00), respectively. Ratios that do not round to 0.01% or (0.01)% are presented as 0.00% or (0.00)%, respectively. A "—" indicates that the line item was not applicable in the corresponding period.
Class I | |
| | | Year Ended December 31, | |
| | | 2016 | | 2015 | | 2014 | | 2013 | | 2012 | |
Net Asset Value, Beginning of Year | | $ | 16.70 | | | $ | 24.09 | | | $ | 26.69 | | | $ | 20.40 | | | $ | 18.29 | | |
Income From Investment Operations: | |
| Net Investment Income (Loss)@ | | | 0.06 | | | | 0.09 | | | | 0.16 | | | | 0.09 | | | | 0.17 | | |
Net Gains or Losses on Securities
(both realized and unrealized) | | | 1.28 | | | | (1.28 | ) | | | 1.79 | | | | 7.70 | | | | 2.16 | | |
Total From Investment Operations | | | 1.34 | | | | (1.19 | ) | | | 1.95 | | | | 7.79 | | | | 2.33 | | |
Less Distributions From: | |
Net Investment Income | | | (0.10 | ) | | | (0.17 | ) | | | (0.13 | ) | | | (0.20 | ) | | | (0.06 | ) | |
Net Capital Gains | | | (3.28 | ) | | | (6.03 | ) | | | (4.42 | ) | | | (1.30 | ) | | | (0.16 | ) | |
Total Distributions | | | (3.38 | ) | | | (6.20 | ) | | | (4.55 | ) | | | (1.50 | ) | | | (0.22 | ) | |
Voluntary Contribution from Management | | | — | | | | — | | | | 0.00 | | | | — | | | | — | | |
Net Asset Value, End of Year | | $ | 14.66 | | | $ | 16.70 | | | $ | 24.09 | | | $ | 26.69 | | | $ | 20.40 | | |
| Total Return† | | | 8.73 | %^ | | | (4.97 | )%^ | | | 9.03 | %^µ | | | 38.81 | % | | | 12.73 | % | |
Ratios/Supplemental Data | |
Net Assets, End of Year (in millions) | | $ | 11.4 | | | $ | 11.8 | | | $ | 14.0 | | | $ | 15.3 | | | $ | 13.3 | | |
| Ratio of Gross Expenses to Average Net Assets# | | | 1.21 | % | | | 1.15 | % | | | 1.08 | % | | | 1.11 | % | | | 1.11 | % | |
Ratio of Net Expenses to Average Net Assets | | | 1.21 | % | | | 1.15 | % | | | 1.08 | % | | | 1.11 | % | | | 1.11 | %§ | |
Ratio of Net Investment Income (Loss) to Average
Net Assets | | | 0.36 | % | | | 0.42 | % | | | 0.60 | % | | | 0.38 | % | | | 0.87 | % | |
Portfolio Turnover Rate | | | 72 | % | | | 51 | % | | | 37 | % | | | 31 | % | | | 32 | % | |
See Notes to Financial Highlights
22
Financial Highlights (cont'd)
Class S | |
| | | Year Ended December 31, | |
| | | 2016 | | 2015 | | 2014 | | 2013 | | 2012 | |
Net Asset Value, Beginning of Year | | $ | 16.59 | | | $ | 23.94 | | | $ | 26.53 | | | $ | 20.29 | | | $ | 18.19 | | |
Income From Investment Operations: | |
| Net Investment Income (Loss)@ | | | 0.05 | | | | 0.07 | | | | 0.12 | | | | 0.06 | | | | 0.14 | | |
Net Gains or Losses on Securities
(both realized and unrealized) | | | 1.28 | | | | (1.28 | ) | | | 1.78 | | | | 7.65 | | | | 2.15 | | |
Total From Investment Operations | | | 1.33 | | | | (1.21 | ) | | | 1.90 | | | | 7.71 | | | | 2.29 | | |
Less Distributions From: | |
Net Investment Income | | | (0.07 | ) | | | (0.11 | ) | | | (0.07 | ) | | | (0.17 | ) | | | (0.03 | ) | |
Net Capital Gains | | | (3.28 | ) | | | (6.03 | ) | | | (4.42 | ) | | | (1.30 | ) | | | (0.16 | ) | |
Total Distributions | | | (3.35 | ) | | | (6.14 | ) | | | (4.49 | ) | | | (1.47 | ) | | | (0.19 | ) | |
Voluntary Contribution from Management | | | — | | | | — | | | | 0.00 | | | | — | | | | — | | |
Net Asset Value, End of Year | | $ | 14.57 | | | $ | 16.59 | | | $ | 23.94 | | | $ | 26.53 | | | $ | 20.29 | | |
| Total Return† | | | 8.75 | %^ | | | (5.12 | )%^ | | | 8.89 | %^µ | | | 38.60 | % | | | 12.60 | % | |
Ratios/Supplemental Data | |
Net Assets, End of Year (in millions) | | $ | 46.2 | | | $ | 51.3 | | | $ | 67.8 | | | $ | 79.9 | | | $ | 69.0 | | |
| Ratio of Gross Expenses to Average Net Assets# | | | 1.46 | % | | | 1.39 | % | | | 1.33 | % | | | 1.36 | % | | | 1.36 | % | |
Ratio of Net Expenses to Average Net Assets | | | 1.25 | % | | | 1.25 | % | | | 1.25 | % | | | 1.25 | % | | | 1.25 | %§ | |
Ratio of Net Investment Income (Loss) to Average
Net Assets | | | 0.31 | % | | | 0.33 | % | | | 0.44 | % | | | 0.26 | % | | | 0.73 | % | |
Portfolio Turnover Rate | | | 72 | % | | | 51 | % | | | 37 | % | | | 31 | % | | | 32 | % | |
See Notes to Financial Highlights
23
Notes to Financial Highlights Guardian Portfolio
† Total return based on per share NAV reflects the effects of changes in NAV on the performance of the Fund during each fiscal period. Returns assume income dividends and other distributions, if any, were reinvested. Results represent past performance and do not indicate future results. Current returns may be lower or higher than the performance data quoted. Investment returns and principal may fluctuate and shares when redeemed may be worth more or less than original cost. Total return would have been lower if Management had not reimbursed and/or waived certain expenses. The total return information shown does not reflect charges and other expenses that apply to the separate accounts or the related insurance policies or other qualified pension or retirement plans, and the inclusion of these charges and other expenses would reduce the total return for all fiscal periods shown.
^ The class action proceeds listed in Note A of the Notes to Financial Statements had no impact on the Fund's total return for the year ended December 31, 2016. Had the Fund not received class action proceeds in 2015, total return based on per share NAV for the year ended December 31, 2015 would have been (5.02)% and (5.17)% for Class I and Class S, respectively. Had the Fund not received class action proceeds in 2014, total return based on per share NAV for the year ended December 31, 2014 would have been 8.98% and 8.84% for Class I and Class S, respectively.
# Represents the annualized ratios of net expenses to average daily net assets if Management had not reimbursed certain expenses and/or waived a portion of the investment management fee. Management did not reimburse or waive fees during the fiscal periods shown for Class I.
@ Calculated based on the average number of shares outstanding during each fiscal period.
§ Prior to January 1, 2013, the Fund had an expense offset arrangement in connection with its custodian contract. The impact of expense reductions related to expense offset arrangements, if any, was less than 0.01%.
µ The voluntary contribution received in 2014 had no impact on the Fund's total return for the year ended December 31, 2014.
24
Report of Independent Registered Public Accounting Firm
To the Board of Trustees of
Neuberger Berman Advisers Management Trust and
Shareholders of Guardian Portfolio
We have audited the accompanying statement of assets and liabilities of Guardian Portfolio, one of the series constituting Neuberger Berman Advisers Management Trust (the "Trust"), including the schedule of investments, as of December 31, 2016, and the related statement of operations for the year then ended, the statements of changes in net assets for each of the two years in the period then ended and the financial highlights for each of the five years in the period then ended. These financial statements and financial highlights are the responsibility of the Trust's management. Our responsibility is to express an opinion on these financial statements and financial highlights based on our audits.
We conducted our audits in accordance with the standards of the Public Company Accounting Oversight Board (United States). Those standards require that we plan and perform the audit to obtain reasonable assurance about whether the financial statements and financial highlights are free of material misstatement. We were not engaged to perform an audit of the Trust's internal control over financial reporting. Our audits included consideration of internal control over financial reporting as a basis for designing audit procedures that are appropriate in the circumstances, but not for the purpose of expressing an opinion on the effectiveness of the Trust's internal control over financial reporting. Accordingly, we express no such opinion. An audit also includes examining, on a test basis, evidence supporting the amounts and disclosures in the financial statements and financial highlights, assessing the accounting principles used and significant estimates made by management, and evaluating the overall financial statement presentation. Our procedures included confirmation of securities owned as of December 31, 2016 by correspondence with the custodian and others or by other appropriate auditing procedures where replies from others were not received. We believe that our audits provide a reasonable basis for our opinion.
In our opinion, the financial statements and financial highlights referred to above present fairly, in all material respects, the financial position of Guardian Portfolio, a series of Neuberger Berman Advisers Management Trust, at December 31, 2016, the results of its operations for the year then ended, the changes in its net assets for each of the two years in the period then ended, and the financial highlights for each of the five years in the period then ended in conformity with U.S. generally accepted accounting principles.
Boston, Massachusetts
February 10, 2017
25
The following tables set forth information concerning the Trustees and Officers of the Fund. All persons named as Trustees and Officers also serve in similar capacities for other funds administered or managed by Management. The Fund's Statement of Additional Information includes additional information about the Trustees as of the time of the Fund's most recent public offering and is available upon request, without charge, by calling (800) 877-9700.
Information about the Board of Trustees
Name, (Year of Birth),
and Address(1) | | Position(s) and
Length of
Time Served(2) | | Principal Occupation(s)(3) | | Number of
Funds in Fund
Complex
Overseen by
Fund Trustee | | Other Directorships Held
Outside Fund Complex by
Fund Trustee(3) |
Independent Trustees |
Michael J. Cosgrove (1949) | | Trustee since 2015 | | President, Carragh Consulting USA, since 2014; formerly, Executive, General Electric Company, 1970 to 2014, including President, Mutual Funds and Global Investment Programs, GE Asset Management, 2011 to 2014, President and Chief Executive Officer, Mutual Funds and Intermediary Business, GE Asset Management, 2007 to 2011, President, Institutional Sales and Marketing, GE Asset Management, 1998 to 2007, and Chief Financial Officer, GE Asset Management, and Deputy Treasurer, GE Company, 1988 to 1993. | | 55 | | | Director, America Press, Inc. (not-for-profit Jesuit publisher), since 2015; Director, Fordham University, since 2001; formerly, Director, The Gabelli Go Anywhere Trust, June 2015 to June 2016; Director, Skin Cancer Foundation (not-for-profit), 2006 to 2015; Director, GE Investments Funds, Inc., 1997 to 2014; Trustee, GE Institutional Funds, 1997 to 2014; Director, GE Asset Management, 1988 to 2014; Director, Elfun Trusts, 1988 to 2014; Trustee, GE Pension & Benefit Plans, 1988 to 2014. |
26
Name, (Year of Birth),
and Address(1) | | Position(s) and
Length of
Time Served(2) | | Principal Occupation(s)(3) | | Number of
Funds in Fund
Complex
Overseen by
Fund Trustee | | Other Directorships Held
Outside Fund Complex by
Fund Trustee(3) |
Marc Gary (1952) | | Trustee since 2015 | | Executive Vice Chancellor and Chief Operating Officer, Jewish Theological Seminary, since 2012; formerly, Executive Vice President and General Counsel, Fidelity Investments, 2007 to 2012; Executive Vice President and General Counsel, BellSouth Corporation, 2004 to 2007; Vice President and Associate General Counsel, BellSouth Corporation, 2000 to 2004; Associate, Partner, and National Litigation Practice Co-Chair, Mayer, Brown LLP, 1981 to 2000; Associate Independent Counsel, Office of Independent Counsel, 1990 to 1992. | | 55 | | | Trustee, Jewish Theological Seminary, since 2015; Director, Counsel on Call (privately held for-profit company), since 2012; Director, Lawyers Committee for Civil Rights Under Law (not-for-profit), since 2005; formerly, Director, Equal Justice Works (not-for-profit), 2005 to 2014; Director, Corporate Counsel Institute, Georgetown University Law Center, 2007 to 2012; Director, Greater Boston Legal Services (not-for-profit), 2007 to 2012. |
Martha C. Goss (1949) | | Trustee since 2007 | | President, Woodhill Enterprises Inc./Chase Hollow Associates LLC (personal investment vehicle), since 2006; formerly, Consultant, Resources Global Professionals (temporary staffing), 2002 to 2006. | | 55 | | | Director, American Water (water utility), since 2003; Director, Allianz Life of New York (insurance), since 2005; Director, Berger Group Holdings, Inc. (engineering consulting firm), since 2013; Director, Financial Women's Association of New York (not-for-profit association), since 2003; Trustee Emerita, Brown University, since 1998; Director, Museum of American Finance (not-for-profit), since 2013; formerly, Non-Executive Chair and Director, Channel Reinsurance (financial guaranty reinsurance), 2006 to 2010; formerly, Director, Ocwen Financial Corporation (mortgage servicing), 2005 to 2010; formerly, Director, Claire's Stores, Inc. (retailer), 2005 to 2007; formerly, Director, Parsons Brinckerhoff Inc. (engineering consulting firm), 2007 to 2010; formerly, Director, Bank Leumi (commercial bank), 2005 to 2007; formerly, Advisory Board Member, Attensity (software developer), 2005 to 2007. |
27
Name, (Year of Birth),
and Address(1) | | Position(s) and
Length of
Time Served(2) | | Principal Occupation(s)(3) | | Number of
Funds in Fund
Complex
Overseen by
Fund Trustee | | Other Directorships Held
Outside Fund Complex by
Fund Trustee(3) |
Michael M. Knetter (1960) | | Trustee since 2007 | | President and Chief Executive Officer, University of Wisconsin Foundation, since October 2010; formerly, Dean, School of Business, University of Wisconsin - Madison; formerly, Professor of International Economics and Associate Dean, Amos Tuck School of Business - Dartmouth College, 1998 to 2002. | | 55 | | | Board Member, American Family Insurance (a mutual company, not publicly traded), since March 2009; formerly, Trustee, Northwestern Mutual Series Fund, Inc., 2007 to 2011; formerly, Director, Wausau Paper, 2005 to 2011; formerly, Director, Great Wolf Resorts, 2004 to 2009. |
Deborah C. McLean (1954) | | Trustee since 2015 | | Member, Circle Financial Group (private wealth management membership practice), since 2011; Managing Director, Golden Seeds LLC (an angel investing group), since 2009; Adjunct Professor, Columbia University School of International and Public Affairs, since 2008; formerly, Visiting Assistant Professor, Fairfield University, Dolan School of Business, Fall 2007; formerly, Adjunct Associate Professor of Finance, Richmond, The American International University in London, 1999 to 2007. | | 55 | | | Board member, Norwalk Community College Foundation, since 2014; Dean's Advisory Council, Radcliffe Institute for Advanced Study, since 2014; formerly, Director and Treasurer, At Home in Darien (not-for-profit), 2012 to 2014; Director, National Executive Service Corps (not-for-profit), 2012 to 2013; Trustee, Richmond, The American International University in London, 1999 to 2013. |
George W. Morriss (1947) | | Trustee since 2007 | | Adjunct Professor, Columbia University School of International and Public Affairs, since October 2012; formerly, Executive Vice President and Chief Financial Officer, People's United Bank, Connecticut (a financial services company), 1991 to 2001. | | 55 | | | Director, National Association of Corporate Directors, Connecticut Chapter, since 2011; Trustee, Steben Alternative Investment Funds, Steben Select Multi-Strategy Fund, and Steben Select Multi-Strategy Master Fund, since 2013; formerly, Treasurer, National Association of Corporate Directors, Connecticut Chapter, 2011 to 2015; formerly, Manager, Larch Lane Multi-Strategy Fund complex (which consisted of three funds), 2006 to 2011; formerly, Member, NASDAQ Issuers' Affairs Committee, 1995 to 2003. |
28
Name, (Year of Birth),
and Address(1) | | Position(s) and
Length of
Time Served(2) | | Principal Occupation(s)(3) | | Number of
Funds in Fund
Complex
Overseen by
Fund Trustee | | Other Directorships Held
Outside Fund Complex by
Fund Trustee(3) |
Tom D. Seip (1950) | | Trustee since 2000; Chairman of the Board since 2008; formerly Lead Independent Trustee from 2006 to 2008 | | General Partner, Ridgefield Farm LLC (a private investment vehicle); formerly, President and CEO, Westaff, Inc. (temporary staffing), May 2001 to January 2002; formerly, Senior Executive, The Charles Schwab Corporation, 1983 to 1998, including Chief Executive Officer, Charles Schwab Investment Management, Inc.; Trustee, Schwab Family of Funds and Schwab Investments, 1997 to 1998; and Executive Vice President-Retail Brokerage, Charles Schwab & Co., Inc., 1994 to 1997. | | 55 | | | Director, H&R Block, Inc. (financial services company), since May 2001; Chairman, Governance and Nominating Committee, H&R Block, Inc., since 2011; formerly, Chairman, Compensation Committee, H&R Block, Inc., 2006 to 2010; formerly, Director, Forward Management, Inc. (asset management company), 1999 to 2006. |
James G. Stavridis (1955) | | Trustee since 2015 | | Dean, Fletcher School of Law and Diplomacy, Tufts University since 2013; formerly, Admiral, United States Navy, 2006 to 2013, including Supreme Allied Commander, NATO and Commander, European Command, 2009 to 2013, and Commander, United States Southern Command, 2006 to 2009. | | 55 | | | Director, Utilidata Inc., since 2015; Director, BMC Software Federal, LLC, since 2014; Director, Vertical Knowledge, LLC, since 2013; formerly, Director, Navy Federal Credit Union, 2000-2002. |
29
Name, (Year of Birth),
and Address(1) | | Position(s) and
Length of
Time Served(2) | | Principal Occupation(s)(3) | | Number of
Funds in Fund
Complex
Overseen by
Fund Trustee | | Other Directorships Held
Outside Fund Complex by
Fund Trustee(3) |
Candace L. Straight (1947) | | Trustee since 1999 | | Private investor and consultant specializing in the insurance industry; formerly, Advisory Director, Securitas Capital LLC (a global private equity investment firm dedicated to making investments in the insurance sector), 1998 to 2003. | | 55 | | | Formerly, Public Member, Board of Governors and Board of Trustees, Rutgers University, 2011 to 2016; formerly, Director, Montpelier Re Holdings Ltd. (reinsurance company), 2006 to 2015; formerly, Director, National Atlantic Holdings Corporation (property and casualty insurance company), 2004 to 2008; formerly, Director, The Proformance Insurance Company (property and casualty insurance company), 2004 to 2008; formerly, Director, Providence Washington Insurance Company (property and casualty insurance company), 1998 to 2006; formerly, Director, Summit Global Partners (insurance brokerage firm), 2000 to 2005. |
Peter P. Trapp (1944) | | Trustee since 1984 | | Retired; formerly, Regional Manager for Mid-Southern Region, Ford Motor Credit Company, September 1997 to 2007; formerly, President, Ford Life Insurance Company, April 1995 to August 1997. | | 55 | | | None. |
30
Name, (Year of Birth),
and Address(1) | | Position(s) and
Length of
Time Served(2) | | Principal Occupation(s)(3) | | Number of
Funds in Fund
Complex
Overseen by
Fund Trustee | | Other Directorships Held
Outside Fund Complex by
Fund Trustee(3) |
Trustees who are "Interested Persons" |
Joseph V. Amato* (1962) | | Trustee since 2009 | | President and Director, Neuberger Berman Group LLC, since 2009; President and Chief Executive Officer, Neuberger Berman BD LLC ("Neuberger Berman") and Neuberger Berman Holdings LLC (including its predecessor, Neuberger Berman Inc.), since 2007; Chief Investment Officer (Equities) and President (Equities), Neuberger Berman Investment Advisers LLC ("NBIA") (formerly, Neuberger Berman Fixed Income LLC ("NBFI") and including predecessor entities), since 2007, and Board Member of NBIA since 2006; formerly, Global Head of Asset Management of Lehman Brothers Holdings Inc.'s ("LBHI") Investment Management Division, 2006 to 2009; formerly, member of LBHI's Investment Management Division's Executive Management Committee, 2006 to 2009; formerly, Managing Director, Lehman Brothers Inc. ("LBI"), 2006 to 2008; formerly, Chief Recruiting and Development Officer, LBI, 2005 to 2006; formerly, Global Head of LBI's Equity Sales and a Member of its Equities Division Executive Committee, 2003 to 2005. | | 55 | | | Member of Board of Advisors, McDonough School of Business, Georgetown University, since 2001; Member of New York City Board of Advisors, Teach for America, since 2005; Trustee, Montclair Kimberley Academy (private school), since 2007; Member of Board of Regents, Georgetown University, since 2013. |
31
Name, (Year of Birth),
and Address(1) | | Position(s) and
Length of
Time Served(2) | | Principal Occupation(s)(3) | | Number of
Funds in Fund
Complex
Overseen by
Fund Trustee | | Other Directorships Held
Outside Fund Complex by
Fund Trustee(3) |
Robert Conti* (1956) | | Chief Executive Officer, President and Trustee since 2008; prior thereto, Executive Vice President in 2008 and Vice President from 2000 to 2008 | | Managing Director, Neuberger Berman, since 2007; President—Mutual Funds, NBIA, since 2008; formerly, Senior Vice President, Neuberger Berman, 2003 to 2006; formerly, Vice President, Neuberger Berman, 1999 to 2003; President and Chief Executive Officer, twenty-eight registered investment companies for which NBIA acts as investment manager and/or administrator. | | 55 | | | Director, Staten Island Mental Health Society, since 1994; formerly, Chairman of the Board, Staten Island Mental Health Society, 2008 to 2011. |
(1) The business address of each listed person is 1290 Avenue of the Americas, New York, NY 10104.
(2) Pursuant to the Trust's Trust Instrument, each of these Trustees shall hold office for life or until his or her successor is elected or the Trust terminates; except that (a) any Trustee may resign by delivering a written resignation; (b) any Trustee may be removed with or without cause at any time by a written instrument signed by at least two-thirds of the other Trustees; (c) any Trustee who requests to be retired, or who has become unable to serve, may be retired by a written instrument signed by a majority of the other Trustees; and (d) any Trustee may be removed at any shareholder meeting by a vote of at least two-thirds of the outstanding shares.
(3) Except as otherwise indicated, each individual has held the positions shown during at least the last five years.
* Indicates a Trustee who is an "interested person" within the meaning of the 1940 Act. Mr. Amato and Mr. Conti are interested persons of the Trust by virtue of the fact that each is an officer of Management, Neuberger Berman and/or their affiliates.
32
Information about the Officers of the Trust
Name, (Year of Birth),
and Address(1) | | Position(s) and
Length of Time
Served(2) | | Principal Occupation(s)(3) |
Claudia A. Brandon (1956) | | Executive Vice President since 2008 and Secretary since 1985 | | Senior Vice President, Neuberger Berman, since 2007 and Employee since 1999; Senior Vice President, NBIA, since 2008 and Assistant Secretary since 2004; formerly, Vice President, Neuberger Berman, 2002 to 2006; formerly, Vice President—Mutual Fund Board Relations, NBIA, 2000 to 2008; formerly, Vice President, NBIA, 1986 to 1999 and Employee, 1984 to 1999; Executive Vice President, twenty-eight registered investment companies for which NBIA acts as investment manager and/or administrator; Secretary, fifteen registered investment companies for which NBIA acts as investment manager and/or administrator . |
Agnes Diaz (1971) | | Vice President since 2013 | | Senior Vice President, Neuberger Berman, since 2012; Senior Vice President, NBIA, since 2012 and Employee since 1996; formerly, Vice President, Neuberger Berman, 2007 to 2012; Vice President, twenty-eight registered investment companies for which NBIA acts as investment manager and/or administrator. |
Anthony DiBernardo (1979) | | Assistant Treasurer since 2011 | | Senior Vice President, NBIA, since 2014, and Employee since 2003; formerly, Vice President, Neuberger Berman, 2009 to 2014; Assistant Treasurer, ten registered investment companies for which NBIA acts as investment manager and/or administrator. |
Corey A. Issing (1978) | | Chief Legal Officer since 2016 (only for purposes of sections 307 and 406 of the Sarbanes-Oxley Act of 2002) and Anti-Money Laundering Compliance Officer since 2016 | | General Counsel and Head of Compliance—Mutual Funds since 2016 and Senior Vice President, NBIA, since 2013, formerly, Associate General Counsel (2015 to 2016), Counsel (2007 to 2015), Vice President (2009—2013); Chief Legal Officer (only for purposes of sections 307 and 406 of the Sarbanes-Oxley Act of 2002), twenty-eight registered investment companies for which NBIA acts as investment manager and/or administrator; Anti-Money Laundering Compliance Officer, twenty-eight registered investment companies for which NBIA acts as investment manager and/or administrator. |
Sheila R. James (1965) | | Assistant Secretary since 2002 | | Vice President, Neuberger Berman, since 2008 and Employee since 1999; Vice President, NBIA, since 2008; formerly, Assistant Vice President, Neuberger Berman, 2007; Employee, NBIA, 1991 to 1999; Assistant Secretary, twenty-eight registered investment companies for which NBIA acts as investment manager and/or administrator. |
33
Name, (Year of Birth),
and Address(1) | | Position(s) and
Length of Time
Served(2) | | Principal Occupation(s)(3) |
Brian Kerrane (1969) | | Chief Operating Officer since 2015 and Vice President since 2008 | | Managing Director, Neuberger Berman, since 2013; Chief Operating Officer—Mutual Funds and Managing Director, NBIA, since 2015 and Employee since 1991; formerly, Senior Vice President, Neuberger Berman, 2006 to 2014; Vice President, NBIA, 2008 to 2015; Chief Operating Officer, ten registered investment companies for which NBIA acts as investment manager and/or administrator; Vice President, twenty-eight registered investment companies for which NBIA acts as investment manager and/or administrator. |
Kevin Lyons (1955) | | Assistant Secretary since 2003 | | Assistant Vice President, Neuberger Berman, since 2008 and Employee since 1999; Assistant Vice President, NBIA, since 2008; formerly, Employee, NBIA, 1993 to 1999; Assistant Secretary, ten registered investment companies for which NBIA acts as investment manager and/or administrator. |
Anthony Maltese (1959) | | Vice President since 2015 | | Senior Vice President, Neuberger Berman, since 2014 and Employee since 2000; Senior Vice President, NBIA, since 2014; Vice President, ten registered investment companies for which NBIA acts as investment manager and/or administrator. |
Owen F. McEntee, Jr. (1961) | | Vice President since 2008 | | Vice President, Neuberger Berman, since 2006; Vice President, NBIA, since 2006 and Employee since 1992; Vice President, ten registered investment companies for which NBIA acts as investment manager and/or administrator. |
John M. McGovern (1970) | | Treasurer and Principal Financial and Accounting Officer since 2005 | | Senior Vice President, Neuberger Berman, since 2007; Senior Vice President, NBIA, since 2007 and Employee since 1993; formerly, Vice President, Neuberger Berman, 2004 to 2006; formerly, Assistant Treasurer, 2002 to 2005; Treasurer and Principal Financial and Accounting Officer, twenty-eight registered investment companies for which NBIA acts as investment manager and/or administrator. |
Frank Rosato (1971) | | Assistant Treasurer since 2005 | | Vice President, Neuberger Berman, since 2006; Vice President, NBIA, since 2006 and Employee since 1995; Assistant Treasurer, ten registered investment companies for which NBIA acts as investment manager and/or administrator. |
Chamaine Williams (1971) | | Chief Compliance Officer since 2005 | | Chief Compliance Officer—Mutual Funds and Senior Vice President, NBIA, since 2006; formerly, Senior Vice President, LBI, 2007 to 2008; formerly, Vice President, LBI, 2003 to 2006; formerly, Chief Compliance Officer, Lehman Brothers Asset Management Inc., 2003 to 2007; formerly, Chief Compliance Officer, Lehman Brothers Alternative Investment Management LLC, 2003 to 2007; Chief Compliance Officer, fifteen registered investment companies for which NBIA acts as investment manager and/or administrator. |
(1) The business address of each listed person is 1290 Avenue of the Americas, New York, NY 10104.
(2) Pursuant to the By-Laws of the Trust, each officer elected by the Trustees shall hold office until his or her successor shall have been elected and qualified or until his or her earlier death, inability to serve, or resignation. Officers serve at the pleasure of the Trustees and may be removed at any time with or without cause.
(3) Except as otherwise indicated, each individual has held the positions shown during at least the last five years
34
Proxy Voting Policies and Procedures
A description of the policies and procedures that the Trust uses to determine how to vote proxies relating to portfolio securities is available, without charge, by calling 800-877-9700 (toll-free) and on the Securities and Exchange Commission's website at www.sec.gov. Information regarding how the Trust voted proxies relating to portfolio securities during the most recent 12-month period ended June 30 is also available upon request, without charge, by calling 800-877-9700 (toll-free), on the Securities and Exchange Commission's website at www.sec.gov, and on Management's website at www.nb.com.
Quarterly Portfolio Schedule
The Trust files a complete schedule of portfolio holdings for the Fund with the Securities and Exchange Commission for the first and third quarters of each fiscal year on Form N-Q. The Trust's Forms N-Q are available on the Securities and Exchange Commission's website at www.sec.gov and may be reviewed and copied at the Securities and Exchange Commission's Public Reference Room in Washington, DC. Information on the operation of the Public Reference Room may be obtained by calling 800-SEC-0330. The information on Form N-Q is available upon request, without charge, by calling 800-877-9700 (toll free).
Board Consideration of the Management Agreement
On an annual basis, the Board of Trustees (the "Board") of Neuberger Berman Advisers Management Trust (the "Trust"), including the Trustees who are not "interested persons" of Neuberger Berman Investment Advisers LLC ("Management") (including its affiliates) or the Trust ("Independent Fund Trustees"), considers whether to continue the management agreement with Management (the "Agreement") for Guardian Portfolio (the "Fund"). Throughout the process, the Independent Fund Trustees are advised by counsel that is experienced in Investment Company Act of 1940 matters and that is independent of Management ("Independent Counsel"). At a meeting held on October 18, 2016, the Board, including the Independent Fund Trustees, approved the continuation of the Agreement for the Fund.
In evaluating the Agreement, the Board, including the Independent Fund Trustees, reviewed extensive materials provided by Management in response to questions submitted by the Independent Fund Trustees and Independent Counsel, and met with senior representatives of Management regarding its personnel, operations and financial condition as they relate to the Fund. The annual contract review extends over at least two regular meetings of the Board to ensure that Management has time to respond to any questions the Independent Fund Trustees may have on their initial review of the materials and that the Independent Fund Trustees have time to consider those responses.
In connection with its deliberations, the Board also considered the broad range of information relevant to the annual contract review that is provided to the Board (including its various standing committees) at meetings throughout the year, including investment performance reports and related portfolio information for the Fund, as well as periodic reports on, among other matters, pricing and valuation; brokerage and execution; compliance; and shareholder and other services provided by Management and its affiliates. To assist the Board in its deliberations regarding the annual contract review, the Board has established a Contract Review Committee comprised of Independent Fund Trustees. The Board has also established other committees that focus throughout the year on specific areas relevant to the annual contract review, such as Fund performance or compliance matters, and that are charged with specific responsibilities regarding the annual contract review. Those committees provide reports that feed into the Contract Review Committee, which reviews and takes account of the information.
The Independent Fund Trustees received from Independent Counsel a memorandum discussing the legal standards for their consideration of the proposed continuation of the Agreement. During the course of the year and during their deliberations regarding the annual contract review, the Contract Review Committee and the Independent Fund Trustees met with Independent Counsel separately from representatives of Management.
In connection with its approval of the continuation of the Agreement, the Board evaluated the terms of the Agreement, the overall fairness of the Agreement to the Fund and whether the Agreement was in the best interests of the Fund and its
35
shareholders. The Board considered all factors it deemed relevant with respect to the Fund, including the following factors: (1) the nature, extent, and quality of the services provided by Management; (2) the investment performance of the Fund compared to an appropriate market index and a peer group of investment companies; (3) the costs of the services provided and the profit or loss realized by Management and its affiliates from their relationship with the Fund; (4) the extent to which economies of scale have been or might be realized as the Fund grows; and (5) whether fee levels reflect any such potential economies of scale for the benefit of the Fund's shareholders. The Board's determination to approve the continuation of the Agreement was based on a comprehensive consideration of all information provided to the Board throughout the year and specifically in connection with the annual contract review. The Board members did not identify any particular information or factor that was all-important or controlling, and each Trustee may have attributed different weights to the various factors. The Board focused on the overall costs and benefits of the Agreement to the Fund and, through the Fund, its shareholders.
With respect to the nature, extent and quality of the services provided, the Board considered the investment philosophy and decision-making processes of Management, and the qualifications, experience, and capabilities of, and the resources available to, the portfolio management personnel of Management who perform services for the Fund. The Board noted that Management also provides certain administrative services, including fund accounting and compliance services. The Board also considered Management's policies and practices regarding brokerage and allocation of portfolio transactions and reviewed the quality of the execution services that Management had provided. The Board also reviewed whether Management used brokers to execute Fund transactions that provide research and other services to Management and the types of benefits potentially derived from such services by Management, the Fund and other clients of Management. The Board also considered that Management's responsibilities include daily management of investment, operational, enterprise, legal, regulatory and compliance risks as they relate to the Fund, and considered information regarding Management's processes for managing risk. In addition, the Board noted the positive compliance history of Management, as no significant compliance problems were reported to the Board with respect to either firm. The Board also considered the general structure of the portfolio manager compensation program and whether this structure provides appropriate incentives to act in the best interests of the Fund.
As in past years, the Board also considered the manner in which Management addressed various non-routine matters that arose during the year, some of them a result of developments in the broader fund industry or the regulations governing it. In addition, the Board considered actions taken by Management in response to recent market conditions, such as regulatory concerns about current trading issues, market liquidity and potential volatility, and considered the overall performance of Management in this context.
The Board factored into its evaluation of the Fund's fees and performance a consideration of the limitations inherent in the methodology for constructing peer groups and determining which investment companies should be included in the peer groups. The Board considered a peer group composed of two types of funds: proprietary funds that are operated by insurance companies or their affiliates, and non-proprietary funds, such as the Fund, operated for insurance company investors by independent investment managers.
With respect to investment performance, the Board considered information regarding the Fund's short, intermediate and long-term performance both on an absolute basis and relative to an appropriate benchmark index and the average performance of a composite peer group (as constructed by an independent organization) of investment companies pursuing broadly similar strategies. The Board also reviewed performance in relation to certain measures of the degree of investment risk undertaken by the portfolio manager. The Board looked at the Fund's S Class as a proxy for both of the Fund's classes. The Board considered that as compared to its peer group, the performance of the Fund's S Class was lower than the median for the 1, 3, 5 and 10-year periods. The Board also considered that the performance of the Fund's S Class was lower than its benchmark for the 1-year period, higher for the 3 and 10-year periods, and equal for the 5-year period. The Board discussed with Management the Fund's performance and steps that Management had taken, or intended to take, to improve performance. The Board also considered Management's responsiveness with respect to the Fund's lagging performance, noting that a new Portfolio Manager assumed responsibility for the Fund in October 2015. In this regard, the Board noted that performance, especially short-term performance, is only one of the factors that it
36
deems relevant to its consideration of the Fund's Agreement and that, after considering all relevant factors, it may be appropriate to approve the continuation of the Agreement notwithstanding the Fund's underperformance.
With respect to the overall fairness of the Agreement, the Board considered the fee structure for the Fund under the Agreement as compared to the peer group. The Board also considered any fall-out (i.e. indirect) benefits likely to accrue to Management or its affiliates from their relationship with the Fund. The Board also considered the profitability of Management and its affiliates from their association with the Fund, and year-over-year changes in each of Management's reported expense categories.
The Board reviewed a comparison of the Fund's management fee and total expense ratio to the peer group and was aware that non-proprietary insurance product funds generally have higher fee structures than proprietary funds. The Board noted that the comparative management fee analysis includes, in the Fund's management fee, the separate administrative fee paid to Management, but it was not clear whether this was the case for all funds in the peer group. The Board compared the Fund's contractual and actual management fees to the mean and median of the contractual and actual management fees, respectively, of the Fund's peer group. (The actual management fees are the contractual management fees reduced by any fee waivers or other adjustments.) In addition, the Board considered the contractual limit on expenses of the Fund. The Board noted that the overall expense ratio of the Fund's S Class is maintained through expense reimbursements by Management that exceed the fees that Management receives from the Fund. The Board noted that although Management realized a profit on its management of the Fund, it experienced a loss on the Fund when all expenses were taken into account.
The Board considered that, for the Fund's S Class shares, as compared to its peer group, the Fund's contractual management fee was higher than the median, but the actual management fee net of fees waived by Management was lower than the median. The Board looked at the S Class as a proxy for both of the Fund's classes. The Board considered whether specific portfolio management, administration or oversight needs contributed to the management fee. The Board also noted that the Fund's size, which impacts its expenses and performance, has been affected by ongoing changes in the insurance market.
The Board also considered whether there were other funds or separate accounts that were advised by Management or its affiliates with investment objectives, policies and strategies that were similar to those of the Fund. The Board compared the fees charged to the Fund to the fees charged to such funds and/or separate accounts. The Board considered the appropriateness and reasonableness of any differences between the fees charged to the Fund and such funds and/or separate accounts, including any breakpoints, and determined that differences in fees and fee structures were consistent with the management and other services provided.
The Board also evaluated any apparent or anticipated economies of scale in relation to the services Management provides to the Fund. The Board considered whether the Fund's fee structure provides for a reduction of payments resulting from the use of breakpoints and whether those breakpoints are set at appropriate asset levels. As in past years, the Board gave careful thought to the size of any breakpoints in the Fund's advisory fees and the asset levels at which they are set. It also considered whether the fees were set at an appropriate level and compared the fee structures to that of the peer group. The Board also considered that Management has provided, at no added cost to the Fund, certain additional services that were required by new regulations or regulatory interpretations, impelled by changes in the securities markets or the business landscape, and/or requested by the Board. In concluding that the benefits accruing to Management and its affiliates by virtue of their relationship with the Fund were reasonable in light of the costs of providing the investment advisory and other services and the benefits accruing to the Fund, the Board reviewed specific data as to Management's profitability on the Fund for a recent period. The Board also considered Management's cost allocation methodology. The Board recognized that Management should be entitled to earn a reasonable level of profits for services they provide to the Fund and, based on its review, concluded that Management's reported level of profitability on the Fund was reasonable.
37
Conclusions
In approving the continuation of the Agreement, the Board concluded that the terms of the Agreement are fair and reasonable to the Fund and that approval of the continuation of the Agreement is in the best interests of the Fund and its shareholders. In reaching this determination, the Board considered that Management could be expected to provide a high level of service to the Fund; regarding the Fund's underperformance, that it retained confidence in Management's capabilities to manage the Fund; that the Fund's fee structure appeared to the Board to be reasonable given the nature, extent and quality of services provided; and that the benefits accruing to Management and its affiliates by virtue of their relationship with the Fund were reasonable in light of the costs of providing the investment advisory and other services and the benefits accruing to the Fund. The Board's conclusions may be based in part on its consideration of materials prepared in connection with the approval or continuance of the Agreement in prior years and on the Board's ongoing regular review of Fund performance and operations throughout the year, in addition to material prepared specifically for the most recent annual review of the Agreement.
Notice to Shareholders
100.00% of the dividends earned during the fiscal year ended December 31, 2016 qualify for the dividends received deduction for corporate shareholders.
The Fund designates $10,937,902 as a capital gain distribution.
38
Neuberger Berman
Advisers Management Trust
International Equity Portfolio
S Class Shares
Annual Report
December 31, 2016
International Equity Portfolio Commentary (Unaudited)
The Neuberger Berman Advisers Management Trust International Equity Portfolio Class S posted a –1.82% total return for the 12 months ended December 31, 2016, underperforming the 1.00% return of its benchmark, the MSCI EAFE® Index (Net) ("EAFE") for the same period.
The EAFE ended the year 1% in positive territory, which masks the bumpy ride investors experienced in 2016: down close to 13% by mid-February on concerns about China and oil prices, recovering through late June on steady economic data from the U.S. and accommodative central bank policy, then losing almost 10% in the days post-Brexit vote, before recovering later in the summer and again following the U.S. election. The EAFE, while positive, trailed both the U.S. and emerging markets, even as talk of trade protectionism damaged the latter.
Within the EAFE, the Energy and Materials sectors saw very strong performance, and Health Care and Telecommunication Services posted the largest losses. By country, New Zealand and Norway sharply outperformed, while Israel and Denmark lagged.
The portfolio's underperformance for the year resulted primarily from stock selection within Industrials and Materials, and by country, by U.K. holdings. Stock selection within Information Technology and Financials were two areas of clear outperformance, and regionally, the portfolio outperformed on the basis of U.S., Switzerland and Netherlands-based holdings.
This period's top individual contributors included ASML, a Netherlands-based semiconductor industry supplier, on anticipated strong demand for its products; Arkema, a French specialty chemicals company, due to margin improvement from a favorable mix; and Partners Group, a Swiss alternative investments manager, who continued to deliver solid growth in assets and performance fees.
Detractors included Travis Perkins, a U.K. builders' merchant, and U.K. retail bank, Lloyds. Both underperformed on risk related to the Brexit vote. Teva, an Israeli pharmaceuticals firm, fell as concerns around increased competition for its key multiple sclerosis drug increased.
Looking ahead, political uncertainties abound, including: whether the incoming U.S. administration will reduce global trade, the outcome of upcoming elections in France and Germany, and the likely terms of the U.K.'s exit from the European Union. We anticipate higher interest rates in the U.S. but more muted increases elsewhere. We believe the result likely means the U.S. dollar will remain at elevated levels, undermining the competitiveness of U.S. multinationals versus their peers overseas. We believe oil prices will continue to move higher but suspect that recent appreciation in other commodities will prove short-lived.
Our portfolio positioning was relatively conservative as we entered 2016, and our approach in 2017 is not vastly different. Rather than adding exposure to cyclical names that have performed strongly in recent months, we remain more optimistic on global and niche firms that we think can execute effectively even if business confidence and global growth are low.
While the outlook appears positive for banks, energy firms and Japanese exporters, in our view, many stocks in these areas are fully priced. We are looking at what appears to us to be more interesting opportunities in the U.K., where sterling could rebound off its 20-year low, and in the Information Technology sector.
We remain of the view that companies with attractive end markets and a differentiated offering to customers and that have a proven management team are most likely to offer investors the most attractive risk/return characteristics. As such, we continue to look for opportunities across countries, across sectors and across the market cap spectrum, with a focus on those that we believe can perform in an uncertain macroeconomic environment.
Sincerely,
Benjamin Segal
Portfolio Manager
Information about principal risks of investing in the Fund is set forth in the prospectus and statement of additional information.
The portfolio composition, industries and holdings of the Fund are subject to change without notice.
The opinions expressed are those of the Fund's portfolio manager. The opinions are as of the date of this report, and are subject to change without notice.
1
International Equity Portfolio (Unaudited)
PERFORMANCE HIGHLIGHTS
| | Inception Date | | Average Annual Total Return
Ended 12/31/2016 | |
| | | 1 Year | | 5 Years | | 10 Years | | Life of Fund | |
International Equity Portfolio
Class S | | 04/29/2005 | | | –1.82 | % | | | 6.12 | % | | | 0.69 | % | | | 3.84 | % | |
| MSCI EAFE® Index (Net)1,2,3 | | | | | 1.00 | % | | | 6.53 | % | | | 0.75 | % | | | 4.05 | % | |
| MSCI EAFE® Index1,2,3 | | | | | 1.51 | % | | | 7.02 | % | | | 1.22 | % | | | 4.53 | % | |
The performance data quoted represent past performance and do not indicate future results. Current performance may be lower or higher than the performance data quoted. For performance data current to the most recent month-end, please visit http://www.nb.com/amtportfolios/performance.
The results shown in the table reflect the reinvestment of income dividends and other distributions, if any. The results do not reflect the effect of taxes a shareholder would pay on Fund distributions or on the redemption of Fund shares. The results do not reflect fees and expenses of the variable annuity and variable life insurance policies or the qualified pension and retirement plans whose proceeds are invested in the Fund.
The investment return and principal value of an investment will fluctuate and shares, when redeemed, may be worth more or less than their original cost.
Returns would have been lower if Neuberger Berman Investment Advisers LLC ("Management") had not reimbursed certain expenses and/or waived a portion of the investment management fees during certain of the periods shown. Repayment by a class (of expenses previously reimbursed and/or fees previously waived by Management) will decrease the class's returns. Please see Note B in the Notes to Financial Statements for specific information regarding expense reimbursement and/or fee waiver arrangements.
As stated in the Fund's most recent prospectus, the total annual operating expense ratio for fiscal year 2015 was 1.73% for Class S shares (before expense reimbursements and/or fee waivers, if any). The expense ratio was 1.50% after expense reimbursements and/or fee waivers. The expense ratios for the annual period ended December 31, 2016 can be found in the Financial Highlights section of this report.
COMPARISON OF A $10,000 INVESTMENT
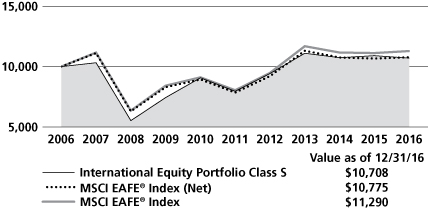
This graph shows the change in value of a hypothetical $10,000 investment in the Fund over the past 10 fiscal years, or since the Fund's inception if it has not operated for 10 years. The result is compared with benchmarks, which include a broad-based market index and may include a more narrowly based index. Market indices have not been reduced to reflect any of the fees and costs of investing. The results shown in the graph reflect the reinvestment of income dividends and other distributions, if any. The results do not reflect the effect of taxes a shareholder would pay on Fund distributions or on the redemption of Fund shares. The results do not reflect fees and expenses of the variable annuity and variable life insurance policies or the qualified pension and retirement plans whose proceeds are invested in the Fund. Results represent past performance and do not indicate future results.
Please see Endnotes for additional information.
2
1 The date used to calculate Life of Fund performance for the index is April 29, 2005, the Fund's commencement of operations.
2 The MSCI EAFE® Index (Europe, Australasia, Far East) is a free float-adjusted market capitalization-weighted index that is designed to measure the equity market performance of developed markets excluding the United States and Canada. The index consists of the following 21 developed market country indices: Australia, Austria, Belgium, Denmark, Finland, France, Germany, Hong Kong, Ireland, Israel, Italy, Japan, the Netherlands, New Zealand, Norway, Portugal, Singapore, Spain, Sweden, Switzerland, and the United Kingdom. Net total return indexes reinvest dividends after the deduction of withholding taxes, using (for international indexes) a tax rate applicable to non-resident institutional investors who do not benefit from double taxation treaties. Gross total return indexes reinvest as much as possible of a company's dividend distributions, regardless of withholding taxes that a non-resident may experience. Please note that the index described in this report does not take into account any fees, expenses or tax consequences of investing in the individual securities that it tracks, and that individuals cannot invest directly in any index. Data about the performance of an index are prepared or obtained by Neuberger Berman Investment Advisers LLC* ("Management") and reflect the reinvestment of income dividends and other distributions, if any. The Fund may invest in securities not included in a described index and generally does not invest in all securities included in a described index.
3 Effective September 30, 2016, the Board approved a change in the benchmark of AMT International Equity Portfolio so that the Fund will use the version of its current benchmark that is net of foreign tax withholdings rather than gross of foreign tax withholdings, which is a more appropriate benchmark for the Fund.
* On January 1, 2016, Neuberger Berman Management LLC ("NBM") transferred to Neuberger Berman Fixed Income LLC ("NBFI") their rights and obligations pertaining to all services they provided to any Fund under any investment management, investment sub-advisory, and/or administration agreement, as applicable (the "Agreements"). Following such transfer, NBFI was renamed Neuberger Berman Investment Advisers LLC ("NBIA" or "Management"). Following the consolidation, the investment professionals of NBM who provided services to any Fund under the Agreements continue to provide the same services, except that they provide those services in their new capacities as investment professionals of NBIA. Further, the consolidation did not result in any change in the investment processes employed by any Fund, the nature or level of services provided to any Fund, or the fees any Fund pays under its Agreements.
On July 1, 2016, NBM was reorganized into "Neuberger Berman" (the "Reorganization"). Upon the completion of the Reorganization, Neuberger Berman assumed all rights and obligations pertaining to all services NBM provided to any Fund under any distribution agreement or distribution and services agreement (the "Agreements") or plan adopted pursuant to Rule 12b-1 under the Investment Company Act of 1940, as amended, (the "Plans"). Accordingly, after the Reorganization, Neuberger Berman became each Fund's distributor and the services previously provided by NBM under the Agreements and Plans are provided by Neuberger Berman.
Following the Reorganization, the employees of NBM provide the same services to each Fund under the Agreements and Plans, except that they provide those services in their capacities as employees of Neuberger Berman. Further, the Reorganization did not result in any change in the nature or level of services provided to each Fund, or the fees, if any, each Fund pays under the Agreements or the Plans.
Please note, effective July 1, 2016, Neuberger Berman Management LLC was reorganized with and into Neuberger Berman LLC, a registered broker-dealer, Member FINRA and the Fund's distributor, which changed its name to Neuberger Berman BD LLC on January 1, 2017.
The investments for the Fund are managed by the same portfolio manager(s) who manage(s) one or more other registered funds that have names, investment objectives and investment styles that are similar to those of the Fund. You should be
3
aware that the Fund is likely to differ from those other mutual fund(s) in size, cash flow pattern and tax matters. Accordingly, the holdings and performance of the Fund can be expected to vary from those of the other mutual fund(s).
Shares of the separate Neuberger Berman Advisers Management Trust Portfolios, including the Fund, are not available to the general public. Shares of the Fund may be purchased only by life insurance companies to be held in their separate accounts, which fund variable annuity and variable life insurance policies, and by qualified pension and retirement plans.
Statistics and projections in this report are derived from sources deemed to be reliable but cannot be regarded as a representation of future results of the Fund. This report is prepared for the general information of shareholders and is not an offer of shares of the Fund. Shares are sold only through the currently effective prospectus, which must precede or accompany this report.
The "Neuberger Berman" name and logo and "Neuberger Berman Investment Advisers LLC" name are registered service marks of Neuberger Berman Group LLC. The individual Fund names in this piece are either service marks or registered service marks of Neuberger Berman Investment Advisers LLC, an affiliate of Neuberger Berman BD LLC, distributor, member FINRA,
© 2017 Neuberger Berman BD LLC, distributor. All rights reserved.
4
Information About Your Fund's Expenses (Unaudited)
As a Fund shareholder, you incur two types of costs: (1) transaction costs such as fees and expenses that are, or may be, imposed under your variable contract or qualified pension plan; and (2) ongoing costs, including management fees, distribution and/or service (12b-1) fees (if applicable), and other Fund expenses. This example is intended to help you understand your ongoing costs (in U.S. dollars) of investing in the Fund and compare these costs with the ongoing costs of investing in other mutual funds.
This table is designed to provide information regarding costs related to your investments. The following examples are based on an investment of $1,000 made at the beginning of the six month period ended December 31, 2016 and held for the entire period. The table illustrates the Fund's costs in two ways:
Actual Expenses and Performance: | | The first section of the table provides information about actual account values and actual expenses in dollars, based on the Fund's actual performance during the period indicated. You may use the information in this line, together with the amount you invested, to estimate the expenses you paid over the period. Simply divide your account value by $1,000 (for example, an $8,600 account value divided by $1,000 = 8.6), then multiply the result by the number in the first section of the table under the heading entitled "Expenses Paid During the Period" to estimate the expenses you paid over the period. | |
Hypothetical Example for
Comparison Purposes: | | The second section of the table provides information about hypothetical account values and hypothetical expenses based on the Fund's actual expense ratio and an assumed rate of return at 5% per year before expenses. This return is not the Fund's actual return. The hypothetical account values and expenses may not be used to estimate the actual ending account balance or expenses you paid for the period. You may use this information to compare the ongoing costs of investing in this Fund versus other funds. To do so, compare the expenses shown in this 5% hypothetical example with the 5% hypothetical examples that appear in the shareholder reports of other funds. | |
Please note that the expenses in the table are meant to highlight your ongoing costs only and do not include any transaction costs, such as fees and expenses that are, or may be imposed under your variable contract or qualified pension plan. Therefore, the information under the heading "Hypothetical (5% annual return before expenses)" is useful in comparing ongoing costs only, and will not help you determine the relative total costs of owning different funds. In addition, if these transaction costs were included, your costs would have been higher.
NEUBERGER BERMAN ADVISERS MANAGEMENT TRUST INTERNATIONAL EQUITY PORTFOLIO
Actual | | Beginning Account
Value
7/1/16 | | Ending Account
Value
12/31/16 | | Expenses Paid During
the Period
7/1/16 - 12/31/16 | |
Class S | | $ | 1,000.00 | | | $ | 1,024.10 | | | $ | 7.68 | * | |
Hypothetical (5% annual return before expenses) | |
Class S | | $ | 1,000.00 | | | $ | 1,017.55 | | | $ | 7.66 | ** | |
* Expenses are equal to the annualized expense ratio of 1.51%, multiplied by the average account value over the period, multiplied by 184/366 (to reflect the one-half year period shown).
** Hypothetical expenses are equal to the annualized expense ratio of 1.51%, multiplied by the average account value over the period (assuming a 5% annual return), multiplied by 184/366 (to reflect the one-half year period shown).
5
Schedule of Investments International Equity Portfolio 12/31/16
NUMBER OF SHARES | | | | VALUE | |
Common Stocks 94.7% | | | |
Australia 2.3% | | | |
| 265,816
| | | Insurance Australia
Group Ltd. | | $ | 1,146,285
| | |
| 191,740 | | | Reliance Worldwide
Corp. Ltd. | | | 442,252 | * | |
| | 93,973 | | | Steadfast Group Ltd. | | | 149,540 | | |
| | | | 1,738,077 | | |
Austria 1.2% | | | |
| | 17,355 | | | Andritz AG | | | 871,328 | | |
Belgium 0.7% | | | |
| | 17,275 | | | Ontex Group NV | | | 513,713 | | |
Canada 6.7% | | | |
| 20,535 | | | Alimentation Couche-Tard, Inc.
Class B | | | 931,122 | | |
| 56,515 | | | ATS Automation Tooling
Systems, Inc. | | | 526,994 | * | |
| | 23,580 | | | Home Capital Group, Inc. | | | 550,402 | | |
| | 10,495 | | | Kinaxis, Inc. | | | 488,540 | * | |
| 8,328 | | | MacDonald, Dettwiler &
Associates Ltd. | | | 414,896 | | |
| 26,920 | | | Peyto Exploration &
Development Corp. | | | 665,857 | | |
| | 45,435 | | | Raging River Exploration, Inc. | | | 357,348 | * | |
| | 33,162 | | | Suncor Energy, Inc. | | | 1,084,282 | | |
| | | | 5,019,441 | | |
China 2.6% | | | |
| 11,380 | | | Alibaba Group
Holding Ltd. ADR | | | 999,278 | * | |
| | 5,580 | | | Baidu, Inc. ADR | | | 917,408 | * | |
| | | | 1,916,686 | | |
Denmark 1.5% | | | |
| | 33,980 | | | Nets A/S | | | 594,680 | *(a) | |
| | 18,230 | | | Sydbank A/S | | | 565,808 | | |
| | | | 1,160,488 | | |
NUMBER OF SHARES | | | | VALUE | |
France 12.2% | | | |
| | 7,133 | | | Air Liquide SA | | $ | 793,279 | | |
| | 10,135 | | | Arkema SA | | | 991,541 | | |
| | 14,260 | | | BNP Paribas SA | | | 908,904 | | |
| | 21,545 | | | Elior Group | | | 492,595 | (a) | |
| | 2,100 | | | Euler Hermes Group | | | 184,582 | | |
| | 8,480 | | | Pernod-Ricard SA | | | 918,981 | | |
| | 7,545 | | | Publicis Groupe SA | | | 520,614 | | |
| | 7,161 | | | Sodexo SA | | | 823,153 | | |
| | 39,230 | | | SPIE SA | | | 826,529 | | |
| | 21,493 | | | TOTAL SA | | | 1,102,271 | | |
| | 18,150 | | | Valeo SA | | | 1,043,357 | | |
| | 2,830 | | | Virbac SA | | | 498,089 | * | |
| | | | 9,103,895 | | |
Germany 8.2% | | | |
| | 13,575 | | | Brenntag AG | | | 754,498 | | |
| | 3,790 | | | Continental AG | | | 732,879 | | |
| | 11,100 | | | CTS Eventim AG & Co. KGaA | | | 349,948 | | |
| | 6,226 | | | Deutsche Boerse AG | | | 508,182 | * | |
| | 11,530 | | | GEA Group AG | | | 464,000 | | |
| | 13,083 | | | Gerresheimer AG | | | 972,566 | | |
| 7,880 | | | Henkel AG & Co. KGaA,
Preference Shares | | | 939,396 | | |
| | 16,290 | | | SAP SE ADR | | | 1,407,945 | | |
| | | | 6,129,414 | | |
Hong Kong 1.5% | | | |
| | 715,300 | | | HKBN Ltd. | | | 782,915 | | |
| | 87,000 | | | Techtronic Industries Co. Ltd. | | | 311,327 | | |
| | | | 1,094,242 | | |
Ireland 0.5% | | | |
| | 114,984 | | | Greencore Group PLC | | | 349,306 | | |
Israel 3.3% | | | |
| 413,310 | | | Bezeq Israeli
Telecommunication Corp. Ltd. | | | 783,977 | | |
| 13,985 | | | Check Point Software
Technologies Ltd. | | | 1,181,173 | * | |
| 13,960 | | | Teva Pharmaceutical
Industries Ltd. ADR | | | 506,050 | | |
| | | | 2,471,200 | | |
Italy 0.9% | | | |
| | 40,270 | | | Azimut Holding SpA | | | 672,309 | | |
See Notes to Financial Statements
6
Schedule of Investments International Equity Portfolio (cont'd)
NUMBER OF SHARES | | | | VALUE | |
Japan 10.9% | | | |
| | 9,800 | | | Daikin Industries Ltd. | | $ | 897,767 | | |
| | 45,400 | | | KANSAI PAINT Co. Ltd. | | | 835,072 | | |
| | 2,100 | | | KEYENCE Corp. | | | 1,436,924 | | |
| | 4,200 | | | Kose Corp. | | | 348,214 | | |
| | 17,000 | | | Nabtesco Corp. | | | 394,077 | | |
| 48,700 | | | SANTEN
PHARMACEUTICAL Co. Ltd. | | | 594,204 | | |
| | 5,300 | | | Sato Holdings Corp. | | | 105,919 | | |
| | 16,300 | | | Shionogi & Co. Ltd. | | | 779,025 | | |
| | 3,400 | | | SMC Corp. | | | 808,943 | | |
| | 11,700 | | | Sundrug Co. Ltd. | | | 808,952 | | |
| | 20,300 | | | TOYOTA MOTOR Corp. | | | 1,190,156 | | |
| | | | 8,199,253 | | |
Netherlands 5.9% | | | |
| | 22,740 | | | AerCap Holdings NV | | | 946,211 | * | |
| | 14,070 | | | ASML Holding NV | | | 1,579,571 | | |
| | 43,046 | | | Koninklijke Ahold Delhaize NV | | | 907,607 | | |
| | 10,465 | | | NXP Semiconductors NV | | | 1,025,675 | * | |
| | | | 4,459,064 | | |
Norway 1.4% | | | |
| | 85,490 | | | Skandiabanken ASA | | | 695,475 | *(a) | |
| | 19,400 | | | Statoil ASA | | | 355,858 | | |
| | | | 1,051,333 | | |
Spain 1.3% | | | |
| 54,403 | | | Banco Bilbao Vizcaya
Argentaria SA | | | 367,312 | | |
| | 68,510 | | | Euskaltel SA | | | 607,226 | *(a) | |
| | | | 974,538 | | |
Sweden 0.9% | | | |
| | 59,565 | | | Nordea Bank AB | | | 662,298 | | |
Switzerland 12.6% | | | |
| | 2,856 | | | Bucher Industries AG | | | 703,272 | | |
| | 8,320 | | | Cie Financiere Richemont SA | | | 551,099 | | |
| | 619 | | | Givaudan SA | | | 1,134,296 | | |
| | 21,815 | | | Julius Baer Group Ltd. | | | 968,960 | * | |
| | 9,055 | | | Novartis AG | | | 658,917 | | |
| | 1,920 | | | Partners Group Holding AG | | | 899,853 | | |
| | 4,066 | | | Roche Holding AG | | | 928,755 | | |
| | 442 | | | SGS SA | | | 899,366 | | |
NUMBER OF SHARES | | | | VALUE | |
| | 5,810 | | | Sonova Holding AG | | $ | 704,070 | | |
| | 7,900 | | | Tecan Group AG | | | 1,232,751 | | |
| | 48,415 | | | UBS Group AG | | | 758,342 | | |
| | | | 9,439,681 | | |
United Kingdom 17.2% | | | |
| | 10,220 | | | Aon PLC | | | 1,139,836 | | |
| | 301,750 | | | Barclays PLC | | | 830,958 | | |
| | 149,120 | | | Biffa PLC | | | 328,498 | *(a) | |
| | 36,271 | | | Bunzl PLC | | | 942,731 | | |
| | 94,520 | | | Clinigen Group PLC | | | 827,054 | * | |
| | 42,071 | | | Compass Group PLC | | | 778,243 | | |
| | 11,310 | | | DCC PLC | | | 841,882 | | |
| | 64,845 | | | Howden Joinery Group PLC | | | 306,714 | | |
| | 1,290,206 | | | Lloyds Banking Group PLC | | | 993,940 | | |
| | 53,306 | | | Prudential PLC | | | 1,069,175 | | |
| | 57,509 | | | RELX PLC | | | 1,026,965 | | |
| | 149,235 | | | RPS Group PLC | | | 409,216 | | |
| | 28,690 | | | Spectris PLC | | | 817,820 | | |
| | 62,169 | | | St. James's Place PLC | | | 776,897 | | |
| | 223,010 | | | TalkTalk Telecom Group PLC | | | 465,025 | | |
| | 40,057 | | | Travis Perkins PLC | | | 716,798 | | |
| | 194,200 | | | Worldpay Group PLC | | | 645,957 | (a) | |
| | | | 12,917,709 | | |
United States 2.9% | | | |
| | 21,455 | | | Nielsen Holdings PLC | | | 900,037 | | |
| | 244,200 | | | Samsonite International SA | | | 695,134 | | |
| | 1 | | | STERIS PLC | | | 68 | | |
| | 8,200 | | | TE Connectivity Ltd. | | | 568,096 | | |
| | | | 2,163,335 | | |
| | | | | Total Common Stocks
(Cost $71,467,944) | | | 70,907,310 | | |
Short-Term Investment 5.9% | | | |
Investment Company 5.9% | | | |
| 4,406,565
| | | State Street Institutional
Treasury Money Market
Fund Premier Class, 0.39%
(Cost $4,406,565) | | | 4,406,565
| (b) | |
| | | | | Total Investments 100.6%
(Cost $75,874,509) | | | 75,313,875
| | |
| | | | | Other Assets Less Liabilities (0.6)% | | | (468,682 | ) | |
| | | | | Net Assets 100.0% | | $ | 74,845,193 | | |
* Non-income producing security.
(a) Securities were purchased under Rule 144A of the Securities Act of 1933, as amended (the "1933 Act"), or are otherwise restricted and, unless registered under the 1933 Act or exempted from registration, may only be sold to qualified institutional investors or may have other restrictions on resale. At 12/31/2016, these securities amounted to $3,364,431 or 4.5% of net assets for the Fund. These securities have been deemed by the investment manager to be liquid.
(b) Represents 7-day effective yield as of 12/31/2016.
See Notes to Financial Statements
7
Schedule of Investments International Equity Portfolio (cont'd)
The following is a summary, categorized by Level (see Note A of Notes to Financial Statements), of inputs used to value the Fund's investments as of December 31, 2016:
Asset Valuation Inputs | | Level 1 | | Level 2 | | Level 3 | | Total | |
Investments: | |
Common Stocks | |
Australia | | $ | — | | | $ | 1,738,077 | | | $ | — | | | $ | 1,738,077 | | |
Hong Kong | | | — | | | | 1,094,242 | | | | — | | | | 1,094,242 | | |
Israel | | | 1,687,223 | | | | 783,977 | | | | — | | | | 2,471,200 | | |
Japan | | | — | | | | 8,199,253 | | | | — | | | | 8,199,253 | | |
United States | | | 1,468,201 | | | | 695,134 | | | | — | | | | 2,163,335 | | |
| Other Common Stocks(a) | | | 55,241,203 | | | | — | | | | — | | | | 55,241,203 | | |
Total Common Stocks | | | 58,396,627 | | | | 12,510,683 | | | | — | | | | 70,907,310 | | |
Short-Term Investment | | | — | | | | 4,406,565 | | | | — | | | | 4,406,565 | | |
Total Investments | | $ | 58,396,627 | | | $ | 16,917,248 | | | $ | — | | | $ | 75,313,875 | | |
(a) The Schedule of Investments provides a geographic categorization as well as a Positions by Industry summary.
As of the year ended December 31, 2016, certain securities were transferred from one level (as of December 31, 2015) to another. Based on beginning of period market values as of January 1, 2016, $969,890 was transferred from Level 1 to Level 2. Interactive Data Pricing and Reference Data LLC ("Interactive") provided adjusted prices for these securities as of December 31, 2016, as stated in the description of the valuation methods of foreign equity securities in Note A of the Notes to Financial Statements. In addition, based on beginning of period market values as of January 1, 2016, $16,376,702 was transferred from Level 2 to Level 1 due to active market activity on recognized exchanges as of December 31, 2016. These securities had been categorized as Level 2 as of December 31, 2015, due to foreign exchanges having been closed and, therefore, no prices having been readily available for the securities as of that date.
See Notes to Financial Statements
8
POSITIONS BY INDUSTRY
International Equity Portfolio (Unaudited)
Industry | | Investments
at Value | | Percentage of
Net Assets | |
Banks | | $ | 5,024,695 | | | | 6.7 | % | |
Insurance | | | 4,466,315 | | | | 6.0 | % | |
Pharmaceuticals | | | 3,965,040 | | | | 5.3 | % | |
Capital Markets | | | 3,807,646 | | | | 5.1 | % | |
Machinery | | | 3,768,614 | | | | 5.0 | % | |
Chemicals | | | 3,754,188 | | | | 5.0 | % | |
Trading Companies & Distributors | | | 3,666,952 | | | | 4.9 | % | |
Oil, Gas & Consumable Fuels | | | 3,565,616 | | | | 4.7 | % | |
Software | | | 3,077,658 | | | | 4.1 | % | |
Life Sciences Tools & Services | | | 3,032,371 | | | | 4.0 | % | |
Professional Services | | | 2,826,368 | | | | 3.8 | % | |
Electronic Equipment, Instruments & Components | | | 2,822,840 | | | | 3.8 | % | |
Food & Staples Retailing | | | 2,647,681 | | | | 3.5 | % | |
Diversified Telecommunication Services | | | 2,639,143 | | | | 3.5 | % | |
Semiconductors & Semiconductor Equipment | | | 2,605,246 | | | | 3.5 | % | |
Hotels, Restaurants & Leisure | | | 2,093,991 | | | | 2.8 | % | |
Internet Software & Services | | | 1,916,686 | | | | 2.6 | % | |
Auto Components | | | 1,776,236 | | | | 2.4 | % | |
Building Products | | | 1,340,019 | | | | 1.8 | % | |
Textiles, Apparel & Luxury Goods | | | 1,246,233 | | | | 1.7 | % | |
IT Services | | | 1,240,637 | | | | 1.7 | % | |
Automobiles | | | 1,190,156 | | | | 1.6 | % | |
Household Products | | | 939,396 | | | | 1.3 | % | |
Beverages | | | 918,981 | | | | 1.2 | % | |
Media | | | 870,562 | | | | 1.2 | % | |
Personal Products | | | 861,927 | | | | 1.1 | % | |
Commercial Services & Supplies | | | 843,633 | | | | 1.1 | % | |
Industrial Conglomerates | | | 841,882 | | | | 1.1 | % | |
Construction & Engineering | | | 826,529 | | | | 1.1 | % | |
Health Care Equipment & Supplies | | | 704,138 | | | | 0.9 | % | |
Thrifts & Mortgage Finance | | | 550,402 | | | | 0.7 | % | |
Aerospace & Defense | | | 414,896 | | | | 0.6 | % | |
Food Products | | | 349,306 | | | | 0.5 | % | |
Household Durables | | | 311,327 | | | | 0.4 | % | |
Short-Term Investment and Other Assets—Net | | | 3,937,883 | | | | 5.3 | % | |
| | | $ | 74,845,193 | | | | 100.0 | % | |
See Notes to Financial Statements
9
Statement of Assets and Liabilities
Neuberger Berman Advisers Management Trust
| | | INTERNATIONAL
EQUITY
PORTFOLIO | |
| | | December 31, 2016 | |
Assets | |
Investments in securities, at value* (Note A)—see Schedule of Investments: | |
Unaffiliated issuers | | $ | 75,313,875 | | |
Foreign currency* | | | 1,898 | | |
Dividends and interest receivable | | | 207,838 | | |
Receivable for securities sold | | | 35,042 | | |
Receivable for Fund shares sold | | | 146 | | |
Prepaid expenses and other assets | | | 890 | | |
Total Assets | | | 75,559,689 | | |
Liabilities | |
Payable for securities purchased | | | 549,485 | | |
Payable for Fund shares redeemed | | | 15,544 | | |
Payable to investment manager (Note B) | | | 51,324 | | |
Payable to administrator—net (Note B) | | | 13,812 | | |
Accrued expenses and other payables | | | 84,331 | | |
Total Liabilities | | | 714,496 | | |
Net Assets | | $ | 74,845,193 | | |
Net Assets consist of: | |
Paid-in capital | | $ | 138,801,990 | | |
Undistributed net investment income (loss) | | | 530,599 | | |
Accumulated net realized gains (losses) on investments | | | (63,914,510 | ) | |
Net unrealized appreciation (depreciation) in value of investments | | | (572,886 | ) | |
Net Assets | | $ | 74,845,193 | | |
Shares Outstanding ($.001 par value; unlimited shares authorized) | | | 6,915,396 | | |
Net Asset Value, offering and redemption price per share | | $ | 10.82 | | |
*Cost of Investments: | |
Unaffiliated issuers | | $ | 75,874,509 | | |
Total cost of foreign currency | | $ | 1,887 | | |
See Notes to Financial Statements
10
Neuberger Berman Advisers Management Trust
| | | INTERNATIONAL
EQUITY
PORTFOLIO | |
| | | For the
Year Ended
December 31, 2016 | |
Investment Income: | |
Income (Note A): | |
Dividend income—unaffiliated issuers | | $ | 1,818,414 | | |
Interest income—unaffiliated issuers | | | 2,488 | | |
Foreign taxes withheld (Note A) | | | (158,669 | ) | |
Total income | | $ | 1,662,233 | | |
Expenses: | |
Investment management fees (Note B) | | | 624,646 | | |
Administration fees (Note B) | | | 220,463 | | |
Distribution fees (Note B) | | | 183,719 | | |
Audit fees | | | 46,560 | | |
Custodian and accounting fees | | | 79,378 | | |
Insurance expense | | | 2,647 | | |
Legal fees | | | 46,814 | | |
Shareholder reports | | | 24,741 | | |
Trustees' fees and expenses | | | 54,963 | | |
Interest expense | | | 427 | | |
Miscellaneous | | | 21,697 | | |
Total expenses | | | 1,306,055 | | |
Expenses reimbursed by Management (Note B) | | | (201,256 | ) | |
Total net expenses | | | 1,104,799 | | |
Net investment income (loss) | | $ | 557,434 | | |
Realized and Unrealized Gain (Loss) on Investments (Note A): | |
Net realized gain (loss) on: | |
Sales of investment securities of unaffiliated issuers | | | (213,771 | ) | |
Foreign currency | | | (22,075 | ) | |
Change in net unrealized appreciation (depreciation) in value of: | |
Unaffiliated investment securities | | | (1,644,992 | ) | |
Foreign currency | | | (763 | ) | |
Net gain (loss) on investments | | | (1,881,601 | ) | |
Net increase (decrease) in net assets resulting from operations | | $ | (1,324,167 | ) | |
See Notes to Financial Statements
11
Statements of Changes in Net Assets
Neuberger Berman Advisers Management Trust
| | | INTERNATIONAL EQUITY PORTFOLIO | |
| | | Year Ended
December 31,
2016 | | Year Ended
December 31,
2015 | |
Increase (Decrease) in Net Assets: | |
From Operations: | |
Net investment income (loss) (Note A) | | $ | 557,434 | | | $ | 485,783 | | |
Net realized gain (loss) on investments (Note A) | | | (235,846 | ) | | | 1,151,235 | | |
Change in net unrealized appreciation (depreciation) of investments (Note A) | | | (1,645,755 | ) | | | (480,338 | ) | |
Net increase (decrease) in net assets resulting from operations | | | (1,324,167 | ) | | | 1,156,680 | | |
Distributions to Shareholders From (Note A): | |
Net investment income | | | (464,264 | ) | | | (743,251 | ) | |
Net realized gain on investments | | | (392,634 | ) | | | (215,188 | ) | |
Total distributions to shareholders | | | (856,898 | ) | | | (958,439 | ) | |
From Fund Share Transactions (Note D): | |
Proceeds from shares sold | | | 4,895,197 | | | | 3,003,747 | | |
Proceeds from reinvestment of dividends and distributions | | | 856,898 | | | | 958,439 | | |
Payments for shares redeemed | | | (5,195,263 | ) | | | (4,994,661 | ) | |
Net increase (decrease) from Fund share transactions | | | 556,832 | | | | (1,032,475 | ) | |
Net Increase (Decrease) in Net Assets | | | (1,624,233 | ) | | | (834,234 | ) | |
Net Assets: | |
Beginning of year | | | 76,469,426 | | | | 77,303,660 | | |
End of year | | $ | 74,845,193 | | | $ | 76,469,426 | | |
Undistributed net investment income (loss) at end of year | | $ | 530,599 | | | $ | 457,557 | | |
See Notes to Financial Statements
12
Notes to Financial Statements International Equity Portfolio
Note A—Summary of Significant Accounting Policies:
1 General: Neuberger Berman Advisers Management Trust (the "Trust") is a Delaware statutory trust organized pursuant to an Amended and Restated Trust Instrument dated March 27, 2014. The Trust is currently comprised of eight separate operating series (each individually a "Fund," and collectively the "Funds") each of which is diversified. The Trust is registered as an open-end management investment company under the Investment Company Act of 1940, as amended (the "1940 Act"), and its shares are registered under the 1933 Act. Neuberger Berman Advisers Management Trust International Equity Portfolio (the "Fund") currently offers only Class S shares. The Trust's Board of Trustees (the "Board") may establish additional series or classes of shares without the approval of shareholders.
The assets of each Fund belong only to that Fund, and the liabilities of each Fund are borne solely by that Fund and no other.
The Fund is an investment company and accordingly follows the investment company accounting and reporting guidance of the Financial Accounting Standards Board ("FASB") Accounting Standard Codification Topic 946 "Financial Services—Investment Companies."
The preparation of financial statements in accordance with U.S. generally accepted accounting principles ("GAAP") requires Neuberger Berman Investment Advisers LLC ("NBIA" or "Management") to make estimates and assumptions at the date of the financial statements. Actual results could differ from those estimates.
Shares of the Fund are not available to the general public and may be purchased only by life insurance companies to serve as an investment vehicle for premiums paid under their variable annuity and variable life insurance contracts and to certain qualified pension and other retirement plans.
2 Portfolio valuation: In accordance with Accounting Standards Codification ("ASC") 820 "Fair Value Measurement" ("ASC 820"), all investments held by the Fund are carried at the value that Management believes the Fund would receive upon selling an investment in an orderly transaction to an independent buyer in the principal or most advantageous market for the investment under current market conditions. Various inputs, including the volume and level of activity for the asset or liability in the market, are considered in valuing the Fund's investments, some of which are discussed below. Significant Management judgment may be necessary to value investments in accordance with ASC 820.
ASC 820 established a three-tier hierarchy of inputs to create a classification of value measurements for disclosure purposes. The three-tier hierarchy of inputs is summarized in the three broad Levels listed below.
| | • | Level 1—quoted prices in active markets for identical investments |
| | • | Level 2—other observable inputs (including quoted prices for similar investments, interest rates, prepayment speeds, credit risk, amortized cost, etc.) |
| | • | Level 3—unobservable inputs (including the Fund's own assumptions in determining the fair value of investments) |
The inputs or methodology used for valuing an investment are not necessarily an indication of the risk associated with investing in those securities.
The value of the Fund's investments in equity securities, for which market quotations are readily available, is generally determined by Management by obtaining valuations from independent pricing services based on the latest sale price quoted on a principal exchange or market for that security (Level 1 inputs). Securities traded primarily on the NASDAQ Stock Market are normally valued at the NASDAQ Official Closing Price ("NOCP") provided by NASDAQ each business day. The NOCP is the most recently reported price as of 4:00:02 p.m., Eastern
13
Time, unless that price is outside the range of the "inside" bid and asked prices (i.e., the bid and asked prices that dealers quote to each other when trading for their own accounts); in that case, NASDAQ will adjust the price to equal the inside bid or asked price, whichever is closer. Because of delays in reporting trades, the NOCP may not be based on the price of the last trade to occur before the market closes. If there is no sale of a security on a particular day, the independent pricing services may value the security based on market quotations.
Management has developed a process to periodically review information provided by independent pricing services for all types of securities.
Investments in non-exchange traded investment companies are valued using the respective fund's daily calculated net asset value per share (Level 2 inputs).
If a valuation is not available from an independent pricing service, or if Management has reason to believe that the valuation received does not represent the amount the Fund might reasonably expect to receive on a current sale in an orderly transaction, Management seeks to obtain quotations from brokers or dealers (generally considered Level 2 or Level 3 inputs depending on the number of quotes available). If such quotations are not readily available, the security is valued using methods the Board has approved in the good-faith belief that the resulting valuation will reflect the fair value of the security. Numerous factors may be considered when determining the fair value of a security based on Level 2 or Level 3 inputs, including available analyst, media or other reports, securities within the same industry with recent highly correlated performance, trading in futures or American Depositary Receipts ("ADRs") and whether the issuer of the security being fair valued has other securities outstanding.
The value of the Fund's investments in foreign securities is generally determined using the same valuation methods and inputs as other Fund investments, as discussed above. Foreign security prices expressed in local currency values are normally translated from the local currency into U.S. dollars using the exchange rates as of 4:00 p.m. Eastern Time on days the New York Stock Exchange ("NYSE") is open for business. The Board has approved the use of Interactive to assist in determining the fair value of foreign equity securities when changes in the value of a certain index suggest that the closing prices on the foreign exchanges may no longer represent the amount that the Fund could expect to receive for those securities or on days when foreign markets are closed and U.S. markets are open. In each of these events, Interactive will provide adjusted prices for certain foreign equity securities using a statistical analysis of historical correlations of multiple factors (Level 2 inputs). In the absence of precise information about the market values of these foreign securities as of the time as of which a Fund's share price is calculated, the Board has determined on the basis of available data that prices adjusted in this way are likely to be closer to the prices the Fund could realize on a current sale than are the prices of those securities established at the close of the foreign markets in which the securities primarily trade.
Fair value prices are necessarily estimates, and there is no assurance that such a price will be at or close to the price at which the security is next quoted or next trades.
3 Foreign currency translation: The accounting records of the Fund are maintained in U.S. dollars. Foreign currency amounts are normally translated into U.S. dollars using the exchange rate as of 4:00 p.m. Eastern Time, on days the NYSE is open for business to determine the value of investments, other assets and liabilities. Purchase and sale prices of securities, and income and expenses, are translated into U.S. dollars at the prevailing rate of exchange on the respective dates of such transactions. Net unrealized foreign currency gain (loss), if any, arises from changes in the value of assets and liabilities, other than investments in securities, as a result of changes in exchange rates and is stated separately in the Statement of Operations.
4 Securities transactions and investment income: Securities transactions are recorded on trade date for financial reporting purposes. Dividend income is recorded on the ex-dividend date or, for certain foreign dividends, as soon as the Fund becomes aware of the dividends. Non-cash dividends included in dividend income, if any, are recorded at the fair market value of the securities received. Interest income, including accretion of original issue discount, where applicable, and accretion of discount on short-term investments, if any, is recorded on the accrual basis. Realized gains and losses from securities transactions and foreign currency transactions, if any, are recorded on the basis of identified cost and stated separately in the Statement of Operations.
14
5 Income tax information: Each Fund is treated as a separate entity for U.S. federal income tax purposes. It is the policy of the Fund to continue to qualify for treatment as a regulated investment company ("RIC") by complying with the requirements of the U.S. Internal Revenue Code applicable to RICs and to distribute substantially all of its net investment income and net realized capital gains to its shareholders. To the extent the Fund distributes substantially all of its net investment income and net realized capital gains to shareholders, no federal income or excise tax provision is required.
The Fund has adopted the provisions of ASC 740 "Income Taxes" ("ASC 740"). ASC 740 sets forth a minimum threshold for financial statement recognition of a tax position taken, or expected to be taken, in a tax return. The Fund recognizes interest and penalties, if any, related to unrecognized tax positions as an income tax expense in the Statement of Operations. The Fund is subject to examination by U.S. federal and state tax authorities for returns filed for the tax years for which the applicable statutes of limitations have not yet expired. As of December 31, 2016, the Fund did not have any unrecognized tax positions.
At December 31, 2016, the cost of investments for U.S. federal income tax basis was $76,052,961. Gross unrealized appreciation of investments was $6,275,653 and gross unrealized depreciation of investments was $7,014,739 resulting in net unrealized depreciation of $739,086 based on cost for U.S. federal income tax purposes.
Income distributions and capital gain distributions are determined in accordance with income tax regulations, which may differ from GAAP. These differences are primarily due to differing treatments of income and gains on various investment securities held by the Fund, timing differences and differing characterization of distributions made by the Fund. The Fund may also utilize earnings and profits distributed to shareholders on redemption of shares as a part of the dividends-paid deduction for income tax purposes.
As determined on December 31, 2016, permanent differences resulting primarily from different book and tax accounting were reclassified at year end. Such differences are attributed to the tax treatment of: foreign currency gains and losses, gains and losses from passive foreign investment companies (PFICs), expiration of capital loss carryforwards and distributions in excess. These reclassifications had no effect on net income, net asset value ("NAV") or NAV per share of the Fund. For the year ended December 31, 2016, the Fund recorded the following permanent reclassifications:
| Paid-in Capital | | Undistributed
Net Investment
Income (Loss) | | Accumulated
Net Realized
Gains (Losses)
on Investments | |
| $ | (67,038,387 | ) | | $ | (20,128 | ) | | $ | 67,058,515 | | |
The tax character of distributions paid during the years ended December 31, 2016 and December 31, 2015 was as follows:
Distributions Paid From: | |
Ordinary Income | | Long-Term Capital Gains | | Total | |
| 2016 | | 2015 | | 2016 | | 2015 | | 2016 | | 2015 | |
| $ | 464,454 | | | $ | 743,251 | | | $ | 392,444 | | | $ | 215,188 | | | $ | 856,898 | | | $ | 958,439 | | |
As of December 31, 2016, the components of distributable earnings (accumulated losses) on a U.S. federal income tax basis were as follows:
Undistributed
Ordinary
Income (Loss) | | Undistributed
Long-Term
Capital Gains | | Unrealized
Appreciation/
(Depreciation) | | Loss
Carryforwards
and Deferrals | | Other
Temporary
Differences | | Total | |
| $ | 534,833 | | | $ | — | | | $ | (751,393 | ) | | $ | (63,740,239 | ) | | $ | 2 | | | $ | (63,956,797 | ) | |
15
The temporary differences between book basis and tax basis distributable earnings are primarily due to: losses disallowed and recognized on wash sales, mark-to-market adjustments on forwards, PFIC adjustments and capital loss carryforwards.
To the extent the Fund's net realized capital gains, if any, can be offset by capital loss carryforwards, it is the policy of the Fund not to distribute such gains. The Regulated Investment Company Modernization Act of 2010 (the "Act") made changes to the capital loss carryforward rules allowing for RICs to carry forward capital losses indefinitely and to retain the character of capital loss carryforwards as short-term or long-term ("Post-Enactment"). Rules in effect previously limited the carryforward period to eight years and all carryforwards were considered short-term in character ("Pre-Enactment"). As determined at December 31, 2016, the Fund had unused capital loss carryforwards available for federal income tax purposes to offset net realized capital gains, if any, as follows:
| | | Pre-Enactment | |
| | | Expiring in: | |
| | | 2017 | |
| | | | | $63,586,748 | | |
Post-Enactment
(No Expiration Date) | |
| Long-Term | | Short-Term | |
| $153,491 | | | $— | | |
Post-Enactment capital loss carryforwards must be fully used before Pre-Enactment capital loss carryforwards; therefore, under certain circumstances, Pre-Enactment capital loss carryforwards available as of the report date may expire unused.
During the year ended December 31, 2016, the Fund had capital loss carryforwards expire of $67,038,387.
6 Distributions to shareholders: The Fund may earn income, net of expenses, daily on its investments. Distributions from net investment income and net realized capital gains, if any, are generally distributed once a year (usually in October). Income distributions and capital gain distributions to shareholders are recorded on the ex-date.
7 Foreign taxes: Foreign taxes withheld, if any, represent amounts withheld by foreign tax authorities, net of refunds recoverable.
8 Expense allocation: Certain expenses are applicable to multiple funds within the complex of related investment companies. Expenses directly attributable to a Fund are charged to that Fund. Expenses of the Trust that are not directly attributable to a particular series of the Trust (e.g., the Fund) are allocated among the series of the Trust, on the basis of relative net assets, except where a more appropriate allocation of expenses to each of the series can otherwise be made fairly. Expenses borne by the complex of related investment companies, which includes open-end and closed-end investment companies for which Management serves as investment manager, that are not directly attributable to a particular investment company in the complex (e.g., the Trust) or series thereof are allocated among the investment companies in the complex or series thereof on the basis of relative net assets, except where a more appropriate allocation of expenses to each of the investment companies in the complex or series thereof can otherwise be made fairly.
9 Investments in foreign securities: Investing in foreign securities may involve sovereign and other risks, in addition to the credit and market risks normally associated with domestic securities. These additional risks include the possibility of adverse political and economic developments (including political instability, nationalization, expropriation, or confiscatory taxation) and the potentially adverse effects of unavailability of public information regarding issuers, less governmental supervision and regulation of financial markets, reduced liquidity of certain financial markets, and the lack of uniform accounting, auditing, and financial reporting standards or the application of standards that are different or less stringent than those applied in the United States. Foreign securities also may experience greater price volatility, higher rates of inflation, and delays in settlement.
16
10 Indemnifications: Like many other companies, the Trust's organizational documents provide that its officers ("Officers") and trustees ("Trustees") are indemnified against certain liabilities arising out of the performance of their duties to the Trust. In addition, both in some of its principal service contracts and in the normal course of its business, the Trust enters into contracts that provide indemnifications to other parties for certain types of losses or liabilities. The Trust's maximum exposure under these arrangements is unknown as this could involve future claims against the Trust.
Note B—Investment Management Fees, Administration Fees, Distribution Arrangements, and Other Transactions with Affiliates:
The Fund retains Management as its investment manager under a Management Agreement. For such investment management services, the Fund pays Management a fee at the annual rate of 0.85% of the first $250 million of the Fund's average daily net assets, 0.825% of the next $250 million, 0.80% of the next $250 million, 0.775% of the next $250 million, 0.75% of the next $500 million, 0.725% of the next $1 billion, and 0.70% of average daily net assets in excess of $2.5 billion. Accordingly, for the year ended December 31, 2016, the investment management fee pursuant to the Management Agreement was equivalent to an annual effective rate of 0.85% of the Fund's average daily net assets.
The Fund retains Management as its administrator under an Administration Agreement. The Fund pays Management an administration fee at the annual rate of 0.30% of its average daily net assets under this agreement. Additionally, Management retains State Street Bank and Trust Company ("State Street") as its sub-administrator under a Sub-Administration Agreement. Management pays State Street a fee for all services received under this agreement.
Neuberger Berman BD LLC (the "Distributor") is the Fund's "principal underwriter" within the meaning of the 1940 Act. It acts as agent in arranging for the sale of the Fund's Class S shares. The Board has adopted a distribution and shareholder services plan (the "Plan") for Class S shares pursuant to Rule 12b-1 under the 1940 Act. The Plan provides that, for its activities and expenses related to the sale and distribution of Class S, and ongoing services provided to investors in the class, the Distributor receives from Class S a fee at the annual rate of 0.25% of Class S's average daily net assets. Distributor may pay a portion of the proceeds from the 12b-1 fee to insurance companies or their affiliates and qualified plan administrators ("intermediaries") for services they provide respecting the Fund to current and prospective variable contract owners and qualified plan participants that invest in the Fund through the intermediaries. Those institutions may use the payments for, among other purposes, compensating employees engaged in sales and/or shareholder servicing. The amount of fees paid by the class during any year may be more or less than the cost of distribution and other services provided to the class. FINRA rules limit the amount of annual distribution fees that may be paid by a mutual fund and impose a ceiling on the cumulative distribution fees paid. The Plan complies with those rules.
Management has contractually agreed to waive fees and/or reimburse the Fund so that the total annual operating expenses do not exceed the expense limitations as detailed in the following table. These undertakings include fees payable to Management but exclude interest (commitment fees relating to borrowings are treated as interest for purposes of this exclusion), taxes, transaction costs, brokerage commissions, dividend and interest expenses relating to short sales, acquired fund fees and expenses and extraordinary expenses, if any; consequently, net expenses may exceed the contractual expense limitation. The Fund has agreed that it will repay Management for fees and expenses waived or reimbursed provided that repayment does not cause the annual operating expenses to exceed its contractual expense limitation in place at the time the fees and expenses were waived or reimbursed, or the expense limitation in place at the time the Fund repays Management, whichever is lower. Any such repayment must be made within three years after the year in which Management incurred the expense.
During the year ended December 31, 2016, there was no repayment to Management under its contractual expense limitation.
17
At December 31, 2016, the Fund's contingent liabilities to Management under its contractual expense limitation were as follows:
| | | | | | | Expenses Reimbursed in
Fiscal Year Ending December 31, | |
| | | | | | | 2014 | | 2015 | | 2016 | |
| | | | | | | Subject to Repayment Until December 31, | |
| | | Contractual
Expense
Limitation(a) | | Expiration | | 2017 | | 2018 | | 2019 | |
Class S | | | 1.50 | % | | 12/31/19 | | $ | 187,924 | | | $ | 178,710 | | | $ | 201,256 | | |
(a) Expense limitation per annum of the Fund's average daily net assets.
Neuberger Berman LLC ("Neuberger") was retained by Management through December 31, 2015, pursuant to a Sub-Advisory Agreement to furnish it with investment recommendations and research information without added cost to the Fund. Several individuals who are Officers and/or Trustees of the Trust are also employees of Neuberger and/or Management. As a result of the entity consolidation described on page 3 of this Annual Report, the services previously provided by Neuberger under the Sub-Advisory Agreement are being provided by NBIA as of January 1, 2016.
Note C—Securities Transactions:
During the year ended December 31, 2016, there were purchase and sale transactions (excluding short-term securities) of $20,508,008 and $22,710,091, respectively.
During the year ended December 31, 2016, no brokerage commissions on securities transactions were paid to affiliated brokers.
Note D—Fund Share Transactions:
Share activity for the years ended December 31, 2016 and December 31, 2015 was as follows:
| | | For the Year Ended December 31, | |
| | | 2016 | | 2015 | |
Shares Sold | | | 453,196 | | | | 260,156 | | |
Shares Issued on Reinvestment of Dividends and Distributions | | | 78,184 | | | | 85,728 | | |
Shares Redeemed | | | (475,991 | ) | | | (436,868 | ) | |
Total | | | 55,389 | | | | (90,984 | ) | |
Note E—Line of Credit:
At December 31, 2016, the Fund was a participant in a syndicated committed, unsecured $700,000,000 line of credit (the "Credit Facility"), to be used only for temporary or emergency purposes. Series of other investment companies managed by Management also participate in this line of credit on substantially the same terms except that some do not have access to the full amount of the Credit Facility. Interest is charged on borrowings under this Credit Facility at the higher of (a) a federal funds effective rate plus 1.00% per annum or (b) a Eurodollar rate for a one-month period plus 1.00% per annum. The Credit Facility has an annual commitment fee of 0.15% per annum of the available line of credit, which is paid quarterly. The Fund has agreed to pay its pro rata share of the annual commitment fee, based on the ratio of its individual net assets to the net assets of all participants at the time the fee is due and payable and the level of its access to the Credit Facility, and interest charged on any borrowing made by the Fund and other costs incurred by the Fund. Because several mutual funds participate in the Credit Facility, there is no assurance that the Fund will have access to all or any part of the $700,000,000 at any particular time.
18
There were no loans outstanding under the Credit Facility at December 31, 2016. During the period ended December 31, 2016, the Fund did not utilize the Credit Facility.
Note F—Recent Accounting Pronouncement:
In October 2016, the U.S. Securities and Exchange Commission ("SEC") adopted new rules and forms, and amendments to certain current rules and forms, to modernize reporting and disclosure of information by registered investment companies. The amendments to Regulation S-X will require standardized, enhanced disclosure about derivatives in investment company financial statements, and will also change the rules governing the form and content of such financial statements. The compliance date for the amendments to Regulation S-X is August 1, 2017. Management is currently evaluating the impact that the adoption of the amendments to Regulation S-X will have on the Fund's financial statements and related disclosures.
19
International Equity Portfolio
The following table includes selected data for a share outstanding throughout each year and other performance information derived from the Financial Statements. Amounts that do not round to $0.01 or $(0.01) per share are presented as $0.00 or $(0.00), respectively. Ratios that do not round to 0.01% or (0.01)% are presented as 0.00% or (0.00)%, respectively. A "—" indicates that the line item was not applicable in the corresponding period.
Class S | |
| | | Year Ended December 31, | |
| | | 2016 | | 2015 | | 2014 | | 2013 | | 2012 | |
Net Asset Value, Beginning of Year | | $ | 11.15 | | | $ | 11.12 | | | $ | 11.54 | | | $ | 9.93 | | | $ | 8.45 | | |
Income From Investment Operations: | |
| Net Investment Income (Loss)@ | | | 0.08 | | | | 0.07 | | | | 0.10 | | | | 0.09 | | | | 0.10 | | |
Net Gains or Losses on Securities
(both realized and unrealized) | | | (0.28 | ) | | | 0.10 | | | | (0.48 | ) | | | 1.67 | | | | 1.46 | | |
Total From Investment Operations | | | (0.20 | ) | | | 0.17 | | | | (0.38 | ) | | | 1.76 | | | | 1.56 | | |
Less Distributions From: | |
Net Investment Income | | | (0.07 | ) | | | (0.11 | ) | | | (0.04 | ) | | | (0.15 | ) | | | (0.08 | ) | |
Net Capital Gains | | | (0.06 | ) | | | (0.03 | ) | | | — | | | | — | | | | — | | |
Total Distributions | | | (0.13 | ) | | | (0.14 | ) | | | (0.04 | ) | | | (0.15 | ) | | | (0.08 | ) | |
Voluntary Contribution from Management | | | — | | | | — | | | | 0.00 | | | | — | | | | — | | |
Net Asset Value, End of Year | | $ | 10.82 | | | $ | 11.15 | | | $ | 11.12 | | | $ | 11.54 | | | $ | 9.93 | | |
| Total Return† | | | (1.82 | )% | | | 1.53 | %^ | | | (3.27 | )%µ | | | 17.83 | % | | | 18.48 | % | |
Ratios/Supplemental Data | |
Net Assets, End of Year (in millions) | | $ | 74.8 | | | $ | 76.5 | | | $ | 77.3 | | | $ | 22.0 | | | $ | 19.7 | | |
| Ratio of Gross Expenses to Average Net Assets# | | | 1.78 | % | | | 1.73 | % | | | 1.77 | % | | | 2.48 | % | | | 2.55 | % | |
Ratio of Net Expenses to Average Net Assets | | | 1.50 | % | | | 1.50 | % | | | 1.50 | % | | | 1.50 | % | | | 1.51 | %§ | |
Ratio of Net Investment Income (Loss) to Average
Net Assets | | | 0.76 | % | | | 0.61 | % | | | 0.90 | % | | | 0.88 | % | | | 1.11 | % | |
Portfolio Turnover Rate | | | 28 | % | | | 27 | % | | | 35 | % | | | 33 | % | | | 33 | % | |
See Notes to Financial Highlights
20
Notes to Financial Highlights International Equity Portfolio
† Total return based on per share NAV reflects the effects of changes in NAV on the performance of the Fund during each fiscal period. Returns assume income dividends and other distributions, if any, were reinvested. Results represent past performance and do not indicate future results. Current returns may be lower or higher than the performance data quoted. Investment returns and principal may fluctuate and shares when redeemed may be worth more or less than original cost. Total return would have been lower if Management had not reimbursed and/or waived certain expenses. The total return information shown does not reflect charges and other expenses that apply to the separate accounts or the related insurance policies or other qualified pension or retirement plans, and the inclusion of these charges and other expenses would reduce the total return for all fiscal periods shown.
^ The class action proceeds received in 2015 had no impact on the Fund's total return for the year ended December 31, 2015.
# Represents the annualized ratios of net expenses to average daily net assets if Management had not reimbursed certain expenses and/or waived a portion of the investment management fee.
@ Calculated based on the average number of shares outstanding during each fiscal period.
§ Prior to January 1, 2013, the Fund had an expense offset arrangement in connection with its custodian contract. The impact of expense reductions related to expense offset arrangements, if any, was less than 0.01%.
µ The voluntary contribution received in 2014 had no impact on the Fund's total return for the year ended December 31, 2014.
21
Report of Independent Registered Public Accounting Firm
To the Board of Trustees of
Neuberger Berman Advisers Management Trust and
Shareholders of International Equity Portfolio
We have audited the accompanying statement of assets and liabilities of International Equity Portfolio, one of the series constituting Neuberger Berman Advisers Management Trust (the "Trust"), including the schedule of investments, as of December 31, 2016, and the related statement of operations for the year then ended, the statements of changes in net assets for each of the two years in the period then ended and the financial highlights for each of the five years in the period then ended. These financial statements and financial highlights are the responsibility of the Trust's management. Our responsibility is to express an opinion on these financial statements and financial highlights based on our audits.
We conducted our audits in accordance with the standards of the Public Company Accounting Oversight Board (United States). Those standards require that we plan and perform the audit to obtain reasonable assurance about whether the financial statements and financial highlights are free of material misstatement. We were not engaged to perform an audit of the Trust's internal control over financial reporting. Our audits included consideration of internal control over financial reporting as a basis for designing audit procedures that are appropriate in the circumstances, but not for the purpose of expressing an opinion on the effectiveness of the Trust's internal control over financial reporting. Accordingly, we express no such opinion. An audit also includes examining, on a test basis, evidence supporting the amounts and disclosures in the financial statements and financial highlights, assessing the accounting principles used and significant estimates made by management, and evaluating the overall financial statement presentation. Our procedures included confirmation of securities owned as of December 31, 2016 by correspondence with the custodian and others or by other appropriate auditing procedures where replies from others were not received. We believe that our audits provide a reasonable basis for our opinion.
In our opinion, the financial statements and financial highlights referred to above present fairly, in all material respects, the financial position of International Equity Portfolio, a series of Neuberger Berman Advisers Management Trust, at December 31, 2016, the results of its operations for the year then ended, the changes in its net assets for each of the two years in the period then ended, and the financial highlights for each of the five years in the period then ended in conformity with U.S. generally accepted accounting principles.
Boston, Massachusetts
February 10, 2017
22
The following tables set forth information concerning the Trustees and Officers of the Fund. All persons named as Trustees and Officers also serve in similar capacities for other funds administered or managed by Management. The Fund's Statement of Additional Information includes additional information about the Trustees as of the time of the Fund's most recent public offering and is available upon request, without charge, by calling (800) 877-9700.
Information about the Board of Trustees
Name, (Year of Birth),
and Address(1) | | Position(s)
and Length
of Time
Served(2) | | Principal Occupation(s)(3) | | Number of
Funds in Fund
Complex
Overseen by
Fund Trustee | | Other Directorships
Held Outside Fund
Complex by Fund
Trustee(3) |
Independent Trustees |
Michael J. Cosgrove (1949) | | Trustee since 2015 | | President, Carragh Consulting USA, since 2014; formerly, Executive, General Electric Company, 1970 to 2014, including President, Mutual Funds and Global Investment Programs, GE Asset Management, 2011 to 2014, President and Chief Executive Officer, Mutual Funds and Intermediary Business, GE Asset Management, 2007 to 2011, President, Institutional Sales and Marketing, GE Asset Management, 1998 to 2007, and Chief Financial Officer, GE Asset Management, and Deputy Treasurer, GE Company, 1988 to 1993. | | 55 | | | Director, America Press, Inc. (not-for-profit Jesuit publisher), since 2015; Director, Fordham University, since 2001; formerly, Director, The Gabelli Go Anywhere Trust, June 2015 to June 2016; Director, Skin Cancer Foundation (not-for-profit), 2006 to 2015; Director, GE Investments Funds, Inc., 1997 to 2014; Trustee, GE Institutional Funds, 1997 to 2014; Director, GE Asset Management, 1988 to 2014; Director, Elfun Trusts, 1988 to 2014; Trustee, GE Pension & Benefit Plans, 1988 to 2014. |
Marc Gary (1952) | | Trustee since 2015 | | Executive Vice Chancellor and Chief Operating Officer, Jewish Theological Seminary, since 2012; formerly, Executive Vice President and General Counsel, Fidelity Investments, 2007 to 2012; Executive Vice President and General Counsel, BellSouth Corporation, 2004 to 2007; Vice President and Associate General Counsel, BellSouth Corporation, 2000 to 2004; Associate, Partner, and National Litigation Practice Co-Chair, Mayer, Brown LLP, 1981 to 2000; Associate Independent Counsel, Office of Independent Counsel, 1990 to 1992. | | 55 | | | Trustee, Jewish Theological Seminary, since 2015; Director, Counsel on Call (privately held for-profit company), since 2012; Director, Lawyers Committee for Civil Rights Under Law (not-for-profit), since 2005; formerly, Director, Equal Justice Works (not-for-profit), 2005 to 2014; Director, Corporate Counsel Institute, Georgetown University Law Center, 2007 to 2012; Director, Greater Boston Legal Services (not-for-profit), 2007 to 2012. |
23
Name, (Year of Birth),
and Address(1) | | Position(s)
and Length
of Time
Served(2) | | Principal Occupation(s)(3) | | Number of
Funds in Fund
Complex
Overseen by
Fund Trustee | | Other Directorships
Held Outside Fund
Complex by Fund
Trustee(3) |
Martha C. Goss (1949) | | Trustee since 2007 | | President, Woodhill Enterprises Inc./Chase Hollow Associates LLC (personal investment vehicle), since 2006; formerly, Consultant, Resources Global Professionals (temporary staffing), 2002 to 2006. | | 55 | | | Director, American Water (water utility), since 2003; Director, Allianz Life of New York (insurance), since 2005; Director, Berger Group Holdings, Inc. (engineering consulting firm), since 2013; Director, Financial Women's Association of New York (not-for-profit association), since 2003; Trustee Emerita, Brown University, since 1998; Director, Museum of American Finance (not-for-profit), since 2013; formerly, Non-Executive Chair and Director, Channel Reinsurance (financial guaranty reinsurance), 2006 to 2010; formerly, Director, Ocwen Financial Corporation (mortgage servicing), 2005 to 2010; formerly, Director, Claire's Stores, Inc. (retailer), 2005 to 2007; formerly, Director, Parsons Brinckerhoff Inc. (engineering consulting firm), 2007 to 2010; formerly, Director, Bank Leumi (commercial bank), 2005 to 2007; formerly, Advisory Board Member, Attensity (software developer), 2005 to 2007. |
Michael M. Knetter (1960) | | Trustee since 2007 | | President and Chief Executive Officer, University of Wisconsin Foundation, since October 2010; formerly, Dean, School of Business, University of Wisconsin - Madison; formerly, Professor of International Economics and Associate Dean, Amos Tuck School of Business - Dartmouth College, 1998 to 2002. | | 55 | | | Board Member, American Family Insurance (a mutual company, not publicly traded), since March 2009; formerly, Trustee, Northwestern Mutual Series Fund, Inc., 2007 to 2011; formerly, Director, Wausau Paper, 2005 to 2011; formerly, Director, Great Wolf Resorts, 2004 to 2009. |
24
Name, (Year of Birth),
and Address(1) | | Position(s)
and Length
of Time
Served(2) | | Principal Occupation(s)(3) | | Number of
Funds in Fund
Complex
Overseen by
Fund Trustee | | Other Directorships
Held Outside Fund
Complex by Fund
Trustee(3) |
Deborah C. McLean (1954) | | Trustee since 2015 | | Member, Circle Financial Group (private wealth management membership practice), since 2011; Managing Director, Golden Seeds LLC (an angel investing group), since 2009; Adjunct Professor, Columbia University School of International and Public Affairs, since 2008; formerly, Visiting Assistant Professor, Fairfield University, Dolan School of Business, Fall 2007; formerly, Adjunct Associate Professor of Finance, Richmond, The American International University in London, 1999 to 2007. | | 55 | | | Board member, Norwalk Community College Foundation, since 2014; Dean's Advisory Council, Radcliffe Institute for Advanced Study, since 2014; formerly, Director and Treasurer, At Home in Darien (not-for-profit), 2012 to 2014; Director, National Executive Service Corps (not-for-profit), 2012 to 2013; Trustee, Richmond, The American International University in London, 1999 to 2013. |
George W. Morriss (1947) | | Trustee since 2007 | | Adjunct Professor, Columbia University School of International and Public Affairs, since October 2012; formerly, Executive Vice President and Chief Financial Officer, People's United Bank, Connecticut (a financial services company), 1991 to 2001. | | 55 | | | Director, National Association of Corporate Directors, Connecticut Chapter, since 2011; Trustee, Steben Alternative Investment Funds, Steben Select Multi-Strategy Fund, and Steben Select Multi-Strategy Master Fund, since 2013; formerly, Treasurer, National Association of Corporate Directors, Connecticut Chapter, 2011 to 2015; formerly, Manager, Larch Lane Multi-Strategy Fund complex (which consisted of three funds), 2006 to 2011; formerly, Member, NASDAQ Issuers' Affairs Committee, 1995 to 2003. |
25
Name, (Year of Birth),
and Address(1) | | Position(s)
and Length
of Time
Served(2) | | Principal Occupation(s)(3) | | Number of
Funds in Fund
Complex
Overseen by
Fund Trustee | | Other Directorships
Held Outside Fund
Complex by Fund
Trustee(3) |
Tom D. Seip (1950) | | Trustee since 2000; Chairman of the Board since 2008; formerly Lead Independent Trustee from 2006 to 2008 | | General Partner, Ridgefield Farm LLC (a private investment vehicle); formerly, President and CEO, Westaff, Inc. (temporary staffing), May 2001 to January 2002; formerly, Senior Executive, The Charles Schwab Corporation, 1983 to 1998, including Chief Executive Officer, Charles Schwab Investment Management, Inc.; Trustee, Schwab Family of Funds and Schwab Investments, 1997 to 1998; and Executive Vice President - Retail Brokerage, Charles Schwab & Co., Inc., 1994 to 1997. | | 55 | | | Director, H&R Block, Inc. (financial services company), since May 2001; Chairman, Governance and Nominating Committee, H&R Block, Inc., since 2011; formerly, Chairman, Compensation Committee, H&R Block, Inc., 2006 to 2010; formerly, Director, Forward Management, Inc. (asset management company), 1999 to 2006. |
James G. Stavridis (1955) | | Trustee since 2015 | | Dean, Fletcher School of Law and Diplomacy, Tufts University since 2013; formerly, Admiral, United States Navy, 2006 to 2013, including Supreme Allied Commander, NATO and Commander, European Command, 2009 to 2013, and Commander, United States Southern Command, 2006 to 2009. | | 55 | | | Director, Utilidata Inc., since 2015; Director, BMC Software Federal, LLC, since 2014; Director, Vertical Knowledge, LLC, since 2013; formerly, Director, Navy Federal Credit Union, 2000-2002. |
26
Name, (Year of Birth),
and Address(1) | | Position(s)
and Length
of Time
Served(2) | | Principal Occupation(s)(3) | | Number of
Funds in Fund
Complex
Overseen by
Fund Trustee | | Other Directorships
Held Outside Fund
Complex by Fund
Trustee(3) |
Candace L. Straight (1947) | | Trustee since 1999 | | Private investor and consultant specializing in the insurance industry; formerly, Advisory Director, Securitas Capital LLC (a global private equity investment firm dedicated to making investments in the insurance sector), 1998 to 2003. | | 55 | | | Formerly, Public Member, Board of Governors and Board of Trustees, Rutgers University, 2011 to 2016; formerly, Director, Montpelier Re Holdings Ltd. (reinsurance company), 2006 to 2015; formerly, Director, National Atlantic Holdings Corporation (property and casualty insurance company), 2004 to 2008; formerly, Director, The Proformance Insurance Company (property and casualty insurance company), 2004 to 2008; formerly, Director, Providence Washington Insurance Company (property and casualty insurance company), 1998 to 2006; formerly, Director, Summit Global Partners (insurance brokerage firm), 2000 to 2005. |
Peter P. Trapp (1944) | | Trustee since 1984 | | Retired; formerly, Regional Manager for Mid-Southern Region, Ford Motor Credit Company, September 1997 to 2007; formerly, President, Ford Life Insurance Company, April 1995 to August 1997. | | 55 | | | None. |
27
Name, (Year of Birth),
and Address(1) | | Position(s)
and Length
of Time
Served(2) | | Principal Occupation(s)(3) | | Number of
Funds in Fund
Complex
Overseen by
Fund Trustee | | Other Directorships
Held Outside Fund
Complex by Fund
Trustee(3) |
Trustees who are "Interested Persons" |
Joseph V. Amato* (1962) | | Trustee since 2009 | | President and Director, Neuberger Berman Group LLC, since 2009; President and Chief Executive Officer, Neuberger Berman BD LLC ("Neuberger Berman") and Neuberger Berman Holdings LLC (including its predecessor, Neuberger Berman Inc.), since 2007; Chief Investment Officer (Equities) and President (Equities), Neuberger Berman Investment Advisers LLC ("NBIA") (formerly, Neuberger Berman Fixed Income LLC ("NBFI") and including predecessor entities), since 2007, and Board Member of NBIA since 2006; formerly, Global Head of Asset Management of Lehman Brothers Holdings Inc.'s ("LBHI") Investment Management Division, 2006 to 2009; formerly, member of LBHI's Investment Management Division's Executive Management Committee, 2006 to 2009; formerly, Managing Director, Lehman Brothers Inc. ("LBI"), 2006 to 2008; formerly, Chief Recruiting and Development Officer, LBI, 2005 to 2006; formerly, Global Head of LBI's Equity Sales and a Member of its Equities Division Executive Committee, 2003 to 2005. | | 55 | | | Member of Board of Advisors, McDonough School of Business, Georgetown University, since 2001; Member of New York City Board of Advisors, Teach for America, since 2005; Trustee, Montclair Kimberley Academy (private school), since 2007; Member of Board of Regents, Georgetown University, since 2013. |
28
Name, (Year of Birth),
and Address(1) | | Position(s)
and Length
of Time
Served(2) | | Principal Occupation(s)(3) | | Number of
Funds in Fund
Complex
Overseen by
Fund Trustee | | Other Directorships
Held Outside Fund
Complex by Fund
Trustee(3) |
Robert Conti* (1956) | | Chief Executive Officer, President and Trustee since 2008; prior thereto, Executive Vice President in 2008 and Vice President from 2000 to 2008 | | Managing Director, Neuberger Berman, since 2007; President - Mutual Funds, NBIA, since 2008; formerly, Senior Vice President, Neuberger Berman, 2003 to 2006; formerly, Vice President, Neuberger Berman, 1999 to 2003; President and Chief Executive Officer, twenty-eight registered investment companies for which NBIA acts as investment manager and/or administrator. | | 55 | | | Director, Staten Island Mental Health Society, since 1994; formerly, Chairman of the Board, Staten Island Mental Health Society, 2008 to 2011. |
(1) The business address of each listed person is 1290 Avenue of the Americas, New York, NY 10104.
(2) Pursuant to the Trust's Trust Instrument, each of these Trustees shall hold office for life or until his or her successor is elected or the Trust terminates; except that (a) any Trustee may resign by delivering a written resignation; (b) any Trustee may be removed with or without cause at any time by a written instrument signed by at least two-thirds of the other Trustees; (c) any Trustee who requests to be retired, or who has become unable to serve, may be retired by a written instrument signed by a majority of the other Trustees; and (d) any Trustee may be removed at any shareholder meeting by a vote of at least two-thirds of the outstanding shares.
(3) Except as otherwise indicated, each individual has held the positions shown during at least the last five years.
* Indicates a Trustee who is an "interested person" within the meaning of the 1940 Act. Mr. Amato and Mr. Conti are interested persons of the Trust by virtue of the fact that each is an officer of Management, Neuberger Berman and/or their affiliates.
29
Information about the Officers of the Trust
Name, (Year of Birth),
and Address(1) | | Position(s)
and Length
of Time
Served(2) | | Principal Occupation(s)(3) |
Claudia A. Brandon (1956) | | Executive Vice President since 2008 and Secretary since 1985 | | Senior Vice President, Neuberger Berman, since 2007 and Employee since 1999; Senior Vice President, NBIA, since 2008 and Assistant Secretary since 2004; formerly, Vice President, Neuberger Berman, 2002 to 2006; formerly, Vice President - Mutual Fund Board Relations, NBIA, 2000 to 2008; formerly, Vice President, NBIA, 1986 to 1999 and Employee, 1984 to 1999; Executive Vice President, twenty-eight registered investment companies for which NBIA acts as investment manager and/or administrator; Secretary, fifteen registered investment companies for which NBIA acts as investment manager and/or administrator . |
Agnes Diaz (1971) | | Vice President since 2013 | | Senior Vice President, Neuberger Berman, since 2012; Senior Vice President, NBIA, since 2012 and Employee since 1996; formerly, Vice President, Neuberger Berman, 2007 to 2012; Vice President, twenty-eight registered investment companies for which NBIA acts as investment manager and/or administrator. |
Anthony DiBernardo (1979) | | Assistant Treasurer since 2011 | | Senior Vice President, NBIA, since 2014, and Employee since 2003; formerly, Vice President, Neuberger Berman, 2009 to 2014; Assistant Treasurer, ten registered investment companies for which NBIA acts as investment manager and/or administrator. |
Corey A. Issing (1978) | | Chief Legal Officer since 2016 (only for purposes of sections 307 and 406 of the Sarbanes-Oxley Act of 2002) and Anti-Money Laundering Compliance Officer since 2016 | | General Counsel and Head of Compliance - Mutual Funds since 2016 and Senior Vice President, NBIA, since 2013, formerly, Associate General Counsel (2015 to 2016), Counsel (2007 to 2015), Vice President (2009 - 2013); Chief Legal Officer (only for purposes of sections 307 and 406 of the Sarbanes-Oxley Act of 2002), twenty-eight registered investment companies for which NBIA acts as investment manager and/or administrator; Anti-Money Laundering Compliance Officer, twenty-eight registered investment companies for which NBIA acts as investment manager and/or administrator. |
Sheila R. James (1965) | | Assistant Secretary since 2002 | | Vice President, Neuberger Berman, since 2008 and Employee since 1999; Vice President, NBIA, since 2008; formerly, Assistant Vice President, Neuberger Berman, 2007; Employee, NBIA, 1991 to 1999; Assistant Secretary, twenty-eight registered investment companies for which NBIA acts as investment manager and/or administrator. |
30
Name, (Year of Birth),
and Address(1) | | Position(s)
and Length
of Time
Served(2) | | Principal Occupation(s)(3) |
Brian Kerrane (1969) | | Chief Operating Officer since 2015 and Vice President since 2008 | | Managing Director, Neuberger Berman, since 2013; Chief Operating Officer - Mutual Funds and Managing Director, NBIA, since 2015 and Employee since 1991; formerly, Senior Vice President, Neuberger Berman, 2006 to 2014; Vice President, NBIA, 2008 to 2015; Chief Operating Officer, ten registered investment companies for which NBIA acts as investment manager and/or administrator; Vice President, twenty-eight registered investment companies for which NBIA acts as investment manager and/or administrator. |
Kevin Lyons (1955) | | Assistant Secretary since 2003 | | Assistant Vice President, Neuberger Berman, since 2008 and Employee since 1999; Assistant Vice President, NBIA, since 2008; formerly, Employee, NBIA, 1993 to 1999; Assistant Secretary, ten registered investment companies for which NBIA acts as investment manager and/or administrator. |
Anthony Maltese (1959) | | Vice President since 2015 | | Senior Vice President, Neuberger Berman, since 2014 and Employee since 2000; Senior Vice President, NBIA, since 2014; Vice President, ten registered investment companies for which NBIA acts as investment manager and/or administrator. |
Owen F. McEntee, Jr. (1961) | | Vice President since 2008 | | Vice President, Neuberger Berman, since 2006; Vice President, NBIA, since 2006 and Employee since 1992; Vice President, ten registered investment companies for which NBIA acts as investment manager and/or administrator. |
John M. McGovern (1970) | | Treasurer and Principal Financial and Accounting Officer since 2005 | | Senior Vice President, Neuberger Berman, since 2007; Senior Vice President, NBIA, since 2007 and Employee since 1993; formerly, Vice President, Neuberger Berman, 2004 to 2006; formerly, Assistant Treasurer, 2002 to 2005; Treasurer and Principal Financial and Accounting Officer, twenty-eight registered investment companies for which NBIA acts as investment manager and/or administrator. |
Frank Rosato (1971) | | Assistant Treasurer since 2005 | | Vice President, Neuberger Berman, since 2006; Vice President, NBIA, since 2006 and Employee since 1995; Assistant Treasurer, ten registered investment companies for which NBIA acts as investment manager and/or administrator. |
Chamaine Williams (1971) | | Chief Compliance Officer since 2005 | | Chief Compliance Officer - Mutual Funds and Senior Vice President, NBIA, since 2006; formerly, Senior Vice President, LBI, 2007 to 2008; formerly, Vice President, LBI, 2003 to 2006; formerly, Chief Compliance Officer, Lehman Brothers Asset Management Inc., 2003 to 2007; formerly, Chief Compliance Officer, Lehman Brothers Alternative Investment Management LLC, 2003 to 2007; Chief Compliance Officer, fifteen registered investment companies for which NBIA acts as investment manager and/or administrator. |
(1) The business address of each listed person is 1290 Avenue of the Americas, New York, NY 10104.
(2) Pursuant to the By-Laws of the Trust, each officer elected by the Trustees shall hold office until his or her successor shall have been elected and qualified or until his or her earlier death, inability to serve, or resignation. Officers serve at the pleasure of the Trustees and may be removed at any time with or without cause.
(3) Except as otherwise indicated, each individual has held the positions shown during at least the last five years
31
Proxy Voting Policies and Procedures
A description of the policies and procedures that the Trust uses to determine how to vote proxies relating to portfolio securities is available, without charge, by calling 800-877-9700 (toll-free) and on the Securities and Exchange Commission's website at www.sec.gov. Information regarding how the Trust voted proxies relating to portfolio securities during the most recent 12-month period ended June 30 is also available upon request, without charge, by calling 800-877-9700 (toll-free), on the Securities and Exchange Commission's website at www.sec.gov, and on Management's website at www.nb.com.
Quarterly Portfolio Schedule
The Trust files a complete schedule of portfolio holdings for the Fund with the Securities and Exchange Commission for the first and third quarters of each fiscal year on Form N-Q. The Trust's Forms N-Q are available on the Securities and Exchange Commission's website at www.sec.gov and may be reviewed and copied at the Securities and Exchange Commission's Public Reference Room in Washington, DC. Information on the operation of the Public Reference Room may be obtained by calling 800-SEC-0330. The information on Form N-Q is available upon request, without charge, by calling 800-877-9700 (toll free).
Board Consideration of the Management Agreement
On an annual basis, the Board of Trustees (the "Board") of Neuberger Berman Advisers Management Trust (the "Trust"), including the Trustees who are not "interested persons" of Neuberger Berman Investment Advisers LLC ("Management") (including its affiliates) or the Trust ("Independent Fund Trustees"), considers whether to continue the management agreement with Management (the "Agreement") for International Equity Portfolio (the "Fund"). Throughout the process, the Independent Fund Trustees are advised by counsel that is experienced in Investment Company Act of 1940 matters and that is independent of Management ("Independent Counsel"). At a meeting held on October 18, 2016, the Board, including the Independent Fund Trustees, approved the continuation of the Agreement for the Fund.
In evaluating the Agreement, the Board, including the Independent Fund Trustees, reviewed extensive materials provided by Management in response to questions submitted by the Independent Fund Trustees and Independent Counsel, and met with senior representatives of Management regarding its personnel, operations and financial condition as they relate to the Fund. The annual contract review extends over at least two regular meetings of the Board to ensure that Management has time to respond to any questions the Independent Fund Trustees may have on their initial review of the materials and that the Independent Fund Trustees have time to consider those responses.
In connection with its deliberations, the Board also considered the broad range of information relevant to the annual contract review that is provided to the Board (including its various standing committees) at meetings throughout the year, including investment performance reports and related portfolio information for the Fund, as well as periodic reports on, among other matters, pricing and valuation; brokerage and execution; compliance; and shareholder and other services provided by Management and its affiliates. To assist the Board in its deliberations regarding the annual contract review, the Board has established a Contract Review Committee comprised of Independent Fund Trustees. The Board has also established other committees that focus throughout the year on specific areas relevant to the annual contract review, such as Fund performance or compliance matters, and that are charged with specific responsibilities regarding the annual contract review. Those committees provide reports that feed into the Contract Review Committee, which reviews and takes account of the information.
The Independent Fund Trustees received from Independent Counsel a memorandum discussing the legal standards for their consideration of the proposed continuation of the Agreement. During the course of the year and during their deliberations regarding the annual contract review, the Contract Review Committee and the Independent Fund Trustees met with Independent Counsel separately from representatives of Management.
32
In connection with its approval of the continuation of the Agreement, the Board evaluated the terms of the Agreement, the overall fairness of the Agreement to the Fund and whether the Agreement was in the best interests of the Fund and its shareholders. The Board considered all factors it deemed relevant with respect to the Fund, including the following factors: (1) the nature, extent, and quality of the services provided by Management; (2) the investment performance of the Fund compared to an appropriate market index and a peer group of investment companies; (3) the costs of the services provided and the profit or loss realized by Management and its affiliates from their relationship with the Fund; (4) the extent to which economies of scale have been or might be realized as the Fund grows; and (5) whether fee levels reflect any such potential economies of scale for the benefit of the Fund's shareholders. The Board's determination to approve the continuation of the Agreement was based on a comprehensive consideration of all information provided to the Board throughout the year and specifically in connection with the annual contract review. The Board members did not identify any particular information or factor that was all-important or controlling, and each Trustee may have attributed different weights to the various factors. The Board focused on the overall costs and benefits of the Agreement to the Fund and, through the Fund, its shareholders.
With respect to the nature, extent and quality of the services provided, the Board considered the investment philosophy and decision-making processes of Management, and the qualifications, experience, and capabilities of, and the resources available to, the portfolio management personnel of Management who perform services for the Fund. The Board noted that Management also provides certain administrative services, including fund accounting and compliance services. The Board also considered Management's policies and practices regarding brokerage and allocation of portfolio transactions and reviewed the quality of the execution services that Management had provided. The Board also reviewed whether Management used brokers to execute Fund transactions that provide research and other services to Management and the types of benefits potentially derived from such services by Management, the Fund and other clients of Management. The Board also considered that Management's responsibilities include daily management of investment, operational, enterprise, legal, regulatory and compliance risks as they relate to the Fund, and considered information regarding Management's processes for managing risk. In addition, the Board noted the positive compliance history of Management, as no significant compliance problems were reported to the Board with respect to either firm. The Board also considered the general structure of the portfolio manager compensation program and whether this structure provides appropriate incentives to act in the best interests of the Fund.
As in past years, the Board also considered the manner in which Management addressed various non-routine matters that arose during the year, some of them a result of developments in the broader fund industry or the regulations governing it. In addition, the Board considered actions taken by Management in response to recent market conditions, such as regulatory concerns about current trading issues, market liquidity and potential volatility, and considered the overall performance of Management in this context.
The Board factored into its evaluation of the Fund's fees and performance a consideration of the limitations inherent in the methodology for constructing peer groups and determining which investment companies should be included in the peer groups. The Board considered a peer group composed of two types of funds: proprietary funds that are operated by insurance companies or their affiliates, and non-proprietary funds, such as the Fund, operated for insurance company investors by independent investment managers.
With respect to investment performance, the Board considered information regarding the Fund's short, intermediate and long-term performance both on an absolute basis and relative to an appropriate benchmark index and the average performance of a composite peer group (as constructed by an independent organization) of investment companies pursuing broadly similar strategies. The Board also reviewed performance in relation to certain measures of the degree of investment risk undertaken by the portfolio manager. The Board considered that as compared to its peer group, the Fund's performance was higher than the median for the 1, 3 and 5-year periods, but lower than the median for the 10-year period. The Board also considered that the Fund's performance was higher than its benchmark for the 1, 3 and 5-year periods, but lower for the 10-year period.
With respect to the overall fairness of the Agreement, the Board considered the fee structure for the Fund under the Agreement as compared to the peer group. The Board also considered any fall-out (i.e. indirect) benefits likely to accrue to Management or its affiliates from their relationship with the Fund. The Board also considered the profitability of
33
Management and its affiliates from their association with the Fund, and year-over-year changes in each of Management's reported expense categories.
The Board reviewed a comparison of the Fund's management fee and total expense ratio to the peer group and was aware that non-proprietary insurance product funds generally have higher fee structures than proprietary funds. The Board noted that the comparative management fee analysis includes, in the Fund's management fee, the separate administrative fee paid to Management, but it was not clear whether this was the case for all funds in the peer group. The Board compared the Fund's contractual and actual management fees to the mean and median of the contractual and actual management fees, respectively, of the Fund's peer group. (The actual management fees are the contractual management fees reduced by any fee waivers or other adjustments.) In addition, the Board considered the contractual limit on expenses of the Fund. The Board noted that the overall expense ratio of the Fund's S Class is maintained through expense reimbursements by Management that exceed the fees that Management receives from the Fund.
The Board considered that, for the Fund's S Class shares, as compared to its peer group, the Fund's contractual management fee and the actual management fee net of fees waived by Management were both higher than the respective medians. The Board considered whether specific portfolio management, administration or oversight needs contributed to the management fee. The Board also noted that the Fund's size, which impacts its expenses and performance, has been affected by ongoing changes in the insurance market.
The Board also considered whether there were other funds or separate accounts that were advised by Management or its affiliates with investment objectives, policies and strategies that were similar to those of the Fund. The Board compared the fees charged to the Fund to the fees charged to such funds and/or separate accounts. The Board considered the appropriateness and reasonableness of any differences between the fees charged to the Fund and such funds and/or separate accounts, including any breakpoints, and determined that differences in fees and fee structures were consistent with the management and other services provided.
The Board also evaluated any apparent or anticipated economies of scale in relation to the services Management provides to the Fund. The Board considered whether the Fund's fee structure provides for a reduction of payments resulting from the use of breakpoints and whether those breakpoints are set at appropriate asset levels. As in past years, the Board gave careful thought to the size of any breakpoints in the Fund's advisory fees and the asset levels at which they are set. It also considered whether the fees were set at an appropriate level and compared the fee structures to that of the peer group. The Board also considered that Management has provided, at no added cost to the Fund, certain additional services that were required by new regulations or regulatory interpretations, impelled by changes in the securities markets or the business landscape, and/or requested by the Board. In concluding that the benefits accruing to Management and its affiliates by virtue of their relationship with the Fund were reasonable in light of the costs of providing the investment advisory and other services and the benefits accruing to the Fund, the Board reviewed specific data as to Management's profitability on the Fund for a recent period. The Board also considered Management's cost allocation methodology. The Board recognized that Management should be entitled to earn a reasonable level of profits for services they provide to the Fund and, based on its review, concluded that Management's reported level of profitability on the Fund was reasonable.
Conclusions
In approving the continuation of the Agreement, the Board concluded that the terms of the Agreement are fair and reasonable to the Fund and that approval of the continuation of the Agreement is in the best interests of the Fund and its shareholders. In reaching this determination, the Board considered that Management could be expected to provide a high level of service to the Fund; that the performance of the Fund was satisfactory over time; that the Fund's fee structure appeared to the Board to be reasonable given the nature, extent and quality of services provided; and that the benefits accruing to Management and its affiliates by virtue of their relationship with the Fund were reasonable in light of the costs of providing the investment advisory and other services and the benefits accruing to the Fund. The Board's conclusions may be based in part on its consideration of materials prepared in connection with the approval or continuance of the Agreement in prior years and on the Board's ongoing regular review of Fund performance and operations throughout the year, in addition to material prepared specifically for the most recent annual review of the Agreement.
34
Notice to Shareholders
The Fund has elected to pass through to its shareholders the credits for taxes paid to foreign countries. For the fiscal year ended December 31, 2016, the Fund designates $119,452, or $0.02 per share outstanding, foreign taxes paid and $1,818,048, or $0.27 per share outstanding, foreign source income earned for Federal income tax purposes.
The Fund designates $392,634 as a capital gain distribution.
35
Neuberger Berman
Advisers Management Trust
Large Cap Value Portfolio
I Class Shares
Annual Report
December 31, 2016
Large Cap Value Portfolio Commentary (Unaudited)
The Neuberger Berman Advisers Management Trust Large Cap Value Portfolio Class I posted a positive total return of 27.37% for the 12 month period ended December 31, 2016 and outperformed its benchmark, the Russell 1000® Value Index (the Index), which returned 17.34% for the same period.
The reporting period began with equities plummeting in response to heightened concerns about macroeconomic weakness in China and the possibility of rising interest rates in the U.S. Falling oil prices and a strengthening U.S. dollar further weighed on stocks. Another drop in equities came towards the middle of the year in response to the Brexit vote. Yet the decline was brief as the U.S. Federal Reserve and the European Union intervened and the domestic economy showed some improvement. However, anxiety about the U.S. election and rising interest rates began to challenge the market once again. Yet equities rebounded and gained momentum after the election, as investors began to anticipate a Trump presidency with increased fiscal spending, lower taxes and an easing of regulations. Oil prices also soared after OPEC and other major oil producers came to an agreement to cut output.
Within the Index, the Materials and Industrials sectors were among the strongest areas of return. Energy, boosted by an oil price recovery, was also one of the highest returning segments. Health Care was the weakest sector, dragged down by legal issues, while Consumer Staples and Consumer Discretionary also lagged.
Within the Fund, the Materials sector contributed the most to performance versus the benchmark for the year, owing largely to gold producer Newmont Mining. Much of the stock's rise came in the first half of the year when gold prices appreciated as investors sought a safe haven from global macroeconomic uncertainty. Industrials also added to relative results due in large part to strength in our Machinery investments, which we believe are positioned to benefit if President Trump ramps up infrastructure spending as he has promised. Our heavier allocation to Financials compared to the benchmark, one of the strongest segments of the market, further lifted relative performance for the year.
Conversely, Consumer Discretionary detracted from relative performance due to our overweight allocation and weaker stock returns. The biggest loss came from the Auto Components industry where we exited out of all of our positions. We also owned an apparel retailer that fell in value due to company-specific doubts about management execution as well as more general concerns about a possible import tariff in the future. We also lost ground in the Utilities segment, where our holdings underperformed their Index counterparts, as well as in Telecommunication Services where we initiated positions in certain companies during the year, losing out on some prior stock gains.
We believe the stock market could remain on an upward trajectory fueled by an improving domestic economy, recovering oil prices and a revival in fiscal spending. Yet we remain keenly aware of potential risks, as equity valuations have risen markedly while corporate earnings growth has been pressured by the strong U.S. dollar. In addition, we believe any disappointment in expected policy changes could throw the market off course. Lastly, while we remain optimistic about oil over the long term, in the short term we could see further volatility. We continue to evaluate all market dislocations for investment opportunities. Our portfolio construction strategy entails seeking out underappreciated stocks with hidden value that can be realized if specific catalysts play out as we expect over time, and we believe that this approach is fundamental to generating favorable returns over the long term.
Sincerely,
Eli M. Salzmann
Portfolio Manager
Information about principal risks of investing in the Fund is set forth in the prospectus and statement of additional information.
The portfolio composition, industries and holdings of the Fund are subject to change without notice.
The opinions expressed are those of the Fund's portfolio manager. The opinions are as of the date of this report, and are subject to change without notice.
1
Large Cap Value Portfolio (Unaudited)
SECTOR ALLOCATION
(as a % of Total Investments*) | |
Consumer Discretionary | | | 10.4 | % | |
Consumer Staples | | | 4.5 | | |
Energy | | | 10.6 | | |
Financials | | | 33.1 | | |
Health Care | | | 5.4 | | |
Industrials | | | 13.1 | | |
Information Technology | | | 3.5 | | |
Materials | | | 7.3 | | |
Telecommunication Services | | | 2.6 | | |
Utilities | | | 1.7 | | |
Short-Term Investment | | | 7.8 | | |
Total | | | 100.0 | % | |
* Derivatives, if any, are excluded from this chart.
PERFORMANCE HIGHLIGHTS
| | Inception | | Average Annual Total Return
Ended 12/31/2016 | |
| | Date | | 1 Year | | 5 Years | | 10 Years | | Life of Fund | |
Large Cap Value
Portolio Class I | | |
03/22/1994 | | | | 27.37 | % | | | 13.54 | % | | | 4.62 | % | | | 8.41 | % | |
Russell 1000®
Value Index1,2 | | | | | | | 17.34 | % | | | 14.80 | % | | | 5.72 | % | | | 9.58 | % | |
The performance data quoted represent past performance and do not indicate future results. Current performance may be lower or higher than the performance data quoted. For performance data current to the most recent month-end, please visit http://www.nb.com/amtportfolios/performance.
The results shown in the table reflect the reinvestment of income dividends and other distributions, if any. The results do not reflect the effect of taxes a shareholder would pay on Fund distributions or on the redemption of Fund shares. The results do not reflect fees and expenses of the variable annuity and variable life insurance policies or the qualified pension and retirement plans whose proceeds are invested in the Fund.
The investment return and principal value of an investment will fluctuate and shares, when redeemed, may be worth more or less than their original cost.
Returns would have been lower if Neuberger Berman Investment Advisers LLC ("Management") had not reimbursed certain expenses and/or waived a portion of the investment management fees during certain of the periods shown. Repayment by a class (of expenses previously reimbursed and/or fees previously waived by Management) will decrease the class's returns. Please see Note B in the Notes to Financial Statements for specific information regarding expense reimbursement and/or fee waiver arrangements.
As stated in the Fund's most recent prospectus, the total annual operating expense ratio for fiscal year 2015 was 1.14% for Class I shares (before expense reimbursements and/or fee waivers, if any). The expense ratios for the annual period ended December 31, 2016 can be found in the Financial Highlights section of this report.
COMPARISON OF A $10,000 INVESTMENT
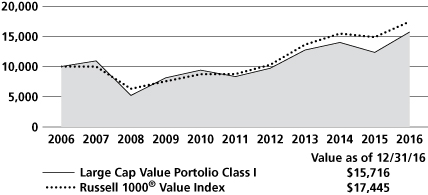
This graph shows the change in value of a hypothetical $10,000 investment in the Fund over the past 10 fiscal years, or since the Fund's inception, if it has not operated for 10 years. The result is compared with benchmarks, which include a broad-based market index and may include a more narrowly based index. Market indices have not been reduced to reflect any of the fees and costs of investing. The results shown in the graph reflect the reinvestment of income dividends and other distributions, if any. The results do not reflect the effect of taxes a shareholder would pay on Fund distributions or on the redemption of Fund shares. The results do not reflect fees and expenses of the variable annuity and variable life insurance policies or the qualified pension and retirement plans whose proceeds are invested in the Fund. Results represent past performance and do not indicate future results.
Please see Endnotes for additional information.
2
1 The date used to calculate Life of Fund performance for the index is March 22, 1994, the Fund's commencement of operations.
2 The Russell 1000® Value Index is a float-adjusted market capitalization-weighted index that measures the performance of the large-cap value segment of the U.S. equity market. It includes those Russell 1000 Index® companies with lower price-to-book ratios and lower forecasted growth rates. The index is rebalanced annually in June. The Russell 1000 Index is a float-adjusted market capitalization-weighted index that measures the performance of the large-cap segment of the U.S. equity market, and includes approximately 1,000 of the largest securities in the Russell 3000® Index (which measures the performance of the 3,000 largest U.S. public companies based on total market capitalization). The index is rebalanced annually in June. Please note that the indices described in this report do not take into account any fees, expenses or tax consequences of investing in the individual securities that they track, and that individuals cannot invest directly in any index. Data about the performance of an index are prepared or obtained by Neuberger Berman Investment Advisers LLC* ("Management") and reflect the reinvestment of income dividends and other distributions, if any. The Fund may invest in securities not included in a described index and generally does not invest in all securities included in a described index.
* On January 1, 2016, Neuberger Berman Management LLC ("NBM") transferred to Neuberger Berman Fixed Income LLC ("NBFI") their rights and obligations pertaining to all services they provided to any Fund under any investment management, investment sub-advisory, and/or administration agreement, as applicable (the "Agreements"). Following such transfer, NBFI was renamed Neuberger Berman Investment Advisers LLC ("NBIA" or "Management"). Following the consolidation, the investment professionals of NBM who provided services to any Fund under the Agreements continue to provide the same services, except that they provide those services in their new capacities as investment professionals of NBIA. Further, the consolidation did not result in any change in the investment processes employed by any Fund, the nature or level of services provided to any Fund, or the fees any Fund pays under its Agreements.
On July 1, 2016, NBM was reorganized into "Neuberger Berman" (the "Reorganization"). Upon the completion of the Reorganization, Neuberger Berman assumed all rights and obligations pertaining to all services NBM provided to any Fund under any distribution agreement or distribution and services agreement (the "Agreements") or plan adopted pursuant to Rule 12b-1 under the Investment Company Act of 1940, as amended, (the "Plans"). Accordingly, after the Reorganization, Neuberger Berman became each Fund's distributor and the services previously provided by NBM under the Agreements and Plans are provided by Neuberger Berman.
Following the Reorganization, the employees of NBM provide the same services to each Fund under the Agreements and Plans, except that they provide those services in their capacities as employees of Neuberger Berman. Further, the Reorganization did not result in any change in the nature or level of services provided to each Fund, or the fees, if any, each Fund pays under the Agreements or the Plans.
Please note, effective July 1, 2016, Neuberger Berman Management LLC was reorganized with and into Neuberger Berman LLC, a registered broker-dealer, Member FINRA and the Fund's distributor, which changed its name to Neuberger Berman BD LLC on January 1, 2017.
The investments for the Fund are managed by the same portfolio manager(s) who manage(s) one or more other registered funds that have names, investment objectives and investment styles that are similar to those of the Fund. You should be aware that the Fund is likely to differ from those other mutual fund(s) in size, cash flow pattern and tax matters. Accordingly, the holdings and performance of the Fund can be expected to vary from those of the other mutual fund(s).
Shares of the separate Neuberger Berman Advisers Management Trust Portfolios, including the Fund, are not available to the general public. Shares of the Fund may be purchased only by life insurance companies to be held in their separate accounts, which fund variable annuity and variable life insurance policies, and by qualified pension and retirement plans.
Statistics and projections in this report are derived from sources deemed to be reliable but cannot be regarded as a representation of future results of the Fund. This report is prepared for the general information of shareholders and is not an offer of shares of the Fund. Shares are sold only through the currently effective prospectus, which must precede or accompany this report.
The "Neuberger Berman" name and logo and "Neuberger Berman Investment Advisers LLC" name are registered service marks of Neuberger Berman Group LLC. The individual Fund names in this piece are either service marks or registered service marks of Neuberger Berman Investment Advisers LLC, an affiliate of Neuberger Berman BD LLC, distributor, member FINRA.
© 2017 Neuberger Berman BD LLC, distributor. All rights reserved.
3
Information About Your Fund's Expenses (Unaudited)
As a Fund shareholder, you incur two types of costs: (1) transaction costs such as fees and expenses that are, or may be, imposed under your variable contract or qualified pension plan; and (2) ongoing costs, including management fees, distribution and/or service (12b-1) fees (if applicable), and other Fund expenses. This example is intended to help you understand your ongoing costs (in U.S. dollars) of investing in the Fund and compare these costs with the ongoing costs of investing in other mutual funds.
This table is designed to provide information regarding costs related to your investments. The following examples are based on an investment of $1,000 made at the beginning of the six month period ended December 31, 2016 and held for the entire period. The table illustrates the Fund's costs in two ways:
Actual Expenses and Performance: | | The first section of the table provides information about actual account values and actual expenses in dollars, based on the Fund's actual performance during the period indicated. You may use the information in this line, together with the amount you invested, to estimate the expenses you paid over the period. Simply divide your account value by $1,000 (for example, an $8,600 account value divided by $1,000 = 8.6), then multiply the result by the number in the first section of the table under the heading entitled "Expenses Paid During the Period" to estimate the expenses you paid over the period. | |
Hypothetical Example for
Comparison Purposes: | | The second section of the table provides information about hypothetical account values and hypothetical expenses based on the Fund's actual expense ratio and an assumed rate of return at 5% per year before expenses. This return is not the Fund's actual return. The hypothetical account values and expenses may not be used to estimate the actual ending account balance or expenses you paid for the period. You may use this information to compare the ongoing costs of investing in this Fund versus other funds. To do so, compare the expenses shown in this 5% hypothetical example with the 5% hypothetical examples that appear in the shareholder reports of other funds. | |
Please note that the expenses in the table are meant to highlight your ongoing costs only and do not include any transaction costs, such as fees and expenses that are, or may be imposed under your variable contract or qualified pension plan. Therefore, the information under the heading "Hypothetical (5% annual return before expenses)" is useful in comparing ongoing costs only, and will not help you determine the relative total costs of owning different funds. In addition, if these transaction costs were included, your costs would have been higher.
NEUBERGER BERMAN ADVISERS MANAGEMENT TRUST LARGE CAP VALUE PORTFOLIO
Actual | | Beginning Account
Value
7/1/16 | | Ending Account
Value
12/31/16 | | Expenses Paid During
the Period
7/1/16 – 12/31/16 | |
Class I | | $ | 1,000.00 | | | $ | 1,169.90 | | | $ | 6.49 | * | |
Hypothetical (5% annual return before expenses) | |
Class I | | $ | 1,000.00 | | | $ | 1,019.15 | | | $ | 6.04 | ** | |
* Expenses are equal to the annualized expense ratio of 1.19%, multiplied by the average account value over the period, multiplied by 184/366 (to reflect the one-half year period shown).
** Hypothetical expenses are equal to the annualized expense ratio of 1.19%, multiplied by the average account value over the period (assuming a 5% annual return), multiplied by 184/366 (to reflect the one-half year period shown).
4
Schedule of Investments Large Cap Value Portfolio 12/31/16
NUMBER OF SHARES | | | | VALUE | |
Common Stocks 96.2% | | | |
Airlines 1.2% | | | |
| | 19,366 | | | Delta Air Lines, Inc. | | $ | 952,614 | | |
Banks 22.9% | | | |
| | 71,419 | | | Bank of America Corp. | | | 1,578,360 | | |
| | 18,571 | | | BB&T Corp. | | | 873,208 | | |
| | 60,703 | | | Citigroup, Inc. | | | 3,607,579 | | |
| | 3,738 | | | Commerce Bancshares, Inc. | | | 216,094 | | |
| | 46,020 | | | JPMorgan Chase & Co. | | | 3,971,066 | | |
| | 24,234 | | | KeyCorp | | | 442,755 | | |
| | 10,630 | | | M&T Bank Corp. | | | 1,662,851 | | |
| | 16,614 | | | PNC Financial Services Group, Inc. | | | 1,943,173 | | |
| | 15,239 | | | SunTrust Banks, Inc. | | | 835,859 | | |
| | 5,269 | | | Synovus Financial Corp. | | | 216,451 | | |
| | 16,699 | | | U.S. Bancorp | | | 857,828 | | |
| | 32,719 | | | Wells Fargo & Co. | | | 1,803,144 | | |
| | | | 18,008,368 | | |
Capital Markets 8.4% | | | |
| | 66,993 | | | Bank of New York Mellon Corp. | | | 3,174,128 | | |
| | 12,674 | | | CME Group, Inc. | | | 1,461,946 | | |
| | 8,240 | | | Goldman Sachs Group, Inc. | | | 1,973,068 | | |
| | | | 6,609,142 | | |
Communications Equipment 1.2% | | | |
| | 29,964 | | | Cisco Systems, Inc. | | | 905,512 | | |
Construction & Engineering 0.6% | | | |
| | 8,613 | | | Jacobs Engineering Group, Inc. | | | 490,941 | * | |
Diversified Telecommunication Services 2.7% | | | |
| | 22,117 | | | AT&T, Inc. | | | 940,636 | | |
| | 22,205 | | | Verizon Communications, Inc. | | | 1,185,303 | | |
| | | | 2,125,939 | | |
Electric Utilities 1.2% | | | |
| | 27,098 | | | Exelon Corp. | | | 961,708 | | |
Electrical Equipment 3.8% | | | |
| | 44,936 | | | Eaton Corp. PLC | | | 3,014,756 | | |
Energy Equipment & Services 1.8% | | | |
| | 17,215 | | | Schlumberger Ltd. | | | 1,445,199 | | |
Food & Staples Retailing 1.6% | | | |
| | 13,231 | | | Wal-Mart Stores, Inc. | | | 914,527 | | |
| | 9,993 | | | Whole Foods Market, Inc. | | | 307,384 | | |
| | | | 1,221,911 | | |
NUMBER OF SHARES | | | | VALUE | |
Health Care Equipment & Supplies 1.4% | | | |
| | 9,662 | | | Medtronic PLC | | $ | 688,224 | | |
| | 3,643 | | | Zimmer Biomet Holdings, Inc. | | | 375,958 | | |
| | | | 1,064,182 | | |
Hotels, Restaurants & Leisure 6.4% | | | |
| | 59,226 | | | Carnival Corp. | | | 3,083,306 | | |
| | 6,490 | | | McDonald's Corp. | | | 789,963 | | |
| | 14,309 | | | Royal Caribbean Cruises Ltd. | | | 1,173,910 | | |
| | | | 5,047,179 | | |
Household Products 3.1% | | | |
| | 29,103 | | | Procter & Gamble Co. | | | 2,446,980 | | |
Industrial Conglomerates 1.8% | | | |
| | 44,355 | | | General Electric Co. | | | 1,401,618 | | |
Insurance 3.2% | | | |
| | 9,034 | | | Athene Holding Ltd. Class A | | | 433,541 | * | |
| | 23,418 | | | Lincoln National Corp. | | | 1,551,911 | | |
| | 10,230 | | | MetLife, Inc. | | | 551,295 | | |
| | | | 2,536,747 | | |
Machinery 6.2% | | | |
| | 23,504 | | | Caterpillar, Inc. | | | 2,179,761 | | |
| | 6,267 | | | Illinois Tool Works, Inc. | | | 767,457 | | |
| | 68,398 | | | Joy Global, Inc. | | | 1,915,144 | | |
| | | | 4,862,362 | | |
Metals & Mining 7.6% | | | |
| | 68,859 | | | BHP Billiton Ltd. ADR | | | 2,463,775 | | |
| | 103,512 | | | Newmont Mining Corp. | | | 3,526,654 | | |
| | | | 5,990,429 | | |
Multi-Utilities 0.5% | | | |
| | 5,194 | | | Dominion Resources, Inc. | | | 397,808 | | |
Multiline Retail 2.0% | | | |
| | 8,288 | | | Kohl's Corp. | | | 409,261 | | |
| | 7,834 | | | Macy's, Inc. | | | 280,536 | | |
| | 11,823 | | | Target Corp. | | | 853,975 | | |
| | | | 1,543,772 | | |
Oil, Gas & Consumable Fuels 9.2% | | | |
| | 24,862 | | | Cabot Oil & Gas Corp. | | | 580,776 | | |
| | 11,148 | | | EOG Resources, Inc. | | | 1,127,063 | | |
| | 42,723 | | | Exxon Mobil Corp. | | | 3,856,178 | | |
| | 30,708 | | | Kinder Morgan, Inc. | | | 635,963 | | |
| | 3,419 | | | Phillips 66 | | | 295,436 | | |
| | 4,105 | | | Pioneer Natural Resources Co. | | | 739,187 | | |
| | | | 7,234,603 | | |
See Notes to Financial Statements
5
Schedule of Investments Large Cap Value Portfolio (cont'd)
NUMBER OF SHARES | | | | VALUE | |
Pharmaceuticals 4.3% | | | |
| | 27,542 | | | Merck & Co., Inc. | | $ | 1,621,398 | | |
| | 54,555 | | | Pfizer, Inc. | | | 1,771,946 | | |
| | | | 3,393,344 | | |
Semiconductors & Semiconductor
Equipment 0.7% | | | |
| | 233 | | | ASML Holding NV | | | 26,143 | | |
| | 5,087 | | | NXP Semiconductors NV | | | 498,577 | * | |
| | | | 524,720 | | |
Technology Hardware, Storage &
Peripherals 1.9% | | | |
| | 21,817 | | | Western Digital Corp. | | | 1,482,465 | | |
Textiles, Apparel & Luxury Goods 2.5% | | | |
| | 21,737 | | | Ralph Lauren Corp. | | | 1,963,286 | | |
| | | | Total Common Stocks
(Cost $65,965,057) | | | 75,625,585 | | |
Short-Term Investment 8.2% | | | |
Investment Company 8.2% | | | |
| 6,424,682
| | | State Street Institutional
U.S. Government
Money Market Fund
Premier Class, 0.42%
(Cost $6,424,682) | | | 6,424,682
| (a) | |
| | | | | Total Investments 104.4%
(Cost $72,389,739) | | | 82,050,267
| | |
| | | | | Other Assets Less Liabilities (4.4)% | | | (3,428,307 | ) | |
| | | | | Net Assets 100.0% | | $ | 78,621,960 | | |
* Non-income producing security.
(a) Represents 7-day effective yield as of 12/31/2016.
See Notes to Financial Statements
6
Schedule of Investments Large Cap Value Portfolio (cont'd)
The following is a summary, categorized by Level (see Note A of Notes to Financial Statements), of inputs used to value the Fund's investments as of December 31, 2016:
Asset Valuation Inputs | | Level 1 | | Level 2 | | Level 3 | | Total | |
Investments: | |
Common Stocks(a) | | $ | 75,625,585 | | | $ | — | | | $ | — | | | $ | 75,625,585 | | |
Short-Term Investment | | | — | | | | 6,424,682 | | | | — | | | | 6,424,682 | | |
Total Investments | | $ | 75,625,585 | | | $ | 6,424,682 | | | $ | — | | | $ | 82,050,267 | | |
(a) The Schedule of Investments provides information on the industry categorization for the portfolio.
As of the year ended December 31, 2016, no securities were transferred from one level (as of December 31, 2015) to another.
See Notes to Financial Statements
7
Statement of Assets and Liabilities
Neuberger Berman Advisers Management Trust
| | | LARGE CAP VALUE
PORTFOLIO | |
| | | December 31, 2016 | |
Assets | |
Investments in securities, at value* (Note A)—see Schedule of Investments: | |
Unaffiliated issuers | | $ | 82,050,267 | | |
Dividends and interest receivable | | | 120,536 | | |
Receivable for securities sold | | | 152,362 | | |
Receivable for Fund shares sold | | | 23,277 | | |
Prepaid expenses and other assets | | | 14,678 | | |
Total Assets | | | 82,361,120 | | |
Liabilities | |
Payable for securities purchased | | | 3,538,093 | | |
Payable for Fund shares redeemed | | | 81,217 | | |
Payable to investment manager (Note B) | | | 36,641 | | |
Payable to administrator (Note B) | | | 19,986 | | |
Accrued expenses and other payables | | | 63,223 | | |
Total Liabilities | | | 3,739,160 | | |
Net Assets | | $ | 78,621,960 | | |
Net Assets consist of: | |
Paid-in capital | | $ | 67,546,890 | | |
Undistributed net investment income (loss) | | | 414,944 | | |
Accumulated net realized gains (losses) on investments | | | 999,598 | | |
Net unrealized appreciation (depreciation) in value of investments | | | 9,660,528 | | |
Net Assets | | $ | 78,621,960 | | |
Shares Outstanding ($.001 par value; unlimited shares authorized) | | | 5,159,079 | | |
Net Asset Value, offering and redemption price per share | | $ | 15.24 | | |
*Cost of Investments | | | $72,389,739 | | |
See Notes to Financial Statements
8
Neuberger Berman Advisers Management Trust
| | | LARGE CAP VALUE
PORTFOLIO | |
| | | For the
Year Ended
December 31, 2016 | |
Investment Income: | |
Income (Note A): | |
Dividend income—unaffiliated issuers | | $ | 1,218,462 | | |
Interest income—unaffiliated issuers | | | 13,792 | | |
Foreign taxes withheld (Note A) | | | (377 | ) | |
Total income | | $ | 1,231,877 | | |
Expenses: | |
Investment management fees (Note B) | | | 327,094 | | |
Administration fees (Note B) | | | 178,415 | | |
Audit fees | | | 46,560 | | |
Custodian and accounting fees | | | 26,801 | | |
Insurance expense | | | 2,024 | | |
Legal fees | | | 32,962 | | |
Shareholder reports | | | 28,844 | | |
Trustees' fees and expenses | | | 54,948 | | |
Miscellaneous | | | 5,396 | | |
Total net expenses | | | 703,044 | | |
Net investment income (loss) | | $ | 528,833 | | |
Realized and Unrealized Gain (Loss) on Investments (Note A): | |
Net realized gain (loss) on: | |
Sales of investment securities of unaffiliated issuers | | | 2,210,949 | | |
Change in net unrealized appreciation (depreciation) in value of: | |
Unaffiliated investment securities | | | 12,260,639 | | |
Net gain (loss) on investments | | | 14,471,588 | | |
Net increase (decrease) in net assets resulting from operations | | $ | 15,000,421 | | |
See Notes to Financial Statements
9
Statements of Changes in Net Assets
Neuberger Berman Advisers Management Trust
| | | LARGE CAP VALUE PORTFOLIO | |
| | | Year Ended
December 31,
2016 | | Year Ended
December 31,
2015 | |
Increase (Decrease) in Net Assets: | |
From Operations (Note A): | |
Net investment income (loss) | | $ | 528,833 | | | $ | 547,521 | | |
Net realized gain (loss) on investments | | | 2,210,949 | | | | 3,909,708 | | |
Change in net unrealized appreciation (depreciation) of investments | | | 12,260,639 | | | | (11,830,067 | ) | |
Net increase (decrease) in net assets resulting from operations | | | 15,000,421 | | | | (7,372,838 | ) | |
Distributions to Shareholders From (Note A): | |
Net investment income | | | (470,886 | ) | | | (455,286 | ) | |
Net realized gain on investments | | | (5,161,853 | ) | | | (4,600,984 | ) | |
Total distributions to shareholders | | | (5,632,739 | ) | | | (5,056,270 | ) | |
From Fund Share Transactions (Note D): | |
Proceeds from shares sold | | | 26,374,250 | | | | 5,949,491 | | |
Proceeds from reinvestment of dividends and distributions | | | 5,632,739 | | | | 5,056,270 | | |
Payments for shares redeemed | | | (16,092,373 | ) | | | (15,513,932 | ) | |
Net increase (decrease) from Fund share transactions | | | 15,914,616 | | | | (4,508,171 | ) | |
Net Increase (Decrease) in Net Assets | | | 25,282,298 | | | | (16,937,279 | ) | |
Net Assets: | |
Beginning of year | | | 53,339,662 | | | | 70,276,941 | | |
End of year | | $ | 78,621,960 | | | $ | 53,339,662 | | |
Undistributed net investment income (loss) at end of year | | $ | 414,944 | | | $ | 547,474 | | |
See Notes to Financial Statements
10
Notes to Financial Statements Large Cap Value Portfolio
Note A—Summary of Significant Accounting Policies:
1 General: Neuberger Berman Advisers Management Trust (the "Trust") is a Delaware statutory trust organized pursuant to an Amended and Restated Trust Instrument dated March 27, 2014. The Trust is currently comprised of eight separate operating series (each individually a "Fund," and collectively the "Funds") each of which is diversified. The Trust is registered as an open-end management investment company under the Investment Company Act of 1940, as amended (the "1940 Act"), and its shares are registered under the Securities Act of 1933, as amended. Neuberger Berman Advisers Management Trust Large Cap Value Portfolio (the "Fund") currently offers only Class I shares. The Trust's Board of Trustees (the "Board") may establish additional series or classes of shares without the approval of shareholders.
The assets of each Fund belong only to that Fund, and the liabilities of each Fund are borne solely by that Fund and no other.
The Fund is an investment company and accordingly follows the investment company accounting and reporting guidance of the Financial Accounting Standards Board ("FASB") Accounting Standard Codification Topic 946 "Financial Services—Investment Companies."
The preparation of financial statements in accordance with U.S. generally accepted accounting principles ("GAAP") requires Neuberger Berman Investment Advisers LLC ("NBIA" or "Management") to make estimates and assumptions at the date of the financial statements. Actual results could differ from those estimates.
Shares of the Fund are not available to the general public and may be purchased only by life insurance companies to serve as an investment vehicle for premiums paid under their variable annuity and variable life insurance contracts and to certain qualified pension and other retirement plans.
2 Portfolio valuation: In accordance with Accounting Standards Codification ("ASC") 820 "Fair Value Measurement" ("ASC 820"), all investments held by the Fund are carried at the value that Management believes the Fund would receive upon selling an investment in an orderly transaction to an independent buyer in the principal or most advantageous market for the investment under current market conditions. Various inputs, including the volume and level of activity for the asset or liability in the market, are considered in valuing the Fund's investments, some of which are discussed below. Significant Management judgment may be necessary to value investments in accordance with ASC 820.
ASC 820 established a three-tier hierarchy of inputs to create a classification of value measurements for disclosure purposes. The three-tier hierarchy of inputs is summarized in the three broad Levels listed below.
• Level 1—quoted prices in active markets for identical investments
• Level 2—other observable inputs (including quoted prices for similar investments, interest rates, prepayment speeds, credit risk, amortized cost, etc.)
• Level 3—unobservable inputs (including the Fund's own assumptions in determining the fair value of investments)
The inputs or methodology used for valuing an investment are not necessarily an indication of the risk associated with investing in those securities.
The value of the Fund's investments in equity securities, for which market quotations are readily available, is generally determined by Management by obtaining valuations from independent pricing services based on the latest sale price quoted on a principal exchange or market for that security (Level 1 inputs). Securities traded primarily on the NASDAQ Stock Market are normally valued at the NASDAQ Official Closing Price ("NOCP") provided by NASDAQ each business day. The NOCP is the most recently reported price as of 4:00:02 p.m., Eastern Time, unless
11
that price is outside the range of the "inside" bid and asked prices (i.e., the bid and asked prices that dealers quote to each other when trading for their own accounts); in that case, NASDAQ will adjust the price to equal the inside bid or asked price, whichever is closer. Because of delays in reporting trades, the NOCP may not be based on the price of the last trade to occur before the market closes. If there is no sale of a security on a particular day, the independent pricing services may value the security based on market quotations.
Management has developed a process to periodically review information provided by independent pricing services for all types of securities.
Investments in non-exchange traded investment companies are valued using the respective fund's daily calculated net asset value per share (Level 2 inputs).
If a valuation is not available from an independent pricing service, or if Management has reason to believe that the valuation received does not represent the amount the Fund might reasonably expect to receive on a current sale in an orderly transaction, Management seeks to obtain quotations from brokers or dealers (generally considered Level 2 or Level 3 inputs depending on the number of quotes available). If such quotations are not readily available, the security is valued using methods the Board has approved in the good-faith belief that the resulting valuation will reflect the fair value of the security. Numerous factors may be considered when determining the fair value of a security based on Level 2 or Level 3 inputs, including available analyst, media or other reports, securities within the same industry with recent highly correlated performance, trading in futures or American Depositary Receipts ("ADRs") and whether the issuer of the security being fair valued has other securities outstanding.
The value of the Fund's investments in foreign securities is generally determined using the same valuation methods and inputs as other Fund investments, as discussed above. Foreign security prices expressed in local currency values are normally translated from the local currency into U.S. dollars using the exchange rates as of 4:00 p.m. Eastern Time on days the New York Stock Exchange ("NYSE") is open for business. The Board has approved the use of Interactive Data Pricing and Reference Data LLC ("Interactive") to assist in determining the fair value of foreign equity securities when changes in the value of a certain index suggest that the closing prices on the foreign exchanges may no longer represent the amount that the Fund could expect to receive for those securities or on days when foreign markets are closed and U.S. markets are open. In each of these events, Interactive will provide adjusted prices for certain foreign equity securities using a statistical analysis of historical correlations of multiple factors (Level 2 inputs). In the absence of precise information about the market values of these foreign securities as of the time as of which a Fund's share price is calculated, the Board has determined on the basis of available data that prices adjusted in this way are likely to be closer to the prices the Fund could realize on a current sale than are the prices of those securities established at the close of the foreign markets in which the securities primarily trade.
Fair value prices are necessarily estimates, and there is no assurance that such a price will be at or close to the price at which the security is next quoted or next trades.
3 Foreign currency translation: The accounting records of the Fund are maintained in U.S. dollars. Foreign currency amounts are normally translated into U.S. dollars using the exchange rate as of 4:00 p.m. Eastern Time, on days the NYSE is open for business to determine the value of investments, other assets and liabilities. Purchase and sale prices of securities, and income and expenses, are translated into U.S. dollars at the prevailing rate of exchange on the respective dates of such transactions. Net unrealized foreign currency gain (loss), if any, arises from changes in the value of assets and liabilities, other than investments in securities, as a result of changes in exchange rates and is stated separately in the Statement of Operations.
4 Securities transactions and investment income: Securities transactions are recorded on trade date for financial reporting purposes. Dividend income is recorded on the ex-dividend date or, for certain foreign dividends, as soon as the Fund becomes aware of the dividends. Non-cash dividends included in dividend income, if any, are recorded at the fair market value of the securities received. Interest income, including accretion of original issue discount, where applicable, and accretion of discount on short-term investments, if any, is recorded on the accrual basis. Realized gains and losses from securities transactions and foreign currency transactions, if any, are recorded on the basis of identified cost and stated separately in the Statement of Operations. Included in net realized gain (loss) on
12
investments are proceeds from the settlements of class action litigation in which the Fund participated as a class member. The amount of such proceeds for the year ended December 31, 2016 was $2,735.
5 Income tax information: Each Fund is treated as a separate entity for U.S. federal income tax purposes. It is the policy of the Fund to continue to qualify for treatment as a regulated investment company ("RIC") by complying with the requirements of the U.S. Internal Revenue Code applicable to RICs and to distribute substantially all of its net investment income and net realized capital gains to its shareholders. To the extent the Fund distributes substantially all of its net investment income and net realized capital gains to shareholders, no federal income or excise tax provision is required.
The Fund has adopted the provisions of ASC 740 "Income Taxes" ("ASC 740"). ASC 740 sets forth a minimum threshold for financial statement recognition of a tax position taken, or expected to be taken, in a tax return. The Fund recognizes interest and penalties, if any, related to unrecognized tax positions as an income tax expense in the Statement of Operations. The Fund is subject to examination by U.S. federal and state tax authorities for returns filed for the tax years for which the applicable statutes of limitations have not yet expired. As of December 31, 2016, the Fund did not have any unrecognized tax positions.
At December 31, 2016, the cost of investments for U.S. federal income tax basis was $73,330,542. Gross unrealized appreciation of investments was $9,869,608 and gross unrealized depreciation of investments was $1,149,883 resulting in net unrealized appreciation of $8,719,725 based on cost for U.S. federal income tax purposes.
Income distributions and capital gain distributions are determined in accordance with income tax regulations, which may differ from GAAP. These differences are primarily due to differing treatments of income and gains on various investment securities held by the Fund, timing differences and differing characterization of distributions made by the Fund. The Fund may also utilize earnings and profits distributed to shareholders on redemption of their shares as a part of the dividends-paid deduction for income tax purposes.
As determined on December 31, 2016, permanent differences resulting primarily from different book and tax accounting were reclassified at year end. Such differences are attributed to the tax treatment of: prior year partnership adjustments and non-taxable adjustments to income. These reclassifications had no effect on net income, net asset value ("NAV") or NAV per share of the Fund. For the year ended December 31, 2016, the Fund recorded the following permanent reclassifications:
| Paid-in Capital | | Undistributed
Net Investment
Income (Loss) | | Accumulated
Net Realized
Gains (Losses)
on Investments | |
| $ | — | | | $ | (190,477 | ) | | $ | 190,477 | | |
The tax character of distributions paid during the years ended December 31, 2016 and December 31, 2015 was as follows:
Distributions Paid From: | |
Ordinary Income | | Long- Term Capital Gain | | Total | |
| 2016 | | 2015 | | 2016 | | 2015 | | 2016 | | 2015 | |
| $ | 470,886 | | | $ | 455,286 | | | $ | 5,161,853 | | | $ | 4,600,984 | | | $ | 5,632,739 | | | $ | 5,056,270 | | |
As of December 31, 2016, the components of distributable earnings (accumulated losses) on a U.S. federal income tax basis were as follows:
Undistributed
Ordinary
Income | | Undistributed
Long- Term
Capital Gain | | Unrealized
Appreciation/
(Depreciation) | | Loss
Carryforwards
and Deferrals | | Other
Temporary
Differences | | Total | |
| $ | 1,951,559 | | | $ | 403,786 | | | $ | 8,719,725 | | | $ | — | | | $ | — | | | $ | 11,075,070 | | |
13
The temporary differences between book basis and tax basis distributable earnings are primarily due to losses disallowed and recognized on wash sales and return of capital adjustments.
6 Distributions to shareholders: The Fund may earn income, net of expenses, daily on its investments. Distributions from net investment income and net realized capital gains, if any, are generally distributed once a year (usually in October). Income distributions and capital gain distributions to shareholders are recorded on the ex-date.
7 Foreign taxes: Foreign taxes withheld, if any, represent amounts withheld by foreign tax authorities, net of refunds recoverable.
8 Expense allocation: Certain expenses are applicable to multiple funds within the complex of related investment companies. Expenses directly attributable to a Fund are charged to that Fund. Expenses of the Trust that are not directly attributable to a particular series of the Trust (e.g., the Fund) are allocated among the series of the Trust, on the basis of relative net assets, except where a more appropriate allocation of expenses to each of the series can otherwise be made fairly. Expenses borne by the complex of related investment companies, which includes open-end and closed-end investment companies for which Management serves as investment manager, that are not directly attributable to a particular investment company in the complex (e.g., the Trust) or series thereof are allocated among the investment companies in the complex or series thereof on the basis of relative net assets, except where a more appropriate allocation of expenses to each of the investment companies in the complex or series thereof can otherwise be made fairly.
9 Investments in foreign securities: Investing in foreign securities may involve sovereign and other risks, in addition to the credit and market risks normally associated with domestic securities. These additional risks include the possibility of adverse political and economic developments (including political instability, nationalization, expropriation, or confiscatory taxation) and the potentially adverse effects of unavailability of public information regarding issuers, less governmental supervision and regulation of financial markets, reduced liquidity of certain financial markets, and the lack of uniform accounting, auditing, and financial reporting standards or the application of standards that are different or less stringent than those applied in the United States. Foreign securities also may experience greater price volatility, higher rates of inflation, and delays in settlement.
10 Indemnifications: Like many other companies, the Trust's organizational documents provide that its officers ("Officers") and trustees ("Trustees") are indemnified against certain liabilities arising out of the performance of their duties to the Trust. In addition, both in some of its principal service contracts and in the normal course of its business, the Trust enters into contracts that provide indemnifications to other parties for certain types of losses or liabilities. The Trust's maximum exposure under these arrangements is unknown as this could involve future claims against the Trust.
Note B—Investment Management Fees, Administration Fees, Distribution Arrangements, and Other Transactions with Affiliates:
The Fund retains Management as its investment manager under a Management Agreement. For such investment management services, the Fund pays Management a fee at the annual rate of 0.55% of the first $250 million of the Fund's average daily net assets, 0.525% of the next $250 million, 0.50% of the next $250 million, 0.475% of the next $250 million, 0.45% of the next $500 million, 0.425% of the next $2.5 billion, and 0.40% of average daily net assets in excess of $4 billion. Accordingly, for the year ended December 31, 2016, the investment management fee pursuant to the Management Agreement was equivalent to an annual effective rate of 0.55% of the Fund's average daily net assets.
The Fund retains Management as its administrator under an Administration Agreement. The Fund pays Management an administration fee at the annual rate of 0.30% of its average daily net assets under this agreement. Additionally, Management retains State Street Bank and Trust Company ("State Street") as its sub-administrator under a Sub-Administration Agreement. Management pays State Street a fee for all services received under this agreement.
14
Neuberger Berman BD LLC (the "Distributor") is the Fund's "principal underwriter" within the meaning of the 1940 Act. It acts as agent in arranging for the sale of the Fund's Class I shares without sales commission or other compensation and bears all advertising and promotion expenses incurred in the sale of those shares. The Board adopted a non-fee distribution plan for the Fund's Class I.
Management has contractually agreed to waive fees and/or reimburse the Fund so that the total annual operating expenses do not exceed the expense limitation as detailed in the following table. This undertaking excludes fees payable to Management, interest (commitment fees relating to borrowings are treated as interest for purposes of this exclusion), taxes, transaction costs, brokerage commissions, dividend and interest expenses relating to short sales, acquired fund fees and expenses and extraordinary expenses, if any; consequently, net expenses may exceed the contractual expense limitation. The Fund has agreed that it will repay Management for fees and expenses waived or reimbursed provided that repayment does not cause the annual operating expenses to exceed its contractual expense limitation in place at the time the fees and expenses were waived or reimbursed, or the expense limitation in place at the time the Fund repays Management, whichever is lower. Any such repayment must be made within three years after the year in which Management incurred the expense.
During the year ended December 31, 2016, there was no repayment to Management under its contractual expense limitation.
At December 31, 2016, the Fund had no contingent liability to Management under its contractual expense limitation.
| | | | | | | Expenses Reimbursed in
Fiscal Year Ending December 31, | |
| | | | | | | 2014 | | 2015 | | 2016 | |
| | | | | | | Subject to Repayment Until December 31, | |
| | | Contractual
Expense
Limitation(a) | | Expiration | | 2017 | | 2018 | | 2019 | |
Class I | | | 1.00 | % | | 12/31/19 | | $ | — | | | $ | — | | | $ | — | | |
(a) Expense limitation per annum of the Fund's average daily net assets.
Neuberger Berman LLC ("Neuberger") was retained by Management through December 31, 2015, pursuant to a Sub-Advisory Agreement to furnish it with investment recommendations and research information without added cost to the Fund. Several individuals who are Officers and/or Trustees of the Trust are also employees of Neuberger and/or Management. As a result of the entity consolidation described on page 3 of this Annual Report, the services previously provided by Neuberger under the Sub-Advisory Agreement are being provided by NBIA as of January 1, 2016.
Note C—Securities Transactions:
During the year ended December 31, 2016, there were purchase and sale transactions (excluding short-term securities) of $61,427,000 and $52,657,668, respectively.
During the year ended December 31, 2016, no brokerage commissions on securities transactions were paid to affiliated brokers.
15
Note D—Fund Share Transactions:
Share activity for the years ended December 31, 2016 and December 31, 2015 was as follows:
| | | For the Year Ended December 31, | |
| | | 2016 | | 2015 | |
Shares Sold | | | 1,832,266 | | | | 394,307 | | |
Shares Issued on Reinvestment of Dividends and Distributions | | | 406,990 | | | | 360,647 | | |
Shares Redeemed | | | (1,125,032 | ) | | | (999,063 | ) | |
Total | | | 1,114,224 | | | | (244,109 | ) | |
Note E—Line of Credit:
At December 31, 2016, the Fund was a participant in a syndicated committed, unsecured $700,000,000 line of credit (the "Credit Facility"), to be used only for temporary or emergency purposes. Series of other investment companies managed by Management also participate in this line of credit on substantially the same terms except that some do not have access to the full amount of the Credit Facility. Interest is charged on borrowings under this Credit Facility at the higher of (a) a federal funds effective rate plus 1.00% per annum or (b) a Eurodollar rate for a one-month period plus 1.00% per annum. The Credit Facility has an annual commitment fee of 0.15% per annum of the available line of credit, which is paid quarterly. The Fund has agreed to pay its pro rata share of the annual commitment fee, based on the ratio of its individual net assets to the net assets of all participants at the time the fee is due and payable and the level of its access to the Credit Facility, and interest charged on any borrowing made by the Fund and other costs incurred by the Fund. Because several mutual funds participate in the Credit Facility, there is no assurance that the Fund will have access to all or any part of the $700,000,000 at any particular time. There were no loans outstanding under the Credit Facility at December 31, 2016. During the period ended December 31, 2016, the Fund did not utilize the Credit Facility.
Note F—Recent Accounting Pronouncement:
In October 2016, the U.S. Securities and Exchange Commission ("SEC") adopted new rules and forms, and amendments to certain current rules and forms, to modernize reporting and disclosure of information by registered investment companies. The amendments to Regulation S-X will require standardized, enhanced disclosure about derivatives in investment company financial statements, and will also change the rules governing the form and content of such financial statements. The compliance date for the amendments to Regulation S-X is August 1, 2017. Management is currently evaluating the impact that the adoption of the amendments to Regulation S-X will have on the Fund's financial statements and related disclosures.
16
Large Cap Value Portfolio
The following table includes selected data for a share outstanding throughout each year and other performance information derived from the Financial Statements. Amounts that do not round to $0.01 or $(0.01) per share are presented as $0.00 or $(0.00), respectively. Ratios that do not round to 0.01% or (0.01)% are presented as 0.00% or (0.00)%, respectively. A "—" indicates that the line item was not applicable in the corresponding period.
Class I | |
| | | Year Ended December 31, | |
| | | 2016 | | 2015 | | 2014 | | 2013 | | 2012 | |
Net Asset Value, Beginning of Year | | $ | 13.19 | | | $ | 16.39 | | | $ | 15.04 | | | $ | 11.60 | | | $ | 9.99 | | |
Income From Investment Operations: | |
| Net Investment Income (Loss)@ | | | 0.13 | | | | 0.14 | | | | 0.11 | | | | 0.10 | | | | 0.12 | | |
Net Gains or Losses on Securities
(both realized and unrealized) | | | 3.34 | | | | (2.00 | ) | | | 1.36 | | | | 3.50 | | | | 1.54 | | |
Total From Investment Operations | | | 3.47 | | | | (1.86 | ) | | | 1.47 | | | | 3.60 | | | | 1.66 | | |
Less Distributions From: | |
Net Investment Income | | | (0.12 | ) | | | (0.12 | ) | | | (0.12 | ) | | | (0.16 | ) | | | (0.05 | ) | |
Net Capital Gains | | | (1.30 | ) | | | (1.22 | ) | | | — | | | | — | | | | — | | |
Total Distributions | | | (1.42 | ) | | | (1.34 | ) | | | (0.12 | ) | | | (0.16 | ) | | | (0.05 | ) | |
Voluntary Contribution from Management | | | — | | | | — | | | | 0.00 | | | | — | | | | — | | |
Net Asset Value, End of Year | | $ | 15.24 | | | $ | 13.19 | | | $ | 16.39 | | | $ | 15.04 | | | $ | 11.60 | | |
| Total Return† | | | 27.37 | %^ | | | (11.80 | )%^ | | | 9.85 | %^µ | | | 31.14 | %^ | | | 16.60 | % | |
Ratios/Supplemental Data | |
Net Assets, End of Year (in millions) | | $ | 78.6 | | | $ | 53.3 | | | $ | 70.3 | | | $ | 69.9 | | | $ | 61.9 | | |
| Ratio of Gross Expenses to Average Net Assets# | | | 1.18 | % | | | 1.14 | % | | | 1.10 | % | | | 1.13 | % | | | 1.15 | % | |
Ratio of Net Expenses to Average Net Assets | | | 1.18 | % | | | 1.14 | % | | | 1.10 | % | | | 1.13 | % | | | 1.15 | %§ | |
Ratio of Net Investment Income (Loss) to Average
Net Assets | | | 0.89 | % | | | 0.89 | % | | | 0.71 | % | | | 0.78 | % | | | 1.15 | % | |
Portfolio Turnover Rate | | | 93 | % | | | 153 | % | | | 130 | % | | | 165 | % | | | 124 | % | |
See Notes to Financial Highlights
17
Notes to Financial Highlights Large Cap Value Portfolio
† Total return based on per share NAV reflects the effects of changes in NAV on the performance of the Fund during each fiscal period. Returns assume income dividends and other distributions, if any, were reinvested. Results represent past performance and do not indicate future results. Current returns may be lower or higher than the performance data quoted. Investment returns and principal may fluctuate and shares when redeemed may be worth more or less than original cost. Total return would have been lower if Management had not reimbursed and/or waived certain expenses. The total return information shown does not reflect charges and other expenses that apply to the separate accounts or the related insurance policies or other qualified pension or retirement plans, and the inclusion of these charges and other expenses would reduce the total return for all fiscal periods shown.
^ The class action proceeds listed in Note A of the Notes to Financial Statements had no impact on the Fund's total return for the year ended December 31, 2016. Had the Fund not received class action proceeds in 2015, total return based on per share NAV for the year ended December 31, 2015 would have been (11.94)%. Had the Fund not received class action proceeds in 2014, total return based on per share NAV for the year ended December 31, 2014 would have been 9.72%. Had the Fund not received class action proceeds in 2013, total return based on per share NAV for the year ended December 31, 2013 would have been 30.61%.
# Represents the annualized ratios of net expenses to average daily net assets if Management had not reimbursed certain expenses and/or waived a portion of the investment management fee. Management did not reimburse or waive fees during the fiscal periods shown.
@ Calculated based on the average number of shares outstanding during each fiscal period.
§ Prior to January 1, 2013, the Fund had an expense offset arrangement in connection with its custodian contract. The impact of expense reductions related to expense offset arrangements, if any, was less than 0.01%.
µ The voluntary contribution received in 2014 had no impact on the Fund's total return for the year ended December 31, 2014.
18
Report of Independent Registered Public Accounting Firm
To the Board of Trustees of
Neuberger Berman Advisers Management Trust and
Shareholders of Large Cap Value Portfolio
We have audited the accompanying statement of assets and liabilities of Large Cap Value Portfolio, one of the series constituting Neuberger Berman Advisers Management Trust (the "Trust"), including the schedule of investments, as of December 31, 2016, and the related statement of operations for the year then ended, the statements of changes in net assets for each of the two years in the period then ended and the financial highlights for each of the five years in the period then ended. These financial statements and financial highlights are the responsibility of the Trust's management. Our responsibility is to express an opinion on these financial statements and financial highlights based on our audits.
We conducted our audits in accordance with the standards of the Public Company Accounting Oversight Board (United States). Those standards require that we plan and perform the audit to obtain reasonable assurance about whether the financial statements and financial highlights are free of material misstatement. We were not engaged to perform an audit of the Trust's internal control over financial reporting. Our audits included consideration of internal control over financial reporting as a basis for designing audit procedures that are appropriate in the circumstances, but not for the purpose of expressing an opinion on the effectiveness of the Trust's internal control over financial reporting. Accordingly, we express no such opinion. An audit also includes examining, on a test basis, evidence supporting the amounts and disclosures in the financial statements and financial highlights, assessing the accounting principles used and significant estimates made by management, and evaluating the overall financial statement presentation. Our procedures included confirmation of securities owned as of December 31, 2016 by correspondence with the custodian and others or by other appropriate auditing procedures where replies from others were not received. We believe that our audits provide a reasonable basis for our opinion.
In our opinion, the financial statements and financial highlights referred to above present fairly, in all material respects, the financial position of Large Cap Value Portfolio, a series of Neuberger Berman Advisers Management Trust, at December 31, 2016, the results of its operations for the year then ended, the changes in its net assets for each of the two years in the period then ended, and the financial highlights for each of the five years in the period then ended in conformity with U.S. generally accepted accounting principles.
Boston, Massachusetts
February 10, 2017
19
The following tables set forth information concerning the Trustees and Officers of the Fund. All persons named as Trustees and Officers also serve in similar capacities for other funds administered or managed by Management. The Fund's Statement of Additional Information includes additional information about the Trustees as of the time of the Fund's most recent public offering and is available upon request, without charge, by calling (800) 877-9700.
Information about the Board of Trustees
Name, (Year of Birth),
and Address(1) | | Position(s) and
Length of
Time Served(2) | | Principal Occupation(s)(3) | | Number of
Funds in Fund
Complex
Overseen by
Fund Trustee | | Other Directorships Held
Outside Fund Complex by
Fund Trustee(3) |
Independent Trustees |
Michael J. Cosgrove (1949) | | Trustee since 2015 | | President, Carragh Consulting USA, since 2014; formerly, Executive, General Electric Company, 1970 to 2014, including President, Mutual Funds and Global Investment Programs, GE Asset Management, 2011 to 2014, President and Chief Executive Officer, Mutual Funds and Intermediary Business, GE Asset Management, 2007 to 2011, President, Institutional Sales and Marketing, GE Asset Management, 1998 to 2007, and Chief Financial Officer, GE Asset Management, and Deputy Treasurer, GE Company, 1988 to 1993. | | 55 | | | Director, America Press, Inc. (not-for-profit Jesuit publisher), since 2015; Director, Fordham University, since 2001; formerly, Director, The Gabelli Go Anywhere Trust, June 2015 to June 2016; Director, Skin Cancer Foundation (not-for-profit), 2006 to 2015; Director, GE Investments Funds, Inc., 1997 to 2014; Trustee, GE Institutional Funds, 1997 to 2014; Director, GE Asset Management, 1988 to 2014; Director, Elfun Trusts, 1988 to 2014; Trustee, GE Pension & Benefit Plans, 1988 to 2014. |
20
Name, (Year of Birth),
and Address(1) | | Position(s) and
Length of
Time Served(2) | | Principal Occupation(s)(3) | | Number of
Funds in Fund
Complex
Overseen by
Fund Trustee | | Other Directorships Held
Outside Fund Complex by
Fund Trustee(3) |
Marc Gary (1952) | | Trustee since 2015 | | Executive Vice Chancellor and Chief Operating Officer, Jewish Theological Seminary, since 2012; formerly, Executive Vice President and General Counsel, Fidelity Investments, 2007 to 2012; Executive Vice President and General Counsel, BellSouth Corporation, 2004 to 2007; Vice President and Associate General Counsel, BellSouth Corporation, 2000 to 2004; Associate, Partner, and National Litigation Practice Co-Chair, Mayer, Brown LLP, 1981 to 2000; Associate Independent Counsel, Office of Independent Counsel, 1990 to 1992. | | 55 | | | Trustee, Jewish Theological Seminary, since 2015; Director, Counsel on Call (privately held for-profit company), since 2012; Director, Lawyers Committee for Civil Rights Under Law (not-for-profit), since 2005; formerly, Director, Equal Justice Works (not-for-profit), 2005 to 2014; Director, Corporate Counsel Institute, Georgetown University Law Center, 2007 to 2012; Director, Greater Boston Legal Services (not-for-profit), 2007 to 2012. |
Martha C. Goss (1949) | | Trustee since 2007 | | President, Woodhill Enterprises Inc./Chase Hollow Associates LLC (personal investment vehicle), since 2006; formerly, Consultant, Resources Global Professionals (temporary staffing), 2002 to 2006. | | 55 | | | Director, American Water (water utility), since 2003; Director, Allianz Life of New York (insurance), since 2005; Director, Berger Group Holdings, Inc. (engineering consulting firm), since 2013; Director, Financial Women's Association of New York (not-for-profit association), since 2003; Trustee Emerita, Brown University, since 1998; Director, Museum of American Finance (not-for-profit), since 2013; formerly, Non-Executive Chair and Director, Channel Reinsurance (financial guaranty reinsurance), 2006 to 2010; formerly, Director, Ocwen Financial Corporation (mortgage servicing), 2005 to 2010; formerly, Director, Claire's Stores, Inc. (retailer), 2005 to 2007; formerly, Director, Parsons Brinckerhoff Inc. (engineering consulting firm), 2007 to 2010; formerly, Director, Bank Leumi (commercial bank), 2005 to 2007; formerly, Advisory Board Member, Attensity (software developer), 2005 to 2007. |
21
Name, (Year of Birth),
and Address(1) | | Position(s) and
Length of
Time Served(2) | | Principal Occupation(s)(3) | | Number of
Funds in Fund
Complex
Overseen by
Fund Trustee | | Other Directorships Held
Outside Fund Complex by
Fund Trustee(3) |
Michael M. Knetter (1960) | | Trustee since 2007 | | President and Chief Executive Officer, University of Wisconsin Foundation, since October 2010; formerly, Dean, School of Business, University of Wisconsin - Madison; formerly, Professor of International Economics and Associate Dean, Amos Tuck School of Business -Dartmouth College, 1998 to 2002. | | 55 | | | Board Member, American Family Insurance (a mutual company, not publicly traded), since March 2009; formerly, Trustee, Northwestern Mutual Series Fund, Inc., 2007 to 2011; formerly, Director, Wausau Paper, 2005 to 2011; formerly, Director, Great Wolf Resorts, 2004 to 2009. |
Deborah C. McLean (1954) | | Trustee since 2015 | | Member, Circle Financial Group (private wealth management membership practice), since 2011; Managing Director, Golden Seeds LLC (an angel investing group), since 2009; Adjunct Professor, Columbia University School of International and Public Affairs, since 2008; formerly, Visiting Assistant Professor, Fairfield University, Dolan School of Business, Fall 2007; formerly, Adjunct Associate Professor of Finance, Richmond, The American International University in London, 1999 to 2007. | | 55 | | | Board member, Norwalk Community College Foundation, since 2014; Dean's Advisory Council, Radcliffe Institute for Advanced Study, since 2014; formerly, Director and Treasurer, At Home in Darien (not-for-profit), 2012 to 2014; Director, National Executive Service Corps (not-for-profit), 2012 to 2013; Trustee, Richmond, The American International University in London, 1999 to 2013. |
George W. Morriss (1947) | | Trustee since 2007 | | Adjunct Professor, Columbia University School of International and Public Affairs, since October 2012; formerly, Executive Vice President and Chief Financial Officer, People's United Bank, Connecticut (a financial services company), 1991 to 2001. | | 55 | | | Director, National Association of Corporate Directors, Connecticut Chapter, since 2011; Trustee, Steben Alternative Investment Funds, Steben Select Multi-Strategy Fund, and Steben Select Multi-Strategy Master Fund, since 2013; formerly, Treasurer, National Association of Corporate Directors, Connecticut Chapter, 2011 to 2015; formerly, Manager, Larch Lane Multi-Strategy Fund complex (which consisted of three funds), 2006 to 2011; formerly, Member, NASDAQ Issuers' Affairs Committee, 1995 to 2003. |
22
Name, (Year of Birth),
and Address(1) | | Position(s) and
Length of
Time Served(2) | | Principal Occupation(s)(3) | | Number of
Funds in Fund
Complex
Overseen by
Fund Trustee | | Other Directorships Held
Outside Fund Complex by
Fund Trustee(3) |
Tom D. Seip (1950) | | Trustee since 2000; Chairman of the Board since 2008; formerly Lead Independent Trustee from 2006 to 2008 | | General Partner, Ridgefield Farm LLC (a private investment vehicle); formerly, President and CEO, Westaff, Inc. (temporary staffing), May 2001 to January 2002; formerly, Senior Executive, The Charles Schwab Corporation, 1983 to 1998, including Chief Executive Officer, Charles Schwab Investment Management, Inc.; Trustee, Schwab Family of Funds and Schwab Investments, 1997 to 1998; and Executive Vice President-Retail Brokerage, Charles Schwab & Co., Inc., 1994 to 1997. | | 55 | | | Director, H&R Block, Inc. (financial services company), since May 2001; Chairman, Governance and Nominating Committee, H&R Block, Inc., since 2011; formerly, Chairman, Compensation Committee, H&R Block, Inc., 2006 to 2010; formerly, Director, Forward Management, Inc. (asset management company), 1999 to 2006. |
James G. Stavridis (1955) | | Trustee since 2015 | | Dean, Fletcher School of Law and Diplomacy, Tufts University since 2013; formerly, Admiral, United States Navy, 2006 to 2013, including Supreme Allied Commander, NATO and Commander, European Command, 2009 to 2013, and Commander, United States Southern Command, 2006 to 2009. | | 55 | | | Director, Utilidata Inc., since 2015; Director, BMC Software Federal, LLC, since 2014; Director, Vertical Knowledge, LLC, since 2013; formerly, Director, Navy Federal Credit Union, 2000-2002. |
23
Name, (Year of Birth),
and Address(1) | | Position(s) and
Length of
Time Served(2) | | Principal Occupation(s)(3) | | Number of
Funds in Fund
Complex
Overseen by
Fund Trustee | | Other Directorships Held
Outside Fund Complex by
Fund Trustee(3) |
Candace L. Straight (1947) | | Trustee since 1999 | | Private investor and consultant specializing in the insurance industry; formerly, Advisory Director, Securitas Capital LLC (a global private equity investment firm dedicated to making investments in the insurance sector), 1998 to 2003. | | 55 | | | Formerly, Public Member, Board of Governors and Board of Trustees, Rutgers University, 2011 to 2016; formerly, Director, Montpelier Re Holdings Ltd. (reinsurance company), 2006 to 2015; formerly, Director, National Atlantic Holdings Corporation (property and casualty insurance company), 2004 to 2008; formerly, Director, The Proformance Insurance Company (property and casualty insurance company), 2004 to 2008; formerly, Director, Providence Washington Insurance Company (property and casualty insurance company), 1998 to 2006; formerly, Director, Summit Global Partners (insurance brokerage firm), 2000 to 2005. |
Peter P. Trapp (1944) | | Trustee since 1984 | | Retired; formerly, Regional Manager for Mid-Southern Region, Ford Motor Credit Company, September 1997 to 2007; formerly, President, Ford Life Insurance Company, April 1995 to August 1997. | | 55 | | | None. |
24
Name, (Year of Birth),
and Address(1) | | Position(s) and
Length of
Time Served(2) | | Principal Occupation(s)(3) | | Number of
Funds in Fund
Complex
Overseen by
Fund Trustee | | Other Directorships Held
Outside Fund Complex by
Fund Trustee(3) |
Trustees who are "Interested Persons" |
Joseph V. Amato* (1962) | | Trustee since 2009 | | President and Director, Neuberger Berman Group LLC, since 2009; President and Chief Executive Officer, Neuberger Berman BD LLC ("Neuberger Berman") and Neuberger Berman Holdings LLC (including its predecessor, Neuberger Berman Inc.), since 2007; Chief Investment Officer (Equities) and President (Equities), Neuberger Berman Investment Advisers LLC ("NBIA") (formerly, Neuberger Berman Fixed Income LLC ("NBFI") and including predecessor entities), since 2007, and Board Member of NBIA since 2006; formerly, Global Head of Asset Management of Lehman Brothers Holdings Inc.'s ("LBHI") Investment Management Division, 2006 to 2009; formerly, member of LBHI's Investment Management Division's Executive Management Committee, 2006 to 2009; formerly, Managing Director, Lehman Brothers Inc. ("LBI"), 2006 to 2008; formerly, Chief Recruiting and Development Officer, LBI, 2005 to 2006; formerly, Global Head of LBI's Equity Sales and a Member of its Equities Division Executive Committee, 2003 to 2005. | | 55 | | | Member of Board of Advisors, McDonough School of Business, Georgetown University, since 2001; Member of New York City Board of Advisors, Teach for America, since 2005; Trustee, Montclair Kimberley Academy (private school), since 2007; Member of Board of Regents, Georgetown University, since 2013. |
25
Name, (Year of Birth),
and Address(1) | | Position(s) and
Length of
Time Served(2) | | Principal Occupation(s)(3) | | Number of
Funds in Fund
Complex
Overseen by
Fund Trustee | | Other Directorships Held
Outside Fund Complex by
Fund Trustee(3) |
Robert Conti* (1956) | | Chief Executive Officer, President and Trustee since 2008; prior thereto, Executive Vice President in 2008 and Vice President from 2000 to 2008 | | Managing Director, Neuberger Berman, since 2007; President—Mutual Funds, NBIA, since 2008; formerly, Senior Vice President, Neuberger Berman, 2003 to 2006; formerly, Vice President, Neuberger Berman, 1999 to 2003; President and Chief Executive Officer, twenty-eight registered investment companies for which NBIA acts as investment manager and/or administrator. | | 55 | | | Director, Staten Island Mental Health Society, since 1994; formerly, Chairman of the Board, Staten Island Mental Health Society, 2008 to 2011. |
(1) The business address of each listed person is 1290 Avenue of the Americas, New York, NY 10104.
(2) Pursuant to the Trust's Trust Instrument, each of these Trustees shall hold office for life or until his or her successor is elected or the Trust terminates; except that (a) any Trustee may resign by delivering a written resignation; (b) any Trustee may be removed with or without cause at any time by a written instrument signed by at least two-thirds of the other Trustees; (c) any Trustee who requests to be retired, or who has become unable to serve, may be retired by a written instrument signed by a majority of the other Trustees; and (d) any Trustee may be removed at any shareholder meeting by a vote of at least two-thirds of the outstanding shares.
(3) Except as otherwise indicated, each individual has held the positions shown during at least the last five years.
* Indicates a Trustee who is an "interested person" within the meaning of the 1940 Act. Mr. Amato and Mr. Conti are interested persons of the Trust by virtue of the fact that each is an officer of Management, Neuberger Berman and/or their affiliates.
26
Information about the Officers of the Trust
Name, (Year of Birth),
and Address(1) | | Position(s) and
Length of Time
Served(2) | | Principal Occupation(s)(3) |
Claudia A. Brandon (1956) | | Executive Vice President since 2008 and Secretary since 1985 | | Senior Vice President, Neuberger Berman, since 2007 and Employee since 1999; Senior Vice President, NBIA, since 2008 and Assistant Secretary since 2004; formerly, Vice President, Neuberger Berman, 2002 to 2006; formerly, Vice President—Mutual Fund Board Relations, NBIA, 2000 to 2008; formerly, Vice President, NBIA, 1986 to 1999 and Employee, 1984 to 1999; Executive Vice President, twenty-eight registered investment companies for which NBIA acts as investment manager and/or administrator; Secretary, fifteen registered investment companies for which NBIA acts as investment manager and/or administrator. |
Agnes Diaz (1971) | | Vice President since 2013 | | Senior Vice President, Neuberger Berman, since 2012; Senior Vice President, NBIA, since 2012 and Employee since 1996; formerly, Vice President, Neuberger Berman, 2007 to 2012; Vice President, twenty-eight registered investment companies for which NBIA acts as investment manager and/or administrator. |
Anthony DiBernardo (1979) | | Assistant Treasurer since 2011 | | Senior Vice President, NBIA, since 2014, and Employee since 2003; formerly, Vice President, Neuberger Berman, 2009 to 2014; Assistant Treasurer, ten registered investment companies for which NBIA acts as investment manager and/or administrator. |
Corey A. Issing (1978) | | Chief Legal Officer since 2016 (only for purposes of sections 307 and 406 of the Sarbanes-Oxley Act of 2002) and Anti-Money Laundering Compliance Officer since 2016 | | General Counsel and Head of Compliance—Mutual Funds since 2016 and Senior Vice President, NBIA, since 2013, formerly, Associate General Counsel (2015 to 2016), Counsel (2007 to 2015), Vice President (2009—2013); Chief Legal Officer (only for purposes of sections 307 and 406 of the Sarbanes-Oxley Act of 2002), twenty-eight registered investment companies for which NBIA acts as investment manager and/or administrator; Anti-Money Laundering Compliance Officer, twenty-eight registered investment companies for which NBIA acts as investment manager and/or administrator. |
Sheila R. James (1965) | | Assistant Secretary since 2002 | | Vice President, Neuberger Berman, since 2008 and Employee since 1999; Vice President, NBIA, since 2008; formerly, Assistant Vice President, Neuberger Berman, 2007; Employee, NBIA, 1991 to 1999; Assistant Secretary, twenty-eight registered investment companies for which NBIA acts as investment manager and/or administrator. |
27
Name, (Year of Birth),
and Address(1) | | Position(s) and
Length of Time
Served(2) | | Principal Occupation(s)(3) |
Brian Kerrane (1969) | | Chief Operating Officer since 2015 and Vice President since 2008 | | Managing Director, Neuberger Berman, since 2013; Chief Operating Officer—Mutual Funds and Managing Director, NBIA, since 2015 and Employee since 1991; formerly, Senior Vice President, Neuberger Berman, 2006 to 2014; Vice President, NBIA, 2008 to 2015; Chief Operating Officer, ten registered investment companies for which NBIA acts as investment manager and/or administrator; Vice President, twenty-eight registered investment companies for which NBIA acts as investment manager and/or administrator. |
Kevin Lyons (1955) | | Assistant Secretary since 2003 | | Assistant Vice President, Neuberger Berman, since 2008 and Employee since 1999; Assistant Vice President, NBIA, since 2008; formerly, Employee, NBIA, 1993 to 1999; Assistant Secretary, ten registered investment companies for which NBIA acts as investment manager and/or administrator. |
Anthony Maltese (1959) | | Vice President since 2015 | | Senior Vice President, Neuberger Berman, since 2014 and Employee since 2000; Senior Vice President, NBIA, since 2014; Vice President, ten registered investment companies for which NBIA acts as investment manager and/or administrator. |
Owen F. McEntee, Jr. (1961) | | Vice President since 2008 | | Vice President, Neuberger Berman, since 2006; Vice President, NBIA, since 2006 and Employee since 1992; Vice President, ten registered investment companies for which NBIA acts as investment manager and/or administrator. |
John M. McGovern (1970) | | Treasurer and Principal Financial and Accounting Officer since 2005 | | Senior Vice President, Neuberger Berman, since 2007; Senior Vice President, NBIA, since 2007 and Employee since 1993; formerly, Vice President, Neuberger Berman, 2004 to 2006; formerly, Assistant Treasurer, 2002 to 2005; Treasurer and Principal Financial and Accounting Officer, twenty-eight registered investment companies for which NBIA acts as investment manager and/or administrator. |
Frank Rosato (1971) | | Assistant Treasurer since 2005 | | Vice President, Neuberger Berman, since 2006; Vice President, NBIA, since 2006 and Employee since 1995; Assistant Treasurer, ten registered investment companies for which NBIA acts as investment manager and/or administrator. |
Chamaine Williams (1971) | | Chief Compliance Officer since 2005 | | Chief Compliance Officer—Mutual Funds and Senior Vice President, NBIA, since 2006; formerly, Senior Vice President, LBI, 2007 to 2008; formerly, Vice President, LBI, 2003 to 2006; formerly, Chief Compliance Officer, Lehman Brothers Asset Management Inc., 2003 to 2007; formerly, Chief Compliance Officer, Lehman Brothers Alternative Investment Management LLC, 2003 to 2007; Chief Compliance Officer, fifteen registered investment companies for which NBIA acts as investment manager and/or administrator. |
(1) The business address of each listed person is 1290 Avenue of the Americas, New York, NY 10104.
(2) Pursuant to the By-Laws of the Trust, each officer elected by the Trustees shall hold office until his or her successor shall have been elected and qualified or until his or her earlier death, inability to serve, or resignation. Officers serve at the pleasure of the Trustees and may be removed at any time with or without cause.
(3) Except as otherwise indicated, each individual has held the positions shown during at least the last five years
28
Proxy Voting Policies and Procedures
A description of the policies and procedures that the Trust uses to determine how to vote proxies relating to portfolio securities is available, without charge, by calling 800-877-9700 (toll-free) and on the Securities and Exchange Commission's website at www.sec.gov. Information regarding how the Trust voted proxies relating to portfolio securities during the most recent 12-month period ended June 30 is also available upon request, without charge, by calling 800-877-9700 (toll-free), on the Securities and Exchange Commission's website at www.sec.gov, and on Management's website at www.nb.com.
Quarterly Portfolio Schedule
The Trust files a complete schedule of portfolio holdings for the Fund with the Securities and Exchange Commission for the first and third quarters of each fiscal year on Form N-Q. The Trust's Forms N-Q are available on the Securities and Exchange Commission's website at www.sec.gov and may be reviewed and copied at the Securities and Exchange Commission's Public Reference Room in Washington, DC. Information on the operation of the Public Reference Room may be obtained by calling 800-SEC-0330. The information on Form N-Q is available upon request, without charge, by calling 800-877-9700 (toll free).
Board Consideration of the Management Agreement
On an annual basis, the Board of Trustees (the "Board") of Neuberger Berman Advisers Management Trust (the "Trust"), including the Trustees who are not "interested persons" of Neuberger Berman Investment Advisers LLC ("Management") (including its affiliates) or the Trust ("Independent Fund Trustees"), considers whether to continue the management agreement with Management (the "Agreement") for Large Cap Value Portfolio (the "Fund"). Throughout the process, the Independent Fund Trustees are advised by counsel that is experienced in Investment Company Act of 1940 matters and that is independent of Management ("Independent Counsel"). At a meeting held on October 18, 2016, the Board, including the Independent Fund Trustees, approved the continuation of the Agreement for the Fund.
In evaluating the Agreement, the Board, including the Independent Fund Trustees, reviewed extensive materials provided by Management in response to questions submitted by the Independent Fund Trustees and Independent Counsel, and met with senior representatives of Management regarding its personnel, operations and financial condition as they relate to the Fund. The annual contract review extends over at least two regular meetings of the Board to ensure that Management has time to respond to any questions the Independent Fund Trustees may have on their initial review of the materials and that the Independent Fund Trustees have time to consider those responses.
In connection with its deliberations, the Board also considered the broad range of information relevant to the annual contract review that is provided to the Board (including its various standing committees) at meetings throughout the year, including investment performance reports and related portfolio information for the Fund, as well as periodic reports on, among other matters, pricing and valuation; brokerage and execution; compliance; and shareholder and other services provided by Management and its affiliates. To assist the Board in its deliberations regarding the annual contract review, the Board has established a Contract Review Committee comprised of Independent Fund Trustees. The Board has also established other committees that focus throughout the year on specific areas relevant to the annual contract review, such as Fund performance or compliance matters, and that are charged with specific responsibilities regarding the annual contract review. Those committees provide reports that feed into the Contract Review Committee, which reviews and takes account of the information.
The Independent Fund Trustees received from Independent Counsel a memorandum discussing the legal standards for their consideration of the proposed continuation of the Agreement. During the course of the year and during their deliberations regarding the annual contract review, the Contract Review Committee and the Independent Fund Trustees met with Independent Counsel separately from representatives of Management.
29
In connection with its approval of the continuation of the Agreement, the Board evaluated the terms of the Agreement, the overall fairness of the Agreement to the Fund and whether the Agreement was in the best interests of the Fund and its shareholders. The Board considered all factors it deemed relevant with respect to the Fund, including the following factors: (1) the nature, extent, and quality of the services provided by Management; (2) the investment performance of the Fund compared to an appropriate market index and a peer group of investment companies; (3) the costs of the services provided and the profit or loss realized by Management and its affiliates from their relationship with the Fund; (4) the extent to which economies of scale have been or might be realized as the Fund grows; and (5) whether fee levels reflect any such potential economies of scale for the benefit of the Fund's shareholders. The Board's determination to approve the continuation of the Agreement was based on a comprehensive consideration of all information provided to the Board throughout the year and specifically in connection with the annual contract review. The Board members did not identify any particular information or factor that was all-important or controlling, and each Trustee may have attributed different weights to the various factors. The Board focused on the overall costs and benefits of the Agreement to the Fund and, through the Fund, its shareholders.
With respect to the nature, extent and quality of the services provided, the Board considered the investment philosophy and decision-making processes of Management, and the qualifications, experience, and capabilities of, and the resources available to, the portfolio management personnel of Management who perform services for the Fund. The Board noted that Management also provides certain administrative services, including fund accounting and compliance services. The Board also considered Management's policies and practices regarding brokerage and allocation of portfolio transactions and reviewed the quality of the execution services that Management had provided. The Board also reviewed whether Management used brokers to execute Fund transactions that provide research and other services to Management and the types of benefits potentially derived from such services by Management, the Fund and other clients of Management. The Board also considered that Management's responsibilities include daily management of investment, operational, enterprise, legal, regulatory and compliance risks as they relate to the Fund, and considered information regarding Management's processes for managing risk. In addition, the Board noted the positive compliance history of Management, as no significant compliance problems were reported to the Board with respect to either firm. The Board also considered the general structure of the portfolio manager compensation program and whether this structure provides appropriate incentives to act in the best interests of the Fund.
As in past years, the Board also considered the manner in which Management addressed various non-routine matters that arose during the year, some of them a result of developments in the broader fund industry or the regulations governing it. In addition, the Board considered actions taken by Management in response to recent market conditions, such as regulatory concerns about current trading issues, market liquidity and potential volatility, and considered the overall performance of Management in this context.
The Board factored into its evaluation of the Fund's fees and performance a consideration of the limitations inherent in the methodology for constructing peer groups and determining which investment companies should be included in the peer groups. The Board considered a peer group composed of two types of funds: proprietary funds that are operated by insurance companies or their affiliates, and non-proprietary funds, such as the Fund, operated for insurance company investors by independent investment managers.
With respect to investment performance, the Board considered information regarding the Fund's short, intermediate, and long-term performance both on an absolute basis and relative to an appropriate benchmark index and the average performance of a composite peer group (as constructed by an independent organization) of investment companies pursuing broadly similar strategies. The Board also reviewed performance in relation to certain measures of the degree of investment risk undertaken by the portfolio manager. The Board considered that as compared to its peer group, the Fund's performance was lower than the median for the 1, 3, 5 and 10-year periods. The Board also considered that the Fund's performance was lower than its benchmark for the 1, 3, 5 and 10-year periods. The Board discussed with Management the Fund's performance and steps that Management had taken, or intended to take, to improve performance. The Board also considered Management's responsiveness with respect to the Fund's lagging performance. In this regard, the Board noted that performance, especially short-term performance, is only one of the factors that it deems
30
relevant to its consideration of the Fund's Agreement and that, after considering all relevant factors, it may be appropriate to approve the continuation of the Agreement notwithstanding the Fund's underperformance.
With respect to the overall fairness of the Agreement, the Board considered the fee structure for the Fund under the Agreement as compared to the peer group. The Board also considered any fall-out (i.e. indirect) benefits likely to accrue to Management or its affiliates from their relationship with the Fund. The Board also considered the profitability of Management and its affiliates from their association with the Fund, and year-over-year changes in each of Management's reported expense categories.
The Board reviewed a comparison of the Fund's management fee and total expense ratio to the peer group and was aware that non-proprietary insurance product funds generally have higher fee structures than proprietary funds. The Board noted that the comparative management fee analysis includes, in the Fund's management fee, the separate administrative fee paid to Management, but it was not clear whether this was the case for all funds in the peer group. The Board compared the Fund's contractual and actual management fees to the mean and median of the contractual and actual management fees, respectively, of the Fund's peer group. (The actual management fees are the contractual management fees reduced by any fee waivers or other adjustments.) In addition, the Board considered the contractual limit on expenses of the Fund. The Board noted that although Management realized a profit on its management of the Fund, it experienced a loss on the Fund when all expenses were taken into account.
The Board considered that, for the Fund's I Class shares, as compared to its peer group, the Fund's contractual management fee and the actual management fee were both higher than the respective medians. The Board considered whether specific portfolio management, administration or oversight needs contributed to the management fee. The Board also noted that the Fund's size, which impacts its expenses and performance, has been affected by ongoing changes in the insurance market.
The Board also considered whether there were other funds or separate accounts that were advised by Management or its affiliates with investment objectives, policies and strategies that were similar to those of the Fund. The Board compared the fees charged to the Fund to the fees charged to such funds and/or separate accounts. The Board considered the appropriateness and reasonableness of any differences between the fees charged to the Fund and such funds and/or separate accounts, including any breakpoints, and determined that differences in fees and fee structures were consistent with the management and other services provided.
The Board also evaluated any apparent or anticipated economies of scale in relation to the services Management provides to the Fund. The Board considered whether the Fund's fee structure provides for a reduction of payments resulting from the use of breakpoints and whether those breakpoints are set at appropriate asset levels. As in past years, the Board gave careful thought to the size of any breakpoints in the Fund's advisory fees and the asset levels at which they are set. It also considered whether the fees were set at an appropriate level and compared the fee structures to that of the peer group. The Board also considered that Management has provided, at no added cost to the Fund, certain additional services that were required by new regulations or regulatory interpretations, impelled by changes in the securities markets or the business landscape, and/or requested by the Board. In concluding that the benefits accruing to Management and its affiliates by virtue of their relationship with the Fund were reasonable in light of the costs of providing the investment advisory and other services and the benefits accruing to the Fund, the Board reviewed specific data as to Management's profitability on the Fund for a recent period. The Board also considered Management's cost allocation methodology. The Board recognized that Management should be entitled to earn a reasonable level of profits for services they provide to the Fund and, based on its review, concluded that Management's reported level of profitability on the Fund was reasonable.
Conclusions
In approving the continuation of the Agreement, the Board concluded that the terms of the Agreement are fair and reasonable to the Fund and that approval of the continuation of the Agreement is in the best interests of the Fund and its shareholders. In reaching this determination, the Board considered that Management could be expected to provide a high level of service to the Fund; regarding the Fund's underperformance, that it retained confidence in Management's capabilities to manage the Fund; that the Fund's fee structure appeared to the Board to be reasonable given the nature,
31
extent and quality of services provided; and that the benefits accruing to Management and its affiliates by virtue of their relationship with the Fund were reasonable in light of the costs of providing the investment advisory and other services and the benefits accruing to the Fund. The Board's conclusions may be based in part on its consideration of materials prepared in connection with the approval or continuance of the Agreement in prior years and on the Board's ongoing regular review of Fund performance and operations throughout the year, in addition to material prepared specifically for the most recent annual review of the Agreement.
Notice to Shareholders
47.70% of the dividends earned during the fiscal year ended December 31, 2016 qualify for the dividends received deduction for corporate shareholders.
The Fund designates $5,161,853 as a capital gain distribution.
32
Neuberger Berman
Advisers Management Trust
Mid Cap Growth Portfolio
I Class Shares
S Class Shares
Annual Report
December 31, 2016
Mid Cap Growth Portfolio Commentary (Unaudited)
The Neuberger Berman Advisers Management Trust Mid Cap Growth Portfolio Class I generated a 4.40% total return for the 12 months ended December 31, 2016, trailing its benchmark, the Russell Midcap® Growth Index, which returned 7.33% for the same period. (Performance for all share classes is provided in the table immediately following the letter.)
Looking back, 2016 offered up an unpredictable roller-coaster of highs and lows that actively challenged past investing dogma and convention. The year began with a global growth crisis of confidence that spurred a meaningful market correction and ruthless risk-off rotation and closed with a hugely unexpected political outcome and equally improbable burst of investing optimism. In between, a cautious U.S. market maintained its "safe-haven" posture by largely shrugging off the U.K.'s surprising decision to leave the European Union, the U.S. Federal Reserve's very public rate debate, complete with dueling hawkish and dovish postures around the overall health and direction of our economy, the oddly correlated and fluctuating power of oil prices, the U.S. dollar and economic news out of China and a healthy dose of campaign-fueled cynicism.
The good news, likely lost amid the stunning headlines and intermittent volatility, is that economic trends remained broadly positive and companies generally continued to execute and deliver reasonably good earnings. We also saw signs, boosted by a now clearer path to sustained monetary tightening and the vote of confidence that it represents, of a shift away from the now eight-year post-financial crisis trend of corporate frugality that has favored financial reallocations, in the form of dividend and share repurchase programs, over differentiating and potentially GDP-boosting capital reinvestments aimed at improving efficiency and competitive positioning.
The main culprit for our 2016 underperformance was a perfect storm at the start of the year of uncharacteristic stock-specific issues that were amplified by investors' extreme rotation among the higher-beta segments of the market. While the balance of the year represented a solid effort for the strategy, we weren't able to overcome those turbulent first two months or the persistent challenges that we faced within the Information Technology (IT) sector, which ultimately proved to be the primary driver of our relative underperformance for the year.
For the year, the portfolio was overweight Health Care, IT, Telecommunication Services, Financials and Energy and underweight Consumer Staples, Real Estate, Consumer Discretionary, Materials and Industrials. Drilling down to our holdings, NVIDIA Corp. was the top performing holding, while Tableau Software was the leading detractor. NVIDIA, a semiconductor company engaged in visual computing applications, consistently delivered very strong results led by its gaming segment. Tableau, a provider of analytics and cloud-based business intelligence software solutions, delivered a poor quarter and surprisingly underwhelming future guidance that highlighted slowing top-line growth and the need for increased spending. We elected to exit our position in Tableau.
We enter 2017 in uncharted territory, and we wouldn't be surprised by a "First 100 Days" market let down, as election bluster is replaced by the need for details and the daunting reality and pace of actual governing. Assuming the new administration finds its footing and setting aside the unpredictable disruptive power of random early morning presidential tweets, we do have a reasonable degree of confidence in its ability, working with a Republican-controlled Congress, to deliver in the sentiment-boosting areas of tax reform, regulations and infrastructure spending, which we believe would pave the way for this highly resilient, yet strangely unloved, bull market to ultimately continue its upward march.
Sincerely,
Kenneth J. Turek
Portfolio Manager
Information about principal risks of investing in the Fund is set forth in the prospectus and statement of additional information.
The portfolio composition, industries and holdings of the Fund are subject to change without notice.
The opinions expressed are those of the Fund's portfolio manager. The opinions are as of the date of this report, and are subject to change without notice.
1
Mid Cap Growth Portfolio (Unaudited)
SECTOR ALLOCATION
(as a % of Total Investments*) | |
Consumer Discretionary | | | 20.0 | % |
Consumer Staples | | | 2.7 | |
Energy | | | 2.0 | |
Financials | | | 7.8 | |
Health Care | | | 16.8 | |
Industrials | | | 13.8 | |
Information Technology | | | 25.1 | |
Materials | | | 3.9 | |
Real Estate | | | 0.5 | |
Telecommunication Services | | | 1.2 | |
Short-Term Investment | | | 5.3 | |
Other | | | 0.9 | |
Total | | | 100.0 | % |
* Derivatives, if any, are excluded from this chart.
PERFORMANCE HIGHLIGHTS
| | | Inception Date | | Average Annual Total Return
Ended 12/31/2016 | |
| | | | 1 Year | | 5 Years | | 10 Years | | Life of Fund | |
Mid Cap Growth
Portfolio Class I | | 11/03/1997 | | | 4.40 | % | | | 11.14 | % | | | 7.22 | % | | | 8.56 | % | |
Mid Cap Growth
Portfolio Class S2 | | 02/18/2003 | | | 4.16 | % | | | 10.85 | % | | | 6.96 | % | | | 8.36 | % | |
Russell Midcap®
Growth Index1,3 | | | | | 7.33 | % | | | 13.51 | % | | | 7.83 | % | | | 7.58 | % | |
Russell Midcap®
Index1,3 | | | | | 13.80 | % | | | 14.72 | % | | | 7.86 | % | | | 9.26 | % | |
The performance data quoted represent past performance and do not indicate future results. Current performance may be lower or higher than the performance data quoted. For performance data current to the most recent month-end, please visit http://www.nb.com/amtportfolios/performance.
The results shown in the table reflect the reinvestment of income dividends and other distributions, if any. The results do not reflect the effect of taxes a shareholder would pay on Fund distributions or on the redemption of Fund shares. The results do not reflect fees and expenses of the variable annuity and variable life insurance policies or the qualified pension and retirement plans whose proceeds are invested in the Fund.
The investment return and principal value of an investment will fluctuate and shares, when redeemed, may be worth more or less than their original cost.
Returns would have been lower if Neuberger Berman Investment Advisers LLC ("Management") had not reimbursed certain expenses and/or waived a portion of the investment management fees during certain of the periods shown. Repayment by a class (of expenses previously reimbursed and/or fees previously waived by Management) will decrease the class's returns. Please see Note B in the Notes to Financial Statements for specific information regarding expense reimbursement and/or fee waiver arrangements.
As stated in the Fund's most recent prospectus, the total annual operating expense ratios for fiscal year 2015 were 0.98% and 1.23% for Class I and Class S shares, respectively (before expense reimbursements and/or fee waivers, if any). The expense ratios for the annual period ended December 31, 2016 can be found in the Financial Highlights section of this report.
COMPARISON OF A $10,000 INVESTMENT
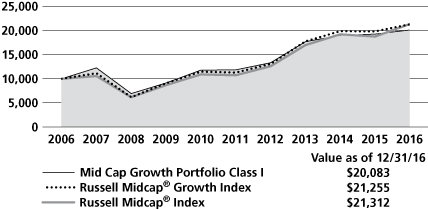
This graph shows the change in value of a hypothetical $10,000 investment in the Fund over the past 10 fiscal years, or since the Fund's inception if it has not operated for 10 years. The graph is based on Class I shares only; the performance of the Fund's share classes will differ primarily due to different class expenses (see Performance Highlights chart above).The result is compared with benchmarks, which include a broad-based market index and may include a more narrowly based index. Market indices have not been reduced to reflect any of the fees and costs of investing. The results shown in the graph reflect the reinvestment of income dividends and other distributions, if any. The results do not reflect the effect of taxes a shareholder would pay on Fund distributions or on the redemption of Fund shares. The results do not reflect fees and expenses of the variable annuity and variable life insurance policies or the qualified pension and retirement plans whose proceeds are invested in the Fund. Results represent past performance and do not indicate future results.
Please see Endnotes for additional information.
2
1 The date used to calculate Life of Fund performance for the index is November 3, 1997, the inception date of the oldest share class.
2 Performance shown prior to February 18, 2003 for Class S shares is that of Class I shares, which has lower expenses and correspondingly higher returns than Class S shares.
3 The Russell Midcap® Growth Index is a float-adjusted market capitalization-weighted index that measures the performance of the mid-cap growth segment of the U.S. equity market. It includes those Russell Midcap® Index companies with higher price-to-book ratios and higher forecasted growth rates. The index is rebalanced annually in June. The Russell Midcap Index is a float-adjusted market capitalization-weighted index that measures the performance of the mid-cap segment of the U.S. equity market. It includes approximately 800 of the smallest securities in the Russell 1000® Index. The index is rebalanced annually in June. Please note that the indices described in this report do not take into account any fees, expenses or tax consequences of investing in the individual securities that they track, and that individuals cannot invest directly in any index. Data about the performance of an index are prepared or obtained by Neuberger Berman Investment Advisers LLC* ("Management") and reflect the reinvestment of income dividends and other distributions, if any. The Fund may invest in securities not included in a described index and generally does not invest in all securities included in a described index.
* On January 1, 2016, Neuberger Berman Management LLC ("NBM") transferred to Neuberger Berman Fixed Income LLC ("NBFI") their rights and obligations pertaining to all services they provided to any Fund under any investment management, investment sub-advisory, and/or administration agreement, as applicable (the "Agreements"). Following such transfer, NBFI was renamed Neuberger Berman Investment Advisers LLC ("NBIA" or "Management"). Following the consolidation, the investment professionals of NBM who provided services to any Fund under the Agreements continue to provide the same services, except that they provide those services in their new capacities as investment professionals of NBIA. Further, the consolidation did not result in any change in the investment processes employed by any Fund, the nature or level of services provided to any Fund, or the fees any Fund pays under its Agreements.
On July 1, 2016, NBM was reorganized into "Neuberger Berman" (the "Reorganization"). Upon the completion of the Reorganization, Neuberger Berman assumed all rights and obligations pertaining to all services NBM provided to any Fund under any distribution agreement or distribution and services agreement (the "Agreements") or plan adopted pursuant to Rule 12b-1 under the Investment Company Act of 1940, as amended, (the "Plans"). Accordingly, after the Reorganization, Neuberger Berman became each Fund's distributor and the services previously provided by NBM under the Agreements and Plans are provided by Neuberger Berman.
Following the Reorganization, the employees of NBM provide the same services to each Fund under the Agreements and Plans, except that they provide those services in their capacities as employees of Neuberger Berman. Further, the Reorganization did not result in any change in the nature or level of services provided to each Fund, or the fees, if any, each Fund pays under the Agreements or the Plans.
Please note, effective July 1, 2016, Neuberger Berman Management LLC was reorganized with and into Neuberger Berman LLC, a registered broker-dealer, Member FINRA and the Fund's distributor, which changed its name to Neuberger Berman BD LLC on January 1, 2017.
The investments for the Fund are managed by the same portfolio manager(s) who manage(s) one or more other registered funds that have names, investment objectives and investment styles that are similar to those of the Fund. You should be aware that the Fund is likely to differ from those other mutual fund(s) in size, cash flow pattern and tax matters. Accordingly, the holdings and performance of the Fund can be expected to vary from those of the other mutual fund(s).
3
Shares of the separate Neuberger Berman Advisers Management Trust Portfolios, including the Fund, are not available to the general public. Shares of the Fund may be purchased only by life insurance companies to be held in their separate accounts, which fund variable annuity and variable life insurance policies, and by qualified pension and retirement plans.
Statistics and projections in this report are derived from sources deemed to be reliable but cannot be regarded as a representation of future results of the Fund. This report is prepared for the general information of shareholders and is not an offer of shares of the Fund. Shares are sold only through the currently effective prospectus, which must precede or accompany this report.
The "Neuberger Berman" name and logo and "Neuberger Berman Investment Advisers LLC" name are registered service marks of Neuberger Berman Group LLC. The individual Fund names in this piece are either service marks or registered service marks of Neuberger Berman Investment Advisers LLC, an affiliate of Neuberger Berman BD LLC, distributor, member FINRA.
© 2017 Neuberger Berman BD LLC, distributor. All rights reserved.
4
Information About Your Fund's Expenses (Unaudited)
As a Fund shareholder, you incur two types of costs: (1) transaction costs such as fees and expenses that are, or may be, imposed under your variable contract or qualified pension plan; and (2) ongoing costs, including management fees, distribution and/or service (12b-1) fees (if applicable), and other Fund expenses. This example is intended to help you understand your ongoing costs (in U.S. dollars) of investing in the Fund and compare these costs with the ongoing costs of investing in other mutual funds.
This table is designed to provide information regarding costs related to your investments. The following examples are based on an investment of $1,000 made at the beginning of the six month period ended December 31, 2016 and held for the entire period. The table illustrates the Fund's costs in two ways:
Actual Expenses and Performance: | | The first section of the table provides information about actual account values and actual expenses in dollars, based on the Fund's actual performance during the period indicated. You may use the information in this line, together with the amount you invested, to estimate the expenses you paid over the period. Simply divide your account value by $1,000 (for example, an $8,600 account value divided by $1,000 = 8.6), then multiply the result by the number in the first section of the table under the heading entitled "Expenses Paid During the Period" to estimate the expenses you paid over the period. |
Hypothetical Example for
Comparison Purposes: | | The second section of the table provides information about hypothetical account values and hypothetical expenses based on the Fund's actual expense ratio and an assumed rate of return at 5% per year before expenses. This return is not the Fund's actual return. The hypothetical account values and expenses may not be used to estimate the actual ending account balance or expenses you paid for the period. You may use this information to compare the ongoing costs of investing in this Fund versus other funds. To do so, compare the expenses shown in this 5% hypothetical example with the 5% hypothetical examples that appear in the shareholder reports of other funds. |
Please note that the expenses in the table are meant to highlight your ongoing costs only and do not include any transaction costs, such as fees and expenses that are, or may be imposed under your variable contract or qualified pension plan. Therefore, the information under the heading "Hypothetical (5% annual return before expenses)" is useful in comparing ongoing costs only, and will not help you determine the relative total costs of owning different funds. In addition, if these transaction costs were included, your costs would have been higher.
NEUBERGER BERMAN ADVISERS MANAGEMENT TRUST MID CAP GROWTH PORTFOLIO
Actual | Beginning Account
Value
7/1/16 | | Ending Account
Value
12/31/16 | | Expenses Paid
During the Period
7/1/16 – 12/31/16 | | Expense
Ratio |
Class I | | $1,000.00 | | | | $1,068.40 | | | | $5.15 | * | | | 0.99 | % |
Class S | | $1,000.00 | | | | $1,067.10 | | | | $6.44 | * | | | 1.24 | % |
Hypothetical (5% annual return before expenses) | |
Class I | | $1,000.00 | | | | $1,020.16 | | | | $5.03 | ** | | | 0.99 | % |
Class S | | $1,000.00 | | | | $1,018.90 | | | | $6.29 | ** | | | 1.24 | % |
* For each class, expenses are equal to the annualized expense ratio for the class, multiplied by the average account value over the period, multiplied by 184/366 (to reflect the one-half year period shown).
** Hypothetical expenses are equal to the annualized expense ratios for each class, multiplied by the average account value over the period (assuming a 5% annual return), multiplied by 184/366 (to reflect the one-half year period shown).
5
Schedule of Investments Mid Cap Growth Portfolio 12/31/16
NUMBER OF SHARES | | | | VALUE | |
Common Stocks 93.9% | | | |
Airlines 1.1% | | | |
| | 40,000 | | | Alaska Air Group, Inc. | | $ | 3,549,200 | | |
Banks 3.1% | | | |
| | 25,000 | | | Comerica, Inc. | | | 1,702,750 | | |
| | 27,500 | | | Signature Bank | | | 4,130,500 | * | |
| | 25,000 | | | SVB Financial Group | | | 4,291,500 | * | |
| | | | 10,124,750 | | |
Biotechnology 3.2% | | | |
| | 22,500 | | | BioMarin Pharmaceutical, Inc. | | | 1,863,900 | * | |
| | 42,500 | | | Incyte Corp. | | | 4,261,475 | * | |
| | 55,000 | | | Neurocrine Biosciences, Inc. | | | 2,128,500 | * | |
| | 17,500 | | | TESARO, Inc. | | | 2,353,400 | * | |
| | | | 10,607,275 | | |
Capital Markets 3.1% | | | |
| | 15,250 | | | Affiliated Managers Group, Inc. | | | 2,215,825 | * | |
| | 51,550 | | | CBOE Holdings, Inc. | | | 3,809,029 | | |
| | 60,500 | | | Raymond James Financial, Inc. | | | 4,190,835 | | |
| | | | 10,215,689 | | |
Chemicals 3.9% | | | |
| | 58,000 | | | RPM International, Inc. | | | 3,122,140 | | |
| | 39,000 | | | Scotts Miracle-Gro Co. Class A | | | 3,726,450 | | |
| | 50,750 | | | Sensient Technologies Corp. | | | 3,987,935 | | |
| | 29,000 | | | WR Grace & Co. | | | 1,961,560 | | |
| | | | 12,798,085 | | |
Commercial Services & Supplies 2.1% | | | |
| | 27,500 | | | Cintas Corp. | | | 3,177,900 | | |
| | 47,000 | | | Waste Connections, Inc. | | | 3,693,730 | | |
| | | | 6,871,630 | | |
Communications Equipment 1.2% | | | |
| | 40,000 | | | Lumentum Holdings, Inc. | | | 1,546,000 | * | |
| | 30,000 | | | Motorola Solutions, Inc. | | | 2,486,700 | | |
| | | | 4,032,700 | | |
Distributors 1.1% | | | |
| | 121,000 | | | LKQ Corp. | | | 3,708,650 | * | |
Diversified Consumer Services 2.0% | | | |
| | 50,050 |
| | Bright Horizons Family
Solutions, Inc. | | | 3,504,501
| * | |
| | 105,750 | | | Service Corp. International | | | 3,003,300 | | |
| | | | 6,507,801 | | |
NUMBER OF SHARES | | | | VALUE | |
Electrical Equipment 1.1% | | | |
| | 15,000 | | | Acuity Brands, Inc. | | $ | 3,462,900 | | |
Electronic Equipment, Instruments &
Components 3.6% | | | |
| | 58,500 | | | Amphenol Corp. Class A | | | 3,931,200 | | |
| | 82,500 | | | CDW Corp. | | | 4,297,425 | | |
| | 28,000 | | | Cognex Corp. | | | 1,781,360 | | |
| | 65,000 | | | Trimble, Inc. | | | 1,959,750 | * | |
| | | | 11,969,735 | | |
Equity Real Estate Investment Trust 0.5% | | | |
| | 22,500 | | | Extra Space Storage, Inc. | | | 1,737,900 | | |
Food Products 2.8% | | | |
| | 42,500 | | | Conagra Brands, Inc. | | | 1,680,875 | | |
| | 40,000 | | | Lamb Weston Holdings, Inc. | | | 1,514,000 | | |
| | 72,500 | | | Pinnacle Foods, Inc. | | | 3,875,125 | | |
| | 25,000 | | | Post Holdings, Inc. | | | 2,009,750 | * | |
| | | | 9,079,750 | | |
Health Care Equipment & Supplies 8.3% | | | |
| | 25,000 | | | ABIOMED, Inc. | | | 2,817,000 | * | |
| | 14,500 | | | C.R. Bard, Inc. | | | 3,257,570 | | |
| | 53,500 | | | Edwards Lifesciences Corp. | | | 5,012,950 | * | |
| | 40,000 |
| | Integra LifeSciences
Holdings Corp. | | | 3,431,600
| * | |
| | 32,500 | | | Nevro Corp. | | | 2,361,450 | * | |
| | 67,500 | | | NuVasive, Inc. | | | 4,546,800 | * | |
| | 37,500 | | | Penumbra, Inc. | | | 2,392,500 | * | |
| | 150,000 | | | Wright Medical Group NV | | | 3,447,000 | * | |
| | | | 27,266,870 | | |
Health Care Providers & Services 2.5% | | | |
| | 40,000 | | | Centene Corp. | | | 2,260,400 | * | |
| | 45,000 | | | Envision Healthcare Corp. | | | 2,848,050 | * | |
| | 80,000 | | | HealthSouth Corp. | | | 3,299,200 | | |
| | | | 8,407,650 | | |
Hotels, Restaurants & Leisure 3.5% | | | |
| | 80,000 | | | Aramark | | | 2,857,600 | | |
| | 125,000 | | | MGM Resorts International | | | 3,603,750 | * | |
| | 110,000 | | | Red Rock Resorts, Inc. Class A | | | 2,550,900 | | |
| | 15,000 | | | Vail Resorts, Inc. | | | 2,419,650 | | |
| | | | 11,431,900 | | |
Household Durables 2.2% | | | |
| | 102,600 | | | Newell Brands, Inc. | | | 4,581,090 | | |
| | 14,500 | | | Whirlpool Corp. | | | 2,635,665 | | |
| | | | 7,216,755 | | |
See Notes to Financial Statements
6
Schedule of Investments Mid Cap Growth Portfolio (cont'd)
NUMBER OF SHARES | | | | VALUE | |
Industrial Conglomerates 1.2% | | | |
| | 22,500 | | | Roper Technologies, Inc. | | $ | 4,119,300 | | |
Insurance 1.6% | | | |
| | 46,500 | | | Assurant, Inc. | | | 4,317,990 | | |
| | 21,000 | | | Athene Holding Ltd. Class A | | | 1,007,790 | * | |
| | | | 5,325,780 | | |
Internet & Catalog Retail 0.8% | | | |
| | 24,000 | | | Expedia, Inc. | | | 2,718,720 | | |
Internet Software & Services 2.0% | | | |
| | 25,000 | | | CoStar Group, Inc. | | | 4,712,250 | * | |
| | 12,500 | | | MercadoLibre, Inc. | | | 1,951,750 | | |
| | | | 6,664,000 | | |
IT Services 5.4% | | | |
| | 82,500 | | | CSRA, Inc. | | | 2,626,800 | | |
| | 55,000 | | | Euronet Worldwide, Inc. | | | 3,983,650 | * | |
| | 34,750 | | | Fiserv, Inc. | | | 3,693,230 | * | |
| | 36,500 | | | Global Payments, Inc. | | | 2,533,465 | | |
| | 85,000 | | | Vantiv, Inc. Class A | | | 5,067,700 | * | |
| | | | 17,904,845 | | |
Life Sciences Tools & Services 0.6% | | | |
| | 10,000 |
| | Bio-Rad Laboratories, Inc.
Class A | | | 1,822,800
| * | |
Machinery 3.2% | | | |
| | 52,500 | | | Fortive Corp. | | | 2,815,575 | | |
| | 40,000 | | | IDEX Corp. | | | 3,602,400 | | |
| | 59,250 | | | Milacron Holdings Corp. | | | 1,103,827 | * | |
| | 27,500 | | | Stanley Black & Decker, Inc. | | | 3,153,975 | | |
| | | | 10,675,777 | | |
Media 0.7% | | | |
| | 40,000 | | | DISH Network Corp. Class A | | | 2,317,200 | * | |
Multiline Retail 0.7% | | | |
| | 30,000 | | | Dollar Tree, Inc. | | | 2,315,400 | * | |
Oil, Gas & Consumable Fuels 2.1% | | | |
| | 24,000 | | | Concho Resources, Inc. | | | 3,182,400 | * | |
| | 21,000 | | | Diamondback Energy, Inc. | | | 2,122,260 | * | |
| | 42,500 | | | Range Resources Corp. | | | 1,460,300 | | |
| | | | 6,764,960 | | |
Pharmaceuticals 2.2% | | | |
| | 20,000 | | | Jazz Pharmaceuticals PLC | | | 2,180,600 | * | |
| | 97,450 | | | Zoetis, Inc. | | | 5,216,499 | | |
| | | | 7,397,099 | | |
NUMBER OF SHARES | | | | VALUE | |
Professional Services 1.4% | | | |
| | 65,500 | | | WageWorks, Inc. | | $ | 4,748,750 | * | |
Road & Rail 1.8% | | | |
| | 41,050 |
| | J.B. Hunt Transport
Services, Inc. | | | 3,984,724
| | |
| | 24,000 |
| | Old Dominion Freight
Line, Inc. | | | 2,058,960
| * | |
| | | | 6,043,684 | | |
Semiconductors & Semiconductor
Equipment 6.6% | | | |
| | 30,000 | | | Lam Research Corp. | | | 3,171,900 | | |
| | 60,000 |
| | MACOM Technology
Solutions Holdings, Inc. | | | 2,776,800
| * | |
| | 72,500 | | | Microsemi Corp. | | | 3,912,825 | * | |
| | 45,000 | | | Monolithic Power
Systems, Inc. | | | 3,686,850
| | |
| | 77,500 | | | NVIDIA Corp. | | | 8,272,350 | | |
| | | | 21,820,725 | | |
Software 6.3% | | | |
| | 85,000 | | | Activision Blizzard, Inc. | | | 3,069,350 | | |
| | 45,000 | | | Electronic Arts, Inc. | | | 3,544,200 | * | |
| | 45,000 | | | Guidewire Software, Inc. | | | 2,219,850 | * | |
| | 40,000 | | | Proofpoint, Inc. | | | 2,826,000 | * | |
| | 38,500 | | | ServiceNow, Inc. | | | 2,862,090 | * | |
| | 23,000 | | | Tyler Technologies, Inc. | | | 3,283,710 | * | |
| | 16,500 |
| | Ultimate Software
Group, Inc. | | | 3,008,775
| * | |
| | | | 20,813,975 | | |
Specialty Retail 8.5% | | | |
| | 67,000 | | | Burlington Stores, Inc. | | | 5,678,250 | * | |
| | 37,500 | | | Dick's Sporting Goods, Inc. | | | 1,991,250 | | |
| | 52,500 | | | Five Below, Inc. | | | 2,097,900 | * | |
| | 20,000 | | | Lithia Motors, Inc. Class A | | | 1,936,600 | | |
| | 20,000 | | | O'Reilly Automotive, Inc. | | | 5,568,200 | * | |
| | 85,000 | | | Ross Stores, Inc. | | | 5,576,000 | | |
| | 35,000 | | | Tractor Supply Co. | | | 2,653,350 | | |
| | 10,000 |
| | Ulta Salon Cosmetics &
Fragrance, Inc. | | | 2,549,400
| * | |
| | | | 28,050,950 | | |
Textiles, Apparel & Luxury Goods 0.5% | | | |
| | 80,000 | | | Hanesbrands, Inc. | | | 1,725,600 | | |
Trading Companies & Distributors 1.8% | | | |
| | 37,500 | | | HD Supply Holdings, Inc. | | | 1,594,125 | * | |
| | 22,500 | | | United Rentals, Inc. | | | 2,375,550 | * | |
| | 9,000 | | | W.W. Grainger, Inc. | | | 2,090,250 | | |
| | | | 6,059,925 | | |
See Notes to Financial Statements
7
Schedule of Investments Mid Cap Growth Portfolio (cont'd)
NUMBER OF SHARES | | | | VALUE | |
Wireless Telecommunication
Services 1.2% | | | |
| | 70,000 | | | T-Mobile US, Inc. | | $ | 4,025,700 | * | |
| | | | | Total Common Stocks
(Cost $254,180,892) | | | 310,304,430
| | |
Exchange Traded Fund 0.9% | | | |
| | 30,000 |
| | iShares Russell Mid-Cap
(Cost $2,886,294) | | | 2,921,700
Growth ETF
| | |
Short-Term Investment 5.3% | | | |
Investment Company 5.3% | | | |
| | 17,445,931 |
| | State Street Institutional U.S.
Government Money Market
Fund Premier Class, 0.42%
(Cost $17,445,931) | | | 17,445,931
| (a) | |
| | | | | Total Investments 100.1%
(Cost $274,513,117) | | | 330,672,061
| | |
| | | | | Other Assets Less Liabilities (0.1)% | | | (450,540 | ) | |
| | | | | Net Assets 100.0% | | $ | 330,221,521 | | |
* Non-income producing security.
(a) Represents 7-day effective yield as of 12/31/2016.
The following is a summary, categorized by Level (see Note A of Notes to Financial Statements), of inputs used to value the Fund's investments as of December 31, 2016:
Asset Valuation Inputs | | Level 1 | | Level 2 | | Level 3 | | Total | |
Investments: | |
Common Stocks(a) | | $ | 310,304,430 | | | $ | — | | | $ | — | | | $ | 310,304,430 | | |
Exchange Traded Fund | | | 2,921,700 | | | | — | | | | — | | | | 2,921,700 | | |
Short-Term Investment | | | — | | | | 17,445,931 | | | | — | | | | 17,445,931 | | |
Total Investments | | $ | 313,226,130 | | | $ | 17,445,931 | | | $ | — | | | $ | 330,672,061 | | |
(a) The Schedule of Investments provides information on the industry categorization for the portfolio.
As of the year ended December 31, 2016, no securities were transferred from one level (as of December 31, 2015) to another.
See Notes to Financial Statements
8
Statement of Assets and Liabilities
Neuberger Berman Advisers Management Trust
| | | MID CAP
GROWTH
PORTFOLIO | |
| | | December 31, 2016 | |
Assets | |
Investments in securities, at value* (Note A)—see Schedule of Investments: | |
Unaffiliated issuers | | $ | 330,672,061 | | |
Dividends and interest receivable | | | 125,457 | | |
Receivable for Fund shares sold | | | 15,251 | | |
Prepaid expenses and other assets | | | 10,186 | | |
Total Assets | | | 330,822,955 | | |
Liabilities | |
Payable for Fund shares redeemed | | | 222,713 | | |
Payable to investment manager (Note B) | | | 153,211 | | |
Payable to administrator (Note B) | | | 136,635 | | |
Accrued expenses and other payables | | | 88,875 | | |
Total Liabilities | | | 601,434 | | |
Net Assets | | $ | 330,221,521 | | |
Net Assets consist of: | |
Paid-in capital | | $ | 266,197,966 | | |
Accumulated net realized gains (losses) on investments | | | 7,864,611 | | |
Net unrealized appreciation (depreciation) in value of investments | | | 56,158,944 | | |
Net Assets | | $ | 330,221,521 | | |
Net Assets | |
Class I | | $ | 85,790,360 | | |
Class S | | | 244,431,161 | | |
Shares Outstanding ($.001 par value; unlimited shares authorized) | |
Class I | | | 3,794,062 | | |
Class S | | | 11,572,475 | | |
Net Asset Value, offering and redemption price per share | |
Class I | | $ | 22.61 | | |
Class S | | | 21.12 | | |
*Cost of Investments | | $ | 274,513,117 | | |
See Notes to Financial Statements
9
Neuberger Berman Advisers Management Trust
| | | MID CAP
GROWTH
PORTFOLIO | |
| | | For the
Year Ended
December 31, 2016 | |
Investment Income: | |
Income (Note A): | |
Dividend income—unaffiliated issuers | | $ | 2,067,727 | | |
Interest income—unaffiliated issuers | | | 64,011 | | |
Foreign taxes withheld (Note A) | | | (2,074 | ) | |
Total income | | $ | 2,129,664 | | |
Expenses: | |
Investment management fees (Note B) | | | 1,785,785 | | |
Administration fees (Note B): | |
Class I | | | 273,346 | | |
Class S | | | 711,388 | | |
Distribution fees (Note B): | |
Class S | | | 592,824 | | |
Audit fees | | | 46,560 | | |
Custodian and accounting fees | | | 103,949 | | |
Insurance expense | | | 10,777 | | |
Legal fees | | | 195,805 | | |
Shareholder reports | | | 41,966 | | |
Trustees' fees and expenses | | | 55,214 | | |
Interest expense | | | 1,549 | | |
Miscellaneous | | | 22,109 | | |
Total net expenses | | | 3,841,272 | | |
Net investment income (loss) | | $ | (1,711,608 | ) | |
Realized and Unrealized Gain (Loss) on Investments (Note A): | |
Net realized gain (loss) on: | |
Sales of investment securities of unaffiliated issuers | | | 8,821,034 | | |
Foreign currency | | | (1,880 | ) | |
Change in net unrealized appreciation (depreciation) in value of: | |
Unaffiliated investment securities | | | 6,722,072 | | |
Foreign currency | | | 2,153 | | |
Net gain (loss) on investments | | | 15,543,379 | | |
Net increase (decrease) in net assets resulting from operations | | $ | 13,831,771 | | |
See Notes to Financial Statements
10
Statements of Changes in Net Assets
Neuberger Berman Advisers Management Trust
| | | MID CAP GROWTH PORTFOLIO | |
| | | Year Ended
December 31,
2016 | | Year Ended
December 31,
2015 | |
Increase (Decrease) in Net Assets: | |
From Operations: | |
Net investment income (loss) (Note A) | | $ | (1,711,608 | ) | | $ | (1,957,702 | ) | |
Net realized gain (loss) on investments (Note A) | | | 8,819,154 | | | | 15,988,521 | | |
Net increase from payments by affiliates (Note B) | | | — | | | | 216,506 | | |
Change in net unrealized appreciation (depreciation) of investments (Note A) | | | 6,724,225 | | | | (17,789,867 | ) | |
Net increase (decrease) in net assets resulting from operations | | | 13,831,771 | | | | (3,542,542 | ) | |
Distributions to Shareholders From (Note A): | |
Net realized gain on investments: | |
Class I | | | (3,945,881 | ) | | | (8,101,561 | ) | |
Class S | | | (11,953,217 | ) | | | (18,371,016 | ) | |
Total distributions to shareholders | | | (15,899,098 | ) | | | (26,472,577 | ) | |
From Fund Share Transactions (Note D): | |
Proceeds from shares sold: | |
Class I | | | 7,360,678 | | | | 41,184,693 | | |
Class S | | | 22,554,951 | | | | 87,920,541 | | |
Proceeds from reinvestment of dividends and distributions: | |
Class I | | | 3,945,881 | | | | 8,101,561 | | |
Class S | | | 11,953,217 | | | | 18,371,016 | | |
Proceeds from shares issued in connection with tax-free reorganizations (Note F) | |
Class I | | | — | | | | 20,675,262 | | |
Class S | | | — | | | | 13,738,256 | | |
Payments for shares redeemed: | |
Class I | | | (36,959,521 | ) | | | (18,868,871 | ) | |
Class S | | | (25,710,083 | ) | | | (10,919,445 | ) | |
Net increase (decrease) from Fund share transactions | | | (16,854,877 | ) | | | 160,203,013 | | |
Net Increase (Decrease) in Net Assets | | | (18,922,204 | ) | | | 130,187,894 | | |
Net Assets: | |
Beginning of year | | | 349,143,725 | | | | 218,955,831 | | |
End of year | | $ | 330,221,521 | | | $ | 349,143,725 | | |
Undistributed net investment income (loss) at end of year | | $ | — | | | $ | — | | |
See Notes to Financial Statements
11
Notes to Financial Statements Mid Cap Growth Portfolio
Note A—Summary of Significant Accounting Policies:
1 General: Neuberger Berman Advisers Management Trust (the "Trust") is a Delaware statutory trust organized pursuant to an Amended and Restated Trust Instrument dated March 27, 2014. The Trust is currently comprised of eight separate operating series (each individually a "Fund," and collectively the "Funds") each of which is diversified. The Trust is registered as an open-end management investment company under the Investment Company Act of 1940, as amended (the "1940 Act"), and its shares are registered under the Securities Act of 1933, as amended. Neuberger Berman Advisers Management Trust Mid Cap Growth Portfolio (the "Fund") currently offers Class I and Class S shares. The Trust's Board of Trustees (the "Board") may establish additional series or classes of shares without the approval of shareholders.
The assets of each Fund belong only to that Fund, and the liabilities of each Fund are borne solely by that Fund and no other.
The Fund is an investment company and accordingly follows the investment company accounting and reporting guidance of the Financial Accounting Standards Board ("FASB") Accounting Standard Codification Topic 946 "Financial Services—Investment Companies."
The preparation of financial statements in accordance with U.S. generally accepted accounting principles ("GAAP") requires Neuberger Berman Investment Advisers LLC ("NBIA" or "Management") to make estimates and assumptions at the date of the financial statements. Actual results could differ from those estimates.
Shares of the Fund are not available to the general public and may be purchased only by life insurance companies to serve as an investment vehicle for premiums paid under their variable annuity and variable life insurance contracts and to certain qualified pension and other retirement plans.
2 Portfolio valuation: In accordance with Accounting Standards Codification ("ASC") 820 "Fair Value Measurement" ("ASC 820"), all investments held by the Fund are carried at the value that Management believes the Fund would receive upon selling an investment in an orderly transaction to an independent buyer in the principal or most advantageous market for the investment under current market conditions. Various inputs, including the volume and level of activity for the asset or liability in the market, are considered in valuing the Fund's investments, some of which are discussed below. Significant Management judgment may be necessary to value investments in accordance with ASC 820.
ASC 820 established a three-tier hierarchy of inputs to create a classification of value measurements for disclosure purposes. The three-tier hierarchy of inputs is summarized in the three broad Levels listed below.
• Level 1—quoted prices in active markets for identical investments
• Level 2—other observable inputs (including quoted prices for similar investments, interest rates, prepayment speeds, credit risk, amortized cost, etc.)
• Level 3—unobservable inputs (including the Fund's own assumptions in determining the fair value of investments)
The inputs or methodology used for valuing an investment are not necessarily an indication of the risk associated with investing in those securities.
The value of the Fund's investments in equity securities and exchange-traded funds, for which market quotations are readily available, is generally determined by Management by obtaining valuations from independent pricing services based on the latest sale price quoted on a principal exchange or market for that security (Level 1 inputs). Securities traded primarily on the NASDAQ Stock Market are normally valued at the NASDAQ Official Closing Price ("NOCP") provided by NASDAQ each business day. The NOCP is the most recently reported price as
12
of 4:00:02 p.m., Eastern Time, unless that price is outside the range of the "inside" bid and asked prices (i.e., the bid and asked prices that dealers quote to each other when trading for their own accounts); in that case, NASDAQ will adjust the price to equal the inside bid or asked price, whichever is closer. Because of delays in reporting trades, the NOCP may not be based on the price of the last trade to occur before the market closes. If there is no sale of a security on a particular day, the independent pricing services may value the security based on market quotations.
Management has developed a process to periodically review information provided by independent pricing services for all types of securities.
Investments in non-exchange traded investment companies are valued using the respective fund's daily calculated net asset value per share (Level 2 inputs).
If a valuation is not available from an independent pricing service, or if Management has reason to believe that the valuation received does not represent the amount the Fund might reasonably expect to receive on a current sale in an orderly transaction, Management seeks to obtain quotations from brokers or dealers (generally considered Level 2 or Level 3 inputs depending on the number of quotes available). If such quotations are not readily available, the security is valued using methods the Board has approved in the good-faith belief that the resulting valuation will reflect the fair value of the security. Numerous factors may be considered when determining the fair value of a security based on Level 2 or Level 3 inputs, including available analyst, media or other reports, securities within the same industry with recent highly correlated performance, trading in futures or American Depositary Receipts ("ADRs") and whether the issuer of the security being fair valued has other securities outstanding.
The value of the Fund's investments in foreign securities is generally determined using the same valuation methods and inputs as other Fund investments, as discussed above. Foreign security prices expressed in local currency values are normally translated from the local currency into U.S. dollars using the exchange rates as of 4:00 p.m. Eastern Time on days the New York Stock Exchange ("NYSE") is open for business. The Board has approved the use of Interactive Data Pricing and Reference Data LLC ("Interactive") to assist in determining the fair value of foreign equity securities when changes in the value of a certain index suggest that the closing prices on the foreign exchanges may no longer represent the amount that the Fund could expect to receive for those securities or on days when foreign markets are closed and U.S. markets are open. In each of these events, Interactive will provide adjusted prices for certain foreign equity securities using a statistical analysis of historical correlations of multiple factors (Level 2 inputs). In the absence of precise information about the market values of these foreign securities as of the time as of which a Fund's share price is calculated, the Board has determined on the basis of available data that prices adjusted in this way are likely to be closer to the prices the Fund could realize on a current sale than are the prices of those securities established at the close of the foreign markets in which the securities primarily trade.
Fair value prices are necessarily estimates, and there is no assurance that such a price will be at or close to the price at which the security is next quoted or next trades.
3 Foreign currency translation: The accounting records of the Fund are maintained in U.S. dollars. Foreign currency amounts are normally translated into U.S. dollars using the exchange rate as of 4:00 p.m. Eastern Time, on days the NYSE is open for business to determine the value of investments, other assets and liabilities. Purchase and sale prices of securities, and income and expenses, are translated into U.S. dollars at the prevailing rate of exchange on the respective dates of such transactions. Net unrealized foreign currency gain (loss), if any, arises from changes in the value of assets and liabilities, other than investments in securities, as a result of changes in exchange rates and is stated separately in the Statement of Operations.
4 Securities transactions and investment income: Securities transactions are recorded on trade date for financial reporting purposes. Dividend income is recorded on the ex-dividend date or, for certain foreign dividends, as soon as the Fund becomes aware of the dividends. Non-cash dividends included in dividend income, if any, are recorded at the fair market value of the securities received. Interest income, including accretion of original issue discount, where applicable, and accretion of discount on short-term investments, if any, is recorded on the accrual basis. Realized gains and losses from securities transactions and foreign currency transactions, if any, are recorded on the basis of identified cost and stated separately in the Statement of Operations. Included in net realized gain (loss) on
13
investments are proceeds from the settlements of class action litigation in which the Fund participated as a class member. The amount of such proceeds for the year ended December 31, 2016 was $166,555.
5 Income tax information: Each Fund is treated as a separate entity for U.S. federal income tax purposes. It is the policy of the Fund to continue to qualify for treatment as a regulated investment company ("RIC") by complying with the requirements of the U.S. Internal Revenue Code applicable to RICs and to distribute substantially all of its net investment income and net realized capital gains to its shareholders. To the extent the Fund distributes substantially all of its net investment income and net realized capital gains to shareholders, no federal income or excise tax provision is required.
The Fund has adopted the provisions of ASC 740 "Income Taxes" ("ASC 740"). ASC 740 sets forth a minimum threshold for financial statement recognition of a tax position taken, or expected to be taken, in a tax return. The Fund recognizes interest and penalties, if any, related to unrecognized tax positions as an income tax expense in the Statement of Operations. The Fund is subject to examination by U.S. federal and state tax authorities for returns filed for the tax years for which the applicable statutes of limitations have not yet expired. As of December 31, 2016, the Fund did not have any unrecognized tax positions.
At December 31, 2016, the cost of investments for U.S. federal income tax basis was $274,712,714. Gross unrealized appreciation of investments was $60,407,044 and gross unrealized depreciation of investments was $4,447,697 resulting in net unrealized appreciation of $55,959,347 based on cost for U.S. federal income tax purposes.
Income distributions and capital gain distributions are determined in accordance with income tax regulations, which may differ from GAAP. These differences are primarily due to differing treatments of income and gains on various investment securities held by the Fund, timing differences and differing characterization of distributions made by the Fund. The Fund may also utilize earnings and profits distributed to shareholders on redemption of their shares as a part of the dividends-paid deduction for income tax purposes.
As determined on December 31, 2016, permanent differences resulting primarily from different book and tax accounting were reclassified at year end. Such differences are attributed to the tax treatment of: net operating losses, adjustments related to real estate investment trusts ("REITs"), non-taxable adjustments to income, foreign currency gains and losses and prior year partnership adjustments. These reclassifications had no effect on net income, net asset value ("NAV") or NAV per share of the Fund. For the year ended December 31, 2016, the Fund recorded the following permanent reclassifications:
| Paid-in Capital | | Undistributed
Net Investment
Income (Loss) | | Accumulated
Net Realized
Gains (Losses)
on Investments | |
| $ | (1,762,246 | ) | | $ | 1,711,608 | | | $ | 50,638 | | |
The tax character of distributions paid during the years ended December 31, 2016 and December 31, 2015 was as follows:
Distributions Paid From: | |
Ordinary Income | | Long-Term Capital Gain | | Total | |
| 2016 | | 2015 | | 2016 | | 2015 | | 2016 | | 2015 | |
| $ | — | | | $ | — | | | $ | 15,899,098 | | | $ | 26,472,577 | | | $ | 15,899,098 | | | $ | 26,472,577 | | |
As of December 31, 2016, the components of distributable earnings (accumulated losses) on a U.S. federal income tax basis were as follows:
Undistributed
Long-Term
Capital Gain | | Unrealized
Appreciation/
(Depreciation) | | Loss
Carryforwards
and Deferrals | | Other
Temporary
Differences | | Total | |
| $ | 8,064,207 | | | $ | 55,959,347 | | | $ | — | | | $ | 1 | | | $ | 64,023,555 | | |
14
The temporary difference between book basis and tax basis distributable earnings is primarily due to losses disallowed and recognized on wash sales and tax adjustments related to REITs.
To the extent the Fund's net realized capital gains, if any, can be offset by capital loss carryforwards, it is the policy of the Fund not to distribute such gains. The Regulated Investment Company Modernization Act of 2010 (the "Act") made changes to the capital loss carryforward rules allowing for RICs to carry forward capital losses indefinitely and to retain the character of capital loss carryforwards as short-term or long-term ("Post-Enactment"). Rules in effect previously limited the carryforward period to eight years and all carryforwards were considered short-term in character ("Pre-Enactment"). As determined at December 31, 2016, the Fund had unused capital loss carryforwards available for federal income tax purposes to offset net realized capital gains, if any, as follows:
Post-Enactment capital loss carryforwards must be fully used before Pre-Enactment capital loss carryforwards; therefore, under certain circumstances, Pre-Enactment capital loss carryforwards available as of the report date may expire unused. As of December 31, 2016, the Fund had no Post-Enactment capital loss carryforwards.
During the year ended December 31, 2016, the Fund utilized capital loss carryforwards of $868,370.
6 Distributions to shareholders: The Fund may earn income, net of expenses, daily on its investments. Distributions from net investment income and net realized capital gains, if any, are generally distributed once a year (usually in October). Income distributions and capital gain distributions to shareholders are recorded on the ex-date.
7 Foreign taxes: Foreign taxes withheld, if any, represent amounts withheld by foreign tax authorities, net of refunds recoverable.
8 Expense allocation: Certain expenses are applicable to multiple funds within the complex of related investment companies. Expenses directly attributable to a Fund are charged to that Fund. Expenses of the Trust that are not directly attributable to a particular series of the Trust (e.g., the Fund) are allocated among the series of the Trust, on the basis of relative net assets, except where a more appropriate allocation of expenses to each of the series can otherwise be made fairly. Expenses borne by the complex of related investment companies, which includes open-end and closed-end investment companies for which Management serves as investment manager, that are not directly attributable to a particular investment company in the complex (e.g., the Trust) or series thereof are allocated among the investment companies in the complex or series thereof on the basis of relative net assets, except where a more appropriate allocation of expenses to each of the investment companies in the complex or series thereof can otherwise be made fairly. The Fund's expenses (other than those specific to each class) are allocated proportionally each day among the classes based upon the relative net assets of each class.
9 Investments in foreign securities: Investing in foreign securities may involve sovereign and other risks, in addition to the credit and market risks normally associated with domestic securities. These additional risks include the possibility of adverse political and economic developments (including political instability, nationalization, expropriation, or confiscatory taxation) and the potentially adverse effects of unavailability of public information regarding issuers, less governmental supervision and regulation of financial markets, reduced liquidity of certain financial markets, and the lack of uniform accounting, auditing, and financial reporting standards or the application of standards that are different or less stringent than those applied in the United States. Foreign securities also may experience greater price volatility, higher rates of inflation, and delays in settlement.
10 Indemnifications: Like many other companies, the Trust's organizational documents provide that its officers ("Officers") and trustees ("Trustees") are indemnified against certain liabilities arising out of the performance of their duties to the Trust. In addition, both in some of its principal service contracts and in the normal course of its business, the Trust enters into contracts that provide indemnifications to other parties for certain types of losses or liabilities. The Trust's maximum exposure under these arrangements is unknown as this could involve future claims against the Trust.
11 Investment company securities and exchange-traded funds: The Fund may invest in shares of other registered investment companies, including exchange-traded funds ("ETFs"), within the limitations prescribed by the 1940
15
Act. Some ETFs seek to track the performance of a particular market index. These indices include both broad-based market indices and more narrowly-based indices, including those relating to particular sectors, markets, regions or industries. However, some ETFs have an actively-managed investment objective. ETF shares are traded like traditional equity securities on a national securities exchange or NASDAQ. A Fund will indirectly bear its proportionate share of any management fees and other expenses paid by such other investment companies, which will increase expenses and decrease returns.
12 Other: All net investment income and realized and unrealized capital gains and losses of the Fund are allocated, on the basis of relative net assets, pro rata among its respective classes.
Note B—Investment Management Fees, Administration Fees, Distribution Arrangements, and Other Transactions with Affiliates:
The Fund retains Management as its investment manager under a Management Agreement. For such investment management services, the Fund pays Management a fee at the annual rate of 0.55% of the first $250 million of the Fund's average daily net assets, 0.525% of the next $250 million, 0.50% of the next $250 million, 0.475% of the next $250 million, 0.45% of the next $500 million, 0.425% of the next $2.5 billion, and 0.40% of average daily net assets in excess of $4 billion. Accordingly, for the year ended December 31, 2016, the investment management fee pursuant to the Management Agreement was equivalent to an annual effective rate of 0.54% of the Fund's average daily net assets.
The Fund retains Management as its administrator under an Administration Agreement. Each class pays Management an administration fee at the annual rate of 0.30% of its average daily net assets under this agreement. Additionally, Management retains State Street Bank and Trust Company ("State Street") as its sub-administrator under a Sub-Administration Agreement. Management pays State Street a fee for all services received under this agreement.
Neuberger Berman BD LLC (the "Distributor") is the Fund's "principal underwriter" within the meaning of the 1940 Act. It acts as agent in arranging for the sale of the Fund's Class I shares without sales commission or other compensation and bears all advertising and promotion expenses incurred in the sale of those shares. The Board adopted a non-fee distribution plan for the Fund's Class I.
The Board has adopted a distribution and shareholder services plan (the "Plan") for Class S shares pursuant to Rule 12b-1 under the 1940 Act. The Plan provides that, for its activities and expenses related to the sale and distribution of Class S, and ongoing services provided to investors in the class, the Distributor receives from Class S a fee at the annual rate of 0.25% of Class S's average daily net assets. Distributor may pay a portion of the proceeds from the 12b-1 fee to insurance companies or their affiliates and qualified plan administrators ("intermediaries") for services they provide respecting the Fund to current and prospective variable contract owners and qualified plan participants that invest in the Fund through the intermediaries. Those institutions may use the payments for, among other purposes, compensating employees engaged in sales and/or shareholder servicing. The amount of fees paid by the class during any year may be more or less than the cost of distribution and other services provided to the class. FINRA rules limit the amount of annual distribution fees that may be paid by a mutual fund and impose a ceiling on the cumulative distribution fees paid. The Plan complies with those rules.
Management has contractually agreed to waive fees and/or reimburse the Fund's Class I and Class S shares so that the total annual operating expenses of those classes do not exceed the expense limitations as detailed in the following table. These undertakings include fees payable to Management for the Fund's Class S shares but exclude such fees payable for the Fund's Class I shares and exclude, for each class, interest (commitment fees relating to borrowings are treated as interest for purposes of this exclusion), taxes, transaction costs, brokerage commissions, dividend and interest expenses relating to short sales, acquired fund fees and expenses and extraordinary expenses if any; consequently, net expenses may exceed the contractual expense limitations. The Fund has agreed that each of its classes will repay Management for fees and expenses waived or reimbursed for that class provided that
16
repayment does not cause that class's annual operating expenses to exceed its contractual expense limitation in place at the time the fees and expenses were waived or reimbursed, or the expense limitation in place at the time the Fund repays Management, whichever is lower. Any such repayment must be made within three years after the year in which Management incurred the expense.
During the year ended December 31, 2016, there was no repayment to Management under its contractual expense limitation.
At December 31, 2016, the Fund had no contingent liability to Management under its contractual expense limitation.
| | | | | | | Expenses Reimbursed in
Fiscal Year Ending December 31, | |
| | | | | | | 2014 | | 2015 | | 2016 | |
| | | | | | | Subject to Repayment Until December 31, | |
| | | Contractual
Expense
Limitation(1) | | Expiration | | 2017 | | 2018 | | 2019 | |
Class I | | | 1.00 | % | | 12/31/19 | | $ | — | | | $ | — | | | $ | — | | |
Class S | | | 1.25 | % | | 12/31/19 | | | — | | | | — | | | | — | | |
(1) Expense limitation per annum of the respective class's average daily net assets.
Neuberger Berman LLC ("Neuberger") was retained by Management through December 31, 2015, pursuant to a Sub-Advisory Agreement to furnish it with investment recommendations and research information without added cost to the Fund. Several individuals who are Officers and/or Trustees of the Trust are also employees of Neuberger and/or Management. As a result of the entity consolidation described on page 3 of this Annual Report, the services previously provided by Neuberger under the Sub-Advisory Agreement are being provided by NBIA as of January 1, 2016.
For the year ended December 31, 2015, the Fund recorded a capital contribution from Management in the amount of $216,506. This amount was paid in connection with losses incurred in the execution of a trade.
Note C—Securities Transactions:
During the year ended December 31, 2016, there were purchase and sale transactions (excluding short-term securities) of $170,425,525 and $202,919,868, respectively.
During the year ended December 31, 2016, no brokerage commissions on securities transactions were paid to affiliated brokers.
Note D—Fund Share Transactions:
Share activity for the years ended December 31, 2016 and December 31, 2015 was as follows:
For the Year Ended December 31, 2016
| | | Shares Sold | | Shares Issued on
Reinvestment of
Dividends and
Distributions | | Shares
Redeemed | | Total | |
Class I | | | 336,199 | | | | 180,672 | | | | (1,676,622 | ) | | | (1,159,751 | ) | |
Class S | | | 1,126,637 | | | | 585,655 | | | | (1,219,712 | ) | | | 492,580 | | |
17
For the Year Ended December 31, 2015
| | | Shares Sold | | Shares Issued on
Reinvestment of
Dividends and
Distributions | | Shares Issued
in Connection
With Tax-Free
Reorganizations
(see Note F) | | Shares
Redeemed | | Total | |
Class I | | | 1,633,736 | | | | 347,259 | | | | 871,902 | | | | (740,441 | ) | | | 2,112,456 | | |
Class S | | | 3,642,482 | | | | 837,712 | | | | 616,453 | | | | (453,361 | ) | | | 4,643,286 | | |
Note E—Line of Credit:
At December 31, 2016, the Fund was a participant in a syndicated committed, unsecured $700,000,000 line of credit (the "Credit Facility"), to be used only for temporary or emergency purposes. Series of other investment companies managed by Management also participate in this line of credit on substantially the same terms except that some do not have access to the full amount of the Credit Facility. Interest is charged on borrowings under this Credit Facility at the higher of (a) a federal funds effective rate plus 1.00% per annum or (b) a Eurodollar rate for a one-month period plus 1.00% per annum. The Credit Facility has an annual commitment fee of 0.15% per annum of the available line of credit, which is paid quarterly. The Fund has agreed to pay its pro rata share of the annual commitment fee, based on the ratio of its individual net assets to the net assets of all participants at the time the fee is due and payable and the level of its access to the Credit Facility, and interest charged on any borrowing made by the Fund and other costs incurred by the Fund. Because several mutual funds participate in the Credit Facility, there is no assurance that the Fund will have access to all or any part of the $700,000,000 at any particular time. There were no loans outstanding under the Credit Facility at December 31, 2016. During the period ended December 31, 2016, the Fund did not utilize the Credit Facility.
Note F—Reorganizations:
At a meeting held on June 24, 2015, the Board, unanimously approved the tax free reorganization of the Neuberger Berman Advisers Management Trust Balanced Portfolio ("Balanced"), Neuberger Berman Advisers Management Trust Growth Portfolio ("Growth") and Neuberger Berman Advisers Management Trust Small Cap Growth Portfolio ("Small Cap Growth") (the "Target Funds") into the Neuberger Berman Advisers Management Trust Mid Cap Growth Portfolio ("Mid Cap Growth") (the "Acquiring Fund"), each, a separate series of the Trust. On November 6, 2015, the Acquiring Fund acquired all of the net assets of the Target Funds in a tax-free exchange of shares pursuant to an Agreement and Plan of Reorganization and Dissolution approved by the Board. The purpose of the transaction was to combine four portfolios with similar investment objectives, policies and risks.
Balanced | | Shares Prior to
Reorganization | | Shares issued by the
Acquiring Fund | | Net Assets Prior to
Reorganization | |
Class I | | | 1,212,817 | | | | 551,083 | | | $ | 13,067,738 | | |
Growth | | Shares Prior to
Reorganization | | Shares issued by the
Acquiring Fund | | Net Assets Prior to
Reorganization | |
Class I | | | 245,859 | | | | 320,819 | | | $ | 7,607,524 | | |
Small Cap Growth | | Shares Prior to
Reorganization | | Shares issued by the
Acquiring Fund | | Net Assets Prior to
Reorganization | |
Class S | | | 899,619 | | | | 616,453 | | | $ | 13,738,256 | | |
18
The appreciation of Balanced, Growth and Small Cap Growth were $2,555,165, $2,288,793 and $629,431, respectively, as of the date of the reorganization. The combined net assets of the Acquiring Fund immediately after the reorganization were $349,985,854.
Assuming the reorganization had been completed on January 1, 2015, the beginning of the reporting period of the Acquiring Fund, the Acquiring Fund's pro forma results of operations for the period ended December 31, 2015, were as follows:
Net Investment Income (Loss) | | $ | (2,136,312 | ) | |
Net Realized and Unrealized Gains/Losses on Investments and Foreign Currency Transactions | | | (772,285 | ) | |
Net Increase/Decrease in Net Assets resulting from Operations | | $ | (2,908,597 | ) | |
Because the combined investment portfolios have been managed as a single integrated portfolio since the reorganization was completed, it is not practicable to separate the amounts of revenue and earnings of the Target Funds that have been included in the Acquiring Fund's Statement of Changes as of December 31, 2015.
Note G—Recent Accounting Pronouncement:
In October 2016, the U.S. Securities and Exchange Commission ("SEC") adopted new rules and forms, and amendments to certain current rules and forms, to modernize reporting and disclosure of information by registered investment companies. The amendments to Regulation S-X will require standardized, enhanced disclosure about derivatives in investment company financial statements, and will also change the rules governing the form and content of such financial statements. The compliance date for the amendments to Regulation S-X is August 1, 2017. Management is currently evaluating the impact that the adoption of the amendments to Regulation S-X will have on the Fund's financial statements and related disclosures.
19
Mid Cap Growth Portfolio
The following tables include selected data for a share outstanding throughout each year and other performance information derived from the Financial Statements. Amounts that do not round to $0.01 or $(0.01) per share are presented as $0.00 or $(0.00), respectively. Ratios that do not round to 0.01% or (0.01)% are presented as 0.00% or (0.00)%, respectively. A "—" indicates that the line item was not applicable in the corresponding period.
Class I | |
| | | Year Ended December 31, | |
| | | 2016 | | 2015 | | 2014 | | 2013 | | 2012 | |
Net Asset Value, Beginning of Year | | $ | 22.73 | | | $ | 24.50 | | | $ | 41.07 | | | $ | 30.97 | | | $ | 27.55 | | |
Income From Investment Operations: | |
| Net Investment Income (Loss)@ | | | (0.08 | ) | | | (0.14 | ) | | | (0.19 | ) | | | (0.19 | ) | | | (0.10 | ) | |
Net Gains or Losses on Securities
(both realized and unrealized) | | | 1.04 | | | | 0.49 | | | | 1.08 | | | | 10.29 | | | | 3.52 | | |
Total From Investment Operations | | | 0.96 | | | | 0.35 | | | | 0.89 | | | | 10.10 | | | | 3.42 | | |
Less Distributions From: | |
Net Capital Gains | | | (1.08 | ) | | | (2.14 | ) | | | (17.46 | ) | | | — | | | | — | | |
Voluntary Contribution from Management | | | — | | | | 0.02 | | | | 0.00 | | | | — | | | | — | | |
Net Asset Value, End of Year | | $ | 22.61 | | | $ | 22.73 | | | $ | 24.50 | | | $ | 41.07 | | | $ | 30.97 | | |
| Total Return† | | | 4.40 | %^ | | | 1.28 | %^µ | | | 7.58 | %µ | | | 32.61 | %^ | | | 12.41 | %^ | |
Ratios/Supplemental Data | |
Net Assets, End of Year (in millions) | | $ | 85.8 | | | $ | 112.6 | | | $ | 69.6 | | | $ | 68.6 | | | $ | 229.0 | | |
| Ratio of Gross Expenses to Average Net Assets# | | | 0.99 | % | | | 0.98 | % | | | 1.00 | % | | | 0.99 | % | | | 0.99 | % | |
Ratio of Net Expenses to Average Net Assets | | | 0.99 | % | | | 0.98 | % | | | 1.00 | % | | | 0.99 | % | | | 0.99 | %§ | |
Ratio of Net Investment Income (Loss) to Average
Net Assets | | | (0.35 | )% | | | (0.54 | )% | | | (0.53 | )% | | | (0.57 | )% | | | (0.34 | )% | |
Portfolio Turnover Rate | | | 54 | % | | | 58 | %ñ | | | 64 | % | | | 43 | % | | | 38 | % | |
See Notes to Financial Highlights
20
Financial Highlights (cont'd)
Class S | |
| | | Year Ended December 31, | |
| | | 2016 | | 2015 | | 2014 | | 2013 | | 2012 | |
Net Asset Value, Beginning of Year | | $ | 21.35 | | | $ | 23.20 | | | $ | 39.95 | | | $ | 30.21 | | | $ | 26.94 | | |
Income From Investment Operations: | |
| Net Investment Income (Loss)@ | | | (0.12 | ) | | | (0.19 | ) | | | (0.27 | ) | | | (0.26 | ) | | | (0.17 | ) | |
Net Gains or Losses on Securities
(both realized and unrealized) | | | 0.97 | | | | 0.46 | | | | 0.98 | | | | 10.00 | | | | 3.44 | | |
Total From Investment Operations | | | 0.85 | | | | 0.27 | | | | 0.71 | | | | 9.74 | | | | 3.27 | | |
Less Distributions From: | |
Net Capital Gains | | | (1.08 | ) | | | (2.14 | ) | | | (17.46 | ) | | | — | | | | — | | |
Voluntary Contribution from Management | | | — | | | | 0.02 | | | | 0.00 | | | | — | | | | — | | |
Net Asset Value, End of Year | | $ | 21.12 | | | $ | 21.35 | | | $ | 23.20 | | | $ | 39.95 | | | $ | 30.21 | | |
| Total Return† | | | 4.16 | %^ | | | 1.00 | %^µ | | | 7.31 | %µ | | | 32.24 | % | | | 12.14 | %^ | |
Ratios/Supplemental Data | |
Net Assets, End of Year (in millions) | | $ | 244.4 | | | $ | 236.6 | | | $ | 149.3 | | | $ | 127.8 | | | $ | 88.2 | | |
Ratio of Gross Expenses to Average Net Assets | | | 1.24 | % | | | 1.24 | % | | | 1.25 | % | | | 1.26 | %# | | | 1.24 | % | |
Ratio of Net Expenses to Average Net Assets | | | 1.24 | % | | | 1.24 | %ß | | | 1.25 | %ß | | | 1.25 | % | | | 1.25 | %§ß | |
Ratio of Net Investment Income (Loss) to Average
Net Assets | | | (0.59 | )% | | | (0.80 | )% | | | (0.78 | )% | | | (0.76 | )% | | | (0.57 | )% | |
Portfolio Turnover Rate | | | 54 | % | | | 58 | %ñ | | | 64 | % | | | 43 | % | | | 38 | % | |
See Notes to Financial Highlights
21
Notes to Financial Highlights Mid Cap Growth Portfolio
† Total return based on per share NAV reflects the effects of changes in NAV on the performance of the Fund during each fiscal period. Returns assume income dividends and other distributions, if any, were reinvested. Results represent past performance and do not indicate future results. Current returns may be lower or higher than the performance data quoted. Investment returns and principal may fluctuate and shares when redeemed may be worth more or less than original cost. Total return would have been lower if Management had not reimbursed and/or waived certain expenses. Total return would have been higher if Management had not recouped previously reimbursed expenses. The total return information shown does not reflect charges and other expenses that apply to the separate accounts or the related insurance policies or other qualified pension or retirement plans, and the inclusion of these charges and other expenses would reduce the total return for all fiscal periods shown.
^ Had the Fund not received class action proceeds listed in Note A of the Notes to Financial Statements, total return based on per share NAV for the year ended December 31, 2016 would have been 4.35% and 4.11% for Class I and Class S, respectively. The class action proceeds received in 2015 had no impact on the Fund's total return for the year ended December 31, 2015. Had the Fund not received class action proceeds in 2013, total return based on per share NAV for the year ended December 31, 2013 would have been 32.58% for Class I. Had the Fund not received class action proceeds in 2012, total return based on per share NAV for the year ended December 31, 2012 would have been 12.34% and 12.06% for Class I and Class S, respectively.
# Represents the annualized ratios of net expenses to average daily net assets if Management had not reimbursed certain expenses and/or waived a portion of the investment management fee. Management did not reimburse or waive fees during the fiscal periods shown.
@ Calculated based on the average number of shares outstanding during each fiscal period.
§ Prior to January 1, 2013, the Fund had an expense offset arrangement in connection with its custodian contract. The impact of expense reductions related to expense offset arrangements, if any, was less than 0.01%.
ß After repayment of expenses previously reimbursed by Management. Had the Fund not made such repayments, the annualized ratio of net expenses to average daily net assets would have been:
| | | Year Ended December 31, | |
| | | 2015 | | 2014 | | 2013 | | 2012 | |
Class S | | | 1.24 | % | | | 1.25 | % | | | — | | | | 1.24 | % | |
µ Had the Fund not received the voluntary contribution listed in Note B of the Notes to Financial Statements, total return based on per share NAV for the year ended December 31, 2015 would have been 1.23% and 0.95% for Class I and Class S, respectively. The voluntary contribution received in 2014 had no impact on the Fund's total return for the year ended December 31, 2014.
ñ On November 6, 2015, Mid Cap Growth acquired all of the net assets of Balanced, Growth and Small Cap Growth pursuant to a Plan of Reorganization and Dissolution. Portfolio turnover excludes purchases and sales of securities by Balanced, Growth and Small Cap Growth (acquired funds) prior to the merger date.
22
Report of Independent Registered Public Accounting Firm
To the Board of Trustees of
Neuberger Berman Advisers Management Trust and
Shareholders of Mid Cap Growth Portfolio
We have audited the accompanying statement of assets and liabilities of Mid Cap Growth Portfolio, one of the series constituting Neuberger Berman Advisers Management Trust (the "Trust"), including the schedule of investments, as of December 31, 2016, and the related statement of operations for the year then ended, the statements of changes in net assets for each of the two years in the period then ended and the financial highlights for each of the five years in the period then ended. These financial statements and financial highlights are the responsibility of the Trust's management. Our responsibility is to express an opinion on these financial statements and financial highlights based on our audits.
We conducted our audits in accordance with the standards of the Public Company Accounting Oversight Board (United States). Those standards require that we plan and perform the audit to obtain reasonable assurance about whether the financial statements and financial highlights are free of material misstatement. We were not engaged to perform an audit of the Trust's internal control over financial reporting. Our audits included consideration of internal control over financial reporting as a basis for designing audit procedures that are appropriate in the circumstances, but not for the purpose of expressing an opinion on the effectiveness of the Trust's internal control over financial reporting. Accordingly, we express no such opinion. An audit also includes examining, on a test basis, evidence supporting the amounts and disclosures in the financial statements and financial highlights, assessing the accounting principles used and significant estimates made by management, and evaluating the overall financial statement presentation. Our procedures included confirmation of securities owned as of December 31, 2016 by correspondence with the custodian. We believe that our audits provide a reasonable basis for our opinion.
In our opinion, the financial statements and financial highlights referred to above present fairly, in all material respects, the financial position of Mid Cap Growth Portfolio, a series of Neuberger Berman Advisers Management Trust, at December 31, 2016, the results of its operations for the year then ended, the changes in its net assets for each of the two years in the period then ended, and the financial highlights for each of the five years in the period then ended in conformity with U.S. generally accepted accounting principles.
Boston, Massachusetts
February 10, 2017
23
The following tables set forth information concerning the Trustees and Officers of the Fund. All persons named as Trustees and Officers also serve in similar capacities for other funds administered or managed by Management. The Fund's Statement of Additional Information includes additional information about the Trustees as of the time of the Fund's most recent public offering and is available upon request, without charge, by calling (800) 877-9700.
Information about the Board of Trustees
Name, (Year of Birth),
and Address(1) | | Position(s) and
Length of
Time Served(2) | | Principal Occupation(s)(3) | | Number of
Funds in Fund
Complex
Overseen by
Fund Trustee | | Other Directorships
Held Outside Fund
Complex by Fund
Trustee(3) |
Independent Trustees |
Michael J. Cosgrove (1949) | | Trustee since 2015 | | President, Carragh Consulting USA, since 2014; formerly, Executive, General Electric Company, 1970 to 2014, including President, Mutual Funds and Global Investment Programs, GE Asset Management, 2011 to 2014, President and Chief Executive Officer, Mutual Funds and Intermediary Business, GE Asset Management, 2007 to 2011, President, Institutional Sales and Marketing, GE Asset Management, 1998 to 2007, and Chief Financial Officer, GE Asset Management, and Deputy Treasurer, GE Company, 1988 to 1993. | | 55 | | | Director, America Press, Inc. (not-for-profit Jesuit publisher), since 2015; Director, Fordham University, since 2001; formerly, Director, The Gabelli Go Anywhere Trust, June 2015 to June 2016; Director, Skin Cancer Foundation (not-for-profit), 2006 to 2015; Director, GE Investments Funds, Inc., 1997 to 2014; Trustee, GE Institutional Funds, 1997 to 2014; Director, GE Asset Management, 1988 to 2014; Director, Elfun Trusts, 1988 to 2014; Trustee, GE Pension & Benefit Plans, 1988 to 2014. |
Marc Gary (1952) | | Trustee since 2015 | | Executive Vice Chancellor and Chief Operating Officer, Jewish Theological Seminary, since 2012; formerly, Executive Vice President and General Counsel, Fidelity Investments, 2007 to 2012; Executive Vice President and General Counsel, BellSouth Corporation, 2004 to 2007; Vice President and Associate General Counsel, BellSouth Corporation, 2000 to 2004; Associate, Partner, and National Litigation Practice Co-Chair, Mayer, Brown LLP, 1981 to 2000; Associate Independent Counsel, Office of Independent Counsel, 1990 to 1992. | | 55 | | | Trustee, Jewish Theological Seminary, since 2015; Director, Counsel on Call (privately held for-profit company), since 2012; Director, Lawyers Committee for Civil Rights Under Law (not-for-profit), since 2005; formerly, Director, Equal Justice Works (not-for-profit), 2005 to 2014; Director, Corporate Counsel Institute, Georgetown University Law Center, 2007 to 2012; Director, Greater Boston Legal Services (not-for-profit), 2007 to 2012. |
24
Name, (Year of Birth),
and Address(1) | | Position(s) and
Length of
Time Served(2) | | Principal Occupation(s)(3) | | Number of
Funds in Fund
Complex
Overseen by
Fund Trustee | | Other Directorships
Held Outside Fund
Complex by Fund
Trustee(3) | |
Martha C. Goss (1949) | | Trustee since 2007 | | President, Woodhill Enterprises Inc./Chase Hollow Associates LLC (personal investment vehicle), since 2006; formerly, Consultant, Resources Global Professionals (temporary staffing), 2002 to 2006. | | 55 | | | Director, American Water (water utility), since 2003; Director, Allianz Life of New York (insurance), since 2005; Director, Berger Group Holdings, Inc. (engineering consulting firm), since 2013; Director, Financial Women's Association of New York (not-for-profit association), since 2003; Trustee Emerita, Brown University, since 1998; Director, Museum of American Finance (not-for-profit), since 2013; formerly, Non-Executive Chair and Director, Channel Reinsurance (financial guaranty reinsurance), 2006 to 2010; formerly, Director, Ocwen Financial Corporation (mortgage servicing), 2005 to 2010; formerly, Director, Claire's Stores, Inc. (retailer), 2005 to 2007; formerly, Director, Parsons Brinckerhoff Inc. (engineering consulting firm), 2007 to 2010; formerly, Director, Bank Leumi (commercial bank), 2005 to 2007; formerly, Advisory Board Member, Attensity (software developer), 2005 to 2007. | |
Michael M. Knetter (1960) | | Trustee since 2007 | | President and Chief Executive Officer, University of Wisconsin Foundation, since October 2010; formerly, Dean, School of Business, University of Wisconsin—Madison; formerly, Professor of International Economics and Associate Dean, Amos Tuck School of Business—Dartmouth College, 1998 to 2002. | | 55 | | | Board Member, American Family Insurance (a mutual company, not publicly traded), since March 2009; formerly, Trustee, Northwestern Mutual Series Fund, Inc., 2007 to 2011; formerly, Director, Wausau Paper, 2005 to 2011; formerly, Director, Great Wolf Resorts, 2004 to 2009. | |
25
Name, (Year of Birth),
and Address(1) | | Position(s) and
Length of
Time Served(2) | | Principal Occupation(s)(3) | | Number of
Funds in Fund
Complex
Overseen by
Fund Trustee | | Other Directorships
Held Outside Fund
Complex by Fund
Trustee(3) | |
Deborah C. McLean (1954) | | Trustee since 2015 | | Member, Circle Financial Group (private wealth management membership practice), since 2011; Managing Director, Golden Seeds LLC (an angel investing group), since 2009; Adjunct Professor, Columbia University School of International and Public Affairs, since 2008; formerly, Visiting Assistant Professor, Fairfield University, Dolan School of Business, Fall 2007; formerly, Adjunct Associate Professor of Finance, Richmond, The American International University in London, 1999 to 2007. | | 55 | | | Board member, Norwalk Community College Foundation, since 2014; Dean's Advisory Council, Radcliffe Institute for Advanced Study, since 2014; formerly, Director and Treasurer, At Home in Darien (not-for-profit), 2012 to 2014; Director, National Executive Service Corps (not-for-profit), 2012 to 2013; Trustee, Richmond, The American International University in London, 1999 to 2013. | |
George W. Morriss (1947) | | Trustee since 2007 | | Adjunct Professor, Columbia University School of International and Public Affairs, since October 2012; formerly, Executive Vice President and Chief Financial Officer, People's United Bank, Connecticut (a financial services company), 1991 to 2001. | | 55 | | | Director, National Association of Corporate Directors, Connecticut Chapter, since 2011; Trustee, Steben Alternative Investment Funds, Steben Select Multi-Strategy Fund, and Steben Select Multi-Strategy Master Fund, since 2013; formerly, Treasurer, National Association of Corporate Directors, Connecticut Chapter, 2011 to 2015; formerly, Manager, Larch Lane Multi-Strategy Fund complex (which consisted of three funds), 2006 to 2011; formerly, Member, NASDAQ Issuers' Affairs Committee, 1995 to 2003. | |
26
Name, (Year of Birth),
and Address(1) | | Position(s) and
Length of
Time Served(2) | | Principal Occupation(s)(3) | | Number of
Funds in Fund
Complex
Overseen by
Fund Trustee | | Other Directorships
Held Outside Fund
Complex by Fund
Trustee(3) | |
Tom D. Seip (1950) | | Trustee since 2000; Chairman of the Board since 2008; formerly Lead Independent Trustee from 2006 to 2008 | | General Partner, Ridgefield Farm LLC (a private investment vehicle); formerly, President and CEO, Westaff, Inc. (temporary staffing), May 2001 to January 2002; formerly, Senior Executive, The Charles Schwab Corporation, 1983 to 1998, including Chief Executive Officer, Charles Schwab Investment Management, Inc.; Trustee, Schwab Family of Funds and Schwab Investments, 1997 to 1998; and Executive Vice President-Retail Brokerage, Charles Schwab & Co., Inc., 1994 to 1997. | | 55 | | | Director, H&R Block, Inc. (financial services company), since May 2001; Chairman, Governance and Nominating Committee, H&R Block, Inc., since 2011; formerly, Chairman, Compensation Committee, H&R Block, Inc., 2006 to 2010; formerly, Director, Forward Management, Inc. (asset management company), 1999 to 2006. | |
James G. Stavridis (1955) | | Trustee since 2015 | | Dean, Fletcher School of Law and Diplomacy, Tufts University since 2013; formerly, Admiral, United States Navy, 2006 to 2013, including Supreme Allied Commander, NATO and Commander, European Command, 2009 to 2013, and Commander, United States Southern Command, 2006 to 2009. | | 55 | | | Director, Utilidata Inc., since 2015; Director, BMC Software Federal, LLC, since 2014; Director, Vertical Knowledge, LLC, since 2013; formerly, Director, Navy Federal Credit Union, 2000-2002. | |
27
Name, (Year of Birth),
and Address(1) | | Position(s) and
Length of
Time Served(2) | | Principal Occupation(s)(3) | | Number of
Funds in Fund
Complex
Overseen by
Fund Trustee | | Other Directorships
Held Outside Fund
Complex by Fund
Trustee(3) | |
Candace L. Straight (1947) | | Trustee since 1999 | | Private investor and consultant specializing in the insurance industry; formerly, Advisory Director, Securitas Capital LLC (a global private equity investment firm dedicated to making investments in the insurance sector), 1998 to 2003. | | 55 | | | Formerly, Public Member, Board of Governors and Board of Trustees, Rutgers University, 2011 to 2016; formerly, Director, Montpelier Re Holdings Ltd. (reinsurance company), 2006 to 2015; formerly, Director, National Atlantic Holdings Corporation (property and casualty insurance company), 2004 to 2008; formerly, Director, The Proformance Insurance Company (property and casualty insurance company), 2004 to 2008; formerly, Director, Providence Washington Insurance Company (property and casualty insurance company), 1998 to 2006; formerly, Director, Summit Global Partners (insurance brokerage firm), 2000 to 2005. | |
Peter P. Trapp (1944) | | Trustee since 1984 | | Retired; formerly, Regional Manager for Mid-Southern Region, Ford Motor Credit Company, September 1997 to 2007; formerly, President, Ford Life Insurance Company, April 1995 to August 1997. | | 55 | | | None. | |
28
Name, (Year of Birth),
and Address(1) | | Position(s) and
Length of
Time Served(2) | | Principal Occupation(s)(3) | | Number of
Funds in Fund
Complex
Overseen by
Fund Trustee | | Other Directorships
Held Outside Fund
Complex by Fund
Trustee(3) | |
Trustees who are "Interested Persons" | |
Joseph V. Amato* (1962) | | Trustee since 2009 | | President and Director, Neuberger Berman Group LLC, since 2009; President and Chief Executive Officer, Neuberger Berman BD LLC ("Neuberger Berman") and Neuberger Berman Holdings LLC (including its predecessor, Neuberger Berman Inc.), since 2007; Chief Investment Officer (Equities) and President (Equities), Neuberger Berman Investment Advisers LLC ("NBIA") (formerly, Neuberger Berman Fixed Income LLC ("NBFI") and including predecessor entities), since 2007, and Board Member of NBIA since 2006; formerly, Global Head of Asset Management of Lehman Brothers Holdings Inc.'s ("LBHI") Investment Management Division, 2006 to 2009; formerly, member of LBHI's Investment Management Division's Executive Management Committee, 2006 to 2009; formerly, Managing Director, Lehman Brothers Inc. ("LBI"), 2006 to 2008; formerly, Chief Recruiting and Development Officer, LBI, 2005 to 2006; formerly, Global Head of LBI's Equity Sales and a Member of its Equities Division Executive Committee, 2003 to 2005. | | 55 | | | Member of Board of Advisors, McDonough School of Business, Georgetown University, since 2001; Member of New York City Board of Advisors, Teach for America, since 2005; Trustee, Montclair Kimberley Academy (private school), since 2007; Member of Board of Regents, Georgetown University, since 2013. | |
29
Name, (Year of Birth),
and Address(1) | | Position(s) and
Length of
Time Served(2) | | Principal Occupation(s)(3) | | Number of
Funds in Fund
Complex
Overseen by
Fund Trustee | | Other Directorships
Held Outside Fund
Complex by Fund
Trustee(3) | |
Robert Conti* (1956) | | Chief Executive Officer, President and Trustee since 2008; prior thereto, Executive Vice President in 2008 and Vice President from 2000 to 2008 | | Managing Director, Neuberger Berman, since 2007; President—Mutual Funds, NBIA, since 2008; formerly, Senior Vice President, Neuberger Berman, 2003 to 2006; formerly, Vice President, Neuberger Berman, 1999 to 2003; President and Chief Executive Officer, twenty-eight registered investment companies for which NBIA acts as investment manager and/or administrator. | | 55 | | | Director, Staten Island Mental Health Society, since 1994; formerly, Chairman of the Board, Staten Island Mental Health Society, 2008 to 2011. | |
(1) The business address of each listed person is 1290 Avenue of the Americas, New York, NY 10104.
(2) Pursuant to the Trust's Trust Instrument, each of these Trustees shall hold office for life or until his or her successor is elected or the Trust terminates; except that (a) any Trustee may resign by delivering a written resignation; (b) any Trustee may be removed with or without cause at any time by a written instrument signed by at least two-thirds of the other Trustees; (c) any Trustee who requests to be retired, or who has become unable to serve, may be retired by a written instrument signed by a majority of the other Trustees; and (d) any Trustee may be removed at any shareholder meeting by a vote of at least two-thirds of the outstanding shares.
(3) Except as otherwise indicated, each individual has held the positions shown during at least the last five years.
* Indicates a Trustee who is an "interested person" within the meaning of the 1940 Act. Mr. Amato and Mr. Conti are interested persons of the Trust by virtue of the fact that each is an officer of Management, Neuberger Berman and/or their affiliates.
30
Information about the Officers of the Trust
Name, (Year of Birth),
and Address(1) | | Position(s) and
Length of Time
Served(2) | | Principal Occupation(s)(3) | |
Claudia A. Brandon (1956) | | Executive Vice President since 2008 and Secretary since 1985 | | Senior Vice President, Neuberger Berman, since 2007 and Employee since 1999; Senior Vice President, NBIA, since 2008 and Assistant Secretary since 2004; formerly, Vice President, Neuberger Berman, 2002 to 2006; formerly, Vice President—Mutual Fund Board Relations, NBIA, 2000 to 2008; formerly, Vice President, NBIA, 1986 to 1999 and Employee, 1984 to 1999; Executive Vice President, twenty-eight registered investment companies for which NBIA acts as investment manager and/or administrator; Secretary, fifteen registered investment companies for which NBIA acts as investment manager and/or administrator. | |
Agnes Diaz (1971) | | Vice President since 2013 | | Senior Vice President, Neuberger Berman, since 2012; Senior Vice President, NBIA, since 2012 and Employee since 1996; formerly, Vice President, Neuberger Berman, 2007 to 2012; Vice President, twenty-eight registered investment companies for which NBIA acts as investment manager and/or administrator. | |
Anthony DiBernardo (1979) | | Assistant Treasurer since 2011 | | Senior Vice President, NBIA, since 2014, and Employee since 2003; formerly, Vice President, Neuberger Berman, 2009 to 2014; Assistant Treasurer, ten registered investment companies for which NBIA acts as investment manager and/or administrator. | |
Corey A. Issing (1978) | | Chief Legal Officer since 2016 (only for purposes of sections 307 and 406 of the Sarbanes-Oxley Act of 2002) and Anti-Money Laundering Compliance Officer since 2016 | | General Counsel and Head of Compliance—Mutual Funds since 2016 and Senior Vice President, NBIA, since 2013, formerly, Associate General Counsel (2015 to 2016), Counsel (2007 to 2015), Vice President (2009 — 2013); Chief Legal Officer (only for purposes of sections 307 and 406 of the Sarbanes-Oxley Act of 2002), twenty-eight registered investment companies for which NBIA acts as investment manager and/or administrator; Anti-Money Laundering Compliance Officer, twenty-eight registered investment companies for which NBIA acts as investment manager and/or administrator. | |
Sheila R. James (1965) | | Assistant Secretary since 2002 | | Vice President, Neuberger Berman, since 2008 and Employee since 1999; Vice President, NBIA, since 2008; formerly, Assistant Vice President, Neuberger Berman, 2007; Employee, NBIA, 1991 to 1999; Assistant Secretary, twenty-eight registered investment companies for which NBIA acts as investment manager and/or administrator. | |
Brian Kerrane (1969) | | Chief Operating Officer since 2015 and Vice President since 2008 | | Managing Director, Neuberger Berman, since 2013; Chief Operating Officer—Mutual Funds and Managing Director, NBIA, since 2015 and Employee since 1991; formerly, Senior Vice President, Neuberger Berman, 2006 to 2014; Vice President, NBIA, 2008 to 2015; Chief Operating Officer, ten registered investment companies for which NBIA acts as investment manager and/or administrator; Vice President, twenty-eight registered investment companies for which NBIA acts as investment manager and/or administrator. | |
31
Name, (Year of Birth),
and Address(1) | | Position(s) and
Length of Time
Served(2) | | Principal Occupation(s)(3) | |
Kevin Lyons (1955) | | Assistant Secretary since 2003 | | Assistant Vice President, Neuberger Berman, since 2008 and Employee since 1999; Assistant Vice President, NBIA, since 2008; formerly, Employee, NBIA, 1993 to 1999; Assistant Secretary, ten registered investment companies for which NBIA acts as investment manager and/or administrator. | |
Anthony Maltese (1959) | | Vice President since 2015 | | Senior Vice President, Neuberger Berman, since 2014 and Employee since 2000; Senior Vice President, NBIA, since 2014; Vice President, ten registered investment companies for which NBIA acts as investment manager and/or administrator. | |
Owen F. McEntee, Jr. (1961) | | Vice President since 2008 | | Vice President, Neuberger Berman, since 2006; Vice President, NBIA, since 2006 and Employee since 1992; Vice President, ten registered investment companies for which NBIA acts as investment manager and/or administrator. | |
John M. McGovern (1970) | | Treasurer and Principal Financial and Accounting Officer since 2005 | | Senior Vice President, Neuberger Berman, since 2007; Senior Vice President, NBIA, since 2007 and Employee since 1993; formerly, Vice President, Neuberger Berman, 2004 to 2006; formerly, Assistant Treasurer, 2002 to 2005; Treasurer and Principal Financial and Accounting Officer, twenty-eight registered investment companies for which NBIA acts as investment manager and/or administrator. | |
Frank Rosato (1971) | | Assistant Treasurer since 2005 | | Vice President, Neuberger Berman, since 2006; Vice President, NBIA, since 2006 and Employee since 1995; Assistant Treasurer, ten registered investment companies for which NBIA acts as investment manager and/or administrator. | |
Chamaine Williams (1971) | | Chief Compliance Officer since 2005 | | Chief Compliance Officer—Mutual Funds and Senior Vice President, NBIA, since 2006; formerly, Senior Vice President, LBI, 2007 to 2008; formerly, Vice President, LBI, 2003 to 2006; formerly, Chief Compliance Officer, Lehman Brothers Asset Management Inc., 2003 to 2007; formerly, Chief Compliance Officer, Lehman Brothers Alternative Investment Management LLC, 2003 to 2007; Chief Compliance Officer, fifteen registered investment companies for which NBIA acts as investment manager and/or administrator. | |
(1) The business address of each listed person is 1290 Avenue of the Americas, New York, NY 10104.
(2) Pursuant to the By-Laws of the Trust, each officer elected by the Trustees shall hold office until his or her successor shall have been elected and qualified or until his or her earlier death, inability to serve, or resignation. Officers serve at the pleasure of the Trustees and may be removed at any time with or without cause.
(3) Except as otherwise indicated, each individual has held the positions shown during at least the last five years
32
Proxy Voting Policies and Procedures
A description of the policies and procedures that the Trust uses to determine how to vote proxies relating to portfolio securities is available, without charge, by calling 800-877-9700 (toll-free) and on the Securities and Exchange Commission's website, at www.sec.gov. Information regarding how the Trust voted proxies relating to portfolio securities during the most recent 12-month period ended June 30 is also available upon request, without charge, by calling 800-877-9700 (toll-free), on the Securities and Exchange Commission's website at www.sec.gov, and on Management's website at www.nb.com.
Quarterly Portfolio Schedule
The Trust files a complete schedule of portfolio holdings for the Fund with the Securities and Exchange Commission for the first and third quarters of each fiscal year on Form N-Q. The Trust's Forms N-Q are available on the Securities and Exchange Commission's website at www.sec.gov and may be reviewed and copied at the Securities and Exchange Commission's Public Reference Room in Washington, DC. Information on the operation of the Public Reference Room may be obtained by calling 800-SEC-0330. The information on Form N-Q is available upon request, without charge, by calling 800-877-9700 (toll free).
Board Consideration of the Management Agreement
On an annual basis, the Board of Trustees (the "Board") of Neuberger Berman Advisers Management Trust (the "Trust"), including the Trustees who are not "interested persons" of Neuberger Berman Investment Advisers LLC ("Management") (including its affiliates) or the Trust ("Independent Fund Trustees"), considers whether to continue the management agreement with Management (the "Agreement") for Mid-Cap Growth Portfolio (the "Fund"). Throughout the process, the Independent Fund Trustees are advised by counsel that is experienced in Investment Company Act of 1940 matters and that is independent of Management ("Independent Counsel"). At a meeting held on October 18, 2016, the Board, including the Independent Fund Trustees, approved the continuation of the Agreement for the Fund.
In evaluating the Agreement, the Board, including the Independent Fund Trustees, reviewed extensive materials provided by Management in response to questions submitted by the Independent Fund Trustees and Independent Counsel, and met with senior representatives of Management regarding its personnel, operations and financial condition as they relate to the Fund. The annual contract review extends over at least two regular meetings of the Board to ensure that Management has time to respond to any questions the Independent Fund Trustees may have on their initial review of the materials and that the Independent Fund Trustees have time to consider those responses.
In connection with its deliberations, the Board also considered the broad range of information relevant to the annual contract review that is provided to the Board (including its various standing committees) at meetings throughout the year, including investment performance reports and related portfolio information for the Fund, as well as periodic reports on, among other matters, pricing and valuation; brokerage and execution; compliance; and shareholder and other services provided by Management and its affiliates. To assist the Board in its deliberations regarding the annual contract review, the Board has established a Contract Review Committee comprised of Independent Fund Trustees. The Board has also established other committees that focus throughout the year on specific areas relevant to the annual contract review, such as Fund performance or compliance matters, and that are charged with specific responsibilities regarding the annual contract review. Those committees provide reports that feed into the Contract Review Committee, which reviews and takes account of the information.
The Independent Fund Trustees received from Independent Counsel a memorandum discussing the legal standards for their consideration of the proposed continuation of the Agreement. During the course of the year and during their deliberations regarding the annual contract review, the Contract Review Committee and the Independent Fund Trustees met with Independent Counsel separately from representatives of Management.
33
In connection with its approval of the continuation of the Agreement, the Board evaluated the terms of the Agreement, the overall fairness of the Agreement to the Fund and whether the Agreement was in the best interests of the Fund and its shareholders. The Board considered all factors it deemed relevant with respect to the Fund, including the following factors: (1) the nature, extent, and quality of the services provided by Management; (2) the investment performance of the Fund compared to an appropriate market index and a peer group of investment companies; (3) the costs of the services provided and the profit or loss realized by Management and its affiliates from their relationship with the Fund; (4) the extent to which economies of scale have been or might be realized as the Fund grows; and (5) whether fee levels reflect any such potential economies of scale for the benefit of the Fund's shareholders. The Board's determination to approve the continuation of the Agreement was based on a comprehensive consideration of all information provided to the Board throughout the year and specifically in connection with the annual contract review. The Board members did not identify any particular information or factor that was all-important or controlling, and each Trustee may have attributed different weights to the various factors. The Board focused on the overall costs and benefits of the Agreement to the Fund and, through the Fund, its shareholders.
With respect to the nature, extent and quality of the services provided, the Board considered the investment philosophy and decision-making processes of Management, and the qualifications, experience, and capabilities of, and the resources available to, the portfolio management personnel of Management who perform services for the Fund. The Board noted that Management also provides certain administrative services, including fund accounting and compliance services. The Board also considered Management's policies and practices regarding brokerage and allocation of portfolio transactions and reviewed the quality of the execution services that Management had provided. The Board also reviewed whether Management used brokers to execute Fund transactions that provide research and other services to Management and the types of benefits potentially derived from such services by Management, the Fund and other clients of Management. The Board also considered that Management's responsibilities include daily management of investment, operational, enterprise, legal, regulatory and compliance risks as they relate to the Fund, and considered information regarding Management's processes for managing risk. In addition, the Board noted the positive compliance history of Management, as no significant compliance problems were reported to the Board with respect to either firm. The Board also considered the general structure of the portfolio manager compensation program and whether this structure provides appropriate incentives to act in the best interests of the Fund.
As in past years, the Board also considered the manner in which Management addressed various non-routine matters that arose during the year, some of them a result of developments in the broader fund industry or the regulations governing it. In addition, the Board considered actions taken by Management in response to recent market conditions, such as regulatory concerns about current trading issues, market liquidity and potential volatility, and considered the overall performance of Management in this context.
The Board factored into its evaluation of the Fund's fees and performance a consideration of the limitations inherent in the methodology for constructing peer groups and determining which investment companies should be included in the peer groups. The Board considered a peer group composed of two types of funds: proprietary funds that are operated by insurance companies or their affiliates, and non-proprietary funds, such as the Fund, operated for insurance company investors by independent investment managers.
With respect to investment performance, the Board considered information regarding the Fund's short, intermediate and long-term performance both on an absolute basis and relative to an appropriate benchmark index and the average performance of a composite peer group (as constructed by an independent organization) of investment companies pursuing broadly similar strategies. The Board also reviewed performance in relation to certain measures of the degree of investment risk undertaken by the portfolio manager. The Board looked at the Fund's S Class as a proxy for both of the Fund's classes. The Board considered that as compared to its peer group, the performance of the Fund's S Class was higher than the median for the 1, 3 and 10-year periods, and equal to the median for the 5-year period. The Board also considered that the performance of the Fund's S Class was higher than its benchmark for the 1, 5 and 10-year periods, but lower for the 3-year period.
34
With respect to the overall fairness of the Agreement, the Board considered the fee structure for the Fund under the Agreement as compared to the peer group. The Board also considered any fall-out (i.e. indirect) benefits likely to accrue to Management or its affiliates from their relationship with the Fund. The Board also considered the profitability of Management and its affiliates from their association with the Fund, and year-over-year changes in each of Management's reported expense categories.
The Board reviewed a comparison of the Fund's management fee and total expense ratio to the peer group and was aware that non-proprietary insurance product funds generally have higher fee structures than proprietary funds. The Board noted that the comparative management fee analysis includes, in the Fund's management fee, the separate administrative fee paid to Management, but it was not clear whether this was the case for all funds in the peer group. The Board compared the Fund's contractual and actual management fees to the mean and median of the contractual and actual management fees, respectively, of the Fund's peer group. (The actual management fees are the contractual management fees reduced by any fee waivers or other adjustments.) In addition, the Board considered the contractual limit on expenses of the Fund. The Board noted that although Management realized a profit on its management of the Fund, it experienced a loss on the Fund when all expenses were taken into account.
The Board considered that, for the Fund's S Class shares, as compared to its peer group, the Fund's contractual management fee and the actual management fee were both higher than the respective medians. The Board looked at the S Class as a proxy for both of the Fund's classes. The Board considered whether specific portfolio management, administration or oversight needs contributed to the management fee. The Board also noted that the Fund's size, which impacts its expenses and performance, has been affected by ongoing changes in the insurance market.
The Board also considered whether there were other funds or separate accounts that were advised by Management or its affiliates with investment objectives, policies and strategies that were similar to those of the Fund. The Board compared the fees charged to the Fund to the fees charged to such funds and/or separate accounts. The Board considered the appropriateness and reasonableness of any differences between the fees charged to the Fund and such funds and/or separate accounts, including any breakpoints, and determined that differences in fees and fee structures were consistent with the management and other services provided.
The Board also evaluated any apparent or anticipated economies of scale in relation to the services Management provides to the Fund. The Board considered whether the Fund's fee structure provides for a reduction of payments resulting from the use of breakpoints and whether those breakpoints are set at appropriate asset levels. As in past years, the Board gave careful thought to the size of any breakpoints in the Fund's advisory fees and the asset levels at which they are set. It also considered whether the fees were set at an appropriate level and compared the fee structures to that of the peer group. The Board also considered that Management has provided, at no added cost to the Fund, certain additional services that were required by new regulations or regulatory interpretations, impelled by changes in the securities markets or the business landscape, and/or requested by the Board. In concluding that the benefits accruing to Management and its affiliates by virtue of their relationship with the Fund were reasonable in light of the costs of providing the investment advisory and other services and the benefits accruing to the Fund, the Board reviewed specific data as to Management's profitability on the Fund for a recent period. The Board also considered Management's cost allocation methodology. The Board recognized that Management should be entitled to earn a reasonable level of profits for services they provide to the Fund and, based on its review, concluded that Management's reported level of profitability on the Fund was reasonable.
Conclusions
In approving the continuation of the Agreement, the Board concluded that the terms of the Agreement are fair and reasonable to the Fund and that approval of the continuation of the Agreement is in the best interests of the Fund and its shareholders. In reaching this determination, the Board considered that Management could be expected to provide a high level of service to the Fund; that the performance of the Fund was satisfactory over time; that the Fund's fee structure appeared to the Board to be reasonable given the nature, extent and quality of services provided; and that the benefits
35
accruing to Management and its affiliates by virtue of their relationship with the Fund were reasonable in light of the costs of providing the investment advisory and other services and the benefits accruing to the Fund. The Board's conclusions may be based in part on its consideration of materials prepared in connection with the approval or continuance of the Agreement in prior years and on the Board's ongoing regular review of Fund performance and operations throughout the year, in addition to material prepared specifically for the most recent annual review of the Agreement.
Notice to Shareholders
The Fund designates $15,899,098 as a capital gain distribution.
36
Neuberger Berman
Advisers Management Trust
Mid Cap Intrinsic Value Portfolio
I Class Shares
S Class Shares
Annual Report
December 31, 2016
Mid Cap Intrinsic Value Portfolio Commentary (Unaudited)
The Neuberger Berman Advisers Management Trust Mid Cap Intrinsic Value Portfolio Class I advanced a total return of 16.17% for the 12 months ended December 31, 2016, but underperformed the Russell Midcap® Value Index, which posted a return of 20.00% for the same period. (Performance for all share classes is provided in the table immediately following this letter.)
2016 was a volatile year for equity markets. Early on, investors were concerned about the potential for a recession and stocks declined. As the year progressed, the domestic economy performed better and stocks rallied, only to retreat again when the U.K. voted to exit the European Union. Trump's surprising election victory and a Republican win in both the House and Senate sent the stock market to record highs.
The changing views on the state of the economy created shifts in sector performance during the year. At the start, investors focused on a low interest rate and low inflationary economy; thus, income producing stocks outperformed, while commodity stocks underperformed. Trump's victory reversed this trend, with investors buying economically sensitive, domestic-oriented companies and companies that could benefit from a reduced corporate tax rate. Additionally, value outperformed growth after lagging in 2015.
The Fund's cyclical positioning was helped by the post-election rally and its regional bank stocks appreciated significantly post-election. In 2016, the Fund benefited from mergers and acquisitions and restructuring activity—ADT, its largest holding at the time, was acquired by Apollo, Tyco approved a merger with Johnson Controls, and B/E Aerospace agreed to be acquired by Rockwell Collins. The Fund's Energy holdings also performed well as oil prices rebounded meaningfully from depressed levels.
Hurting performance during 2016 was the Fund's stock selection in Technology, as a number of its Technology holdings came under pressure from reduced earnings expectations. In addition, many of the Fund's Technology names had large foreign exposure and were pressured by Trump's victory. Also detracting from performance for the year was GNC (sold after the end of the fiscal period), which materially missed earnings expectations and fired its CEO. We decided to sell the position due to a change in our investment thesis for this holding. We also eliminated Corecivic (formerly Corrections Corp. of America), as the Obama administration and Clinton's platform sought to reduce the use of private prisons and the stock declined significantly. Finally, Hertz (sold prior to 12/31/16) declined as earnings materially missed expectations due in large part to improper fleet sizing.
Post-election, we made adjustments to reflect what we believed would be the potential impact from some of Trump's key economic policies being adopted, especially the border tax which we believe has severe implications for any company that imports many of its products. As such, we started to reduce or eliminate a number of the Fund's holdings in the retail sector where the risk/reward no longer appeared favorable. On the buy side, we added some new companies, one which we subsequently sold after a sharp run up in its price. We believe there are investment opportunities in the Health Care area as many of these stocks have come under unrelenting selling pressure.
Looking ahead to 2017, we believe that the macroeconomic environment should become more conducive to stock picking, with a reduction in monetary stimulus creating lower stock market correlations. After eight years of the Obama administration's economic policy of tax, spend and regulate, we are optimistic that Trump's economic plan will be positive for domestic economic growth, and therefore stocks, over the long term. However, we believe a tremendous amount of uncertainty with regard to Trump's policies is likely to create more volatility during 2017.
Sincerely,
Michael C. Greene
Portfolio Manager
Information about principal risks of investing in the Fund is set forth in the prospectus and statement of additional information.
The portfolio composition, industries and holdings of the Fund are subject to change without notice.
The opinions expressed are those of the Fund's portfolio manager. The opinions are as of the date of this report, and are subject to change without notice.
1
Mid Cap Intrinsic Value Portfolio (Unaudited)
SECTOR ALLOCATION
(as a % of Total Investments*) | |
Consumer Discretionary | | | 9.5 | % |
Consumer Staples | | | 2.8 | |
Energy | | | 8.2 | |
Financial Services | | | 15.6 | |
Health Care | | | 8.7 | |
Materials & Processing | | | 4.0 | |
Producer Durables | | | 18.9 | |
Technology | | | 17.9 | |
Utilities | | | 5.7 | |
Short-Term Investment | | | 8.7 | |
Total | | | 100.0 | % |
* Derivatives, if any, are excluded from this chart.
PERFORMANCE HIGHLIGHTS
| | | Average Annual Total Return
Ended 12/31/2016 | |
| Inception Date | | 1 Year | | | 5 Years | | | 10 Years | | | Life of Fund | |
Mid Cap Intrinsic
Value Portfolio Class I | 08/22/2001 | | | 16.17 | % | | | 13.93 | % | | | 6.39 | % | | | 8.34 | % |
Mid Cap Intrinsic Value
Portfolio Class S2 | 04/29/2005 | | | 15.98 | % | | | 13.70 | % | | | 6.16 | % | | | 8.18 | % |
Russell Midcap®
Value Index1,3 | | | | 20.00 | % | | | 15.70 | % | | | 7.59 | % | | | 10.04 | % |
| Russell Midcap® Index1,3 | | | | 13.80 | % | | | 14.72 | % | | | 7.86 | % | | | 9.45 | % |
The performance data quoted represent past performance and do not indicate future results. Current performance may be lower or higher than the performance data quoted. For performance data current to the most recent month-end, please visit http://www.nb.com/amtportfolios/ performance.
The results shown in the table reflect the reinvestment of income dividends and other distributions, if any. The results do not reflect the effect of taxes a shareholder would pay on Fund distributions or on the redemption of Fund shares. The results do not reflect fees and expenses of the variable annuity and variable life insurance policies or the qualified pension and retirement plans whose proceeds are invested in the Fund.
The investment return and principal value of an investment will fluctuate and shares, when redeemed, may be worth more or less than their original cost.
Returns would have been lower if Neuberger Berman Investment Advisers LLC ("Management") had not reimbursed certain expenses and/ or waived a portion of the investment management fees during certain of the periods shown. Repayment by a class (of expenses previously reimbursed and/ or fees previously waived by Management) will decrease the class's returns. Please see Note B in the Notes to Financial Statements for specific information regarding expense reimbursement and/ or fee waiver arrangements.
As stated in the Fund's most recent prospectus, the total annual operating expense ratios for fiscal year 2015 were 1.03% and 1.28% for Class I and Class S shares, respectively (before expense reimbursements and/ or fee waivers, if any). The expense ratio was 1.25% for Class S shares after expense reimbursements and/ or fee waivers. The expense ratios for the annual period ended December 31, 2016 can be found in the Financial Highlights section of this report.
COMPARISON OF A $10,000 INVESTMENT
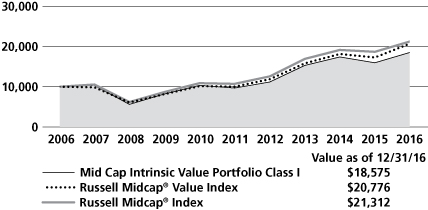
This graph shows the change in value of a hypothetical $10,000 investment in the Fund over the past 10 fiscal years, or since the Fund's inception, if it has not operated for 10 years. The graph is based on Class I shares only; the performance of the Fund's share classes will differ primarily due to different class expenses (see Performance Highlights chart above). The result is compared with benchmarks, which include a broad-based market index and may include a more narrowly based index. Market indices have not been reduced to reflect any of the fees and costs of investing. The results shown in the graph reflect the reinvestment of income dividends and other distributions, if any. The results do not reflect the effect of taxes a shareholder would pay on Fund distributions or on the redemption of Fund shares. The results do not reflect fees and expenses of the variable annuity and variable life insurance policies or the qualified pension and retirement plans whose proceeds are invested in the Fund. Results represent past performance and do not indicate future results.
Please see Endnotes for additional information.
2
Endnotes1 The date used to calculate Life of Fund performance for the index is August 22, 2001, the inception date of the oldest share class.
2 Performance shown prior to April 29, 2005 for Class S shares is that of Class I shares, which has lower expenses and correspondingly higher returns than Class S shares.
3 The Russell Midcap® Value Index is a float-adjusted market capitalization-weighted index that measures the performance of the mid-cap value segment of the U.S. equity market. It includes those Russell Midcap® Index companies with lower price-to-book ratios and lower forecasted growth rates. The index is rebalanced annually in June. The Russell Midcap Index is a float-adjusted market capitalization-weighted index that measures the performance of the mid-cap segment of the U.S. equity market. It includes approximately 800 of the smallest securities in the Russell 1000® Index. The index is rebalanced annually in June. Please note that the indices described in this report do not take into account any fees, expenses or tax consequences of investing in the individual securities that they track, and that individuals cannot invest directly in any index. Data about the performance of an index are prepared or obtained by Neuberger Berman Investment Advisers LLC* ("Management") and reflect the reinvestment of income dividends and other distributions, if any. The Fund may invest in securities not included in a described index and generally does not invest in all securities included in a described index.
* On January 1, 2016, Neuberger Berman Management LLC ("NBM") transferred to Neuberger Berman Fixed Income LLC ("NBFI") their rights and obligations pertaining to all services they provided to any Fund under any investment management, investment sub-advisory, and/or administration agreement, as applicable (the "Agreements"). Following such transfer, NBFI was renamed Neuberger Berman Investment Advisers LLC ("NBIA" or "Management"). Following the consolidation, the investment professionals of NBM who provided services to any Fund under the Agreements continue to provide the same services, except that they provide those services in their new capacities as investment professionals of NBIA. Further, the consolidation did not result in any change in the investment processes employed by any Fund, the nature or level of services provided to any Fund, or the fees any Fund pays under its Agreements.
On July 1, 2016, NBM was reorganized into "Neuberger Berman" (the "Reorganization"). Upon the completion of the Reorganization, Neuberger Berman assumed all rights and obligations pertaining to all services NBM provided to any Fund under any distribution agreement or distribution and services agreement (the "Agreements") or plan adopted pursuant to Rule 12b-1 under the Investment Company Act of 1940, as amended, (the "Plans"). Accordingly, after the Reorganization, Neuberger Berman became each Fund's distributor and the services previously provided by NBM under the Agreements and Plans are provided by Neuberger Berman.
Following the Reorganization, the employees of NBM provide the same services to each Fund under the Agreements and Plans, except that they provide those services in their capacities as employees of Neuberger Berman. Further, the Reorganization did not result in any change in the nature or level of services provided to each Fund, or the fees, if any, each Fund pays under the Agreements or the Plans.
Please note, effective July 1, 2016, Neuberger Berman Management LLC was reorganized with and into Neuberger Berman LLC, a registered broker-dealer, Member FINRA and the Fund's distributor, which changed its name to Neuberger Berman BD LLC on January 1, 2017.
The investments for the Fund are managed by the same portfolio manager(s) who manage(s) one or more other registered funds that have names, investment objectives and investment styles that are similar to those of the Fund. You should be aware that the Fund is likely to differ from those other mutual fund(s) in size, cash flow pattern and tax matters. Accordingly, the holdings and performance of the Fund can be expected to vary from those of the other mutual fund(s).
Shares of the separate Neuberger Berman Advisers Management Trust Portfolios, including the Fund, are not available to the general public. Shares of the Fund may be purchased only by life insurance companies to be held in their separate accounts, which fund variable annuity and variable life insurance policies, and by qualified pension and retirement plans.
Statistics and projections in this report are derived from sources deemed to be reliable but cannot be regarded as a representation of future results of the Fund. This report is prepared for the general information of shareholders and is not an offer of shares of the Fund. Shares are sold only through the currently effective prospectus, which must precede or accompany this report.
The "Neuberger Berman" name and logo and "Neuberger Berman Investment Advisers LLC" name are registered service marks of Neuberger Berman Group LLC. The individual Fund names in this piece are either service marks or registered service marks of Neuberger Berman Investment Advisers LLC, an affiliate of Neuberger Berman BD LLC, distributor, member FINRA.
© 2017 Neuberger Berman BD LLC, distributor. All rights reserved.
3
Information About Your Fund's Expenses (Unaudited)
As a Fund shareholder, you incur two types of costs: (1) transaction costs such as fees and expenses that are, or may be, imposed under your variable contract or qualified pension plan; and (2) ongoing costs, including management fees, distribution and/or service (12b-1) fees (if applicable), and other Fund expenses. This example is intended to help you understand your ongoing costs (in U.S. dollars) of investing in the Fund and compare these costs with the ongoing costs of investing in other mutual funds.
This table is designed to provide information regarding costs related to your investments. The following examples are based on an investment of $1,000 made at the beginning of the six month period ended December 31, 2016 and held for the entire period. The table illustrates the Fund's costs in two ways:
Actual Expenses and Performance: | | The first section of the table provides information about actual account values and actual expenses in dollars, based on the Fund's actual performance during the period indicated. You may use the information in this line, together with the amount you invested, to estimate the expenses you paid over the period. Simply divide your account value by $1,000 (for example, an $8,600 account value divided by $1,000 = 8.6), then multiply the result by the number in the first section of the table under the heading entitled "Expenses Paid During the Period" to estimate the expenses you paid over the period. | |
Hypothetical Example for
Comparison Purposes: | | The second section of the table provides information about hypothetical account values and hypothetical expenses based on the Fund's actual expense ratio and an assumed rate of return at 5% per year before expenses. This return is not the Fund's actual return. The hypothetical account values and expenses may not be used to estimate the actual ending account balance or expenses you paid for the period. You may use this information to compare the ongoing costs of investing in this Fund versus other funds. To do so, compare the expenses shown in this 5% hypothetical example with the 5% hypothetical examples that appear in the shareholder reports of other funds. | |
Please note that the expenses in the table are meant to highlight your ongoing costs only and do not include any transaction costs, such as fees and expenses that are, or may be imposed under your variable contract or qualified pension plan. Therefore, the information under the heading "Hypothetical (5% annual return before expenses)" is useful in comparing ongoing costs only, and will not help you determine the relative total costs of owning different funds. In addition, if these transaction costs were included, your costs would have been higher.
NEUBERGER BERMAN ADVISERS MANAGEMENT TRUST MID CAP INTRINSIC VALUE PORTFOLIO
Actual | | Beginning Account
Value 7/1/16 | | Ending Account
Value 12/31/16 | | Expenses Paid During
the Period
7/1/16 – 12/31/16 | | Expense
Ratio | |
Class I | | $ | 1,000.00 | | | $ | 1,104.50 | | | $ | 5.61 | * | | | 1.06 | % | |
Class S | | $ | 1,000.00 | | | $ | 1,104.00 | | | $ | 6.66 | * | | | 1.26 | % | |
Hypothetical (5% annual return before expenses) | |
Class I | | $ | 1,000.00 | | | $ | 1,019.81 | | | $ | 5.38 | ** | | | 1.06 | % | |
Class S | | $ | 1,000.00 | | | $ | 1,018.80 | | | $ | 6.39 | ** | | | 1.26 | % | |
* For each class, expenses are equal to the annualized expense ratio for the class, multiplied by the average account value over the period, multiplied by 184/366 (to reflect the one-half year period shown).
** Hypothetical expenses are equal to the annualized expense ratios for each class, multiplied by the average account value over the period (assuming a 5% annual return), multiplied by 184/366 (to reflect the one-half year period shown).
4
Schedule of Investments Mid Cap Intrinsic Value Portfolio 12/31/16
NUMBER OF SHARES | | | | VALUE | |
Common Stocks 90.4% | | | |
Aerospace & Defense 9.3% | | | |
| | 64,000 | | | B/E Aerospace, Inc. | | $ | 3,852,160 | | |
| | 24,050 | | | General Dynamics Corp. | | | 4,152,473 | | |
| | 40,300 | | | Orbital ATK, Inc. | | | 3,535,519 | | |
| 60,200 | | | Spirit AeroSystems Holdings,
Inc. Class A | | | 3,512,670 | | |
| | | | 15,052,822 | | |
Airlines 2.2% | | | |
| | 75,500 | | | American Airlines Group, Inc. | | | 3,525,095 | | |
Banks 6.9% | | | |
| | 96,900 | | | BankUnited, Inc. | | | 3,652,161 | | |
| | 52,800 | | | BB&T Corp. | | | 2,482,656 | | |
| | 49,100 | | | Comerica, Inc. | | | 3,344,201 | | |
| | 11,000 | | | M&T Bank Corp. | | | 1,720,730 | | |
| | | | 11,199,748 | | |
Building Products 2.3% | | | |
| 88,910 | | | Johnson Controls International
PLC | | | 3,662,203 | | |
Capital Markets 2.0% | | | |
| | 41,500 | | | State Street Corp. | | | 3,225,380 | | |
Chemicals 3.5% | | | |
| | 28,700 | | | Ashland Global Holdings, Inc. | | | 3,136,623 | | |
| | 121,000 | | | Valvoline, Inc. | | | 2,601,500 | | |
| | | | 5,738,123 | | |
Commercial Services & Supplies 2.2% | | | |
| | 226,100 | | | Covanta Holding Corp. | | | 3,527,160 | | |
Construction & Engineering 2.0% | | | |
| | 22,900 | | | Valmont Industries, Inc. | | | 3,226,610 | | |
Containers & Packaging 1.4% | | | |
| | 32,100 | | | Avery Dennison Corp. | | | 2,254,062 | | |
Electric Utilities 1.8% | | | |
| | 40,900 | | | Edison International | | | 2,944,391 | | |
Electronic Equipment, Instruments &
Components 2.7% | | | |
| | 137,400 | | | Flex Ltd. | | | 1,974,438 | * | |
| | 36,800 | | | Itron, Inc. | | | 2,312,880 | * | |
| | | | 4,287,318 | | |
NUMBER OF SHARES | | | | VALUE | |
Equity Real Estate Investment Trust 1.8% | | | |
| | 100,540 | | | Colony Starwood Homes | | $ | 2,896,557 | | |
Food & Staples Retailing 2.8% | | | |
| | 148,000 | | | Whole Foods Market, Inc. | | | 4,552,480 | | |
Health Care Equipment & Supplies 2.8% | | | |
| | 43,300 | | | Zimmer Biomet Holdings, Inc. | | | 4,468,560 | | |
Hotels, Restaurants & Leisure 1.4% | | | |
| | 29,800 | | | Wyndham Worldwide Corp. | | | 2,275,826 | | |
Household Durables 0.5% | | | |
| | 4,700 | | | Whirlpool Corp. | | | 854,319 | | |
Independent Power and Renewable
Electricity Producers 1.7% | | | |
| | 243,200 | | | AES Corp. | | | 2,825,984 | | |
IT Services 4.6% | | | |
| | 80,300 | | | Amdocs Ltd. | | | 4,677,475 | | |
| | 102,000 | | | Teradata Corp. | | | 2,771,340 | * | |
| | | | 7,448,815 | | |
Life Sciences Tools & Services 1.9% | | | |
| | 40,700 | | | Quintiles IMS Holdings, Inc. | | | 3,095,235 | * | |
Media 2.1% | | | |
| | 24,800 | | | CBS Corp. Class B | | | 1,577,776 | | |
| 35,450 | | | Lions Gate Entertainment Corp.
Class A | | | 953,605 | | |
| 35,450 | | | Lions Gate Entertainment Corp.
Class B | | | 869,943 | * | |
| | | | 3,401,324 | | |
Mortgage Real Estate Investment 1.9% | | | |
| | 136,900 | | | Starwood Property Trust, Inc. | | | 3,004,955 | | |
Multi-Utilities 2.1% | | | |
| | 134,700 | | | CenterPoint Energy, Inc. | | | 3,319,008 | | |
Multiline Retail 1.1% | | | |
| | 51,800 | | | Macy's, Inc. | | | 1,854,958 | | |
Oil, Gas & Consumable Fuels 6.5% | | | |
| | 138,100 | | | Cabot Oil & Gas Corp. | | | 3,226,016 | | |
| | 70,400 | | | Devon Energy Corp. | | | 3,215,168 | | |
| | 70,700 | | | ONEOK, Inc. | | | 4,058,887 | | |
| | | | 10,500,071 | | |
See Notes to Financial Statements
5
Schedule of Investments Mid Cap Intrinsic Value Portfolio (cont'd)
NUMBER OF SHARES | | | | VALUE | |
Pharmaceuticals 3.9% | | | |
| | 36,400 | | | Perrigo Co. PLC | | $ | 3,029,572 | | |
| 90,000 | | | Teva Pharmaceutical Industries
Ltd. ADR | | | 3,262,500 | | |
| | | | 6,292,072 | | |
Road & Rail 1.4% | | | |
| | 60,300 | | | Avis Budget Group, Inc. | | | 2,211,804 | * | |
Semiconductors & Semiconductor
Equipment 4.4% | | | |
| | 252,100 | | | ON Semiconductor Corp. | | | 3,216,796 | * | |
| | 52,300 | | | Skyworks Solutions, Inc. | | | 3,904,718 | | |
| | | | 7,121,514 | | |
Software 4.9% | | | |
| | 58,100 | | | Cadence Design Systems, Inc. | | | 1,465,282 | * | |
| 42,700 | | | Check Point Software
Technologies Ltd. | | | 3,606,442 | * | |
| | 188,300 | | | Nuance Communications, Inc. | | | 2,805,670 | * | |
| | | | 7,877,394 | | |
Specialty Retail 1.8% | | | |
| | 34,700 | | | Best Buy Co., Inc. | | | 1,480,649 | | |
| | 313,700 | | | Office Depot, Inc. | | | 1,417,924 | | |
| | | | 2,898,573 | | |
Technology Hardware, Storage &
Peripherals 2.6% | | | |
| | 62,921 | | | Western Digital Corp. | | | 4,275,482 | | |
NUMBER OF SHARES | | | | VALUE | |
Textiles, Apparel & Luxury Goods 1.0% | | | |
| | 30,600 | | | Deckers Outdoor Corp. | | $ | 1,694,934 | * | |
Trading Companies & Distributors 2.9% | | | |
| | 111,100 | | | AerCap Holdings NV | | | 4,622,871 | * | |
| | | | Total Common Stocks
(Cost $114,532,266) | | | 146,135,648 | | |
Rights 0.0% | | | |
Food & Staples Retailing 0.0% | | | |
| | 39,450 | | | Safeway, Inc. (Casa Ley) | | | 9,863 | (a)* | |
| 39,450 | | | Safeway, Inc. (Property
Development Centers) | | | 789 | (a)* | |
| | | | Total Rights
(Cost $41,817) | | | 10,652 | | |
Short-Term Investment 8.6% | | | |
Investment Company 8.6% | | | |
| 13,945,755 | | | State Street Institutional
U.S. Government Money
Market Fund Premier Class,
0.42% (Cost $13,945,755) | | | 13,945,755 | (b) | |
| | | | Total Investments 99.0%
(Cost $128,519,838) | | | 160,092,055 | | |
| | | | | Other Assets Less Liabilities 1.0% | | | 1,554,742 | | |
| | | | | Net Assets 100.0% | | $ | 161,646,797 | | |
* Non-income producing security.
(a) Illiquid security.
(b) Represents 7-day effective yield as of 12/31/2016.
The following is a summary, categorized by Level (see Note A of Notes to Financial Statements), of inputs used to value the Fund's investments as of December 31, 2016:
Asset Valuation Inputs | | Level 1 | | Level 2 | | Level 3(b) | | Total | |
Investments: | |
Common Stocks(a) | | $ | 146,135,648 | | | $ | — | | | $ | — | | | $ | 146,135,648 | | |
Rights(a) | | | — | | | | — | | | | 10,652 | | | | 10,652 | | |
Short-Term Investment | | | — | | | | 13,945,755 | | | | — | | | | 13,945,755 | | |
Total Investments | | $ | 146,135,648 | | | $ | 13,945,755 | | | $ | 10,652 | | | $ | 160,092,055 | | |
(a) The Schedule of Investments provides information on the industry categorization for the portfolio.
See Notes to Financial Statements
6
Schedule of Investments Mid Cap Intrinsic Value Portfolio (cont'd)
(b) The following is a reconciliation between the beginning and ending balances of investments in which unobservable inputs (Level 3) were used in determining value:
Investments
in Securities: | | Beginning
balance, as
of 1/1/2016 | | Accrued
discounts/
(premiums) | | Realized
gain/(loss) | | Change in
unrealized
appreciation/
(depreciation) | | Purchases | | Sales | | Transfers
into
Level 3 | | Transfers
out of
Level 3 | | Balance
as of
12/31/2016 | | Net change
in unrealized
appreciation/
(depreciation)
from
investments
still held as of
12/31/2016 | |
Rights(c) | |
Food & Staples
Retailing | | $ | 15,780 | | | $ | — | | | $ | — | | | $ | (5,128 | ) | | $ | — | | | $ | — | | | $ | — | | | $ | — | | | $ | 10,652 | | | $ | (5,128 | ) | |
Total | | $ | 15,780 | | | $ | — | | | $ | — | | | $ | (5,128 | ) | | $ | — | | | $ | — | | | $ | — | | | $ | — | | | $ | 10,652 | | | $ | (5,128 | ) | |
(c) These securities are valued based on a single quotation obtained from a dealer. The Fund does not have access to unobservable inputs and therefore cannot disclose such inputs used in formulating such quotation.
As of the year ended December 31, 2016, no securities were transferred from one level (as of December 31, 2015) to another.
See Notes to Financial Statements
7
Statement of Assets and Liabilities
Neuberger Berman Advisers Management Trust
| | | MID CAP
INTRINSIC
VALUE
PORTFOLIO | |
| | | December 31, 2016 | |
Assets | |
Investments in securities, at value* (Note A)—see Schedule of Investments: | | $ | 160,092,055 | | |
Dividends and interest receivable | | | 315,599 | | |
Receivable for securities sold | | | 1,427,206 | | |
Receivable for Fund shares sold | | | 60,896 | | |
Prepaid expenses and other assets | | | 1,755 | | |
Total Assets | | | 161,897,511 | | |
Liabilities | |
Payable for Fund shares redeemed | | | 48,942 | | |
Payable to investment manager (Note B) | | | 75,948 | | |
Payable to administrator—net (Note B) | | | 53,589 | | |
Accrued expenses and other payables | | | 72,235 | | |
Total Liabilities | | | 250,714 | | |
Net Assets | | $ | 161,646,797 | | |
Net Assets consist of: | |
Paid-in capital | | $ | 138,298,941 | | |
Undistributed net investment income (loss) | | | 1,237,980 | | |
Accumulated net realized gains (losses) on investments | | | (9,462,341 | ) | |
Net unrealized appreciation (depreciation) in value of investments | | | 31,572,217 | | |
Net Assets | | $ | 161,646,797 | | |
Net Assets | |
Class I | | $ | 104,706,564 | | |
Class S | | | 56,940,233 | | |
Shares Outstanding ($.001 par value; unlimited shares authorized) | |
Class I | | | 6,190,227 | | |
Class S | | | 2,967,573 | | |
Net Asset Value, offering and redemption price per share | |
Class I | | $ | 16.91 | | |
Class S | | | 19.19 | | |
*Cost of Investments | | $ | 128,519,838 | | |
See Notes to Financial Statements
8
Neuberger Berman Advisers Management Trust
| | | MID CAP
INTRINSIC
VALUE
PORTFOLIO | |
| | | For the
Year Ended
December 31, 2016 | |
Investment Income: | |
Income (Note A): | |
Dividend income—unaffiliated issuers | | $ | 3,204,095 | | |
Interest income—unaffiliated issuers | | | 40,702 | | |
Foreign taxes withheld (Note A) | | | (4,231 | ) | |
Total income | | $ | 3,240,566 | | |
Expenses: | |
Investment management fees (Note B) | | | 822,956 | | |
Administration fees (Note B): | |
Class I | | | 286,768 | | |
Class S | | | 162,117 | | |
Distribution fees (Note B): | |
Class S | | | 135,097 | | |
Audit fees | | | 46,560 | | |
Custodian and accounting fees | | | 58,893 | | |
Insurance expense | | | 5,214 | | |
Legal fees | | | 87,309 | | |
Shareholder reports | | | 31,024 | | |
Trustees' fees and expenses | | | 55,039 | | |
Miscellaneous | | | 11,121 | | |
Total expenses | | | 1,702,098 | | |
Expenses reimbursed by Management (Note B) | | | (23,969 | ) | |
Total net expenses | | | 1,678,129 | | |
Net investment income (loss) | | $ | 1,562,437 | | |
Realized and Unrealized Gain (Loss) on Investments (Note A): | |
Net realized gain (loss) on: | |
Sales of investment securities of unaffiliated issuers | | | (6,405,396 | ) | |
Change in net unrealized appreciation (depreciation) in value of: | |
Unaffiliated investment securities | | | 27,638,506 | | |
Net gain (loss) on investments | | | 21,233,110 | | |
Net increase (decrease) in net assets resulting from operations | | $ | 22,795,547 | | |
See Notes to Financial Statements
9
Statements of Changes in Net Assets
Neuberger Berman Advisers Management Trust
| | | MID CAP INTRINSIC VALUE PORTFOLIO | |
| | | Year Ended
December 31,
2016 | | Year Ended
December 31,
2015 | |
Increase (Decrease) in Net Assets: | |
From Operations: | |
Net investment income (loss) (Note A) | | $ | 1,562,437 | | | $ | 508,507 | | |
Net realized gain (loss) on investments (Note A) | | | (6,405,396 | ) | | | 20,901,957 | | |
Change in net unrealized appreciation (depreciation) of investments (Note A) | | | 27,638,506 | | | | (34,714,488 | ) | |
Net increase (decrease) in net assets resulting from operations | | | 22,795,547 | | | | (13,304,024 | ) | |
Distributions to Shareholders From (Note A): | |
Net investment income: | |
Class I | | | (635,017 | ) | | | (770,274 | ) | |
Class S | | | (130,629 | ) | | | (231,010 | ) | |
Net realized gain on investments: | |
Class I | | | (7,219,441 | ) | | | (2,295,395 | ) | |
Class S | | | (3,562,341 | ) | | | (1,256,382 | ) | |
Total distributions to shareholders | | | (11,547,428 | ) | | | (4,553,061 | ) | |
From Fund Share Transactions (Note D): | |
Proceeds from shares sold: | |
Class I | | | 20,771,315 | | | | 26,997,291 | | |
Class S | | | 6,119,027 | | | | 14,869,968 | | |
Proceeds from reinvestment of dividends and distributions: | |
Class I | | | 7,854,458 | | | | 3,065,669 | | |
Class S | | | 3,692,970 | | | | 1,487,392 | | |
Payments for shares redeemed: | |
Class I | | | (21,510,721 | ) | | | (20,637,990 | ) | |
Class S | | | (12,774,496 | ) | | | (16,977,499 | ) | |
Net increase (decrease) from Fund share transactions | | | 4,152,553 | | | | 8,804,831 | | |
Net Increase (Decrease) in Net Assets | | | 15,400,672 | | | | (9,052,254 | ) | |
Net Assets: | |
Beginning of year | | | 146,246,125 | | | | 155,298,379 | | |
End of year | | $ | 161,646,797 | | | $ | 146,246,125 | | |
Undistributed net investment income (loss) at end of year | | $ | 1,237,980 | | | $ | 1,076,939 | | |
See Notes to Financial Statements
10
Notes to Financial Statements Mid Cap Intrinsic Value Portfolio
Note A—Summary of Significant Accounting Policies:
1 General: Neuberger Berman Advisers Management Trust (the "Trust") is a Delaware statutory trust organized pursuant to an Amended and Restated Trust Instrument dated March 27, 2014. The Trust is currently comprised of eight separate operating series (each individually a "Fund," and collectively the "Funds") each of which is diversified. The Trust is registered as an open-end management investment company under the Investment Company Act of 1940, as amended (the "1940 Act"), and its shares are registered under the Securities Act of 1933, as amended. Neuberger Berman Advisers Management Trust Mid Cap Intrinsic Value Portfolio (the "Fund") currently offers Class I and Class S shares. The Trust's Board of Trustees (the "Board") may establish additional series or classes of shares without the approval of shareholders.
The assets of each Fund belong only to that Fund, and the liabilities of each Fund are borne solely by that Fund and no other.
The Fund is an investment company and accordingly follows the investment company accounting and reporting guidance of the Financial Accounting Standards Board ("FASB") Accounting Standard Codification Topic 946 "Financial Services—Investment Companies."
The preparation of financial statements in accordance with U.S. generally accepted accounting principles ("GAAP") requires Neuberger Berman Investment Advisers LLC ("NBIA" or "Management") to make estimates and assumptions at the date of the financial statements. Actual results could differ from those estimates.
Shares of the Fund are not available to the general public and may be purchased only by life insurance companies to serve as an investment vehicle for premiums paid under their variable annuity and variable life insurance contracts and to certain qualified pension and other retirement plans.
2 Portfolio valuation: In accordance with Accounting Standards Codification ("ASC") 820 "Fair Value Measurement" ("ASC 820"), all investments held by the Fund are carried at the value that Management believes the Fund would receive upon selling an investment in an orderly transaction to an independent buyer in the principal or most advantageous market for the investment under current market conditions. Various inputs, including the volume and level of activity for the asset or liability in the market, are considered in valuing the Fund's investments, some of which are discussed below. Significant Management judgment may be necessary to value investments in accordance with ASC 820.
ASC 820 established a three-tier hierarchy of inputs to create a classification of value measurements for disclosure purposes. The three-tier hierarchy of inputs is summarized in the three broad Levels listed below.
• Level 1—quoted prices in active markets for identical investments
• Level 2—other observable inputs (including quoted prices for similar investments, interest rates, prepayment speeds, credit risk, amortized cost, etc.)
• Level 3—unobservable inputs (including the Fund's own assumptions in determining the fair value of investments)
The inputs or methodology used for valuing an investment are not necessarily an indication of the risk associated with investing in those securities.
The value of the Fund's investments in equity securities and rights, for which market quotations are readily available, is generally determined by Management by obtaining valuations from independent pricing services based on the latest sale price quoted on a principal exchange or market for that security (Level 1 inputs). Securities traded primarily on the NASDAQ Stock Market are normally valued at the NASDAQ Official Closing Price ("NOCP") provided by NASDAQ each business day. The NOCP is the most recently reported price as of 4:00:02 p.m., Eastern
11
Time, unless that price is outside the range of the "inside" bid and asked prices (i.e., the bid and asked prices that dealers quote to each other when trading for their own accounts); in that case, NASDAQ will adjust the price to equal the inside bid or asked price, whichever is closer. Because of delays in reporting trades, the NOCP may not be based on the price of the last trade to occur before the market closes. If there is no sale of a security on a particular day, the independent pricing services may value the security based on market quotations.
Management has developed a process to periodically review information provided by independent pricing services for all types of securities.
Investments in non-exchange traded investment companies are valued using the respective fund's daily calculated net asset value per share (Level 2 inputs).
If a valuation is not available from an independent pricing service, or if Management has reason to believe that the valuation received does not represent the amount the Fund might reasonably expect to receive on a current sale in an orderly transaction, Management seeks to obtain quotations from brokers or dealers (generally considered Level 2 or Level 3 inputs depending on the number of quotes available). If such quotations are not readily available, the security is valued using methods the Board has approved in the good-faith belief that the resulting valuation will reflect the fair value of the security. Numerous factors may be considered when determining the fair value of a security based on Level 2 or Level 3 inputs, including available analyst, media or other reports, securities within the same industry with recent highly correlated performance, trading in futures or American Depositary Receipts ("ADRs") and whether the issuer of the security being fair valued has other securities outstanding.
The value of the Fund's investments in foreign securities is generally determined using the same valuation methods and inputs as other Fund investments, as discussed above. Foreign security prices expressed in local currency values are normally translated from the local currency into U.S. dollars using the exchange rates as of 4:00 p.m. Eastern Time on days the New York Stock Exchange ("NYSE") is open for business. The Board has approved the use of Interactive Data Pricing and Reference Data LLC ("Interactive") to assist in determining the fair value of foreign equity securities when changes in the value of a certain index suggest that the closing prices on the foreign exchanges may no longer represent the amount that the Fund could expect to receive for those securities or on days when foreign markets are closed and U.S. markets are open. In each of these events, Interactive will provide adjusted prices for certain foreign equity securities using a statistical analysis of historical correlations of multiple factors (Level 2 inputs). In the absence of precise information about the market values of these foreign securities as of the time as of which a Fund's share price is calculated, the Board has determined on the basis of available data that prices adjusted in this way are likely to be closer to the prices the Fund could realize on a current sale than are the prices of those securities established at the close of the foreign markets in which the securities primarily trade.
Fair value prices are necessarily estimates, and there is no assurance that such a price will be at or close to the price at which the security is next quoted or next trades.
3 Foreign currency translation: The accounting records of the Fund are maintained in U.S. dollars. Foreign currency amounts are normally translated into U.S. dollars using the exchange rate as of 4:00 p.m. Eastern Time, on days the NYSE is open for business to determine the value of investments, other assets and liabilities. Purchase and sale prices of securities, and income and expenses, are translated into U.S. dollars at the prevailing rate of exchange on the respective dates of such transactions. Net unrealized foreign currency gain (loss), if any, arises from changes in the value of assets and liabilities, other than investments in securities, as a result of changes in exchange rates and is stated separately in the Statement of Operations.
4 Securities transactions and investment income: Securities transactions are recorded on trade date for financial reporting purposes. Dividend income is recorded on the ex-dividend date or, for certain foreign dividends, as soon as the Fund becomes aware of the dividends. Non-cash dividends included in dividend income, if any, are recorded at the fair market value of the securities received. Interest income, including accretion of original issue discount, where applicable, and accretion of discount on short-term investments, if any, is recorded on the accrual basis. Realized gains and losses from securities transactions and foreign currency transactions, if any, are recorded on the basis of identified cost and stated separately in the Statement of Operations. Included in net realized gain (loss) on
12
investments are proceeds from the settlements of class action litigation in which the Fund participated as a class member. The amount of such proceeds for the year ended December 31, 2016 was $51,541.
5 Income tax information: Each Fund is treated as a separate entity for U.S. federal income tax purposes. It is the policy of the Fund to continue to qualify for treatment as a regulated investment company ("RIC") by complying with the requirements of the U.S. Internal Revenue Code applicable to RICs and to distribute substantially all of its net investment income and net realized capital gains to its shareholders. To the extent the Fund distributes substantially all of its net investment income and net realized capital gains to shareholders, no federal income or excise tax provision is required.
The Fund has adopted the provisions of ASC 740 "Income Taxes" ("ASC 740"). ASC 740 sets forth a minimum threshold for financial statement recognition of a tax position taken, or expected to be taken, in a tax return. The Fund recognizes interest and penalties, if any, related to unrecognized tax positions as an income tax expense in the Statement of Operations. The Fund is subject to examination by U.S. federal and state tax authorities for returns filed for the tax years for which the applicable statutes of limitations have not yet expired. As of December 31, 2016, the Fund did not have any unrecognized tax positions.
At December 31, 2016, the cost of investments for U.S. federal income tax basis was $128,302,667. Gross unrealized appreciation of investments was $35,721,141 and gross unrealized depreciation of investments was $3,931,753 resulting in net unrealized appreciation of $31,789,388 based on cost for U.S. federal income tax purposes.
Income distributions and capital gain distributions are determined in accordance with income tax regulations, which may differ from GAAP. These differences are primarily due to differing treatments of income and gains on various investment securities held by the Fund, timing differences and differing characterization of distributions made by the Fund. The Fund may also utilize earnings and profits distributed to shareholders on redemption of their shares as a part of the dividends-paid deduction for income tax purposes.
As determined on December 31, 2016, permanent differences resulting primarily from different book and tax accounting were reclassified at year end. Such differences are attributed to the tax treatment of: prior year adjustments, distributions re-designated, partnership basis adjustments, non-deductible expense, return of capital distributions from real estate investment trusts ("REITs") and capital gain distributions from REITs. These reclassifications had no effect on net income, net asset value ("NAV") or NAV per share of the Fund. For the year ended December 31, 2016, the Fund recorded the following permanent reclassifications:
| Paid-in Capital | | Undistributed
Net Investment
Income (Loss) | | Accumulated
Net Realized
Gains (Losses)
on Investments | |
| $ | (289 | ) | | $ | (635,750 | ) | | $ | 636,039 | | |
The tax character of distributions paid during the years ended December 31, 2016 and December 31, 2015 was as follows:
| | | Distributions Paid From: | |
| | | Ordinary Income | | Long-Term Capital Gain | | Total | |
| | | 2016 | | 2015 | | 2016 | | 2015 | | 2016 | | 2015 | |
| | | | | $ | 766,176 | | | $ | 1,001,284 | | | $ | 10,781,252 | | | $ | 3,551,777 | | | $ | 11,547,428 | | | $ | 4,553,061 | | |
As of December 31, 2016, the components of distributable earnings (accumulated losses) on a U.S. federal income tax basis were as follows:
Undistributed
Ordinary
Income | | Undistributed
Long-Term
Capital Gain | | Unrealized
Appreciation/
(Depreciation) | | Loss
Carryforwards
and Deferrals | | Other
Temporary
Differences | | Total | |
| $ | 1,237,980 | | | $ | — | | | $ | 31,789,388 | | | $ | (9,679,512 | ) | | $ | — | | | $ | 23,347,856 | | |
13
The temporary differences between book basis and tax basis distributable earnings are primarily due to: losses disallowed and recognized on wash sales and return of capital adjustments.
To the extent the Fund's net realized capital gains, if any, can be offset by capital loss carryforwards, it is the policy of the Fund not to distribute such gains. The Regulated Investment Company Modernization Act of 2010 (the "Act") made changes to the capital loss carryforward rules allowing for RICs to carry forward capital losses indefinitely and to retain the character of capital loss carryforwards as short-term or long-term ("Post-Enactment"). Rules in effect previously limited the carryforward period to eight years and all carryforwards were considered short-term in character ("Pre-Enactment"). As determined at December 31, 2016, the Fund had unused capital loss carryforwards available for federal income tax purposes to offset net realized capital gains, if any, as follows:
| Pre-Enactment | |
Expiring in:
2017 | |
| | 3,818,173 | | |
| | | Post-Enactment
(No Expiration Date) | |
| | | Long-Term | | Short-Term | |
| | | | | $ | 2,840,658 | | | $ | 3,020,681 | | |
Post-Enactment capital loss carryforwards must be fully used before Pre-Enactment capital loss carryforwards; therefore, under certain circumstances, Pre-Enactment capital loss carryforwards available as of the report date may expire unused.
6 Distributions to shareholders: The Fund may earn income, net of expenses, daily on its investments. Distributions from net investment income and net realized capital gains, if any, are generally distributed once a year (usually in October). Income distributions and capital gain distributions to shareholders are recorded on the ex-date.
It is the policy of the Fund to pass through to its shareholders substantially all real estate investment trust ("REIT") distributions and other income it receives, less operating expenses. The distributions the Fund receives from REITs are generally composed of income, capital gains, and/or return of REIT capital, but the REITs do not report this information to the Fund until the following calendar year. At December 31, 2016, the Fund estimated these amounts within the financial statements because the information is not available from the REITs until after the Fund's fiscal period. For the year ended December 31, 2016, the character of distributions paid to shareholders disclosed within the Statements of Changes in Net Assets is based on estimates made at that time. All estimates are based upon REIT information sources available to the Fund together with actual IRS Forms 1099-DIV received to date. Based on past experience it is possible that a portion of the Fund's distributions during the current fiscal year will be considered tax return of capital, but the actual amount of the tax return of capital, if any, is not determinable until after the Fund's fiscal year-end. After calendar year-end, when the Fund learns the nature of the distributions paid by REITs during that year, distributions previously identified as income are often re-characterized as return of capital and/or capital gain. After all applicable REITs have informed the Fund of the actual breakdown of distributions paid to the Fund during its fiscal year, estimates previously recorded are adjusted on the books of the Fund to reflect actual results. As a result, the composition of the Fund's distributions as reported herein may differ from the final composition determined after calendar year-end and reported to Fund shareholders on IRS Form 1099-DIV.
7 Foreign taxes: Foreign taxes withheld, if any, represent amounts withheld by foreign tax authorities, net of refunds recoverable.
8 Expense allocation: Certain expenses are applicable to multiple funds within the complex of related investment companies. Expenses directly attributable to a Fund are charged to that Fund. Expenses of the Trust that are not directly attributable to a particular series of the Trust (e.g., the Fund) are allocated among the series of the Trust, on
14
the basis of relative net assets, except where a more appropriate allocation of expenses to each of the series can otherwise be made fairly. Expenses borne by the complex of related investment companies, which includes open-end and closed-end investment companies for which Management serves as investment manager, that are not directly attributable to a particular investment company in the complex (e.g., the Trust) or series thereof are allocated among the investment companies in the complex or series thereof on the basis of relative net assets, except where a more appropriate allocation of expenses to each of the investment companies in the complex or series thereof can otherwise be made fairly. The Fund's expenses (other than those specific to each class) are allocated proportionally each day among the classes based upon the relative net assets of each class.
9 Investments in foreign securities: Investing in foreign securities may involve sovereign and other risks, in addition to the credit and market risks normally associated with domestic securities. These additional risks include the possibility of adverse political and economic developments (including political instability, nationalization, expropriation, or confiscatory taxation) and the potentially adverse effects of unavailability of public information regarding issuers, less governmental supervision and regulation of financial markets, reduced liquidity of certain financial markets, and the lack of uniform accounting, auditing, and financial reporting standards or the application of standards that are different or less stringent than those applied in the United States. Foreign securities also may experience greater price volatility, higher rates of inflation, and delays in settlement.
10 Indemnifications: Like many other companies, the Trust's organizational documents provide that its officers ("Officers") and trustees ("Trustees") are indemnified against certain liabilities arising out of the performance of their duties to the Trust. In addition, both in some of its principal service contracts and in the normal course of its business, the Trust enters into contracts that provide indemnifications to other parties for certain types of losses or liabilities. The Trust's maximum exposure under these arrangements is unknown as this could involve future claims against the Trust.
11 Other: All net investment income and realized and unrealized capital gains and losses of the Fund are allocated, on the basis of relative net assets, pro rata among its respective classes.
Note B—Investment Management Fees, Administration Fees, Distribution Arrangements, and Other Transactions with Affiliates:
The Fund retains Management as its investment manager under a Management Agreement. For such investment management services, the Fund pays Management a fee at the annual rate of 0.55% of the first $250 million of the Fund's average daily net assets, 0.525% of the next $250 million, 0.50% of the next $250 million, 0.475% of the next $250 million, 0.45% of the next $500 million, 0.425% of the next $2.5 billion, and 0.40% of average daily net assets in excess of $4 billion. Accordingly, for the year ended December 31, 2016, the investment management fee pursuant to the Management Agreement was equivalent to an annual effective rate of 0.55% of the Fund's average daily net assets.
The Fund retains Management as its administrator under an Administration Agreement. Each class pays Management an administration fee at the annual rate of 0.30% of its average daily net assets under this agreement. Additionally, Management retains State Street Bank and Trust Company ("State Street") as its sub-administrator under a Sub-Administration Agreement. Management pays State Street a fee for all services received under this agreement.
Neuberger Berman BD LLC (the "Distributor") is the Fund's "principal underwriter" within the meaning of the 1940 Act. It acts as agent in arranging for the sale of the Fund's Class I shares without sales commission or other compensation and bears all advertising and promotion expenses incurred in the sale of those shares. The Board adopted a non-fee distribution plan for the Fund's Class I.
The Board has adopted a distribution and shareholder services plan (the "Plan") for Class S shares pursuant to Rule 12b-1 under the 1940 Act. The Plan provides that, for its activities and expenses related to the sale and distribution of Class S, and ongoing services provided to investors in the class, the Distributor receives from Class S
15
a fee at the annual rate of 0.25% of Class S's average daily net assets. Distributor may pay a portion of the proceeds from the 12b-1 fee to insurance companies or their affiliates and qualified plan administrators ("intermediaries") for services they provide respecting the Fund to current and prospective variable contract owners and qualified plan participants that invest in the Fund through the intermediaries. Those institutions may use the payments for, among other purposes, compensating employees engaged in sales and/or shareholder servicing. The amount of fees paid by the class during any year may be more or less than the cost of distribution and other services provided to the class. FINRA rules limit the amount of annual distribution fees that may be paid by a mutual fund and impose a ceiling on the cumulative distribution fees paid. The Plan complies with those rules.
Management has contractually agreed to waive fees and/or reimburse the Fund's Class I and Class S shares so that the total annual operating expenses of those classes do not exceed the expense limitations as detailed in the following table. These undertakings include fees payable to Management but exclude interest (commitment fees relating to borrowings are treated as interest for purposes of this exclusion), taxes, transaction costs, brokerage commissions, dividend and interest expenses relating to short sales, acquired fund fees and expenses and extraordinary expenses, if any; consequently, net expenses may exceed the contractual expense limitations. The Fund has agreed that each of its classes will repay Management for fees and expenses waived or reimbursed for that class provided that repayment does not cause that class's annual operating expenses to exceed its contractual expense limitation in place at the time the fees and expenses were waived or reimbursed, or the expense limitation in place at the time the Fund repays Management, whichever is lower. Any such repayment must be made within three years after the year in which Management incurred the expense.
During the year ended December 31, 2016, there was no repayment to Management under its contractual expense limitation.
At December 31, 2016, the Fund's contingent liabilities to Management under its contractual expense limitation were as follows:
| | | | | | | Expenses Reimbursed in
Fiscal Year Ending December 31, | |
| | | | | | | 2014 | | 2015 | | 2016 | |
| | | | | | | Subject to Repayment Until December 31, | |
| | | Contractual
Expense
Limitation(a) | | Expiration | | 2017 | | 2018 | | 2019 | |
Class I | | | 1.50 | % | | 12/31/19 | | $ | — | | | $ | — | | | $ | — | | |
Class S | | | 1.25 | % | | 12/31/20 | | | 12,553 | | | | 16,998 | | | | 23,969 | | |
(a) Expense limitation per annum of the respective class's average daily net assets.
Neuberger Berman LLC ("Neuberger") was retained by Management through December 31, 2015, pursuant to a Sub-Advisory Agreement to furnish it with investment recommendations and research information without added cost to the Fund. Several individuals who are Officers and/or Trustees of the Trust are also employees of Neuberger and/or Management. As a result of the entity consolidation described on page 3 of this Annual Report, the services previously provided by Neuberger under the Sub-Advisory Agreement are being provided by NBIA as of January 1, 2016.
Note C—Securities Transactions:
During the year ended December 31, 2016, there were purchase and sale transactions (excluding short-term securities) of $50,296,922 and $52,321,779, respectively.
During the year ended December 31, 2016, no brokerage commissions on securities transactions were paid to affiliated brokers.
16
Note D—Fund Share Transactions:
Share activity for the years ended December 31, 2016 and December 31, 2015 was as follows:
For the Year Ended December 31, 2016
| | | Shares Sold | | Shares Issued on
Reinvestment of
Dividends and
Distributions | | Shares
Redeemed | | Total | |
Class I | | | 1,283,423 | | | | 501,562 | | | | (1,316,975 | ) | | | 468,010 | | |
Class S | | | 330,018 | | | | 207,820 | | | | (696,761 | ) | | | (158,923 | ) | |
For the Year Ended December 31, 2015
| | | Shares Sold | | Shares Issued on
Reinvestment of
Dividends and
Distributions | | Shares
Redeemed | | Total | |
Class I | | | 1,520,026 | | | | 184,346 | | | | (1,154,146 | ) | | | 550,226 | | |
Class S | | | 747,609 | | | | 79,710 | | | | (852,150 | ) | | | (24,831 | ) | |
Note E—Line of Credit:
At December 31, 2016, the Fund was a participant in a syndicated committed, unsecured $700,000,000 line of credit (the "Credit Facility"), to be used only for temporary or emergency purposes. Series of other investment companies managed by Management also participate in this line of credit on substantially the same terms except that some do not have access to the full amount of the Credit Facility. Interest is charged on borrowings under this Credit Facility at the higher of (a) a federal funds effective rate plus 1.00% per annum or (b) a Eurodollar rate for a one-month period plus 1.00% per annum. The Credit Facility has an annual commitment fee of 0.15% per annum of the available line of credit, which is paid quarterly. The Fund has agreed to pay its pro rata share of the annual commitment fee, based on the ratio of its individual net assets to the net assets of all participants at the time the fee is due and payable and the level of its access to the Credit Facility, and interest charged on any borrowing made by the Fund and other costs incurred by the Fund. Because several mutual funds participate in the Credit Facility, there is no assurance that the Fund will have access to all or any part of the $700,000,000 at any particular time. There were no loans outstanding under the Credit Facility at December 31, 2016. During the period ended December 31, 2016, the Fund did not utilize the Credit Facility.
Note F—Recent Accounting Pronouncement:
In October 2016, the U.S. Securities and Exchange Commission ("SEC") adopted new rules and forms, and amendments to certain current rules and forms, to modernize reporting and disclosure of information by registered investment companies. The amendments to Regulation S-X will require standardized, enhanced disclosure about derivatives in investment company financial statements, and will also change the rules governing the form and content of such financial statements. The compliance date for the amendments to Regulation S-X is August 1, 2017. Management is currently evaluating the impact that the adoption of the amendments to Regulation S-X will have on the Fund's financial statements and related disclosures.
17
Mid Cap Intrinsic Value Portfolio
The following tables include selected data for a share outstanding throughout each year and other performance information derived from the Financial Statements. Amounts that do not round to $0.01 or $(0.01) per share are presented as $0.00 or $(0.00), respectively. Ratios that do not round to 0.01% or (0.01)% are presented as 0.00% or (0.00)%, respectively. A "—" indicates that the line item was not applicable in the corresponding period.
Class I | |
| | | Year Ended December 31, | |
| | | 2016 | | 2015 | | 2014 | | 2013 | | 2012 | |
Net Asset Value, Beginning of Year | | $ | 15.85 | | | $ | 17.87 | | | $ | 16.38 | | | $ | 12.09 | | | $ | 14.26 | | |
Income From Investment Operations: | |
| Net Investment Income (Loss)@ | | | 0.18 | | | | 0.07 | | | | 0.20 | | | | 0.17 | | | | 0.18 | | |
Net Gains or Losses on Securities
(both realized and unrealized) | | | 2.27 | | | | (1.53 | ) | | | 1.98 | | | | 4.30 | | | | 1.94 | | |
Total From Investment Operations | | | 2.45 | | | | (1.46 | ) | | | 2.18 | | | | 4.47 | | | | 2.12 | | |
Less Distributions From: | |
Net Investment Income | | | (0.11 | ) | | | (0.14 | ) | | | (0.19 | ) | | | (0.18 | ) | | | (0.10 | ) | |
Net Capital Gains | | | (1.28 | ) | | | (0.42 | ) | | | (0.50 | ) | | | — | | | | (4.19 | ) | |
Total Distributions | | | (1.39 | ) | | | (0.56 | ) | | | (0.69 | ) | | | (0.18 | ) | | | (4.29 | ) | |
Voluntary Contribution from Management | | | — | | | | — | | | | 0.00 | | | | — | | | | — | | |
Net Asset Value, End of Year | | $ | 16.91 | | | $ | 15.85 | | | $ | 17.87 | | | $ | 16.38 | | | $ | 12.09 | | |
| Total Return† | | | 16.17 | %^ | | | (8.34 | )%^ | | | 13.84 | %µ | | | 37.05 | %^ | | | 15.53 | % | |
Ratios/Supplemental Data | |
Net Assets, End of Year (in millions) | | $ | 104.7 | | | $ | 90.7 | | | $ | 92.4 | | | $ | 84.1 | | | $ | 68.0 | | |
| Ratio of Gross Expenses to Average Net Assets# | | | 1.05 | % | | | 1.03 | % | | | 1.02 | % | | | 1.03 | % | | | 1.07 | % | |
Ratio of Net Expenses to Average Net Assets | | | 1.05 | % | | | 1.03 | % | | | 1.02 | % | | | 1.03 | % | | | 1.07 | %§ | |
Ratio of Net Investment Income (Loss) to Average
Net Assets | | | 1.12 | % | | | 0.42 | % | | | 1.20 | % | | | 1.16 | % | | | 1.27 | % | |
Portfolio Turnover Rate | | | 36 | % | | | 41 | % | | | 30 | % | | | 35 | % | | | 29 | % | |
See Notes to Financial Highlights
18
Financial Highlights (cont'd)
Class S | |
| | | Year Ended December 31, | |
| | | 2016 | | 2015 | | 2014 | | 2013 | | 2012 | |
Net Asset Value, Beginning of Year | | $ | 17.78 | | | $ | 19.95 | | | $ | 18.20 | | | $ | 13.43 | | | $ | 15.41 | | |
Income From Investment Operations: | |
| Net Investment Income (Loss)@ | | | 0.17 | | | | 0.04 | | | | 0.18 | | | | 0.15 | | | | 0.17 | | |
Net Gains or Losses on Securities
(both realized and unrealized) | | | 2.57 | | | | (1.72 | ) | | | 2.21 | | | | 4.77 | | | | 2.10 | | |
Total From Investment Operations | | | 2.74 | | | | (1.68 | ) | | | 2.39 | | | | 4.92 | | | | 2.27 | | |
Less Distributions From: | |
Net Investment Income | | | (0.05 | ) | | | (0.07 | ) | | | (0.14 | ) | | | (0.15 | ) | | | (0.06 | ) | |
Net Capital Gains | | | (1.28 | ) | | | (0.42 | ) | | | (0.50 | ) | | | — | | | | (4.19 | ) | |
Total Distributions | | | (1.33 | ) | | | (0.49 | ) | | | (0.64 | ) | | | (0.15 | ) | | | (4.25 | ) | |
Voluntary Contribution from Management | | | — | | | | — | | | | 0.00 | | | | — | | | | — | | |
Net Asset Value, End of Year | | $ | 19.19 | | | $ | 17.78 | | | $ | 19.95 | | | $ | 18.20 | | | $ | 13.43 | | |
| Total Return† | | | 15.98 | %^ | | | (8.52 | )%^ | | | 13.56 | %µ | | | 36.71 | %^ | | | 15.37 | % | |
Ratios/Supplemental Data | |
Net Assets, End of Year (in millions) | | $ | 56.9 | | | $ | 55.6 | | | $ | 62.9 | | | $ | 62.5 | | | $ | 53.5 | | |
| Ratio of Gross Expenses to Average Net Assets# | | | 1.30 | % | | | 1.28 | % | | | 1.27 | % | | | 1.28 | % | | | 1.32 | % | |
Ratio of Net Expenses to Average Net Assets | | | 1.25 | % | | | 1.25 | % | | | 1.25 | % | | | 1.25 | % | | | 1.25 | %§ | |
Ratio of Net Investment Income (Loss) to Average
Net Assets | | | 0.91 | % | | | 0.18 | % | | | 0.97 | % | | | 0.95 | % | | | 1.09 | % | |
Portfolio Turnover Rate | | | 36 | % | | | 41 | % | | | 30 | % | | | 35 | % | | | 29 | % | |
See Notes to Financial Highlights
19
Notes to Financial Highlights Mid Cap Intrinsic Value Portfolio
† Total return based on per share NAV reflects the effects of changes in NAV on the performance of the Fund during each fiscal period. Returns assume income dividends and other distributions, if any, were reinvested. Results represent past performance and do not indicate future results. Current returns may be lower or higher than the performance data quoted. Investment returns and principal may fluctuate and shares when redeemed may be worth more or less than original cost. Total return would have been lower if Management had not reimbursed and/or waived certain expenses. The total return information shown does not reflect charges and other expenses that apply to the separate accounts or the related insurance policies or other qualified pension or retirement plans, and the inclusion of these charges and other expenses would reduce the total return for all fiscal periods shown.
^ The class action proceeds listed in Note A of the Notes to Financial Statements had no impact on the Fund's total return for the year ended December 31, 2016. The class action proceeds received in 2015 had no impact on the Fund's total return for the year ended December 31, 2015. Had the Fund not received class action proceeds in 2013, total return based on per share NAV for the year ended December 31, 2013 would have been 36.88% and 36.56% for Class I and Class S, respectively.
# Represents the annualized ratios of net expenses to average daily net assets if Management had not reimbursed certain expenses and/or waived a portion of the investment management fee. Management did not reimburse or waive fees during the fiscal periods shown for Class I.
@ Calculated based on the average number of shares outstanding during each fiscal period.
§ Prior to January 1, 2013, the Fund had an expense offset arrangement in connection with its custodian contract. The impact of expense reductions related to expense offset arrangements, if any, was less than 0.01%.
µ The voluntary contribution received in 2014 had no impact on the Fund's total return for the year ended December 31, 2014.
20
Report of Independent Registered Public Accounting Firm
To the Board of Trustees of
Neuberger Berman Advisers Management Trust and
Shareholders of Mid Cap Intrinsic Value Portfolio
We have audited the accompanying statement of assets and liabilities of Mid Cap Intrinsic Value Portfolio, one of the series constituting Neuberger Berman Advisers Management Trust (the "Trust"), including the schedule of investments, as of December 31, 2016, and the related statement of operations for the year then ended, the statements of changes in net assets for each of the two years in the period then ended and the financial highlights for each of the five years in the period then ended. These financial statements and financial highlights are the responsibility of the Trust's management. Our responsibility is to express an opinion on these financial statements and financial highlights based on our audits.
We conducted our audits in accordance with the standards of the Public Company Accounting Oversight Board (United States). Those standards require that we plan and perform the audit to obtain reasonable assurance about whether the financial statements and financial highlights are free of material misstatement. We were not engaged to perform an audit of the Trust's internal control over financial reporting. Our audits included consideration of internal control over financial reporting as a basis for designing audit procedures that are appropriate in the circumstances, but not for the purpose of expressing an opinion on the effectiveness of the Trust's internal control over financial reporting. Accordingly, we express no such opinion. An audit also includes examining, on a test basis, evidence supporting the amounts and disclosures in the financial statements and financial highlights, assessing the accounting principles used and significant estimates made by management, and evaluating the overall financial statement presentation. Our procedures included confirmation of securities owned as of December 31, 2016 by correspondence with the custodian and others or by other appropriate auditing procedures where replies from others were not received. We believe that our audits provide a reasonable basis for our opinion.
In our opinion, the financial statements and financial highlights referred to above present fairly, in all material respects, the financial position of Mid Cap Intrinsic Value Portfolio, a series of Neuberger Berman Advisers Management Trust, at December 31, 2016, the results of its operations for the year then ended, the changes in its net assets for each of the two years in the period then ended, and the financial highlights for each of the five years in the period then ended in conformity with U.S. generally accepted accounting principles.
Boston, Massachusetts
February 10, 2017
21
The following tables set forth information concerning the Trustees and Officers of the Fund. All persons named as Trustees and Officers also serve in similar capacities for other funds administered or managed by Management. The Fund's Statement of Additional Information includes additional information about the Trustees as of the time of the Fund's most recent public offering and is available upon request, without charge, by calling (800) 877-9700.
Information about the Board of Trustees
Name, (Year of Birth),
and Address(1) | | Position(s)
and Length
of Time
Served(2) | | Principal Occupation(s)(3) | | Number of
Funds in Fund
Complex
Overseen by
Fund Trustee | | Other Directorships
Held Outside Fund
Complex by Fund
Trustee(3) | |
Independent Trustees | |
Michael J. Cosgrove (1949) | | Trustee since 2015 | | President, Carragh Consulting USA, since 2014; formerly, Executive, General Electric Company, 1970 to 2014, including President, Mutual Funds and Global Investment Programs, GE Asset Management, 2011 to 2014, President and Chief Executive Officer, Mutual Funds and Intermediary Business, GE Asset Management, 2007 to 2011, President, Institutional Sales and Marketing, GE Asset Management, 1998 to 2007, and Chief Financial Officer, GE Asset Management, and Deputy Treasurer, GE Company, 1988 to 1993. | | 55 | | | Director, America Press, Inc. (not-for-profit Jesuit publisher), since 2015; Director, Fordham University, since 2001; formerly, Director, The Gabelli Go Anywhere Trust, June 2015 to June 2016; Director, Skin Cancer Foundation (not-for-profit), 2006 to 2015; Director, GE Investments Funds, Inc., 1997 to 2014; Trustee, GE Institutional Funds, 1997 to 2014; Director, GE Asset Management, 1988 to 2014; Director, Elfun Trusts, 1988 to 2014; Trustee, GE Pension & Benefit Plans, 1988 to 2014. | |
22
Name, (Year of Birth),
and Address(1) | | Position(s)
and Length
of Time
Served(2) | | Principal Occupation(s)(3) | | Number of
Funds in Fund
Complex
Overseen by
Fund Trustee | | Other Directorships
Held Outside Fund
Complex by Fund
Trustee(3) | |
Marc Gary (1952) | | Trustee since 2015 | | Executive Vice Chancellor and Chief Operating Officer, Jewish Theological Seminary, since 2012; formerly, Executive Vice President and General Counsel, Fidelity Investments, 2007 to 2012; Executive Vice President and General Counsel, BellSouth Corporation, 2004 to 2007; Vice President and Associate General Counsel, BellSouth Corporation, 2000 to 2004; Associate, Partner, and National Litigation Practice Co-Chair, Mayer, Brown LLP, 1981 to 2000; Associate Independent Counsel, Office of Independent Counsel, 1990 to 1992. | | 55 | | | Trustee, Jewish Theological Seminary, since 2015; Director, Counsel on Call (privately held for-profit company), since 2012; Director, Lawyers Committee for Civil Rights Under Law (not-for-profit), since 2005; formerly, Director, Equal Justice Works (not-for-profit), 2005 to 2014; Director, Corporate Counsel Institute, Georgetown University Law Center, 2007 to 2012; Director, Greater Boston Legal Services (not-for-profit), 2007 to 2012. | |
23
Name, (Year of Birth),
and Address(1) | | Position(s)
and Length
of Time
Served(2) | | Principal Occupation(s)(3) | | Number of
Funds in Fund
Complex
Overseen by
Fund Trustee | | Other Directorships
Held Outside Fund
Complex by Fund
Trustee(3) | |
Martha C. Goss (1949) | | Trustee since 2007 | | President, Woodhill Enterprises Inc./Chase Hollow Associates LLC (personal investment vehicle), since 2006; formerly, Consultant, Resources Global Professionals (temporary staffing), 2002 to 2006. | | 55 | | | Director, American Water (water utility), since 2003; Director, Allianz Life of New York (insurance), since 2005; Director, Berger Group Holdings, Inc. (engineering consulting firm), since 2013; Director, Financial Women's Association of New York (not-for-profit association), since 2003; Trustee Emerita, Brown University, since 1998; Director, Museum of American Finance (not-for-profit), since 2013; formerly, Non-Executive Chair and Director, Channel Reinsurance (financial guaranty reinsurance), 2006 to 2010; formerly, Director, Ocwen Financial Corporation (mortgage servicing), 2005 to 2010; formerly, Director, Claire's Stores, Inc. (retailer), 2005 to 2007; formerly, Director, Parsons Brinckerhoff Inc. (engineering consulting firm), 2007 to 2010; formerly, Director, Bank Leumi (commercial bank), 2005 to 2007; formerly, Advisory Board Member, Attensity (software developer), 2005 to 2007. | |
Michael M. Knetter (1960) | | Trustee since 2007 | | President and Chief Executive Officer, University of Wisconsin Foundation, since October 2010; formerly, Dean, School of Business, University of Wisconsin—Madison; formerly, Professor of International Economics and Associate Dean, Amos Tuck School of Business—Dartmouth College, 1998 to 2002. | | 55 | | | Board Member, American Family Insurance (a mutual company, not publicly traded), since March 2009; formerly, Trustee, Northwestern Mutual Series Fund, Inc., 2007 to 2011; formerly, Director, Wausau Paper, 2005 to 2011; formerly, Director, Great Wolf Resorts, 2004 to 2009. | |
24
Name, (Year of Birth),
and Address(1) | | Position(s)
and Length
of Time
Served(2) | | Principal Occupation(s)(3) | | Number of
Funds in Fund
Complex
Overseen by
Fund Trustee | | Other Directorships
Held Outside Fund
Complex by Fund
Trustee(3) | |
Deborah C. McLean (1954) | | Trustee since 2015 | | Member, Circle Financial Group (private wealth management membership practice), since 2011; Managing Director, Golden Seeds LLC (an angel investing group), since 2009; Adjunct Professor, Columbia University School of International and Public Affairs, since 2008; formerly, Visiting Assistant Professor, Fairfield University, Dolan School of Business, Fall 2007; formerly, Adjunct Associate Professor of Finance, Richmond, The American International University in London, 1999 to 2007. | | 55 | | | Board member, Norwalk Community College Foundation, since 2014; Dean's Advisory Council, Radcliffe Institute for Advanced Study, since 2014; formerly, Director and Treasurer, At Home in Darien (not-for-profit), 2012 to 2014; Director, National Executive Service Corps (not-for-profit), 2012 to 2013; Trustee, Richmond, The American International University in London, 1999 to 2013. | |
George W. Morriss (1947) | | Trustee since 2007 | | Adjunct Professor, Columbia University School of International and Public Affairs, since October 2012; formerly, Executive Vice President and Chief Financial Officer, People's United Bank, Connecticut (a financial services company), 1991 to 2001. | | 55 | | | Director, National Association of Corporate Directors, Connecticut Chapter, since 2011; Trustee, Steben Alternative Investment Funds, Steben Select Multi-Strategy Fund, and Steben Select Multi-Strategy Master Fund, since 2013; formerly, Treasurer, National Association of Corporate Directors, Connecticut Chapter, 2011 to 2015; formerly, Manager, Larch Lane Multi-Strategy Fund complex (which consisted of three funds), 2006 to 2011; formerly, Member, NASDAQ Issuers' Affairs Committee, 1995 to 2003. | |
25
Name, (Year of Birth),
and Address(1) | | Position(s)
and Length
of Time
Served(2) | | Principal Occupation(s)(3) | | Number of
Funds in Fund
Complex
Overseen by
Fund Trustee | | Other Directorships
Held Outside Fund
Complex by Fund
Trustee(3) | |
Tom D. Seip (1950) | | Trustee since 2000; Chairman of the Board since 2008; formerly Lead Independent Trustee from 2006 to 2008 | | General Partner, Ridgefield Farm LLC (a private investment vehicle); formerly, President and CEO, Westaff, Inc. (temporary staffing), May 2001 to January 2002; formerly, Senior Executive, The Charles Schwab Corporation, 1983 to 1998, including Chief Executive Officer, Charles Schwab Investment Management, Inc.; Trustee, Schwab Family of Funds and Schwab Investments, 1997 to 1998; and Executive Vice President—Retail Brokerage, Charles Schwab & Co., Inc., 1994 to 1997. | | 55 | | | Director, H&R Block, Inc. (financial services company), since May 2001; Chairman, Governance and Nominating Committee, H&R Block, Inc., since 2011; formerly, Chairman, Compensation Committee, H&R Block, Inc., 2006 to 2010; formerly, Director, Forward Management, Inc. (asset management company), 1999 to 2006. | |
James G. Stavridis (1955) | | Trustee since 2015 | | Dean, Fletcher School of Law and Diplomacy, Tufts University since 2013; formerly, Admiral, United States Navy, 2006 to 2013, including Supreme Allied Commander, NATO and Commander, European Command, 2009 to 2013, and Commander, United States Southern Command, 2006 to 2009. | | 55 | | | Director, Utilidata Inc., since 2015; Director, BMC Software Federal, LLC, since 2014; Director, Vertical Knowledge, LLC, since 2013; formerly, Director, Navy Federal Credit Union, 2000-2002. | |
26
Name, (Year of Birth),
and Address(1) | | Position(s)
and Length
of Time
Served(2) | | Principal Occupation(s)(3) | | Number of
Funds in Fund
Complex
Overseen by
Fund Trustee | | Other Directorships
Held Outside Fund
Complex by Fund
Trustee(3) | |
Candace L. Straight (1947) | | Trustee since 1999 | | Private investor and consultant specializing in the insurance industry; formerly, Advisory Director, Securitas Capital LLC (a global private equity investment firm dedicated to making investments in the insurance sector), 1998 to 2003. | | 55 | | | Formerly, Public Member, Board of Governors and Board of Trustees, Rutgers University, 2011 to 2016; formerly, Director, Montpelier Re Holdings Ltd. (reinsurance company), 2006 to 2015; formerly, Director, National Atlantic Holdings Corporation (property and casualty insurance company), 2004 to 2008; formerly, Director, The Proformance Insurance Company (property and casualty insurance company), 2004 to 2008; formerly, Director, Providence Washington Insurance Company (property and casualty insurance company), 1998 to 2006; formerly, Director, Summit Global Partners (insurance brokerage firm), 2000 to 2005. | |
Peter P. Trapp (1944) | | Trustee since 1984 | | Retired; formerly, Regional Manager for Mid-Southern Region, Ford Motor Credit Company, September 1997 to 2007; formerly, President, Ford Life Insurance Company, April 1995 to August 1997. | | 55 | | | None. | |
27
Name, (Year of Birth),
and Address(1) | | Position(s)
and Length
of Time
Served(2) | | Principal Occupation(s)(3) | | Number of
Funds in Fund
Complex
Overseen by
Fund Trustee | | Other Directorships
Held Outside Fund
Complex by Fund
Trustee(3) | |
Trustees who are "Interested Persons" | |
Joseph V. Amato* (1962) | | Trustee since 2009 | | President and Director, Neuberger Berman Group LLC, since 2009; President and Chief Executive Officer, Neuberger Berman BD LLC ("Neuberger Berman") and Neuberger Berman Holdings LLC (including its predecessor, Neuberger Berman Inc.), since 2007; Chief Investment Officer (Equities) and President (Equities), Neuberger Berman Investment Advisers LLC ("NBIA") (formerly, Neuberger Berman Fixed Income LLC ("NBFI") and including predecessor entities), since 2007, and Board Member of NBIA since 2006; formerly, Global Head of Asset Management of Lehman Brothers Holdings Inc.'s ("LBHI") Investment Management Division, 2006 to 2009; formerly, member of LBHI's Investment Management Division's Executive Management Committee, 2006 to 2009; formerly, Managing Director, Lehman Brothers Inc. ("LBI"), 2006 to 2008; formerly, Chief Recruiting and Development Officer, LBI, 2005 to 2006; formerly, Global Head of LBI's Equity Sales and a Member of its Equities Division Executive Committee, 2003 to 2005. | | 55 | | | Member of Board of Advisors, McDonough School of Business, Georgetown University, since 2001; Member of New York City Board of Advisors, Teach for America, since 2005; Trustee, Montclair Kimberley Academy (private school), since 2007; Member of Board of Regents, Georgetown University, since 2013. | |
28
Name, (Year of Birth),
and Address(1) | | Position(s)
and Length
of Time
Served(2) | | Principal Occupation(s)(3) | | Number of
Funds in Fund
Complex
Overseen by
Fund Trustee | | Other Directorships
Held Outside Fund
Complex by Fund
Trustee(3) | |
Robert Conti* (1956) | | Chief Executive Officer, President and Trustee since 2008; prior thereto, Executive Vice President in 2008 and Vice President from 2000 to 2008 | | Managing Director, Neuberger Berman, since 2007; President—Mutual Funds, NBIA, since 2008; formerly, Senior Vice President, Neuberger Berman, 2003 to 2006; formerly, Vice President, Neuberger Berman, 1999 to 2003; President and Chief Executive Officer, twenty-eight registered investment companies for which NBIA acts as investment manager and/or administrator. | | 55 | | | Director, Staten Island Mental Health Society, since 1994; formerly, Chairman of the Board, Staten Island Mental Health Society, 2008 to 2011. | |
(1) The business address of each listed person is 1290 Avenue of the Americas, New York, NY 10104.
(2) Pursuant to the Trust's Trust Instrument, each of these Trustees shall hold office for life or until his or her successor is elected or the Trust terminates; except that (a) any Trustee may resign by delivering a written resignation; (b) any Trustee may be removed with or without cause at any time by a written instrument signed by at least two-thirds of the other Trustees; (c) any Trustee who requests to be retired, or who has become unable to serve, may be retired by a written instrument signed by a majority of the other Trustees; and (d) any Trustee may be removed at any shareholder meeting by a vote of at least two-thirds of the outstanding shares.
(3) Except as otherwise indicated, each individual has held the positions shown during at least the last five years.
* Indicates a Trustee who is an "interested person" within the meaning of the 1940 Act. Mr. Amato and Mr. Conti are interested persons of the Trust by virtue of the fact that each is an officer of Management, Neuberger Berman and/or their affiliates.
29
Information about the Officers of the Trust
Name, (Year of Birth),
and Address(1) | | Position(s)
and Length of
Time Served(2) | | Principal Occupation(s)(3) | |
Claudia A. Brandon (1956) | | Executive Vice President since 2008 and Secretary since 1985 | | Senior Vice President, Neuberger Berman, since 2007 and Employee since 1999; Senior Vice President, NBIA, since 2008 and Assistant Secretary since 2004; formerly, Vice President, Neuberger Berman, 2002 to 2006; formerly, Vice President—Mutual Fund Board Relations, NBIA, 2000 to 2008; formerly, Vice President, NBIA, 1986 to 1999 and Employee, 1984 to 1999; Executive Vice President, twenty-eight registered investment companies for which NBIA acts as investment manager and/or administrator; Secretary, fifteen registered investment companies for which NBIA acts as investment manager and/or administrator. | |
Agnes Diaz (1971) | | Vice President since 2013 | | Senior Vice President, Neuberger Berman, since 2012; Senior Vice President, NBIA, since 2012 and Employee since 1996; formerly, Vice President, Neuberger Berman, 2007 to 2012; Vice President, twenty-eight registered investment companies for which NBIA acts as investment manager and/or administrator. | |
Anthony DiBernardo (1979) | | Assistant Treasurer since 2011 | | Senior Vice President, NBIA, since 2014, and Employee since 2003; formerly, Vice President, Neuberger Berman, 2009 to 2014; Assistant Treasurer, ten registered investment companies for which NBIA acts as investment manager and/or administrator. | |
Corey A. Issing (1978) | | Chief Legal Officer since 2016 (only for purposes of sections 307 and 406 of the Sarbanes-Oxley Act of 2002) and Anti-Money Laundering Compliance Officer since 2016 | | General Counsel and Head of Compliance—Mutual Funds since 2016 and Senior Vice President, NBIA, since 2013, formerly, Associate General Counsel (2015 to 2016), Counsel (2007 to 2015), Vice President (2009-2013); Chief Legal Officer (only for purposes of sections 307 and 406 of the Sarbanes-Oxley Act of 2002), twenty-eight registered investment companies for which NBIA acts as investment manager and/or administrator; Anti-Money Laundering Compliance Officer, twenty-eight registered investment companies for which NBIA acts as investment manager and/or administrator. | |
Sheila R. James (1965) | | Assistant Secretary since 2002 | | Vice President, Neuberger Berman, since 2008 and Employee since 1999; Vice President, NBIA, since 2008; formerly, Assistant Vice President, Neuberger Berman, 2007; Employee, NBIA, 1991 to 1999; Assistant Secretary, twenty-eight registered investment companies for which NBIA acts as investment manager and/or administrator. | |
30
Name, (Year of Birth),
and Address(1) | | Position(s)
and Length of
Time Served(2) | | Principal Occupation(s)(3) | |
Brian Kerrane (1969) | | Chief Operating Officer since 2015 and Vice President since 2008 | | Managing Director, Neuberger Berman, since 2013; Chief Operating Officer—Mutual Funds and Managing Director, NBIA, since 2015 and Employee since 1991; formerly, Senior Vice President, Neuberger Berman, 2006 to 2014; Vice President, NBIA, 2008 to 2015; Chief Operating Officer, ten registered investment companies for which NBIA acts as investment manager and/or administrator; Vice President, twenty-eight registered investment companies for which NBIA acts as investment manager and/or administrator. | |
Kevin Lyons (1955) | | Assistant Secretary since 2003 | | Assistant Vice President, Neuberger Berman, since 2008 and Employee since 1999; Assistant Vice President, NBIA, since 2008; formerly, Employee, NBIA, 1993 to 1999; Assistant Secretary, ten registered investment companies for which NBIA acts as investment manager and/or administrator. | |
Anthony Maltese (1959) | | Vice President since 2015 | | Senior Vice President, Neuberger Berman, since 2014 and Employee since 2000; Senior Vice President, NBIA, since 2014; Vice President, ten registered investment companies for which NBIA acts as investment manager and/or administrator. | |
Owen F. McEntee, Jr. (1961) | | Vice President since 2008 | | Vice President, Neuberger Berman, since 2006; Vice President, NBIA, since 2006 and Employee since 1992; Vice President, ten registered investment companies for which NBIA acts as investment manager and/or administrator. | |
John M. McGovern (1970) | | Treasurer and Principal Financial and Accounting Officer since 2005 | | Senior Vice President, Neuberger Berman, since 2007; Senior Vice President, NBIA, since 2007 and Employee since 1993; formerly, Vice President, Neuberger Berman, 2004 to 2006; formerly, Assistant Treasurer, 2002 to 2005; Treasurer and Principal Financial and Accounting Officer, twenty-eight registered investment companies for which NBIA acts as investment manager and/or administrator. | |
Frank Rosato (1971) | | Assistant Treasurer since 2005 | | Vice President, Neuberger Berman, since 2006; Vice President, NBIA, since 2006 and Employee since 1995; Assistant Treasurer, ten registered investment companies for which NBIA acts as investment manager and/or administrator. | |
Chamaine Williams (1971) | | Chief Compliance Officer since 2005 | | Chief Compliance Officer—Mutual Funds and Senior Vice President, NBIA, since 2006; formerly, Senior Vice President, LBI, 2007 to 2008; formerly, Vice President, LBI, 2003 to 2006; formerly, Chief Compliance Officer, Lehman Brothers Asset Management Inc., 2003 to 2007; formerly, Chief Compliance Officer, Lehman Brothers Alternative Investment Management LLC, 2003 to 2007; Chief Compliance Officer, fifteen registered investment companies for which NBIA acts as investment manager and/or administrator. | |
(1) The business address of each listed person is 1290 Avenue of the Americas, New York, NY 10104.
(2) Pursuant to the By-Laws of the Trust, each officer elected by the Trustees shall hold office until his or her successor shall have been elected and qualified or until his or her earlier death, inability to serve, or resignation. Officers serve at the pleasure of the Trustees and may be removed at any time with or without cause.
(3) Except as otherwise indicated, each individual has held the positions shown during at least the last five years
31
Proxy Voting Policies and Procedures
A description of the policies and procedures that the Trust uses to determine how to vote proxies relating to portfolio securities is available, without charge, by calling 800-877-9700 (toll-free) and on the Securities and Exchange Commission's website at www.sec.gov. Information regarding how the Trust voted proxies relating to portfolio securities during the most recent 12-month period ended June 30 is also available upon request, without charge, by calling 800-877-9700 (toll-free), on the Securities and Exchange Commission's website at www.sec.gov, and on Management's website at www.nb.com.
Quarterly Portfolio Schedule
The Trust files a complete schedule of portfolio holdings for the Fund with the Securities and Exchange Commission for the first and third quarters of each fiscal year on Form N-Q. The Trust's Forms N-Q are available on the Securities and Exchange Commission's website at www.sec.gov and may be reviewed and copied at the Securities and Exchange Commission's Public Reference Room in Washington, DC. Information on the operation of the Public Reference Room may be obtained by calling 800-SEC-0330. The information on Form N-Q is available upon request, without charge, by calling 800-877-9700 (toll free).
Board Consideration of the Management Agreement
On an annual basis, the Board of Trustees (the "Board") of Neuberger Berman Advisers Management Trust (the "Trust"), including the Trustees who are not "interested persons" of Neuberger Berman Investment Advisers LLC ("Management") (including its affiliates) or the Trust ("Independent Fund Trustees"), considers whether to continue the management agreement with Management (the "Agreement") for Mid Cap Intrinsic Value Portfolio (the "Fund"). Throughout the process, the Independent Fund Trustees are advised by counsel that is experienced in Investment Company Act of 1940 matters and that is independent of Management ("Independent Counsel"). At a meeting held on October 18, 2016, the Board, including the Independent Fund Trustees, approved the continuation of the Agreement for the Fund.
In evaluating the Agreement, the Board, including the Independent Fund Trustees, reviewed extensive materials provided by Management in response to questions submitted by the Independent Fund Trustees and Independent Counsel, and met with senior representatives of Management regarding its personnel, operations and financial condition as they relate to the Fund. The annual contract review extends over at least two regular meetings of the Board to ensure that Management has time to respond to any questions the Independent Fund Trustees may have on their initial review of the materials and that the Independent Fund Trustees have time to consider those responses.
In connection with its deliberations, the Board also considered the broad range of information relevant to the annual contract review that is provided to the Board (including its various standing committees) at meetings throughout the year, including investment performance reports and related portfolio information for the Fund, as well as periodic reports on, among other matters, pricing and valuation; brokerage and execution; compliance; and shareholder and other services provided by Management and its affiliates. To assist the Board in its deliberations regarding the annual contract review, the Board has established a Contract Review Committee comprised of Independent Fund Trustees. The Board has also established other committees that focus throughout the year on specific areas relevant to the annual contract review, such as Fund performance or compliance matters, and that are charged with specific responsibilities regarding the annual contract review. Those committees provide reports that feed into the Contract Review Committee, which reviews and takes account of the information.
The Independent Fund Trustees received from Independent Counsel a memorandum discussing the legal standards for their consideration of the proposed continuation of the Agreement. During the course of the year and during their deliberations regarding the annual contract review, the Contract Review Committee and the Independent Fund Trustees met with Independent Counsel separately from representatives of Management.
32
In connection with its approval of the continuation of the Agreement, the Board evaluated the terms of the Agreement, the overall fairness of the Agreement to the Fund and whether the Agreement was in the best interests of the Fund and its shareholders. The Board considered all factors it deemed relevant with respect to the Fund, including the following factors: (1) the nature, extent, and quality of the services provided by Management; (2) the investment performance of the Fund compared to an appropriate market index and a peer group of investment companies; (3) the costs of the services provided and the profit or loss realized by Management and its affiliates from their relationship with the Fund; (4) the extent to which economies of scale have been or might be realized as the Fund grows; and (5) whether fee levels reflect any such potential economies of scale for the benefit of the Fund's shareholders. The Board's determination to approve the continuation of the Agreement was based on a comprehensive consideration of all information provided to the Board throughout the year and specifically in connection with the annual contract review. The Board members did not identify any particular information or factor that was all-important or controlling, and each Trustee may have attributed different weights to the various factors. The Board focused on the overall costs and benefits of the Agreement to the Fund and, through the Fund, its shareholders.
With respect to the nature, extent and quality of the services provided, the Board considered the investment philosophy and decision-making processes of Management, and the qualifications, experience, and capabilities of, and the resources available to, the portfolio management personnel of Management who perform services for the Fund. The Board noted that Management also provides certain administrative services, including fund accounting and compliance services. The Board also considered Management's policies and practices regarding brokerage and allocation of portfolio transactions and reviewed the quality of the execution services that Management had provided. The Board also reviewed whether Management used brokers to execute Fund transactions that provide research and other services to Management and the types of benefits potentially derived from such services by Management, the Fund and other clients of Management. The Board also considered that Management's responsibilities include daily management of investment, operational, enterprise, legal, regulatory and compliance risks as they relate to the Fund, and considered information regarding Management's processes for managing risk. In addition, the Board noted the positive compliance history of Management, as no significant compliance problems were reported to the Board with respect to either firm. The Board also considered the general structure of the portfolio manager compensation program and whether this structure provides appropriate incentives to act in the best interests of the Fund.
As in past years, the Board also considered the manner in which Management addressed various non-routine matters that arose during the year, some of them a result of developments in the broader fund industry or the regulations governing it. In addition, the Board considered actions taken by Management in response to recent market conditions, such as regulatory concerns about current trading issues, market liquidity and potential volatility, and considered the overall performance of Management in this context.
The Board factored into its evaluation of the Fund's fees and performance a consideration of the limitations inherent in the methodology for constructing peer groups and determining which investment companies should be included in the peer groups. The Board considered a peer group composed of two types of funds: proprietary funds that are operated by insurance companies or their affiliates, and non-proprietary funds, such as the Fund, operated for insurance company investors by independent investment managers.
With respect to investment performance, the Board considered information regarding the Fund's short, intermediate and long-term performance both on an absolute basis and relative to an appropriate benchmark index and the average performance of a composite peer group (as constructed by an independent organization) of investment companies pursuing broadly similar strategies. The Board also reviewed performance in relation to certain measures of the degree of investment risk undertaken by the portfolio manager. The Board looked at the Fund's I Class as a proxy for both of the Fund's classes. The Board considered that as compared to its peer group, the performance of the Fund's I Class was lower than the median for the 1, 5 and 10-year periods, but higher than the median for the 3-year period. The Board also considered that the performance of the Fund's I Class was lower than its benchmark for the 1, 5 and 10-year periods, but higher for the 3-year period. The Board discussed with Management the Fund's performance and steps that Management had taken, or intended to take, to improve performance. The Board also considered Management's responsiveness with respect to the Fund's lagging performance. In this regard, the Board noted that performance, especially short-term
33
performance, is only one of the factors that it deems relevant to its consideration of the Fund's Agreement and that, after considering all relevant factors, it may be appropriate to approve the continuation of the Agreement notwithstanding the Fund's underperformance.
With respect to the overall fairness of the Agreement, the Board considered the fee structure for the Fund under the Agreement as compared to the peer group. The Board also considered any fall-out (i.e. indirect) benefits likely to accrue to Management or its affiliates from their relationship with the Fund. The Board also considered the profitability of Management and its affiliates from their association with the Fund, and year-over-year changes in each of Management's reported expense categories.
The Board reviewed a comparison of the Fund's management fee and total expense ratio to the peer group and was aware that non-proprietary insurance product funds generally have higher fee structures than proprietary funds. The Board noted that the comparative management fee analysis includes, in the Fund's management fee, the separate administrative fee paid to Management, but it was not clear whether this was the case for all funds in the peer group. The Board compared the Fund's contractual and actual management fees to the mean and median of the contractual and actual management fees, respectively, of the Fund's peer group. (The actual management fees are the contractual management fees reduced by any fee waivers or other adjustments.) In addition, the Board considered the contractual limit on expenses of the Fund. The Board noted that the overall expense ratio of the Fund's S Class is maintained through expense reimbursements by Management that exceed the fees that Management receives from the Fund. The Board noted that although Management realized a profit on its management of the Fund, it experienced a loss on the Fund when all expenses were taken into account.
The Board considered that, for the Fund's I Class shares, as compared to its peer group, the Fund's contractual management fee and the actual management fee were both higher than the respective medians. The Board looked at the I Class as a proxy for both of the Fund's classes. The Board considered whether specific portfolio management, administration or oversight needs contributed to the management fee. The Board also noted that the Fund's size, which impacts its expenses and performance, has been affected by ongoing changes in the insurance market.
The Board also considered whether there were other funds or separate accounts that were advised by Management or its affiliates with investment objectives, policies and strategies that were similar to those of the Fund. The Board compared the fees charged to the Fund to the fees charged to such funds and/or separate accounts. The Board considered the appropriateness and reasonableness of any differences between the fees charged to the Fund and such funds and/or separate accounts, including any breakpoints, and determined that differences in fees and fee structures were consistent with the management and other services provided.
The Board also evaluated any apparent or anticipated economies of scale in relation to the services Management provides to the Fund. The Board considered whether the Fund's fee structure provides for a reduction of payments resulting from the use of breakpoints and whether those breakpoints are set at appropriate asset levels. As in past years, the Board gave careful thought to the size of any breakpoints in the Fund's advisory fees and the asset levels at which they are set. It also considered whether the fees were set at an appropriate level and compared the fee structures to that of the peer group. The Board also considered that Management has provided, at no added cost to the Fund, certain additional services that were required by new regulations or regulatory interpretations, impelled by changes in the securities markets or the business landscape, and/or requested by the Board. In concluding that the benefits accruing to Management and its affiliates by virtue of their relationship with the Fund were reasonable in light of the costs of providing the investment advisory and other services and the benefits accruing to the Fund, the Board reviewed specific data as to Management's profitability on the Fund for a recent period. The Board also considered Management's cost allocation methodology. The Board recognized that Management should be entitled to earn a reasonable level of profits for services they provide to the Fund and, based on its review, concluded that Management's reported level of profitability on the Fund was reasonable.
Conclusions
In approving the continuation of the Agreement, the Board concluded that the terms of the Agreement are fair and reasonable to the Fund and that approval of the continuation of the Agreement is in the best interests of the Fund and its
34
shareholders. In reaching this determination, the Board considered that Management could be expected to provide a high level of service to the Fund; regarding the Fund's underperformance, that it retained confidence in Management's capabilities to manage the Fund; that the Fund's fee structure appeared to the Board to be reasonable given the nature, extent and quality of services provided; and that the benefits accruing to Management and its affiliates by virtue of their relationship with the Fund were reasonable in light of the costs of providing the investment advisory and other services and the benefits accruing to the Fund. The Board's conclusions may be based in part on its consideration of materials prepared in connection with the approval or continuance of the Agreement in prior years and on the Board's ongoing regular review of Fund performance and operations throughout the year, in addition to material prepared specifically for the most recent annual review of the Agreement.
Notice to Shareholders
100.00% of the dividends earned during the fiscal year ended December 31, 2016 qualify for the dividends received deduction for corporate shareholders.
The Fund designates $10,781,782 as a capital gain distribution.
35
Neuberger Berman
Advisers Management Trust
Short Duration Bond Portfolio
I Class Shares
Annual Report
December 31, 2016
Short Duration Bond Portfolio Commentary (Unaudited)
The Neuberger Berman Advisers Management Trust Short Duration Bond Portfolio Class I posted a 1.22% total return for the twelve months ended December 31, 2016, underperforming its benchmark, the Bloomberg Barclays 1-3 Year U.S. Government/Credit Bond Index, which returned 1.28% for the same period.
U.S. Treasury yields moved higher (and their prices declined) during the reporting period as a whole. Longer-term yields declined over the first half of the period due to several bouts of investor risk aversion. Also supporting the Treasury market were indications from the U.S. Federal Reserve (Fed) that it would take a measured approach in terms of normalizing monetary policy. Treasury yields then moved sharply higher after the November elections given expectations that growth and inflation would increase under the Trump administration. In addition, the Fed raised interest rates in December 2016 and increased its projected number of rate hikes for 2017. For the twelve months ended December 31, 2016, the yield on the two-year Treasury moved 14 basis points (bps) higher, whereas the 10-year Treasury yield rose 18 bps. The spread sectors generated positive returns during the reporting period.
The primary detractors from the Fund's performance during the reporting period were its duration and yield curve positioning. The Fund maintained a defensive duration position relative to the benchmark, with an overweight to the shorter end of the yield curve. This was a negative for relative performance as shorter-term rates underperformed for the period. Elsewhere, the Fund's higher quality credit bias was not rewarded, as lower quality credits outperformed within corporate sectors. This was particularly evident in the energy sector where the Fund had an overweight to higher quality securities, which lagged lower quality, more speculative names. On the upside, the Fund's allocations to non-agency mortgage-backed securities and commercial mortgage-backed securities were positive for performance. Both benefited from a lack of new issuance and overall solid demand.
The Fund maintained an overweight to the spread sectors (non-U.S. treasuries) and an underweight to U.S. Treasury Obligations during the reporting period. However, several adjustments were made to the portfolio, including modestly reducing its allocations to U.S. Treasury Obligations and Asset-Backed Securities. Conversely, we increased the Fund's investment grade credit exposure by actively participating in the new issuance market. Finally, we opportunistically increased the Fund's duration but remained shorter than that of the benchmark.
Treasury futures were used during the period to more efficiently manage the Fund's duration and yield curve positioning. The Fund's use of futures detracted from performance during the reporting period.
Looking ahead, we anticipate the U.S. economy to continue expanding at a relatively modest pace, perhaps in the 2% to 2.5% range in 2017. In our view, inflation will be around the Fed's 2% target. Turning to the Fed, we anticipate two or three rate hikes in 2017. We believe market volatility could increase given the uncertainties surrounding future Fed monetary policy, questions surrounding fiscal policy under the Trump administration and potential geopolitical issues. We view periods of volatility as opportunities to selectively purchase attractively valued securities, as well as manage the Fund's duration and yield curve positioning.
Sincerely,
Thomas Sontag And Michael Foster
Portfolio Managers
Information about principal risks of investing in the Fund is set forth in the prospectus and statement of additional information.
The portfolio composition, industries and holdings of the Fund are subject to change without notice.
The opinions expressed are those of the Fund's portfolio managers. The opinions are as of the date of this report, and are subject to change without notice.
1
Short Duration Bond Portfolio (Unaudited)
PORTFOLIO BY TYPE OF SECURITY
(as a % of Total Net Assets) | |
Asset-Backed Securities | | | 18.6 | % |
Corporate Bonds | | | 38.6 | |
Mortgage-Backed Securities | | | 29.4 | |
U.S. Treasury Obligations | | | 10.7 | |
Short-Term Investment | | | 2.4 | |
Other Assets Less Liabilities | | | 0.3 | * |
Total | | | 100.0 | % |
* Percentage includes appreciation/depreciation from derivatives, if any.
PERFORMANCE HIGHLIGHTS
| | | Average Annual Total Return
Ended 12/31/2016 | |
| | Inception Date | 1 Year | | 5 Years | | 10 Years | | Life of Fund | |
Short Duration Bond
Portfolio Class I |
09/10/1984 | | | 1.22 | % | | | 1.43 | % | | | 1.54 | % | | | 4.89 | % |
Bloomberg Barclays
1-3 Year U.S. Government/
Credit Bond Index1,2 | | | | 1.28 | % | | | 0.92 | % | | | 2.44 | % | | | 5.50 | % |
The performance data quoted represent past performance and do not indicate future results. Current performance may be lower or higher than the performance data quoted. For performance data current to the most recent month-end, please visit http://www.nb.com/amtportfolios/ performance.
The results shown in the table reflect the reinvestment of income dividends and other distributions, if any. The results do not reflect the effect of taxes a shareholder would pay on Fund distributions or on the redemption of Fund shares. The results do not reflect fees and expenses of the variable annuity and variable life insurance policies or the qualified pension and retirement plans whose proceeds are invested in the Fund.
The investment return and principal value of an investment will fluctuate and shares, when redeemed, may be worth more or less than their original cost.
Returns would have been lower if Neuberger Berman Investment Advisers LLC ("Management") had not reimbursed certain expenses and/ or waived a portion of the investment management fees during certain of the periods shown. Repayment by a class (of expenses previously reimbursed and/ or fees previously waived by Management) will decrease the class's returns. Please see Note B in the Notes to Financial Statements for specific information regarding expense reimbursement and/ or fee waiver arrangements.
For the period ended December 31, 2016, the 30-day SEC yield was 0.69% for Class I shares.
As stated in the Fund's most recent prospectus, the total annual operating expense ratio for fiscal year 2015 was 0.84% for Class I shares (before expense reimbursements and/ or fee waivers, if any). The expense ratios for the annual period ended December 31, 2016 can be found in the Financial Highlights section of this report.
COMPARISON OF A $10,000 INVESTMENT

This graph shows the change in value of a hypothetical $10,000 investment in the Fund over the past 10 fiscal years, or since the Fund's inception, if it has not operated for 10 years. The result is compared with benchmarks, which include a broad-based market index and may include a more narrowly based index. Market indices have not been reduced to reflect any of the fees and costs of investing. The results shown in the graph reflect the reinvestment of income dividends and other distributions, if any. The results do not reflect the effect of taxes a shareholder would pay on Fund distributions or on the redemption of Fund shares. The results do not reflect fees and expenses of the variable annuity and variable life insurance policies or the qualified pension and retirement plans whose proceeds are invested in the Fund. Results represent past performance and do not indicate future results.
Please see Endnotes for additional information.
2
1 The date used to calculate Life of Fund performance for the index is September 10, 1984, the Fund's commencement of operations.
2 The Bloomberg Barclays 1-3 Year U.S. Government/Credit Bond Index is the 1-3 year component of the Barclays U.S. Government/Credit Index. The Bloomberg Barclays U.S. Government/Credit Index is the non-securitized component of the Bloomberg Barclays U.S. Aggregate Bond Index and includes Treasuries and government-related (agency, sovereign, supranational, and local authority debt) and corporate securities. On August 24, 2016, Bloomberg acquired the Barclays fixed income benchmark indices from Barclays. Barclays and Bloomberg have agreed to co-brand the indices as the Bloomberg Barclays Indices for an initial term of five years. For more information, please visit www.bloombergindices.com/. Please note that the indices described in this report do not take into account any fees, expenses or tax consequences of investing in the individual securities that they track, and that individuals cannot invest directly in any index. Data about the performance of an index are prepared or obtained by Neuberger Berman Investment Advisers LLC* ("Management") and reflect the reinvestment of income dividends and other distributions, if any. The Fund may invest in securities not included in a described index and generally does not invest in all securities included in a described index.
* On January 1, 2016, Neuberger Berman Management LLC ("NBM") transferred to Neuberger Berman Fixed Income LLC ("NBFI") their rights and obligations pertaining to all services they provided to any Fund under any investment management, investment sub-advisory, and/or administration agreement, as applicable (the "Agreements"). Following such transfer, NBFI was renamed Neuberger Berman Investment Advisers LLC ("NBIA" or "Management"). Following the consolidation, the investment professionals of NBM who provided services to any Fund under the Agreements continue to provide the same services, except that they provide those services in their new capacities as investment professionals of NBIA. Further, the consolidation did not result in any change in the investment processes employed by any Fund, the nature or level of services provided to any Fund, or the fees any Fund pays under its Agreements.
On July 1, 2016, NBM was reorganized into "Neuberger Berman" (the "Reorganization"). Upon the completion of the Reorganization, Neuberger Berman assumed all rights and obligations pertaining to all services NBM provided to any Fund under any distribution agreement or distribution and services agreement (the "Agreements") or plan adopted pursuant to Rule 12b-1 under the Investment Company Act of 1940, as amended, (the "Plans"). Accordingly, after the Reorganization, Neuberger Berman became each Fund's distributor and the services previously provided by NBM under the Agreements and Plans are provided by Neuberger Berman.
Following the Reorganization, the employees of NBM provide the same services to each Fund under the Agreements and Plans, except that they provide those services in their capacities as employees of Neuberger Berman. Further, the Reorganization did not result in any change in the nature or level of services provided to each Fund, or the fees, if any, each Fund pays under the Agreements or the Plans.
Please note, effective July 1, 2016, Neuberger Berman Management LLC was reorganized with and into Neuberger Berman LLC, a registered broker-dealer, Member FINRA and the Fund's distributor, which changed its name to Neuberger Berman BD LLC on January 1, 2017.
The investments for the Fund are managed by the same portfolio manager(s) who manage(s) one or more other registered funds that have names, investment objectives and investment styles that are similar to those of the Fund. You should be aware that the Fund is likely to differ from those other mutual fund(s) in size, cash flow pattern and tax matters. Accordingly, the holdings and performance of the Fund can be expected to vary from those of the other mutual fund(s).
Shares of the separate Neuberger Berman Advisers Management Trust Portfolios, including the Fund, are not available to the general public. Shares of the Fund may be purchased only by life insurance companies to be held in their separate accounts, which fund variable annuity and variable life insurance policies, and by qualified pension and retirement plans.
3
Statistics and projections in this report are derived from sources deemed to be reliable but cannot be regarded as a representation of future results of the Fund. This report is prepared for the general information of shareholders and is not an offer of shares of the Fund. Shares are sold only through the currently effective prospectus, which must precede or accompany this report.
The "Neuberger Berman" name and logo and "Neuberger Berman Investment Advisers LLC name are registered service marks of Neuberger Berman Group LLC. The individual Fund names in this piece are either service marks or registered service marks of Neuberger Berman Investment Advisers LLC, an affiliate of Neuberger Berman BD LLC, distributor, member FINRA.
© 2017 Neuberger Berman BD LLC, distributor. All rights reserved.
4
Information About Your Fund's Expenses (Unaudited)
As a Fund shareholder, you incur two types of costs: (1) transaction costs such as fees and expenses that are, or may be, imposed under your variable contract or qualified pension plan; and (2) ongoing costs, including management fees, distribution and/or service (12b-1) fees (if applicable), and other Fund expenses. This example is intended to help you understand your ongoing costs (in U.S. dollars) of investing in the Fund and compare these costs with the ongoing costs of investing in other mutual funds.
This table is designed to provide information regarding costs related to your investments. The following examples are based on an investment of $1,000 made at the beginning of the six month period ended December 31, 2016 and held for the entire period. The table illustrates the Fund's costs in two ways:
Actual Expenses and Performance: | | The first section of the table provides information about actual account values and actual expenses in dollars, based on the Fund's actual performance during the period indicated. You may use the information in this line, together with the amount you invested, to estimate the expenses you paid over the period. Simply divide your account value by $1,000 (for example, an $8,600 account value divided by $1,000 = 8.6), then multiply the result by the number in the first section of the table under the heading entitled "Expenses Paid During the Period" to estimate the expenses you paid over the period. | |
Hypothetical Example for Comparison Purposes: | | The second section of the table provides information about hypothetical account values and hypothetical expenses based on the Fund's actual expense ratio and an assumed rate of return at 5% per year before expenses. This return is not the Fund's actual return. The hypothetical account values and expenses may not be used to estimate the actual ending account balance or expenses you paid for the period. You may use this information to compare the ongoing costs of investing in this Fund versus other funds. To do so, compare the expenses shown in this 5% hypothetical example with the 5% hypothetical examples that appear in the shareholder reports of other funds. | |
Please note that the expenses in the table are meant to highlight your ongoing costs only and do not include any transaction costs, such as fees and expenses that are, or may be imposed under your variable contract or qualified pension plan. Therefore, the information under the heading "Hypothetical (5% annual return before expenses)" is useful in comparing ongoing costs only, and will not help you determine the relative total costs of owning different funds. In addition, if these transaction costs were included, your costs would have been higher.
Expense Example
NEUBERGER BERMAN ADVISERS MANAGEMENT TRUST SHORT DURATION BOND PORTFOLIO
Actual | | Beginning Account
Value
7/1/16 | | Ending Account
Value
12/31/16 | | Expenses Paid During
the Period
7/1/16 – 12/31/16 | |
Class I | | $ | 1,000.00 | | | $ | 999.80 | | | $ | 4.62 | * | |
Hypothetical (5% annual return before expenses) | |
Class I | | $ | 1,000.00 | | | $ | 1,020.51 | | | $ | 4.67 | ** | |
* Expenses are equal to the annualized expense ratio of 0.92%, multiplied by the average account value over the period, multiplied by 184/366 (to reflect the one-half year period shown).
** Hypothetical expenses are equal to the annualized expense ratio of 0.92%, multiplied by the average account value over the period (assuming a 5% annual return), multiplied by 184/366 (to reflect the one-half year period shown).
5
Schedule of Investments Short Duration Bond Portfolio 12/31/16
PRINCIPAL AMOUNT | | | | VALUE | |
U.S. Treasury Obligations 10.7% | | | |
| | | | | U.S. Treasury Notes | | | | | |
$ | 3,495,000 | | | 0.88%, due 9/15/19 | | $ | 3,447,783 | | |
| | 10,735,000 | | | 1.00%, due 11/15/19 | | | 10,600,694 | | |
| | 1,315,000 | | | 1.38%, due 12/15/19 | | | 1,311,193 | | |
| | | | | Total U.S. Treasury Obligations (Cost $15,495,966) | | | 15,359,670 | | |
Mortgage-Backed Securities 29.4% | | | |
Adjustable Mixed Balance 1.6% | | | |
| | 1,611,107 | | | Countrywide Home Loan Mortgage Pass-Through Trust, Ser. 2006-HYB5, Class 2A1,
3.01%, due 9/20/36 | | | 1,272,615
| (a) | |
| | 280,627 | | | Harborview Mortgage Loan Trust, Ser. 2004-4, Class 3A, 1.74%, due 6/19/34 | | | 268,505 | (a) | |
| | 831,594 | | | Merrill Lynch Mortgage Investors Trust, Ser. 2005-A1, Class 2A1, 3.03%, due 12/25/34 | | | 828,763 | (a) | |
| | | | 2,369,883 | | |
Commercial Mortgage-Backed 17.9% | | | |
| | | | | Citigroup Commercial Mortgage Trust | | | | | |
| | 509,840 | | | Ser. 2013-GC15, Class A1, 1.38%, due 9/10/46 | | | 509,759 | | |
| | 2,195,000 | | | Ser. 2016-P6,Class A1, 1.88%, due 12/10/49 | | | 2,189,622 | | |
| | | | | Commercial Mortgage Pass-Through Certificates | | | | | |
| | 3,085,781 | | | Ser. 2014-LC15, Class A1, 1.26%, due 4/10/47 | | | 3,077,752 | | |
| | 715,939 | | | Ser. 2014-CR16, Class A1, 1.45%, due 4/10/47 | | | 714,952 | | |
| | 1,327,920 | | | Ser. 2014-UBS3, Class A1, 1.40%, due 6/10/47 | | | 1,326,697 | | |
| | 1,373,486 | | | Ser. 2014-UBS4, Class A1, 1.31%, due 8/10/47 | | | 1,371,269 | | |
| | 342,491 | | | Ser. 2014-UBS5, Class A1, 1.37%, due 9/10/47 | | | 342,632 | | |
| | 1,063,730 | | | Ser. 2015-CR25, Class A1, 1.74%, due 8/10/48 | | | 1,063,355 | | |
| | 1,478,746 | | | Ser. 2015-PC1, Class A1, 1.67%, due 7/10/50 | | | 1,480,298 | | |
| | 1,662,754 | | | DBJPM Mortgage Trust, Ser. 2016-C3, Class A1, 1.50%, due 9/10/49 | | | 1,641,737 | | |
| | 711,449 | | | GS Mortgage Securities Trust, Ser. 2015-GS1, Class A1, 1.94%, due 11/10/48 | | | 706,957 | | |
| | 57,068 | | | JP Morgan Chase Commercial Mortgage Securities Corp., Ser. 2007-CB18, Class A4,
5.44%, due 6/12/47 | | | 57,028 | | |
| | | | | Morgan Stanley Bank of America Merrill Lynch Trust | | | | | |
| | 463,302 | | | Ser. 2013-C10, Class A1, 1.39%, due 7/15/46 | | | 463,188 | | |
| | 1,664,016 | | | Ser. 2016-C28, Class A1, 1.53%, due 1/15/49 | | | 1,648,604 | | |
| | 1,421,870 | | | SG Commercial Mortgage Securities Trust, Ser. 2016-C5, Class A1, 1.35%, due 10/10/48 | | | 1,401,173 | | |
| | | | | Wells Fargo Commercial Mortgage Trust | | | | | |
| | 697,415 | | | Ser. 2015-P2, Class A1, 1.97%, due 12/15/48 | | | 697,762 | | |
| | 2,085,126 | | | Ser. 2016-NXS6, Class A1, 1.42%, due 11/15/49 | | | 2,057,724 | | |
| | 2,403,876 | | | Ser. 2016-NXS5, Class A1, 1.56%, due 1/15/59 | | | 2,384,382 | | |
| | 2,469,114 | | | WF-RBS Commercial Mortgage Trust, Ser. 2014-C21, Class A1, 1.41%, due 8/15/47 | | | 2,462,556 | | |
| | | | 25,597,447 | | |
Mortgage-Backed Non-Agency 1.7% | | | |
| | 359,896 | | | Countrywide Home Loans, Ser. 2005-R2, Class 2A4, 8.50%, due 6/25/35 | | | 374,550 | (b) | |
| | | | | GSMPS Mortgage Loan Trust | | | | | |
| | 1,576,173 | | | Ser. 2005-RP2, Class 1A4, 8.50%, due 3/25/35 | | | 1,713,338 | (b) | |
| | 301,828 | | | Ser. 2005-RP3, Class 1A4, 8.50%, due 9/25/35 | | | 335,674 | (b) | |
| | | | 2,423,562 | | |
See Notes to Financial Statements
6
Schedule of Investments Short Duration Bond Portfolio (cont'd)
PRINCIPAL AMOUNT | | | | VALUE | |
Fannie Mae 4.9% | | | |
| | | | | Pass-Through Certificates | | | | | |
$ | 1,226,337 | | | 3.50%, due 10/1/25 | | $ | 1,278,156 | | |
| | 2,505,535 | | | 3.00%, due 9/1/27 | | | 2,576,062 | | |
| | 2,882,714 | | | 4.50%, due 5/1/41 – 5/1/44 | | | 3,105,490 | | |
| | | | 6,959,708 | | |
Freddie Mac 3.3% | | | |
| | | | | Pass-Through Certificates | | | | | |
| | 1,368,784 | | | 3.50%, due 5/1/26 | | | 1,429,242 | | |
| | 1,717,473 | | | 3.00%, due 1/1/27 | | | 1,762,852 | | |
| | 1,426,666 | | | 4.50%, due 11/1/39 | | | 1,534,422 | | |
| | | | 4,726,516 | | |
| | | | | Total Mortgage-Backed Securities (Cost $42,456,703) | | | 42,077,116 | | |
Corporate Bonds 38.6% | | | |
Auto Manufacturers 5.1% | | | |
| | 885,000 | | | Daimler Finance N.A. LLC, 1.50%, due 7/5/19 | | | 870,351 | (b) | |
| | | | | Ford Motor Credit Co. LLC | | | | | |
| | 1,510,000 | | | 4.25%, due 2/3/17 | | | 1,512,973 | | |
| | 1,465,000 | | | 2.02%, due 5/3/19 | | | 1,450,973 | | |
| | 1,585,000 | | | General Motors Financial Co., Inc., 2.40%, due 5/9/19 | | | 1,580,162 | | |
| | 1,005,000 | | | Hyundai Capital America, 1.45%, due 2/6/17 | | | 1,005,171 | (b) | |
| | 845,000 | | | Toyota Motor Credit Corp., 1.55%, due 7/13/18 | | | 844,651 | | |
| | | | 7,264,281 | | |
Banks 14.6% | | | |
| | | | | Bank of America Corp. | | | | | |
| | 2,600,000 | | | 2.00%, due 1/11/18 | | | 2,605,798 | | |
| | 620,000 | | | Ser. L, 2.60%, due 1/15/19 | | | 625,080 | | |
| | 1,125,000 | | | Capital One N.A., 2.35%, due 8/17/18 | | | 1,131,275 | | |
| | 1,985,000 | | | Citigroup, Inc., 2.05%, due 6/7/19 | | | 1,976,679 | | |
| | 2,240,000 | | | Goldman Sachs Group, Inc., 2.90%, due 7/19/18 | | | 2,270,560 | | |
| | 2,180,000 | | | JPMorgan Chase & Co., 2.25%, due 1/23/20 | | | 2,173,504 | | |
| | 785,000 | | | Mizuho Bank Ltd., 1.30%, due 4/16/17 | | | 784,882 | (b) | |
| | 2,545,000 | | | Morgan Stanley, 2.45%, due 2/1/19 | | | 2,561,555 | | |
| | 605,000 | | | MUFG Americas Holdings Corp., 1.63%, due 2/9/18 | | | 602,804 | | |
| | 1,985,000 | | | National Australia Bank Ltd., 1.38%, due 7/12/19 | | | 1,950,757 | | |
| | 2,610,000 | | | Wachovia Corp., 5.75%, due 6/15/17 | | | 2,659,658 | | |
| | 1,470,000 | | | Wells Fargo & Co., 1.40%, due 9/8/17 | | | 1,468,220 | | |
| | | | 20,810,772 | | |
Beverages 1.9% | | | |
| | 2,115,000 | | | Anheuser-Busch InBev Finance, Inc., 1.90%, due 2/1/19 | | | 2,117,563 | | |
| | 650,000 | | | Molson Coors Brewing Co., 1.45%, due 7/15/19 | | | 640,131 | | |
| | | | 2,757,694 | | |
Commercial Services 1.4% | | | |
| | | | | ERAC USA Finance LLC | | | | | |
| | 1,090,000 | | | 2.75%, due 3/15/17 | | | 1,092,913 | (b) | |
| | 890,000 | | | 6.38%, due 10/15/17 | | | 922,120 | (b)(c) | |
| | | | 2,015,033 | | |
See Notes to Financial Statements
7
Schedule of Investments Short Duration Bond Portfolio (cont'd)
PRINCIPAL AMOUNT | | | | VALUE | |
Computers 1.5% | | | |
$ | 800,000 | | | Diamond 1 Finance Corp./Diamond 2 Finance Corp., 3.48%, due 6/1/19 | | $ | 816,439 | (b)(c) | |
| | 1,320,000 | | | HP Enterprise Co., 2.85%, due 10/5/18 | | | 1,332,516 | | |
| | | | 2,148,955 | | |
Electric 1.1% | | | |
| | 500,000 | | | Dominion Resources, Inc., Ser. B, 1.60%, due 8/15/19 | | | 492,155 | | |
| | 695,000 | | | Exelon Corp., 1.55%, due 6/9/17 | | | 693,723 | | |
| | 370,000 | | | Southern Co., 1.55%, due 7/1/18 | | | 368,565 | | |
| | | | 1,554,443 | | |
Insurance 0.5% | | | |
| | 730,000 | | | Berkshire Hathaway Finance Corp., 1.70%, due 3/15/19 | | | 729,181 | | |
Media 0.5% | | | |
| | | | | Thomson Reuters Corp. | | | | | |
| | 350,000 | | | 1.30%, due 2/23/17 | | | 350,015 | | |
| | 415,000 | | | 1.65%, due 9/29/17 | | | 415,447 | | |
| | | | 765,462 | | |
Oil & Gas 1.1% | | | |
| | 805,000 | | | BP Capital Markets PLC, 1.68%, due 5/3/19 | | | 799,104 | | |
| | 845,000 | | | Shell Int'l Finance BV, 1.38%, due 5/10/19 | | | 836,284 | | |
| | | | 1,635,388 | | |
Pharmaceuticals 2.9% | | | |
| | 555,000 | | | AbbVie, Inc., 1.80%, due 5/14/18 | | | 555,335 | | |
| | 540,000 | | | McKesson Corp., 1.29%, due 3/10/17 | | | 540,129 | | |
| | 900,000 | | | Mylan NV, 2.50%, due 6/7/19 | | | 894,900 | (b)(c) | |
| | 1,080,000 | | | Shire Acquisitions Investments Ireland DAC, 1.90%, due 9/23/19 | | | 1,065,808 | | |
| | 1,065,000 | | | Teva Pharmaceutical Finance Netherlands III BV, 1.70%, due 7/19/19 | | | 1,045,932 | | |
| | | | 4,102,104 | | |
Pipelines 0.3% | | | |
| | 390,000 | | | Enterprise Products Operating LLC, 1.65%, due 5/7/18 | | | 388,848 | | |
Real Estate Investment Trusts 1.0% | | | |
| | 1,445,000 | | | Simon Property Group LP, 1.50%, due 2/1/18 | | | 1,444,173 | (b) | |
Retail 1.5% | | | |
| | 2,065,000 | | | CVS Health Corp., 1.90%, due 7/20/18 | | | 2,072,591 | | |
Telecommunications 5.2% | | | |
| | | | | AT&T, Inc. | | | | | |
| | 1,050,000 | | | 1.70%, due 6/1/17 | | | 1,051,439 | | |
| | 1,860,000 | | | 1.40%, due 12/1/17 | | | 1,855,793 | | |
| | 1,250,000 | | | 2.30%, due 3/11/19 | | | 1,254,317 | | |
| | | | | Verizon Communications, Inc. | | | | | |
| | 1,250,000 | | | 3.65%, due 9/14/18 | | | 1,291,037 | | |
| | 2,040,000 | | | 1.38%, due 8/15/19 | | | 2,007,338 | | |
| | | | 7,459,924 | | |
| | | | | Total Corporate Bonds (Cost $55,288,728) | | | 55,148,849 | | |
See Notes to Financial Statements
8
Schedule of Investments Short Duration Bond Portfolio (cont'd)
PRINCIPAL AMOUNT | | | | VALUE | |
Asset-Backed Securities 18.6% | | | |
$ | 2,747,996 | | | Ally Auto Receivables Trust, Ser. 2014-2, Class A3, 1.25%, due 4/15/19 | | $ | 2,749,023 | | |
| | 2,125,000 | | | Bank of America Credit Card Trust, Ser. 2014-A2, Class A, 0.97%, due 9/16/19 | | | 2,125,417 | (a) | |
| | | | | Capital One Multi-Asset Execution Trust | | | | | |
| | 4,797,000 | | | Ser. 2007-A2, Class A2, 0.78%, due 12/16/19 | | | 4,797,000 | (a) | |
| | 2,800,000 | | | Ser. 2016-A3, Class A3, 1.34%, due 4/15/22 | | | 2,767,980 | | |
| | 676,865 | | | Carmax Auto Owner Trust, Ser. 2014-1, Class A3, 0.79%, due 10/15/18 | | | 676,422 | | |
| | 4,200,000 | | | Chase Issuance Trust, Ser. 2016-A5, Class A5, 1.27%, due 7/15/21 | | | 4,142,319 | | |
| | 1,870,000 | | | Citibank Credit Card Issuance Trust, Ser. 2016-A1, Class A1, 1.75%, due 11/19/21 | | | 1,860,755 | | |
| | 619,380 | | | Fannie Mae Grantor Trust, Ser. 2003-T4, Class 1A, 0.98%, due 9/26/33 | | | 615,564 | (a) | |
| | 440,274 | | | Ford Credit Auto Owner Trust, Ser. 2014-A, Class A3, 0.79%, due 5/15/18 | | | 440,165 | | |
| | 1,789,578 | | | Honda Auto Receivables Owner Trust, Ser. 2015-2, Class A3, 1.04%, due 2/21/19 | | | 1,787,630 | | |
| | 356,939 | | | Hyundai Auto Receivables Trust, Ser. 2014-A, Class A3, 0.79%, due 7/16/18 | | | 356,807 | | |
| | 986,024 | | | SLM Student Loan Trust, Ser. 2013-2, Class A, 1.21%, due 6/25/43 | | | 971,146 | (a) | |
| | 1,864,709 | | | Toyota Auto Receivables Owner Trust, Ser. 2015-A, Class A3, 1.12%, due 2/15/19 | | | 1,863,674 | | |
| | 1,425,000 | | | Verizon Owner Trust, Ser. 2016-1A, Class A, 1.42%, due 1/20/21 | | | 1,414,729 | (b) | |
| | | | | Total Asset-Backed Securities (Cost $26,593,510) | | | 26,568,631 | | |
NUMBER OF SHARES | | | | | |
Short-Term Investment 2.4% | | | |
Investment Company 2.4% | | | |
| | 3,448,083 | | | State Street Institutional U.S. Government Money Market Fund Premier Class,
0.42% (Cost $3,448,083) | | | 3,448,083
| (d) | |
| | | | | Total Investments 99.7% (Cost $143,282,990) | | | 142,602,349 | | |
| | | | | Other Assets Less Liabilities 0.3% | | | 398,805 | (e) | |
| | | | | Net Assets 100.0% | | $ | 143,001,154 | | |
(a) Variable or floating rate security. The interest rate shown was the current rate as of 12/31/2016 and changes periodically.
(b) Securities were purchased under Rule 144A of the Securities Act of 1933, as amended (the "1933 Act"), or are otherwise restricted and, unless registered under the 1933 Act or exempted from registration, may only be sold to qualified institutional investors or may have other restrictions on resale. At 12/31/2016, these securities amounted to $11,669,240 or 8.2% of net assets for the Fund. These securities have been deemed by the investment manager to be liquid.
(c) Step Bond. Coupon rate is a fixed rate for an initial period that either resets at a specific date or may reset in the future contingent upon a predetermined trigger. The interest rate shown was the current rate as of 12/31/2016.
(d) Represents 7-day effective yield as of 12/31/2016.
(e) Includes the impact of the Fund's open positions in derivatives at 12/31/2016.
See Notes to Financial Statements
9
Schedule of Investments Short Duration Bond Portfolio (cont'd)
Derivative Instruments
Futures contracts ("futures"):
At December 31, 2016, open positions in futures for the Fund were as follows:
Expiration | | Open Contracts | | Positions | | Unrealized
Appreciation/
(Depreciation) | |
3/31/2017 | | 26 U.S. Treasury Note, 2 Year | | Long | | $ | (4,112 | ) | |
At December 31, 2016, the notional value of futures for the Fund was $5,633,875 for long positions. The Fund had $15,730 deposited in a segregated account to cover margin requirements on open futures.
For the year ended December 31, 2016, the average notional value of futures for the Fund was $7,708,383 for long positions.
The following is a summary, categorized by Level (see Note A of Notes to Financial Statements), of inputs used to value the Fund's investments as of December 31, 2016:
Asset Valuation Inputs | | Level 1 | | Level 2 | | Level 3 | | Total | |
Investments: | |
U.S. Treasury Obligations | | $ | — | | | $ | 15,359,670 | | | $ | — | | | $ | 15,359,670 | | |
Mortgage-Backed Securities(a) | | | — | | | | 42,077,116 | | | | — | | | | 42,077,116 | | |
Corporate Bonds(a) | | | — | | | | 55,148,849 | | | | — | | | | 55,148,849 | | |
Asset-Backed Securities | | | — | | | | 26,568,631 | | | | — | | | | 26,568,631 | | |
Short-Term Investment | | | — | | | | 3,448,083 | | | | — | | | | 3,448,083 | | |
Total Investments | | $ | — | | | $ | 142,602,349 | | | $ | — | | | $ | 142,602,349 | | |
(a) The Schedule of Investments provides information on the industry categorization for the portfolio.
As of the year ended December 31, 2016, no securities were transferred from one level (as of December 31, 2015) to another.
The following is a summary, categorized by Level (see Note A of Notes to Financial Statements), of inputs used to value the Fund's derivatives as of December 31, 2016:
Other Financial Instruments | | Level 1 | | Level 2 | | Level 3 | | Total | |
Futures(a) | |
Liabilities | | $ | (4,112 | ) | | $ | — | | | $ | — | | | $ | (4,112 | ) | |
Total | | $ | (4,112 | ) | | $ | — | | | $ | — | | | $ | (4,112 | ) | |
(a) Futures are reported at the cumulative appreciation/(depreciation) of the instrument.
See Notes to Financial Statements
10
Statement of Assets and Liabilities
Neuberger Berman Advisers Management Trust
| | | SHORT DURATION
BOND PORTFOLIO | |
| | | December 31, 2016 | |
Assets | |
Investments in securities, at value* (Note A)—see Schedule of Investments: | |
Unaffiliated issuers | | $ | 142,602,349 | | |
Cash collateral segregated for futures contracts (Note A) | | | 15,730 | | |
Dividends and interest receivable | | | 487,586 | | |
Receivable for Fund shares sold | | | 121,259 | | |
Receivable for variation margin on future contracts (Note A) | | | 5,200 | | |
Prepaid expenses and other assets | | | 3,897 | | |
Total Assets | | | 143,236,021 | | |
Liabilities | |
Payable for Fund shares redeemed | | | 61,134 | | |
Payable to investment manager (Note B) | | | 30,402 | | |
Payable to administrator (Note B) | | | 48,643 | | |
Accrued expenses and other payables | | | 94,688 | | |
Total Liabilities | | | 234,867 | | |
Net Assets | | $ | 143,001,154 | | |
Net Assets consist of: | |
Paid-in capital | | $ | 220,281,621 | | |
Undistributed net investment income (loss) | | | 1,965,775 | | |
Accumulated net realized gains (losses) on investments | | | (78,561,489 | ) | |
Net unrealized appreciation (depreciation) in value of investments | | | (684,753 | ) | |
Net Assets | | $ | 143,001,154 | | |
Shares Outstanding ($.001 par value; unlimited shares authorized) | | | 13,593,483 | | |
Net Asset Value, offering and redemption price per share | | $ | 10.52 | | |
*Cost of Investments | | $ | 143,282,990 | | |
See Notes to Financial Statements
11
Neuberger Berman Advisers Management Trust
| | | SHORT DURATION
BOND PORTFOLIO | |
| | | For the Year Ended
December 31, 2016 | |
Investment Income: | |
Income (Note A): | |
Interest income—unaffiliated issuers | | $ | 2,495,817 | | |
Foreign taxes withheld (Note A) | | | (1,281 | ) | |
Total income | | $ | 2,494,536 | | |
Expenses: | |
Investment management fees (Note B) | | | 401,537 | | |
Administration fees (Note B) | | | 642,459 | | |
Audit fees | | | 57,170 | | |
Custodian and accounting fees | | | 76,001 | | |
Insurance expense | | | 5,938 | | |
Legal fees | | | 103,442 | | |
Shareholder reports | | | 51,026 | | |
Trustees' fees and expenses | | | 55,058 | | |
Interest expense | | | 1,146 | | |
Miscellaneous | | | 13,626 | | |
Total net expenses | | | 1,407,403 | | |
Net investment income (loss) | | $ | 1,087,133 | | |
Realized and Unrealized Gain (Loss) on Investments (Note A): | |
Net realized gain (loss) on: | |
Sales of investment securities of unaffiliated issuers | | | 936,305 | | |
Futures contracts | | | (34,304 | ) | |
Change in net unrealized appreciation (depreciation) in value of: | |
Unaffiliated investment securities | | | (24,005 | ) | |
Futures contracts | | | (4,112 | ) | |
Net gain (loss) on investments | | | 873,884 | | |
Net increase (decrease) in net assets resulting from operations | | $ | 1,961,017 | | |
See Notes to Financial Statements
12
Statements of Changes in Net Assets
Neuberger Berman Advisers Management Trust
| | | SHORT DURATION
BOND PORTFOLIO | |
| | | Year Ended
December 31,
2016 | | Year Ended
December 31,
2015 | |
Increase (Decrease) in Net Assets: | |
From Operations: | |
Net investment income (loss) (Note A) | | $ | 1,087,133 | | | $ | 340,526 | | |
Net realized gain (loss) on investments (Note A) | | | 902,001 | | | | 10,142 | | |
Change in net unrealized appreciation (depreciation) of investments (Note A) | | | (28,117 | ) | | | 137,680 | | |
Net increase (decrease) in net assets resulting from operations | | | 1,961,017 | | | | 488,348 | | |
Distributions to Shareholders From (Note A): | |
Net investment income | | | (1,778,567 | ) | | | (2,479,442 | ) | |
From Fund Share Transactions (Note D): | |
Proceeds from shares sold | | | 32,335,688 | | | | 28,198,493 | | |
Proceeds from reinvestment of dividends and distributions | | | 1,778,567 | | | | 2,479,442 | | |
Payments for shares redeemed | | | (51,307,740 | ) | | | (53,256,364 | ) | |
Net increase (decrease) from Fund share transactions | | | (17,193,485 | ) | | | (22,578,429 | ) | |
Net Increase (Decrease) in Net Assets | | | (17,011,035 | ) | | | (24,569,523 | ) | |
Net Assets: | |
Beginning of year | | | 160,012,189 | | | | 184,581,712 | | |
End of year | | $ | 143,001,154 | | | $ | 160,012,189 | | |
Undistributed net investment income (loss) at end of year | | $ | 1,965,775 | | | $ | 1,778,247 | | |
See Notes to Financial Statements
13
Notes to Financial Statements Short Duration Bond Portfolio
Note A—Summary of Significant Accounting Policies:
1 General: Neuberger Berman Advisers Management Trust (the "Trust") is a Delaware statutory trust organized pursuant to an Amended and Restated Trust Instrument dated March 27, 2014. The Trust is currently comprised of eight separate operating series (each individually a "Fund," and collectively the "Funds") each of which is diversified. The Trust is registered as an open-end management investment company under the Investment Company Act of 1940, as amended (the "1940 Act"), and its shares are registered under the 1933 Act. Neuberger Berman Advisers Management Trust Short Duration Bond Portfolio (the "Fund") currently offers only Class I shares. The Trust's Board of Trustees (the "Board") may establish additional series or classes of shares without the approval of shareholders.
The assets of each Fund belong only to that Fund, and the liabilities of each Fund are borne solely by that Fund and no other.
The Fund is an investment company and accordingly follows the investment company accounting and reporting guidance of the Financial Accounting Standards Board ("FASB") Accounting Standard Codification Topic 946 "Financial Services — Investment Companies."
The preparation of financial statements in accordance with U.S. generally accepted accounting principles ("GAAP") requires Neuberger Berman Investment Advisers LLC ("NBIA" or "Management") to make estimates and assumptions at the date of the financial statements. Actual results could differ from those estimates.
Shares of the Fund are not available to the general public and may be purchased only by life insurance companies to serve as an investment vehicle for premiums paid under their variable annuity and variable life insurance contracts and to certain qualified pension and other retirement plans.
2 Portfolio valuation: In accordance with Accounting Standards Codification ("ASC") 820 "Fair Value Measurement" ("ASC 820"), all investments held by the Fund are carried at the value that Management believes the Fund would receive upon selling an investment in an orderly transaction to an independent buyer in the principal or most advantageous market for the investment under current market conditions. Various inputs, including the volume and level of activity for the asset or liability in the market, are considered in valuing the Fund's investments, some of which are discussed below. Significant Management judgment may be necessary to value investments in accordance with ASC 820.
ASC 820 established a three-tier hierarchy of inputs to create a classification of value measurements for disclosure purposes. The three-tier hierarchy of inputs is summarized in the three broad Levels listed below.
• Level 1—quoted prices in active markets for identical investments
• Level 2—other observable inputs (including quoted prices for similar investments, interest rates, prepayment speeds, credit risk, amortized cost, etc.)
• Level 3—unobservable inputs (including the Fund's own assumptions in determining the fair value of investments)
The inputs or methodology used for valuing an investment are not necessarily an indication of the risk associated with investing in those securities.
The value of the Fund's investments in debt securities is determined by Management primarily by obtaining valuations from independent pricing services based on readily available bid or offer quotations, respectively, or if quotations are not available, by methods which include various considerations based on security type (generally Level 2 inputs). In addition to the consideration of yields or prices of securities of comparable quality, coupon,
14
maturity and type, indications as to values from dealers, and general market conditions, the following is a description of other Level 2 inputs and related valuation techniques used by independent pricing services to value certain types of debt securities held by the Fund:
Corporate Bonds. Inputs used to value corporate debt securities generally include relative credit information, observed market movements, sector news, U.S. Treasury yield curve or relevant benchmark curve, and other market information, which may include benchmark yields, reported trades, broker-dealer quotes, issuer spreads, benchmark securities, bids, offers, and reference data, such as market research publications, when available ("Other Market Information").
U.S. Treasury Obligations. Inputs used to value U.S. Treasury securities generally include quotes from several inter-dealer brokers and Other Market Information.
Asset-Backed Securities and Mortgage-Backed Securities. Inputs used to value asset-backed securities and mortgage-backed securities generally include models that consider a number of factors, which may include the following: prepayment speeds, cash flows, spread adjustments and Other Market Information.
The value of futures is determined by Management by obtaining valuations from independent pricing services at the settlement price at the market close (Level 1 inputs).
Management has developed a process to periodically review information provided by independent pricing services for all types of securities.
Investments in non-exchange traded investment companies are valued using the respective fund's daily calculated net asset value per share (Level 2 inputs).
If a valuation is not available from an independent pricing service, or if Management has reason to believe that the valuation received does not represent the amount the Fund might reasonably expect to receive on a current sale in an orderly transaction, Management seeks to obtain quotations from brokers or dealers (generally considered Level 2 or Level 3 inputs depending on the number of quotes available). If such quotations are not readily available, the security is valued using methods the Board has approved in the good-faith belief that the resulting valuation will reflect the fair value of the security. Numerous factors may be considered when determining the fair value of a security based on Level 2 or Level 3 inputs, including available analyst, media or other reports, securities within the same industry with recent highly correlated performance, trading in futures or American Depositary Receipts ("ADRs") and whether the issuer of the security being fair valued has other securities outstanding.
Fair value prices are necessarily estimates, and there is no assurance that such a price will be at or close to the price at which the security is next quoted or next trades.
3 Foreign currency translation: The accounting records of the Fund are maintained in U.S. dollars. Foreign currency amounts are normally translated into U.S. dollars using the exchange rate as of 4:00 p.m. Eastern Time, on days the NYSE is open for business to determine the value of investments, other assets and liabilities. Purchase and sale prices of securities, and income and expenses, are translated into U.S. dollars at the prevailing rate of exchange on the respective dates of such transactions. Net unrealized foreign currency gain (loss), if any, arises from changes in the value of assets and liabilities, other than investments in securities, as a result of changes in exchange rates and is stated separately in the Statement of Operations.
4 Securities transactions and investment income: Securities transactions are recorded on trade date for financial reporting purposes. Interest income, including accretion of discount (adjusted for original issue discount, where applicable) is recorded on the accrual basis. Realized gains and losses from securities transactions and foreign currency transactions, if any, are recorded on the basis of identified cost and stated separately in the Statement of Operations. Included in net realized gain (loss) on investments are proceeds from the settlements of class action litigation in which the Fund participated as a class member. The amount of such proceeds for the year ended December 31, 2016 was $786,612.
15
5 Income tax information: Each Fund is treated as a separate entity for U.S. federal income tax purposes. It is the policy of the Fund to continue to qualify for treatment as a regulated investment company ("RIC") by complying with the requirements of the U.S. Internal Revenue Code applicable to RICs and to distribute substantially all of its net investment income and net realized capital gains to its shareholders. To the extent the Fund distributes substantially all of its net investment income and net realized capital gains to shareholders, no federal income or excise tax provision is required.
The Fund has adopted the provisions of ASC 740 "Income Taxes" ("ASC 740"). ASC 740 sets forth a minimum threshold for financial statement recognition of a tax position taken, or expected to be taken, in a tax return. The Fund recognizes interest and penalties, if any, related to unrecognized tax positions as an income tax expense in the Statement of Operations. The Fund is subject to examination by U.S. federal and state tax authorities for returns filed for the tax years for which the applicable statutes of limitations have not yet expired. As of December 31, 2016, the Fund did not have any unrecognized tax positions.
At December 31, 2016, the cost of investments for U.S. federal income tax basis was $143,701,457. Gross unrealized appreciation of investments was $294,026 and gross unrealized depreciation of investments was $1,393,134 resulting in net unrealized depreciation of $1,099,108 based on cost for U.S. federal income tax purposes.
Income distributions and capital gain distributions are determined in accordance with income tax regulations, which may differ from GAAP. These differences are primarily due to differing treatments of income and gains on various investment securities held by the Fund, timing differences and differing characterization of distributions made by the Fund. The Fund may also utilize earnings and profits distributed to shareholders on redemption of their shares as a part of the dividends-paid deduction for income tax purposes.
As determined on December 31, 2016, permanent differences resulting primarily from different book and tax accounting were reclassified at year end. Such differences are attributed to the tax treatment of: paydown gains and losses and amortization of bond premium. These reclassifications had no effect on net income, net asset value ("NAV") or NAV per share of the Fund. For the year ended December 31, 2016, the Fund recorded the following permanent reclassifications:
| Paid-in Capital | | Undistributed
Net Investment
Income (Loss) | | Accumulated
Net Realized
Gains (Losses)
on Investments | |
| $ | — | | | $ | 878,962 | | | $ | (878,962 | ) | |
The tax character of distributions paid during the years ended December 31, 2016 and December 31, 2015 was as follows:
Distributions Paid From: | |
Ordinary Income | | Total | |
| 2016 | | 2015 | | 2016 | | 2015 | |
| $ | 1,778,567 | | | $ | 2,479,442 | | | $ | 1,778,567 | | | $ | 2,479,442 | | |
As of December 31, 2016, the components of distributable earnings (accumulated losses) on a U.S. federal income tax basis were as follows:
Undistributed
Ordinary
Income | | Unrealized
Appreciation/
(Depreciation) | | Loss
Carryforwards
and Deferrals | | Other
Temporary
Differences | | Total | |
| $ | 1,965,775 | | | $ | (1,099,108 | ) | | $ | (78,147,134 | ) | | $ | — | | | $ | (77,280,467 | ) | |
16
The temporary differences between book basis and tax basis distributable earnings are primarily due to: amortization of bond premium and mark-to-market adjustments on futures.
To the extent the Fund's net realized capital gains, if any, can be offset by capital loss carryforwards, it is the policy of the Fund not to distribute such gains. The Regulated Investment Company Modernization Act of 2010 (the "Act") made changes to the capital loss carryforward rules allowing for RICs to carry forward capital losses indefinitely and to retain the character of capital loss carryforwards as short-term or long-term ("Post-Enactment"). Rules in effect previously limited the carryforward period to eight years and all carryforwards were considered short-term in character ("Pre-Enactment"). As determined at December 31, 2016, the Fund had unused capital loss carryforwards available for federal income tax purposes to offset net realized capital gains, if any, as follows:
Pre-Enactment | |
Expiring in: | |
| 2017 | | 2018 | |
| $ | 45,541,698 | | | $ | 7,896,656 | | |
Post-Enactment (No Expiration Date) | |
| Long-Term | | Short-Term | |
| $ | 22,865,846 | | | $ | 1,842,934 | | |
Post-Enactment capital loss carryforwards must be fully used before Pre-Enactment capital loss carryforwards; therefore, under certain circumstances, Pre-Enactment capital loss carryforwards available as of the report date may expire unused.
6 Distributions to shareholders: The Fund may earn income, net of expenses, daily on its investments. Distributions from net investment income and net realized capital gains, if any, are generally distributed once a year (usually in October). Income distributions and capital gain distributions to shareholders are recorded on the ex-date.
7 Foreign taxes: Foreign taxes withheld, if any, represent amounts withheld by foreign tax authorities, net of refunds recoverable.
8 Expense allocation: Certain expenses are applicable to multiple funds within the complex of related investment companies. Expenses directly attributable to a Fund are charged to that Fund. Expenses of the Trust that are not directly attributable to a particular series of the Trust (e.g., the Fund) are allocated among the series of the Trust, on the basis of relative net assets, except where a more appropriate allocation of expenses to each of the series can otherwise be made fairly. Expenses borne by the complex of related investment companies, which includes open-end and closed-end investment companies for which Management serves as investment manager, that are not directly attributable to a particular investment company in the complex (e.g., the Trust) or series thereof are allocated among the investment companies in the complex or series thereof on the basis of relative net assets, except where a more appropriate allocation of expenses to each of the investment companies in the complex or series thereof can otherwise be made fairly.
9 Dollar rolls: The Fund may enter into dollar roll transactions with respect to mortgage-backed securities. In a dollar roll transaction, the Fund sells securities for delivery in the current month and simultaneously agrees to repurchase substantially similar (i.e., same type and coupon) securities on a specified future date from the same party. During the period before the repurchase, the Fund foregoes principal and interest payments on the securities. The Fund is compensated by the difference between the current sales price and the forward price for the future purchase (often referred to as the "drop"), as well as by the interest earned on the cash proceeds of the initial sale. Dollar rolls may increase fluctuations in the Fund's NAV and may be viewed as a form of leverage. There is a risk that the counterparty will be unable or unwilling to complete the transaction as scheduled, which may result in losses to the Fund.
10 Investments in foreign securities: Investing in foreign securities may involve sovereign and other risks, in addition to the credit and market risks normally associated with domestic securities. These additional risks include the possibility of adverse political and economic developments (including political instability, nationalization,
17
expropriation, or confiscatory taxation) and the potentially adverse effects of unavailability of public information regarding issuers, less governmental supervision and regulation of financial markets, reduced liquidity of certain financial markets, and the lack of uniform accounting, auditing, and financial reporting standards or the application of standards that are different or less stringent than those applied in the United States. Foreign securities also may experience greater price volatility, higher rates of inflation, and delays in settlement.
11 Derivative instruments: The Fund's use of derivatives during the year ended December 31, 2016, is described below. Please see the Schedule of Investments for the Fund's open positions in derivatives at December 31, 2016. The Fund has adopted the provisions of ASC 815 "Derivatives and Hedging" ("ASC 815"). The disclosure requirements of ASC 815 distinguish between derivatives that qualify for hedge accounting and those that do not. Because investment companies value their derivatives at fair value and recognize changes in fair value through the Statement of Operations, they do not qualify for hedge accounting. Accordingly, even though the Fund's investments in derivatives may represent economic hedges, they are considered non-hedge transactions for purposes of this disclosure.
Futures contracts: During the year ended December 31, 2016, the Fund used U.S. Treasury futures to manage the duration of the Fund.
At the time the Fund enters into a futures contract, it is required to deposit with the futures commission merchant a specified amount of cash or liquid securities, known as "initial margin," which is a percentage of the value of the futures contract being traded that is set by the exchange upon which the futures contract is traded. Each day, the futures contract is valued at the official settlement price of the board of trade or U.S. commodity exchange on which such futures contract is traded. Subsequent payments, known as "variation margin," to and from the broker are made on a daily basis, or as needed, as the market price of the futures contract fluctuates. Daily variation margin adjustments, arising from this "mark to market," are recorded by a Fund as unrealized gains or losses.
Although some futures by their terms call for actual delivery or acquisition of the underlying securities or currency, in most cases the contracts are closed out prior to delivery by offsetting purchases or sales of matching futures. When the contracts are closed, a Fund recognizes a gain or loss. Risks of entering into futures contracts include the possibility there may be an illiquid market, possibly at a time of rapidly declining prices, and/or a change in the value of the contract may not correlate with changes in the value of the underlying securities. Futures executed on regulated futures exchanges have minimal counterparty risk to a Fund because the exchange's clearinghouse assumes the position of the counterparty in each transaction. Thus, the Fund is exposed to risk only in connection with the clearinghouse and not in connection with the original counterparty to the transaction.
For U.S. federal income tax purposes, the futures transactions undertaken by the Fund may cause the Fund to recognize gains or losses from marking contracts to market even though its positions have not been sold or terminated, may affect the character of the gains or losses recognized as long-term or short-term, and may affect the timing of some capital gains and losses realized by the Fund. Also, the Fund's losses on transactions involving futures contracts may be deferred rather than being taken into account currently in calculating the Fund's taxable income.
At December 31, 2016, the Fund had the following derivatives (which did not qualify as hedging instruments under ASC 815), grouped by primary risk exposure:
Liability Derivatives
| | | Interest Rate Risk | | Statement of
Assets and Liabilities
Location | |
Futures
| | $ | (4,112
| ) | | Receivable/Payable for
variation margin on futures
contracts(a) | |
Total Value — Liabilities | | $ | (4,112 | ) | | | |
(a) "Futures" reflects the cumulative appreciation (depreciation) of futures as of December 31, 2016, which is reflected in the Statement of Assets and Liabilities under the caption "Net unrealized appreciation (depreciation) in value of
18
investments." The current day's variation margin as of December 31, 2016, if any, is reflected in the Statement of Assets and Liabilities under the caption "Receivable/Payable for variation margin on futures contracts."
The impact of the use of these derivative instruments on the Statement of Operations during the year ended December 31, 2016, was as follows:
Realized Gain (Loss)
| | Interest Rate Risk | | Statement of
Operations Location | |
Futures
| | $ | (34,304
| ) | | Net realized gain
(loss) on: futures contracts | |
Total Realized Gain (Loss) | | $ | (34,304 | ) | | | |
Change in Appreciation/(Depreciation)
| | Interest Rate Risk | | | |
Futures
| | $ | (4,112
| ) | | Change in net unrealized
appreciation
(depreciation) in
value of:
futures contracts | |
Total Change in Appreciation/
(Depreciation) | | $ | (4,112
| ) | |
| |
The Fund adopted the provisions of Accounting Standards Update 2011-11 Disclosures about Offsetting Assets and Liabilities ("ASU 2011-11"). ASU 2011-11 is intended to enhance disclosure requirements on the offsetting of financial assets and liabilities. Pursuant to ASU 2011-11, an entity is required to disclose both gross and net information for assets and liabilities related to derivatives, repurchase and reverse repurchase agreements, and securities lending and securities borrowing transactions that are eligible for offset or subject to an enforceable master netting or similar agreement. At December 31, 2016, the Fund had no derivatives eligible for offset or subject to an enforceable master netting or similar agreement.
12 Indemnifications: Like many other companies, the Trust's organizational documents provide that its officers ("Officers") and trustees ("Trustees") are indemnified against certain liabilities arising out of the performance of their duties to the Trust. In addition, both in some of its principal service contracts and in the normal course of its business, the Trust enters into contracts that provide indemnifications to other parties for certain types of losses or liabilities. The Trust's maximum exposure under these arrangements is unknown as this could involve future claims against the Trust.
Note B—Investment Management Fees, Administration Fees, Distribution Arrangements, and Other Transactions with Affiliates:
The Fund retains Management as its investment manager under a Management Agreement. For such investment management services, the Fund pays Management a fee at the annual rate of 0.25% of the first $500 million of the Fund's average daily net assets, 0.225% of the next $500 million, 0.20% of the next $500 million, 0.175% of the next $500 million, and 0.15% of average daily net assets in excess of $2 billion. Accordingly, for the year ended December 31, 2016, the investment management fee pursuant to the Management Agreement was equivalent to an annual effective rate of 0.25% of the Fund's average daily net assets.
The Fund retains Management as its administrator under an Administration Agreement. The Fund pays Management an administration fee at the annual rate of 0.40% of its average daily net assets under this agreement. Additionally, Management retains State Street Bank and Trust Company ("State Street") as its sub-administrator under a Sub-Administration Agreement. Management pays State Street a fee for all services received under this agreement.
19
Neuberger Berman BD LLC is the Fund's "principal underwriter" within the meaning of the 1940 Act. It acts as agent in arranging for the sale of the Fund's Class I shares without sales commission or other compensation and bears all advertising and promotion expenses incurred in the sale of those shares. The Board adopted a non-fee distribution plan for the Fund's Class I.
Management has contractually agreed to waive fees and/or reimburse the Fund so that the total annual operating expenses do not exceed the expense limitations as detailed in the following table. These undertakings exclude fees payable to Management, interest (commitment fees relating to borrowings are treated as interest for purposes of this exclusion), taxes, transaction costs, brokerage commissions, dividend and interest expenses relating to short sales, acquired fund fees and expenses and extraordinary expenses, if any; consequently, net expenses may exceed the contractual expense limitation. The Fund has agreed that it will repay Management for fees and expenses waived or reimbursed provided that repayment does not cause the annual operating expenses to exceed its contractual expense limitation in place at the time the fees and expenses were waived or reimbursed, or the expense limitation in place at the time the Fund repays Management, whichever is lower. Any such repayment must be made within three years after the year in which Management incurred the expense.
During the year ended December 31, 2016, there was no repayment to Management under its contractual expense limitation.
At December 31, 2016, the Fund had no contingent liability to Management under its contractual expense limitation.
| | | | | | | Expenses Reimbursed in
Fiscal Year Ending December 31, | |
| | | | | | | 2014 | | 2015 | | 2016 | |
| | | | | | | Subject to Repayment Until December 31, | |
| | | Contractual
Expense
Limitation(a) | | Expiration | | 2017 | | 2018 | | 2019 | |
Class I | | | 1.00 | % | | 12/31/19 | | $ | — | | | $ | — | | | $ | — | | |
(a) Expense limitation per annum of the Fund's average daily net assets.
Neuberger Berman Fixed Income LLC ("NBFI"), as the sub-adviser to the Fund, was retained by Management through December 31, 2015, to furnish it with investment recommendations and research information without added cost to the Fund. Several individuals who are Officers and/or Trustees of the Trust are also employees of NBFI and/or Management. As a result of the entity consolidation described on page 3 of this Annual Report, the services previously provided by NBFI under the Sub-Advisory Agreement are being provided by NBIA as of January 1, 2016.
Note C—Securities Transactions:
Cost of purchases and proceeds of sales and maturities of long-term securities (excluding futures) for the year ended December 31, 2016 were as follows:
Purchases of
U.S. Government
and Agency
Obligations | | Purchases excluding
U.S. Government
and Agency
Obligations | | Sales and Maturities
of U.S. Government
and Agency
Obligations | | Sales and Maturities
excluding
U.S. Government
and Agency
Obligations | |
| $ | 54,138,336 | | | $ | 67,932,869 | | | $ | 64,779,573 | | | $ | 76,815,449 | | |
20
Note D—Fund Share Transactions:
Share activity for the years ended December 31, 2016 and December 31, 2015 was as follows:
| | | For the Year Ended December 31, | |
| | | 2016 | | 2015 | |
Shares Sold | | | 3,059,430 | | | | 2,642,530 | | |
Shares Issued on Reinvestment of Dividends and Distributions | | | 168,745 | | | | 234,796 | | |
Shares Redeemed | | | (4,838,177 | ) | | | (4,988,565 | ) | |
Total | | | (1,610,002 | ) | | | (2,111,239 | ) | |
Note E—Line of Credit:
At December 31, 2016, the Fund was a participant in a syndicated committed, unsecured $700,000,000 line of credit (the "Credit Facility"), to be used only for temporary or emergency purposes. Series of other investment companies managed by Management also participate in this line of credit on substantially the same terms except that some do not have access to the full amount of the Credit Facility. Interest is charged on borrowings under this Credit Facility at the higher of (a) a federal funds effective rate plus 1.00% per annum or (b) a Eurodollar rate for a one-month period plus 1.00% per annum. The Credit Facility has an annual commitment fee of 0.15% per annum of the available line of credit, which is paid quarterly. The Fund has agreed to pay its pro rata share of the annual commitment fee, based on the ratio of its individual net assets to the net assets of all participants at the time the fee is due and payable and the level of its access to the Credit Facility, and interest charged on any borrowing made by the Fund and other costs incurred by the Fund. Because several mutual funds participate in the Credit Facility, there is no assurance that the Fund will have access to all or any part of the $700,000,000 at any particular time. There were no loans outstanding under the Credit Facility at December 31, 2016. During the period ended December 31, 2016, the Fund did not utilize the Credit Facility.
Note F—Recent Accounting Pronouncement:
In October 2016, the U.S. Securities and Exchange Commission ("SEC") adopted new rules and forms, and amendments to certain current rules and forms, to modernize reporting and disclosure of information by registered investment companies. The amendments to Regulation S-X will require standardized, enhanced disclosure about derivatives in investment company financial statements, and will also change the rules governing the form and content of such financial statements. The compliance date for the amendments to Regulation S-X is August 1, 2017. Management is currently evaluating the impact that the adoption of the amendments to Regulation S-X will have on the Fund's financial statements and related disclosures.
21
Short Duration Bond Portfolio
The following table includes selected data for a share outstanding throughout each year and other performance information derived from the Financial Statements. Amounts that do not round to $0.01 or $(0.01) per share are presented as $0.00 or $(0.00), respectively. Ratios that do not round to 0.01% or (0.01)% are presented as 0.00% or (0.00)%, respectively. A "—" indicates that the line item was not applicable in the corresponding period.
Class I | |
| | | Year Ended December 31, | |
| | | 2016 | | 2015 | | 2014 | | 2013 | | 2012 | |
Net Asset Value, Beginning of Year | | $ | 10.52 | | | $ | 10.66 | | | $ | 10.78 | | | $ | 10.95 | | | $ | 10.79 | | |
Income From Investment Operations: | |
| Net Investment Income (Loss)@ | | | 0.07 | | | | 0.02 | | | | 0.07 | | | | 0.07 | | | | 0.13 | | |
Net Gains or Losses on Securities
(both realized and unrealized) | | | 0.06 | | | | 0.00 | | | | 0.00 | | | | (0.00 | ) | | | 0.37 | | |
Total From Investment Operations | | | 0.13 | | | | 0.02 | | | | 0.07 | | | | 0.07 | | | | 0.50 | | |
Less Distributions From: | |
Net Investment Income | | | (0.13 | ) | | | (0.16 | ) | | | (0.19 | ) | | | (0.24 | ) | | | (0.34 | ) | |
Voluntary Contribution from Management | | | — | | | | — | | | | 0.00 | | | | — | | | | — | | |
Net Asset Value, End of Year | | $ | 10.52 | | | $ | 10.52 | | | $ | 10.66 | | | $ | 10.78 | | | $ | 10.95 | | |
| Total Return† | | | 1.22 | %^ | | | 0.18 | %^ | | | 0.61 | %µ | | | 0.62 | % | | | 4.61 | % | |
Ratios/Supplemental Data | |
Net Assets, End of Year (in millions) | | $ | 143.0 | | | $ | 160.0 | | | $ | 184.6 | | | $ | 227.7 | | | $ | 226.6 | | |
| Ratio of Gross Expenses to Average Net Assets# | | | 0.88 | % | | | 0.84 | % | | | 0.82 | % | | | 0.80 | % | | | 0.82 | % | |
Ratio of Net Expenses to Average Net Assets | | | 0.88 | % | | | 0.84 | % | | | 0.82 | % | | | 0.80 | % | | | 0.82 | %§ | |
Ratio of Net Investment Income (Loss) to Average
Net Assets | | | 0.68 | % | | | 0.19 | % | | | 0.69 | % | | | 0.64 | % | | | 1.20 | % | |
Portfolio Turnover Rate | | | 79 | % | | | 65 | % | | | 58 | % | | | 72 | % | | | 67 | % | |
See Notes to Financial Highlights
22
Notes to Financial Highlights Short Duration Bond Portfolio
† Total return based on per share NAV reflects the effects of changes in NAV on the performance of the Fund during each fiscal period. Returns assume income dividends and other distributions, if any, were reinvested. Results represent past performance and do not indicate future results. Current returns may be lower or higher than the performance data quoted. Investment returns and principal may fluctuate and shares when redeemed may be worth more or less than original cost. Total return would have been lower if Management had not reimbursed and/or waived certain expenses. The total return information shown does not reflect charges and other expenses that apply to the separate accounts or the related insurance policies or other qualified pension or retirement plans, and the inclusion of these charges and other expenses would reduce the total return for all fiscal periods shown.
^ Had the Fund not received the class action proceeds listed in Note A of the Notes to Financial Statements, total return based on per share NAV for the year ended December 31, 2016 would have been 0.64%. Had the Fund not received class action proceeds in 2015, total return based on per share NAV for the year ended December 31, 2015 would have been 0.09%.
# Represents the annualized ratios of net expenses to average daily net assets if Management had not reimbursed certain expenses and/or waived a portion of the investment management fee. Management did not reimburse or waive fees during the fiscal periods shown.
@ Calculated based on the average number of shares outstanding during each fiscal period.
§ Prior to January 1, 2013, the Fund had an expense offset arrangement in connection with its custodian contract. The impact of expense reductions related to expense offset arrangements, if any, was less than 0.01%.
µ The voluntary contribution received in 2014 had no impact on the Fund's total return for the year ended December 31, 2014.
23
Report of Independent Registered Public Accounting Firm
To the Board of Trustees of
Neuberger Berman Advisers Management Trust and
Shareholders of Short Duration Bond Portfolio
We have audited the accompanying statement of assets and liabilities of Short Duration Bond Portfolio, one of the series constituting Neuberger Berman Advisers Management Trust (the "Trust"), including the schedule of investments, as of December 31, 2016, and the related statement of operations for the year then ended, the statements of changes in net assets for each of the two years in the period then ended and the financial highlights for each of the five years in the period then ended. These financial statements and financial highlights are the responsibility of the Trust's management. Our responsibility is to express an opinion on these financial statements and financial highlights based on our audits.
We conducted our audits in accordance with the standards of the Public Company Accounting Oversight Board (United States). Those standards require that we plan and perform the audit to obtain reasonable assurance about whether the financial statements and financial highlights are free of material misstatement. We were not engaged to perform an audit of the Trust's internal control over financial reporting. Our audits included consideration of internal control over financial reporting as a basis for designing audit procedures that are appropriate in the circumstances, but not for the purpose of expressing an opinion on the effectiveness of the Trust's internal control over financial reporting. Accordingly, we express no such opinion. An audit also includes examining, on a test basis, evidence supporting the amounts and disclosures in the financial statements and financial highlights, assessing the accounting principles used and significant estimates made by management, and evaluating the overall financial statement presentation. Our procedures included confirmation of securities owned as of December 31, 2016 by correspondence with the custodian. We believe that our audits provide a reasonable basis for our opinion.
In our opinion, the financial statements and financial highlights referred to above present fairly, in all material respects, the financial position of Short Duration Bond Portfolio, a series of Neuberger Berman Advisers Management Trust, at December 31, 2016, the results of its operations for the year then ended, the changes in its net assets for each of the two years in the period then ended, and the financial highlights for each of the five years in the period then ended in conformity with U.S. generally accepted accounting principles.
Boston, Massachusetts
February 10, 2017
24
The following tables set forth information concerning the Trustees and Officers of the Fund. All persons named as Trustees and Officers also serve in similar capacities for other funds administered or managed by Management. The Fund's Statement of Additional Information includes additional information about the Trustees as of the time of the Fund's most recent public offering and is available upon request, without charge, by calling (800) 877-9700.
Information about the Board of Trustees
Name, (Year of Birth),
and Address(1) | | Position(s) and
Length of
Time Served(2) | | Principal Occupation(s)(3) | | Number of
Funds in Fund
Complex
Overseen by Fund Trustee | | Other Directorships
Held Outside Fund
Complex by Fund
Trustee(3) |
Independent Trustees |
Michael J. Cosgrove (1949) | | Trustee since 2015 | | President, Carragh Consulting USA, since 2014; formerly, Executive, General Electric Company, 1970 to 2014, including President, Mutual Funds and Global Investment Programs, GE Asset Management, 2011 to 2014, President and Chief Executive Officer, Mutual Funds and Intermediary Business, GE Asset Management, 2007 to 2011, President, Institutional Sales and Marketing, GE Asset Management, 1998 to 2007, and Chief Financial Officer, GE Asset Management, and Deputy Treasurer, GE Company, 1988 to 1993. | | 55 | | | Director, America Press, Inc. (not-for-profit Jesuit publisher), since 2015; Director, Fordham University, since 2001; formerly, Director, The Gabelli Go Anywhere Trust, June 2015 to June 2016; Director, Skin Cancer Foundation (not-for-profit), 2006 to 2015; Director, GE Investments Funds, Inc., 1997 to 2014; Trustee, GE Institutional Funds, 1997 to 2014; Director, GE Asset Management, 1988 to 2014; Director, Elfun Trusts, 1988 to 2014; Trustee, GE Pension & Benefit Plans, 1988 to 2014. |
25
Name, (Year of Birth),
and Address(1) | | Position(s) and
Length of
Time Served(2) | | Principal Occupation(s)(3) | | Number of
Funds in Fund
Complex
Overseen by Fund Trustee | | Other Directorships
Held Outside Fund
Complex by Fund
Trustee(3) |
Marc Gary (1952) | | Trustee since 2015 | | Executive Vice Chancellor and Chief Operating Officer, Jewish Theological Seminary, since 2012; formerly, Executive Vice President and General Counsel, Fidelity Investments, 2007 to 2012; Executive Vice President and General Counsel, BellSouth Corporation, 2004 to 2007; Vice President and Associate General Counsel, BellSouth Corporation, 2000 to 2004; Associate, Partner, and National Litigation Practice Co-Chair, Mayer, Brown LLP, 1981 to 2000; Associate Independent Counsel, Office of Independent Counsel, 1990 to 1992. | | 55 | | | Trustee, Jewish Theological Seminary, since 2015; Director, Counsel on Call (privately held for-profit company), since 2012; Director, Lawyers Committee for Civil Rights Under Law (not-for-profit), since 2005; formerly, Director, Equal Justice Works (not-for-profit), 2005 to 2014; Director, Corporate Counsel Institute, Georgetown University Law Center, 2007 to 2012; Director, Greater Boston Legal Services (not-for-profit), 2007 to 2012. |
Martha C. Goss (1949) | | Trustee since 2007 | | President, Woodhill Enterprises Inc./Chase Hollow Associates LLC (personal investment vehicle), since 2006; formerly, Consultant, Resources Global Professionals (temporary staffing), 2002 to 2006. | | 55 | | | Director, American Water (water utility), since 2003; Director, Allianz Life of New York (insurance), since 2005; Director, Berger Group Holdings, Inc. (engineering consulting firm), since 2013; Director, Financial Women's Association of New York (not-for-profit association), since 2003; Trustee Emerita, Brown University, since 1998; Director, Museum of American Finance (not-for-profit), since 2013; formerly, Non-Executive Chair and Director, Channel Reinsurance (financial guaranty reinsurance), 2006 to 2010; formerly, Director, Ocwen Financial Corporation (mortgage servicing), 2005 to 2010; formerly, Director, Claire's Stores, Inc. (retailer), 2005 to 2007; formerly, Director, Parsons Brinckerhoff Inc. (engineering consulting firm), 2007 to 2010; formerly, Director, Bank Leumi (commercial bank), 2005 to 2007; formerly, Advisory Board Member, Attensity (software developer), 2005 to 2007. |
26
Name, (Year of Birth),
and Address(1) | | Position(s) and
Length of
Time Served(2) | | Principal Occupation(s)(3) | | Number of Funds in Fund
Complex
Overseen by
Fund Trustee | | Other Directorships
Held Outside Fund
Complex by Fund
Trustee(3) |
Michael M. Knetter (1960) | | Trustee since 2007 | | President and Chief Executive Officer, University of Wisconsin Foundation, since October 2010; formerly, Dean, School of Business, University of Wisconsin - Madison; formerly, Professor of International Economics and Associate Dean, Amos Tuck School of Business -Dartmouth College, 1998 to 2002. | | 55 | | Board Member, American Family Insurance (a mutual company, not publicly traded), since March 2009; formerly, Trustee, Northwestern Mutual Series Fund, Inc., 2007 to 2011; formerly, Director, Wausau Paper, 2005 to 2011; formerly, Director, Great Wolf Resorts, 2004 to 2009. |
Deborah C. McLean (1954) | | Trustee since 2015 | | Member, Circle Financial Group (private wealth management membership practice), since 2011; Managing Director, Golden Seeds LLC (an angel investing group), since 2009; Adjunct Professor, Columbia University School of International and Public Affairs, since 2008; formerly, Visiting Assistant Professor, Fairfield University, Dolan School of Business, Fall 2007; formerly, Adjunct Associate Professor of Finance, Richmond, The American International University in London, 1999 to 2007. | | 55 | | Board member, Norwalk Community College Foundation, since 2014; Dean's Advisory Council, Radcliffe Institute for Advanced Study, since 2014; formerly, Director and Treasurer, At Home in Darien (not-for-profit), 2012 to 2014; Director, National Executive Service Corps (not-for-profit), 2012 to 2013; Trustee, Richmond, The American International University in London, 1999 to 2013. |
George W. Morriss (1947) | | Trustee since 2007 | | Adjunct Professor, Columbia University School of International and Public Affairs, since October 2012; formerly, Executive Vice President and Chief Financial Officer, People's United Bank, Connecticut (a financial services company), 1991 to 2001. | | 55 | | Director, National Association of Corporate Directors, Connecticut Chapter, since 2011; Trustee, Steben Alternative Investment Funds, Steben Select Multi-Strategy Fund, and Steben Select Multi-Strategy Master Fund, since 2013; formerly, Treasurer, National Association of Corporate Directors, Connecticut Chapter, 2011 to 2015; formerly, Manager, Larch Lane Multi-Strategy Fund complex (which consisted of three funds), 2006 to 2011; formerly, Member, NASDAQ Issuers' Affairs Committee, 1995 to 2003. |
27
Name, (Year of Birth),
and Address(1) | | Position(s) and
Length of
Time Served(2) | | Principal Occupation(s)(3) | | Number of
Funds in Fund
Complex
Overseen by
Fund Trustee | | Other Directorships
Held Outside Fund
Complex by Fund
Trustee(3) |
Tom D. Seip (1950) | | Trustee since 2000; Chairman of the Board since 2008; formerly Lead Independent Trustee from 2006 to 2008 | | General Partner, Ridgefield Farm LLC (a private investment vehicle); formerly, President and CEO, Westaff, Inc. (temporary staffing), May 2001 to January 2002; formerly, Senior Executive, The Charles Schwab Corporation, 1983 to 1998, including Chief Executive Officer, Charles Schwab Investment Management, Inc.; Trustee, Schwab Family of Funds and Schwab Investments, 1997 to 1998; and Executive Vice President-Retail Brokerage, Charles Schwab & Co., Inc., 1994 to 1997. | | 55 | | Director, H&R Block, Inc. (financial services company), since May 2001; Chairman, Governance and Nominating Committee, H&R Block, Inc., since 2011; formerly, Chairman, Compensation Committee, H&R Block, Inc., 2006 to 2010; formerly, Director, Forward Management, Inc. (asset management company), 1999 to 2006. |
James G. Stavridis (1955) | | Trustee since 2015 | | Dean, Fletcher School of Law and Diplomacy, Tufts University since 2013; formerly, Admiral, United States Navy, 2006 to 2013, including Supreme Allied Commander, NATO and Commander, European Command, 2009 to 2013, and Commander, United States Southern Command, 2006 to 2009. | | 55 | | Director, Utilidata Inc., since 2015; Director, BMC Software Federal, LLC, since 2014; Director, Vertical Knowledge, LLC, since 2013; formerly, Director, Navy Federal Credit Union, 2000-2002. |
28
Name, (Year of Birth),
and Address(1) | | Position(s) and
Length of
Time Served(2) | | Principal Occupation(s)(3) | | Number of
Funds in Fund
Complex
Overseen by
Fund Trustee | | Other Directorships
Held Outside Fund
Complex by Fund
Trustee(3) |
Candace L. Straight (1947) | | Trustee since 1999 | | Private investor and consultant specializing in the insurance industry; formerly, Advisory Director, Securitas Capital LLC (a global private equity investment firm dedicated to making investments in the insurance sector), 1998 to 2003. | | 55 | | Formerly, Public Member, Board of Governors and Board of Trustees, Rutgers University, 2011 to 2016; formerly, Director, Montpelier Re Holdings Ltd. (reinsurance company), 2006 to 2015; formerly, Director, National Atlantic Holdings Corporation (property and casualty insurance company), 2004 to 2008; formerly, Director, The Proformance Insurance Company (property and casualty insurance company), 2004 to 2008; formerly, Director, Providence Washington Insurance Company (property and casualty insurance company), 1998 to 2006; formerly, Director, Summit Global Partners (insurance brokerage firm), 2000 to 2005. |
Peter P. Trapp (1944) | | Trustee since 1984 | | Retired; formerly, Regional Manager for Mid-Southern Region, Ford Motor Credit Company, September 1997 to 2007; formerly, President, Ford Life Insurance Company, April 1995 to August 1997. | | 55 | | None. |
29
Name, (Year of Birth),
and Address(1) | | Position(s) and
Length of
Time Served(2) | | Principal Occupation(s)(3) | | Number of
Funds in Fund
Complex
Overseen by Fund Trustee | | Other Directorships
Held Outside Fund
Complex by Fund
Trustee(3) |
Trustees who are "Interested Persons" |
Joseph V. Amato* (1962) | | Trustee since 2009 | | President and Director, Neuberger Berman Group LLC, since 2009; President and Chief Executive Officer, Neuberger Berman BD LLC ("Neuberger Berman") and Neuberger Berman Holdings LLC (including its predecessor, Neuberger Berman Inc.), since 2007; Chief Investment Officer (Equities) and President (Equities), Neuberger Berman Investment Advisers LLC ("NBIA") (formerly, Neuberger Berman Fixed Income LLC ("NBFI") and including predecessor entities), since 2007, and Board Member of NBIA since 2006; formerly, Global Head of Asset Management of Lehman Brothers Holdings Inc.'s ("LBHI") Investment Management Division, 2006 to 2009; formerly, member of LBHI's Investment Management Division's Executive Management Committee, 2006 to 2009; formerly, Managing Director, Lehman Brothers Inc. ("LBI"), 2006 to 2008; formerly, Chief Recruiting and Development Officer, LBI, 2005 to 2006; formerly, Global Head of LBI's Equity Sales and a Member of its Equities Division Executive Committee, 2003 to 2005. | | 55 | | Member of Board of Advisors, McDonough School of Business, Georgetown University, since 2001; Member of New York City Board of Advisors, Teach for America, since 2005; Trustee, Montclair Kimberley Academy (private school), since 2007; Member of Board of Regents, Georgetown University, since 2013. |
30
Name, (Year of Birth),
and Address(1) | | Position(s) and
Length of
Time Served(2) | | Principal Occupation(s)(3) | | Number of
Funds in Fund
Complex
Overseen by Fund Trustee | | Other Directorships
Held Outside Fund
Complex by Fund
Trustee(3) |
Robert Conti* (1956) | | Chief Executive Officer, President and Trustee since 2008; prior thereto, Executive Vice President in 2008 and Vice President from 2000 to 2008 | | Managing Director, Neuberger Berman, since 2007; President - Mutual Funds, NBIA, since 2008; formerly, Senior Vice President, Neuberger Berman, 2003 to 2006; formerly, Vice President, Neuberger Berman, 1999 to 2003; President and Chief Executive Officer, twenty-eight registered investment companies for which NBIA acts as investment manager and/or administrator. | | 55 | | Director, Staten Island Mental Health Society, since 1994; formerly, Chairman of the Board, Staten Island Mental Health Society, 2008 to 2011. |
(1) The business address of each listed person is 1290 Avenue of the Americas, New York, NY 10104.
(2) Pursuant to the Trust's Trust Instrument, each of these Trustees shall hold office for life or until his or her successor is elected or the Trust terminates; except that (a) any Trustee may resign by delivering a written resignation; (b) any Trustee may be removed with or without cause at any time by a written instrument signed by at least two-thirds of the other Trustees; (c) any Trustee who requests to be retired, or who has become unable to serve, may be retired by a written instrument signed by a majority of the other Trustees; and (d) any Trustee may be removed at any shareholder meeting by a vote of at least two-thirds of the outstanding shares.
(3) Except as otherwise indicated, each individual has held the positions shown during at least the last five years.
* Indicates a Trustee who is an "interested person" within the meaning of the 1940 Act. Mr. Amato and Mr. Conti are interested persons of the Trust by virtue of the fact that each is an officer of Management, Neuberger Berman and/or their affiliates.
31
Information about the Officers of the Trust
Name, (Year of Birth),
and Address(1) | | Position(s) and
Length of
Time Served(2) | | Principal Occupation(s)(3) |
Claudia A. Brandon (1956) | | Executive Vice President since 2008 and Secretary since 1985 | | Senior Vice President, Neuberger Berman, since 2007 and Employee since 1999; Senior Vice President, NBIA, since 2008 and Assistant Secretary since 2004; formerly, Vice President, Neuberger Berman, 2002 to 2006; formerly, Vice President — Mutual Fund Board Relations, NBIA, 2000 to 2008; formerly, Vice President, NBIA, 1986 to 1999 and Employee, 1984 to 1999; Executive Vice President, twenty-eight registered investment companies for which NBIA acts as investment manager and/or administrator; Secretary, fifteen registered investment companies for which NBIA acts as investment manager and/or administrator. |
Agnes Diaz (1971) | | Vice President since 2013 | | Senior Vice President, Neuberger Berman, since 2012; Senior Vice President, NBIA, since 2012 and Employee since 1996; formerly, Vice President, Neuberger Berman, 2007 to 2012; Vice President, twenty-eight registered investment companies for which NBIA acts as investment manager and/or administrator. |
Anthony DiBernardo (1979) | | Assistant Treasurer since 2011 | | Senior Vice President, NBIA, since 2014, and Employee since 2003; formerly, Vice President, Neuberger Berman, 2009 to 2014; Assistant Treasurer, ten registered investment companies for which NBIA acts as investment manager and/or administrator. |
Corey A. Issing (1978) | | Chief Legal Officer since 2016 (only for purposes of sections 307 and 406 of the Sarbanes-Oxley Act of 2002) and Anti-Money Laundering Compliance Officer since 2016 | | General Counsel and Head of Compliance — Mutual Funds since 2016 and Senior Vice President, NBIA, since 2013, formerly, Associate General Counsel (2015 to 2016), Counsel (2007 to 2015), Vice President (2009 — 2013); Chief Legal Officer (only for purposes of sections 307 and 406 of the Sarbanes-Oxley Act of 2002), twenty-eight registered investment companies for which NBIA acts as investment manager and/or administrator; Anti-Money Laundering Compliance Officer, twenty-eight registered investment companies for which NBIA acts as investment manager and/or administrator. |
Sheila R. James (1965) | | Assistant Secretary since 2002 | | Vice President, Neuberger Berman, since 2008 and Employee since 1999; Vice President, NBIA, since 2008; formerly, Assistant Vice President, Neuberger Berman, 2007; Employee, NBIA, 1991 to 1999; Assistant Secretary, twenty-eight registered investment companies for which NBIA acts as investment manager and/or administrator. |
32
Name, (Year of Birth),
and Address(1) | | Position(s) and
Length of
Time Served(2) | | Principal Occupation(s)(3) |
Brian Kerrane (1969) | | Chief Operating Officer since 2015 and Vice President since 2008 | | Managing Director, Neuberger Berman, since 2013; Chief Operating Officer — Mutual Funds and Managing Director, NBIA, since 2015 and Employee since 1991; formerly, Senior Vice President, Neuberger Berman, 2006 to 2014; Vice President, NBIA, 2008 to 2015; Chief Operating Officer, ten registered investment companies for which NBIA acts as investment manager and/or administrator; Vice President, twenty-eight registered investment companies for which NBIA acts as investment manager and/or administrator. |
Kevin Lyons (1955) | | Assistant Secretary since 2003 | | Assistant Vice President, Neuberger Berman, since 2008 and Employee since 1999; Assistant Vice President, NBIA, since 2008; formerly, Employee, NBIA, 1993 to 1999; Assistant Secretary, ten registered investment companies for which NBIA acts as investment manager and/or administrator. |
Anthony Maltese (1959) | | Vice President since 2015 | | Senior Vice President, Neuberger Berman, since 2014 and Employee since 2000; Senior Vice President, NBIA, since 2014; Vice President, ten registered investment companies for which NBIA acts as investment manager and/or administrator. |
Owen F. McEntee, Jr. (1961) | | Vice President since 2008 | | Vice President, Neuberger Berman, since 2006; Vice President, NBIA, since 2006 and Employee since 1992; Vice President, ten registered investment companies for which NBIA acts as investment manager and/or administrator. |
John M. McGovern (1970) | | Treasurer and Principal Financial and Accounting Officer since 2005 | | Senior Vice President, Neuberger Berman, since 2007; Senior Vice President, NBIA, since 2007 and Employee since 1993; formerly, Vice President, Neuberger Berman, 2004 to 2006; formerly, Assistant Treasurer, 2002 to 2005; Treasurer and Principal Financial and Accounting Officer, twenty-eight registered investment companies for which NBIA acts as investment manager and/or administrator. |
Frank Rosato (1971) | | Assistant Treasurer since 2005 | | Vice President, Neuberger Berman, since 2006; Vice President, NBIA, since 2006 and Employee since 1995; Assistant Treasurer, ten registered investment companies for which NBIA acts as investment manager and/or administrator. |
Chamaine Williams (1971) | | Chief Compliance Officer since 2005 | | Chief Compliance Officer — Mutual Funds and Senior Vice President, NBIA, since 2006; formerly, Senior Vice President, LBI, 2007 to 2008; formerly, Vice President, LBI, 2003 to 2006; formerly, Chief Compliance Officer, Lehman Brothers Asset Management Inc., 2003 to 2007; formerly, Chief Compliance Officer, Lehman Brothers Alternative Investment Management LLC, 2003 to 2007; Chief Compliance Officer, fifteen registered investment companies for which NBIA acts as investment manager and/or administrator. |
(1) The business address of each listed person is 1290 Avenue of the Americas, New York, NY 10104.
(2) Pursuant to the By-Laws of the Trust, each officer elected by the Trustees shall hold office until his or her successor shall have been elected and qualified or until his or her earlier death, inability to serve, or resignation. Officers serve at the pleasure of the Trustees and may be removed at any time with or without cause.
(3) Except as otherwise indicated, each individual has held the positions shown during at least the last five years
33
Proxy Voting Policies and Procedures
A description of the policies and procedures that the Trust uses to determine how to vote proxies relating to portfolio securities is available, without charge, by calling 800-877-9700 (toll-free) and on the Securities and Exchange Commission's website, at www.sec.gov. Information regarding how the Trust voted proxies relating to portfolio securities during the most recent 12-month period ended June 30 is also available upon request, without charge, by calling 800-877-9700 (toll-free), on the Securities and Exchange Commission's website at www.sec.gov, and on Management's website at www.nb.com.
Quarterly Portfolio Schedule
The Trust files a complete schedule of portfolio holdings for the Fund with the Securities and Exchange Commission for the first and third quarters of each fiscal year on Form N-Q. The Trust's Forms N-Q are available on the Securities and Exchange Commission's website at www.sec.gov and may be reviewed and copied at the Securities and Exchange Commission's Public Reference Room in Washington, DC. Information on the operation of the Public Reference Room may be obtained by calling 800-SEC-0330. The information on Form N-Q is available upon request, without charge, by calling 800-877-9700 (toll free).
Board Consideration of the Management Agreement
On an annual basis, the Board of Trustees (the "Board") of Neuberger Berman Advisers Management Trust (the "Trust"), including the Trustees who are not "interested persons" of Neuberger Berman Investment Advisers LLC ("Management") (including its affiliates) or the Trust ("Independent Fund Trustees"), considers whether to continue the management agreement with Management (the "Agreement") for Short Duration Bond Portfolio (the "Fund"). Throughout the process, the Independent Fund Trustees are advised by counsel that is experienced in Investment Company Act of 1940 matters and that is independent of Management ("Independent Counsel"). At a meeting held on October 18, 2016, the Board, including the Independent Fund Trustees, approved the continuation of the Agreement for the Fund.
In evaluating the Agreement, the Board, including the Independent Fund Trustees, reviewed extensive materials provided by Management in response to questions submitted by the Independent Fund Trustees and Independent Counsel, and met with senior representatives of Management regarding its personnel, operations and financial condition as they relate to the Fund. The annual contract review extends over at least two regular meetings of the Board to ensure that Management has time to respond to any questions the Independent Fund Trustees may have on their initial review of the materials and that the Independent Fund Trustees have time to consider those responses.
In connection with its deliberations, the Board also considered the broad range of information relevant to the annual contract review that is provided to the Board (including its various standing committees) at meetings throughout the year, including investment performance reports and related portfolio information for the Fund, as well as periodic reports on, among other matters, pricing and valuation; brokerage and execution; compliance; and shareholder and other services provided by Management and its affiliates. To assist the Board in its deliberations regarding the annual contract review, the Board has established a Contract Review Committee comprised of Independent Fund Trustees. The Board has also established other committees that focus throughout the year on specific areas relevant to the annual contract review, such as Fund performance or compliance matters, and that are charged with specific responsibilities regarding the annual contract review. Those committees provide reports that feed into the Contract Review Committee, which reviews and takes account of the information.
The Independent Fund Trustees received from Independent Counsel a memorandum discussing the legal standards for their consideration of the proposed continuation of the Agreement. During the course of the year and during their deliberations regarding the annual contract review, the Contract Review Committee and the Independent Fund Trustees met with Independent Counsel separately from representatives of Management.
34
In connection with its approval of the continuation of the Agreement, the Board evaluated the terms of the Agreement, the overall fairness of the Agreement to the Fund and whether the Agreement was in the best interests of the Fund and its shareholders. The Board considered all factors it deemed relevant with respect to the Fund, including the following factors: (1) the nature, extent, and quality of the services provided by Management; (2) the investment performance of the Fund compared to an appropriate market index and a peer group of investment companies; (3) the costs of the services provided and the profit or loss realized by Management and its affiliates from their relationship with the Fund; (4) the extent to which economies of scale have been or might be realized as the Fund grows; and (5) whether fee levels reflect any such potential economies of scale for the benefit of the Fund's shareholders. The Board's determination to approve the continuation of the Agreement was based on a comprehensive consideration of all information provided to the Board throughout the year and specifically in connection with the annual contract review. The Board members did not identify any particular information or factor that was all-important or controlling, and each Trustee may have attributed different weights to the various factors. The Board focused on the overall costs and benefits of the Agreement to the Fund and, through the Fund, its shareholders.
With respect to the nature, extent and quality of the services provided, the Board considered the investment philosophy and decision-making processes of Management, and the qualifications, experience, and capabilities of, and the resources available to, the portfolio management personnel of Management who perform services for the Fund. The Board noted that Management also provides certain administrative services, including fund accounting and compliance services. The Board also considered Management's policies and practices regarding brokerage and allocation of portfolio transactions and reviewed the quality of the execution services that Management had provided. The Board also considered that Management's responsibilities include daily management of investment, operational, enterprise, legal, regulatory and compliance risks as they relate to the Fund, and considered information regarding Management's processes for managing risk. In addition, the Board noted the positive compliance history of Management, as no significant compliance problems were reported to the Board with respect to either firm. The Board also considered the general structure of the portfolio manager compensation program and whether this structure provides appropriate incentives to act in the best interests of the Fund.
As in past years, the Board also considered the manner in which Management addressed various non-routine matters that arose during the year, some of them a result of developments in the broader fund industry or the regulations governing it. In addition, the Board considered actions taken by Management in response to recent market conditions, such as regulatory concerns about changes in fixed-income market liquidity and potential volatility, and considered the overall performance of Management in this context.
The Board factored into its evaluation of the Fund's fees and performance a consideration of the limitations inherent in the methodology for constructing peer groups and determining which investment companies should be included in the peer groups. The Board considered a peer group composed of two types of funds: proprietary funds that are operated by insurance companies or their affiliates, and non-proprietary funds, such as the Fund, operated for insurance company investors by independent investment managers.
With respect to investment performance, the Board considered information regarding the Fund's short, intermediate and long-term performance both on an absolute basis and relative to an appropriate benchmark index and the average performance of a composite peer group (as constructed by an independent organization) of investment companies pursuing broadly similar strategies. The Board also reviewed performance in relation to certain measures of the degree of investment risk undertaken by the portfolio managers. The Board considered that as compared to its peer group, the Fund's performance was lower than the median for the 1-year period, higher than the median for the 3 and 5-year periods, and equal to the median for the 10-year period. The Board also considered that the Fund's performance was lower than its benchmark for the 1, 3 and 10-year periods, but higher for the 5-year period. The Board discussed with Management the Fund's performance and steps that Management had taken, or intended to take, to improve performance. The Board also considered Management's responsiveness with respect to the Fund's lagging performance. In this regard, the Board noted that performance, especially short-term performance, is only one of the factors that it deems relevant to its consideration of the Fund's Agreement and that, after considering all relevant factors, it may be appropriate to approve the continuation of the Agreement notwithstanding the Fund's underperformance.
With respect to the overall fairness of the Agreement, the Board considered the fee structure for the Fund under the Agreement as compared to the peer group. The Board also considered any fall-out (i.e. indirect) benefits likely to accrue
35
to Management or its affiliates from their relationship with the Fund. The Board also considered the profitability of Management and its affiliates from their association with the Fund, and year-over-year changes in each of Management's reported expense categories.
The Board reviewed a comparison of the Fund's management fee and total expense ratio to the peer group and was aware that non-proprietary insurance product funds generally have higher fee structures than proprietary funds. The Board noted that the comparative management fee analysis includes, in the Fund's management fee, the separate administrative fee paid to Management, but it was not clear whether this was the case for all funds in the peer group. The Board compared the Fund's contractual and actual management fees to the mean and median of the contractual and actual management fees, respectively, of the Fund's peer group. (The actual management fees are the contractual management fees reduced by any fee waivers or other adjustments.) In addition, the Board considered the contractual limit on expenses of the Fund. The Board noted that Management incurred a loss on its management of the Fund during the review period.
The Board considered that, for the Fund's I Class shares, as compared to its peer group, the Fund's contractual management fee and the actual management fee were both higher than the respective medians. The Board considered whether specific portfolio management, administration or oversight needs contributed to the management fee. The Board also noted that the Fund's size, which impacts its expenses and performance, has been affected by ongoing changes in the insurance market.
The Board also considered whether there were other funds or separate accounts that were advised by Management or its affiliates with investment objectives, policies and strategies that were similar to those of the Fund. The Board compared the fees charged to the Fund to the fees charged to such funds and/or separate accounts. The Board considered the appropriateness and reasonableness of any differences between the fees charged to the Fund and such funds and/or separate accounts, including any breakpoints, and determined that differences in fees and fee structures were consistent with the management and other services provided.
The Board also evaluated any apparent or anticipated economies of scale in relation to the services Management provides to the Fund. The Board considered whether the Fund's fee structure provides for a reduction of payments resulting from the use of breakpoints and whether those breakpoints are set at appropriate asset levels. As in past years, the Board gave careful thought to the size of any breakpoints in the Fund's advisory fees and the asset levels at which they are set. It also considered whether the fees were set at an appropriate level and compared the fee structures to that of the peer group. The Board also considered that Management has provided, at no added cost to the Fund, certain additional services that were required by new regulations or regulatory interpretations, impelled by changes in the securities markets or the business landscape, and/or requested by the Board. In concluding that the benefits accruing to Management and its affiliates by virtue of their relationship with the Fund were reasonable in light of the costs of providing the investment advisory and other services and the benefits accruing to the Fund, the Board reviewed specific data as to Management's profitability on the Fund for a recent period. The Board also considered Management's cost allocation methodology. The Board recognized that Management should be entitled to earn a reasonable level of profits for services they provide to the Fund and, based on its review, concluded that Management's reported level of profitability on the Fund was reasonable.
Conclusions
In approving the continuation of the Agreement, the Board concluded that the terms of the Agreement are fair and reasonable to the Fund and that approval of the continuation of the Agreement is in the best interests of the Fund and its shareholders. In reaching this determination, the Board considered that Management could be expected to provide a high level of service to the Fund; regarding the Fund's underperformance, that it retained confidence in Management's capabilities to manage the Fund; that the Fund's fee structure appeared to the Board to be reasonable given the nature, extent and quality of services provided; and that the benefits accruing to Management and its affiliates by virtue of their relationship with the Fund were reasonable in light of the costs of providing the investment advisory and other services and the benefits accruing to the Fund. The Board's conclusions may be based in part on its consideration of materials prepared in connection with the approval or continuance of the Agreement in prior years and on the Board's ongoing regular review of Fund performance and operations throughout the year, in addition to material prepared specifically for the most recent annual review of the Agreement.
36
Neuberger Berman
Advisers Management Trust
Socially Responsive Portfolio
I Class Shares
S Class Shares
Annual Report
December 31, 2016
Socially Responsive Portfolio Commentary (Unaudited)
The Neuberger Berman Advisers Management Trust Socially Responsive Portfolio Class I generated a total return of 9.86% for the 12 months ended December 31, 2016, trailing the 11.96% return of its benchmark, the S&P 500® Index, for the same period. (Performance for all share classes is provided in the table immediately following the letter.)
The double-digit positive returns for the benchmark in 2016 masked considerable volatility throughout the year. Early on, fears of a slowing Chinese economy drove markets sharply downward; then in the second quarter, volatility increased in response to concerns of the potential impact of the "Brexit" vote. Volatility rose again around the timing of U.S. Federal Reserve (Fed) rate increases and finally as U.S. elections approached. As the year closed, U.S. markets recovered, reflecting the ongoing steady growth in the U.S. economy and corporate profits, low inflation, and post-election optimism around potential tax reform, infrastructure spending, and overall economic growth.
Within the portfolio, holdings in Industrials, Consumer Staples and Real Estate provided positive relative performance this year, while those in Financials, Telecommunication Services and Consumer Discretionary detracted. Top performers included Texas Instruments, Schlumberger and JP Morgan Chase. Detractors included Alliance Data Systems, BorgWarner, and Roche.
Leadership in Environmental, Social and Governance ("ESG") practices is one of several characteristics that we use to identify high quality companies. Conviction in the ability of these businesses to grow at an advantage to their peers is reflected in position sizes. While any given quarter can have shorter term factors that affect performance, during calendar 2016 the top ten positions in the portfolio which represented about 38% by weight contributed over 60% of the performance.
Given our focus on the long-term attractiveness of businesses, the year's volatility gave us opportunities to acquire companies that meet our business quality and ESG criteria at attractive valuations. We added Medtronic, Alphabet, JP Morgan Chase, Delphi Automotive, Weyerhaeuser, Motorola Solutions, Fortive, Praxair, Kroger, AmerisourceBergen, EQT Corp. and Novozymes. Generally, sales were based on valuation considerations, with names typically being returned to our prospect list. We sold Adobe, O'Reilly Automotive, PayPal, TJX Companies, Abbott Laboratories, BorgWarner, Fortive and Praxair.
Looking ahead, we anticipate the slow and positive growth trend to continue in the U.S. due to the following factors. Consumer spending, approximately two thirds of U.S. GDP, has remained strong as improving employment and wage growth has increased purchasing power and strengthened consumers' balance sheets. Oil and commodities prices have rebounded from their lows. While the dollar has strengthened approximately 5% from mid-year lows, this is much less a headwind than the double-digit appreciation we saw in 2014 and 2015. And finally, we anticipate the Fed will continue to be measured in raising rates.
Our primary concerns continue to be geopolitical. Internationally, these include the volatile environment in the Middle East, the widening foreign policy gulf between Russia and the West, the rise of populist parties in Europe in front of elections, and the uncertainty created by the Brexit vote. In addition, the lack of transparency into policy actions in China, the world's second largest economy, raises the risk of unintended consequences as the Chinese government struggles to strike a balance between curbing excessive speculation and sustainable long-term economic growth. Domestically, the lack of clarity on the new administration's trade and economic policies may also create volatility.
We believe our portfolio companies are positioned to do well in a variety of environments and that the operating characteristics inherent in the businesses we own can translate top-line growth in the low- to mid-single digits into stronger, advantaged bottom-line growth. Absent an exogenous shock, our outlook is for continued slow growth for the global economy, but we believe our portfolio holdings also have the balance sheet strength and free cash flow generation that could enable them to weather global economic turmoil, should it occur.
We look forward to continuing to serve your investment needs.
Sincerely,
Ingrid S. Dyott And Sajjad S. Ladiwala
Co-Portfolio Managers
Information about principal risks of investing in the Fund is set forth in the prospectus and statement of additional information.
The portfolio composition, industries and holdings of the Fund are subject to change without notice.
The opinions expressed are those of the Fund's portfolio managers. The opinions are as of the date of this report, and are subject to change without notice.
1
Socially Responsive Portfolio (Unaudited)
SECTOR ALLOCATION
(as a % of Total Investments*) | |
Consumer Discretionary | | | 7.2 | % |
Consumer Staples | | | 5.8 | |
Energy | | | 9.5 | |
Financials | | | 15.9 | |
Health Care | | | 15.3 | |
Industrials | | | 14.6 | |
Information Technology | | | 20.4 | |
Materials | | | 2.2 | |
Real Estate | | | 2.3 | |
Telecommunication Services | | | 2.3 | |
Utilities | | | 2.0 | |
Short-Term Investments | | | 2.5 | |
Total | | | 100.0 | % |
* Derivatives, if any, are excluded from this chart.
PERFORMANCE HIGHLIGHTS
| | Inception | | Average Annual Total Return
Ended 12/31/2016 | |
| | Date | | 1 Year | | 5 Years | | 10 Years | | Life of Fund | |
Socially Responsive
Portfolio Class I | | 02/18/1999 | | | 9.86 | % | | | 13.01 | % | | | 6.52 | % | | | 6.80 | % | |
Socially Responsive
Portfolio Class S2 | | 05/01/2006 | | | 9.64 | % | | | 12.80 | % | | | 6.37 | % | | | 6.72 | % | |
| S&P 500® Index1,3 | | | | | 11.96 | % | | | 14.66 | % | | | 6.95 | % | | | 5.42 | % | |
The performance data quoted represent past performance and do not indicate future results. Current performance may be lower or higher than the performance data quoted. For performance data current to the most recent month-end, please visit http://www.nb.com/amtportfolios/performance.
The results shown in the table reflect the reinvestment of income dividends and other distributions, if any. The results do not reflect the effect of taxes a shareholder would pay on Fund distributions or on the redemption of Fund shares. The results do not reflect fees and expenses of the variable annuity and variable life insurance policies or the qualified pension and retirement plans whose proceeds are invested in the Fund.
The investment return and principal value of an investment will fluctuate and shares, when redeemed, may be worth more or less than their original cost.
Returns would have been lower if Neuberger Berman Investment Advisers LLC ("Management") had not reimbursed certain expenses and/or waived a portion of the investment management fees during certain of the periods shown. Repayment by a class (of expenses previously reimbursed and/or fees previously waived by Management) will decrease the class's returns. Please see Note B in the Notes to Financial Statements for specific information regarding expense reimbursement and/or fee waiver arrangements.
As stated in the Fund's most recent prospectus, the total annual operating expense ratios for fiscal year 2015 were 0.98% and 1.23% for Class I and Class S shares, respectively (before expense reimbursements and/or fee waivers, if any). The expense ratio was 1.17% for Class S shares after expense reimbursements and/or fee waivers. The expense ratios for the annual period ended December 31, 2016 can be found in the Financial Highlights section of this report.
COMPARISON OF A $10,000 INVESTMENT
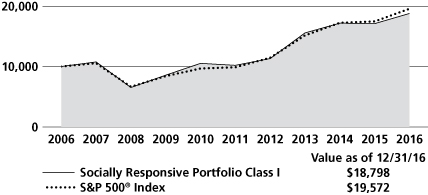
This graph shows the change in value of a hypothetical $10,000 investment in the Fund over the past 10 fiscal years, or since the Fund's inception, if it has not operated for 10 years. The graph is based on Class I shares only; the performance of the Fund's share classes will differ primarily due to different class expenses (see Performance Highlights chart above). The result is compared with benchmarks, which include a broad-based market index and may include a more narrowly based index. Market indices have not been reduced to reflect any of the fees and costs of investing. The results shown in the graph reflect the reinvestment of income dividends and other distributions, if any. The results do not reflect the effect of taxes a shareholder would pay on Fund distributions or on the redemption of Fund shares. The results do not reflect fees and expenses of the variable annuity and variable life insurance policies or the qualified pension and retirement plans whose proceeds are invested in the Fund. Results represent past performance and do not indicate future results.
Please see Endnotes for additional information.
2
1 The date used to calculate Life of Fund performance for the index is February 18, 1999, the inception date of the oldest share class.
2 Performance shown prior to May 1, 2006 for Class S shares is that of Class I shares, which has lower expenses and correspondingly higher returns than Class S shares.
3 The S&P 500® Index is a float-adjusted market capitalization-weighted index that focuses on the large-cap segment of the U.S. equity market, and includes a significant portion of the total value of the market. Please note that the index described in this report does not take into account any fees, expenses or tax consequences of investing in the individual securities that it tracks, and that individuals cannot invest directly in any index. Data about the performance of an index are prepared or obtained by Neuberger Berman Investment Advisers LLC* ("Management") and reflect the reinvestment of income dividends and other distributions, if any. The Fund may invest in securities not included in a described index and generally does not invest in all securities included in a described index.
* On January 1, 2016, Neuberger Berman Management LLC ("NBM") transferred to Neuberger Berman Fixed Income LLC ("NBFI") their rights and obligations pertaining to all services they provided to any Fund under any investment management, investment sub-advisory, and/or administration agreement, as applicable (the "Agreements"). Following such transfer, NBFI was renamed Neuberger Berman Investment Advisers LLC ("NBIA" or "Management"). Following the consolidation, the investment professionals of NBM who provided services to any Fund under the Agreements continue to provide the same services, except that they provide those services in their new capacities as investment professionals of NBIA. Further, the consolidation did not result in any change in the investment processes employed by any Fund, the nature or level of services provided to any Fund, or the fees any Fund pays under its Agreements.
On July 1, 2016, NBM was reorganized into "Neuberger Berman" (the "Reorganization"). Upon the completion of the Reorganization, Neuberger Berman assumed all rights and obligations pertaining to all services NBM provided to any Fund under any distribution agreement or distribution and services agreement (the "Agreements") or plan adopted pursuant to Rule 12b-1 under the Investment Company Act of 1940, as amended, (the "Plans"). Accordingly, after the Reorganization, Neuberger Berman became each Fund's distributor and the services previously provided by NBM under the Agreements and Plans are provided by Neuberger Berman.
Following the Reorganization, the employees of NBM provide the same services to each Fund under the Agreements and Plans, except that they provide those services in their capacities as employees of Neuberger Berman. Further, the Reorganization did not result in any change in the nature or level of services provided to each Fund, or the fees, if any, each Fund pays under the Agreements or the Plans.
Please note, effective July 1, 2016, Neuberger Berman Management LLC was reorganized with and into Neuberger Berman LLC, a registered broker-dealer, Member FINRA and the Fund's distributor, which changed its name to Neuberger Berman BD LLC on January 1, 2017.
The investments for the Fund are managed by the same portfolio manager(s) who manage(s) one or more other registered funds that have names, investment objectives and investment styles that are similar to those of the Fund. You should be aware that the Fund is likely to differ from those other mutual fund(s) in size, cash flow pattern and tax matters. Accordingly, the holdings and performance of the Fund can be expected to vary from those of the other mutual fund(s).
Shares of the separate Neuberger Berman Advisers Management Trust Portfolios, including the Fund, are not available to the general public. Shares of the Fund may be purchased only by life insurance companies to be held in their separate accounts, which fund variable annuity and variable life insurance policies, and by qualified pension and retirement plans.
Statistics and projections in this report are derived from sources deemed to be reliable but cannot be regarded as a representation of future results of the Fund. This report is prepared for the general information of shareholders and is not an offer of shares of the Fund. Shares are sold only through the currently effective prospectus, which must precede or accompany this report.
The "Neuberger Berman" name and logo and "Neuberger Berman Investment Advisers LLC" name are registered service marks of Neuberger Berman Group LLC. The individual Fund names in this piece are either service marks or registered service marks of Neuberger Berman Investment Advisers LLC, an affiliate of Neuberger Berman BD LLC, distributor, member FINRA.
© 2017 Neuberger Berman BD LLC, distributor. All rights reserved.
3
Information About Your Fund's Expenses (Unaudited)
As a Fund shareholder, you incur two types of costs: (1) transaction costs such as fees and expenses that are, or may be, imposed under your variable contract or qualified pension plan; and (2) ongoing costs, including management fees, distribution and/or service (12b-1) fees (if applicable), and other Fund expenses. This example is intended to help you understand your ongoing costs (in U.S. dollars) of investing in the Fund and compare these costs with the ongoing costs of investing in other mutual funds.
This table is designed to provide information regarding costs related to your investments. The following examples are based on an investment of $1,000 made at the beginning of the six month period ended December 31, 2016 and held for the entire period. The table illustrates the Fund's costs in two ways:
Actual Expenses and Performance: | | The first section of the table provides information about actual account values and actual expenses in dollars, based on the Fund's actual performance during the period indicated. You may use the information in this line, together with the amount you invested, to estimate the expenses you paid over the period. Simply divide your account value by $1,000 (for example, an $8,600 account value divided by $1,000 = 8.6), then multiply the result by the number in the first section of the table under the heading entitled "Expenses Paid During the Period" to estimate the expenses you paid over the period. | |
Hypothetical Example for
Comparison Purposes: | | The second section of the table provides information about hypothetical account values and hypothetical expenses based on the Fund's actual expense ratio and an assumed rate of return at 5% per year before expenses. This return is not the Fund's actual return. The hypothetical account values and expenses may not be used to estimate the actual ending account balance or expenses you paid for the period. You may use this information to compare the ongoing costs of investing in this Fund versus other funds. To do so, compare the expenses shown in this 5% hypothetical example with the 5% hypothetical examples that appear in the shareholder reports of other funds. | |
Please note that the expenses in the table are meant to highlight your ongoing costs only and do not include any transaction costs, such as fees and expenses that are, or may be imposed under your variable contract or qualified pension plan. Therefore, the information under the heading "Hypothetical (5% annual return before expenses)" is useful in comparing ongoing costs only, and will not help you determine the relative total costs of owning different funds. In addition, if these transaction costs were included, your costs would have been higher.
NEUBERGER BERMAN ADVISERS MANAGEMENT TRUST SOCIALLY RESPONSIVE PORTFOLIO
Actual | | Beginning Account
Value 7/1/16 | | Ending Account
Value 12/31/16 | | Expenses Paid During
the Period
7/1/16 – 12/31/16 | | Expense
Ratio | |
Class I | | $ | 1,000.00 | | | $ | 1,084.00 | | | $ | 5.19 | * | | | 0.99 | % | |
Class S | | $ | 1,000.00 | | | $ | 1,083.30 | | | $ | 6.18 | * | | | 1.18 | % | |
Hypothetical (5% annual return before expenses) | |
Class I | | $ | 1,000.00 | | | $ | 1,020.16 | | | $ | 5.03 | ** | | | 0.99 | % | |
Class S | | $ | 1,000.00 | | | $ | 1,019.20 | | | $ | 5.99 | ** | | | 1.18 | % | |
* For each class, expenses are equal to the annualized expense ratio for the class, multiplied by the average account value over the period, multiplied by 184/366 (to reflect the one-half year period shown).
** Hypothetical expenses are equal to the annualized expense ratios for each class, multiplied by the average account value over the period (assuming a 5% annual return), multiplied by 184/366 (to reflect the one-half year period shown).
4
Schedule of Investments Socially Responsive Portfolio 12/31/16
NUMBER OF SHARES | | | | VALUE | |
Common Stocks 97.6% | | | |
Airlines 2.2% | | | |
| | 107,740 | | | Ryanair Holdings PLC ADR | | $ | 8,970,432 | * | |
Auto Components 2.5% | | | |
| | 153,024 | | | Delphi Automotive PLC | | | 10,306,166 | | |
Banks 5.4% | | | |
| | 115,722 | | | JPMorgan Chase & Co. | | | 9,985,651 | | |
| | 233,708 | | | U.S. Bancorp | | | 12,005,580 | | |
| | | | 21,991,231 | | |
Capital Markets 3.0% | | | |
| | 215,930 | | | Intercontinental Exchange, Inc. | | | 12,182,771 | | |
Communications Equipment 3.2% | | | |
| | 80,733 | | | Motorola Solutions, Inc. | | | 6,691,958 | | |
| | 199,395 | | | NetScout Systems, Inc. | | | 6,280,943 | * | |
| | | | 12,972,901 | | |
Consumer Finance 2.8% | | | |
| | 153,733 | | | American Express Co. | | | 11,388,541 | | |
Diversified Telecommunication
Services 2.3% | | | |
| | 167,260 | | | Level 3 Communications, Inc. | | | 9,426,774 | * | |
Electric Utilities 2.0% | | | |
| | 145,104 | | | Eversource Energy | | | 8,014,094 | | |
Energy Equipment & Services 3.0% | | | |
| | 144,919 | | | Schlumberger Ltd. | | | 12,165,950 | | |
Equity Real Estate Investment Trust 2.3% | | | |
| | 307,834 | | | Weyerhaeuser Co. | | | 9,262,725 | | |
Food & Staples Retailing 2.3% | | | |
| | 272,155 | | | Kroger Co. | | | 9,392,069 | | |
Health Care Equipment & Supplies 8.8% | | | |
| | 89,798 | | | Becton, Dickinson & Co. | | | 14,866,059 | | |
| | 153,479 | | | Danaher Corp. | | | 11,946,805 | | |
| | 125,057 | | | Medtronic PLC | | | 8,907,810 | | |
| | | | 35,720,674 | | |
Health Care Providers & Services 4.6% | | | |
| | 161,567 | | | AmerisourceBergen Corp. | | | 12,632,924 | | |
| | 201,509 | | | Premier, Inc. Class A | | | 6,117,813 | * | |
| | | | 18,750,737 | | |
NUMBER OF SHARES | | | | VALUE | |
Household Durables 3.7% | | | |
| | 340,857 | | | Newell Brands, Inc. | | $ | 15,219,265 | | |
Industrial Conglomerates 2.0% | | | |
| | 46,034 | | | 3M Co. | | | 8,220,291 | | |
Insurance 4.7% | | | |
| | 539,749 | | | Progressive Corp. | | | 19,161,090 | | |
Internet Software & Services 5.2% | | | |
| | 12,121 | | | Alphabet, Inc. Class A | | | 9,605,286 | * | |
| | 385,523 | | | eBay, Inc. | | | 11,446,178 | * | |
| | | | 21,051,464 | | |
IT Services 4.1% | | | |
| | 35,877 | | | Alliance Data Systems Corp. | | | 8,197,895 | | |
| | 83,298 | | | MasterCard, Inc. Class A | | | 8,600,518 | | |
| | | | 16,798,413 | | |
Oil, Gas & Consumable Fuels 6.6% | | | |
| | 44,674 | | | Cimarex Energy Co. | | | 6,071,197 | | |
| | 120,219 | | | EQT Corp. | | | 7,862,322 | | |
| | 335,046 | | | Noble Energy, Inc. | | | 12,751,851 | | |
| | | | 26,685,370 | | |
Personal Products 3.5% | | | |
| | 345,071 | | | Unilever NV | | | 14,168,615 | | |
Pharmaceuticals 2.0% | | | |
| | 35,244 | | | Roche Holding AG | | | 8,050,432 | | |
Professional Services 4.0% | | | |
| | 75,860 | | | ManpowerGroup, Inc. | | | 6,741,678 | | |
| | 195,440 | | | Robert Half International, Inc. | | | 9,533,564 | | |
| | | | 16,275,242 | | |
Road & Rail 2.3% | | | |
| 97,691 | | | J.B. Hunt Transport
Services, Inc. | | | 9,482,865 | | |
Semiconductors & Semiconductor
Equipment 4.9% | | | |
| | 275,365 | | | Texas Instruments, Inc. | | | 20,093,384 | | |
Software 3.0% | | | |
| | 107,405 | | | Intuit, Inc. | | | 12,309,687 | | |
Specialty Chemicals 2.2% | | | |
| | 259,539 | | | Novozymes A/S B Shares | | | 8,948,354 | | |
See Notes to Financial Statements
5
Schedule of Investments Socially Responsive Portfolio (cont'd)
NUMBER OF SHARES | | | | VALUE | |
Textiles, Apparel & Luxury Goods 0.9% | | | |
| | 151,595 | | | Gildan Activewear, Inc. | | $ | 3,845,965 | | |
Trading Companies & Distributors 4.1% | | | |
| | 92,826 | | | NOW, Inc. | | | 1,900,148 | * | |
| | 63,840 | | | W.W. Grainger, Inc. | | | 14,826,840 | | |
| | | | 16,726,988 | | |
| | | | Total Common Stocks
(Cost $303,524,298) | | | 397,582,490 | | |
Short-Term Investments 2.5% | | | |
PRINCIPAL AMOUNT | | | | | |
Certificates of Deposit 0.1% | | | |
$ | 100,000 | | | Self Help Credit Union, 0.25%,
due 1/3/17 | | | 100,000 | | |
| 100,000 | | | Self Help Federal Credit Union,
0.68%, due 1/26/17 | | | 100,000 | | |
| | | | 200,000 | (a) | |
NUMBER OF SHARES | | | | | |
Investment Company 2.4% | | | |
| 9,761,614 | | | State Street Institutional
Treasury Money Market Fund
Premier Class, 0.39% | | | 9,761,614 | (b) | |
| | | | Total Short-Term Investments
(Cost $9,961,614) | | | 9,961,614 | | |
| | | | Total Investments 100.1%
(Cost $313,485,912) | | | 407,544,104 | | |
| | | | | Other Assets Less Liabilities (0.1)% | | | (296,204 | ) | |
| | | | | Net Assets 100.0% | | $ | 407,247,900 | | |
* Non-income producing security.
(a) At cost, which approximates market value.
(b) Represents 7-day effective yield as of 12/31/2016.
See Notes to Financial Statements
6
Schedule of Investments Socially Responsive Portfolio (cont'd)
The following is a summary, categorized by Level (see Note A of Notes to Financial Statements), of inputs used to value the Fund's investments as of December 31, 2016:
Asset Valuation Inputs | | Level 1 | | Level 2 | | Level 3 | | Total | |
Investments: | |
Common Stocks(a) | | $ | 397,582,490 | | | $ | — | | | $ | — | | | $ | 397,582,490 | | |
Short-Term Investments(a) | | | — | | | | 9,961,614 | | | | — | | | | 9,961,614 | | |
Total Investments | | $ | 397,582,490 | | | $ | 9,961,614 | | | $ | — | | | $ | 407,544,104 | | |
(a) The Schedule of Investments provides information on the industry categorization for the portfolio.
As of the year ended December 31, 2016, certain securities were transferred from one level (as of December 31, 2015) to another. Based on beginning of period market values as of January 1, 2016, $7,925,300 was transferred from Level 2 to Level 1. Interactive Data Pricing and Reference Data LLC ("Interactive") provided adjusted prices for these securities as of December 31, 2015, as stated in the description of the valuation methods of foreign equity securities in Note A of Notes to Financial Statements.
See Notes to Financial Statements
7
Statement of Assets and Liabilities
Neuberger Berman Advisers Management Trust
| | | SOCIALLY
RESPONSIVE
PORTFOLIO | |
| | | December 31, 2016 | |
Assets | |
Investments in securities, at value* (Note A)—see Schedule of Investments: | |
Unaffiliated issuers | | $ | 407,544,104 | | |
Dividends and interest receivable | | | 477,741 | | |
Receivable for Fund shares sold | | | 78,169 | | |
Prepaid expenses and other assets | | | 4,474 | | |
Total Assets | | | 408,104,488 | | |
Liabilities | |
Payable for securities purchased | | | 364,734 | | |
Payable for Fund shares redeemed | | | 88,904 | | |
Payable to investment manager (Note B) | | | 187,551 | | |
Payable to administrator-net (Note B) | | | 120,092 | | |
Accrued expenses and other payables | | | 95,307 | | |
Total Liabilities | | | 856,588 | | |
Net Assets | | $ | 407,247,900 | | |
Net Assets consist of: | |
Paid-in capital | | $ | 294,980,281 | | |
Undistributed net investment income (loss) | | | 2,176,673 | | |
Accumulated net realized gains (losses) on investments | | | 16,048,500 | | |
Net unrealized appreciation (depreciation) in value of investments | | | 94,042,446 | | |
Net Assets | | $ | 407,247,900 | | |
Net Assets | |
Class I | | $ | 329,067,444 | | |
Class S | | | 78,180,456 | | |
Shares Outstanding ($.001 par value; unlimited shares authorized) | |
Class I | | | 14,581,532 | | |
Class S | | | 3,450,593 | | |
Net Asset Value, offering and redemption price per share | |
Class I | | $ | 22.57 | | |
Class S | | | 22.66 | | |
*Cost of Investments | | $ | 313,485,912 | | |
See Notes to Financial Statements
8
Neuberger Berman Advisers Management Trust
| | SOCIALLY
RESPONSIVE
PORTFOLIO | |
| | For the
Year Ended
December 31, 2016 | |
Investment Income: | |
Income (Note A): | |
Dividend income—unaffiliated issuers | $ | 6,226,514 | |
Interest income—unaffiliated issuers | | 17,495 | |
Foreign taxes withheld (Note A) | | (116,914 | ) |
Total income | $ | 6,127,095 | |
Expenses: | |
Investment management fees (Note B) | | 2,083,765 | |
Administration fees (Note B): | |
Class I | | 931,724 | |
Class S | | 223,285 | |
Distribution fees (Note B): | |
Class S | | 186,070 | |
Audit fees | | 46,560 | |
Custodian and accounting fees | | 112,912 | |
Insurance expense | | 13,043 | |
Legal fees | | 225,306 | |
Shareholder reports | | 116,015 | |
Trustees' fees and expenses | | 55,272 | |
Interest expense | | 176 | |
Miscellaneous | | 27,673 | |
Total expenses | | 4,021,801 | |
Expenses reimbursed by Management (Note B) | | (54,583 | ) |
Total net expenses | | 3,967,218 | |
Net investment income (loss) | $ | 2,159,877 | |
Realized and Unrealized Gain (Loss) on Investments (Note A): | |
Net realized gain (loss) on: | |
Sales of investment securities of unaffiliated issuers | | 16,753,279 | |
Foreign currency | | 18,178 | |
Change in net unrealized appreciation (depreciation) in value of: | |
Unaffiliated investment securities | | 17,723,320 | |
Foreign currency | | (3,853 | ) |
Net gain (loss) on investments | | 34,490,924 | |
Net increase (decrease) in net assets resulting from operations | $ | 36,650,801 | |
See Notes to Financial Statements
9
Statements of Changes in Net Assets
Neuberger Berman Advisers Management Trust
| | | SOCIALLY RESPONSIVE
PORTFOLIO | |
| | | Year Ended
December 31,
2016 | | Year Ended
December 31,
2015 | |
Increase (Decrease) in Net Assets: | |
From Operations: | |
Net investment income (loss) (Note A) | | $ | 2,159,877 | | | $ | 2,570,078 | | |
Net realized gain (loss) on investments (Note A) | | | 16,771,457 | | | | 13,698,429 | | |
Change in net unrealized appreciation (depreciation) of investments (Note A) | | | 17,719,467 | | | | (18,197,876 | ) | |
Net increase (decrease) in net assets resulting from operations | | | 36,650,801 | | | | (1,929,369 | ) | |
Distributions to Shareholders From (Note A): | |
Net investment income: | |
Class I | | | (2,189,849 | ) | | | (1,784,606 | ) | |
Class S | | | (369,048 | ) | | | (243,770 | ) | |
Net realized gain on investments: | |
Class I | | | (11,244,225 | ) | | | (28,214,516 | ) | |
Class S | | | (2,715,281 | ) | | | (6,891,832 | ) | |
Total distributions to shareholders | | | (16,518,403 | ) | | | (37,134,724 | ) | |
From Fund Share Transactions (Note D): | |
Proceeds from shares sold: | |
Class I | | | 12,634,893 | | | | 31,304,486 | | |
Class S | | | 7,310,759 | | | | 5,362,023 | | |
Proceeds from reinvestment of dividends and distributions: | |
Class I | | | 13,434,074 | | | | 29,999,122 | | |
Class S | | | 3,084,329 | | | | 7,135,602 | | |
Payments for shares redeemed: | |
Class I | | | (21,038,136 | ) | | | (23,488,301 | ) | |
Class S | | | (10,854,996 | ) | | | (11,007,356 | ) | |
Net increase (decrease) from Fund share transactions | | | 4,570,923 | | | | 39,305,576 | | |
Net Increase (Decrease) in Net Assets | | | 24,703,321 | | | | 241,483 | | |
Net Assets: | |
Beginning of year | | | 382,544,579 | | | | 382,303,096 | | |
End of year | | $ | 407,247,900 | | | $ | 382,544,579 | | |
Undistributed net investment income (loss) at end of year | | $ | 2,176,673 | | | $ | 2,557,515 | | |
See Notes to Financial Statements
10
Notes to Financial Statements Socially Responsive Portfolio
Note A—Summary of Significant Accounting Policies:
1 General: Neuberger Berman Advisers Management Trust (the "Trust") is a Delaware statutory trust organized pursuant to an Amended and Restated Trust Instrument dated March 27, 2014. The Trust is currently comprised of eight separate operating series (each individually a "Fund," and collectively the "Funds") each of which is diversified. The Trust is registered as an open-end management investment company under the Investment Company Act of 1940, as amended (the "1940 Act"), and its shares are registered under the Securities Act of 1933, as amended. Neuberger Berman Advisers Management Trust Socially Responsive Portfolio (the "Fund") currently offers Class I and Class S shares. The Trust's Board of Trustees (the "Board") may establish additional series or classes of shares without the approval of shareholders.
The assets of each Fund belong only to that Fund, and the liabilities of each Fund are borne solely by that Fund and no other.
The Fund is an investment company and accordingly follows the investment company accounting and reporting guidance of the Financial Accounting Standards Board ("FASB") Accounting Standard Codification Topic 946 "Financial Services—Investment Companies."
The preparation of financial statements in accordance with U.S. generally accepted accounting principles ("GAAP") requires Neuberger Berman Investment Advisers LLC ("NBIA" or "Management") to make estimates and assumptions at the date of the financial statements. Actual results could differ from those estimates.
Shares of the Fund are not available to the general public and may be purchased only by life insurance companies to serve as an investment vehicle for premiums paid under their variable annuity and variable life insurance contracts and to certain qualified pension and other retirement plans.
2 Portfolio valuation: In accordance with Accounting Standards Codification ("ASC") 820 "Fair Value Measurement" ("ASC 820"), all investments held by the Fund are carried at the value that Management believes the Fund would receive upon selling an investment in an orderly transaction to an independent buyer in the principal or most advantageous market for the investment under current market conditions. Various inputs, including the volume and level of activity for the asset or liability in the market, are considered in valuing the Fund's investments, some of which are discussed below. Significant Management judgment may be necessary to value investments in accordance with ASC 820.
ASC 820 established a three-tier hierarchy of inputs to create a classification of value measurements for disclosure purposes. The three-tier hierarchy of inputs is summarized in the three broad Levels listed below.
• Level 1—quoted prices in active markets for identical investments
• Level 2—other observable inputs (including quoted prices for similar investments, interest rates, prepayment speeds, credit risk, amortized cost, etc.)
• Level 3—unobservable inputs (including the Fund's own assumptions in determining the fair value of investments)
The inputs or methodology used for valuing an investment are not necessarily an indication of the risk associated with investing in those securities.
The value of the Fund's investments in equity securities, for which market quotations are readily available, is generally determined by Management by obtaining valuations from independent pricing services based on the latest sale price quoted on a principal exchange or market for that security (Level 1 inputs). Securities traded primarily on the NASDAQ Stock Market are normally valued at the NASDAQ Official Closing Price ("NOCP") provided by NASDAQ each business day. The NOCP is the most recently reported price as of 4:00:02 p.m., Eastern
11
Time, unless that price is outside the range of the "inside" bid and asked prices (i.e., the bid and asked prices that dealers quote to each other when trading for their own accounts); in that case, NASDAQ will adjust the price to equal the inside bid or asked price, whichever is closer. Because of delays in reporting trades, the NOCP may not be based on the price of the last trade to occur before the market closes. If there is no sale of a security on a particular day, the independent pricing services may value the security based on market quotations.
Management has developed a process to periodically review information provided by independent pricing services for all types of securities.
Certificates of deposit are valued at amortized cost.
Investments in non-exchange traded investment companies are valued using the respective fund's daily calculated net asset value per share (Level 2 inputs).
If a valuation is not available from an independent pricing service, or if Management has reason to believe that the valuation received does not represent the amount the Fund might reasonably expect to receive on a current sale in an orderly transaction, Management seeks to obtain quotations from brokers or dealers (generally considered Level 2 or Level 3 inputs depending on the number of quotes available). If such quotations are not readily available, the security is valued using methods the Board has approved in the good-faith belief that the resulting valuation will reflect the fair value of the security. Numerous factors may be considered when determining the fair value of a security based on Level 2 or Level 3 inputs, including available analyst, media or other reports, securities within the same industry with recent highly correlated performance, trading in futures or American Depositary Receipts ("ADRs") and whether the issuer of the security being fair valued has other securities outstanding.
The value of the Fund's investments in foreign securities is generally determined using the same valuation methods and inputs as other Fund investments, as discussed above. Foreign security prices expressed in local currency values are normally translated from the local currency into U.S. dollars using the exchange rates as of 4:00 p.m. Eastern Time on days the New York Stock Exchange ("NYSE") is open for business. The Board has approved the use of Interactive to assist in determining the fair value of foreign equity securities when changes in the value of a certain index suggest that the closing prices on the foreign exchanges may no longer represent the amount that the Fund could expect to receive for those securities or on days when foreign markets are closed and U.S. markets are open. In each of these events, Interactive will provide adjusted prices for certain foreign equity securities using a statistical analysis of historical correlations of multiple factors (Level 2 inputs). In the absence of precise information about the market values of these foreign securities as of the time as of which a Fund's share price is calculated, the Board has determined on the basis of available data that prices adjusted in this way are likely to be closer to the prices the Fund could realize on a current sale than are the prices of those securities established at the close of the foreign markets in which the securities primarily trade.
Fair value prices are necessarily estimates, and there is no assurance that such a price will be at or close to the price at which the security is next quoted or next trades.
3 Foreign currency translation: The accounting records of the Fund are maintained in U.S. dollars. Foreign currency amounts are normally translated into U.S. dollars using the exchange rate as of 4:00 p.m. Eastern Time, on days the NYSE is open for business to determine the value of investments, other assets and liabilities. Purchase and sale prices of securities, and income and expenses, are translated into U.S. dollars at the prevailing rate of exchange on the respective dates of such transactions. Net unrealized foreign currency gain (loss), if any, arises from changes in the value of assets and liabilities, other than investments in securities, as a result of changes in exchange rates and is stated separately in the Statement of Operations.
4 Securities transactions and investment income: Securities transactions are recorded on trade date for financial reporting purposes. Dividend income is recorded on the ex-dividend date or, for certain foreign dividends, as soon as the Fund becomes aware of the dividends. Non-cash dividends included in dividend income, if any, are recorded at the fair market value of the securities received. Interest income, including accretion of original issue discount, where applicable, and accretion of discount on short-term investments, if any, is recorded on the accrual basis.
12
Realized gains and losses from securities transactions and foreign currency transactions, if any, are recorded on the basis of identified cost and stated separately in the Statement of Operations.
5 Income tax information: Each Fund is treated as a separate entity for U.S. federal income tax purposes. It is the policy of the Fund to continue to qualify for treatment as a regulated investment company ("RIC") by complying with the requirements of the U.S. Internal Revenue Code applicable to RICs and to distribute substantially all of its net investment income and net realized capital gains to its shareholders. To the extent the Fund distributes substantially all of its net investment income and net realized capital gains to shareholders, no federal income or excise tax provision is required.
The Fund has adopted the provisions of ASC 740 "Income Taxes" ("ASC 740"). ASC 740 sets forth a minimum threshold for financial statement recognition of a tax position taken, or expected to be taken, in a tax return. The Fund recognizes interest and penalties, if any, related to unrecognized tax positions as an income tax expense in the Statement of Operations. The Fund is subject to examination by U.S. federal and state tax authorities for returns filed for the tax years for which the applicable statutes of limitations have not yet expired. As of December 31, 2016, the Fund did not have any unrecognized tax positions.
At December 31, 2016, the cost of investments for U.S. federal income tax basis was $313,873,340. Gross unrealized appreciation of investments was $98,045,222 and gross unrealized depreciation of investments was $4,374,458 resulting in net unrealized appreciation of $93,670,764 based on cost for U.S. federal income tax purposes.
Income distributions and capital gain distributions are determined in accordance with income tax regulations, which may differ from GAAP. These differences are primarily due to differing treatments of income and gains on various investment securities held by the Fund, timing differences and differing characterization of distributions made by the Fund. The Fund may also utilize earnings and profits distributed to shareholders on redemption of their shares as a part of the dividends-paid deduction for income tax purposes.
As determined on December 31, 2016, permanent differences resulting primarily from different book and tax accounting were reclassified at year end. Such differences are attributed to the tax treatment of foreign currency gains and losses. These reclassifications had no effect on net income, net asset value ("NAV") or NAV per share of the Fund. For the year ended December 31, 2016, the Fund recorded the following permanent reclassifications:
| Paid-in Capital | | Undistributed
Net Investment
Income (Loss) | | Accumulated
Net Realized
Gains (Losses)
on Investments | |
| $ | — | | | $ | 18,178 | | | $ | (18,178 | ) | |
The tax character of distributions paid during the years ended December 31, 2016 and December 31, 2015 was as follows:
Distributions Paid From: | |
Ordinary Income | | Long-Term Capital Gain | | Total | |
| 2016 | | 2015 | | 2016 | | 2015 | | 2016 | | 2015 | |
| $ | 2,558,897 | | | $ | 2,028,376 | | | $ | 13,959,506 | | | $ | 35,106,348 | | | $ | 16,518,403 | | | $ | 37,134,724 | | |
As of December 31, 2016, the components of distributable earnings (accumulated losses) on a U.S. federal income tax basis were as follows:
Undistributed
Ordinary
Income | | Undistributed
Long-Term
Capital Gain | | Unrealized
Appreciation/
(Depreciation) | | Loss
Carryforwards
and Deferrals | | Other
Temporary
Differences | | Total | |
| $ | 3,250,827 | | | $ | 15,361,774 | | | $ | 93,655,018 | | | $ | — | | | $ | — | | | $ | 112,267,619 | | |
The temporary differences between book basis and tax basis distributable earnings are primarily due to losses disallowed and recognized on wash sales.
13
6 Distributions to shareholders: The Fund may earn income, net of expenses, daily on its investments. Distributions from net investment income and net realized capital gains, if any, are generally distributed once a year (usually in October). Income distributions and capital gain distributions to shareholders are recorded on the ex-date.
It is the policy of the Fund to pass through to its shareholders substantially all real estate investment trust ("REIT") distributions and other income it receives, less operating expenses. The distributions the Fund receives from REITs are generally composed of income, capital gains, and/or return of REIT capital, but the REITs do not report this information to the Fund until the following calendar year. At December 31, 2016, the Fund estimated these amounts within the financial statements because the information is not available from the REITs until after the Fund's fiscal period. For the year ended December 31, 2016, the character of distributions paid to shareholders disclosed within the Statements of Changes in Net Assets is based on estimates made at that time. All estimates are based upon REIT information sources available to the Fund together with actual IRS Forms 1099-DIV received to date. Based on past experience it is possible that a portion of the Fund's distributions during the current fiscal year will be considered tax return of capital, but the actual amount of the tax return of capital, if any, is not determinable until after the Fund's fiscal year-end. After calendar year-end, when the Fund learns the nature of the distributions paid by REITs during that year, distributions previously identified as income are often re-characterized as return of capital and/or capital gain. After all applicable REITs have informed the Fund of the actual breakdown of distributions paid to the Fund during its fiscal year, estimates previously recorded are adjusted on the books of the Fund to reflect actual results. As a result, the composition of the Fund's distributions as reported herein may differ from the final composition determined after calendar year-end and reported to Fund shareholders on IRS Form 1099-DIV.
7 Foreign taxes: Foreign taxes withheld, if any, represent amounts withheld by foreign tax authorities, net of refunds recoverable.
8 Expense allocation: Certain expenses are applicable to multiple funds within the complex of related investment companies. Expenses directly attributable to a Fund are charged to that Fund. Expenses of the Trust that are not directly attributable to a particular series of the Trust (e.g., the Fund) are allocated among the series of the Trust, on the basis of relative net assets, except where a more appropriate allocation of expenses to each of the series can otherwise be made fairly. Expenses borne by the complex of related investment companies, which includes open-end and closed-end investment companies for which Management serves as investment manager, that are not directly attributable to a particular investment company in the complex (e.g., the Trust) or series thereof are allocated among the investment companies in the complex or series thereof on the basis of relative net assets, except where a more appropriate allocation of expenses to each of the investment companies in the complex or series thereof can otherwise be made fairly. The Fund's expenses (other than those specific to each class) are allocated proportionally each day among the classes based upon the relative net assets of each class.
9 Investments in foreign securities: Investing in foreign securities may involve sovereign and other risks, in addition to the credit and market risks normally associated with domestic securities. These additional risks include the possibility of adverse political and economic developments (including political instability, nationalization, expropriation, or confiscatory taxation) and the potentially adverse effects of unavailability of public information regarding issuers, less governmental supervision and regulation of financial markets, reduced liquidity of certain financial markets, and the lack of uniform accounting, auditing, and financial reporting standards or the application of standards that are different or less stringent than those applied in the United States. Foreign securities also may experience greater price volatility, higher rates of inflation, and delays in settlement.
10 Indemnifications: Like many other companies, the Trust's organizational documents provide that its officers ("Officers") and trustees ("Trustees") are indemnified against certain liabilities arising out of the performance of their duties to the Trust. In addition, both in some of its principal service contracts and in the normal course of its business, the Trust enters into contracts that provide indemnifications to other parties for certain types of losses or liabilities. The Trust's maximum exposure under these arrangements is unknown as this could involve future claims against the Trust.
14
11 Other: All net investment income and realized and unrealized capital gains and losses of the Fund are allocated, on the basis of relative net assets, pro rata among its respective classes.
Note B—Investment Management Fees, Administration Fees, Distribution Arrangements, and Other Transactions with Affiliates:
The Fund retains Management as its investment manager under a Management Agreement. For such investment management services, the Fund pays Management a fee at the annual rate of 0.55% of the first $250 million of the Fund's average daily net assets, 0.525% of the next $250 million, 0.50% of the next $250 million, 0.475% of the next $250 million, 0.45% of the next $500 million, 0.425% of the next $2.5 billion, and 0.40% of average daily net assets in excess of $4 billion. Accordingly, for the year ended December 31, 2016, the investment management fee pursuant to the Management Agreement was equivalent to an annual effective rate of 0.54% of the Fund's average daily net assets.
The Fund retains Management as its administrator under an Administration Agreement. Each class pays Management an administration fee at the annual rate of 0.30% of its average daily net assets under this agreement. Additionally, Management retains State Street Bank and Trust Company ("State Street") as its sub-administrator under a Sub-Administration Agreement. Management pays State Street a fee for all services received under this agreement.
Neuberger Berman BD LLC (the "Distributor") is the Fund's "principal underwriter" within the meaning of the 1940 Act. It acts as agent in arranging for the sale of the Fund's Class I shares without sales commission or other compensation and bears all advertising and promotion expenses incurred in the sale of those shares. The Board adopted a non-fee distribution plan for the Fund's Class I.
The Board has adopted a distribution and shareholder services plan (the "Plan") for Class S shares pursuant to Rule 12b-1 under the 1940 Act. The Plan provides that, for its activities and expenses related to the sale and distribution of Class S, and ongoing services provided to investors in the class, the Distributor receives from Class S a fee at the annual rate of 0.25% of Class S's average daily net assets. Distributor may pay a portion of the proceeds from the 12b-1 fee to insurance companies or their affiliates and qualified plan administrators ("intermediaries") for services they provide respecting the Fund to current and prospective variable contract owners and qualified plan participants that invest in the Fund through the intermediaries. Those institutions may use the payments for, among other purposes, compensating employees engaged in sales and/or shareholder servicing. The amount of fees paid by the class during any year may be more or less than the cost of distribution and other services provided to the class. FINRA rules limit the amount of annual distribution fees that may be paid by a mutual fund and impose a ceiling on the cumulative distribution fees paid. The Plan complies with those rules.
Management has contractually agreed to waive fees and/or reimburse the Fund's Class I and Class S shares so that the total annual operating expenses of those classes do not exceed the expense limitations as detailed in the following table. These undertakings exclude interest (commitment fees relating to borrowings are treated as interest for purposes of this exclusion), taxes, transaction costs, brokerage commissions, dividend and interest expenses relating to short sales, acquired fund fees and expenses and extraordinary expenses, if any; consequently, net expenses may exceed the contractual expense limitations. The Fund has agreed that each of its classes will repay Management for fees and expenses waived or reimbursed for that class provided that repayment does not cause that class's annual operating expenses to exceed its contractual expense limitation in place at the time the fees and expenses were waived or reimbursed, or the expense limitation in place at the time the Fund repays Management, whichever is lower. Any such repayment must be made within three years after the year in which Management incurred the expense.
During the year ended December 31, 2016, there was no repayment to Management under its contractual expense limitation.
15
At December 31, 2016, the Fund's contingent liabilities to Management under its contractual expense limitation were as follows:
| | | | | | | Expenses Reimbursed in
Fiscal Year Ending December 31, | |
| | | | | | | 2014 | | 2015 | | 2016 | |
| | | | | | | Subject to Repayment Until December 31, | |
| | | Contractual
Expense
Limitation(a) | | Expiration | | 2017 | | 2018 | | 2019 | |
Class I | | | 1.30 | % | | 12/31/19 | | $ | — | | | $ | — | | | $ | — | | |
Class S | | | 1.17 | % | | 12/31/19 | | | 45,262 | | | | 46,514 | | | | 54,583 | | |
(a) Expense limitation per annum of the respective class's average daily net assets.
Neuberger Berman LLC ("Neuberger") was retained by Management through December 31, 2015, pursuant to a Sub-Advisory Agreement to furnish it with investment recommendations and research information without added cost to the Fund. Several individuals who are Officers and/or Trustees of the Trust are also employees of Neuberger and/or Management. As a result of the entity consolidation described on page 3 of this Annual Report, the services previously provided by Neuberger under the Sub-Advisory Agreement are being provided by NBIA as of January 1, 2016.
Note C—Securities Transactions:
During the year ended December 31, 2016, there were purchase and sale transactions (excluding short-term securities) of $116,304,041 and $122,209,776, respectively.
During the year ended December 31, 2016, no brokerage commissions on securities transactions were paid to affiliated brokers.
Note D—Fund Share Transactions:
Share activity for the years ended December 31, 2016 and December 31, 2015 was as follows:
For the Year Ended December 31, 2016
| | | Shares Sold | | Shares Issued on
Reinvestment of
Dividends and
Distributions | | Shares
Redeemed | | Total | |
Class I | | | 588,560 | | | | 626,297 | | | | (967,764 | ) | | | 247,093 | | |
Class S | | | 327,963 | | | | 143,191 | | | | (498,504 | ) | | | (27,350 | ) | |
For the Year Ended December 31, 2015
| | | Shares Sold | | Shares Issued on
Reinvestment of
Dividends and
Distributions | | Shares
Redeemed | | Total | |
Class I | | | 1,316,233 | | | | 1,403,796 | | | | (1,003,193 | ) | | | 1,716,836 | | |
Class S | | | 227,843 | | | | 332,662 | | | | (469,015 | ) | | | 91,490 | | |
16
Note E—Line of Credit:
At December 31, 2016, the Fund was a participant in a syndicated committed, unsecured $700,000,000 line of credit (the "Credit Facility"), to be used only for temporary or emergency purposes. Series of other investment companies managed by Management also participate in this line of credit on substantially the same terms except that some do not have access to the full amount of the Credit Facility. Interest is charged on borrowings under this Credit Facility at the higher of (a) a federal funds effective rate plus 1.00% per annum or (b) a Eurodollar rate for a one-month period plus 1.00% per annum. The Credit Facility has an annual commitment fee of 0.15% per annum of the available line of credit, which is paid quarterly. The Fund has agreed to pay its pro rata share of the annual commitment fee, based on the ratio of its individual net assets to the net assets of all participants at the time the fee is due and payable and the level of its access to the Credit Facility, and interest charged on any borrowing made by the Fund and other costs incurred by the Fund. Because several mutual funds participate in the Credit Facility, there is no assurance that the Fund will have access to all or any part of the $700,000,000 at any particular time. There were no loans outstanding under the Credit Facility at December 31, 2016. During the period ended December 31, 2016, the Fund did not utilize the Credit Facility.
Note F—Recent Accounting Pronouncement:
In October 2016, the U.S. Securities and Exchange Commission ("SEC") adopted new rules and forms, and amendments to certain current rules and forms, to modernize reporting and disclosure of information by registered investment companies. The amendments to Regulation S-X will require standardized, enhanced disclosure about derivatives in investment company financial statements, and will also change the rules governing the form and content of such financial statements. The compliance date for the amendments to Regulation S-X is August 1, 2017. Management is currently evaluating the impact that the adoption of the amendments to Regulation S-X will have on the Fund's financial statements and related disclosures.
17
Socially Responsive Portfolio
The following tables include selected data for a share outstanding throughout each year and other performance information derived from the Financial Statements. Amounts that do not round to $0.01 or $(0.01) per share are presented as $0.00 or $(0.00), respectively. Ratios that do not round to 0.01% or (0.01)% are presented as 0.00% or (0.00)%, respectively. A "—" indicates that the line item was not applicable in the corresponding period.
Class I | |
| | | Year Ended December 31, | |
| | | 2016 | | 2015 | | 2014 | | 2013 | | 2012 | |
Net Asset Value, Beginning of Year | | $ | 21.46 | | | $ | 23.88 | | | $ | 21.72 | | | $ | 15.89 | | | $ | 14.35 | | |
Income From Investment Operations: | |
| Net Investment Income (Loss)@ | | | 0.13 | | | | 0.16 | | | | 0.15 | | | | 0.09 | | | | 0.15 | | |
Net Gains or Losses on Securities
(both realized and unrealized) | | | 1.94 | | | | (0.28 | ) | | | 2.10 | | | | 5.87 | | | | 1.43 | | |
Total From Investment Operations | | | 2.07 | | | | (0.12 | ) | | | 2.25 | | | | 5.96 | | | | 1.58 | | |
Less Distributions From: | |
Net Investment Income | | | (0.16 | ) | | | (0.14 | ) | | | (0.09 | ) | | | (0.13 | ) | | | (0.04 | ) | |
Net Capital Gains | | | (0.80 | ) | | | (2.16 | ) | | | — | | | | — | | | | — | | |
Total Distributions | | | (0.96 | ) | | | (2.30 | ) | | | (0.09 | ) | | | (0.13 | ) | | | (0.04 | ) | |
Voluntary Contribution from Management | | | — | | | | — | | | | 0.00 | | | | — | | | | — | | |
Net Asset Value, End of Year | | $ | 22.57 | | | $ | 21.46 | | | $ | 23.88 | | | $ | 21.72 | | | $ | 15.89 | | |
| Total Return† | | | 9.86 | % | | | (0.46 | )%^ | | | 10.38 | %µ | | | 37.60 | % | | | 10.98 | % | |
Ratios/Supplemental Data | |
Net Assets, End of Year (in millions) | | $ | 329.1 | | | $ | 307.6 | | | $ | 301.3 | | | $ | 244.2 | | | $ | 148.7 | | |
| Ratio of Gross Expenses to Average Net Assets# | | | 1.00 | % | | | 0.98 | % | | | 0.98 | % | | | 0.99 | % | | | 1.03 | % | |
Ratio of Net Expenses to Average Net Assets | | | 1.00 | % | | | 0.98 | % | | | 0.98 | % | | | 0.99 | % | | | 1.03 | %§ | |
Ratio of Net Investment Income (Loss) to Average
Net Assets | | | 0.59 | % | | | 0.70 | % | | | 0.68 | % | | | 0.49 | % | | | 0.98 | % | |
Portfolio Turnover Rate | | | 31 | % | | | 24 | % | | | 37 | % | | | 29 | % | | | 30 | % | |
See Notes to Financial Highlights
18
Financial Highlights (cont'd)
Class S | |
| | | Year Ended December 31, | |
| | | 2016 | | 2015 | | 2014 | | 2013 | | 2012 | |
Net Asset Value, Beginning of Year | | $ | 21.54 | | | $ | 23.93 | | | $ | 21.76 | | | $ | 15.92 | | | $ | 14.39 | | |
Income From Investment Operations: | |
| Net Investment Income (Loss)@ | | | 0.09 | | | | 0.12 | | | | 0.12 | | | | 0.06 | | | | 0.13 | | |
Net Gains or Losses on Securities
(both realized and unrealized) | | | 1.94 | | | | (0.27 | ) | | | 2.08 | | | | 5.89 | | | | 1.42 | | |
Total From Investment Operations | | | 2.03 | | | | (0.15 | ) | | | 2.20 | | | | 5.95 | | | | 1.55 | | |
Less Distributions From: | |
Net Investment Income | | | (0.11 | ) | | | (0.08 | ) | | | (0.03 | ) | | | (0.11 | ) | | | (0.02 | ) | |
Net Capital Gains | | | (0.80 | ) | | | (2.16 | ) | | | — | | | | — | | | | — | | |
Total Distributions | | | (0.91 | ) | | | (2.24 | ) | | | (0.03 | ) | | | (0.11 | ) | | | (0.02 | ) | |
Voluntary Contribution from Management | | | — | | | | — | | | | 0.00 | | | | — | | | | — | | |
Net Asset Value, End of Year | | $ | 22.66 | | | $ | 21.54 | | | $ | 23.93 | | | $ | 21.76 | | | $ | 15.92 | | |
| Total Return† | | | 9.64 | % | | | (0.59 | )%^ | | | 10.11 | %µ | | | 37.41 | % | | | 10.74 | % | |
Ratios/Supplemental Data | |
Net Assets, End of Year (in millions) | | $ | 78.2 | | | $ | 74.9 | | | $ | 81.1 | | | $ | 80.7 | | | $ | 66.7 | | |
| Ratio of Gross Expenses to Average Net Assets# | | | 1.25 | % | | | 1.23 | % | | | 1.23 | % | | | 1.24 | % | | | 1.28 | % | |
Ratio of Net Expenses to Average Net Assets | | | 1.17 | % | | | 1.17 | % | | | 1.17 | % | | | 1.17 | % | | | 1.17 | %§ | |
Ratio of Net Investment Income (Loss) to Average
Net Assets | | | 0.42 | % | | | 0.52 | % | | | 0.52 | % | | | 0.32 | % | | | 0.82 | % | |
Portfolio Turnover Rate | | | 31 | % | | | 24 | % | | | 37 | % | | | 29 | % | | | 30 | % | |
See Notes to Financial Highlights
19
Notes to Financial Highlights Socially Responsive Portfolio
† Total return based on per share NAV reflects the effects of changes in NAV on the performance of the Fund during each fiscal period. Returns assume income dividends and other distributions, if any, were reinvested. Results represent past performance and do not indicate future results. Current returns may be lower or higher than the performance data quoted. Investment returns and principal may fluctuate and shares when redeemed may be worth more or less than original cost. Total return would have been lower if Management had not reimbursed and/or waived certain expenses. The total return information shown does not reflect charges and other expenses that apply to the separate accounts or the related insurance policies or other qualified pension or retirement plans, and the inclusion of these charges and other expenses would reduce the total return for all fiscal periods shown.
^ The class action proceeds received in 2015 had no impact on the Fund's total return for the year ended December 31, 2015.
# Represents the annualized ratios of net expenses to average daily net assets if Management had not reimbursed certain expenses and/or waived a portion of the investment management fee. Management did not reimburse or waive fees during the fiscal periods shown for Class I.
@ Calculated based on the average number of shares outstanding during each fiscal period.
§ Prior to January 1, 2013, the Fund had an expense offset arrangement in connection with its custodian contract. The impact of expense reductions related to expense offset arrangements, if any, was less than 0.01%.
µ The voluntary contribution received in 2014 had no impact on the Fund's total return for the year ended December 31, 2014.
20
Report of Independent Registered Public Accounting Firm
To the Board of Trustees of
Neuberger Berman Advisers Management Trust and
Shareholders of Socially Responsive Portfolio
We have audited the accompanying statement of assets and liabilities of Socially Responsive Portfolio, one of the series constituting Neuberger Berman Advisers Management Trust (the "Trust"), including the schedule of investments, as of December 31, 2016, and the related statement of operations for the year then ended, the statements of changes in net assets for each of the two years in the period then ended and the financial highlights for each of the five years in the period then ended. These financial statements and financial highlights are the responsibility of the Trust's management. Our responsibility is to express an opinion on these financial statements and financial highlights based on our audits.
We conducted our audits in accordance with the standards of the Public Company Accounting Oversight Board (United States). Those standards require that we plan and perform the audit to obtain reasonable assurance about whether the financial statements and financial highlights are free of material misstatement. We were not engaged to perform an audit of the Trust's internal control over financial reporting. Our audits included consideration of internal control over financial reporting as a basis for designing audit procedures that are appropriate in the circumstances, but not for the purpose of expressing an opinion on the effectiveness of the Trust's internal control over financial reporting. Accordingly, we express no such opinion. An audit also includes examining, on a test basis, evidence supporting the amounts and disclosures in the financial statements and financial highlights, assessing the accounting principles used and significant estimates made by management, and evaluating the overall financial statement presentation. Our procedures included confirmation of securities owned as of December 31, 2016 by correspondence with the custodian and others or by other appropriate auditing procedures where replies from others were not received. We believe that our audits provide a reasonable basis for our opinion.
In our opinion, the financial statements and financial highlights referred to above present fairly, in all material respects, the financial position of Socially Responsive Portfolio, a series of Neuberger Berman Advisers Management Trust, at December 31, 2016, the results of its operations for the year then ended, the changes in its net assets for each of the two years in the period then ended, and the financial highlights for each of the five years in the period then ended in conformity with U.S. generally accepted accounting principles.
Boston, Massachusetts
February 10, 2017
21
The following tables set forth information concerning the Trustees and Officers of the Fund. All persons named as Trustees and Officers also serve in similar capacities for other funds administered or managed by Management. The Fund's Statement of Additional Information includes additional information about the Trustees as of the time of the Fund's most recent public offering and is available upon request, without charge, by calling (800) 877-9700.
Information about the Board of Trustees
Name, (Year of Birth),
and Address(1) | | Position(s)
and Length
of Time
Served(2) | | Principal Occupation(s)(3) | | Number of
Funds in Fund
Complex
Overseen by Fund Trustee | | Other Directorships
Held Outside Fund
Complex by Fund
Trustee(3) |
Independent Trustees |
Michael J. Cosgrove (1949) | | Trustee since 2015 | | President, Carragh Consulting USA, since 2014; formerly, Executive, General Electric Company, 1970 to 2014, including President, Mutual Funds and Global Investment Programs, GE Asset Management, 2011 to 2014, President and Chief Executive Officer, Mutual Funds and Intermediary Business, GE Asset Management, 2007 to 2011, President, Institutional Sales and Marketing, GE Asset Management, 1998 to 2007, and Chief Financial Officer, GE Asset Management, and Deputy Treasurer, GE Company, 1988 to 1993. | | 55 | | | Director, America Press, Inc. (not-for-profit Jesuit publisher), since 2015; Director, Fordham University, since 2001; formerly, Director, The Gabelli Go Anywhere Trust, June 2015 to June 2016; Director, Skin Cancer Foundation (not-for-profit), 2006 to 2015; Director, GE Investments Funds, Inc., 1997 to 2014; Trustee, GE Institutional Funds, 1997 to 2014; Director, GE Asset Management, 1988 to 2014; Director, Elfun Trusts, 1988 to 2014; Trustee, GE Pension & Benefit Plans, 1988 to 2014. |
22
Name, (Year of Birth),
and Address(1) | | Position(s)
and Length
of Time
Served(2) | | Principal Occupation(s)(3) | | Number of
Funds in Fund
Complex
Overseen by Fund Trustee | | Other Directorships
Held Outside Fund
Complex by Fund
Trustee(3) |
Marc Gary (1952) | | Trustee since 2015 | | Executive Vice Chancellor and Chief Operating Officer, Jewish Theological Seminary, since 2012; formerly, Executive Vice President and General Counsel, Fidelity Investments, 2007 to 2012; Executive Vice President and General Counsel, BellSouth Corporation, 2004 to 2007; Vice President and Associate General Counsel, BellSouth Corporation, 2000 to 2004; Associate, Partner, and National Litigation Practice Co-Chair, Mayer, Brown LLP, 1981 to 2000; Associate Independent Counsel, Office of Independent Counsel, 1990 to 1992. | | 55 | | | Trustee, Jewish Theological Seminary, since 2015; Director, Counsel on Call (privately held for-profit company), since 2012; Director, Lawyers Committee for Civil Rights Under Law (not-for-profit), since 2005; formerly, Director, Equal Justice Works (not-for-profit), 2005 to 2014; Director, Corporate Counsel Institute, Georgetown University Law Center, 2007 to 2012; Director, Greater Boston Legal Services (not-for-profit), 2007 to 2012. |
23
Name, (Year of Birth),
and Address(1) | | Position(s)
and Length
of Time
Served(2) | | Principal Occupation(s)(3) | | Number of
Funds in Fund
Complex
Overseen by
Fund Trustee | | Other Directorships
Held Outside Fund
Complex by Fund
Trustee(3) |
Martha C. Goss (1949) | | Trustee since 2007 | | President, Woodhill Enterprises Inc./Chase Hollow Associates LLC (personal investment vehicle), since 2006; formerly, Consultant, Resources Global Professionals (temporary staffing), 2002 to 2006. | | 55 | | | Director, American Water (water utility), since 2003; Director, Allianz Life of New York (insurance), since 2005; Director, Berger Group Holdings, Inc. (engineering consulting firm), since 2013; Director, Financial Women's Association of New York (not-for-profit association), since 2003; Trustee Emerita, Brown University, since 1998; Director, Museum of American Finance (not-for-profit), since 2013; formerly, Non-Executive Chair and Director, Channel Reinsurance (financial guaranty reinsurance), 2006 to 2010; formerly, Director, Ocwen Financial Corporation (mortgage servicing), 2005 to 2010; formerly, Director, Claire's Stores, Inc. (retailer), 2005 to 2007; formerly, Director, Parsons Brinckerhoff Inc. (engineering consulting firm), 2007 to 2010; formerly, Director, Bank Leumi (commercial bank), 2005 to 2007; formerly, Advisory Board Member, Attensity (software developer), 2005 to 2007. |
Michael M. Knetter (1960) | | Trustee since 2007 | | President and Chief Executive Officer, University of Wisconsin Foundation, since October 2010; formerly, Dean, School of Business, University of Wisconsin—Madison; formerly, Professor of International Economics and Associate Dean, Amos Tuck School of Business—Dartmouth College, 1998 to 2002. | | 55 | | | Board Member, American Family Insurance (a mutual company, not publicly traded), since March 2009; formerly, Trustee, Northwestern Mutual Series Fund, Inc., 2007 to 2011; formerly, Director, Wausau Paper, 2005 to 2011; formerly, Director, Great Wolf Resorts, 2004 to 2009. |
24
Name, (Year of Birth),
and Address(1) | | Position(s)
and Length
of Time
Served(2) | | Principal Occupation(s)(3) | | Number of
Funds in Fund
Complex
Overseen by
Fund Trustee | | Other Directorships
Held Outside Fund
Complex by Fund
Trustee(3) |
Deborah C. McLean (1954) | | Trustee since 2015 | | Member, Circle Financial Group (private wealth management membership practice), since 2011; Managing Director, Golden Seeds LLC (an angel investing group), since 2009; Adjunct Professor, Columbia University School of International and Public Affairs, since 2008; formerly, Visiting Assistant Professor, Fairfield University, Dolan School of Business, Fall 2007; formerly, Adjunct Associate Professor of Finance, Richmond, The American International University in London, 1999 to 2007. | | 55 | | | Board member, Norwalk Community College Foundation, since 2014; Dean's Advisory Council, Radcliffe Institute for Advanced Study, since 2014; formerly, Director and Treasurer, At Home in Darien (not-for-profit), 2012 to 2014; Director, National Executive Service Corps (not-for-profit), 2012 to 2013; Trustee, Richmond, The American International University in London, 1999 to 2013. |
George W. Morriss (1947) | | Trustee since 2007 | | Adjunct Professor, Columbia University School of International and Public Affairs, since October 2012; formerly, Executive Vice President and Chief Financial Officer, People's United Bank, Connecticut (a financial services company), 1991 to 2001. | | 55 | | | Director, National Association of Corporate Directors, Connecticut Chapter, since 2011; Trustee, Steben Alternative Investment Funds, Steben Select Multi-Strategy Fund, and Steben Select Multi-Strategy Master Fund, since 2013; formerly, Treasurer, National Association of Corporate Directors, Connecticut Chapter, 2011 to 2015; formerly, Manager, Larch Lane Multi-Strategy Fund complex (which consisted of three funds), 2006 to 2011; formerly, Member, NASDAQ Issuers' Affairs Committee, 1995 to 2003. |
25
Name, (Year of Birth),
and Address(1) | | Position(s)
and Length
of Time
Served(2) | | Principal Occupation(s)(3) | | Number of
Funds in Fund
Complex
Overseen by
Fund Trustee | | Other Directorships
Held Outside Fund
Complex by Fund
Trustee(3) |
Tom D. Seip (1950) | | Trustee since 2000; Chairman of the Board since 2008; formerly Lead Independent Trustee from 2006 to 2008 | | General Partner, Ridgefield Farm LLC (a private investment vehicle); formerly, President and CEO, Westaff, Inc. (temporary staffing), May 2001 to January 2002; formerly, Senior Executive, The Charles Schwab Corporation, 1983 to 1998, including Chief Executive Officer, Charles Schwab Investment Management, Inc.; Trustee, Schwab Family of Funds and Schwab Investments, 1997 to 1998; and Executive Vice President-Retail Brokerage, Charles Schwab & Co., Inc., 1994 to 1997. | | 55 | | | Director, H&R Block, Inc. (financial services company), since May 2001; Chairman, Governance and Nominating Committee, H&R Block, Inc., since 2011; formerly, Chairman, Compensation Committee, H&R Block, Inc., 2006 to 2010; formerly, Director, Forward Management, Inc. (asset management company), 1999 to 2006. |
James G. Stavridis (1955) | | Trustee since 2015 | | Dean, Fletcher School of Law and Diplomacy, Tufts University since 2013; formerly, Admiral, United States Navy, 2006 to 2013, including Supreme Allied Commander, NATO and Commander, European Command, 2009 to 2013, and Commander, United States Southern Command, 2006 to 2009. | | 55 | | | Director, Utilidata Inc., since 2015; Director, BMC Software Federal, LLC, since 2014; Director, Vertical Knowledge, LLC, since 2013; formerly, Director, Navy Federal Credit Union, 2000-2002. |
26
Name, (Year of Birth),
and Address(1) | | Position(s)
and Length
of Time
Served(2) | | Principal Occupation(s)(3) | | Number of
Funds in Fund
Complex
Overseen by
Fund Trustee | | Other Directorships
Held Outside Fund
Complex by Fund
Trustee(3) |
Candace L. Straight (1947) | | Trustee since 1999 | | Private investor and consultant specializing in the insurance industry; formerly, Advisory Director, Securitas Capital LLC (a global private equity investment firm dedicated to making investments in the insurance sector), 1998 to 2003. | | 55 | | | Formerly, Public Member, Board of Governors and Board of Trustees, Rutgers University, 2011 to 2016; formerly, Director, Montpelier Re Holdings Ltd. (reinsurance company), 2006 to 2015; formerly, Director, National Atlantic Holdings Corporation (property and casualty insurance company), 2004 to 2008; formerly, Director, The Proformance Insurance Company (property and casualty insurance company), 2004 to 2008; formerly, Director, Providence Washington Insurance Company (property and casualty insurance company), 1998 to 2006; formerly, Director, Summit Global Partners (insurance brokerage firm), 2000 to 2005. |
Peter P. Trapp (1944) | | Trustee since 1984 | | Retired; formerly, Regional Manager for Mid-Southern Region, Ford Motor Credit Company, September 1997 to 2007; formerly, President, Ford Life Insurance Company, April 1995 to August 1997. | | 55 | | | None. |
27
Name, (Year of Birth),
and Address(1) | | Position(s)
and Length
of Time
Served(2) | | Principal Occupation(s)(3) | | Number of
Funds in Fund
Complex
Overseen by
Fund Trustee | | Other Directorships
Held Outside Fund
Complex by Fund
Trustee(3) |
Trustees who are "Interested Persons" |
Joseph V. Amato* (1962) | | Trustee since 2009 | | President and Director, Neuberger Berman Group LLC, since 2009; President and Chief Executive Officer, Neuberger Berman BD LLC ("Neuberger Berman") and Neuberger Berman Holdings LLC (including its predecessor, Neuberger Berman Inc.), since 2007; Chief Investment Officer (Equities) and President (Equities), Neuberger Berman Investment Advisers LLC ("NBIA") (formerly, Neuberger Berman Fixed Income LLC ("NBFI") and including predecessor entities), since 2007, and Board Member of NBIA since 2006; formerly, Global Head of Asset Management of Lehman Brothers Holdings Inc.'s ("LBHI") Investment Management Division, 2006 to 2009; formerly, member of LBHI's Investment Management Division's Executive Management Committee, 2006 to 2009; formerly, Managing Director, Lehman Brothers Inc. ("LBI"), 2006 to 2008; formerly, Chief Recruiting and Development Officer, LBI, 2005 to 2006; formerly, Global Head of LBI's Equity Sales and a Member of its Equities Division Executive Committee, 2003 to 2005. | | 55 | | | Member of Board of Advisors, McDonough School of Business, Georgetown University, since 2001; Member of New York City Board of Advisors, Teach for America, since 2005; Trustee, Montclair Kimberley Academy (private school), since 2007; Member of Board of Regents, Georgetown University, since 2013. |
28
Name, (Year of Birth),
and Address(1) | | Position(s)
and Length
of Time
Served(2) | | Principal Occupation(s)(3) | | Number of
Funds in Fund
Complex
Overseen by
Fund Trustee | | Other Directorships
Held Outside Fund
Complex by Fund
Trustee(3) |
Robert Conti* (1956) | | Chief Executive Officer, President and Trustee since 2008; prior thereto, Executive Vice President in 2008 and Vice President from 2000 to 2008 | | Managing Director, Neuberger Berman, since 2007; President—Mutual Funds, NBIA, since 2008; formerly, Senior Vice President, Neuberger Berman, 2003 to 2006; formerly, Vice President, Neuberger Berman, 1999 to 2003; President and Chief Executive Officer, twenty-eight registered investment companies for which NBIA acts as investment manager and/or administrator. | | 55 | | | Director, Staten Island Mental Health Society, since 1994; formerly, Chairman of the Board, Staten Island Mental Health Society, 2008 to 2011. |
(1) The business address of each listed person is 1290 Avenue of the Americas, New York, NY 10104.
(2) Pursuant to the Trust's Trust Instrument, each of these Trustees shall hold office for life or until his or her successor is elected or the Trust terminates; except that (a) any Trustee may resign by delivering a written resignation; (b) any Trustee may be removed with or without cause at any time by a written instrument signed by at least two-thirds of the other Trustees; (c) any Trustee who requests to be retired, or who has become unable to serve, may be retired by a written instrument signed by a majority of the other Trustees; and (d) any Trustee may be removed at any shareholder meeting by a vote of at least two-thirds of the outstanding shares.
(3) Except as otherwise indicated, each individual has held the positions shown during at least the last five years.
* Indicates a Trustee who is an "interested person" within the meaning of the 1940 Act. Mr. Amato and Mr. Conti are interested persons of the Trust by virtue of the fact that each is an officer of Management, Neuberger Berman and/or their affiliates.
29
Information about the Officers of the Trust
Name, (Year of Birth),
and Address(1) | | Position(s)
and Length
of Time
Served(2) | | Principal Occupation(s)(3) |
Claudia A. Brandon (1956) | | Executive Vice President since 2008 and Secretary since 1985 | | Senior Vice President, Neuberger Berman, since 2007 and Employee since 1999; Senior Vice President, NBIA, since 2008 and Assistant Secretary since 2004; formerly, Vice President, Neuberger Berman, 2002 to 2006; formerly, Vice President—Mutual Fund Board Relations, NBIA, 2000 to 2008; formerly, Vice President, NBIA, 1986 to 1999 and Employee, 1984 to 1999; Executive Vice President, twenty-eight registered investment companies for which NBIA acts as investment manager and/or administrator; Secretary, fifteen registered investment companies for which NBIA acts as investment manager and/or administrator. |
Agnes Diaz (1971) | | Vice President since 2013 | | Senior Vice President, Neuberger Berman, since 2012; Senior Vice President, NBIA, since 2012 and Employee since 1996; formerly, Vice President, Neuberger Berman, 2007 to 2012; Vice President, twenty-eight registered investment companies for which NBIA acts as investment manager and/or administrator. |
Anthony DiBernardo (1979) | | Assistant Treasurer since 2011 | | Senior Vice President, NBIA, since 2014, and Employee since 2003; formerly, Vice President, Neuberger Berman, 2009 to 2014; Assistant Treasurer, ten registered investment companies for which NBIA acts as investment manager and/or administrator. |
Corey A. Issing (1978) | | Chief Legal Officer since 2016 (only for purposes of sections 307 and 406 of the Sarbanes-Oxley Act of 2002) and Anti-Money Laundering Compliance Officer since 2016 | | General Counsel and Head of Compliance—Mutual Funds since 2016 and Senior Vice President, NBIA, since 2013, formerly, Associate General Counsel (2015 to 2016), Counsel (2007 to 2015), Vice President (2009-2013); Chief Legal Officer (only for purposes of sections 307 and 406 of the Sarbanes-Oxley Act of 2002), twenty-eight registered investment companies for which NBIA acts as investment manager and/or administrator; Anti-Money Laundering Compliance Officer, twenty-eight registered investment companies for which NBIA acts as investment manager and/or administrator. |
Sheila R. James (1965) | | Assistant Secretary since 2002 | | Vice President, Neuberger Berman, since 2008 and Employee since 1999; Vice President, NBIA, since 2008; formerly, Assistant Vice President, Neuberger Berman, 2007; Employee, NBIA, 1991 to 1999; Assistant Secretary, twenty-eight registered investment companies for which NBIA acts as investment manager and/or administrator. |
30
Name, (Year of Birth),
and Address(1) | | Position(s)
and Length
of Time
Served(2) | | Principal Occupation(s)(3) |
Brian Kerrane (1969) | | Chief Operating Officer since 2015 and Vice President since 2008 | | Managing Director, Neuberger Berman, since 2013; Chief Operating Officer—Mutual Funds and Managing Director, NBIA, since 2015 and Employee since 1991; formerly, Senior Vice President, Neuberger Berman, 2006 to 2014; Vice President, NBIA, 2008 to 2015; Chief Operating Officer, ten registered investment companies for which NBIA acts as investment manager and/or administrator; Vice President, twenty-eight registered investment companies for which NBIA acts as investment manager and/or administrator. |
Kevin Lyons (1955) | | Assistant Secretary since 2003 | | Assistant Vice President, Neuberger Berman, since 2008 and Employee since 1999; Assistant Vice President, NBIA, since 2008; formerly, Employee, NBIA, 1993 to 1999; Assistant Secretary, ten registered investment companies for which NBIA acts as investment manager and/or administrator. |
Anthony Maltese (1959) | | Vice President since 2015 | | Senior Vice President, Neuberger Berman, since 2014 and Employee since 2000; Senior Vice President, NBIA, since 2014; Vice President, ten registered investment companies for which NBIA acts as investment manager and/or administrator. |
Owen F. McEntee, Jr. (1961) | | Vice President since 2008 | | Vice President, Neuberger Berman, since 2006; Vice President, NBIA, since 2006 and Employee since 1992; Vice President, ten registered investment companies for which NBIA acts as investment manager and/or administrator. |
John M. McGovern (1970) | | Treasurer and Principal Financial and Accounting Officer since 2005 | | Senior Vice President, Neuberger Berman, since 2007; Senior Vice President, NBIA, since 2007 and Employee since 1993; formerly, Vice President, Neuberger Berman, 2004 to 2006; formerly, Assistant Treasurer, 2002 to 2005; Treasurer and Principal Financial and Accounting Officer, twenty-eight registered investment companies for which NBIA acts as investment manager and/or administrator. |
Frank Rosato (1971) | | Assistant Treasurer since 2005 | | Vice President, Neuberger Berman, since 2006; Vice President, NBIA, since 2006 and Employee since 1995; Assistant Treasurer, ten registered investment companies for which NBIA acts as investment manager and/or administrator. |
Chamaine Williams (1971) | | Chief Compliance Officer since 2005 | | Chief Compliance Officer—Mutual Funds and Senior Vice President, NBIA, since 2006; formerly, Senior Vice President, LBI, 2007 to 2008; formerly, Vice President, LBI, 2003 to 2006; formerly, Chief Compliance Officer, Lehman Brothers Asset Management Inc., 2003 to 2007; formerly, Chief Compliance Officer, Lehman Brothers Alternative Investment Management LLC, 2003 to 2007; Chief Compliance Officer, fifteen registered investment companies for which NBIA acts as investment manager and/or administrator. |
(1) The business address of each listed person is 1290 Avenue of the Americas, New York, NY 10104.
(2) Pursuant to the By-Laws of the Trust, each officer elected by the Trustees shall hold office until his or her successor shall have been elected and qualified or until his or her earlier death, inability to serve, or resignation. Officers serve at the pleasure of the Trustees and may be removed at any time with or without cause.
(3) Except as otherwise indicated, each individual has held the positions shown during at least the last five years.
31
Proxy Voting Policies and Procedures
A description of the policies and procedures that the Trust uses to determine how to vote proxies relating to portfolio securities is available, without charge, by calling 800-877-9700 (toll-free) and on the Securities and Exchange Commission's website at www.sec.gov. Information regarding how the Trust voted proxies relating to portfolio securities during the most recent 12-month period ended June 30 is also available upon request, without charge, by calling 800-877-9700 (toll-free), on the Securities and Exchange Commission's website at www.sec.gov, and on Management's website at www.nb.com.
Quarterly Portfolio Schedule
The Trust files a complete schedule of portfolio holdings for the Fund with the Securities and Exchange Commission for the first and third quarters of each fiscal year on Form N-Q. The Trust's Forms N-Q are available on the Securities and Exchange Commission's website at www.sec.gov and may be reviewed and copied at the Securities and Exchange Commission's Public Reference Room in Washington, DC. Information on the operation of the Public Reference Room may be obtained by calling 800-SEC-0330. The information on Form N-Q is available upon request, without charge, by calling 800-877-9700 (toll free).
Board Consideration of the Management Agreement
On an annual basis, the Board of Trustees (the "Board") of Neuberger Berman Advisers Management Trust (the "Trust"), including the Trustees who are not "interested persons" of Neuberger Berman Investment Advisers LLC ("Management") (including its affiliates) or the Trust ("Independent Fund Trustees"), considers whether to continue the management agreement with Management (the "Agreement") for Socially Responsive Portfolio (the "Fund"). Throughout the process, the Independent Fund Trustees are advised by counsel that is experienced in Investment Company Act of 1940 matters and that is independent of Management ("Independent Counsel"). At a meeting held on October 18, 2016, the Board, including the Independent Fund Trustees, approved the continuation of the Agreement for the Fund.
In evaluating the Agreement, the Board, including the Independent Fund Trustees, reviewed extensive materials provided by Management in response to questions submitted by the Independent Fund Trustees and Independent Counsel, and met with senior representatives of Management regarding its personnel, operations and financial condition as they relate to the Fund. The annual contract review extends over at least two regular meetings of the Board to ensure that Management has time to respond to any questions the Independent Fund Trustees may have on their initial review of the materials and that the Independent Fund Trustees have time to consider those responses.
In connection with its deliberations, the Board also considered the broad range of information relevant to the annual contract review that is provided to the Board (including its various standing committees) at meetings throughout the year, including investment performance reports and related portfolio information for the Fund, as well as periodic reports on, among other matters, pricing and valuation; brokerage and execution; compliance; and shareholder and other services provided by Management and its affiliates. To assist the Board in its deliberations regarding the annual contract review, the Board has established a Contract Review Committee comprised of Independent Fund Trustees. The Board has also established other committees that focus throughout the year on specific areas relevant to the annual contract review, such as Fund performance or compliance matters, and that are charged with specific responsibilities regarding the annual contract review. Those committees provide reports that feed into the Contract Review Committee, which reviews and takes account of the information.
The Independent Fund Trustees received from Independent Counsel a memorandum discussing the legal standards for their consideration of the proposed continuation of the Agreement. During the course of the year and during their deliberations regarding the annual contract review, the Contract Review Committee and the Independent Fund Trustees met with Independent Counsel separately from representatives of Management.
32
In connection with its approval of the continuation of the Agreement, the Board evaluated the terms of the Agreement, the overall fairness of the Agreement to the Fund and whether the Agreement was in the best interests of the Fund and its shareholders. The Board considered all factors it deemed relevant with respect to the Fund, including the following factors: (1) the nature, extent, and quality of the services provided by Management; (2) the investment performance of the Fund compared to an appropriate market index and a peer group of investment companies; (3) the costs of the services provided and the profit or loss realized by Management and its affiliates from their relationship with the Fund; (4) the extent to which economies of scale have been or might be realized as the Fund grows; and (5) whether fee levels reflect any such potential economies of scale for the benefit of the Fund's shareholders. The Board's determination to approve the continuation of the Agreement was based on a comprehensive consideration of all information provided to the Board throughout the year and specifically in connection with the annual contract review. The Board members did not identify any particular information or factor that was all-important or controlling, and each Trustee may have attributed different weights to the various factors. The Board focused on the overall costs and benefits of the Agreement to the Fund and, through the Fund, its shareholders.
With respect to the nature, extent and quality of the services provided, the Board considered the investment philosophy and decision-making processes of Management, and the qualifications, experience, and capabilities of, and the resources available to, the portfolio management personnel of Management who perform services for the Fund. The Board noted that Management also provides certain administrative services, including fund accounting and compliance services. The Board also considered Management's policies and practices regarding brokerage and allocation of portfolio transactions and reviewed the quality of the execution services that Management had provided. The Board also reviewed whether Management used brokers to execute Fund transactions that provide research and other services to Management and the types of benefits potentially derived from such services by Management, the Fund and other clients of Management. The Board also considered that Management's responsibilities include daily management of investment, operational, enterprise, legal, regulatory and compliance risks as they relate to the Fund, and considered information regarding Management's processes for managing risk. In addition, the Board noted the positive compliance history of Management, as no significant compliance problems were reported to the Board with respect to either firm. The Board also considered the general structure of the portfolio manager compensation program and whether this structure provides appropriate incentives to act in the best interests of the Fund.
As in past years, the Board also considered the manner in which Management addressed various non-routine matters that arose during the year, some of them a result of developments in the broader fund industry or the regulations governing it. In addition, the Board considered actions taken by Management in response to recent market conditions, such as regulatory concerns about current trading issues, market liquidity and potential volatility, and considered the overall performance of Management in this context.
The Board factored into its evaluation of the Fund's fees and performance a consideration of the limitations inherent in the methodology for constructing peer groups and determining which investment companies should be included in the peer groups. The Board considered a peer group composed of two types of funds: proprietary funds that are operated by insurance companies or their affiliates, and non-proprietary funds, such as the Fund, operated for insurance company investors by independent investment managers.
With respect to investment performance, the Board considered information regarding the Fund's short, intermediate and long-term performance both on an absolute basis and relative to an appropriate benchmark index and the average performance of a composite peer group (as constructed by an independent organization) of investment companies pursuing broadly similar strategies. The Board also reviewed performance in relation to certain measures of the degree of investment risk undertaken by the portfolio managers. The Board looked at the Fund's I Class as a proxy for both of the Fund's classes. The Board considered that as compared to its peer group, the performance of the Fund's I Class was higher than the median for the 1 and 3-year periods, and equal to the median for the 5 and 10-year periods. The Board also considered that the performance of the Fund's I Class was higher than its benchmark for the 1, 3, 5 and 10-year periods.
With respect to the overall fairness of the Agreement, the Board considered the fee structure for the Fund under the Agreement as compared to the peer group. The Board also considered any fall-out (i.e. indirect) benefits likely to accrue to Management or its affiliates from their relationship with the Fund. The Board also considered the profitability of
33
Management and its affiliates from their association with the Fund, and year-over-year changes in each of Management's reported expense categories.
The Board reviewed a comparison of the Fund's management fee and total expense ratio to the peer group and was aware that non-proprietary insurance product funds generally have higher fee structures than proprietary funds. The Board noted that the comparative management fee analysis includes, in the Fund's management fee, the separate administrative fee paid to Management, but it was not clear whether this was the case for all funds in the peer group. The Board compared the Fund's contractual and actual management fees to the mean and median of the contractual and actual management fees, respectively, of the Fund's peer group. (The actual management fees are the contractual management fees reduced by any fee waivers or other adjustments.) In addition, the Board considered the contractual limit on expenses of the Fund. The Board noted that the overall expense ratio of the Fund's S Class is maintained through expense reimbursements by Management that exceed the fees that Management receives from the Fund.
The Board considered that, for the Fund's I Class shares, as compared to its peer group, the Fund's contractual management fee and the actual management fee net of fees waived by Management were both higher than the respective medians. The Board looked at the I Class as a proxy for both of the Fund's classes. The Board considered whether specific portfolio management, administration or oversight needs contributed to the management fee. The Board also noted that the Fund's size, which impacts its expenses and performance, has been affected by ongoing changes in the insurance market.
The Board also considered whether there were other funds or separate accounts that were advised by Management or its affiliates with investment objectives, policies and strategies that were similar to those of the Fund. The Board compared the fees charged to the Fund to the fees charged to such funds and/or separate accounts. The Board considered the appropriateness and reasonableness of any differences between the fees charged to the Fund and such funds and/or separate accounts, including any breakpoints, and determined that differences in fees and fee structures were consistent with the management and other services provided.
The Board also evaluated any apparent or anticipated economies of scale in relation to the services Management provides to the Fund. The Board considered whether the Fund's fee structure provides for a reduction of payments resulting from the use of breakpoints and whether those breakpoints are set at appropriate asset levels. As in past years, the Board gave careful thought to the size of any breakpoints in the Fund's advisory fees and the asset levels at which they are set. It also considered whether the fees were set at an appropriate level and compared the fee structures to that of the peer group. The Board also considered that Management has provided, at no added cost to the Fund, certain additional services that were required by new regulations or regulatory interpretations, impelled by changes in the securities markets or the business landscape, and/or requested by the Board. In concluding that the benefits accruing to Management and its affiliates by virtue of their relationship with the Fund were reasonable in light of the costs of providing the investment advisory and other services and the benefits accruing to the Fund, the Board reviewed specific data as to Management's profitability on the Fund for a recent period. The Board also considered Management's cost allocation methodology. The Board recognized that Management should be entitled to earn a reasonable level of profits for services they provide to the Fund and, based on its review, concluded that Management's reported level of profitability on the Fund was reasonable.
Conclusions
In approving the continuation of the Agreement, the Board concluded that the terms of the Agreement are fair and reasonable to the Fund and that approval of the continuation of the Agreement is in the best interests of the Fund and its shareholders. In reaching this determination, the Board considered that Management could be expected to provide a high level of service to the Fund; that the performance of the Fund was satisfactory over time; that the Fund's fee structure appeared to the Board to be reasonable given the nature, extent and quality of services provided; and that the benefits accruing to Management and its affiliates by virtue of their relationship with the Fund were reasonable in light of the costs of providing the investment advisory and other services and the benefits accruing to the Fund. The Board's conclusions may be based in part on its consideration of materials prepared in connection with the approval or continuance of the
34
Agreement in prior years and on the Board's ongoing regular review of Fund performance and operations throughout the year, in addition to material prepared specifically for the most recent annual review of the Agreement.
Notice to Shareholders
100.00% of the dividends earned during the fiscal year ended December 31, 2016 qualify for the dividends received deduction for corporate shareholders.
The Fund designates $13,959,506 as a capital gain distribution.
35
Item 2. Code of Ethics.
The Board of Trustees (“Board”) of Neuberger Berman Advisers Management Trust (“Registrant”) has adopted a code of ethics that applies to the Registrant's principal executive officer, principal financial officer, principal accounting officer or controller, or persons performing similar functions (“Code of Ethics”). During the period covered by this Form N-CSR, there were no substantive amendments to the Code of Ethics and there were no waivers from the Code of Ethics granted to the Registrant's principal executive officer, principal financial officer, principal accounting officer or controller, or persons performing similar functions.
Item 3. Audit Committee Financial Expert.
The Board has determined that the Registrant has three audit committee financial experts serving on its audit committee. The Registrant's audit committee financial experts are Michael J. Cosgrove, Deborah C. McLean, and George W. Morriss. Mr. Cosgrove, Ms. McLean, and Mr. Morriss are independent trustees as defined by Form N-CSR.
Item 4. Principal Accountant Fees and Services.
Ernst & Young LLP (“E&Y”) serves as independent registered public accounting firm to Absolute Return Multi-Manager Portfolio, Guardian Portfolio, International Equity Portfolio, Large Cap Value Portfolio, Mid Cap Growth Portfolio, Mid Cap Intrinsic Value Portfolio, Short Duration Bond Portfolio, and Socially Responsive Portfolio (collectively, the “Funds”). The Funds commenced operations on, respectively, May 1, 2014, November 3, 1997, April 29, 2005, March 22, 1994, November 3, 1997, August 22, 2001, July 12, 2002, and February 18, 1999.
The aggregate fees billed for professional services rendered by E&Y for the audit of the annual financial statements or services that are normally provided by E&Y in connection with statutory and regulatory filings or engagements were $314,000 and $335,130 for the fiscal years ended 2015 and 2016, respectively.
The aggregate fees billed to the Registrant for assurance and related services by E&Y that are reasonably related to the performance of the audit of the Registrant’s financial statements and are not reported above in Audit Fees were $0 and $0 for the fiscal years ended 2015 and 2016, respectively. The Audit Committee approved 0% and 0% of these services provided by E&Y for the fiscal years ended 2015 and 2016, respectively, pursuant to the waiver provisions of Rule 2-01(c)(7)(i)(C) of Regulation S-X.
The fees billed to other entities in the investment company complex for assurance and related services by E&Y that are reasonably related to the performance of the audit that the Audit Committee was required to approve because the engagement related directly to the operations and financial reporting of the Registrant were $0 and $0 for the fiscal years ended 2015 and 2016, respectively. The Audit Committee approved 0% and 0% of these services provided by E&Y for the fiscal years ended 2015 and 2016, respectively, pursuant to the waiver provisions of Rule 2-01(c)(7)(i)(C) of Regulation S-X.
The aggregate fees billed to the Registrant for professional services rendered by E&Y for tax compliance, tax advice, and tax planning were $103,350 and $83,200 for the fiscal years ended 2015 and 2016, respectively. The nature of the services provided includes preparation of the Federal and State tax extensions and tax returns, review of annual excise tax calculations, and preparation of form 8613, in addition to guidance with the identification of Passive Foreign Investment Companies ("PFICs"), assistance with determination of various foreign withholding taxes, and assistance with Internal Revenue Code and tax regulation requirements for fund investments. The Audit Committee approved 0% and 0% of these services provided by E&Y for the fiscal years ended 2015 and 2016, respectively, pursuant to the waiver provisions of Rule 2-01(c)(7)(i)(C) of Regulation S-X.
The fees billed to other entities in the investment company complex for professional services rendered by E&Y for tax compliance, tax advice, and tax planning that the Audit Committee was required to approve because the engagement related directly to the operations and financial reporting of the Registrant were $0 and $0 for the fiscal years ended 2015 and 2016, respectively. The Audit Committee approved 0% and 0% of these services provided by E&Y for the fiscal years ended 2015 and 2016, respectively, pursuant to the waiver provisions of Rule 2-01(c)(7)(i)(C) of Regulation S-X.
The aggregate fees billed to the Registrant for products and services provided by E&Y, other than services reported in Audit Fees, Audit-Related Fees, and Tax Fees were $0 and $0 for the fiscal years ended 2015 and 2016, respectively. The Audit Committee approved 0% and 0% of these services provided by E&Y for the fiscal years ended 2015 and 2016, respectively, pursuant to the waiver provisions of Rule 2-01(c)(7)(i)(C) of Regulation S-X.
The fees billed to other entities in the investment company complex for products and services provided by E&Y, other than services reported in Audit Fees, Audit-Related Fees, and Tax Fees, that the Audit Committee was required to approve because the engagement related directly to the operations and financial reporting of the Registrant were $0 and $0 for the fiscal years ended 2015 and 2016, respectively. The Audit Committee approved 0% and 0% of these services provided by E&Y for the fiscal years ended 2015 and 2016, respectively, pursuant to the waiver provisions of Rule 2-01(c)(7)(i)(C) of Regulation S-X.
(1) The Audit Committee’s pre-approval policies and procedures for the Registrant to engage an accountant to render audit and non-audit services delegate to each member of the Committee the power to pre-approve services between meetings of the Committee.
(2) None of the services described in paragraphs (b) through (d) above were approved by the Audit Committee pursuant to paragraph (c)(7)(i)(C) of Rule 2-01 of Regulation S-X.
Not applicable.
Non-audit fees billed by E&Y for services rendered to the Registrant were $103,350 and $83,200 for the fiscal years ended 2015 and 2016, respectively.
Non-audit fees billed by E&Y for services rendered to the Registrant’s investment adviser and any entity controlling, controlled by, or under common control with the adviser that provides ongoing services to the Registrant were $0 and $0 for the fiscal years ended 2015 and 2016, respectively.
(h) The Audit Committee of the Board considered whether the provision of non-audit services rendered to the Registrant’s investment adviser and any entity controlling, controlled by, or under common control with the adviser that provides ongoing services to the Registrant that were not pre-approved by the Audit Committee because the engagement did not relate directly to the operations and financial reporting of the Registrant is compatible with maintaining E&Y’s independence.
Item 5. Audit Committee of Listed Registrants.
Not applicable to the Registrant.
Item 6. Schedule of Investments.
The complete schedule of investments for each series is disclosed in the Registrant's applicable annual report included as Item 1 of this Form N-CSR.
Item 7. Disclosure of Proxy Voting Policies and Procedures for Closed-End Management Investment Companies.
Not applicable to the Registrant.
Item 8. Portfolio Managers of Closed-End Management Investment Companies.
Not applicable to the Registrant.
Item 9. Purchases of Equity Securities by Closed-End Management Investment Company and Affiliated Purchasers.
Not applicable to the Registrant.
Item 10. Submission of Matters to a Vote of Security Holders.
There were no changes to the procedures by which shareholders may recommend nominees to the Board.
Item 11. Controls and Procedures.
Item 12. Exhibits.
The certification furnished pursuant to Rule 30a-2(b) under the Act and Section 906 of the Sarbanes-Oxley Act will not be deemed “filed” for purposes of Section 18 of the Securities Exchange Act of 1934, as amended (“Exchange Act”), or otherwise subject to the liability of that section. Such certification will not be deemed to be incorporated by reference into any filing under the Securities Act of 1933, as amended, or the Exchange Act, except to the extent that the Registrant specifically incorporates it by reference.
Pursuant to the requirements of the Securities Exchange Act of 1934 and the Investment Company Act of 1940, the Registrant has duly caused this report to be signed on its behalf by the undersigned, thereunto duly authorized.
Pursuant to the requirements of the Securities Exchange Act of 1934 and the Investment Company Act of 1940, this report has been signed below by the following persons on behalf of the Registrant and in the capacities and on the dates indicated.