Advisers Management Trust
International Equity Portfolio
S Class Shares
Annual Report
December 31, 2013
International Equity Portfolio Commentary (Unaudited)
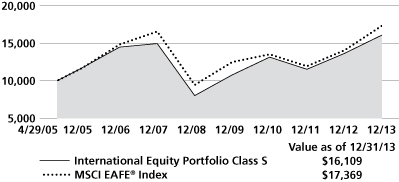
The Neuberger Berman Advisers Management Trust (AMT) International Equity Portfolio Class S generated a 17.83% total return for the fiscal year ended December 31, 2013, underperforming the 23.29% return of its benchmark, the MSCI EAFE® Index.
In our view, advances in international equity markets during 2013 were significantly driven by central bank policy and a reduction in perceived risk. Economically challenged parts of the eurozone, including Greece, Ireland and Spain, saw the biggest gains as economic conditions stabilized and sentiment improved, while an initial positive response to "Abenomics" fostered an improvement in Japan. However, slower growth in China and other emerging markets negatively impacted Canada and Australia—commodity export-oriented economies driven by developing world demand. Our strategy of focusing on high profitability operators—many of which have global exposure including the slowing emerging markets—lagged the index, as weaker businesses outperformed.
During the reporting period, the Portfolio added most value within Consumer Staples and Industrials, and by avoiding Utilities, a relatively weak sector for the year. Energy and Consumer Discretionary holdings underperformed, and our overweight to Materials was a disadvantage. By country, our underweight to Australia was beneficial, as were holdings in Germany and Israel. Opportunistic Canadian, Korean and Chinese allocations were relative detractors.
Among individual holdings, Continental, PIGEON and Roche were the year's top contributors. Continental, the German tire firm, benefited with increasing auto sales. Japanese baby and childcare products firm Pigeon saw its stock advance on successful expansion in China and other parts of Asia, and Roche, the Swiss-based global pharmaceuticals company, outperformed on the basis of its leading oncology franchise. Canadian mining firms New Gold and Silver Wheaton were the largest detractors, declining with commodity prices, followed by Petrofac, a UK-listed oil services firm, that announced a larger-than-expected investment in offshore services, a relatively risky area of the oil services business. We sold the Petrofac position.
Looking ahead, we believe the macro environment in developed international markets will incrementally strengthen but remain lackluster, with Europe registering minimally positive GDP figures and Japan struggling to maintain 2013 momentum. Within such a backdrop, we believe that paying close attention to individual company fundamentals will be key to generating outperformance.
Much of the past year's price appreciation was driven not by significant earnings improvements, but rather by expansion of price multiples, with the forward price/earnings ratio of the MSCI EAFE Index rising from 13.1 at year-end 2012 to its recent 15.2. With higher investor expectations, the market could be more vulnerable to disappointing news from companies or policymakers.
We therefore remain focused on companies we believe can execute well in a low growth environment, with strong track records in tough economic times, solid balance sheets and steady cash flows. We also believe companies with unique product offerings should maintain pricing power and the ability to generate free cash flows. Further, we believe niche operators may have advantages over conglomerates, especially in segments such as industrials, manufacturing, branded consumer goods, health care and technology.
We are seeking opportunities to own companies with these characteristics at valuations that offer potential upside, even against conservative expectations, while at the same time, avoiding areas of concern: for example, companies that would struggle without government support, operate with a thin capital base, or face declining revenues for structural or demographic reasons. Despite the recent strength in international markets, we continue to see what we believe are excellent bottom-up opportunities in select areas. In our view, businesses with proven management teams and execution strategies, value-added services addressing niche markets and managed with an emphasis on cash flows, have attractive outperformance potential.
Sincerely,
BENJAMIN SEGAL
PORTFOLIO MANAGER
Information about the principal risks of investing in the Portfolio is set forth in the prospectus and statement of additional information.
The portfolio composition, industries and holdings of the Portfolio are subject to change.
The opinions expressed are those of the Fund's portfolio manager. The opinions are as of the date of this report, and are subject to change without notice.
International Equity Portfolio (Unaudited)
SECTOR ALLOCATION
| (as a % of Total Investments) | |
| Consumer Discretionary | | | 12.6 | % | |
| Consumer Staples | | | 12.1 | | |
| Energy | | | 3.0 | | |
| Financials | | | 15.5 | | |
| Health Care | | | 9.7 | | |
| Industrials | | | 22.3 | | |
| Information Technology | | | 8.4 | | |
| Materials | | | 11.0 | | |
| Telecommunication Services | | | 3.4 | | |
| Short-Term Investments | | | 2.0 | | |
| Total | | | 100.0 | % | |
PERFORMANCE HIGHLIGHTS
| | | Inception | | Average Annual Total Return Ended 12/31/2013 | |
| | | Date | | 1 Year | | 5 Years | | Life of Fund | |
International Equity Portfolio Class S | | 04/29/2005 | | | 17.83 | % | | | 14.97 | % | | | 5.65 | % | |
MSCI EAFE® Index1,2 | | | | | 23.29 | % | | | 12.96 | % | | | 6.57 | % | |
The performance data quoted represent past performance and do not indicate future results. Current performance may be lower or higher than the performance data quoted. For more current performance data, please visit http://www.nb.com/amtportfolios/performance.
The results shown in the table reflect the reinvestment of income dividends and other distributions, if any. The results do not reflect the effect of taxes a shareholder would pay on Portfolio distributions or on the redemption of Portfolio shares. The results do not reflect fees and expenses of the variable annuity and variable life insurance policies or the qualified pension and retirement plans whose proceeds are invested in the Portfolio.
The investment return and principal value of an investment will fluctuate and shares, when redeemed, may be worth more or less than their original cost.
Returns would have been lower if Neuberger Berman Management LLC ("Management") had not reimbursed certain expenses and/or waived a portion of the investment management fees during certain of the periods shown. Repayment by a class (of expenses previously reimbursed and/or fees previously waived by Management) will decrease the class's returns. Please see Note B in the Notes to Financial Statements for specific information regarding expense reimbursement and/or fee waiver arrangements.
As stated in the Portfolio's most recent prospectus, the total annual operating expense ratio for fiscal year 2012 was 2.55% for Class S shares (before expense reimbursements and/or fee waivers, if any). This expense ratio was 1.51% after expense reimbursements and/or fee waivers.
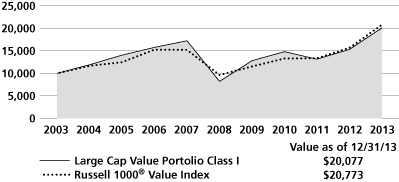
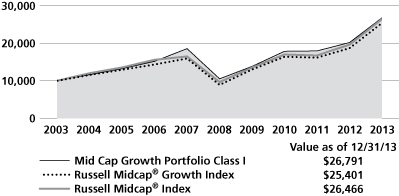
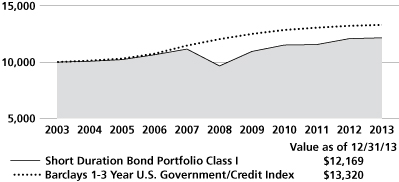
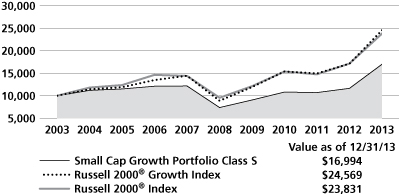
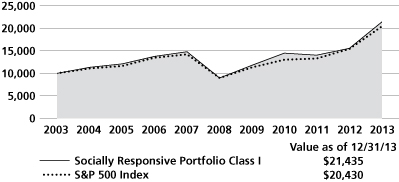
COMPARISON OF A $10,000 INVESTMENT
This graph shows the change in value of a hypothetical $10,000 investment in the Portfolio over the past 10 fiscal years, or since the Portfolio's inception if it has not operated for 10 years. The result is compared with benchmarks, which include a broad-based market index and may include a more narrowly based index. Market indices have not been reduced to reflect any of the fees and costs of investing. The results shown in the graph reflect the reinvestment of income dividends and other distributions, if any. The results do not reflect the effect of taxes a shareholder would pay on Portfolio distributions or on the redemption of Portfolio shares. The results do not reflect fees and expenses of the variable annuity and variable life insurance policies or the qualified pension and retirement plans whose proceeds are invested in the Portfolio. Results represent past performance and do not indicate future results.
Please see Endnotes for additional information.
Endnotes
1 The date used to calculate Life of Fund performance for the index is April 29, 2005, the Portfolio's commencement of operations.
2 The MSCI EAFE® Index (Europe, Australasia, Far East) is a free float-adjusted market capitalization index that is designed to measure the equity market performance of developed markets, excluding the U.S. & Canada. As of November 27, 2013, the MSCI EAFE Index consisted of the following 21, developed market country indices: Australia, Austria, Belgium, Denmark, Finland, France, Germany, Hong Kong, Ireland, Israel, Italy, Japan, the Netherlands, New Zealand, Norway, Portugal, Singapore, Spain, Sweden, Switzerland and the United Kingdom. Please note that indices do not take into account any fees, expenses or tax consequences of investing in the individual securities that they track, and that individuals cannot invest directly in any index. Data about the performance of an index are prepared or obtained by Neuberger Berman Management LLC ("Management") and reflect the reinvestment of income dividends and other distributions, if any. The Portfolio may invest in securities not included in a described index and/or may not invest in all securities included in a described index.
Any ratios or other measurements using a factor of forecasted earnings of a company discussed herein are based on consensus estimates, not Management's own projections, and they may or may not be realized. By quoting them herein, Management does not offer an opinion as to the accuracy of and does not guarantee these forecasted numbers.
The investments for the Portfolio are managed by the same portfolio manager(s) who manage(s) one or more other registered funds that have names, investment objectives and investment styles that are similar to those of the Portfolio. You should be aware that the Portfolio is likely to differ from the other mutual fund(s) in size, cash flow pattern and tax matters. Accordingly, the holdings and performance of the Portfolio can be expected to vary from those of the other mutual fund(s).
Shares of the separate AMT Portfolios are not available to the general public. Shares of this Portfolio may be purchased only by life insurance companies to be used with their separate accounts that fund variable annuity and variable life insurance policies and by qualified pension and retirement plans.
Shares of the AMT Portfolios are sold only through the currently effective prospectuses, which must precede or accompany this report.
The "Neuberger Berman" name and logo are registered service marks of Neuberger Berman Group LLC. "Neuberger Berman Management LLC" and the individual Fund name in this piece are either service marks or registered service marks of Neuberger Berman Management LLC.
© 2014 Neuberger Berman Management LLC distributor. All rights reserved. Information About Your Fund's Expenses (Unaudited)
As a Fund shareholder, you incur two types of costs: (1) transaction costs such as fees and expenses that are, or may be, imposed under your variable contract or qualified pension plan; and (2) ongoing costs, including management fees, distribution and/or service (12b-1) fees (if applicable), and other Fund expenses. This example is intended to help you understand your ongoing costs (in U.S. dollars) of investing in the Fund and compare these costs with the ongoing costs of investing in other mutual funds.
This table is designed to provide information regarding costs related to your investments. The following examples are based on an investment of $1,000 made at the beginning of the six month period ended December 31, 2013 and held for the entire period. The table illustrates the Fund's costs in two ways:
| Actual Expenses and Performance: | | The first section of the table provides information about actual account values and actual expenses in dollars, based on the Fund's actual performance during the period. You may use the information in this line, together with the amount you invested, to estimate the expenses you paid over the period. Simply divide your account value by $1,000 (for example, an $8,600 account value divided by $1,000 = 8.6), then multiply the result by the number in the first section of the table under the heading entitled "Expenses Paid During the Period" to estimate the expenses you paid over the period. | |
| | | | |
| Hypothetical Example for Comparison Purposes: | | The second section of the table provides information about hypothetical account values and hypothetical expenses based on the Fund's actual expense ratio and an assumed rate of return at 5% per year before expenses. This return is not the Fund's actual return. The hypothetical account values and expenses may not be used to estimate the actual ending account balance or expenses you paid for the period. You may use this information to compare the ongoing costs of investing in this Fund versus other funds. To do so, compare the expenses shown in this 5% hypothetical example with the 5% hypothetical examples that appear in the shareholder reports of other funds. | |
Please note that the expenses in the table are meant to highlight your ongoing costs only and do not include any transaction costs, such as fees and expenses that are, or may be imposed under your variable contract or qualified pension plan. Therefore, the information under the heading "Hypothetical (5% annual return before expenses)" is useful in comparing ongoing costs only, and will not help you determine the relative total costs of owning different funds. In addition, if these transaction costs were included, your costs would have been higher.
Expense Information as of 12/31/13
NEUBERGER BERMAN ADVISERS MANAGEMENT TRUST INTERNATIONAL EQUITY PORTFOLIO
| Actual | | Beginning Account Value 7/1/13 | | Ending Account Value 12/31/13 | | Expenses Paid During the Period* 7/1/13 – 12/31/13 | |
| Class S | | $ | 1,000.00 | | | $ | 1,158.50 | | | $ | 8.16 | | |
| Hypothetical (5% annual return before expenses)** | |
| Class S | | $ | 1,000.00 | | | $ | 1,017.64 | | | $ | 7.63 | | |
* Expenses are equal to the annualized expense ratio of 1.50%, multiplied by the average account value over the period, multiplied by 184/365 (to reflect the one-half year period shown).
** Hypothetical 5% annual return before expenses is calculated by multiplying the number of days in the most recent half year divided by 365.
Schedule of Investments International Equity Portfoliob
| NUMBER OF SHARES | | VALUE† | |
| Common Stocks (98.0%) | |
| | | | |
| Australia (1.3%) | |
| | 21,790 | | | Brambles Ltd. | | $ | 178,025 | | |
| | 12,590 | | | Iluka Resources Ltd. | | | 97,015 | | |
| | 4,358 | | | Recall Holdings Ltd. | | | 15,798 | * | |
| | | | 290,838 | | |
| Austria (1.1%) | |
| | 3,945 | | | Andritz AG | | | 247,229 | | |
| | | | | | | | | | |
| Belgium (0.9%) | | | |
| | 3,550 | | | Colruyt SA | | | 198,182 | | |
| | | | | | | | | | |
| Brazil (0.7%) | | | |
| | 17,450 | | | SLC Agricola SA | | | 150,887 | | |
| | | | | | | | | | |
| Canada (7.7%) | |
| | 1,565 | | | Agrium, Inc. | | | 143,166 | | |
| | 1,590 | | | Alimentation Couche- Tard, Inc. Class B | | | 119,566 | | |
| | 11,625 | | | ATS Automation Tooling Systems, Inc. | | | 148,835 | * | |
| | 3,842 | | | Cenovus Energy, Inc. | | | 109,952 | | |
| | 9,062 | | | Corus Entertainment, Inc., B Shares | | | 219,416 | | |
| | 1,870 | | | Dollarama, Inc. | | | 155,286 | | |
| | 2,605 | | | Home Capital Group, Inc. | | | 198,468 | | |
| | 3,268 | | | MacDonald, Dettwiler & Associates Ltd. | | | 253,195 | | |
| | 21,105 | | | New Gold, Inc. | | | 110,467 | * | |
| | 2,500 | | | ShawCor Ltd. | | | 99,977 | | |
| | 6,875 | | | Silver Wheaton Corp. | | | 138,827 | | |
| | | | 1,697,155 | | |
| China (1.8%) | |
| | 5,365 | | | China Mobile Ltd. ADR | | | 280,536 | | |
| | 73,000 | | | PICC Property & Casualty Co. Ltd., H Shares | | | 108,262 | | |
| | | | 388,798 | | |
| Denmark (1.9%) | |
| | 9,205 | | | Sydbank A/S | | | 244,759 | * | |
| | 1,857 | | | Tryg A/S | | | 179,572 | | |
| | | | 424,331 | | |
| France (9.0%) | |
| | 2,365 | | | Arkema SA | | $ | 275,867 | | |
| | 8,728 | | | Eutelsat Communications SA | | | 272,141 | | |
| | 1,215 | | | Pernod-Ricard SA | | | 138,415 | | |
| | 2,428 | | | Publicis Groupe SA | | | 222,157 | | |
| | 13,747 | | | Rexel SA | | | 360,741 | | |
| | 3,015 | | | Sanofi | | | 319,873 | | |
| | 3,836 | | | Sodexo | | | 388,612 | | |
| | | | 1,977,806 | | |
| Germany (12.0%) | |
| | 1,745 | | | Bayer AG | | | 245,016 | | |
| | 1,830 | | | Brenntag AG | | | 339,640 | | |
| | 1,640 | | | Continental AG | | | 360,290 | | |
| | 3,556 | | | Deutsche Boerse AG | | | 294,700 | | |
| | 3,588 | | | Gerresheimer AG | | | 251,393 | | |
| | 2,100 | | | Henkel AG & Co. KGaA, Preference Shares | | | 244,092 | | |
| | 1,471 | | | Linde AG | | | 308,007 | | |
| | 3,035 | | | SAP AG ADR | | | 264,470 | | |
| | 1,192 | | | Volkswagen AG, Preference Shares | | | 335,451 | | |
| | | | 2,643,059 | | |
| Ireland (0.6%) | |
| | 2,470 | | | DCC PLC | | | 121,438 | | |
| | | | | | | | | | |
| Israel (2.7%) | |
| | 154,490 | | | Bezeq Israeli Telecommunication Corp. Ltd. | | | 261,859 | | |
| | 5,155 | | | Check Point Software Technologies Ltd. | | | 332,600 | * | |
| | | | 594,459 | | |
| Japan (15.2%) | |
| | 1,800 | | | FANUC Corp. | | | 329,833 | | |
| | 17,600 | | | KANSAI PAINT Co. Ltd. | | | 260,268 | | |
| | 49 | | | Kenedix Realty Investment Corp. | | | 232,562 | | |
| | 900 | | | KEYENCE Corp. | | | 385,367 | | |
| | 5,900 | | | Nihon Kohden Corp. | | | 205,914 | | |
| | 4,000 | | | PIGEON Corp. | | | 193,998 | | |
| | 3,100 | | | Pola Orbis Holdings, Inc. | | | 110,702 | | |
| | 4,050 | | | Sanrio Co. Ltd. | | | 170,534 | | |
| | 1,100 | | | SMC Corp. | | | 277,627 | | |
| | 2,200 | | | SOFTBANK Corp. | | | 193,052 | | |
| | 4,500 | | | SUGI HOLDINGS Co. Ltd. | | | 182,812 | | |
| | 7,300 | | | Sundrug Co. Ltd. | | | 326,078 | | |
| | 6,300 | | | TOYOTA MOTOR Corp. | | | 384,143 | | |
| | 11,000 | | | Wacom Co. Ltd. | | | 77,346 | | |
| | | | 3,330,236 | | |
See Notes to Schedule of Investments
| NUMBER OF SHARES | | VALUE† | |
| Korea (1.6%) | |
| | 520 | | | Samsung Electronics Co. Ltd. GDR | | $ | 339,560 | | |
| | | | | | | | | | |
| Netherlands (5.9%) | |
| | 3,460 | | | Akzo Nobel NV | | | 268,174 | | |
| | 2,225 | | | ASML Holding NV | | | 208,266 | | |
| | 14,780 | | | Koninklijke Ahold NV | | | 265,344 | | |
| | 4,908 | | | Nutreco NV | | | 243,812 | | |
| | 7,816 | | | Unilever NV | | | 314,778 | | |
| | | | 1,300,374 | | |
| Nigeria (0.8%) | |
| | 61,600 | | | Afren PLC | | | 172,595 | * | |
| | | | | | | | | | |
| Norway (2.5%) | |
| | 17,331 | | | DNB ASA | | | 311,059 | | |
| | 69,765 | | | Norwegian Property ASA | | | 83,622 | | |
| | 20,769 | | | ProSafe SE | | | 160,677 | | |
| | | | 555,358 | | |
| Russia (0.8%) | |
| | 14,030 | | | Sberbank of Russia ADR | | | 176,497 | | |
| | | | | | | | | | |
| Singapore (1.7%) | |
| | 3,925 | | | Jardine Matheson Holdings Ltd. | | | 205,317 | | |
| | 9,200 | | | United Overseas Bank Ltd. | | | 154,846 | | |
| | | | 360,163 | | |
| Sweden (2.6%) | |
| | 6,042 | | | Elekta AB, B Shares | | | 92,462 | | |
| | 19,905 | | | Nordea Bank AB | | | 268,375 | | |
| | 17,410 | | | Telefonaktiebolaget LM Ericsson, B Shares | | | 212,567 | | |
| | | | 573,404 | | |
| Switzerland (13.4%) | |
| | 971 | | | Bucher Industries AG | | | 282,162 | | |
| | 229 | | | Givaudan SA | | | 327,599 | * | |
| | 3,235 | | | Julius Baer Group Ltd. | | | 155,461 | * | |
| | 360 | | | Kaba Holding AG | | | 174,890 | * | |
| | 4,027 | | | Novartis AG | | | 322,761 | | |
| | 810 | | | Partners Group Holding AG | | | 215,799 | | |
| | 1,556 | | | Roche Holding AG | | | 435,876 | | |
| | 137 | | | SGS SA | | | 315,409 | | |
| | 98 | | | Sika AG | | | 349,218 | | |
| | 1,395 | | | Sulzer AG | | | 225,406 | | |
| | 7,530 | | | UBS AG | | | 144,179 | * | |
| | | | 2,948,760 | | |
| United Kingdom (12.1%) | |
| | 39,016 | | | Amlin PLC | | | 296,489 | | |
| | 3,060 | | | Aon PLC | | | 256,703 | | |
| | 12,965 | | | Bunzl PLC | | | 311,306 | | |
| | 16,805 | | | Diploma PLC | | | 187,841 | | |
| | 12,030 | | | ICAP PLC | | | 89,964 | | |
| | 61,925 | | | Mitie Group PLC | | | 325,990 | | |
| | 17,439 | | | Reed Elsevier PLC | | | 259,614 | | |
| | 46,950 | | | RPS Group PLC | | | 260,996 | | |
| | 3,145 | | | SABMiller PLC | | | 161,499 | | |
| | 13,090 | | | Synergy Health PLC | | | 260,767 | | |
| | 4,092 | | | Travis Perkins PLC | | | 126,849 | | |
| | 7,908 | | | Tullow Oil PLC | | | 111,964 | | |
| | | | 2,649,982 | | |
| United States (1.7%) | |
| | 4,925 | | | Nielsen Holdings NV | | | 226,008 | | |
| | 6,975 | | | Taminco Corp. | | | 140,965 | * | |
| | | | 366,973 | | |
| | | | | Total Common Stocks (Cost $16,601,217) | | | 21,508,084 | | |
| Short-Term Investments (2.0%) | |
| | 436,598 | | | State Street Institutional Treasury Money Market Fund Institutional Class (Cost $436,598) | | | 436,598 | | |
| | | | | Total Investments (100.0%) (Cost $17,037,815) | | | 21,944,682 | ## | |
| | | | | Cash, receivables and other assets, less liabilities (0.0%) | | | 6,344 | | |
| | | | | Total Net Assets (100.0%) | | $ | 21,951,026 | | |
See Notes to Schedule of Investments
SUMMARY SCHEDULE OF INVESTMENTS BY INDUSTRY INTERNATIONAL EQUITY PORTFOLIO (UNAUDITED)
| Industry | | Investments at Value† | | Percentage of Net Assets | |
| Chemicals | | $ | 2,073,264 | | | | 9.4 | % | |
| Machinery | | | 1,511,092 | | | | 6.9 | % | |
| Pharmaceuticals | | | 1,323,526 | | | | 6.0 | % | |
| Commercial Banks | | | 1,155,536 | | | | 5.3 | % | |
| Trading Companies & Distributors | | | 1,138,536 | | | | 5.2 | % | |
| Food & Staples Retailing | | | 1,091,982 | | | | 5.0 | % | |
| Media | | | 973,328 | | | | 4.4 | % | |
| Commercial Services & Supplies | | | 939,901 | | | | 4.3 | % | |
| Insurance | | | 841,026 | | | | 3.8 | % | |
| Automobiles | | | 719,594 | | | | 3.3 | % | |
| Food Products | | | 709,477 | | | | 3.2 | % | |
| Capital Markets | | | 605,403 | | | | 2.7 | % | |
| Software | | | 597,070 | | | | 2.7 | % | |
| Electronic Equipment, Instruments & Components | | | 573,208 | | | | 2.6 | % | |
| Semiconductors & Semiconductor Equipment | | | 547,826 | | | | 2.5 | % | |
| Professional Services | | | 541,417 | | | | 2.5 | % | |
| Wireless Telecommunication Services | | | 473,588 | | | | 2.1 | % | |
| Household Products | | | 438,090 | | | | 2.0 | % | |
| Oil, Gas & Consumable Fuels | | | 394,511 | | | | 1.8 | % | |
| Hotels, Restaurants & Leisure | | | 388,612 | | | | 1.8 | % | |
| Auto Components | | | 360,290 | | | | 1.6 | % | |
| Metals & Mining | | | 346,309 | | | | 1.6 | % | |
| Industrial Conglomerates | | | 326,755 | | | | 1.5 | % | |
| Beverages | | | 299,914 | | | | 1.4 | % | |
| Health Care Equipment & Supplies | | | 298,376 | | | | 1.4 | % | |
| Diversified Financial Services | | | 294,700 | | | | 1.3 | % | |
| Diversified Telecommunication Services | | | 261,859 | | | | 1.2 | % | |
| Health Care Providers & Services | | | 260,767 | | | | 1.2 | % | |
| Energy Equipment & Services | | | 260,654 | | | | 1.2 | % | |
| Aerospace & Defense | | | 253,195 | | | | 1.2 | % | |
| Life Sciences Tools & Services | | | 251,393 | | | | 1.1 | % | |
| Real Estate Investment Trusts | | | 232,562 | | | | 1.1 | % | |
| Communications Equipment | | | 212,567 | | | | 1.0 | % | |
| Thrifts & Mortgage Finance | | | 198,468 | | | | 0.9 | % | |
| Specialty Retail | | | 170,534 | | | | 0.8 | % | |
| Multiline Retail | | | 155,286 | | | | 0.7 | % | |
| Personal Products | | | 110,702 | | | | 0.5 | % | |
| Real Estate Management & Development | | | 83,622 | | | | 0.4 | % | |
| Computers & Peripherals | | | 77,346 | | | | 0.3 | % | |
| IT Services | | | 15,798 | | | | 0.1 | % | |
| Short-Term Investments and Other Assets—Net | | | 442,942 | | | | 2.0 | % | |
| | | $ | 21,951,026 | | | | 100.0 | % | |
See Notes to Schedule of Investments
Notes to Schedule of Investments International Equity Portfolio
† In accordance with Accounting Standards Codification ("ASC") 820 "Fair Value Measurements and Disclosures" ("ASC 820"), all investments held by Neuberger Berman Advisers Management Trust International Equity Portfolio (the "Fund") (formerly, Neuberger Berman Advisers Management Trust International Portfolio") are carried at the value that Neuberger Berman Management LLC ("Management") believes the Fund would receive upon selling an investment in an orderly transaction to an independent buyer in the principal or most advantageous market for the investment under current market conditions. Various inputs, including the volume and level of activity for the asset or liability in the market, are considered in valuing the Fund's investments, some of which are discussed below. Significant management judgment may be necessary to value investments in accordance with ASC 820.
ASC 820 established a three-tier hierarchy of inputs to create a classification of value measurements for disclosure purposes. The three-tier hierarchy of inputs is summarized in the three broad Levels listed below.
• Level 1 – quoted prices in active markets for identical investments
• Level 2 – other significant observable inputs (including quoted prices for similar investments, interest rates, prepayment speeds, credit risk, amortized cost, etc.)
• Level 3 – significant unobservable inputs (including the Fund's own assumptions in determining the fair value of investments)
The inputs or methodology used for valuing an investment are not necessarily an indication of the risk associated with investing in those securities.
The value of the Fund's investments in equity securities and exchange traded funds, for which market quotations are readily available, is generally determined by Management by obtaining valuations from an independent pricing service based on the latest sale price quoted on a principal exchange or market for that security (Level 1 inputs). Securities traded primarily on the NASDAQ Stock Market are normally valued by the Fund at the NASDAQ Official Closing Price ("NOCP") provided by NASDAQ each business day. The NOCP is the most recently reported price as of 4:00:02 p.m., Eastern time, unless that price is outside the range of the "inside" bid and asked prices (i.e., the bid and asked prices that dealers quote to each other when trading for their own accounts); in that case, NASDAQ will adjust the price to equal the inside bid or asked price, whichever is closer. Because of delays in reporting trades, the NOCP may not be based on the price of the last trade to occur before the market closes. If there is no reported sale of a security on a particular day, the independent pricing service may value the security based on reported market quotations.
Management has developed a process to periodically review information provided by independent pricing services for all types of securities.
Investments in investment companies are valued using the respective fund's daily calculated net asset value per share (Level 2 inputs).
If a valuation is not available from an independent pricing service, or if Management has reason to believe that the valuation received does not represent the amount the Fund might reasonably expect to receive on a current sale in an orderly transaction, the Fund seeks to obtain quotations from principal market makers (generally considered Level 3 inputs). If such quotations are not readily available, the security is valued using methods the Neuberger Berman Advisers Management Trust's Board of Trustees (the "Board") has approved on the belief that they reflect fair value. Numerous factors may be considered when determining the fair value of a security based on Level 2 or 3 inputs, including available analyst, media or other reports, trading in futures or American Depositary Receipts ("ADRs") and whether the issuer of the security being fair valued has other securities outstanding.
The value of the Fund's investments in foreign securities is generally determined using the same valuation methods and inputs as other Fund investments, as discussed above. Foreign security prices expressed in local currency
See Notes to Financial Statements
Notes to Schedule of Investments International Equity Portfolio (cont'd)
values are translated from the local currency into U.S. dollars using the exchange rates as of 4:00 p.m., Eastern time. The Board has approved the use of Interactive Data Pricing and Reference Data, Inc. ("Interactive") to assist in determining the fair value of foreign equity securities when changes in the value of a certain index suggest that the closing prices on the foreign exchanges may no longer represent the amount that the Fund could expect to receive for those securities or on days when foreign markets are closed and U.S. markets are open. In each of these events, Interactive will provide adjusted prices for certain foreign equity securities using a statistical analysis of historical correlations of multiple factors (Level 2 inputs). In the absence of precise information about the market values of these foreign securities as of the close of the New York Stock Exchange, the Board has determined on the basis of available data that prices adjusted in this way are likely to be closer to the prices the Fund could realize on a current sale than are the prices of those securities established at the close of the foreign markets in which the securities primarily trade.
Fair value prices are necessarily estimates, and there is no assurance that such a price will be at or close to the price at which the security is next quoted or next trades.
The following is a summary, categorized by Level, of inputs used to value the Fund's investments as of December 31, 2013:
| Asset Valuation Inputs | | Level 1 | | Level 2 | | Level 3 | | Total | |
| Investments: | |
| Common Stocks^ | |
| Austria | | $ | — | | | $ | 247,229 | | | $ | — | | | $ | 247,229 | | |
| Denmark | | | — | | | | 424,331 | | | | — | | | | 424,331 | | |
| Germany | | | 264,470 | | | | 2,378,589 | | | | — | | | | 2,643,059 | | |
| Japan | | | — | | | | 3,330,236 | | | | — | | | | 3,330,236 | | |
| Norway | | | 83,622 | | | | 471,736 | | | | — | | | | 555,358 | | |
| Sweden | | | — | | | | 573,404 | | | | — | | | | 573,404 | | |
| Switzerland | | | — | | | | 2,948,760 | | | | — | | | | 2,948,760 | | |
Other Common Stocksß | | | 10,785,707 | | | | — | | | | — | | | | 10,785,707 | | |
| Total Common Stocks | | | 11,133,799 | | | | 10,374,285 | | | | — | | | | 21,508,084 | | |
| Short-Term Investments | | | — | | | | 436,598 | | | | — | | | | 436,598 | | |
| Total Investments | | $ | 11,133,799 | | | $ | 10,810,883 | | | $ | — | | | $ | 21,944,682 | | |
^ The Schedule of Investments and Summary Schedule of Investments by Industry provides information on the country and industry categorization for the portfolio.
ß Represents one or more geographic locations and/or industries where all securities were Level 1 securities. Please refer to the Schedule of Investments for additional information.
As of the year ending December 31, 2013, certain securities were transferred from one level to another based on beginning of period market values as of December 31, 2012. $226,979 was transferred from Level 1 to Level 2. Interactive provided adjusted prices for this security as of December 31, 2013, as stated in the description of the valuation methods of foreign equity securities in footnote † above. In addition, $4,846,726 was transferred from Level 2 to Level 1 due to active market activity on recognized exchanges as of December 31, 2013. These securities had been categorized as Level 2 as of December 31, 2012, due to foreign exchanges having been closed and, therefore, no prices having been readily available for the securities as of that date.
See Notes to Financial Statements
Notes to Schedule of Investments International Equity Portfolio (cont'd)
## At December 31, 2013, the cost of investments for U.S. federal income tax purposes was $17,346,689. Gross unrealized appreciation of investments was $5,012,532 and gross unrealized depreciation of investments was $414,539, resulting in net unrealized appreciation of $4,597,993 based on cost for U.S. federal income tax purposes.
* Security did not produce income during the last twelve months.
b Effective May 1, 2013. Formerly, International Portfolio through April 30, 2013.
See Notes to Financial Statements
Statement of Assets and Liabilities
Neuberger Berman Advisers Management Trust
| | | INTERNATIONAL EQUITY PORTFOLIO | |
| | | December 31, 2013 | |
| Assets | |
| Investments in securities, at value* (Note A)—see Schedule of Investments: | |
| Unaffiliated issuers | | $ | 21,944,682 | | |
| Dividends and interest receivable | | | 47,304 | | |
| Receivable for securities sold | | | 44,310 | | |
| Prepaid expenses and other assets | | | 267 | | |
| Total Assets | | | 22,036,563 | | |
| | |
| Liabilities | |
| Payable for Fund shares redeemed | | | 6,506 | | |
| Payable to investment manager (Note B) | | | 15,404 | | |
| Payable to administrator—net (Note B) | | | 376 | | |
| Accrued expenses and other payables | | | 63,251 | | |
| Total Liabilities | | | 85,537 | | |
| Net Assets | | $ | 21,951,026 | | |
| | |
| Net Assets consist of: | |
| Paid-in capital | | $ | 149,387,611 | | |
| Undistributed net investment income (loss) | | | 103,804 | | |
| Accumulated net realized gains (losses) on investments | | | (132,448,242 | ) | |
| Net unrealized appreciation (depreciation) in value of investments | | | 4,907,853 | | |
| Net Assets | | $ | 21,951,026 | | |
| | | | | | |
| Shares Outstanding ($.001 par value; unlimited shares authorized) | | | 1,902,633 | | |
| Net Asset Value, offering and redemption price per share | | $ | 11.54 | | |
| *Cost of Investments | | $ | 17,037,815 | | |
See Notes to Financial Statements
Statement of Operations
Neuberger Berman Advisers Management Trust
| | | INTERNATIONAL EQUITY PORTFOLIO | |
| | | For the Year Ended December 31, 2013 | |
| Investment Income: | |
| Income (Note A): | |
| Dividend income—unaffiliated issuers | | $ | 535,732 | | |
| Interest and other income—unaffiliated issuers | | | 70 | | |
| Foreign taxes withheld (Note A) | | | (52,498 | ) | |
| Total income | | $ | 483,304 | | |
| | |
| Expenses: | |
| Investment management fees (Note B) | | | 172,416 | | |
| Administration fees (Note B) | | | 60,853 | | |
| Distribution fees (Note B) | | | 50,710 | | |
| Audit fees | | | 44,835 | | |
| Custodian and accounting fees | | | 87,139 | | |
| Insurance expense | | | 901 | | |
| Legal fees | | | 9,070 | | |
| Shareholder reports | | | 24,776 | | |
| Trustees' fees and expenses | | | 41,990 | | |
| Miscellaneous | | | 9,741 | | |
| Total expenses | | | 502,431 | | |
| Expenses reimbursed by Management (Note B) | | | (197,811 | ) | |
| Total net expenses | | | 304,620 | | |
| Net investment income (loss) | | $ | 178,684 | | |
| | |
| Realized and Unrealized Gain (Loss) on Investments (Note A): | |
| Net realized gain (loss) on: | |
| Sales of investment securities of unaffiliated issuers | | | 942,537 | | |
| Foreign currency | | | (18,798 | ) | |
| | |
| Change in net unrealized appreciation (depreciation) in value of: | |
| Unaffiliated investment securities | | | 2,248,744 | | |
| Foreign currency | | | 1,312 | | |
| Net gain (loss) on investments | | | 3,173,795 | | |
| Net increase (decrease) in net assets resulting from operations | | $ | 3,352,479 | | |
See Notes to Financial Statements
Statements of Changes in Net Assets
Neuberger Berman Advisers Management Trust
| | | INTERNATIONAL EQUITY PORTFOLIO | |
| | | Year Ended December 31, 2013 | | Year Ended December 31, 2012 | |
| Increase (Decrease) in Net Assets: | |
| From Operations (Note A): | |
| Net investment income (loss) | | $ | 178,684 | | | $ | 220,417 | | |
| Net realized gain (loss) on investments | | | 923,739 | | | | 202,859 | | |
| Change in net unrealized appreciation (depreciation) of investments | | | 2,250,056 | | | | 2,956,042 | | |
| Net increase (decrease) in net assets resulting from operations | | | 3,352,479 | | | | 3,379,318 | | |
| | |
| Distributions to Shareholders From (Note A): | |
| Net investment income | | | (282,648 | ) | | | (160,166 | ) | |
| | |
| From Fund Share Transactions (Note D): | |
| Proceeds from shares sold | | | 2,313,829 | | | | 1,222,280 | | |
| Proceeds from reinvestment of dividends and distributions | | | 282,648 | | | | 160,166 | | |
| Payments for shares redeemed | | | (3,374,499 | ) | | | (4,844,614 | ) | |
| Net increase (decrease) from Fund share transactions | | | (778,022 | ) | | | (3,462,168 | ) | |
| Net Increase (Decrease) in Net Assets | | | 2,291,809 | | | | (243,016 | ) | |
| | |
| Net Assets: | |
| Beginning of year | | | 19,659,217 | | | | 19,902,233 | | |
| End of year | | $ | 21,951,026 | | | $ | 19,659,217 | | |
| Undistributed net investment income (loss) at end of year | | $ | 103,804 | | | $ | 214,097 | | |
See Notes to Financial Statements
Notes to Financial Statements International Equity Portfolio
Note A—Summary of Significant Accounting Policies:
1 General: Neuberger Berman Advisers Management Trust (the "Trust") is a Delaware statutory trust organized pursuant to a Trust Instrument dated May 23, 1994. The Trust is currently comprised of ten separate operating series (each individually a "Series," and collectively the "Funds") each of which is diversified. The Trust is registered as an open-end management investment company under the Investment Company Act of 1940, as amended (the "1940 Act"), and its shares are registered under the Securities Act of 1933, as amended. The Fund currently offers only Class S shares. The Board may establish additional series or classes of shares without the approval of shareholders.
The assets of each Series belong only to that Series, and the liabilities of each Series are borne solely by that Series and no other.
The preparation of financial statements in accordance with U.S. generally accepted accounting principles ("GAAP") requires Management to make estimates and assumptions at the date of the financial statements. Actual results could differ from those estimates.
Shares of the Fund are not available to the general public and may be purchased only by life insurance companies to be used with their separate accounts that fund variable annuity and variable life insurance policies and by qualified pension and retirement plans.
2 Portfolio valuation: Investment securities are valued as indicated in the notes following the Schedule of Investments.
3 Foreign currency translation: The accounting records of the Fund are maintained in U.S. dollars. Foreign currency amounts are translated into U.S. dollars using the exchange rate as of 4:00 p.m., Eastern time, to determine the value of investments, other assets and liabilities. Purchase and sale prices of securities, and income and expenses, are translated into U.S. dollars at the prevailing rate of exchange on the respective dates of such transactions. Net unrealized foreign currency gain (loss), if any, arises from changes in the value of assets and liabilities, other than investments in securities, as a result of changes in exchange rates and is stated separately in the Statement of Operations.
4 Securities transactions and investment income: Securities transactions are recorded on trade date for financial reporting purposes. Dividend income is recorded on the ex-dividend date or, for certain foreign dividends, as soon as the Fund becomes aware of the dividends. Non-cash dividends included in dividend income, if any, are recorded at the fair market value of the securities received. Interest income, including accretion of original issue discount, where applicable, and accretion of discount on short-term investments, if any, is recorded on the accrual basis. Realized gains and losses from securities transactions and foreign currency transactions, if any, are recorded on the basis of identified cost and stated separately in the Statement of Operations.
5 Income tax information: Each Series is treated as a separate entity for U.S. federal income tax purposes. It is the policy of the Fund to continue to qualify for treatment as a regulated investment company by complying with the requirements of the U.S. Internal Revenue Code applicable to regulated investment companies and to distribute substantially all of its net investment income and net realized capital gains to its shareholders. To the extent the Fund distributes substantially all of its net investment income and net realized capital gains to shareholders, no federal income or excise tax provision is required.
The Fund has adopted the provisions of ASC 740 "Income Taxes" ("ASC 740"). ASC 740 sets forth a minimum threshold for financial statement recognition of a tax position taken, or expected to be taken, in a tax return. The Fund recognizes interest and penalties, if any, related to unrecognized tax positions as an income tax expense in the Statement of Operations. The Fund is subject to examination by U.S. federal and state tax authorities for returns filed for the prior three fiscal years 2010 - 2012. As of December 31, 2013, the Fund did not have any unrecognized tax positions.
Income distributions and capital gain distributions are determined in accordance with income tax regulations, which may differ from GAAP. These differences are primarily due to differing treatments of income and gains on various investment securities held by the Fund, timing differences and differing characterization of distributions made by the Fund. The Fund may also utilize earnings and profits distributed to shareholders on redemption of shares as a part of the dividends-paid deduction for income tax purposes.
As determined on December 31, 2013, permanent differences resulting primarily from different book and tax accounting were reclassified at year end. Such differences are attributed to: foreign currency gains and losses and passive foreign investment company gains and losses. These reclassifications had no effect on net income, net asset value ("NAV") or NAV per share of the Fund. For the year ended December 31, 2013, the Fund recorded the following permanent reclassifications:
| Paid-in Capital | | Undistributed Net Investment Income (Loss) | | Accumulated Net Realized Gains (Losses) on Investments | |
| $ | (2 | ) | | $ | (6,329 | ) | | $ | 6,331 | | |
For tax purposes, distributions of short-term gains are taxable to shareholders as ordinary income.
The tax character of distributions paid during the years ended December 31, 2013 and December 31, 2012 was as follows:
| Distributions Paid From: | |
| Ordinary Income | | Total | |
| 2013 | | 2012 | | 2013 | | 2012 | |
| $ | 282,648 | | | $ | 160,166 | | | $ | 282,648 | | | $ | 160,166 | | |
As of December 31, 2013, the components of distributable earnings (accumulated losses) on a U.S. federal income tax basis were as follows:
Undistributed Ordinary Income (Loss) | | Unrealized Appreciation (Depreciation) | | Loss Carryforwards and Deferrals | | Other Temporary Differences | | Total | |
| $ | 263,456 | | | $ | 4,598,979 | | | $ | (132,299,020 | ) | | $ | — | | | $ | (127,436,585 | ) | |
The differences between book basis and tax basis distributable earnings are primarily due to: timing differences of wash sales, passive foreign investment companies and capital loss carryforwards.
To the extent the Fund's net realized capital gains, if any, can be offset by capital loss carryforwards, it is the policy of the Fund not to distribute such gains. The Regulated Investment Company ("RIC") Modernization Act of 2010 (the "Act") became effective for the Fund on January 1, 2011. The Act modernizes several of the federal income and excise tax provisions related to RICs. Among the changes made are changes to the capital loss carryforward rules allowing for RICs to carry forward capital losses indefinitely and to retain the character of capital loss carryforwards as short-term or long-term ("Post-Enactment"). Rules in effect previously limited the carryforward period to eight years and all carryforwards were considered short-term in character ("Pre-Enactment"). As determined at December 31, 2013, the Fund had unused capital loss carryforwards available for federal income tax purposes to offset net realized capital gains, if any, as follows:
| Pre-Enactment | |
| Expiring in: | |
| 2016 | | 2017 | |
| $ | 68,712,272 | | | $ | 63,586,748 | | |
Post-Enactment capital loss carryforwards must be fully used before Pre-Enactment capital loss carryforwards; therefore, under certain circumstances, Pre-Enactment capital loss carryforwards available as of the report date may expire unused. As of December 31, 2013, the Fund had no Post-Enactment capital loss carryforwards.
During the year ended December 31, 2013, the Fund utilized capital loss carryforwards of $891,420.
6 Distributions to shareholders: The Fund may earn income, net of expenses, daily on its investments. Distributions from net investment income and net realized capital gains, if any, generally are distributed once a year (usually in October). Income distributions and capital gain distributions to shareholders are recorded on the ex-date.
7 Foreign taxes: Foreign taxes withheld, if any, represent amounts withheld by foreign tax authorities, net of refunds recoverable.
8 Expense allocation: Certain expenses are applicable to multiple funds. Expenses directly attributable to a Series are charged to that Series. Expenses of the Trust that are not directly attributable to a particular series of the Trust (e.g., the Fund) are allocated among the series of the Trust, on the basis of relative net assets, except where a more appropriate allocation of expenses to each of the series can otherwise be made fairly. Expenses borne by the complex of related investment companies, which includes open-end and closed-end investment companies for which Management serves as investment manager, that are not directly attributable to a particular investment company in the complex (e.g., the Trust) or series thereof are allocated among the investment companies in the complex or series thereof, on the basis of relative net assets, except where a more appropriate allocation of expenses to each of the investment companies in the complex or series thereof can otherwise be made fairly.
9 Investments in foreign securities: Investing in foreign securities may involve certain sovereign and other risks, in addition to the credit and market risks normally associated with domestic securities. These additional risks include the possibility of adverse political and economic developments (including political instability, nationalization, expropriation, or confiscatory taxation) and the potentially adverse effects of unavailability of public information regarding issuers, less governmental supervision and regulation of financial markets, reduced liquidity of certain financial markets, and the lack of uniform accounting, auditing, and financial reporting standards or the application of standards that are different or less stringent than those applied in the United States. Foreign securities also may experience greater price volatility, higher rates of inflation, and delays in settlement.
10 Indemnifications: Like many other companies, the Trust's organizational documents provide that its officers and trustees are indemnified against certain liabilities arising out of the performance of their duties to the Trust. In addition, both in some of its principal service contracts and in the normal course of its business, the Trust enters into contracts that provide indemnifications to other parties for certain types of losses or liabilities. The Trust's maximum exposure under these arrangements is unknown as this could involve future claims against the Trust.
Note B—Management Fees, Administration Fees, Distribution Arrangements, and Other Transactions with Affiliates:
The Fund retains Management as its investment manager under a Management Agreement. For such investment management services, the Fund pays Management a fee at the annual rate of 0.85% of the first $250 million of the Fund's average daily net assets, 0.825% of the next $250 million, 0.80% of the next $250 million, 0.775% of the next $250 million, 0.75% of the next $500 million, 0.725% of the next $1 billion, and 0.70% of average daily net assets in excess of $2.5 billion. Accordingly, for the year ended December 31, 2013, the management fee pursuant to the Management Agreement was equivalent to an annual effective rate of 0.85% of the Fund's average daily net assets.
The Fund retains Management as its administrator under an Administration Agreement. The Fund pays Management an administration fee at the annual rate of 0.30% of its average daily net assets under this agreement. Additionally, Management retains State Street Bank and Trust Company ("State Street") as its sub-administrator under a Sub-Administration Agreement. Management pays State Street a fee for all services received under this agreement.
Management acts as agent in arranging for the sale of Fund shares without commission and bears advertising and promotion expenses. The Board has adopted a distribution plan (the "Plan") with respect to the Fund, pursuant to Rule 12b-1 under the 1940 Act. The Plan provides that, as compensation for administrative and other services provided to the Fund, Management's activities and expenses related to the sale and distribution of the Fund's shares, and ongoing services provided to investors in the Fund, Management receives from the Fund a fee at the annual rate of 0.25% of the Fund's average daily net assets. Management receives this amount to provide distribution and shareholder servicing for the Fund and pays a portion of it to institutions that provide such services. Those institutions may use the payments for, among other purposes, compensating employees engaged in sales and/or shareholder servicing. The amount of fees paid by the Fund during any year may be more or less than the cost of distribution and other services provided to the Fund. FINRA rules limit the amount of annual distribution fees that may be paid by a mutual fund and impose a ceiling on the cumulative distribution fees paid. The Trust's Plan complies with those rules.
Management has contractually undertaken to waive current payment of fees and/or reimburse the Fund for its operating expenses (including fees payable to Management but excluding interest, taxes, brokerage commissions, extraordinary expenses and transaction costs, if any; consequently, net expenses may exceed the contractual expense limitations) ("Operating Expenses") which exceed the expense limitation as detailed in the following table. The Fund has agreed to repay Management for fees and expenses waived and/or its excess Operating Expenses previously reimbursed by Management, so long as its annual Operating Expenses during that period do not exceed its expense limitation in place at the time the fees and expenses were waived or reimbursed, and the repayment is made within three years after the year in which Management issued the reimbursement or waived fees. During the year ended December 31, 2013, there was no repayment to Management under its contractual expense limitation. At December 31, 2013, the Fund's contingent liabilities to Management under its contractual expense limitation were as follows:
| | | | | | | Expenses Reimbursed in Fiscal Year Ending December 31, | |
| | | | | | | 2011 | | 2012 | | 2013 | |
| | | | | | | Subject to Repayment Until December 31, | |
| | | Contractual Expense Limitation(1) | | Expiration | | 2014 | | 2015 | | 2016 | |
| Class S | | | 1.50 | % | | 12/31/16 | | $ | 330,578 | | | $ | 208,062 | | | $ | 197,811 | | |
(1) Expense limitation per annum of the Fund's average daily net assets.
Neuberger Berman LLC ("Neuberger") is retained by Management to furnish it with investment recommendations and research information without added cost to the Fund. Several individuals who are officers and/or trustees of the Trust are also employees of Neuberger and/or Management.
Management and Neuberger are indirect subsidiaries of Neuberger Berman Group LLC ("NBG" and together with its consolidated subsidiaries, "NB Group"). As of January 1, 2014, NBSH Acquisition, LLC, ("NBSH") which is owned by certain NB Group employees and permitted transferees, owns 82% of NBG's equity, and Lehman Brothers Holdings Inc. ("LBHI") and certain of its subsidiaries (collectively, the "LBHI Parties") own the remaining 18%. In December 2013, NBG, NBSH and LBHI executed an agreement that permits NBG to accelerate the purchase of the remaining equity owned by the LBHI Parties. It is anticipated that in March 2014 NBSH will own 90% of NBG's equity, and by March 2015 it is expected that NBG will be 100% owned by employees and permitted transferees.
Note C—Securities Transactions:
During the year ended December 31, 2013, there were purchase and sale transactions (excluding short-term securities) of $6,664,024 and $8,035,900, respectively.
During the year ended December 31, 2013, no brokerage commissions on securities transactions were paid to affiliated brokers.
Note D—Fund Share Transactions:
Share activity for the years ended December 31, 2013 and December 31, 2012 was as follows:
| | | For the Year Ended December 31, | |
| | | 2013 | | 2012 | |
| Shares Sold | | | 213,195 | | | | 134,733 | | |
| Shares Issued on Reinvestment of Dividends and Distributions | | | 25,579 | | | | 16,931 | | |
| Shares Redeemed | | | (316,840 | ) | | | (526,971 | ) | |
| Total | | | (78,066 | ) | | | (375,307 | ) | |
Note E—Lines of Credit:
At December 31, 2013, the Fund was a participant in a single committed, unsecured $300,000,000 ($200,000,000 prior to September 2013) line of credit with State Street, to be used only for temporary or emergency purposes. Other investment companies managed by Management also participate in this line of credit on the same terms. Interest is charged on borrowings under this line of credit at the higher of (a) the Federal Funds Rate plus 1.25% per annum or (b) the overnight LIBOR Rate plus 1.25% per annum. A commitment fee of 0.10% per annum on the unused portion of the available line of credit is charged, of which each participating mutual fund has agreed to pay its pro rata share, based on the ratio of its individual net assets to the net assets of all participants at the time the fee is due and payable. The fee is paid quarterly in arrears. Because several mutual funds participate, there is no assurance that an individual mutual fund will have access to all or any part of the $300,000,000 at any particular time. There were no loans outstanding pursuant to this line of credit at December 31, 2013. During the year ended December 31, 2013, the Fund did not utilize this line of credit.
At December 31, 2013, the Fund was a participant in a single uncommitted, unsecured $100,000,000 line of credit with State Street, to be used only for temporary or emergency purposes. Other investment companies managed by Management also participate in this line of credit on the same terms. Interest is charged on borrowings under this line of credit at a variable rate per annum as determined and quoted by State Street at the time a Fund requests a loan. Because several mutual funds participate, there is no assurance that an individual Fund will have access to all or any part of the $100,000,000 at any particular time. There were no loans outstanding pursuant to this line of credit at December 31, 2013. During the year ended December 31, 2013, the Fund did not utilize this line of credit.
Note F—Recent Accounting Pronouncement:
In June 2013, the Financial Accounting Standards Board ("FASB") issued Accounting Standards Update 2013-08 Financial Services—Investment Companies (Topic 946)—Amendments to the Scope, Measurement, and Disclosure Requirements ("ASU 2013-08"). Effective for interim and annual reporting periods in fiscal years that begin after December 15, 2013, ASU 2013-08 sets forth a methodology for determining whether an entity should be characterized as an investment company and prescribes fair value accounting for an investment company's non-controlling ownership interest in another investment company. FASB has determined that a fund registered under the 1940 Act automatically meets ASU 2013-08's criteria for an investment company. Although still evaluating the potential impacts of ASU 2013-08 on the Fund's financial statements, Management expects that the impact of the Fund's adoption will be limited to additional financial statement disclosures.
Financial Highlights
International Equity Portfolio
The following table includes selected data for a share outstanding throughout each year and other performance information derived from the Financial Statements. Per share amounts that round to less than $.01 or $(.01) per share are presented as $.00 or $(.00), respectively. Ratios that round to less than .00% or (.00%) per share are presented as .00% or (.00%), respectively. A "—" indicates that the line item was not applicable in the corresponding period.
| Class S | |
| | | Year Ended December 31, | |
| | | 2013 | | 2012 | | 2011 | | 2010 | | 2009 | |
| Net Asset Value, Beginning of Year | | $ | 9.93 | | | $ | 8.45 | | | $ | 10.34 | | | $ | 9.51 | | | $ | 7.29 | | |
| Income From Investment Operations: | |
Net Investment Income (Loss)‡ | | | .09 | | | | .10 | | | | .11 | | | | .13 | | | | .09 | | |
Net Gains or Losses on Securities (both realized and unrealized) | | | 1.67 | | | | 1.46 | | | | (1.36 | ) | | | 1.90 | | | | 2.43 | | |
| Total From Investment Operations | | | 1.76 | | | | 1.56 | | | | (1.25 | ) | | | 2.03 | | | | 2.52 | | |
| Less Distributions From: | |
| Net Investment Income | | | (.15 | ) | | | (.08 | ) | | | (.64 | ) | | | (1.20 | ) | | | (.30 | ) | |
Redemption FeesØØ | | | — | | | | — | | | | .00 | | | | .00 | | | | .00 | | |
| Net Asset Value, End of Year | | $ | 11.54 | | | $ | 9.93 | | | $ | 8.45 | | | $ | 10.34 | | | $ | 9.51 | | |
Total Return†† | | | 17.83 | % | | | 18.48 | % | | | (12.33 | )% | | | 22.01 | % | | | 34.51 | %@ | |
| Ratios/Supplemental Data | |
| Net Assets, End of Year (in millions) | | $ | 22.0 | | | $ | 19.7 | | | $ | 19.9 | | | $ | 24.8 | | | $ | 330.1 | | |
Ratio of Gross Expenses to Average Net Assets# | | | 2.48 | % | | | 2.55 | % | | | 2.89 | % | | | 1.65 | % | | | 1.66 | % | |
Ratio of Net Expenses to Average Net Assets§ | | | 1.50 | % | | | 1.51 | % | | | 1.50 | % | | | 1.50 | % | | | 1.50 | % | |
Ratio of Net Investment Income (Loss) to Average Net Assets | | | .88 | % | | | 1.11 | % | | | 1.09 | % | | | 1.42 | % | | | 1.13 | % | |
| Portfolio Turnover Rate | | | 33 | % | | | 33 | % | | | 45 | % | | | 61 | % | | | 80 | % | |
See Notes to Financial Highlights
Notes to Financial Highlights International Equity Portfolio
†† Total return based on per share NAV reflects the effects of changes in NAV on the performance of the Fund during each fiscal period. Returns assume income dividends and other distributions, if any, were reinvested. Results represent past performance and do not indicate future results. Current returns may be lower or higher than the performance data quoted. Investment returns and principal may fluctuate and shares when redeemed may be worth more or less than original cost. Total return would have been lower if Management had not reimbursed and/or waived certain expenses. The total return information shown does not reflect charges and other expenses that apply to the separate account or the related insurance policies, and the inclusion of these charges and other expenses would reduce the total return for all fiscal periods shown.
@ For the year ended December 31, 2009, Management reimbursed the Fund for losses incurred in connection with the disposition of foreign currency contracts, which had a .01% impact on total return.
# Represents the annualized ratios of net expenses to average daily net assets if Management had not reimbursed certain expenses and/or waived a portion of the investment management fee.
‡ Calculated based on the average number of shares outstanding during each fiscal period.
ØØ Prior to May 1, 2011, the Fund charged a redemption fee of 2% on shares redeemed or exchanged for shares of another fund within 60 days or less of the purchase date. As of May 1, 2011, the Fund no longer charges a redemption fee.
§ Prior to January 1, 2013, the Fund had an expense offset arrangement in connection with its custodian contract. The impact of expense reductions related to expense offset arrangements, if any, was less than .01%.
Report of Independent Registered Public Accounting Firm
To the Board of Trustees of
Neuberger Berman Advisers Management Trust and
Shareholders of International Equity Portfolio
We have audited the accompanying statement of assets and liabilities of International Equity Portfolio (formerly, International Portfolio), one of the series constituting Neuberger Berman Advisers Management Trust (the "Trust"), including the schedule of investments, as of December 31, 2013, and the related statement of operations for the year then ended, the statements of changes in net assets for each of the two years in the period then ended, and the financial highlights for each of the five years in the period then ended. These financial statements and financial highlights are the responsibility of the Trust's management. Our responsibility is to express an opinion on these financial statements and financial highlights based on our audits.
We conducted our audits in accordance with the standards of the Public Company Accounting Oversight Board (United States). Those standards require that we plan and perform the audit to obtain reasonable assurance about whether the financial statements and financial highlights are free of material misstatement. We were not engaged to perform an audit of the Trust's internal control over financial reporting. Our audits included consideration of internal control over financial reporting as a basis for designing audit procedures that are appropriate in the circumstances, but not for the purpose of expressing an opinion on the effectiveness of the Trust's internal control over financial reporting. Accordingly, we express no such opinion. An audit also includes examining, on a test basis, evidence supporting the amounts and disclosures in the financial statements and financial highlights, assessing the accounting principles used and significant estimates made by management, and evaluating the overall financial statement presentation. Our procedures included confirmation of securities owned as of December 31, 2013 by correspondence with the custodian and others or by other appropriate auditing procedures where replies from others were not received. We believe that our audits provide a reasonable basis for our opinion.
In our opinion, the financial statements and financial highlights referred to above present fairly, in all material respects, the financial position of International Equity Portfolio, a series of Neuberger Berman Advisers Management Trust, at December 31, 2013, the results of its operations for the year then ended, the changes in its net assets for each of the two years in the period then ended, and the financial highlights for each of the five years in the period then ended, in conformity with U.S. generally accepted accounting principles.
Boston, Massachusetts
February 10, 2014
Trustee and Officer Information
The following tables set forth information concerning the trustees ("Trustees") and officers ("Officers") of Neuberger Berman Advisers Management Trust (the "Trust"). All persons named as Trustees and Officers also serve in similar capacities for other funds administered or managed by Management, Neuberger and Neuberger Berman Fixed Income LLC ("NBFI"). The Statement of Additional Information includes additional information about Trustees and is available upon request, without charge, by calling (800) 877-9700.
Information about the Board of Trustees
Name, (Year of Birth), and Address(1) | | Position(s) and Length of Time Served(2) | | Principal Occupation(s)(3) | | Number of Funds in Fund Complex Overseen by Fund Trustee | | Other Directorships Held Outside Fund Complex by Fund Trustee(3) | |
Independent Trustees | |
| Faith Colish (1935) | | Trustee since 1982 | | Counsel, Carter Ledyard & Milburn LLP (law firm) since October 2002; formerly, Attorney-at-Law and President, Faith Colish, A Professional Corporation, 1980 to 2002. | | | 56 | | | Formerly, Director, 1997 to 2003, and Advisory Director, 2003 to 2006, ABA Retirement Funds (formerly, American Bar Retirement Association) (not-for-profit membership corporation). | |
| Martha C. Goss (1949) | | Trustee since 2007 | | President, Woodhill Enterprises Inc./Chase Hollow Associates LLC (personal investment vehicle), since 2006; formerly, Consultant, Resources Global Professionals (temporary staffing), 2002 to 2006. | | | 56 | | | Director, American Water (water utility), since 2003; Director, Allianz Life of New York (insurance), since 2005; Director, Berger Group Holdings, Inc. (engineering consulting firm), since 2013; Director, Financial Women's Association of New York (not-for-profit association), since 2003; Trustee Emerita, Brown University, since 1998; Director, Museum of American Finance (not-for-profit), since 2013; formerly, Non-Executive Chair and Director, Channel Reinsurance (financial guaranty reinsurance), 2006 to 2010; formerly, Director, Ocwen Financial Corporation (mortgage servicing), 2005 to 2010; formerly, Director, Claire's Stores, Inc. (retailer), 2005 to 2007; formerly, Director, Parsons Brinckerhoff Inc. (engineering consulting firm), 2007 to 2010; formerly Director, Bank Leumi (commercial bank), 2005 to 2007; formerly Advisory Board Member, Attensity (software developer), 2005 to 2007. | |
Name, (Year of Birth), and Address(1) | | Position(s) and Length of Time Served(2) | | Principal Occupation(s)(3) | | Number of Funds in Fund Complex Overseen by Fund Trustee | | Other Directorships Held Outside Fund Complex by Fund Trustee(3) | |
| | | | | | | | | | | | |
| Michael M. Knetter (1960) | | Trustee since 2007 | | President and Chief Executive Officer, University of Wisconsin Foundation, since October 2010; formerly, Dean, School of Business, University of Wisconsin - Madison; formerly, Professor of International Economics and Associate Dean, Amos Tuck School of Business - Dartmouth College, 1998 to 2002. | | | 56 | | | Director, American Family Insurance (a mutual company, not publicly traded), since March 2009; formerly, Trustee, Northwestern Mutual Series Fund, Inc., 2007 to 2010; formerly, Director, Wausau Paper, 2005 to 2011; formerly, Director, Great Wolf Resorts, 2004 to 2009. | |
| Howard A. Mileaf (1937) | | Trustee since 1999 | | Retired; formerly, Vice President and General Counsel, WHX Corporation (holding company), 1993 to 2001. | | | 56 | | | Formerly, Director, Webfinancial Corporation (holding company), 2002 to 2008; formerly, Director, WHX Corporation (holding company), 2002 to 2005; formerly, Director, State Theatre of New Jersey (not-for-profit theatre), 2000 to 2005. | |
| George W. Morriss (1947) | | Trustee since 2007 | | Adjunct Professor, Columbia University School of International and Public Affairs, since October 2012; formerly, Executive Vice President and Chief Financial Officer, People's Bank, Connecticut (a financial services company), 1991 to 2001. | | | 56 | | | Director and Treasurer, National Association of Corporate Directors, Connecticut Chapter, since 2013; Trustee, Steben Alternative Investment Funds, Steben Select Multi-Strategy Fund, and Steben Select Multi-Strategy Master Fund, since 2013; formerly, Manager, Larch Lane Multi-Strategy Fund complex (which consisted of three funds), 2006 to 2011; formerly, Member, NASDAQ Issuers' Affairs Committee, 1995 to 2003. | |
Name, (Year of Birth), and Address(1) | | Position(s) and Length of Time Served(2) | | Principal Occupation(s)(3) | | Number of Funds in Fund Complex Overseen by Fund Trustee | | Other Directorships Held Outside Fund Complex by Fund Trustee(3) | |
| | | | | | | | | | | | |
| Tom D. Seip (1950) | | Trustee since 2000; Chairman of the Board since 2008; Lead Independent Trustee 2006 to 2008 | | General Partner, Ridgefield Farm LLC (a private investment vehicle); formerly, President and CEO, Westaff, Inc. (temporary staffing), May 2001 to January 2002; formerly, Senior Executive, The Charles Schwab Corporation, 1983 to 1998, including Chief Executive Officer, Charles Schwab Investment Management, Inc.; Trustee, Schwab Family of Funds and Schwab Investments, 1997 to 1998; and Executive Vice President-Retail Brokerage, Charles Schwab & Co., Inc., 1994 to 1997. | | | 56 | | | Director, H&R Block, Inc. (financial services company), since May 2001; Chairman, Governance and Nominating Committee, H&R Block, Inc., since 2011; formerly, Chairman, Compensation Committee, H&R Block, Inc., 2006 to 2010; formerly, Director, Forward Management, Inc. (asset management company), 1999 to 2006. | |
| Candace L. Straight (1947) | | Trustee since 1999 | | Private investor and consultant specializing in the insurance industry; formerly, Advisory Director, Securitas Capital LLC (a global private equity investment firm dedicated to making investments in the insurance sector), 1998 to December 2003. | | | 56 | | | Public Member, Board of Governors and Board of Trustees, Rutgers University, since 2011; Director, Montpelier Re Holdings Ltd. (reinsurance company), since 2006; formerly, Director, National Atlantic Holdings Corporation (property and casualty insurance company), 2004 to 2008; formerly, Director, The Proformance Insurance Company (property and casualty insurance company), 2004 to 2008; formerly, Director, Providence Washington Insurance Company (property and casualty insurance company), 1998 to 2006; formerly, Director, Summit Global Partners (insurance brokerage firm), 2000 to 2005. | |
| Peter P. Trapp (1944) | | Trustee since 1984 | | Retired; formerly, Regional Manager for Mid-Southern Region, Ford Motor Credit Company, September 1997 to 2007; formerly, President, Ford Life Insurance Company, April 1995 to August 1997. | | | 56 | | | None. | |
Name, (Year of Birth), and Address(1) | | Position(s) and Length of Time Served(2) | | Principal Occupation(s)(3) | | Number of Funds in Fund Complex Overseen by Fund Trustee | | Other Directorships Held Outside Fund Complex by Fund Trustee(3) | |
Trustees who are "Interested Persons" | |
| Joseph V. Amato* (1962) | | Trustee since 2009 | | President and Director, Neuberger Berman Group LLC, since 2009; President and Chief Executive Officer, Neuberger and Neuberger Berman Holdings LLC (including its predecessor, Neuberger Berman Inc.), since 2007; Chief Investment Officer (Equities) and Managing Director, NB Management, since 2009; Managing Director, NBFI, since 2007; Board member of NBFI since 2006; formerly, Global Head of Asset Management of Lehman Brothers Holdings Inc.'s ("LBHI") Investment Management Division, 2006 to 2009; formerly, member of LBHI's Investment Management Division's Executive Management Committee, 2006 to 2009; formerly, Managing Director, Lehman Brothers Inc. ("LBI"), 2006 to 2008; formerly, Chief Recruiting and Development Officer, LBI, 2005 to 2006; formerly, Global Head of LBI's Equity Sales and a Member of its Equities Division Executive Committee, 2003 to 2005. | | | 56 | | | Member of Board of Advisors, McDonough School of Business, Georgetown University, since 2001; Member of New York City Board of Advisors, Teach for America, since 2005; Trustee, Montclair Kimberley Academy (private school), since 2007; Member of Board of Regents, Georgetown University, since 2013. | |
Name, (Year of Birth), and Address(1) | | Position(s) and Length of Time Served(2) | | Principal Occupation(s)(3) | | Number of Funds in Fund Complex Overseen by Fund Trustee | | Other Directorships Held Outside Fund Complex by Fund Trustee(3) | |
| | | | | | | | | | | | |
| Robert Conti* (1956) | | Chief Executive Officer, President and Trustee since 2008; prior thereto, Executive Vice President in 2008 and Vice President 2000 to 2008 | | Managing Director, Neuberger, since 2007; formerly, Senior Vice President, Neuberger, 2003 to 2006; formerly, Vice President, Neuberger, 1999 to 2003; President and Chief Executive Officer, Management, since 2008; formerly, Senior Vice President, Management, 2000 to 2008; Managing Director, NBFI, since 2009. | | | 56 | | | Director, Staten Island Mental Health Society, since 1994; formerly, Chairman of the Board, Staten Island Mental Health Society, 2008 to 2011. | |
(1) The business address of each listed person is 605 Third Avenue, New York, New York 10158.
(2) Pursuant to the Trust's Trust Instrument, each of these Trustees shall hold office for life or until his or her successor is elected or the Trust terminates; except that (a) any Trustee may resign by delivering a written resignation; (b) any Trustee may be removed with or without cause at any time by a written instrument signed by at least two-thirds of the other Trustees; (c) any Trustee who requests to be retired, or who has become unable to serve, may be retired by a written instrument signed by a majority of the other Trustees; and (d) any Trustee may be removed at any shareholder meeting by a vote of at least two-thirds of the outstanding shares.
(3) Except as otherwise indicated, each individual has held the positions shown for at least the last five years.
* Indicates a Trustee who is an "interested person" within the meaning of the 1940 Act. Mr. Amato and Mr. Conti are interested persons of the Trust because each is an officer of Management, Neuberger and/or their affiliates.
Information about the Officers of the Trust
Name, (Year of Birth), and Address(1) | | Position(s) and Length of Time Served(2) | | Principal Occupation(s)(3) | |
| | | | | | |
| Andrew B. Allard (1961) | | Chief Legal Officer since 2013 (only for purposes of sections 307 and 406 of the Sarbanes-Oxley Act of 2002) and Anti-Money Laundering Compliance Officer since 2002 | | General Counsel and Senior Vice President, Management since 2013; Senior Vice President, Neuberger, since 2006 and Employee since 1999; Deputy General Counsel, Neuberger, since 2004; formerly, Vice President, Neuberger, 2000 to 2005; formerly, Employee, Management, 1994 to 1999; Chief Legal Officer since 2013 (only for purposes of sections 307 and 406 of the Sarbanes-Oxley Act of 2002) ten registered investment companies for which Management acts as investment manager and administrator (ten since 2013); Anti-Money Laundering Compliance Officer, ten registered investment companies for which Management acts as investment manager and administrator (six since 2002, one since 2003, one since 2005, one since 2006 and one since 2013). | |
| | | | | | |
| Claudia A. Brandon (1956) | | Executive Vice President since 2008 and Secretary since 1985 | | Senior Vice President, Neuberger, since 2007 and Employee since 1999; Senior Vice President, Management, since 2008 and Assistant Secretary since 2004; formerly, Vice President, Neuberger, 2002 to 2006; formerly, Vice President-Mutual Fund Board Relations, Management, 2000 to 2008; formerly, Vice President, Management, 1986 to 1999 and Employee 1984 to 1999; Executive Vice President, ten registered investment companies for which Management acts as investment manager and administrator (nine since 2008 and one since 2013); Secretary, ten registered investment companies for which Management acts as investment manager and administrator (three since 1985, three since 2002, one since 2003, one since 2005, one since 2006 and one since 2013). | |
| | | | | | |
| Agnes Diaz (1971) | | Vice President since 2013 | | Senior Vice President, Neuberger, since 2012; Employee, Management, since 1996; formerly, Vice President, Neuberger, 2007 to 2012; Vice President, ten registered investment companies for which Management acts as investment manager and administrator (ten since 2013). | |
| | | | | | |
| Anthony DiBernardo (1979) | | Assistant Treasurer since 2011 | | Vice President, Neuberger, since 2009; Employee, Management, since 2003; Assistant Treasurer, ten registered investment companies for which Management acts as investment manager and administrator (nine since 2011 and one since 2013). | |
| | | | | | |
| Sheila R. James (1965) | | Assistant Secretary since 2002 | | Vice President, Neuberger, since 2008 and Employee since 1999; formerly, Assistant Vice President, Neuberger, 2007; formerly, Employee, Management, 1991 to 1999; Assistant Secretary, ten registered investment companies for which Management acts as investment manager and administrator (six since 2002, one since 2003, one since 2005, one since 2006 and one since 2013). | |
| | | | | | |
| Brian Kerrane (1969) | | Vice President since 2008 | | Senior Vice President, Neuberger, since 2006; formerly, Vice President, Neuberger, 2002 to 2006; Vice President, Management, since 2008 and Employee since 1991; Vice President, ten registered investment companies for which Management acts as investment manager and administrator (nine since 2008 and one since 2013). | |
Name, (Year of Birth), and Address(1) | | Position(s) and Length of Time Served(2) | | Principal Occupation(s)(3) | |
| | | | | | |
| Kevin Lyons (1955) | | Assistant Secretary since 2003 | | Assistant Vice President, Neuberger, since 2008 and Employee since 1999; formerly, Employee, Management, 1993 to 1999; Assistant Secretary, ten registered investment companies for which Management acts as investment manager and administrator (seven since 2003, one since 2005, one since 2006 and one since 2013). | |
| | | | | | |
| Owen F. McEntee, Jr. (1961) | | Vice President since 2008 | | Vice President, Neuberger, since 2006; Employee, Management, since 1992; Vice President, ten registered investment companies for which Management acts as investment manager and administrator (nine since 2008 and one since 2013). | |
| | | | | | |
| John M. McGovern (1970) | | Treasurer and Principal Financial and Accounting Officer since 2005 | | Senior Vice President, Neuberger, since 2007; formerly, Vice President, Neuberger, 2004 to 2006; Employee, Management, since 1993; Treasurer and Principal Financial and Accounting Officer, ten registered investment companies for which Management acts as investment manager and administrator (eight since 2005, one since 2006 and one since 2013); formerly, Assistant Treasurer, eight registered investment companies for which Management acts as investment manager and administrator, 2002 to 2005. | |
| | | | | | |
| Frank Rosato (1971) | | Assistant Treasurer since 2005 | | Vice President, Neuberger, since 2006; Employee, Management, since 1995; Assistant Treasurer, ten registered investment companies for which Management acts as investment manager and administrator (eight since 2005, one since 2006 and one since 2013). | |
| | | | | | |
| Neil S. Siegel (1967) | | Vice President since 2008 | | Managing Director, Management, since 2008; Managing Director, Neuberger, since 2006; Managing Director NBFI, since 2011; formerly, Senior Vice President, Neuberger, 2004 to 2006; Vice President, ten registered investment companies for which Management acts as investment manager and administrator (nine since 2008 and one since 2013). | |
| | | | | | |
| Chamaine Williams (1971) | | Chief Compliance Officer since 2005 | | Senior Vice President, Neuberger, since 2007; Chief Compliance Officer, Management, since 2006; Chief Compliance Officer, ten registered investment companies for which Management acts as investment manager and administrator (eight since 2005, one since 2006 and one since 2013); formerly, Senior Vice President, LBI, 2007 to 2008; formerly, Vice President, LBI, 2003 to 2006; formerly, Chief Compliance Officer, Lehman Brothers Asset Management Inc., 2003 to 2007; formerly, Chief Compliance Officer, Lehman Brothers Alternative Investment Management LLC, 2003 to 2007. | |
(1) The business address of each listed person is 605 Third Avenue, New York, New York 10158.
(2) Pursuant to the By-Laws of the Trust, each officer elected by the Trustees shall hold office until his or her successor shall have been elected and qualified or until his or her earlier death, inability to serve, or resignation. Officers serve at the pleasure of the Trustees and may be removed at any time with or without cause.
(3) Except as otherwise indicated, each individual has held the positions shown for at least the last five years.
Proxy Voting Policies and Procedures
A description of the policies and procedures that the Trust uses to determine how to vote proxies relating to portfolio securities is available, without charge, by calling 800-877-9700 (toll-free) and on the website of the Securities and Exchange Commission at www.sec.gov. Information regarding how the Trust voted proxies relating to portfolio securities during the most recent 12-month period ended June 30 is also available, without charge, by calling 800-877-9700 (toll-free), on the website of the Securities and Exchange Commission at www.sec.gov, and on Management's website at www.nb.com.
Quarterly Portfolio Schedule
The Trust files a complete schedule of portfolio holdings for the Fund with the Securities and Exchange Commission for the first and third quarters of each fiscal year on Form N-Q. The Trust's Forms N-Q are available on the Securities and Exchange Commission's website at www.sec.gov and may be reviewed and copied at the Securities and Exchange Commission's Public Reference Room in Washington, DC. Information on the operation of the Public Reference Room may be obtained by calling 800-SEC-0330. The information on Form N-Q is available upon request, without charge, by calling 800-877-9700 (toll free).
Notice to Shareholders
0.15% of the dividends earned during the fiscal year ended December 31, 2013 qualifies for the dividends received deduction for corporate shareholders.
The Fund has elected to pass through to its shareholders the credits for taxes paid to foreign countries. For the fiscal year ended December 31, 2013, the Fund designates $44,500, or $0.02 per share outstanding, foreign taxes paid and $535,768, or $0.29 per share outstanding, foreign source income earned for Federal income tax purposes.
Board Consideration of the Management and Sub-Advisory Agreements
On an annual basis, the Board of Trustees ("Board") of Neuberger Berman Advisers Management Trust ("Trust"), including the Trustees who are not "interested persons" of Neuberger Berman Management LLC ("Management") (including its affiliates) or the Trust ("Independent Fund Trustees"), considers whether to continue the Management and Sub-Advisory Agreements ("Agreements") for International Equity Portfolio ("Fund"). At a meeting held on October 22-23, 2013, the Board, including the Independent Fund Trustees, approved the continuation of the Fund's Agreements.
In evaluating the Agreements, the Board, including the Independent Fund Trustees, reviewed extensive materials provided by Management in response to questions submitted by the Board and counsel for the Independent Fund Trustees, and met with senior representatives of Management regarding its personnel, operations and financial condition as they relate to the Fund. The annual contract review extends over at least two regular meetings of the Board to ensure that Management has time to respond to any questions the Independent Fund Trustees may have on their initial review of the materials and that the Independent Fund Trustees have time to consider those responses.
In connection with its deliberations, the Board also considered the broad range of information relevant to the annual contract review that is provided to the Board (including its various standing committees) at meetings throughout the year, including investment performance reports and related portfolio information for the Fund, as well as periodic reports on, among other matters, pricing and valuation; brokerage and execution; and compliance, shareholder and other services provided by Management and its affiliates. To assist the Board in its deliberations regarding the annual contract review, the Board has established a Contract Review Committee comprised of Independent Fund Trustees, as well as other committees that focus throughout the year on specific areas relevant to the annual contract review, such as Fund performance or compliance matters.
Throughout the process, the Independent Fund Trustees were advised by counsel that is experienced in Investment Company Act of 1940 matters and that is independent of Management. The Independent Fund Trustees received from independent counsel a memorandum discussing the legal standards for their consideration of the proposed continuation of the Agreements. During the course of the year and during their deliberations regarding the annual contract review, the Independent Fund Trustees met with such counsel separately from representatives of Management.
In connection with its approval of the continuation of the Agreements, the Board evaluated the terms of the Agreements, the overall fairness of the Agreements to the Fund and whether the Agreements were in the best interests of the Fund and its shareholders. The Board considered all factors it deemed relevant with respect to the Fund, including the following factors: (1) the nature, extent, and quality of the services provided by Management and Neuberger Berman LLC ("Neuberger"); (2) the investment performance of the Fund compared to a relevant market index and a peer group of investment companies; (3) the costs of the services provided and the profit or loss realized by Management and its affiliates from their relationship with the Fund; (4) the extent to which economies of scale might be realized as the Fund grows; and (5) whether fee levels reflect any such potential economies of scale for the benefit of investors in the Fund. While each Trustee may have attributed different weights to the various factors, the Board's determination to approve the continuation of the Agreements was based on a comprehensive consideration of all information provided to the Board throughout the year and specifically in connection with the annual contract review. The Board members did not identify any particular information or factor that was all-important or controlling. The Board focused on the overall costs and benefits of the Agreements relating to the Fund and, through the Fund, its shareholders.
With respect to the nature, extent and quality of the services provided, the Board considered the investment philosophy and decision-making processes of Management and Neuberger, and the qualifications, experience and capabilities of and the resources available to the portfolio management personnel of Management and Neuberger who perform services for the Fund. The Board noted that Management also provides certain administrative services, including fund accounting and compliance oversight. The Board also considered Management's and Neuberger's policies and practices regarding brokerage and allocation of portfolio transactions and reviewed the quality of the execution services that Management had provided. The Board also reviewed whether Management or Neuberger used brokers to execute Fund transactions that provide research and other services to Management or Neuberger and the types of benefits potentially derived from such services by Management, Neuberger, the Fund and other clients of Management and Neuberger. The Board also considered that Management's responsibilities include daily management of investment, operational, enterprise, legal, regulatory and compliance risks as they relate to the Fund, and considered information regarding Management's process for managing risk. In addition, the Board noted the positive compliance history of Management and Neuberger, as each firm has been free of significant reported compliance problems. The Board also considered the general structure of the portfolio manager compensation program and whether this structure provides appropriate incentives to act in the best interests of the Fund. As in past years, the Board also considered the manner in which Management addressed various non-routine matters that arose during the year, some of them a result of developments in the broader fund industry or the regulations governing it. In addition, the Board considered actions taken by Management and Neuberger in response to recent market conditions, including actions taken in response to changes in market volatility, and considered the overall performance of Management and Neuberger in this context.
With respect to investment performance, the Board considered information regarding the Fund's short-, intermediate- and long-term performance on both an absolute basis and relative to a relevant market index (or benchmark) and the average performance of a composite peer group (as constructed by an independent organization) of investment companies pursuing broadly similar strategies. The Board also reviewed performance in relation to certain measures of the degree of investment risk undertaken by the portfolio manager. The Board factored into its evaluation of the Fund's performance the limitations inherent in the methodology for constructing peer groups and determining which investment companies should be included in which peer groups. In this regard, the Board noted that performance, especially short-term performance, is only one of the factors that it deems relevant to its consideration of the Fund's Agreements and that, after considering all relevant factors, it may be appropriate to approve the continuation of the Agreements notwithstanding the Fund's recent performance.
With respect to the overall fairness of the Agreements, the Board considered the fee structure for the Fund under the Agreements as compared to a peer group of comparable funds and any fall-out benefits likely to accrue to Management or Neuberger or their affiliates from their relationship with the Fund. The Board also considered the profitability of Management and its affiliates from their association with the Fund. The Board reviewed a comparison of the Fund's management fee and overall expense ratio to a peer group of broadly comparable funds. The Board noted that the comparative management fee analysis includes, in the Fund's management fee, the separate administrative fee paid to Management, but it was not clear whether this was the case for all funds in the peer group. The Board considered the mean and median of the management fees and expense ratios of each peer group. In addition, the Board considered the contractual limit on expenses of the Fund. The Board noted that Management incurred a loss on the Fund during the review period. The Board also considered whether there were other funds that were advised or sub-advised by Management or its affiliates or separate accounts managed by Management or its affiliates with investment objectives, policies and strategies that were similar to those of the Fund. The Board compared the fees charged to the Fund to the fees charged to any such funds and/or separate accounts. The Board considered the appropriateness and reasonableness of any differences between the fees charged to the Fund and any such funds and/or separate accounts, including any breakpoints, and determined that any differences in fees and fee structures were consistent with the management and other services provided.
The Board also evaluated any apparent or anticipated economies of scale in relation to the services Management provides to the Fund. The Board considered whether the Fund's fee structure provides for a reduction of payments resulting from the use of breakpoints and whether any such breakpoints are set at appropriate asset levels. In concluding that the benefits accruing to Management and its affiliates by virtue of their relationship to the Fund were reasonable in light of the costs of providing the investment advisory and other services and the benefits accruing to the Fund, the Board reviewed specific data as to Management's profit or loss on the Fund for a recent period. The Board also carefully examined Management's cost allocation methodology.
Conclusions
In approving the Agreements, the Board concluded that the terms of each Agreement are fair and reasonable and that approval of the Agreements is in the best interests of the Fund and its shareholders. In reaching this determination, the Board considered that Management and Neuberger could be expected to provide a high level of service to the Fund; that the performance of the Fund was satisfactory over time; that the Fund's fee structure appeared to the Board to be reasonable given the nature, extent and quality of services provided; and that the benefits accruing to Management and its affiliates by virtue of their relationship to the Fund were reasonable in light of the costs of providing the investment advisory and other services and the benefits accruing to the Fund. The Board's conclusions may be based in part on its consideration of the Agreements in prior years and on the Board's ongoing regular review of Fund performance and operations throughout the year, in addition to material prepared specifically for the most recent annual review of the Agreements.
32