UNITED STATES
SECURITIES AND EXCHANGE COMMISSION
Washington, D.C. 20549
FORM N-CSR
CERTIFIED SHAREHOLDER REPORT OF REGISTERED MANAGEMENT
INVESTMENT COMPANIES
Investment Company Act file number | 811-3940 | |||||
|
| |||||
| Strategic Funds, Inc. |
| ||||
| (Exact name of Registrant as specified in charter) |
| ||||
|
|
| ||||
|
c/o The Dreyfus Corporation 200 Park Avenue New York, New York 10166 |
| ||||
| (Address of principal executive offices) (Zip code) |
| ||||
|
|
| ||||
| Michael A. Rosenberg, Esq. 200 Park Avenue New York, New York 10166 |
| ||||
| (Name and address of agent for service) |
| ||||
| ||||||
Registrant's telephone number, including area code: | (212) 922-6000 | |||||
|
| |||||
Date of fiscal year end:
| 8/31 |
| ||||
Date of reporting period: | 8/31/2010 |
| ||||
The following N-CSR relates only to the Registrant’s series listed below and does not affect the other series of the Registrant, which have different fiscal year ends and, therefore, different N-CSR reporting requirements. Separate N-CSR Forms will be filed for these series, as appropriate.
Dreyfus Conservative Allocation Fund
Dreyfus Growth Allocation Fund
Dreyfus Moderate Allocation Fund
| Dreyfus |
| Conservative |
| Allocation Fund |
ANNUAL REPORT August 31, 2010
Save time. Save paper. View your next shareholder report online as soon as it’s available. Log into www.dreyfus.com and sign up for Dreyfus eCommunications. It’s simple and only takes a few minutes.
The views expressed in this report reflect those of the portfolio manager only through the end of the period covered and do not necessarily represent the views of Dreyfus or any other person in the Dreyfus organization. Any such views are subject to change at any time based upon market or other conditions and Dreyfus disclaims any responsibility to update such views.These views may not be relied on as investment advice and, because investment decisions for a Dreyfus fund are based on numerous factors, may not be relied on as an indication of trading intent on behalf of any Dreyfus fund.

Contents | |
THE FUND | |
| 2 | A Letter from the Chairman and CEO |
| 3 | Discussion of Fund Performance |
| 6 | Fund Performance |
| 7 | Understanding Your Fund’s Expenses |
| 7 | Comparing Your Fund’s Expenses With Those of Other Funds |
| 8 | Statement of Investments |
| 9 | Statement of Assets and Liabilities |
| 10 | Statement of Operations |
| 11 | Statement of Changes in Net Assets |
| 12 | Financial Highlights |
| 13 | Notes to Financial Statements |
| 23 | Report of Independent Registered Public Accounting Firm |
| 24 | Important Tax Information |
| 25 | Board Members Information |
| 28 | Officers of the Fund |
FOR MORE INFORMATION | |
Back Cover |
| Dreyfus |
| Conservative |
| Allocation Fund |
The Fund

A LETTER FROM THE CHAIRMAN AND CEO
Dear Shareholder:
We are pleased to present this annual report for Dreyfus Conservative Allocation Fund, covering the period from the fund’s inception on October 1, 2009, through August 31, 2010.
As the summer of 2010 cooled off, so did the pace of the U.S. and global economic recoveries. Former engines of growth appeared to stall as large parts of the developed world remained indebted and burdened by weak housing markets.While some emerging markets have posted more impressive growth rates, their developing economies have not yet provided a meaningful boost to global economic activity.The result has been a subpar U.S. recovery with stubbornly high unemployment rates, low levels of consumer confidence and muted corporate investment.
Nonetheless, we do not expect a return to recessionary conditions, thanks to record low short-term interest rates and quantitative easing from the Federal Reserve Board. In addition, the corporate profit outlook continues to be positive for many U.S. companies that have taken advantage of improved demand while aggressively controlling costs. Consequently, we believe high-quality stocks, in general, are now attractive relative to other asset classes due to improved valuations, healthy corporate balance sheets and better-than-expected earnings. As always, your financial advisor is best-suited to help you evaluate and adjust your investments and potentially seize opportunities in this slow-growth economic context.
For information about how the fund performed during the reporting period, as well as general market perspectives, we provide a Discussion of Fund Performance on the pages that follow.
Thank you for your continued confidence and support.

Jonathan R. Baum
Chairman and Chief Executive Officer
The Dreyfus Corporation
September 15, 2010
2

DISCUSSION OF FUND PERFORMANCE
For the period of October 1, 2009, through August 31, 2010, as provided by Richard B. Hoey,A. Paul Disdier, CFA, Christopher E. Sheldon, CFA, and Keith L. Stransky, CFA, Portfolio Managers
Market and Fund Performance Overview
For the period between the fund’s inception on October 1, 2009, and August 31, 2010, Dreyfus Conservative Allocation Fund produced a total return of 4.91%.1 In comparison, the fund’s benchmark, the Standard & Poor’s 500 Composite Stock Price Index produced a total return of 1.16% for the same period. The secondary customized blended index composed of 40% Standard & Poor’s 500 Composite Stock Price Index and 60% Barclays Capital U.S. Aggregate Bond Index achieved 5.29% for the same period.2 After rallying over much of the reporting period, stocks and higher yielding bonds were driven lower over the spring and summer of 2010 by several economic setbacks.The fund produced higher returns than its benchmark, the Standard & Poor’s 500 Composite Stock Price Index, primarily due to the holdings investing in the underlying funds of investment grade bonds, which generally performed better.
The Fund’s Investment Approach
Dreyfus Conservative Allocation Fund seeks current income with some consideration for capital appreciation. In pursuing its goal, the fund normally allocates 40% of its assets to equity securities and 60% of its assets to fixed income securities.
The fund achieves its targeted asset allocation mix by investing in other mutual funds that are advised by The Dreyfus Corporation (Dreyfus). In turn, the underlying funds invest in a wide range of equity and fixed income securities, including U.S. large-, mid- and small-cap equities; international, global and emerging-market equities; and U.S. and international fixed income securities.
The fund’s portfolio managers, who comprise the Dreyfus Investment Committee, select the underlying funds based on their investment objectives and management policies, portfolio holdings, risk/reward profiles, historical performance, and other factors.As of August 31, 2010, the fund may invest in any of 33 underlying funds identified by the Dreyfus Investment Committee, which generally will select only certain, and not all, of the underlying funds for investment at any given time.
| The Fund | 3 |
DISCUSSION OF FUND PERFORMANCE (continued)
Economic Concerns Outweighed Corporate Performance
From the beginning of the reporting period through April 2010, the U.S. and global economies continued to recover from the Great Recession and financial crisis. Manufacturing activity increased and many corporations posted stronger earnings, propelling stocks, corporate bonds and commercial mortgage-backed securities higher.
However, in May 2010 several developments threatened the economic recovery. Europe was roiled by a sovereign debt crisis when Greece found itself unable to finance a heavy debt burden. Robust economic growth in China seemed to spark local inflationary pressures, and investors worried that remedial measures might dampen a major engine of global growth. In the United States, mixed data regarding unemployment and housing markets suggested that stubborn economic headwinds might constrain already mild growth.As a result, rallies among stocks and higher yielding bonds were derailed, and traditional safe havens such as U.S. government securities gained value.
Stock Selections Dampened Fund Performance
The fund achieved better results from its underlying fixed income investments, all of which produced higher returns than the fund’s fixed income benchmark. However, relative strength among underlying bond funds was not enough to fully offset weakness among their equity-oriented counterparts.
The fund’s performance also was bolstered by several allocation changes during the reporting period. In November 2009, we shifted 5% of the assets invested in Dreyfus/Newton International Equity Fund to Dreyfus International Stock Index Fund, which as an index fund, effectively gives the fund broader exposure to international stock markets. In January 2010, we shifted 25% of the emerging markets sector allocation from Emerging Markets Opportunity Fund, which had lagged market averages, to the better-performing Dreyfus Emerging Markets Fund. In May, we moved the remaining 25% of the total sector allocation from Emerging Markets Opportunity Fund to Dreyfus Emerging Markets Fund. In June, we shifted allocations within the domestic large cap space from Dreyfus Appreciation Fund to Dreyfus/The Boston Company Large Cap Core Fund.
Although the fund produced positive absolute returns, its performance was undermined by relatively weak returns from its underlying funds that invest in large- and midcap stocks, including Dreyfus Alpha Growth Fund, Dreyfus Strategic Value Fund, Dreyfus S&P STARS Opportunities Fund and Dreyfus/The Boston Company Small/Mid
4
Cap Growth Fund. In addition, Emerging Markets Opportunity Fund was a drag on relative performance early in the reporting period.
Remaining Cautiously Opportunistic
Although we remain concerned regarding recent economic weakness, we do not expect a return to recessionary conditions. Consequently, we are more optimistic regarding stocks than bonds. In our judgment, rising corporate earnings could lead to an increase in mergers-and-acquisitions activity, potentially benefiting stocks as companies begin to deploy some of the massive cash reserves currently on their balance sheets. In contrast, we expect bonds to trade within a relatively narrow range if, as we expect, interest rates remain low in a subpar economic expansion. We believe that these strategies—as well as the fund’s broadly diversified exposure to BNY Mellon Asset Management’s portfolio managers—positions the fund appropriately for today’s slow-growth environment.
September 15, 2010
| Please note: the position in any security highlighted with italicized typeface was sold during the | |
| reporting period. | |
| Equity funds are subject generally to market, market sector, market liquidity, issuer and investment | |
| style risks, among other factors, to varying degrees, all of which are more fully described in the | |
| fund’s prospectus. Stocks of small- and/or midcap companies often experience sharper price | |
| fluctuations than stocks of large-cap companies. | |
| Asset allocation and diversification cannot assure a profit or protect against loss. | |
| The ability of the fund to achieve its investment goal depends, in part, on the ability of the | |
| Dreyfus Investment Committee to allocate effectively the fund’s assets among the asset classes and | |
| the underlying funds.There can be no assurance that the actual allocations will be effective in | |
| achieving the fund’s investment goal.The underlying funds may not achieve their investment | |
| objectives, and their performance may be lower than that of the asset class the underlying funds | |
| were selected to represent. | |
| Bond funds are subject generally to interest rate, credit, liquidity and market risks, to varying | |
| degrees, all of which are more fully described in the fund's prospectus. Generally, all other factors | |
| being equal, bond prices are inversely related to interest-rate changes and rate increases can cause | |
| price declines. | |
| The fund’s performance will be influenced by political, social and economic factors affecting | |
| investments in foreign companies. Special risks associated with investments in foreign companies | |
| include exposure to currency fluctuations, less liquidity, less developed or less efficient trading | |
| markets, lack of comprehensive company information, political instability and differing auditing | |
| and legal standards.These risks are enhanced in emerging markets countries. | |
| 1 | Total return includes reinvestment of dividends and any capital gains paid. Past performance is no |
| guarantee of future results. Share price and investment return fluctuate such that upon redemption, | |
| fund shares may be worth more or less than their original cost. Return figure provided reflects the | |
| absorption of certain fund expenses by The Dreyfus Corporation pursuant to an agreement in | |
| effect through January 1, 2011, at which time it may be extended, terminated or modified. Had | |
| these expenses not been absorbed, the fund’s return would have been lower. | |
| 2 | SOURCE: LIPPER INC. — Reflects reinvestment of dividends and, where applicable, capital |
| gain distributions.The Standard & Poor’s 500 Composite Stock Price Index is a widely accepted, | |
| unmanaged index of U.S. stock market performance.The Barclays Capital U.S.Aggregate Bond | |
| Index is a widely accepted, unmanaged total return index of corporate, U.S. government and U.S. | |
| government agency debt instruments, mortgage-backed securities and asset-backed securities with an | |
| average maturity of 1-10 years. Investors cannot invest directly in any index. |
The Fund 5
FUND PERFORMANCE

Comparison of change in value of $10,000 investment in Dreyfus Conservative Allocation Fund with the Standard & Poor’s 500 Composite Stock Price Index and the Customized Blended Index
| Actual Aggregate Total Returns as of 8/31/10 | ||
| Inception | From | |
| Date | Inception | |
| Fund | 10/1/09 | 4.91% |
| Standard & Poor’s 500 | ||
| Composite Stock Price Index | 9/30/09 | 1.16% |
| Customized Blended Index | 9/30/09 | 5.29% |
| † Source: Lipper Inc. |
| Past performance is not predictive of future performance.The fund’s performance shown in the graph and table does not |
| reflect the deduction of taxes that a shareholder would pay on fund distributions or the redemption of fund shares. |
| The above graph compares a $10,000 investment made in Dreyfus Conservative Allocation Fund on 10/1/09 |
| (inception date) to a $10,000 investment made in two different indices: (1) the Standard & Poor’s 500 Composite |
| Stock Price Index (the “S&P 500 Index”) and (2) the Customized Blended Index.The Customized Blended Index is |
| calculated on a year-to-date basis. For comparative purposes, the value of each index on 9/30/09 is used as the |
| beginning value on 10/1/09.All dividends and capital gain distributions are reinvested. |
| The fund’s performance shown in the line graph takes into account all applicable fees and expenses.The S&P 500 Index |
| is a widely accepted, unmanaged index of U.S. stock market performance.The Customized Blended Index is composed of |
| the S&P 500 Index, 40% and the Barclays Capital U.S.Aggregate Bond Index (the “Barclays Index”), 60%.The |
| Barclays Index is a widely accepted, unmanaged index of corporate, government and government agency debt instruments, |
| mortgage-backed securities and asset-backed securities with an average maturity of 1-10 years. Unlike a mutual fund, the |
| indices are not subject to charges, fees and other expenses. Investors cannot invest directly in any index. Further |
| information relating to fund performance, including expense reimbursements, if applicable, is contained in the Expenses |
| section of the prospectus and elsewhere in this report. |
6
UNDERSTANDING YOUR FUND’S EXPENSES (Unaudited)
As a mutual fund investor, you pay ongoing expenses, such as management fees and other expenses. Using the information below, you can estimate how these expenses affect your investment and compare them with the expenses of other funds.You also may pay one-time transaction expenses, including sales charges (loads) and redemption fees, which are not shown in this section and would have resulted in higher total expenses. For more information, see your fund’s prospectus or talk to your financial adviser.
Review your fund’s expenses
The table below shows the expenses you would have paid on a $1,000 investment in Dreyfus Conservative Allocation Fund from March 1, 2010 to August 31, 2010. It also shows how much a $1,000 investment would be worth at the close of the period, assuming actual returns and expenses.
| Expenses and Value of a $1,000 Investment |
| assuming actual returns for the six months ended August 31, 2010 |
| Expenses paid per $1,000† | $ 3.66 |
| Ending value (after expenses) | $1,014.10 |
| COMPARING YOUR FUND’S EXPENSES |
| WITH THOSE OF OTHER FUNDS (Unaudited) |
Using the SEC’s method to compare expenses
The Securities and Exchange Commission (SEC) has established guidelines to help investors assess fund expenses. Per these guidelines, the table below shows your fund’s expenses based on a $1,000 investment, assuming a hypothetical 5% annualized return. You can use this information to compare the ongoing expenses (but not transaction expenses or total cost) of investing in the fund with those of other funds.All mutual fund shareholder reports will provide this information to help you make this comparison. Please note that you cannot use this information to estimate your actual ending account balance and expenses paid during the period.
| Expenses and Value of a $1,000 Investment |
| assuming a hypothetical 5% annualized return for the six months ended August 31, 2010 |
| Expenses paid per $1,000† | $ 3.67 |
| Ending value (after expenses) | $1,021.58 |
| † Expenses are equal to the fund’s annualized expense ratio of .72%, multiplied by the average account value over the |
| period, multiplied by 184/365 (to reflect the one-half year period). |
| The Fund | 7 |
| STATEMENT OF INVESTMENTS |
| August 31, 2010 |
| Registered Investment Companies—100.0% | Shares | Value ($) |
| Dreyfus Bond Market Index Fund, Basic Shares | 149,275 a | 1,616,650 |
| Dreyfus Emerging Markets Debt | ||
| Local Currency Fund, Cl. I | 32,370 a | 458,682 |
| Dreyfus Emerging Markets Fund, Cl. I | 12,573 a | 145,973 |
| Dreyfus Global Absolute Return Fund, Cl. I | 8,105 a,b | 99,126 |
| Dreyfus Global Real Estate Securities Fund, Cl. I | 7,521 a | 49,940 |
| Dreyfus High Yield Fund, Cl. I | 72,337 a | 460,786 |
| Dreyfus International Bond Fund, Cl. I | 27,466 a | 452,637 |
| Dreyfus International Stock Index Fund | 7,898 a | 103,071 |
| Dreyfus International Value Fund, Cl. I | 11,829 a | 122,544 |
| Dreyfus Midcap Value Fund, Cl. I | 4,060 a | 108,029 |
| Dreyfus Research Growth Fund, Cl. Z | 77,831 a | 568,947 |
| Dreyfus S&P Stars Opportunities Fund, Cl. I | 5,776 a,b | 105,172 |
| Dreyfus Select Managers Small Cap Value Fund, Cl. I | 6,569 a | 107,340 |
| Dreyfus Strategic Value Fund, Cl. I | 23,284 a | 542,527 |
| Dreyfus Total Return Advantage Fund, Cl. I | 116,216 a | 1,622,376 |
| Dreyfus U.S. Equity Fund, Cl. I | 25,360 a | 282,000 |
| Dreyfus/Newton International Equity Fund, Cl. I | 6,822 a | 107,110 |
| Dreyfus/The Boston Company Large Cap Core Fund, Cl. I | 10,038 a | 285,882 |
| Dreyfus/The Boston Company Small/Mid Cap Growth Fund, Cl. I | 9,557 a,b | 106,276 |
| International Stock Fund, Cl. I | 7,296 a | 86,898 |
| Total Investments (cost $7,427,622) | 100.0% | 7,431,966 |
| Cash and Receivables (Net) | 0.0% | (439) |
| Net Assets | 100.0% | 7,431,527 |
| a | Investment in affiliated mutual fund. |
| b | Non-income producing security. |
| Portfolio Summary (Unaudited)† | |||
| Value (%) | Value (%) | ||
| Mutual Funds: Domestic | 78.1 | Mutual Funds: Foreign | 21.9 |
| 100.0 | |||
| † Based on net assets. |
| See notes to financial statements. |
8
| STATEMENT OF ASSETS AND LIABILITIES |
| August 31, 2010 |
| Cost | Value | |
| Assets ($): | ||
| Investments in affiliated issuers— | ||
| See Statement of Investments—Note 1(c) | 7,427,622 | 7,431,966 |
| Cash | 7,103 | |
| Deferred assets | 17,927 | |
| Due from The Dreyfus Corporation and affiliates—Note 3(b) | 12,893 | |
| 7,469,889 | ||
| Liabilities ($): | ||
| Accrued expenses | 38,362 | |
| Net Assets ($) | 7,431,527 | |
| Composition of Net Assets ($): | ||
| Paid-in capital | 7,375,796 | |
| Accumulated undistributed investment income—net | 47,277 | |
| Accumulated net realized gain (loss) on investments | 4,110 | |
| Accumulated net unrealized appreciation | ||
| (depreciation) on investments | 4,344 | |
| Net Assets ($) | 7,431,527 | |
| Shares Outstanding | ||
| (100 million shares of $.001 par value Common Stock authorized) | 571,987 | |
| Net Asset Value, offering and redemption price per share ($) | 12.99 | |
| See notes to financial statements. |
| The Fund | 9 |
| STATEMENT OF OPERATIONS |
| From October 1, 2009 (commencement of operations) to August 31, 2010 |
| Investment Income ($): | |
| Income: | |
| Cash dividends from affiliated issuers | 97,854 |
| Expenses: | |
| Auditing fees | 36,022 |
| Legal fees | 23,568 |
| Registration fees | 22,197 |
| Shareholder servicing costs—Note 3(b) | 12,246 |
| Prospectus and shareholders’ reports | 4,673 |
| Custodian fees—Note 3(b) | 1,140 |
| Directors’ fees and expenses—Note 3(c) | 739 |
| Loan commitment fees—Note 2 | 4 |
| Miscellaneous | 5,548 |
| Total Expenses | 106,137 |
| Less—expense reimbursement from The Dreyfus | |
| Corporation due to undertaking—Note 3(a) | (78,099) |
| Less—waiver of shareholder servicing fees—Note 3(b) | (739) |
| Less—reduction in fees due to earnings credits—Note 1(b) | (17) |
| Net Expenses | 27,282 |
| Investment Income—Net | 70,572 |
| Realized and Unrealized Gain (Loss) on Investments—Note 4 ($): | |
| Net realized gain (loss) on investments in affiliated issuers | (3,168) |
| Capital gain distributions from affiliated issuers | 13,691 |
| Net Realized Gain (Loss) | 10,523 |
| Net unrealized appreciation (depreciation) on investments in affiliated issuers | 4,344 |
| Net Realized and Unrealized Gain (Loss) on Investments | 14,867 |
| Net Increase in Net Assets Resulting from Operations | 85,439 |
| See notes to financial statements. | |
10
| STATEMENT OF CHANGES IN NET ASSETS |
| From October 1, 2009 (commencement of operations) to August 31, 2010 |
| Operations ($): | |
| Investment income—net | 70,572 |
| Net realized gain (loss) on investments | 10,523 |
| Net unrealized appreciation (depreciation) on | |
| investments in affiliated issuers | 4,344 |
| Net Increase (Decrease) in Net Assets | |
| Resulting from Operations | 85,439 |
| Dividends to Shareholders from ($): | |
| Investment income—net | (30,094) |
| Capital Stock Transactions ($): | |
| Net proceeds from shares sold | 8,458,290 |
| Dividends reinvested | 26,748 |
| Cost of shares redeemed | (1,108,856) |
| Increase (Decrease) in Net Assets | |
| from Capital Stock Transactions | 7,376,182 |
| Total Increase (Decrease) in Net Assets | 7,431,527 |
| Net Assets ($): | |
| Beginning of Period | — |
| End of Period | 7,431,527 |
| Undistributed investment income—net | 47,277 |
| Capital Share Transactions (Shares): | |
| Shares sold | 655,759 |
| Shares issued for dividends reinvested | 2,103 |
| Shares redeemed | (85,875) |
| Net Increase (Decrease) in Shares Outstanding | 571,987 |
| See notes to financial statements. | |
| The Fund | 11 |
FINANCIAL HIGHLIGHTS
The following table describes the performance for the fiscal period from October 1, 2009 (commencement of operations) to August 31, 2010.Total return shows how much your investment in the fund would have increased (or decreased) during the period assuming you had reinvested all dividends and distributions.These figures have been derived from the fund’s financial statements.
| Per Share Data ($): | |
| Net asset value, beginning of period | 12.50 |
| Investment Operations: | |
| Investment income—neta | .20 |
| Net realized and unrealized | |
| gain (loss) on investments | .41 |
| Total from Investment Operations | .61 |
| Distributions: | |
| Dividends from investment income—net | (.12) |
| Net asset value, end of period | 12.99 |
| Total Return (%)b | 4.91 |
| Ratios/Supplemental Data (%): | |
| Ratio of total expenses to average net assetsc,d | 2.76 |
| Ratio of net expenses to average net assetsc,d | .71 |
| Ratio of net investment income | |
| to average net assetsc,d | 1.84 |
| Portfolio Turnover Rateb | 36.82 |
| Net Assets, end of period ($ x 1,000) | 7,432 |
| a | Based on average shares outstanding at each month end. |
| b | Not annualized. |
| c | Annualized. |
| d | Amounts do not include the activity of the underlying funds. |
See notes to financial statements.
12
NOTES TO FINANCIAL STATEMENTS
NOTE 1—Significant Accounting Policies:
Dreyfus Conservative Allocation Fund (the “fund”) is a separate diversified series of Strategic Funds, Inc. (the “Company”) which is registered under the Investment Company Act of 1940, as amended (the “Act”), as a open-end management investment company and operates as a series company currently offering eleven series, including the fund, which commenced operations on October 1, 2009. The fund’s investment objective is to seek current income with some consideration for capital appreciation.The Dreyfus Corporation (the “Manager” or “Dreyfus”), a wholly-owned subsidiary of The Bank of New York Mellon Corporation (“BNY Mellon”), serves as the fund’s investment adviser. MBSC Securities Corporation (the “Distributor”), a wholly-owned subsidiary of the Manager, is the distributor of the fund’s shares, which are sold to the public withou t a sales charge.
As of August 31, 2010, MBC Investments Corp., an indirect subsidiary of BNY Mellon, held 40,381 shares of the fund.
The Company accounts separately for the assets, liabilities and operations of each series. Expenses directly attributable to each series are charged to that series’ operations; expenses which are applicable to all series are allocated among them on a pro rata basis.
The Financial Accounting Standards Board (“FASB”) Accounting Standards Codification (“ASC”) has become the exclusive reference of authoritative U.S. generally accepted accounting principles (“GAAP”) recognized by the FASB to be applied by nongovernmental entities. Rules and interpretive releases of the Securities and Exchange Commission (“SEC”) under authority of federal laws are also sources of authoritative GAAP for SEC registrants. The ASC has superseded all existing non-SEC accounting and reporting standards. The fund’s financial statements are prepared in accordance with GAAP, which may require the use of management estimates and assumptions.Actual results could differ from those estimates.
| The Fund | 13 |
NOTES TO FINANCIAL STATEMENTS (continued)
The Company enters into contracts that contain a variety of indemnifications. The fund’s maximum exposure under these arrangements is unknown.The fund does not anticipate recognizing any loss related to these arrangements.
(a) Portfolio valuation: Investments in open-end investment companies are valued at the net asset value of each underlying fund determined as of the close of the New York Stock Exchange (generally 4 p.m., Eastern time) on the valuation date.
The fair value of a financial instrument is the amount that would be received to sell an asset or paid to transfer a liability in an orderly transaction between market participants at the measurement date (i.e. the exit price). GAAP establishes a fair value hierarchy that prioritizes the inputs of valuation techniques used to measure fair value.This hierarchy gives the highest priority to unadjusted quoted prices in active markets for identical assets or liabilities (Level 1 measurements) and the lowest priority to unobservable inputs (Level 3 measurements).
Additionally, GAAP provides guidance on determining whether the volume and activity in a market has decreased significantly and whether such a decrease in activity results in transactions that are not orderly. GAAP requires enhanced disclosures around valuation inputs and techniques used during annual and interim periods.
Various inputs are used in determining the value of the fund’s investments relating to fair value measurements.These inputs are summarized in the three broad levels listed below:
| Level 1—unadjusted quoted prices in active markets for |
| identical investments. |
| Level 2—other significant observable inputs (including quoted |
| prices for similar investments, interest rates, prepayment speeds, |
| credit risk, etc.). |
| Level 3—significant unobservable inputs (including the fund’s own |
| assumptions in determining the fair value of investments). |
14
The inputs or methodology used for valuing securities are not necessarily an indication of the risk associated with investing in those securities.
The following is a summary of the inputs used as of August 31, 2010 in valuing the fund’s investments:
| Level 1— | Level 2—Other | Level 3— | ||
| Unadjusted | Significant | Significant | ||
| Quoted | Observable | Unobservable | ||
| Prices | Inputs | Inputs | Total | |
| Assets ($) | ||||
| Investments in Securities: | ||||
| Mutual Funds | 7,431,966 | — | — | 7,431,966 |
In January 2010, FASB issued Accounting Standards Update (“ASU”) No. 2010-06 “Improving Disclosures about Fair Value Measurements”. The portions of ASU No. 2010-06 which require reporting entities to prepare new disclosures surrounding amounts and reasons for significant transfers in and out of Level 1 and Level 2 fair value measurements as well as inputs and valuation techniques used to measure fair value for both recurring and nonrecurring fair value measurements that fall in either Level 2 or Level 3 have been adopted by the fund. No significant transfers between Level 1 or Level 2 fair value measurements occurred at August 31, 2010.The remaining portion of ASU No. 2010-06 requires reporting entities to make new disclosures about information on purchases, sales, issuances and settlements on a gross basis in the reconciliation of activity in Level 3 fair value measurements.These new and revis ed disclosures are required to be implemented for fiscal years beginning after December 15, 2010. Management is currently evaluating the impact that the adoption of this remaining portion of ASU No. 2010-06 may have on the fund’s financial statement disclosures.
(b) Securities transactions and investment income: Securities transactions are recorded on a trade date basis. Realized gains and losses from securities transactions are recorded on the identified cost basis. Dividend income is recognized on the ex-dividend date and interest
| The Fund | 15 |
NOTES TO FINANCIAL STATEMENTS (continued)
income, including, where applicable, accretion of discount and amortization of premium on investments, is recognized on the accrual basis.
The fund has arrangements with the custodian and cash management bank whereby the fund may receive earnings credits when positive cash balances are maintained, which are used to offset custody and cash management fees. For financial reporting purposes, the fund includes net earnings credits as an expense offset in the Statement of Operations.
(c) Affiliated issuers: Investments in other investment companies advised by Dreyfus are defined as “affiliated” in the Act.
The fund may invest in shares of certain affiliated investment companies also advised or managed by Dreyfus. Investments in affiliated investment companies for the period ended August 31, 2010 were as follows:
| Affiliated | |||||
| Investment | Value | Dividends/ | |||
| Company | 10/1/2009 ($) | Purchases ($) | Sales ($) | Distributions ($) | |
| Dreyfus Alpha | |||||
| Growth Fund CI. I | — | 426,656 | 459,708 | 1,941 | |
| Dreyfus Appreciation Fund | — | 263,464 | 255,132 | 2,318 | |
| Dreyfus Bond Market | |||||
| Index Fund, Basic Shares | — | 1,768,763 | 201,888 | 29,844 | |
| Dreyfus Emerging | |||||
| Markets Debt Local | |||||
| Currency Fund, CI. I | — | 498,624 | 57,682 | 1,791 | |
| Dreyfus Emerging | |||||
| Markets Fund, CI. I | — | 162,063 | 16,867 | 353 | |
| Dreyfus Global Absolute | |||||
| Return Fund, CI. I | — | 110,959 | 12,882 | — | |
| Dreyfus Global Real Estate | |||||
| Securities Fund, CI. I | — | 55,877 | 6,345 | 1,225 | |
| Dreyfus High Yield | |||||
| Fund, CI. I | — | 520,852 | 57,682 | 24,018 | |
| Dreyfus International | |||||
| Bond Fund, CI. I | — | 503,367 | 57,682 | 6,534 | |
| Dreyfus International | |||||
| Stock Index Fund | — | 124,940 | 14,420 | 1,265 | |
| Dreyfus International | |||||
| Value Fund, CI. I | — | 149,791 | 17,305 | 740 | |
| Dreyfus Midcap | |||||
| Value Fund, CI. I | — | 124,468 | 14,421 | 259 | |
| Dreyfus Research | |||||
| Growth Fund, CI. Z | — | 639,791 | 24,533 | 584 | |
16
| Affiliated | |||||
| Investment | Value | Dividends/ | |||
| Company | 10/1/2009 ($) | Purchases ($) | Sales ($) | Distributions ($) | |
| Dreyfus S&P Stars | |||||
| Opportunities Fund, CI. I | — | 124,208 | 14,420 | — | |
| Dreyfus Select | |||||
| Managers Small Cap | |||||
| Value Fund, CI. I | — | 124,314 | 14,420 | 104 | |
| Dreyfus Strategic | |||||
| Value Fund, CI. I | — | 657,120 | 76,141 | 1,300 | |
| Dreyfus Total Return | |||||
| Advantage Fund, CI. I | — | 1,776,776 | 201,888 | 37,805 | |
| Dreyfus U.S. Equity | |||||
| Fund, CI. I | — | 338,302 | 39,224 | 456 | |
| Dreyfus/Newton International | |||||
| Equity Fund, CI. I | — | 130,613 | 19,949 | 344 | |
| Dreyfus/The Boston Company | |||||
| Large Cap Core | |||||
| Fund, CI. I | — | 294,187 | 1,578 | — | |
| Dreyfus/The Boston Company | |||||
| Small/Mid Cap | |||||
| Growth Fund, Cl. I | — | 124,209 | 14,421 | — | |
| Emerging Markets | |||||
| Opportunity Fund, CI. I | — | 39,719 | 37,887 | 292 | |
| International Stock | |||||
| Fund, CI. I | — | 99,738 | 11,536 | 372 | |
| Total | — | 9,058,801 | 1,628,011 | 111,545 | |
| Change in Net | ||||
| Affiliated | Unrealized | |||
| Investment | Net Realized | Appreciation | Value | Net |
| Company | Gain (Loss) ($) | (Depreciation) ($) | 8/31/2010 ($) | Assets (%) |
| Dreyfus Alpha | ||||
| Growth Fund CI. I | 33,052 | — | — | — |
| Dreyfus Appreciation | ||||
| Fund | (8,332) | — | — | — |
| Dreyfus Bond | ||||
| Market Index Fund, | ||||
| Basic Shares | (1,328) | 51,103 | 1,616,650 | 21.7 |
| Dreyfus Emerging | ||||
| Markets Debt Local | ||||
| Currency Fund, CI. I | (1,703) | 19,443 | 458,682 | 6.2 |
| Dreyfus Emerging | ||||
| Markets Fund, CI. I | (1,004) | 1,781 | 145,973 | 2.0 |
| Dreyfus Global Absolute | ||||
| Return Fund, CI. I | (188) | 1,237 | 99,126 | 1.3 |
| The Fund | 17 |
NOTES TO FINANCIAL STATEMENTS (continued)
| Change in Net | |||||
| Affiliated | Unrealized | ||||
| Investment | Net Realized | Appreciation | Value | Net | |
| Company | Gain (Loss) ($) | (Depreciation) ($) | 8/31/2010 ($) | Assets (%) | |
| Dreyfus Global Real | |||||
| Estate Securities | |||||
| Fund, CI. I | (394) | 802 | 49,940 | 0.7 | |
| Dreyfus High Yield | |||||
| Fund, CI. I | (1,555) | (829) | 460,786 | 6.2 | |
| Dreyfus International | |||||
| Bond Fund, CI. I | (2,314) | 9,266 | 452,637 | 6.1 | |
| Dreyfus International | |||||
| Stock Index Fund | (1,209) | (6,240) | 103,071 | 1.4 | |
| Dreyfus International | |||||
| Value Fund, CI. I | (1,169) | (8,773) | 122,544 | 1.7 | |
| Dreyfus Midcap | |||||
| Value Fund, CI. I | (750) | (1,268) | 108,029 | 1.5 | |
| Dreyfus Research | |||||
| Growth Fund, CI. Z | (1,719) | (44,592) | 568,947 | 7.7 | |
| Dreyfus S&P Stars | |||||
| Opportunities | |||||
| Fund, CI. I | (497) | (4,119) | 105,172 | 1.4 | |
| Dreyfus Select Managers | |||||
| Small Cap Value | |||||
| Fund, CI. I | (602) | (1,952) | 107,340 | 1.4 | |
| Dreyfus Strategic | |||||
| Value Fund, CI. I | (4,040) | (34,412) | 542,527 | 7.3 | |
| Dreyfus Total Return | |||||
| Advantage Fund, CI. I | (4,090) | 51,578 | 1,622,376 | 21.8 | |
| Dreyfus U.S. Equity | |||||
| Fund, CI. I | (1,431) | (15,647) | 282,000 | 3.8 | |
| Dreyfus/Newton | |||||
| International | |||||
| Equity Fund, CI. I | (939) | (2,615) | 107,110 | 1.4 | |
| Dreyfus/The Boston Company | |||||
| Large Cap Core | |||||
| Fund, CI. I | (38) | (6,689) | 285,882 | 3.8 | |
| Dreyfus/The Boston Company | |||||
| Small/Mid Cap | |||||
| Growth Fund, Cl. I | (562) | (2,950) | 106,276 | 1.4 | |
| Emerging Markets | |||||
| Opportunity Fund, CI. I | (1,832) | — | — | — | |
| International Stock | |||||
| Fund, CI. I | (524) | (780) | 86,898 | 1.2 | |
| Total | (3,168) | 4,344 | 7,431,966 | 100.0 | |
18
(d) Dividends to shareholders: Dividends are recorded on the ex-dividend date. Dividends from investment income-net and dividends from net realized capital gains, if any, are normally declared and paid annually, but the fund may make distributions on a more frequent basis to comply with the distribution requirements of the Internal Revenue Code of 1986, as amended (the “Code”).To the extent that net realized capital gains can be offset by capital loss carryovers, it is the policy of the fund not to distribute such gains. Income and capital gain distributions are determined in accordance with income tax regulations, which may differ from GAAP.
(e) Federal income taxes: It is the policy of the fund to continue to qualify as a regulated investment company, if such qualification is in the best interests of its shareholders, by complying with the applicable provisions of the Code, and to make distributions of taxable income sufficient to relieve it from substantially all federal income and excise taxes.
As of and during the period ended August 31, 2010, the fund did not have any liabilities for any uncertain tax positions.The fund recognizes interest and penalties, if any, related to uncertain tax positions as income tax expense in the Statement of Operations. During the period, the fund did not incur any interest or penalties.
The tax year for the period ended August 31, 2010 remains subject to examination by the Internal Revenue Service and state taxing authorities.
At August 31, 2010, the components of accumulated earnings on a tax basis were as follows: undistributed ordinary income $75,994, undistributed capital gains $2,063 and unrealized depreciation $22,326.
The tax character of distributions paid to shareholders during the fiscal period ended August 31, 2010 was as follows: ordinary income $30,094.
During the period ended August 31, 2010, as a result of permanent book to tax differences, primarily due to the tax treatment for fund start-up
| The Fund | 19 |
NOTES TO FINANCIAL STATEMENTS (continued)
costs and the reclass of short-term capital gain distributions from regulated investment company holdings, the fund increased accumulated undistributed investment income-net by $6,799, decreased accumulated net realized gain (loss) on investments by $6,413 and decreased paid-in capital by $386. Net assets and net asset value per share were not affected by this reclassification.
NOTE 2—Bank Lines of Credit:
The fund participates with other Dreyfus-managed funds in a $225 million unsecured credit facility led by Citibank, N.A. and a $300 million unsecured credit facility provided by The Bank of New York Mellon, a subsidiary of BNY Mellon and an affiliate of Dreyfus (each, a “Facility”), each to be utilized primarily for temporary or emergency purposes, including the financing of redemptions. In connection therewith, the fund has agreed to pay its pro rata portion of commitment fees for each Facility. Interest is charged to the fund based on rates determined pursuant to the terms of the respective Facility at the time of borrowing. During the period ended on August 31, 2010, the fund did not borrow under the Facilities.
NOTE 3—Management Fee and Other Transactions with Affiliates:
(a) Pursuant to a management agreement with the Manager, there is no management fee paid to the Manager. The fund invests in other mutual funds advised by the Manager. All fees and expenses of the underlying funds are reflected in the underlying funds’ net asset value.
The Manager has contractually agreed, until January 1, 2011, to assume the expenses of the fund so that the total annual fund and underlying fund’s operating expenses (excluding taxes, interest, brokerage commissions, commitment fees on borrowings and extraordinary expenses) do not exceed 1.40% of the value of the fund’s average daily net assets. The expense reimbursement, pursuant to the undertaking, amounted to $78,099 during the period ended August 31, 2010.
20
(b) Under the Shareholder Services Plan, the fund pays the Distributor at an annual rate of .25% of the value of the fund’s average daily net assets for the provision of certain services.The services provided may include personal services relating to shareholder accounts, such as answering shareholder inquiries regarding the fund’s shares and providing reports and other information, and services related to the maintenance of shareholder accounts.The Distributor may make payments to Service Agents (a securities dealer, financial institution or other industry professional) in respect of these services. The Distributor determines the amounts to be paid to Service Agents. Fees paid to the Distributor will be waived to the extent that the fund invests in an underlying affiliated fund with a shareholder services plan. Du ring the period ended August 31, 2010, the fund was charged $9,604 pursuant to the Shareholder Services Plan of which $739 was waived due to the fund’s investment in certain of the underlying funds.
The fund compensates DreyfusTransfer, Inc., a wholly-owned subsidiary of the Manager, under a transfer agency agreement for providing personnel and facilities to perform transfer agency services for the fund.
During the period ended August 31, 2010, the fund was charged $1,823 pursuant to the transfer agency agreement, which is included in Shareholder servicing costs in the Statement of Operations.
The fund compensates The Bank of New York Mellon under a cash management agreement for performing cash management services related to fund subscriptions and redemptions. During the period ended August 31, 2010, the fund was charged $241 pursuant to the cash management agreement, which is included in Shareholder servicing costs in the Statement of Operations.These fees were partially offset by earnings credits of $17.
The fund also compensates The Bank of New York Mellon under a custody agreement for providing custodial services for the fund.
| The Fund | 21 |
NOTES TO FINANCIAL STATEMENTS (continued)
During the period ended August 31, 2010, the fund was charged $1,140 pursuant to the custody agreement.
During the period ended August 31, 2010, the fund was charged $4,648 for services performed by the Chief Compliance Officer.
The components of “Due fromThe Dreyfus Corporation and affiliates” in the Statement of Assets and Liabilities consist of: shareholder services plan fees $1,521, custodian fees $354, chief compliance officer fees $673 and transfer agency per account fees $695, which are offset against an expense reimbursement currently in effect in the amount of $16,136.
(c) Each Board member also serves as a Board member of other funds within the Dreyfus complex. Annual retainer fees and attendance fees are allocated to each fund based on net assets.
NOTE 4—Securities Transactions:
The aggregate amount of purchases and sales of investment securities, excluding short-term securities, during the period ended August 31, 2010, amounted to $9,058,801 and $1,628,011, respectively.
The provisions of ASC Topic 815 “Derivatives and Hedging” require qualitative disclosures about objectives and strategies for using derivatives, quantitative disclosures about fair value amounts of gains and losses on derivative instruments and disclosures about credit-risk-related contingent features in derivative agreements.The fund held no derivatives during the period ended August 31, 2010.These disclosures did not impact the notes to the financial statements.
At August 31, 2010, the cost of investments for federal income tax purposes was $7,454,292; accordingly, accumulated net unrealized depreciation on investments was $22,326, consisting of $135,210 gross unrealized appreciation and $157,536 gross unrealized depreciation.
22
| REPORT OF INDEPENDENT REGISTERED |
| PUBLIC ACCOUNTING FIRM |
Shareholders and Board of Directors
Dreyfus Conservative Allocation Fund
We have audited the accompanying statement of assets and liabilities, including the statement of investments, of Dreyfus Conservative Allocation Fund (one of the series comprising Strategic Funds, Inc.) as of August 31, 2010, and the related statements of operations and changes in net assets and financial highlights for the period from October 1, 2009 (commencement of operations) to August 31, 2010. These financial statements and financial highlights are the responsibility of the Fund’s management. Our responsibility is to express an opinion on these financial statements and financial highlights based on our audit.
We conducted our audit in accordance with the standards of the Public Company Accounting Oversight Board (United States).Those standards require that we plan and perform the audit to obtain reasonable assurance about whether the financial statements and financial highlights are free of material misstatement.We were not engaged to perform an audit of the Fund’s internal control over financial reporting. Our audit included consideration of internal control over financial reporting as a basis for designing audit procedures that are appropriate in the circumstances, but not for the purpose of expressing an opinion on the effectiveness of the Fund’s internal control over financial reporting. Accordingly, we express no such opinion. An audit also includes examining, on a test basis, evidence supporting the amounts and disclosures in the financial statements and financial highlights, assessing the accounting pr inciples used and significant estimates made by management, and evaluating the overall financial statement presentation. Our procedures included confirmation of securities owned as of August 31, 2010 by correspondence with the custodian and others.We believe that our audit provides a reasonable basis for our opinion.
In our opinion, the financial statements and financial highlights referred to above present fairly, in all material respects, the financial position of Dreyfus Conservative Allocation Fund at August 31, 2010, and the results of its operations, the changes in its net assets and the financial highlights for the period from October 1, 2009 to August 31, 2010, in conformity with U.S. generally accepted accounting principles.

| New York, New York |
| October 25, 2010 |
| The Fund | 23 |
IMPORTANT TAX INFORMATION (Unaudited)
For federal tax purposes, the fund hereby designates 89.04% of the ordinary dividends paid during the fiscal year ended August 31, 2010 as qualifying for the corporate dividends received deduction.Also certain dividends paid by the fund may be subject to a maximum tax rate of 15%, as provided for by the Jobs and Growth Tax Relief Reconciliation Act of 2003. Of the distributions paid during the fiscal year, $30,094 represents the maximum amount that may be considered qualified dividend income. Shareholders will receive notification in early 2011 of the percentage applicable to the preparation of their 2010 income tax returns.
24
BOARD MEMBERS INFORMATION (Unaudited)
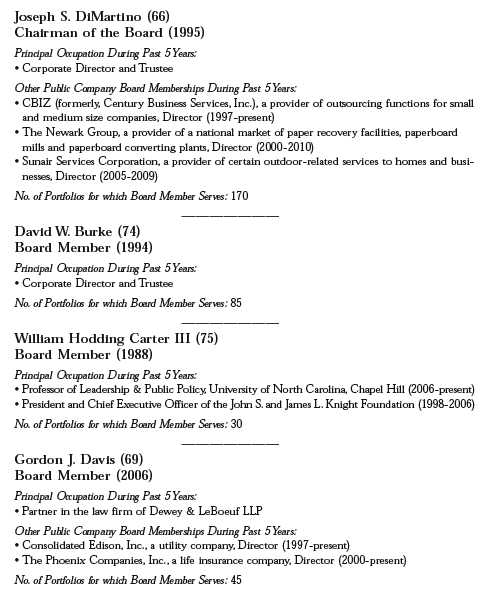
| The Fund | 25 |
BOARD MEMBERS INFORMATION (Unaudited) (continued)

26
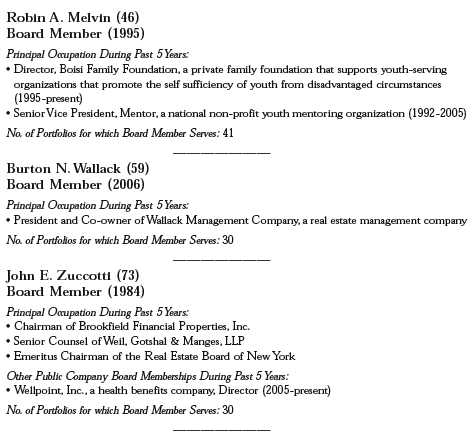
Once elected all Board Members serve for an indefinite term, but achieve Emeritus status upon reaching age 80.The address of the Board Members and Officers is in c/o The Dreyfus Corporation, 200 Park Avenue, NewYork, NewYork 10166.Additional information about the Board Members is available in the fund’s Statement of Additional Information which can be obtained from Dreyfus free of charge by calling this toll free number: 1-800-554-4611.
Arnold S. Hiatt, Emeritus Board Member
| The Fund | 27 |
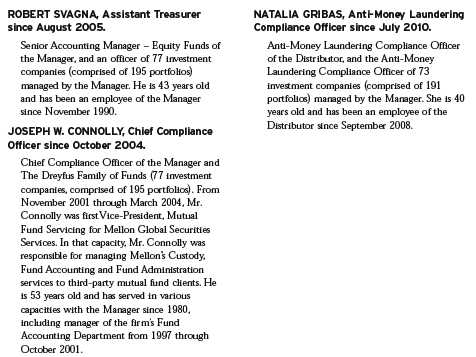
OFFICERS OF THE FUND (Unaudited)

28
| The Fund | 29 |
OFFICERS OF THE FUND (Unaudited) (continued)
30
NOTES
For More Information
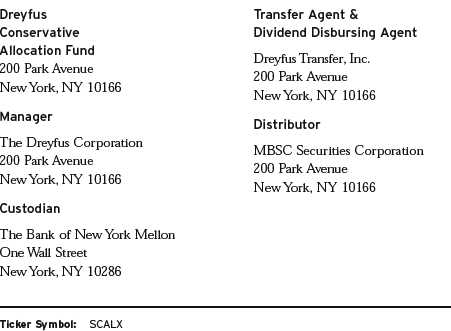
Telephone Call your financial representative or 1-800-554-4611
Mail The Dreyfus Family of Funds, 144 Glenn Curtiss Boulevard, Uniondale, NY 11556-0144
The fund files its complete schedule of portfolio holdings with the Securities and Exchange Commission (“SEC”) for the first and third quarters of each fiscal year on Form N-Q. The fund’s Forms N-Q are available on the SEC’s website at http://www.sec.gov and may be reviewed and copied at the SEC’s Public Reference Room in Washington, DC. Information on the operation of the Public Reference Room may be obtained by calling 1-800-SEC-0330.
A description of the policies and procedures that the fund uses to determine how to vote proxies relating to portfolio securities, and information regarding how the fund voted these proxies for the most recent 12-month period ended June 30 is available at http://www.dreyfus.com and on the SEC’s website at http://www.sec.gov. The description of the policies and procedures is also available without charge, upon request, by calling 1-800-645-6561.

| Dreyfus |
| Growth Allocation Fund |
ANNUAL REPORT August 31, 2010
Save time. Save paper. View your next shareholder report online as soon as it’s available. Log into www.dreyfus.com and sign up for Dreyfus eCommunications. It’s simple and only takes a few minutes.
The views expressed in this report reflect those of the portfolio manager only through the end of the period covered and do not necessarily represent the views of Dreyfus or any other person in the Dreyfus organization. Any such views are subject to change at any time based upon market or other conditions and Dreyfus disclaims any responsibility to update such views.These views may not be relied on as investment advice and, because investment decisions for a Dreyfus fund are based on numerous factors, may not be relied on as an indication of trading intent on behalf of any Dreyfus fund.

Contents | |
THE FUND | |
| 2 | A Letter from the Chairman and CEO |
| 3 | Discussion of Fund Performance |
| 6 | Fund Performance |
| 7 | Understanding Your Fund’s Expenses |
| 7 | Comparing Your Fund’s Expenses With Those of Other Funds |
| 8 | Statement of Investments |
| 9 | Statement of Assets and Liabilities |
| 10 | Statement of Operations |
| 11 | Statement of Changes in Net Assets |
| 12 | Financial Highlights |
| 13 | Notes to Financial Statements |
| 23 | Report of Independent Registered Public Accounting Firm |
| 24 | Important Tax Information |
| 25 | Board Members Information |
| 28 | Officers of the Fund |
FOR MORE INFORMATION | |
Back Cover |
Dreyfus
Growth Allocation Fund
The Fund

A LETTER FROM THE CHAIRMAN AND CEO
Dear Shareholder:
We are pleased to present this annual report for Dreyfus Growth Allocation Fund, covering the period from the fund’s inception on October 1, 2009, through August 31, 2010.
As the summer of 2010 cooled off, so did the pace of the global economic recovery. Former engines of growth appeared to stall as large parts of the developed world remained indebted and burdened by weak housing markets. While some emerging markets have posted more impressive growth rates, their developing economies have not yet provided a meaningful boost to global economic activity.The result has been a subpar worldwide recovery with stubbornly high unemployment rates, low levels of consumer confidence and muted corporate investment.
Nonetheless, we do not expect a return to recessionary conditions, thanks to stimulative monetary and fiscal policies in many countries. In addition, the corporate profit outlook continues to be positive as companies have taken advantage of improved demand while aggressively controlling costs. Consequently, we believe international stocks may offer a wider range of investment opportunity, due to improved valuations, healthy corporate balance sheets and better-than-expected earnings. However, selectivity and attention to company-specific fundamentals are likely to be keys to investment success over the foreseeable future.As always, your financial advisor is best-suited to help you evaluate and adjust your global exposure and potentially seize opportunities in this slow-growth economic context.
For information about how the fund performed during the reporting period, as well as general market perspectives, we provide a Discussion of Fund Performance on the pages that follow.
Thank you for your continued confidence and support.

Jonathan R. Baum
Chairman and Chief Executive Officer
The Dreyfus Corporation
September 15, 2010
2

DISCUSSION OF FUND PERFORMANCE
For the period of October 1, 2009, through August 31, 2010, as provided by Richard B. Hoey,A. Paul Disdier, Christopher E. Sheldon, CFA, and Keith L. Stransky, CFA, Portfolio Managers
Market and Fund Performance Overview
For the period between the fund’s inception on October 1, 2009, and August 31, 2010, Dreyfus Growth Allocation Fund produced a total return of 3.26%.1 In comparison, the fund’s benchmark, the Standard & Poor’s 500 Composite Stock Price Index produced a total return of 1.16% for the same period.The secondary customized blended index composed of 80% Standard & Poor’s 500 Composite Stock Price Index and 20% Barclays Capital U.S. Aggregate Bond Index achieved 2.54% for the same period.2 After rallying over much of the reporting period, stocks and higher yielding bonds were d riven lower over the spring and summer of 2010 by several economic setbacks.The fund produced higher returns than its benchmark, the Standard & Poor’s 500 Composite Stock Price Index, primarily due to the holdings investing in the underlying funds of investment grade bonds, which generally performed better.
The Fund’s Investment Approach
Dreyfus Growth Allocation Fund seeks long-term capital appreciation with some consideration for current income. In pursuing its goal, the fund normally allocates 80% of its assets to equity securities and 20% of its assets to fixed income securities.
The fund achieves its targeted asset allocation mix by investing in other mutual funds that are advised by The Dreyfus Corporation (Dreyfus). In turn, the underlying funds invest in a wide range of equity and fixed income securities, including U.S. large-, mid- and small-cap equities; international, global and emerging-market equities; and U.S. and international fixed income securities.
The fund’s portfolio managers, who comprise the Dreyfus Investment Committee, select the underlying funds based on their investment objectives and management policies, portfolio holdings, risk/reward profiles, historical performance and other factors.As of August 31, 2010, the fund may invest in any of 33 underlying funds identified by the Dreyfus Investment Committee, which generally will select only certain, and not all, of the underlying funds for investment at any given time.
| The Fund | 3 |
DISCUSSION OF FUND PERFORMANCE (continued)
Economic Concerns Outweighed Corporate Performance
From the beginning of the reporting period through April 2010, the U.S. and global economies continued to recover from the Great Recession and financial crisis. Manufacturing activity increased and many corporations posted stronger earnings, propelling stocks, corporate bonds and commercial mortgage-backed securities higher.
However, in May 2010 several developments threatened the economic recovery. Europe was roiled by a sovereign debt crisis when Greece found itself unable to finance a heavy debt burden. Robust economic growth in China seemed to spark local inflationary pressures, and investors worried that remedial measures might dampen a major engine of global growth. In the United States, mixed data regarding unemployment and housing markets suggested that stubborn economic headwinds might constrain already mild growth.As a result, rallies among stocks and higher yielding bonds were derailed, and traditional safe havens such as U.S. government securities gained value.
U.S. Stocks Dampened Fund Performance
The fund achieved better results from its underlying fixed income investments, all of which produced higher returns than the fund’s fixed income benchmark. However, relative strength among underlying bond funds was not enough to fully offset weakness among their equity-oriented counterparts.
The fund’s performance also was bolstered by several allocation changes during the reporting period. In November 2009, we shifted 5% of the assets invested in Dreyfus/Newton International Equity Fund to Dreyfus International Stock Index Fund, which as an index fund may effectively give the fund broader exposure to international stock markets. In January 2010, we shifted 25% of the emerging markets sector allocation from Emerging Markets Opportunity Fund, which had lagged market averages, to the better-performing Dreyfus Emerging Markets Fund. In May, we moved the remaining 25% of the total sector allocation from Emerging Markets Opportunity Fund to Dreyfus Emerging Markets Fund. In June, we shifted allocations within the domestic large cap space from Dreyfus Appreciation Fund to Dreyfus/The Boston Company Large Cap Core Fund.
Although the fund produced positive absolute returns, its performance was undermined by relatively weak returns from its underlying funds investing in large- and midcap stocks, including Dreyfus Alpha Growth Fund, Dreyfus StrategicValue Fund, Dreyfus S&P STARS Opportunities Fund and Dreyfus/The Boston Company Small/Mid Cap Growth
4
Fund. In addition, Emerging Markets Opportunity Fund was a drag on relative performance early in the reporting period.
Remaining Cautiously Opportunistic
Although we remain concerned regarding recent economic weakness, we do not expect a return to recessionary conditions. Consequently, we have maintained the fund’s emphasis on stocks over bonds. In our judgment, rising corporate earnings could lead to an increase in mergers-and-acquisitions activity, potentially benefiting stocks as companies begin to deploy some of the massive cash reserves currently on their balance sheets. In contrast, we expect bonds to trade within a relatively narrow range if, as we expect, interest rates remain low in a subpar economic expansion.We believe that these strategies—as well as the fund’s broadly diversified exposure to BNY Mellon Asset Management’s portfolio managers—position the fund appropriately for today’s slow-growth environment.
September 15, 2010
| Please note: the position in any security highlighted with italicized typeface was sold during the | |
| reporting period. | |
| Equity funds are subject generally to market, market sector, market liquidity, issuer and investment | |
| style risks, among other factors, to varying degrees, all of which are more fully described in the | |
| fund’s prospectus. Stocks of small- and/or midcap companies often experience sharper price | |
| fluctuations than stocks of large-cap companies. | |
| Asset allocation and diversification cannot assure a profit or protect against loss. | |
| The ability of the fund to achieve its investment goal depends, in part, on the ability of the | |
| Dreyfus Investment Committee to allocate effectively the fund’s assets among the asset classes and | |
| the underlying funds.There can be no assurance that the actual allocations will be effective in | |
| achieving the fund’s investment goal.The underlying funds may not achieve their investment | |
| objectives, and their performance may be lower than that of the asset class the underlying funds | |
| were selected to represent. | |
| Bond funds are subject generally to interest rate, credit, liquidity and market risks, to varying | |
| degrees, all of which are more fully described in the fund’s prospectus. Generally, all other factors | |
| being equal, bond prices are inversely related to interest-rate changes, and rate increases can cause | |
| price declines. | |
| The fund’s performance will be influenced by political, social and economic factors affecting | |
| investments in foreign companies. Special risks associated with investments in foreign companies | |
| include exposure to currency fluctuations, less liquidity, less developed or less efficient trading | |
| markets, lack of comprehensive company information, political instability and differing auditing | |
| and legal standards.These risks are enhanced in emerging markets countries. | |
| 1 | Total return includes reinvestment of dividends and any capital gains paid. Past performance is no |
| guarantee of future results. Share price and investment return fluctuate such that upon redemption, | |
| fund shares may be worth more or less than their original cost. Return figure provided reflects the | |
| absorption of certain fund expenses by The Dreyfus Corporation pursuant to an agreement in | |
| effect through January 1, 2011, at which time it may be extended, terminated or modified. Had | |
| these expenses not been absorbed, the fund’s return would have been lower. | |
| 2 | SOURCE: LIPPER INC. — Reflects reinvestment of dividends and, where applicable, capital |
| gain distributions.The Standard & Poor’s 500 Composite Stock Price Index is a widely accepted, | |
| unmanaged index of U.S. stock market performance.The Barclays Capital U.S.Aggregate Bond | |
| Index is a widely accepted, unmanaged total return index of corporate, U.S. government and U.S. | |
| government agency debt instruments, mortgage-backed securities and asset-backed securities with an | |
| average maturity of 1-10 years. Investors cannot invest directly in any index. |
| The Fund | 5 |
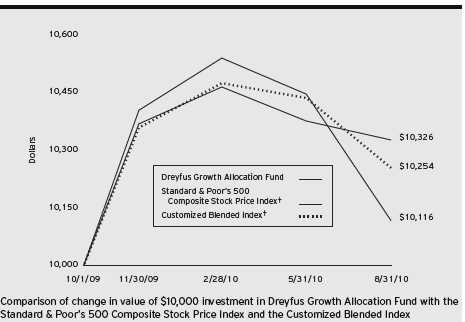
FUND PERFORMANCE
| Actual Aggregate Total Returns as of 8/31/10 | ||
| Inception | From | |
| Date | Inception | |
| Fund | 10/1/09 | 3.26% |
| Standard & Poor’s 500 | ||
| Composite Stock Price Index | 9/30/09 | 1.16% |
| Customized Blended Index | 9/30/09 | 2.54% |
| † Source: Lipper Inc. |
| Past performance is not predictive of future performance.The fund’s performance shown in the graph and table does not |
| reflect the deduction of taxes that a shareholder would pay on fund distributions or the redemption of fund shares. |
| The above graph compares a $10,000 investment made in Dreyfus Growth Allocation Fund on 10/1/09 (inception |
| date) to a $10,000 investment made in two different indices: (1) the Standard & Poor’s 500 Composite Stock Price |
| Index (the “S&P 500 Index”) and (2) the Customized Blended Index.The Customized Blended Index is calculated |
| on a year-to-date basis. For comparative purposes, the value of each index on 9/30/09 is used as the beginning value on |
| 10/1/09.All dividends and capital gain distributions are reinvested. |
| The fund’s performance shown in the line graph takes into account all applicable fees and expenses.The S&P 500 Index |
| is a widely accepted, unmanaged index of U.S. stock market performance.The Customized Blended Index is composed of |
| the S&P 500 Index, 80%, and the Barclays Capital U.S.Aggregate Bond Index (the “Barclays Index”), 20%.The |
| Barclays Index is a widely accepted, unmanaged index of corporate, government and government agency debt instruments, |
| mortgage-backed securities and asset-backed securities with an average maturity of 1-10 years. Unlike a mutual fund, the |
| indices are not subject to charges, fees and other expenses. Investors cannot invest directly in any index. Further |
| information relating to fund performance, including expense reimbursements, if applicable, is contained in the Expenses |
| section of the prospectus and elsewhere in this report. |
6
UNDERSTANDING YOUR FUND’S EXPENSES (Unaudited)
As a mutual fund investor, you pay ongoing expenses, such as management fees and other expenses. Using the information below, you can estimate how these expenses affect your investment and compare them with the expenses of other funds.You also may pay one-time transaction expenses, including sales charges (loads) and redemption fees, which are not shown in this section and would have resulted in higher total expenses. For more information, see your fund’s prospectus or talk to your financial adviser.
Review your fund’s expenses
The table below shows the expenses you would have paid on a $1,000 investment in Dreyfus Growth Allocation Fund from March 1, 2010 to August 31, 2010. It also shows how much a $1,000 investment would be worth at the close of the period, assuming actual returns and expenses.
Expenses and Value of a $1,000 Investment
assuming actual returns for the six months ended August 31, 2010
| Expenses paid per $1,000† | $ 2.85 |
| Ending value (after expenses) | $986.90 |
| COMPARING YOUR FUND’S EXPENSES |
| WITH THOSE OF OTHER FUNDS (Unaudited) |
Using the SEC’s method to compare expenses
The Securities and Exchange Commission (SEC) has established guidelines to help investors assess fund expenses. Per these guidelines, the table below shows your fund’s expenses based on a $1,000 investment, assuming a hypothetical 5% annualized return. You can use this information to compare the ongoing expenses (but not transaction expenses or total cost) of investing in the fund with those of other funds.All mutual fund shareholder reports will provide this information to help you make this comparison. Please note that you cannot use this information to estimate your actual ending account balance and expenses paid during the period.
Expenses and Value of a $1,000 Investment
assuming a hypothetical 5% annualized return for the six months ended August 31, 2010
| Expenses paid per $1,000† | $ 2.91 |
| Ending value (after expenses) | $1,022.33 |
| † Expenses are equal to the fund’s annualized expense ratio of .57% ,multiplied by the average account value over the |
| period, multiplied by 184/365 (to reflect the one-half year period). |
| The Fund | 7 |
| STATEMENT OF INVESTMENTS |
| August 31, 2010 |
| Registered Investment Companies—99.9% | Shares | Value ($) | |
| Dreyfus Bond Market Index Fund, Basic Shares | 36,956 | a | 400,229 |
| Dreyfus Emerging Markets Debt Local Currency Fund, Cl. I | 7,955 | a | 112,728 |
| Dreyfus Emerging Markets Fund, Cl. I | 18,411 | a | 213,747 |
| Dreyfus Global Absolute Return Fund, Cl. I | 41,786 | a,b | 511,040 |
| Dreyfus Global Real Estate Securities Fund, Cl. I | 38,712 | a | 257,047 |
| Dreyfus High Yield Fund, Cl. I | 17,837 | a | 113,621 |
| Dreyfus International Bond Fund, Cl. I | 6,752 | a | 111,275 |
| Dreyfus International Stock Index Fund | 11,467 | a | 149,647 |
| Dreyfus International Value Fund, Cl. I | 17,086 | a | 177,010 |
| Dreyfus Midcap Value Fund, Cl. I | 4,937 | a | 131,363 |
| Dreyfus Research Growth Fund, Cl. Z | 94,940 | a | 694,009 |
| Dreyfus S&P Stars Opportunities Fund, Cl. I | 7,032 | a,b | 128,045 |
| Dreyfus Select Managers Small Cap Value Fund, Cl. I | 7,971 | a | 130,242 |
| Dreyfus Strategic Value Fund, Cl. I | 28,229 | a | 657,742 |
| Dreyfus Total Return Advantage Fund, Cl. I | 28,785 | a | 401,847 |
| Dreyfus U.S. Equity Fund, Cl. I | 30,956 | a | 344,228 |
| Dreyfus/Newton International Equity Fund, Cl. I | 9,847 | a | 154,597 |
| Dreyfus/The Boston Company Large Cap Core Fund, Cl. I | 12,256 | a | 349,054 |
| Dreyfus/The Boston Company | |||
| Small/Mid Cap Growth Fund, Cl. I | 11,588 | a,b | 128,860 |
| International Stock Fund, Cl. I | 10,682 | a | 127,221 |
| Total Investments (cost $5,425,660) | 99.9% | 5,293,552 | |
| Cash and Receivables (Net) | .1% | 7,554 | |
| Net Assets | 100.0% | 5,301,106 | |
| a | Investment in affiliated mutual fund. |
| b | Non-income producing security. |
| Portfolio Summary (Unaudited)† | |||
| Value (%) | Value (%) | ||
| Mutual Funds: Domestic | 65.6 | Mutual Funds: Foreign | 34.2 |
| 99.8 | |||
| † Based on net assets. |
| See notes to financial statements. |
8
| STATEMENT OF ASSETS AND LIABILITIES |
| August 31, 2010 |
| Cost | Value | |
| Assets ($): | ||
| Investments in affiliated issuers— | ||
| See Statement of Investments—Note 1(c) | 5,425,660 | 5,293,552 |
| Cash | 21,293 | |
| Receivable for shares of Common Stock subscribed | 864 | |
| Deferred assets | 13,655 | |
| Due from The Dreyfus Corporation and affiliates—Note 3(b) | 11,477 | |
| 5,340,841 | ||
| Liabilities ($): | ||
| Accrued expenses | 39,735 | |
| Net Assets ($) | 5,301,106 | |
| Composition of Net Assets ($): | ||
| Paid-in capital | 5,441,407 | |
| Accumulated undistributed investment income—net | 6,343 | |
| Accumulated net realized gain (loss) on investments | (14,536) | |
| Accumulated net unrealized appreciation | ||
| (depreciation) on investments | (132,108) | |
| Net Assets ($) | 5,301,106 | |
| Shares Outstanding | ||
| (100 million shares of $.001 par value Common Stock authorized) | 414,656 | |
| Net Asset Value, offering and redemption price per share ($) | 12.78 | |
| See notes to financial statements. | ||
| The Fund | 9 |
| STATEMENT OF OPERATIONS |
| From October 1, 2009 (commencement of operations) to August 31, 2010 |
| Investment Income ($): | |
| Income: | |
| Cash dividends from affiliated issuers | 46,571 |
| Expenses: | |
| Auditing fees | 36,030 |
| Legal fees | 24,558 |
| Registration fees | 23,813 |
| Shareholder servicing costs—Note 3(b) | 11,380 |
| Prospectus and shareholders’ reports | 6,751 |
| Custodian fees—Note 3(b) | 1,174 |
| Directors’ fees and expenses—Note 3(c) | 1,079 |
| Loan commitment fees—Note 2 | 4 |
| Miscellaneous | 3,734 |
| Total Expenses | 108,523 |
| Less—expense reimbursement from The Dreyfus | |
| Corporation due to undertaking—Note 3(a) | (88,718) |
| Less—waiver of shareholder servicing fees—Note 3(b) | (1,110) |
| Less—reduction in fees due to earnings credits—Note 1(b) | (19) |
| Net Expenses | 18,676 |
| Investment Income—Net | 27,895 |
| Realized and Unrealized Gain (Loss) on Investments—Note 4 ($): | |
| Net realized gain (loss) on investments in affiliated issuers | (16,753) |
| Capital gain distributions from affiliated issuers | 3,951 |
| Net Realized Gain (Loss) | (12,802) |
| Net unrealized appreciation (depreciation) | |
| on investments in affiliated issuers | (132,108) |
| Net Realized and Unrealized Gain (Loss) on Investments | (144,910) |
| Net (Decrease) in Net Assets Resulting from Operations | (117,015) |
| See notes to financial statements. | |
10
| STATEMENT OF CHANGES IN NET ASSETS |
| From October 1, 2009 (commencement of operations) to August 31, 2010 |
| Operations ($): | |
| Investment income—net | 27,895 |
| Net realized gain (loss) on investments | (12,802) |
| Net unrealized appreciation (depreciation) | |
| on investments in affiliated issuers | (132,108) |
| Net Increase (Decrease) in Net Assets | |
| Resulting from Operations | (117,015) |
| Dividends to Shareholders from ($): | |
| Investment income—net | (23,500) |
| Capital Stock Transactions ($): | |
| Net proceeds from shares sold | 6,236,789 |
| Dividends reinvested | 23,218 |
| Cost of shares redeemed | (818,386) |
| Increase (Decrease) in Net Assets | |
| from Capital Stock Transactions | 5,441,621 |
| Total Increase (Decrease) in Net Assets | 5,301,106 |
| Net Assets ($): | |
| Beginning of Period | — |
| End of Period | 5,301,106 |
| Undistributed investment income—net | 6,343 |
| Capital Share Transactions (Shares): | |
| Shares sold | 476,752 |
| Shares issued for dividends reinvested | 1,789 |
| Shares redeemed | (63,885) |
| Net Increase (Decrease) in Shares Outstanding | 414,656 |
| See notes to financial statements. | |
| The Fund | 11 |
FINANCIAL HIGHLIGHTS
The following table describes the performance for the fiscal period from October 1, 2009 (commencement of operations) to August 31, 2010.Total return shows how much your investment in the fund would have increased (or decreased) during the period assuming you had reinvested all dividends and distributions.These figures have been derived from the fund’s financial statements.
| Per Share Data ($): | |
| Net asset value, beginning of period | 12.50 |
| Investment Operations: | |
| Investment income—neta | .10 |
| Net realized and unrealized | |
| gain (loss) on investments | .31 |
| Total from Investment Operations | .41 |
| Distributions: | |
| Dividends from investment income—net | (.13) |
| Net asset value, end of period | 12.78 |
| Total Return (%)b | 3.26 |
| Ratios/Supplemental Data (%): | |
| Ratio of total expenses to average net assetsc,d | 3.31 |
| Ratio of net expenses to average net assetsc,d | .57 |
| Ratio of net investment income | |
| to average net assetsc,d | .85 |
| Portfolio Turnover Rateb | 45.65 |
| Net Assets, end of period ($ x 1,000) | 5,301 |
| a | Based on average shares outstanding at each month end. |
| b | Not annualized. |
| c | Annualized. |
| d | Amounts do not include the activity of the underlying funds. |
See notes to financial statements.
12
NOTES TO FINANCIAL STATEMENTS
NOTE 1—Significant Accounting Policies:
Dreyfus Growth Allocation Fund (the “fund”) is a separate diversified series of Dreyfus Strategic Funds, Inc. (the “Company”), which is registered under the Investment Company Act of 1940, as amended (the “Act”), as an open-end management investment company and operates as a series company currently offering eleven series, including the fund, which commenced operations on October 1, 2009. The fund’s investment objective is to seek long-term capital appreciation with some consideration for current income.The Dreyfus Corporation (the “Manager” or “Dreyfus”), a wholly-owned subsidiary of The Bank of NewYork Mellon Corporation (“BNY Mellon”), serves as the fund’s investment adviser. MBSC Securities Corporation (the “Distributor”), a wholly-owned subsidiary of the Manager, is the distributor of the fund’s shares, which are sold to the public without a sales charge.
As of August 31, 2010, MBC Investments Corp., an indirect subsidiary of BNY Mellon, held 40,401 shares of the fund.
The Company accounts separately for the assets, liabilities and operations of each series. Expenses directly attributable to each series are charged to that series’ operations; expenses which are applicable to all series are allocated among them on a pro rata basis.
The Financial Accounting Standards Board (“FASB”) Accounting Standards Codification (“ASC”) has become the exclusive reference of authoritative U.S. generally accepted accounting principles (“GAAP”) recognized by the FASB to be applied by nongovernmental entities. Rules and interpretive releases of the Securities and Exchange Commission (“SEC”) under authority of federal laws are also sources of authoritative GAAP for SEC registrants.The ASC has superseded all existing non-SEC accounting and reporting standards. The fund’s financial statements are prepared in accordance with GAAP, which may require the use of management estimates and assumptions.Actual results could differ from those estimates.
| The Fund | 13 |
NOTES TO FINANCIAL STATEMENTS (continued)
The Company enters into contracts that contain a variety of indemnifications.The fund’s maximum exposure under these arrangements is unknown.The fund does not anticipate recognizing any loss related to these arrangements.
(a) Portfolio valuation: Investments in open-end investment companies are valued at the net asset value of each underlying fund determined as of the close of the New York Stock Exchange (generally 4 p.m., Eastern time) on the valuation date.
The fair value of a financial instrument is the amount that would be received to sell an asset or paid to transfer a liability in an orderly transaction between market participants at the measurement date (i.e. the exit price). GAAP establishes a fair value hierarchy that prioritizes the inputs of valuation techniques used to measure fair value.This hierarchy gives the highest priority to unadjusted quoted prices in active markets for identical assets or liabilities (Level 1 measurements) and the lowest priority to unobservable inputs (Level 3 measurements).
Additionally, GAAP provides guidance on determining whether the volume and activity in a market has decreased significantly and whether such a decrease in activity results in transactions that are not orderly. GAAP requires enhanced disclosures around valuation inputs and techniques used during annual and interim periods.
Various inputs are used in determining the value of the fund’s investments relating to fair value measurements.These inputs are summarized in the three broad levels listed below:
Level 1—unadjusted quoted prices in active markets for
identical investments.
Level 2—other significant observable inputs (including quoted
prices for similar investments, interest rates, prepayment speeds,
credit risk, etc.).
Level 3—significant unobservable inputs (including the fund’s
own assumptions in determining the fair value of investments).
14
The inputs or methodology used for valuing securities are not necessarily an indication of the risk associated with investing in those securities.
The following is a summary of the inputs used as of August 31, 2010 in valuing the fund’s investments:
| Level 1— | Level 2—Other | Level 3— | ||
| Unadjusted | Significant | Significant | ||
| Quoted | Observable | Unobservable | ||
| Prices | Inputs | Inputs | Total | |
| Assets ($) | ||||
| Investments in Securities: | ||||
| Mutual Funds | 5,293,552 | — | — | 5,293,552 |
In January 2010, FASB issued Accounting Standards Update (“ASU”) No. 2010-06 “Improving Disclosures about FairValue Measurements”. The portions of ASU No. 2010-06 which require reporting entities to prepare new disclosures surrounding amounts and reasons for significant transfers in and out of Level 1 and Level 2 fair value measurements as well as inputs and valuation techniques used to measure fair value for both recurring and nonrecurring fair value measurements that fall in either Level 2 or Level 3 have been adopted by the fund. No significant transfers between Level 1 or Level 2 fair value measurements occurred at August 31, 2010. The remaining portion of ASU No. 2010-06 requires reporting entities to make new disclosures about information on purchases, sales, issuances and settlements on a gross basis in the reconciliation of activity in Level 3 fair value measurements. These new and revi sed disclosures are required to be implemented for fiscal years beginning after December 15, 2010. Management is currently evaluating the impact that the adoption of this remaining portion of ASU No. 2010-06 may have on the fund’s financial statement disclosures.
(b) Securities transactions and investment income: Securities transactions are recorded on a trade date basis. Realized gains and losses from securities transactions are recorded on the identified cost basis.
| The Fund | 15 |
NOTES TO FINANCIAL STATEMENTS (continued)
Dividend income is recognized on the ex-dividend date and interest income, including, where applicable, accretion of discount and amortization of premium on investments, is recognized on the accrual basis.
The fund has arrangements with the custodian and cash management bank whereby the fund may receive earnings credits when positive cash balances are maintained, which are used to offset custody and cash management fees. For financial reporting purposes, the fund includes net earnings credits as an expense offset in the Statement of Operations.
(c) Affiliated issuers: Investments in other investment companies advised by Dreyfus are defined as “affiliated” in the Act.
The fund may invest in shares of certain affiliated investment companies also advised or managed by Dreyfus. Investments in affiliated investment companies for the period ended August 31, 2010 were as follows:
| Affiliated | |||||
| Investment | Value | Dividends/ | |||
| Company | 10/1/2009 ($) | Purchases ($) | Sales ($) | Distributions ($) | |
| Dreyfus Alpha | |||||
| Growth Fund, Cl. I | — | 632,208 | 679,080 | 2,894 | |
| Dreyfus Appreciation Fund | — | 370,719 | 357,560 | 3,052 | |
| Dreyfus Bond Market | |||||
| Index Fund, Basic Shares | — | 432,252 | 46,236 | 8,535 | |
| Dreyfus Emerging | |||||
| Markets Debt Local | |||||
| Currency Fund, Cl. I | — | 121,566 | 13,210 | 520 | |
| Dreyfus Emerging | |||||
| Markets Fund, Cl. I | — | 239,436 | 25,243 | 552 | |
| Dreyfus Global Absolute | |||||
| Return Fund, Cl. I | — | 567,709 | 61,956 | — | |
| Dreyfus Global Real | |||||
| Estate Securities | |||||
| Fund, Cl. I | — | 286,314 | 30,516 | 6,696 | |
| Dreyfus High Yield | |||||
| Fund, Cl. I | — | 127,918 | 13,210 | 6,870 | |
| Dreyfus International | |||||
| Bond Fund, Cl. I | — | 122,947 | 13,210 | 1,891 | |
| Dreyfus International | |||||
| Stock Index Fund | — | 183,755 | 19,815 | 1,998 | |
| Dreyfus International | |||||
| Value Fund, Cl. I | — | 219,210 | 23,779 | 1,326 | |
| Dreyfus Midcap Value | |||||
| Fund, Cl. I | — | 151,710 | 16,513 | 402 | |
16
| Affiliated | |||||
| Investment | Value | Dividends/ | |||
| Company | 10/1/2009 ($) | Purchases ($) | Sales ($) | Distributions ($) | |
| Dreyfus Research | |||||
| Growth Fund, Cl. Z | — | 828,962 | 66,626 | 848 | |
| Dreyfus S&P Stars | |||||
| Opportunities | |||||
| Fund, Cl. I | — | 151,308 | 16,513 | — | |
| Dreyfus Select | |||||
| Managers Small | |||||
| Cap Value Fund, Cl. I | — | 151,444 | 16,513 | 135 | |
| Dreyfus Strategic | |||||
| Value Fund, Cl. I | — | 800,851 | 87,188 | 1,942 | |
| Dreyfus Total Return | |||||
| Advantage Fund, Cl. I | — | 434,428 | 46,236 | 10,764 | |
| Dreyfus U.S. Equity | |||||
| Fund, Cl. I | — | 412,144 | 44,915 | 584 | |
| Dreyfus/Newton | |||||
| International Equity | |||||
| Fund, Cl. I | — | 193,273 | 31,165 | 539 | |
| Dreyfus/The Boston | |||||
| Company Large Cap | |||||
| Core Fund, Cl. I | — | 360,712 | 4,174 | — | |
| Dreyfus/The Boston | |||||
| Company Small/Mid Cap | |||||
| Growth Fund, Cl. I | — | 151,308 | 16,513 | — | |
| Emerging Markets | |||||
| Opportunity Fund, Cl. I | — | 54,463 | 51,975 | 456 | |
| International Stock | |||||
| Fund, Cl. I | — | 145,774 | 15,852 | 518 | |
| 7,140,411 | 1,697,998 | 50,522 | |||
| Change in Net | ||||
| Affiliated | Unrealized | |||
| Investment | Net Realized | Appreciation | Value | Net |
| Company | Gain (Loss) ($) | (Depreciation) ($) | 8/31/2010 ($) | Assets (%) |
| Dreyfus Alpha | ||||
| Growth Fund, Cl. I | 46,872 | — | — | — |
| Dreyfus | ||||
| Appreciation Fund | (13,159) | — | — | — |
| Dreyfus Bond Market | ||||
| Index, Basic Shares | 42 | 14,171 | 400,229 | 7.6 |
| Dreyfus Emerging | ||||
| Markets Debt Local | ||||
| Currency Fund, Cl. I | (737) | 5,109 | 112,728 | 2.1 |
| Dreyfus Emerging | ||||
| Markets Fund, Cl. I | (2,774) | 2,328 | 213,747 | 4.0 |
| The Fund | 17 |
NOTES TO FINANCIAL STATEMENTS (continued)
| Change in Net | |||||
| Affiliated | Unrealized | ||||
| Investment | Net Realized | Appreciation | Value | Net | |
| Company | Gain/(Loss) ($) | (Depreciation) ($) | 8/31/2010 ($) | Assets (%) | |
| Dreyfus Global Absolute | |||||
| Return Fund, Cl. I | (664) | 5,951 | 511,040 | 9.7 | |
| Dreyfus Global Real | |||||
| Estate Securities | |||||
| Fund, Cl. I | (3,027) | 4,276 | 257,047 | 4.8 | |
| Dreyfus High Yield | |||||
| Fund, Cl. I | (694) | (393) | 113,621 | 2.2 | |
| Dreyfus International | |||||
| Bond Fund, Cl. I | (756) | 2,294 | 111,275 | 2.1 | |
| Dreyfus International | |||||
| Stock Index Fund | (3,469) | (10,824) | 149,647 | 2.8 | |
| Dreyfus International | |||||
| Value Fund, Cl. I | (3,620) | (14,801) | 177,010 | 3.3 | |
| Dreyfus Midcap Value | |||||
| Fund, Cl. I | (2,074) | (1,760) | 131,363 | 2.5 | |
| Dreyfus Research | |||||
| Growth Fund, Cl. Z | (6,808) | (61,519) | 694,009 | 13.1 | |
| Dreyfus S&P Stars | |||||
| Opportunities | |||||
| Fund, Cl. I | (1,534) | (5,216) | 128,045 | 2.4 | |
| Dreyfus Select Managers | |||||
| Small Cap Value | |||||
| Fund, Cl. I | (1,767) | (2,922) | 130,242 | 2.5 | |
| Dreyfus Strategic | |||||
| Value Fund, Cl. I | (9,859) | (46,062) | 657,742 | 12.4 | |
| Dreyfus Total Return | |||||
| Advantage Fund, Cl. I | (319) | 13,974 | 401,847 | 7.6 | |
| Dreyfus U.S. | |||||
| Equity Fund, Cl. I | (3,771) | (19,230) | 344,228 | 6.5 | |
| Dreyfus/Newton | |||||
| International | |||||
| Equity Fund, Cl. I | (2,679) | (4,832) | 154,597 | 2.9 | |
| Dreyfus/The Boston | |||||
| Company Large Cap | |||||
| Core Fund, Cl. I | (146) | (7,338) | 349,054 | 6.6 | |
| Dreyfus/The Boston | |||||
| Company Small/Mid Cap | |||||
| Growth Fund, Cl. I | (1,676) | (4,259) | 128,860 | 2.4 | |
| Emerging Markets | |||||
| Opportunity Fund, Cl. I | (2,488) | — | — | — | |
| International Stock | |||||
| Fund, Cl. I | (1,646) | (1,055) | 127,221 | 2.4 | |
| (16,753) | (132,108) | 5,293,552 | 99.9 | ||
18
(d) Dividends to shareholders: Dividends are recorded on the ex-dividend date. Dividends from investment income-net and dividends from net realized capital gains, if any, are normally declared and paid annually, but the fund may make distributions on a more frequent basis to comply with the distribution requirements of the Internal Revenue Code of 1986, as amended (the “Code”).To the extent that net realized capital gains can be offset by capital loss carryovers, it is the policy of the fund not to distribute such gains. Income and capital gain distributions are determined in accordance with income tax regulations, which may differ from GAAP.
(e) Federal income taxes: It is the policy of the fund to continue to qualify as a regulated investment company, if such qualification is in the best interests of its shareholders, by complying with the applicable provisions of the Code, and to make distributions of taxable income sufficient to relieve it from substantially all federal income and excise taxes.
As of and during the period ended August 31, 2010, the fund did not have any liabilities for any uncertain tax positions.The fund recognizes interest and penalties, if any, related to uncertain tax positions as income tax expense in the Statement of Operations. During the period, the fund did not incur any interest or penalties.
The tax year for the period ended August 31, 2010 remains subject to examination by the Internal Revenue Service and state taxing authorities.
At August 31, 2010, the components of accumulated earnings on a tax basis were as follows: undistributed ordinary income $38,855, undistributed capital gains $1,218 and unrealized depreciation $180,374.
The tax character of distributions paid to shareholders during the fiscal period ended August 31, 2010 was as follows: ordinary income $23,500.
During the period ended August 31, 2010, as a result of permanent book to tax differences, primarily due to the tax treatment for fund start-up costs and the reclass of short-term capital gain distributions
| The Fund | 19 |
NOTES TO FINANCIAL STATEMENTS (continued)
from regulated investment company holdings, the fund increased accumulated undistributed investment income-net by $1,948, decreased accumulated net realized gain (loss) on investments by $1,734 and decreased paid-in capital by $214. Net assets and net asset value per share were not affected by this reclassification.
NOTE 2—Bank Lines of Credit:
The fund participates with other Dreyfus-managed funds in a $225 million unsecured credit facility led by Citibank, N.A. and a $300 million unsecured credit facility provided by The Bank of New York Mellon, a subsidiary of BNY Mellon and an affiliate of Dreyfus (each, a “Facility”), each to be utilized primarily for temporary or emergency purposes, including the financing of redemptions. In connection therewith, the fund has agreed to pay its pro rata portion of commitment fees for each Facility. Interest is charged to the fund based on rates determined pursuant to the terms of the respective Facility at the time of borrowing. During the period ended on August 31, 2010, the fund did not borrow under the Facilities.
NOTE 3—Management Fee and Other Transactions with Affiliates:
(a) Pursuant to a management agreement with the Manager, there is no management fee paid to the Manager. The fund invests in other mutual funds advised by the Manager. All fees and expenses of the underlying funds are reflected in the underlying fund’s net asset value.
The Manager has contractually agreed, until January 1, 2011, to assume the expenses of the fund so that the total annual fund and underlying funds operating expenses (excluding taxes, interest, brokerage commissions, commitment fees on borrowing and extraordinary expenses) do not exceed 1.50% of the value of the fund’s average daily net assets.The expense reimbursement, pursuant to the undertaking, amounted to $88,718 during the period ended August 31, 2010.
(b) Under the Shareholder Services Plan, the fund pays the Distributor at an annual rate of .25% of the value of their average daily net assets for
20
the provision of certain services.The services provided may include personal services relating to shareholder accounts, such as answering shareholder inquiries regarding the fund shares and providing reports and other information, and services related to the maintenance of shareholder accounts.The Distributor may make payments to Service Agents (a securities dealer, financial institution or other industry professional) in respect of these services.The Distributor determines the amounts to be paid to Service Agents. Fees paid to the Distributor will be waived to the extent that the fund invests in an underlying affiliated fund with a shareholder services plan. During the period ended August 31, 2010, the fund was charged $8,200 pursuant to the Shareholder Services Plan of which $1,110 was waived due to the fund’s investment in certain of the underlying funds.
The fund compensates Dreyfus Transfer, Inc., a wholly-owned subsidiary of the Manager, under a transfer agency agreement for providing personnel and facilities to perform transfer agency services for the fund. During the period ended August 31, 2010, the fund was charged $1,675 pursuant to the transfer agency agreement, which is included in Shareholder servicing costs in the Statement of Operations.
The fund compensates The Bank of New York Mellon under a cash management agreement for performing cash management services related to fund subscriptions and redemptions. During the period ended August 31, 2010, the fund was charged $281 pursuant to the cash management agreement, which is included in Shareholder servicing costs in the Statement of Operations.These fees were partially offset by earnings credits of $19.
The fund also compensates The Bank of New York Mellon under a custody agreement for providing custodial services for the fund. During the period ended August 31, 2010, the fund was charged $1,174 pursuant to the custody agreement.
During the period ended August 31, 2010, the fund was charged $4,648 for services performed by the Chief Compliance Officer.
| The Fund | 21 |
NOTES TO FINANCIAL STATEMENTS (continued)
The components of “Due fromThe Dreyfus Corporation and affiliates” in the Statement of Assets and Liabilities consist of: shareholder services plan fees $1,126, custodian fees $300, chief compliance officer fees $673 and transfer agency per account fees $344, which are offset against an expense reimbursement currently in effect in the amount of $13,920.
(c) Each Board member also serves as a Board member of other funds within the Dreyfus complex. Annual retainer fees and attendance fees are allocated to each fund based on net assets.
NOTE 4—Securities Transactions:
The aggregate amount of purchases and sales of investment securities, excluding short-term securities, during the period ended August 31, 2010, amounted to $7,140,411 and $1,697,998, respectively.
The provisions of ASC Topic 815 “Derivatives and Hedging” require qualitative disclosures about objectives and strategies for using derivatives, quantitative disclosures about fair value amounts of gains and losses on derivative instruments and disclosures about credit-risk-related contingent features in derivative agreements.The fund held no derivatives during the period ended August 31, 2010. These disclosures did not impact the notes to the financial statements.
At August 31, 2010, the cost of investments for federal income tax purposes was $5,473,926; accordingly, accumulated net unrealized depreciation on investments was $180,374, consisting of $48,103 gross unrealized appreciation and $228,477 gross unrealized depreciation.
22
| REPORT OF INDEPENDENT REGISTERED |
| PUBLIC ACCOUNTING FIRM |
Shareholders and Board of Directors
Dreyfus Growth Allocation Fund
We have audited the accompanying statement of assets and liabilities, including the statement of investments, of Dreyfus Growth Allocation Fund (one of the series comprising Strategic Funds, Inc.) as of August 31, 2010, and the related statements of operations and changes in net assets and financial highlights for the period from October 1, 2009 (commencement of operations) to August 31, 2010.These financial statements and financial highlights are the responsibility of the Fund’s management. Our responsibility is to express an opinion on these financial statements and financial highlights based on our audit.
We conducted our audit in accordance with the standards of the Public Company Accounting Oversight Board (United States).Those standards require that we plan and perform the audit to obtain reasonable assurance about whether the financial statements and financial highlights are free of material misstatement.We were not engaged to perform an audit of the Fund’s internal control over financial reporting. Our audit included consideration of internal control over financial reporting as a basis for designing audit procedures that are appropriate in the circumstances, but not for the purpose of expressing an opinion on the effectiveness of the Fund’s internal control over financial reporting.Accordingly, we express no such opinion. An audit also includes examining, on a test basis, evidence supporting the amounts and disclosures in the financial statements and financial highlights, assessing the accounting pri nciples used and significant estimates made by management, and evaluating the overall financial statement presentation. Our procedures included confirmation of securities owned as of August 31, 2010 by correspondence with the custodian and others.We believe that our audit provides a reasonable basis for our opinion.
In our opinion, the financial statements and financial highlights referred to above present fairly, in all material respects, the financial position of Dreyfus Growth Allocation Fund at August 31, 2010, and the results of its operations, the changes in its net assets and the financial highlights for the period from October 1, 2009 to August 31, 2010, in conformity with U.S. generally accepted accounting principles.

| New York, New York |
| October 25, 2010 |
| The Fund | 23 |
IMPORTANT TAX INFORMATION (Unaudited)
For federal tax purposes, the fund hereby designates 74.59% of the ordinary dividends paid during the fiscal year ended August 31, 2010 as qualifying for the corporate dividends received deduction.Also certain dividends paid by the fund may be subject to a maximum tax rate of 15%, as provided for by the Jobs and Growth Tax Relief Reconciliation Act of 2003. Of the distributions paid during the fiscal year, $23,500 represents the maximum amount that may be considered qualified dividend income. Shareholders will receive notification in early 2011 of the percentage applicable to the preparation of their 2010 income tax returns.
24
BOARD MEMBERS INFORMATION (Unaudited)
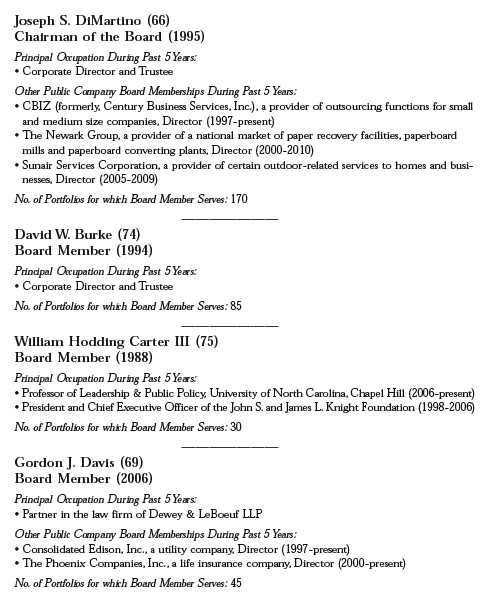
| The Fund | 25 |
BOARD MEMBERS INFORMATION (Unaudited) (continued)

26
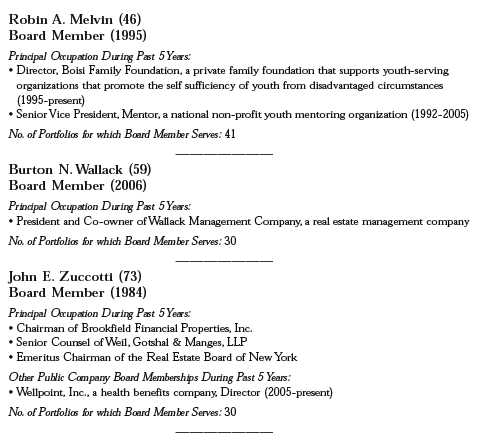
Once elected all Board Members serve for an indefinite term, but achieve Emeritus status upon reaching age 80.The address of the Board Members and Officers is in c/o The Dreyfus Corporation, 200 Park Avenue, NewYork, NewYork 10166.Additional information about the Board Members is available in the fund’s Statement of Additional Information which can be obtained from Dreyfus free of charge by calling this toll free number: 1-800-554-4611.
Arnold S. Hiatt, Emeritus Board Member
| The Fund | 27 |
OFFICERS OF THE FUND (Unaudited)

28
| The Fund | 29 |
OFFICERS OF THE FUND (Unaudited) (continued)
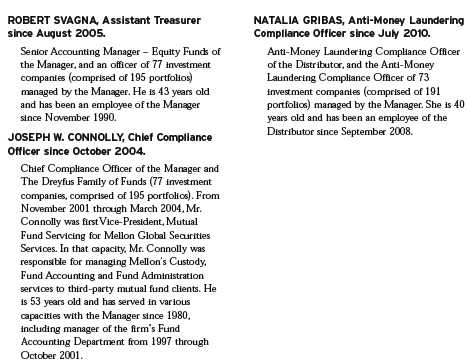
30
NOTES
For More Information
Ticker Symbol: SGALX
Telephone Call your financial representative or 1-800-554-4611
Mail The Dreyfus Family of Funds, 144 Glenn Curtiss Boulevard, Uniondale, NY 11556-0144
The fund files its complete schedule of portfolio holdings with the Securities and Exchange Commission (“SEC”) for the first and third quarters of each fiscal year on Form N-Q. The fund’s Forms N-Q are available on the SEC’s website at http://www.sec.gov and may be reviewed and copied at the SEC’s Public Reference Room in Washington, DC. Information on the operation of the Public Reference Room may be obtained by calling 1-800-SEC-0330.
A description of the policies and procedures that the fund uses to determine how to vote proxies relating to portfolio securities, and information regarding how the fund voted these proxies for the most recent 12-month period ended June 30 is available at http://www.dreyfus.com and on the SEC’s website at http://www.sec.gov. The description of the policies and procedures is also available without charge, upon request, by calling 1-800-645-6561.

| Dreyfus |
| Moderate Allocation Fund |
ANNUAL REPORT August 31, 2010
Save time. Save paper. View your next shareholder report online as soon as it’s available. Log into www.dreyfus.com and sign up for Dreyfus eCommunications. It’s simple and only takes a few minutes.
The views expressed in this report reflect those of the portfolio manager only through the end of the period covered and do not necessarily represent the views of Dreyfus or any other person in the Dreyfus organization. Any such views are subject to change at any time based upon market or other conditions and Dreyfus disclaims any responsibility to update such views.These views may not be relied on as investment advice and, because investment decisions for a Dreyfus fund are based on numerous factors, may not be relied on as an indication of trading intent on behalf of any Dreyfus fund.

Contents | |
THE FUND | |
| 2 | A Letter from the Chairman and CEO |
| 3 | Discussion of Fund Performance |
| 6 | Fund Performance |
| 7 | Understanding Your Fund’s Expenses |
| 7 | Comparing Your Fund’s Expenses With Those of Other Funds |
| 8 | Statement of Investments |
| 9 | Statement of Assets and Liabilities |
| 10 | Statement of Operations |
| 11 | Statement of Changes in Net Assets |
| 12 | Financial Highlights |
| 13 | Notes to Financial Statements |
| 23 | Report of Independent Registered Public Accounting Firm |
| 24 | Important Tax Information |
| 25 | Board Members Information |
| 28 | Officers of the Fund |
FOR MORE INFORMATION | |
Back Cover |
Dreyfus
Moderate Allocation Fund
The Fund

A LETTER FROM THE CHAIRMAN AND CEO
Dear Shareholder:
We are pleased to present this annual report for Dreyfus Moderate Allocation Fund, covering the period from the fund’s inception on October 1, 2009, through August 31, 2010.
As the summer of 2010 cooled off, so did the pace of the U.S. and global economic recoveries. Former engines of growth appeared to stall as large parts of the developed world remained indebted and burdened by weak housing markets.While some emerging markets have posted more impressive growth rates, their developing economies have not yet provided a meaningful boost to global economic activity.The result has been a subpar U.S. recovery with stubbornly high unemployment rates, low levels of consumer confidence and muted corporate investment.
Nonetheless, we do not expect a return to recessionary conditions, thanks to record low short-term interest rates and quantitative easing from the Federal Reserve Board. In addition, the corporate profit outlook continues to be positive for many U.S. companies that have taken advantage of improved demand while aggressively controlling costs. Consequently, we believe high-quality stocks, in general, are now attractive relative to other asset classes due to improved valuations, healthy corporate balance sheets and better-than-expected earnings. As always, your financial advisor is best-suited to help you evaluate and adjust your investments and potentially seize opportunities in this slow-growth economic context.
For information about how the fund performed during the reporting period, as well as general market perspectives, we provide a Discussion of Fund Performance on the pages that follow.
Thank you for your continued confidence and support.

Jonathan R. Baum
Chairman and Chief Executive Officer
The Dreyfus Corporation
September 15, 2010
2

DISCUSSION OF FUND PERFORMANCE
For the period of October 1, 2009, through August 31, 2010, as provided by Richard B. Hoey,A. Paul Disdier, Christopher E. Sheldon, CFA, and Keith L. Stransky, CFA, Portfolio Managers
Market and Fund Performance Overview
For the period between the fund’s inception on October 1, 2009, and August 31, 2010, Dreyfus Moderate Allocation Fund produced a total return of 4.43%.1 In comparison, the fund’s benchmark, the Standard & Poor’s 500 Composite Stock Price Index produced a total return of 1.16% for the same period.The secondary customized blended index composed of 60% Standard & Poor’s 500 Composite Stock Price Index and 40% Barclays Capital U.S. Aggregate Bond Index achieved 3.91% for the same period.2 After rallying over much of the reporting period, stocks and higher yielding bonds were driven lower over the spring and summer of 2010 by several economic setbacks.The fund produced higher returns than its benchmark, the Standard & Poor’s 500 Composite Stock Price Index, primarily due to the holdings investing in the underlying funds of investment grade bonds, which generally performed better.
The Fund’s Investment Approach
Dreyfus Moderate Allocation Fund seeks a balance of current income and capital appreciation. In pursuing its goal, the fund normally allocates 60% of its assets to equity securities and 40% of its assets to fixed income securities.
The fund achieves its targeted asset allocation mix by investing in other mutual funds that are advised by The Dreyfus Corporation (Dreyfus). In turn, the underlying funds invest in a wide range of equity and fixed income securities, including U.S. large-, mid- and small-cap equities; international, global and emerging-market equities; and U.S. and international fixed income securities.
The fund’s portfolio managers, who comprise the Dreyfus Investment Committee, select the underlying funds based on their investment objectives and management policies, portfolio holdings, risk/reward profiles, historical performance and other factors.As of August 31, 2010, the fund may invest in any of 33 underlying funds identified by the Dreyfus Investment Committee, which generally will select only certain, and not all, of the underlying funds for investment at any given time.
| The Fund | 3 |
DISCUSSION OF FUND PERFORMANCE (continued)
Economic Concerns Outweighed Corporate Performance
From the beginning of the reporting period through April 2010, the U.S. and global economies continued to recover from the Great Recession and financial crisis. Manufacturing activity increased and many corporations posted stronger earnings, propelling stocks, corporate bonds and commercial mortgage-backed securities higher.
However, in May 2010 several developments threatened the economic recovery. Europe was roiled by a sovereign debt crisis when Greece found itself unable to finance a heavy debt burden. Robust economic growth in China seemed to spark local inflationary pressures, and investors worried that remedial measures might dampen a major engine of global growth. In the United States, mixed data regarding unemployment and housing markets suggested that stubborn economic headwinds might constrain already mild growth.As a result, rallies among stocks and higher yielding bonds were derailed, and traditional safe havens such as U.S. government securities gained value.
U.S. Stocks Dampened Fund Performance
The fund achieved better results from its underlying fixed income investments, all of which produced higher returns than the fund’s fixed income benchmark. However, relative strength among underlying bond funds was not enough to fully offset weakness among their equity-oriented counterparts.
The fund’s performance also was bolstered by several allocation changes during the reporting period. In November 2009, we shifted 5% of the assets invested in Dreyfus/Newton International Equity Fund to Dreyfus International Stock Index Fund, which as an index fund may effectively give the fund broader exposure to international stock markets. In January 2010, we shifted 25% of the total invested in the emerging markets sector allocation from Emerging Markets Opportunity Fund, which had lagged market averages, to the better-performing Dreyfus Emerging Markets Fund. In May, we moved the remaining 25% of the total sector allocation from Emerging Markets Opportunity Fu nd to Dreyfus Emerging Markets Fund. In June, we shifted allocations within the domestic large cap space from Dreyfus Appreciation Fund to Dreyfus/The Boston Company Large Cap Core Fund.
Although the fund produced positive absolute returns, its performance was undermined by relatively weak returns from its underlying funds investing in large- and midcap stocks, including Dreyfus Alpha Growth Fund, Dreyfus StrategicValue Fund, Dreyfus S&P STARS Opportunities Fund and Dreyfus/The Boston Company Small/Mid Cap Growth
4
Fund. In addition, Emerging Markets Opportunity Fund was a drag on relative performance early in the reporting period.
Remaining Cautiously Opportunistic
Although we remain concerned regarding recent economic weakness, we do not expect a return to recessionary conditions. Consequently, we have maintained the fund’s emphasis on stocks over bonds. In our judgment, rising corporate earnings could lead to an increase in mergers-and-acquisitions activity, potentially benefiting stocks as companies begin to deploy some of the massive cash reserves currently on their balance sheets. In contrast, we expect bonds to trade within a relatively narrow range if, as we expect, interest rates remain low in a subpar economic expansion.We believe that these strategies—as well as the fund’s broadly diversified exposure to BNY Mellon Asset Management’s portfolio managers—positions the fund appropriately for today’s slow-growth environment.
September 15, 2010
| Please note: the position in any security highlighted with italicized typeface was sold during the | |
| reporting period. | |
| Equity funds are subject generally to market, market sector, market liquidity, issuer and investment | |
| style risks, among other factors, to varying degrees, all of which are more fully described in the | |
| fund’s prospectus. Stocks of small- and/or midcap companies often experience sharper price | |
| fluctuations than stocks of large-cap companies. | |
| Asset allocation and diversification cannot assure a profit or protect against loss. | |
| The ability of the fund to achieve its investment goal depends, in part, on the ability of the | |
| Dreyfus Investment Committee to allocate effectively the fund’s assets among the asset classes and | |
| the underlying funds.There can be no assurance that the actual allocations will be effective in | |
| achieving the fund’s investment goal.The underlying funds may not achieve their investment | |
| objectives, and their performance may be lower than that of the asset class the underlying funds | |
| were selected to represent. | |
| Bond funds are subject generally to interest rate, credit, liquidity and market risks, to varying | |
| degrees, all of which are more fully described in the fund’s prospectus. Generally, all other factors | |
| being equal, bond prices are inversely related to interest-rate changes, and rate increases can cause | |
| price declines. | |
| The fund’s performance will be influenced by political, social and economic factors affecting | |
| investments in foreign companies. Special risks associated with investments in foreign companies | |
| include exposure to currency fluctuations, less liquidity, less developed or less efficient trading | |
| markets, lack of comprehensive company information, political instability and differing auditing | |
| and legal standards.These risks are enhanced in emerging markets countries. | |
| 1 | Total return includes reinvestment of dividends and any capital gains paid. Past performance is no |
| guarantee of future results. Share price and investment return fluctuate such that upon redemption, | |
| fund shares may be worth more or less than their original cost. Return figure provided reflects the | |
| absorption of certain fund expenses by The Dreyfus Corporation pursuant to an agreement in | |
| effect through January 1, 2011, at which time it may be extended, terminated or modified. Had | |
| these expenses not been absorbed, the fund’s return would have been lower. | |
| 2 | SOURCE: LIPPER INC. — Reflects reinvestment of dividends and, where applicable, capital |
| gain distributions.The Standard & Poor’s 500 Composite Stock Price Index is a widely accepted, | |
| unmanaged index of U.S. stock market performance.The Barclays Capital U.S.Aggregate Bond | |
| Index is a widely accepted, unmanaged total return index of corporate, U.S. government and U.S. | |
| government agency debt instruments, mortgage-backed securities and asset-backed securities with an | |
| average maturity of 1-10 years. Investors cannot invest directly in any index. |
| The Fund | 5 |
FUND PERFORMANCE
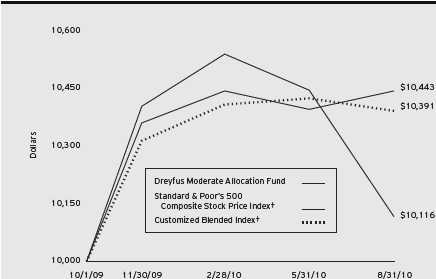
Comparison of change in value of $10,000 investment in Dreyfus Moderate Allocation Fund with the Standard & Poor’s 500 Composite Stock Price Index and the Customized Blended Index
| Actual Aggregate Total Returns as of 8/31/10 | ||
| Inception | From | |
| Date | Inception | |
| Fund | 10/1/09 | 4.43% |
| Standard & Poor’s 500 | ||
| Composite Stock Price Index | 9/30/09 | 1.16% |
| Customized Blended Index | 9/30/09 | 3.91% |
| † Source: Lipper Inc. |
| Past performance is not predictive of future performance.The fund’s performance shown in the graph and table does not |
| reflect the deduction of taxes that a shareholder would pay on fund distributions or the redemption of fund shares. |
| The above graph compares a $10,000 investment made in Dreyfus Moderate Allocation Fund on 10/1/09 (inception |
| date) to a $10,000 investment made in two different indices: (1) the Standard & Poor’s 500 Composite Stock Price |
| Index (the “S&P 500 Index”) and (2) the Customized Blended Index.The Customized Blended Index is calculated |
| on a year-to-date basis. For comparative purposes, the value of each index on 9/30/09 is used as the beginning value on |
| 10/1/09.All dividends and capital gain distributions are reinvested. |
| The fund’s performance shown in the line graph takes into account all applicable fees and expenses.The S&P 500 Index |
| is a widely accepted, unmanaged index of U.S. stock market performance.The Customized Blended Index is composed of |
| the S&P 500 Index, 60%, and the Barclays Capital U.S.Aggregate Bond Index (“Barclays Index”), 40%.The |
| Barclays Index is a widely accepted, unmanaged index of corporate, government and government agency debt instruments, |
| mortgage-backed securities and asset-backed securities with an average maturity of 1-10 years. Unlike a mutual fund, the |
| indices are not subject to charges, fees and other expenses. Investors cannot invest directly in any index. Further |
| information relating to fund performance, including expense reimbursements, if applicable, is contained in the Expenses |
| section of the prospectus and elsewhere in this report. |
6
UNDERSTANDING YOUR FUND’S EXPENSES (Unaudited)
As a mutual fund investor, you pay ongoing expenses, such as management fees and other expenses. Using the information below, you can estimate how these expenses affect your investment and compare them with the expenses of other funds.You also may pay one-time transaction expenses, including sales charges (loads) and redemption fees, which are not shown in this section and would have resulted in higher total expenses. For more information, see your fund’s prospectus or talk to your financial adviser.
Review your fund’s expenses
The table below shows the expenses you would have paid on a $1,000 investment in Dreyfus Moderate Allocation Fund from March 1, 2010 to August 31, 2010. It also shows how much a $1,000 investment would be worth at the close of the period, assuming actual returns and expenses.
Expenses and Value of a $1,000 Investment
assuming actual returns for the six months ended August 31, 2010
| Expenses paid per $1,000† | $ 3.33 |
| Ending value (after expenses) | $1,000.00 |
COMPARING YOUR FUND’S EXPENSES
WITH THOSE OF OTHER FUNDS (Unaudited)
Using the SEC’s method to compare expenses
The Securities and Exchange Commission (SEC) has established guidelines to help investors assess fund expenses. Per these guidelines, the table below shows your fund’s expenses based on a $1,000 investment, assuming a hypothetical 5% annualized return. You can use this information to compare the ongoing expenses (but not transaction expenses or total cost) of investing in the fund with those of other funds.All mutual fund shareholder reports will provide this information to help you make this comparison. Please note that you cannot use this information to estimate your actual ending account balance and expenses paid during the period.
Expenses and Value of a $1,000 Investment
assuming a hypothetical 5% annualized return for the six months ended August 31, 2010
| Expenses paid per $1,000† | $ 3.36 |
| Ending value (after expenses) | $1,021.88 |
| † Expenses are equal to the fund’s annualized expense ratio of .66% multiplied by the average account value over the |
| period, multiplied by 184/365 (to reflect the one-half year period). |
| The Fund | 7 |
| STATEMENT OF INVESTMENTS |
| August 31, 2010 |
| Registered Investment Companies—99.0% | Shares | Value ($) |
| Dreyfus Bond Market Index Fund, Basic Shares | 151,366 a | 1,639,297 |
| Dreyfus Emerging Markets Debt Local Currency Fund, Cl. I | 32,735 a | 463,859 |
| Dreyfus Emerging Markets Fund, Cl. I | 28,505 a | 330,939 |
| Dreyfus Global Absolute Return Fund, Cl. I | 49,185 a,b | 601,534 |
| Dreyfus Global Real Estate Securities Fund, Cl. I | 45,559 a | 302,513 |
| Dreyfus High Yield Fund, Cl. I | 72,994 a | 464,974 |
| Dreyfus International Bond Fund, Cl. I | 27,810 a | 458,305 |
| Dreyfus International Stock Index Fund | 17,983 a | 234,674 |
| Dreyfus International Value Fund, Cl. I | 26,811 a | 277,762 |
| Dreyfus Midcap Value Fund, Cl. I | 8,123 a | 216,148 |
| Dreyfus Research Growth Fund, Cl. Z | 156,450 a | 1,143,647 |
| Dreyfus S&P Stars Opportunities Fund, Cl. I | 11,614 a,b | 211,495 |
| Dreyfus Select Managers Small Cap Value Fund, Cl. I | 13,139 a | 214,686 |
| Dreyfus Strategic Value Fund, Cl. I | 46,824 a | 1,091,010 |
| Dreyfus Total Return Advantage Fund, Cl. I | 117,832 a | 1,644,939 |
| Dreyfus U.S. Equity Fund, Cl. I | 51,048 a | 567,653 |
| Dreyfus/Newton International Equity Fund, Cl. I | 15,404 a | 241,839 |
| Dreyfus/The Boston Company Large Cap Core Fund, Cl. I | 20,258 a | 576,946 |
| Dreyfus/The Boston Company | ||
| Small/Mid Cap Growth Fund, Cl. I | 19,172 a,b | 213,194 |
| International Stock Fund, Cl. I | 16,560 a | 197,226 |
| Total Investments (cost $11,245,029) | 99.0% | 11,092,640 |
| Cash and Receivables (Net) | 1.0% | 107,458 |
| Net Assets | 100.0% | 11,200,098 |
| a | Investment in affiliated mutual fund. |
| b | Non-income producing security. |
| Portfolio Summary (Unaudited)† | |||
| Value (%) | Value (%) | ||
| Mutual Funds: Domestic | 71.3 | Mutual Funds: Foreign | 27.7 |
| 99.0 | |||
| † Based on net assets. | |||
| See notes to financial statements. | |||
8
| STATEMENT OF ASSETS AND LIABILITIES |
| August 31, 2010 |
| Cost | Value | |
| Assets ($): | ||
| Investments in affiliated issuers— | ||
| See Statement of Investments—Note 1(c) | 11,245,029 | 11,092,640 |
| Cash | 117,885 | |
| Receivable for shares of Capital Stock subscribed | 30,812 | |
| Deferred assets | 18,539 | |
| Due from The Dreyfus Corporation and affiliates—Note 3(b) | 10,120 | |
| 11,269,996 | ||
| Liabilities ($): | ||
| Payable for investment securities purchased | 19,312 | |
| Payable for shares of Capital Stock redeemed | 11,000 | |
| Accrued expenses | 39,586 | |
| 69,898 | ||
| Net Assets ($) | 11,200,098 | |
| Composition of Net Assets ($): | ||
| Paid-in capital | 11,291,915 | |
| Accumulated undistributed investment income—net | 42,843 | |
| Accumulated net realized gain (loss) on investments | 17,729 | |
| Accumulated net unrealized appreciation | ||
| (depreciation) on investments | (152,389) | |
| Net Assets ($) | 11,200,098 | |
| Shares Outstanding | ||
| (100 million shares of $.001 par value Common Stock authorized) | 866,076 | |
| Net Asset Value, offering and redemption price per share ($) | 12.93 | |
| See notes to financial statements. | ||
| The Fund | 9 |
| STATEMENT OF OPERATIONS |
| From October 1, 2009 (commencement of operations) to August 31, 2010 |
| Investment Income ($): | |
| Income: | |
| Cash dividends from affiliated issuers | 111,390 |
| Expenses: | |
| Auditing fees | 36,022 |
| Legal fees | 24,372 |
| Registration fees | 22,539 |
| Shareholder servicing costs—Note 3(b) | 19,326 |
| Prospectus and shareholders’ reports | 3,871 |
| Custodian fees—Note 3(b) | 1,091 |
| Directors’ fees and expenses—Note 3(c) | 990 |
| Loan commitment fees—Note 2 | 5 |
| Miscellaneous | 5,437 |
| Total Expenses | 113,653 |
| Less—expense reimbursement from The Dreyfus | |
| Corporation due to undertaking—Note 3(a) | (74,346) |
| Less—waiver of shareholder servicing fees—Note 3(b) | (1,544) |
| Less—reduction in fees due to earnings credits—Note 1(b) | (30) |
| Net Expenses | 37,733 |
| Investment Income—Net | 73,657 |
| Realized and Unrealized Gain (Loss) on Investments—Note 4 ($): | |
| Net realized gain (loss) on investments in affiliated issuers | 11,507 |
| Capital gain distributions from affiliated issuers | 11,521 |
| Net Realized Gain (Loss) | 23,028 |
| Net unrealized appreciation (depreciation) | |
| on investments in affiliated issuers | (152,389) |
| Net Realized and Unrealized Gain (Loss) on Investments | (129,361) |
| Net (Decrease) in Net Assets Resulting from Operations | (55,704) |
| See notes to financial statements. | |
10
| STATEMENT OF CHANGES IN NET ASSETS |
| From October 1, 2009 (commencement of operations) to August 31, 2010 |
| Operations ($): | |
| Investment income—net | 73,657 |
| Net realized gain (loss) on investments | 23,028 |
| Net unrealized appreciation (depreciation) | |
| on investments in affiliated issuers | (152,389) |
| Net Increase (Decrease) in Net Assets | |
| Resulting from Operations | (55,704) |
| Dividends to Shareholders from ($): | |
| Investment income—net | (36,541) |
| Capital Stock Transactions ($): | |
| Net proceeds from shares sold | 12,226,788 |
| Dividends reinvested | 35,930 |
| Cost of shares redeemed | (970,375) |
| Increase (Decrease) in Net Assets | |
| from Capital Stock Transactions | 11,292,343 |
| Total Increase (Decrease) in Net Assets | 11,200,098 |
| Net Assets ($): | |
| Beginning of Period | — |
| End of Period | 11,200,098 |
| Undistributed investment income—net | 42,843 |
| Capital Share Transactions (Shares): | |
| Shares sold | 938,152 |
| Shares issued for dividends reinvested | 2,783 |
| Shares redeemed | (74,859) |
| Net Increase (Decrease) in Shares Outstanding | 866,076 |
| See notes to financial statements. | |
| The Fund | 11 |
FINANCIAL HIGHLIGHTS
The following table describes the performance for the fiscal period from October 1, 2009 (commencement of operations) to August 31, 2010.Total return shows how much your investment in the fund would have increased (or decreased) during the period assuming you had reinvested all dividends and distributions.These figures have been derived from the fund’s financial statements.
| Per Share Data ($): | |
| Net asset value, beginning of period | 12.50 |
| Investment Operations: | |
| Investment income—neta | .14 |
| Net realized and unrealized | |
| gain (loss) on investments | .41 |
| Total from Investment Operations | .55 |
| Distributions: | |
| Dividends from investment income—net | (.12) |
| Net asset value, end of period | 12.93 |
| Total Return (%)b | 4.43 |
| Ratios/Supplemental Data (%): | |
| Ratio of total expenses to average net assetsc,d | 1.96 |
| Ratio of net expenses to average net assetsc,d | .65 |
| Ratio of net investment income | |
| to average net assetsc,d | 1.27 |
| Portfolio Turnover Rateb | 31.21 |
| Net Assets, end of period ($ x 1,000) | 11,200 |
| a | Based on average shares outstanding at each month end. |
| b | Not annualized. |
| c | Annualized. |
| d | Amounts do not include the activity of the underlying funds. |
See notes to financial statements.
12
NOTES TO FINANCIAL STATEMENTS
NOTE 1—Significant Accounting Policies:
Dreyfus Moderate Allocation Fund (the “fund”) is a separate diversified series of Strategic Funds, Inc. (the “Company”) which is registered under the Investment Company Act of 1940, as amended (the “Act”), as a open-end management investment company and operates as a series company currently offering eleven series, including the fund, which commenced operations on October 1, 2009. The fund’s investment objective is to seek a balance of current income and capital appreciation. The Dreyfus Corporation (the “Manager” or “Dreyfus”), a wholly-owned subsidiary of The Bank of New York Mellon Corporation (“BNY Mellon”), serves as the fund’s investment adviser. MBSC Securities Corporation (the “Distributor”), a wholly-owned subsidiary of the Manager, is the distributor of the fund’s shares, which are sold to the public without a sales char ge.
The Company accounts separately for the assets, liabilities and operations of each series. Expenses directly attributable to each series are charged to that series’ operations; expenses which are applicable to all series are allocated among them on a pro rata basis.
The Financial Accounting Standards Board (“FASB”) Accounting Standards Codification (“ASC”) has become the exclusive reference of authoritative U.S. generally accepted accounting principles (“GAAP”) recognized by the FASB to be applied by nongovernmental entities. Rules and interpretive releases of the Securities and Exchange Commission (“SEC”) under authority of federal laws are also sources of authoritative GAAP for SEC registrants. The ASC has superseded all existing non-SEC accounting and reporting standards. The fund’s financial statements are prepared in accordance with GAAP, which may require the use of management estimates and assumptions.Actual results could differ from those estimates.
| The Fund | 13 |
NOTES TO FINANCIAL STATEMENTS (continued)
The Company enters into contracts that contain a variety of indemnifications. The fund’s maximum exposure under these arrangements is unknown.The fund does not anticipate recognizing any loss related to these arrangements.
(a) Portfolio valuation: Investments in open-end investment companies are valued at the net asset value of each underlying fund determined as of the close of the NewYork Stock Exchange (generally 4 p.m., Eastern time) on the valuation date.
The fair value of a financial instrument is the amount that would be received to sell an asset or paid to transfer a liability in an orderly transaction between market participants at the measurement date (i.e. the exit price). GAAP establishes a fair value hierarchy that prioritizes the inputs of valuation techniques used to measure fair value.This hierarchy gives the highest priority to unadjusted quoted prices in active markets for identical assets or liabilities (Level 1 measurements) and the lowest priority to unobservable inputs (Level 3 measurements).
Additionally, GAAP provides guidance on determining whether the volume and activity in a market has decreased significantly and whether such a decrease in activity results in transactions that are not orderly. GAAP requires enhanced disclosures around valuation inputs and techniques used during annual and interim periods.
Various inputs are used in determining the value of the fund’s investments relating to fair value measurements.These inputs are summarized in the three broad levels listed below:
Level 1—unadjusted quoted prices in active markets for
identical investments.
Level 2—other significant observable inputs (including quoted
prices for similar investments, interest rates, prepayment speeds,
credit risk, etc.).
Level 3—significant unobservable inputs (including the fund’s own
assumptions in determining the fair value of investments).
The inputs or methodology used for valuing securities are not necessarily an indication of the risk associated with investing in those securities.
14
The following is a summary of the inputs used as of August 31, 2010 in valuing the fund’s investments:
| Level 1— | Level 2—Other | Level 3— | ||
| Unadjusted | Significant | Significant | ||
| Quoted | Observable | Unobservable | ||
| Prices | Inputs | Inputs | Total | |
| Assets ($) | ||||
| Investments in Securities: | ||||
| Mutual Funds | 11,092,640 | — | — | 11,092,640 |
In January 2010, FASB issued Accounting Standards Update (“ASU”) No. 2010-06 “Improving Disclosures about FairValue Measurements”. The portions of ASU No. 2010-06 which require reporting entities to prepare new disclosures surrounding amounts and reasons for significant transfers in and out of Level 1 and Level 2 fair value measurements as well as inputs and valuation techniques used to measure fair value for both recurring and nonrecurring fair value measurements that fall in either Level 2 or Level 3 have been adopted by the fund. No significant transfers between Level 1 or Level 2 fair value measurements occurred at August 31, 2010. The remaining portion of ASU No. 2010-06 requires reporting entities to make new disclosures about information on purchases, sales, issuances and settlements on a gross basis in the reconciliation of activity in Level 3 fair value measurements. These new and revi sed disclosures are required to be implemented for fiscal years beginning after December 15, 2010. Management is currently evaluating the impact that the adoption of this remaining portion of ASU No. 2010-06 may have on the fund’s financial statement disclosures.
(b) Securities transactions and investment income: Securities transactions are recorded on a trade date basis. Realized gains and losses from securities transactions are recorded on the identified cost basis.
Dividend income is recognized on the ex-dividend date and interest income, including, where applicable, accretion of discount and amortization of premium on investments, is recognized on the accrual basis.
| The Fund | 15 |
NOTES TO FINANCIAL STATEMENTS (continued)
The fund has arrangements with the custodian and cash management bank whereby the fund may receive earnings credits when positive cash balances are maintained, which are used to offset custody and cash management fees. For financial reporting purposes, the fund includes net earnings credits as an expense offset in the Statement of Operations.
(c) Affiliated issuers: Investments in other investment companies advised by Dreyfus are defined as “affiliated” in the Act.
The fund may invest in shares of certain affiliated investment companies also advised or managed by Dreyfus. Investments in affiliated investment companies for the period ended August 31, 2010 were as follows:
| Affiliated | |||||
| Investment | Value | Dividends/ | |||
| Company | 10/1/2009 ($) | Purchases ($) | Sales ($) | Distributions ($) | |
| Dreyfus Alpha | |||||
| Growth Fund CI. I | — | 863,314 | 925,175 | 3,093 | |
| Dreyfus Appreciation Fund | — | 507,774 | 489,159 | 3,871 | |
| Dreyfus Bond Market | |||||
| Index Fund, Basic Shares | — | 1,675,192 | 89,474 | 30,239 | |
| Dreyfus Emerging | |||||
| Markets Debt Local | |||||
| Currency Fund, CI. I | — | 471,633 | 25,564 | 1,646 | |
| Dreyfus Emerging | |||||
| Markets Fund, CI. I | — | 349,266 | 19,173 | 645 | |
| Dreyfus Global Absolute | |||||
| Return Fund, CI. I | — | 629,782 | 34,256 | — | |
| Dreyfus Global Real Estate | |||||
| Securities Fund, CI. I | — | 316,298 | 16,872 | 6,107 | |
| Dreyfus High Yield | |||||
| Fund, CI. I | — | 494,145 | 25,564 | 24,159 | |
| Dreyfus International | |||||
| Bond Fund, CI. I | — | 476,124 | 25,564 | 6,136 | |
| Dreyfus International | |||||
| Stock Index Fund | — | 266,643 | 14,380 | 2,379 | |
| Dreyfus International | |||||
| Value Fund, CI. I | — | 318,570 | 17,256 | 1,329 | |
| Dreyfus Midcap | |||||
| Value Fund, CI. I | — | 235,496 | 12,782 | 503 | |
| Dreyfus Research | |||||
| Growth Fund, CI. Z | — | 1,270,119 | 30,663 | 1,225 | |
16
| Affiliated | |||||
| Investment | Value | Dividends/ | |||
| Company | 10/1/2009 ($) | Purchases ($) | Sales ($) | Distributions ($) | |
| Dreyfus S&P Stars | |||||
| Opportunities | |||||
| Fund, CI. I | — | 234,993 | 12,782 | — | |
| Dreyfus Select | |||||
| Managers Small | |||||
| Cap Value Fund, CI. I | — | 235,167 | 12,782 | 173 | |
| Dreyfus Strategic | |||||
| Value Fund, CI. I | — | 1,242,856 | 67,489 | 2,091 | |
| Dreyfus Total Return | |||||
| Advantage Fund, CI. I | — | 1,681,789 | 89,474 | 36,790 | |
| Dreyfus U.S. Equity | |||||
| Fund, CI. I | — | 639,920 | 34,767 | 738 | |
| Dreyfus/Newton | |||||
| International | |||||
| Equity Fund, CI. I | — | 276,345 | 25,626 | 628 | |
| Dreyfus/The Boston | |||||
| Company Large Cap | |||||
| Core Fund, CI. I | — | 595,124 | 5,454 | — | |
| Dreyfus/The Boston | |||||
| Company Small/Mid Cap | |||||
| Growth Fund, CI. I | — | 234,993 | 12,782 | — | |
| Emerging Markets | |||||
| Opportunity Fund, CI. I | — | 80,468 | 76,064 | 534 | |
| International Stock | |||||
| Fund, CI. I | — | 212,117 | 11,504 | 625 | |
| Total | — | 13,308,128 | 2,074,606 | 122,911 | |
| Change in Net | |||||
| Affiliated | Unrealized | ||||
| Investment | Net Realized | Appreciation | Value | Net | |
| Company | Gain (Loss) ($) | (Depreciation) ($) | 8/31/2010 ($) | Assets (%) | |
| Dreyfus Alpha Growth | |||||
| Fund CI. I | 61,861 | — | — | — | |
| Dreyfus Appreciation | |||||
| Fund | (18,615) | — | — | — | |
| Dreyfus Bond Market | |||||
| Index Fund, Basic Shares | (222) | 53,801 | 1,639,297 | 14.6 | |
| Dreyfus Emerging | |||||
| Markets Debt Local | |||||
| Currency Fund, CI. I | (874) | 18,664 | 463,859 | 4.1 | |
| Dreyfus Emerging | |||||
| Markets Fund, CI. I | (1,797) | 2,643 | 330,939 | 3.0 | |
| The Fund | 17 |
NOTES TO FINANCIAL STATEMENTS (continued)
| Change in Net | ||||
| Affiliated | Unrealized | |||
| Investment | Net Realized | Appreciation | Value | Net |
| Company | Gain (Loss) ($) | (Depreciation) ($) | 8/31/2010 ($) | Assets (%) |
| Dreyfus Global Absolute | ||||
| Return Fund, CI. I | (546) | 6,554 | 601,534 | 5.4 |
| Dreyfus Global Real | ||||
| Estate Securities | ||||
| Fund, CI. I | (1,437) | 4,524 | 302,513 | 2.7 |
| Dreyfus High Yield | ||||
| Fund, CI. I | (864) | (2,743) | 464,974 | 4.1 |
| Dreyfus International | ||||
| Bond Fund, CI. I | (988) | 8,733 | 458,305 | 4.1 |
| Dreyfus International | ||||
| Stock Index Fund | (1,649) | (15,940) | 234,674 | 2.1 |
| Dreyfus International | ||||
| Value Fund, CI. I | (1,680) | (21,872) | 277,762 | 2.5 |
| Dreyfus Midcap | ||||
| Value Fund, CI. I | (1,107) | (5,459) | 216,148 | 1.9 |
| Dreyfus Research | ||||
| Growth Fund, CI. Z | (2,662) | (93,147) | 1,143,647 | 10.2 |
| Dreyfus S&P Stars | ||||
| Opportunities | ||||
| Fund, CI. I | (828) | (9,888) | 211,495 | 1.9 |
| Dreyfus Select Managers | ||||
| Small Cap Value | ||||
| Fund, CI. I | (901) | (6,798) | 214,686 | 1.9 |
| Dreyfus Strategic | ||||
| Value Fund, CI. I | (5,393) | (78,964) | 1,091,010 | 9.7 |
| Dreyfus Total Return | ||||
| Advantage Fund, CI. I | (1,216) | 53,840 | 1,644,939 | 14.7 |
| Dreyfus U.S. Equity | ||||
| Fund, CI. I | (1,863) | (35,637) | 567,653 | 5.1 |
| Dreyfus/Newton | ||||
| International | ||||
| Equity Fund, CI. I | (1,447) | (7,433) | 241,839 | 2.2 |
| Dreyfus/The Boston | ||||
| Company Large Cap | ||||
| Core Fund, CI. I | (130) | (12,594) | 576,946 | 5.1 |
| Dreyfus/The Boston | ||||
| Company Small/Mid Cap | ||||
| Growth Fund, CI. I | (917) | (8,100) | 213,194 | 1.9 |
| Emerging | ||||
| Markets Opportunity | ||||
| Fund, CI. I | (4,404) | — | — | — |
| International Stock | ||||
| Fund, CI. I | (814) | (2,573) | 197,226 | 1.8 |
| Total | 11,507 | (152,389) | 11,092,640 | 99.00 |
18
(d) Dividends to shareholders: Dividends are recorded on the ex-dividend date. Dividends from investment income-net and dividends from net realized capital gains, if any, are normally declared and paid annually, but the fund may make distributions on a more frequent basis to comply with the distribution requirements of the Internal Revenue Code of 1986, as amended (the “Code”).To the extent that net realized capital gains can be offset by capital loss carryovers, it is the policy of the fund not to distribute such gains. Income and capital gain distributions are determined in accordance with income tax regulations, which may differ from GAAP.
(e) Federal income taxes: It is the policy of the fund to continue to qualify as a regulated investment company, if such qualification is in the best interests of its shareholders, by complying with the applicable provisions of the Code, and to make distributions of taxable income sufficient to relieve it from substantially all federal income and excise taxes.
As of and during the period ended August 31, 2010, the fund did not have any liabilities for any uncertain tax positions.The fund recognizes interest and penalties, if any, related to uncertain tax positions as income tax expense in the Statement of Operations. During the period, the fund did not incur any interest or penalties.
The tax year for the period ended August 31, 2010 remains subject to examination by the Internal Revenue Service and state taxing authorities.
At August 31, 2010, the components of accumulated earnings on a tax basis were as follows: undistributed ordinary income $84,276, undistributed capital gains $3,792 and unrealized depreciation $179,885.
The tax character of distributions paid to shareholders during the fiscal period ended August 31, 2010 was as follows: ordinary income $36,541.
During the period ended August 31, 2010, as a result of permanent book to tax differences, primarily due to the tax treatment for fund start-up costs and the reclass of short-term capital gain distributions from regulated investment company holdings, the fund increased accu-
| The Fund | 19 |
NOTES TO FINANCIAL STATEMENTS (continued)
mulated undistributed investment income-net by $5,727, decreased accumulated net realized gain (loss) on investments by $5,299 and decreased paid-in capital by $428. Net assets and net asset value per share were not affected by this reclassification.
NOTE 2—Bank Lines of Credit:
The fund participates with other Dreyfus-managed funds in a $225 million unsecured credit facility led by Citibank, N.A. and a $300 million unsecured credit facility provided by The Bank of New York Mellon, a subsidiary of BNY Mellon and an affiliate of Dreyfus, (each, a “Facility”), each to be utilized primarily for temporary or emergency purposes, including the financing of redemptions. In connection therewith, the fund has agreed to pay its pro rata portion of commitment fees for each Facility. Interest is charged to the fund based on rates determined pursuant to the terms of the respective Facility at the time of borrowing. During the period ended on August 31, 2010, the fund did not borrow under the Facilities.
NOTE 3—Management Fee and Other Transactions with Affiliates:
(a) Pursuant to a management agreement with the Manager, there is no management fee paid to the Manager. The fund invests in other mutual funds advised by the Manager. All fees and expenses of the underlying funds are reflected in the underlying funds’ net asset value.
The Manager has contractually agreed, until January 1, 2011, to assume the expenses of the fund so that the total annual fund and underlying funds’ operating expenses (excluding taxes, interest, brokerage commissions, commitment fees on borrowings and extraordinary expenses) do not exceed 1.45% of the value of the fund’s average daily net assets. The expense reimbursement, pursuant to the undertaking, amounted to $74,346 during the period ended August 31, 2010.
(b) Under the Shareholder Services Plan, the fund pays the Distributor at an annual rate of .25% of the value of the fund’s average daily net assets for the provision of certain service. The services provided may
20
include personal services relating to shareholder accounts, such as answering shareholder inquiries regarding the fund’s shares and providing reports and other information, and services related to the maintenance of shareholder accounts.The Distributor may make payments to Service Agents (a securities dealer, financial institution or other industry professional) in respect of these services. The Distributor determines the amounts to be paid to Service Agents. Fees paid to the Distributor will be waived to the extent that the fund invests in an underlying affiliated fund with a shareholder services plan. During the period ended August 31, 2010, the fund was charged $14,496 pursuant to the Shareholder Services Plan of which $1,544 was waived due to the fund’s investment in certain of the underlying funds.
The fund compensates Dreyfus Transfer, Inc., a wholly-owned subsidiary of the Manager, under a transfer agency agreement for providing personnel and facilities to perform transfer agency services for the fund. During the period ended August 31, 2010, the fund was charged $3,277 pursuant to the transfer agency agreement, which is included in Shareholder servicing costs in the Statement of Operations.
The fund compensates The Bank of New York Mellon under a cash management agreement for performing cash management services related to fund subscriptions and redemptions. During the period ended August 31, 2010, the fund was charged $443 pursuant to the cash management agreement, which is included in Shareholder servicing costs in the Statement of Operations.These fees were partially offset by earnings credits of $30.
The fund also compensates The Bank of New York Mellon under a custody agreement for providing custodial services for the fund. During the period ended August 31, 2010, the fund was charged $1,091 pursuant to the custody agreement.
During the period ended August 31, 2010, the fund was charged $4,648 for services performed by the Chief Compliance Officer.
| The Fund | 21 |
NOTES TO FINANCIAL STATEMENTS (continued)
The components of “Due to The Dreyfus Corporation and affiliates” in the Statement of Assets and Liabilities consist of: shareholder services plan fees $2,330, custodian fees $273, chief compliance officer fees $673 and transfer agency per account fees $1,179, which are offset against an expense reimbursement currently in effect in the amount of $14,575.
(c) Each Board member also serves as a Board member of other funds within the Dreyfus complex. Annual retainer fees and attendance fees are allocated to each fund based on net assets.
NOTE 4—Securities Transactions:
The aggregate amount of purchases and sales of investment securities, excluding short-term securities, during the period ended August 31, 2010, amounted to $13,308,128 and $2,074,606, respectively.
The provisions of ASC Topic 815 “Derivatives and Hedging” require qualitative disclosures about objectives and strategies for using derivatives, quantitative disclosures about fair value amounts of gains and losses on derivative instruments and disclosures about credit-risk-related contingent features in derivative agreements.The fund held no derivatives during the period ended August 31, 2010.These disclosures did not impact the notes to the financial statements.
At August 31, 2010, the cost of investments for federal income tax purposes was $11,272,525 accordingly; accumulated net unrealized depreciation on investments was $179,885, consisting of $148,761 gross unrealized appreciation and $328,646 gross unrealized depreciation.
22
REPORT OF INDEPENDENT REGISTERED
PUBLIC ACCOUNTING FIRM
Shareholders and Board of Directors
Dreyfus Moderate Allocation Fund
We have audited the accompanying statement of assets and liabilities, including the statement of investments, of Dreyfus Moderate Allocation Fund (one of the series comprising Strategic Funds, Inc.) as of August 31, 2010, and the related statements of operations and changes in net assets and financial highlights for the period from October 1, 2009 (commencement of operations) to August 31, 2010. These financial statements and financial highlights are the responsibility of the Fund’s management. Our responsibility is to express an opinion on these financial statements and financial highlights based on our audit.
We conducted our audit in accordance with the standards of the Public Company Accounting Oversight Board (United States).Those standards require that we plan and perform the audit to obtain reasonable assurance about whether the financial statements and financial highlights are free of material misstatement.We were not engaged to perform an audit of the Fund’s internal control over financial reporting. Our audit included consideration of internal control over financial reporting as a basis for designing audit procedures that are appropriate in the circumstances, but not for the purpose of expressing an opinion on the effectiveness of the Fund’s internal control over financial reporting. Accordingly, we express no such opinion.An audit also includes examining, on a test basis, evidence supporting the amounts and disclosures in the financial statements and financial highlights, assessing the accounting pri nciples used and significant estimates made by management, and evaluating the overall financial statement presentation. Our procedures included confirmation of securities owned as of August 31, 2010 by correspondence with the custodian and others. We believe that our audit provides a reasonable basis for our opinion.
In our opinion, the financial statements and financial highlights referred to above present fairly, in all material respects, the financial position of Dreyfus Moderate Allocation Fund at August 31, 2010, and the results of its operations, the changes in its net assets and the financial highlights for the period from October 1, 2009 to August 31, 2010, in conformity with U.S. generally accepted accounting principles.

| New York, New York |
| October 25, 2010 |
| The Fund | 23 |
IMPORTANT TAX INFORMATION (Unaudited)
For federal tax purposes, the fund hereby designates 92.01% of the ordinary dividends paid during the fiscal year ended August 31, 2010 as qualifying for the corporate dividends received deduction. Also certain dividends paid by the fund may be subject to a maximum tax rate of 15%, as provided for by the Jobs and Growth Tax Relief Reconciliation Act of 2003. Of the distributions paid during the fiscal year, $36,541 represents the maximum amount that may be considered qualified dividend income. Shareholders will receive notification in early 2011 of the percentage applicable to the preparation of their 2010 income tax returns.
24
BOARD MEMBERS INFORMATION (Unaudited)
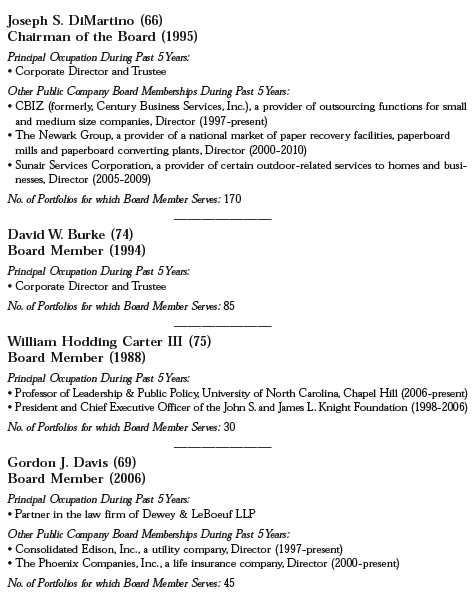
| The Fund | 25 |
BOARD MEMBERS INFORMATION (Unaudited) (continued)
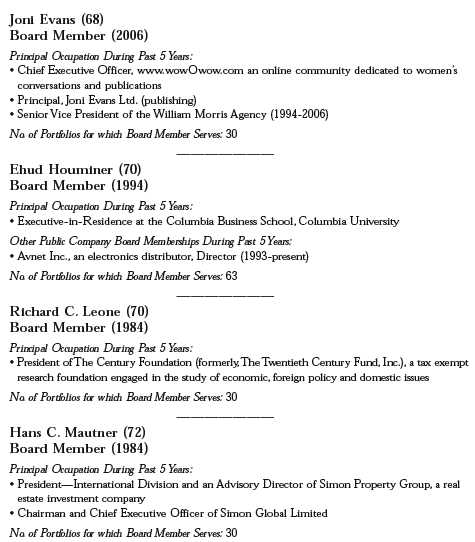
26
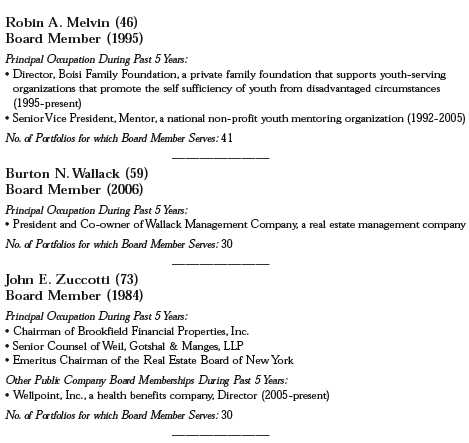
Once elected all Board Members serve for an indefinite term, but achieve Emeritus status upon reaching age 80.The address of the Board Members and Officers is in c/o The Dreyfus Corporation, 200 Park Avenue, NewYork, NewYork 10166.Additional information about the Board Members is available in the fund’s Statement of Additional Information which can be obtained from Dreyfus free of charge by calling this toll free number: 1-800-554-4611.
Arnold S. Hiatt, Emeritus Board Member
| The Fund | 27 |
OFFICERS OF THE FUND (Unaudited)

28
| The Fund | 29 |
OFFICERS OF THE FUND (Unaudited) (continued)
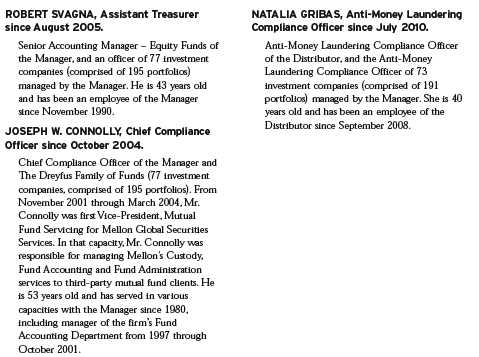
30
NOTES
For More Information
Ticker Symbol: SMDAX
Telephone Call your financial representative or 1-800-554-4611
Mail The Dreyfus Family of Funds, 144 Glenn Curtiss Boulevard, Uniondale, NY 11556-0144
The fund files its complete schedule of portfolio holdings with the Securities and Exchange Commission (“SEC”) for the first and third quarters of each fiscal year on Form N-Q. The fund’s Forms N-Q are available on the SEC’s website at http://www.sec.gov and may be reviewed and copied at the SEC’s Public Reference Room in Washington, DC. Information on the operation of the Public Reference Room may be obtained by calling 1-800-SEC-0330.
A description of the policies and procedures that the fund uses to determine how to vote proxies relating to portfolio securities, and information regarding how the fund voted these proxies for the most recent 12-month period ended June 30 is available at http://www.dreyfus.com and on the SEC’s website at http://www.sec.gov. The description of the policies and procedures is also available without charge, upon request, by calling 1-800-645-6561.

Item 2. Code of Ethics.
The Registrant has adopted a code of ethics that applies to the Registrant's principal executive officer, principal financial officer, principal accounting officer or controller, or persons performing similar functions. There have been no amendments to, or waivers in connection with, the Code of Ethics during the period covered by this Report.
Item 3. Audit Committee Financial Expert.
The Registrant's Board has determined that Ehud Houminer, a member of the Audit Committee of the Board, is an audit committee financial expert as defined by the Securities and Exchange Commission (the "SEC"). Ehud Houminer is "independent" as defined by the SEC for purposes of audit committee financial expert determinations.
Item 4. Principal Accountant Fees and Services.
(a) Audit Fees. The aggregate fees billed for each of the last two fiscal years (the "Reporting Periods") for professional services rendered by the Registrant's principal accountant (the "Auditor") for the audit of the Registrant's annual financial statements or services that are normally provided by the Auditor in connection with the statutory and regulatory filings or engagements for the Reporting Periods, were $ 0 in 2009 and $79,290 in 2010.
(b) Audit-Related Fees. The aggregate fees billed in the Reporting Periods for assurance and related services by the Auditor that are reasonably related to the performance of the audit of the Registrant's financial statements and are not reported under paragraph (a) of this Item 4 were $0 in 2009 and $ 6,000 in 2010. These services consisted of one or more of the following: (i) agreed upon procedures related to compliance with Internal Revenue Code section 817(h), (ii) security counts required by Rule 17f-2 under the Investment Company Act of 1940, as amended, (iii) advisory services as to the accounting or disclosure treatment of Registrant transactions or events and (iv) advisory services to the accounting or disclosure treatment of the actual or potential impact to the Registrant of final or proposed rules, standards or interpretations by the Securities and Exchange Commission, the Financial Accounting Standards Boards or other regulatory or standard-setting bodies.
The aggregate fees billed in the Reporting Periods for non-audit assurance and related services by the Auditor to the Registrant's investment adviser (not including any sub-investment adviser whose role is primarily portfolio management and is subcontracted with or overseen by another investment adviser), and any entity controlling, controlled by or under common control with the investment adviser that provides ongoing services to the Registrant ("Service Affiliates"), that were reasonably related to the performance of the annual audit of the Service Affiliate, which required pre-approval by the Audit Committee were $0 in 2009 and $0 in 2010.
(c) Tax Fees. The aggregate fees billed in the Reporting Periods for professional services rendered by the Auditor for tax compliance, tax advice, and tax planning ("Tax Services") were $ 0in 2009 and $4,701 in 2010. These services consisted of: (i) review or preparation of U.S. federal, state, local and excise tax returns; (ii) U.S. federal, state and local tax planning, advice and assistance regarding statutory, regulatory or administrative developments; (iii) tax advice regarding tax qualification matters and/or treatment of various financial instruments held or proposed to be acquired or held, and (iv) determination of Passive Foreign Investment Companies. The aggregate fees billed in the Reporting Periods for Tax Services by the Auditor to Service Affiliates, which required pre-approval by the Audit Committee were $0 in 2009 and $0 in 2010.
(d) All Other Fees. The aggregate fees billed in the Reporting Periods for products and services provided by the Auditor, other than the services reported in paragraphs (a) through (c) of this Item, were $ 0 in 2009 and $2,002 in 2010. [These services consisted of a review of the Registrant's anti-money laundering program].
The aggregate fees billed in the Reporting Periods for Non-Audit Services by the Auditor to Service Affiliates, other than the services reported in paragraphs (b) through (c) of this Item, which required pre-approval by the Audit Committee, were $0 in 2009 and $0 in 2010.
(e)(1) Audit Committee Pre-Approval Policies and Procedures. The Registrant's Audit Committee has established policies and procedures (the "Policy") for pre-approval (within specified fee limits) of the Auditor's engagements for non-audit services to the Registrant and Service Affiliates without specific case-by-case consideration. The pre-approved services in the Policy can include pre-approved audit services, pre-approved audit-related services, pre-approved tax services and pre-approved all other services. Pre-approval considerations include whether the proposed services are compatible with maintaining the Auditor's independence. Pre-approvals pursuant to the Policy are considered annually.
(e)(2) Note: None of the services described in paragraphs (b) through (d) of this Item 4 were approved by the Audit Committee pursuant to paragraph (c)(7)(i)(C) of Rule 2-01 of Regulation S-X.
(f) None of the hours expended on the principal accountant's engagement to audit the registrant's financial statements for the most recent fiscal year were attributed to work performed by persons other than the principal account's full-time, permanent employees.
Non-Audit Fees. The aggregate non-audit fees billed by the Auditor for services rendered to the Registrant, and rendered to Service Affiliates, for the Reporting Periods were $24,372,300 in 2009 and $28,173,266 in 2010.
Auditor Independence. The Registrant's Audit Committee has considered whether the provision of non-audit services that were rendered to Service Affiliates, which were not pre-approved (not requiring pre-approval), is compatible with maintaining the Auditor's independence.
Item 5. Audit Committee of Listed Registrants.
Not applicable. [CLOSED-END FUNDS ONLY]
Item 6. Investments.
(a) Not applicable.
Item 7. Disclosure of Proxy Voting Policies and Procedures for Closed-End Management Investment Companies.
Not applicable. [CLOSED-END FUNDS ONLY]
Item 8. Portfolio Managers of Closed-End Management Investment Companies.
Not applicable. [CLOSED-END FUNDS ONLY, beginning with reports for periods ended on and after December 31, 2005]
Item 9. Purchases of Equity Securities by Closed-End Management Investment Companies and Affiliated Purchasers.
Not applicable. [CLOSED-END FUNDS ONLY]
Item 10. Submission of Matters to a Vote of Security Holders.
There have been no material changes to the procedures applicable to Item 10.
Item 11. Controls and Procedures.
(a) The Registrant's principal executive and principal financial officers have concluded, based on their evaluation of the Registrant's disclosure controls and procedures as of a date within 90 days of the filing date of this report, that the Registrant's disclosure controls and procedures are reasonably designed to ensure that information required to be disclosed by the Registrant on Form N-CSR is recorded, processed, summarized and reported within the required time periods and that information required to be disclosed by the Registrant in the reports that it files or submits on Form N-CSR is accumulated and communicated to the Registrant's management, including its principal executive and principal financial officers, as appropriate to allow timely decisions regarding required disclosure.
(b) There were no changes to the Registrant's internal control over financial reporting that occurred during the second fiscal quarter of the period covered by this report that have materially affected, or are reasonably likely to materially affect, the Registrant's internal control over financial reporting.
Item 12. Exhibits.
(a)(1) Code of ethics referred to in Item 2.
(a)(2) Certifications of principal executive and principal financial officers as required by Rule 30a-2(a) under the Investment Company Act of 1940.
(a)(3) Not applicable.
(b) Certification of principal executive and principal financial officers as required by Rule 30a-2(b) under the Investment Company Act of 1940.
SIGNATURES
Pursuant to the requirements of the Securities Exchange Act of 1934 and the Investment Company Act of 1940, the Registrant has duly caused this Report to be signed on its behalf by the undersigned, thereunto duly authorized.
Strategic Funds, Inc.;
By: /s/ Bradley J. Skapyak | |
Bradley J. Skapyak, President
| |
Date: | October 26, 2010 |
| |
Pursuant to the requirements of the Securities Exchange Act of 1934 and the Investment Company Act of 1940, this Report has been signed below by the following persons on behalf of the Registrant and in the capacities and on the dates indicated. | |
| |
By: /s/ Bradley J. Skapyak | |
Bradley J. Skapyak, President
| |
Date: | October 26, 2010 |
| |
By: /s/ James Windels | |
James Windels, Treasurer
| |
Date: | October 26, 2010 |
| |
EXHIBIT INDEX
(a)(1) Code of ethics referred to in Item 2.
(a)(2) Certifications of principal executive and principal financial officers as required by Rule 30a-2(a) under the Investment Company Act of 1940. (EX-99.CERT)
(b) Certification of principal executive and principal financial officers as required by Rule 30a-2(b) under the Investment Company Act of 1940. (EX-99.906CERT)