UNITED STATES
SECURITIES AND EXCHANGE COMMISSION
Washington, D.C. 20549
FORM N-CSR
CERTIFIED SHAREHOLDER REPORT OF REGISTERED MANAGEMENT
INVESTMENT COMPANIES
Investment Company Act file number | 811- 3940 |
| |
| Strategic Funds, Inc. | |
| (Exact name of Registrant as specified in charter) | |
| | |
| c/o The Dreyfus Corporation 200 Park Avenue New York, New York 10166 | |
| (Address of principal executive offices) (Zip code) | |
| | |
| Michael A. Rosenberg, Esq. 200 Park Avenue New York, New York 10166 | |
| (Name and address of agent for service) | |
|
Registrant's telephone number, including area code: | (212) 922-6000 |
| |
Date of fiscal year end: | 5/31 | |
Date of reporting period: | 5/31/11 | |
| | |
| | | | | | | |
The following N-CSR relates only to the Registrant’s series listed below and does not affect the other series of the Registrant, which have different fiscal year ends and, therefore, different N-CSR reporting requirements. Separate N-CSR Forms will be filed for these series, as appropriate.
Dreyfus Select Managers Large Cap Growth Fund
Dreyfus Select Managers Small Cap Growth Fund
FORM N-CSR
Item 1. Reports to Stockholders.
|
| Dreyfus |
| Select Managers |
| Large Cap Growth Fund |
ANNUAL REPORT May 31, 2011

Save time. Save paper. View your next shareholder report online as soon as it’s available. Log into www.dreyfus.com and sign up for Dreyfus eCommunications. It’s simple and only takes a few minutes.
The views expressed in this report reflect those of the portfolio manager only through the end of the period covered and do not necessarily represent the views of Dreyfus or any other person in the Dreyfus organization. Any such views are subject to change at any time based upon market or other conditions and Dreyfus disclaims any responsibility to update such views.These views may not be relied on as investment advice and, because investment decisions for a Dreyfus fund are based on numerous factors, may not be relied on as an indication of trading intent on behalf of any Dreyfus fund.
Not FDIC-Insured • Not Bank-Guaranteed • May Lose Value
| | Contents |
| | THE FUND |
| 2 | A Letter from the Chairman and CEO |
| 3 | Discussion of Fund Performance |
| 6 | Fund Performance |
| 8 | Understanding Your Fund’s Expenses |
| 8 | Comparing Your Fund’s Expenses With Those of Other Funds |
| 9 | Statement of Investments |
| 13 | Statement of Assets and Liabilities |
| 14 | Statement of Operations |
| 15 | Statement of Changes in Net Assets |
| 16 | Financial Highlights |
| 17 | Notes to Financial Statements |
| 26 | Report of Independent Registered Public Accounting Firm |
| 27 | Important Tax Information |
| 28 | Board Members Information |
| 31 | Officers of the Fund |
| | FOR MORE INFORMATION |
| | Back Cover |
Dreyfus
Select Managers
Large Cap Growth Fund
The Fund

A LETTER FROM THE CHAIRMAN AND CEO
Dear Shareholder:
We are pleased to present this annual report for Dreyfus Select Managers Large Cap Growth Fund, covering the period from the fund’s inception, July 1, 2010, through May 31, 2011. For information about how the fund performed during the reporting period, as well as general market perspectives, we provide a Discussion of Fund Performance on the pages that follow.
The U.S. economy appears to have hit a soft patch in the spring of 2011 after accelerating over the second half of 2010. Disappointing labor, housing and manufacturing data have come at a time of higher energy prices and some tightening of monetary policy in global markets. In our view, the current slowdown should be relatively brief as the world recovers from the supply shocks created by weather impacts on food production, the decline in Libyan oil exports and supply-chain disruptions stemming from Japan’s natural and nuclear disasters.The U.S. stock market produced mostly positive results in this choppy economic environment due to better-than-expected corporate earnings and robust ongoing industrial demand from the emerging markets.
We remain optimistic as the U.S. economy moves through the middle stages of its cycle. Indeed, global macroeconomic policy generally has remained stimulative despite the recent efforts of some central banks to forestall inflationary pressures. We continue to expect sustainable economic growth, a rising but volatile uptrend in inflation and an improving U.S. labor market in the months ahead.As always, to determine how these forces may affect your investments, we urge you to talk regularly with your financial advisor.
Thank you for your continued confidence and support.

Jonathan R. Baum
Chairman and Chief Executive Officer
The Dreyfus Corporation
June 15, 2011
2

DISCUSSION OF FUND PERFORMANCE
For the period of July 1, 2010, through May 31, 2011, as provided by Keith L. Stransky and Robert B. Mayerick, Portfolio Allocation Managers, EACM Advisors LLC
Market and Fund Performance Overview
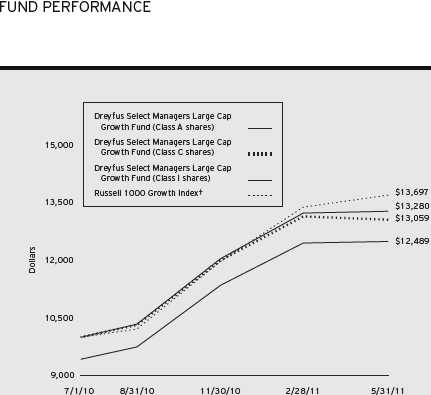
For the period between the fund’s inception on July 1, 2010, and the end of its fiscal year on May 31, 2011, Dreyfus Select Managers Large Cap Growth Fund’s Class A shares produced a total return of 32.48%, Class C shares returned 31.59% and Class I shares returned 32.80%.1 In comparison, the total return of the Russell 1000 Growth Index (the “Index”), the fund’s benchmark, was 36.97% for the same period.2
U.S. stocks generally rallied over the reporting period as an economic recovery appeared to gain momentum. Growth stocks produced higher returns, on average, than value stocks.The fund’s returns, while solid on an absolute basis, were lower than its benchmark, primarily due to shortfalls in the financials, energy, and telecommunications services sectors.
The Fund’s Investment Approach
The fund seeks long term capital appreciation.To pursue its goal, the fund normally invests at least 80% of its assets in the stocks of companies with market capitalizations of $10 billion or more at the time of purchase.
The fund uses a “multi-manager” approach by selecting one or more subadvisers to manage the fund’s assets.We seek subadvisers that complement one another’s styles of investing. We monitor and evaluate the performance of the subadvisers and recommend any changes to Dreyfus and the fund’s board.
The fund’s assets are currently allocated among three subadvisers, each of which acts independently and uses its own methodology to select investments. Currently, 42% of the fund’s assets are under the management of Cupps Capital Management, LLC, which employs a proprietary investment framework to evaluate the attractiveness of stocks. Approximately 39% of the fund’s assets are under the management of Goldman Sachs Asset Management, LP, which employs a bottom-up approach to stock selection.Approximately 19% of the fund’s assets are under the management of Mar Vista Investment Partners, LLC, which
DISCUSSION OF FUND PERFORMANCE (continued)
employs a bottom-up approach to stock selection, seeking high quality growth companies whose stocks are trading at discounts to fair value. These percentages can change over time.
Greater Economic Confidence Fueled a Market Rally
The reporting period began in the midst of a downturn in investor sentiment due to a sovereign debt crisis in Europe and a sluggish U.S. recovery. By the end of the summer of 2010, however, a new round of quantitative easing of U.S. monetary policy convinced investors that a double-dip recession was unlikely. A more optimistic outlook was reinforced by subsequent improvements in employment and consumer spending, better-than-expected corporate earnings and the passage of fiscally stimulative tax legislation.
Although stocks continued to advance over the opening weeks of 2011, the market rally was interrupted in February, when political unrest in the Middle East led to sharply higher energy prices, and again in March, when devastating natural and nuclear disasters in Japan threatened one of the world’s largest economies. Stocks mostly rebounded after these unexpected setbacks, but disappointing U.S. financial data in the spring caused investors to reduce their economic expectations, and stocks gave back a portion of their previous gains.
Financial Sector Dampened Relative Performance
Although the fund participated to a significant degree in the reporting period’s gains, relative performance was undermined by disappointing stock selection in the financial sector. Insurance conglomerate Berkshire Hathaway failed to advance due to controversy surrounding the company’s acquisition of chemicals producer Lubrizol, and commodities exchange CME Group suffered from uncertainty regarding regulatory reforms.
Underweighted exposure to the energy sector also hindered relative performance. Particularly damaging was an underweighting in integrated energy giant Exxon Mobil, which comprises a significant portion of the benchmark, and performed well. Finally, an overweighted position in the telecommunications services sector weighed on results; disappointments included cellphone tower operators American Tower and Crown Castle International, which were hurt by concerns regarding consolidation among wireless carriers.
4
The fund achieved better results in the information technology sector, where an overweighted position buoyed relative performance.Top performers included software developers Citrix Systems and Salesforce.com, which benefited from the growing popularity of “cloud computing.” Materials stocks also fared relatively well, as coal and metals producer Ivanhoe Mines more than doubled in value amid takeover speculation.
Finding Opportunities in a Slow-Growth Environment
As of the reporting period’s end, the U.S. economy appears to have hit a soft patch. Moreover, global macroeconomic developments have captured investors’ attention, distracting them from the business fundamentals that historically have driven equity markets over the long term.Therefore, we expect heightened market volatility to persist until the direction of the economy and corporate earnings becomes clearer.
We remain optimistic over the longer term. In our analysis, valuations currently appear reasonable, and large-cap companies should benefit as they put some of their massive cash reserves to work in shareholder-friendly ways. As always, we intend to adjust the fund’s allocations among its underlying investment managers as market conditions develop and opportunities arise.
June 15, 2011
|
| Equity funds are subject generally to market, market sector, market liquidity, issuer and investment |
| style risks, among other factors, to varying degrees, all of which are more fully described in the |
| fund’s prospectus. |
| Total return includes reinvestment of dividends and any capital gains paid, and does not take into |
| consideration the maximum initial sales charge in the case of Class A shares, or the applicable |
| contingent deferred sales charge imposed on redemptions in the case of Class C shares. Had these |
| charges been reflected, returns would have been lower. Past performance is no guarantee of future |
| results. Share price and investment return fluctuate such that upon redemption, fund shares may be |
| worth more or less than their original cost. Return figures provided reflect the absorption of certain |
| fund expenses by The Dreyfus Corporation pursuant to an undertaking in effect through October |
| 1, 2011, at which time it may be extended, terminated or modified. Had these expenses not been |
| absorbed, the fund’s returns would have been lower. |
| SOURCE: LIPPER INC. — Reflects the monthly reinvestment of dividends and, where |
| applicable, capital gain distributions.The Russell 1000 Growth Index is an unmanaged index |
| that measures the performance of those Russell 1000 companies with higher price-to-book ratios |
| and higher forecasted growth values.The index does not take into account fees and expenses to |
| which the fund is subject. Investors cannot invest directly in any index. |
|
| Comparison of change in value of $10,000 investment in Dreyfus Select Managers Large Cap |
| Growth Fund Class A shares, Class C shares and Class I shares and the Russell 1000 Growth Index |
| |
| † Source: Lipper Inc. |
| Past performance is not predictive of future performance. |
| The above graph compares a $10,000 investment made in Class A, Class C and Class I shares of Dreyfus Select |
| Managers Large Cap Growth Fund on 7/1/10 (inception date) to a $10,000 investment made in the Russell 1000 |
| Growth Index (the “Index”) on that date.All dividends and capital gain distributions are reinvested. |
| The fund’s performance shown in the line graph takes into account the maximum initial sales charge on Class A shares, |
| the applicable contingent deferred sales charge on Class C shares and all other applicable fees and expenses on all classes. |
| The Index is a widely accepted, unmanaged large-cap index that measures the performance of those Russell 1000 |
| companies with higher price-to-book ratios and higher forecasted growth values. Unlike a mutual fund, the Index is not |
| subject to charges, fees and other expenses. Investors cannot invest directly in any index. Further information relating to |
| fund expenses, including expense reimbursements, if applicable, is contained in the Expenses section of the prospectus and |
| elsewhere in this report. |
6
| | |
| Actual Aggregate Total Returns as of 5/31/11 | | |
| |
| | Inception | From |
| | Date | Inception |
| Class A shares | | |
| with maximum sales charge (5.75%) | 7/1/10 | 24.89% |
| without sales charge | 7/1/10 | 32.48% |
| Class C shares | | |
| with applicable redemption charge † | 7/1/10 | 30.59% |
| without redemption | 7/1/10 | 31.59% |
| Class I shares | 7/1/10 | 32.80% |
| Russell 1000 Growth Index | 6/30/10 | 36.97%†† |
Past performance is not predictive of future performance.The fund’s performance shown in the graph and table does not reflect the deduction of taxes that a shareholder would pay on fund distributions or the redemption of fund shares.
| |
| † | The maximum contingent deferred sales charge for Class C shares is 1% for shares redeemed within one year of the |
| | date of purchase. |
| †† | For comparative purposes, the value of the Index as of 6/30/10 is used as the beginning value on 7/1/10. |
UNDERSTANDING YOUR FUND’S EXPENSES (Unaudited)
As a mutual fund investor, you pay ongoing expenses, such as management fees and other expenses. Using the information below, you can estimate how these expenses affect your investment and compare them with the expenses of other funds.You also may pay one-time transaction expenses, including sales charges (loads) and redemption fees, which are not shown in this section and would have resulted in higher total expenses. For more information, see your fund’s prospectus or talk to your financial adviser.
Review your fund’s expenses
The table below shows the expenses you would have paid on a $1,000 investment in Dreyfus Select Managers Large Cap Growth Fund from December 1, 2010 to May 31, 2011. It also shows how much a $1,000 investment would be worth at the close of the period, assuming actual returns and expenses.
Expenses and Value of a $1,000 Investment
assuming actual returns for the six months ended May 31, 2011
| | | |
| | Class A | Class C | Class I |
| Expenses paid per $1,000† | $ 6.55 | $ 10.45 | $ 5.24 |
| Ending value (after expenses) | $1,100.30 | $1,096.60 | $1,102.30 |
COMPARING YOUR FUND’S EXPENSES
WITH THOSE OF OTHER FUNDS (Unaudited)
Using the SEC’s method to compare expenses
The Securities and Exchange Commission (SEC) has established guidelines to help investors assess fund expenses. Per these guidelines, the table below shows your fund’s expenses based on a $1,000 investment, assuming a hypothetical 5% annualized return. You can use this information to compare the ongoing expenses (but not transaction expenses or total cost) of investing in the fund with those of other funds.All mutual fund shareholder reports will provide this information to help you make this comparison. Please note that you cannot use this information to estimate your actual ending account balance and expenses paid during the period.
Expenses and Value of a $1,000 Investment
assuming a hypothetical 5% annualized return for the six months ended May 31, 2011
| | | |
| | Class A | Class C | Class I |
| Expenses paid per $1,000† | $ 6.29 | $ 10.05 | $ 5.04 |
| Ending value (after expenses) | $1,018.70 | $1,014.96 | $1,019.95 |
|
| † Expenses are equal to the fund’s annualized expense ratio of 1.25% for Class A, 2.00% for Class C and 1.00% |
| for Class I, multiplied by the average account value over the period, multiplied by 182/365 (to reflect the one-half |
| year period). |
8
STATEMENT OF INVESTMENTS
May 31, 2011
| | |
| Common Stocks—99.0% | Shares | Value ($) |
| Consumer Discretionary—15.0% | | |
| Avon Products | 2,537 | 75,374 |
| Chipotle Mexican Grill | 170 a | 49,142 |
| Ford Motor | 4,111 a | 61,336 |
| Johnson Controls | 1,442 | 57,103 |
| Lowe’s | 6,073 | 146,603 |
| MasterCard, Cl. A | 538 | 154,433 |
| Netflix | 370 a | 100,196 |
| New Oriental Education & | | |
| Technology Group, ADR | 260 a | 30,113 |
| News, Cl. A | 2,733 | 50,123 |
| NIKE, Cl. B | 1,038 | 87,659 |
| Omnicom Group | 934 | 43,683 |
| Paychex | 2,199 | 71,028 |
| Polo Ralph Lauren | 252 | 31,946 |
| Staples | 5,610 | 94,360 |
| Starbucks | 650 | 23,914 |
| VF | 250 | 24,918 |
| Walt Disney | 1,723 | 71,728 |
| | | 1,173,659 |
| Consumer Staples—6.6% | | |
| Anheuser-Busch, ADR | 347 | 20,987 |
| Costco Wholesale | 1,476 | 121,740 |
| Green Mountain Coffee Roasters | 405 a | 33,360 |
| Monsanto | 690 | 49,018 |
| PepsiCo | 2,530 | 179,933 |
| Procter & Gamble | 625 | 41,875 |
| Yum! Brands | 1,263 | 69,869 |
| | | 516,782 |
| Energy—7.8% | | |
| Baker Hughes | 875 | 64,689 |
| Chevron | 770 | 80,781 |
| Devon Energy | 401 | 33,712 |
| Exxon Mobil | 855 | 71,367 |
| Halliburton | 1,374 | 68,906 |
| Occidental Petroleum | 478 | 51,552 |
| PetroHawk Energy | 920 a | 24,352 |
STATEMENT OF INVESTMENTS (continued)
| | | |
| Common Stocks (continued) | Shares | | Value ($) |
| Energy (continued) | | | |
| Schlumberger | 1,982 | | 169,897 |
| Southwestern Energy | 1,051 a | 46,002 |
| | | | 611,258 |
| Financial—6.4% | | | |
| American Express | 961 | | 49,588 |
| Berkshire Hathaway, Cl. B | 794 | a | 62,782 |
| CB Richard Ellis Group, Cl. A | 3,210 | a | 84,840 |
| Charles Schwab | 3,562 | | 64,151 |
| CME Group | 298 | | 85,156 |
| ICICI Bank, ADR | 435 | | 20,745 |
| JPMorgan Chase & Co. | 560 | | 24,214 |
| Northern Trust | 1,065 | | 51,961 |
| Wells Fargo & Co. | 2,119 | | 60,116 |
| | | | 503,553 |
| Health Care—8.5% | | | |
| C.R. Bard | 566 | | 63,267 |
| Gilead Sciences | 1,171 | a | 48,878 |
| HCA Holdings | 1,375 | | 47,974 |
| Illumina | 566 a | 40,797 |
| Intuitive Surgical | 317 | a | 110,633 |
| Johnson & Johnson | 2,105 | | 141,646 |
| St. Jude Medical | 2,125 | | 107,674 |
| Teva Pharmaceutical Industries, ADR | 1,094 | | 55,685 |
| Vertex Pharmaceuticals | 825 a | 44,542 |
| | | | 661,096 |
| Industrial—7.8% | | | |
| Deere & Co. | 191 | | 16,441 |
| FedEx | 726 | | 67,983 |
| General Dynamics | 440 | | 32,657 |
| Goodrich | 1,688 | | 147,346 |
| Parker Hannifin | 633 | | 56,242 |
| Thermo Fisher Scientific | 2,808 | a | 183,784 |
| Union Pacific | 468 | | 49,126 |
| United Continential Holdings | 2,420 | a | 58,443 |
| | | | 612,022 |
10
| | |
| Common Stocks (continued) | Shares | Value ($) |
| Information Technology—30.7% | | |
| Altera | 855 | 41,117 |
| Amazon.com | 898 a | 176,628 |
| Apple | 1,257 a | 437,222 |
| Applied Materials | 2,275 | 31,349 |
| ASML Holding (NY Shares) | 841 | 32,807 |
| Baidu, ADR | 513 a | 69,619 |
| Citrix Systems | 994 a | 87,094 |
| Corning | 2,026 | 40,824 |
| EMC | 3,393 a | 96,599 |
| Emerson Electric | 1,112 | 60,660 |
| Equinix | 616 a | 62,462 |
| Google, Cl. A | 225 a | 119,030 |
| Hewlett-Packard | 1,217 | 45,491 |
| Intel | 3,060 | 68,881 |
| Intuit | 833 a | 44,957 |
| KLA-Tencor | 720 | 31,032 |
| Micron Technology | 3,140 a | 32,028 |
| Microsoft | 2,245 | 56,147 |
| NetApp | 1,536 a | 84,127 |
| Oracle | 8,192 | 280,330 |
| Rackspace Hosting | 1,664 a | 73,216 |
| Salesforce.com | 1,073 a | 163,375 |
| Texas Instruments | 1,847 | 65,199 |
| VMware, Cl. A | 843 a | 82,041 |
| Xilinx | 3,167 | 112,999 |
| Yandex, Cl. A | 50 | 1,673 |
| | | 2,396,907 |
| Materials—5.6% | | |
| Cliffs Natural Resources | 360 | 32,652 |
| Dow Chemical | 405 | 14,633 |
| E.I. du Pont de Nemours & Co. | 795 | 42,373 |
| Freeport-McMoRan Copper & Gold | 783 | 40,434 |
| Ivanhoe Mines | 1,343 a | 33,857 |
| Joy Global | 586 | 52,535 |
| Praxair | 1,324 | 140,132 |
STATEMENT OF INVESTMENTS (continued)
| | | |
| Common Stocks (continued) | | Shares | Value ($) |
| Materials (continued) | | | |
| Precision Castparts | | 497 | 78,079 |
| | | | 434,695 |
| Telecommunications—10.6% | | | |
| Alcatel-Lucent, ADR | | 12,725 | 72,151 |
| American Tower, Cl. A | | 3,717 a | 206,219 |
| Crown Castle International | | 1,975 a | 81,785 |
| IPG Photonics | | 445 a | 33,442 |
| Juniper Networks | | 1,445 a | 52,901 |
| Polycom | | 1,200 a | 68,892 |
| QUALCOMM | | 5,389 | 315,741 |
| | | | 831,131 |
| |
| Total Investments (cost $6,388,233) | 99.0% | 7,741,103 |
| Cash and Receivables (Net) | | 1.0% | 74,474 |
| Net Assets | | 100.0% | 7,815,577 |
| |
| ADR—American Depository Receipts | | | |
| a Non-income producing security. | | | |
| |
| |
| |
| Portfolio Summary (Unaudited)† | | |
| | Value (%) | | Value (%) |
| Information Technology | 30.7 | Energy | 7.8 |
| Consumer Discretionary | 15.0 | Consumer Staples | 6.6 |
| Telecommunications | 10.6 | Financial | 6.4 |
| Health Care | 8.5 | Materials | 5.6 |
| Industrial | 7.8 | | 99.0 |
| |
| † Based on net assets. | | | |
| See notes to financial statements. | | | |
12
|
| STATEMENT OF ASSETS AND LIABILITIES |
| May 31, 2011 |
| | | |
| | | Cost | Value |
| Assets ($): | | | |
| Investments in securities—See Statement of Investments | 6,388,233 | 7,741,103 |
| Cash | | | 208,627 |
| Dividends receivable | | | 8,877 |
| Prepaid expenses | | | 39,049 |
| Due from The Dreyfus Corporation and affiliates—Note 3(c) | | 2,289 |
| | | | 7,999,945 |
| Liabilities ($): | | | |
| Payable for investment securities purchased | | | 131,018 |
| Accrued expenses | | | 53,350 |
| | | | 184,368 |
| Net Assets ($) | | | 7,815,577 |
| Composition of Net Assets ($): | | | |
| Paid-in capital | | | 6,010,903 |
| Accumulated net realized gain (loss) on investments | | | 451,804 |
| Accumulated net unrealized appreciation | | | |
| (depreciation) on investments | | | 1,352,870 |
| Net Assets ($) | | | 7,815,577 |
| |
| |
| Net Asset Value Per Share | | | |
| | Class A | Class C | Class I |
| Net Assets ($) | 1,315,519 | 1,290,399 | 5,209,659 |
| Shares Outstanding | 80,992 | 80,000 | 320,000 |
| Net Asset Value Per Share ($) | 16.24 | 16.13 | 16.28 |
| |
| See notes to financial statements. | | | |
|
| STATEMENT OF OPERATIONS |
| From July 1, 2010 (commencement of operations) to May 31, 2011 |
| |
| Investment Income ($): | |
| Income: | |
| Cash dividends (net of $485 foreign taxes withheld at source) | 66,859 |
| Expenses: | |
| Management fee—Note 3(a) | 49,854 |
| Legal fees | 84,424 |
| Registration fees | 50,847 |
| Auditing fees | 39,306 |
| Custodian fees—Note 3(c) | 13,113 |
| Distribution fees—Note 3(b) | 8,266 |
| Shareholder servicing costs—Note 3(c) | 6,024 |
| Prospectus and shareholders’ reports | 5,954 |
| Directors’ fees and expenses—Note 3(d) | 5,338 |
| Loan commitment fees—Note 2 | 66 |
| Miscellaneous | 9,561 |
| Total Expenses | 272,753 |
| Less—expense reimbursement from The Dreyfus | |
| Corporation due to undertaking—Note 3(a) | (192,414) |
| Net Expenses | 80,339 |
| Investment (Loss)—Net | (13,480) |
| Realized and Unrealized Gain (Loss) on Investments—Note 4 ($): | |
| Net realized gain (loss) on investments | 605,832 |
| Net unrealized appreciation (depreciation) on investments | 1,352,870 |
| Net Realized and Unrealized Gain (Loss) on Investments | 1,958,702 |
| Net Increase in Net Assets Resulting from Operations | 1,945,222 |
| |
| See notes to financial statements. | |
14
|
| STATEMENT OF CHANGES IN NET ASSETS |
| From July 1, 2010 (commencement of operations) to May 31, 2011 |
| |
| Operations ($): | |
| Investment (loss)—net | (13,480) |
| Net realized gain (loss) on investments | 605,832 |
| Net unrealized appreciation (depreciation) on investments | 1,352,870 |
| Net Increase (Decrease) in Net Assets | |
| Resulting from Operations | 1,945,222 |
| Dividends to Shareholders from ($): | |
| Net realized gain on investments: | |
| Class A Shares | (24,240) |
| Class C Shares | (24,240) |
| Class I Shares | (96,960) |
| Total Dividends | (145,440) |
| Capital Stock Transactions ($): | |
| Net proceeds from shares sold: | |
| Class A Shares | 1,046,000 |
| Class C Shares | 1,000,000 |
| Class I Shares | 4,000,000 |
| Cost of shares redeemed: | |
| Class A Shares | (30,205) |
| Increase (Decrease) in Net Assets | |
| from Capital Stock Transactions | 6,015,795 |
| Total Increase (Decrease) in Net Assets | 7,815,577 |
| Net Assets ($): | |
| Beginning of Period | — |
| End of Period | 7,815,577 |
| Capital Share Transactions (Shares): | |
| Class A | |
| Shares sold | 82,859 |
| Shares redeemed | (1,867) |
| Net Increase (Decrease) in Shares Outstanding | 80,992 |
| Class C | |
| Shares sold | 80,000 |
| Class I | |
| Shares sold | 320,000 |
| |
| See notes to financial statements. | |
FINANCIAL HIGHLIGHTS
The following table describes the performance for each share class for the period from July 1, 2010 (commencement of operations) to May 31, 2011.All information (except portfolio turnover rate) reflects financial results for a single fund share. Total return shows how much your investment in the fund would have increased (or decreased) during the period, assuming you had reinvested all dividends and distributions.These figures have been derived from the fund’s financial statements.
| | | |
| | Class A | Class C | Class I |
| | Shares | Shares | Shares |
| Per Share Data ($): | | | |
| Net asset value, beginning of period | 12.50 | 12.50 | 12.50 |
| Investment Operations: | | | |
| Investment income (loss)—neta | (.03) | (.14) | .00b |
| Net realized and unrealized | | | |
| gain (loss) on investments | 4.07 | 4.07 | 4.08 |
| Total from Investment Operations | 4.04 | 3.93 | 4.08 |
| Distributions: | | | |
| Dividends from net realized gain on investments | (.30) | (.30) | (.30) |
| Net asset value, end of period | 16.24 | 16.13 | 16.28 |
| Total Return (%)c | 32.48d | 31.59d | 32.80 |
| Ratios/Supplemental Data (%): | | | |
| Ratio of total expenses to average net assetse | 4.15 | 4.90 | 3.90 |
| Ratio of net expenses to average net assetse | 1.25 | 2.00 | 1.00 |
| Ratio of net investment income | | | |
| (loss) to average net assetse | (.24) | (.99) | .00f |
| Portfolio Turnover Ratec | 127.65 | 127.65 | 127.65 |
| Net Assets, end of period ($ x 1,000) | 1,316 | 1,290 | 5,210 |
| |
| a | Based on average shares outstanding at each month end. |
| b | Amount represents less than $.01 per share. |
| c | Not annualized. |
| d | Exclusive of sales charge. |
| e | Annualized. |
| f | Amount represents less than .01%. |
See notes to financial statements.
16
NOTES TO FINANCIAL STATEMENTS
NOTE 1—Significant Accounting Policies:
Dreyfus Select Managers Large Cap Growth Fund (the “fund”) is a separate diversified series of Strategic Funds, Inc. (the “Company”) which is registered under the Investment Company Act of 1940, as amended (the “Act”), as an open-end management investment company and operates as a series company currently offering ten series, including the fund, which commenced operations on July 1, 2010.The fund’s investment objective is to seek capital appreciation.The Dreyfus Corporation (the “Manager” or “Dreyfus”), a wholly-owned subsidiary of The Bank of New York Mellon Corporation (“BNY Mellon”), serves as the fund’s investment adviser. EACM Advisors LLC (“EACM”), a subsidiary of BNY Mellon and an affiliate of Dreyfus, serves as the fund’s portfolio allocation manager. Cupps Capital Management, LLC (“CCM”), Goldman Sachs Asset Management, L.P. (“GSAM”) and MarVista Investment Partners, LLC (“MarVista”) serve as the fund’s sub-investment advisers, each managing an allocated portion of the fund’s portfolio.
MBSC Securities Corporation (the “Distributor”), a wholly-owned subsidiary of Dreyfus, is the distributor of the fund’s shares.The fund is authorized to issue 75 million shares of $.001 par value Common Stock in each of the following classes of shares: Class A, Class C and Class I. Class A shares are subject to a sales charge imposed at the time of purchase. Class C shares are subject to a contingent deferred sales charge (“CDSC”) imposed on Class C shares redeemed within one year of purchase. Class I shares are sold at net asset value per share only to institutional investors. Other differences between the classes include the services offered to and the expenses borne by each class, the allocation of certain transfer agency costs and certain voting rights. Income, expenses (other than expenses attributable to a specific class), and realized and unrealized gains or losses on investments are allocated to each class of shares based on its relative net assets.
NOTES TO FINANCIAL STATEMENTS (continued)
The Company accounts separately for the assets, liabilities and operations of each series. Expenses directly attributable to each series are charged to that series’ operations; expenses which are applicable to all series are allocated among them on a pro rata basis.
The Financial Accounting Standards Board (“FASB”) Accounting Standards Codification (“ASC”) is the exclusive reference of authoritative U.S. generally accepted accounting principles (“GAAP”) recognized by the FASB to be applied by nongovernmental entities. Rules and interpretive releases of the Securities and Exchange Commission (“SEC”) under authority of federal laws are also sources of authoritative GAAP for SEC registrants. The fund’s financial statements are prepared in accordance with GAAP, which may require the use of management estimates and assumptions.Actual results could differ from those estimates.
The Company enters into contracts that contain a variety of indemnifications.The fund’s maximum exposure under these arrangements is unknown.The fund does not anticipate recognizing any loss related to these arrangements.
(a) Portfolio valuation: Investments in securities are valued at the last sales price on the securities exchange or national securities market on which such securities are primarily traded. Securities listed on the National Market System for which market quotations are available are valued at the official closing price or, if there is no official closing price that day, at the last sales price. Securities not listed on an exchange or the national securities market, or securities for which there were no transactions, are valued at the average of the most recent bid and asked prices, except for open short positions, where the asked price is used for valuation purposes. Bid price is used when no asked price is available. U.S. Treasury Bills are valued by an independent pricing service approved by the Board of Directors. Registered investment companies that are not traded on an exchange are valued at their net asset value.
18
When market quotations or official closing prices are not readily available, or are determined not to reflect accurately fair value, such as when the value of a security has been significantly affected by events after the close of the exchange or market on which the security is principally traded (for example, a foreign exchange or market),but before the fund calculates its net asset value, the fund may value these investments at fair value as determined in accordance with the procedures approved by the Board of Directors. Fair valuing of securities may be determined with the assistance of a pricing service using calculations based on indices of domestic securities and other appropriate indicators, such as prices of relevant ADRs and futures contracts. For other securities that are fair valued by the Board of Directors, certain factors may be considered such as: fundamental analytical data, the nature and duration of restrictions on disposition, an evaluation of the forces that influence the market in which the securities are purchased and sold and public trading in similar securities of the issuer or comparable issuers.
The fair value of a financial instrument is the amount that would be received to sell an asset or paid to transfer a liability in an orderly transaction between market participants at the measurement date (i.e. the exit price). GAAP establishes a fair value hierarchy that prioritizes the inputs of valuation techniques used to measure fair value.This hierarchy gives the highest priority to unadjusted quoted prices in active markets for identical assets or liabilities (Level 1 measurements) and the lowest priority to unobservable inputs (Level 3 measurements).
Additionally, GAAP provides guidance on determining whether the volume and activity in a market has decreased significantly and whether such a decrease in activity results in transactions that are not orderly. GAAP requires enhanced disclosures around valuation inputs and techniques used during annual and interim periods.
NOTES TO FINANCIAL STATEMENTS (continued)
Various inputs are used in determining the value of the fund’s investments relating to fair value measurements.These inputs are summarized in the three broad levels listed below:
Level 1—unadjusted quoted prices in active markets for identical investments.
Level 2—other significant observable inputs (including quoted prices for similar investments, interest rates, prepayment speeds, credit risk, etc.).
Level 3—significant unobservable inputs (including the fund’s own assumptions in determining the fair value of investments).
The inputs or methodology used for valuing securities are not necessarily an indication of the risk associated with investing in those securities.
The following is a summary of the inputs used as of May 31, 2011, in valuing the fund’s investments:
| | | | |
| | | Level 2—Other | Level 3— | |
| | Level 1— | Significant | Significant | |
| | Unadjusted | Observable | Unobservable | |
| | Quoted Prices | Inputs | Inputs | Total |
| Assets ($) | | | | |
| Investments in Securities: | | | |
| Equity Securities— | | | | |
| Domestic† | 7,436,273 | — | — | 7,436,273 |
| Equity Securities— | | | | |
| Foreign† | 304,830 | — | — | 304,830 |
| |
| † See Statement of Investments for additional detailed categorizations. | |
In January 2010, FASB issued Accounting Standards Update (“ASU”) No. 2010-06 “Improving Disclosures about FairValue Measurements”. The portions of ASU No. 2010-06 which require reporting entities to prepare new disclosures surrounding amounts and reasons for significant transfers in and out of Level 1 and Level 2 fair value measurements as well as inputs and valuation techniques used to measure fair value for both recurring and nonrecurring fair value measurements that fall in either Level 2 or Level 3 have been adopted by the fund. No significant transfers between Level 1 or Level 2 fair value measurements occurred at May 31, 2011.
20
In May 2011, FASB issued ASU No. 2011-04 “Amendments to Achieve Common Fair Value Measurement and Disclosure Requirements in GAAP and International Financial Reporting Standards (“IFRS”)”. ASU No. 2011-04 includes common requirements for measurement of and disclosure about fair value between GAAP and IFRS. ASU No. 2011-04 will require reporting entities to disclose the following information for fair value measurements categorized within Level 3 of the fair value hierarchy: quantitative information about the unobservable inputs used in the fair value measurement, the valuation processes used by the reporting entity and a narrative description of the sensitivity of the fair value measurement to changes in unobservable inputs and the interrelationships between those unobservable inputs. In addition,ASU No. 2011-04 will require reporting entities to make disclosures about amounts and reasons for all transfers in and out of Level 1 and Level 2 fair value measurements. The new and revised disclosures are effective for interim and annual reporting periods beginning after December 15, 2011. At this time, management is evaluating the implications of ASU No. 2011-04 and its impact on the financial statements.
(b) Securities transactions and investment income: Securities transactions are recorded on a trade date basis. Realized gains and losses from securities transactions are recorded on the identified cost basis. Dividend income is recognized on the ex-dividend date and interest income, including, where applicable, accretion of discount and amortization of premium on investments, is recognized on the accrual basis.
(c) Affiliated issuers: Investments in other investment companies advised by Dreyfus are defined as “affiliated” in the Act.
(d) Dividends to shareholders: Dividends are recorded on the ex-dividend date. Dividends from investment income-net and dividends from net realized capital gains, if any, are normally declared and paid annually, but the fund may make distributions on a more frequent basis to comply with the distribution requirements of the Internal Revenue Code of 1986, as amended (the “Code”).To the extent that
NOTES TO FINANCIAL STATEMENTS (continued)
net realized capital gains can be offset by capital loss carryovers, it is the policy of the fund not to distribute such gains. Income and capital gain distributions are determined in accordance with income tax regulations, which may differ from GAAP.
(e) Federal income taxes: It is the policy of the fund to continue to qualify as a regulated investment company, if such qualification is in the best interests of its shareholders, by complying with the applicable provisions of the Code, and to make distributions of taxable income sufficient to relieve it from substantially all federal income and excise taxes.
As of and during the period ended May 31, 2011, the fund did not have any liabilities for any uncertain tax positions.The fund recognizes interest and penalties, if any, related to uncertain tax positions as income tax expense in the Statement of Operations. During the period, the fund did not incur any interest or penalties.
At May 31, 2011, the components of accumulated earnings on a tax basis were as follows: undistributed ordinary income $481,321 and unrealized appreciation $1,323,353.
The tax character of distributions paid to shareholders during the fiscal period ended May 31, 2011 was as follows: ordinary income $145,440.
During the period ended May 31, 2011, as a result of permanent book to tax differences, primarily due to the tax treatment for net operating losses and fund start-up costs, the fund increased accumulated undistributed investment income-net by $13,480, decreased accumulated net realized gain (loss) on investments by $8,588 and decreased paid-in capital by $4,892. Net assets and net asset value per share were not affected by this reclassification.
NOTE 2—Bank Lines of Credit:
The fund participates with other Dreyfus-managed funds in a $225 million unsecured credit facility led by Citibank, N.A. and a $300 million unsecured credit facility provided by The Bank of New York Mellon, a subsidiary of BNY Mellon and an affiliate of Dreyfus (each,
22
a “Facility”), each to be utilized primarily for temporary or emergency purposes, including the financing of redemptions. In connection therewith, the fund has agreed to pay its pro rata portion of commitment fees for each Facility. Interest is charged to the fund based on rates determined pursuant to the terms of the respective Facility at the time of borrowing. During the period ended May 31, 2011, the fund did not borrow under the Facilities.
NOTE 3—Management Fee, Sub-Investment Advisory Fee and Other Transactions With Affiliates:
(a) Pursuant to a management agreement (“Agreement”) with Dreyfus, the management fee is computed at the annual rate of .75% of the value of the fund’s average daily net assets and is payable monthly. Dreyfus has contractually agreed, until October 1, 2011, to waive receipt of its fees and/or assume the expenses of the fund so that the direct expenses of none of the classes (excluding Rule 12b-1 fees, shareholder services fees, taxes, interest, brokerage commissions, commitment fees on borrowings and extraordinary expenses) exceed 1% of the value of the fund’s average daily net assets.The expense reimbursement, pursuant to the undertaking, amounted to $192,414 during the period ended May 31, 2011.
Pursuant to separate Sub-Investment Advisory Agreements (each, a “Sub-Investment Advisory Agreement”) between Dreyfus and each of CCM, GSAM and Mar Vista, each Sub-Investment Advisory Agreement will continue until November 30, 2011. Dreyfus pays CCM, GSAM and Mar Vista separate monthly fees at an annual percentage rate based on the average daily net assets of the fund under the Sub-Adviser’s management.
(b) Under the Distribution Plan (the “Plan”) adopted pursuant to Rule 12b-1 under the Act, Class C shares pay the Distributor for distributing its shares at an annual rate of .75% of the value of the average daily net assets of Class C shares. During the period ended May 31, 2011, Class C shares were charged $8,266 pursuant to the Plan.
NOTES TO FINANCIAL STATEMENTS (continued)
(c) Under the Shareholder Services Plan, Class A and Class C shares pay the Distributor at an annual rate of .25% of the value of their average daily net assets for the provision of certain services. The services provided may include personal services relating to shareholder accounts, such as answering shareholder inquiries regarding Class A and Class C shares and providing reports and other information, and services related to the maintenance of shareholder accounts. The Distributor may make payments to Service Agents (a securities dealer, financial institution or other industry professional) in respect of these services.The Distributor determines the amounts to be paid to Service Agents. During the period ended May 31, 2011, Class A and Class C shares were charged $2,788 and $2,756, respectively, pursuant to the Shareholder Services Plan.
The fund compensates Dreyfus Transfer, Inc., a wholly-owned subsidiary of Dreyfus, under a transfer agency agreement for providing personnel and facilities to perform transfer agency services for the fund. During the period ended May 31, 2011, the fund was charged $55 pursuant to the transfer agency agreement, which is included in Shareholder servicing costs in the Statement of Operations.
The fund has arrangements with the custodian and cash management bank whereby the fund may receive earnings credits when positive cash balances are maintained, which are used to offset custody and cash management fees. For financial reporting purposes, the fund includes net earnings credits as an expense offset in the Statement of Operations.
The fund compensates The Bank of New York Mellon under a cash management agreement for performing cash management services related to fund subscriptions and redemptions. During the period ended May 31, 2011, the fund was charged $9 pursuant to the cash management agreement, which is included in Shareholder servicing costs in the Statement of Operations.
24
The fund also compensates The Bank of New York Mellon under a custody agreement for providing custodial services for the fund. During the period ended May 31, 2011, the fund was charged $13,113 pursuant to the custody agreement.
During the period ended May 31, 2011, the fund was charged $6,387 for services performed by the Chief Compliance Officer.
The components of “Due fromThe Dreyfus Corporation and affiliates” in the Statement of Assets and Liabilities consist of: management fees $4,949, Rule 12b-1 distribution plan fees $816, shareholder services plan fees $552, custodian fees $7,299, chief compliance officer fees $3,006 and transfer agency per account fees $15, which are offset against an expense reimbursement currently in effect in the amount of $18,926.
(d) Each Board member also serves as a Board member of other funds within the Dreyfus complex. Annual retainer fees and attendance fees are allocated to each fund based on net assets.
NOTE 4—Securities Transactions:
The aggregate amount of purchases and sales of investment securities, excluding short-term securities, during the period ended May 31, 2011, amounted to $14,869,926 and $9,086,768, respectively.
At May 31, 2011, the cost of investments for federal income tax purposes was $6,417,750; accordingly, accumulated net unrealized appreciation on investments was $1,323,353, consisting of $1,423,488 gross unrealized appreciation and $100,135 gross unrealized depreciation.
REPORT OF INDEPENDENT REGISTERED
PUBLIC ACCOUNTING FIRM
Shareholders and Board of Directors
Dreyfus Select Managers Large Cap Growth Fund
We have audited the accompanying statement of assets and liabilities, including the statement of investments, of Dreyfus Select Managers Large Cap Growth Fund (one of the series comprising Strategic Funds, Inc.) as of May 31, 2011, and the related statements of operations and changes in net assets and financial highlights for the period from July 1, 2010 (commencement of operations) to May 31, 2011.These financial statements and financial highlights are the responsibility of the Fund’s management. Our responsibility is to express an opinion on these financial statements and financial highlights based on our audit.
We conducted our audit in accordance with the standards of the Public Company Accounting Oversight Board (United States).Those standards require that we plan and perform the audit to obtain reasonable assurance about whether the financial statements and financial highlights are free of material misstatement.We were not engaged to perform an audit of the Fund’s internal control over financial reporting. Our audit included consideration of internal control over financial reporting as a basis for designing audit procedures that are appropriate in the circumstances, but not for the purpose of expressing an opinion on the effectiveness of the Fund’s internal control over financial reporting. Accordingly, we express no such opinion.An audit also includes examining, on a test basis, evidence supporting the amounts and disclosures in the financial statements and financial highlights, assessing the accounting principles used and significant estimates made by management, and evaluating the overall financial statement presentation. Our procedures included confirmation of securities owned as of May 31, 2011 by correspondence with the custodian and others.We believe that our audit provides a reasonable basis for our opinion.
In our opinion, the financial statements and financial highlights referred to above present fairly, in all material respects, the financial position of Dreyfus Select Managers Large Cap Growth Fund at May 31, 2011, and the results of its operations, the changes in its net assets and the financial highlights for the period from July 1, 2010 to May 31, 2011, in conformity with U.S. generally accepted accounting principles.

New York, New York
July 26, 2011
26
IMPORTANT TAX INFORMATION (Unaudited)
For federal tax purposes the fund hereby designates 9.99% of the ordinary dividends paid during the fiscal year ended May 31, 2011 as qualifying for the corporate dividends received deduction. Also certain dividends paid by the fund may be subject to a maximum tax rate of 15%, as provided for by the Jobs and Growth Tax Relief Reconciliation Act of 2003. Of the distributions paid during the fiscal year, $65,286 represents the maximum amount that may be considered qualified dividend income. Shareholders will receive notification in early 2012 of the percentage applicable to the preparation of their 2011 income tax returns. Also, the fund hereby designates $.3030 per share as a short-term capital gain distribution paid on December 16, 2010.
BOARD MEMBERS INFORMATION (Unaudited)
|
| Joseph S. DiMartino (67) |
| Chairman of the Board (1995) |
| Principal Occupation During Past 5Years: |
| • Corporate Director and Trustee |
| Other Public Company Board Memberships During Past 5Years: |
| • CBIZ (formerly, Century Business Services, Inc.), a provider of outsourcing functions for small |
| and medium size companies, Director (1997-present) |
| • Sunair Services Corporation, a provider of certain outdoor-related services to homes and |
| businesses, Director (2005-2009) |
| • The Newark Group, a provider of a national market of paper recovery facilities, paperboard |
| mills and paperboard converting plants, Director (2000-2010) |
| No. of Portfolios for which Board Member Serves: 170 |
| ——————— |
| David W. Burke (75) |
| Board Member (1994) |
| Principal Occupation During Past 5Years: |
| • Corporate Director and Trustee |
| No. of Portfolios for which Board Member Serves: 84 |
| ——————— |
| William Hodding Carter III (76) |
| Board Member (1988) |
| Principal Occupation During Past 5Years: |
| • Professor of Leadership & Public Policy, University of North Carolina, Chapel Hill (2006-present) |
| • President and Chief Executive Officer of the John S. and James L. Knight Foundation (1998-2006) |
| No. of Portfolios for which Board Member Serves: 29 |
| ——————— |
| Gordon J. Davis (69) |
| Board Member (2006) |
| Principal Occupation During Past 5Years: |
| • Partner in the law firm of Dewey & LeBoeuf LLP |
| Other Public Company Board Memberships During Past 5Years: |
| • Consolidated Edison, Inc., a utility company, Director (1997-present) |
| • The Phoenix Companies, Inc., a life insurance company, Director (2000-present) |
| No. of Portfolios for which Board Member Serves: 45 |
28
|
| Joni Evans (69) |
| Board Member (2006) |
| Principal Occupation During Past 5Years: |
| • Chief Executive Officer, www.wowOwow.com an online community dedicated to women’s |
| conversations and publications (2007-present) |
| • Principal, Joni Evans Ltd. (publishing) (2006-present) |
| • Senior Vice President of the William Morris Agency (1994-2006) |
| No. of Portfolios for which Board Member Serves: 29 |
| ——————— |
| Ehud Houminer (70) |
| Board Member (1994) |
| Principal Occupation During Past 5Years: |
| • Executive-in-Residence at the Columbia Business School, Columbia University (1992-present) |
| Other Public Company Board Memberships During Past 5Years: |
| • Avnet Inc., an electronics distributor, Director (1993-present) |
| No. of Portfolios for which Board Member Serves: 64 |
| ——————— |
| Richard C. Leone (71) |
| Board Member (1984) |
| Principal Occupation During Past 5Years: |
| • President of The Century Foundation (formerly,The Twentieth Century Fund, Inc.), a tax exempt |
| research foundation engaged in the study of economic, foreign policy and domestic issues |
| Other Public Company Board Memberships During Past 5Years: |
| • Partnership for a Secure America, Director |
| No. of Portfolios for which Board Member Serves: 29 |
| ——————— |
| Hans C. Mautner (73) |
| Board Member (1984) |
| Principal Occupation During Past 5Years: |
| • President—International Division and an Advisory Director of Simon Property Group, a real |
| estate investment company (1998-2010) |
| • Chairman and Chief Executive Officer of Simon Global Limited (1999-2010) |
| No. of Portfolios for which Board Member Serves: 29 |
BOARD MEMBERS INFORMATION (Unaudited) (continued)
|
| Robin A. Melvin (47) |
| Board Member (1995) |
| Principal Occupation During Past 5Years: |
| • Director, Boisi Family Foundation, a private family foundation that supports youth-serving |
| organizations that promote the self sufficiency of youth from disadvantaged circumstances |
| (1995-present) |
| • SeniorVice President, Mentor, a national non-profit youth mentoring organization (1992-2005) |
| No. of Portfolios for which Board Member Serves: 56 |
| ——————— |
| Burton N. Wallack (60) |
| Board Member (2006) |
| Principal Occupation During Past 5Years: |
| • President and Co-owner of Wallack Management Company, a real estate management company |
| No. of Portfolios for which Board Member Serves: 29 |
| ——————— |
| John E. Zuccotti (73) |
| Board Member (1984) |
| Principal Occupation During Past 5Years: |
| • Chairman of Brookfield Properties, Inc. |
| • Senior Counsel of Weil, Gotshal & Manges, LLP |
| • Emeritus Chairman of the Real Estate Board of New York |
| Other Public Company Board Memberships During Past 5Years: |
| • Emigrant Savings Bank, Director (2004-present) |
| • Doris Duke Charitable Foundation,Trustee (2006-present) |
| No. of Portfolios for which Board Member Serves: 29 |
| ——————— |
Once elected all Board Members serve for an indefinite term, but achieve Emeritus status upon reaching age 80.The address of the Board Members and Officers is in c/o The Dreyfus Corporation, 200 Park Avenue, NewYork, NewYork 10166.Additional information about the Board Members is available in the fund’s Statement of Additional Information which can be obtained from Dreyfus free of charge by calling this toll free number: 1-800-DREYFUS.
Arnold S. Hiatt, Emeritus Board Member
30
OFFICERS OF THE FUND (Unaudited)
OFFICERS OF THE FUND (Unaudited) (continued)
32
For More Information
|
| Dreyfus |
| Select Managers |
| Small Cap Growth Fund |
ANNUAL REPORT May 31, 2011

Save time. Save paper. View your next shareholder report online as soon as it’s available. Log into www.dreyfus.com and sign up for Dreyfus eCommunications. It’s simple and only takes a few minutes.
The views expressed in this report reflect those of the portfolio manager only through the end of the period covered and do not necessarily represent the views of Dreyfus or any other person in the Dreyfus organization. Any such views are subject to change at any time based upon market or other conditions and Dreyfus disclaims any responsibility to update such views.These views may not be relied on as investment advice and, because investment decisions for a Dreyfus fund are based on numerous factors, may not be relied on as an indication of trading intent on behalf of any Dreyfus fund.
Not FDIC-Insured • Not Bank-Guaranteed • May Lose Value
| | Contents |
| | THE FUND |
| 2 | A Letter from the Chairman and CEO |
| 3 | Discussion of Fund Performance |
| 6 | Fund Performance |
| 8 | Understanding Your Fund’s Expenses |
| 8 | Comparing Your Fund’s Expenses With Those of Other Funds |
| 9 | Statement of Investments |
| 15 | Statement of Assets and Liabilities |
| 16 | Statement of Operations |
| 17 | Statement of Changes in Net Assets |
| 19 | Financial Highlights |
| 20 | Notes to Financial Statements |
| 29 | Report of Independent Registered Public Accounting Firm |
| 30 | Board Members Information |
| 33 | Officers of the Fund |
| | FOR MORE INFORMATION |
| | Back Cover |
Dreyfus
Select Managers
Small Cap Growth Fund
The Fund

A LETTER FROM THE CHAIRMAN AND CEO
Dear Shareholder:
We are pleased to present this annual report for Dreyfus Select Managers Small Cap Growth Fund, covering the period from the fund’s inception, July 1, 2010, through May 31, 2011. For information about how the fund performed during the reporting period, as well as general market perspectives, we provide a Discussion of Fund Performance on the pages that follow.
The U.S. economy appears to have hit a soft patch in the spring of 2011 after accelerating over the second half of 2010. Disappointing labor, housing and manufacturing data have come at a time of higher energy prices and some tightening of monetary policy in global markets. In our view, the current slowdown should be relatively brief as the world recovers from the supply shocks created by weather impacts on food production, the decline in Libyan oil exports and supply-chain disruptions stemming from Japan’s natural and nuclear disasters.The U.S. stock market produced mostly positive results in this choppy economic environment due to better-than-expected corporate earnings and robust ongoing industrial demand from the emerging markets.
We remain optimistic as the U.S. economy moves through the middle stages of its cycle. Indeed, global macroeconomic policy generally has remained stimulative despite the recent efforts of some central banks to forestall inflationary pressures. We continue to expect sustainable economic growth, a rising but volatile uptrend in inflation and an improving U.S. labor market in the months ahead.As always, to determine how these forces may affect your investments, we urge you to talk regularly with your financial advisor.
Thank you for your continued confidence and support.

Jonathan R. Baum
Chairman and Chief Executive Officer
The Dreyfus Corporation
June 15, 2011
2

DISCUSSION OF FUND PERFORMANCE
For the period of July 1, 2010, through May 31, 2011, as provided by Keith L. Stransky and Robert B. Mayerick, Portfolio Allocation Managers, EACM Advisors LLC
Market and Fund Performance Overview
For the period between the fund’s inception on July 1, 2010, and the end of its fiscal year on May 31, 2011, Dreyfus Select Managers Small Cap Growth Fund’s Class A shares produced a total return of 47.31%, Class C shares returned 46.19% and Class I shares returned 47.63%.1 In comparison, the total return of the Russell 2000 Growth Index (the “Index”), the fund’s benchmark, was 46.63% for the same period.2
U.S. stocks generally rallied over the reporting period as an economic recovery appeared to gain momentum. Growth stocks produced higher returns, on average, than value stocks.The fund’s returns were roughly in line with its benchmark, as strong performance in the information technology and health care sectors was balanced by shortfalls in the energy and materials sectors.
The Fund’s Investment Approach
The fund seeks long term capital appreciation.To pursue its goal, the fund normally invests at least 80% of its assets in the stocks of small-cap companies.
The fund uses a “multi-manager” approach by selecting one or more subadvisers to manage its assets.We seek subadvisers that complement one another’s styles of investing.We monitor and evaluate the performance of the subadvisers and recommend any changes to Dreyfus and the fund’s board.
The fund’s assets are currently allocated among three subadvisers, each of which acts independently and uses its own methodology to select investments. Currently 38% of the fund’s assets are under the management of Riverbridge Partners, LLC, which employs a bottom-up approach to stock selection and focuses on companies that are building their earnings power and intrinsic value over long periods of time.Approximately 29% of the fund’s assets are under the management of Geneva Capital
DISCUSSION OF FUND PERFORMANCE (continued)
Management Ltd., which employs bottom-up fundamental analysis supplemented by top-down considerations to identify companies that perform well over long periods of time.Approximately 33% of the fund’s assets are under the management of Cupps Capital Management, LLC, which employs a proprietary investment framework to evaluate the attractiveness of stocks.These percentages can change over time.
Greater Economic Confidence Fueled a Market Rally
The reporting period began in the midst of a downturn in investor sentiment due to a sovereign debt crisis in Europe and a sluggish U.S. recovery. By the end of the summer of 2010, however, a new round of quantitative easing of U.S. monetary policy convinced many investors that a double-dip recession was unlikely. A more optimistic outlook was reinforced by subsequent improvements in employment and consumer spending, better-than-expected corporate earnings and the passage of fiscally stimulative tax legislation.
Although stocks continued to advance over the opening weeks of 2011, the market rally was interrupted in February, when political unrest in the Middle East led to sharply higher energy prices, and again in March, when devastating natural and nuclear disasters in Japan threatened one of the world’s largest economies. Stocks mostly recovered quickly from these unexpected setbacks, but disappointing U.S. financial data in the spring caused investors to revise their economic expectations downward, and stocks gave back a portion of their previous gains by the reporting period’s end.
Stock Selection Strategies Fueled Relative Performance
The fund’s relative performance was particularly robust in the information technology sector, which comprises more than a quarter of the benchmark. Overweighted exposure to technology stocks helped the fund participate more fully in the sector’s gains, and strong stock selections included robotic automation specialist IPG Photonics, which encountered robust demand from companies seeking to improve efficiency and productivity and software developer NetSuite, which nearly tripled in price due to the growing popularity of “cloud computing,” in which businesses manage data and applications over the Internet. Winning stock selection in the health care sector also buoyed the fund’s relative performance. In particular, diagnostic
4
equipment maker Cepheid, reported strong quarterly results and gained value amid takeover speculation.
The fund’s investments in the energy and materials sectors lagged market averages due to the fund’s underweighted exposure to companies that benefited from surging commodity prices, particularly those related to energy and agricultural.
Finding Opportunities in a Slow-Growth Environment
As of the reporting period’s end, the U.S. economy appears to have hit a soft patch. Moreover, global macroeconomic developments have captured investors’ attention, distracting them from the business fundamentals that historically have driven equity markets over the long term.Therefore, we expect heightened market volatility to persist until the direction of the global economy and corporate earnings becomes clearer.
We remain optimistic over the longer term, particularly with regard to small-cap stocks. In our analysis, valuations currently appear reasonable, and small companies should benefit from intensifying mergers-and-acquisitions activity as large-cap companies put some of their massive cash reserves to work.As always, we intend to adjust the fund’s allocations among its underlying investment managers as market conditions develop and opportunities arise.
June 15, 2011
| |
| | Equity funds are subject generally to market, market sector, market liquidity, issuer and investment |
| | style risks, among other factors, to varying degrees, all of which are more fully described in the |
| | fund’s prospectus. |
| | The prices of small company stocks tend to be more volatile than the prices of large company |
| | stocks, mainly because these companies have less established and more volatile earnings histories. |
| | They also tend to be less liquid than larger company stocks. |
| 1 | Total return includes reinvestment of dividends and any capital gains paid, and does not take into |
| | consideration the maximum initial sales charge in the case of Class A shares, or the applicable |
| | contingent deferred sales charge imposed on redemptions in the case of Class C shares. Had these |
| | charges been reflected, returns would have been lower. Past performance is no guarantee of future |
| | results. Share price and investment return fluctuate such that upon redemption, fund shares may be |
| | worth more or less than their original cost. Return figures provided reflect the absorption of certain |
| | fund expenses by The Dreyfus Corporation pursuant to an undertaking in effect through October |
| | 1, 2011, at which time it may be extended, terminated or modified. Had these expenses not been |
| | absorbed, the fund’s returns would have been lower. |
| 2 | SOURCE: LIPPER INC. — The Russell 2000 Growth Index is an unmanaged index, |
| | which measures the performance of those Russell 2000 companies with higher price-to-book ratios |
| | and higher forecasted growth values.The total return figure cited for this index assumes change in |
| | security prices and reinvestment of dividends, but does not reflect the costs of managing a mutual |
| | fund. Investors cannot invest directly in any index. |
|
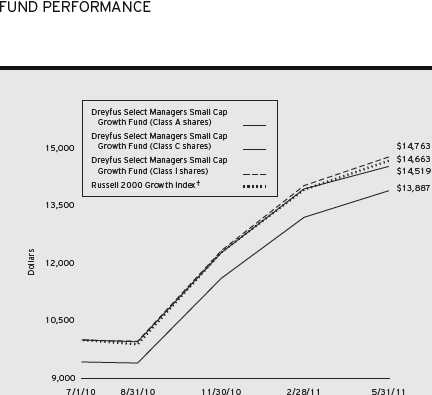
| Comparison of change in value of $10,000 investment in Dreyfus Select Managers Small Cap |
| Growth Fund Class A shares, Class C shares and Class I shares and the Russell 2000 Growth Index |
| |
| † Source: Lipper Inc. |
| Past performance is not predictive of future performance. |
| The above graph compares a $10,000 investment made in Class A, Class C and Class I shares of Dreyfus Select |
| Managers Small Cap Growth Fund on 7/1/10 (inception date) to a $10,000 investment made in the Russell 2000 |
| Growth Index (the “Index”) on that date.All dividends and capital gain distributions are reinvested. |
| The fund’s performance shown in the line graph takes into account the maximum initial sales charge on Class A shares, |
| the applicable contingent deferred sales charge on Class C shares and all other applicable fees and expenses on all classes. |
| The Index is an unmanaged index, which measures the performance of those Russell 2000 companies with higher price- |
| to-book ratios and higher forecasted growth values. Unlike a mutual fund, the Index is not subject to charges, fees and |
| other expenses. Investors cannot invest directly in any index. Further information relating to fund expenses, including |
| expense reimbursements, if applicable, is contained in the Expenses section of the prospectus and elsewhere in this report. |
6
| | |
| Actual Aggregate Total Returns as of 5/31/11 | | |
| |
| | Inception | From |
| | Date | Inception |
| Class A shares | | |
| with maximum sales charge (5.75%) | 7/1/10 | 38.87% |
| without sales charge | 7/1/10 | 47.31% |
| Class C shares | | |
| with applicable redemption charge † | 7/1/10 | 45.19% |
| without redemption | 7/1/10 | 46.19% |
| Class I shares | 7/1/10 | 47.63% |
| Russell 2000 Growth Index | 6/30/10 | 46.63%†† |
Past performance is not predictive of future performance.The fund’s performance shown in the graph and table does not reflect the deduction of taxes that a shareholder would pay on fund distributions or the redemption of fund shares.
| |
| † | The maximum contingent deferred sales charge for Class C shares is 1% for shares redeemed within one year of the |
| | date of purchase. |
| †† | For comparative purposes, the value of the Index as of 6/30/10 is used as the beginning value on 7/1/10. |
UNDERSTANDING YOUR FUND’S EXPENSES (Unaudited)
As a mutual fund investor, you pay ongoing expenses, such as management fees and other expenses. Using the information below, you can estimate how these expenses affect your investment and compare them with the expenses of other funds.You also may pay one-time transaction expenses, including sales charges (loads) and redemption fees, which are not shown in this section and would have resulted in higher total expenses. For more information, see your fund’s prospectus or talk to your financial adviser.
Review your fund’s expenses
The table below shows the expenses you would have paid on a $1,000 investment in Dreyfus Select Managers Small Cap Growth Fund from December 1, 2010 to May 31, 2011. It also shows how much a $1,000 investment would be worth at the close of the period, assuming actual returns and expenses.
Expenses and Value of a $1,000 Investment
assuming actual returns for the six months ended May 31, 2011
| | | |
| | Class A | Class C | Class I |
| Expenses paid per $1,000† | $ 7.67 | $ 11.75 | $ 6.30 |
| Ending value (after expenses) | $1,196.50 | $1,191.30 | $1,197.50 |
COMPARING YOUR FUND’S EXPENSES
WITH THOSE OF OTHER FUNDS (Unaudited)
Using the SEC’s method to compare expenses
The Securities and Exchange Commission (SEC) has established guidelines to help investors assess fund expenses. Per these guidelines, the table below shows your fund’s expenses based on a $1,000 investment, assuming a hypothetical 5% annualized return. You can use this information to compare the ongoing expenses (but not transaction expenses or total cost) of investing in the fund with those of other funds.All mutual fund shareholder reports will provide this information to help you make this comparison. Please note that you cannot use this information to estimate your actual ending account balance and expenses paid during the period.
Expenses and Value of a $1,000 Investment
assuming a hypothetical 5% annualized return for the six months ended May 31, 2011
| | | |
| | Class A | Class C | Class I |
| Expenses paid per $1,000† | $ 7.04 | $ 10.80 | $ 5.79 |
| Ending value (after expenses) | $1,017.95 | $1,014.21 | $1,019.20 |
|
| † Expenses are equal to the fund’s annualized expense ratio of 1.40% for Class A, 2.15% for Class C and 1.15% |
| for Class I, multiplied by the average account value over the period, multiplied by 182/365 (to reflect the one-half |
| year period). |
8
STATEMENT OF INVESTMENTS
May 31, 2011
| | |
| Common Stocks—98.8% | Shares | Value ($) |
| Consumer Discretionary—15.6% | | |
| Allegiant Travel | 9,040 a | 412,314 |
| BJ’s Restaurants | 3,803 a | 194,828 |
| Capella Education | 7,860 a | 379,952 |
| Cheesecake Factory | 31,335 a | 995,513 |
| CROCS | 45,520 a | 1,034,670 |
| Dick’s Sporting Goods | 13,150 a | 522,581 |
| DTS | 13,275 a | 611,712 |
| FactSet Research Systems | 5,180 | 574,255 |
| G-III Apparel Group | 4,430 a | 190,136 |
| Grand Canyon Education | 26,366 a | 340,121 |
| Greenbrier Cos. | 14,340 a | 373,700 |
| Hibbett Sports | 18,585 a | 773,879 |
| JOS. A. Bank Clothiers | 5,420 a | 309,482 |
| K12 | 15,100 a | 525,480 |
| LKQ | 62,050 a | 1,649,910 |
| Mobile Mini | 18,795 a | 422,887 |
| MWI Veterinary Supply | 8,545 a | 720,343 |
| Panera Bread, Cl. A | 4,300 a | 537,629 |
| ReachLocal | 8,740 | 183,453 |
| Rentrak | 10,050 a | 206,728 |
| ServiceSource International | 19,485 | 378,983 |
| Tesla Motors | 33,200 | 1,000,648 |
| Titan International | 14,723 | 404,735 |
| Ulta Salon, Cosmetics & Fragrance | 38,336 a | 2,146,050 |
| Vera Bradley | 19,035 | 940,900 |
| Westport Innovations | 33,370 a | 828,577 |
| Wet Seal, Cl. A | 16,920 a | 72,756 |
| WMS Industries | 13,340 a | 419,676 |
| Zipcar | 15,360 | 385,843 |
| | | 17,537,741 |
| Consumer Staples—3.2% | | |
| Diamond Foods | 10,730 | 798,634 |
| Fresh Market | 16,939 | 681,625 |
| Green Mountain Coffee Roasters | 4,173 a | 343,730 |
STATEMENT OF INVESTMENTS (continued)
| | |
| Common Stocks (continued) | Shares | Value ($) |
| Consumer Staples (continued) | | |
| TreeHouse Foods | 9,670 a | 589,193 |
| United Natural Foods | 27,450 a | 1,194,349 |
| | | 3,607,531 |
| Energy—2.8% | | |
| Brigham Exploration | 25,655 a | 798,897 |
| Clean Energy Fuels | 7,735 a | 110,610 |
| Dril-Quip | 6,675 a | 495,151 |
| Gevo | 4,215 | 81,265 |
| Rosetta Resources | 18,905 a | 929,181 |
| SM Energy | 8,345 | 554,859 |
| Solazyme | 6,285 | 141,601 |
| | | 3,111,564 |
| Exchange Traded Funds—.9% | | |
| iShares Russell 2000 Index Fund | 11,895 | 1,009,172 |
| Financial—3.8% | | |
| Affiliated Managers Group | 5,120 a | 541,338 |
| Cass Information Systems | 14,390 | 573,441 |
| Financial Engines | 52,836 a | 1,315,616 |
| Portfolio Recovery Associates | 13,750 a | 1,191,025 |
| PrivateBancorp | 1,600 | 26,192 |
| Strategic Hotels & Resorts | 50,383 a | 337,062 |
| Texas Capital Bancshares | 12,415 a | 310,747 |
| | | 4,295,421 |
| Health Care—15.6% | | |
| Abaxis | 23,800 a | 740,894 |
| AngioDynamics | 46,970 a | 737,429 |
| Bio-Reference Labs | 23,785 a | 592,960 |
| Cepheid | 103,240 a | 3,316,069 |
| Complete Genomics | 20,120 | 321,518 |
| Dexcom | 24,913 a | 392,878 |
| Exact Sciences | 20,865 a | 155,653 |
| Genomic Health | 4,790 a | 131,869 |
| Haemonetics | 7,965 a | 538,673 |
| Healthcare Services Group | 27,700 | 472,562 |
| HeartWare International | 4,618 a | 336,421 |
| IDEXX Laboratories | 5,565 a | 438,077 |
10
| | |
| Common Stocks (continued) | Shares | Value ($) |
| Health Care (continued) | | |
| Incyte | 11,825 a | 209,657 |
| Insulet | 20,595 a | 434,143 |
| IPC The Hospitalist | 15,665 a | 795,469 |
| Mako Surgical | 21,776 a | 716,866 |
| Masimo | 18,500 | 568,320 |
| Mednax | 16,500 a | 1,239,975 |
| Medtox Scientific | 12,825 | 216,614 |
| Neogen | 43,090 a | 1,932,156 |
| NxStage Medical | 23,747 a | 446,681 |
| Pharmasset | 5,245 a | 536,039 |
| SXC Health Solutions | 13,910 a | 819,855 |
| Techne | 16,745 | 1,364,717 |
| Theravance | 1,935 a | 50,562 |
| Tornier | 3,300 | 90,915 |
| | | 17,596,972 |
| Industrial—18.2% | | |
| Acuity Brands | 12,330 | 751,637 |
| Aerovironment | 8,990 a | 271,408 |
| Beacon Roofing Supply | 40,590 a | 889,327 |
| Chart Industries | 7,585 a | 368,479 |
| Chemed | 22,250 | 1,503,432 |
| CoStar Group | 9,230 a | 582,413 |
| Donaldson | 8,975 | 535,897 |
| Echo Global Logistics | 33,944 a | 505,766 |
| Esterline Technologies | 6,145 a | 464,685 |
| Forrester Research | 19,180 | 727,689 |
| Forward Air | 15,195 | 533,344 |
| FreightCar America | 6,570 a | 181,661 |
| Genesee & Wyoming, Cl. A | 14,540 a | 862,949 |
| Hexcel | 43,953 a | 908,509 |
| HMS Holdings | 9,485 a | 740,399 |
| iRobot | 18,334 a | 616,022 |
| Marten Transport | 21,290 | 477,748 |
| MAXIMUS | 12,685 | 1,063,003 |
| Middleby | 10,372 a | 892,511 |
| Monro Muffler Brake | 22,757 | 736,189 |
STATEMENT OF INVESTMENTS (continued)
| | |
| Common Stocks (continued) | Shares | Value ($) |
| Industrial (continued) | | |
| Polypore International | 17,651 a | 1,157,023 |
| Resources Connection | 40,025 | 564,753 |
| Ritchie Brothers Auctioneers | 47,000 | 1,302,840 |
| Rollins | 78,420 | 1,577,810 |
| SuccessFactors | 28,784 a | 1,009,455 |
| Titan Machinery | 7,410 a | 198,514 |
| Triumph Group | 5,086 | 475,643 |
| Universal Technical Institute | 12,820 | 232,555 |
| US Airways Group | 30,575 a | 278,232 |
| | | 20,409,893 |
| Information Technology—30.1% | | |
| Allscripts Healthcare Solutions | 42,100 a | 846,631 |
| ANSYS | 9,209 a | 528,320 |
| athenahealth | 17,649 a | 790,146 |
| Blackboard | 12,260 a | 528,283 |
| Bottomline Technologies | 25,790 a | 670,540 |
| BroadSoft | 2,992 a | 118,304 |
| Cabot Microelectronics | 18,700 a | 939,675 |
| Concur Technologies | 20,090 a | 1,003,898 |
| Constant Contact | 31,470 a | 756,854 |
| Cymer | 4,710 a | 225,468 |
| DealerTrack Holdings | 28,200 a | 653,394 |
| Digi International | 65,705 a | 774,662 |
| Echelon | 55,290 a | 528,572 |
| FARO Technologies | 14,625 a | 654,615 |
| Fortinet | 12,492 a | 605,737 |
| Gentex | 55,825 | 1,638,464 |
| Guidance Software | 31,000 a | 248,930 |
| Innerworkings | 60,545 a | 512,816 |
| Inphi | 16,979 | 336,863 |
| Integrated Device Technology | 14,985 a | 125,724 |
| Interactive Intelligence | 21,645 a | 785,930 |
| Intralinks Holdings | 23,330 | 481,765 |
| Lattice Semiconductor | 16,215 a | 106,857 |
| LivePerson | 17,822 a | 211,369 |
| Medidata Solutions | 18,295 a | 420,602 |
12
| | |
| Common Stocks (continued) | Shares | Value ($) |
| Information Technology (continued) | | |
| Mellanox Technologies | 15,509 a | 478,918 |
| Nanometrics | 24,903 a | 392,720 |
| Napco Security Technologies | 6,895 a | 15,238 |
| National Instruments | 53,052 | 1,549,118 |
| NetSuite | 35,705 a | 1,347,507 |
| OpenTable | 3,600 a | 317,988 |
| Opnet Technologies | 18,193 | 712,620 |
| Parexel International | 20,795 a | 523,410 |
| Pegasystems | 12,075 | 451,001 |
| Power Integrations | 21,875 | 805,438 |
| PROS Holdings | 8,960 a | 150,528 |
| QLIK Technologies | 14,875 | 495,189 |
| Quality Systems | 13,850 | 1,192,208 |
| Rackspace Hosting | 22,574 a | 993,256 |
| Riverbed Technology | 23,100 a | 875,952 |
| Semtech | 48,525 a | 1,388,786 |
| Stratasys | 24,324 a | 856,205 |
| Telvent GIT | 15,080 a | 519,506 |
| Teradyne | 23,007 a | 368,342 |
| Tyler Technologies | 25,665 a | 652,148 |
| Ultimate Software Group | 55,436 a | 3,125,482 |
| Ultratech | 26,470 a | 840,952 |
| Veeco Instruments | 9,165 a | 527,812 |
| Velti | 2,230 a | 34,476 |
| Verint Systems | 23,175 a | 786,560 |
| | | 33,895,779 |
| Materials—3.0% | | |
| Balchem | 23,225 | 1,002,159 |
| CIRCOR International | 12,935 | 573,150 |
| Codexis | 2,780 a | 30,441 |
| Entree Gold | 46,626 a | 112,835 |
| Kaydon | 13,985 | 508,634 |
| Landec | 42,205 a | 242,257 |
| RBC Bearings | 13,715 a | 548,600 |
| Rockwood Holdings | 7,027 a | 369,550 |
| | | 3,387,626 |
STATEMENT OF INVESTMENTS (continued)
| | |
| Common Stocks (continued) | Shares | Value ($) |
| Telecommunications—5.3% | | |
| Acme Packet | 10,555 a | 798,908 |
| Aruba Networks | 13,758 a | 391,002 |
| EZchip Semiconductor | 13,775 a | 496,451 |
| Finisar | 25,315 a | 608,066 |
| IPG Photonics | 33,328 a | 2,504,599 |
| Logmein | 20,293 a | 883,151 |
| Meru Networks | 3,535 a | 63,312 |
| ShoreTel | 17,410 a | 191,510 |
| | | 5,936,999 |
| Utilities—.3% | | |
| EnerNOC | 15,600 a | 281,580 |
| |
| Total Investments (cost $96,335,188) | 98.8% | 111,070,278 |
| Cash and Receivables (Net) | 1.2% | 1,381,680 |
| Net Assets | 100.0% | 112,451,958 |
| |
| a | Non-income producing security. |
| | | |
| Portfolio Summary (Unaudited)† | | |
| |
| | Value (%) | | Value (%) |
| Information Technology | 30.1 | Consumer Staples | 3.2 |
| Industrial | 18.2 | Materials | 3.0 |
| Consumer Discretionary | 15.6 | Energy | 2.8 |
| Health Care | 15.6 | Exchange Traded Funds | .9 |
| Telecommunications | 5.3 | Utilities | .3 |
| Financial | 3.8 | | 98.8 |
|
| † Based on net assets. |
| See notes to financial statements. |
14
|
| STATEMENT OF ASSETS AND LIABILITIES |
| May 31, 2011 |
| | | |
| | | Cost | Value |
| Assets ($): | | | |
| Investments in securities—See Statement of Investments | 96,335,188 | 111,070,278 |
| Cash | | | 1,878,325 |
| Receivable for investment securities sold | | | 815,661 |
| Receivable for shares of Common Stock subscribed | | | 217,728 |
| Dividends receivable | | | 18,160 |
| Prepaid expenses | | | 40,294 |
| | | | 114,040,446 |
| Liabilities ($): | | | |
| Due to The Dreyfus Corporation and affiliates—Note 3(c) | | 153,008 |
| Payable for investment securities purchased | | | 1,308,996 |
| Payable for shares of Common Stock redeemed | | | 43,000 |
| Accrued expenses | | | 83,484 |
| | | | 1,588,488 |
| Net Assets ($) | | | 112,451,958 |
| Composition of Net Assets ($): | | | |
| Paid-in capital | | | 98,767,567 |
| Accumulated net realized gain (loss) on investments | | | (1,050,699) |
| Accumulated net unrealized appreciation | | | |
| (depreciation) on investments | | | 14,735,090 |
| Net Assets ($) | | | 112,451,958 |
| |
| |
| Net Asset Value Per Share | | | |
| | Class A | Class C | Class I |
| Net Assets ($) | 757,545 | 214,415 | 111,479,998 |
| Shares Outstanding | 41,261 | 11,769 | 6,057,645 |
| Net Asset Value Per Share ($) | 18.36 | 18.22 | 18.40 |
| |
| See notes to financial statements. | | | |
|
| STATEMENT OF OPERATIONS |
| From July 1, 2010 (commencement of operations) to May 31, 2011 |
| |
| Investment Income ($): | |
| Income: | |
| Cash dividends (net of $1,471 foreign taxes withheld at source) | 139,174 |
| Expenses: | |
| Management fee—Note 3(a) | 396,776 |
| Custodian fees—Note 3(c) | 166,903 |
| Legal fees | 83,011 |
| Registration fees | 61,794 |
| Auditing fees | 42,091 |
| Directors’ fees and expenses—Note 3(d) | 30,579 |
| Distribution fees—Note 3(b) | 8,190 |
| Shareholder servicing costs—Note 3(c) | 6,931 |
| Prospectus and shareholders’ reports | 5,215 |
| Loan commitment fees—Note 2 | 541 |
| Miscellaneous | 11,543 |
| Total Expenses | 813,574 |
| Less—reduction in management fee due to undertaking—Note 3(a) | (292,208) |
| Less—reduction in fees due to earnings credits—Note 3(c) | (3) |
| Net Expenses | 521,363 |
| Investment (Loss)—Net | (382,189) |
| Realized and Unrealized Gain (Loss) on Investments—Note 4 ($): | |
| Net realized gain (loss) on investments | (924,132) |
| Net unrealized appreciation (depreciation) on investments | 14,735,090 |
| Net Realized and Unrealized Gain (Loss) on Investments | 13,810,958 |
| Net Increase in Net Assets Resulting from Operations | 13,428,769 |
| |
| See notes to financial statements. | |
16
|
| STATEMENT OF CHANGES IN NET ASSETS |
| From July 1, 2010 (commencement of operations) to May 31, 2011 |
| |
| Operations ($): | |
| Investment (loss)—net | (382,189) |
| Net realized gain (loss) on investments | (924,132) |
| Net unrealized appreciation (depreciation) on investments | 14,735,090 |
| Net Increase (Decrease) in Net Assets | |
| Resulting from Operations | 13,428,769 |
| Dividends to Shareholders from ($): | |
| Return of capital: | |
| Class A Shares | (3,991) |
| Class C Shares | (3,855) |
| Class I Shares | (87,963) |
| Total Dividends | (95,809) |
| Capital Stock Transactions ($): | |
| Net proceeds from shares sold: | |
| Class A Shares | 1,543,542 |
| Class C Shares | 1,040,566 |
| Class I Shares | 107,868,046 |
| Dividends reinvested: | |
| Class A Shares | 151 |
| Class C Shares | 15 |
| Class I Shares | 37,375 |
| Cost of shares redeemed: | |
| Class A Shares | (1,257,599) |
| Class C Shares | (1,264,893) |
| Class I Shares | (8,848,205) |
| Increase (Decrease) in Net Assets | |
| from Capital Stock Transactions | 99,118,998 |
| Total Increase (Decrease) in Net Assets | 112,451,958 |
| Net Assets ($): | |
| Beginning of Period | — |
| End of Period | 112,451,958 |
STATEMENT OF CHANGES IN NET ASSETS (continued)
| |
| Capital Share Transactions: | |
| Class A | |
| Shares sold | 111,006 |
| Shares issued for dividends reinvested | 9 |
| Shares redeemed | (69,754) |
| Net Increase (Decrease) in Shares Outstanding | 41,261 |
| Class C | |
| Shares sold | 82,360 |
| Shares issued for dividends reinvested | 1 |
| Shares redeemed | (70,592) |
| Net Increase (Decrease) in Shares Outstanding | 11,769 |
| Class I | |
| Shares sold | 6,547,983 |
| Shares issued for dividends reinvested | 2,292 |
| Shares redeemed | (492,630) |
| Net Increase (Decrease) in Shares Outstanding | 6,057,645 |
| See notes to financial statements. | |
18
FINANCIAL HIGHLIGHTS
The following table describes the performance for each share class for the period from July 1, 2010 (commencement of operations) to May 31, 2011.All information (except portfolio turnover rate) reflects financial results for a single fund share.Total return shows how much your investment in the fund would have increased (or decreased) during the period, assuming you had reinvested all dividends and distri-butions.These figures have been derived from the fund’s financial statements.
| | | |
| | Class A | Class C | Class I |
| | Shares | Shares | Shares |
| Per Share Data ($): | | | |
| Net asset value, beginning of period | 12.50 | 12.50 | 12.50 |
| Investment Operations: | | | |
| Investment (loss)—neta | (.15) | (.26) | (.13) |
| Net realized and unrealized gain (loss) on investments | 6.06 | 6.03 | 6.08 |
| Total from Investment Operations | 5.91 | 5.77 | 5.95 |
| Distributions: | | | |
| Return of capital | (.05) | (.05) | (.05) |
| Net asset value, end of period | 18.36 | 18.22 | 18.40 |
| Total Return (%)b | 47.31c | 46.19c | 47.63 |
| Ratios/Supplemental Data (%): | | | |
| Ratio of total expenses to average net assetsd | 2.95 | 3.73 | 1.77 |
| Ratio of net expenses to average net assetsd | 1.40 | 2.15 | 1.15 |
| Ratio of net investment (loss) to average net assetsd | (1.03) | (1.77) | (.84) |
| Portfolio Turnover Rateb | 70.41 | 70.41 | 70.41 |
| Net Assets, end of period ($ x 1,000) | 758 | 214 | 111,480 |
| |
| a | Based on average shares outstanding at each month end. |
| b | Not annualized. |
| c | Exclusive of sales charge. |
| d | Annualized. |
See notes to financial statements.
NOTES TO FINANCIAL STATEMENTS
NOTE 1—Significant Accounting Policies:
Dreyfus Select Managers Small Cap Growth Fund (the “fund”) is a separate diversified series of Strategic Funds, Inc. (the “Company”) which is registered under the Investment Company Act of 1940, as amended (the “Act”), as an open-end management investment company and operates as a series company currently offering ten series, including the fund, which commenced operations on July 1, 2010.The fund’s investment objective is to seek capital appreciation.The Dreyfus Corporation (the “Manager” or “Dreyfus”), a wholly-owned subsidiary of The Bank of New York Mellon Corporation (“BNY Mellon”), serves as the fund’s investment adviser. EACM Advisors LLC (“EACM”), a subsidiary of BNY Mellon and an affiliate of Dreyfus, serves as the fund’s portfolio allocation manager. Riverbridge Partners, LLC (“Riverbridge”), Geneva Capital Management Ltd. (“Geneva”) and Cupps Capital Management, LLC (“CCM”), serve as the fund’s sub-investment advisers, each managing an allocated portion of the fund’s portfolio.
MBSC Securities Corporation (the “Distributor”), a wholly-owned subsidiary of Dreyfus, is the distributor of the fund’s shares.The fund is authorized to issue 75 million shares of $.001 par value Common Stock in each of the following classes of shares: Class A, Class C and Class I. Class A shares are subject to a sales charge imposed at the time of purchase. Class C shares are subject to a contingent deferred sales charge (“CDSC”) imposed on Class C shares redeemed within one year of purchase. Class I shares are sold at net asset value per share only to institutional investors. Other differences between the classes include the services offered to and the expenses borne by each class, the allocation of certain transfer agency costs and certain voting rights. Income, expenses (other than expenses attributable to a specific class), and realized and unrealized gains or losses on investments are allocated to each class of shares based on its relative net assets.
As of May 31, 2011, MBC Investments Corp., an indirect subsidiary of BNY Mellon, held 10,539 Class A and 10,607 Class C shares of the fund.
20
The Company accounts separately for the assets, liabilities and operations of each series. Expenses directly attributable to each series are charged to that series’ operations; expenses which are applicable to all series are allocated among them on a pro rata basis.
The Financial Accounting Standards Board (“FASB”) Accounting Standards Codification (“ASC”) is the exclusive reference of authoritative U.S. generally accepted accounting principles (“GAAP”) recognized by the FASB to be applied by nongovernmental entities. Rules and interpretive releases of the Securities and Exchange Commission (“SEC”) under authority of federal laws are also sources of authoritative GAAP for SEC registrants. The fund’s financial statements are prepared in accordance with GAAP, which may require the use of management estimates and assumptions.Actual results could differ from those estimates.
The Company enters into contracts that contain a variety of indemnifications.The fund’s maximum exposure under these arrangements is unknown.The fund does not anticipate recognizing any loss related to these arrangements.
(a) Portfolio valuation: Investments in securities are valued at the last sales price on the securities exchange or national securities market on which such securities are primarily traded. Securities listed on the National Market System for which market quotations are available are valued at the official closing price or, if there is no official closing price that day, at the last sales price. Securities not listed on an exchange or the national securities market, or securities for which there were no transactions, are valued at the average of the most recent bid and asked prices, except for open short positions, where the asked price is used for valuation purposes. Bid price is used when no asked price is available. Registered investment companies that are not traded on an exchange are valued at their net asset value.When market quotations or official closing prices are not readily available, or are determined not to reflect accurately fair value, such as when the value of a security has been significantly affected by events after the close of the exchange or market on which the security is principally traded (for example, a foreign exchange or market), but before the fund calculates its net asset
NOTES TO FINANCIAL STATEMENTS (continued)
value, the fund may value these investments at fair value as determined in accordance with the procedures approved by the Board of Directors. Fair valuing of securities may be determined with the assistance of a pricing service using calculations based on indices of domestic securities and other appropriate indicators, such as prices of relevant American Depository Receipts and futures contracts. For other securities that are fair valued by the Board of Directors, certain factors may be considered such as: fundamental analytical data, the nature and duration of restrictions on disposition, an evaluation of the forces that influence the market in which the securities are purchased and sold and public trading in similar securities of the issuer or comparable issuers.
The fair value of a financial instrument is the amount that would be received to sell an asset or paid to transfer a liability in an orderly transaction between market participants at the measurement date (i.e. the exit price). GAAP establishes a fair value hierarchy that prioritizes the inputs of valuation techniques used to measure fair value.This hierarchy gives the highest priority to unadjusted quoted prices in active markets for identical assets or liabilities (Level 1 measurements) and the lowest priority to unobservable inputs (Level 3 measurements).
Additionally, GAAP provides guidance on determining whether the volume and activity in a market has decreased significantly and whether such a decrease in activity results in transactions that are not orderly. GAAP requires enhanced disclosures around valuation inputs and techniques used during annual and interim periods.
Various inputs are used in determining the value of the fund’s investments relating to fair value measurements.These inputs are summarized in the three broad levels listed below:
Level 1—unadjusted quoted prices in active markets for identical investments.
Level 2—other significant observable inputs (including quoted prices for similar investments, interest rates, prepayment speeds, credit risk, etc.).
Level 3—significant unobservable inputs (including the fund’s own assumptions in determining the fair value of investments).
22
The inputs or methodology used for valuing securities are not necessarily an indication of the risk associated with investing in those securities.
The following is a summary of the inputs used as of May 31, 2011, in valuing the fund’s investments:
| | | | |
| | | Level 2—Other | Level 3— | |
| | Level 1— | Significant | Significant | |
| | Unadjusted | Observable | Unobservable | |
| | Quoted Prices | Inputs | Inputs | Total |
| Assets ($) | | | | |
| Investments in Securities: | | | |
| Equity Securities— | | | | |
| Domestic† | 106,766,421 | — | — | 106,766,421 |
| Equity Securities— | | | | |
| Foreign�� | 3,294,685 | — | — | 3,294,685 |
| Exchange | | | | |
| Traded Funds | 1,009,172 | — | — | 1,009,172 |
| |
| † See Statement of Investments for additional detailed categorizations. | |
In January 2010, FASB issued Accounting Standards Update (“ASU”) No. 2010-06 “Improving Disclosures about FairValue Measurements”. The portions of ASU No. 2010-06 which require reporting entities to prepare new disclosures surrounding amounts and reasons for significant transfers in and out of Level 1 and Level 2 fair value measurements as well as inputs and valuation techniques used to measure fair value for both recurring and nonrecurring fair value measurements that fall in either Level 2 or Level 3 have been adopted by the fund. No significant transfers between Level 1 or Level 2 fair value measurements occurred at May 31, 2011.
In May 2011, FASB issued ASU No. 2011-04 “Amendments to Achieve Common Fair Value Measurement and Disclosure Requirements in GAAP and International Financial Reporting Standards (“IFRS”)”. ASU No. 2011-04 includes common requirements for measurement of and disclosure about fair value between GAAP and IFRS. ASU No. 2011-04 will require reporting entities to disclose the following information for fair value measurements categorized within Level 3 of the fair value hierarchy: quantitative information about the unobservable
NOTES TO FINANCIAL STATEMENTS (continued)
inputs used in the fair value measurement, the valuation processes used by the reporting entity and a narrative description of the sensitivity of the fair value measurement to changes in unobservable inputs and the interrelationships between those unobservable inputs. In addition,ASU No. 2011-04 will require reporting entities to make disclosures about amounts and reasons for all transfers in and out of Level 1 and Level 2 fair value measurements.The new and revised disclosures are effective for interim and annual reporting periods beginning after December 15, 2011. At this time, management is evaluating the implications of ASU No. 2011-04 and its impact on the financial statements.
(b) Securities transactions and investment income: Securities transactions are recorded on a trade date basis. Realized gains and losses from securities transactions are recorded on the identified cost basis. Dividend income is recognized on the ex-dividend date and interest income, including, where applicable, accretion of discount and amortization of premium on investments, is recognized on the accrual basis.
(c) Affiliated issuers: Investments in other investment companies advised by Dreyfus are defined as “affiliated” in the Act.
(d) Dividends to shareholders: Dividends are recorded on the ex-dividend date. Dividends from investment income-net and dividends from net realized capital gains, if any, are normally declared and paid annually, but the fund may make distributions on a more frequent basis to comply with the distribution requirements of the Internal Revenue Code of 1986, as amended (the “Code”).To the extent that net realized capital gains can be offset by capital loss carryovers, it is the policy of the fund not to distribute such gains. Income and capital gain distributions are determined in accordance with income tax regulations, which may differ from GAAP.
(e) Federal income taxes: It is the policy of the fund to continue to qualify as a regulated investment company, if such qualification is in the best interests of its shareholders, by complying with the applicable provisions of the Code, and to make distributions of taxable income sufficient to relieve it from substantially all federal income and excise taxes.
24
As of and during the period ended May 31, 2011, the fund did not have any liabilities for any uncertain tax positions.The fund recognizes interest and penalties, if any, related to uncertain tax positions as income tax expense in the Statement of Operations. During the period, the fund did not incur any interest or penalties.
The tax period ended May 31, 2011 remains subject to examination by the Internal Revenue Service and state taxing authorities.
At May 31, 2011, the components of accumulated earnings on a tax basis were as follows: unrealized appreciation $13,841,349. In addition, the fund had $156,958 of capital losses realized after October 31, 2010, which were deferred for tax purposes to the first day of the following fiscal year.
The tax character of distributions paid to shareholders during the fiscal period ended May 31, 2011 was as follows: return of capital $95,809.
During the period ended May 31, 2011, as a result of permanent book to tax differences, primarily due to the tax treatment for net operating losses and fund start-up costs, the fund increased accumulated undistributed investment income-net by $382,189, decreased accumulated net realized gain (loss) on investments by $126,567 and decreased paid-in capital by $255,622. Net assets and net asset value per share were not affected by this reclassification.
NOTE 2—Bank Lines of Credit:
The fund participates with other Dreyfus-managed funds in a $225 million unsecured credit facility led by Citibank, N.A. and a $300 million unsecured credit facility provided by The Bank of New York Mellon, a subsidiary of BNY Mellon and an affiliate of Dreyfus (each, a “Facility”), each to be utilized primarily for temporary or emergency purposes, including the financing of redemptions. In connection therewith, the fund has agreed to pay its pro rata portion of commitment fees for each Facility. Interest is charged to the fund based on rates determined pursuant to the terms of the respective Facility at the
NOTES TO FINANCIAL STATEMENTS (continued)
time of borrowing. During the period ended May 31, 2011, the fund did not borrow under the Facilities.
NOTE 3—Management Fee, Sub-Investment Advisory Fee and Other Transactions With Affiliates:
(a) Pursuant to a management agreement with Dreyfus, the management fee is computed at the annual rate of .90% of the value of the fund’s average daily net assets and is payable monthly. Dreyfus has contractually agreed, until October 1, 2011, to waive receipt of its fees and/or assume the expenses of the fund so that the direct expenses of none of the classes (excluding Rule 12b-1 fees, shareholder services fees, taxes, interest, brokerage commissions, commitment fees on borrowings and extraordinary expenses) exceed 1.15% of the value of the fund’s average daily net assets.The reduction in management fee, pursuant to the undertaking, amounted to $292,208 during the period ended May 31, 2011.
Pursuant to separate Sub-Investment Advisory Agreements (each, a “Sub-Investment Advisory Agreement”) between Dreyfus and each of Riverbridge, Geneva and CCM, each Sub-Investment Advisory Agreement will continue until November 30, 2011. Dreyfus pays Riverbridge, Geneva and CCM separate monthly fees at an annual percentage rate based on the average daily net assets of the fund under the Sub-Adviser’s management.
During the period ended May 31, 2011, the Distributor retained $1,069 from commissions earned on sales of the fund’s Class A shares.
(b) Under the Distribution Plan (the “Plan”) adopted pursuant to Rule 12b-1 under the Act, Class C shares pay the Distributor for distributing its shares at an annual rate of .75% of the value of the average daily net assets of Class C shares. During the period ended May 31, 2011, Class C shares were charged $8,190 pursuant to the Plan.
(c) Under the Shareholder Services Plan, Class A and Class C shares pay the Distributor at an annual rate of .25% of the value of their average daily net assets for the provision of certain services. The services
26
provided may include personal services relating to shareholder accounts, such as answering shareholder inquiries regarding Class A and Class C shares and providing reports and other information, and services related to the maintenance of shareholder accounts. The Distributor may make payments to Service Agents (a securities dealer, financial institution or other industry professional) in respect of these services.The Distributor determines the amounts to be paid to Service Agents. During the period ended May 31, 2011, Class A and Class C shares were charged $2,913 and $2,730, respectively, pursuant to the Shareholder Services Plan.
The fund compensates Dreyfus Transfer, Inc., a wholly-owned subsidiary of Dreyfus, under a transfer agency agreement for providing personnel and facilities to perform transfer agency services for the fund. During the period ended May 31, 2011, the fund was charged $704 pursuant to the transfer agency agreement, which is included in Shareholder servicing costs in the Statement of Operations.
The fund has arrangements with the custodian and cash management bank whereby the fund may receive earnings credits when positive cash balances are maintained, which are used to offset custody and cash management fees. For financial reporting purposes, the fund includes net earnings credits as an expense offset in the Statement of Operations.
The fund compensates The Bank of New York Mellon under a cash management agreement for performing cash management services related to fund subscriptions and redemptions. During the period ended May 31, 2011, the fund was charged $54 pursuant to the cash management agreement, which is included in Shareholder servicing costs in the Statement of Operations. These fees were partially offset by earnings credits of $3.
The fund also compensates The Bank of New York Mellon under a custody agreement for providing custodial services for the fund. During the period ended May 31, 2011, the fund was charged $166,903 pursuant to the custody agreement.
NOTES TO FINANCIAL STATEMENTS (continued)
During the period ended May 31, 2011, the fund was charged $6,387 for services performed by the Chief Compliance Officer.
The components of “Due to The Dreyfus Corporation and affiliates” in the Statement of Assets and Liabilities consist of: management fees $85,834, Rule 12b-1 distribution plan fees $431, shareholder services plan fees $358, custodian fees $125,685, chief compliance officer fees $3,006 and transfer agency per account fees $270, which are offset against an expense reimbursement currently in effect in the amount of $62,576.
(d) Each Board member also serves as a Board member of other funds within the Dreyfus complex. Annual retainer fees and attendance fees are allocated to each fund based on net assets.
NOTE 4—Securities Transactions:
The aggregate amount of purchases and sales of investment securities, excluding short-term securities, during the period ended May 31, 2011, amounted to $133,228,210 and $35,968,890, respectively.
At May 31, 2011, the cost of investments for federal income tax purposes was $97,228,929; accordingly, accumulated net unrealized appreciation on investments was $13,841,349, consisting of $16,274,629 gross unrealized appreciation and $2,433,280 gross unrealized depreciation.
NOTE 5—Subsequent Event:
The Board of Directors approved on July 18, 2011, to be effective on or about July 29, 2011, new sub-investment advisory agreements between the fund and King Investment Advisors, Inc. (“King”) and Nicholas Investment Partners, L.P. (“Nicholas”), pursuant to which King and Nicholas will serve as additional sub-investment advisers for the fund.
28
REPORT OF INDEPENDENT REGISTERED
PUBLIC ACCOUNTING FIRM
Shareholders and Board of Directors
Dreyfus Select Managers Small Cap Growth Fund
We have audited the accompanying statement of assets and liabilities, including the statement of investments, of Dreyfus Select Managers Small Cap Growth Fund (one of the series comprising Strategic Funds, Inc.) as of May 31, 2011, and the related statements of operations and changes in net assets and financial highlights for the period from July 1, 2010 (commencement of operations) to May 31, 2011.These financial statements and financial highlights are the responsibility of the Fund’s management. Our responsibility is to express an opinion on these financial statements and financial highlights based on our audit.
We conducted our audit in accordance with the standards of the Public Company Accounting Oversight Board (United States).Those standards require that we plan and perform the audit to obtain reasonable assurance about whether the financial statements and financial highlights are free of material misstatement.We were not engaged to perform an audit of the Fund’s internal control over financial reporting. Our audit included consideration of internal control over financial reporting as a basis for designing audit procedures that are appropriate in the circumstances, but not for the purpose of expressing an opinion on the effectiveness of the Fund’s internal control over financial reporting. Accordingly, we express no such opinion. An audit also includes examining, on a test basis, evidence supporting the amounts and disclosures in the financial statements and financial highlights, assessing the accounting principles used and significant estimates made by management, and evaluating the overall financial statement presentation. Our procedures included confirmation of securities owned as of May 31, 2011 by correspondence with the custodian and others.We believe that our audit provides a reasonable basis for our opinion.
In our opinion, the financial statements and financial highlights referred to above present fairly, in all material respects, the financial position of Dreyfus Select Managers Small Cap Growth Fund at May 31, 2011, and the results of its operations, the changes in its net assets and the financial highlights for the period from July 1, 2010 to May 31, 2011, in conformity with U.S. generally accepted accounting principles.

|
| New York, New York |
| July 26, 2011 |
BOARD MEMBERS INFORMATION (Unaudited)
|
| Joseph S. DiMartino (67) |
| Chairman of the Board (1995) |
| Principal Occupation During Past 5Years: |
| • Corporate Director and Trustee |
| Other Public Company Board Memberships During Past 5Years: |
| • CBIZ (formerly, Century Business Services, Inc.), a provider of outsourcing functions for small |
| and medium size companies, Director (1997-present) |
| • Sunair Services Corporation, a provider of certain outdoor-related services to homes and |
| businesses, Director (2005-2009) |
| • The Newark Group, a provider of a national market of paper recovery facilities, paperboard |
| mills and paperboard converting plants, Director (2000-2010) |
| No. of Portfolios for which Board Member Serves: 170 |
| ——————— |
| David W. Burke (75) |
| Board Member (1994) |
| Principal Occupation During Past 5Years: |
| • Corporate Director and Trustee |
| No. of Portfolios for which Board Member Serves: 84 |
| ——————— |
| William Hodding Carter III (76) |
| Board Member (1988) |
| Principal Occupation During Past 5Years: |
| • Professor of Leadership & Public Policy, University of North Carolina, Chapel Hill |
| (2006-present) |
| • President and Chief Executive Officer of the John S. and James L. Knight Foundation |
| (1998-2006) |
| No. of Portfolios for which Board Member Serves: 29 |
| ——————— |
| Gordon J. Davis (70) |
| Board Member (2006) |
| Principal Occupation During Past 5Years: |
| • Partner in the law firm of Dewey & LeBoeuf LLP |
| Other Public Company Board Memberships During Past 5Years: |
| • Consolidated Edison, Inc., a utility company, Director (1997-present) |
| • The Phoenix Companies, Inc., a life insurance company, Director (2000-present) |
| No. of Portfolios for which Board Member Serves: 45 |
30
|
| Joni Evans (69) |
| Board Member (2006) |
| Principal Occupation During Past 5Years: |
| • Chief Executive Officer, www.wowOwow.com an online community dedicated to women’s |
| conversations and publications (2007-present) |
| • Principal, Joni Evans Ltd. (publishing) (2006-present) |
| • Senior Vice President of the William Morris Agency (1994-2006) |
| No. of Portfolios for which Board Member Serves: 29 |
| ——————— |
| Ehud Houminer (71) |
| Board Member (1994) |
| Principal Occupation During Past 5Years: |
| • Executive-in-Residence at the Columbia Business School, Columbia University (1992-present) |
| Other Public Company Board Memberships During Past 5Years: |
| • Avnet Inc., an electronics distributor, Director (1993-present) |
| No. of Portfolios for which Board Member Serves: 64 |
| ——————— |
| Richard C. Leone (71) |
| Board Member (1984) |
| Principal Occupation During Past 5Years: |
| • President ofThe Century Foundation (formerly,TheTwentieth Century Fund, Inc.), a tax exempt |
| research foundation engaged in the study of economic, foreign policy and domestic issues |
| Other Public Company Board Memberships During Past 5Years: |
| • Partnership for a Secure America, Director |
| No. of Portfolios for which Board Member Serves: 29 |
| ——————— |
| Hans C. Mautner (73) |
| Board Member (1984) |
| Principal Occupation During Past 5Years: |
| • President—International Division and an Advisory Director of Simon Property Group, a real |
| estate investment company (1998-2010) |
| • Chairman and Chief Executive Officer of Simon Global Limited (1999-2010) |
| No. of Portfolios for which Board Member Serves: 29 |
BOARD MEMBERS INFORMATION (Unaudited) (continued)
|
| Robin A. Melvin (47) |
| Board Member (1995) |
| Principal Occupation During Past 5Years: |
| • Director, Boisi Family Foundation, a private family foundation that supports youth-serving |
| organizations that promote the self sufficiency of youth from disadvantaged circumstances |
| (1995-present) |
| • SeniorVice President, Mentor, a national non-profit youth mentoring organization (1992-2005) |
| No. of Portfolios for which Board Member Serves: 56 |
| ——————— |
| Burton N. Wallack (60) |
| Board Member (2006) |
| Principal Occupation During Past 5Years: |
| • President and Co-owner of Wallack Management Company, a real estate management company |
| No. of Portfolios for which Board Member Serves: 29 |
| ——————— |
| John E. Zuccotti (74) |
| Board Member (1984) |
| Principal Occupation During Past 5Years: |
| • Chairman of Brookfield Properties, Inc. |
| • Senior Counsel of Weil, Gotshal & Manges, LLP |
| • Emeritus Chairman of the Real Estate Board of New York |
| Other Public Company Board Memberships During Past 5Years: |
| • Emigrant Savings Bank, Director (2004-present) |
| • Doris Duke Charitable Foundation,Trustee (2006-present) |
| No. of Portfolios for which Board Member Serves: 29 |
| ——————— |
Once elected all Board Members serve for an indefinite term, but achieve Emeritus status upon reaching age 80.The address of the Board Members and Officers is in c/o The Dreyfus Corporation, 200 Park Avenue, NewYork, NewYork 10166.Additional information about the Board Members is available in the fund’s Statement of Additional Information which can be obtained from Dreyfus free of charge by calling this toll free number: 1-800-DREYFUS.
Arnold S. Hiatt, Emeritus Board Member
32
OFFICERS OF THE FUND (Unaudited)
OFFICERS OF THE FUND (Unaudited) (continued)
34
For More Information
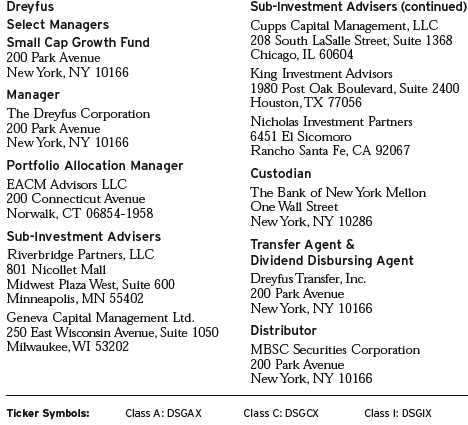
Item 2. Code of Ethics.
The Registrant has adopted a code of ethics that applies to the Registrant's principal executive officer, principal financial officer, principal accounting officer or controller, or persons performing similar functions. There have been no amendments to, or waivers in connection with, the Code of Ethics during the period covered by this Report.
Item 3. Audit Committee Financial Expert.
The Registrant's Board has determined that Ehud Houminer, a member of the Audit Committee of the Board, is an audit committee financial expert as defined by the Securities and Exchange Commission (the "SEC"). Ehud Houminer is "independent" as defined by the SEC for purposes of audit committee financial expert determinations.
Item 4. Principal Accountant Fees and Services.
(a) Audit Fees. The aggregate fees billed for each of the last two fiscal years (the "Reporting Periods") for professional services rendered by the Registrant's principal accountant (the "Auditor") for the audit of the Registrant's annual financial statements or services that are normally provided by the Auditor in connection with the statutory and regulatory filings or engagements for the Reporting Periods, were $0 in 2010 and $60,624 in 2011.
(b) Audit-Related Fees. The aggregate fees billed in the Reporting Periods for assurance and related services by the Auditor that are reasonably related to the performance of the audit of the Registrant's financial statements and are not reported under paragraph (a) of this Item 4 were $0 in 2010 and $0 in 2011. These services consisted of one or more of the following: (i) agreed upon procedures related to compliance with Internal Revenue Code section 817(h), (ii) security counts required by Rule 17f-2 under the Investment Company Act of 1940, as amended, (iii) advisory services as to the accounting or disclosure treatment of Registrant transactions or events and (iv) advisory services to the accounting or disclosure treatment of the actual or potential impact to the Registrant of final or proposed rules, standards or interpretations by the Securities and Exchange Commission, the Financial Accounting Standards Boards or other regulatory or standard-setting bodies.
The aggregate fees billed in the Reporting Periods for non-audit assurance and related services by the Auditor to the Registrant's investment adviser (not including any sub-investment adviser whose role is primarily portfolio management and is subcontracted with or overseen by another investment adviser), and any entity controlling, controlled by or under common control with the investment adviser that provides ongoing services to the Registrant ("Service Affiliates"), that were reasonably related to the performance of the annual audit of the Service Affiliate, which required pre-approval by the Audit Committee were $0 in 2010 and $0 in 2011.
(c) Tax Fees. The aggregate fees billed in the Reporting Periods for professional services rendered by the Auditor for tax compliance, tax advice, and tax planning ("Tax Services") were $0 in 2010 and $1,596 in 2011. These services consisted of: (i) review or preparation of U.S. federal, state, local and excise tax returns; (ii) U.S. federal, state and local tax planning, advice and assistance regarding statutory, regulatory or administrative developments; (iii) tax advice regarding tax qualification matters and/or treatment of various financial instruments held or proposed to be acquired or held, and (iv) determination of Passive Foreign Investment Companies. The aggregate fees billed in the Reporting Periods for Tax Services by the Auditor to Service Affiliates, which required pre-approval by the Audit Committee were $0 in 2009 and $0 in 2010.
(d) All Other Fees. The aggregate fees billed in the Reporting Periods for products and services provided by the Auditor, other than the services reported in paragraphs (a) through (c) of this Item, were $0 in 2010 and $39 in 2011. [These services consisted of a review of the Registrant's anti-money laundering program].
The aggregate fees billed in the Reporting Periods for Non-Audit Services by the Auditor to Service Affiliates, other than the services reported in paragraphs (b) through (c) of this Item, which required pre-approval by the Audit Committee, were $0 in 2010 and $0 in 2011.
(e)(1) Audit Committee Pre-Approval Policies and Procedures. The Registrant's Audit Committee has established policies and procedures (the "Policy") for pre-approval (within specified fee limits) of the Auditor's engagements for non-audit services to the Registrant and Service Affiliates without specific case-by-case consideration. The pre-approved services in the Policy can include pre-approved audit services, pre-approved audit-related services, pre-approved tax services and pre-approved all other services. Pre-approval considerations include whether the proposed services are compatible with maintaining the Auditor's independence. Pre-approvals pursuant to the Policy are considered annually.
(e)(2) Note: None of the services described in paragraphs (b) through (d) of this Item 4 were approved by the Audit Committee pursuant to paragraph (c)(7)(i)(C) of Rule 2-01 of Regulation S-X.
(f) None of the hours expended on the principal accountant's engagement to audit the registrant's financial statements for the most recent fiscal year were attributed to work performed by persons other than the principal account's full-time, permanent employees.
Non-Audit Fees. The aggregate non-audit fees billed by the Auditor for services rendered to the Registrant, and rendered to Service Affiliates, for the Reporting Periods were $28,017,293 in 2010 and $19,630,755 in 2011.
Auditor Independence. The Registrant's Audit Committee has considered whether the provision of non-audit services that were rendered to Service Affiliates, which were not pre-approved (not requiring pre-approval), is compatible with maintaining the Auditor's independence.
Item 5. Audit Committee of Listed Registrants.
Not applicable. [CLOSED-END FUNDS ONLY]
Item 6. Investments.
(a) Not applicable.
Item 7. Disclosure of Proxy Voting Policies and Procedures for Closed-End Management Investment Companies.
Not applicable. [CLOSED-END FUNDS ONLY]
Item 8. Portfolio Managers of Closed-End Management Investment Companies.
Not applicable. [CLOSED-END FUNDS ONLY, beginning with reports for periods ended on and after December 31, 2005]
Item 9. Purchases of Equity Securities by Closed-End Management Investment Companies and Affiliated Purchasers.
Not applicable. [CLOSED-END FUNDS ONLY]
Item 10. Submission of Matters to a Vote of Security Holders.
There have been no material changes to the procedures applicable to Item 10.
Item 11. Controls and Procedures.
(a) The Registrant's principal executive and principal financial officers have concluded, based on their evaluation of the Registrant's disclosure controls and procedures as of a date within 90 days of the filing date of this report, that the Registrant's disclosure controls and procedures are reasonably designed to ensure that information required to be disclosed by the Registrant on Form N-CSR is recorded, processed, summarized and reported within the required time periods and that information required to be disclosed by the Registrant in the reports that it files or submits on Form N-CSR is accumulated and communicated to the Registrant's management, including its principal executive and principal financial officers, as appropriate to allow timely decisions regarding required disclosure.
(b) There were no changes to the Registrant's internal control over financial reporting that occurred during the second fiscal quarter of the period covered by this report that have materially affected, or are reasonably likely to materially affect, the Registrant's internal control over financial reporting.
Item 12. Exhibits.
(a)(1) Code of ethics referred to in Item 2.
(a)(2) Certifications of principal executive and principal financial officers as required by Rule 30a-2(a) under the Investment Company Act of 1940.
(a)(3) Not applicable.
(b) Certification of principal executive and principal financial officers as required by Rule 30a-2(b) under the Investment Company Act of 1940.
SIGNATURES
Pursuant to the requirements of the Securities Exchange Act of 1934 and the Investment Company Act of 1940, the Registrant has duly caused this Report to be signed on its behalf by the undersigned, thereunto duly authorized.
Strategic Funds, Inc.
By: /s/ Bradley J. Skapyak |
Bradley J. Skapyak, President |
Date: | July 25, 2011 |
|
Pursuant to the requirements of the Securities Exchange Act of 1934 and the Investment Company Act of 1940, this Report has been signed below by the following persons on behalf of the Registrant and in the capacities and on the dates indicated. |
|
By: /s/ Bradley J. Skapyak |
Bradley J. Skapyak, President |
Date: | July 25, 2011 |
|
By: |
James Windels, Treasurer |
Date: | July 25, 2011 |
|
EXHIBIT INDEX
(a)(1) Code of ethics referred to in Item 2.
(a)(2) Certifications of principal executive and principal financial officers as required by Rule 30a-2(a) under the Investment Company Act of 1940. (EX-99.CERT)
(b) Certification of principal executive and principal financial officers as required by Rule 30a-2(b) under the Investment Company Act of 1940. (EX-99.906CERT)