UNITED STATES
SECURITIES AND EXCHANGE COMMISSION
Washington, D.C. 20549
FORM N-CSR
CERTIFIED SHAREHOLDER REPORT OF REGISTERED MANAGEMENT
INVESTMENT COMPANIES
Investment Company Act file number | 811-3940 |
| |
| Strategic Funds, Inc. | |
| (Exact name of Registrant as specified in charter) | |
| | |
| c/o The Dreyfus Corporation 200 Park Avenue New York, New York 10166 | |
| (Address of principal executive offices) (Zip code) | |
| | |
| Michael A. Rosenberg, Esq. 200 Park Avenue New York, New York 10166 | |
| (Name and address of agent for service) | |
|
Registrant's telephone number, including area code: | (212) 922-6000 |
| |
Date of fiscal year end: | 8/31 | |
Date of reporting period: | 8/31/2011 | |
| | | | | | | |
The following N-CSR relates only to the Registrant’s series listed below and does not affect the other series of the Registrant, which have different fiscal year ends and, therefore, different N-CSR reporting requirements. Separate N-CSR Forms will be filed for these series, as appropriate.
Dreyfus Conservative Allocation Fund
Dreyfus Growth Allocation Fund
Dreyfus Moderate Allocation Fund
FORM N-CSR
Item 1. Reports to Stockholders.
Save time. Save paper. View your next shareholder report online as soon as it’s available. Log into www.dreyfus.com and sign up for Dreyfus eCommunications. It’s simple and only takes a few minutes.
The views expressed in this report reflect those of the portfolio manager only through the end of the period covered and do not necessarily represent the views of Dreyfus or any other person in the Dreyfus organization. Any such views are subject to change at any time based upon market or other conditions and Dreyfus disclaims any responsibility to update such views.These views may not be relied on as investment advice and, because investment decisions for a Dreyfus fund are based on numerous factors, may not be relied on as an indication of trading intent on behalf of any Dreyfus fund.
Not FDIC-Insured • Not Bank-Guaranteed • May Lose Value
| | Contents |
| | THE FUND |
| 2 | A Letter from the Chairman and CEO |
| 3 | Discussion of Fund Performance |
| 6 | Fund Performance |
| 7 | Understanding Your Fund’s Expenses |
| 7 | Comparing Your Fund’s Expenses With Those of Other Funds |
| 8 | Statement of Investments |
| 9 | Statement of Assets and Liabilities |
| 10 | Statement of Operations |
| 11 | Statement of Changes in Net Assets |
| 12 | Financial Highlights |
| 13 | Notes to Financial Statements |
| 24 | Report of Independent Registered Public Accounting Firm |
| 25 | Important Tax Information |
| 26 | Board Members Information |
| 29 | Officers of the Fund |
| | FOR MORE INFORMATION |
| | Back Cover |
Dreyfus
Conservative
Allocation Fund
The Fund

A LETTER FROM THE CHAIRMAN AND CEO
Dear Shareholder:
We are pleased to present this annual report for Dreyfus Conservative Allocation Fund, covering the 12-month period from September 1, 2010, through August 31, 2011. For information about how the fund performed during the reporting period, as well as general market perspectives, we provide a Discussion of Fund Performance on the pages that follow.
Although stocks and higher yielding bonds rallied strongly through the first quarter of 2011 due to expectations of a more robust economic recovery, the reporting period ended amid sharply deteriorating investor sentiment due to disappointing economic data, an escalating sovereign debt crisis in Europe and a contentious debate regarding taxes, spending and borrowing in the United States. In the final month of the reporting period, a major credit rating agency downgraded U.S. long-term debt, marking the first time in history that U.S.Treasury securities were not assigned the highest possible credit rating. Both stocks and bonds proved volatile in this tumultuous environment, as the stalled economy caused securities from economically sensitive market sectors to give back many of the reporting period’s previous gains.
The economic outlook currently is clouded by heightened market volatility and political infighting, but we believe that a sustained, moderate global expansion is more likely than a double-dip recession. Inflationary pressures appear to be waning in most countries, including the United States, as energy prices have retreated from their highs. The Federal Reserve Board has signaled its intention to maintain an aggressively accommodative monetary policy, which may help offset the financial stresses caused by recent fiscal policy choices in the United States and Europe. To assess how these and other developments may affect your investments, we encourage you, as always, to speak with your financial advisor.
Thank you for your continued confidence and support.

Jonathan R. Baum
Chairman and Chief Executive Officer
The Dreyfus Corporation
September 15, 2011
2

DISCUSSION OF FUND PERFORMANCE
For the period of September 1, 2010, through August 31, 2011, as provided by Richard B. Hoey, A. Paul Disdier, Christopher E. Sheldon, CFA, and Keith L. Stransky, CFA, Portfolio Managers
Fund and Market Performance Overview
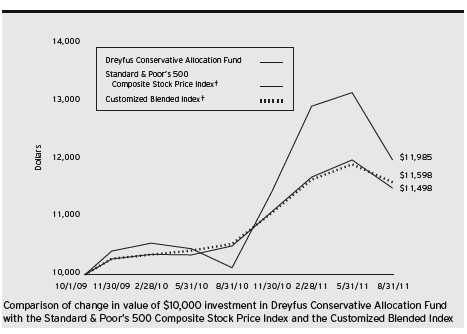
For the 12-month period ended August 31, 2011, Dreyfus Conservative Allocation Fund produced a total return of 9.61%.1 In comparison, the fund’s benchmark, the Standard & Poor’s 500 Composite Stock Price Index produced a total return of 18.48% for the same period.The fund also utilizes a customized blended index composed of 40% Standard & Poor’s 500 Composite Stock Price Index and 60% Barclays Capital U.S. Aggregate Bond Index, and this blended index returned 10.16% for the same period.2 Stocks and higher yielding sectors of the bond market rallied through the first quarter of 2011 amid expectations of continued economic recovery. However, several macroeconomic disappointments later derailed investor sentiment, erasing some of the markets’ previous gains.The fund’s return lagged its benchmarks, primarily due to disappointments among some of the underlying funds’ more economically sensitive holdings.
The Fund’s Investment Approach
Dreyfus Conservative Allocation Fund seeks current income with some consideration for capital appreciation. In pursuing its goal, the fund normally allocates 40% of its assets to equity securities and 60% of its assets to fixed income securities.
The fund achieves its targeted asset allocation mix by investing in other mutual funds that are advised by The Dreyfus Corporation (Dreyfus). In turn, the underlying funds invest in a wide range of equity and fixed income securities, including U.S. large-, mid- and small-cap equities; international, global and emerging-market equities; and U.S. and international fixed income securities.
The fund’s portfolio managers, who comprise the Dreyfus Investment Committee, select the underlying funds based on their investment objectives and management policies, portfolio holdings, risk/reward profiles, historical performance and other factors.The fund may invest in any of 31 underlying funds identified by the Dreyfus Investment
DISCUSSION OF FUND PERFORMANCE (continued)
Committee, which generally will select only certain, and not all, of the underlying funds for investment at any given time.
Shifting Sentiment Sparked Heightened Volatility
Investors’ outlooks improved markedly at the start of the reporting period when the Federal Reserve Board announced new measures to jump-start the U.S. economy. Subsequent improvements in economic data and corporate earnings also helped support rising stock prices.The rally was interrupted in February 2011 by political uprisings in the Middle East and again in March by devastating natural and nuclear disasters in Japan, but stock prices bounced back quickly from these unexpected shocks.
Following the S&P’s late April peak, investor sentiment began to wane, before deteriorating in earnest last summer when Greece appeared headed for default on its debt. Global economic data came in below expectations and a contentious debate regarding U.S. government spending and borrowing intensified. Stocks suffered bouts of heightened volatility as investors engaged in a“flight to quality”away from economically sensitive sectors of the stock market and higher yielding sectors of the bond market. In contrast, traditional safe havens, such as U.S.Treasury securities, gained value late in the reporting period.
Cyclical Stocks Dampened Fund Performance
Throughout the reporting period, we maintained a modest emphasis on owning more stocks over bonds, which helped support the fund’s relative performance over the first eight months of the reporting period but proved detrimental over the summer of 2011. However, the fund exhibited less volatility than the overall stock market, primarily due to its fixed-income allocation.
The fund’s performance compared to its benchmarks also was undermined by the cyclical tilt of some of its underlying equity funds, including Dreyfus Research Growth Fund, Dreyfus U.S. Equity Fund and Dreyfus/The Boston Company Large Cap Core Fund. Dreyfus Strategic Value Fund lagged market averages as value-oriented stocks trailed growth-oriented stocks. The fund achieved better relative results from Dreyfus Appreciation Fund, which benefited from a focus on dividend-paying stocks of large, multinational companies. The fund’s underlying fixed-income funds—Dreyfus Bond Market Index Fund and Dreyfus Total Return Advantage Fund—produced returns that were roughly in line with bond market averages.
4
The Dreyfus Investment Committee made a number of changes to the fund’s investment allocations during the reporting period. In October 2010, 1.5% of the fund’s total assets were shifted from Dreyfus Select Managers Small Cap Value Fund to Dreyfus Small Cap Stock Index Fund. In February 2011, we moved 2.6% of the fund’s assets to Dreyfus Appreciation Fund. Finally, in July 2011 we shifted 0.9% of assets from Dreyfus International Value Fund to Dreyfus International Equity Fund for a somewhat more defensive asset mix.
Defensive Bias in a Choppy Economic Recovery
We expect a subpar global economic rebound to persist amid significant headwinds over the remainder of 2011 and are monitoring a number of macroeconomic developments, including the sovereign debt crisis in Europe, U.S. federal deficit reduction negotiations and central bank policies worldwide.Therefore, we have maintained a relatively defensive bias in the selection of underlying equity funds, and have continued to rely on more defensively structured bond funds to help cushion heightened market volatility.
September 15, 2011
| |
| | Equity funds are subject generally to market, market sector, market liquidity, issuer and investment |
| | style risks, among other factors, to varying degrees, all of which are more fully described in the |
| | fund’s prospectus. Stocks of small- and/or midcap companies often experience sharper price |
| | fluctuations than stocks of large-cap companies. |
| | Asset allocation and diversification cannot assure a profit or protect against loss. |
| | The ability of the fund to achieve its investment goal depends, in part, on the ability of the |
| | Dreyfus Investment Committee to allocate effectively the fund’s assets among the asset classes and |
| | the underlying funds.There can be no assurance that the actual allocations will be effective in |
| | achieving the fund’s investment goal. |
| | Bond funds are subject generally to interest rate, credit, liquidity and market risks, to varying degrees, |
| | all of which are more fully described in the fund’s prospectus. Generally, all other factors being equal, |
| | bond prices are inversely related to interest-rate changes and rate increases can cause price declines. |
| 1 | Total return includes reinvestment of dividends and any capital gains paid. Past performance is no |
| | guarantee of future results. Share price and investment return fluctuate such that upon redemption, |
| | fund shares may be worth more or less than their original cost. Return figure provided reflects the |
| | absorption of certain fund expenses by The Dreyfus Corporation pursuant to an agreement in |
| | effect through January 1, 2012, at which time it may be extended, terminated or modified. Had |
| | these expenses not been absorbed, the fund’s return would have been lower. |
| 2 | SOURCE: LIPPER INC. — Reflects reinvestment of dividends and, where applicable, capital |
| | gain distributions.The Standard & Poor’s 500 Composite Stock Price Index is a widely accepted, |
| | unmanaged index of U.S. stock market performance.The Barclays Capital U.S.Aggregate Bond |
| | Index is a widely accepted, unmanaged total return index of corporate, U.S. government and U.S. |
| | government agency debt instruments, mortgage-backed securities and asset-backed securities with an |
| | average maturity of 1-10 years. Investors cannot invest directly in any index. |
FUND PERFORMANCE
| | | | | |
| Average Annual Total Returns as of 8/31/11 | | | |
| | Inception | | From |
| | Date | 1Year | Inception |
| Fund | 10/1/09 | 9.61% | 7.54% |
| Standard & Poor’s 500 | | | |
| Composite Stock Price Index | 9/30/09 | 18.48% | 9.91%†† |
| Customized Blended Index | 9/30/09 | 10.16% | 8.04%†† |
|
| † Source: Lipper Inc. |
| Past performance is not predictive of future performance.The fund’s performance shown in the graph and table does not |
| reflect the deduction of taxes that a shareholder would pay on fund distributions or the redemption of fund shares. |
| The above graph compares a $10,000 investment made in Dreyfus Conservative Allocation Fund on 10/1/09 |
| (inception date) to a $10,000 investment made in two different indices: (1) the Standard & Poor’s 500 Composite |
| Stock Price Index (the “S&P 500 Index”) and (2) the Customized Blended Index.The Customized Blended Index is |
| calculated on a year-to-date basis.All dividends and capital gain distributions are reinvested. |
| The fund’s performance shown in the line graph above takes into account all applicable fees and expenses.The S&P 500 |
| Index is a widely accepted, unmanaged index of U.S. stock market performance.The Customized Blended Index is |
| composed of the S&P 500 Index, 40%, and the Barclays Capital U.S.Aggregate Bond Index (the “Barclays Index”), |
| 60%.The Barclays Index is a widely accepted, unmanaged index of corporate, government and government agency debt |
| instruments, mortgage-backed securities and asset-backed securities with an average maturity of 1-10 years. Unlike a |
| mutual fund, the indices are not subject to charges, fees and other expenses. Investors cannot invest directly in any index. |
| Further information relating to fund performance, including expense reimbursements, if applicable, is contained in the |
| Financial Highlights section of the prospectus and elsewhere in this report. |
| †† For comparative purposes, the value of each index on 9/30/09 is used as the beginning value on 10/1/09. |
6
UNDERSTANDING YOUR FUND’S EXPENSES (Unaudited)
As a mutual fund investor, you pay ongoing expenses, such as management fees and other expenses. Using the information below, you can estimate how these expenses affect your investment and compare them with the expenses of other funds.You also may pay one-time transaction expenses, including sales charges (loads) and redemption fees, which are not shown in this section and would have resulted in higher total expenses. For more information, see your fund’s prospectus or talk to your financial adviser.
Review your fund’s expenses
The table below shows the expenses you would have paid on a $1,000 investment in Dreyfus Conservative Allocation Fund from March 1, 2011 to August 31, 2011. It also shows how much a $1,000 investment would be worth at the close of the period, assuming actual returns and expenses.
| | |
| Expenses and Value of a $1,000 Investment |
| assuming actual returns for the six months ended August 31, 2011 |
| |
| Expenses paid per $1,000† | $ | 3.65 |
| Ending value (after expenses) | $ | 983.70 |
|
| COMPARING YOUR FUND’S EXPENSES |
| WITH THOSE OF OTHER FUNDS (Unaudited) |
Using the SEC’s method to compare expenses
The Securities and Exchange Commission (SEC) has established guidelines to help investors assess fund expenses. Per these guidelines, the table below shows your fund’s expenses based on a $1,000 investment, assuming a hypothetical 5% annualized return. You can use this information to compare the ongoing expenses (but not transaction expenses or total cost) of investing in the fund with those of other funds.All mutual fund shareholder reports will provide this information to help you make this comparison. Please note that you cannot use this information to estimate your actual ending account balance and expenses paid during the period.
| | |
| Expenses and Value of a $1,000 Investment |
| assuming a hypothetical 5% annualized return for the six months ended August 31, 2011 |
| |
| Expenses paid per $1,000† | $ | 3.72 |
| Ending value (after expenses) | $ | 1,021.53 |
† Expenses are equal to the fund’s annualized expense ratio of .73%, multiplied by the average account value over the period, multiplied by 184/365 (to reflect the one-half year period).
|
| STATEMENT OF INVESTMENTS |
| August 31, 2011 |
| | | |
| Registered Investment Companies—99.9% | Shares | Value ($) |
| Dreyfus Appreciation Fund | 11,271a | 445,097 |
| Dreyfus Bond Market Index Fund, Basic Shares | 329,749a | 3,597,566 |
| Dreyfus Emerging Markets Debt Local Currency Fund, Cl. I | 69,509a | 1,063,483 |
| Dreyfus Emerging Markets Fund, Cl. I | 25,820a | 303,898 |
| Dreyfus Global Absolute Return Fund, Cl. I | 18,137a,b | 216,916 |
| Dreyfus Global Real Estate Securities Fund, Cl. I | 15,561a | 112,821 |
| Dreyfus High Yield Fund, Cl. I | 159,509a | 998,525 |
| Dreyfus International Bond Fund, Cl. I | 60,824a | 1,057,731 |
| Dreyfus International Equity Fund, Cl. I | 5,241a | 139,243 |
| Dreyfus International Stock Index Fund | 16,638a | 232,770 |
| Dreyfus International Value Fund, Cl. I | 11,868a | 126,629 |
| Dreyfus Opportunistic Midcap Value Fund, Cl. I | 7,766a,b | 242,364 |
| Dreyfus/Newton International Equity Fund, Cl. I | 14,327a | 240,403 |
| Dreyfus Research Growth Fund, Cl. Z | 104,697a | 930,754 |
| Dreyfus S&P Stars Opportunities Fund, Cl. I | 11,307a | 246,261 |
| Dreyfus Small Cap Stock Index Fund | 13,093a | 256,613 |
| Dreyfus Strategic Value Fund, Cl. I | 47,290a | 1,243,729 |
| Dreyfus Total Return Advantage Fund, Cl. I | 265,410a | 3,596,304 |
| Dreyfus U.S. Equity Fund, Cl. I | 51,259a | 691,998 |
| Dreyfus/The Boston Company Large Cap Core Fund, Cl. I | 20,234a | 658,417 |
| Dreyfus/The Boston Company | | |
| Small/Mid Cap Growth Fund, Cl. I | 18,520a,b | 258,166 |
| International Stock Fund, Cl. I | 14,879a | 198,337 |
| |
| Total Investments (cost $16,538,996) | 99.9% | 16,858,025 |
| Cash and Receivables (Net) | .1% | 19,444 |
| Net Assets | 100.0% | 16,877,469 |
| |
| a | Investment in affiliated mutual fund. |
| b | Non-income producing security. |
| | | |
| Portfolio Summary (Unaudited)† | | |
| | Value (%) | | Value (%) |
| Mutual Funds: Domestic | 78.0 | Mutual Funds: Foreign | 21.9 |
| | | | 99.9 |
| † Based on net assets. | | | |
| See notes to financial statements. | | | |
8
|
| STATEMENT OF ASSETS AND LIABILITIES |
| August 31, 2011 |
| | |
| | Cost | Value |
| Assets ($): | | |
| Investments in affiliated issuers— | | |
| See Statement of Investments—Note 1(c) | 16,538,996 | 16,858,025 |
| Receivable for investment securities sold | | 64,167 |
| Prepaid expenses | | 12,521 |
| | | 16,934,713 |
| Liabilities ($): | | |
| Due to The Dreyfus Corporation and affiliates—Note 3(b) | | 2,153 |
| Cash overdraft due to Custodian | | 12,740 |
| Accrued expenses | | 42,351 |
| | | 57,244 |
| Net Assets ($) | | 16,877,469 |
| Composition of Net Assets ($): | | |
| Paid-in capital | | 16,419,492 |
| Accumulated undistributed investment income—net | | 133,714 |
| Accumulated net realized gain (loss) on investments | | 5,234 |
| Accumulated net unrealized appreciation | | |
| (depreciation) on investments | | 319,029 |
| Net Assets ($) | | 16,877,469 |
| Shares Outstanding | | |
| (100 million shares of $.001 par value Common Stock authorized) | | 1,213,530 |
| Net Asset Value, offering and redemption price per share ($) | | 13.91 |
| |
| See notes to financial statements. | | |
|
| STATEMENT OF OPERATIONS |
| Year Ended August 31, 2011 |
| | |
| Investment Income ($): | |
| Income: | |
| Cash dividends from affiliated issuers | 311,152 |
| Expenses: | |
| Auditing fees | 40,844 |
| Shareholder servicing costs—Note 3(b) | 39,610 |
| Registration fees | 22,095 |
| Prospectus and shareholders’ reports | 9,060 |
| Directors’ fees and expenses—Note 3(c) | 4,240 |
| Custodian fees—Note 3(b) | 3,090 |
| Legal fees | 2,019 |
| Loan commitment fees—Note 2 | 161 |
| Miscellaneous | 9,461 |
| Total Expenses | 130,580 |
| Less—expense reimbursement from The Dreyfus | |
| Corporation due to undertaking—Note 3(a) | (38,540) |
| Less—waiver of shareholder servicing fees—Note 3(b) | (2,156) |
| Less—reduction in fees due to earnings credits—Note 3(b) | (43) |
| Net Expenses | 89,841 |
| Investment Income—Net | 221,311 |
| Realized and Unrealized Gain (Loss) on Investments—Note 4 ($): | |
| Net realized gain (loss) on investments in affiliated issuers | (18,386) |
| Capital gain distributions from affiliated issuers | 113,410 |
| Net Realized Gain (Loss) | 95,024 |
| Net unrealized appreciation (depreciation) | |
| on investments in affiliated issuers | 314,685 |
| Net Realized and Unrealized Gain (Loss) on Investments | 409,709 |
| Net Increase in Net Assets Resulting from Operations | 631,020 |
| |
| See notes to financial statements. | |
10
STATEMENT OF CHANGES IN NET ASSETS
| | | | |
| | Year Ended August 31, |
| | 2011 | 2010a |
| Operations ($): | | |
| Investment income—net | 221,311 | 70,572 |
| Net realized gain (loss) on | | |
| investments in affiliated issuers | 95,024 | 10,523 |
| Net unrealized appreciation (depreciation) | | |
| on investments in affiliated issuers | 314,685 | 4,344 |
| Net Increase (Decrease) in Net Assets | | |
| Resulting from Operations | 631,020 | 85,439 |
| Dividends to Shareholders from ($): | | |
| Investment income—net | (194,001) | (30,094) |
| Net realized gain on investments | (34,773) | — |
| Total Dividends | (228,774) | (30,094) |
| Capital Stock Transactions ($): | | |
| Net proceeds from shares sold | 11,957,733 | 8,458,290 |
| Dividends reinvested | 225,493 | 26,748 |
| Cost of shares redeemed | (3,139,530) | (1,108,856) |
| Increase (Decrease) in Net Assets | | |
| from Capital Stock Transactions | 9,043,696 | 7,376,182 |
| Total Increase (Decrease) in Net Assets | 9,445,942 | 7,431,527 |
| Net Assets ($): | | |
| Beginning of Period | 7,431,527 | — |
| End of Period | 16,877,469 | 7,431,527 |
| Undistributed investment income—net | 133,714 | 47,277 |
| Capital Share Transactions (Shares): | | |
| Shares sold | 850,229 | 655,759 |
| Shares issued for dividends reinvested | 16,352 | 2,103 |
| Shares redeemed | (225,038) | (85,875) |
| Net Increase (Decrease) in Shares Outstanding | 641,543 | 571,987 |
| |
| a From October 1, 2009 (commencement of operations) to August 31, 2010. | |
| See notes to financial statements. | | |
FINANCIAL HIGHLIGHTS
The following table describes the performance for the fiscal periods indicated. Total return shows how much your investment in the fund would have increased (or decreased) during each period, assuming you had reinvested all dividends and distributions.These figures have been derived from the fund’s financial statements.
| | | | |
| | Year Ended August 31, |
| | 2011 | 2010a |
| Per Share Data ($): | | |
| Net asset value, beginning of period | 12.99 | 12.50 |
| Investment Operations: | | |
| Investment income—netb | .25 | .20 |
| Net realized and unrealized | | |
| gain (loss) on investments | 1.00 | .41 |
| Total from Investment Operations | 1.25 | .61 |
| Distributions: | | |
| Dividends from investment income—net | (.28) | (.12) |
| Dividends from net realized gain on investments | (.05) | — |
| Total Distributions | (.33) | (.12) |
| Net asset value, end of period | 13.91 | 12.99 |
| Total Return (%) | 9.61 | 4.91c |
| Ratios/Supplemental Data (%): | | |
| Ratio of total expenses to average net assetsd | 1.06 | 2.76e |
| Ratio of net expenses to average net assetsd | .73 | .71e |
| Ratio of net investment income | | |
| to average net assetsd | 1.79 | 1.84e |
| Portfolio Turnover Rate | 20.04 | 36.82c |
| Net Assets, end of period ($ x 1,000) | 16,877 | 7,432 |
| |
| a | From October 1, 2009 (commencement of operations) to August 31, 2010. |
| b | Based on average shares outstanding at each month end. |
| c | Not annualized. |
| d | Amounts do not include the activity of the underlying funds. |
| e | Annualized. |
| See notes to financial statements. |
12
NOTES TO FINANCIAL STATEMENTS
NOTE 1—Significant Accounting Policies:
Dreyfus Conservative Allocation Fund (the “fund”) is a separate diversified series of Strategic Funds, Inc. (the “Company”) which is registered under the Investment Company Act of 1940, as amended (the “Act”), as a open-end management investment company and operates as a series company currently offering ten series, including the fund. The fund’s investment objective is to seek current income with some consideration for capital appreciation. The Dreyfus Corporation (the “Manager” or “Dreyfus”), a wholly-owned subsidiary of The Bank of New York Mellon Corporation (“BNY Mellon”), serves as the fund’s investment adviser. MBSC Securities Corporation (the “Distributor”), a wholly-owned subsidiary of the Manager, is the distributor of the fund’s shares, which are sold to the public without a sales charge.
The Company accounts separately for the assets, liabilities and operations of each series. Expenses directly attributable to each series are charged to that series’ operations; expenses which are applicable to all series are allocated among them on a pro rata basis.
The Financial Accounting Standards Board (“FASB”) Accounting Standards Codification (“ASC”) is the exclusive reference of authoritative U.S. generally accepted accounting principles (“GAAP”) recognized by the FASB to be applied by nongovernmental entities. Rules and interpretive releases of the Securities and Exchange Commission (“SEC”) under authority of federal laws are also sources of authoritative GAAP for SEC registrants. The fund’s financial statements are prepared in accordance with GAAP, which may require the use of management estimates and assumptions.Actual results could differ from those estimates.
The Company enters into contracts that contain a variety of indemnifications. The fund’s maximum exposure under these arrangements is unknown.The fund does not anticipate recognizing any loss related to these arrangements.
NOTES TO FINANCIAL STATEMENTS (continued)
(a) Portfolio valuation: The fair value of a financial instrument is the amount that would be received to sell an asset or paid to transfer a liability in an orderly transaction between market participants at the measurement date (i.e. the exit price). GAAP establishes a fair value hierarchy that prioritizes the inputs of valuation techniques used to measure fair value.This hierarchy gives the highest priority to unadjusted quoted prices in active markets for identical assets or liabilities (Level 1 measurements) and the lowest priority to unobservable inputs (Level 3 measurements).
Additionally, GAAP provides guidance on determining whether the volume and activity in a market has decreased significantly and whether such a decrease in activity results in transactions that are not orderly. GAAP requires enhanced disclosures around valuation inputs and techniques used during annual and interim periods.
Various inputs are used in determining the value of the fund’s investments relating to fair value measurements.These inputs are summarized in the three broad levels listed below:
Level 1—unadjusted quoted prices in active markets for identical investments.
Level 2—other significant observable inputs (including quoted prices for similar investments, interest rates, prepayment speeds, credit risk, etc.).
Level 3—significant unobservable inputs (including the fund’s own assumptions in determining the fair value of investments).
The inputs or methodology used for valuing securities are not necessarily an indication of the risk associated with investing in those securities.
Investments are valued at the net asset value of each underlying fund determined as of the close of the NewYork Stock Exchange (generally 4 p.m., Eastern time) on the valuation date and are generally categorized as Level 1 in the hierarchy.
14
The following is a summary of the inputs used as of August 31, 2011 in valuing the fund’s investments:
| | | | |
| | | Level 2—Other | Level 3— | |
| | Level 1— | Significant | Significant | |
| | Unadjusted | Observable | Unobservable | |
| | Quoted Prices | Inputs | Inputs | Total |
| Assets ($) | | | | |
| Investments in Securities: | | | |
| Mutual Funds | 16,858,025 | — | — | 16,858,025 |
In January 2010, FASB issued Accounting Standards Update (“ASU”) No. 2010-06 “Improving Disclosures about FairValue Measurements” (“ASU 2010-06”). The portions of ASU 2010-06 which require reporting entities to prepare new disclosures surrounding amounts and reasons for significant transfers in and out of Level 1 and Level 2 fair value measurements as well as inputs and valuation techniques used to measure fair value for both recurring and nonrecurring fair value measurements that fall in either Level 2 or Level 3 have been adopted by the fund. No significant transfers between Level 1 or Level 2 fair value measurements occurred at August 31, 2011.
In May 2011, FASB issued ASU No. 2011-04 “Amendments to Achieve Common Fair Value Measurement and Disclosure Requirements in GAAP and International Financial Reporting Standards (“IFRS”)” (“ASU 2011-04”). ASU 2011-04 includes common requirements for measurement of and disclosure about fair value between GAAP and IFRS. ASU 2011-04 will require reporting entities to disclose the following information for fair value measurements categorized within Level 3 of the fair value hierarchy: quantitative information about the unobservable inputs used in the fair value measurement, the valuation processes used by the reporting entity and a narrative description of the sensitivity of the fair value measurement to changes in unobservable inputs and the interrelationships between those unobservable inputs. In
NOTES TO FINANCIAL STATEMENTS (continued)
addition, ASU 2011-04 will require reporting entities to make disclosures about amounts and reasons for all transfers in and out of Level 1 and Level 2 fair value measurements.The new and revised disclosures are effective for interim and annual reporting periods beginning after December 15, 2011. At this time, management is evaluating the implications of ASU 2011-04 and its impact on the financial statements.
(b) Securities transactions and investment income: Securities transactions are recorded on a trade date basis. Realized gains and losses from securities transactions are recorded on the identified cost basis. Dividend income is recognized on the ex-dividend date and interest income, including, where applicable, accretion of discount and amortization of premium on investments, is recognized on the accrual basis.
(c) Affiliated issuers: Investments in other investment companies advised by Dreyfus are defined as “affiliated” in the Act.
The fund may invest in shares of certain affiliated investment companies also advised or managed by Dreyfus. Investments in affiliated investment companies for the period ended August 31, 2011 were as follows:
| | | | | | |
| Affiliated | | | | | | |
| Investment | Value | | | | Net Realized | |
| Company | 8/31/2010 | ($) | Purchases ($)† | Sales ($) | Gain (Loss) ($) | |
| Dreyfus | | | | | | |
| Appreciation Fund | — | | 473,368 | 27,359 | (1,032 | ) |
| Dreyfus Bond Market | | | | | | |
| Index Fund, | | | | | | |
| Basic Shares | 1,616,650 | | 2,307,087 | 390,767 | (3,062 | ) |
| Dreyfus Emerging | | | | | | |
| Markets Debt Local | | | | | | |
| Currency Fund, Cl. I | 458,682 | | 663,098 | 111,648 | (1,214 | ) |
| Dreyfus Emerging | | | | | | |
| Markets Fund, Cl. I | 145,973 | | 212,598 | 37,215 | (1,864 | ) |
| Dreyfus Global | | | | | | |
| Absolute Return | | | | | | |
| Fund, Cl. I | 99,126 | | 148,699 | 24,936 | (781 | ) |
| Dreyfus Global Real | | | | | | |
| Estate Securities | | | | | | |
| Fund, Cl. I | 49,940 | | 72,779 | 12,281 | (343 | ) |
| Dreyfus High Yield | | | | | | |
| Fund, Cl. I | 460,786 | | 695,319 | 111,648 | (2,683 | ) |
16
| | | | | | |
| Affiliated | | | | | | |
| Investment | Value | | | | Net Realized | |
| Company | 8/31/2010 | ($) | Purchases ($)† | Sales ($) | Gain (Loss) ($) | |
| Dreyfus International | | | | | | |
| Bond Fund, Cl. I | 452,637 | | 672,701 | 111,647 | (2,510 | ) |
| Dreyfus International | | | | | | |
| Equity Fund, Cl. I | — | | 163,652 | 5,793 | (498 | ) |
| Dreyfus International | | | | | | |
| Stock Index Fund | 103,071 | | 161,596 | 27,911 | (1,653 | ) |
| Dreyfus International | | | | | | |
| Value Fund, Cl. I | 122,544 | | 185,949 | 184,576 | (2,342 | ) |
| Dreyfus Opportunistic | | | | | | |
| Midcap Value | | | | | | |
| Fund, Cl. I | 108,029 | | 158,489 | 27,912 | (1,984 | ) |
| Dreyfus Research | | | | | | |
| Growth Fund, Cl. Z | 568,947 | | 663,043 | 416,414 | 16,861 | |
| Dreyfus S&P Stars | | | | | | |
| Opportunities | | | | | | |
| Fund, Cl. I | 105,172 | | 158,554 | 27,911 | (1,706 | ) |
| Dreyfus Select | | | | | | |
| Managers Small Cap | | | | | | |
| Value Fund, Cl. I | 107,340 | | 22,230 | 149,317 | 17,795 | |
| Dreyfus Small Cap | | | | | | |
| Stock Index Fund | — | | 281,987 | 19,975 | (1,351 | ) |
| Dreyfus Strategic | | | | | | |
| Value Fund, Cl. I | 542,527 | | 843,143 | 147,374 | (9,380 | ) |
| Dreyfus Total | | | | | | |
| Return Advantage | | | | | | |
| Fund, Cl. I | 1,622,376 | | 2,384,415 | 390,766 | (11,204 | ) |
| Dreyfus U.S. Equity | | | | | | |
| Fund, Cl. I | 282,000 | | 433,585 | 75,922 | (3,300 | ) |
| Dreyfus/Newton | | | | | | |
| International | | | | | | |
| Equity Fund, Cl. I | 107,110 | | 162,267 | 27,912 | (1,075 | ) |
| Dreyfus/The Boston | | | | | | |
| Company Large | | | | | | |
| Cap Core | | | | | | |
| Fund, Cl. I | 285,882 | | 434,414 | 75,921 | (3,071 | ) |
| Dreyfus/The Boston | | | | | | |
| Company | | | | | | |
| Small/Mid Cap | | | | | | |
| Growth Fund, Cl. I | 106,276 | | 158,489 | 27,911 | (1,421 | ) |
| International | | | | | | |
| Stock Fund, Cl. I | 86,898 | | 127,744 | 22,330 | (568 | ) |
| Total | 7,431,966 | | 11,585,206 | 2,455,446 | (18,386 | ) |
| |
| † Includes reinvested dividends/distributions. | | | | | |
NOTES TO FINANCIAL STATEMENTS (continued)
| | | | | | | |
| | | Change in Net | | | | | |
| Affiliated | | Unrealized | | | | | |
| Investment | | Appreciation | | Value | | Net | Dividends/ |
| Company | (Depreciation) ($) | | 8/31/2011 | ($) | Assets (%) | Distributions ($) |
| Dreyfus | | | | | | | |
| Appreciation Fund | 120 | | 445,097 | | 2.6 | 52 |
| Dreyfus Bond Market | | | | | | |
| Index Fund, | | | | | | | |
| Basic Shares | | 67,658 | | 3,597,566 | | 21.3 | 88,236 |
| Dreyfus Emerging | | | | | | |
| Markets Debt Local | | | | | | |
| Currency Fund, Cl. I | 54,565 | | 1,063,483 | | 6.3 | 29,141 |
| Dreyfus Emerging | | | | | | |
| Markets Fund, Cl. I | (15,594 | ) | 303,898 | | 1.8 | 1,279 |
| Dreyfus Global | | | | | | | |
| Absolute Return | | | | | | |
| Fund, Cl. I | | (5,192 | ) | 216,916 | | 1.3 | 7,115 |
| Dreyfus Global Real | | | | | | |
| Estate Securities | | | | | | |
| Fund, Cl. I | | 2,726 | | 112,821 | | 0.7 | 3,044 |
| Dreyfus High Yield | | | | | | |
| Fund, Cl. I | | (43,249 | ) | 998,525 | | 5.9 | 61,361 |
| Dreyfus International | | | | | | |
| Bond Fund, Cl. I | 46,550 | | 1,057,731 | | 6.3 | 38,743 |
| Dreyfus International | | | | | | |
| Equity Fund, Cl. I | (18,118 | ) | 139,243 | | 0.8 | — |
| Dreyfus International | | | | | | |
| Stock Index Fund | (2,333 | ) | 232,770 | | 1.4 | 3,106 |
| Dreyfus International | | | | | | |
| Value Fund, Cl. I | 5,054 | | 126,629 | | 0.8 | 2,539 |
| Dreyfus Opportunistic | | | | | | |
| Midcap Value | | | | | | | |
| Fund, Cl. I | | 5,742 | | 242,364 | | 1.4 | — |
| Dreyfus Research | | | | | | |
| Growth Fund, Cl. Z | 98,317 | | 930,754 | | 5.5 | 3,137 |
| Dreyfus S&P Stars | | | | | | |
| Opportunities | | | | | | | |
| Fund, Cl. I | | 12,152 | | 246,261 | | 1.5 | 65 |
| Dreyfus Select | | | | | | | |
| Managers Small Cap | | | | | | |
| Value Fund, Cl. I | 1,952 | | — | | — | — |
| Dreyfus Small Cap | | | | | | |
| Stock Index Fund | (4,048 | ) | 256,613 | | 1.5 | 4,348 |
| Dreyfus Strategic | | | | | | |
| Value Fund, Cl. I | 14,813 | | 1,243,729 | | 7.4 | 6,319 |
18
| | | | | | | |
| | | Change in Net | | | | | |
| Affiliated | | Unrealized | | | | | |
| Investment | | Appreciation | | Value | | Net | Dividends/ |
| Company | (Depreciation) ($) | | 8/31/2011 | ($) | Assets (%) | Distributions ($) |
| Dreyfus Total Return | | | | | | |
| Advantage Fund, Cl. I | (8,517 | ) | 3,596,304 | | 21.3 | 165,530 |
| Dreyfus U.S. Equity | | | | | | |
| Fund, Cl. I | | 55,635 | | 691,998 | | 4.1 | 2,493 |
| Dreyfus/Newton | | | | | | | |
| International | | | | | | | |
| Equity Fund, Cl. I | 13 | | 240,403 | | 1.4 | 3,778 |
| Dreyfus/The Boston | | | | | | |
| Company Large Cap | | | | | | |
| Core Fund, Cl. I | 17,113 | | 658,417 | | 3.9 | 3,323 |
| Dreyfus/The Boston | | | | | | |
| Company | | | | | | | |
| Small/Mid Cap | | | | | | | |
| Growth Fund, Cl. I | 22,733 | | 258,166 | | 1.5 | — |
| International | | | | | | | |
| Stock Fund, Cl. I | 6,593 | | 198,337 | | 1.2 | 953 |
| Total | | 314,685 | | 16,858,025 | | 99.9 | 424,562 |
(d) Dividends to shareholders: Dividends are recorded on the ex-dividend date. Dividends from investment income-net and dividends from net realized capital gains, if any, are normally declared and paid annually, but the fund may make distributions on a more frequent basis to comply with the distribution requirements of the Internal Revenue Code of 1986, as amended (the “Code”).To the extent that net realized capital gains can be offset by capital loss carryovers, it is the policy of the fund not to distribute such gains. Income and capital gain distributions are determined in accordance with income tax regulations, which may differ from GAAP.
(e) Federal income taxes: It is the policy of the fund to continue to qualify as a regulated investment company, if such qualification is in the best interests of its shareholders, by complying with the applicable provisions of the Code, and to make distributions of taxable income sufficient to relieve it from substantially all federal income and excise taxes.
NOTES TO FINANCIAL STATEMENTS (continued)
As of and during the period ended August 31, 2011, the fund did not have any liabilities for any uncertain tax positions.The fund recognizes interest and penalties, if any, related to uncertain tax positions as income tax expense in the Statement of Operations. During the period, the fund did not incur any interest or penalties.
Each of the tax years in the two-year period ended August 31, 2011 remains subject to examination by the Internal Revenue Service and state taxing authorities.
At August 31, 2011, the components of accumulated earnings on a tax basis were as follows: undistributed ordinary income $169,859, undistributed capital gains $54,300 and unrealized appreciation $233,818.
The tax character of distributions paid to shareholders during the fiscal periods ended August 31, 2011 and August 31, 2010 were as follows: ordinary income $226,662 and $30,094 and long-term capital gains $2,112 and $0, respectively.
During the period ended August 31, 2011, as a result of permanent book to tax differences, primarily due to the tax treatment for short-term capital gain distributions from regulated investment company holdings, the fund increased accumulated undistributed investment income-net by $59,127 and decreased accumulated net realized gain (loss) on investments by the same amount. Net assets and net asset value per share were not affected by this reclassification.
NOTE 2—Bank Lines of Credit:
The fund participates with other Dreyfus-managed funds in a $225 million unsecured credit facility led by Citibank, N.A. and a $300 million unsecured credit facility provided by The Bank of New York Mellon, a subsidiary of BNY Mellon and an affiliate of Dreyfus (each, a “Facility”), each to be utilized primarily for temporary or emergency purposes, including the financing of redemptions. In connection therewith, the fund has agreed to pay its pro rata portion of commitment fees for each Facility. Interest is charged to the fund based on
20
rates determined pursuant to the terms of the respective Facility at the time of borrowing. During the period ended August 31, 2011, the fund did not borrow under the Facilities.
NOTE 3—Management Fee and Other Transactions With Affiliates:
(a) Pursuant to a management agreement with the Manager, there is no management fee paid to the Manager. The fund invests in other mutual funds advised by the Manager. All fees and expenses of the underlying funds are reflected in the underlying funds’ net asset values.
The Manager has contractually agreed, until January 1, 2012, to assume the expenses of the fund so that the total annual fund and underlying funds’ operating expenses (excluding taxes, interest, brokerage commissions, commitment fees on borrowings and extraordinary expenses) do not exceed 1.40% of the value of the fund’s average daily net assets. The expense reimbursement, pursuant to the undertaking, amounted to $38,540 during the period ended August 31, 2011.
(b) Under the Shareholder Services Plan, the fund pays the Distributor at an annual rate of .25% of the value of the fund’s average daily net assets for the provision of certain services.The services provided may include personal services relating to shareholder accounts, such as answering shareholder inquiries regarding the fund’s shares and providing reports and other information, and services related to the maintenance of shareholder accounts.The Distributor may make payments to Service Agents (a securities dealer, financial institution or other industry professional) in respect of these services. The Distributor determines the amounts to be paid to Service Agents. Fees paid to the Distributor will be waived to the extent that the fund invests in an underlying affiliated fund with a shareholder services plan. During the period ended August 31, 2011, the fund was charged $30,858 pursuant to the Shareholder Services Plan of which $2,156 was waived due to the fund’s investment in certain of the underlying funds.
NOTES TO FINANCIAL STATEMENTS (continued)
The fund compensates Dreyfus Transfer, Inc., a wholly-owned subsidiary of the Manager, under a transfer agency agreement for providing personnel and facilities to perform transfer agency services for the fund. During the period ended August 31, 2011, the fund was charged $5,789 pursuant to the transfer agency agreement, which is included in Shareholder servicing costs in the Statement of Operations.
The fund has arrangements with the custodian and cash management bank whereby the fund may receive earnings credits when positive cash balances are maintained, which are used to offset custody and cash management fees. For financial reporting purposes, the fund includes net earnings credits as an expense offset in the Statement of Operations.
The fund compensates The Bank of New York Mellon under a cash management agreement for performing cash management services related to fund subscriptions and redemptions. During the period ended August 31, 2011, the fund was charged $1,053 pursuant to the cash management agreement, which is included in Shareholder servicing costs in the Statement of Operations.These fees were partially offset by earnings credits of $43.
The fund also compensates The Bank of New York Mellon under a custody agreement for providing custodial services for the fund. During the period ended August 31, 2011, the fund was charged $3,090 pursuant to the custody agreement.
During the period ended August 31, 2011, the fund was charged $7,225 for services performed by the Chief Compliance Officer.
22
The components of “Due to The Dreyfus Corporation and affiliates” in the Statement of Assets and Liabilities consist of: shareholder services plan fees $3,500, custodian fees $631, chief compliance officer fees $3,253 and transfer agency per account fees $1,130, which are offset against an expense reimbursement currently in effect in the amount of $6,361.
(c) Each Board member also serves as a Board member of other funds within the Dreyfus complex. Annual retainer fees and attendance fees are allocated to each fund based on net assets.
NOTE 4—Securities Transactions:
The aggregate amount of purchases and sales of investment securities, excluding short-term securities, during the period ended August 31, 2011, amounted to $11,585,206 and $2,455,446, respectively.
At August 31, 2011, the cost of investments for federal income tax purposes was $16,624,207; accordingly, accumulated net unrealized appreciation on investments was $233,818, consisting of $437,533 gross unrealized appreciation and $203,715 gross unrealized depreciation.
|
| REPORT OF INDEPENDENT REGISTERED |
| PUBLIC ACCOUNTING FIRM |
Shareholders and Board of Directors Dreyfus Conservative Allocation Fund
We have audited the accompanying statement of assets and liabilities, including the statement of investments, of Dreyfus Conservative Allocation Fund (one of the series comprising Strategic Funds, Inc.) as of August 31, 2011 and the related statement of operations for the year then ended and the statement of changes in net assets and financial highlights for the year then ended and for the period from October 1, 2009 (commencement of operations) to August 31, 2010.These financial statements and financial highlights are the responsibility of the Fund’s management. Our responsibility is to express an opinion on these financial statements and financial highlights based on our audits.
We conducted our audits in accordance with the standards of the Public Company Accounting Oversight Board (United States).Those standards require that we plan and perform the audit to obtain reasonable assurance about whether the financial statements and financial highlights are free of material misstatement.We were not engaged to perform an audit of the Fund’s internal control over financial reporting. Our audits included consideration of internal control over financial reporting as a basis for designing audit procedures that are appropriate in the circumstances, but not for the purpose of expressing an opinion on the effectiveness of the Fund’s internal control over financial reporting. Accordingly, we express no such opinion. An audit also includes examining, on a test basis, evidence supporting the amounts and disclosures in the financial statements and financial highlights, assessing the accounting principles used and significant estimates made by management, and evaluating the overall financial statement presentation. Our procedures included confirmation of securities owned as of August 31, 2011 by correspondence with the custodian and others.We believe that our audits provide a reasonable basis for our opinion.
In our opinion, the financial statements and financial highlights referred to above present fairly, in all material respects, the financial position of Dreyfus Conservative Allocation Fund at August 31, 2011, the results of its operations for the year then ended and the changes in its net assets and the financial highlights for the year then ended and for the period from October 1, 2009 to August 31, 2010, in conformity with U.S. generally accepted accounting principles.

New York, New York
October 27, 2011
24
IMPORTANT TAX INFORMATION (Unaudited)
For federal tax purposes, the fund hereby designates 94.16% of the ordinary dividends paid during the fiscal year ended August 31, 2011 as qualifying for the corporate dividends received deduction.Also certain dividends paid by the fund may be subject to a maximum tax rate of 15%, as provided for by the Jobs and GrowthTax Relief Reconciliation Act of 2003. Of the distributions paid during the fiscal year, $216,457 represents the maximum amount that may be considered qualified dividend income. The fund also hereby designates $.0464 per share as a short-term capital gain distribution and $.0030 per share as a long-term capital gain distribution paid on December 31, 2010. Shareholders will receive notification in early 2012 of the percentage applicable to the preparation of their 2011 income tax returns.

OFFICERS OF THE FUND (Unaudited)
BRADLEY J. SKAPYAK, President since January 2010.
Chief Operating Officer and a director of the Manager since June 2009. From April 2003 to June 2009, Mr. Skapyak was the head of the Investment Accounting and Support Department of the Manager. He is an officer of 75 investment companies (comprised of 167 portfolios) managed by the Manager. He is 52 years old and has been an employee of the Manager since February 1988.
MICHAEL A. ROSENBERG, Vice President and Secretary since August 2005.
Assistant General Counsel of BNY Mellon, and an officer of 76 investment companies (comprised of 192 portfolios) managed by the Manager. He is 51 years old and has been an employee of the Manager since October 1991.
KIESHA ASTWOOD, Vice President and Assistant Secretary since January 2010.
Counsel of BNY Mellon, and an officer of 76 investment companies (comprised of 192 portfolios) managed by the Manager. She is 38 years old and has been an employee of the Manager since July 1995.
JAMES BITETTO, Vice President and Assistant Secretary since August 2005.
Senior Counsel of BNY Mellon and Secretary of the Manager, and an officer of 76 investment companies (comprised of 192 portfolios) managed by the Manager. He is 45 years old and has been an employee of the Manager since December 1996.
JONI LACKS CHARATAN, Vice President and Assistant Secretary since August 2005.
Senior Counsel of BNY Mellon, and an officer of 76 investment companies (comprised of 192 portfolios) managed by the Manager. She is 55 years old and has been an employee of the Manager since October 1988.
JOSEPH M. CHIOFFI, Vice President and Assistant Secretary since August 2005.
Senior Counsel of BNY Mellon, and an officer of 76 investment companies (comprised of 192 portfolios) managed by the Manager. He is 49 years old and has been an employee of the Manager since June 2000.
KATHLEEN DENICHOLAS, Vice President and Assistant Secretary since January 2010.
Managing Counsel of BNY Mellon, and an officer of 76 investment companies (comprised of 192 portfolios) managed by the Manager. She is 36 years old and has been an employee of the Manager since February 2001.
JANETTE E. FARRAGHER, Vice President and Assistant Secretary since August 2005.
Assistant General Counsel of BNY Mellon, and an officer of 76 investment companies (comprised of 192 portfolios) managed by the Manager. She is 48 years old and has been an employee of the Manager since February 1984.
JOHN B. HAMMALIAN, Vice President and Assistant Secretary since August 2005.
Senior Managing Counsel of BNY Mellon, and an officer of 76 investment companies (comprised of 192 portfolios) managed by the Manager. He is 48 years old and has been an employee of the Manager since February 1991.
M. CRISTINA MEISER, Vice President and Assistant Secretary since January 2010.
Senior Counsel of BNY Mellon, and an officer of 76 investment companies (comprised of 192 portfolios) managed by the Manager. She is 41 years old and has been an employee of the Manager since August 2001.
OFFICERS OF THE FUND (Unaudited) (continued)
ROBERT R. MULLERY, Vice President and Assistant Secretary since August 2005.
Managing Counsel of BNY Mellon, and an officer of 76 investment companies (comprised of 192 portfolios) managed by the Manager. He is 59 years old and has been an employee of the Manager since May 1986.
JEFF PRUSNOFSKY, Vice President and Assistant Secretary since August 2005.
Senior Managing Counsel of BNY Mellon, and an officer of 76 investment companies (comprised of 192 portfolios) managed by the Manager. He is 46 years old and has been an employee of the Manager since October 1990.
JAMES WINDELS, Treasurer since November 2001.
Director – Mutual Fund Accounting of the Manager, and an officer of 76 investment companies (comprised of 192 portfolios) managed by the Manager. He is 52 years old and has been an employee of the Manager since April 1985.
RICHARD CASSARO, Assistant Treasurer since January 2008.
Senior Accounting Manager – Money Market and Municipal Bond Funds of the Manager, and an officer of 76 investment companies (comprised of 192 portfolios) managed by the Manager. He is 52 years old and has been an employee of the Manager since September 1982.
GAVIN C. REILLY, Assistant Treasurer since December 2005.
Tax Manager of the Investment Accounting and Support Department of the Manager, and an officer of 76 investment companies (comprised of 192 portfolios) managed by the Manager. He is 43 years old and has been an employee of the Manager since April 1991.
ROBERT ROBOL, Assistant Treasurer since August 2005.
Senior Accounting Manager – Fixed Income Funds of the Manager, and an officer of 76 investment companies (comprised of 192 portfolios) managed by the Manager. He is 47 years old and has been an employee of the Manager since October 1988.
ROBERT SALVIOLO, Assistant Treasurer since July 2007.
Senior Accounting Manager – Equity Funds of the Manager, and an officer of 76 investment companies (comprised of 192 portfolios) managed by the Manager. He is 44 years old and has been an employee of the Manager since June 1989.
ROBERT SVAGNA, Assistant Treasurer since August 2005.
Senior Accounting Manager – Equity Funds of the Manager, and an officer of 76 investment companies (comprised of 192 portfolios) managed by the Manager. He is 44 years old and has been an employee of the Manager since November 1990.
30
JOSEPH W. CONNOLLY, Chief Compliance Officer since October 2004.
Chief Compliance Officer of the Manager and The Dreyfus Family of Funds (76 investment companies, comprised of 192 portfolios). From November 2001 through March 2004, Mr. Connolly was first Vice-President, Mutual Fund Servicing for Mellon Global Securities Services. In that capacity, Mr. Connolly was responsible for managing Mellon’s Custody, Fund Accounting and Fund Administration services to third-party mutual fund clients. He is 54 years old and has served in various capacities with the Manager since 1980, including manager of the firm’s Fund Accounting Department from 1997 through October 2001.
STEPHEN J. STOREN, Anti-Money Laundering Compliance Officer since May 2011.
Chief Compliance Officer of the Distributor, and the Anti-Money Laundering Compliance Officer of 72 investment companies (comprised of 188 portfolios) managed by the Manager. He is 56 years old and has been an employee of the Distributor since October 1999.
Save time. Save paper. View your next shareholder report online as soon as it’s available. Log into www.dreyfus.com and sign up for Dreyfus eCommunications. It’s simple and only takes a few minutes.
The views expressed in this report reflect those of the portfolio manager only through the end of the period covered and do not necessarily represent the views of Dreyfus or any other person in the Dreyfus organization. Any such views are subject to change at any time based upon market or other conditions and Dreyfus disclaims any responsibility to update such views.These views may not be relied on as investment advice and, because investment decisions for a Dreyfus fund are based on numerous factors, may not be relied on as an indication of trading intent on behalf of any Dreyfus fund.
Not FDIC-Insured • Not Bank-Guaranteed • May Lose Value
| | Contents |
| | THE FUND |
| 2 | A Letter from the Chairman and CEO |
| 3 | Discussion of Fund Performance |
| 6 | Fund Performance |
| 7 | Understanding Your Fund’s Expenses |
| 7 | Comparing Your Fund’s Expenses With Those of Other Funds |
| 8 | Statement of Investments |
| 9 | Statement of Assets and Liabilities |
| 10 | Statement of Operations |
| 11 | Statement of Changes in Net Assets |
| 12 | Financial Highlights |
| 13 | Notes to Financial Statements |
| 24 | Report of Independent Registered Public Accounting Firm |
| 25 | Important Tax Information |
| 26 | Board Members Information |
| 29 | Officers of the Fund |
| | FOR MORE INFORMATION |
| | Back Cover |
Dreyfus
Growth Allocation Fund
The Fund

A LETTER FROM THE CHAIRMAN AND CEO
Dear Shareholder:
We are pleased to present this annual report for Dreyfus Growth Allocation Fund, covering the 12-month period from September 1, 2010, through August 31, 2011. For information about how the fund performed during the reporting period, as well as general market perspectives, we provide a Discussion of Fund Performance on the pages that follow.
Although stocks and higher yielding bonds rallied strongly through the first quarter of 2011 due to expectations of a more robust economic recovery, the reporting period ended amid sharply deteriorating investor sentiment due to disappointing economic data, an escalating sovereign debt crisis in Europe and a contentious debate regarding taxes, spending and borrowing in the United States. In the final month of the reporting period, a major credit rating agency downgraded U.S. long-term debt, marking the first time in history that U.S.Treasury securities were not assigned the highest possible credit rating. Both stocks and bonds proved volatile in this tumultuous environment, as the stalled economy caused securities from economically sensitive market sectors to give back many of the reporting period’s previous gains.
The economic outlook currently is clouded by heightened market volatility and political infighting, but we believe that a sustained, moderate global expansion is more likely than a double-dip recession. Inflationary pressures appear to be waning in most countries, including the United States, as energy prices have retreated from their highs.The Federal Reserve Board has signaled its intention to maintain an aggressively accommodative monetary policy, which may help offset the financial stresses caused by recent fiscal policy choices in the United States and Europe. To assess how these and other developments may affect your investments, we encourage you, as always, to speak with your financial advisor.
Thank you for your continued confidence and support.

Jonathan R. Baum
Chairman and Chief Executive Officer
The Dreyfus Corporation
September 15, 2011
2

DISCUSSION OF FUND PERFORMANCE
For the period of September 1, 2010, through August 31, 2011, as provided by Richard B. Hoey, A. Paul Disdier, Christopher E. Sheldon, CFA, and Keith L. Stransky, CFA, Portfolio Managers
Fund and Market Performance Overview
For the 12-month period ended August 31, 2011, Dreyfus Growth Allocation Fund produced a total return of 12.56%.1 In comparison, the fund’s benchmark, the Standard & Poor’s 500 Composite Stock Price Index produced a total return of 18.48% for the same period. The fund also utilizes a customized blended index composed of 80% Standard & Poor’s 500 Composite Stock Price Index and 20% Barclays Capital U.S. Aggregate Bond Index, and this blended index returned 15.70% for the same period.2 Stocks and higher yielding sectors of the bond market rallied through the first quarter of 2011 amid expectations of continued economic recovery. However, several macroeconomic disappointments later derailed investor sentiment, erasing some of the markets’ previous gains.The fund’s return lagged its benchmarks, primarily due to disappointments among some of the underlying funds’ more economically sensitive holdings.
The Fund’s Investment Approach
Dreyfus Growth Allocation Fund seeks long-term capital appreciation with some consideration for current income. In pursuing its goal, the fund normally allocates 80% of its assets to equity securities and 20% of its assets to fixed income securities.
The fund achieves its targeted asset allocation mix by investing in other mutual funds that are advised by The Dreyfus Corporation (Dreyfus). In turn, the underlying funds invest in a wide range of equity and fixed income securities, including U.S. large-, mid- and small-cap equities; international, global and emerging-market equities; and U.S. and international fixed income securities.
The fund’s portfolio managers, who comprise the Dreyfus Investment Committee, select the underlying funds based on their investment objectives and management policies, portfolio holdings, risk/reward profiles, historical performance and other factors.The fund may invest in any of 31 underlying funds identified by the Dreyfus Investment
DISCUSSION OF FUND PERFORMANCE (continued)
Committee, which generally will select only certain, and not all, of the underlying funds for investment at any given time.
Shifting Sentiment Sparked Heightened Volatility
Investors’ outlooks improved markedly at the start of the reporting period when the Federal Reserve Board announced new measures to jump-start the U.S. economy. Subsequent improvements in economic data and corporate earnings also helped support rising stock prices.The rally was interrupted in February 2011 by political uprisings in the Middle East and again in March by devastating natural and nuclear disasters in Japan, but stock prices bounced back quickly from these unexpected shocks.
Following the S&P’s late April peak, investor sentiment began to wane, before deteriorating in earnest last summer when Greece appeared headed for default on its debt. Global economic data came in below expectations and a contentious debate regarding U.S. government spending and borrowing intensified. Stocks suffered bouts of heightened volatility as investors engaged in a“flight to quality”away from economically sensitive sectors of the stock market and higher yielding sectors of the bond market. In contrast, traditional safe havens, such as U.S.Treasury securities, gained value late in the reporting period.
Cyclical Stocks Dampened Fund Performance
Throughout the reporting period, we maintained a modest emphasis on owning more stocks over bonds, which helped support the fund’s relative performance over the first eight months of the reporting period but proved detrimental over the summer of 2011. However, the fund exhibited less volatility than the overall market, primarily due to its fixed-income allocation.
The fund’s performance compared to its benchmarks also was undermined by the cyclical tilt of some of its underlying equity funds, including Dreyfus Research Growth Fund, Dreyfus U.S. Equity Fund and Dreyfus/The Boston Company Large Cap Core Fund. Dreyfus Strategic Value Fund lagged market averages as value-oriented stocks trailed growth-oriented stocks. The fund achieved better relative results from Dreyfus Appreciation Fund, which benefited from a focus on dividend-paying stocks of large, multinational companies. The fund’s underlying fixed-income funds—Dreyfus Bond Market Index Fund and Dreyfus Total Return Advantage Fund—produced returns that were roughly in line with bond market averages.
4
The Dreyfus Investment Committee made a number of changes to the fund’s investment allocations during the reporting period. In October 2010, 2.5% of the fund’s total assets were shifted from Dreyfus Select Managers Small Cap Value Fund to Dreyfus Small Cap Stock Index Fund. In February 2011, we moved 4% of the fund’s assets to Dreyfus Appreciation Fund. Finally, in July 2011 we shifted 1.8% of assets from Dreyfus International Value Fund to Dreyfus International Equity Fund for a somewhat more defensive asset mix.
Defensive Bias in a Choppy Economic Recovery
We expect a subpar global economic rebound to persist amid significant headwinds over the remainder of 2011 and are monitoring a number of macroeconomic developments, including the sovereign debt crisis in Europe, U.S. federal deficit reduction negotiations and central bank policies worldwide.Therefore, we have maintained a relatively defensive bias in the selection of underlying equity funds, and we have continued to rely on more defensively structured bond funds to help cushion heightened market volatility.
September 15, 2011
| |
| | Equity funds are subject generally to market, market sector, market liquidity, issuer and investment |
| | style risks, among other factors, to varying degrees, all of which are more fully described in the |
| | fund’s prospectus. Stocks of small- and/or midcap companies often experience sharper price |
| | fluctuations than stocks of large-cap companies. |
| | Asset allocation and diversification cannot assure a profit or protect against loss. |
| | The ability of the fund to achieve its investment goal depends, in part, on the ability of the |
| | Dreyfus Investment Committee to allocate effectively the fund’s assets among the asset classes and |
| | the underlying funds.There can be no assurance that the actual allocations will be effective in |
| | achieving the fund’s investment goal.The underlying funds may not achieve their investment |
| | objectives, and their performance may be lower than that of the asset class the underlying funds |
| | were selected to represent. |
| | Bond funds are subject generally to interest rate, credit, liquidity and market risks, to varying degrees, |
| | all of which are more fully described in the fund’s prospectus. Generally, all other factors being equal, |
| | bond prices are inversely related to interest-rate changes, and rate increases can cause price declines. |
| 1 | Total return includes reinvestment of dividends and any capital gains paid. Past performance is no |
| | guarantee of future results. Share price and investment return fluctuate such that upon redemption, |
| | fund shares may be worth more or less than their original cost. Return figure provided reflects the |
| | absorption of certain fund expenses by The Dreyfus Corporation pursuant to an agreement in |
| | effect through January 1, 2012, at which time it may be extended, terminated or modified. Had |
| | these expenses not been absorbed, the fund’s return would have been lower. |
| 2 | SOURCE: LIPPER INC. — Reflects reinvestment of dividends and, where applicable, capital |
| | gain distributions.The Standard & Poor’s 500 Composite Stock Price Index is a widely accepted, |
| | unmanaged index of U.S. stock market performance.The Barclays Capital U.S.Aggregate Bond |
| | Index is a widely accepted, unmanaged total return index of corporate, U.S. government and U.S. |
| | government agency debt instruments, mortgage-backed securities and asset-backed securities with an |
| | average maturity of 1-10 years. Investors cannot invest directly in any index. |
The Fund 5
FUND PERFORMANCE
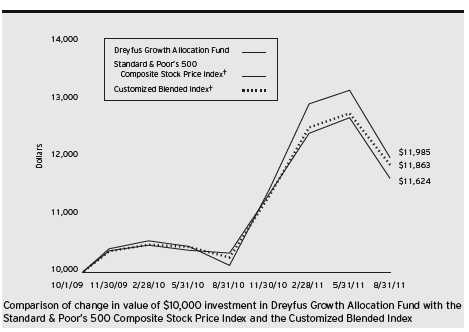
| | | | | |
| Average Annual Total Returns as of 8/31/11 | | | |
| | Inception | | From |
| | Date | 1Year | Inception |
| Fund | 10/1/09 | 12.56% | 8.15% |
| Standard & Poor’s 500 | | | |
| Composite Stock Price Index | 9/30/09 | 18.48% | 9.91%†† |
| Customized Blended Index | 9/30/09 | 15.70% | 9.32%†† |
|
| † Source: Lipper Inc. |
| Past performance is not predictive of future performance.The fund’s performance shown in the graph and table does not |
| reflect the deduction of taxes that a shareholder would pay on fund distributions or the redemption of fund shares. |
| The above graph compares a $10,000 investment made in Dreyfus Growth Allocation Fund on 10/1/09 (inception |
| date) to a $10,000 investment made in two different indices: (1) the Standard & Poor’s 500 Composite Stock Price |
| Index (the “S&P 500 Index”) and (2) the Customized Blended Index.The Customized Blended Index is calculated |
| on a year-to-date basis.All dividends and capital gain distributions are reinvested. |
| The fund’s performance shown in the line graph above takes into account all applicable fees and expenses.The S&P 500 |
| Index is a widely accepted, unmanaged index of U.S. stock market performance.The Customized Blended Index is |
| composed of the S&P 500 Index, 80%, and the Barclays Capital U.S.Aggregate Bond Index (the “Barclays Index”), |
| 20%.The Barclays Index is a widely accepted, unmanaged index of corporate, government and government agency debt |
| instruments, mortgage-backed securities and asset-backed securities with an average maturity of 1-10 years. Unlike a |
| mutual fund, the indices are not subject to charges, fees and other expenses. Investors cannot invest directly in any index. |
| Further information relating to fund performance, including expense reimbursements, if applicable, is contained in the |
| Financial Highlights section of the prospectus and elsewhere in this report. |
| †† For comparative purposes, the value of each index on 9/30/09 is used as the beginning value on 10/1/09. |
6
UNDERSTANDING YOUR FUND’S EXPENSES (Unaudited)
As a mutual fund investor, you pay ongoing expenses, such as management fees and other expenses. Using the information below, you can estimate how these expenses affect your investment and compare them with the expenses of other funds.You also may pay one-time transaction expenses, including sales charges (loads) and redemption fees, which are not shown in this section and would have resulted in higher total expenses. For more information, see your fund’s prospectus or talk to your financial adviser.
Review your fund’s expenses
The table below shows the expenses you would have paid on a $1,000 investment in Dreyfus Growth Allocation Fund from March 1, 2011 to August 31, 2011. It also shows how much a $1,000 investment would be worth at the close of the period, assuming actual returns and expenses.
| | |
| Expenses and Value of a $1,000 Investment |
| assuming actual returns for the six months ended August 31, 2011 |
| |
| Expenses paid per $1,000† | $ | 3.03 |
| Ending value (after expenses) | $ | 936.70 |
|
| COMPARING YOUR FUND’S EXPENSES |
| WITH THOSE OF OTHER FUNDS (Unaudited) |
Using the SEC’s method to compare expenses
The Securities and Exchange Commission (SEC) has established guidelines to help investors assess fund expenses. Per these guidelines, the table below shows your fund’s expenses based on a $1,000 investment, assuming a hypothetical 5% annualized return. You can use this information to compare the ongoing expenses (but not transaction expenses or total cost) of investing in the fund with those of other funds.All mutual fund shareholder reports will provide this information to help you make this comparison. Please note that you cannot use this information to estimate your actual ending account balance and expenses paid during the period.
| | |
| Expenses and Value of a $1,000 Investment |
| assuming a hypothetical 5% annualized return for the six months ended August 31, 2011 |
| |
| Expenses paid per $1,000† | $ | 3.16 |
| Ending value (after expenses) | $ | 1,022.08 |
† Expenses are equal to the fund’s annualized expense ratio of .62% ,multiplied by the average account value over the period, multiplied by 184/365 (to reflect the one-half year period).
|
| STATEMENT OF INVESTMENTS |
| August 31, 2011 |
| | | |
| Registered Investment Companies—99.7% | Shares | Value ($) |
| Dreyfus Appreciation Fund | 14,071a | 555,679 |
| Dreyfus Bond Market Index Fund, Basic Shares | 80,830a | 881,861 |
| Dreyfus Emerging Markets Debt Local Currency Fund, Cl. I | 17,056a | 260,950 |
| Dreyfus Emerging Markets Fund, Cl. I | 37,713a | 443,884 |
| Dreyfus Global Absolute Return Fund, Cl. I | 93,016a,b | 1,112,477 |
| Dreyfus Global Real Estate Securities Fund, Cl. I | 80,216a | 581,567 |
| Dreyfus High Yield Fund, Cl. I | 39,133a | 244,974 |
| Dreyfus International Bond Fund, Cl. I | 14,913a | 259,336 |
| Dreyfus International Equity Fund, Cl. I | 7,826a | 207,925 |
| Dreyfus International Stock Index Fund | 24,355a | 340,724 |
| Dreyfus International Value Fund, Cl. I | 16,857a | 179,861 |
| Dreyfus Opportunistic Midcap Value Fund, Cl. I | 9,514a,b | 296,945 |
| Dreyfus Research Growth Fund, Cl. Z | 127,103a | 1,129,942 |
| Dreyfus S&P Stars Opportunities Fund, Cl. I | 13,872a | 302,138 |
| Dreyfus Small Cap Stock Index Fund | 15,981a | 313,224 |
| Dreyfus Strategic Value Fund, Cl. I | 57,739a | 1,518,530 |
| Dreyfus Total Return Advantage Fund, Cl. I | 65,097a | 882,063 |
| Dreyfus U.S. Equity Fund, Cl. I | 62,800a | 847,800 |
| Dreyfus/Newton International Equity Fund, Cl. I | 20,852a | 349,898 |
| Dreyfus/The Boston Company Large Cap Core Fund, Cl. I | 24,817a | 807,548 |
| Dreyfus/The Boston Company | | |
| Small/Mid Cap Growth Fund, Cl. I | 22,666a,b | 315,964 |
| International Stock Fund, Cl. I | 21,835a | 291,061 |
| |
| Total Investments (cost $11,970,332) | 99.7% | 12,124,351 |
| Cash and Receivables (Net) | .3% | 31,761 |
| Net Assets | 100.0% | 12,156,112 |
| |
| a | Investment in affiliated mutual fund. |
| b | Non-income producing security. |
| | | |
| Portfolio Summary (Unaudited)† | | |
| | Value (%) | | Value (%) |
| Mutual Funds: Domestic | 66.6 | Mutual Funds: Foreign | 33.1 |
| | | | 99.7 |
| † Based on net assets. | | | |
| See notes to financial statements. | | | |
8
|
| STATEMENT OF ASSETS AND LIABILITIES |
| August 31, 2011 |
| | |
| | Cost | Value |
| Assets ($): | | |
| Investments in affiliated issuers—See Statement of | | |
| Investments—Note 1(c) | 11,970,332 | 12,124,351 |
| Cash | | 65,622 |
| Prepaid expenses | | 12,393 |
| | | 12,202,366 |
| Liabilities ($): | | |
| Due to The Dreyfus Corporation and affiliates—Note 3(b) | | 2,140 |
| Accrued expenses | | 44,114 |
| | | 46,254 |
| Net Assets ($) | | 12,156,112 |
| Composition of Net Assets ($): | | |
| Paid-in capital | | 11,957,614 |
| Accumulated undistributed investment income—net | | 29,282 |
| Accumulated net realized gain (loss) on investments | | 15,197 |
| Accumulated net unrealized appreciation | | |
| (depreciation) on investments | | 154,019 |
| Net Assets ($) | | 12,156,112 |
| Shares Outstanding | | |
| (100 million shares of $.001 par value Common Stock authorized) | | 855,174 |
| Net Asset Value, offering and redemption price per share ($) | | 14.21 |
| |
| See notes to financial statements. | | |
|
| STATEMENT OF OPERATIONS |
| Year Ended August 31, 2011 |
| | |
| Investment Income ($): | |
| Income: | |
| Cash dividends from affiliated issuers | 123,596 |
| Expenses: | |
| Auditing fees | 40,239 |
| Shareholder servicing costs—Note 3(b) | 32,828 |
| Registration fees | 20,075 |
| Prospectus and shareholders’ reports | 9,805 |
| Custodian fees—Note 3(b) | 3,186 |
| Directors’ fees and expenses—Note 3(c) | 3,026 |
| Loan commitment fees—Note 2 | 128 |
| Miscellaneous | 11,544 |
| Total Expenses | 120,831 |
| Less—expense reimbursement from The Dreyfus | |
| Corporation due to undertaking—Note 3(a) | (57,502) |
| Less—waiver of shareholder servicing fees—Note 3(b) | (2,469) |
| Less—reduction in fees due to earnings credits—Note 3(b) | (42) |
| Net Expenses | 60,818 |
| Investment Income—Net | 62,778 |
| Realized and Unrealized Gain (Loss) on Investments—Note 4 ($): | |
| Net realized gain (loss) on investments in affiliated issuers | 18,018 |
| Capital gain distributions from affiliated issuers | 76,683 |
| Net Realized Gain (Loss) | 94,701 |
| Net unrealized appreciation (depreciation) on investments in affiliated issuers | 286,127 |
| Net Realized and Unrealized Gain (Loss) on Investments | 380,828 |
| Net Increase in Net Assets Resulting from Operations | 443,606 |
| |
| See notes to financial statements. | |
10
STATEMENT OF CHANGES IN NET ASSETS
| | | | |
| | Year Ended August 31, |
| | 2011 | 2010a |
| Operations ($): | | |
| Investment income—net | 62,778 | 27,895 |
| Net realized gain (loss) on | | |
| investments in affiliated issuers | 94,701 | (12,802) |
| Net unrealized appreciation (depreciation) | | |
| on investments in affiliated issuers | 286,127 | (132,108) |
| Net Increase (Decrease) in Net Assets | | |
| Resulting from Operations | 443,606 | (117,015) |
| Dividends to Shareholders from ($): | | |
| Investment income—net | (65,004) | (23,500) |
| Net realized gain on investments | (40,394) | — |
| Total Dividends | (105,398) | (23,500) |
| Capital Stock Transactions ($): | | |
| Net proceeds from shares sold | 8,550,184 | 6,236,789 |
| Dividends reinvested | 99,785 | 23,218 |
| Cost of shares redeemed | (2,133,171) | (818,386) |
| Increase (Decrease) in Net Assets | | |
| from Capital Stock Transactions | 6,516,798 | 5,441,621 |
| Total Increase (Decrease) in Net Assets | 6,855,006 | 5,301,106 |
| Net Assets ($): | | |
| Beginning of Period | 5,301,106 | — |
| End of Period | 12,156,112 | 5,301,106 |
| Undistributed investment income—net | 29,282 | 6,343 |
| Capital Share Transactions (Shares): | | |
| Shares sold | 581,902 | 476,752 |
| Shares issued for dividends reinvested | 6,830 | 1,789 |
| Shares redeemed | (148,214) | (63,885) |
| Net Increase (Decrease) in Shares Outstanding | 440,518 | 414,656 |
| a From October 1, 2009 (commencement of operations) to August 31, 2010. | |
| See notes to financial statements. | | |
FINANCIAL HIGHLIGHTS
The following table describes the performance for the fiscal periods indicated. Total return shows how much your investment in the fund would have increased (or decreased) during each period, assuming you had reinvested all dividends and distributions.These figures have been derived from the fund’s financial statements.
| | | | |
| | Year Ended August 31, |
| | 2011 | 2010a |
| Per Share Data ($): | | |
| Net asset value, beginning of period | 12.78 | 12.50 |
| Investment Operations: | | |
| Investment income—netb | .10 | .10 |
| Net realized and unrealized | | |
| gain (loss) on investments | 1.51 | .31 |
| Total from Investment Operations | 1.61 | .41 |
| Distributions: | | |
| Dividends from investment income—net | (.11) | (.13) |
| Dividends from net realized gain on investments | (.07) | — |
| Total Distributions | (.18) | (.13) |
| Net asset value, end of period | 14.21 | 12.78 |
| Total Return (%) | 12.56 | 3.26c |
| Ratios/Supplemental Data (%): | | |
| Ratio of total expenses to average net assetsd | 1.26 | 3.33e |
| Ratio of net expenses to average net assetsd | .63 | .57e |
| Ratio of net investment income | | |
| to average net assetsd | .65 | .85e |
| Portfolio Turnover Rate | 21.83 | 45.65c |
| Net Assets, end of period ($ x 1,000) | 12,156 | 5,301 |
| |
| a | From October 1, 2009 (commencement of operations) to August 31, 2010. |
| b | Based on average shares outstanding at each month end. |
| c | Not annualized. |
| d | Amounts do not include the activity of the underlying funds. |
| e | Annualized. |
| See notes to financial statements. |
12
NOTES TO FINANCIAL STATEMENTS
NOTE 1—Significant Accounting Policies:
Dreyfus Growth Allocation Fund (the “fund”) is a separate diversified series of Dreyfus Strategic Funds, Inc. (the “Company”), which is registered under the Investment Company Act of 1940, as amended (the “Act”), as an open-end management investment company and operates as a series company currently offering ten series, including the fund.The fund’s investment objective is to seek long-term capital appreciation with some consideration for current income.The Dreyfus Corporation (the “Manager” or “Dreyfus”), a wholly-owned subsidiary of The Bank of NewYork Mellon Corporation (“BNY Mellon”), serves as the fund’s investment adviser. MBSC Securities Corporation (the “Distributor”), a wholly-owned subsidiary of the Manager, is the distributor of the fund’s shares, which are sold to the public without a sales charge.
The Company accounts separately for the assets, liabilities and operations of each series. Expenses directly attributable to each series are charged to that series’ operations; expenses which are applicable to all series are allocated among them on a pro rata basis.
The Financial Accounting Standards Board (“FASB”) Accounting Standards Codification (“ASC”) is the exclusive reference of authoritative U.S. generally accepted accounting principles (“GAAP”) recognized by the FASB to be applied by nongovernmental entities. Rules and interpretive releases of the Securities and Exchange Commission (“SEC”) under authority of federal laws are also sources of authoritative GAAP for SEC registrants. The fund’s financial statements are prepared in accordance with GAAP, which may require the use of management estimates and assumptions.Actual results could differ from those estimates.
The Company enters into contracts that contain a variety of indemnifications. The fund’s maximum exposure under these arrangements is unknown.The fund does not anticipate recognizing any loss related to these arrangements.
NOTES TO FINANCIAL STATEMENTS (continued)
(a) Portfolio valuation: The fair value of a financial instrument is the amount that would be received to sell an asset or paid to transfer a liability in an orderly transaction between market participants at the measurement date (i.e. the exit price). GAAP establishes a fair value hierarchy that prioritizes the inputs of valuation techniques used to measure fair value.This hierarchy gives the highest priority to unadjusted quoted prices in active markets for identical assets or liabilities (Level 1 measurements) and the lowest priority to unobservable inputs (Level 3 measurements).
Additionally, GAAP provides guidance on determining whether the volume and activity in a market has decreased significantly and whether such a decrease in activity results in transactions that are not orderly. GAAP requires enhanced disclosures around valuation inputs and techniques used during annual and interim periods.
Various inputs are used in determining the value of the fund’s investments relating to fair value measurements.These inputs are summarized in the three broad levels listed below:
Level 1—unadjusted quoted prices in active markets for identical investments.
Level 2—other significant observable inputs (including quoted prices for similar investments, interest rates, prepayment speeds, credit risk, etc.).
Level 3—significant unobservable inputs (including the fund’s own assumptions in determining the fair value of investments).
The inputs or methodology used for valuing securities are not necessarily an indication of the risk associated with investing in those securities.
Investments are valued at the net asset value of each underlying fund determined as of the close of the NewYork Stock Exchange (generally 4 p.m., Eastern time) on the valuation date and are generally categorized as Level 1 in the hierarchy.
14
The following is a summary of the inputs used as of August 31, 2011 in valuing the fund’s investments:
| | | | |
| | | Level 2—Other | Level 3— | |
| | Level 1— | Significant | Significant | |
| | Unadjusted | Observable | Unobservable | |
| | Quoted Prices | Inputs | Inputs | Total |
| Assets ($) | | | | |
| Investments in Securities: | | | |
| Mutual Funds | 12,124,351 | — | — | 12,124,351 |
In January 2010, FASB issued Accounting Standards Update (“ASU”) No. 2010-06 “Improving Disclosures about FairValue Measurements” (“ASU 2010-06”). The portions of ASU 2010-06 which require reporting entities to prepare new disclosures surrounding amounts and reasons for significant transfers in and out of Level 1 and Level 2 fair value measurements as well as inputs and valuation techniques used to measure fair value for both recurring and nonrecurring fair value measurements that fall in either Level 2 or Level 3 have been adopted by the fund. No significant transfers between Level 1 or Level 2 fair value measurements occurred at August 31, 2011.
In May 2011, FASB issued ASU No. 2011-04 “Amendments to Achieve Common Fair Value Measurement and Disclosure Requirements in GAAP and International Financial Reporting Standards (“IFRS”)” (“ASU 2011-04”). ASU 2011-04 includes common requirements for measurement of and disclosure about fair value between GAAP and IFRS. ASU 2011-04 will require reporting entities to disclose the following information for fair value measurements categorized within Level 3 of the fair value hierarchy: quantitative information about the unobservable inputs used in the fair value measurement, the valuation processes used by the reporting entity and a narrative description of the sensitivity of the fair value measurement to changes in unobservable inputs and the interrelationships between those unobservable inputs. In
NOTES TO FINANCIAL STATEMENTS (continued)
addition, ASU 2011-04 will require reporting entities to make disclosures about amounts and reasons for all transfers in and out of Level 1 and Level 2 fair value measurements.The new and revised disclosures are effective for interim and annual reporting periods beginning after December 15, 2011. At this time, management is evaluating the implications of ASU 2011-04 and its impact on the financial statements.
(b) Securities transactions and investment income: Securities transactions are recorded on a trade date basis. Realized gains and losses from securities transactions are recorded on the identified cost basis. Dividend income is recognized on the ex-dividend date and interest income, including, where applicable, accretion of discount and amortization of premium on investments, is recognized on the accrual basis.
(c) Affiliated issuers: Investments in other investment companies advised by Dreyfus are defined as “affiliated” in the Act.
The fund may invest in shares of certain affiliated investment companies also advised or managed by Dreyfus. Investments in affiliated investment companies for the period ended August 31, 2011 were as follows:
| | | | | | |
| Affiliated | | | | | | |
| Investment | Value | | | | Net Realized | |
| Company | 8/31/2010 | ($) | Purchases ($)† | Sales ($) | Gain (Loss) ($) | |
| Dreyfus | | | | | | |
| Appreciation Fund | — | | 574,648 | 21,169 | (423 | ) |
| Dreyfus Bond Market | | | | | | |
| Index Fund, | | | | | | |
| Basic Shares | 400,229 | | 554,703 | 89,066 | (879 | ) |
| Dreyfus Emerging | | | | | | |
| Markets Debt Local | | | | | | |
| Currency Fund, Cl. I | 112,728 | | 159,478 | 25,448 | (165 | ) |
| Dreyfus Emerging | | | | | | |
| Markets Fund, Cl. I | 213,747 | | 305,968 | 50,894 | (1,088 | ) |
| Dreyfus Global | | | | | | |
| Absolute Return | | | | | | |
| Fund, Cl. I | 511,040 | | 752,436 | 119,346 | (1,846 | ) |
| Dreyfus Global Real | | | | | | |
| Estate Securities | | | | | | |
| Fund, Cl. I | 257,047 | | 367,989 | 58,783 | 7 | |
| Dreyfus High Yield | | | | | | |
| Fund, Cl. I | 113,621 | | 167,755 | 25,448 | (458 | ) |
16
| | | | | | |
| Affiliated | | | | | | |
| Investment | Value | | | | Net Realized | |
| Company | 8/31/2010 | ($) | Purchases ($)† | Sales ($) | Gain (Loss) ($) | |
| Dreyfus International | | | | | | |
| Bond Fund, Cl. I | 111,275 | | 162,450 | 25,447 | (451 | ) |
| Dreyfus International | | | | | | |
| Equity Fund, Cl. I | — | | 237,237 | 1,558 | (192 | ) |
| Dreyfus International | | | | | | |
| Stock Index Fund | 149,647 | | 232,845 | 38,170 | (1,282 | ) |
| Dreyfus International | | | | | | |
| Value Fund, Cl. I | 177,010 | | 269,009 | 273,128 | (517 | ) |
| Dreyfus Opportunistic | | | | | | |
| Midcap Value | | | | | | |
| Fund, Cl. I | 131,363 | | 189,969 | 31,810 | (930 | ) |
| Dreyfus Research | | | | | | |
| Growth Fund, Cl. Z | 694,009 | | 848,794 | 563,229 | 19,361 | |
| Dreyfus S&P Stars | | | | | | |
| Opportunities | | | | | | |
| Fund, Cl. I | 128,045 | | 190,050 | 31,810 | (800 | ) |
| Dreyfus Select | | | | | | |
| Managers Small Cap | | | | | | |
| Value Fund, Cl. I | 130,242 | | 26,711 | 180,304 | 20,430 | |
| Dreyfus Small Cap | | | | | | |
| Stock Index Fund | — | | 334,267 | 16,498 | (572 | ) |
| Dreyfus Strategic | | | | | | |
| Value Fund, Cl. I | 657,742 | | 1,011,075 | 167,950 | (6,181 | ) |
| Dreyfus Total | | | | | | |
| Return Advantage | | | | | | |
| Fund, Cl. I | 401,847 | | 574,980 | 89,065 | (2,221 | ) |
| Dreyfus U.S. Equity | | | | | | |
| Fund, Cl. I | 344,228 | | 520,220 | 86,520 | (2,068 | ) |
| Dreyfus/Newton | | | | | | |
| International | | | | | | |
| Equity Fund, Cl. I | 154,597 | | 233,753 | 38,171 | (668 | ) |
| Dreyfus/The Boston | | | | | | |
| Company Large Cap | | | | | | |
| Core Fund, Cl. I | 349,054 | | 521,058 | 86,520 | (253 | ) |
| Dreyfus/The Boston | | | | | | |
| Company | | | | | | |
| Small/Mid Cap | | | | | | |
| Growth Fund, Cl. I | 128,860 | | 189,968 | 31,809 | (775 | ) |
| International Stock | | | | | | |
| Fund, Cl. I | 127,221 | | 183,970 | 30,536 | (11 | ) |
| | 5,293,552 | | 8,609,333 | 2,082,679 | 18,018 | |
| |
| † Includes reinvested dividends/distributions. | | | | | |
NOTES TO FINANCIAL STATEMENTS (continued)
| | | | | | | |
| | Change in Net | | | | | |
| Affiliated | | Unrealized | | | | | |
| Investment | | Appreciation | | Value | | Net | Dividends/ |
| Company | (Depreciation) ($) | | 8/31/2011 | ($) | Assets (%) | Distributions ($) |
| Dreyfus | | | | | | | |
| Appreciation Fund | 2,623 | | 555,679 | | 4.6 | 73 |
| Dreyfus Bond Market | | | | | | |
| Index Fund, | | | | | | | |
| Basic Shares | | 16,874 | | 881,861 | | 7.3 | 23,889 |
| Dreyfus Emerging | | | | | | |
| Markets Debt Local | | | | | | |
| Currency Fund, Cl. I | 14,357 | | 260,950 | | 2.1 | 7,504 |
| Dreyfus Emerging | | | | | | |
| Markets Fund, Cl. I | (23,849 | ) | 443,884 | | 3.6 | 2,019 |
| Dreyfus Global Absolute | | | | | | |
| Return Fund, Cl. I | (29,807 | ) | 1,112,477 | | 9.2 | 39,676 |
| Dreyfus Global Real | | | | | | |
| Estate Securities | | | | | | |
| Fund, Cl. I | | 15,307 | | 581,567 | | 4.8 | 16,928 |
| Dreyfus High Yield | | | | | | |
| Fund, Cl. I | | (10,496 | ) | 244,974 | | 2.0 | 15,781 |
| Dreyfus International | | | | | | |
| Bond Fund, Cl. I | 11,509 | | 259,336 | | 2.1 | 9,378 |
| Dreyfus International | | | | | | |
| Equity Fund, Cl. I | (27,562 | ) | 207,925 | | 1.7 | — |
| Dreyfus International | | | | | | |
| Stock Index Fund | (2,316 | ) | 340,724 | | 2.8 | 4,883 |
| Dreyfus International | | | | | | |
| Value Fund, Cl. I | 7,487 | | 179,861 | | 1.5 | 3,811 |
| Dreyfus Opportunistic | | | | | | |
| Midcap Value | | | | | | | |
| Fund, Cl. I | | 8,353 | | 296,945 | | 2.4 | — |
| Dreyfus Research | | | | | | |
| Growth Fund, Cl. Z | 131,007 | | 1,129,942 | | 9.3 | 3,884 |
| Dreyfus S&P Stars | | | | | | |
| Opportunities | | | | | | | |
| Fund, Cl. I | | 16,653 | | 302,138 | | 2.5 | 82 |
| Dreyfus Select Managers | | | | | | |
| Small Cap Value | | | | | | |
| Fund, Cl. I | | 2,921 | | — | | — | — |
| Dreyfus Small Cap | | | | | | |
| Stock Index Fund | (3,973 | ) | 313,224 | | 2.6 | 6,016 |
| Dreyfus Strategic | | | | | | |
| Value Fund, Cl. I | 23,844 | | 1,518,530 | | 12.5 | 8,043 |
| Dreyfus Total Return | | | | | | |
| Advantage Fund, Cl. I | (3,478 | ) | 882,063 | | 7.2 | 43,069 |
| Dreyfus U.S. Equity | | | | | | |
| Fund, Cl. I | | 71,940 | | 847,800 | | 7.0 | 3,506 |
18
| | | | | |
| | Change in Net | | | | |
| Affiliated | Unrealized | | | | |
| Investment | Appreciation | Value | | Net | Dividends/ |
| Company | (Depreciation) ($) | 8/31/2011 | ($) | Assets (%) | Distributions ($) |
| Dreyfus/Newton | | | | | |
| International | | | | | |
| Equity Fund, Cl. I | 387 | 349,898 | | 2.9 | 5,791 |
| Dreyfus/The Boston | | | | | |
| Company Large Cap | | | | |
| Core Fund, Cl. I | 24,209 | 807,548 | | 6.6 | 4,345 |
| Dreyfus/The Boston | | | | | |
| Company | | | | | |
| Small/Mid Cap | | | | | |
| Growth Fund, Cl. I | 29,720 | 315,964 | | 2.6 | — |
| International Stock | | | | | |
| Fund, Cl. I | 10,417 | 291,061 | | 2.4 | 1,601 |
| | 286,127 | 12,124,351 | | 99.7 | 200,279 |
(d) Dividends to shareholders: Dividends are recorded on the ex-dividend date. Dividends from investment income-net and dividends from net realized capital gains, if any, are normally declared and paid annually, but the fund may make distributions on a more frequent basis to comply with the distribution requirements of the Internal Revenue Code of 1986, as amended (the “Code”).To the extent that net realized capital gains can be offset by capital loss carryovers, it is the policy of the fund not to distribute such gains. Income and capital gain distributions are determined in accordance with income tax regulations, which may differ from GAAP.
(e) Federal income taxes: It is the policy of the fund to continue to qualify as a regulated investment company, if such qualification is in the best interests of its shareholders, by complying with the applicable provisions of the Code, and to make distributions of taxable income sufficient to relieve it from substantially all federal income and excise taxes.
As of and during the period ended August 31, 2011, the fund did not have any liabilities for any uncertain tax positions.The fund recognizes interest and penalties, if any, related to uncertain tax positions as income tax expense in the Statement of Operations. During the period, the fund did not incur any interest or penalties.
NOTES TO FINANCIAL STATEMENTS (continued)
Each of the tax years in the two-year period ended August 31, 2011 remains subject to examination by the Internal Revenue Service and state taxing authorities.
At August 31, 2011, the components of accumulated earnings on a tax basis were as follows: undistributed ordinary income $62,913, undistributed capital gains $57,814 and unrealized appreciation $77,771.
The tax character of distributions paid to shareholders during the fiscal periods ended August 31, 2011 and August 31, 2010 were as follows: ordinary income $104,112 and $23,500 and long-term capital gains $1,286 and $0, respectively.
During the period ended August 31, 2011, as a result of permanent book to tax differences, primarily due to the tax treatment for the reclass of short-term capital gain distributions from regulated investment company holdings, the fund increased accumulated undistributed investment income-net by $25,165, decreased accumulated net realized gain (loss) on investments by $24,574 and decreased paid-in capital by $591. Net assets and net asset value per share were not affected by this reclassification.
NOTE 2—Bank Lines of Credit:
The fund participates with other Dreyfus-managed funds in a $225 million unsecured credit facility led by Citibank, N.A. and a $300 million unsecured credit facility provided by The Bank of New York Mellon, a subsidiary of BNY Mellon and an affiliate of Dreyfus (each, a “Facility”), each to be utilized primarily for temporary or emergency purposes, including the financing of redemptions. In connection therewith, the fund has agreed to pay its pro rata portion of commitment fees for each Facility. Interest is charged to the fund based on rates determined pursuant to the terms of the respective Facility at the time of borrowing. During the period ended on August 31, 2011, the fund did not borrow under the Facilities.
20
NOTE 3—Management Fee and Other Transactions with Affiliates:
(a) Pursuant to a management agreement with the Manager, there is no management fee paid to the Manager. The fund invests in other mutual funds advised by the Manager. All fees and expenses of the underlying funds are reflected in the underlying fund’s net asset value.
The Manager has contractually agreed, until January 1, 2012, to assume the expenses of the fund so that the total annual fund and underlying funds’ operating expenses (excluding taxes, interest, brokerage commissions, commitment fees on borrowings and extraordinary expenses) do not exceed 1.50% of the value of the fund’s average daily net assets. The expense reimbursement, pursuant to the undertaking, amounted to $57,502 during the period ended August 31, 2011.
(b) Under the Shareholder Services Plan, the fund pays the Distributor at an annual rate of .25% of the value of the fund’s average daily net assets for the provision of certain services. The services provided may include personal services relating to shareholder accounts, such as answering shareholder inquiries regarding the fund shares and providing reports and other information, and services related to the maintenance of shareholder accounts.The Distributor may make payments to Service Agents (a securities dealer, financial institution or other industry professional) in respect of these services. The Distributor determines the amounts to be paid to Service Agents. Fees paid to the Distributor will be waived to the extent that the fund invests in an underlying affiliated fund with a shareholder services plan. During the period ended August 31, 2011, the fund was charged $23,972 pursuant to the Shareholder Services Plan of which $2,469 was waived due to the fund’s investment in certain of the underlying funds.
NOTES TO FINANCIAL STATEMENTS (continued)
The fund compensates Dreyfus Transfer, Inc., a wholly-owned subsidiary of the Manager, under a transfer agency agreement for providing personnel and facilities to perform transfer agency services for the fund. During the period ended August 31, 2011, the fund was charged $5,751 pursuant to the transfer agency agreement, which is included in Shareholder servicing costs in the Statement of Operations.
The fund has arrangements with the custodian and cash management bank whereby the fund may receive earnings credits when positive cash balances are maintained, which are used to offset custody and cash management fees. For financial reporting purposes, the fund includes net earnings credits as an expense offset in the Statement of Operations.
The fund compensates The Bank of New York Mellon under a cash management agreement for performing cash management services related to fund subscriptions and redemptions. During the period ended August 31, 2011, the fund was charged $1,025 pursuant to the cash management agreement, which is included in Shareholder servicing costs in the Statement of Operations.These fees were partially offset by earnings credits of $42.
The fund also compensates The Bank of New York Mellon under a custody agreement for providing custodial services for the fund. During the period ended August 31, 2011, the fund was charged $3,186 pursuant to the custody agreement.
During the period ended August 31, 2011, the fund was charged $7,225 for services performed by the Chief Compliance Officer.
The components of “Due to The Dreyfus Corporation and affiliates” in the Statement of Assets and Liabilities consist of: shareholder services plan fees $2,496, custodian fees $602, chief compliance officer fees $3,253 and transfer agency per account fees $1,065, which are offset against an expense reimbursement currently in effect in the amount of $5,276.
22
(c) Each Board member also serves as a Board member of other funds within the Dreyfus complex. Annual retainer fees and attendance fees are allocated to each fund based on net assets.
NOTE 4—Securities Transactions:
The aggregate amount of purchases and sales of investment securities, excluding short-term securities, during the period ended August 31, 2011, amounted to $8,609,333 and $2,082,679, respectively.
At August 31, 2011, the cost of investments for federal income tax purposes was $12,046,580; accordingly, accumulated net unrealized appreciation on investments was $77,771, consisting of $288,936 gross unrealized appreciation and $211,165 gross unrealized depreciation.
|
| REPORT OF INDEPENDENT REGISTERED |
| PUBLIC ACCOUNTING FIRM |
Shareholders and Board of Directors
Dreyfus Growth Allocation Fund
We have audited the accompanying statement of assets and liabilities, including the statement of investments, of Dreyfus Growth Allocation Fund (one of the series comprising Strategic Funds, Inc.) as of August 31, 2011, and the related statement of operations for the year then ended, and the statement of changes in net assets and financial highlights for the year then ended and for the period from October 1, 2009 (commencement of operations) to August 31, 2010. These financial statements and financial highlights are the responsibility of the Fund’s management. Our responsibility is to express an opinion on these financial statements and financial highlights based on our audits.
We conducted our audits in accordance with the standards of the Public Company Accounting Oversight Board (United States).Those standards require that we plan and perform the audit to obtain reasonable assurance about whether the financial statements and financial highlights are free of material misstatement.We were not engaged to perform an audit of the Fund’s internal control over financial reporting. Our audits included consideration of internal control over financial reporting as a basis for designing audit procedures that are appropriate in the circumstances, but not for the purpose of expressing an opinion on the effectiveness of the Fund’s internal control over financial reporting. Accordingly, we express no such opinion. An audit also includes examining, on a test basis, evidence supporting the amounts and disclosures in the financial statements and financial highlights, assessing the accounting principles used and significant estimates made by management, and evaluating the overall financial statement presentation. Our procedures included confirmation of securities owned as of August 31, 2011 by correspondence with the custodian and others.We believe that our audits provide a reasonable basis for our opinion.
In our opinion, the financial statements and financial highlights referred to above present fairly, in all material respects, the financial position of Dreyfus Growth Allocation Fund at August 31, 2011, the results of its operations for the year then ended and the changes in its net assets and the financial highlights for the year then ended and for the period from October 1, 2009 to August 31, 2010, in conformity with U.S. generally accepted accounting principles.

New York, New York
October 27, 2011
24
IMPORTANT TAX INFORMATION (Unaudited)
For federal tax purposes, the fund hereby designates 88.17% of the ordinary dividends paid during the fiscal year ended August 31, 2011 as qualifying for the corporate dividends received deduction.Also certain dividends paid by the fund may be subject to a maximum tax rate of 15%, as provided for by the Jobs and GrowthTax Relief Reconciliation Act of 2003. Of the distributions paid during the fiscal year, $88,578 represents the maximum amount that may be considered qualified dividend income.The fund also hereby designates $.0669 per share as a short-term capital gain distribution and $.0022 per share as a long-term capital gain distribution paid on December 31, 2010. Shareholders will receive notification in early 2012 of the percentage applicable to the preparation of their 2011 income tax returns.
OFFICERS OF THE FUND (Unaudited)
BRADLEY J. SKAPYAK, President since January 2010.
Chief Operating Officer and a director of the Manager since June 2009. From April 2003 to June 2009, Mr. Skapyak was the head of the Investment Accounting and Support Department of the Manager. He is an officer of 75 investment companies (comprised of 167 portfolios) managed by the Manager. He is 52 years old and has been an employee of the Manager since February 1988.
MICHAEL A. ROSENBERG, Vice President and Secretary since August 2005.
Assistant General Counsel of BNY Mellon, and an officer of 76 investment companies (comprised of 192 portfolios) managed by the Manager. He is 51 years old and has been an employee of the Manager since October 1991.
KIESHA ASTWOOD, Vice President and Assistant Secretary since January 2010.
Counsel of BNY Mellon, and an officer of 76 investment companies (comprised of 192 portfolios) managed by the Manager. She is 38 years old and has been an employee of the Manager since July 1995.
JAMES BITETTO, Vice President and Assistant Secretary since August 2005.
Senior Counsel of BNY Mellon and Secretary of the Manager, and an officer of 76 investment companies (comprised of 192 portfolios) managed by the Manager. He is 45 years old and has been an employee of the Manager since December 1996.
JONI LACKS CHARATAN, Vice President and Assistant Secretary since August 2005.
Senior Counsel of BNY Mellon, and an officer of 76 investment companies (comprised of 192 portfolios) managed by the Manager. She is 55 years old and has been an employee of the Manager since October 1988.
JOSEPH M. CHIOFFI, Vice President and Assistant Secretary since August 2005.
Senior Counsel of BNY Mellon, and an officer of 76 investment companies (comprised of 192 portfolios) managed by the Manager. He is 49 years old and has been an employee of the Manager since June 2000.
KATHLEEN DENICHOLAS, Vice President and Assistant Secretary since January 2010.
Managing Counsel of BNY Mellon, and an officer of 76 investment companies (comprised of 192 portfolios) managed by the Manager. She is 36 years old and has been an employee of the Manager since February 2001.
JANETTE E. FARRAGHER, Vice President and Assistant Secretary since August 2005.
Assistant General Counsel of BNY Mellon, and an officer of 76 investment companies (comprised of 192 portfolios) managed by the Manager. She is 48 years old and has been an employee of the Manager since February 1984.
JOHN B. HAMMALIAN, Vice President and Assistant Secretary since August 2005.
Senior Managing Counsel of BNY Mellon, and an officer of 76 investment companies (comprised of 192 portfolios) managed by the Manager. He is 48 years old and has been an employee of the Manager since February 1991.
M. CRISTINA MEISER, Vice President and Assistant Secretary since January 2010.
Senior Counsel of BNY Mellon, and an officer of 76 investment companies (comprised of 192 portfolios) managed by the Manager. She is 41 years old and has been an employee of the Manager since August 2001.
OFFICERS OF THE FUND (Unaudited) (continued)
ROBERT R. MULLERY, Vice President and Assistant Secretary since August 2005.
Managing Counsel of BNY Mellon, and an officer of 76 investment companies (comprised of 192 portfolios) managed by the Manager. He is 59 years old and has been an employee of the Manager since May 1986.
JEFF PRUSNOFSKY, Vice President and Assistant Secretary since August 2005.
Senior Managing Counsel of BNY Mellon, and an officer of 76 investment companies (comprised of 192 portfolios) managed by the Manager. He is 46 years old and has been an employee of the Manager since October 1990.
JAMES WINDELS, Treasurer since November 2001.
Director – Mutual Fund Accounting of the Manager, and an officer of 76 investment companies (comprised of 192 portfolios) managed by the Manager. He is 52 years old and has been an employee of the Manager since April 1985.
RICHARD CASSARO, Assistant Treasurer since January 2008.
Senior Accounting Manager – Money Market and Municipal Bond Funds of the Manager, and an officer of 76 investment companies (comprised of 192 portfolios) managed by the Manager. He is 52 years old and has been an employee of the Manager since September 1982.
GAVIN C. REILLY, Assistant Treasurer since December 2005.
Tax Manager of the Investment Accounting and Support Department of the Manager, and an officer of 76 investment companies (comprised of 192 portfolios) managed by the Manager. He is 43 years old and has been an employee of the Manager since April 1991.
ROBERT ROBOL, Assistant Treasurer since August 2005.
Senior Accounting Manager – Fixed Income Funds of the Manager, and an officer of 76 investment companies (comprised of 192 portfolios) managed by the Manager. He is 47 years old and has been an employee of the Manager since October 1988.
ROBERT SALVIOLO, Assistant Treasurer since July 2007.
Senior Accounting Manager – Equity Funds of the Manager, and an officer of 76 investment companies (comprised of 192 portfolios) managed by the Manager. He is 44 years old and has been an employee of the Manager since June 1989.
ROBERT SVAGNA, Assistant Treasurer since August 2005.
Senior Accounting Manager – Equity Funds of the Manager, and an officer of 76 investment companies (comprised of 192 portfolios) managed by the Manager. He is 44 years old and has been an employee of the Manager since November 1990.
30
JOSEPH W. CONNOLLY, Chief Compliance Officer since October 2004.
Chief Compliance Officer of the Manager and The Dreyfus Family of Funds (76 investment companies, comprised of 192 portfolios). From November 2001 through March 2004, Mr. Connolly was first Vice-President, Mutual Fund Servicing for Mellon Global Securities Services. In that capacity, Mr. Connolly was responsible for managing Mellon’s Custody, Fund Accounting and Fund Administration services to third-party mutual fund clients. He is 54 years old and has served in various capacities with the Manager since 1980, including manager of the firm’s Fund Accounting Department from 1997 through October 2001.
STEPHEN J. STOREN, Anti-Money Laundering Compliance Officer since May 2011.
Chief Compliance Officer of the Distributor, and the Anti-Money Laundering Compliance Officer of 72 investment companies (comprised of 188 portfolios) managed by the Manager. He is 56 years old and has been an employee of the Distributor since October 1999.
Save time. Save paper. View your next shareholder report online as soon as it’s available. Log into www.dreyfus.com and sign up for Dreyfus eCommunications. It’s simple and only takes a few minutes.
The views expressed in this report reflect those of the portfolio manager only through the end of the period covered and do not necessarily represent the views of Dreyfus or any other person in the Dreyfus organization. Any such views are subject to change at any time based upon market or other conditions and Dreyfus disclaims any responsibility to update such views.These views may not be relied on as investment advice and, because investment decisions for a Dreyfus fund are based on numerous factors, may not be relied on as an indication of trading intent on behalf of any Dreyfus fund.
Not FDIC-Insured • Not Bank-Guaranteed • May Lose Value
| | Contents |
| | THE FUND |
| 2 | A Letter from the Chairman and CEO |
| 3 | Discussion of Fund Performance |
| 6 | Fund Performance |
| 7 | Understanding Your Fund’s Expenses |
| 7 | Comparing Your Fund’s Expenses With Those of Other Funds |
| 8 | Statement of Investments |
| 9 | Statement of Assets and Liabilities |
| 10 | Statement of Operations |
| 11 | Statement of Changes in Net Assets |
| 12 | Financial Highlights |
| 13 | Notes to Financial Statements |
| 24 | Report of Independent Registered Public Accounting Firm |
| 25 | Important Tax Information |
| 26 | Board Members Information |
| 29 | Officers of the Fund |
| | FOR MORE INFORMATION |
| | Back Cover |
Dreyfus
Moderate Allocation Fund
The Fund

A LETTER FROM THE CHAIRMAN AND CEO
Dear Shareholder:
We are pleased to present this annual report for Dreyfus Moderate Allocation Fund, covering the 12-month period from September 1, 2010, through August 31, 2011. For information about how the fund performed during the reporting period, as well as general market perspectives, we provide a Discussion of Fund Performance on the pages that follow.
Although stocks and higher yielding bonds rallied strongly through the first quarter of 2011 due to expectations of a more robust economic recovery, the reporting period ended amid sharply deteriorating investor sentiment due to disappointing economic data, an escalating sovereign debt crisis in Europe and a contentious debate regarding taxes, spending and borrowing in the United States. In the final month of the reporting period, a major credit rating agency downgraded U.S. long-term debt, marking the first time in history that U.S.Treasury securities were not assigned the highest possible credit rating. Both stocks and bonds proved volatile in this tumultuous environment, as the stalled economy caused securities from economically sensitive market sectors to give back many of the reporting period’s previous gains.
The economic outlook currently is clouded by heightened market volatility and political infighting, but we believe that a sustained, moderate global expansion is more likely than a double-dip recession. Inflationary pressures appear to be waning in most countries, including the United States, as energy prices have retreated from their highs. The Federal Reserve Board has signaled its intention to maintain an aggressively accommodative monetary policy, which may help offset the financial stresses caused by recent fiscal policy choices in the United States and Europe.To assess how these and other developments may affect your investments, we encourage you, as always, to speak with your financial advisor.
Thank you for your continued confidence and support.

Jonathan R. Baum
Chairman and Chief Executive Officer
The Dreyfus Corporation
September 15, 2011
2

DISCUSSION OF FUND PERFORMANCE
For the period of September 1, 2010, through August 31, 2011, as provided by Richard B. Hoey, A. Paul Disdier, Christopher E. Sheldon, CFA, and Keith L. Stransky, CFA, Portfolio Managers
Fund and Market Performance Overview
For the 12-month period ended August 31, 2011, Dreyfus Moderate Allocation Fund produced a total return of 11.02%.1 In comparison, the fund’s benchmark, the Standard & Poor’s 500 Composite Stock Price Index produced a total return of 18.48% for the same period. The fund also utilizes a customized blended index composed of 60% Standard & Poor’s 500 Composite Stock Price Index and 40% Barclays Capital U.S. Aggregate Bond Index, and this blended index returned 12.93% for the same period.2 Stocks and higher yielding sectors of the bond market rallied through the first quarter of 2011 amid expectations of continued economic recovery. However, several macroeconomic disappointments later derailed investor sentiment, erasing some of the markets’ previous gains.The fund’s return lagged its benchmark, primarily due to disappointments among some of the underlying funds’ more economically sensitive holdings.
The Fund’s Investment Approach
Dreyfus Moderate Allocation Fund seeks a balance of current income and capital appreciation. In pursuing its goal, the fund normally allocates 60% of its assets to equity securities and 40% of its assets to fixed income securities.
The fund achieves its targeted asset allocation mix by investing in other mutual funds that are advised by The Dreyfus Corporation (Dreyfus). In turn, the underlying funds invest in a wide range of equity and fixed income securities, including U.S. large-, mid- and small-cap equities; international, global and emerging-market equities; and U.S. and international fixed income securities.
The fund’s portfolio managers, who comprise the Dreyfus Investment Committee, select the underlying funds based on their investment objectives and management policies, portfolio holdings, risk/reward profiles, historical performance and other factors.The fund may invest in any of 31 underlying funds identified by the Dreyfus Investment
DISCUSSION OF FUND PERFORMANCE (continued)
Committee, which generally will select only certain, and not all, of the underlying funds for investment at any given time.
Shifting Sentiment Sparked Heightened Volatility
Investors’ outlooks improved markedly at the start of the reporting period when the Federal Reserve Board announced new measures to jump-start the U.S. economy. Subsequent improvements in economic data and corporate earnings also helped support rising stock prices.The rally was interrupted in February 2011 by political uprisings in the Middle East and again in March by devastating natural and nuclear disasters in Japan, but stock prices bounced back quickly from these unexpected shocks.
Following the S&P’s late April peak, investor sentiment began to wane, before deteriorating in earnest last summer when Greece appeared headed for default on its debt. Global economic data came in below expectations and a contentious debate regarding U.S. government spending and borrowing intensified. Stocks suffered bouts of heightened volatility as investors engaged in a “flight to quality” away from economically sensitive sectors of the stock market and higher yielding sectors of the bond market. In contrast, traditional safe havens, such as U.S.Treasury securities, gained value late in the reporting period.
Cyclical Stocks Dampened Fund Performance
Throughout the reporting period, we maintained a modest emphasis on owning more stocks over bonds, which helped support the fund’s relative performance over the first eight months of the reporting period but proved detrimental over the summer of 2011. However, the fund exhibited less volatility than the overall market, primarily due to its fixed-income allocation.
The fund’s performance compared to its benchmarks also was undermined by the cyclical tilt of some of its underlying equity funds, including Dreyfus Research Growth Fund, Dreyfus U.S. Equity Fund and Dreyfus/The Boston Company Large Cap Core Fund. Dreyfus Strategic Value Fund lagged market averages as value-oriented stocks trailed growth-oriented stocks.The fund achieved better relative results from Dreyfus Appreciation Fund, which benefited from a focus on dividend-paying stocks of large, multinational companies. The fund’s underlying fixed-income funds—Dreyfus Bond Market Index Fund and Dreyfus Total Return Advantage Fund—produced returns that were roughly in line with bond market averages.
4
The Dreyfus Investment Committee made a number of changes to the fund’s investment allocations during the reporting period. In October 2010, 2% of the fund’s total assets were shifted from Dreyfus Select Managers Small Cap Value Fund to Dreyfus Small Cap Stock Index Fund. In February 2011, we moved 3.5% of the fund’s assets to Dreyfus Appreciation Fund. Finally, in July 2011 we shifted 1.5% of assets from Dreyfus International Value Fund to Dreyfus International Equity Fund for a somewhat more defensive asset mix.
Defensive Bias in a Choppy Economic Recovery
We expect a subpar global economic rebound to persist amid significant headwinds over the remainder of 2011 and are monitoring a number of macroeconomic developments, including the sovereign debt crisis in Europe, U.S. federal deficit reduction negotiations and central bank policies worldwide.Therefore, we have maintained a relatively defensive bias in the selection of underlying equity funds, and we have continued to rely on more defensively structured bond funds to help cushion heightened market volatility.
September 15, 2011
| |
| | Equity funds are subject generally to market, market sector, market liquidity, issuer and investment |
| | style risks, among other factors, to varying degrees, all of which are more fully described in the |
| | fund’s prospectus. Stocks of small- and/or midcap companies often experience sharper price |
| | fluctuations than stocks of large-cap companies. |
| | Asset allocation and diversification cannot assure a profit or protect against loss. |
| | The ability of the fund to achieve its investment goal depends, in part, on the ability of the |
| | Dreyfus Investment Committee to allocate effectively the fund’s assets among the asset classes and |
| | the underlying funds.There can be no assurance that the actual allocations will be effective in |
| | achieving the fund’s investment goal. |
| | Bond funds are subject generally to interest rate, credit, liquidity and market risks, to varying degrees, |
| | all of which are more fully described in the fund’s prospectus. Generally, all other factors being equal, |
| | bond prices are inversely related to interest-rate changes, and rate increases can cause price declines. |
| 1 | Total return includes reinvestment of dividends and any capital gains paid. Past performance is no |
| | guarantee of future results. Share price and investment return fluctuate such that upon redemption, |
| | fund shares may be worth more or less than their original cost. Return figure provided reflects the |
| | absorption of certain fund expenses by The Dreyfus Corporation pursuant to an agreement in |
| | effect through January 1, 2012, at which time it may be extended, terminated or modified. Had |
| | these expenses not been absorbed, the fund’s return would have been lower. |
| 2 | SOURCE: LIPPER INC. — Reflects reinvestment of dividends and, where applicable, capital |
| | gain distributions.The Standard & Poor’s 500 Composite Stock Price Index is a widely accepted, |
| | unmanaged index of U.S. stock market performance.The Barclays Capital U.S.Aggregate Bond |
| | Index is a widely accepted, unmanaged total return index of corporate, U.S. government and U.S. |
| | government agency debt instruments, mortgage-backed securities and asset-backed securities with an |
| | average maturity of 1-10 years. Investors cannot invest directly in any index. |
FUND PERFORMANCE
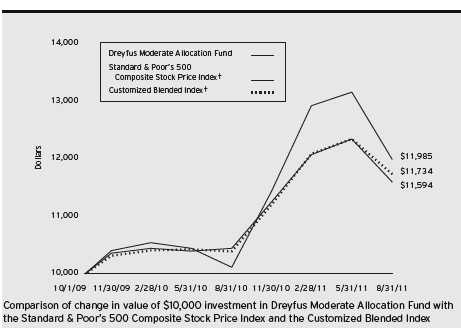
| | | | | |
| Average Annual Total Returns as of 8/31/11 | | | |
| | Inception | | From |
| | Date | 1Year | Inception |
| Fund | 10/1/09 | 11.02% | 8.01% |
| Standard & Poor’s 500 | | | |
| Composite Stock Price Index | 9/30/09 | 18.48% | 9.91%†† |
| Customized Blended Index | 9/30/09 | 12.93% | 8.69%†† |
† Source: Lipper Inc.
Past performance is not predictive of future performance.The fund’s performance shown in the graph and table does not reflect the deduction of taxes that a shareholder would pay on fund distributions or the redemption of fund shares.
The above graph compares a $10,000 investment made in Dreyfus Moderate Allocation Fund on 10/1/09 (inception date) to a $10,000 investment made in two different indices: (1) the Standard & Poor’s 500 Composite Stock Price Index (the “S&P 500 Index”) and (2) the Customized Blended Index.The Customized Blended Index is calculated on a year-to-date basis.All dividends and capital gain distributions are reinvested.
The fund’s performance shown in the line graph above takes into account all applicable fees and expenses.The S&P 500 Index is a widely accepted, unmanaged index of U.S. stock market performance.The Customized Blended Index is composed of the S&P 500 Index, 60%, and the Barclays Capital U.S.Aggregate Bond Index (“Barclays Index”), 40%.The Barclays Index is a widely accepted, unmanaged index of corporate, government and government agency debt instruments, mortgage-backed securities and asset-backed securities with an average maturity of 1-10 years. Unlike a mutual fund, the indices are not subject to charges, fees and other expenses. Investors cannot invest directly in any index. Further information relating to fund performance, including expense reimbursements, if applicable, is contained in the Financial Highlights section of the prospectus and elsewhere in this report.
For comparative purposes, the value of each index on 9/30/09 is used as the beginning value on 10/1/09.
6
UNDERSTANDING YOUR FUND’S EXPENSES (Unaudited)
As a mutual fund investor, you pay ongoing expenses, such as management fees and other expenses. Using the information below, you can estimate how these expenses affect your investment and compare them with the expenses of other funds.You also may pay one-time transaction expenses, including sales charges (loads) and redemption fees, which are not shown in this section and would have resulted in higher total expenses. For more information, see your fund’s prospectus or talk to your financial adviser.
Review your fund’s expenses
The table below shows the expenses you would have paid on a $1,000 investment in Dreyfus Moderate Allocation Fund from March 1, 2011 to August 31, 2011. It also shows how much a $1,000 investment would be worth at the close of the period, assuming actual returns and expenses.
| | |
| Expenses and Value of a $1,000 Investment |
| assuming actual returns for the six months ended August 31, 2011 |
| |
| Expenses paid per $1,000† | $ | 3.01 |
| Ending value (after expenses) | $ | 960.50 |
|
| COMPARING YOUR FUND’S EXPENSES |
| WITH THOSE OF OTHER FUNDS (Unaudited) |
Using the SEC’s method to compare expenses
The Securities and Exchange Commission (SEC) has established guidelines to help investors assess fund expenses. Per these guidelines, the table below shows your fund’s expenses based on a $1,000 investment, assuming a hypothetical 5% annualized return. You can use this information to compare the ongoing expenses (but not transaction expenses or total cost) of investing in the fund with those of other funds.All mutual fund shareholder reports will provide this information to help you make this comparison. Please note that you cannot use this information to estimate your actual ending account balance and expenses paid during the period.
| | |
| Expenses and Value of a $1,000 Investment |
| assuming a hypothetical 5% annualized return for the six months ended August 31, 2011 |
| |
| Expenses paid per $1,000† | $ | 3.11 |
| Ending value (after expenses) | $ | 1,022.13 |
† Expenses are equal to the fund’s annualized expense ratio of .61% multiplied by the average account value over the period, multiplied by 184/365 (to reflect the one-half year period).
The Fund 7
|
| STATEMENT OF INVESTMENTS |
| August 31, 2011 |
| | | | |
| Registered Investment Companies—100.1% | Shares | Value ($) |
| Dreyfus Appreciation Fund | 25,967a | 1,025,440 |
| Dreyfus Bond Market Index Fund, Basic Shares | 366,269a | 3,995,992 |
| Dreyfus Emerging Markets Debt Local Currency Fund, Cl. I | 77,171a | 1,180,718 |
| Dreyfus Emerging Markets Fund, Cl. I | 64,523a | 759,431 |
| Dreyfus Global Absolute Return Fund, Cl. I | 120,975a,b | 1,446,865 |
| Dreyfus Global Real Estate Securities Fund, Cl. I | 103,862a | 752,999 |
| Dreyfus High Yield Fund, Cl. I | 177,125a | 1,108,800 |
| Dreyfus International Bond Fund, Cl. I | 67,574a | 1,175,111 |
| Dreyfus International Equity Fund, Cl. I | 13,528a | 359,447 |
| Dreyfus International Stock Index Fund | 41,880a | 585,905 |
| Dreyfus International Value Fund, Cl. I | 28,914a | 308,509 |
| Dreyfus Opportunistic Midcap Value Fund, Cl. I | 17,284a,b | 539,436 |
| Dreyfus Research Growth Fund, Cl. Z | 229,421a | 2,039,555 |
| Dreyfus S&P Stars Opportunities Fund, Cl. I | 25,251a | 549,970 |
| Dreyfus Small Cap Stock Index Fund | 29,118a | 570,707 |
| Dreyfus Strategic Value Fund, Cl. I | 105,722a | 2,780,492 |
| Dreyfus Total Return Advantage Fund, Cl. I | 294,779a | 3,994,251 |
| Dreyfus U.S. Equity Fund, Cl. I | 114,404a | 1,544,461 |
| Dreyfus/Newton International Equity Fund, Cl. I | 35,848a | 601,526 |
| Dreyfus/The Boston Company Large Cap Core Fund, Cl. I | 45,221a | 1,471,503 |
| Dreyfus/The Boston Company | | |
| Small/Mid Cap Growth Fund, Cl. I | 41,331a,b | 576,154 |
| International Stock Fund, Cl. I | 37,311a | 497,354 |
| |
| Total Investments (cost $27,477,076) | 100.1% | 27,864,626 |
| Cash and Receivables (Net) | (.1%) | (24,632) |
| Net Assets | 100.0% | 27,839,994 |
| |
| a | Investment in affiliated mutual fund. |
| b | Non-income producing security. |
| | | |
| Portfolio Summary (Unaudited)† | | |
| | Value (%) | | Value (%) |
| Mutual Funds: Domestic | 72.6 | Mutual Funds: Foreign | 27.5 |
| | | | 100.1 |
| † Based on net assets. | | | |
| See notes to financial statements. | | | |
8
|
| STATEMENT OF ASSETS AND LIABILITIES |
| August 31, 2011 |
| | |
| | Cost | Value |
| Assets ($): | | |
| Investments in affiliated issuers— | | |
| See Statement of Investments—Note 1(c) | 27,477,076 | 27,864,626 |
| Cash | | 14,350 |
| Prepaid expenses | | 12,852 |
| | | 27,891,828 |
| Liabilities ($): | | |
| Due to The Dreyfus Corporation and affiliates—Note 3(b) | | 7,271 |
| Accrued expenses | | 44,563 |
| | | 51,834 |
| Net Assets ($) | | 27,839,994 |
| Composition of Net Assets ($): | | |
| Paid-in capital | | 27,214,666 |
| Accumulated undistributed investment income—net | | 135,827 |
| Accumulated net realized gain (loss) on investments | | 101,951 |
| Accumulated net unrealized appreciation | | |
| (depreciation) on investments | | 387,550 |
| Net Assets ($) | | 27,839,994 |
| Shares Outstanding | | |
| (100 million shares of $.001 par value Common Stock authorized) | | 1,971,129 |
| Net Asset Value, offering and redemption price per share ($) | | 14.12 |
| |
| See notes to financial statements. | | |
|
| STATEMENT OF OPERATIONS |
| Year Ended August 31, 2011 |
| | |
| Investment Income ($): | |
| Income: | |
| Cash dividends from affiliated issuers | 405,809 |
| Expenses: | |
| Shareholder servicing costs—Note 3(b) | 67,419 |
| Auditing fees | 40,849 |
| Registration fees | 23,779 |
| Prospectus and shareholders’ reports | 8,957 |
| Directors’ fees and expenses—Note 3(c) | 4,344 |
| Custodian fees—Note 3(b) | 3,533 |
| Legal fees | 2,250 |
| Loan commitment fees—Note 2 | 274 |
| Miscellaneous | 9,540 |
| Total Expenses | 160,945 |
| Less—expense reimbursement from The Dreyfus | |
| Corporation due to undertaking—Note 3(a) | (20,144) |
| Less—waiver of shareholder servicing fees—Note 3(b) | (4,982) |
| Less—reduction in fees due to earnings credits—Note 3(b) | (69) |
| Net Expenses | 135,750 |
| Investment Income—Net | 270,059 |
| Realized and Unrealized Gain (Loss) on Investments—Note 4 ($): | |
| Net realized gain (loss) on investments in affiliated issuers | 26,098 |
| Capital gain distributions from affiliated issuers | 189,996 |
| Net Realized Gain (Loss) | 216,094 |
| Net unrealized appreciation (depreciation) | |
| on investments in affiliated issuers | 539,939 |
| Net Realized and Unrealized Gain (Loss) on Investments | 756,033 |
| Net Increase in Net Assets Resulting from Operations | 1,026,092 |
| |
| See notes to financial statements. | |
10
STATEMENT OF CHANGES IN NET ASSETS
| | | | |
| | Year Ended August 31, |
| | 2011 | 2010a |
| Operations ($): | | |
| Investment income—net | 270,059 | 73,657 |
| Net realized gain (loss) on | | |
| investments in affiliated issuers | 216,094 | 23,028 |
| Net unrealized appreciation (depreciation) | | |
| on investments in affiliated issuers | 539,939 | (152,389) |
| Net Increase (Decrease) in Net Assets | | |
| Resulting from Operations | 1,026,092 | (55,704) |
| Dividends to Shareholders from ($): | | |
| Investment income—net | (259,104) | (36,541) |
| Net realized gain on investments | (49,843) | — |
| Total Dividends | (308,947) | (36,541) |
| Capital Stock Transactions ($): | | |
| Net proceeds from shares sold | 18,653,885 | 12,226,788 |
| Dividends reinvested | 297,484 | 35,930 |
| Cost of shares redeemed | (3,028,618) | (970,375) |
| Increase (Decrease) in Net Assets | | |
| from Capital Stock Transactions | 15,922,751 | 11,292,343 |
| Total Increase (Decrease) in Net Assets | 16,639,896 | 11,200,098 |
| Net Assets ($): | | |
| Beginning of Period | 11,200,098 | — |
| End of Period | 27,839,994 | 11,200,098 |
| Undistributed investment income—net | 135,827 | 42,843 |
| Capital Share Transactions (Shares): | | |
| Shares sold | 1,295,573 | 938,152 |
| Shares issued for dividends reinvested | 20,875 | 2,783 |
| Shares redeemed | (211,395) | (74,859) |
| Net Increase (Decrease) in Shares Outstanding | 1,105,053 | 866,076 |
| |
| a From October 1, 2009 (commencement of operations) to August 31, 2010. | |
| See notes to financial statements. | | |
FINANCIAL HIGHLIGHTS
The following table describes the performance for the fiscal periods indicated. Total return shows how much your investment in the fund would have increased (or decreased) during each period, assuming you had reinvested all dividends and distributions.These figures have been derived from the fund’s financial statements.
| | | | |
| | Year Ended August 31, |
| | 2011 | 2010a |
| Per Share Data ($): | | |
| Net asset value, beginning of period | 12.93 | 12.50 |
| Investment Operations: | | |
| Investment income—netb | .18 | .14 |
| Net realized and unrealized | | |
| gain (loss) on investments | 1.25 | .41 |
| Total from Investment Operations | 1.43 | .55 |
| Distributions: | | |
| Dividends from investment income—net | (.20) | (.12) |
| Dividends from net realized gain on investments | (.04) | — |
| Total Distributions | (.24) | (.12) |
| Net asset value, end of period | 14.12 | 12.93 |
| Total Return (%) | 11.02 | 4.43c |
| Ratios/Supplemental Data (%): | | |
| Ratio of total expenses to average net assetsd | .74 | 1.96e |
| Ratio of net expenses to average net assetsd | .63 | .65e |
| Ratio of net investment income | | |
| to average net assetsd | 1.25 | 1.27e |
| Portfolio Turnover Rate | 17.48 | 31.21c |
| Net Assets, end of period ($ x 1,000) | 27,840 | 11,200 |
| |
| a | From October 1, 2009 (commencement of operations) to August 31, 2010. |
| b | Based on average shares outstanding at each month end. |
| c | Not annualized. |
| d | Amounts do not include the activity of the underlying funds. |
| e | Annualized. |
| See notes to financial statements. |
12
NOTES TO FINANCIAL STATEMENTS
NOTE 1—Significant Accounting Policies:
Dreyfus Moderate Allocation Fund (the “fund”) is a separate diversified series of Strategic Funds, Inc. (the “Company”) which is registered under the Investment Company Act of 1940, as amended (the “Act”), as a open-end management investment company and operates as a series company currently offering ten series, including the fund.The fund’s investment objective is to seek a balance of current income and capital appreciation. The Dreyfus Corporation (the “Manager” or “Dreyfus”), a wholly-owned subsidiary of The Bank of New York Mellon Corporation (“BNY Mellon”), serves as the fund’s investment adviser. MBSC Securities Corporation (the “Distributor”), a wholly-owned subsidiary of the Manager, is the distributor of the fund’s shares, which are sold to the public without a sales charge.
The Company accounts separately for the assets, liabilities and operations of each series. Expenses directly attributable to each series are charged to that series’ operations; expenses which are applicable to all series are allocated among them on a pro rata basis.
The Financial Accounting Standards Board (“FASB”) Accounting Standards Codification (“ASC”) is the exclusive reference of authoritative U.S. generally accepted accounting principles (“GAAP”) recognized by the FASB to be applied by nongovernmental entities. Rules and interpretive releases of the Securities and Exchange Commission (“SEC”) under authority of federal laws are also sources of authoritative GAAP for SEC registrants. The fund’s financial statements are prepared in accordance with GAAP, which may require the use of management estimates and assumptions.Actual results could differ from those estimates.
The Company enters into contracts that contain a variety of indemnifications. The fund’s maximum exposure under these arrangements is unknown.The fund does not anticipate recognizing any loss related to these arrangements.
NOTES TO FINANCIAL STATEMENTS (continued)
(a) Portfolio valuation: The fair value of a financial instrument is the amount that would be received to sell an asset or paid to transfer a liability in an orderly transaction between market participants at the measurement date (i.e. the exit price). GAAP establishes a fair value hierarchy that prioritizes the inputs of valuation techniques used to measure fair value.This hierarchy gives the highest priority to unadjusted quoted prices in active markets for identical assets or liabilities (Level 1 measurements) and the lowest priority to unobservable inputs (Level 3 measurements).
Additionally, GAAP provides guidance on determining whether the volume and activity in a market has decreased significantly and whether such a decrease in activity results in transactions that are not orderly. GAAP requires enhanced disclosures around valuation inputs and techniques used during annual and interim periods.
Various inputs are used in determining the value of the fund’s investments relating to fair value measurements.These inputs are summarized in the three broad levels listed below:
Level 1—unadjusted quoted prices in active markets for identical investments.
Level 2—other significant observable inputs (including quoted prices for similar investments, interest rates, prepayment speeds, credit risk, etc.).
Level 3—significant unobservable inputs (including the fund’s own assumptions in determining the fair value of investments).
The inputs or methodology used for valuing securities are not necessarily an indication of the risk associated with investing in those securities.
Investments are valued at the net asset value of each underlying fund determined as of the close of the NewYork Stock Exchange (generally 4 p.m., Eastern time) on the valuation date and are generally categorized as Level 1 in the hierarchy.
14
The following is a summary of the inputs used as of August 31, 2011 in valuing the fund’s investments:
| | | | |
| | | Level 2—Other | Level 3— | |
| | Level 1— | Significant | Significant | |
| | Unadjusted | Observable | Unobservable | |
| | Quoted Prices | Inputs | Inputs | Total |
| Assets ($) | | | | |
| Investments in Securities: | | | |
| Mutual Funds | 27,864,626 | — | — | 27,864,626 |
In January 2010, FASB issued Accounting Standards Update (“ASU”) No. 2010-06 “Improving Disclosures about FairValue Measurements” (“ASU 2010-06”). The portions of ASU 2010-06 which require reporting entities to prepare new disclosures surrounding amounts and reasons for significant transfers in and out of Level 1 and Level 2 fair value measurements as well as inputs and valuation techniques used to measure fair value for both recurring and nonrecurring fair value measurements that fall in either Level 2 or Level 3 have been adopted by the fund. No significant transfers between Level 1 or Level 2 fair value measurements occurred at August 31, 2011.
In May 2011, FASB issued ASU No. 2011-04 “Amendments to Achieve Common Fair Value Measurement and Disclosure Requirements in GAAP and International Financial Reporting Standards (“IFRS”)” (“ASU 2011-04”). ASU 2011-04 includes common requirements for measurement of and disclosure about fair value between GAAP and IFRS. ASU 2011-04 will require reporting entities to disclose the following information for fair value measurements categorized within Level 3 of the fair value hierarchy: quantitative information about the unobservable inputs used in the fair value measurement, the valuation processes used by the reporting entity and a narrative description of the sensitivity of the fair value measurement to changes in unobservable inputs and the interrelationships between those unobservable inputs. In addition, ASU 2011-04 will require reporting entities to make disclo-
NOTES TO FINANCIAL STATEMENTS (continued)
sures about amounts and reasons for all transfers in and out of Level 1 and Level 2 fair value measurements.The new and revised disclosures are effective for interim and annual reporting periods beginning after December 15, 2011. At this time, management is evaluating the implications of ASU 2011-04 and its impact on the financial statements.
(b) Securities transactions and investment income: Securities transactions are recorded on a trade date basis. Realized gains and losses from securities transactions are recorded on the identified cost basis. Dividend income is recognized on the ex-dividend date and interest income, including, where applicable, accretion of discount and amortization of premium on investments, is recognized on the accrual basis.
(c) Affiliated issuers: Investments in other investment companies advised by Dreyfus are defined as “affiliated” in the Act.
The fund may invest in shares of certain affiliated investment companies also advised or managed by Dreyfus. Investments in affiliated investment companies for the period ended August 31, 2011 were as follows:
| | | | | | |
| Affiliated | | | | | | |
| Investment | Value | | | | Net Realized | |
| Company | 8/31/2010 | ($) | Purchases ($)† | Sales ($) | Gain (Loss) ($) | |
| Dreyfus | | | | | | |
| Appreciation Fund | — | | 1,054,417 | 30,535 | (990 | ) |
| Dreyfus Bond Market | | | | | | |
| Index Fund, | | | | | | |
| Basic Shares | 1,639,297 | | 2,602,983 | 316,846 | (4,773 | ) |
| Dreyfus Emerging | | | | | | |
| Markets Debt | | | | | | |
| Local Currency | | | | | | |
| Fund, Cl. I | 463,859 | | 748,608 | 90,527 | (1,778 | ) |
| Dreyfus Emerging | | | | | | |
| Markets Fund, Cl. I | 330,939 | | 539,650 | 67,896 | (1,862 | ) |
| Dreyfus Global | | | | | | |
| Absolute Return | | | | | | |
| Fund, Cl. I | 601,534 | | 1,008,452 | 121,307 | (3,126 | ) |
| Dreyfus Global Real | | | | | | |
| Estate Securities | | | | | | |
| Fund, Cl. I | 302,513 | | 493,185 | 59,748 | (1,130 | ) |
| Dreyfus High Yield | | | | | | |
| Fund, Cl. I | 464,974 | | 784,667 | 90,528 | (1,868 | ) |
16
| | | | | | |
| Affiliated | | | | | | |
| Investment | Value | | | | Net Realized | |
| Company | 8/31/2010 | ($) | Purchases ($)† | Sales ($) | Gain (Loss) ($) | |
| Dreyfus International | | | | | | |
| Bond Fund, Cl. I | 458,305 | | 760,766 | 90,528 | (3,441 | ) |
| Dreyfus International | | | | | | |
| Equity Fund, Cl. I | — | | 409,358 | 2,817 | (214 | ) |
| Dreyfus International | | | | | | |
| Stock Index Fund | 234,674 | | 410,417 | 50,922 | (1,712 | ) |
| Dreyfus International | | | | | | |
| Value Fund, Cl. I | 277,762 | | 472,343 | 450,577 | (2,493 | ) |
| Dreyfus Opportunistic | | | | | | |
| Midcap Value | | | | | | |
| Fund, Cl. I | 216,148 | | 357,466 | 45,264 | (2,072 | ) |
| Dreyfus Research | | | | | | |
| Growth Fund, Cl. Z | 1,143,647 | | 1,562,161 | 930,533 | 49,824 | |
| Dreyfus S&P Stars | | | | | | |
| Opportunities | | | | | | |
| Fund, Cl. I | 211,495 | | 357,620 | 45,263 | (1,786 | ) |
| Dreyfus Select | | | | | | |
| Managers Small Cap | | | | | | |
| Value Fund, Cl. I | 214,686 | | 66,702 | 322,672 | 34,486 | |
| Dreyfus Small Cap | | | | | | |
| Stock Index Fund | — | | 612,773 | 34,126 | (1,315 | ) |
| Dreyfus Strategic | | | | | | |
| Value Fund, Cl. I | 1,091,010 | | 1,902,555 | 238,992 | (9,839 | ) |
| Dreyfus Total | | | | | | |
| Return Advantage | | | | | | |
| Fund, Cl. I | 1,644,939 | | 2,698,215 | 316,846 | (10,867 | ) |
| Dreyfus U.S. Equity | | | | | | |
| Fund, Cl. I | 567,653 | | 978,396 | 123,117 | (3,403 | ) |
| Dreyfus/Newton | | | | | | |
| International | | | | | | |
| Equity Fund, Cl. I | 241,839 | | 412,185 | 50,921 | (1,417 | ) |
| Dreyfus/The Boston | | | | | | |
| Company Large Cap | | | | | | |
| Core Fund, Cl. I | 576,946 | | 980,291 | 123,117 | (2,174 | ) |
| Dreyfus/The Boston | | | | | | |
| Company Small/Mid | | | | | | |
| Cap Growth | | | | | | |
| Fund, Cl. I | 213,194 | | 357,466 | 45,265 | (1,558 | ) |
| International Stock | | | | | | |
| Fund, Cl. I | 197,226 | | 324,357 | 40,737 | (394 | ) |
| TOTAL | 11,092,640 | | 19,895,033 | 3,689,084 | 26,098 | |
| |
| † Includes reinvested dividends/distributions. | | | | | |
NOTES TO FINANCIAL STATEMENTS (continued)
| | | | | | | |
| | | Change in Net | | | | | |
| Affiliated | | Unrealized | | | | | |
| Investment | | Appreciation | | Value | | Net | Dividends/ |
| Company | (Depreciation) ($) | | 8/31/2011 | ($) | Assets (%) | Distributions ($) |
| Dreyfus | | | | | | | |
| Appreciation Fund | 2,548 | | 1,025,440 | | 3.7 | 127 |
| Dreyfus Bond Market | | | | | | |
| Index Fund, | | | | | | | |
| Basic Shares | | 75,331 | | 3,995,992 | | 14.4 | 100,724 |
| Dreyfus Emerging | | | | | | |
| Markets Debt Local | | | | | | |
| Currency Fund, Cl. I | 60,556 | | 1,180,718 | | 4.3 | 33,677 |
| Dreyfus Emerging | | | | | | |
| Markets Fund, Cl. I | (41,400 | ) | 759,431 | | 2.7 | 3,452 |
| Dreyfus Global | | | | | | | |
| Absolute Return | | | | | | |
| Fund, Cl. I | | (38,688 | ) | 1,446,865 | | 5.2 | 50,444 |
| Dreyfus Global Real | | | | | | |
| Estate Securities | | | | | | |
| Fund, Cl. I | | 18,179 | | 752,999 | | 2.7 | 21,330 |
| Dreyfus High Yield | | | | | | |
| Fund, Cl. I | | (48,445 | ) | 1,108,800 | | 4.0 | 69,736 |
| Dreyfus International | | | | | | |
| Bond Fund, Cl. I | 50,009 | | 1,175,111 | | 4.2 | 45,835 |
| Dreyfus International | | | | | | |
| Equity Fund, Cl. I | (46,880 | ) | 359,447 | | 1.3 | — |
| Dreyfus International | | | | | | |
| Stock Index Fund | (6,552 | ) | 585,905 | | 2.1 | 8,268 |
| Dreyfus International | | | | | | |
| Value Fund, Cl. I | 11,474 | | 308,509 | | 1.1 | 6,836 |
| Dreyfus Opportunistic | | | | | | |
| Midcap Value | | | | | | | |
| Fund, Cl. I | | 13,158 | | 539,436 | | 1.9 | — |
| Dreyfus Research | | | | | | |
| Growth Fund, Cl. Z | 214,456 | | 2,039,555 | | 7.3 | 6,958 |
| Dreyfus S&P Stars | | | | | | |
| Opportunities | | | | | | | |
| Fund, Cl. I | | 27,904 | | 549,970 | | 2.0 | 155 |
| Dreyfus Select | | | | | | | |
| Managers Small Cap | | | | | | |
| Value Fund, Cl. I | 6,798 | | — | | — | — |
| Dreyfus Small Cap | | | | | | |
| Stock Index Fund | (6,625 | ) | 570,707 | | 2.0 | 10,476 |
| Dreyfus Strategic | | | | | | |
| Value Fund, Cl. I | 35,758 | | 2,780,492 | | 10.0 | 15,138 |
| Dreyfus Total Return | | | | | | |
| Advantage Fund, Cl. I | (21,190 | ) | 3,994,251 | | 14.3 | 195,900 |
| Dreyfus U.S. Equity | | | | | | |
| Fund, Cl. I | | 124,932 | | 1,544,461 | | 5.5 | 6,090 |
18
| | | | | | |
| | Change in Net | | | | |
| Affiliated | Unrealized | | | | |
| Investment | Appreciation | Value | | Net | Dividends/ |
| Company | (Depreciation) ($) | 8/31/2011 | ($) | Assets (%) | Distributions ($) |
| Dreyfus/Newton | | | | | |
| International | | | | | |
| Equity Fund, Cl. I | (160) | 601,526 | | 2.2 | 10,037 |
| Dreyfus/The Boston | | | | | |
| Company Large Cap | | | | |
| Core Fund, Cl. I | 39,557 | 1,471,503 | | 5.3 | 7,984 |
| Dreyfus/The Boston | | | | | |
| Company Small/Mid | | | | |
| Cap Growth | | | | | |
| Fund, Cl. I | 52,317 | 576,154 | | 2.1 | — |
| International Stock | | | | | |
| Fund, Cl. I | 16,902 | 497,354 | | 1.8 | 2,638 |
| TOTAL | 539,939 | 27,864,626 | | 100.1 | 595,805 |
(d) Dividends to shareholders: Dividends are recorded on the ex-dividend date. Dividends from investment income-net and dividends from net realized capital gains, if any, are normally declared and paid annually, but the fund may make distributions on a more frequent basis to comply with the distribution requirements of the Internal Revenue Code of 1986, as amended (the “Code”).To the extent that net realized capital gains can be offset by capital loss carryovers, it is the policy of the fund not to distribute such gains. Income and capital gain distributions are determined in accordance with income tax regulations, which may differ from GAAP.
(e) Federal income taxes: It is the policy of the fund to continue to qualify as a regulated investment company, if such qualification is in the best interests of its shareholders, by complying with the applicable provisions of the Code, and to make distributions of taxable income sufficient to relieve it from substantially all federal income and excise taxes.
As of and during the period ended August 31, 2011, the fund did not have any liabilities for any uncertain tax positions.The fund recognizes interest and penalties, if any, related to uncertain tax positions as income tax expense in the Statement of Operations. During the period, the fund did not incur any interest or penalties.
NOTES TO FINANCIAL STATEMENTS (continued)
Each of the tax years in the two-year period ended August 31, 2011 remains subject to examination by the Internal Revenue Service and state taxing authorities.
At August 31, 2011, the components of accumulated earnings on a tax basis were as follows: undistributed ordinary income $217,911, undistributed capital gains $110,673 and unrealized appreciation $296,744.
The tax character of distributions paid to shareholders during the fiscal periods ended August 31, 2011 and August 31, 2010 were as follows: ordinary income $305,155 and $36,541 and long-term capital gains $3,792 and $0, respectively.
During the period ended August 31, 2011, as a result of permanent book to tax differences, primarily due to the tax treatment of short-term capital gain distributions from regulated investment company holdings, the fund increased accumulated undistributed investment income-net by $82,029 and decreased accumulated net realized gain (loss) on investments by the same amount. Net assets and net asset value per share were not affected by this reclassification.
NOTE 2—Bank Lines of Credit:
The fund participates with other Dreyfus-managed funds in a $225 million unsecured credit facility led by Citibank, N.A. and a $300 million unsecured credit facility provided by The Bank of New York Mellon, a subsidiary of BNY Mellon and an affiliate of Dreyfus, (each, a “Facility”), each to be utilized primarily for temporary or emergency purposes, including the financing of redemptions. In connection therewith, the fund has agreed to pay its pro rata portion of commitment fees for each Facility. Interest is charged to the fund based on rates determined pursuant to the terms of the respective Facility at the time of borrowing. During the period ended August 31, 2011, the fund did not borrow under the Facilities.
20
NOTE 3—Management Fee and Other Transactions with Affiliates:
(a) Pursuant to a management agreement with the Manager, there is no management fee paid to the Manager. The fund invests in other mutual funds advised by the Manager. All fees and expenses of the underlying funds are reflected in the underlying funds’ net asset values.
The Manager has contractually agreed, until January 1, 2012, to assume the expenses of the fund so that the total annual fund and underlying funds’ operating expenses (excluding taxes, interest, brokerage commissions, commitment fees on borrowings and extraordinary expenses) do not exceed 1.45% of the value of the fund’s average daily net assets. The expense reimbursement, pursuant to the undertaking, amounted to $20,144 during the period ended August 31, 2011.
(b) Under the Shareholder Services Plan, the fund pays the Distributor at an annual rate of .25% of the value of the fund’s average daily net assets for the provision of certain service. The services provided may include personal services relating to shareholder accounts, such as answering shareholder inquiries regarding the fund’s shares and providing reports and other information, and services related to the maintenance of shareholder accounts.The Distributor may make payments to Service Agents (a securities dealer, financial institution or other industry professional) in respect of these services.The Distributor determines the amounts to be paid to Service Agents. Fees paid to the Distributor will be waived to the extent that the fund invests in an underlying affiliated fund with a shareholder services plan. During the period ended August 31, 2011, the fund was charged $54,040 pursuant to the Shareholder Services Plan of which $4,982 was waived due to the fund’s investment in certain of the underlying funds.
NOTES TO FINANCIAL STATEMENTS (continued)
The fund compensates Dreyfus Transfer, Inc., a wholly-owned subsidiary of the Manager, under a transfer agency agreement for providing personnel and facilities to perform transfer agency services for the fund. During the period ended August 31, 2011, the fund was charged $5,184 pursuant to the transfer agency agreement, which is included in Shareholder servicing costs in the Statement of Operations.
The fund has arrangements with the custodian and cash management bank whereby the fund may receive earnings credits when positive cash balances are maintained, which are used to offset custody and cash management fees. For financial reporting purposes, the fund includes net earnings credits as an expense offset in the Statement of Operations.
The fund compensates The Bank of New York Mellon under a cash management agreement for performing cash management services related to fund subscriptions and redemptions. During the period ended August 31, 2011, the fund was charged $1,659 pursuant to the cash management agreement, which is included in Shareholder servicing costs in the Statement of Operations.These fees were partially offset by earnings credits of $69.
The fund also compensates The Bank of New York Mellon under a custody agreement for providing custodial services for the fund. During the period ended August 31, 2011, the fund was charged $3,533 pursuant to the custody agreement.
During the period ended August 31, 2011, the fund was charged $7,225 for services performed by the Chief Compliance Officer.
The components of “Due to The Dreyfus Corporation and affiliates” in the Statement of Assets and Liabilities consist of: shareholder services plan fees $5,751, custodian fees $600, chief compliance officer fees $3,253 and transfer agency per account fees $1,560, which are offset against an expense reimbursement currently in effect in the amount of $3,893.
22
(c) Each Board member also serves as a Board member of other funds within the Dreyfus complex. Annual retainer fees and attendance fees are allocated to each fund based on net assets.
NOTE 4—Securities Transactions:
The aggregate amount of purchases and sales of investment securities, excluding short-term securities, during the period ended August 31, 2011, amounted to $19,895,033 and $3,689,084, respectively.
At August 31, 2011, the cost of investments for federal income tax purposes was $27,567,882; accordingly, accumulated net unrealized appreciation on investments was $296,744, consisting of $646,823 gross unrealized appreciation and $350,079 gross unrealized depreciation.
|
| REPORT OF INDEPENDENT REGISTERED |
| PUBLIC ACCOUNTING FIRM |
Shareholders and Board of Directors
Dreyfus Moderate Allocation Fund
We have audited the accompanying statement of assets and liabilities, including the statement of investments, of Dreyfus Moderate Allocation Fund (one of the series comprising Strategic Funds, Inc.) as of August 31, 2011, and the related statement of operations for the year then ended, and the statement of changes in net assets and financial highlights for the year then ended and for the period from October 1, 2009 (commencement of operations) to August 31, 2010. These financial statements and financial highlights are the responsibility of the Fund’s management. Our responsibility is to express an opinion on these financial statements and financial highlights based on our audits.
We conducted our audits in accordance with the standards of the Public Company Accounting Oversight Board (United States).Those standards require that we plan and perform the audit to obtain reasonable assurance about whether the financial statements and financial highlights are free of material misstatement.We were not engaged to perform an audit of the Fund’s internal control over financial reporting. Our audits included consideration of internal control over financial reporting as a basis for designing audit procedures that are appropriate in the circumstances, but not for the purpose of expressing an opinion on the effectiveness of the Fund’s internal control over financial reporting. Accordingly, we express no such opinion.An audit also includes examining, on a test basis, evidence supporting the amounts and disclosures in the financial statements and financial highlights, assessing the accounting principles used and significant estimates made by management, and evaluating the overall financial statement presentation. Our procedures included confirmation of securities owned as of August 31, 2011 by correspondence with the custodian and others.We believe that our audits provide a reasonable basis for our opinion.
In our opinion, the financial statements and financial highlights referred to above present fairly, in all material respects, the financial position of Dreyfus Moderate Allocation Fund at August 31, 2011, the results of its operations for the year then ended and the changes in its net assets and the financial highlights for the year then ended and for the period from October 1, 2009 to August 31, 2010, in conformity with U.S. generally accepted accounting principles.

New York, New York
October 27, 2011
24
IMPORTANT TAX INFORMATION (Unaudited)
For federal tax purposes, the fund hereby designates 92.16% of the ordinary dividends paid during the fiscal year ended August 31, 2011 as qualifying for the corporate dividends received deduction.Also certain dividends paid by the fund may be subject to a maximum tax rate of 15%, as provided for by the Jobs and GrowthTax Relief Reconciliation Act of 2003. Of the distributions paid during the fiscal year, $295,183 represents the maximum amount that may be considered qualified dividend income. The fund also hereby designates $.0353 per share as a short-term capital gain distribution and $.0030 per share as a long-term capital gain distribution paid on December 31, 2010. Shareholders will receive notification in early 2012 of the percentage applicable to the preparation of their 2011 income tax returns.
OFFICERS OF THE FUND (Unaudited)
BRADLEY J. SKAPYAK, President since January 2010.
Chief Operating Officer and a director of the Manager since June 2009. From April 2003 to June 2009, Mr. Skapyak was the head of the Investment Accounting and Support Department of the Manager. He is an officer of 75 investment companies (comprised of 167 portfolios) managed by the Manager. He is 52 years old and has been an employee of the Manager since February 1988.
MICHAEL A. ROSENBERG, Vice President and Secretary since August 2005.
Assistant General Counsel of BNY Mellon, and an officer of 76 investment companies (comprised of 192 portfolios) managed by the Manager. He is 51 years old and has been an employee of the Manager since October 1991.
KIESHA ASTWOOD, Vice President and Assistant Secretary since January 2010.
Counsel of BNY Mellon, and an officer of 76 investment companies (comprised of 192 portfolios) managed by the Manager. She is 38 years old and has been an employee of the Manager since July 1995.
JAMES BITETTO, Vice President and Assistant Secretary since August 2005.
Senior Counsel of BNY Mellon and Secretary of the Manager, and an officer of 76 investment companies (comprised of 192 portfolios) managed by the Manager. He is 45 years old and has been an employee of the Manager since December 1996.
JONI LACKS CHARATAN, Vice President and Assistant Secretary since August 2005.
Senior Counsel of BNY Mellon, and an officer of 76 investment companies (comprised of 192 portfolios) managed by the Manager. She is 55 years old and has been an employee of the Manager since October 1988.
JOSEPH M. CHIOFFI, Vice President and Assistant Secretary since August 2005.
Senior Counsel of BNY Mellon, and an officer of 76 investment companies (comprised of 192 portfolios) managed by the Manager. He is 49 years old and has been an employee of the Manager since June 2000.
KATHLEEN DENICHOLAS, Vice President and Assistant Secretary since January 2010.
Managing Counsel of BNY Mellon, and an officer of 76 investment companies (comprised of 192 portfolios) managed by the Manager. She is 36 years old and has been an employee of the Manager since February 2001.
JANETTE E. FARRAGHER, Vice President and Assistant Secretary since August 2005.
Assistant General Counsel of BNY Mellon, and an officer of 76 investment companies (comprised of 192 portfolios) managed by the Manager. She is 48 years old and has been an employee of the Manager since February 1984.
JOHN B. HAMMALIAN, Vice President and Assistant Secretary since August 2005.
Senior Managing Counsel of BNY Mellon, and an officer of 76 investment companies (comprised of 192 portfolios) managed by the Manager. He is 48 years old and has been an employee of the Manager since February 1991.
M. CRISTINA MEISER, Vice President and Assistant Secretary since January 2010.
Senior Counsel of BNY Mellon, and an officer of 76 investment companies (comprised of 192 portfolios) managed by the Manager. She is 41 years old and has been an employee of the Manager since August 2001.
OFFICERS OF THE FUND (Unaudited) (continued)
ROBERT R. MULLERY, Vice President and Assistant Secretary since August 2005.
Managing Counsel of BNY Mellon, and an officer of 76 investment companies (comprised of 192 portfolios) managed by the Manager. He is 59 years old and has been an employee of the Manager since May 1986.
JEFF PRUSNOFSKY, Vice President and Assistant Secretary since August 2005.
Senior Managing Counsel of BNY Mellon, and an officer of 76 investment companies (comprised of 192 portfolios) managed by the Manager. He is 46 years old and has been an employee of the Manager since October 1990.
JAMES WINDELS, Treasurer since November 2001.
Director – Mutual Fund Accounting of the Manager, and an officer of 76 investment companies (comprised of 192 portfolios) managed by the Manager. He is 52 years old and has been an employee of the Manager since April 1985.
RICHARD CASSARO, Assistant Treasurer since January 2008.
Senior Accounting Manager – Money Market and Municipal Bond Funds of the Manager, and an officer of 76 investment companies (comprised of 192 portfolios) managed by the Manager. He is 52 years old and has been an employee of the Manager since September 1982.
GAVIN C. REILLY, Assistant Treasurer since December 2005.
Tax Manager of the Investment Accounting and Support Department of the Manager, and an officer of 76 investment companies (comprised of 192 portfolios) managed by the Manager. He is 43 years old and has been an employee of the Manager since April 1991.
ROBERT ROBOL, Assistant Treasurer since August 2005.
Senior Accounting Manager – Fixed Income Funds of the Manager, and an officer of 76 investment companies (comprised of 192 portfolios) managed by the Manager. He is 47 years old and has been an employee of the Manager since October 1988.
ROBERT SALVIOLO, Assistant Treasurer since July 2007.
Senior Accounting Manager – Equity Funds of the Manager, and an officer of 76 investment companies (comprised of 192 portfolios) managed by the Manager. He is 44 years old and has been an employee of the Manager since June 1989.
ROBERT SVAGNA, Assistant Treasurer since August 2005.
Senior Accounting Manager – Equity Funds of the Manager, and an officer of 76 investment companies (comprised of 192 portfolios) managed by the Manager. He is 44 years old and has been an employee of the Manager since November 1990.
30
JOSEPH W. CONNOLLY, Chief Compliance Officer since October 2004.
Chief Compliance Officer of the Manager and The Dreyfus Family of Funds (76 investment companies, comprised of 192 portfolios). From November 2001 through March 2004, Mr. Connolly was first Vice-President, Mutual Fund Servicing for Mellon Global Securities Services. In that capacity, Mr. Connolly was responsible for managing Mellon’s Custody, Fund Accounting and Fund Administration services to third-party mutual fund clients. He is 54 years old and has served in various capacities with the Manager since 1980, including manager of the firm’s Fund Accounting Department from 1997 through October 2001.
STEPHEN J. STOREN, Anti-Money Laundering Compliance Officer since May 2011.
Chief Compliance Officer of the Distributor, and the Anti-Money Laundering Compliance Officer of 72 investment companies (comprised of 188 portfolios) managed by the Manager. He is 56 years old and has been an employee of the Distributor since October 1999.
Item 2. Code of Ethics.
The Registrant has adopted a code of ethics that applies to the Registrant's principal executive officer, principal financial officer, principal accounting officer or controller, or persons performing similar functions. There have been no amendments to, or waivers in connection with, the Code of Ethics during the period covered by this Report.
Item 3. Audit Committee Financial Expert.
The Registrant's Board has determined that Ehud Houminer, a member of the Audit Committee of the Board, is an audit committee financial expert as defined by the Securities and Exchange Commission (the "SEC"). Ehud Houminer is "independent" as defined by the SEC for purposes of audit committee financial expert determinations.
Item 4. Principal Accountant Fees and Services.
(a) Audit Fees. The aggregate fees billed for each of the last two fiscal years (the "Reporting Periods") for professional services rendered by the Registrant's principal accountant (the "Auditor") for the audit of the Registrant's annual financial statements or services that are normally provided by the Auditor in connection with the statutory and regulatory filings or engagements for the Reporting Periods, were $79,290 in 2010 and $90,936 in 2011.
(b) Audit-Related Fees. The aggregate fees billed in the Reporting Periods for assurance and related services by the Auditor that are reasonably related to the performance of the audit of the Registrant's financial statements and are not reported under paragraph (a) of this Item 4 were $ 6,000 in 2010 and $18,000 in 2011. These services consisted of one or more of the following: (i) agreed upon procedures related to compliance with Internal Revenue Code section 817(h), (ii) security counts required by Rule 17f-2 under the Investment Company Act of 1940, as amended, (iii) advisory services as to the accounting or disclosure treatment of Registrant transactions or events and (iv) advisory services to the accounting or disclosure treatment of the actual or potential impact to the Registrant of final or proposed rules, standards or interpretations by the Securities and Exchange Commission, the Financial Accounting Standards Boards or other regulatory or standard-setting bodies.
The aggregate fees billed in the Reporting Periods for non-audit assurance and related services by the Auditor to the Registrant's investment adviser (not including any sub-investment adviser whose role is primarily portfolio management and is subcontracted with or overseen by another investment adviser), and any entity controlling, controlled by or under common control with the investment adviser that provides ongoing services to the Registrant ("Service Affiliates"), that were reasonably related to the performance of the annual audit of the Service Affiliate, which required pre-approval by the Audit Committee were $0 in 2010 and $0 in 2011.
(c) Tax Fees. The aggregate fees billed in the Reporting Periods for professional services rendered by the Auditor for tax compliance, tax advice, and tax planning ("Tax Services") were $4,701 in 2010 and $9,293 in 2011. These services consisted of: (i) review or preparation of U.S. federal, state, local and excise tax returns; (ii) U.S. federal, state and local tax planning, advice and assistance regarding statutory, regulatory or administrative developments; (iii) tax advice regarding tax qualification matters and/or treatment of various financial instruments held or proposed to be acquired or held, and (iv) determination of Passive Foreign Investment Companies. The aggregate fees billed in the Reporting Periods for Tax Services by the Auditor to Service Affiliates, which required pre-approval by the Audit Committee were $0 in 2010 and $0 in 2011.
(d) All Other Fees. The aggregate fees billed in the Reporting Periods for products and services provided by the Auditor, other than the services reported in paragraphs (a) through (c) of this Item, were $2,002 in 2010 and $17 in 2011. [These services consisted of a review of the Registrant's anti-money laundering program].
The aggregate fees billed in the Reporting Periods for Non-Audit Services by the Auditor to Service Affiliates, other than the services reported in paragraphs (b) through (c) of this Item, which required pre-approval by the Audit Committee, were $0 in 2010 and $0 in 2011.
(e)(1) Audit Committee Pre-Approval Policies and Procedures. The Registrant's Audit Committee has established policies and procedures (the "Policy") for pre-approval (within specified fee limits) of the Auditor's engagements for non-audit services to the Registrant and Service Affiliates without specific case-by-case consideration. The pre-approved services in the Policy can include pre-approved audit services, pre-approved audit-related services, pre-approved tax services and pre-approved all other services. Pre-approval considerations include whether the proposed services are compatible with maintaining the Auditor's independence. Pre-approvals pursuant to the Policy are considered annually.
(e)(2) Note: None of the services described in paragraphs (b) through (d) of this Item 4 were approved by the Audit Committee pursuant to paragraph (c)(7)(i)(C) of Rule 2-01 of Regulation S-X.
(f) None of the hours expended on the principal accountant's engagement to audit the registrant's financial statements for the most recent fiscal year were attributed to work performed by persons other than the principal account's full-time, permanent employees.
Non-Audit Fees. The aggregate non-audit fees billed by the Auditor for services rendered to the Registrant, and rendered to Service Affiliates, for the Reporting Periods were $28,173,266 in 2010 and $ 16,103,335 in 2011.
Auditor Independence. The Registrant's Audit Committee has considered whether the provision of non-audit services that were rendered to Service Affiliates, which were not pre-approved (not requiring pre-approval), is compatible with maintaining the Auditor's independence.
Item 5. Audit Committee of Listed Registrants.
Not applicable. [CLOSED-END FUNDS ONLY]
Item 6. Investments.
(a) Not applicable.
Item 7. Disclosure of Proxy Voting Policies and Procedures for Closed-End Management Investment Companies.
Not applicable. [CLOSED-END FUNDS ONLY]
Item 8. Portfolio Managers of Closed-End Management Investment Companies.
Not applicable. [CLOSED-END FUNDS ONLY, beginning with reports for periods ended on and after December 31, 2005]
Item 9. Purchases of Equity Securities by Closed-End Management Investment Companies and Affiliated Purchasers.
Not applicable. [CLOSED-END FUNDS ONLY]
Item 10. Submission of Matters to a Vote of Security Holders.
There have been no material changes to the procedures applicable to Item 10.
Item 11. Controls and Procedures.
(a) The Registrant's principal executive and principal financial officers have concluded, based on their evaluation of the Registrant's disclosure controls and procedures as of a date within 90 days of the filing date of this report, that the Registrant's disclosure controls and procedures are reasonably designed to ensure that information required to be disclosed by the Registrant on Form N-CSR is recorded, processed, summarized and reported within the required time periods and that information required to be disclosed by the Registrant in the reports that it files or submits on Form N-CSR is accumulated and communicated to the Registrant's management, including its principal executive and principal financial officers, as appropriate to allow timely decisions regarding required disclosure.
(b) There were no changes to the Registrant's internal control over financial reporting that occurred during the second fiscal quarter of the period covered by this report that have materially affected, or are reasonably likely to materially affect, the Registrant's internal control over financial reporting.
Item 12. Exhibits.
(a)(1) Code of ethics referred to in Item 2.
(a)(2) Certifications of principal executive and principal financial officers as required by Rule 30a-2(a) under the Investment Company Act of 1940.
(a)(3) Not applicable.
(b) Certification of principal executive and principal financial officers as required by Rule 30a-2(b) under the Investment Company Act of 1940.
SIGNATURES
Pursuant to the requirements of the Securities Exchange Act of 1934 and the Investment Company Act of 1940, the Registrant has duly caused this Report to be signed on its behalf by the undersigned, thereunto duly authorized.
Strategic Funds, Inc.;
By: /s/ Bradley J. Skapyak |
Bradley J. Skapyak, President |
Date: | October 24, 2011 |
|
Pursuant to the requirements of the Securities Exchange Act of 1934 and the Investment Company Act of 1940, this Report has been signed below by the following persons on behalf of the Registrant and in the capacities and on the dates indicated. |
|
By: /s/ Bradley J. Skapyak |
Bradley J. Skapyak, President |
Date: | October 24, 2011 |
|
By: /s/ James Windels |
James Windels, Treasurer |
Date: | October 24, 2011 |
|
EXHIBIT INDEX
(a)(1) Code of ethics referred to in Item 2.
(a)(2) Certifications of principal executive and principal financial officers as required by Rule 30a-2(a) under the Investment Company Act of 1940. (EX-99.CERT)
(b) Certification of principal executive and principal financial officers as required by Rule 30a-2(b) under the Investment Company Act of 1940. (EX-99.906CERT)