UNITED STATES
SECURITIES AND EXCHANGE COMMISSION
Washington, D.C. 20549
FORM N-CSR
CERTIFIED SHAREHOLDER REPORT OF REGISTERED MANAGEMENT
INVESTMENT COMPANIES
Investment Company Act file number | 811- 3940 |
| |
| Strategic Funds, Inc. | |
| (Exact name of Registrant as specified in charter) | |
| | |
| c/o The Dreyfus Corporation 200 Park Avenue New York, New York 10166 | |
| (Address of principal executive offices) (Zip code) | |
| | |
| Janette E. Farragher, Esq. 200 Park Avenue New York, New York 10166 | |
| (Name and address of agent for service) | |
|
Registrant's telephone number, including area code: | (212) 922-6000 |
| |
Date of fiscal year end: | 5/31 | |
Date of reporting period: | 5/31/12 | |
| | |
| | | | | | | |
The following N-CSR relates only to the Registrant’s series listed below and does not affect the other series of the Registrant, which have different fiscal year ends and, therefore, different N-CSR reporting requirements. Separate N-CSR Forms will be filed for these series, as appropriate.
Dreyfus Select Managers Small Cap Growth Fund
FORM N-CSR
Item 1. Reports to Stockholders.
|
| Dreyfus |
| Select Managers |
| Small Cap Growth Fund |
ANNUAL REPORT May 31, 2012

Save time. Save paper. View your next shareholder report online as soon as it’s available. Log into www.dreyfus.com and sign up for Dreyfus eCommunications. It’s simple and only takes a few minutes.
The views expressed in this report reflect those of the portfolio manager only through the end of the period covered and do not necessarily represent the views of Dreyfus or any other person in the Dreyfus organization. Any such views are subject to change at any time based upon market or other conditions and Dreyfus disclaims any responsibility to update such views.These views may not be relied on as investment advice and, because investment decisions for a Dreyfus fund are based on numerous factors, may not be relied on as an indication of trading intent on behalf of any Dreyfus fund.
|
| Not FDIC-Insured • Not Bank-Guaranteed • May Lose Value |
| | Contents |
| | THE FUND |
| 2 | A Letter from the Chairman and CEO |
| 3 | Discussion of Fund Performance |
| 6 | Fund Performance |
| 8 | Understanding Your Fund’s Expenses |
| 8 | Comparing Your Fund’s Expenses With Those of Other Funds |
| 9 | Statement of Investments |
| 18 | Statement of Assets and Liabilities |
| 19 | Statement of Operations |
| 20 | Statement of Changes in Net Assets |
| 22 | Financial Highlights |
| 25 | Notes to Financial Statements |
| 35 | Report of Independent Registered Public Accounting Firm |
| 36 | Board Members Information |
| 39 | Officers of the Fund |
| | FOR MORE INFORMATION |
| | Back Cover |
Dreyfus
Select Managers
Small Cap Growth Fund
The Fund

A LETTER FROM THE CHAIRMAN AND CEO
Dear Shareholder:
We are pleased to present this annual report for Dreyfus Select Managers Small Cap Growth Fund, covering the 12-month period from June 1, 2011, through May 31, 2012. For information about how the fund performed during the reporting period, as well as general market perspectives, we provide a Discussion of Fund Performance on the pages that follow.
The market rebound that drove stock prices higher during the fall and winter seemed to sputter toward the end of the first quarter 2012, primarily due to a resurgent European debt crisis and renewed U.S. economic concerns, including disappointing employment data. Consequently, stocks ended the reporting period with low or negative returns, on average, with steeper declines among smaller companies and more mild losses for large-cap stocks.
Despite the market’s recent swoon, we believe that trends in many of the more economically sensitive areas of the U.S. economy remain favorable. For example, in the automobile industry, new cars offer improved gas mileage, the average age of the auto fleet is old, and credit is widely available at a time when household debt-service ratios have dropped sharply. Even residential construction has moved into a sustainable uptrend, in our opinion, as employment has expanded and homebuilders have seen a rise in orders. On the other hand, net exports may prove to be a slight drag on domestic growth since the economy in the United States is stronger than in many of its trading partners. On the whole, we expect near-trend growth in the U.S. economy for the remainder of 2012.
As always, we encourage you to discuss our observations with your financial advisor.
Thank you for your continued confidence and support.
Jonathan R. Baum
Chairman and Chief Executive Officer
The Dreyfus Corporation
June 15, 2012
2

DISCUSSION OF FUND PERFORMANCE
For the period of June 1, 2011, through May 31, 2012, as provided by Keith L. Stransky and Robert B. Mayerick, Portfolio Allocation Managers, EACM Advisors LLC
Fund and Market Performance Overview
For the 12-month period ended May 31, 2012, Dreyfus Select Managers Small Cap Growth Fund’s Class A shares produced a total return of –6.70%, Class C shares returned –7.30% and Class I shares returned –6.41%.1 In comparison, the total return of the Russell 2000 Growth Index (the “Index”), the fund’s benchmark, was –9.46% for the same period.2 Small-cap stocks declined sharply over the summer of 2011 due to disappointing U.S. economic data and a worsening European debt crisis, and a subsequent rally was not enough to offset those losses from early in the reporting period.The fund outperformed the Index, mainly due to a focus on companies benefiting from positive secular trends.
The Fund’s Investment Approach
The fund seeks long-term capital appreciation. To pursue its goal, the fund normally invests at least 80% of its assets in the stocks of small-cap companies.
The fund uses a “multi-manager” approach by selecting one or more sub-advisers to manage its assets.We seek sub-advisers that complement one another’s style of investing.We monitor and evaluate the performance of the sub-advisers and will make corresponding recommendations to Dreyfus and the fund’s Board.
The fund’s assets are currently under the day-to-day portfolio management of five sub-advisers, each of whom acts independently and uses their own methodology to select investments.At the end of the reporting period, 21% of the fund’s assets are under the management of Riverbridge Partners, LLC, which employs a bottom-up approach to stock selection and focuses on companies that are building their earnings power and intrinsic value over long periods of time.Approximately 28% of the fund’s assets are under the management of Geneva Capital Management Ltd., which employs bottom-up fundamental analysis supplemented by top-down considerations to identify companies that
DISCUSSION OF FUND PERFORMANCE (continued)
perform well over long periods of time.Approximately 19% of the fund’s assets are under the management of Cupps Capital Management, LLC, which employs a proprietary investment framework to evaluate the attractiveness of stocks. King Investment Advisors, Inc., which uses a bottom-up approach seeking stocks trading at a discount to private market value that possess a growth catalyst, and Nicholas Investment Partners, L.P., which employs quantitative/qualitative analysis to identify companies experiencing positive change in seeking above-expected growth, manage 15% and 17%, respectively, of the fund’s assets. These percentages can change over time, within ranges described in the prospectus.
Changing Economic Data Fueled Market Volatility
Equity markets floundered early in the reporting period, mainly due to a debt crisis in Greece that threatened other members of the European Union and uncertainties regarding the sustainability of the U.S. economic recovery.These issues led investors to avoid many of the market’s riskier areas, including small-cap stocks, and they focused instead on traditionally defensive investments. Many of these concerns abated over the final months of 2011 and early 2012 as investors responded to better U.S. economic data and what seemed to be credible measures by European policymakers to address the sovereign debt crisis. Consequently, investors shifted their attention to riskier assets.
However, new developments in the spring of 2012 called some of these positive influences into question. The U.S. labor market’s rebound slowed markedly as the public sector shed jobs and employment gains in the private sector proved more anemic than expected. Austerity measures designed to relieve fiscal pressures in Europe were resisted by voters in France, Greece and Germany, raising questions regarding the region’s economic prospects.These threats to global growth caused most stock market averages, including the Index, to decline in April and May.
Secular Growers Bolstered Fund Performance
The fund’s relative performance was buoyed by its sub-advisers’ focus on companies benefiting from positive trends unrelated to the economic cycle. For example, in the information technology sector, a number of suppliers of components used in products made by large-cap electronics innovator Apple gained value on the strength of robust sales of the company’s smartphones and tablet computers. Indeed, the fund maintained overweighted exposure to the information technology sector,
4
where other strong performers included semiconductor devices maker Mellanox Technologies and software developer Tyler Technologies, both of which raised their revenue guidance they provide to analysts. Above-average results in the consumer discretionary sector were supported by retailer Ulta Salon, Cosmetics & Fragrance, which opened new stores to accommodate rising demand for its beauty products, and sporting goods seller Hibbett Sports, which raised its earnings outlook twice during the reporting period.
On the other hand, the fund encountered disappointments in the financials sector, as retirement planning specialist Financial Engines was hurt by elevated stock market volatility. Among telecommunications services companies, Latin American wireless operator NII Holdings, which was sold during the reporting period, declined after reducing its 2012 earnings forecast due to sluggish customer demand.
Positioned for Continued Volatility
Congressional gridlock, the U.S presidential election and the European sovereign debt crisis may continue to spark bouts of heightened volatility in equity markets. Therefore, we have maintained the fund’s focus on small-cap companies with track records of consistent growth in businesses that tend to be relatively insensitive to overseas turmoil and a changing domestic economy.
June 15, 2012
Equity funds are subject generally to market, market sector, market liquidity, issuer and investment style risks, among other factors, to varying degrees, all of which are more fully described in the fund’s prospectus.
The prices of small company stocks tend to be more volatile than the prices of large company stocks, mainly because these companies have less established and more volatile earnings histories. They also tend to be less liquid than larger company stocks.
| |
| 1 | Total return includes reinvestment of dividends and any capital gains paid, and does not take into |
| | consideration the maximum initial sales charge in the case of Class A shares, or the applicable |
| | contingent deferred sales charge imposed on redemptions in the case of Class C shares. Had these |
| | charges been reflected, returns would have been lower. Past performance is no guarantee of future |
| | results. Share price and investment return fluctuate such that upon redemption, fund shares may be |
| | worth more or less than their original cost. Return figures provided reflect the absorption of certain |
| | fund expenses by The Dreyfus Corporation pursuant to an undertaking in effect through October |
| | 1, 2012, at which time it may be extended, terminated or modified. Had these expenses not been |
| | absorbed, the fund’s returns would have been lower. |
| 2 | SOURCE: LIPPER INC. — The Russell 2000 Growth Index is an unmanaged index, |
| | which measures the performance of those Russell 2000 companies with higher price-to-book ratios |
| | and higher forecasted growth values.The total return figure cited for this index assumes change in |
| | security prices and reinvestment of dividends, but does not reflect the costs of managing a mutual |
| | fund. Investors cannot invest directly in any index. |
FUND PERFORMANCE
|
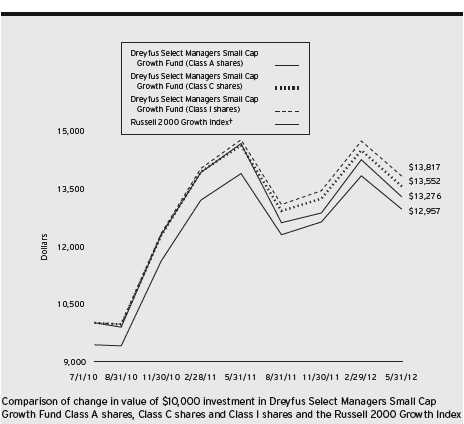
| † Source: Lipper Inc. |
| Past performance is not predictive of future performance. |
| The above graph compares a $10,000 investment made in Class A, Class C and Class I shares of Dreyfus Select |
| Managers Small Cap Growth Fund on 7/1/10 (inception date) to a $10,000 investment made in the Russell 2000 |
| Growth Index (the “Index”) on that date.All dividends and capital gain distributions are reinvested. |
| The fund’s performance shown in the line graph takes into account the maximum initial sales charge on Class A shares |
| and all other applicable fees and expenses on all classes.The Index is an unmanaged index, which measures the |
| performance of those Russell 2000 companies with higher price-to-book ratios and higher forecasted growth values. Unlike |
| a mutual fund, the Index is not subject to charges, fees and other expenses. Investors cannot invest directly in any index |
| Further information relating to fund performance, including expense reimbursements, if applicable, is contained in the |
| Financial Highlights section of the prospectus and elsewhere in this report. |
6
| | | | | |
| Average Annual Total Returns as of 5/31/12 | | |
| |
| | Inception | | From |
| | Date | 1Year | Inception |
| Class A shares | | | |
| with maximum sales charge (5.75%) | 7/1/10 | –12.06% | 14.44% |
| without sales charge | 7/1/10 | –6.70% | 18.02% |
| Class C shares | | | |
| with applicable redemption charge † | 7/1/10 | –8.23% | 17.15% |
| without redemption | 7/1/10 | –7.30% | 17.15% |
| Class I shares | 7/1/10 | –6.41% | 18.34% |
| Russell 2000 Growth Index | 6/30/10 | –9.46% | 15.93%†† |
Past performance is not predictive of future performance.The fund’s performance shown in the graph and table does not reflect the deduction of taxes that a shareholder would pay on fund distributions or the redemption of fund shares.
| |
| † | The maximum contingent deferred sales charge for Class C shares is 1% for shares redeemed within one year of the |
| | date of purchase. |
| †† | For comparative purposes, the value of the Index as of 6/30/10 is used as the beginning value on 7/1/10. |
UNDERSTANDING YOUR FUND’S EXPENSES (Unaudited)
As a mutual fund investor, you pay ongoing expenses, such as management fees and other expenses. Using the information below, you can estimate how these expenses affect your investment and compare them with the expenses of other funds.You also may pay one-time transaction expenses, including sales charges (loads) and redemption fees, which are not shown in this section and would have resulted in higher total expenses. For more information, see your fund’s prospectus or talk to your financial adviser.
Review your fund’s expenses
The table below shows the expenses you would have paid on a $1,000 investment in Dreyfus Select Managers Small Cap Growth Fund from December 1, 2011 to May 31, 2012. It also shows how much a $1,000 investment would be worth at the close of the period, assuming actual returns and expenses.
Expenses and Value of a $1,000 Investment
assuming actual returns for the six months ended May 31, 2012
| | | | | | |
| | | Class A | | Class C | | Class I |
| Expenses paid per $1,000† | $ | 6.79 | $ | 9.97 | $ | 5.02 |
| Ending value (after expenses) | $ | 1,026.40 | $ | 1,024.30 | $ | 1,028.10 |
COMPARING YOUR FUND’S EXPENSES
WITH THOSE OF OTHER FUNDS (Unaudited)
Using the SEC’s method to compare expenses
The Securities and Exchange Commission (SEC) has established guidelines to help investors assess fund expenses. Per these guidelines, the table below shows your fund’s expenses based on a $1,000 investment, assuming a hypothetical 5% annualized return. You can use this information to compare the ongoing expenses (but not transaction expenses or total cost) of investing in the fund with those of other funds.All mutual fund shareholder reports will provide this information to help you make this comparison. Please note that you cannot use this information to estimate your actual ending account balance and expenses paid during the period.
Expenses and Value of a $1,000 Investment
assuming a hypothetical 5% annualized return for the six months ended May 31, 2012
| | | | | | |
| | | Class A | | Class C | | Class I |
| Expenses paid per $1,000† | $ | 6.76 | $ | 9.92 | $ | 5.00 |
| Ending value (after expenses) | $ | 1,018.30 | $ | 1,015.15 | $ | 1,020.05 |
|
| † Expenses are equal to the fund’s annualized expense ratio of 1.34% for Class A, 1.97% for Class C and .99% |
| for Class I, multiplied by the average account value over the period, multiplied by 183/366 (to reflect the one-half |
| year period). |
8
|
| STATEMENT OF INVESTMENTS |
| May 31, 2012 |
| | | |
| Common Stocks—96.6% | Shares | Value ($) |
| Consumer Discretionary—18.8% | | |
| Arctic Cat | 15,923b | 575,775 |
| BJ’s Restaurants | 22,550b | 987,464 |
| Body Central | 14,668b | 214,886 |
| Bravo Brio Restaurant Group | 51,175b | 840,294 |
| Brunswick | 12,515 | 274,079 |
| Callaway Golf | 256,100a | 1,413,672 |
| Capella Education | 7,145b | 219,423 |
| Caribou Coffee | 25,815b | 307,199 |
| Cheesecake Factory | 30,030b | 974,173 |
| Dick’s Sporting Goods | 13,480 | 626,820 |
| DSW, Cl. A | 5,201 | 310,396 |
| DTS | 21,740b | 600,676 |
| Elizabeth Arden | 15,603b | 537,679 |
| Express | 10,260b | 189,810 |
| FactSet Research Systems | 8,490a | 895,101 |
| Fifth & Pacific Companies | 37,734a,b | 451,676 |
| Fuel Systems Solutions | 14,895b | 223,425 |
| GNC Holdings, Cl. A | 8,122 | 312,941 |
| Grand Canyon Education | 40,438b | 732,737 |
| Hibbett Sports | 30,440b | 1,705,553 |
| IMAX | 14,888a,b | 316,221 |
| Jones Group | 29,588 | 285,228 |
| JOS. A. Bank Clothiers | 14,970b | 664,069 |
| La-Z-Boy | 36,966b | 521,590 |
| Liquidity Services | 25,513b | 1,630,026 |
| Lithia Motors, Cl. A | 12,894 | 314,871 |
| LKQ | 71,950b | 2,621,858 |
| Lumber Liquidators Holdings | 10,974a,b | 319,234 |
| Mattress Firm Holding | 6,960a | 238,241 |
| Meritage Homes | 15,553b | 466,746 |
| Millennial Media | 18,097 | 249,377 |
| Mobile Mini | 17,195b | 236,259 |
| MWI Veterinary Supply | 14,000b | 1,301,300 |
| Orient-Express Hotels, Cl. A | 81,100b | 684,484 |
| Pacific Sunwear of California | 411,600a,b | 588,588 |
STATEMENT OF INVESTMENTS (continued)
| | | |
| Common Stocks (continued) | Shares | Value ($) |
| Consumer Discretionary (continued) | | |
| Panera Bread, Cl. A | 7,040b | 1,034,528 |
| Rentrak | 9,388b | 152,086 |
| Saks | 21,773a,b | 214,682 |
| Select Comfort | 46,727b | 1,278,451 |
| Shutterfly | 38,900b | 1,072,473 |
| Sonic Automotive, Cl. A | 20,651a | 307,493 |
| Sotheby’s | 40,025 | 1,220,763 |
| Steven Madden | 9,694b | 392,995 |
| Susser Holdings | 18,061b | 528,284 |
| Team | 24,660b | 657,929 |
| Tesla Motors | 25,970a,b | 766,115 |
| Tilly’s, Cl. A | 30,881 | 502,743 |
| Titan International | 15,149a | 339,338 |
| Tumi Holdings | 8,186a | 141,209 |
| Ulta Salon, Cosmetics & Fragrance | 12,695 | 1,134,552 |
| United Rentals | 28,110b | 971,201 |
| Vitamin Shoppe | 24,660b | 1,221,163 |
| Westport Innovations | 40,066a,b | 978,011 |
| | | 35,745,887 |
| Consumer Staples—3.2% | | |
| Annie’s | 16,031 | 643,645 |
| Calavo Growers | 14,227 | 389,678 |
| Cott | 107,500b | 812,700 |
| Fresh Market | 27,057a,b | 1,572,552 |
| SUPERVALU | 100,000a | 452,000 |
| TreeHouse Foods | 15,840b | 903,038 |
| United Natural Foods | 26,215b | 1,329,100 |
| | | 6,102,713 |
| Energy—4.0% | | |
| Berry Petroleum, Cl. A | 6,165 | 239,880 |
| Dril-Quip | 17,310b | 1,048,813 |
| Energy XXI | 16,308 | 506,363 |
| Flotek Industries | 41,075b | 437,449 |
| Gulfport Energy | 52,207b | 964,785 |
| Key Energy Services | 23,536b | 233,242 |
| Kodiak Oil & Gas | 38,516b | 312,365 |
10
| | | |
| Common Stocks (continued) | Shares | Value ($) |
| Energy (continued) | | |
| OYO Geospace | 3,455b | 320,589 |
| Rosetta Resources | 21,495b | 831,642 |
| SM Energy | 14,060 | 760,505 |
| Superior Energy Services | 54,475b | 1,178,839 |
| Tesco | 63,900b | 768,078 |
| | | 7,602,550 |
| Exchange Traded Funds—1.8% | | |
| iShares Russell 2000 Growth Index Fund | 15,363 | 1,337,656 |
| iShares Russell 2000 Index Fund | 27,153 | 2,066,614 |
| | | 3,404,270 |
| Financial—7.3% | | |
| Affiliated Managers Group | 5,320b | 548,332 |
| Cardtronics | 12,622b | 353,668 |
| Cass Information Systems | 15,313 | 563,978 |
| Coinstar | 15,375a,b | 944,486 |
| Ellie Mae | 20,258b | 329,192 |
| Financial Engines | 73,016a,b | 1,531,876 |
| First Commonwealth Financial | 122,000 | 764,940 |
| HFF, Cl. A | 27,533b | 360,132 |
| Howard Hughes | 7,899b | 472,913 |
| MarketAxess Holdings | 34,685 | 1,119,979 |
| MetroCorp Bancshares | 103,000b | 978,500 |
| OceanFirst Financial | 37,700 | 531,570 |
| Portfolio Recovery Associates | 13,220b | 913,634 |
| PrivateBancorp | 4,965 | 73,134 |
| SPS Commerce | 33,486b | 925,553 |
| Stewart Information Services | 49,300a | 681,819 |
| Stifel Financial | 5,465b | 173,732 |
| Strategic Hotels & Resorts | 55,716b,c | 347,111 |
| Texas Capital Bancshares | 44,143b | 1,711,866 |
| Western Alliance Bancorp | 49,797b | 434,230 |
| | | 13,760,645 |
| Health Care—16.0% | | |
| Abaxis | 22,825b | 747,290 |
| ABIOMED | 52,131a,b | 1,059,823 |
| Achillion Pharmaceuticals | 19,700a,b | 141,446 |
STATEMENT OF INVESTMENTS (continued)
| | | |
| Common Stocks (continued) | Shares | Value ($) |
| Health Care (continued) | | |
| Air Methods | 3,429b | 312,553 |
| Alkermes | 27,159b | 424,224 |
| AngioDynamics | 21,563b | 259,619 |
| Arena Pharmaceuticals | 53,450b | 357,581 |
| Auxilium Pharmaceuticals | 79,100b | 1,510,810 |
| Bio-Reference Labs | 35,960b | 691,511 |
| BioScrip | 217,400b | 1,469,624 |
| Cantel Medical | 36,342 | 794,436 |
| Cardiovascular Systems | 1,330a,b | 12,023 |
| Cepheid | 60,898b | 2,303,771 |
| DexCom | 34,704b | 373,068 |
| Dynavax Technologies | 106,794b | 402,613 |
| Emergent BioSolutions | 64,750b | 933,695 |
| Endologix | 29,663b | 403,120 |
| Exact Sciences | 27,285b | 269,576 |
| Genomic Health | 14,500b | 489,955 |
| Haemonetics | 13,045b | 909,367 |
| Healthcare Services Group | 59,055 | 1,154,525 |
| Hologic | 67,900b | 1,138,004 |
| IDEXX Laboratories | 9,110b | 772,892 |
| Illumina | 17,400a,b | 749,244 |
| Incyte | 9,171a,b | 195,434 |
| Insulet | 10,945b | 201,607 |
| IPC The Hospitalist | 15,170b | 530,798 |
| Jazz Pharmaceuticals | 8,725b | 376,920 |
| Luminex | 18,700b | 414,205 |
| MAKO Surgical | 6,653b | 151,090 |
| MAP Pharmaceuticals | 10,671a,b | 125,598 |
| Mednax | 15,780b | 962,738 |
| Medtox Scientific | 12,405b | 250,705 |
| Neogen | 42,856b | 1,668,813 |
| PAREXEL International | 97,935b | 2,620,741 |
| Questcor Pharmaceuticals | 7,875a,b | 326,025 |
| Salix Pharmaceuticals | 3,411b | 176,724 |
| STAAR Surgical | 26,612b | 225,936 |
| SXC Health Solutions | 17,972a,b | 1,612,268 |
12
| | | |
| Common Stocks (continued) | Shares | Value ($) |
| Health Care (continued) | | |
| Techne | 23,435 | 1,590,299 |
| Theravance | 10,822a,b | 223,907 |
| Thoratec | 21,400b | 649,276 |
| Tornier | 17,997b | 355,441 |
| | | 30,339,295 |
| Industrial—13.6% | | |
| Acuity Brands | 20,190 | 1,100,355 |
| Allegiant Travel | 14,805a,b | 960,104 |
| American Railcar Industries | 17,786b | 376,174 |
| Barnes Group | 21,015 | 489,019 |
| Beacon Roofing Supply | 39,010b | 969,398 |
| Chart Industries | 23,648b | 1,477,054 |
| Chemed | 21,265a | 1,181,271 |
| CoStar Group | 8,885b | 656,513 |
| Donaldson | 22,405 | 801,427 |
| Echo Global Logistics | 32,609b | 554,679 |
| Forrester Research | 9,795 | 316,183 |
| Forward Air | 14,590 | 462,941 |
| GATX | 5,360 | 205,234 |
| Genesee & Wyoming, Cl. A | 23,815b | 1,193,370 |
| Heritage-Crystal Clean | 8,375b | 163,815 |
| Hexcel | 26,411b | 643,900 |
| HMS Holdings | 49,910b | 1,337,089 |
| Marten Transport | 44,560 | 912,143 |
| MAXIMUS | 24,325 | 1,107,031 |
| Middleby | 14,861b | 1,519,834 |
| Monro Muffler Brake | 23,922 | 808,324 |
| Newpark Resources | 28,888b | 167,262 |
| Old Dominion Freight Line | 6,061b | 264,017 |
| Orbital Sciences | 79,300b | 887,367 |
| Polypore International | 8,197a,b | 303,207 |
| Proto Labs | 20,892 | 770,706 |
| RailAmerica | 17,116b | 407,703 |
| Resources Connection | 38,410 | 460,920 |
| Ritchie Brothers Auctioneers | 45,100a | 893,882 |
| Rollins | 75,280 | 1,598,947 |
STATEMENT OF INVESTMENTS (continued)
| | | |
| Common Stocks (continued) | Shares | Value ($) |
| Industrial (continued) | | |
| Swift Transportation | 15,550b | 164,986 |
| Tennant | 6,770 | 285,694 |
| Textainer Group Holdings | 7,088 | 232,983 |
| Titan Machinery | 11,916b | 367,609 |
| Triumph Group | 8,963 | 536,346 |
| US Airways Group | 49,832b | 658,779 |
| USG | 38,800a,b | 598,296 |
| | | 25,834,562 |
| Information Technology—27.8% | | |
| 3D Systems | 14,653a,b | 445,451 |
| Active Network | 20,394 | 286,332 |
| Aspen Technology | 14,599b | 322,638 |
| athenahealth | 26,485a,b | 1,925,195 |
| Bottomline Technologies | 42,240b | 755,251 |
| Brightcove | 8,245 | 104,547 |
| BroadSoft | 15,254b | 416,587 |
| Cabot Microelectronics | 17,905 | 561,143 |
| Cirrus Logic | 17,986b | 516,558 |
| Cogent Communications Group | 22,200b | 393,828 |
| Cognex | 9,580 | 335,204 |
| CommVault Systems | 21,741b | 1,019,000 |
| Concur Technologies | 32,505b | 2,010,434 |
| Constant Contact | 48,960b | 991,441 |
| Cornerstone OnDemand | 18,685b | 374,634 |
| Cymer | 14,460b | 783,298 |
| DealerTrack Holdings | 26,875b | 733,687 |
| Demandware | 21,097a | 656,327 |
| Digi International | 58,970b | 533,089 |
| Ebix | 32,155a | 559,497 |
| Envivio | 28,699 | 240,785 |
| ExlService Holdings | 19,570b | 424,082 |
| FARO Technologies | 18,925b | 873,010 |
| Fortinet | 28,129b | 597,741 |
| Fusion-io | 31,680a | 661,478 |
| Gentex | 35,433 | 790,156 |
| Guidewire Software | 16,995 | 440,340 |
14
| | | |
| Common Stocks (continued) | Shares | Value ($) |
| Information Technology (continued) | | |
| HealthStream | 25,914b | 547,304 |
| Imperva | 6,495 | 166,986 |
| inContact | 32,359b | 169,238 |
| Infoblox | 16,669 | 329,880 |
| InnerWorkings | 58,140a,b | 685,471 |
| Interactive Intelligence Group | 35,450b | 914,610 |
| InvenSense | 42,991a | 427,331 |
| Jive Software | 10,447a | 174,987 |
| Kenexa | 13,413b | 391,257 |
| Kulicke & Soffa Industries | 21,046b | 221,404 |
| LivePerson | 26,656b | 460,083 |
| Maxwell Technologies | 30,985a,b | 214,726 |
| Medidata Solutions | 42,345b | 1,196,670 |
| Mellanox Technologies | 13,881b | 839,106 |
| National Instruments | 50,872 | 1,324,707 |
| NetSuite | 37,197b | 1,745,283 |
| Omnicell | 61,000b | 798,490 |
| OpenTable | 25,700a,b | 1,020,804 |
| Opnet Technologies | 21,245 | 530,488 |
| Pegasystems | 36,412a | 1,128,408 |
| Power Integrations | 20,910 | 853,337 |
| Procera Networks | 24,443b | 510,859 |
| PROS Holdings | 27,711b | 416,496 |
| QLIK Technologies | 8,345b | 189,682 |
| Quality Systems | 21,950 | 627,990 |
| Rackspace Hosting | 16,964b | 839,209 |
| Riverbed Technology | 37,295b | 611,638 |
| SciQuest | 25,023b | 393,862 |
| Semtech | 46,485b | 1,119,824 |
| Shuffle Master | 19,961b | 316,581 |
| Silicon Motion Technology, ADR | 7,966a,b | 107,860 |
| SolarWinds | 15,130b | 693,862 |
| Sourcefire | 20,634b | 1,138,171 |
| Splunk | 4,761 | 155,018 |
| Stratasys | 19,740b | 938,045 |
| Synaptics | 24,050b | 645,021 |
STATEMENT OF INVESTMENTS (continued)
| | | |
| Common Stocks (continued) | Shares | Value ($) |
| Information Technology (continued) | | |
| Synchronoss Technologies | 12,586b | 225,415 |
| Take-Two Interactive Software | 91,500b | 1,054,080 |
| Tangoe | 15,520 | 299,691 |
| Teradyne | 9,512b | 137,448 |
| Travelzoo | 34,825a,b | 812,119 |
| Tyler Technologies | 42,035b | 1,567,906 |
| Ultimate Software Group | 61,856b | 4,968,892 |
| Ultratech | 21,975b | 666,282 |
| Veeco Instruments | 25,505a,b | 884,513 |
| Verint Systems | 22,200b | 637,584 |
| Vocera Communications | 17,231 | 416,129 |
| Yelp | 25,664a | 428,845 |
| | | 52,695,325 |
| Materials—2.4% | | |
| American Vanguard | 4,581 | 123,458 |
| Balchem | 22,135 | 642,800 |
| CIRCOR International | 21,185 | 681,945 |
| GSE Holding | 14,601 | 159,151 |
| Intrepid Potash | 41,100b | 806,793 |
| Kaiser Aluminum | 4,829 | 231,744 |
| RBC Bearings | 26,585b | 1,233,544 |
| Sensient Technologies | 17,435 | 636,726 |
| | | 4,516,161 |
| Telecommunications—1.7% | | |
| Allot Communications | 19,568b | 509,159 |
| EZchip Semiconductor | 19,090a,b | 705,566 |
| IPG Photonics | 20,096b | 860,108 |
| Ixia | 27,471b | 290,643 |
| LogMeIn | 19,175b | 614,559 |
| Ubiquiti Networks | 13,187 | 245,938 |
| | | 3,225,973 |
| Total Common Stocks | | |
| (cost $170,528,440) | | 183,227,381 |
16
| | | | |
| Investment of Cash Collateral | | |
| for Securities Loaned—12.8% | Shares | Value ($) |
| Registered Investment Company; | | |
| Dreyfus Institutional Cash | | |
| Advantage Fund | | |
| (cost $24,229,303) | 24,229,303d | 24,229,303 |
| |
| Total Investments (cost $194,757,743) | 109.4% | 207,456,684 |
| Liabilities, Less Cash and Receivables | (9.4%) | (17,789,722) |
| Net Assets | 100.0% | 189,666,962 |
ADR—American Depository Receipts
|
| a Security, or portion thereof, on loan.At May 31, 2012, the value of the fund’s securities on loan was $23,240,362 |
| and the value of the collateral held by the fund was $24,246,265, consisting of cash collateral of $24,229,303 and |
| U.S. Government Agency securities valued at $16,962. |
| b Non-income producing security. |
| c Investment in real estate investment trust. |
| d Investment in affiliated money market mutual fund. |
| | | |
| Portfolio Summary (Unaudited)† | | |
| |
| | Value (%) | | Value (%) |
| Information Technology | 27.8 | Energy | 4.0 |
| Consumer Discretionary | 18.8 | Consumer Staples | 3.2 |
| Health Care | 16.0 | Materials | 2.4 |
| Industrial | 13.6 | Exchange Traded Funds | 1.8 |
| Money Market Investment | 12.8 | Telecommunications | 1.7 |
| Financial | 7.3 | | 109.4 |
| |
| † Based on net assets. | | | |
| See notes to financial statements. | | | |
|
| STATEMENT OF ASSETS AND LIABILITIES |
| May 31, 2012 |
| | | | |
| | | Cost | Value |
| Assets ($): | | | |
| Investments in securities—See Statement of Investments (including | | |
| securities on loan, valued at $23,240,362)—Note 1(b): | | |
| Unaffiliated issuers | | 170,528,440 | 183,227,381 |
| Affiliated issuers | | 24,229,303 | 24,229,303 |
| Cash | | | 6,868,922 |
| Receivable for investment securities sold | | | 1,586,337 |
| Receivable for shares of Common Stock subscribed | | | 225,400 |
| Dividends and securities lending income receivable | | | 83,705 |
| Prepaid expenses | | | 26,666 |
| | | | 216,247,714 |
| Liabilities ($): | | | |
| Due to The Dreyfus Corporation and affiliates—Note 3(c) | | 165,379 |
| Liability for securities on loan—Note 1(b) | | | 24,229,303 |
| Payable for investment securities purchased | | | 2,089,924 |
| Payable for shares of Common Stock redeemed | | | 20,068 |
| Accrued expenses | | | 76,078 |
| | | | 26,580,752 |
| Net Assets ($) | | | 189,666,962 |
| Composition of Net Assets ($): | | | |
| Paid-in capital | | | 184,247,847 |
| Accumulated net realized gain (loss) on investments | | | (7,279,826) |
| Accumulated net unrealized appreciation | | | |
| (depreciation) on investments | | | 12,698,941 |
| Net Assets ($) | | | 189,666,962 |
| |
| |
| Net Asset Value Per Share | | | |
| | Class A | Class C | Class I |
| Net Assets ($) | 429,719 | 46,565 | 189,190,678 |
| Shares Outstanding | 25,083 | 2,757 | 10,985,110 |
| Net Asset Value Per Share ($) | 17.13 | 16.89 | 17.22 |
| See notes to financial statements. | | | |
18
| | |
| STATEMENT OF OPERATIONS | |
| Year Ended May 31, 2012 | |
| |
| |
| |
| |
| Investment Income ($): | |
| Income: | |
| Cash dividends (net of $3,408 foreign taxes withheld at source) | 707,439 |
| Income from securities lending—Note 1(b) | 254,158 |
| Total Income | 961,597 |
| Expenses: | |
| Management fee—Note 3(a) | 1,285,973 |
| Professional fees | 56,466 |
| Registration fees | 53,422 |
| Custodian fees—Note 3(c) | 35,803 |
| Prospectus and shareholders’ reports | 15,794 |
| Shareholder servicing costs—Note 3(c) | 6,582 |
| Directors’ fees and expenses—Note 3(d) | 3,733 |
| Loan commitment fees—Note 2 | 1,334 |
| Distribution fees—Note 3(b) | 971 |
| Miscellaneous | 18,255 |
| Total Expenses | 1,478,333 |
| Less—reduction in management fee due to undertaking—Note 3(a) | (22,768) |
| Less—reduction in fees due to earnings credits—Note 3(c) | (4) |
| Net Expenses | 1,455,561 |
| Investment (Loss)—Net | (493,964) |
| Realized and Unrealized Gain (Loss) on Investments—Note 4 ($): | |
| Net realized gain (loss) on investments | (6,229,127) |
| Net unrealized appreciation (depreciation) on investments | (2,036,149) |
| Net Realized and Unrealized Gain (Loss) on Investments | (8,265,276) |
| Net (Decrease) in Net Assets Resulting from Operations | (8,759,240) |
| See notes to financial statements. | |
STATEMENT OF CHANGES IN NET ASSETS
| | | | |
| | | Year Ended May 31, |
| | 2012 | 2011a |
| Operations ($): | | |
| Investment (loss)—net | (493,964) | (382,189) |
| Net realized gain (loss) on investments | (6,229,127) | (924,132) |
| Net unrealized appreciation | | |
| (depreciation) on investments | (2,036,149) | 14,735,090 |
| Net Increase (Decrease) in Net Assets | | |
| Resulting from Operations | (8,759,240) | 13,428,769 |
| Dividends to Shareholders from ($): | | |
| Return of capital: | | |
| Class A Shares | — | (3,991) |
| Class C Shares | — | (3,855) |
| Class I Shares | — | (87,963) |
| Total Dividends | — | (95,809) |
| Capital Stock Transactions ($): | | |
| Net proceeds from shares sold: | | |
| Class A Shares | 581,804 | 1,543,542 |
| Class C Shares | 16,201 | 1,040,566 |
| Class I Shares | 112,376,547 | 107,868,046 |
| Dividends reinvested: | | |
| Class A Shares | — | 151 |
| Class C Shares | — | 15 |
| Class I Shares | — | 37,375 |
| Cost of shares redeemed: | | |
| Class A Shares | (876,833) | (1,257,599) |
| Class C Shares | (157,340) | (1,264,893) |
| Class I Shares | (25,966,135) | (8,848,205) |
| Increase (Decrease) in Net Assets | | |
| from Capital Stock Transactions | 85,974,244 | 99,118,998 |
| Total Increase (Decrease) in Net Assets | 77,215,004 | 112,451,958 |
| Net Assets ($): | | |
| Beginning of Period | 112,451,958 | — |
| End of Period | 189,666,962 | 112,451,958 |
20
| | | | |
| | | Year Ended May 31, |
| | 2012 | 2011a |
| Capital Share Transactions: | | |
| Class A | | |
| Shares sold | 32,886 | 111,006 |
| Shares issued for dividends reinvested | — | 9 |
| Shares redeemed | (49,064) | (69,754) |
| Net Increase (Decrease) in Shares Outstanding | (16,178) | 41,261 |
| Class C | | |
| Shares sold | 901 | 82,360 |
| Shares issued for dividends reinvested | — | 1 |
| Shares redeemed | (9,913) | (70,592) |
| Net Increase (Decrease) in Shares Outstanding | (9,012) | 11,769 |
| Class I | | |
| Shares sold | 6,484,576 | 6,547,983 |
| Shares issued for dividends reinvested | — | 2,292 |
| Shares redeemed | (1,557,111) | (492,630) |
| Net Increase (Decrease) in Shares Outstanding | 4,927,465 | 6,057,645 |
| |
| a From July 1, 2010 (commencement of operations) to May 31, 2011. | |
| See notes to financial statements. | | |
FINANCIAL HIGHLIGHTS
The following tables describe the performance for each share class for the fiscal periods indicated.All information (except portfolio turnover rate) reflects financial results for a single fund share.Total return shows how much your investment in the fund would have increased (or decreased) during each period, assuming you had reinvested all dividends and distributions.These figures have been derived from the fund’s financial statements.
| | | | |
| | Year Ended May 31, |
| Class A Shares | 2012 | 2011a |
| Per Share Data ($): | | |
| Net asset value, beginning of period | 18.36 | 12.50 |
| Investment Operations: | | |
| Investment (loss)—netb | (.13) | (.15) |
| Net realized and unrealized gain (loss) on investments | (1.10) | 6.06 |
| Total from Investment Operations | (1.23) | 5.91 |
| Distributions: | | |
| Return of capital | — | (.05) |
| Net asset value, end of period | 17.13 | 18.36 |
| Total Return (%)c | (6.70) | 47.31d |
| Ratios/Supplemental Data (%): | | |
| Ratio of total expenses to average net assets | 1.43 | 2.95e |
| Ratio of net expenses to average net assets | 1.34 | 1.40e |
| Ratio of net investment (loss) to average net assets | (.78) | (1.03)e |
| Portfolio Turnover Rate | 107.62 | 70.41d |
| Net Assets, end of period ($ x 1,000) | 430 | 758 |
| |
| a | From July 1, 2010 (commencement of operations) to May 31, 2011. |
| b | Based on average shares outstanding at each month end. |
| c | Exclusive of sales charge. |
| d | Not annualized. |
| e | Annualized. |
See notes to financial statements.
22
| | | | |
| | Year Ended May 31, |
| Class C Shares | 2012 | 2011a |
| Per Share Data ($): | | |
| Net asset value, beginning of period | 18.22 | 12.50 |
| Investment Operations: | | |
| Investment (loss)—netb | (.26) | (.26) |
| Net realized and unrealized gain (loss) on investments | (1.07) | 6.03 |
| Total from Investment Operations | (1.33) | 5.77 |
| Distributions: | | |
| Return of capital | — | (.05) |
| Net asset value, end of period | 16.89 | 18.22 |
| Total Return (%)c | (7.30) | 46.19d |
| Ratios/Supplemental Data (%): | | |
| Ratio of total expenses to average net assets | 2.16 | 3.73e |
| Ratio of net expenses to average net assets | 2.07 | 2.15e |
| Ratio of net investment (loss) to average net assets | (1.56) | (1.77)e |
| Portfolio Turnover Rate | 107.62 | 70.41d |
| Net Assets, end of period ($ x 1,000) | 47 | 214 |
| |
| a | From July 1, 2010 (commencement of operations) to May 31, 2011. |
| b | Based on average shares outstanding at each month end. |
| c | Exclusive of sales charge. |
| d | Not annualized. |
| e | Annualized. |
See notes to financial statements.
FINANCIAL HIGHLIGHTS (continued)
| | | | |
| | Year Ended May 31, |
| Class I Shares | 2012 | 2011a |
| Per Share Data ($): | | |
| Net asset value, beginning of period | 18.40 | 12.50 |
| Investment Operations: | | |
| Investment (loss)—netb | (.06) | (.13) |
| Net realized and unrealized gain (loss) on investments | (1.12) | 6.08 |
| Total from Investment Operations | (1.18) | 5.95 |
| Distributions: | | |
| Return of capital | — | (.05) |
| Net asset value, end of period | 17.22 | 18.40 |
| Total Return (%) | (6.41) | 47.63c |
| Ratios/Supplemental Data (%): | | |
| Ratio of total expenses to average net assets | 1.03 | 1.77d |
| Ratio of net expenses to average net assets | 1.02 | 1.15d |
| Ratio of net investment (loss) to average net assets | (.34) | (.84)d |
| Portfolio Turnover Rate | 107.62 | 70.41c |
| Net Assets, end of period ($ x 1,000) | 189,191 | 111,480 |
| |
| a | From July 1, 2010 (commencement of operations) to May 31, 2011. |
| b | Based on average shares outstanding at each month end. |
| c | Not annualized. |
| d | Annualized. |
See notes to financial statements.
24
NOTES TO FINANCIAL STATEMENTS
NOTE 1—Significant Accounting Policies:
Dreyfus Select Managers Small Cap Growth Fund (the “fund”) is a separate non-diversified series of Strategic Funds, Inc. (the “Company”) which is registered under the Investment Company Act of 1940, as amended (the “Act”), as an open-end management investment company and operates as a series company currently offering ten series, including the fund. The fund’s investment objective is to seek capital appreciation. The Dreyfus Corporation (the “Manager” or “Dreyfus”), a wholly-owned subsidiary of The Bank of New York Mellon Corporation (“BNY Mellon”), serves as the fund’s investment adviser. EACM Advisors LLC (“EACM”), a subsidiary of BNY Mellon and an affiliate of Dreyfus, serves as the fund’s portfolio allocation manager. Riverbridge Partners, LLC (“Riverbridge”), Geneva Capital Management Ltd. (“Geneva”), Cupps Capital Management, LLC (“CCM”), King Investment Advisors, Inc. (“King”) and Nicholas Investment Partners, L.P. (“Nicholas”), serve as the fund’s sub-investment advisers, each managing a percentage of the fund’s portfolio. Effective July 29, 2011, the Board of Directors approved new Sub-Investment Advisory Agreements with King and Nicholas.
MBSC Securities Corporation (the “Distributor”), a wholly-owned subsidiary of Dreyfus, is the distributor of the fund’s shares.The fund is authorized to issue 75 million shares of $.001 par value Common Stock in each of the following classes of shares: Class A, Class C and Class I. Class A shares are subject to a sales charge imposed at the time of purchase. Class C shares are subject to a contingent deferred sales charge (“CDSC”) imposed on Class C shares redeemed within one year of purchase. Class I shares are sold at net asset value per share only to institutional investors. Other differences between the classes include the services offered to and the expenses borne by each class, the allocation of certain transfer agency costs and certain voting rights. Income, expenses (other than expenses attributable to a specific class), and realized and unrealized gains or losses on investments are allocated to each class of shares based on its relative net assets.
NOTES TO FINANCIAL STATEMENTS (continued)
As of May 31, 2012, MBC Investments Corp., an indirect subsidiary of BNY Mellon, held 1,155 Class C shares of the fund.
The Company accounts separately for the assets, liabilities and operations of each series. Expenses directly attributable to each series are charged to that series’ operations; expenses which are applicable to all series are allocated among them on a pro rata basis.
The Financial Accounting Standards Board (“FASB”) Accounting Standards Codification is the exclusive reference of authoritative U.S. generally accepted accounting principles (“GAAP”) recognized by the FASB to be applied by nongovernmental entities. Rules and interpretive releases of the Securities and Exchange Commission (“SEC”) under authority of federal laws are also sources of authoritative GAAP for SEC registrants. The fund’s financial statements are prepared in accordance with GAAP, which may require the use of management estimates and assumptions.Actual results could differ from those estimates.
The Company enters into contracts that contain a variety of indemnifications.The fund’s maximum exposure under these arrangements is unknown.The fund does not anticipate recognizing any loss related to these arrangements.
(a) Portfolio valuation: The fair value of a financial instrument is the amount that would be received to sell an asset or paid to transfer a liability in an orderly transaction between market participants at the measurement date (i.e. the exit price). GAAP establishes a fair value hierarchy that prioritizes the inputs of valuation techniques used to measure fair value.This hierarchy gives the highest priority to unadjusted quoted prices in active markets for identical assets or liabilities (Level 1 measurements) and the lowest priority to unobservable inputs (Level 3 measurements).
Additionally, GAAP provides guidance on determining whether the volume and activity in a market has decreased significantly and whether such a decrease in activity results in transactions that are not orderly. GAAP requires enhanced disclosures around valuation inputs and techniques used during annual and interim periods.
26
Various inputs are used in determining the value of the fund’s investments relating to fair value measurements.These inputs are summarized in the three broad levels listed below:
Level 1—unadjusted quoted prices in active markets for identical investments.
Level 2—other significant observable inputs (including quoted prices for similar investments, interest rates, prepayment speeds, credit risk, etc.).
Level 3—significant unobservable inputs (including the fund’s own assumptions in determining the fair value of investments).
The inputs or methodology used for valuing securities are not necessarily an indication of the risk associated with investing in those securities.
Changes in valuation techniques may result in transfers in or out of an assigned level within the disclosure hierarchy. Valuation techniques used to value the fund’s investments are as follows:
Investments in securities are valued at the last sales price on the securities exchange or national securities market on which such securities are primarily traded. Securities listed on the National Market System for which market quotations are available are valued at the official closing price or, if there is no official closing price that day, at the last sales price. Securities not listed on an exchange or the national securities market, or securities for which there were no transactions, are valued at the average of the most recent bid and asked prices, except for open short positions, where the asked price is used for valuation purposes. Bid price is used when no asked price is available. Registered investment companies that are not traded on an exchange are valued at their net asset value. All of the preceding securities are categorized within Level 1 of the fair value hierarchy.
Fair valuing of securities may be determined with the assistance of a pricing service using calculations based on indices of domestic securities and other appropriate indicators, such as prices of relevant ADRs and futures contracts. Utilizing these techniques may result in transfers between Level 1 and Level 2 of the fair value hierarchy.
NOTES TO FINANCIAL STATEMENTS (continued)
When market quotations or official closing prices are not readily available, or are determined not to reflect accurately fair value, such as when the value of a security has been significantly affected by events after the close of the exchange or market on which the security is principally traded (for example, a foreign exchange or market), but before the fund calculates its net asset value, the fund may value these investments at fair value as determined in accordance with the procedures approved by the Board of Directors. Certain factors may be considered when fair valuing investments such as: fundamental analytical data, the nature and duration of restrictions on disposition, an evaluation of the forces that influence the market in which the securities are purchased and sold, and public trading in similar securities of the issuer or comparable issuers.These securities are either categorized as Level 2 or 3 depending on the relevant inputs used.
For restricted securities where observable inputs are limited, assumptions about market activity and risk are used and are categorized within Level 3 of the fair value hierarchy.
The following is a summary of the inputs used as of May 31, 2012 in valuing the fund’s investments:
| | | | |
| | | Level 2—Other | Level 3— | |
| | Level 1— | Significant | Significant | |
| | Unadjusted | Observable | Unobservable | |
| | Quoted Prices | Inputs | Inputs | Total |
| Assets ($) | | | | |
| Investments in Securities: | | | |
| Equity Securities— | | | | |
| Domestic† | 175,627,928 | — | — | 175,627,928 |
| Equity Securities— | | | | |
| Foreign† | 4,195,183 | — | — | 4,195,183 |
| Mutual Funds/ | | | | |
| Exchange | | | | |
| Traded Funds | 27,633,573 | — | — | 27,633,573 |
| |
| † See Statement of Investments for additional detailed categorizations. | |
In May 2011, FASB issued Accounting Standards Update (“ASU”) No. 2011-04 “Amendments to Achieve Common FairValue Measurement and Disclosure Requirements in GAAP and International Financial
28
Reporting Standards (“IFRS”)” (“ASU 2011-04”). ASU 2011-04 includes common requirements for measurement of and disclosure about fair value between GAAP and IFRS. ASU 2011-04 will require reporting entities to disclose the following information for fair value measurements categorized within Level 3 of the fair value hierarchy: quantitative information about the unobservable inputs used in the fair value measurement, the valuation processes used by the reporting entity and a narrative description of the sensitivity of the fair value measurement to changes in unobservable inputs and the interrelationships between those unobservable inputs. In addition, ASU 2011-04 will require reporting entities to make disclosures about amounts and reasons for all transfers in and out of Level 1 and Level 2 fair value measurements.The new and revised disclosures are effective for interim and annual reporting periods beginning after December 15, 2011. At this time, management is evaluating the implications of ASU 2011-04 and its impact on the financial statements.
(b) Securities transactions and investment income: Securities transactions are recorded on a trade date basis. Realized gains and losses from securities transactions are recorded on the identified cost basis. Dividend income is recognized on the ex-dividend date and interest income, including, where applicable, accretion of discount and amortization of premium on investments, is recognized on the accrual basis.
Pursuant to a securities lending agreement with The Bank of New York Mellon, a subsidiary of BNY Mellon and an affiliate of Dreyfus, the fund may lend securities to qualified institutions. It is the fund’s policy that, at origination, all loans are secured by collateral of at least 102% of the value of U.S. securities loaned and 105% of the value of foreign securities loaned. Collateral equivalent to at least 100% of the market value of securities on loan is maintained at all times. Collateral is either in the form of cash, which can be invested in certain money market mutual funds managed by Dreyfus, U.S. Government and Agency securities or letters of credit.The fund is entitled to receive all income on securities loaned, in addition to income earned as a result
x
NOTES TO FINANCIAL STATEMENTS (continued)
of the lending transaction. Although each security loaned is fully collateralized, the fund bears the risk of delay in recovery of, or loss of rights in, the securities loaned should a borrower fail to return the securities in a timely manner. During the period ended May 31, 2012, The Bank of New York Mellon earned $108,925 from lending portfolio securities, pursuant to the securities lending agreement.
(c) Affiliated issuers: Other investment companies advised by Dreyfus are considered to be “affiliated” with the fund.
The fund may invest in shares of certain affiliated investment companies also advised or managed by Dreyfus. Investments in affiliated investment companies for the period ended May 31, 2012 were as follows:
| | | | | |
| Affiliated | | | | | |
| Investment | Value | | | Value | Net |
| Company | 5/31/2011 ($) | Purchases ($) | Sales ($) | 5/31/2012 ($) | Assets (%) |
| Dreyfus | | | | | |
| Institutional | | | | | |
| Cash | | | | | |
| Advantage | | | | | |
| Fund | — | 87,211,555 | 62,982,252 | 24,229,303 | 12.8 |
(d) Dividends to shareholders: Dividends are recorded on the ex-dividend date. Dividends from investment income-net and dividends from net realized capital gains, if any, are normally declared and paid annually, but the fund may make distributions on a more frequent basis to comply with the distribution requirements of the Internal Revenue Code of 1986, as amended (the “Code”).To the extent that net realized capital gains can be offset by capital loss carryovers, it is the policy of the fund not to distribute such gains. Income and capital gain distributions are determined in accordance with income tax regulations, which may differ from GAAP.
(e) Federal income taxes: It is the policy of the fund to continue to qualify as a regulated investment company, if such qualification is in the best interests of its shareholders, by complying with the applicable provisions of the Code, and to make distributions of taxable income sufficient to relieve it from substantially all federal income and excise taxes.
30
As of and during the period ended May 31, 2012, the fund did not have any liabilities for any uncertain tax positions.The fund recognizes interest and penalties, if any, related to uncertain tax positions as income tax expense in the Statement of Operations. During the period, the fund did not incur any interest or penalties.
Each of the tax years in the two-year period ended May 31, 2012 remains subject to examination by the Internal Revenue Service and state taxing authorities.
At May 31, 2012, the components of accumulated earnings on a tax basis were as follows: undistributed capital losses $4,722,274 and unrealized appreciation $10,141,389.
Under the Regulated Investment Company Modernization Act of 2010 (the “2010 Act”), the fund is permitted to carry forward capital losses incurred in taxable years beginning after December 22, 2010 (“post-enactment losses”) for an unlimited period. Furthermore, post-enactment capital loss carryovers retain their character as either short-term or long-term capital losses rather than short-term as they were under previous statute.
The accumulated capital loss carryover is available for federal income tax purposes to be applied against future net realized capital gains, if any, realized subsequent to May 31, 2012 and consists of $4,722,274 of short-term post-enactment losses which can be carried forward for an unlimited time.
The tax character of distributions paid to shareholders during the fiscal periods ended May 31, 2012 and May 31, 2011 were as follows: return of capital $0 and $95,809, respectively.
During the period ended May 31, 2012, as a result of permanent book to tax differences, due to the tax treatment for net operating losses, the fund increased accumulated undistributed investment income-net by $493,964 and decreased paid-in capital by the same amount. Net assets and net asset value per share were not affected by this reclassification.
NOTES TO FINANCIAL STATEMENTS (continued)
NOTE 2—Bank Lines of Credit:
The fund participates with other Dreyfus-managed funds in a $225 million unsecured credit facility led by Citibank, N.A. and a $300 million unsecured credit facility provided by The Bank of New York Mellon, (each, a “Facility”), each to be utilized primarily for temporary or emergency purposes, including the financing of redemptions. In connection therewith, the fund has agreed to pay its pro rata portion of commitment fees for each Facility. Interest is charged to the fund based on rates determined pursuant to the terms of the respective Facility at the time of borrowing. During the period ended May 31, 2012, the fund did not borrow under the Facilities.
NOTE 3—Management Fee, Sub-Investment Advisory Fee and Other Transactions With Affiliates:
(a) Pursuant to a management agreement with Dreyfus, the management fee is computed at the annual rate of .90% of the value of the fund’s average daily net assets and is payable monthly. Dreyfus has contractually agreed, until October 1, 2012, to waive receipt of its fees and/or assume the expenses of the fund so that the direct expenses of none of the classes (excluding Rule 12b-1 distribution plan fees, shareholder services plan fees, taxes, interest expense, brokerage commissions, commitment fees on borrowings and extraordinary expenses) exceed 1.15% of the value of the fund’s average daily net assets.The reduction in management fee, pursuant to the undertaking, amounted to $22,768 during the period ended May 31, 2012.
Pursuant to separate Sub-Investment Advisory Agreements between Dreyfus and Riverbridge, Geneva, CCM, King and Nicholas, Dreyfus pays Riverbridge, Geneva, CCM, King and Nicholas separate monthly fees at an annual percentage of the value of the fund’s average daily net assets.
During the period ended May 31, 2012, the Distributor retained $4,708 from commissions earned on sales of the fund’s Class A shares.
32
(b) Under the Distribution Plan (the “Plan”) adopted pursuant to Rule 12b-1 under the Act, Class C shares pay the Distributor for distributing its shares at an annual rate of .75% of the value of the average daily net assets of Class C shares. During the period ended May 31, 2012, Class C shares were charged $971 pursuant to the Plan.
(c) Under the Shareholder Services Plan, Class A and Class C shares pay the Distributor at an annual rate of .25% of the value of their average daily net assets for the provision of certain services.The services provided may include personal services relating to shareholder accounts, such as answering shareholder inquiries regarding the fund and providing reports and other information, and services related to the maintenance of shareholder accounts.The Distributor may make payments to Service Agents (a securities dealer, financial institution or other industry professional) in respect of these services. The Distributor determines the amounts to be paid to Service Agents. During the period ended May 31, 2012, Class A and Class C shares were charged $2,227 and $323, respectively, pursuant to the Shareholder Services Plan.
The fund compensates Dreyfus Transfer, Inc., a wholly-owned subsidiary of Dreyfus, under a transfer agency agreement for providing personnel and facilities to perform transfer agency and cash management services for the fund. During the period ended May 31, 2012, the fund was charged $2,431 pursuant to the transfer agency agreement, which is included in Shareholder servicing costs in the Statement of Operations.
The fund compensatesThe Bank of NewYork Mellon under a custody agreement for providing custodial services for the fund. During the period ended May 31, 2012, the fund was charged $35,803 pursuant to the custody agreement.
The fund has arrangements with the transfer agent and the custodian whereby the fund may receive earnings credits when positive cash balances are maintained, which are used to offset transfer agency and
NOTES TO FINANCIAL STATEMENTS (continued)
custody fees. For financial reporting purposes, the fund includes net earnings credits as an expense offset in the Statement of Operations.
Prior to May 29, 2012, the fund compensated The Bank of NewYork Mellon under cash management agreements for performing cash management services related to fund subscriptions and redemptions. During the period ended May 31, 2012, the fund was charged $150 pursuant to the cash management agreements, which is included in Shareholder servicing costs in the Statement of Operations.These fees were partially offset by earnings credits of $4.
During the period ended May 31, 2012, the fund was charged $6,565 for services performed by the Chief Compliance Officer and his staff.
The components of “Due to The Dreyfus Corporation and affiliates” in the Statement of Assets and Liabilities consist of: management fees $144,038, Rule 12b-1 distribution plan fees $31, shareholder services plan fees $104, custodian fees $18,000, chief compliance officer fees $2,652 and transfer agency per account fees $606, which are offset against an expense reimbursement currently in effect in the amount of $52.
(d) Each Board member also serves as a Board member of other funds within the Dreyfus complex. Annual retainer fees and attendance fees are allocated to each fund based on net assets.
NOTE 4—Securities Transactions:
The aggregate amount of purchases and sales of investment securities, excluding short-term securities, during the period ended May 31, 2012, amounted to $232,662,109 and $152,237,513, respectively.
At May 31, 2012, the cost of investments for federal income tax purposes was $197,315,295; accordingly, accumulated net unrealized appreciation on investments was $10,141,389, consisting of $23,593,797 gross unrealized appreciation and $13,452,408 gross unrealized depreciation.
34
|
| REPORT OF INDEPENDENT REGISTERED |
| PUBLIC ACCOUNTING FIRM |
Shareholders and Board of Directors
Dreyfus Select Managers Small Cap Growth Fund
We have audited the accompanying statement of assets and liabilities, including the statement of investments, of Dreyfus Select Managers Small Cap Growth Fund (one of the series comprising Strategic Funds, Inc.) as of May 31, 2012, and the related statement of operations for the year then ended, and the statement of changes in net assets and financial highlights for the year then ended and for the period from July 1, 2010 (commencement of operations) to May 31, 2011. These financial statements and financial highlights are the responsibility of the Fund’s management. Our responsibility is to express an opinion on these financial statements and financial highlights based on our audits.
We conducted our audits in accordance with the standards of the Public Company Accounting Oversight Board (United States).Those standards require that we plan and perform the audit to obtain reasonable assurance about whether the financial statements and financial highlights are free of material misstatement. We were not engaged to perform an audit of the Fund’s internal control over financial reporting. Our audits included consideration of internal control over financial reporting as a basis for designing audit procedures that are appropriate in the circumstances, but not for the purpose of expressing an opinion on the effectiveness of the Fund’s internal control over financial reporting. Accordingly, we express no such opinion.An audit also includes examining, on a test basis, evidence supporting the amounts and disclosures in the financial statements and financial highlights, assessing the accounting principles used and significant estimates made by management, and evaluating the overall financial statement presentation. Our procedures included confirmation of securities owned as of May 31, 2012 by correspondence with the custodian and others.We believe that our audits provide a reasonable basis for our opinion.
In our opinion, the financial statements and financial highlights referred to above present fairly, in all material respects, the financial position of Dreyfus Select Managers Small Cap Growth Fund at May 31, 2012, the results of its operations for the year then ended, and the changes in its net assets and the financial highlights for the year then ended and for the period from July 1, 2010 to May 31, 2011, in conformity with U.S. generally accepted accounting principles.

|
| New York, New York |
| July 27, 2012 |
BOARD MEMBERS INFORMATION (Unaudited)
|
| Joseph S. DiMartino (68) |
| Chairman of the Board (1995) |
| Principal Occupation During Past 5Years: |
| • Corporate Director and Trustee |
| Other Public Company Board Memberships During Past 5Years: |
| • CBIZ (formerly, Century Business Services, Inc.), a provider of outsourcing functions for small |
| and medium size companies, Director (1997-present) |
| • Sunair Services Corporation, a provider of certain outdoor-related services to homes and |
| businesses, Director (2005-2009) |
| • The Newark Group, a provider of a national market of paper recovery facilities, paperboard |
| mills and paperboard converting plants, Director (2000-2010) |
| No. of Portfolios for which Board Member Serves: 157 |
| ——————— |
| William Hodding Carter III (77) |
| Board Member (1988) |
| Principal Occupation During Past 5Years: |
| • Professor of Leadership & Public Policy, University of North Carolina, Chapel Hill (2006-present) |
| • President and Chief Executive Officer of the John S. and James L. Knight Foundation (1998-2006) |
| No. of Portfolios for which Board Member Serves: 27 |
| ——————— |
| Gordon J. Davis (70) |
| Board Member (2006) |
| Principal Occupation During Past 5Years: |
| • Partner in the law firm of Venable, LLP |
| • Partner in the law firm of Dewey & LeBoeuf, LLP (1994-2012) |
| Other Public Company Board Memberships During Past 5Years: |
| • Consolidated Edison, Inc., a utility company, Director (1997-present) |
| • The Phoenix Companies, Inc., a life insurance company, Director (2000-present) |
| No. of Portfolios for which Board Member Serves: 40 |
| ——————— |
| Joni Evans (70) |
| Board Member (2006) |
| Principal Occupation During Past 5Years: |
| • Chief Executive Officer, www.wowOwow.com an online community dedicated to women’s |
| conversations and publications (2007-present) |
| • Principal, Joni Evans Ltd. (publishing) (2006-present) |
| • Senior Vice President of the William Morris Agency (1994-2006) |
| No. of Portfolios for which Board Member Serves: 27 |
36
|
| Ehud Houminer (71) |
| Board Member (1994) |
| Principal Occupation During Past 5Years: |
| • Executive-in-Residence at the Columbia Business School, Columbia University (1992-present) |
| Other Public Company Board Memberships During Past 5Years: |
| • Avnet Inc., an electronics distributor, Director (1993-present) |
| No. of Portfolios for which Board Member Serves: 60 |
| ——————— |
| Richard C. Leone (72) |
| Board Member (1984) |
| Principal Occupation During Past 5Years: |
| • Senior Fellow of The Century Foundation (formerly,The Twentieth Century Fund, Inc.), a tax |
| exempt research foundation engaged in the study of economic, foreign policy and domestic issues |
| Other Public Company Board Memberships During Past 5Years: |
| • Partnership for a Secure America, Director |
| No. of Portfolios for which Board Member Serves: 27 |
| ——————— |
| Hans C. Mautner (74) |
| Board Member (1984) |
| Principal Occupation During Past 5Years: |
| • President—International Division and an Advisory Director of Simon Property Group, a real |
| estate investment company (1998-2010) |
| • Chairman and Chief Executive Officer of Simon Global Limited (1999-2010) |
| No. of Portfolios for which Board Member Serves: 27 |
BOARD MEMBERS INFORMATION (Unaudited) (continued)
|
| Robin A. Melvin (48) |
| Board Member (1995) |
| Principal Occupation During Past 5Years: |
| • Director, Boisi Family Foundation, a private family foundation that supports youth-serving orga- |
| nizations that promote the self sufficiency of youth from disadvantaged circumstances (1995-2012) |
| No. of Portfolios for which Board Member Serves: 50 |
| ——————— |
| Burton N.Wallack (61) |
| Board Member (2006) |
| Principal Occupation During Past 5Years: |
| • President and Co-owner of Wallack Management Company, a real estate management company |
| No. of Portfolios for which Board Member Serves: 27 |
| ——————— |
| John E. Zuccotti (74) |
| Board Member (1984) |
| Principal Occupation During Past 5Years: |
| • Chairman of Brookfield Properties, Inc. |
| • Senior Counsel of Weil, Gotshal & Manges, LLP |
| • Emeritus Chairman of the Real Estate Board of New York |
| Other Public Company Board Memberships During Past 5Years: |
| • Emigrant Savings Bank, Director (2004-present) |
| • Doris Duke Charitable Foundation,Trustee (2006-present) |
| • New York Private Bank & Trust, Director |
| No. of Portfolios for which Board Member Serves: 27 |
| ——————— |
Once elected all Board Members serve for an indefinite term, but achieve Emeritus status upon reaching age 80.The address of the Board Members and Officers is c/o The Dreyfus Corporation, 200 Park Avenue, NewYork, NewYork 10166.Additional information about the Board Members is available in the fund’s Statement of Additional Information which can be obtained from Dreyfus free of charge by calling this toll free number: 1-800-DREYFUS.
David W. Burke, Emeritus Board Member
Arnold S. Hiatt, Emeritus Board Member
38
OFFICERS OF THE FUND (Unaudited)
BRADLEY J. SKAPYAK, President since January 2010.
Chief Operating Officer and a director of the Manager since June 2009; from April 2003 to June 2009, Mr. Skapyak was the head of the Investment Accounting and Support Department of the Manager. He is an officer of 72 investment companies (comprised of 156 portfolios) managed by the Manager. He is 53 years old and has been an employee of the Manager since February 1988.
JANETTE E. FARRAGHER, Vice President and Secretary since December 2011.
Assistant General Counsel of BNY Mellon, and an officer of 73 investment companies (comprised of 183 portfolios) managed by the Manager. She is 49 years old and has been an employee of the Manager since February 1984.
KIESHA ASTWOOD, Vice President and Assistant Secretary since January 2010.
Counsel of BNY Mellon, and an officer of 73 investment companies (comprised of 183 portfolios) managed by the Manager. She is 39 years old and has been an employee of the Manager since July 1995.
JAMES BITETTO, Vice President and Assistant Secretary since August 2005.
Senior Counsel of BNY Mellon and Secretary of the Manager, and an officer of 73 investment companies (comprised of 183 portfolios) managed by the Manager. He is 45 years old and has been an employee of the Manager since December 1996.
JONI LACKS CHARATAN, Vice President and Assistant Secretary since August 2005.
Senior Counsel of BNY Mellon, and an officer of 73 investment companies (comprised of 183 portfolios) managed by the Manager. She is 56 years old and has been an employee of the Manager since October 1988.
JOSEPH M. CHIOFFI, Vice President and Assistant Secretary since August 2005.
Senior Counsel of BNY Mellon, and an officer of 73 investment companies (comprised of 183 portfolios) managed by the Manager. He is 50 years old and has been an employee of the Manager since June 2000.
KATHLEEN DENICHOLAS, Vice President and Assistant Secretary since January 2010.
Managing Counsel of BNY Mellon, and an officer of 73 investment companies (comprised of 183 portfolios) managed by the Manager. She is 37 years old and has been an employee of the Manager since February 2001.
JOHN B. HAMMALIAN, Vice President and Assistant Secretary since August 2005.
Senior Managing Counsel of BNY Mellon, and an officer of 73 investment companies (comprised of 183 portfolios) managed by the Manager. He is 48 years old and has been an employee of the Manager since February 1991.
M. CRISTINA MEISER, Vice President and Assistant Secretary since January 2010.
Senior Counsel of BNY Mellon, and an officer of 73 investment companies (comprised of 183 portfolios) managed by the Manager. She is 42 years old and has been an employee of the Manager since August 2001.
ROBERT R. MULLERY, Vice President and Assistant Secretary since August 2005.
Managing Counsel of BNY Mellon, and an officer of 73 investment companies (comprised of 183 portfolios) managed by the Manager. He is 60 years old and has been an employee of the Manager since May 1986.
OFFICERS OF THE FUND (Unaudited) (continued)
JEFF PRUSNOFSKY, Vice President and Assistant Secretary since August 2005.
Senior Managing Counsel of BNY Mellon, and an officer of 73 investment companies (comprised of 183 portfolios) managed by the Manager. He is 47 years old and has been an employee of the Manager since October 1990.
JAMES WINDELS, Treasurer since November 2001.
Director – Mutual Fund Accounting of the Manager, and an officer of 73 investment companies (comprised of 183 portfolios) managed by the Manager. He is 53 years old and has been an employee of the Manager since April 1985.
RICHARD CASSARO, Assistant Treasurer since January 2008.
Senior Accounting Manager – Money Market and Municipal Bond Funds of the Manager, and an officer of 73 investment companies (comprised of 183 portfolios) managed by the Manager. He is 53 years old and has been an employee of the Manager since September 1982.
GAVIN C. REILLY, Assistant Treasurer since December 2005.
Tax Manager of the Investment Accounting and Support Department of the Manager, and an officer of 73 investment companies (comprised of 183 portfolios) managed by the Manager. He is 43 years old and has been an employee of the Manager since April 1991.
ROBERT S. ROBOL, Assistant Treasurer since August 2005.
Senior Accounting Manager – Fixed Income Funds of the Manager, and an officer of 73 investment companies (comprised of 183 portfolios) managed by the Manager. He is 48 years old and has been an employee of the Manager since October 1988.
ROBERT SALVIOLO, Assistant Treasurer since July 2007.
Senior Accounting Manager – Equity Funds of the Manager, and an officer of 73 investment companies (comprised of 183 portfolios) managed by the Manager. He is 45 years old and has been an employee of the Manager since June 1989.
ROBERT SVAGNA, Assistant Treasurer since August 2005.
Senior Accounting Manager – Equity Funds of the Manager, and an officer of 73 investment companies (comprised of 183 portfolios) managed by the Manager. He is 45 years old and has been an employee of the Manager since November 1990.
JOSEPH W. CONNOLLY, Chief Compliance Officer since October 2004.
Chief Compliance Officer of the Manager and The Dreyfus Family of Funds (73 investment companies, comprised of 183 portfolios).
He is 55 years old and has served in various capacities with the Manager since 1980, including manager of the firm’s Fund Accounting Department from 1997 through October 2001.
MATTHEW D. CONNOLLY, Anti-Money Laundering Compliance Officer since April 2012.
Anti-Money Laundering Compliance Officer of the Distributor since October 2011; from March 2010 to September 2011, Global Head, KYC Reviews and Director, UBS Investment Bank; until March 2010,AML Compliance Officer and Senior Vice President, Citi Global Wealth Management. He is an officer of 69 investment companies (comprised of 179 portfolios) managed by the Manager. He is 39 years old and has been an employee of the Distributor since October 2011.
40
For More Information
Item 2. Code of Ethics.
The Registrant has adopted a code of ethics that applies to the Registrant's principal executive officer, principal financial officer, principal accounting officer or controller, or persons performing similar functions. There have been no amendments to, or waivers in connection with, the Code of Ethics during the period covered by this Report.
Item 3. Audit Committee Financial Expert.
The Registrant's Board has determined that Ehud Houminer, a member of the Audit Committee of the Board, is an audit committee financial expert as defined by the Securities and Exchange Commission (the "SEC"). Ehud Houminer is "independent" as defined by the SEC for purposes of audit committee financial expert determinations.
Item 4. Principal Accountant Fees and Services.
(a) Audit Fees. The aggregate fees billed for each of the last two fiscal years (the "Reporting Periods") for professional services rendered by the Registrant's principal accountant (the "Auditor") for the audit of the Registrant's annual financial statements or services that are normally provided by the Auditor in connection with the statutory and regulatory filings or engagements for the Reporting Periods, were $60,624 in 2011 and $30,857 in 2012.
(b) Audit-Related Fees. The aggregate fees billed in the Reporting Periods for assurance and related services by the Auditor that are reasonably related to the performance of the audit of the Registrant's financial statements and are not reported under paragraph (a) of this Item 4 were $0 in 2011 and $12,000 in 2012. These services consisted of one or more of the following: (i) agreed upon procedures related to compliance with Internal Revenue Code section 817(h), (ii) security counts required by Rule 17f-2 under the Investment Company Act of 1940, as amended, (iii) advisory services as to the accounting or disclosure treatment of Registrant transactions or events and (iv) advisory services to the accounting or disclosure treatment of the actual or potential impact to the Registrant of final or proposed rules, standards or interpretations by the Securities and Exchange Commission, the Financial Accounting Standards Boards or other regulatory or standard-setting bodies.
The aggregate fees billed in the Reporting Periods for non-audit assurance and related services by the Auditor to the Registrant's investment adviser (not including any sub-investment adviser whose role is primarily portfolio management and is subcontracted with or overseen by another investment adviser), and any entity controlling, controlled by or under common control with the investment adviser that provides ongoing services to the Registrant ("Service Affiliates"), that were reasonably related to the performance of the annual audit of the Service Affiliate, which required pre-approval by the Audit Committee were $0 in 2011 and $0 in 2012.
(c) Tax Fees. The aggregate fees billed in the Reporting Periods for professional services rendered by the Auditor for tax compliance, tax advice, and tax planning ("Tax Services") were $1,596 in 2011 and $3,478 in 2012. These services consisted of: (i) review or preparation of U.S. federal, state, local and excise tax returns; (ii) U.S. federal, state and local tax planning, advice and assistance regarding statutory, regulatory or administrative developments; (iii) tax advice regarding tax qualification matters and/or treatment of various financial instruments held or proposed to be acquired or held, and (iv) determination of Passive Foreign Investment Companies. The aggregate fees billed in the Reporting Periods for Tax Services by the Auditor to Service Affiliates, which required pre-approval by the Audit Committee were $0 in 2011 and $0 in 2012.
(d) All Other Fees. The aggregate fees billed in the Reporting Periods for products and services provided by the Auditor, other than the services reported in paragraphs (a) through (c) of this Item, were $39 in 2011 and $8 in 2012. [These services consisted of a review of the Registrant's anti-money laundering program].
The aggregate fees billed in the Reporting Periods for Non-Audit Services by the Auditor to Service Affiliates, other than the services reported in paragraphs (b) through (c) of this Item, which required pre-approval by the Audit Committee, were $0 in 2011 and $0 in 2012.
(e)(1) Audit Committee Pre-Approval Policies and Procedures. The Registrant's Audit Committee has established policies and procedures (the "Policy") for pre-approval (within specified fee limits) of the Auditor's engagements for non-audit services to the Registrant and Service Affiliates without specific case-by-case consideration. The pre-approved services in the Policy can include pre-approved audit services, pre-approved audit-related services, pre-approved tax services and pre-approved all other services. Pre-approval considerations include whether the proposed services are compatible with maintaining the Auditor's independence. Pre-approvals pursuant to the Policy are considered annually.
(e)(2) Note: None of the services described in paragraphs (b) through (d) of this Item 4 were approved by the Audit Committee pursuant to paragraph (c)(7)(i)(C) of Rule 2-01 of Regulation S-X.
(f) None of the hours expended on the principal accountant's engagement to audit the registrant's financial statements for the most recent fiscal year were attributed to work performed by persons other than the principal account's full-time, permanent employees.
Non-Audit Fees. The aggregate non-audit fees billed by the Auditor for services rendered to the Registrant, and rendered to Service Affiliates, for the Reporting Periods were $19,526,919 in 2011 and $34,285,599 in 2012.
Auditor Independence. The Registrant's Audit Committee has considered whether the provision of non-audit services that were rendered to Service Affiliates, which were not pre-approved (not requiring pre-approval), is compatible with maintaining the Auditor's independence.
Item 5. Audit Committee of Listed Registrants.
Not applicable. [CLOSED-END FUNDS ONLY]
Item 6. Investments.
(a) Not applicable.
Item 7. Disclosure of Proxy Voting Policies and Procedures for Closed-End Management Investment Companies.
Not applicable. [CLOSED-END FUNDS ONLY]
Item 8. Portfolio Managers of Closed-End Management Investment Companies.
Not applicable. [CLOSED-END FUNDS ONLY, beginning with reports for periods ended on and after December 31, 2005]
Item 9. Purchases of Equity Securities by Closed-End Management Investment Companies and Affiliated Purchasers.
Not applicable. [CLOSED-END FUNDS ONLY]
Item 10. Submission of Matters to a Vote of Security Holders.
There have been no material changes to the procedures applicable to Item 10.
Item 11. Controls and Procedures.
(a) The Registrant's principal executive and principal financial officers have concluded, based on their evaluation of the Registrant's disclosure controls and procedures as of a date within 90 days of the filing date of this report, that the Registrant's disclosure controls and procedures are reasonably designed to ensure that information required to be disclosed by the Registrant on Form N-CSR is recorded, processed, summarized and reported within the required time periods and that information required to be disclosed by the Registrant in the reports that it files or submits on Form N-CSR is accumulated and communicated to the Registrant's management, including its principal executive and principal financial officers, as appropriate to allow timely decisions regarding required disclosure.
(b) There were no changes to the Registrant's internal control over financial reporting that occurred during the second fiscal quarter of the period covered by this report that have materially affected, or are reasonably likely to materially affect, the Registrant's internal control over financial reporting.
Item 12. Exhibits.
(a)(1) Code of ethics referred to in Item 2.
(a)(2) Certifications of principal executive and principal financial officers as required by Rule 30a-2(a) under the Investment Company Act of 1940.
(a)(3) Not applicable.
(b) Certification of principal executive and principal financial officers as required by Rule 30a-2(b) under the Investment Company Act of 1940.
SIGNATURES
Pursuant to the requirements of the Securities Exchange Act of 1934 and the Investment Company Act of 1940, the Registrant has duly caused this Report to be signed on its behalf by the undersigned, thereunto duly authorized.
Strategic Funds, Inc.
By: /s/ Bradley J. Skapyak |
Bradley J. Skapyak, President |
Date: | July 24, 2012 |
|
Pursuant to the requirements of the Securities Exchange Act of 1934 and the Investment Company Act of 1940, this Report has been signed below by the following persons on behalf of the Registrant and in the capacities and on the dates indicated. |
|
By: /s/ Bradley J. Skapyak |
Bradley J. Skapyak, President |
Date: | July 24, 2012 |
|
By: /s/ James Windels |
James Windels, Treasurer |
Date: | July 24, 2012 |
|
EXHIBIT INDEX
(a)(1) Code of ethics referred to in Item 2.
(a)(2) Certifications of principal executive and principal financial officers as required by Rule 30a-2(a) under the Investment Company Act of 1940. (EX-99.CERT)
(b) Certification of principal executive and principal financial officers as required by Rule 30a-2(b) under the Investment Company Act of 1940. (EX-99.906CERT)