UNITED STATES
SECURITIES AND EXCHANGE COMMISSION
Washington, D.C. 20549
FORM N-CSR
CERTIFIED SHAREHOLDER REPORT OF REGISTERED MANAGEMENT
INVESTMENT COMPANIES
Investment Company Act file number | 811-3940 |
| |
| Strategic Funds, Inc. | |
| (Exact name of Registrant as specified in charter) | |
| | |
| c/o The Dreyfus Corporation 200 Park Avenue New York, New York 10166 | |
| (Address of principal executive offices) (Zip code) | |
| | |
| Janette E. Farragher, Esq. 200 Park Avenue New York, New York 10166 | |
| (Name and address of agent for service) | |
|
Registrant's telephone number, including area code: | (212) 922-6000 |
| |
Date of fiscal year end: | 11/30 | |
Date of reporting period: | 11/30/12 | |
| | | | | | | |
The following N-CSR relates only to the Registrant’s series listed below and does not affect the other series of the Registrant, which have different fiscal year ends and, therefore, different N-CSR reporting requirements. Separate N-CSR Forms will be filed for these series, as appropriate.
Dreyfus Select Managers Small Cap Value Fund
Dreyfus U.S. Equity Fund
Global Stock Fund
International Stock Fund
FORM N-CSR
Item 1. Reports to Stockholders.
Save time. Save paper. View your next shareholder report online as soon as it’s available. Log into www.dreyfus.com and sign up for Dreyfus eCommunications. It’s simple and only takes a few minutes.
The views expressed in this report reflect those of the portfolio manager only through the end of the period covered and do not necessarily represent the views of Dreyfus or any other person in the Dreyfus organization. Any such views are subject to change at any time based upon market or other conditions and Dreyfus disclaims any responsibility to update such views.These views may not be relied on as investment advice and, because investment decisions for a Dreyfus fund are based on numerous factors, may not be relied on as an indication of trading intent on behalf of any Dreyfus fund.
| | Contents |
| | THE FUND |
| 2 | A Letter from the President |
| 3 | Discussion of Fund Performance |
| 6 | Fund Performance |
| 8 | Understanding Your Fund’s Expenses |
| 8 | Comparing Your Fund’s Expenses With Those of Other Funds |
| 9 | Statement of Investments |
| 26 | Statement of Assets and Liabilities |
| 27 | Statement of Operations |
| 28 | Statement of Changes in Net Assets |
| 30 | Financial Highlights |
| 33 | Notes to Financial Statements |
| 43 | Report of Independent Registered Public Accounting Firm |
| 44 | Important Tax Information |
| 45 | Information About the Renewal of the Fund’s Management, Portfolio Allocation Management and Sub-Invesment Advisory Agreements |
| 53 | Board Members Information |
| 56 | Officers of the Fund |
| | FOR MORE INFORMATION |
| | Back Cover |
|
| Dreyfus |
| Select Managers |
| Small Cap Value Fund |
The Fund
A LETTER FROM THE PRESIDENT
Dear Shareholder:
We are pleased to present this annual report for Dreyfus Select Managers Small Cap Value Fund, covering the 12-month period from December 1, 2011, through November 30, 2012. For information about how the fund performed during the reporting period, as well as general market perspectives, we provide a Discussion of Fund Performance on the pages that follow.
Despite pronounced stock market weakness during the spring of 2012, equities generally advanced over the reporting period as investors responded to encouraging macroeconomic developments throughout the world. Employment gains in the United States, credible measures to prevent a more severe banking crisis in Europe, and the likelihood of a “soft landing” for China’s economy buoyed investor sentiment, as did aggressively accommodative monetary policies from central banks in the United States, Europe, Japan and China. Consequently, U.S. stocks across all capitalization ranges posted respectable returns, on average, for the reporting period.
In light of the easy monetary policies adopted by many countries, we expect global growth to be slightly more robust in 2013 than in 2012.The U.S. economic recovery is likely to persist at subpar levels, as growth early in the new year may remain constrained by uncertainties surrounding fiscal policy and tax reforms. However, resolution of these issues may prompt corporate decision-makers to increase capital spending later in the year, which could have positive implications for the U.S. economy and domestic equity markets.As always, we encourage you to stay in touch with your financial advisor as new developments unfold.
Thank you for your continued confidence and support.
Sincerely,

J. Charles Cardona
President
The Dreyfus Corporation
December 17, 2012
2
DISCUSSION OF FUND PERFORMANCE
For the period of December 1, 2011, through November 30, 2012, as provided by Keith L. Stransky and Robert B. Mayerick, Portfolio Allocation Managers, EACM Advisors LLC
Fund and Market Performance Overview
For the 12-month period ended November 30, 2012, Dreyfus Select Managers Small Cap Value Fund’s Class A shares produced a total return of 15.04%, Class C shares returned 14.16% and Class I shares returned 15.45%.1 In comparison, the Russell 2000Value Index (the “Index”), the fund’s benchmark, returned 15.05% for the same period.2
Small-cap value stocks generally rallied over the reporting period as investors responded to improving economic conditions. The fund’s Class I shares produced fractionally higher returns than its benchmark, primarily due to strong results from the financials sector.
The Fund’s Investment Approach
The fund seeks capital appreciation.To pursue its goal, the fund normally invests at least 80% of its net assets in the stocks of small-cap companies.The fund uses a “multi-manager” approach by selecting one or more sub-advisers to manage its assets.As the fund’s portfolio allocation managers, we seek sub-advisers that complement one another’s style of investing, consistent with the fund’s investment goal.We monitor and evaluate the performance of the sub-advisers and will make corresponding recommendations to Dreyfus and the fund’s Board based on our evaluations.
The fund’s assets are currently under the day-to-day portfolio management of seven sub-advisers, each acting independently of one another and using its own methodology to select portfolio investments.As of the end of the reporting period, 18% of the fund’s assets are under the management of Thompson, Siegel and Walmsley, LLC, which employs a combination of quantitative and qualitative security selection methods based on a four-factor valuation model.Approximately 23% of the fund’s assets are under the management of Walthausen & Co., LLC, which uses a proprietary valuation model to identify companies that are trading at a discount to their intrinsic values. Approximately 14% of the fund’s assets are under the management of Neuberger Berman Management LLC, which uses fundamental analysis and a bottom-up stock selection process to identify publicly traded small-cap companies selling at a material
The Fund 3
DISCUSSION OF FUND PERFORMANCE (continued)
discount to their intrinsic value.Approximately 28% of the fund’s assets are under the management of Lombardia Capital Partners, LLC, which uses fundamental analysis and a bottom-up value-oriented approach in seeking stocks trading below their intrinsic values. Approximately 11% of the fund’s assets are under the management of Iridian Asset Management LLC, which employs bottom-up stock selection and a disciplined valuation process to identify and invest in corporate change.Approximately 5% of the fund’s assets are under the management of Vulcan Value Partners, LLC, which seeks companies with sustainable competitive advantages that may enable them to earn superior cash returns on capital.Approximately 1% of the fund’s assets are under the management of Kayne Anderson Rudnick Investment Management, LLC, which was added as a sub-adviser on August 15, 2012, and employs a fundamental, bottom-up, research-driven investment process in seeking to identify high quality companies whose securities are trading at attractive valuations.These percentages can change over time, within ranges described in the prospectus.
Economic Optimism Lifted U.S. Equities
The reporting period began in the aftermath of pronounced stock market weakness, resulting in attractive valuations across several market sectors. By the first quarter of 2012, stocks were rallying amid stronger U.S. employment gains and a quantitative easing program in Europe. Corporate earnings remained strong, and many companies had shored up their balance sheets. Investors grew more tolerant of risks, focusing more on business fundamentals and less on news headlines.
These positive influences were called into question during the spring, when the U.S. labor market’s rebound slowed and measures to relieve Europe’s fiscal pressures encountered resistance. However, investor sentiment soon improved when several central banks, including the Federal Reserve Board and European Central Bank, announced measures to stimulate their economies. Ensuing market rallies enabled the benchmark to end the reporting period with double-digit gains.
Financial Stocks Buoyed Relative Performance
The fund’s investments proved particularly successful in the financials sector, where mortgage servicing providers Ocwen Financial and Altisource Portfolio Solutions advanced strongly after Ocwen Financial made an accretive acquisition. In other areas, engineering and construction firm The Shaw Group was acquired by a former competitor, and home health care provider Lincare Holdings was taken over by a German gas producer.
4
The fund achieved less favorable results in the information technology sector, where relatively heavy exposure weighed on relative performance. Disappointments in the sector included components manufacturer Pulse Electronics which missed earnings targets, and solar equipment and services provider GT Advanced Technologies, which warned of a challenging 2013.
Economic Recovery Remains Intact
We are optimistic about the prospects for small-cap value stocks. Accommodative monetary policies are expected to keep the economy growing at a moderate pace, and large-cap companies have plenty of cash available to acquire smaller businesses. We believe the fund is well positioned for this environment, as its holdings have lower valuations than the benchmark, on average, but with higher growth rates.The fund’s sub-advisers, in part, have focused on investment managers seeking companies with steady growth rates, reasonable valuations, and businesses that tend to be relatively insensitive to economic cycles. In the aggregate, the sub-advisers have also found a number of opportunities in the industrials and information technology sectors, but fewer among financial companies and utilities.
December 17, 2012
|
| Equity funds are subject generally to market, market sector, market liquidity, issuer and investment style risks, among |
| other factors, to varying degrees, all of which are more fully described in the fund’s prospectus. |
| The prices of small company stocks tend to be more volatile than the prices of large company stocks, mainly because |
| these companies have less established and more volatile earnings histories.They also tend to be less liquid than larger |
| company stocks. |
| 1 Total return includes reinvestment of dividends and any capital gains paid, and does not take into consideration the |
| maximum initial sales charge in the case of Class A shares, or the applicable contingent deferred sales charge imposed |
| on redemptions in the case of Class C shares. Had these charges been reflected, returns would have been lower. Past |
| performance is no guarantee of future results. Share price and investment return fluctuate such that upon redemption, |
| fund shares may be worth more or less than their original cost. Return figures provided reflect the absorption of certain |
| fund expenses by The Dreyfus Corporation pursuant to an undertaking in effect through April 1, 2013, at which |
| time it may be extended, terminated or modified. Had these expenses not been absorbed, the fund’s returns would |
| have been lower. |
| 2 SOURCE: LIPPER INC. — Reflects the reinvestment of dividends and, where applicable, capital gain |
| distributions.The Russell 2000 Value Index is an unmanaged index, which measures the performance of those |
| Russell 2000 companies with lower price-to-book ratios and lower forecasted growth values. Investors cannot invest |
| directly in any index. |
The Fund 5
FUND PERFORMANCE
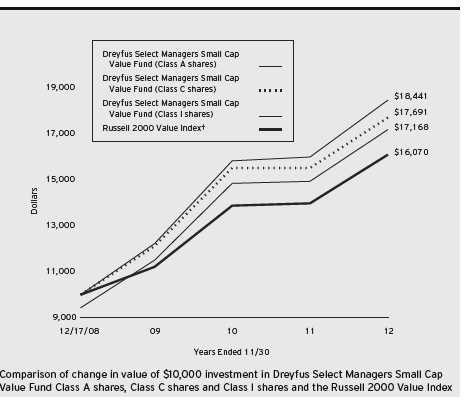
† Source: Lipper Inc.
Past performance is not predictive of future performance.
The above graph compares a $10,000 investment made in each of the Class A, Class C and Class I shares of Dreyfus Select Managers Small Cap Value Fund on 12/17/08 (inception date) to a $10,000 investment made in the Russell 2000 Value Index (the “Index”) on that date.All dividends and capital gain distributions are reinvested.
The fund’s performance shown in the line graph above takes into account the maximum initial sales charge on Class A shares and all other applicable fees and expenses on all classes.The Index is an unmanaged index, which measures the performance of those Russell 2000 companies with lower price-to-book ratios and lower forecasted growth values. Unlike a mutual fund, the Index is not subject to charges, fees and other expenses. Investors cannot invest directly in any index. These factors can contribute to the Index potentially outperforming the fund. Further information relating to fund performance, including expense reimbursements, if applicable, is contained in the Financial Highlights section of the prospectus and elsewhere in this report.
6
| | | | | |
| Average Annual Total Returns as of 11/30/12 | | | | |
| |
| | Inception | | | From | |
| | Date | 1 | Year | Inception | |
| Class A shares | | | | | |
| with maximum sales charge (5.75%) | 12/17/08 | 8.42 | % | 14.62 | % |
| without sales charge | 12/17/08 | 15.04 | % | 16.34 | % |
| Class C shares | | | | | |
| with applicable redemption charge † | 12/17/08 | 13.16 | % | 15.50 | % |
| without redemption | 12/17/08 | 14.16 | % | 15.50 | % |
| Class I shares | 12/17/08 | 15.45 | % | 16.71 | % |
| Russell 2000 Value Index | 12/31/08 | 15.05 | % | 12.88 | %†† |
Past performance is not predictive of future performance.The fund’s performance shown in the graph and table does not reflect the deduction of taxes that a shareholder would pay on fund distributions or the redemption of fund shares.
| |
| † | The maximum contingent deferred sales charge for Class C shares is 1% for shares redeemed within one year of the |
| | date of purchase. |
| †† | For comparative purposes, the value of the Index as of 12/31/08 is used as the beginning value on 12/17/08. |
The Fund 7
UNDERSTANDING YOUR FUND’S EXPENSES (Unaudited)
As a mutual fund investor, you pay ongoing expenses, such as management fees and other expenses. Using the information below, you can estimate how these expenses affect your investment and compare them with the expenses of other funds.You also may pay one-time transaction expenses, including sales charges (loads) and redemption fees, which are not shown in this section and would have resulted in higher total expenses. For more information, see your fund’s prospectus or talk to your financial adviser.
Review your fund’s expenses
The table below shows the expenses you would have paid on a $1,000 investment in Dreyfus Select Managers Small CapValue Fund from June 1, 2012 to November 30, 2012. It also shows how much a $1,000 investment would be worth at the close of the period, assuming actual returns and expenses.
Expenses and Value of a $1,000 Investment
assuming actual returns for the six months ended November 30, 2012
| | | | | | |
| | | Class A | | Class C | | Class I |
| Expenses paid per $1,000† | $ | 7.22 | $ | 11.05 | $ | 5.12 |
| Ending value (after expenses) | $ | 1,109.10 | $ | 1,105.30 | $ | 1,111.50 |
COMPARING YOUR FUND’S EXPENSES
WITH THOSE OF OTHER FUNDS (Unaudited)
Using the SEC’s method to compare expenses
The Securities and Exchange Commission (SEC) has established guidelines to help investors assess fund expenses. Per these guidelines, the table below shows your fund’s expenses based on a $1,000 investment, assuming a hypothetical 5% annualized return. You can use this information to compare the ongoing expenses (but not transaction expenses or total cost) of investing in the fund with those of other funds.All mutual fund shareholder reports will provide this information to help you make this comparison. Please note that you cannot use this information to estimate your actual ending account balance and expenses paid during the period.
Expenses and Value of a $1,000 Investment
assuming a hypothetical 5% annualized return for the six months ended November 30, 2012
| | | | | | |
| | | Class A | | Class C | | Class I |
| Expenses paid per $1,000† | $ | 6.91 | $ | 10.58 | $ | 4.90 |
| Ending value (after expenses) | $ | 1,018.15 | $ | 1,014.50 | $ | 1,020.15 |
|
| † Expenses are equal to the fund’s annualized expense ratio of 1.37% for Class A, 2.10% for Class C and .97% |
| for Class I, multiplied by the average account value over the period, multiplied by 183/366 (to reflect the one-half |
| year period). |
8
STATEMENT OF INVESTMENTS
November 30, 2012
| | | | |
| Common Stocks—96.1% | Shares | | | Value ($) |
| Aerospace & Defense—1.7% | | | | |
| Aerovironment | 17,450 | a | 356,154 |
| Curtiss-Wright | 18,768 | | 595,509 |
| DigitalGlobe | 34,200 | a,b | 852,948 |
| Hexcel | 98,342 | a | 2,542,141 |
| Moog, Cl. A | 5,820 | a | 213,943 |
| Spirit Aerosystems Holdings, Cl. A | 48,930 | a | 770,647 |
| Teledyne Technologies | 14,800 | a | 932,400 |
| Textron | 35,200 | | 826,848 |
| Triumph Group | 4,390 | | 288,028 |
| | | | | 7,378,618 |
| Air Freight & Logistics—.3% | | | | |
| Air Transport Services Group | 180,736 | a | 684,989 |
| Atlas Air Worldwide Holdings | 15,600 | a | 675,168 |
| | | | | 1,360,157 |
| Airlines—.4% | | | | |
| Hawaiian Holdings | 112,100 | a | 699,504 |
| SkyWest | 72,090 | | 835,523 |
| | | | | 1,535,027 |
| Auto Components—1.6% | | | | |
| Cooper Tire & Rubber | 164,616 | | 4,112,108 |
| Exide Technologies | 143,890 | a | 415,842 |
| Gentherm | 64,400 | a | 778,596 |
| Modine Manufacturing | 89,600 | a | 663,040 |
| Visteon | 15,010 | a | 752,001 |
| | | | | 6,721,587 |
| Automobiles—.3% | | | | |
| Thor Industries | 30,631 | | 1,156,014 |
| Beverages—.2% | | | | |
| Constellation Brands, Cl. A | 16,000 | a | 574,080 |
| National Beverage | 8,895 | | 152,638 |
| | | | | 726,718 |
| Biotechnology—.1% | | | | |
| Alkermes | 20,020 | a | 386,586 |
The Fund 9
STATEMENT OF INVESTMENTS (continued)
| | | | |
| Common Stocks (continued) | Shares | | | Value ($) |
| Building Products—.6% | | | | |
| AAON | 38,147 | | | 802,994 |
| Gibraltar Industries | 55,787 | a | | 773,766 |
| NCI Building Systems | 85,790 | a | | 1,122,991 |
| | | | | 2,699,751 |
| Capital Markets—2.9% | | | | |
| Ares Capital | 184,215 | | | 3,267,974 |
| Eaton Vance | 37,607 | | | 1,198,911 |
| Fifth Street Finance | 150,904 | b | | 1,626,745 |
| Investment Technology Group | 54,065 | a | | 483,341 |
| Janus Capital Group | 94,767 | | | 777,089 |
| Piper Jaffray | 24,040 | a | | 682,015 |
| Waddell & Reed Financial, Cl. A | 69,369 | | | 2,253,799 |
| Walter Investment Management | 49,540 | | | 2,094,551 |
| | | | | 12,384,425 |
| Chemicals—3.4% | | | | |
| American Vanguard | 25,100 | | | 835,077 |
| Balchem | 1,960 | | | 70,070 |
| Chemtura | 60,100 | a | | 1,221,232 |
| Cytec Industries | 8,800 | | | 604,032 |
| Ferro | 168,770 | a | | 484,370 |
| KMG Chemicals | 45,001 | | | 819,918 |
| Kraton Performance Polymers | 90,970 | a | | 2,136,886 |
| LSB Industries | 47,290 | a | | 1,580,905 |
| Omnova Solutions | 138,200 | a | | 1,025,444 |
| PolyOne | 106,270 | | | 2,140,278 |
| RPM International | 44,865 | | | 1,301,534 |
| Sensient Technologies | 38,673 | | | 1,399,963 |
| TPC Group | 20,000 | a | | 960,600 |
| | | | | 14,580,309 |
| Commercial Banks—8.8% | | | | |
| BancorpSouth | 89,279 | | | 1,181,161 |
| Bank of Hawaii | 32,644 | b | | 1,419,035 |
| Bank of the Ozarks | 4,600 | | | 146,188 |
| BankUnited | 23,700 | | | 556,950 |
| BBCN Bancorp | 157,545 | | | 1,792,862 |
| Bryn Mawr Bank | 53,520 | | | 1,152,286 |
10
| | | |
| Common Stocks (continued) | Shares | | Value ($) |
| Commercial Banks (continued) | | | |
| Centerstate Banks | 91,120 | | 716,203 |
| City Holding | 33,590 | b | 1,128,624 |
| City National | 9,200 | | 447,948 |
| Columbia Banking System | 53,300 | | 919,958 |
| Comerica | 28,827 | | 852,991 |
| Community Bank System | 82,453 | b | 2,216,337 |
| Cullen/Frost Bankers | 5,153 | | 281,405 |
| CVB Financial | 125,100 | | 1,271,016 |
| East West Bancorp | 67,818 | | 1,434,351 |
| F.N.B | 135,818 | | 1,466,834 |
| First Bancorp | 11,100 | | 123,654 |
| First Commonwealth Financial | 99,000 | | 634,590 |
| First Financial Bankshares | 35,940 | b | 1,398,425 |
| First Merchants | 39,447 | | 535,690 |
| First Midwest Bancorp | 55,178 | | 689,725 |
| First Niagara Financial Group | 293,684 | | 2,214,377 |
| Hancock Holding | 95,719 | | 3,007,491 |
| Huntington Bancshares | 137,400 | | 845,010 |
| IBERIABANK | 28,200 | | 1,374,750 |
| Independent Bank | 7,740 | b | 222,138 |
| Investors Bancorp | 23,272 | | 398,417 |
| National Bank Holdings, Cl. A | 29,940 | | 548,501 |
| SVB Financial Group | 18,700 | a | 1,032,614 |
| TCF Financial | 89,100 | | 1,058,508 |
| Texas Capital Bancshares | 40,600 | a | 1,828,624 |
| Trustmark | 36,381 | | 808,386 |
| Umpqua Holdings | 176,710 | | 2,060,439 |
| Union First Market Bankshares | 45,904 | | 701,872 |
| Westamerica Bancorporation | 3,210 | | 136,618 |
| Wintrust Financial | 37,400 | | 1,375,946 |
| | | | 37,979,924 |
| Commercial Service & Supply—2.8% | | | |
| ACCO Brands | 193,686 | a | 1,305,444 |
| Asta Funding | 60,630 | | 560,221 |
| Avery Dennison | 45,770 | | 1,531,007 |
| Brink’s | 36,500 | | 1,002,290 |
The Fund 11
STATEMENT OF INVESTMENTS (continued)
| | | |
| Common Stocks (continued) | Shares | | Value ($) |
| Commercial Service & Supply (continued) | | | |
| Ceco Environmental | 43,480 | | 405,234 |
| Covanta Holding | 59,800 | | 1,129,024 |
| Deluxe | 130,090 | | 3,746,592 |
| Encore Capital Group | 47,600 | a,b | 1,265,208 |
| Ennis | 52,064 | | 792,414 |
| Metalico | 123,690 | a | 206,562 |
| | | | 11,943,996 |
| Communications Equipment—2.7% | | | |
| ADTRAN | 5,375 | b | 105,565 |
| Arris Group | 76,700 | a | 1,071,499 |
| Aviat Networks | 186,918 | a | 514,024 |
| Black Box | 63,306 | | 1,560,493 |
| Brocade Communications Systems | 194,700 | a | 1,105,896 |
| Ciena | 35,200 | a,b | 523,776 |
| Emulex | 171,170 | a | 1,258,100 |
| Infinera | 103,300 | a,b | 576,414 |
| Ituran Location and Control | 54,344 | | 710,276 |
| Oplink Communications | 100,823 | a | 1,562,756 |
| Plantronics | 69,386 | | 2,333,452 |
| Sierra Wireless | 54,800 | a | 424,152 |
| | | | 11,746,403 |
| Computers & Peripherals—1.3% | | | |
| Electronics for Imaging | 85,565 | a | 1,570,973 |
| Lexmark International, Cl. A | 77,610 | b | 1,888,251 |
| Logitech International | 106,000 | b | 752,600 |
| Quantum | 575,420 | a | 690,504 |
| Silicon Graphics International | 64,110 | a,b | 537,883 |
| | | | 5,440,211 |
| Construction & Engineering—2.1% | | | |
| Aegion | 35,113 | a | 724,030 |
| Dycom Industries | 5,100 | a | 91,596 |
| Foster Wheeler | 26,748 | a | 600,760 |
| Granite Construction | 13,601 | | 416,191 |
| KBR | 44,500 | | 1,237,100 |
| Layne Christensen | 43,290 | a | 995,237 |
| Orion Marine Group | 87,933 | a | 624,324 |
12
| | | |
| Common Stocks (continued) | Shares | | Value ($) |
| Construction & Engineering (continued) | | | |
| Pike Electric | 53,301 | a | 527,680 |
| Shaw Group | 42,715 | a | 1,919,185 |
| Tutor Perini | 136,795 | a | 1,759,184 |
| | | | 8,895,287 |
| Consumer Finance—1.7% | | | |
| Cash America International | 20,600 | | 767,144 |
| DFC Global | 56,400 | a | 984,180 |
| First Cash Financial Services | 28,170 | a | 1,360,893 |
| Netspend Holdings | 167,230 | a | 1,948,230 |
| World Acceptance | 32,977 | a,b | 2,407,651 |
| | | | 7,468,098 |
| Container & Packaging—1.0% | | | |
| AptarGroup | 3,000 | | 143,010 |
| Crown Holdings | 32,900 | a | 1,228,815 |
| Greif, Cl. A | 25,094 | | 1,029,607 |
| Sealed Air | 57,500 | | 967,150 |
| Sonoco Products | 38,460 | | 1,156,492 |
| | | | 4,525,074 |
| Distributors—.1% | | | |
| VOXX International | 46,700 | a | 314,758 |
| Diversified Consumer Services—.5% | | | |
| Coinstar | 20,600 | a,b | 969,024 |
| Hillenbrand | 7,815 | | 165,365 |
| Universal Technical Institute | 91,343 | | 865,018 |
| | | | 1,999,407 |
| Diversified Financial Services—.7% | | | |
| Leucadia National | 27,510 | | 609,346 |
| NASDAQ OMX Group | 37,920 | | 918,802 |
| PHH | 74,130 | a,b | 1,624,188 |
| | | | 3,152,336 |
| Diversified Telecommunications—.2% | | | |
| MagicJack VocalTec | 39,150 | a,b | 673,771 |
| Electric Utilities—1.2% | | | |
| Empire District Electric | 66,301 | | 1,326,020 |
| PNM Resources | 42,400 | | 895,912 |
| Portland General Electric | 69,254 | | 1,871,936 |
The Fund 13
STATEMENT OF INVESTMENTS (continued)
| | | |
| Common Stocks (continued) | Shares | | Value ($) |
| Electric Utilities (continued) | | | |
| UNS Energy | 28,000 | | 1,192,240 |
| | | | 5,286,108 |
| Electrical Equipment—1.1% | | | |
| EnerSys | 34,659 | a | 1,207,519 |
| Franklin Electric | 17,201 | | 1,024,492 |
| Generac Holdings | 28,100 | b | 916,903 |
| GrafTech International | 128,428 | a,b | 1,245,752 |
| LSI Industries | 70,765 | | 482,617 |
| | | | 4,877,283 |
| Electronic Equipment & Instruments—3.9% | | | |
| Anixter International | 16,434 | | 1,003,789 |
| Badger Meter | 3,475 | | 156,583 |
| Benchmark Electronics | 62,253 | a | 967,412 |
| Cognex | 2,640 | | 94,565 |
| CTS | 161,096 | | 1,427,311 |
| Dolby Laboratories, Cl. A | 22,000 | a,b | 734,140 |
| GSI Group | 61,420 | a | 466,178 |
| Itron | 19,240 | a | 842,712 |
| Mercury Systems | 41,500 | a | 364,785 |
| Methode Electronics | 56,910 | | 513,897 |
| Park Electrochemical | 60,851 | | 1,482,939 |
| Plexus | 45,227 | a | 1,047,006 |
| Power-One | 376,181 | a,b | 1,561,151 |
| Pulse Electronics | 287,328 | | 91,945 |
| Radisys | 186,488 | a | 419,598 |
| ScanSource | 18,273 | a | 539,967 |
| SYNNEX | 37,280 | a | 1,230,986 |
| Vishay Intertechnology | 335,830 | a | 3,257,551 |
| Vishay Precision Group | 39,265 | a | 479,033 |
| | | | 16,681,548 |
| Energy Equipment & Services—1.9% | | | |
| Bristow Group | 15,899 | | 828,338 |
| Cal Dive International | 447,610 | a | 702,748 |
| CARBO Ceramics | 1,000 | | 76,570 |
| Helix Energy Solutions Group | 55,500 | a | 971,805 |
| ION Geophysical | 94,700 | a | 564,412 |
14
| | | |
| Common Stocks (continued) | Shares | | Value ($) |
| Energy Equipment & Services (continued) | | | |
| McDermott International | 50,400 | a | 530,712 |
| Newpark Resources | 230,670 | a,b | 1,799,226 |
| TETRA Technologies | 122,800 | a | 859,600 |
| Tidewater | 43,731 | | 1,961,773 |
| | | | 8,295,184 |
| Exchange-Traded Funds—.7% | | | |
| iShares Russell 2000 Index Fund | 34,680 | b | 2,846,534 |
| Food & Staples Retailing—.4% | | | |
| Andersons | 15,600 | | 658,008 |
| Nash Finch | 52,050 | | 1,098,255 |
| | | | 1,756,263 |
| Food Products—.4% | | | |
| Darling International | 52,040 | a | 877,915 |
| Hillshire Brands | 22,720 | | 632,752 |
| Overhill Farms | 41,025 | a | 181,330 |
| Smithfield Foods | 8,060 | a | 180,302 |
| | | | 1,872,299 |
| Gas Utilities—.4% | | | |
| Atmos Energy | 51,832 | | 1,814,638 |
| Health Care Technology—.3% | | | |
| Allscripts Healthcare Solutions | 100,990 | a | 1,123,009 |
| Healthcare Equipment & Supplies—1.8% | | | |
| Accuray | 83,670 | a | 525,448 |
| AngioDynamics | 59,979 | a | 632,179 |
| CryoLife | 103,457 | | 614,534 |
| Hill-Rom Holdings | 66,928 | | 1,871,307 |
| Merit Medical Systems | 46,079 | a | 639,577 |
| Natus Medical | 51,446 | a | 582,369 |
| NxStage Medical | 38,240 | a | 459,645 |
| Symmetry Medical | 184,768 | a | 1,801,488 |
| Syneron Medical | 72,720 | a | 606,485 |
| Young Innovations | 1,880 | | 68,000 |
| | | | 7,801,032 |
| Healthcare Providers & Services—2.5% | | | |
| Acadia Healthcare | 33,900 | a | 778,005 |
| Air Methods | 9,200 | a | 1,004,364 |
The Fund 15
STATEMENT OF INVESTMENTS (continued)
| | | |
| Common Stocks (continued) | Shares | | Value ($) |
| Healthcare Providers & Services (continued) | | | |
| AmSurg | 55,111 | a | 1,544,210 |
| Bio-Reference Labs | 51,390 | a,b | 1,353,099 |
| Chemed | 8,500 | | 578,680 |
| Health Net | 23,460 | a | 552,483 |
| HealthSouth | 8,630 | a | 189,774 |
| Kindred Healthcare | 197,206 | a | 2,139,685 |
| Magellan Health Services | 32,900 | a | 1,706,852 |
| Owens & Minor | 6,585 | | 180,297 |
| Universal American | 70,650 | | 585,688 |
| | | | 10,613,137 |
| Hotels, Restaurants & Leisure—2.4% | | | |
| Cracker Barrel Old Country Store | 30,612 | | 1,881,107 |
| Interval Leisure Group | 20,646 | | 388,764 |
| Jack in the Box | 34,100 | a | 939,455 |
| Krispy Kreme Doughnuts | 200,740 | a | 1,826,734 |
| Multimedia Games Holding Company | 47,400 | a | 700,572 |
| Nathan’s Famous | 10,711 | a | 339,110 |
| Ruby Tuesday | 85,380 | a | 666,818 |
| Ruth’s Hospitality Group | 82,211 | a | 616,582 |
| Scientific Games, Cl. A | 108,700 | a | 905,471 |
| SHFL Entertainment | 46,900 | a | 645,344 |
| Sonic | 41,134 | a | 416,687 |
| Wendy’s | 232,010 | b | 1,081,167 |
| | | | 10,407,811 |
| Household Durables—1.2% | | | |
| Beazer Homes USA | 39,270 | a,b | 586,301 |
| CSS Industries | 40,200 | | 824,904 |
| Harman International Industries | 5,120 | | 202,547 |
| Jarden | 11,225 | | 593,915 |
| Lifetime Brands | 20,939 | | 209,390 |
| M/I Homes | 80,690 | a | 1,775,987 |
| Tupperware Brands | 12,786 | | 829,172 |
| | | | 5,022,216 |
16
| | | |
| Common Stocks (continued) | Shares | | Value ($) |
| Household Products—.1% | | | |
| Church & Dwight | 3,770 | | 204,145 |
| WD-40 | 4,420 | | 208,801 |
| | | | 412,946 |
| Independent Power Prod. & Energy Traders—.3% | | | |
| GenOn Energy | 273,200 | a | 696,660 |
| Ormat Technologies | 40,500 | b | 746,010 |
| | | | 1,442,670 |
| Industrial Conglomerates—.5% | | | |
| Standex International | 47,200 | | 2,325,072 |
| Insurance—5.4% | | | |
| American Equity Investment Life Holding | 238,785 | b | 2,753,191 |
| American Financial Group | 6,990 | | 277,153 |
| Argo Group International Holdings | 18,460 | | 612,687 |
| Aspen Insurance Holdings | 48,200 | | 1,508,660 |
| Assurant | 6,310 | | 215,865 |
| Donegal Group, Cl. A | 31,546 | | 436,281 |
| Endurance Specialty Holdings | 28,504 | | 1,145,861 |
| Everest Re Group | 7,583 | | 822,528 |
| FBL Financial Group, Cl. A | 21,604 | | 718,117 |
| Fidelity National Financial, Cl. A | 44,000 | | 1,065,240 |
| Hanover Insurance Group | 24,092 | | 880,563 |
| HCC Insurance Holdings | 72,982 | | 2,691,576 |
| Horace Mann Educators | 35,200 | | 673,024 |
| Navigators Group | 17,233 | a | 903,182 |
| Platinum Underwriters Holdings | 17,566 | | 782,038 |
| Primerica | 65,970 | | 1,888,721 |
| ProAssurance | 1,961 | | 177,823 |
| RLI | 19,695 | | 1,269,146 |
| Tower Group | 178,287 | | 3,013,050 |
| Validus Holdings | 36,988 | | 1,311,594 |
| | | | 23,146,300 |
| Internet & Catalog Retail—.2% | | | |
| Shutterfly | 39,000 | a | 1,051,050 |
The Fund 17
STATEMENT OF INVESTMENTS (continued)
| | | |
| Common Stocks (continued) | Shares | | Value ($) |
| Internet Software & Services—.5% | | | |
| DealerTrack Holdings | 31,650 | a | 851,068 |
| Digital River | 62,200 | a | 908,742 |
| Unwired Planet | 247,632 | a | 339,256 |
| | | | 2,099,066 |
| IT Services—3.0% | | | |
| Acxiom | 79,834 | a | 1,412,263 |
| CACI International, Cl. A | 47,600 | a | 2,434,740 |
| Cardtronics | 46,600 | a | 1,069,004 |
| Cass Information Systems | 3,880 | | 182,321 |
| Computer Services | 2,735 | | 82,023 |
| Convergys | 154,550 | | 2,412,526 |
| CoreLogic | 58,900 | a | 1,521,976 |
| DST Systems | 18,100 | | 1,043,284 |
| Heartland Payment Systems | 30,884 | | 915,093 |
| Jack Henry & Associates | 5,460 | | 212,230 |
| MoneyGram International | 49,000 | a | 588,490 |
| NeuStar, Cl. A | 23,143 | a | 930,349 |
| Online Resources | 106,250 | a | 245,437 |
| Syntel | 3,435 | | 206,650 |
| | | | 13,256,386 |
| Leisure Equipment & Products—.1% | | | |
| JAKKS Pacific | 45,958 | b | 573,556 |
| Life Sciences Tools & Services—.5% | | | |
| Affymetrix | 102,600 | a,b | 341,658 |
| Cambrex | 47,900 | a | 525,463 |
| Charles River | | | |
| Laboratories International | 29,800 | a | 1,143,426 |
| | | | 2,010,547 |
| Machinery—4.1% | | | |
| Actuant, Cl. A | 40,050 | | 1,152,238 |
| Albany International, Cl. A | 30,710 | | 660,572 |
| Altra Holdings | 40,450 | | 760,864 |
| CLARCOR | 3,265 | | 151,431 |
18
| | | |
| Common Stocks (continued) | Shares | | Value ($) |
| Machinery (continued) | | | |
| Columbus McKinnon | 65,220 | a | 975,691 |
| Donaldson | 14,579 | | 489,563 |
| ESCO Technologies | 26,600 | | 976,220 |
| Flow International | 178,700 | a | 562,905 |
| Gardner Denver | 4,384 | | 306,222 |
| Graco | 4,145 | | 204,804 |
| Harsco | 26,550 | | 534,982 |
| Hyster-Yale Materials Handling | 10,260 | | 425,585 |
| Hyster-Yale Materials Handling, Cl. B | 10,260 | | 425,585 |
| IDEX | 10,826 | | 486,629 |
| ITT | 40,200 | | 899,274 |
| John Bean Technologies | 53,010 | | 863,533 |
| Lincoln Electric Holdings | 20,030 | | 951,626 |
| Lydall | 67,791 | a | 887,384 |
| Manitowoc | 44,400 | | 666,000 |
| Navistar International | 25,100 | a,b | 512,291 |
| Tennant | 26,200 | | 999,268 |
| Titan International | 80,420 | b | 1,634,939 |
| TriMas | 62,690 | a | 1,623,671 |
| Twin Disc | 28,200 | b | 481,092 |
| | | | 17,632,369 |
| Marine—.1% | | | |
| Danaos | 115,000 | a | 317,400 |
| Media—.6% | | | |
| John Wiley & Sons, Cl. A | 11,170 | | 476,959 |
| Meredith | 25,078 | b | 781,932 |
| Valassis Communications | 52,730 | a,b | 1,369,925 |
| | | | 2,628,816 |
| Metals & Mining—2.1% | | | |
| Carpenter Technology | 4,110 | | 199,171 |
| Haynes International | 27,080 | | 1,260,303 |
| Kaiser Aluminum | 29,005 | | 1,765,534 |
| Materion | 43,910 | | 900,155 |
The Fund 19
STATEMENT OF INVESTMENTS (continued)
| | | |
| Common Stocks (continued) | Shares | | Value ($) |
| Metals & Mining (continued) | | | |
| Metals USA Holdings | 76,910 | | 1,202,872 |
| Noranda Aluminum Holding | 123,800 | | 734,134 |
| Olympic Steel | 25,400 | b | 502,158 |
| RTI International Metals | 28,080 | a | 696,384 |
| Stillwater Mining | 45,920 | a | 527,162 |
| Worthington Industries | 59,400 | | 1,399,464 |
| | | | 9,187,337 |
| Multi-Utilities—.3% | | | |
| NorthWestern | 35,800 | | 1,241,902 |
| Office Electronics—.4% | | | |
| Zebra Technologies, Cl. A | 49,066 | a | 1,911,121 |
| Oil, Gas & Consumable Fuels—3.3% | | | |
| Berry Petroleum, Cl. A | 63,888 | | 1,987,556 |
| Callon Petroleum | 147,490 | a | 691,728 |
| Energy XXI | 28,900 | b | 915,552 |
| EPL Oil & Gas | 60,280 | a | 1,265,277 |
| Gulfport Energy | 47,530 | a | 1,808,041 |
| Halcon Resources | 136,370 | a | 842,767 |
| Northern Oil and Gas | 73,982 | a,b | 1,161,517 |
| PetroQuest Energy | 100,880 | a,b | 537,690 |
| Stone Energy | 61,430 | a | 1,273,444 |
| Synergy Resources | 162,220 | a | 627,791 |
| TransGlobe Energy | 55,000 | a | 569,800 |
| Warren Resources | 266,219 | a | 732,102 |
| Western Refining | 50,700 | b | 1,472,835 |
| World Fuel Services | 5,395 | | 210,135 |
| | | | 14,096,235 |
| Paper & Forest Products—.9% | | | |
| Glatfelter | 87,429 | | 1,485,419 |
| Mercer International | 180,915 | a | 1,255,550 |
| Schweitzer-Mauduit International | 26,408 | | 989,508 |
| | | | 3,730,477 |
20
| | | |
| Common Stocks (continued) | Shares | | Value ($) |
| Personal Products—1.0% | | | |
| Medifast | 24,700 | a | 783,484 |
| Nu Skin Enterprises, Cl. A | 75,062 | b | 3,407,815 |
| | | | 4,191,299 |
| Pharmaceuticals—.7% | | | |
| Flamel Technologies, ADR | 228,462 | a | 740,217 |
| MAP Pharmaceuticals | 18,280 | a,b | 291,383 |
| Nektar Therapeutics | 23,017 | a,b | 150,301 |
| Questcor Pharmaceuticals | 29,400 | b | 762,930 |
| Sagent Pharmaceuticals | 30,480 | a,b | 454,152 |
| Santarus | 81,600 | a | 813,552 |
| | | | 3,212,535 |
| Professional Services—3.3% | | | |
| Acacia Research | 37,850 | a | 841,405 |
| American Reprographics | 156,480 | a | 394,330 |
| Barrett Business Services | 19,971 | | 664,036 |
| CBIZ | 215,919 | a,b | 1,254,489 |
| CDI | 61,763 | | 1,020,325 |
| Corporate Executive Board | 3,720 | | 159,216 |
| Dun & Bradstreet | 12,965 | | 1,026,569 |
| FTI Consulting | 80,740 | a | 2,495,673 |
| Kelly Services, Cl. A | 56,200 | | 767,692 |
| Korn/Ferry International | 135,202 | a | 1,949,613 |
| Lender Processing Services | 150,420 | | 3,737,937 |
| | | | 14,311,285 |
| Real Estate Investment Trusts—2.8% | | | |
| Brandywine Realty Trust | 54,800 | c | 653,764 |
| Capstead Mortgage | 78,900 | c | 957,846 |
| EPR Properties | 2,400 | | 108,840 |
| First Potomac Realty Trust | 49,442 | c | 579,955 |
| Glimcher Realty Trust | 11,824 | c | 126,753 |
| Hersha Hospitality Trust | 339,958 | c | 1,594,403 |
| LaSalle Hotel Properties | 29,500 | c | 711,245 |
The Fund 21
STATEMENT OF INVESTMENTS (continued)
| | | |
| Common Stocks (continued) | Shares | | Value ($) |
| Real Estate Investment Trusts (continued) | | | |
| Medical Properties Trust | 202,304 | c | 2,360,888 |
| Omega Healthcare Investors | 131,160 | c | 3,006,187 |
| PS Business Parks | 11,300 | c | 728,737 |
| Ramco-Gershenson Properties Trust | 81,215 | c | 1,086,657 |
| | | | 11,915,275 |
| Real Estate Management & | | | |
| Development—.4% | | | |
| Altisource Portfolio Solutions | 17,113 | a | 1,819,625 |
| Road & Rail—.9% | | | |
| Arkansas Best | 54,345 | | 449,977 |
| Avis Budget Group | 58,400 | a | 1,106,096 |
| Con-way | 28,300 | | 794,947 |
| Landstar System | 4,110 | | 207,843 |
| Ryder System | 23,700 | | 1,115,559 |
| | | | 3,674,422 |
| Semiconductors & Semiconductor | | | |
| Equipment—2.1% | | | |
| Cabot Microelectronics | 4,365 | | 142,386 |
| Ceva | 25,900 | a | 391,349 |
| FormFactor | 157,632 | a | 698,310 |
| Freescale Semiconductor | 50,870 | a,b | 471,056 |
| GT Advanced Technologies | 428,100 | a,b | 1,442,697 |
| Integrated Silicon Solution | 78,743 | a | 689,789 |
| Kulicke & Soffa Industries | 105,850 | a | 1,209,865 |
| LTX-Credence | 80,142 | a | 455,207 |
| Rambus | 75,200 | a | 367,728 |
| Silicon Image | 211,500 | a | 985,590 |
| Spansion, Cl. A | 43,840 | a | 513,805 |
| Teradyne | 29,050 | a | 454,342 |
| Ultratech | 25,000 | a | 820,500 |
| Veeco Instruments | 12,760 | a,b | 363,150 |
| | | | 9,005,774 |
22
| | | |
| Common Stocks (continued) | Shares | | Value ($) |
| Software—2.7% | | | |
| Accelrys | 79,000 | a | 695,990 |
| American Software, Cl. A | 135,776 | | 1,095,712 |
| Cadence Design Systems | 71,100 | a | 905,103 |
| Comverse | 20,133 | | 579,227 |
| Comverse Technology | 122,430 | a | 435,851 |
| Ebix | 10,950 | | 184,069 |
| Fair Isaac | 16,433 | | 703,661 |
| FalconStor Software | 295,918 | a | 707,244 |
| NetScout Systems | 38,600 | a | 969,632 |
| Progress Software | 31,990 | a | 643,319 |
| Rovi | 55,960 | a | 858,426 |
| SeaChange International | 66,200 | a | 612,350 |
| TiVo | 101,700 | a | 1,189,890 |
| Tyler Technologies | 15,600 | a | 731,952 |
| Verint Systems | 42,110 | a,b | 1,169,395 |
| | | | 11,481,821 |
| Specialty Retail—4.2% | | | |
| Barnes & Noble | 62,800 | a,b | 901,180 |
| Bebe Stores | 105,416 | | 396,364 |
| Chico’s FAS | 37,890 | | 706,648 |
| Express | 25,900 | a | 386,687 |
| Finish Line, Cl. A | 51,400 | | 1,060,382 |
| Guess? | 15,780 | | 408,229 |
| JOS. A. Bank Clothiers | 36,410 | a,b | 1,569,272 |
| Kirkland’s | 47,740 | a | 433,957 |
| Men’s Wearhouse | 41,400 | | 1,343,016 |
| Office Depot | 275,090 | a | 924,302 |
| OfficeMax | 232,200 | | 2,322,000 |
| PEP Boys-Manny Moe & Jack | 127,130 | b | 1,343,764 |
| RadioShack | 149,800 | b | 304,094 |
| Rent-A-Center | 144,695 | | 5,029,598 |
The Fund 23
STATEMENT OF INVESTMENTS (continued)
| | | |
| Common Stocks (continued) | Shares | | Value ($) |
| Specialty Retail (continued) | | | |
| Sonic Automotive, Cl. A | 52,129 | b | 1,029,026 |
| | | | 18,158,519 |
| Textiles, Apparel & Luxury Goods—1.5% | | | |
| Aeropostale | 35,060 | a | 484,179 |
| American Eagle Outfitters | 32,950 | | 698,540 |
| Ascena Retail Group | 85,937 | a | 1,727,334 |
| Delta Apparel | 45,995 | a | 667,387 |
| G-III Apparel Group | 16,100 | a | 612,605 |
| Iconix Brand Group | 119,354 | a | 2,406,176 |
| | | | 6,596,221 |
| Thrifts & Mortgage Finance—1.8% | | | |
| Astoria Financial | 61,000 | b | 569,130 |
| Brookline Bancorp | 72,744 | | 615,414 |
| Dime Community Bancshares | 67,230 | | 937,858 |
| First Financial Holdings | 55,266 | | 745,538 |
| Flushing Financial | 45,015 | | 673,424 |
| Heritage Financial Group | 51,954 | | 682,676 |
| Ocwen Financial | 66,400 | a | 2,381,104 |
| Rockville Financial | 53,488 | | 694,274 |
| Washington Federal | 36,168 | | 581,220 |
| | | | 7,880,638 |
| Tobacco—.1% | | | |
| Universal | 11,600 | b | 578,840 |
| Trading Companies & Distributors—.6% | | | |
| CAI International | 59,250 | a | 1,185,000 |
| DXP Enterprises | 17,800 | a | 859,562 |
| Lawson Products | 31,896 | b | 264,099 |
| Textainer Group Holdings | 12,700 | b | 383,286 |
| | | | 2,691,947 |
| Total Common Stocks | | | |
| (cost $381,504,476) | | | 414,046,970 |
24
| | | | |
| Investment of Cash Collateral | | | | |
| for Securities Loaned—10.1% | Shares | | Value ($) | |
| Registered Investment Company; | | | | |
| Dreyfus Institutional Cash Advantage Fund | | | | |
| (cost $43,410,240) | 43,410,240 | d | 43,410,240 | |
| Total Investments (cost $424,914,716) | 106.2 | % | 457,457,210 | |
| Liabilities, Less Cash and Receivables | (6.2 | %) | (26,671,068 | ) |
| Net Assets | 100.0 | % | 430,786,142 | |
ADR—American Depository Receipts
|
| a Non-income producing security. |
| b Security, or portion thereof, on loan.At November 30, 2012, the value of the fund’s securities on loan was |
| $42,385,211 and the value of the collateral held by the fund was $43,724,540, consisting of cash collateral of |
| $43,410,240 and U.S. Government & Agency securities valued at $314,300. |
| c Investment in real estate investment trust. |
| d Investment in affiliated money market mutual fund. |
| | | |
| Portfolio Summary (Unaudited)† | | |
| |
| | Value (%) | | Value (%) |
| Capital Goods | 10.7 | Utilities | 2.2 |
| Banks | 10.6 | Semiconductors & | |
| Money Market Investment | 10.1 | Semiconductor Equipment | 2.1 |
| Technology Hardware & Equipment | 8.3 | Automobiles & Components | 1.9 |
| Materials | 7.4 | Transportation | 1.7 |
| Software & Services | 6.2 | Pharmaceuticals, | |
| Commercial & Professional Services | 6.1 | Biotech & Life Sciences | 1.3 |
| Insurance | 5.4 | Household & Personal Products | 1.1 |
| Diversified Financials | 5.3 | Exchange-Traded Funds | .7 |
| Energy | 5.2 | Food, Beverage & Tobacco | .7 |
| Health Care Equipment & Services | 4.6 | Media | .6 |
| Retailing | 4.5 | Food & Staples Retailing | .4 |
| Real Estate | 3.2 | Telecommunication Services | .2 |
| Consumer Services | 2.9 | | |
| Consumer Durables & Apparel | 2.8 | | 106.2 |
| |
| † Based on net assets. | | | |
| See notes to financial statements. | | | |
The Fund 25
STATEMENT OF ASSETS AND LIABILITIES
November 30, 2012
| | | |
| | | Cost | Value |
| Assets ($): | | | |
| Investments in securities—See Statement of Investments (including | | |
| securities on loan, valued at $42,385,211)—Note 1(b): | | |
| Unaffiliated issuers | | 381,504,476 | 414,046,970 |
| Affiliated issuers | | 43,410,240 | 43,410,240 |
| Cash | | | 15,444,789 |
| Receivable for investment securities sold | | | 5,567,487 |
| Dividends and securities lending income receivable | | | 722,876 |
| Receivable for shares of Common Stock subscribed | | | 144,200 |
| Prepaid expenses | | | 31,479 |
| | | | 479,368,041 |
| Liabilities ($): | | | |
| Due to The Dreyfus Corporation and affiliates—Note 3(c) | | 339,855 |
| Liability for securities on loan—Note 1(b) | | | 43,410,240 |
| Payable for investment securities purchased | | | 4,079,473 |
| Payable for shares of Common Stock redeemed | | | 663,757 |
| Accrued expenses | | | 88,574 |
| | | | 48,581,899 |
| Net Assets ($) | | | 430,786,142 |
| Composition of Net Assets ($): | | | |
| Paid-in capital | | | 379,028,895 |
| Accumulated undistributed investment income—net | | | 1,890,606 |
| Accumulated net realized gain (loss) on investments | | | 17,324,147 |
| Accumulated net unrealized appreciation | | | |
| depreciation) on investments | | | 32,542,494 |
| Net Assets ($) | | | 430,786,142 |
| |
| |
| Net Asset Value Per Share | | | |
| | Class A | Class C | Class I |
| Net Assets ($) | 889,210 | 164,976 | 429,731,956 |
| Shares Outstanding | 45,318 | 8,683 | 21,655,152 |
| Net Asset Value Per Share ($) | 19.62 | 19.00 | 19.84 |
| |
| See notes to financial statements. | | | |
26
STATEMENT OF OPERATIONS
Year Ended November 30, 2012
| | |
| Investment Income ($): | | |
| Income: | | |
| Cash dividends (net of $3,666 foreign taxes withheld at source) | 5,222,988 | |
| Income from securities lending—Note 1(b) | 302,904 | |
| Total Income | 5,525,892 | |
| Expenses: | | |
| Management fee—Note 3(a) | 3,299,659 | |
| Custodian fees—Note 3(c) | 92,648 | |
| Professional fees | 63,189 | |
| Registration fees | 59,374 | |
| Directors’ fees and expenses—Note 3(d) | 47,819 | |
| Prospectus and shareholders’ reports | 16,104 | |
| Shareholder servicing costs—Note 3(c) | 8,147 | |
| Loan commitment fees—Note 2 | 3,542 | |
| Distribution fees—Note 3(b) | 1,278 | |
| Miscellaneous | 26,124 | |
| Total Expenses | 3,617,884 | |
| Less—reduction in expenses due to undertaking—Note 3(a) | (399 | ) |
| Less—reduction in fees due to earnings credits—Note 3(c) | (14 | ) |
| Net Expenses | 3,617,471 | |
| Investment Income—Net | 1,908,421 | |
| Realized and Unrealized Gain (Loss) on Investments—Note 4 ($): | | |
| Net realized gain (loss) on investments | 18,752,627 | |
| Net unrealized appreciation (depreciation) on investments | 28,174,786 | |
| Net Realized and Unrealized Gain (Loss) on Investments | 46,927,413 | |
| Net Increase in Net Assets Resulting from Operations | 48,835,834 | |
| |
| See notes to financial statements. | | |
The Fund 27
STATEMENT OF CHANGES IN NET ASSETS
| | | | |
| | Year Ended November 30, | |
| | 2012 | | 2011 | |
| Operations ($): | | | | |
| Investment income—net | 1,908,421 | | 573,823 | |
| Net realized gain (loss) on investments | 18,752,627 | | 24,412,345 | |
| Net unrealized appreciation | | | | |
| (depreciation) on investments | 28,174,786 | | (24,681,280 | ) |
| Net Increase (Decrease) in Net Assets | | | | |
| Resulting from Operations | 48,835,834 | | 304,888 | |
| Dividends to Shareholders from ($): | | | | |
| Investment income—net: | | | | |
| Class I Shares | (639,291 | ) | — | |
| Net realized gain on investments: | | | | |
| Class A Shares | (75,831 | ) | (443,790 | ) |
| Class C Shares | (14,596 | ) | (61,614 | ) |
| Class I Shares | (25,288,419 | ) | (14,742,480 | ) |
| Total Dividends | (26,018,137 | ) | (15,247,884 | ) |
| Capital Stock Transactions ($): | | | | |
| Net proceeds from shares sold: | | | | |
| Class A Shares | 118,438 | | 830,601 | |
| Class C Shares | 506 | | 146,384 | |
| Class I Shares | 147,573,196 | | 119,134,231 | |
| Dividends reinvested: | | | | |
| Class A Shares | 75,831 | | 43,161 | |
| Class C Shares | 14,596 | | 15,022 | |
| Class I Shares | 13,220,617 | | 6,759,296 | |
| Cost of shares redeemed: | | | | |
| Class A Shares | (421,174 | ) | (7,562,568 | ) |
| Class C Shares | (22,518 | ) | (958,764 | ) |
| Class I Shares | (50,912,127 | ) | (56,671,319 | ) |
| Increase (Decrease) in Net Assets | | | | |
| from Capital Stock Transactions | 109,647,365 | | 61,736,044 | |
| Total Increase (Decrease) in Net Assets | 132,465,062 | | 46,793,048 | |
| Net Assets ($): | | | | |
| Beginning of Period | 298,321,080 | | 251,528,032 | |
| End of Period | 430,786,142 | | 298,321,080 | |
| Undistributed investment income—net | 1,890,606 | | 621,176 | |
28
| | | | |
| | Year Ended November 30, | |
| | 2012 | | 2011 | |
| Capital Share Transactions: | | | | |
| Class A | | | | |
| Shares sold | 6,248 | | 40,242 | |
| Shares issued for dividends reinvested | 4,401 | | 2,167 | |
| Shares redeemed | (22,730 | ) | (357,221 | ) |
| Net Increase (Decrease) in Shares Outstanding | (12,081 | ) | (314,812 | ) |
| Class C | | | | |
| Shares sold | 30 | | 7,198 | |
| Shares issued for dividends reinvested | 869 | | 766 | |
| Shares redeemed | (1,216 | ) | (46,318 | ) |
| Net Increase (Decrease) in Shares Outstanding | (317 | ) | (38,354 | ) |
| Class I | | | | |
| Shares sold | 7,796,955 | | 6,040,831 | |
| Shares issued for dividends reinvested | 761,027 | | 337,627 | |
| Shares redeemed | (2,677,729 | ) | (2,940,158 | ) |
| Net Increase (Decrease) in Shares Outstanding | 5,880,253 | | 3,438,300 | |
| |
| See notes to financial statements. | | | | |
The Fund 29
FINANCIAL HIGHLIGHTS
The following tables describe the performance for each share class for the fiscal periods indicated.All information (except portfolio turnover rate) reflects financial results for a single fund share.Total return shows how much your investment in the fund would have increased (or decreased) during each period, assuming you had reinvested all dividends and distributions.These figures have been derived from the fund’s financial statements.
| | | | | | | | |
| | | | Year Ended November 30, | | | |
| Class A Shares | 2012 | | 2011 | | 2010 | | 2009 | a |
| Per Share Data ($): | | | | | | | | |
| Net asset value, beginning of period | 18.66 | | 19.63 | | 15.24 | | 12.50 | |
| Investment Operations: | | | | | | | | |
| Investment income (loss)—netb | .02 | | (.04 | ) | (.05 | ) | (.00 | )c |
| Net realized and unrealized | | | | | | | | |
| gain (loss) on investments | 2.56 | | .23 | | 4.47 | | 2.74 | |
| Total from Investment Operations | 2.58 | | .19 | | 4.42 | | 2.74 | |
| Distributions: | | | | | | | | |
| Dividends from net realized | | | | | | | | |
| gain on investments | (1.62 | ) | (1.16 | ) | (.03 | ) | — | |
| Net asset value, end of period | 19.62 | | 18.66 | | 19.63 | | 15.24 | |
| Total Return (%)d | 15.04 | | .62 | | 29.05 | | 21.92 | e |
| Ratios/Supplemental Data (%): | | | | | | | | |
| Ratio of total expenses to average net assets | 1.40 | | 1.29 | | 1.34 | | 2.94 | f |
| Ratio of net expenses to average net assets | 1.36 | | 1.27 | | 1.32 | | 1.40 | f |
| Ratio of net investment income | | | | | | | | |
| (loss) to average net assets | .12 | | (.18 | ) | (.27 | ) | (.02 | )f |
| Portfolio Turnover Rate | 74.74 | | 67.49 | | 56.03 | | 48.43 | e |
| Net Assets, end of period ($ x 1,000) | 889 | | 1,071 | | 7,308 | | 6,289 | |
| |
| a | From December 17, 2008 (commencement of operations) to November 30, 2009. |
| b | Based on average shares outstanding at each month end. |
| c | Amount represents less than $.01 per share. |
| d | Exclusive of sales charge. |
| e | Not annualized. |
| f | Annualized. |
See notes to financial statements.
30
| | | | | | | | |
| | | | Year Ended November 30, | | | |
| Class C Shares | 2012 | | 2011 | | 2010 | | 2009 | a |
| Per Share Data ($): | | | | | | | | |
| Net asset value, beginning of period | 18.25 | | 19.34 | | 15.13 | | 12.50 | |
| Investment Operations: | | | | | | | | |
| Investment (loss)—netb | (.12 | ) | (.18 | ) | (.18 | ) | (.10 | ) |
| Net realized and unrealized | | | | | | | | |
| gain (loss) on investments | 2.49 | | .25 | | 4.42 | | 2.73 | |
| Total from Investment Operations | 2.37 | | .07 | | 4.24 | | 2.63 | |
| Distributions: | | | | | | | | |
| Dividends from net realized | | | | | | | | |
| gain on investments | (1.62 | ) | (1.16 | ) | (.03 | ) | — | |
| Net asset value, end of period | 19.00 | | 18.25 | | 19.34 | | 15.13 | |
| Total Return (%)c | 14.16 | | (.03 | ) | 28.07 | | 21.04 | d |
| Ratios/Supplemental Data (%): | | | | | | | | |
| Ratio of total expenses to average net assets | 2.15 | | 2.03 | | 2.10 | | 3.70 | e |
| Ratio of net expenses to average net assets | 2.12 | | 2.02 | | 2.08 | | 2.15 | e |
| Ratio of net investment (loss) | | | | | | | | |
| to average net assets | (.64 | ) | (.92 | ) | (1.02 | ) | (.77 | )e |
| Portfolio Turnover Rate | 74.74 | | 67.49 | | 56.03 | | 48.43 | d |
| Net Assets, end of period ($ x 1,000) | 165 | | 164 | | 916 | | 617 | |
| |
| a | From December 17, 2008 (commencement of operations) to November 30, 2009. |
| b | Based on average shares outstanding at each month end. |
| c | Exclusive of sales charge. |
| d | Not annualized. |
| e | Annualized. |
See notes to financial statements.
The Fund 31
FINANCIAL HIGHLIGHTS (continued)
| | | | | | | | |
| | | | Year Ended November 30, | | | |
| Class I Shares | 2012 | | 2011 | | 2010 | | 2009 | a |
| Per Share Data ($): | | | | | | | | |
| Net asset value, beginning of period | 18.83 | | 19.72 | | 15.28 | | 12.50 | |
| Investment Operations: | | | | | | | | |
| Investment income—netb | .10 | | .04 | | .00 | c | .03 | |
| Net realized and unrealized | | | | | | | | |
| gain (loss) on investments | 2.57 | | .23 | | 4.47 | | 2.75 | |
| Total from Investment Operations | 2.67 | | .27 | | 4.47 | | 2.78 | |
| Distributions: | | | | | | | | |
| Dividends from investment income—net | (.04 | ) | — | | (.00 | )c | — | |
| Dividends from net realized | | | | | | | | |
| gain on investments | (1.62 | ) | (1.16 | ) | (.03 | ) | — | |
| Total Distributions | (1.66 | ) | (1.16 | ) | (.03 | ) | — | |
| Net asset value, end of period | 19.84 | | 18.83 | | 19.72 | | 15.28 | |
| Total Return (%) | 15.45 | | 1.04 | | 29.32 | | 22.24 | d |
| Ratios/Supplemental Data (%): | | | | | | | | |
| Ratio of total expenses to average net assets | .99 | | .99 | | 1.07 | | 1.91 | e |
| Ratio of net expenses to average net assets | .99 | | .99 | | 1.06 | | 1.15 | e |
| Ratio of net investment income | | | | | | | | |
| o average net assets | .52 | | .20 | | .02 | | .26 | e |
| Portfolio Turnover Rate | 74.74 | | 67.49 | | 56.03 | | 48.43 | d |
| Net Assets, end of period ($ x 1,000) | 429,732 | | 297,086 | | 243,304 | | 63,379 | |
| |
| a | From December 17, 2008 (commencement of operations) to November 30, 2009. |
| b | Based on average shares outstanding at each month end. |
| c | Amount represents less than $.01 per share. |
| d | Not annualized. |
| e | Annualized. |
See notes to financial statements.
32
NOTES TO FINANCIAL STATEMENTS
NOTE 1—Significant Accounting Policies:
Dreyfus Select Managers Small CapValue Fund (the “fund”) is a separate non-diversified series of Strategic Funds, Inc. (the “Company”), which is registered under the Investment Company Act of 1940, as amended (the “Act”), as an open-end management investment company and operates as a series company currently offering nine series, including the fund.The fund’s investment objective is to seek capital appreciation.The Dreyfus Corporation (the “Manager” or “Dreyfus”), a wholly-owned subsidiary of The Bank of New York Mellon Corporation (“BNY Mellon”), serves as the fund’s investment adviser. EACM Advisors LLC (“EACM”), a subsidiary of BNY Mellon and an affiliate of Dreyfus, serves as the fund’s portfolio allocation manager.Thompson, Siegel and Walmsley, LLC (“TS&W”), Walthausen & Co., LLC (“Walthausen”), Neuberger Berman Management LLC (“Neuberger Berman”), Lombardia Capital Partners, LLC (“Lombardia”), Iridian Asset Management LLC (“Iridian”),Vulcan Value Partners, LLC (“Vulcan”) and Kayne Anderson Rudnick Investment Management, LLC (“Kayne”) serve as the fund’s sub-investment advisers, each managing an allocated portion of the fund’s portfolio. Effective May 10, 2012 and August 15, 2012, the Company’s Board of Directors (the “Board”) approved new sub-investment advisory agreements with Vulcan and Kayne, respectively.
MBSC Securities Corporation (the “Distributor”), a wholly-owned subsidiary of Dreyfus, is the distributor of the fund’s shares.The fund is authorized to issue 100 million shares of $.001 par value Common Stock in each of the following classes of shares: Class A, Class C and Class I. Class A shares are subject to a sales charge imposed at the time of purchase. Class C shares are subject to a contingent deferred sales charge (“CDSC”) imposed on Class C shares redeemed within one year of purchase. Class I shares are sold at net asset value per share only to institutional investors. Other differences between the classes include
The Fund 33
NOTES TO FINANCIAL STATEMENTS (continued)
the services offered to and the expenses borne by each class, the allocation of certain transfer agency costs and certain voting rights. Income, expenses (other than expenses attributable to a specific class), and realized and unrealized gains or losses on investments are allocated to each class of shares based on its relative net assets.
The Company accounts separately for the assets, liabilities and operations of each series. Expenses directly attributable to each series are charged to that series’ operations; expenses which are applicable to all series are allocated among them on a pro rata basis.
The Financial Accounting Standards Board (“FASB”) Accounting Standards Codification is the exclusive reference of authoritative U.S. generally accepted accounting principles (“GAAP”) recognized by the FASB to be applied by nongovernmental entities. Rules and interpretive releases of the Securities and Exchange Commission (“SEC”) under authority of federal laws are also sources of authoritative GAAP for SEC registrants. The fund’s financial statements are prepared in accordance with GAAP, which may require the use of management estimates and assumptions.Actual results could differ from those estimates.
The Company enters into contracts that contain a variety of indemnifications.The fund’s maximum exposure under these arrangements is unknown.The fund does not anticipate recognizing any loss related to these arrangements.
(a) Portfolio valuation: The fair value of a financial instrument is the amount that would be received to sell an asset or paid to transfer a liability in an orderly transaction between market participants at the measurement date (i.e., the exit price). GAAP establishes a fair value hierarchy that prioritizes the inputs of valuation techniques used to measure fair value.This hierarchy gives the highest priority to unad-
34
justed quoted prices in active markets for identical assets or liabilities (Level 1 measurements) and the lowest priority to unobservable inputs (Level 3 measurements).
Additionally, GAAP provides guidance on determining whether the volume and activity in a market has decreased significantly and whether such a decrease in activity results in transactions that are not orderly. GAAP requires enhanced disclosures around valuation inputs and techniques used during annual and interim periods.
Various inputs are used in determining the value of the fund’s investments relating to fair value measurements.These inputs are summarized in the three broad levels listed below:
Level 1—unadjusted quoted prices in active markets for identical investments.
Level 2—other significant observable inputs (including quoted prices for similar investments, interest rates, prepayment speeds, credit risk, etc.).
Level 3—significant unobservable inputs (including the fund’s own assumptions in determining the fair value of investments).
The inputs or methodology used for valuing securities are not necessarily an indication of the risk associated with investing in those securities.
Changes in valuation techniques may result in transfers in or out of an assigned level within the disclosure hierarchy. Valuation techniques used to value the fund’s investments are as follows:
Investments in securities are valued at the last sales price on the securities exchange or national securities market on which such securities are primarily traded. Securities listed on the National Market System for which market quotations are available are valued at the official closing
The Fund 35
NOTES TO FINANCIAL STATEMENTS (continued)
price or, if there is no official closing price that day, at the last sales price. Securities not listed on an exchange or the national securities market, or securities for which there were no transactions, are valued at the average of the most recent bid and asked prices, except for open short positions, where the asked price is used for valuation purposes. Bid price is used when no asked price is available. Registered investment companies that are not traded on an exchange are valued at their net asset value. All of the preceding securities are categorized within Level 1 of the fair value hierarchy.
Fair valuing of securities may be determined with the assistance of a pricing service using calculations based on indices of domestic securities and other appropriate indicators, such as prices of relevant ADRs and financial futures. Utilizing these techniques may result in transfers between Level 1 and Level 2 of the fair value hierarchy.
When market quotations or official closing prices are not readily available, or are determined not to reflect accurately fair value, such as when the value of a security has been significantly affected by events after the close of the exchange or market on which the security is principally traded (for example, a foreign exchange or market), but before the fund calculates its net asset value, the fund may value these investments at fair value as determined in accordance with the procedures approved by the Board. Certain factors may be considered when fair valuing investments such as: fundamental analytical data, the nature and duration of restrictions on disposition, an evaluation of the forces that influence the market in which the securities are purchased and sold, and public trading in similar securities of the issuer or comparable issuers. These securities are either categorized within Level 2 or 3 depending on the relevant inputs used.
For restricted securities where observable inputs are limited, assumptions about market activity and risk are used and are categorized within Level 3 of the fair value hierarchy.
36
The following is a summary of the inputs used as of November 30, 2012 in valuing the fund’s investments:
| | | | | |
| | | Level 2—Other | | Level 3— | |
| | Level 1— | Significant | | Significant | |
| | Unadjusted | Observable | | Unobservable | |
| | Quoted Prices | Inputs | | Inputs | Total |
| Assets ($) | | | | | |
| Investments in Securities: | | | | |
| Equity Securities— | | | | | |
| Domestic | | | | | |
| Common Stocks† | 403,413,006 | 425,585 | †† | — | 403,838,591 |
| Equity Securities— | | | | | |
| Foreign | | | | | |
| Common Stocks† | 7,361,845 | — | | — | 7,361,845 |
| Exchange-Traded | | | | | |
| Funds | 2,846,534 | — | | — | 2,846,534 |
| Mutual Funds | 43,410,240 | — | | — | 43,410,240 |
| |
| † | See Statement of Investments for additional detailed categorizations. |
| †† | Securities classified as Level 2 at period end as the values were determined pursuant to the fund’s |
| | fair valuation procedures. |
At November 30, 2012, there were no transfers between Level 1 and Level 2 of the fair value hierarchy.
(b) Securities transactions and investment income: Securities transactions are recorded on a trade date basis. Realized gains and losses from securities transactions are recorded on the identified cost basis. Dividend income is recognized on the ex-dividend date and interest income, including, where applicable, accretion of discount and amortization of premium on investments, is recognized on the accrual basis.
Pursuant to a securities lending agreement with The Bank of New York Mellon, a subsidiary of BNY Mellon and an affiliate of Dreyfus, the fund may lend securities to qualified institutions. It is the fund’s policy that, at origination, all loans are secured by collateral of at least 102% of the value of U.S. securities loaned and 105% of the value of foreign securities loaned. Collateral equivalent to at least 100% of the
The Fund 37
NOTES TO FINANCIAL STATEMENTS (continued)
market value of securities on loan is maintained at all times. Collateral is either in the form of cash, which can be invested in certain money market mutual funds managed by Dreyfus, U.S. Government and Agency securities or letters of credit.The fund is entitled to receive all income on securities loaned, in addition to income earned as a result of the lending transaction. Although each security loaned is fully collateralized, the fund bears the risk of delay in recovery of, or loss of rights in, the securities loaned should a borrower fail to return the securities in a timely manner. During the period ended November 30, 2012,The Bank of New York Mellon earned $100,968 from lending portfolio securities, pursuant to the securities lending agreement.
(c) Affiliated issuers: Investments in other investment companies advised by Dreyfus are defined as “affiliated” in the Act. Investments in affiliated investment companies for the period ended November 30, 2012 were as follows:
| | | | | |
| Affiliated | | | | | |
| Investment | Value | | | Value | Net |
| Company | 11/30/2011($) | Purchases ($) | Sales ($) | 11/30/2012 ($) | Assets (%) |
| Dreyfus | | | | | |
| Institutional | | | | | |
| Cash | | | | | |
| Advantage | | | | | |
| Fund | 11,415,857 | 170,177,841 | 138,183,458 | 43,410,240 | 10.1 |
(d) Dividends to shareholders: Dividends are recorded on the ex-dividend date. Dividends from investment income-net and dividends from net realized capital gains, if any, are normally declared and paid annually, but the fund may make distributions on a more frequent basis to comply with the distribution requirements of the Internal Revenue Code of 1986, as amended (the “Code”). To the extent that net realized capital gains can be offset by capital loss carryovers, it is the policy of the fund not to distribute such gains. Income and capital gain distributions are determined in accordance with income tax regulations, which may differ from GAAP.
(e) Federal income taxes: It is the policy of the fund to continue to qualify as a regulated investment company, if such qualification is in the best interests of its shareholders, by complying with the applicable pro-
38
visions of the Code, and to make distributions of taxable income sufficient to relieve it from substantially all federal income and excise taxes.
As of and during the period ended November 30, 2012, the fund did not have any liabilities for any uncertain tax positions.The fund recognizes interest and penalties, if any, related to uncertain tax positions as income tax expense in the Statement of Operations. During the period, the fund did not incur any interest or penalties.
Each of the tax years in the four-year period ended November 30, 2012 remains subject to examination by the Internal Revenue Service and state taxing authorities.
At November 30, 2012, the components of accumulated earnings on a tax basis were as follows: undistributed ordinary income $11,594,979, undistributed capital gains $11,932,510 and unrealized appreciation $28,229,758.
The tax character of distributions paid to shareholders during the fiscal periods ended November 30, 2012 and November 30, 2011 were as follows: ordinary income $7,650,223 and $11,066,759 and long-term capital gains $18,367,914 and $4,181,125, respectively.
NOTE 2—Bank Lines of Credit:
The fund participates with other Dreyfus-managed funds in a $210 million unsecured credit facility led by Citibank, N.A. and a $300 million unsecured credit facility provided by The Bank of New York Mellon, (each, a “Facility”), each to be utilized primarily for temporary or emergency purposes, including the financing of redemptions. Prior to October 10, 2012, the unsecured credit facility with Citibank, N.A., was $225 million. In connection therewith, the fund has agreed to pay its pro rata portion of commitment fees for each Facility. Interest is charged to the fund based on rates determined pursuant to the terms of the respective Facility at the time of borrowing. During the period ended on November 30, 2012, the fund did not borrow under the Facilities.
The Fund 39
NOTES TO FINANCIAL STATEMENTS (continued)
NOTE 3—Management Fee, Sub-Investment Advisory Fee and Other Transactions With Affiliates:
(a) Pursuant to a management agreement with Dreyfus, the management fee is computed at the annual rate of .90% of the value of the fund’s average daily net assets and is payable monthly. Dreyfus has contractually agreed, from December 1, 2011 through April 1, 2013, to waive receipt of its fees and/or assume the expenses of the fund so that the direct expenses of none of the classes (excluding Rule 12b-1 Distribution Plan fees, Shareholder Services Plan fees, taxes, interest expense, brokerage commissions, commitment fees on borrowings and extraordinary expenses) exceed an annual rate of 1.15% of the value of the fund’s average daily net assets.The reduction in expenses, pursuant to the undertaking amounted to $399 during the period ended November 30, 2012.
Pursuant to separate Sub-Investment Advisory Agreements between Dreyfus and TS&W, Walthausen, Neuberger Berman, Lombardia, Iridian, Vulcan and Kayne, Dreyfus pays each sub-investment adviser separate monthly fees at an annual percentage of the value of the fund’s average daily net assets managed by such sub-investment adviser.
(b) Under the Distribution Plan adopted pursuant to Rule 12b-1 under the Act, Class C shares pay the Distributor for distributing its shares at an annual rate of .75% of the value of the average daily net assets of Class C shares. During the period ended November 30, 2012, Class C shares were charged $1,278 pursuant to the Distribution Plan.
(c) Under the Shareholder Services Plan, Class A and Class C shares pay the Distributor at an annual rate of .25% of the value of their average daily net assets for the provision of certain services.The services provided may include personal services relating to shareholder accounts, such as answering shareholder inquiries regarding the fund and providing reports and other information, and services related to the maintenance of shareholder accounts.The Distributor may make payments to Service
40
Agents (securities dealers, financial institutions or other industry professionals) with respect to these services.The Distributor determines the amounts to be paid to Service Agents. During the period ended November 30, 2012, Class A and Class C shares were charged $2,146 and $426, respectively, pursuant to the Shareholder Services Plan.
The fund has arrangements with the transfer agent and the custodian whereby the fund may receive earnings credits when positive cash balances are maintained, which are used to offset transfer agency and custody fees. For financial reporting purposes, the fund includes net earnings credits as an expense offset in the Statement of Operations.
The fund compensates Dreyfus Transfer, Inc., a wholly-owned subsidiary of Dreyfus, under a transfer agency agreement for providing transfer agency services for the fund and, since May 29, 2012, cash management services related to fund subscriptions and redemptions. During the period ended November 30, 2012, the fund was charged $3,073 for transfer agency services and $72 for cash management services. Cash management fees were partially offset by earnings credits of $9.These fees are included in Shareholder servicing costs in the Statement of Operations.
The fund compensatesThe Bank of NewYork Mellon under a custody agreement for providing custodial services for the fund. During the period ended November 30, 2012, the fund was charged $92,648 pursuant to the custody agreement.
Prior to May 29, 2012, the fund compensated The Bank of NewYork Mellon under a cash management agreement for performing cash management services related to fund subscriptions and redemptions. During the period ended November 30, 2012, the fund was charged $140 pursuant to the cash management agreement, which is included in Shareholder servicing costs in the Statement of Operations. These fees were partially offset by earnings credits of $5.
The Fund 41
NOTES TO FINANCIAL STATEMENTS (continued)
During the period ended November 30, 2012, the fund was charged $8,650 for services performed by the Chief Compliance Officer and his staff.
The components of “Due to The Dreyfus Corporation and affiliates” in the Statement of Assets and Liabilities consist of: management fees $308,482, Distribution Plan fees $99, Shareholder Services Plan fees $205, custodian fees $27,046, Chief Compliance Officer fees $3,318 and transfer agency fees $705.
(d) Each Board member also serves as a Board member of other funds within the Dreyfus complex. Annual retainer fees and attendance fees are allocated to each fund based on net assets.
NOTE 4—Securities Transactions:
The aggregate amount of purchases and sales of investment securities, excluding short-term securities, during the period ended November 30, 2012, amounted to $338,828,921 and $262,868,263, respectively.
At November 30, 2012, the cost of investments for federal income tax purposes was $429,227,452; accordingly, accumulated net unrealized appreciation on investments was $28,229,758, consisting of $56,640,393 gross unrealized appreciation and $28,410,635 gross unrealized depreciation.
42
REPORT OF INDEPENDENT REGISTERED
PUBLIC ACCOUNTING FIRM
Shareholders and Board of Directors
Dreyfus Select Managers Small Cap Value Fund
We have audited the accompanying statement of assets and liabilities, including the statement of investments, of Dreyfus Select Managers Small CapValue Fund (one of the series comprising Strategic Funds, Inc.) as of November 30, 2012, and the related statement of operations for the year then ended, the statement of changes in net assets for each of the two years in the period then ended, and the financial highlights for each of the periods indicated therein. These financial statements and financial highlights are the responsibility of the Fund’s management. Our responsibility is to express an opinion on these financial statements and financial highlights based on our audits.
We conducted our audits in accordance with the standards of the Public Company Accounting Oversight Board (United States).Those standards require that we plan and perform the audit to obtain reasonable assurance about whether the financial statements and financial highlights are free of material misstatement.We were not engaged to perform an audit of the Fund’s internal control over financial reporting. Our audits included consideration of internal control over financial reporting as a basis for designing audit procedures that are appropriate in the circumstances, but not for the purpose of expressing an opinion on the effectiveness of the Fund’s internal control over financial reporting. Accordingly, we express no such opinion.An audit also includes examining, on a test basis, evidence supporting the amounts and disclosures in the financial statements and financial highlights, assessing the accounting principles used and significant estimates made by management, and evaluating the overall financial statement presentation. Our procedures included confirmation of securities owned as of November 30, 2012 by correspondence with the custodian and others. We believe that our audits provide a reasonable basis for our opinion.
In our opinion, the financial statements and financial highlights referred to above present fairly, in all material respects, the financial position of Dreyfus Select Managers Small CapValue Fund at November 30, 2012, the results of its operations for the year then ended, the changes in its net assets for each of the two years in the period then ended, and the financial highlights for each of the indicated periods, in conformity with U.S. generally accepted accounting principles.

New York, New York
January 28, 2013
The Fund 43
IMPORTANT TAX INFORMATION (Unaudited)
For federal tax purposes the fund hereby reports 46.80% of the ordinary dividends paid during the fiscal year ended November 30, 2012 as qualifying for the corporate dividends received deduction.Also certain dividends paid by the fund may be subject to a maximum tax rate of 15%, as provided for by the Jobs and Growth Tax Relief Reconciliation Act of 2003. Of the distributions paid during the fiscal year, $3,140,185 represents the maximum amount that may be considered qualified dividend income. Shareholders will receive notification in early 2013 of the percentage applicable to the preparation of their 2012 income tax returns. Also, the fund hereby reports $.4478 per share as a short-term capital gain distribution paid and $1.1724 per share as a long-term capital gain distribution paid on December 30, 2011 and also reports $.0002 per share as a short-term capital gain distribution paid and $.0012 per share as a long-term capital gain distribution paid on March 28, 2012.
44
INFORMATION ABOUT THE RENEWAL OF THE FUND’S
MANAGEMENT, PORTFOLIO ALLOCATION MANAGEMENT
AND SUB-INVESTMENT ADVISORY AGREEMENTS (Unaudited)
At a meeting of the fund’s Board of Directors held on November 5-6, 2012, the Board considered the renewal of (a) the fund’s Management Agreement, pursuant to which Dreyfus provides the fund with investment advisory and administrative services; (b) Dreyfus’ Portfolio Allocation Management Agreement (the “Allocation Agreement”) with EACM Advisors, LLC (“EACM”), pursuant to which EACM is responsible for evaluating and recommending sub-advisers to provide the fund with day-to-day portfolio management services, recommending the percentage of fund assets to be allocated to each sub-adviser, monitoring and evaluating the performance of the sub-advisers, and recommending whether a sub-adviser should be terminated; and (c) Dreyfus’ separate Sub-Investment Advisory Agreements with each of Thomson, Siegel and Walmsley, LLC, Walthausen & Co., LLC, Neuberger Berman Management, LLC, Lombardia Capital Partners, LLC, and Iridian Asset Management, LLC (collectively, the “Sub-Advisers”), pursuant to which each Sub-Adviser serves as sub-investment adviser and provides day-today management of a percentage of the fund’s portfolio (collectively, the “Sub-Advisory Agreements”).The Board members, none of whom are “interested persons” (as defined in the Investment Company Act of 1940, as amended) of the fund, were assisted in their review by independent legal counsel and met with counsel in executive session separate from representatives of Dreyfus and EACM. In considering the renewal of the Agreements, the Board considered all factors that it believed to be relevant, including those discussed below.The Board did not identify any one factor as dispositive, and each Board member may have attributed different weights to the factors considered.
Analysis of Nature, Extent, and Quality of Services Provided to the Fund.The Board considered information previously provided to them in presentations from Dreyfus representatives regarding the nature, extent, and quality of the services provided to funds in the Dreyfus fund complex, and Dreyfus representatives confirmed that there had been no material changes in this information. Dreyfus provided the number of open accounts in the fund, the fund’s asset size and the allocation of fund assets among distribution channels. Dreyfus also had previously provided
The Fund 45
INFORMATION ABOUT THE RENEWAL OF THE FUND’S MANAGEMENT,
PORTFOLIO ALLOCATION MANAGEMENT AND SUB-INVESTMENT
ADVISORY AGREEMENTS (Unaudited) (continued)
information regarding the diverse intermediary relationships and distribution channels of funds in the Dreyfus fund complex (such as retail direct or intermediary, in which intermediaries typically are paid by the fund and/or Dreyfus) and Dreyfus’ corresponding need for broad, deep, and diverse resources to be able to provide ongoing shareholder services to each intermediary or distribution channel, as applicable to the fund.
The Board also considered research support available to, and portfolio management capabilities of, the fund’s portfolio management personnel and that Dreyfus also provides oversight of day-to-day fund operations, including fund accounting and administration and assistance in meeting legal and regulatory requirements.The Board also considered Dreyfus’ extensive administrative, accounting, and compliance infrastructures, Dreyfus’ supervisory activities over EACM and the Sub-Advisers, and EACM’s evaluations and recommendations to Dreyfus regarding the Sub-Advisers and EACM’s supervisory activities over the Sub-Advisers. The Board also considered the brokerage policies and practices (including policies and practices regarding soft dollars) of the respective Sub-Advisers and the respective standards applied in seeking best execution.
Comparative Analysis of the Fund’s Performance and Management Fee and Expense Ratio.The Board reviewed reports prepared by Lipper, Inc. (“Lipper”), an independent provider of investment company data, which included information comparing (1) the fund’s performance with the performance of a group of comparable funds (the “Performance Group”) and with a broader group of funds (the “Performance Universe”), all for various periods ended September 30, 2012, and (2) the fund’s actual and contractual management fees and total expenses with those of a group of comparable funds (the “Expense Group”) and with a broader group of funds (the “Expense Universe”), the information for which was derived in part from fund financial statements available to Lipper as of the date of its analysis. Dreyfus previously had furnished the Board with a description of the methodology Lipper used to select the Performance Group and Performance Universe and the Expense Group and Expense Universe.
46
Dreyfus representatives stated that the usefulness of performance comparisons may be affected by a number of factors, including different investment limitations that may be applicable to the fund and comparison funds.The Board discussed the results of the comparisons and noted that the fund’s total return performance was above the Performance Group median and the Performance Universe median for the reported time periods. Dreyfus also provided a comparison of the fund’s actual total return for its three calendar years of existence to the return of the fund’s benchmark index, and the Board noted the fund’s return was higher in each calendar year.
The Board also reviewed the range of actual and contractual management fees and total expenses of the Expense Group and Expense Universe funds and discussed the results of the comparisons.The Board noted that the fund’s contractual management fee was above the Expense Group median, the fund’s actual management fee was above the Expense Group median and the Expense Universe median, and the fund’s actual total expenses approximated the Expense Group median and were below the Expense Universe median.
Dreyfus representatives noted that Dreyfus has contractually agreed to waive receipt of its fees and/or assume the expenses of the fund, until April 1, 2013, so that annual direct fund operating expenses (excluding Rule 12b-1 Distribution Plan fees, Shareholder Services Plan fees, taxes, interest expense, brokerage commissions, commitment fees on borrowings and extraordinary expenses) do not exceed 1.15% of the fund’s average daily net assets.
Dreyfus representatives reviewed with the Board the management or investment advisory fees (1) paid by funds advised or administered by Dreyfus that are in the same Lipper category as the fund and (2) paid to Dreyfus, EACM, or one of the respective Sub-Advisers for advising any separate accounts and/or other types of client portfolios that are considered to have similar investment strategies and policies as the fund (the “Similar Clients”), and explained the nature of the Similar
The Fund 47
INFORMATION ABOUT THE RENEWAL OF THE FUND’S MANAGEMENT,
PORTFOLIO ALLOCATION MANAGEMENT AND SUB-INVESTMENT
ADVISORY AGREEMENTS (Unaudited) (continued)
Clients.They discussed differences in fees paid and the relationship of the fees paid in light of any differences in the services provided and other relevant factors.The Board considered the relevance of the fee information provided for the Similar Clients to evaluate the appropriateness and reasonableness of the fund’s management fee.
The Board considered the fee paid to EACM and to each Sub-Adviser in relation to the fee paid to Dreyfus by the fund and the respective services provided by the Sub-Adviser and Dreyfus. The Board also reviewed and considered the individual performance of the respective Sub-Advisers as to the portion of the fund’s assets under their man-agement.The Board also noted that EACM’s and each Sub-Adviser’s fee is paid by Dreyfus (out of its fee from the fund) and not the fund.
Analysis of Profitability and Economies of Scale. Dreyfus representatives reviewed the expenses allocated and profit received by Dreyfus and the resulting profitability percentage for managing the fund and the aggregate profitability percentage to Dreyfus of managing the funds in the Dreyfus fund complex, and the method used to determine the expenses and profit.The Board concluded that the profitability results were not unreasonable, given the services rendered and service levels provided by Dreyfus.The Board also noted the expense limitation arrangement and its effect on Dreyfus’ profitability.The Board also had been provided with information prepared by an independent consulting firm regarding Dreyfus’ approach to allocating costs to, and determining the profitability of, individual funds and the entire Dreyfus fund complex.The consulting firm also had analyzed where any economies of scale might emerge in connection with the management of a fund.
The Board’s counsel stated that the Board should consider the profitability analysis (1) as part of the evaluation of whether the fees under the Agreements bear a reasonable relationship to the mix of services provided by Dreyfus, EACM, and the Sub-Advisers, including the nature, extent and quality of such services, and (2) in light of the relevant circumstances for the fund and the extent to which economies of scale would be realized if the fund grows and whether fee levels reflect these economies of scale for the benefit of fund shareholders. Since Dreyfus, and not the fund,
48
pays EACM and each Sub-Adviser pursuant to respective Agreements, the Board did not consider EACM’s or any Sub-Adviser’s profitability to be relevant to its deliberations. Dreyfus representatives also noted that, as a result of shared and allocated costs among funds in the Dreyfus fund complex, the extent of economies of scale could depend substantially on the level of assets in the complex as a whole, so that increases and decreases in complex-wide assets can affect potential economies of scale in a manner that is disproportionate to, or even in the opposite direction from, changes in the fund’s asset level.The Board members also considered potential benefits to Dreyfus and each Sub-Adviser from acting as investment adviser and sub-investment adviser, respectively, and EACM from acting as portfolio allocation manager, and noted the soft dollar arrangements in effect for trading the fund’s investments.
At the conclusion of these discussions, the Board agreed that it had been furnished with sufficient information to make an informed business decision with respect to the renewal of the Agreements. Based on the discussions and considerations as described above, the Board concluded and determined as follows.
The Board concluded that the nature, extent and quality of the services provided by Dreyfus, EACM, and the Sub-Advisers are adequate and appropriate.
The Board was satisfied with the fund’s performance, in light of the considerations described above.
The Board concluded that the respective fees paid to Dreyfus, EACM, and the Sub-Advisers were reasonable in light of the con- siderations described above.
The Board determined that the economies of scale which may accrue to Dreyfus and its affiliates in connection with the management of the fund had been adequately considered by Dreyfus in connection with the fee rate charged to the fund pursuant to the Agreement and that, to the extent in the future it were determined that material economies of scale had not been shared with the fund, the Board would seek to have those economies of scale shared with the fund.
The Fund 49
INFORMATION ABOUT THE RENEWAL OF THE FUND’S MANAGEMENT,
PORTFOLIO ALLOCATION MANAGEMENT AND SUB-INVESTMENT
ADVISORY AGREEMENTS (Unaudited) (continued)
In evaluating the Agreements, the Board considered these conclusions and determinations and also relied on its previous knowledge, gained through meetings and other interactions with Dreyfus and its affiliates and the Sub-Adviser, of the fund and the services provided to the fund by Dreyfus and the Sub-Adviser.The Board also relied on information received on a routine and regular basis throughout the year relating to the operations of the fund and the investment management and other services provided under the Agreements, including information on the investment performance of the fund in comparison to similar mutual funds and benchmark performance indices; general market outlook as applicable to the fund; and compliance reports. In addition, it should be noted that the Board’s consideration of the contractual fee arrangements for this fund had the benefit of a number of years of reviews of prior or similar agreements during which lengthy discussions took place between the Board and Dreyfus representatives. Certain aspects of the arrangements may receive greater scrutiny in some years than in others, and the Board’s conclusions may be based, in part, on their consideration of the same or similar arrangements in prior years.The Board determined that renewal of the Agreements for the ensuing year was in the best interests of the fund and its shareholders.
APPROVAL OF AN ADDITONAL SUB-INVESTMENT ADVISER
At a meeting of the fund’s Board of Directors held on July 30, 2012, the Board considered the approval of a Sub-Investment Advisory Agreement with Kayne Anderson Rudnick Investment Management LLC (the “Sub-Adviser”), pursuant to which the Sub-Adviser would serve as an additional sub-investment adviser and provide day-to-day management of a percentage of the fund’s portfolio (the “Sub-Advisory Agreement”). The Board members, none of whom are “interested persons” (as defined in the Investment Company Act of 1940, as amended) of the fund, were assisted in their review by independent legal counsel and met with counsel in executive session separate from representatives of Dreyfus and EACM. In considering approval of the Sub-Advisory Agreement, the Board considered all factors that it believed to be relevant, including those discussed below.
50
Analysis of Nature, Extent, and Quality of Services to be Provided to the Fund.The Board considered information previously provided to them in a presentation from Dreyfus representatives regarding the nature, extent, and quality of the services provided to funds in the Dreyfus fund complex, and representatives of Dreyfus confirmed that there had been no material changes in this information. Dreyfus also had previously provided information regarding the diverse intermediary relationships and distribution channels of funds in the Dreyfus fund complex and Dreyfus’ corresponding need for broad, deep, and diverse resources to be able to provide ongoing shareholder services to each distribution channel, including the distribution channel(s) for the fund.
The Board considered the portfolio management and research capabilities of the Sub-Adviser, the Sub-Adviser’s portfolio brokerage policies and practices (including policies and practices regarding soft dollars) and the standards applied in seeking best execution, and that Dreyfus and EACM would supervise the Sub-Adviser’s activities with respect to the fund.
Comparative Analysis of Performance and Fees. Representatives of Dreyfus and EACM reviewed the investment strategies to be employed by the Sub-Adviser in managing its portion of the fund’s assets. The Board considered EACM’s presentation regarding the Sub-Adviser’s portfolio management and research resources and capabilities, experience in managing small cap equity funds, historical investment performance in the strategy to be employed for the fund, reputation and financial condition, brokerage and trading policies and practices, and internal compliance programs, as well as Dreyfus’ and EACM’s recommendation and supervision of, and relationship with, the Sub-Adviser.
Dreyfus representatives reviewed with the Board members the advisory fees paid to the Sub-Adviser for funds in the same Lipper category as the fund, or by separate accounts and/or other types of client portfolios managed by the Sub-Adviser considered to have similar investment strategies and policies as the fund (the “Similar Accounts”), and
The Fund 51
INFORMATION ABOUT THE RENEWAL OF THE FUND’S MANAGEMENT,
PORTFOLIO ALLOCATION MANAGEMENT AND SUB-INVESTMENT
ADVISORY AGREEMENTS (Unaudited) (continued)
explained the nature of the Similar Accounts. Dreyfus representatives noted that neither Dreyfus nor EACM advise any separate accounts and/or other types of client portfolios considered to have similar investment strategies and policies as the fund. They discussed differences in fees paid and the relationship of the fees paid in light of any differences in the services provided and other relevant factors
The Board considered the fee to the Sub-Adviser in relation to the fee paid to Dreyfus by the fund and the respective services to be provided by the Sub-Adviser and Dreyfus.The Board noted the Sub-Adviser’s fee would be paid by Dreyfus (out of its fee from the fund) and not the fund and would be at the same rate as that payable to the fund’s other sub-advisers. The Board also reviewed and considered the Sub-Adviser’s composite performance record.
Analysis of Profitability. Since Dreyfus, and not the fund, would pay the Sub-Adviser, the Board did not consider the Sub-Adviser’s profitability to be relevant to its deliberations.
At the conclusion of these discussions, the Board agreed that it had been furnished with sufficient information to make an informed business decision with respect to approval of the Sub-Advisory Agreement. Based on the discussions and considerations as described above, the Board concluded and determined as follows.
The Board concluded that the nature, extent, and quality of the ser- vices to be provided by the Sub-Adviser are adequate and appropri- ate, in light of the considerations described above.
The Board concluded that the fee to be paid to the Sub-Adviser is reasonable, in light of the considerations described above, and that consideration of total expense ratios, profitability, and economics of scale were not relevant to the determination.
The Board considered these conclusions and determinations and, without any one factor being dispositive, determined that approval of the Sub-Advisory Agreement was in the best interests of the fund and its shareholders.
52
BOARD MEMBERS INFORMATION (Unaudited)
|
| Joseph S. DiMartino (69) |
| Chairman of the Board (1995) |
| Principal Occupation During Past 5Years: |
| • Corporate Director and Trustee |
| Other Public Company Board Memberships During Past 5Years: |
| • CBIZ (formerly, Century Business Services, Inc.), a provider of outsourcing functions for small |
| and medium size companies, Director (1997-present) |
| • Sunair Services Corporation, a provider of certain outdoor-related services to homes and |
| businesses, Director (2005-2009) |
| • The Newark Group, a provider of a national market of paper recovery facilities, paperboard |
| mills and paperboard converting plants, Director (2000-2010) |
| No. of Portfolios for which Board Member Serves: 157 |
| ——————— |
| William Hodding Carter III (77) |
| Board Member (1988) |
| Principal Occupation During Past 5Years: |
| • Professor of Leadership & Public Policy, University of North Carolina, Chapel Hill (2006-present) |
| No. of Portfolios for which Board Member Serves: 27 |
| ——————— |
| Gordon J. Davis (71) |
| Board Member (2006) |
| Principal Occupation During Past 5Years: |
| • Partner in the law firm of Venable, LLP (2012-present) |
| • Partner in the law firm of Dewey & LeBoeuf, LLP (1994-2012) |
| Other Public Company Board Memberships During Past 5Years: |
| • Consolidated Edison, Inc., a utility company, Director (1997-present) |
| • The Phoenix Companies, Inc., a life insurance company, Director (2000-present) |
| No. of Portfolios for which Board Member Serves: 50 |
| ——————— |
| Joni Evans (70) |
| Board Member (2006) |
| Principal Occupation During Past 5Years: |
| • Chief Executive Officer, www.wowOwow.com an online community dedicated to women’s |
| conversations and publications (2007-present) |
| • Principal, Joni Evans Ltd. (publishing) (2006-present) |
| No. of Portfolios for which Board Member Serves: 27 |
The Fund 53
BOARD MEMBERS INFORMATION (Unaudited) (continued)
|
| Ehud Houminer (72) |
| Board Member (1994) |
| Principal Occupation During Past 5Years: |
| • Executive-in-Residence at the Columbia Business School, Columbia University (1992-present) |
| Other Public Company Board Memberships During Past 5Years: |
| • Avnet Inc., an electronics distributor, Director (1993-2012) |
| No. of Portfolios for which Board Member Serves: 73 |
| ——————— |
| Richard C. Leone (72) |
| Board Member (1984) |
| Principal Occupation During Past 5Years: |
| • Senior Fellow and former President of The Century Foundation (formerly,The Twentieth |
| Century Fund, Inc.), a tax exempt research foundation engaged in the study of economic, |
| foreign policy and domestic issues |
| Other Public Company Board Memberships During Past 5Years: |
| • Partnership for a Secure America, Director |
| No. of Portfolios for which Board Member Serves: 27 |
| ——————— |
| Hans C. Mautner (75) |
| Board Member (1984) |
| Principal Occupation During Past 5Years: |
| • President—International Division and an Advisory Director of Simon Property Group, a real |
| estate investment company (1998-2010) |
| • Chairman and Chief Executive Officer of Simon Global Limited (1999-2010) |
| No. of Portfolios for which Board Member Serves: 27 |
| ——————— |
| Robin A. Melvin (49) |
| Board Member (1995) |
| Principal Occupation During Past 5Years: |
| • Director, Boisi Family Foundation, a private family foundation that supports youth-serving orga- |
| nizations that promote the self sufficiency of youth from disadvantaged circumstances (1995-2012) |
| No. of Portfolios for which Board Member Serves: 100 |
54
|
| Burton N.Wallack (62) |
| Board Member (2006) |
| Principal Occupation During Past 5Years: |
| • President and Co-owner of Wallack Management Company, a real estate management company |
| No. of Portfolios for which Board Member Serves: 27 |
| ——————— |
| John E. Zuccotti (75) |
| Board Member (1984) |
| Principal Occupation During Past 5Years: |
| • Chairman of Brookfield Properties, Inc. |
| • Senior Counsel of Weil, Gotshal & Manges, LLP |
| • Emeritus Chairman of the Real Estate Board of New York |
| Other Public Company Board Memberships During Past 5Years: |
| • Emigrant Savings Bank, Director (2004-present) |
| • Doris Duke Charitable Foundation,Trustee (2006-present) |
| • New York Private Bank & Trust, Director |
| No. of Portfolios for which Board Member Serves: 27 |
| ——————— |
| Once elected all Board Members serve for an indefinite term, but achieve Emeritus status upon reaching age 80.The |
| address of the Board Members and Officers is c/o The Dreyfus Corporation, 200 Park Avenue, NewYork, NewYork |
| 10166.Additional information about the Board Members is available in the fund’s Statement of Additional Information |
| which can be obtained from Dreyfus free of charge by calling this toll free number: 1-800-DREYFUS. |
| David W. Burke, Emeritus Board Member |
| Arnold S. Hiatt, Emeritus Board Member |
The Fund 55
OFFICERS OF THE FUND (Unaudited)
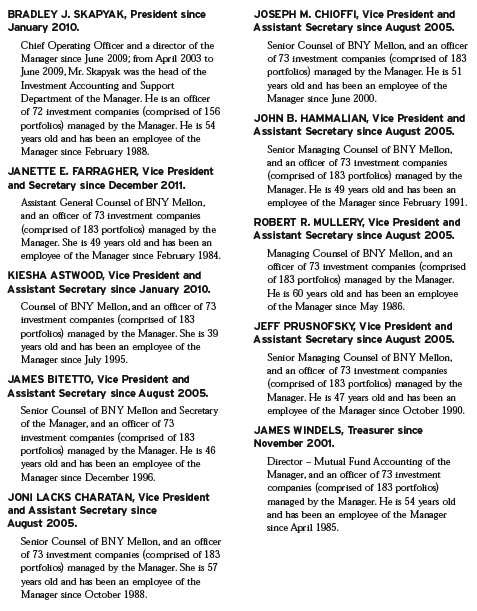
56
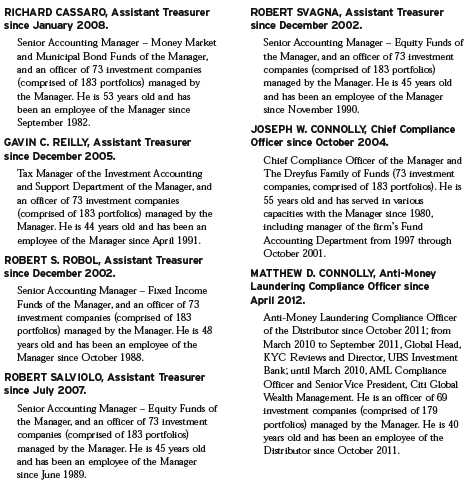
The Fund 57
Save time. Save paper. View your next shareholder report online as soon as it’s available. Log into www.dreyfus.com and sign up for Dreyfus eCommunications. It’s simple and only takes a few minutes.
The views expressed in this report reflect those of the portfolio manager only through the end of the period covered and do not necessarily represent the views of Dreyfus or any other person in the Dreyfus organization. Any such views are subject to change at any time based upon market or other conditions and Dreyfus disclaims any responsibility to update such views.These views may not be relied on as investment advice and, because investment decisions for a Dreyfus fund are based on numerous factors, may not be relied on as an indication of trading intent on behalf of any Dreyfus fund.

| | Contents |
| | THE FUND |
| 2 | A Letter from the President |
| 3 | Discussion of Fund Performance |
| 6 | Fund Performance |
| 8 | UnderstandingYour Fund’s Expenses |
| 8 | ComparingYour Fund’s Expenses With Those of Other Funds |
| 9 | Statement of Investments |
| 13 | Statement of Assets and Liabilities |
| 14 | Statement of Operations |
| 15 | Statement of Changes in Net Assets |
| 17 | Financial Highlights |
| 20 | Notes to Financial Statements |
| 30 | Report of Independent Registered Public Accounting Firm |
| 31 | Important Tax Information |
| 32 | Information About the Renewal of the Fund’s Management and Sub-Investment Advisory Agreements |
| 37 | Board Members Information |
| 40 | Officers of the Fund |
| | FOR MORE INFORMATION |
| | Back Cover |
Dreyfus
U.S. Equity Fund
The Fund
A LETTER FROM THE PRESIDENT
Dear Shareholder:
We are pleased to present this annual report for Dreyfus U.S. Equity Fund, covering the 12-month period from December 1, 2011, through November 30, 2012. For information about how the fund performed during the reporting period, as well as general market perspectives, we provide a Discussion of Fund Performance on the pages that follow.
Despite pronounced stock market weakness during the spring of 2012, equities generally advanced over the reporting period as investors responded to encouraging macroeconomic developments throughout the world. Employment gains in the United States, credible measures to prevent a more severe banking crisis in Europe, and the likelihood of a “soft landing” for China’s economy buoyed investor sentiment, as did aggressively accommodative monetary policies from central banks in the United States, Europe, Japan and China. Consequently, U.S. stocks across all capitalization ranges posted respectable returns, on average, for the reporting period.
In light of the easy monetary policies adopted by many countries, we expect global growth to be slightly more robust in 2013 than in 2012.The U.S. economic recovery is likely to persist at subpar levels, as growth early in the new year may remain constrained by uncertainties surrounding fiscal policy and tax reforms. However, resolution of these issues may prompt corporate decision-makers to increase capital spending later in the year, which could have positive implications for the U.S. economy and domestic equity markets.As always, we encourage you to stay in touch with your financial advisor as new developments unfold.
Thank you for your continued confidence and support.
Sincerely,

J. Charles Cardona
President
The Dreyfus Corporation
December 17, 2012
2
DISCUSSION OF FUND PERFORMANCE
For the period of December 1, 2011, through November 30, 2012, as provided by Charlie Macquaker and Roy Leckie of Walter Scott & Partners Limited (Walter Scott), Sub-investment adviser
Fund and Market Performance Overview
For the 12-month period ended November 30, 2012, Dreyfus U.S. Equity Fund’s Class A shares achieved a return of 8.80%, Class C shares returned 7.85% and Class I shares returned 9.23%.1 In comparison, the fund’s benchmark, the Morgan Stanley Capital International USA Index (“MSCI USA Index”), achieved a 15.36% return over the same period.2
Despite heightened volatility, U.S. stocks generally rallied over the reporting period as investors responded to aggressively accommodative monetary policies from the Federal Reserve Board (the “Fed”) and other central banks. The fund produced lower returns than its benchmark, primarily due to its lack of exposure to some of the market’s better performers.
The Fund’s Investment Approach
The fund seeks long-term real returns by investing in stocks of companies that are located in the United States.When selecting stocks,Walter Scott seeks companies with fundamental strengths that indicate the potential for sustainable growth. The firm focuses on individual stock selection through extensive fundamental research. Candidates are initially selected for research if they meet certain broad absolute and trend criteria. Financial statements are analyzed in an effort to identify the nature of their cash generation and to understand the variables that add value to their businesses. Companies meeting the financial criteria are subjected to a detailed investigation of their products, costs and pricing, competition, industry position and outlook.
Economic Optimism Lifted U.S. Equities
The reporting period began in the aftermath of pronounced stock market weakness, resulting in attractive valuations across a number of market sectors in December 2011. Indeed, by the first quarter of 2012, stocks generally were rallying amid stronger U.S. employment and manufacturing gains, as well as a quantitative easing
The Fund 3
DISCUSSION OF FUND PERFORMANCE (continued)
program in Europe that forestalled a more severe banking crisis in the region. Meanwhile, corporate earnings generally remained strong, and many companies had shored up their balance sheets. Investors grew more tolerant of risks, focusing more intently on business fundamentals and less on news headlines.
These positive influences were called into question during the spring, when the U.S. labor market’s rebound and measures designed to relieve fiscal pressures in Europe encountered political resistance. However, investor sentiment soon improved when several central banks announced measures to stimulate their economies. The Fed extended Operation Twist in June and embarked on a third round of quantitative easing in September. In July, the European Central Bank signaled its commitment to supporting the euro, which was followed by plans to buy distressed debt from the European Union’s more troubled members. U.S. stocks rallied over the summer, enabling the benchmark to end the reporting period with double-digit gains.
Defensive Posture Dampened Relative Performance
Our cautious investment approach generally beats market averages during market downturns, but lags during rallies.The reporting period proved to be no exception. This was particularly evident in the financials sector, an area we have avoided for some time due, in part, to ongoing deleveraging pressures. As a result, the fund did not participate in gains posted by major U.S. banks. In addition, the fund did not hold some of the reporting period’s top performers, such as electronics innovator Apple, Internet retailer Amazon.com and industrial conglomerate General Electric.
Several holdings also disappointed during the reporting period. Semiconductors giant Intel struggled to adjust its product mix amid an industry-wide transition from personal computers to mobile devices. Investors responded negatively to acquisitions made by thermal imaging specialist FLIR Systems. In the energy sector, demand from drillers for ceramic proppant from CARBO Ceramics was hurt by low natural gas prices, and Occidental Petroleum and Apache struggled when declining oil prices limited production growth.
The fund achieved better results in other areas. In the health care sector,Australia-based sleep apnea specialist maker ResMed benefited from a weak Australian dollar and robust demand for its devices.Among consumer discretionary companies, discount retailerThe
4
TJX Companies posted higher profits, sales and same-store comparisons, and clothing chain Urban Outfitters reported substantial sales and earnings growth in 2012 after weathering bouts of weakness in 2011. Information technology company Amphenol, Cl.A, gained market share amid the increasing popularity of mobile devices containing its connectors. Payment processing firm MasterCard, Cl. A, saw higher transaction volumes as more consumers used credit and debit cards instead of cash.
Macroeconomic Uncertainty Persists
We expect market volatility to persist over the near term as subpar global economic recoveries continue. Signs of early economic recovery in the U.S. are amongst the most encouraging but political uncertainties are likely to continue to fuel market volatility domestically.That said, the investment focus remains unchanged; a focus on high-quality companies that, in our analysis, have healthy balance sheets, profitable businesses, strong management teams, and favorable long-term growth prospects.
December 17, 2012
|
| Please note, the position in any security highlighted with italicized typeface was sold during the reporting period. |
| Equity funds are subject generally to market, market sector, market liquidity, issuer and investment style risks, among |
| other factors, to varying degrees, all of which are more fully described in the fund’s prospectus. |
| 1 Total return includes reinvestment of dividends and any capital gains paid, and does not take into consideration the |
| maximum initial sales charge in the case of Class A shares, or the applicable contingent deferred sales charge imposed |
| on redemptions in the case of Class C shares. Had these charges been reflected, returns would have been lower. Past |
| performance is no guarantee of future results. Share price and investment return fluctuate such that upon redemption, |
| fund shares may be worth more or less than their original cost. Return figures for the fund provided reflect the |
| absorption of certain fund expenses by The Dreyfus Corporation pursuant to an undertaking in effect through April |
| 1, 2013, at which time it may be extended, terminated or modified. Had these expenses not been absorbed, the |
| fund’s returns would have been lower. |
| 2 SOURCE: LIPPER INC. – Reflects reinvestment of net dividends and, where applicable, capital gain distributions. |
| The Morgan Stanley Capital International USA (MSCI USA) Index is an unmanaged, market capitalization |
| weighted index that is designed to measure the performance of publicly traded stocks issued by companies in the |
| United States. Investors cannot invest directly in any index. |
The Fund 5
FUND PERFORMANCE
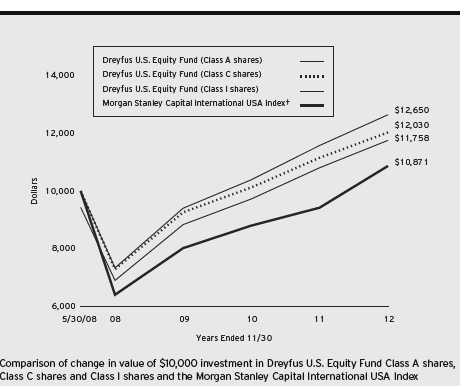
† Source: Lipper Inc.
Past performance is not predictive of future performance.
The above graph compares a $10,000 investment made in each of the Class A, Class C and Class I shares of Dreyfus U.S. Equity Fund on 5/30/08 (inception date) to a $10,000 investment made in the Morgan Stanley Capital International USA Index (the “Index”) on that date.All dividends and capital gain distributions are reinvested.
The fund’s performance shown in the line graph above takes into account the maximum initial sales charge on Class A shares and all other applicable fees and expenses on all classes.The Index is an unmanaged, market capitalization-weighted index that is designed to measure the performance of publicly traded stocks issued by companies in the United States. Unlike a mutual fund, the Index is not subject to charges, fees and other expenses. Investors cannot invest directly in any index. Further information relating to fund performance, including expense reimbursements, if applicable, is contained in the Financial Highlights section of the prospectus and elsewhere in this report.
6
| | | | | |
| Average Annual Total Returns as of 11/30/12 | | | | |
| |
| | Inception | | | From | |
| | Date | 1 | Year | Inception | |
| Class A shares | | | | | |
| with maximum sales charge (5.75%) | 5/30/08 | 2.52 | % | 3.66 | % |
| without sales charge | 5/30/08 | 8.80 | % | 5.03 | % |
| Class C shares | | | | | |
| with applicable redemption charge† | 5/30/08 | 6.85 | % | 4.19 | % |
| without redemption | 5/30/08 | 7.85 | % | 4.19 | % |
| Class I shares | 5/30/08 | 9.23 | % | 5.36 | % |
| Morgan Stanley Capital | | | | | |
| International USA Index | 5/31/08 | 15.36 | % | 1.87 | % |
Past performance is not predictive of future performance.The fund’s performance shown in the graph and table does not reflect the deduction of taxes that a shareholder would pay on fund distributions or the redemption of fund shares.
|
| † The maximum contingent deferred sales charge for Class C shares is 1% for shares redeemed within one year of the |
| date of purchase. |
The Fund 7
UNDERSTANDING YOUR FUND’S EXPENSES (Unaudited)
As a mutual fund investor, you pay ongoing expenses, such as management fees and other expenses. Using the information below, you can estimate how these expenses affect your investment and compare them with the expenses of other funds.You also may pay one-time transaction expenses, including sales charges (loads) and redemption fees, which are not shown in this section and would have resulted in higher total expenses. For more information, see your fund’s prospectus or talk to your financial adviser.
Review your fund’s expenses
The table below shows the expenses you would have paid on a $1,000 investment in Dreyfus U.S. Equity Fund from June 1, 2012 to November 30, 2012. It also shows how much a $1,000 investment would be worth at the close of the period, assuming actual returns and expenses.
Expenses and Value of a $1,000 Investment
assuming actual returns for the six months ended November 30, 2012
| | | | | | |
| | | Class A | | Class C | | Class I |
| Expenses paid per $1,000† | $ | 6.11 | $ | 10.64 | $ | 4.15 |
| Ending value (after expenses) | $ | 1,071.40 | $ | 1,066.20 | $ | 1,073.40 |
COMPARING YOUR FUND’S EXPENSES
WITH THOSE OF OTHER FUNDS (Unaudited)
Using the SEC’s method to compare expenses
The Securities and Exchange Commission (SEC) has established guidelines to help investors assess fund expenses. Per these guidelines, the table below shows your fund’s expenses based on a $1,000 investment, assuming a hypothetical 5% annualized return. You can use this information to compare the ongoing expenses (but not transaction expenses or total cost) of investing in the fund with those of other funds.All mutual fund shareholder reports will provide this information to help you make this comparison. Please note that you cannot use this information to estimate your actual ending account balance and expenses paid during the period.
Expenses and Value of a $1,000 Investment
assuming a hypothetical 5% annualized return for the six months ended November 30, 2012
| | | | | | |
| | | Class A | | Class C | | Class I |
| Expenses paid per $1,000† | $ | 5.96 | $ | 10.38 | $ | 4.04 |
| Ending value (after expenses) | $ | 1,019.10 | $ | 1,014.70 | $ | 1,021.00 |
|
| † Expenses are equal to the fund’s annualized expense ratio of 1.18% for Class A, 2.06% for Class C and .80% |
| for Class I, multiplied by the average account value over the period, multiplied by 183/366 (to reflect the one-half |
| year period). |
8
STATEMENT OF INVESTMENTS
November 30, 2012
| | | | |
| Common Stocks—97.2% | Shares | | | Value ($) |
| Capital Goods—16.5% | | | | |
| Boeing | 152,900 | | | 11,357,412 |
| Donaldson | 293,900 | | | 9,869,162 |
| Emerson Electric | 217,200 | | | 10,909,956 |
| Fastenal | 244,100 | | | 10,205,821 |
| Flowserve | 93,200 | | | 12,912,860 |
| MSC Industrial Direct, Cl. A | 139,800 | | | 10,157,868 |
| Precision Castparts | 62,060 | | | 11,381,183 |
| Rockwell Collins | 203,800 | a | | 11,653,284 |
| | | | | 88,447,546 |
| Consumer Durables & Apparel—3.7% | | | | |
| Coach | 172,500 | | | 9,977,400 |
| NIKE, Cl. B | 104,300 | | | 10,167,164 |
| | | | | 20,144,564 |
| Consumer Services—5.6% | | | | |
| McDonald’s | 128,900 | | | 11,219,456 |
| Panera Bread, Cl. A | 54,700 | b | | 8,779,350 |
| Starbucks | 194,400 | | | 10,083,528 |
| | | | | 30,082,334 |
| Energy—9.8% | | | | |
| Apache | 113,300 | | | 8,734,297 |
| CARBO Ceramics | 161,700 | a | | 12,381,369 |
| EOG Resources | 101,460 | | | 11,933,725 |
| Occidental Petroleum | 121,100 | | | 9,107,931 |
| Schlumberger | 149,450 | | | 10,703,609 |
| | | | | 52,860,931 |
| Food & Staples Retailing—2.3% | | | | |
| Wal-Mart Stores | 173,000 | | | 12,459,460 |
| Food, Beverage & Tobacco—1.9% | | | | |
| Coca-Cola | 269,400 | | | 10,215,648 |
The Fund 9
STATEMENT OF INVESTMENTS (continued)
| | | |
| Common Stocks (continued) | Shares | | Value ($) |
| Health Care Equipment & Services—9.9% | | | |
| C.R. Bard | 51,650 | | 5,113,867 |
| Meridian Bioscience | 566,900 | a | 11,355,007 |
| ResMed | 356,800 | a | 14,660,912 |
| Stryker | 185,600 | | 10,052,096 |
| Varian Medical Systems | 174,400 | b | 12,061,504 |
| | | | 53,243,386 |
| Household & Personal Products—2.1% | | | |
| Colgate-Palmolive | 101,900 | | 11,056,150 |
| Materials—6.2% | | | |
| Monsanto | 139,100 | | 12,740,169 |
| Praxair | 95,100 | | 10,195,671 |
| Sigma-Aldrich | 139,900 | | 10,145,548 |
| | | | 33,081,388 |
| Pharmaceuticals, Biotech & | | | |
| Life Sciences—3.9% | | | |
| Celgene | 139,400 | b | 10,955,446 |
| Johnson & Johnson | 146,700 | | 10,229,391 |
| | | | 21,184,837 |
| Retailing—9.2% | | | |
| Family Dollar Stores | 176,900 | a | 12,595,280 |
| The TJX Companies | 315,300 | | 13,980,402 |
| Tractor Supply | 104,400 | | 9,356,328 |
| Urban Outfitters | 354,200 | b | 13,353,340 |
| | | | 49,285,350 |
| Semiconductors & | | | |
| Semiconductor Equipment—2.0% | | | |
| Intel | 555,000 | | 10,861,350 |
10
| | | |
| Common Stocks (continued) | Shares | | Value ($) |
| Software & Services—14.5% | | | |
| Adobe Systems | 291,300 | b | 10,081,893 |
| Automatic Data Processing | 175,800 | | 9,978,408 |
| Google, Cl. A | 16,960 | b | 11,844,355 |
| MasterCard, Cl. A | 28,370 | | 13,863,852 |
| Microsoft | 388,100 | | 10,331,222 |
| Oracle | 351,100 | | 11,270,310 |
| Paychex | 326,000 | | 10,608,040 |
| | | | 77,978,080 |
| Technology Hardware & | | | |
| Equipment—5.6% | | | |
| Amphenol, Cl. A | 123,300 | | 7,634,736 |
| Cisco Systems | 592,700 | | 11,207,957 |
| QUALCOMM | 174,100 | | 11,076,242 |
| | | | 29,918,935 |
| Transportation—4.0% | | | |
| C.H. Robinson Worldwide | 185,600 | | 11,458,944 |
| Expeditors International of Washington | 268,400 | | 10,043,528 |
| | | | 21,502,472 |
| Total Common Stocks | | | |
| (cost $451,956,371) | | | 522,322,431 |
| |
| Other Investment—3.5% | | | |
| Registered | | | |
| Investment Company; | | | |
| Dreyfus Institutional Preferred | | | |
| Plus Money Market Fund | | | |
| (cost $18,726,000) | 18,726,000 | c | 18,726,000 |
The Fund 11
STATEMENT OF INVESTMENTS (continued)
| | | | |
| Investment of Cash Collateral | | | | |
| for Securities Loaned—.8% | Shares | | Value ($) | |
| Registered Investment Company; | | | | |
| Dreyfus Institutional Cash Advantage Fund | | | | |
| (cost $4,361,023) | 4,361,023 | c | 4,361,023 | |
| Total Investments (cost $475,043,394) | 101.5 | % | 545,409,454 | |
| Liabilities, Less Cash and Receivables | (1.5 | %) | (8,303,138 | ) |
| Net Assets | 100.0 | % | 537,106,316 | |
|
| a Security, or portion thereof, on loan.At November 30, 2012, the value of the fund’s securities on loan was |
| $12,504,917 and the value of the collateral held by the fund was $12,736,137, consisting of cash collateral of |
| $4,361,023 and U.S. Government and Agency securities valued at $8,375,114. |
| b Non-income producing security. |
| c Investment in affiliated money market mutual fund. |
| | | |
| Portfolio Summary (Unaudited)† | | |
| |
| | Value (%) | | Value (%) |
| Capital Goods | 16.5 | Pharmaceuticals, | |
| Software & Services | 14.5 | Biotech & Life Sciences | 3.9 |
| Health Care Equipment & Services | 9.9 | Consumer Durables & Apparel | 3.7 |
| Energy | 9.8 | Food & Staples Retailing | 2.3 |
| Retailing | 9.2 | Household & Personal Products | 2.1 |
| Materials | 6.2 | Semiconductors & | |
| Consumer Services | 5.6 | Semiconductor Equipment | 2.0 |
| Technology Hardware & Equipment | 5.6 | Food, Beverage & Tobacco | 1.9 |
| Money Market Investments | 4.3 | | |
| Transportation | 4.0 | | 101.5 |
| |
| † Based on net assets. | | | |
| See notes to financial statements. | | | |
12
STATEMENT OF ASSETS AND LIABILITIES
November 30, 2012
| | | | |
| | | Cost | Value | |
| Assets ($): | | | | |
| Investments in securities—See Statement of Investments (including | | | |
| securities on loan, valued at $12,504,917)—Note 1(b): | | | |
| Unaffiliated issuers | | 451,956,371 | 522,322,431 | |
| Affiliated issuers | | 23,087,023 | 23,087,023 | |
| Cash | | | 229,126 | |
| Dividends and securities lending income receivable | | | 1,038,568 | |
| Receivable for shares of Common Stock subscribed | | | 75,000 | |
| Prepaid expenses | | | 19,899 | |
| | | | 546,772,047 | |
| Liabilities ($): | | | | |
| Due to The Dreyfus Corporation and affiliates—Note 3(c) | | 338,887 | |
| Payable for investment securities purchased | | | 4,739,040 | |
| Liability for securities on loan—Note 1(b) | | | 4,361,023 | |
| Payable for shares of Common Stock redeemed | | | 142,850 | |
| Accrued expenses | | | 83,931 | |
| | | | 9,665,731 | |
| Net Assets ($) | | | 537,106,316 | |
| Composition of Net Assets ($): | | | | |
| Paid-in capital | | | 465,701,468 | |
| Accumulated undistributed investment income—net | | | 4,443,355 | |
| Accumulated net realized gain (loss) on investments | | | (3,404,567 | ) |
| Accumulated net unrealized appreciation | | | | |
| (depreciation) on investments | | | 70,366,060 | |
| Net Assets ($) | | | 537,106,316 | |
| |
| |
| Net Asset Value Per Share | | | | |
| | Class A | Class C | Class I | |
| Net Assets ($) | 1,809,805 | 277,522 | 535,018,989 | |
| Shares Outstanding | 117,165 | 18,543 | 34,491,720 | |
| Net Asset Value Per Share ($) | 15.45 | 14.97 | 15.51 | |
| |
| See notes to financial statements. | | | | |
The Fund 13
STATEMENT OF OPERATIONS
Year Ended November 30, 2012
| | |
| Investment Income ($): | | |
| Income: | | |
| Cash dividends: | | |
| Unaffiliated issuers | 7,509,171 | |
| Affiliated issuers | 16,082 | |
| Income from securities lending—Note 1(b) | 874,551 | |
| Total Income | 8,399,804 | |
| Expenses: | | |
| Management fee—Note 3(a) | 3,587,124 | |
| Professional fees | 66,015 | |
| Registration fees | 58,374 | |
| Directors’ fees and expenses—Note 3(d) | 54,262 | |
| Custodian fees—Note 3(c) | 40,658 | |
| Prospectus and shareholders’ reports | 12,172 | |
| Shareholder servicing costs—Note 3(c) | 9,929 | |
| Loan commitment fees—Note 2 | 3,869 | |
| Distribution fees—Note 3(b) | 2,145 | |
| Miscellaneous | 18,131 | |
| Total Expenses | 3,852,679 | |
| Less—reduction in fees due to earnings credits—Note 3(c) | (15 | ) |
| Net Expenses | 3,852,664 | |
| Investment Income—Net | 4,547,140 | |
| Realized and Unrealized Gain (Loss) on Investments—Note 4 ($): | | |
| Net realized gain (loss) on investments | (733,670 | ) |
| Net unrealized appreciation (depreciation) on investments | 36,376,747 | |
| Net Realized and Unrealized Gain (Loss) on Investments | 35,643,077 | |
| Net Increase in Net Assets Resulting from Operations | 40,190,217 | |
| |
| See notes to financial statements. | | |
14
STATEMENT OF CHANGES IN NET ASSETS
| | | | |
| | Year Ended November 30, | |
| | 2012 | | 2011 | |
| Operations ($): | | | | |
| Investment income—net | 4,547,140 | | 1,851,998 | |
| Net realized gain (loss) on investments | (733,670 | ) | (2,670,897 | ) |
| Net unrealized appreciation | | | | |
| (depreciation) on investments | 36,376,747 | | 25,300,645 | |
| Net Increase (Decrease) in Net Assets | | | | |
| Resulting from Operations | 40,190,217 | | 24,481,746 | |
| Dividends to Shareholders from ($): | | | | |
| Investment income—net: | | | | |
| Class I Shares | (1,914,449 | ) | (274,865 | ) |
| Net realized gain on investments: | | | | |
| Class A Shares | — | | (11,303 | ) |
| Class C Shares | — | | (1,516 | ) |
| Class I Shares | — | | (752,726 | ) |
| Total Dividends | (1,914,449 | ) | (1,040,410 | ) |
| Capital Stock Transactions ($): | | | | |
| Net proceeds from shares sold: | | | | |
| Class A Shares | 1,520,589 | | 460,558 | |
| Class C Shares | 119,955 | | 150,798 | |
| Class I Shares | 200,047,673 | | 249,266,465 | |
| Dividends reinvested: | | | | |
| Class A Shares | — | | 1,717 | |
| Class C Shares | — | | 322 | |
| Class I Shares | 606,842 | | 668,490 | |
| Cost of shares redeemed: | | | | |
| Class A Shares | (782,606 | ) | (2,101,246 | ) |
| Class C Shares | (75,248 | ) | (281,394 | ) |
| Class I Shares | (80,298,753 | ) | (41,422,323 | ) |
| Increase (Decrease) in Net Assets | | | | |
| from Capital Stock Transactions | 121,138,452 | | 206,743,387 | |
| Total Increase (Decrease) in Net Assets | 159,414,220 | | 230,184,723 | |
| Net Assets ($): | | | | |
| Beginning of Period | 377,692,096 | | 147,507,373 | |
| End of Period | 537,106,316 | | 377,692,096 | |
| Undistributed investment income—net | 4,443,355 | | 1,810,664 | |
The Fund 15
STATEMENT OF CHANGES IN NET ASSETS (continued)
| | | | |
| | Year Ended November 30, | |
| | 2012 | | 2011 | |
| Capital Share Transactions: | | | | |
| Class A | | | | |
| Shares sold | 101,027 | | 33,007 | |
| Shares issued for dividends reinvested | — | | 127 | |
| Shares redeemed | (53,436 | ) | (152,404 | ) |
| Net Increase (Decrease) in Shares Outstanding | 47,591 | | (119,270 | ) |
| Class C | | | | |
| Shares sold | 8,430 | | 11,125 | |
| Shares issued for dividends reinvested | — | | 24 | |
| Shares redeemed | (5,290 | ) | (20,449 | ) |
| Net Increase (Decrease) in Shares Outstanding | 3,140 | | (9,300 | ) |
| Class I | | | | |
| Shares sold | 13,460,380 | | 18,119,105 | |
| Shares issued for dividends reinvested | 42,645 | | 49,481 | |
| Shares redeemed | (5,385,690 | ) | (3,038,221 | ) |
| Net Increase (Decrease) in Shares Outstanding | 8,117,335 | | 15,130,365 | |
| |
| See notes to financial statements. | | | | |
16
FINANCIAL HIGHLIGHTS
The following tables describe the performance for each share class for the fiscal periods indicated.All information (except portfolio turnover rate) reflects financial results for a single fund share.Total return shows how much your investment in the fund would have increased (or decreased) during each period, assuming you had reinvested all dividends and distributions.These figures have been derived from the fund’s financial statements.
| | | | | | | | | |
| | | Year Ended November 30, | | | |
| Class A Shares | 2012 | 2011 | | 2010 | | 2009 | | 2008 | a |
| Per Share Data ($): | | | | | | | | | |
| Net asset value, beginning of period | 14.20 | 12.83 | | 11.68 | | 9.14 | | 12.50 | |
| Investment Operations: | | | | | | | | | |
| Investment income—netb | .08 | .04 | | .01 | | .04 | | .02 | |
| Net realized and unrealized | | | | | | | | | |
| gain (loss) on investments | 1.17 | 1.39 | | 1.16 | | 2.53 | | (3.38 | ) |
| Total from Investment Operations | 1.25 | 1.43 | | 1.17 | | 2.57 | | (3.36 | ) |
| Distributions: | | | | | | | | | |
| Dividends from investment income—net | — | — | | (.02 | ) | (.03 | ) | — | |
| Dividends from net realized | | | | | | | | | |
| gain on investments | — | (.06 | ) | — | | — | | — | |
| Total Distributions | — | (.06 | ) | (.02 | ) | (.03 | ) | — | |
| Net asset value, end of period | 15.45 | 14.20 | | 12.83 | | 11.68 | | 9.14 | |
| Total Return (%)c | 8.80 | 11.17 | | 10.01 | | 28.19 | | (26.88 | )d |
| Ratios/Supplemental Data (%): | | | | | | | | | |
| Ratio of total expenses | | | | | | | | | |
| to average net assets | 1.22 | 1.15 | | 1.76 | | 4.65 | | 5.54 | e |
| Ratio of net expenses | | | | | | | | | |
| to average net assets | 1.22 | 1.15 | | 1.40 | | 1.40 | | 1.40 | e |
| Ratio of net investment income | | | | | | | | | |
| to average net assets | .57 | .29 | | .04 | | .42 | | .33 | e |
| Portfolio Turnover Rate | 5.73 | 10.61 | | 13.62 | | 31.79 | | 7.98 | d |
| Net Assets, end of period ($ x 1,000) | 1,810 | 988 | | 2,424 | | 3,884 | | 2,618 | |
| |
| a | From May 30, 2008 (commencement of operations) to November 30, 2008. |
| b | Based on average shares outstanding at each month end. |
| c | Exclusive of sales charge. |
| d | Not annualized. |
| e | Annualized. |
See notes to financial statements.
The Fund 17
FINANCIAL HIGHLIGHTS (continued)
| | | | | | | | | | |
| | | | Year Ended November 30, | | | |
| Class C Shares | 2012 | | 2011 | | 2010 | | 2009 | | 2008 | a |
| Per Share Data ($): | | | | | | | | | | |
| Net asset value, beginning of period | 13.88 | | 12.65 | | 11.58 | | 9.11 | | 12.50 | |
| Investment Operations: | | | | | | | | | | |
| Investment (loss)—netb | (.05 | ) | (.06 | ) | (.09 | ) | (.03 | ) | (.02 | ) |
| Net realized and unrealized | | | | | | | | | | |
| gain (loss) on investments | 1.14 | | 1.35 | | 1.16 | | 2.50 | | (3.37 | ) |
| Total from Investment Operations | 1.09 | | 1.29 | | 1.07 | | 2.47 | | (3.39 | ) |
| Distributions: | | | | | | | | | | |
| Dividends from net realized | | | | | | | | | | |
| gain on investments | — | | (.06 | ) | — | | — | | — | |
| Net asset value, end of period | 14.97 | | 13.88 | | 12.65 | | 11.58 | | 9.11 | |
| Total Return (%)c | 7.85 | | 10.22 | | 9.24 | | 27.11 | | (27.12 | )d |
| Ratios/Supplemental Data (%): | | | | | | | | | | |
| Ratio of total expenses | | | | | | | | | | |
| to average net assets | 2.08 | | 1.94 | | 2.52 | | 5.83 | | 6.30 | e |
| Ratio of net expenses | | | | | | | | | | |
| to average net assets | 2.08 | | 1.94 | | 2.15 | | 2.15 | | 2.14 | e |
| Ratio of net investment (loss) | | | | | | | | | | |
| to average net assets | (.33 | ) | (.47 | ) | (.71 | ) | (.27 | ) | (.41 | )e |
| Portfolio Turnover Rate | 5.73 | | 10.61 | | 13.62 | | 31.79 | | 7.98 | d |
| Net Assets, end of period ($ x 1,000) | 278 | | 214 | | 312 | | 497 | | 374 | |
| |
| a | From May 30, 2008 (commencement of operations) to November 30, 2008. |
| b | Based on average shares outstanding at each month end. |
| c | Exclusive of sales charge. |
| d | Not annualized. |
| e | Annualized. |
See notes to financial statements.
18
| | | | | | | | | | |
| | | | Year Ended November 30, | | | |
| Class I Shares | 2012 | | 2011 | | 2010 | | 2009 | | 2008 | a |
| Per Share Data ($): | | | | | | | | | | |
| Net asset value, beginning of period | 14.27 | | 12.88 | | 11.70 | | 9.16 | | 12.50 | |
| Investment Operations: | | | | | | | | | | |
| Investment income—netb | .14 | | .09 | | .07 | | .05 | | .03 | |
| Net realized and unrealized | | | | | | | | | | |
| gain (loss) on investments | 1.17 | | 1.38 | | 1.15 | | 2.54 | | (3.37 | ) |
| Total from Investment Operations | 1.31 | | 1.47 | | 1.22 | | 2.59 | | (3.34 | ) |
| Distributions: | | | | | | | | | | |
| Dividends from investment income—net | (.07 | ) | (.02 | ) | (.04 | ) | (.05 | ) | — | |
| Dividends from net realized | | | | | | | | | | |
| gain on investments | — | | (.06 | ) | — | | — | | — | |
| Total Distributions | (.07 | ) | (.08 | ) | (.04 | ) | (.05 | ) | — | |
| Net asset value, end of period | 15.51 | | 14.27 | | 12.88 | | 11.70 | | 9.16 | |
| Total Return (%) | 9.23 | | 11.46 | | 10.47 | | 28.36 | | (26.72 | )c |
| Ratios/Supplemental Data (%): | | | | | | | | | | |
| Ratio of total expenses | | | | | | | | | | |
| to average net assets | .80 | | .82 | | .94 | | 3.77 | | 5.25 | d |
| Ratio of net expenses | | | | | | | | | | |
| to average net assets | .80 | | .82 | | .94 | | 1.15 | | 1.14 | d |
| Ratio of net investment income | | | | | | | | | | |
| to average net assets | .95 | | .67 | | .56 | | .54 | | .59 | d |
| Portfolio Turnover Rate | 5.73 | | 10.61 | | 13.62 | | 31.79 | | 7.98 | c |
| Net Assets, end of period ($ x 1,000) | 535,019 | | 376,490 | | 144,771 | | 1,870 | | 366 | |
| |
| a | From May 30, 2008 (commencement of operations) to November 30, 2008. |
| b | Based on average shares outstanding at each month end. |
| c | Not annualized. |
| d | Annualized. |
See notes to financial statements.
The Fund 19
NOTES TO FINANCIAL STATEMENTS
NOTE 1—Significant Accounting Policies:
Dreyfus U.S. Equity Fund (the “fund”) is a separate diversified series of Strategic Funds, Inc. (the “Company”) which is registered under the Investment Company Act of 1940, as amended (the “Act”), as an open-end management investment company and operates as a series company currently offering nine series, including the fund.The fund’s investment objective is to seek long-term total return. The Dreyfus Corporation (the “Manager” or “Dreyfus”), a wholly-owned subsidiary of The Bank of New York Mellon Corporation (“BNY Mellon”), serves as the fund’s investment adviser. Walter Scott & Partners Limited (“Walter Scott”), a subsidiary of BNY Mellon and an affiliate of Dreyfus, serves as the fund’s sub-investment adviser.
MBSC Securities Corporation (the “Distributor”), a wholly-owned subsidiary of Dreyfus, is the Distributor of the fund’s shares.The fund is authorized to issue 100 million shares of $.001 par value Common Stock in each of the following classes of shares: Class A, Class C and Class I. Class A shares are subject to a sales charge imposed at the time of purchase. Class C shares are subject to a contingent deferred sales charge (“CDSC”) on Class C shares redeemed within one year of purchase. Class I shares are sold at net asset value per share only to institutional investors. Other differences between the classes include the services offered to and the expenses borne by each class, the allocation of certain transfer agency costs and certain voting rights. Income, expenses (other than expenses attributable to a specific class), and realized and unrealized gains or losses on investments are allocated to each class of shares based on its relative net assets.
The Company accounts separately for the assets, liabilities and operations of each series. Expenses directly attributable to each series are charged to that series’ operations; expenses which are applicable to all series are allocated among them on a pro rata basis.
The Financial Accounting Standards Board (“FASB”) Accounting Standards Codification is the exclusive reference of authoritative U.S. generally accepted accounting principles (“GAAP”) recognized by the FASB to be applied by nongovernmental entities. Rules and interpretive
20
releases of the Securities and Exchange Commission (“SEC”) under authority of federal laws are also sources of authoritative GAAP for SEC registrants. The fund’s financial statements are prepared in accordance with GAAP, which may require the use of management estimates and assumptions.Actual results could differ from those estimates.
The Company enters into contracts that contain a variety of indemnifications.The fund’s maximum exposure under these arrangements is unknown.The fund does not anticipate recognizing any loss related to these arrangements.
(a) Portfolio valuation: The fair value of a financial instrument is the amount that would be received to sell an asset or paid to transfer a liability in an orderly transaction between market participants at the measurement date (i.e., the exit price). GAAP establishes a fair value hierarchy that prioritizes the inputs of valuation techniques used to measure fair value.This hierarchy gives the highest priority to unadjusted quoted prices in active markets for identical assets or liabilities (Level 1 measurements) and the lowest priority to unobservable inputs (Level 3 measurements).
Additionally, GAAP provides guidance on determining whether the volume and activity in a market has decreased significantly and whether such a decrease in activity results in transactions that are not orderly. GAAP requires enhanced disclosures around valuation inputs and techniques used during annual and interim periods.
Various inputs are used in determining the value of the fund’s investments relating to fair value measurements.These inputs are summarized in the three broad levels listed below:
Level 1—unadjusted quoted prices in active markets for identical investments.
Level 2—other significant observable inputs (including quoted prices for similar investments, interest rates, prepayment speeds, credit risk, etc.).
Level 3—significant unobservable inputs (including the fund’s own assumptions in determining the fair value of investments).
The Fund 21
NOTES TO FINANCIAL STATEMENTS (continued)
The inputs or methodology used for valuing securities are not necessarily an indication of the risk associated with investing in those securities.
Changes in valuation techniques may result in transfers in or out of an assigned level within the disclosure hierarchy. Valuation techniques used to value the fund’s investments are as follows:
Investments in securities are valued at the last sales price on the securities exchange or national securities market on which such securities are primarily traded. Securities listed on the National Market System for which market quotations are available are valued at the official closing price or, if there is no official closing price that day, at the last sales price. Securities not listed on an exchange or the national securities market, or securities for which there were no transactions, are valued at the average of the most recent bid and asked prices, except for open short positions, where the asked price is used for valuation purposes. Bid price is used when no asked price is available. Registered investment companies that are not traded on an exchange are valued at their net asset value. All of the preceding securities are categorized within Level 1 of the fair value hierarchy.
Fair valuing of securities may be determined with the assistance of a pricing service using calculations based on indices of domestic securities and other appropriate indicators, such as prices of relevant American Depository Receipts and financial futures. Utilizing these techniques may result in transfers between Level 1 and Level 2 of the fair value hierarchy.
When market quotations or official closing prices are not readily available, or are determined not to reflect accurately fair value, such as when the value of a security has been significantly affected by events after the close of the exchange or market on which the security is principally traded (for example, a foreign exchange or market), but before the fund calculates its net asset value, the fund may value these investments at fair value as determined in accordance with the procedures approved by the Company’s Board of Directors (the “Board”). Certain factors may be considered when fair valuing investments such as: fundamental analytical
22
data, the nature and duration of restrictions on disposition, an evaluation of the forces that influence the market in which the securities are purchased and sold, and public trading in similar securities of the issuer or comparable issuers. These securities are either categorized within Level 2 or 3 depending on the relevant inputs used.
For restricted securities where observable inputs are limited, assumptions about market activity and risk are used and are categorized within Level 3 of the fair value hierarchy.
The following is a summary of the inputs used as of November 30, 2012 in valuing the fund’s investments:
| | | | |
| | | Level 2—Other | Level 3— | |
| | Level 1— | Significant | Significant | |
| | Unadjusted | Observable | Unobservable | |
| | Quoted Prices | Inputs | Inputs | Total |
| Assets ($) | | | | |
| Investments in Securities: | | | |
| Equity Securities— | | | | |
| Domestic | | | | |
| Common Stocks† | 522,322,431 | — | — | 522,322,431 |
| Mutual Funds | 23,087,023 | — | — | 23,087,023 |
| |
| † See Statement of Investments for additional detailed categorizations. | |
At November 30, 2012, there were no transfers between Level 1 and Level 2 of the fair value hierarchy.
(b) Securities transactions and investment income: Securities transactions are recorded on a trade date basis. Realized gains and losses from securities transactions are recorded on the identified cost basis. Dividend income is recognized on the ex-dividend date and interest income, including, where applicable, accretion of discount and amortization of premium on investments, is recognized on the accrual basis.
Pursuant to a securities lending agreement with The Bank of New York Mellon, a subsidiary of BNY Mellon and an affiliate of Dreyfus, the fund may lend securities to qualified institutions. It is the fund’s policy that, at origination, all loans are secured by collateral of at least
The Fund 23
NOTES TO FINANCIAL STATEMENTS (continued)
102% of the value of U.S. securities loaned and 105% of the value of foreign securities loaned. Collateral equivalent to at least 100% of the market value of securities on loan is maintained at all times. Collateral is either in the form of cash, which can be invested in certain money market mutual funds managed by Dreyfus, U.S. Government and Agency securities or letters of credit.The fund is entitled to receive all income on securities loaned, in addition to income earned as a result of the lending transaction. Although each security loaned is fully collateralized, the fund bears the risk of delay in recovery of, or loss of rights in, the securities loaned should a borrower fail to return the securities in a timely manner. During the period ended November 30, 2012,The Bank of New York Mellon earned $374,808 from lending portfolio securities, pursuant to the securities lending agreement.
(c) Affiliated issuers: Investments in other investment companies advised by Dreyfus are defined as “affiliated” in the Act. Investments in affiliated investment companies for the period ended November 30, 2012 were as follows:
| | | | | |
| Affiliated | | | | | |
| Investment | Value | | | Value | Net |
| Company | 11/30/2011($) | Purchases ($) | Sales ($) | 11/30/2012 ($) | Assets (%) |
| Dreyfus | | | | | |
| Institutional | | | | | |
| Preferred | | | | | |
| Plus Money | | | | | |
| Market | | | | | |
| Fund | 19,448,000 | 148,716,000 | 149,438,000 | 18,726,000 | 3.5 |
| Dreyfus | | | | | |
| Institutional | | | | | |
| Cash | | | | | |
| Advantage | | | | | |
| Fund | — | 95,965,411 | 91,604,388 | 4,361,023 | .8 |
| Total | 19,448,000 | 244,681,411 | 241,042,388 | 23,087,023 | 4.3 |
(d) Dividends to shareholders: Dividends are recorded on the ex-dividend date. Dividends from investment income-net and dividends from net realized capital gains, if any, are normally declared and paid annually, but the fund may make distributions on a more frequent basis to comply with the distribution requirements of the Internal Revenue Code
24
of 1986, as amended (the “Code”). To the extent that net realized capital gains can be offset by capital loss carryovers, it is the policy of the fund not to distribute such gains. Income and capital gain distributions are determined in accordance with income tax regulations, which may differ from GAAP.
(e) Federal income taxes: It is the policy of the fund to continue to qualify as a regulated investment company, if such qualification is in the best interests of its shareholders, by complying with the applicable provisions of the Code, and to make distributions of taxable income sufficient to relieve it from substantially all federal income and excise taxes.
As of and during the period ended November 30, 2012, the fund did not have any liabilities for any uncertain tax positions.The fund recognizes interest and penalties, if any, related to uncertain tax positions as income tax expense in the Statement of Operations. During the period, the fund did not incur any interest or penalties.
Each of the tax years in the four-year period ended November 30, 2012 remains subject to examination by the Internal Revenue Service and state taxing authorities.
At November 30, 2012, the components of accumulated earnings on a tax basis were as follows: undistributed ordinary income $4,443,355, accumulated capital losses $1,790,028 and unrealized appreciation $70,358,362. In addition, the fund had $1,606,841 of capital losses realized after October 31, 2012, which were deferred for tax purposes to the first day of the following fiscal year.
Under the Regulated Investment Company Modernization Act of 2010 (the “2010 Act”), the fund is permitted to carry forward capital losses incurred in taxable years beginning after December 22, 2010 (“post-enactment losses”) for an unlimited period. Furthermore, post-enactment capital loss carryovers retain their character as either short-term or long-term capital losses rather than short-term as they were under previous statute.The 2010 Act requires post-enactment losses to
The Fund 25
NOTES TO FINANCIAL STATEMENTS (continued)
be utilized before the utilization of losses incurred in taxable years prior to the effective date of the 2010 Act (“pre-enactment losses”).As a result of this ordering rule, pre-enactment losses may be more likely to expire unused.
The accumulated capital loss carryover is available for federal income tax purposes to be applied against future net realized capital gains, if any, realized subsequent to November 30, 2012. If not applied, the carryover expires in fiscal year 2019.
The tax character of distributions paid to shareholders during the fiscal periods ended November 30, 2012 and November 30, 2011 were as follows: ordinary income $1,914,449 and $1,040,410, respectively.
NOTE 2—Bank Lines of Credit:
The fund participates with other Dreyfus-managed funds in a $210 million unsecured credit facility led by Citibank, N.A. and a $300 million unsecured credit facility provided by The Bank of New York Mellon (each, a “Facility”), each to be utilized primarily for temporary or emergency purposes, including the financing of redemptions. Prior to October 10, 2012, the unsecured credit facility with Citibank, N.A., was $225 million. In connection therewith, the fund has agreed to pay its pro rata portion of commitment fees for each Facility. Interest is charged to the fund based on rates determined pursuant to the terms of the respective Facility at the time of borrowing. During the period ended November 30, 2012, the fund did not borrow under the Facilities.
NOTE 3—Management Fee, Sub-Investment Advisory Fee and Other Transactions With Affiliates:
(a) Pursuant to a management agreement with Dreyfus, the management fee is computed at the annual rate of .75% of the value of the fund’s average daily net assets and is payable monthly. Dreyfus has contractually agreed, until April 1, 2013, to waive receipt of its fees and/or assume the expenses of the fund so that the expenses of none of the classes (excluding Rule 12b-1 Distribution Plan fees, Shareholder Services Plan fees, taxes, interest expense, brokerage commissions,
26
commitment fees on borrowings and extraordinary expenses) exceed 1.15% of the value of the fund’s average daily net assets. During the period ended November 30, 2012, there were no reduction in expenses pursuant to the undertaking.
Pursuant to a sub-investment advisory agreement between Dreyfus and Walter Scott, Dreyfus pays Walter Scott a monthly fee at an annual percentage of the fund’s average daily net assets.
During the period ended November 30, 2012, the Distributor retained $4,638 from commissions earned on sales of the fund’s Class A shares.
(b) Under the Distribution Plan adopted pursuant to Rule 12b-1 under the Act, Class C shares pay the Distributor for distributing its shares at an annual rate of .75% of the value of the average daily net assets of Class C shares. During the period ended November 30, 2012, Class C shares were charged $2,145 pursuant to the Distribution Plan.
(c) Under the Shareholder Services Plan, Class A and Class C shares pay the Distributor at an annual rate of .25% of the value of their average daily net assets for the provision of certain services. The services provided may include personal services relating to shareholder accounts, such as answering shareholder inquiries regarding Class A and Class C shares and providing reports and other information, and services related to the maintenance of shareholder accounts. The Distributor may make payments to Service Agents (securities dealers, financial institutions or other industry professionals) with respect to these services.The Distributor determines the amounts to be paid to Service Agents. During the period ended November 30, 2012, Class A and Class C shares were charged $3,102 and $715, respectively, pursuant to the Shareholder Services Plan.
The fund has arrangements with the transfer agent and the custodian whereby the fund may receive earnings credits when positive cash balances are maintained, which are used to offset transfer agency and custody fees. For financial reporting purposes, the fund includes net earnings credits as an expense offset in the Statement of Operations.
The Fund 27
NOTES TO FINANCIAL STATEMENTS (continued)
The fund compensates Dreyfus Transfer, Inc., a wholly-owned subsidiary of Dreyfus, under a transfer agency agreement for providing transfer agency services for the fund and, since May 29, 2012, cash management services related to fund subscriptions and redemptions. During the period ended November 30, 2012, the fund was charged $2,835 for transfer agency services and $82 for cash management services. Cash management fees were partially offset by earnings credits of $10. These fees are included in Shareholder servicing costs in the Statement of Operations.
The fund compensatesThe Bank of NewYork Mellon under a custody agreement for providing custodial services for the fund. During the period ended November 30, 2012, the fund was charged $40,658 pursuant to the custody agreement.
Prior to May 29, 2012, the fund compensated The Bank of NewYork Mellon under a cash management agreement for performing cash management services related to fund subscriptions and redemptions. During the period ended November 30, 2012, the fund was charged $122 pursuant to the cash management agreement, which is included in Shareholder servicing costs in the Statement of Operations. These fees were partially offset by earnings credits of $5.
During the period ended November 30, 2012, the fund was charged $8,650 for services performed by the Chief Compliance Officer and his staff.
The components of “Due to The Dreyfus Corporation and affiliates” in the Statement of Assets and Liabilities consist of: management fees $321,169, Distribution Plan fees $170, Shareholder Services Plan fees $384, custodian fees $13,132, Chief Compliance Officer fees $3,318 and transfer agency fees $714.
28
(d) Each Board member also serves as a Board member of other funds within the Dreyfus complex. Annual retainer fees and attendance fees are allocated to each fund based on net assets.
NOTE 4—Securities Transactions:
The aggregate amount of purchases and sales of investment securities, excluding short-term securities, during the period ended November 30, 2012, amounted to $158,067,203 and $26,399,056, respectively.
At November 30, 2012, the cost of investments for federal income tax purposes was $475,051,092; accordingly, accumulated net unrealized appreciation on investments was $70,358,362, consisting of $81,357,900 gross unrealized appreciation and $10,999,538 gross unrealized depreciation.
The Fund 29
REPORT OF INDEPENDENT REGISTERED
PUBLIC ACCOUNTING FIRM
Shareholders and Board of Directors
Dreyfus U.S. Equity Fund
We have audited the accompanying statement of assets and liabilities, including the statement of investments, of Dreyfus U.S. Equity Fund (one of the series comprising Strategic Funds, Inc.) as of November 30, 2012, and the related statement of operations for the year then ended, the statement of changes in net assets for each of the two years in the period then ended, and the financial highlights for each of the periods indicated therein. These financial statements and financial highlights are the responsibility of the Fund’s management. Our responsibility is to express an opinion on these financial statements and financial highlights based on our audits.
We conducted our audits in accordance with the standards of the Public Company Accounting Oversight Board (United States).Those standards require that we plan and perform the audit to obtain reasonable assurance about whether the financial statements and financial highlights are free of material misstatement.We were not engaged to perform an audit of the Fund’s internal control over financial reporting. Our audits included consideration of internal control over financial reporting as a basis for designing audit procedures that are appropriate in the circumstances, but not for the purpose of expressing an opinion on the effectiveness of the Fund’s internal control over financial reporting. Accordingly, we express no such opinion.An audit also includes examining, on a test basis, evidence supporting the amounts and disclosures in the financial statements and financial highlights, assessing the accounting principles used and significant estimates made by management, and evaluating the overall financial statement presentation. Our procedures included confirmation of securities owned as of November 30, 2012 by correspondence with the custodian and others. We believe that our audits provide a reasonable basis for our opinion.
In our opinion, the financial statements and financial highlights referred to above present fairly, in all material respects, the financial position of Dreyfus U.S. Equity Fund at November 30, 2012, the results of its operations for the year then ended, the changes in its net assets for each of the two years in the period then ended, and the financial highlights for each of the indicated periods, in conformity with U.S. generally accepted accounting principles.
NewYork, NewYork
January 28, 2013
30
IMPORTANT TAX INFORMATION (Unaudited)
For federal tax purposes, the fund hereby reports 100% of the ordinary dividends paid during the fiscal year ended November 30, 2012 as qualifying for the corporate dividends received deduction.Also, certain dividends paid by the fund may be subject to a maximum tax rate of 15%, as provided for by the Jobs and Growth Tax Relief Reconciliation Act of 2003. Of the distributions paid during the fiscal year, $1,914,449 represents the maximum amount that may be considered qualified dividend income. Shareholders will receive notification in early 2013 of the percentage applicable to the preparation of their 2012 income tax returns.
The Fund 31
INFORMATION ABOUT THE RENEWAL OF THE
FUND’S MANAGEMENT AND SUB-INVESTMENT
ADVISORY AGREEMENTS (Unaudited)
At a meeting of the fund’s Board of Directors held on November 5-6, 2012, the Board considered the renewal of the fund’s Management Agreement, pursuant to which Dreyfus provides the fund with investment advisory and administrative services (the “Agreement”), and the Sub-Investment Advisory Agreement (together, the “Agreements”), between Dreyfus and Walter Scott & Partners Limited (the “Sub-Adviser”), pursuant to which the Sub-Adviser provides day-to-day management of the fund’s investments. The Board members, none of whom are “interested persons” (as defined in the Investment Company Act of 1940, as amended) of the fund, were assisted in their review by independent legal counsel and met with counsel in executive session separate from representatives of Dreyfus and the Sub-Adviser. In considering the renewal of the Agreements, the Board considered all factors that it believed to be relevant, including those discussed below. The Board did not identify any one factor as dispositive, and each Board member may have attributed different weights to the factors considered.
Analysis of Nature, Extent, and Quality of Services Provided to the Fund.The Board considered information previously provided to them in presentations from Dreyfus representatives regarding the nature, extent, and quality of the services provided to funds in the Dreyfus fund complex, and Dreyfus representatives confirmed that there had been no material changes in this information. Dreyfus provided the number of open accounts in the fund, the fund’s asset size and the allocation of fund assets among distribution channels. Dreyfus also had previously provided information regarding the diverse intermediary relationships and distribution channels of funds in the Dreyfus fund complex (such as retail direct or intermediary, in which intermediaries typically are paid by the fund and/or Dreyfus) and Dreyfus’ corresponding need for broad, deep, and diverse resources to be able to provide ongoing shareholder services to each intermediary or distribution channel, as applicable to the fund.
The Board also considered research support available to, and portfolio management capabilities of, the fund’s portfolio management personnel and that Dreyfus also provides oversight of day-to-day fund operations, including fund accounting and administration and assistance in meeting
32
legal and regulatory requirements.The Board also considered Dreyfus’ extensive administrative, accounting, and compliance infrastructures, as well as Dreyfus’ supervisory activities over the Sub-Adviser.The Board also considered portfolio management’s brokerage policies and practices (including policies and practices regarding soft dollars) and the standards applied in seeking best execution.
Comparative Analysis of the Fund’s Performance and Management Fee and Expense Ratio.The Board reviewed reports prepared by Lipper, Inc. (“Lipper”), an independent provider of investment company data, which included information comparing (1) the fund’s performance with the performance of a group of comparable funds (the “Performance Group”) and with a broader group of funds (the “Performance Universe”), all for various periods ended September 30, 2012, and (2) the fund’s actual and contractual management fees and total expenses with those of a group of comparable funds (the “Expense Group”) and with a broader group of funds (the “Expense Universe”), the information for which was derived in part from fund financial statements available to Lipper as of the date of its analysis. Dreyfus previously had furnished the Board with a description of the methodology Lipper used to select the Performance Group and Performance Universe and the Expense Group and Expense Universe.
Dreyfus representatives stated that the usefulness of performance comparisons may be affected by a number of factors, including different investment limitations that may be applicable to the fund and comparison funds.The Board discussed the results of the comparisons and noted that the fund’s total return performance was below the Performance Group and Performance Universe medians for the one-year period and above the Performance Group and Performance Universe medians for each other time period. Dreyfus also provided a comparison of the fund’s calendar year total returns to the fund’s benchmark index and noted that the fund’s returns were higher in two of the three years and lower in one year than those of the benchmark index.
The Fund 33
INFORMATION ABOUT THE RENEWAL OF THE FUND’S MANAGEMENT AND
SUB-INVESTMENT ADVISORY AGREEMENTS (Unaudited) (continued)
The Board also reviewed the range of actual and contractual management fees and total expenses of the Expense Group and Expense Universe funds and discussed the results of the comparisons.The Board noted that the fund’s contractual management fee was below the Expense Group median, the fund’s actual management fee was above the Expense Group median and the Expense Universe median, and the fund’s total expenses were above the Expense Group median and below the Expense Universe median.
Dreyfus representatives noted that Dreyfus has contractually agreed to waive receipt of its fees and/or assume the expenses of the fund, until April 1, 2013, so that annual direct fund operating expenses (excluding Rule 12b-1 fees, shareholder services fees, taxes, interest, brokerage commissions, commitment fees on borrowings, acquired fund fees and extraordinary expenses) do not exceed 1.15% of the fund’s average daily net assets.
Dreyfus representatives reviewed with the Board the management or investment advisory fees (1) paid by funds advised or administered by Dreyfus that are in the same Lipper category as the fund and (2) paid to Dreyfus or the Sub-Adviser or its affiliates for advising any separate accounts and/or other types of client portfolios that are considered to have similar investment strategies and policies as the fund (the “Similar Clients”), and explained the nature of the Similar Clients.They discussed differences in fees paid and the relationship of the fees paid in light of any differences in the services provided and other relevant factors.The Board considered the relevance of the fee information provided for the Similar Clients to evaluate the appropriateness and reasonableness of the fund’s management fee.
The Board considered the fee to the Sub-Adviser in relation to the fee paid to Dreyfus by the fund and the respective services provided by the Sub-Adviser and Dreyfus.The Board also noted the Sub-Adviser’s fee is paid by Dreyfus (out of its fee from the fund) and not the fund.
Analysis of Profitability and Economies of Scale. Dreyfus representatives reviewed the expenses allocated and profit received by Dreyfus and the resulting profitability percentage for managing the fund and
34
the aggregate profitability percentage to Dreyfus of managing the funds in the Dreyfus fund complex, and the method used to determine the expenses and profit. The Board concluded that the profitability results were not unreasonable, given the services rendered and service levels provided by Dreyfus. The Board also had been provided with information prepared by an independent consulting firm regarding Dreyfus’ approach to allocating costs to, and determining the profitability of, individual funds and the entire Dreyfus fund complex.The consulting firm also had analyzed where any economies of scale might emerge in connection with the management of a fund.
The Board’s counsel stated that the Board should consider the profitability analysis (1) as part of the evaluation of whether the fees under the Agreements bear a reasonable relationship to the mix of services provided by Dreyfus and the Sub-Adviser, including the nature, extent and quality of such services, and (2) in light of the relevant circumstances for the fund and the extent to which economies of scale would be realized if the fund grows and whether fee levels reflect these economies of scale for the benefit of fund shareholders. Since Dreyfus, and not the fund, pays the Sub-Adviser pursuant to the Sub-Investment Advisory Agreement, the Board did not consider the Sub-Adviser’s profitability to be relevant to its deliberations. Dreyfus representatives also noted that, as a result of shared and allocated costs among funds in the Dreyfus fund complex, the extent of economies of scale could depend substantially on the level of assets in the complex as a whole, so that increases and decreases in complex-wide assets can affect potential economies of scale in a manner that is disproportionate to, or even in the opposite direction from, changes in the fund’s asset level.The Board also considered potential benefits to Dreyfus and the Sub-Adviser from acting as investment adviser and sub-investment adviser, respectively, and noted the soft dollar arrangements in effect for trading the fund’s investments.
At the conclusion of these discussions, the Board agreed that it had been furnished with sufficient information to make an informed business decision with respect to the renewal of the Agreements.
The Fund 35
INFORMATION ABOUT THE RENEWAL OF THE FUND’S MANAGEMENT AND
SUB-INVESTMENT ADVISORY AGREEMENTS (Unaudited) (continued)
Based on the discussions and considerations as described above, the Board concluded and determined as follows.
The Board concluded that the nature, extent and quality of the services provided by Dreyfus and the Sub-Adviser are adequate and appropriate.
The Board was satisfied with the fund’s performance, in light of the considerations described above.
The Board concluded that the fees paid to Dreyfus and the Sub- Adviser were reasonable in light of the considerations described above.
The Board determined that the economies of scale which may accrue to Dreyfus and its affiliates in connection with the management of the fund had been adequately considered by Dreyfus in connection with the fee rate charged to the fund pursuant to the Agreement and that, to the extent in the future it were determined that material economies of scale had not been shared with the fund, the Board would seek to have those economies of scale shared with the fund.
In evaluating the Agreements, the Board considered these conclusions and determinations and also relied on its previous knowledge, gained through meetings and other interactions with Dreyfus and its affiliates and the Sub-Adviser, of the fund and the services provided to the fund by Dreyfus and the Sub-Adviser.The Board also relied on information received on a routine and regular basis throughout the year relating to the operations of the fund and the investment management and other services provided under the Agreements, including information on the investment performance of the fund in comparison to similar mutual funds and benchmark performance indices; general market outlook as applicable to the fund; and compliance reports. In addition, it should be noted that the Board’s consideration of the contractual fee arrangements for this fund had the benefit of a number of years of reviews of prior or similar agreements during which lengthy discussions took place between the Board and Dreyfus representatives. Certain aspects of the arrangements may receive greater scrutiny in some years than in others, and the Board’s conclusions may be based, in part, on their consideration of the same or similar arrangements in prior years.The Board determined that renewal of the Agreements for the ensuing year was in the best interests of the fund and its shareholders.
36
BOARD MEMBERS INFORMATION (Unaudited)
|
| Joseph S. DiMartino (69) |
| Chairman of the Board (1995) |
| Principal Occupation During Past 5Years: |
| • Corporate Director and Trustee |
| Other Public Company Board Memberships During Past 5Years: |
| • CBIZ (formerly, Century Business Services, Inc.), a provider of outsourcing functions for small |
| and medium size companies, Director (1997-present) |
| • Sunair Services Corporation, a provider of certain outdoor-related services to homes and |
| businesses, Director (2005-2009) |
| • The Newark Group, a provider of a national market of paper recovery facilities, paperboard |
| mills and paperboard converting plants, Director (2000-2010) |
| No. of Portfolios for which Board Member Serves: 157 |
| ——————— |
| William Hodding Carter III (77) |
| Board Member (1988) |
| Principal Occupation During Past 5Years: |
| • Professor of Leadership & Public Policy, University of North Carolina, Chapel Hill (2006-present) |
| No. of Portfolios for which Board Member Serves: 27 |
| ——————— |
| Gordon J. Davis (71) |
| Board Member (2006) |
| Principal Occupation During Past 5Years: |
| • Partner in the law firm ofVenable, LLP (2012-present) |
| • Partner in the law firm of Dewey & LeBoeuf, LLP (1994-2012) |
| Other Public Company Board Memberships During Past 5Years: |
| • Consolidated Edison, Inc., a utility company, Director (1997-present) |
| • The Phoenix Companies, Inc., a life insurance company, Director (2000-present) |
| No. of Portfolios for which Board Member Serves: 50 |
| ——————— |
| Joni Evans (70) |
| Board Member (2006) |
| Principal Occupation During Past 5Years: |
| • Chief Executive Officer, www.wowOwow.com an online community dedicated to women’s |
| conversations and publications (2007-present) |
| • Principal, Joni Evans Ltd. (publishing) (2006-present) |
| No. of Portfolios for which Board Member Serves: 27 |
The Fund 37
BOARD MEMBERS INFORMATION (Unaudited) (continued)
|
| Ehud Houminer (72) |
| Board Member (1994) |
| Principal Occupation During Past 5Years: |
| • Executive-in-Residence at the Columbia Business School, Columbia University (1992-present) |
| Other Public Company Board Memberships During Past 5Years: |
| • Avnet Inc., an electronics distributor, Director (1993-2012) |
| No. of Portfolios for which Board Member Serves: 73 |
| ——————— |
| Richard C. Leone (72) |
| Board Member (1984) |
| Principal Occupation During Past 5Years: |
| • Senior Fellow and former President of The Century Foundation (formerly,The Twentieth |
| Century Fund, Inc.), a tax exempt research foundation engaged in the study of economic, |
| foreign policy and domestic issues |
| Other Public Company Board Memberships During Past 5Years: |
| • Partnership for a Secure America, Director |
| No. of Portfolios for which Board Member Serves: 27 |
| ——————— |
| Hans C. Mautner (75) |
| Board Member (1984) |
| Principal Occupation During Past 5Years: |
| • President—International Division and an Advisory Director of Simon Property Group, a real |
| estate investment company (1998-2010) |
| • Chairman and Chief Executive Officer of Simon Global Limited (1999-2010) |
| No. of Portfolios for which Board Member Serves: 27 |
| ——————— |
| Robin A. Melvin (49) |
| Board Member (1995) |
| Principal Occupation During Past 5Years: |
| • Director, Boisi Family Foundation, a private family foundation that supports youth-serving orga- |
| nizations that promote the self sufficiency of youth from disadvantaged circumstances (1995-2012) |
| No. of Portfolios for which Board Member Serves: 100 |
38
|
| Burton N.Wallack (62) |
| Board Member (2006) |
| Principal Occupation During Past 5Years: |
| • President and Co-owner of Wallack Management Company, a real estate management company |
| No. of Portfolios for which Board Member Serves: 27 |
| ——————— |
| John E. Zuccotti (75) |
| Board Member (1984) |
| Principal Occupation During Past 5Years: |
| • Chairman of Brookfield Properties, Inc. |
| • Senior Counsel of Weil, Gotshal & Manges, LLP |
| • Emeritus Chairman of the Real Estate Board of NewYork |
| Other Public Company Board Memberships During Past 5Years: |
| • Emigrant Savings Bank, Director (2004-present) |
| • Doris Duke Charitable Foundation,Trustee (2006-present) |
| • NewYork Private Bank & Trust, Director |
| No. of Portfolios for which Board Member Serves: 27 |
| ——————— |
| Once elected all Board Members serve for an indefinite term, but achieve Emeritus status upon reaching age 80.The |
| address of the Board Members and Officers is c/o The Dreyfus Corporation, 200 Park Avenue, NewYork, NewYork |
| 10166.Additional information about the Board Members is available in the fund’s Statement of Additional Information |
| which can be obtained from Dreyfus free of charge by calling this toll free number: 1-800-DREYFUS. |
| David W. Burke, Emeritus Board Member |
| Arnold S. Hiatt, Emeritus Board Member |
The Fund 39
OFFICERS OF THE FUND (Unaudited)
40

The Fund 41
Save time. Save paper. View your next shareholder report online as soon as it’s available. Log into www.dreyfus.com and sign up for Dreyfus eCommunications. It’s simple and only takes a few minutes.
The views expressed in this report reflect those of the portfolio manager only through the end of the period covered and do not necessarily represent the views of Dreyfus or any other person in the Dreyfus organization. Any such views are subject to change at any time based upon market or other conditions and Dreyfus disclaims any responsibility to update such views.These views may not be relied on as investment advice and, because investment decisions for a Dreyfus fund are based on numerous factors, may not be relied on as an indication of trading intent on behalf of any Dreyfus fund.
| | Contents |
| | THE FUND |
| 2 | A Letter from the President |
| 3 | Discussion of Fund Performance |
| 6 | Fund Performance |
| 8 | UnderstandingYour Fund’s Expenses |
| 8 | ComparingYour Fund’s Expenses With Those of Other Funds |
| 9 | Statement of Investments |
| 12 | Statement of Assets and Liabilities |
| 13 | Statement of Operations |
| 14 | Statement of Changes in Net Assets |
| 16 | Financial Highlights |
| 19 | Notes to Financial Statements |
| 32 | Report of Independent Registered Public Accounting Firm |
| 33 | Important Tax Information |
| 34 | Information About the Renewal of the Fund’s Management and Sub-Investment Advisory Agreements |
| 39 | Board Members Information |
| 42 | Officers of the Fund |
| | FOR MORE INFORMATION |
| | Back Cover |
Global Stock Fund
The Fund
A LETTER FROM THE PRESIDENT
Dear Shareholder:
We are pleased to present this annual report for Global Stock Fund, covering the 12-month period from December 1, 2011, through November 30, 2012. For information about how the fund performed during the reporting period, as well as general market perspectives, we provide a Discussion of Fund Performance on the pages that follow.
Despite pronounced stock market weakness during the spring of 2012, international equities generally advanced over the reporting period as investors responded to encouraging macroeconomic developments throughout the world. Employment gains in the United States, credible measures to prevent a more severe banking crisis in Europe, and the likelihood of a “soft landing” for China’s economy buoyed investor sentiment, as did aggressively accommodative monetary policies from central banks in the United States, Europe, Japan and China. Consequently, global markets rose over the second half of the reporting period, offsetting previous bouts of weakness and enabling international stocks to post respectable gains, on average, for the reporting period.
In light of the easy monetary policies adopted by many countries, we expect global growth to be slightly more robust in 2013 than in 2012 as uncertainties surrounding U.S. fiscal policy ease, further healing of the European financial crisis occurs, and the emerging markets achieve a modestly stronger pace of growth.As always, we encourage you to stay in touch with your financial advisor as new developments unfold.
Thank you for your continued confidence and support.
Sincerely,

J. Charles Cardona
President
The Dreyfus Corporation
December 17, 2012
2
DISCUSSION OF FUND PERFORMANCE
For the period of December 1, 2011, through November 30, 2012, as provided by Charlie Macquaker and Roy Leckie of Walter Scott & Partners Limited (Walter Scott), Sub-investment adviser
Fund and Market Performance Overview
For the 12-month period ended November 30, 2012, Global Stock Fund’s Class A shares produced a total return of 13.08%, Class C shares returned 12.21% and Class I shares returned 13.49%.1 In comparison, the fund’s benchmark, the Morgan Stanley Capital International World Index (the “MSCI World Index”), achieved a 13.62% return over the same period.2
Amid heightened volatility, global stock markets generally rallied over the reporting period as investors responded to aggressively accommodative monetary policies in many parts of the world.The fund lagged its benchmark, primarily due to its defensive investment posture, particularly in the financials sector.
The Fund’s Investment Approach
The fund seeks long-term real returns by investing in high-quality companies capable of sustainable growth and wealth creation over a long time horizon.The fund focuses on individual stock selection through extensive fundamental research. Candidates are initially selected for research if they meet certain broad absolute and trend criteria. Financial statements are analyzed in an effort to identify the nature of the cash generation that is looked for in any investment and to understand the variables that demonstrate robust financial health and define long-term competitive advantage. Companies meeting the financial criteria are then subjected to a detailed investigation of products, costs and pricing, competition, industry position and outlook.
Central Bank Actions Lifted Global Equities
The reporting period began in the aftermath of pronounced weakness in global stock markets, resulting in attractive valuations across a number of market sectors in December 2011. Indeed, by the first quarter of 2012, many markets were rallying amid stronger U.S. employment gains, a quantitative easing program in Europe that forestalled a more severe banking crisis in the region, and less restrictive monetary and
The Fund 3
DISCUSSION OF FUND PERFORMANCE (continued)
fiscal policies in China. Meanwhile, corporate earnings generally remained strong, and many companies had shored up their balance sheets. Investors grew more tolerant of risks, focusing more intently on business fundamentals and less on news headlines.
These positive influences were called into question during the spring, when the U.S. labor market’s rebound slowed, measures designed to relieve fiscal pressures in Europe encountered political resistance, and the Chinese economy remained under pressure. However, investor sentiment soon improved when several central banks adopted aggressively accommodative monetary policies. In the United States, the Federal Reserve Board extended Operation Twist in June and embarked on a third round of quantitative easing in September. In a July speech, the head of the European Central Bank signaled the central bank’s commitment to supporting the euro, which was followed by plans to buy distressed debt from the European Union’s more troubled members. In China, industrial production improved, supporting exporters and commodities producers, and investors responded positively to expectations that new government leadership would adopt more stimulative fiscal policies.
Cautious Posture Dampened Relative Performance
Our relatively cautious investment approach generally beats market averages during market downturns, but lags during rallies.The reporting period proved to be no exception. This was particularly evident in the financials sector, an area we have regarded skeptically for some time due, in part, to ongoing deleveraging pressures. Consequently, the fund did not participate significantly in the sector’s gains when investors responded positively to various governments’ efforts to shore up their troubled banking systems. The fund’s relative results also were undercut by overweighted exposure to Japan, which continued to struggle with deflationary pressures and a weak domestic economy.
A number of individual holdings also disappointed during the reporting period. In the energy sector, U.K.-based BG Group encountered production problems in a number of its natural gas fields, and government intervention prevented Petroleo Brasileiro,ADR from passing along higher input costs to its customers. Proliferation of devices and uses of those devices has fundamentally changed many of the markets in which Canon operates, and concerns about how the company will fare in this new landscape has weighed on the share price of Japanese electronics company, Canon. U.S. semiconductors giant Intel struggled with an industry-wide transition from personal computers to mobile devices.
4
The fund achieved better results in the health care sector, where Australian blood plasma specialist CSL benefited from a weaker Australian dollar, strong sales and positive news regarding new products under development. Spain-based retailer Inditex reported higher gross margins and favorable same-store-sales comparisons. In the United States, discount apparel retailer The TJX Companies posted higher profits, sales and same-store comparisons. Denmark’s Novo Nordisk saw sales of its diabetes drugs increase. U.S. connectors manufacturer Amphenol gained market share amid the increasing popularity of mobile devices containing its products.
Global Uncertainty Persists
With valuations higher than they were a year ago and economic recovery in many parts of the world muted at best, a degree of caution is warranted.That said, the investment focus remains unchanged; a continued focus on companies that, in our analysis, have low debt levels, robust long-term growth prospects and strong market leading positions, companies with the attributes to deliver profitable growth regardless of broader economic conditions.
December 17, 2012
|
| Equity funds are subject generally to market, market sector, market liquidity, issuer and investment style risks, among |
| other factors, to varying degrees, all of which are more fully described in the fund’s prospectus. |
| Investing internationally involves special risks, including changes in currency exchange rates, political, economic and |
| social instability, a lack of comprehensive company information, differing auditing and legal standards and less market |
| liquidity.These risks generally are greater with emerging market countries than with more economically and politically |
| established foreign countries. |
| 1 Total return includes reinvestment of dividends and any capital gains paid and does not take into consideration the |
| maximum initial sales charge in the case of Class A shares, or the applicable contingent deferred sales charge imposed |
| on redemptions in the case of Class C shares. Had these charges been reflected, returns would have been lower. Past |
| performance is no guarantee of future results. Share price, yield and investment return fluctuate such that upon |
| redemption, fund shares may be worth more or less than their original cost. |
| 2 SOURCE: LIPPER INC. — Reflects reinvestment of net dividends and, where applicable, capital gain |
| distributions.The Morgan Stanley Capital International (MSCI) World Index is an unmanaged index of global stock |
| market performance, including the United States, Canada, Europe,Australia, New Zealand and the Far East. |
| Investors cannot invest directly in any index. |
The Fund 5
FUND PERFORMANCE
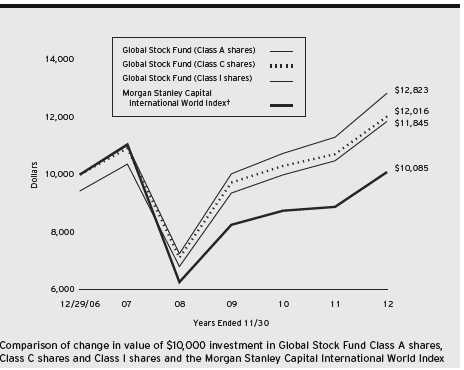
† Source: Lipper Inc.
Past performance is not predictive of future performance.
The above graph compares a $10,000 investment made in each of the Class A, Class C and Class I shares of Global Stock Fund on 12/29/06 (inception date) to a $10,000 investment made in the Morgan Stanley Capital International World Index (the “Index”) on that date.All dividends and capital gain distributions are reinvested.
The fund’s performance shown in the line graph above takes into account the maximum initial sales charge on Class A shares and all other applicable fees and expenses on all classes.The Index is an unmanaged index of global stock market performance, including the United States, Canada,Australia, New Zealand and the Far East and includes net dividends reinvested. Unlike a mutual fund, the Index is not subject to charges, fees and other expenses. Investors cannot invest directly in any index. Further information relating to fund performance, including expense reimbursements, if applicable, is contained in the Financial Highlights section of the prospectus and elsewhere in this report.
6
| | | | | | | |
| Average Annual Total Returns as of 11/30/12 | | | | | | |
| |
| | Inception | | | | | From | |
| | Date | 1 | Year | 5 Years | | Inception | |
| Class A shares | | | | | | | |
| with maximum sales charge (5.75%) | 12/29/06 | 6.61 | % | 1.50 | % | 2.90 | % |
| without sales charge | 12/29/06 | 13.08 | % | 2.71 | % | 3.93 | % |
| Class C shares | | | | | | | |
| with applicable redemption charge † | 12/29/06 | 11.21 | % | 1.95 | % | 3.15 | % |
| without redemption | 12/29/06 | 12.21 | % | 1.95 | % | 3.15 | % |
| Class I shares | 12/29/06 | 13.49 | % | 3.10 | % | 4.29 | % |
| Morgan Stanley Capital | | | | | | | |
| International World Index | 12/31/06 | 13.62 | % | –1.80 | % | 0.14 | % |
Past performance is not predictive of future performance.The fund’s performance shown in the graph and table does not reflect the deduction of taxes that a shareholder would pay on fund distributions or the redemption of fund shares.
|
| † The maximum contingent deferred sales charge for Class C shares is 1% for shares redeemed within one year of the |
| date of purchase. |
The Fund 7
UNDERSTANDING YOUR FUND’S EXPENSES (Unaudited)
As a mutual fund investor, you pay ongoing expenses, such as management fees and other expenses. Using the information below, you can estimate how these expenses affect your investment and compare them with the expenses of other funds.You also may pay one-time transaction expenses, including sales charges (loads) and redemption fees, which are not shown in this section and would have resulted in higher total expenses. For more information, see your fund’s prospectus or talk to your financial adviser.
Review your fund’s expenses
The table below shows the expenses you would have paid on a $1,000 investment in Global Stock Fund from June 1, 2012 to November 30, 2012. It also shows how much a $1,000 investment would be worth at the close of the period, assuming actual returns and expenses.
Expenses and Value of a $1,000 Investment
assuming actual returns for the six months ended November 30, 2012
| | | | | | |
| | | Class A | | Class C | | Class I |
| Expenses paid per $1,000† | $ | 6.73 | $ | 10.73 | $ | 4.93 |
| Ending value (after expenses) | $ | 1,119.20 | $ | 1,114.40 | $ | 1,121.40 |
COMPARING YOUR FUND’S EXPENSES
WITH THOSE OF OTHER FUNDS (Unaudited)
Using the SEC’s method to compare expenses
The Securities and Exchange Commission (SEC) has established guidelines to help investors assess fund expenses. Per these guidelines, the table below shows your fund’s expenses based on a $1,000 investment, assuming a hypothetical 5% annualized return. You can use this information to compare the ongoing expenses (but not transaction expenses or total cost) of investing in the fund with those of other funds.All mutual fund shareholder reports will provide this information to help you make this comparison. Please note that you cannot use this information to estimate your actual ending account balance and expenses paid during the period.
Expenses and Value of a $1,000 Investment
assuming a hypothetical 5% annualized return for the six months ended November 30, 2012
| | | | | | |
| | | Class A | | Class C | | Class I |
| Expenses paid per $1,000† | $ | 6.41 | $ | 10.23 | $ | 4.70 |
| Ending value (after expenses) | $ | 1,018.65 | $ | 1,014.85 | $ | 1,020.35 |
|
| † Expenses are equal to the fund’s annualized expense ratio of 1.27% for Class A, 2.03% for Class C and .93% |
| for Class I, multiplied by the average account value over the period, multiplied by 183/366 (to reflect the one-half |
| year period). |
8
STATEMENT OF INVESTMENTS
November 30, 2012
| | |
| Common Stocks—97.6% | Shares | Value ($) |
| Australia—4.1% | | |
| CSL | 305,300 | 16,472,219 |
| Woodside Petroleum | 398,000 | 14,038,947 |
| | | 30,511,166 |
| Brazil—1.5% | | |
| Petroleo Brasileiro, ADR, Cl. A | 631,800 | 11,088,090 |
| Canada—1.9% | | |
| Suncor Energy | 431,100 | 14,087,186 |
| China—3.1% | | |
| China Shenhua Energy, Cl. H | 1,888,000 | 7,734,510 |
| CNOOC | 7,184,000 | 15,368,729 |
| | | 23,103,239 |
| Denmark—1.9% | | |
| Novo Nordisk, Cl. B | 90,900 | 14,436,117 |
| France—3.5% | | |
| Cie Generale d’Optique Essilor International | 115,000 | 11,105,006 |
| L’Oreal | 110,000 | 14,928,275 |
| | | 26,033,281 |
| Hong Kong—5.1% | | |
| China Mobile | 1,255,500 | 14,352,830 |
| CLP Holdings | 940,500 | 8,245,849 |
| Hong Kong & China Gas | 5,590,668 | 15,148,516 |
| | | 37,747,195 |
| Japan—14.0% | | |
| Canon | 416,500 | 14,566,258 |
| Chugai Pharmaceutical | 371,100 | 7,355,825 |
| Daikin Industries | 183,200 | 5,760,349 |
| Denso | 419,100 | 13,772,571 |
| FANUC | 84,300 | 14,214,472 |
| Honda Motor | 435,900 | 14,446,277 |
| Keyence | 22,957 | 6,410,750 |
| Komatsu | 334,300 | 7,490,169 |
| Mitsubishi Estate | 337,000 | 6,495,942 |
| Shin-Etsu Chemical | 239,600 | 14,096,682 |
| | | 104,609,295 |
The Fund 9
STATEMENT OF INVESTMENTS (continued)
| | | |
| Common Stocks (continued) | Shares | | Value ($) |
| Singapore—1.2% | | | |
| DBS Group Holdings | 771,074 | | 9,128,313 |
| Spain—2.4% | | | |
| Inditex | 130,500 | | 17,888,569 |
| Sweden—1.6% | | | |
| Hennes & Mauritz, Cl. B | 374,000 | | 12,136,232 |
| Switzerland—6.2% | | | |
| Nestle | 216,000 | | 14,136,614 |
| Novartis | 100,600 | | 6,225,758 |
| SGS | 5,000 | | 11,217,222 |
| Syngenta | 37,300 | | 14,953,005 |
| | | | 46,532,599 |
| Taiwan—1.1% | | | |
| Taiwan Semiconductor Manufacturing, ADR | 458,800 | | 7,923,476 |
| United Kingdom—10.2% | | | |
| BG Group | 672,000 | | 11,520,123 |
| HSBC Holdings | 1,520,000 | | 15,529,736 |
| Reckitt Benckiser Group | 242,200 | | 15,230,630 |
| Standard Chartered | 594,041 | | 13,847,886 |
| Tesco | 2,823,000 | | 14,703,879 |
| WM Morrison Supermarkets | 1,200,500 | | 5,170,059 |
| | | | 76,002,313 |
| United States—39.8% | | | |
| Adobe Systems | 415,800 | a | 14,390,838 |
| Amphenol, Cl. A | 165,400 | | 10,241,568 |
| Automatic Data Processing | 246,700 | | 14,002,692 |
| C.R. Bard | 79,700 | | 7,891,097 |
| Cisco Systems | 798,000 | | 15,090,180 |
| Colgate-Palmolive | 123,900 | | 13,443,150 |
| EOG Resources | 142,500 | | 16,760,850 |
| Fastenal | 210,000 | | 8,780,100 |
| Google, Cl. A | 19,800 | a | 13,827,726 |
| Intel | 677,900 | | 13,266,503 |
| Johnson & Johnson | 186,100 | | 12,976,753 |
| MasterCard, Cl. A | 30,300 | | 14,807,004 |
| Microsoft | 503,200 | | 13,395,184 |
| NIKE, Cl. B | 143,800 | | 14,017,624 |
10
| | | |
| Common Stocks (continued) | Shares | | Value ($) |
| United States (continued) | | | |
| Oracle | 447,400 | | 14,361,540 |
| Praxair | 128,600 | | 13,787,206 |
| Precision Castparts | 85,000 | | 15,588,150 |
| QUALCOMM | 245,600 | | 15,625,072 |
| Schlumberger | 203,700 | | 14,588,994 |
| Sigma-Aldrich | 166,400 | | 12,067,328 |
| The TJX Companies | 326,800 | | 14,490,312 |
| Wal-Mart Stores | 185,200 | | 13,338,104 |
| | | | 296,737,975 |
| Total Common Stocks | | | |
| (cost $596,112,303) | | | 727,965,046 |
| |
| Other Investment—2.1% | | | |
| Registered Investment Company; | | | |
| Dreyfus Institutional Preferred | | | |
| Plus Money Market Fund | | | |
| (cost $15,460,000) | 15,460,000 | b | 15,460,000 |
| Total Investments (cost $611,572,303) | 99.7 | % | 743,425,046 |
| Cash and Receivables (Net) | .3 | % | 2,326,446 |
| Net Assets | 100.0 | % | 745,751,492 |
| |
| ADR—American Depository Receipts |
| a | Non-income producing security. |
| b | Investment in affiliated money market mutual fund. |
| | | |
| Portfolio Summary (Unaudited)† | | |
| |
| | Value (%) | | Value (%) |
| Information Technology | 22.5 | Materials | 7.4 |
| Energy | 14.1 | Financial | 6.0 |
| Consumer Staples | 12.2 | Utilities | 3.1 |
| Consumer Discretionary | 11.6 | Money Market Investment | 2.1 |
| Health Care | 10.3 | Telecommunication Services | 1.9 |
| Industrial | 8.5 | | 99.7 |
|
| † Based on net assets. |
| See notes to financial statements. |
The Fund 11
STATEMENT OF ASSETS AND LIABILITIES
November 30, 2012
| | | | |
| | | Cost | Value | |
| Assets ($): | | | | |
| Investments in securities—See Statement of Investments: | | | |
| Unaffiliated issuers | | 596,112,303 | 727,965,046 | |
| Affiliated issuers | | 15,460,000 | 15,460,000 | |
| Cash | | | 79,536 | |
| Cash denominated in foreign currencies | | 193,915 | 192,624 | |
| Receivable for shares of Common Stock subscribed | | | 1,871,307 | |
| Dividends receivable | | | 1,526,335 | |
| Prepaid expenses | | | 59,241 | |
| | | | 747,154,089 | |
| Liabilities ($): | | | | |
| Due to The Dreyfus Corporation and affiliates—Note 3(c) | | 585,819 | |
| Payable for shares of Common Stock redeemed | | | 686,244 | |
| Accrued expenses | | | 130,534 | |
| | | | 1,402,597 | |
| Net Assets ($) | | | 745,751,492 | |
| Composition of Net Assets ($): | | | | |
| Paid-in capital | | | 612,211,513 | |
| Accumulated undistributed investment income—net | | | 6,631,320 | |
| Accumulated net realized gain (loss) on investments | | | (4,944,331 | ) |
| Accumulated net unrealized appreciation (depreciation) | | | |
| on investments and foreign currency transactions | | | 131,852,990 | |
| Net Assets ($) | | | 745,751,492 | |
| |
| |
| Net Asset Value Per Share | | | | |
| | Class A | Class C | Class I | |
| Net Assets ($) | 61,805,864 | 15,882,682 | 668,062,946 | |
| Shares Outstanding | 4,113,904 | 1,079,409 | 43,849,653 | |
| Net Asset Value Per Share ($) | 15.02 | 14.71 | 15.24 | |
| |
| See notes to financial statements. | | | | |
12
STATEMENT OF OPERATIONS
Year Ended November 30, 2012
| | |
| Investment Income ($): | | |
| Income: | | |
| Cash dividends (net of $681,823 foreign taxes withheld at source): | | |
| Unaffiliated issuers | 12,886,201 | |
| Affiliated issuers | 16,218 | |
| Total Income | 12,902,419 | |
| Expenses: | | |
| Management fee—Note 3(a) | 5,296,230 | |
| Shareholder servicing costs—Note 3(c) | 310,732 | |
| Custodian fees—Note 3(c) | 131,097 | |
| Distribution fees—Note 3(b) | 112,354 | |
| Professional fees | 94,742 | |
| Directors’ fees and expenses—Note 3(d) | 71,936 | |
| Registration fees | 52,958 | |
| Prospectus and shareholders’ reports | 25,123 | |
| Loan commitment fees—Note 2 | 5,743 | |
| Miscellaneous | 36,242 | |
| Total Expenses | 6,137,157 | |
| Less—reduction in fees due to earnings credits—Note 3(c) | (96 | ) |
| Net Expenses | 6,137,061 | |
| Investment Income—Net | 6,765,358 | |
| Realized and Unrealized Gain (Loss) on Investments—Note 4 ($): | | |
| Net realized gain (loss) on investments and foreign currency transactions | (1,759,796 | ) |
| Net realized gain (loss) on forward foreign currency exchange contracts | (46,299 | ) |
| Net Realized Gain (Loss) | (1,806,095 | ) |
| Net unrealized appreciation (depreciation) on | | |
| investments and foreign currency transactions | 73,505,019 | |
| Net unrealized appreciation (depreciation) on | | |
| forward foreign currency exchange contracts | 5,785 | |
| Net Unrealized Appreciation (Depreciation) | 73,510,804 | |
| Net Realized and Unrealized Gain (Loss) on Investments | 71,704,709 | |
| Net Increase in Net Assets Resulting from Operations | 78,470,067 | |
| |
| See notes to financial statements. | | |
The Fund 13
STATEMENT OF CHANGES IN NET ASSETS
| | | | |
| | Year Ended November 30, | |
| | 2012 | | 2011 | |
| Operations ($): | | | | |
| Investment income—net | 6,765,358 | | 5,368,888 | |
| Net realized gain (loss) on investments | (1,806,095 | ) | 1,843,441 | |
| Net unrealized appreciation | | | | |
| (depreciation) on investments | 73,510,804 | | 11,848,076 | |
| Net Increase (Decrease) in Net Assets | | | | |
| Resulting from Operations | 78,470,067 | | 19,060,405 | |
| Dividends to Shareholders from ($): | | | | |
| Investment income—net: | | | | |
| Class A Shares | (361,165 | ) | (217,775 | ) |
| Class C Shares | (5,282 | ) | (10,303 | ) |
| Class I Shares | (5,003,982 | ) | (2,828,840 | ) |
| Net realized gain on investments: | | | | |
| Class A Shares | (446,761 | ) | (121,894 | ) |
| Class C Shares | (130,675 | ) | (33,756 | ) |
| Class I Shares | (4,313,537 | ) | (1,159,738 | ) |
| Total Dividends | (10,261,402 | ) | (4,372,306 | ) |
| Capital Stock Transactions ($): | | | | |
| Net proceeds from shares sold: | | | | |
| Class A Shares | 25,765,348 | | 22,110,809 | |
| Class C Shares | 3,753,627 | | 6,607,448 | |
| Class I Shares | 281,322,507 | | 183,142,487 | |
| Dividends reinvested: | | | | |
| Class A Shares | 778,549 | | 326,342 | |
| Class C Shares | 91,613 | | 32,739 | |
| Class I Shares | 4,912,548 | | 1,452,989 | |
| Cost of shares redeemed: | | | | |
| Class A Shares | (19,549,231 | ) | (12,193,628 | ) |
| Class C Shares | (3,380,751 | ) | (3,247,869 | ) |
| Class I Shares | (151,541,785 | ) | (89,612,012 | ) |
| Increase (Decrease) in Net Assets | | | | |
| from Capital Stock Transactions | 142,152,425 | | 108,619,305 | |
| Total Increase (Decrease) in Net Assets | 210,361,090 | | 123,307,404 | |
| Net Assets ($): | | | | |
| Beginning of Period | 535,390,402 | | 412,082,998 | |
| End of Period | 745,751,492 | | 535,390,402 | |
| Undistributed investment income—net | 6,631,320 | | 5,364,574 | |
14
| | | | |
| | Year Ended November 30, | |
| | 2012 | | 2011 | |
| Capital Share Transactions: | | | | |
| Class A | | | | |
| Shares sold | 1,825,152 | | 1,631,287 | |
| Shares issued for dividends reinvested | 59,567 | | 24,013 | |
| Shares redeemed | (1,387,430 | ) | (898,291 | ) |
| Net Increase (Decrease) in Shares Outstanding | 497,289 | | 757,009 | |
| Class C | | | | |
| Shares sold | 270,088 | | 487,100 | |
| Shares issued for dividends reinvested | 7,107 | | 2,439 | |
| Shares redeemed | (245,232 | ) | (243,895 | ) |
| Net Increase (Decrease) in Shares Outstanding | 31,963 | | 245,644 | |
| Class I | | | | |
| Shares sold | 19,533,004 | | 13,282,493 | |
| Shares issued for dividends reinvested | 371,881 | | 105,749 | |
| Shares redeemed | (10,561,836 | ) | (6,619,481 | ) |
| Net Increase (Decrease) in Shares Outstanding | 9,343,049 | | 6,768,761 | |
| |
| See notes to financial statements. | | | | |
The Fund 15
FINANCIAL HIGHLIGHTS
The following tables describe the performance for each share class for the fiscal periods indicated.All information (except portfolio turnover rate) reflects financial results for a single fund share.Total return shows how much your investment in the fund would have increased (or decreased) during each period, assuming you had reinvested all dividends and distributions.These figures have been derived from the fund’s financial statements.
| | | | | | | | | | |
| | | | Year Ended November 30, | | | |
| Class A Shares | 2012 | | 2011 | | 2010 | | 2009 | | 2008 | |
| Per Share Data ($): | | | | | | | | | | |
| Net asset value, beginning of period | 13.51 | | 12.99 | | 12.23 | | 8.91 | | 13.73 | |
| Investment Operations: | | | | | | | | | | |
| Investment income—neta | .11 | | .11 | | .07 | | .06 | | .05 | |
| Net realized and unrealized | | | | | | | | | | |
| gain (loss) on investments | 1.62 | | .52 | | .75 | | 3.28 | | (4.70 | ) |
| Total from Investment Operations | 1.73 | | .63 | | .82 | | 3.34 | | (4.65 | ) |
| Distributions: | | | | | | | | | | |
| Dividends from investment income—net | (.10 | ) | (.07 | ) | (.06 | ) | (.02 | ) | (.08 | ) |
| Dividends from net realized | | | | | | | | | | |
| gain on investments | (.12 | ) | (.04 | ) | — | | — | | (.09 | ) |
| Total Distributions | (.22 | ) | (.11 | ) | (.06 | ) | (.02 | ) | (.17 | ) |
| Net asset value, end of period | 15.02 | | 13.51 | | 12.99 | | 12.23 | | 8.91 | |
| Total Return (%)b | 13.08 | | 4.86 | | 6.70 | | 37.57 | | (34.32 | ) |
| Ratios/Supplemental Data (%): | | | | | | | | | | |
| Ratio of total expenses | | | | | | | | | | |
| to average net assets | 1.28 | | 1.27 | | 1.32 | | 1.38 | | 1.59 | |
| Ratio of net expenses | | | | | | | | | | |
| to average net assets | 1.28 | | 1.27 | | 1.32 | | 1.38 | | 1.47 | |
| Ratio of net investment income | | | | | | | | | | |
| to average net assets | .80 | | .80 | | .56 | | .53 | | .44 | |
| Portfolio Turnover Rate | 6.05 | | 8.54 | | 7.50 | | 12.75 | | 15.54 | |
| Net Assets, end of period ($ x 1,000) | 61,806 | | 48,872 | | 37,152 | | 8,212 | | 3,329 | |
| |
| a | Based on average shares outstanding at each month end. |
| b | Exclusive of sales charge. |
See notes to financial statements.
16
| | | | | | | | | | |
| | | | Year Ended November 30, | | | |
| Class C Shares | 2012 | | 2011 | | 2010 | | 2009 | | 2008 | |
| Per Share Data ($): | | | | | | | | | | |
| Net asset value, beginning of period | 13.24 | | 12.78 | | 12.07 | | 8.83 | | 13.64 | |
| Investment Operations: | | | | | | | | | | |
| Investment income (loss)—neta | .01 | | .01 | | (.02 | ) | (.01 | ) | (.04 | ) |
| Net realized and unrealized | | | | | | | | | | |
| gain (loss) on investments | 1.59 | | .50 | | .73 | | 3.25 | | (4.68 | ) |
| Total from Investment Operations | 1.60 | | .51 | | .71 | | 3.24 | | (4.72 | ) |
| Distributions: | | | | | | | | | | |
| Dividends from investment income—net | (.01 | ) | (.01 | ) | (.00 | )b | — | | — | |
| Dividends from net realized | | | | | | | | | | |
| gain on investments | (.12 | ) | (.04 | ) | — | | — | | (.09 | ) |
| Total Distributions | (.13 | ) | (.05 | ) | (.00 | )b | — | | (.09 | ) |
| Net asset value, end of period | 14.71 | | 13.24 | | 12.78 | | 12.07 | | 8.83 | |
| Total Return (%)c | 12.21 | | 4.01 | | 5.90 | | 36.69 | | (34.82 | ) |
| Ratios/Supplemental Data (%): | | | | | | | | | | |
| Ratio of total expenses | | | | | | | | | | |
| to average net assets | 2.05 | | 2.03 | | 2.09 | | 2.12 | | 2.36 | |
| Ratio of net expenses | | | | | | | | | | |
| to average net assets | 2.05 | | 2.03 | | 2.09 | | 2.09 | | 2.22 | |
| Ratio of net investment income | | | | | | | | | | |
| (loss) to average net assets | .05 | | .05 | | (.17 | ) | (.11 | ) | (.29 | ) |
| Portfolio Turnover Rate | 6.05 | | 8.54 | | 7.50 | | 12.75 | | 15.54 | |
| Net Assets, end of period ($ x 1,000) | 15,883 | | 13,872 | | 10,243 | | 1,873 | | 695 | |
| |
| a | Based on average shares outstanding at each month end. |
| b | Amount represents less than $.01 per share. |
| c | Exclusive of sales charge. |
See notes to financial statements.
The Fund 17
FINANCIAL HIGHLIGHTS (continued)
| | | | | | | | | | |
| | | | Year Ended November 30, | | | |
| Class I Shares | 2012 | | 2011 | | 2010 | | 2009 | | 2008 | |
| Per Share Data ($): | | | | | | | | | | |
| Net asset value, beginning of period | 13.70 | | 13.15 | | 12.36 | | 8.99 | | 13.76 | |
| Investment Operations: | | | | | | | | | | |
| Investment income—neta | .16 | | .16 | | .12 | | .11 | | .10 | |
| Net realized and unrealized | | | | | | | | | | |
| gain (loss) on investments | 1.64 | | .53 | | .76 | | 3.31 | | (4.76 | ) |
| Total from Investment Operations | 1.80 | | .69 | | .88 | | 3.42 | | (4.66 | ) |
| Distributions: | | | | | | | | | | |
| Dividends from investment income—net | (.14 | ) | (.10 | ) | (.09 | ) | (.05 | ) | (.02 | ) |
| Dividends from net realized | | | | | | | | | | |
| gain on investments | (.12 | ) | (.04 | ) | — | | — | | (.09 | ) |
| Total Distributions | (.26 | ) | (.14 | ) | (.09 | ) | (.05 | ) | (.11 | ) |
| Net asset value, end of period | 15.24 | | 13.70 | | 13.15 | | 12.36 | | 8.99 | |
| Total Return (%) | 13.49 | | 5.23 | | 7.12 | | 38.22 | | (34.12 | ) |
| Ratios/Supplemental Data (%): | | | | | | | | | | |
| Ratio of total expenses | | | | | | | | | | |
| to average net assets | .93 | | .93 | | .96 | | .99 | | 1.17 | |
| Ratio of net expenses | | | | | | | | | | |
| to average net assets | .93 | | .93 | | .96 | | .99 | | 1.15 | |
| Ratio of net investment income | | | | | | | | | | |
| to average net assets | 1.14 | | 1.13 | | .94 | | 1.05 | | .83 | |
| Portfolio Turnover Rate | 6.05 | | 8.54 | | 7.50 | | 12.75 | | 15.54 | |
| Net Assets, end of period ($ x 1,000) | 668,063 | | 472,646 | | 364,688 | | 263,694 | | 72,656 | |
| a Based on average shares outstanding at each month end. | | | | | | | | | |
| See notes to financial statements. | | | | | | | | | | |
18
NOTES TO FINANCIAL STATEMENTS
NOTE 1—Significant Accounting Policies:
Global Stock Fund (the “fund”) is a separate diversified series of Strategic Funds, Inc. (the “Company”), which is registered under the Investment Company Act of 1940, as amended (the “Act”), as an open-end management investment company and operates as a series company currently offering nine series, including the fund.The fund’s investment objective is to seek long-term total return. The Dreyfus Corporation (the “Manager” or “Dreyfus”), a wholly-owned subsidiary of The Bank of New York Mellon Corporation (“BNY Mellon”), serves as the fund’s investment adviser. Walter Scott & Partners Limited (“Walter Scott”), a subsidiary of BNY Mellon and an affiliate of Dreyfus, serves as the fund’s sub-investment adviser.
MBSC Securities Corporation (the “Distributor”), a wholly-owned subsidiary of Dreyfus, is the distributor of the fund’s shares.The fund is authorized to issue 100 million shares of $.001 par value Common Stock in each of the following classes of shares: Class A, Class C and Class I. Class A shares are subject to a sales charge imposed at the time of purchase. Class C shares are subject to a contingent deferred sales charge (“CDSC”) on Class C shares redeemed within one year of purchase. Class I shares are sold at net asset value per share only to institutional investors. Other differences between the classes include the services offered to and the expenses borne by each class, the allocation of certain transfer agency costs and certain voting rights. Income, expenses (other than expenses attributable to a specific class), and realized and unrealized gains or losses on investments are allocated to each class of shares based on its relative net assets.
The Fund 19
NOTES TO FINANCIAL STATEMENTS (continued)
The Company accounts separately for the assets, liabilities and operations of each series. Expenses directly attributable to each series are charged to that series’ operations; expenses which are applicable to all series are allocated among them on a pro rata basis.
The Financial Accounting Standards Board (“FASB”) Accounting Standards Codification is the exclusive reference of authoritative U.S. generally accepted accounting principles (“GAAP”) recognized by the FASB to be applied by nongovernmental entities. Rules and interpretive releases of the Securities and Exchange Commission (“SEC”) under authority of federal laws are also sources of authoritative GAAP for SEC registrants. The fund’s financial statements are prepared in accordance with GAAP, which may require the use of management estimates and assumptions.Actual results could differ from those estimates.
The Company enters into contracts that contain a variety of indemnifications.The fund’s maximum exposure under these arrangements is unknown.The fund does not anticipate recognizing any loss related to these arrangements.
(a) Portfolio valuation: The fair value of a financial instrument is the amount that would be received to sell an asset or paid to transfer a liability in an orderly transaction between market participants at the measurement date (i.e., the exit price). GAAP establishes a fair value hierarchy that prioritizes the inputs of valuation techniques used to measure fair value.This hierarchy gives the highest priority to unadjusted quoted prices in active markets for identical assets or liabilities (Level 1 measurements) and the lowest priority to unobservable inputs (Level 3 measurements).
Additionally, GAAP provides guidance on determining whether the volume and activity in a market has decreased significantly and whether such a decrease in activity results in transactions that are not orderly. GAAP requires enhanced disclosures around valuation inputs and techniques used during annual and interim periods.
20
Various inputs are used in determining the value of the fund’s investments relating to fair value measurements.These inputs are summarized in the three broad levels listed below:
Level 1—unadjusted quoted prices in active markets for identical investments.
Level 2—other significant observable inputs (including quoted prices for similar investments, interest rates, prepayment speeds, credit risk, etc.).
Level 3—significant unobservable inputs (including the fund’s own assumptions in determining the fair value of investments).
The inputs or methodology used for valuing securities are not necessarily an indication of the risk associated with investing in those securities.
Changes in valuation techniques may result in transfers in or out of an assigned level within the disclosure hierarchy. Valuation techniques used to value the fund’s investments are as follows:
Investments in securities are valued at the last sales price on the securities exchange or national securities market on which such securities are primarily traded. Securities listed on the National Market System for which market quotations are available are valued at the official closing price or, if there is no official closing price that day, at the last sales price. Securities not listed on an exchange or the national securities market, or securities for which there were no transactions, are valued at the average of the most recent bid and asked prices, except for open short positions, where the asked price is used for valuation purposes. Bid price is used when no asked price is available. Registered investment companies that are not traded on an exchange are valued at their net asset value. All of the preceding securities are categorized within Level 1 of the fair value hierarchy.
The Fund 21
NOTES TO FINANCIAL STATEMENTS (continued)
Fair valuing of securities may be determined with the assistance of a pricing service using calculations based on indices of domestic securities and other appropriate indicators, such as prices of relevant ADRs and financial futures. Utilizing these techniques may result in transfers between Level 1 and Level 2 of the fair value hierarchy.
When market quotations or official closing prices are not readily available, or are determined not to reflect accurately fair value, such as when the value of a security has been significantly affected by events after the close of the exchange or market on which the security is principally traded (for example, a foreign exchange or market), but before the fund calculates its net asset value, the fund may value these investments at fair value as determined in accordance with the procedures approved by the Company’s Board of Directors (the “Board”). Certain factors may be considered when fair valuing investments such as: fundamental analytical data, the nature and duration of restrictions on disposition, an evaluation of the forces that influence the market in which the securities are purchased and sold, and public trading in similar securities of the issuer or comparable issuers.These securities are either categorized within Level 2 or 3 depending on the relevant inputs used.
For restricted securities where observable inputs are limited, assumptions about market activity and risk are used and are categorized within Level 3 of the fair value hierarchy.
Investments denominated in foreign currencies are translated to U.S. dollars at the prevailing rates of exchange.
Forward foreign currency exchange contracts (“forward contracts”) are valued at the forward rate. These securities are generally categorized within Level 2 of the fair value hierarchy.
22
The following is a summary of the inputs used as of November 30, 2012 in valuing the fund’s investments:
| | | | |
| | | Level 2—Other | Level 3— | |
| | Level 1— | Significant | Significant | |
| | Unadjusted | Observable | Unobservable | |
| | Quoted Prices | Inputs | Inputs | Total |
| Assets ($) | | | | |
| Investments in Securities: | | | |
| Equity Securities— | | | | |
| Domestic | | | | |
| Common Stocks† | 296,737,975 | — | — | 296,737,975 |
| Equity Securities— | | | | |
| Foreign | | | | |
| Common Stocks† | 431,227,071 | — | — | 431,227,071 |
| Mutual Funds | 15,460,000 | — | — | 15,460,000 |
| |
| † See Statement of Investments for additional detailed categorizations. | |
At November 30, 2011, $149,495,704 of exchange traded foreign equity securities were classified within Level 2 of the fair value hierarchy pursuant to the fund’s fair valuation procedures.
(b) Foreign currency transactions: The fund does not isolate that portion of the results of operations resulting from changes in foreign exchange rates on investments from the fluctuations arising from changes in the market prices of securities held. Such fluctuations are included with the net realized and unrealized gain or loss on investments.
Net realized foreign exchange gains or losses arise from sales of foreign currencies, currency gains or losses realized on securities transactions between trade and settlement date, and the difference between the amounts of dividends, interest and foreign withholding taxes recorded on the fund’s books and the U.S. dollar equivalent of the amounts
The Fund 23
NOTES TO FINANCIAL STATEMENTS (continued)
actually received or paid. Net unrealized foreign exchange gains and losses arise from changes in the value of assets and liabilities other than investments resulting from changes in exchange rates. Foreign currency gains and losses on investments are also included with net realized and unrealized gain or loss on investments.
(c) Securities transactions and investment income: Securities transactions are recorded on a trade date basis. Realized gains and losses from securities transactions are recorded on the identified cost basis. Dividend income is recognized on the ex-dividend date and interest income, including, where applicable, accretion of discount and amortization of premium on investments, is recognized on the accrual basis.
(d) Affiliated issuers: Investments in other investment companies advised by Dreyfus are defined as “affiliated” in the Act. Investments in affiliated investment companies for the period ended November 30, 2012 were as follows:
| | | | | |
| Affiliated | | | | | |
| Investment | Value | | | Value | Net |
| Company | 11/30/2011($) | Purchases ($) | Sales ($) | 11/30/2012 ($) | Assets (%) |
| Dreyfus | | | | | |
| Institutional | | | | | |
| Preferred | | | | | |
| Plus Money | | | | | |
| Market | | | | | |
| Fund | 9,200,000 | 249,925,000 | 243,665,000 | 15,460,000 | 2.1 |
(e) Risk: Investing in foreign markets may involve special risks and considerations not typically associated with investing in the U.S.These risks include revaluation of currencies, high rates of inflation, repatriation restrictions on income and capital, and adverse political and economic developments. Moreover, securities issued in these markets may be less liquid, subject to government ownership controls and delayed settlements, and their prices may be more volatile than those of comparable securities in the U.S.
(f) Dividends to shareholders: Dividends are recorded on the ex-dividend date. Dividends from investment income-net and dividends from net realized capital gains, if any, are normally declared and paid annually,
24
but the fund may make distributions on a more frequent basis to comply with the distribution requirements of the Internal Revenue Code of 1986, as amended (the “Code”). To the extent that net realized capital gains can be offset by capital loss carryovers, it is the policy of the fund not to distribute such gains. Income and capital gain distributions are determined in accordance with income tax regulations, which may differ from GAAP.
(g) Federal income taxes: It is the policy of the fund to continue to qualify as a regulated investment company, if such qualification is in the best interests of its shareholders, by complying with the applicable provisions of the Code, and to make distributions of taxable income sufficient to relieve it from substantially all federal income and excise taxes.
As of and during the period ended November 30, 2012, the fund did not have any liabilities for any uncertain tax positions.The fund recognizes interest and penalties, if any, related to uncertain tax positions as income tax expense in the Statement of Operations. During the period, the fund did not incur any interest or penalties.
Each of the tax years in the four-year period ended November 30, 2012 remains subject to examination by the Internal Revenue Service and state taxing authorities.
At November 30, 2012, the components of accumulated earnings on a tax basis were as follows: undistributed ordinary income $6,631,320, accumulated capital losses $4,741,012 and unrealized appreciation $131,649,671.
Under the Regulated Investment Company Modernization Act of 2010 (the “2010 Act”), the fund is permitted to carry forward capital losses incurred in taxable years beginning after December 22, 2010 (“post-enactment losses”) for an unlimited period. Furthermore, post-enactment capital loss carryovers retain their character as either short-term or long-term capital losses rather than short-term as they were under previous statute.
The Fund 25
NOTES TO FINANCIAL STATEMENTS (continued)
The accumulated capital loss carryover is available for federal income tax purposes to be applied against future net realized capital gains, if any, realized subsequent to November 30, 2012.The fund has $239,900 of post-enactment short-term capital losses and $4,501,112 of post-enactment long-term capital losses which can be carried forward for an unlimited period.
The tax character of distributions paid to shareholders during the fiscal periods ended November 30, 2012 and November 30, 2011 were as follows: ordinary income $7,714,574 and $3,941,459 and long-term capital gains $2,546,828 and $430,847, respectively.
During the period ended November 30, 2012, as a result of permanent book to tax differences, primarily due to the tax treatment for foreign currency gains and losses and dividend reclassification, the fund decreased accumulated undistributed investment income-net by $128,183 and increased accumulated net realized gain (loss) on investments by the same amount. Net assets and net asset value per share were not affected by this reclassification.
(h) New Accounting Pronouncement: In December 2011, FASB issued Accounting Standards Update No. 2011-11 “Disclosures about Offsetting Assets and Liabilities” (“ASU 2011-11”). These disclosure requirements are intended to help investors and other financial statement users to better assess the effect or potential effect of offsetting arrangements on a company’s financial position. They also improve transparency in the reporting of how companies mitigate credit risk, including disclosure of related collateral pledged or received. In addition, ASU 2011-11 facilitates comparison between those entities that prepare their financial statements on the basis of GAAP and those entities that prepare their financial statements on the basis of International Financial Reporting Standards (“IFRS”).ASU 2011-11 requires entities to: disclose both gross and net information about both instruments and transactions eligible for offset in the financial statements; and disclose instruments and transactions subject to an agreement similar to a
26
master netting agreement. ASU 2011-11 is effective for fiscal years beginning on or after January 1, 2013, and interim periods within those annual periods.At this time, management is evaluating the implications of ASU 2011-11 and its impact on the fund’s financial statement disclosures.
NOTE 2—Bank Lines of Credit:
The fund participates with other Dreyfus-managed funds in a $210 million unsecured credit facility led by Citibank, N.A. and a $300 million unsecured credit facility provided by The Bank of New York Mellon, a subsidiary of BNY Mellon and an affiliate of Dreyfus (each, a “Facility”), each to be utilized primarily for temporary or emergency purposes, including the financing of redemptions. Prior to October 10, 2012, the unsecured credit facility with Citibank, N.A., was $225 million. In connection therewith, the fund has agreed to pay its pro rata portion of commitment fees for each Facility. Interest is charged to the fund based on rates determined pursuant to the terms of the respective Facility at the time of borrowing. During the period ended November 30, 2012, the fund did not borrow under the Facilities.
NOTE 3—Management Fee, Sub-Investment Advisory Fee and Other Transactions With Affiliates:
(a) Pursuant to a management agreement with Dreyfus, the management fee is computed at the annual rate of .85% of the value of the fund’s average daily net assets and is payable monthly. Dreyfus had contractually agreed, from December 1, 2011 through April 1, 2012, to waive receipt of its fees and/or assume the expenses of the fund so that the direct expenses of none of the classes (excluding Rule 12b-1 Distribution Plan fees, Shareholder Services Plan fees, taxes, interest expense, brokerage commissions, commitment fees on borrowings and extraordinary expenses) exceed an annual rate of 1.25% of the value of the fund’s average daily net assets. During the period ended November 30, 2012, there was no reduction in expenses pursuant to the undertaking.
The Fund 27
NOTES TO FINANCIAL STATEMENTS (continued)
Pursuant to a sub-investment advisory agreement between Dreyfus and Walter Scott, Dreyfus pays Walter Scott a monthly fee at an annual percentage of the value of the fund’s average daily net assets.
During the period ended November 30, 2012, the Distributor retained $7,896 from commissions earned on sales of the fund’s Class A shares and $1,769 from CDSCs on redemptions of the fund’s Class C shares.
(b) Under the Distribution Plan adopted pursuant to Rule 12b-1 under the Act, Class C shares pay the Distributor for distributing its shares at an annual rate of .75% of the value of the average daily net assets of Class C shares. During the period ended November 30, 2012, Class C shares were charged $112,354, pursuant to the Distribution Plan.
(c) Under the Shareholder Services Plan, Class A and Class C shares pay the Distributor at an annual rate of .25% of the value of their average daily net assets for the provision of certain services.The services provided may include personal services relating to shareholder accounts, such as answering shareholder inquiries regarding the fund and providing reports and other information, and services related to the maintenance of shareholder accounts.The Distributor may make payments to Service Agents (securities dealers, financial institutions or other industry professionals) with respect to these services. The Distributor determines the amounts to be paid to Service Agents. During the period ended November 30, 2012, Class A and Class C shares were charged $138,672 and $37,451, respectively, pursuant to the Shareholder Services Plan.
The fund has arrangements with the transfer agent and the custodian whereby the fund may receive earnings credits when positive cash balances are maintained, which are used to offset transfer agency and custody fees. For financial reporting purposes, the fund includes net earnings credits as an expense offset in the Statement of Operations.
The fund compensates Dreyfus Transfer, Inc., a wholly-owned subsidiary of Dreyfus, under a transfer agency agreement for providing
28
transfer agency services for the fund and, since May 29, 2012, cash management services related to fund subscriptions and redemptions. During the period ended November 30, 2012, the fund was charged $14,737 for transfer agency services and $483 for cash management services. Cash management fees were partially offset by earnings credits of $61. These fees are included in Shareholder servicing costs in the Statement of Operations.
The fund compensates The Bank of New York Mellon under a custody agreement for providing custodial services for the fund. During the period ended November 30, 2012, the fund was charged $131,097 pursuant to the custody agreement.
Prior to May 29, 2012, the fund compensated The Bank of NewYork Mellon under a cash management agreement for performing cash management services related to fund subscriptions and redemptions. During the period ended November 30, 2012, the fund was charged $951 pursuant to the cash management agreement, which is included in Shareholder servicing costs in the Statement of Operations. These fees were partially offset by earnings credits of $35.
During the period ended November 30, 2012, the fund was charged $8,650 for services performed by the Chief Compliance Officer and his staff.
The components of “Due to The Dreyfus Corporation and affiliates” in the Statement of Assets and Liabilities consist of: management fees $505,933, Distribution Plan fees $9,522, Shareholder Services Plan fees $15,662, custodian fees $48,174, Chief Compliance Officer fees $3,318 and transfer agency fees $3,210.
(d) Each Board member also serves as a Board member of other funds within the Dreyfus complex. Annual retainer fees and attendance fees are allocated to each fund based on net assets.
The Fund 29
NOTES TO FINANCIAL STATEMENTS (continued)
NOTE 4—Securities Transactions:
The aggregate amount of purchases and sales of investment securities, excluding short-term securities and forward contracts, during the period ended November 30, 2012, amounted to $175,508,359 and $36,785,202, respectively.
Derivatives: A derivative is a financial instrument whose performance is derived from the performance of another asset. Each type of derivative instrument that was held by the fund during the period ended November 30, 2012 is discussed below.
Forward Foreign Currency Exchange Contracts: The fund enters into forward contracts in order to hedge its exposure to changes in foreign currency exchange rates on its foreign portfolio holdings, to settle foreign currency transactions or as a part of its investment strategy. When executing forward contracts, the fund is obligated to buy or sell a foreign currency at a specified rate on a certain date in the future. With respect to sales of forward contracts, the fund incurs a loss if the value of the contract increases between the date the forward contract is opened and the date the forward contract is closed.The fund realizes a gain if the value of the contract decreases between those dates.With respect to purchases of forward contracts, the fund incurs a loss if the value of the contract decreases between the date the forward contract is opened and the date the forward contract is closed.The fund realizes a gain if the value of the contract increases between those dates. Any realized or unrealized gains or losses which occurred during the period are reflected in the Statement of Operations. The fund is exposed to foreign currency risk as a result of changes in value of underlying financial instruments.The fund is also exposed to credit risk associated with counterparty nonperformance on these forward contracts, which is typically limited to the unrealized gain on each open contract. At November 30, 2012, there were no forward contracts outstanding.
30
The following summarizes the average market value of derivatives outstanding during the period ended November 30, 2012:
| |
| | Average Market Value ($) |
| Forward contracts | 2,065,324 |
At November 30, 2012, the cost of investments for federal income tax purposes was $611,775,622; accordingly, accumulated net unrealized appreciation on investments was $131,649,424, consisting of $142,721,526 gross unrealized appreciation and $11,072,102 gross unrealized depreciation.
The Fund 31
REPORT OF INDEPENDENT REGISTERED
PUBLIC ACCOUNTING FIRM
Shareholders and Board of Directors
Global Stock Fund
We have audited the accompanying statement of assets and liabilities, including the statement of investments, of Global Stock Fund (one of the series comprising Strategic Funds, Inc.) as of November 30, 2012, and the related statement of operations for the year then ended, the statement of changes in net assets for each of the two years in the period then ended, and the financial highlights for each of the five years in the period then ended.These financial statements and financial highlights are the responsibility of the Fund’s management. Our responsibility is to express an opinion on these financial statements and financial highlights based on our audits.
We conducted our audits in accordance with the standards of the Public Company Accounting Oversight Board (United States).Those standards require that we plan and perform the audit to obtain reasonable assurance about whether the financial statements and financial highlights are free of material misstatement.We were not engaged to perform an audit of the Fund’s internal control over financial reporting. Our audits included consideration of internal control over financial reporting as a basis for designing audit procedures that are appropriate in the circumstances, but not for the purpose of expressing an opinion on the effectiveness of the Fund’s internal control over financial reporting. Accordingly, we express no such opinion. An audit also includes examining, on a test basis, evidence supporting the amounts and disclosures in the financial statements and financial highlights, assessing the accounting principles used and significant estimates made by management, and evaluating the overall financial statement presentation. Our procedures included confirmation of securities owned as of November 30, 2012 by correspondence with the custodian and others.We believe that our audits provide a reasonable basis for our opinion.
In our opinion, the financial statements and financial highlights referred to above present fairly, in all material respects, the financial position of Global Stock Fund at November 30, 2012, the results of its operations for the year then ended, the changes in its net assets for each of the two years in the period then ended, and the financial highlights for each of the five years in the period then ended, in conformity with U.S. generally accepted accounting principles.

NewYork, NewYork
January 28, 2013
32
IMPORTANT TAX INFORMATION (Unaudited)
In accordance with federal tax law, the fund elects to provide each shareholder with their portion of the fund’s foreign taxes paid and the income sourced from foreign countries. Accordingly, the fund hereby reports the following information regarding its fiscal year ended November 30, 2012:
—the total amount of taxes paid to foreign countries was $609,280
—the total amount of income sourced from foreign countries was $9,514,444.
Where required by federal tax law rules, shareholders will receive notification of their proportionate share of foreign taxes paid and foreign sourced income for the 2012 calendar year with Form 1099-DIV which will be mailed in early 2013.
For the fiscal year ended November 30, 2012, certain dividends paid by the fund may be subject to a maximum tax rate of 15%, as provided for by the Jobs and Growth Tax Relief Reconciliation Act of 2003. Of the distributions paid during the fiscal year, $7,714,574 represents the maximum amount that may be considered qualified dividend income. Also, the fund hereby reports $.0592 per share as a short-term capital gain distribution paid and also reports $.0645 per share as a long-term capital gain distribution paid on December 30, 2011.
The Fund 33
INFORMATION ABOUT THE RENEWAL OF THE
FUND’S MANAGEMENT AND SUB-INVESTMENT
ADVISORY AGREEMENTS (Unaudited)
At a meeting of the fund’s Board of Directors held on November 5-6, 2012, the Board considered the renewal of the fund’s Management Agreement, pursuant to which Dreyfus provides the fund with investment advisory and administrative services (the “Agreement”), and the Sub-Investment Advisory Agreement (together, the “Agreements”), between Dreyfus and Walter Scott & Partners Limited (the “Sub-Adviser”), pursuant to which the Sub-Adviser provides day-to-day management of the fund’s investments. The Board members, none of whom are “interested persons” (as defined in the Investment Company Act of 1940, as amended) of the fund, were assisted in their review by independent legal counsel and met with counsel in executive session separate from representatives of Dreyfus and the Sub-Adviser. In considering the renewal of the Agreements, the Board considered all factors that it believed to be relevant, including those discussed below. The Board did not identify any one factor as dispositive, and each Board member may have attributed different weights to the factors considered.
Analysis of Nature, Extent, and Quality of Services Provided to the Fund.The Board considered information previously provided to them in presentations from Dreyfus representatives regarding the nature, extent, and quality of the services provided to funds in the Dreyfus fund complex, and Dreyfus representatives confirmed that there had been no material changes in this information. Dreyfus provided the number of open accounts in the fund, the fund’s asset size and the allocation of fund assets among distribution channels. Dreyfus also had previously provided information regarding the diverse intermediary relationships and distribution channels of funds in the Dreyfus fund complex (such as retail direct or intermediary, in which intermediaries typically are paid by the fund and/or Dreyfus) and Dreyfus’ corresponding need for broad, deep, and diverse resources to be able to provide ongoing shareholder services to each intermediary or distribution channel, as applicable to the fund.
The Board also considered research support available to, and portfolio management capabilities of, the fund’s portfolio management personnel and that Dreyfus also provides oversight of day-to-day fund operations, including fund accounting and administration and assistance in meeting
34
legal and regulatory requirements.The Board also considered Dreyfus’ extensive administrative, accounting, and compliance infrastructures, as well as Dreyfus’ supervisory activities over the Sub-Adviser.The Board also considered portfolio management’s brokerage policies and practices (including policies and practices regarding soft dollars) and the standards applied in seeking best execution.
Comparative Analysis of the Fund’s Performance and Management Fee and Expense Ratio.The Board reviewed reports prepared by Lipper, Inc. (“Lipper”), an independent provider of investment company data, which included information comparing (1) the fund’s performance with the performance of a group of comparable funds (the “Performance Group”) and with a broader group of funds (the “Performance Universe”), all for various periods ended September 30, 2012, and (2) the fund’s actual and contractual management fees and total expenses with those of a group of comparable funds (the “Expense Group”) and with a broader group of funds (the “Expense Universe”), the information for which was derived in part from fund financial statements available to Lipper as of the date of its analysis. Dreyfus previously had furnished the Board with a description of the methodology Lipper used to select the Performance Group and Performance Universe and the Expense Group and Expense Universe.
Dreyfus representatives stated that the usefulness of performance comparisons may be affected by a number of factors, including different investment limitations that may be applicable to the fund and comparison funds.The Board discussed the results of the comparisons and noted that the fund’s total return performance was below the Performance Group and Performance Universe medians for the one-year period and above the Performance Group and Performance Universe medians for each other time period. Dreyfus also provided a comparison of the fund’s calendar year returns to the fund’s benchmark index and noted that the fund’s returns were higher in four years and lower in one year than those of the benchmark index.
The Fund 35
INFORMATION ABOUT THE RENEWAL OF THE FUND’S MANAGEMENT AND
SUB-INVESTMENT ADVISORY AGREEMENTS (Unaudited) (continued)
The Board also reviewed the range of actual and contractual management fees and total expenses of the Expense Group and Expense Universe funds and discussed the results of the comparisons.The Board noted that the fund’s contractual management fee was below the Expense Group median, the fund’s actual management fee was below the Expense Group median and at the Expense Universe median, and the fund’s total expenses were below the Expense Group median and the Expense Universe median.
Dreyfus representatives reviewed with the Board the management or investment advisory fees (1) paid by funds advised or administered by Dreyfus that are in the same Lipper category as the fund and (2) paid to Dreyfus or the Sub-Adviser or its affiliates for advising any separate accounts and/or other types of client portfolios that are considered to have similar investment strategies and policies as the fund (the “Similar Clients”), and explained the nature of the Similar Clients.They discussed differences in fees paid and the relationship of the fees paid in light of any differences in the services provided and other relevant factors.The Board considered the relevance of the fee information provided for the Similar Clients to evaluate the appropriateness and reasonableness of the fund’s management fee.
The Board considered the fee to the Sub-Adviser in relation to the fee paid to Dreyfus by the fund and the respective services provided by the Sub-Adviser and Dreyfus.The Board also noted the Sub-Adviser’s fee is paid by Dreyfus (out of its fee from the fund) and not the fund.
Analysis of Profitability and Economies of Scale. Dreyfus representatives reviewed the expenses allocated and profit received by Dreyfus and the resulting profitability percentage for managing the fund and the aggregate profitability percentage to Dreyfus of managing the funds in the Dreyfus fund complex, and the method used to determine the expenses and profit. The Board concluded that the profitability results were not unreasonable, given the services rendered and service levels provided by Dreyfus. The Board also had been provided with information prepared by an independent consulting firm regarding
36
Dreyfus’ approach to allocating costs to, and determining the profitability of, individual funds and the entire Dreyfus fund complex.The consulting firm also had analyzed where any economies of scale might emerge in connection with the management of a fund.
The Board’s counsel stated that the Board should consider the profitability analysis (1) as part of the evaluation of whether the fees under the Agreements bear a reasonable relationship to the mix of services provided by Dreyfus and the Sub-Adviser, including the nature, extent and quality of such services, and (2) in light of the relevant circumstances for the fund and the extent to which economies of scale would be realized if the fund grows and whether fee levels reflect these economies of scale for the benefit of fund shareholders. Since Dreyfus, and not the fund, pays the Sub-Adviser pursuant to the Sub-Investment Advisory Agreement, the Board did not consider the Sub-Adviser’s profitability to be relevant to its deliberations. Dreyfus representatives also noted that, as a result of shared and allocated costs among funds in the Dreyfus fund complex, the extent of economies of scale could depend substantially on the level of assets in the complex as a whole, so that increases and decreases in complex-wide assets can affect potential economies of scale in a manner that is disproportionate to, or even in the opposite direction from, changes in the fund’s asset level.The Board also considered potential benefits to Dreyfus and the Sub-Adviser from acting as investment adviser and sub-investment adviser, respectively, and noted the soft dollar arrangements in effect for trading the fund’s investments.
At the conclusion of these discussions, the Board agreed that it had been furnished with sufficient information to make an informed business decision with respect to the renewal of the Agreements. Based on the discussions and considerations as described above, the Board concluded and determined as follows.
The Fund 37
INFORMATION ABOUT THE RENEWAL OF THE FUND’S MANAGEMENT AND
SUB-INVESTMENT ADVISORY AGREEMENTS (Unaudited) (continued)
The Board was satisfied with the fund’s performance, in light of the considerations described above.
The Board concluded that the fees paid to Dreyfus and the Sub- Adviser were reasonable in light of the considerations described above.
The Board determined that the economies of scale which may accrue to Dreyfus and its affiliates in connection with the management of the fund had been adequately considered by Dreyfus in connection with the fee rate charged to the fund pursuant to the Agreement and that, to the extent in the future it were determined that material economies of scale had not been shared with the fund, the Board would seek to have those economies of scale shared with the fund.
In evaluating the Agreements, the Board considered these conclusions and determinations and also relied on its previous knowledge, gained through meetings and other interactions with Dreyfus and its affiliates and the Sub-Adviser, of the fund and the services provided to the fund by Dreyfus and the Sub-Adviser.The Board also relied on information received on a routine and regular basis throughout the year relating to the operations of the fund and the investment management and other services provided under the Agreements, including information on the investment performance of the fund in comparison to similar mutual funds and benchmark performance indices; general market outlook as applicable to the fund; and compliance reports. In addition, it should be noted that the Board’s consideration of the contractual fee arrangements for this fund had the benefit of a number of years of reviews of prior or similar agreements during which lengthy discussions took place between the Board and Dreyfus representatives. Certain aspects of the arrangements may receive greater scrutiny in some years than in others, and the Board’s conclusions may be based, in part, on their consideration of the same or similar arrangements in prior years.The Board determined that renewal of the Agreements for the ensuing year was in the best interests of the fund and its shareholders.
38
BOARD MEMBERS INFORMATION (Unaudited)
|
| Joseph S. DiMartino (69) |
| Chairman of the Board (1995) |
| Principal Occupation During Past 5Years: |
| • Corporate Director and Trustee |
| Other Public Company Board Memberships During Past 5Years: |
| • CBIZ (formerly, Century Business Services, Inc.), a provider of outsourcing functions for small |
| and medium size companies, Director (1997-present) |
| • Sunair Services Corporation, a provider of certain outdoor-related services to homes and |
| businesses, Director (2005-2009) |
| • The Newark Group, a provider of a national market of paper recovery facilities, paperboard |
| mills and paperboard converting plants, Director (2000-2010) |
| No. of Portfolios for which Board Member Serves: 157 |
| ——————— |
| William Hodding Carter III (77) |
| Board Member (1988) |
| Principal Occupation During Past 5Years: |
| • Professor of Leadership & Public Policy, University of North Carolina, Chapel Hill (2006-present) |
| No. of Portfolios for which Board Member Serves: 27 |
| ——————— |
| Gordon J. Davis (71) |
| Board Member (2006) |
| Principal Occupation During Past 5Years: |
| • Partner in the law firm ofVenable, LLP (2012-present) |
| • Partner in the law firm of Dewey & LeBoeuf, LLP (1994-2012) |
| Other Public Company Board Memberships During Past 5Years: |
| • Consolidated Edison, Inc., a utility company, Director (1997-present) |
| • The Phoenix Companies, Inc., a life insurance company, Director (2000-present) |
| No. of Portfolios for which Board Member Serves: 50 |
| ——————— |
| Joni Evans (70) |
| Board Member (2006) |
| Principal Occupation During Past 5Years: |
| • Chief Executive Officer, www.wowOwow.com an online community dedicated to women’s |
| conversations and publications (2007-present) |
| • Principal, Joni Evans Ltd. (publishing) (2006-present) |
| No. of Portfolios for which Board Member Serves: 27 |
The Fund 39
BOARD MEMBERS INFORMATION (Unaudited) (continued)
|
| Ehud Houminer (72) |
| Board Member (1994) |
| Principal Occupation During Past 5Years: |
| • Executive-in-Residence at the Columbia Business School, Columbia University (1992-present) |
| Other Public Company Board Memberships During Past 5Years: |
| • Avnet Inc., an electronics distributor, Director (1993-2012) |
| No. of Portfolios for which Board Member Serves: 73 |
| ——————— |
| Richard C. Leone (72) |
| Board Member (1984) |
| Principal Occupation During Past 5Years: |
| • Senior Fellow and former President of The Century Foundation (formerly,The Twentieth |
| Century Fund, Inc.), a tax exempt research foundation engaged in the study of economic, |
| foreign policy and domestic issues |
| Other Public Company Board Memberships During Past 5Years: |
| • Partnership for a Secure America, Director |
| No. of Portfolios for which Board Member Serves: 27 |
| ——————— |
| Hans C. Mautner (75) |
| Board Member (1984) |
| Principal Occupation During Past 5Years: |
| • President—International Division and an Advisory Director of Simon Property Group, a real |
| estate investment company (1998-2010) |
| • Chairman and Chief Executive Officer of Simon Global Limited (1999-2010) |
| No. of Portfolios for which Board Member Serves: 27 |
| ——————— |
| Robin A. Melvin (49) |
| Board Member (1995) |
| Principal Occupation During Past 5Years: |
| • Director, Boisi Family Foundation, a private family foundation that supports youth-serving orga- |
| nizations that promote the self sufficiency of youth from disadvantaged circumstances (1995-2012) |
| No. of Portfolios for which Board Member Serves: 100 |
40
|
| Burton N.Wallack (62) |
| Board Member (2006) |
| Principal Occupation During Past 5Years: |
| • President and Co-owner of Wallack Management Company, a real estate management company |
| No. of Portfolios for which Board Member Serves: 27 |
| ——————— |
| John E. Zuccotti (75) |
| Board Member (1984) |
| Principal Occupation During Past 5Years: |
| • Chairman of Brookfield Properties, Inc. |
| • Senior Counsel of Weil, Gotshal & Manges, LLP |
| • Emeritus Chairman of the Real Estate Board of NewYork |
| Other Public Company Board Memberships During Past 5Years: |
| • Emigrant Savings Bank, Director (2004-present) |
| • Doris Duke Charitable Foundation,Trustee (2006-present) |
| • NewYork Private Bank & Trust, Director |
| No. of Portfolios for which Board Member Serves: 27 |
| ——————— |
| Once elected all Board Members serve for an indefinite term, but achieve Emeritus status upon reaching age 80.The |
| address of the Board Members and Officers is c/o The Dreyfus Corporation, 200 Park Avenue, NewYork, NewYork |
| 10166.Additional information about the Board Members is available in the fund’s Statement of Additional Information |
| which can be obtained from Dreyfus free of charge by calling this toll free number: 1-800-DREYFUS. |
| David W. Burke, Emeritus Board Member |
| Arnold S. Hiatt, Emeritus Board Member |
The Fund 41
OFFICERS OF THE FUND (Unaudited)

42

The Fund 43
Save time. Save paper. View your next shareholder report online as soon as it’s available. Log into www.dreyfus.com and sign up for Dreyfus eCommunications. It’s simple and only takes a few minutes.
The views expressed in this report reflect those of the portfolio manager only through the end of the period covered and do not necessarily represent the views of Dreyfus or any other person in the Dreyfus organization. Any such views are subject to change at any time based upon market or other conditions and Dreyfus disclaims any responsibility to update such views.These views may not be relied on as investment advice and, because investment decisions for a Dreyfus fund are based on numerous factors, may not be relied on as an indication of trading intent on behalf of any Dreyfus fund.
| | Contents |
| | THE FUND |
| 2 | A Letter from the President |
| 3 | Discussion of Fund Performance |
| 6 | Fund Performance |
| 8 | Understanding Your Fund’s Expenses |
| 8 | Comparing Your Fund’s Expenses With Those of Other Funds |
| 9 | Statement of Investments |
| 12 | Statement of Assets and Liabilities |
| 13 | Statement of Operations |
| 14 | Statement of Changes in Net Assets |
| 16 | Financial Highlights |
| 19 | Notes to Financial Statements |
| 32 | Report of Independent Registered Public Accounting Firm |
| 33 | Important Tax Information |
| 34 | Information About the Renewal of the Fund’s Management and Sub-Investment Advisory Agreements |
| 39 | Board Members Information |
| 42 | Officers of the Fund |
| | FOR MORE INFORMATION |
| | Back Cover |
International
Stock Fund
The Fund
A LETTER FROM THE PRESIDENT
Dear Shareholder:
We are pleased to present this annual report for International Stock Fund, covering the 12-month period from December 1, 2011, through November 30, 2012. For information about how the fund performed during the reporting period, as well as general market perspectives, we provide a Discussion of Fund Performance on the pages that follow.
Despite pronounced stock market weakness during the spring of 2012, international equities generally advanced over the reporting period as investors responded to encouraging macroeconomic developments throughout the world. Employment gains in the United States, credible measures to prevent a more severe banking crisis in Europe, and the likelihood of a “soft landing” for China’s economy buoyed investor sentiment, as did aggressively accommodative monetary policies from central banks in the United States, Europe, Japan and China. Consequently, global markets rose over the second half of the reporting period, offsetting previous bouts of weakness and enabling international stocks to post respectable gains, on average, for the reporting period.
In light of the easy monetary policies adopted by many countries, we expect global growth to be slightly more robust in 2013 than in 2012 as uncertainties surrounding U.S. fiscal policy ease, further healing of the European financial crisis occurs, and the emerging markets achieve a modestly stronger pace of growth.As always, we encourage you to stay in touch with your financial advisor as new developments unfold.
Thank you for your continued confidence and support.
Sincerely,

J. Charles Cardona
President
The Dreyfus Corporation
December 17, 2012
2
DISCUSSION OF FUND PERFORMANCE
For the period of December 1, 2011, through November 30, 2012, as provided by Charlie Macquaker and Roy Leckie of Walter Scott & Partners Limited (Walter Scott), Sub-investment adviser
Fund and Market Performance Overview
For the 12-month period ended November 30, 2012, International Stock Fund’s Class A shares achieved a return of 13.40%, Class C shares returned 12.58% and Class I shares returned 13.74%.1 In comparison, the fund’s benchmark index, the Morgan Stanley Capital International Europe, Australasia, Far East Index (the “MSCI EAFE Index”), achieved a 12.61% return over the same period.2
Amid heightened volatility, international stock markets generally rallied over the reporting period as investors responded to aggressively accommodative monetary policies in many parts of the world.The fund’s Class A and Class I shares produced higher returns than its benchmark, primarily due to the success of our stock selection strategy in the health care and information technology sectors.
The Fund’s Investment Approach
The fund seeks long-term real return by investing in high-quality companies capable of sustainable growth and wealth creation over a long time horizon.The fund invests in stocks of foreign companies that are predominantly located in the world’s developed markets outside of the United States.When selecting stocks,Walter Scott seeks companies with fundamental strengths that indicate the potential for sustainable growth.The firm focuses on individual stock selection through extensive fundamental research. Candidates are initially selected for research if they meet certain broad absolute and trend criteria. Financial statements are analyzed in an effort to identify the nature of their cash generation and to understand the variables that add value to their businesses. Companies meeting the financial criteria are subjected to a detailed investigation of products, costs and pricing, competition, industry position and outlook.
The Fund 3
DISCUSSION OF FUND PERFORMANCE (continued)
Central Bank Actions Lifted Global Equities
The reporting period began in the aftermath of pronounced weakness in international stock markets, resulting in attractive valuations across a number of market sectors in December 2011. Indeed, by the first quarter of 2012, many markets were rallying amid a quantitative easing program in Europe that forestalled a more severe banking crisis in the region, less restrictive monetary and fiscal policies in China, and stronger U.S. employment gains. Meanwhile, corporate earnings generally remained strong, and many companies had shored up their balance sheets. Investors grew more tolerant of risks, focusing more intently on business fundamentals and less on news headlines.
These positive influences were called into question during the spring, when measures designed to relieve fiscal pressures in Europe encountered political resistance, the Chinese economy remained under pressure, and the U.S. labor market’s rebound slowed. However, investor sentiment soon improved when several central banks announced measures to stimulate their economies. In a July speech, the head of the European Central Bank signaled the central bank’s commitment to supporting the euro, which was followed by plans to buy distressed debt from the European Union’s more troubled members. In China, industrial production improved, supporting exporters and commodities producers, and investors responded positively to expectations that new government leadership would adopt more stimulative fiscal policies. In the United States, the Federal Reserve Board extended Operation Twist in June and embarked on a third round of quantitative easing in September.
Stock Selections Buoyed Relative Performance
The fund achieved relatively strong results in the health care sector, where Australian blood plasma specialist CSL benefited from a weaker Australian dollar, strong sales and positive news regarding new products under development, and Denmark’s Novo Nordisk, Cl. B, saw sales of its diabetes drugs increase. Moreover, Australian hearing implants producer Cochlear rebounded from depressed levels after the company responded decisively to a 2011 product recall. In other areas, Spain-based retailer Inditex reported higher gross margins and favorable same-store sales comparisons as the company’s international and online presence continues to expand. Finnish elevator manufacturer Kone, Cl. B, posted strong results, particularly in China, enabling management to increase sales and earnings guidance to investors.
4
Disappointments during the reporting period included U.K. supermarket chain Tesco, which following a period of disappointing sales growth within its U.K. store base saw expenses rise as it pursued an extensive investment program to refurbish stores and improve customer service. In the energy sector, U.K.-based BG Group encountered production problems in a number of its natural gas fields, government intervention prevented Petroleo Brasileiro, ADR from passing along higher input costs to its customers, and French pipe producer Vallourec struggled with operational issues. Finally, Japanese electronics company Canon was undermined by competitive pressures in its product markets exacerbated by the strong yen.
Global Uncertainty Persists
With valuations higher than they were a year ago and economic recovery in many parts of the world muted at best, a degree of caution is warranted. That said, the investment focus remains unchanged; a continued focus on companies that, in our analysis, have low debt levels, robust long term growth prospects and strong market leading positions, companies with the attributes to deliver profitable growth regardless of broader economic conditions.
December 17, 2012
|
| Please note, the position in any security highlighted with italicized typeface was sold during the reporting period. |
| Equity funds are subject generally to market, market sector, market liquidity, issuer and investment style risks, among |
| other factors, to varying degrees, all of which are more fully described in the fund’s prospectus. |
| Investing internationally involves special risks, including changes in currency exchange rates, political, economic and |
| social instability, a lack of comprehensive company information, differing auditing and legal standards and less |
| market liquidity. |
| 1 Total return includes reinvestment of dividends and any capital gains paid, and does not take into consideration the |
| maximum initial sales charge in the case of Class A shares, or the applicable contingent deferred sales charge imposed |
| on redemptions in the case of Class C shares. Had these charges been reflected, returns would have been lower. Past |
| performance is no guarantee of future results. Share price and investment return fluctuate such that upon redemption, |
| fund shares may be worth more or less than their original cost. |
| 2 SOURCE: LIPPER INC. – Reflects reinvestment of net dividends and, where applicable, capital gain distributions. |
| The Morgan Stanley Capital International Europe,Australasia, Far East (MSCI EAFE) Index is an unmanaged |
| index composed of a sample of companies representative of the market structure of European and Pacific Basin |
| countries. Returns are calculated on a month-end basis. Investors cannot invest directly in any index. |
The Fund 5
FUND PERFORMANCE
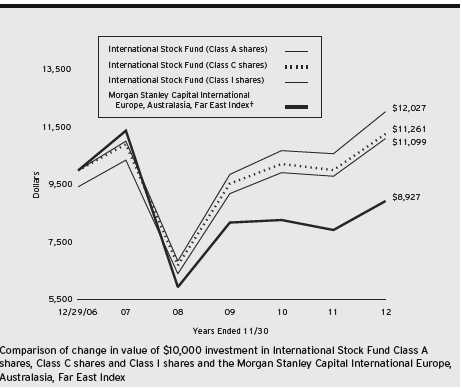
† Source: Lipper Inc.
Past performance is not predictive of future performance.
The above graph compares a $10,000 investment made in each of the Class A, Class C and Class I shares of International Stock Fund on 12/29/06 (inception date) to a $10,000 investment made in the Morgan Stanley Capital International Europe,Australasia, Far East Index (the “Index”) on that date.All dividends and capital gain distributions are reinvested.
The fund’s performance shown in the line graph above takes into account the maximum initial sales charge on Class A shares and all other applicable fees and expenses on all classes.The Index is an unmanaged, market capitalization weighted index that is designed to measure the performance of publicly traded stocks issued by companies in developed markets excluding the U.S. and Canada. Unlike a mutual fund, the Index is not subject to charges, fees and other expenses. Investors cannot invest directly in any index. Further information relating to fund performance, including expense reimbursements, if applicable, is contained in the Financial Highlights section of the prospectus and elsewhere in this report.
6
| | | | | | | |
| Average Annual Total Returns as of 11/30/12 | | | | | | |
| |
| | Inception | | | | | From | |
| | Date | 1 | Year | 5 Years | | Inception | |
| Class A shares | | | | | | | |
| with maximum sales charge (5.75%) | 12/29/06 | 6.86 | % | 0.21 | % | 1.78 | % |
| without sales charge | 12/29/06 | 13.40 | % | 1.41 | % | 2.80 | % |
| Class C shares | | | | | | | |
| with applicable redemption charge † | 12/29/06 | 11.58 | % | 0.65 | % | 2.03 | % |
| without redemption | 12/29/06 | 12.58 | % | 0.65 | % | 2.03 | % |
| Class I shares | 12/29/06 | 13.74 | % | 1.79 | % | 3.17 | % |
| Morgan Stanley Capital | | | | | | | |
| International Europe, | | | | | | | |
| Australasia, Far East Index | 12/31/06 | 12.61 | % | –4.73 | % | –1.90 | % |
Past performance is not predictive of future performance.The fund’s performance shown in the graph and table does not reflect the deduction of taxes that a shareholder would pay on fund distributions or the redemption of fund shares.
|
| † The maximum contingent deferred sales charge for Class C shares is 1% for shares redeemed within one year of the |
| date of purchase. |
The Fund 7
UNDERSTANDING YOUR FUND’S EXPENSES (Unaudited)
As a mutual fund investor, you pay ongoing expenses, such as management fees and other expenses. Using the information below, you can estimate how these expenses affect your investment and compare them with the expenses of other funds.You also may pay one-time transaction expenses, including sales charges (loads) and redemption fees, which are not shown in this section and would have resulted in higher total expenses. For more information, see your fund’s prospectus or talk to your financial adviser.
Review your fund’s expenses
The table below shows the expenses you would have paid on a $1,000 investment in International Stock Fund from June 1, 2012 to November 30, 2012. It also shows how much a $1,000 investment would be worth at the close of the period, assuming actual returns and expenses.
Expenses and Value of a $1,000 Investment
assuming actual returns for the six months ended November 30, 2012
| | | | | | |
| | | Class A | | Class C | | Class I |
| Expenses paid per $1,000† | $ | 7.03 | $ | 10.98 | $ | 4.94 |
| Ending value (after expenses) | $ | 1,145.10 | $ | 1,141.70 | $ | 1,147.20 |
COMPARING YOUR FUND’S EXPENSES
WITH THOSE OF OTHER FUNDS (Unaudited)
Using the SEC’s method to compare expenses
The Securities and Exchange Commission (SEC) has established guidelines to help investors assess fund expenses. Per these guidelines, the table below shows your fund’s expenses based on a $1,000 investment, assuming a hypothetical 5% annualized return. You can use this information to compare the ongoing expenses (but not transaction expenses or total cost) of investing in the fund with those of other funds.All mutual fund shareholder reports will provide this information to help you make this comparison. Please note that you cannot use this information to estimate your actual ending account balance and expenses paid during the period.
Expenses and Value of a $1,000 Investment
assuming a hypothetical 5% annualized return for the six months ended November 30, 2012
| | | | | | |
| | | Class A | | Class C | | Class I |
| Expenses paid per $1,000† | $ | 6.61 | $ | 10.33 | $ | 4.65 |
| Ending value (after expenses) | $ | 1,018.45 | $ | 1,014.75 | $ | 1,020.40 |
|
| † Expenses are equal to the fund’s annualized expense ratio of 1.31% for Class A, 2.05% for Class C and .92% |
| for Class I, multiplied by the average account value over the period, multiplied by 183/366 (to reflect the one-half |
| year period). |
8
STATEMENT OF INVESTMENTS
November 30, 2012
| | |
| Common Stocks—97.4% | Shares | Value ($) |
| Australia—9.0% | | |
| Coca-Cola Amatil | 2,918,000 | 41,841,456 |
| Cochlear | 280,800 | 22,095,468 |
| CSL | 877,400 | 47,339,421 |
| Shopping Centres Australasia Property Group | 268,000 | 405,544 |
| Woodside Petroleum | 1,122,000 | 39,577,132 |
| Woolworths | 1,340,000 | 40,945,920 |
| | | 192,204,941 |
| Belgium—1.8% | | |
| Colruyt | 849,000 | 39,065,196 |
| Brazil—1.6% | | |
| Petroleo Brasileiro, ADR, Cl. A | 1,895,900 | 33,273,045 |
| Canada—2.0% | | |
| Suncor Energy | 1,326,900 | 43,359,515 |
| China—3.2% | | |
| China Shenhua Energy, Cl. H | 5,297,000 | 21,700,053 |
| CNOOC | 21,889,000 | 46,827,130 |
| | | 68,527,183 |
| Denmark—2.0% | | |
| Novo Nordisk, Cl. B | 265,000 | 42,085,491 |
| Finland—1.1% | | |
| Kone, Cl. B | 318,000 | 23,821,773 |
| France—7.6% | | |
| Air Liquide | 331,300 | 40,462,971 |
| Danone | 656,700 | 41,657,076 |
| Essilor International | 364,000 | 35,149,757 |
| L’Oreal | 333,000 | 45,191,960 |
| | | 162,461,764 |
| Germany—4.5% | | |
| Adidas | 541,000 | 47,576,985 |
| SAP | 610,000 | 47,631,582 |
| | | 95,208,567 |
| Hong Kong—6.2% | | |
| China Mobile | 3,890,500 | 44,476,052 |
| CLP Holdings | 4,863,000 | 42,636,429 |
| Hong Kong & China Gas | 16,866,206 | 45,700,798 |
| | | 132,813,279 |
The Fund 9
STATEMENT OF INVESTMENTS (continued)
| | |
| Common Stocks (continued) | Shares | Value ($) |
| Italy—.7% | | |
| Tenaris, ADR | 388,800 | 15,528,672 |
| Japan—21.9% | | |
| AEON Mall | 866,900 | 22,399,430 |
| Canon | 1,302,900 | 45,566,333 |
| Chugai Pharmaceutical | 628,000 | 12,448,014 |
| Daito Trust Construction | 411,700 | 39,903,961 |
| Denso | 1,309,100 | 43,019,978 |
| FANUC | 250,400 | 42,221,872 |
| Honda Motor | 1,333,700 | 44,200,502 |
| INPEX | 7,665 | 41,098,199 |
| Keyence | 83,820 | 23,406,762 |
| Komatsu | 1,944,500 | 43,567,556 |
| Mitsubishi Estate | 1,186,000 | 22,861,091 |
| Shimamura | 204,300 | 20,644,374 |
| Shin-Etsu Chemical | 748,700 | 44,049,190 |
| Tokio Marine Holdings | 899,000 | 23,054,358 |
| | | 468,441,620 |
| Singapore—1.9% | | |
| DBS Group Holdings | 1,681,305 | 19,904,028 |
| Oversea-Chinese Banking | 2,715,061 | 20,931,283 |
| | | 40,835,311 |
| Spain—2.6% | | |
| Inditex | 398,300 | 54,597,833 |
| Sweden—1.9% | | |
| Hennes & Mauritz, Cl. B | 1,242,000 | 40,302,675 |
| Switzerland—8.6% | | |
| Nestle | 665,000 | 43,522,445 |
| Novartis | 652,000 | 40,349,843 |
| Roche Holding | 164,000 | 32,279,702 |
| SGS | 8,290 | 18,598,155 |
| Syngenta | 120,500 | 48,306,626 |
| | | 183,056,771 |
| Taiwan—2.4% | | |
| Taiwan Semiconductor Manufacturing, ADR | 2,910,500 | 50,264,335 |
10
| | | | |
| Common Stocks (continued) | | Shares | | Value ($) |
| United Kingdom—18.4% | | | | |
| BG Group | | 2,380,000 | | 40,800,436 |
| Burberry Group | | 2,229,000 | | 45,961,340 |
| Centrica | | 8,085,000 | | 42,215,161 |
| HSBC Holdings | | 4,736,000 | | 48,387,388 |
| Reckitt Benckiser Group | | 734,000 | | 46,157,235 |
| SABMiller | | 924,000 | | 41,858,017 |
| Smith & Nephew | | 4,000,000 | | 42,136,631 |
| Standard Chartered | | 1,905,990 | | 44,431,163 |
| Tesco | | 7,761,000 | | 40,423,947 |
| | | | | 392,371,318 |
| Total Common Stocks | | | | |
| (cost $1,821,409,061) | | | | 2,078,219,289 |
| |
| Other Investment—2.2% | | | | |
| Registered Investment Company; | | | | |
| Dreyfus Institutional Preferred | | | | |
| Plus Money Market Fund | | | | |
| (cost $47,720,000) | | 47,720,000 | a | 47,720,000 |
| Total Investments (cost $1,869,129,061) | 99.6 | % | 2,125,939,289 |
| Cash and Receivables (Net) | | .4 | % | 7,921,855 |
| Net Assets | | 100.0 | % | 2,133,861,144 |
| |
| ADR—American Depository Receipts | | | | |
| a Investment in affiliated money market mutual fund. | | | |
| |
| |
| Portfolio Summary (Unaudited)† | | | |
| | Value (%) | | | Value (%) |
| Consumer Staples | 17.9 | Materials | | 6.2 |
| Consumer Discretionary | 13.9 | Utilities | | 6.1 |
| Energy | 13.2 | Industrial | | 6.0 |
| Health Care | 12.8 | Money Market Investment | | 2.2 |
| Financial | 11.4 | Telecommunication Services | | 2.1 |
| Information Technology | 7.8 | | | 99.6 |
| |
| † Based on net assets. | | | | |
| See notes to financial statements. | | | | |
The Fund 11
STATEMENT OF ASSETS AND LIABILITIES
November 30, 2012
| | | | |
| | | Cost | Value | |
| Assets ($): | | | | |
| Investments in securities—See Statement of Investments: | | | |
| Unaffiliated issuers | | 1,821,409,061 | 2,078,219,289 | |
| Affiliated issuers | | 47,720,000 | 47,720,000 | |
| Cash | | | 2,143,118 | |
| Cash denominated in foreign currencies | | 1,348,124 | 1,337,787 | |
| Receivable for shares of Common Stock subscribed | | 4,961,181 | |
| Dividends receivable | | | 3,445,232 | |
| Prepaid expenses | | | 56,894 | |
| | | | 2,137,883,501 | |
| Liabilities ($): | | | | |
| Due to The Dreyfus Corporation and affiliates—Note 3(c) | | 1,684,172 | |
| Payable for shares of Common Stock redeemed | | | 2,053,395 | |
| Accrued expenses | | | 284,790 | |
| | | | 4,022,357 | |
| Net Assets ($) | | | 2,133,861,144 | |
| Composition of Net Assets ($): | | | | |
| Paid-in capital | | | 1,913,398,796 | |
| Accumulated undistributed investment income—net | | | 29,866,773 | |
| Accumulated net realized gain (loss) on investments | | (66,121,372 | ) |
| Accumulated net unrealized appreciation (depreciation) | | | |
| on investments and foreign currency transactions | | 256,716,947 | |
| Net Assets ($) | | | 2,133,861,144 | |
| |
| |
| Net Asset Value Per Share | | | | |
| | Class A | Class C | Class I | |
| Net Assets ($) | 174,825,039 | 23,962,045 | 1,935,074,060 | |
| Shares Outstanding | 12,374,662 | 1,729,478 | 135,655,313 | |
| Net Asset Value Per Share ($) | 14.13 | 13.86 | 14.26 | |
| |
| See notes to financial statements. | | | | |
12
STATEMENT OF OPERATIONS
Year Ended November 30, 2012
| | |
| Investment Income ($): | | |
| Income: | | |
| Cash dividends (net of $3,432,206 foreign taxes withheld at source): | | |
| Unaffiliated issuers | 49,282,744 | |
| Affiliated issuers | 49,781 | |
| Total Income | 49,332,525 | |
| Expenses: | | |
| Management fee—Note 3(a) | 14,484,528 | |
| Shareholder servicing costs—Note 3(c) | 948,887 | |
| Custodian fees—Note 3(c) | 465,587 | |
| Distribution fees—Note 3(b) | 168,480 | |
| Directors’ fees and expenses—Note 3(d) | 165,856 | |
| Professional fees | 163,992 | |
| Registration fees | 158,048 | |
| Prospectus and shareholders’ reports | 70,817 | |
| Loan commitment fees—Note 2 | 15,392 | |
| Miscellaneous | 103,383 | |
| Total Expenses | 16,744,970 | |
| Less—reduction in fees due to earnings credits—Note 3(c) | (455 | ) |
| Net Expenses | 16,744,515 | |
| Investment Income—Net | 32,588,010 | |
| Realized and Unrealized Gain (Loss) on Investments—Note 4 ($): | | |
| Net realized gain (loss) on investments and foreign currency transactions | (25,668,274 | ) |
| Net realized gain (loss) on forward foreign currency exchange contracts | (939,489 | ) |
| Net Realized Gain (Loss) | (26,607,763 | ) |
| Net unrealized appreciation (depreciation) on | | |
| investments and foreign currency transactions | 229,678,449 | |
| Net unrealized appreciation (depreciation) on | | |
| forward foreign currency exchange contracts | 14,241 | |
| Net Unrealized Appreciation (Depreciation) | 229,692,690 | |
| Net Realized and Unrealized Gain (Loss) on Investments | 203,084,927 | |
| Net Increase in Net Assets Resulting from Operations | 235,672,937 | |
| |
| See notes to financial statements. | | |
The Fund 13
STATEMENT OF CHANGES IN NET ASSETS
| | | | |
| | Year Ended November 30, | |
| | 2012 | | 2011 | |
| Operations ($): | | | | |
| Investment income—net | 32,588,010 | | 15,717,906 | |
| Net realized gain (loss) on investments | (26,607,763 | ) | (19,894,512 | ) |
| Net unrealized appreciation | | | | |
| (depreciation) on investments | 229,692,690 | | (41,774,228 | ) |
| Net Increase (Decrease) in Net Assets | | | | |
| Resulting from Operations | 235,672,937 | | (45,950,834 | ) |
| Dividends to Shareholders from ($): | | | | |
| Investment income—net: | | | | |
| Class A Shares | (1,727,130 | ) | (891,065 | ) |
| Class C Shares | (33,444 | ) | (62,687 | ) |
| Class I Shares | (14,304,931 | ) | (5,951,410 | ) |
| Total Dividends | (16,065,505 | ) | (6,905,162 | ) |
| Capital Stock Transactions ($): | | | | |
| Net proceeds from shares sold: | | | | |
| Class A Shares | 69,431,573 | | 141,281,526 | |
| Class C Shares | 6,334,328 | | 15,822,744 | |
| Class I Shares | 952,851,615 | | 597,266,958 | |
| Dividends reinvested: | | | | |
| Class A Shares | 1,702,274 | | 878,594 | |
| Class C Shares | 23,020 | | 42,711 | |
| Class I Shares | 7,414,889 | | 2,081,783 | |
| Cost of shares redeemed: | | | | |
| Class A Shares | (108,468,076 | ) | (64,098,053 | ) |
| Class C Shares | (8,328,062 | ) | (4,950,839 | ) |
| Class I Shares | (338,580,321 | ) | (130,894,151 | ) |
| Increase (Decrease) in Net Assets | | | | |
| from Capital Stock Transactions | 582,381,240 | | 557,431,273 | |
| Total Increase (Decrease) in Net Assets | 801,988,672 | | 504,575,277 | |
| Net Assets ($): | | | | |
| Beginning of Period | 1,331,872,472 | | 827,297,195 | |
| End of Period | 2,133,861,144 | | 1,331,872,472 | |
| Undistributed investment income—net | 29,866,773 | | 13,815,202 | |
14
| | | | |
| | Year Ended November 30, | |
| | 2012 | | 2011 | |
| Capital Share Transactions: | | | | |
| Class A | | | | |
| Shares sold | 5,272,552 | | 10,369,700 | |
| Shares issued for dividends reinvested | 140,566 | | 64,508 | |
| Shares redeemed | (8,325,957 | ) | (4,837,020 | ) |
| Net Increase (Decrease) in Shares Outstanding | (2,912,839 | ) | 5,597,188 | |
| Class C | | | | |
| Shares sold | 485,056 | | 1,171,466 | |
| Shares issued for dividends reinvested | 1,923 | | 3,178 | |
| Shares redeemed | (648,380 | ) | (387,816 | ) |
| Net Increase (Decrease) in Shares Outstanding | (161,401 | ) | 786,828 | |
| Class I | | | | |
| Shares sold | 72,715,136 | | 44,375,224 | |
| Shares issued for dividends reinvested | 608,776 | | 151,955 | |
| Shares redeemed | (25,572,016 | ) | (9,928,482 | ) |
| Net Increase (Decrease) in Shares Outstanding | 47,751,896 | | 34,598,697 | |
| |
| See notes to financial statements. | | | | |
The Fund 15
FINANCIAL HIGHLIGHTS
The following tables describe the performance for each share class for the fiscal periods indicated.All information (except portfolio turnover rate) reflects financial results for a single fund share.Total return shows how much your investment in the fund would have increased (or decreased) during each period, assuming you had reinvested all dividends and distributions.These figures have been derived from the fund’s financial statements.
| | | | | | | | | | |
| | | | Year Ended November 30, | | | |
| Class A Shares | 2012 | | 2011 | | 2010 | | 2009 | | 2008 | |
| Per Share Data ($): | | | | | | | | | | |
| Net asset value, beginning of period | 12.58 | | 12.83 | | 11.97 | | 8.43 | | 13.72 | |
| Investment Operations: | | | | | | | | | | |
| Investment income—neta | .21 | | .15 | | .09 | | .05 | | .09 | |
| Net realized and unrealized | | | | | | | | | | |
| gain (loss) on investments | 1.46 | | (.31 | ) | .86 | | 3.58 | | (5.28 | ) |
| Total from Investment Operations | 1.67 | | (.16 | ) | .95 | | 3.63 | | (5.19 | ) |
| Distributions: | | | | | | | | | | |
| Dividends from investment income—net | (.12 | ) | (.09 | ) | (.09 | ) | (.09 | ) | (.02 | ) |
| Dividends from net realized | | | | | | | | | | |
| gain on investments | — | | — | | — | | — | | (.08 | ) |
| Total Distributions | (.12 | ) | (.09 | ) | (.09 | ) | (.09 | ) | (.10 | ) |
| Net asset value, end of period | 14.13 | | 12.58 | | 12.83 | | 11.97 | | 8.43 | |
| Total Return (%)b | 13.40 | | (1.32 | ) | 7.99 | | 43.33 | | (38.07 | ) |
| Ratios/Supplemental Data (%): | | | | | | | | | | |
| Ratio of total expenses | | | | | | | | | | |
| to average net assets | 1.31 | | 1.27 | | 1.34 | | 1.43 | | 1.43 | |
| Ratio of net expenses | | | | | | | | | | |
| to average net assets | 1.31 | | 1.27 | | 1.34 | | 1.42 | | 1.41 | |
| Ratio of net investment income | | | | | | | | | | |
| to average net assets | 1.62 | | 1.08 | | .69 | | .50 | | .79 | |
| Portfolio Turnover Rate | 5.47 | | 5.07 | | 5.91 | | 21.67 | | 13.18 | |
| Net Assets, end of period ($ x 1,000) | 174,825 | | 192,351 | | 124,347 | | 18,059 | | 1,126 | |
| |
| a | Based on average shares outstanding at each month end. |
| b | Exclusive of sales charge. |
See notes to financial statements.
16
| | | | | | | | | | |
| | | | Year Ended November 30, | | | |
| Class C Shares | 2012 | | 2011 | | 2010 | | 2009 | | 2008 | |
| Per Share Data ($): | | | | | | | | | | |
| Net asset value, beginning of period | 12.33 | | 12.64 | | 11.83 | | 8.32 | | 13.64 | |
| Investment Operations: | | | | | | | | | | |
| Investment income (loss)—neta | .12 | | .04 | | (.02 | ) | (.01 | ) | .00 | b |
| Net realized and unrealized | | | | | | | | | | |
| gain (loss) on investments | 1.43 | | (.30 | ) | .87 | | 3.53 | | (5.24 | ) |
| Total from Investment Operations | 1.55 | | (.26 | ) | .85 | | 3.52 | | (5.24 | ) |
| Distributions: | | | | | | | | | | |
| Dividends from investment income—net | (.02 | ) | (.05 | ) | (.04 | ) | (.01 | ) | — | |
| Dividends from net realized | | | | | | | | | | |
| gain on investments | — | | — | | — | | — | | (.08 | ) |
| Total Distributions | (.02 | ) | (.05 | ) | (.04 | ) | (.01 | ) | (.08 | ) |
| Net asset value, end of period | 13.86 | | 12.33 | | 12.64 | | 11.83 | | 8.32 | |
| Total Return (%)c | 12.58 | | (2.08 | ) | 7.18 | | 42.31 | | (38.58 | ) |
| Ratios/Supplemental Data (%): | | | | | | | | | | |
| Ratio of total expenses | | | | | | | | | | |
| to average net assets | 2.06 | | 2.05 | | 2.13 | | 2.25 | | 2.24 | |
| Ratio of net expenses | | | | | | | | | | |
| to average net assets | 2.06 | | 2.05 | | 2.13 | | 2.22 | | 2.20 | |
| Ratio of net investment income | | | | | | | | | | |
| (loss) to average net assets | .90 | | .33 | | (.12 | ) | (.13 | ) | .03 | |
| Portfolio Turnover Rate | 5.47 | | 5.07 | | 5.91 | | 21.67 | | 13.18 | |
| Net Assets, end of period ($ x 1,000) | 23,962 | | 23,319 | | 13,959 | | 1,224 | | 197 | |
| |
| a | Based on average shares outstanding at each month end. |
| b | Amount represents less than $.01 per share. |
| c | Exclusive of sales charge. |
See notes to financial statements.
The Fund 17
FINANCIAL HIGHLIGHTS (continued)
| | | | | | | | | | |
| | | | Year Ended November 30, | | | |
| Class I Shares | 2012 | | 2011 | | 2010 | | 2009 | | 2008 | |
| Per Share Data ($): | | | | | | | | | | |
| Net asset value, beginning of period | 12.70 | | 12.93 | | 12.04 | | 8.47 | | 13.76 | |
| Investment Operations: | | | | | | | | | | |
| Investment income—neta | .26 | | .19 | | .14 | | .12 | | .14 | |
| Net realized and unrealized | | | | | | | | | | |
| gain (loss) on investments | 1.46 | | (.31 | ) | .86 | | 3.57 | | (5.30 | ) |
| Total from Investment Operations | 1.72 | | (.12 | ) | 1.00 | | 3.69 | | (5.16 | ) |
| Distributions: | | | | | | | | | | |
| Dividends from investment income—net | (.16 | ) | (.11 | ) | (.11 | ) | (.12 | ) | (.05 | ) |
| Dividends from net realized | | | | | | | | | | |
| gain on investments | — | | — | | — | | — | | (.08 | ) |
| Total Distributions | (.16 | ) | (.11 | ) | (.11 | ) | (.12 | ) | (.13 | ) |
| Net asset value, end of period | 14.26 | | 12.70 | | 12.93 | | 12.04 | | 8.47 | |
| Total Return (%) | 13.74 | | (1.01 | ) | 8.38 | | 43.98 | | (37.82 | ) |
| Ratios/Supplemental Data (%): | | | | | | | | | | |
| Ratio of total expenses | | | | | | | | | | |
| to average net assets | .93 | | .93 | | .97 | | 1.01 | | 1.03 | |
| Ratio of net expenses | | | | | | | | | | |
| to average net assets | .93 | | .93 | | .97 | | 1.01 | | 1.02 | |
| Ratio of net investment income | | | | | | | | | | |
| to average net assets | 1.96 | | 1.41 | | 1.11 | | 1.18 | | 1.19 | |
| Portfolio Turnover Rate | 5.47 | | 5.07 | | 5.91 | | 21.67 | | 13.18 | |
| Net Assets, end of period | | | | | | | | | | |
| ($ x 1,000) | 1,935,074 | | 1,116,202 | | 688,992 | | 339,535 | | 119,650 | |
| |
| a Based on average shares outstanding at each month end. | | | | | | | | | |
| See notes to financial statements. | | | | | | | | | | |
18
NOTES TO FINANCIAL STATEMENTS
NOTE 1—Significant Accounting Policies:
International Stock Fund (the “fund”) is a separate diversified series of Strategic Funds, Inc. (the “Company”), which is registered under the Investment Company Act of 1940, as amended (the “Act”), as an open-end management investment company and operates as a series company currently offering nine series, including the fund.The fund’s investment objective is to seek long-term total return. The Dreyfus Corporation (the “Manager” or “Dreyfus”), a wholly-owned subsidiary of The Bank of NewYork Mellon Corporation (“BNY Mellon”), serves as the fund’s investment adviser. Walter Scott & Partners Limited (“Walter Scott”), a subsidiary of BNY Mellon and an affiliate of Dreyfus, serves as the fund’s sub-investment adviser.
MBSC Securities Corporation (the “Distributor”), a wholly-owned subsidiary of Dreyfus, is the distributor of the fund’s shares.The fund is authorized to issue 400 million shares of $.001 par value Common Stock.The fund currently offers three classes of shares: Class A (100 million shares authorized), Class C (100 million shares authorized) and Class I (200 million shares authorized). Class A shares are subject to a sales charge imposed at the time of purchase. Class C shares are subject to a contingent deferred sales charge (“CDSC”) on Class C shares redeemed within one year of purchase. Class I shares are sold at net asset value per share only to institutional investors. Other differences between the classes include the services offered to and the expenses borne by each class, the allocation of certain transfer agency costs and certain voting rights. Income, expenses (other than expenses attributable to a specific class), and realized and unrealized gains or losses on investments are allocated to each class of shares based on its relative net assets.
The Company accounts separately for the assets, liabilities and operations of each series. Expenses directly attributable to each series are
The Fund 19
NOTES TO FINANCIAL STATEMENTS (continued)
charged to that series’ operations; expenses which are applicable to all series are allocated among them on a pro rata basis.
The Financial Accounting Standards Board (“FASB”) Accounting Standards Codification is the exclusive reference of authoritative U.S. generally accepted accounting principles (“GAAP”) recognized by the FASB to be applied by nongovernmental entities. Rules and interpretive releases of the Securities and Exchange Commission (“SEC”) under authority of federal laws are also sources of authoritative GAAP for SEC registrants. The fund’s financial statements are prepared in accordance with GAAP, which may require the use of management estimates and assumptions.Actual results could differ from those estimates.
The Company enters into contracts that contain a variety of indemnifications.The fund’s maximum exposure under these arrangements is unknown.The fund does not anticipate recognizing any loss related to these arrangements.
(a) Portfolio valuation: The fair value of a financial instrument is the amount that would be received to sell an asset or paid to transfer a liability in an orderly transaction between market participants at the measurement date (i.e., the exit price). GAAP establishes a fair value hierarchy that prioritizes the inputs of valuation techniques used to measure fair value.This hierarchy gives the highest priority to unadjusted quoted prices in active markets for identical assets or liabilities (Level 1 measurements) and the lowest priority to unobservable inputs (Level 3 measurements).
Additionally, GAAP provides guidance on determining whether the volume and activity in a market has decreased significantly and whether such a decrease in activity results in transactions that are not orderly. GAAP requires enhanced disclosures around valuation inputs and techniques used during annual and interim periods.
20
Various inputs are used in determining the value of the fund’s investments relating to fair value measurements.These inputs are summarized in the three broad levels listed below:
Level 1—unadjusted quoted prices in active markets for identical investments.
Level 2—other significant observable inputs (including quoted prices for similar investments, interest rates, prepayment speeds, credit risk, etc.).
Level 3—significant unobservable inputs (including the fund’s own assumptions in determining the fair value of investments).
The inputs or methodology used for valuing securities are not necessarily an indication of the risk associated with investing in those securities.
Changes in valuation techniques may result in transfers in or out of an assigned level within the disclosure hierarchy. Valuation techniques used to value the fund’s investments are as follows:
Investments in securities are valued at the last sales price on the securities exchange or national securities market on which such securities are primarily traded. Securities listed on the National Market System for which market quotations are available are valued at the official closing price or, if there is no official closing price that day, at the last sales price. Securities not listed on an exchange or the national securities market, or securities for which there were no transactions, are valued at the average of the most recent bid and asked prices, except for open short positions, where the asked price is used for valuation purposes. Bid price is used when no asked price is available. Registered investment companies that are not traded on an exchange are valued at their net asset value. All of the preceding securities are categorized within Level 1 of the fair value hierarchy.
The Fund 21
NOTES TO FINANCIAL STATEMENTS (continued)
Fair valuing of securities may be determined with the assistance of a pricing service using calculations based on indices of domestic securities and other appropriate indicators, such as prices of relevant ADRs and financial futures. Utilizing these techniques may result in transfers between Level 1 and Level 2 of the fair value hierarchy.
When market quotations or official closing prices are not readily available, or are determined not to reflect accurately fair value, such as when the value of a security has been significantly affected by events after the close of the exchange or market on which the security is principally traded (for example, a foreign exchange or market), but before the fund calculates its net asset value, the fund may value these investments at fair value as determined in accordance with the procedures approved by the Company’s Board of Directors (the “Board”). Certain factors may be considered when fair valuing investments such as: fundamental analytical data, the nature and duration of restrictions on disposition, an evaluation of the forces that influence the market in which the securities are purchased and sold, and public trading in similar securities of the issuer or comparable issuers. These securities are either categorized within Level 2 or 3 depending on the relevant inputs used.
For restricted securities where observable inputs are limited, assumptions about market activity and risk are used and are categorized within Level 3 of the fair value hierarchy.
Investments denominated in foreign currencies are translated to U.S. dollars at the prevailing rates of exchange.
Forward foreign currency exchange contracts (“forward contracts”) are valued at the forward rate. These securities are generally categorized within Level 2 of the fair value hierarchy.
22
The following is a summary of the inputs used as of November 30, 2012 in valuing the fund’s investments:
| | | | |
| | | Level 2—Other | Level 3— | |
| | Level 1— | Significant | Significant | |
| | Unadjusted | Observable | Unobservable | |
| | Quoted Prices | Inputs | Inputs | Total |
| Assets ($) | | | | |
| Investments in Securities: | | | |
| Equity Securities— | | | | |
| Foreign | | | | |
| Common | | | | |
| Stocks† | 2,078,219,289 | — | — | 2,078,219,289 |
| Mutual Funds | 47,720,000 | — | — | 47,720,000 |
| |
| † See Statement of Investments for additional detailed categorizations. | |
At November 30, 2011, $582,080,078 of exchange traded foreign equity securities were classified within Level 2 of the fair value hierarchy pursuant to the fund’s fair valuation procedures.
(b) Foreign currency transactions: The fund does not isolate that portion of the results of operations resulting from changes in foreign exchange rates on investments from the fluctuations arising from changes in the market prices of securities held. Such fluctuations are included with the net realized and unrealized gain or loss on investments.
Net realized foreign exchange gains or losses arise from sales of foreign currencies, currency gains or losses realized on securities transactions between trade and settlement date, and the difference between the amounts of dividends, interest and foreign withholding taxes recorded on the fund’s books and the U.S. dollar equivalent of the amounts actually received or paid. Net unrealized foreign exchange gains and losses arise from changes in the value of assets and liabilities other than
The Fund 23
NOTES TO FINANCIAL STATEMENTS (continued)
investments resulting from changes in exchange rates. Foreign currency gains and losses on investments are also included with net realized and unrealized gain or loss on investments.
(c) Securities transactions and investment income: Securities transactions are recorded on a trade date basis. Realized gains and losses from securities transactions are recorded on the identified cost basis. Dividend income is recognized on the ex-dividend date and interest income, including, where applicable, accretion of discount and amortization of premium on investments, is recognized on the accrual basis.
(d) Affiliated issuers: Investments in other investment companies advised by Dreyfus are defined as “affiliated” in the Act. Investments in affiliated investment companies for the period ended November 30, 2012 were as follows:
| | | | | |
| Affiliated | | | | | |
| Investment | Value | | | Value | Net |
| Company | 11/30/2011($) | Purchases ($) | Sales ($) | 11/30/2012 ($) | Assets (%) |
| Dreyfus | | | | | |
| Institutional | | | | | |
| Preferred | | | | | |
| Plus Money | | | | | |
| Market | | | | | |
| Fund | 25,700,000 | 733,300,000 | 711,280,000 | 47,720,000 | 2.2 |
(e) Risk: Investing in foreign markets may involve special risks and considerations not typically associated with investing in the U.S.These risks include revaluation of currencies, high rates of inflation, repatriation restrictions on income and capital, and adverse political and economic developments. Moreover, securities issued in these markets may be less liquid, subject to government ownership controls and delayed settlements, and their prices may be more volatile than those of comparable securities in the U.S.
(f) Dividends to shareholders: Dividends are recorded on the ex-dividend date. Dividends from investment income-net and dividends from net realized capital gains, if any, are normally declared and paid annually, but the fund may make distributions on a more frequent basis to com-
24
ply with the distribution requirements of the Internal Revenue Code of 1986, as amended (the “Code”).To the extent that net realized capital gains can be offset by capital loss carryovers, it is the policy of the fund not to distribute such gains. Income and capital gain distributions are determined in accordance with income tax regulations, which may differ from GAAP.
(g) Federal income taxes: It is the policy of the fund to continue to qualify as a regulated investment company, if such qualification is in the best interests of its shareholders, by complying with the applicable provisions of the Code, and to make distributions of taxable income sufficient to relieve it from substantially all federal income and excise taxes.
As of and during the period ended November 30, 2012, the fund did not have any liabilities for any uncertain tax positions.The fund recognizes interest and penalties, if any, related to uncertain tax positions as income tax expense in the Statement of Operations. During the period, the fund did not incur any interest or penalties.
Each of the tax years in the four-year period ended November 30, 2012 remains subject to examination by the Internal Revenue Service and state taxing authorities.
At November 30, 2012, the components of accumulated earnings on a tax basis were as follows: undistributed ordinary income $34,713,695, accumulated capital losses $63,186,457 and unrealized appreciation $248,935,110.
Under the Regulated Investment Company Modernization Act of 2010 (the “2010 Act”), the fund is permitted to carry forward capital losses incurred in taxable years beginning after December 22, 2010 (“post-enactment losses”) for an unlimited period. Furthermore, post-enactment capital loss carryovers retain their character as either short-term or long-term capital losses rather than short-term as they were under previous statute.The 2010 Act requires post-enactment losses to be utilized before the utilization of losses incurred in taxable years
The Fund 25
NOTES TO FINANCIAL STATEMENTS (continued)
prior to the effective date of the 2010 Act (“pre-enactment losses”).As a result of this ordering rule, pre-enactment losses may be more likely to expire unused.
The accumulated capital loss carryover is available for federal income tax purposes to be applied against future net realized capital gains, if any, realized subsequent to November 30, 2012. If not applied, $598,805 of the carryover expires in fiscal year 2016, $15,114,500 expires in fiscal year 2017 and $16,297,830 expires in fiscal year 2019. The fund has $4,753,073 of post-enactment short-term capital losses and $26,422,249 of post-enactment long-term capital losses which can be carried forward for an unlimited period.
The tax character of distributions paid to shareholders during the fiscal periods ended November 30, 2012 and November 30, 2011 were as follows: ordinary income $16,065,505 and $6,905,162, respectively.
During the period ended November 30, 2012, as a result of permanent book to tax differences, primarily due to the tax treatment for foreign currency gains and losses, the fund decreased accumulated undistributed investment income-net by $470,934 and increased accumulated net realized gain (loss) on investments by the same amount. Net assets and net asset value per share were not affected by this reclassification.
(h) New Accounting Pronouncement: In December 2011, FASB issued Accounting Standards Update No. 2011-11 “Disclosures about Offsetting Assets and Liabilities” (“ASU 2011-11”). These disclosure requirements are intended to help investors and other financial statement users to better assess the effect or potential effect of offsetting arrangements on a company’s financial position.They also improve transparency in the reporting of how companies mitigate credit risk, including disclosure of related collateral pledged or received. In addition,ASU 2011-11 facilitates comparison between those entities that prepare their financial statements on the basis of GAAP and those entities that prepare their financial statements on the basis of International Financial Reporting Standards (“IFRS”).ASU 2011-11 requires entities to: disclose both gross
26
and net information about both instruments and transactions eligible for offset in the financial statements; and disclose instruments and transactions subject to an agreement similar to a master netting agreement. ASU 2011-11 is effective for fiscal years beginning on or after January 1, 2013, and interim periods within those annual periods. At this time, management is evaluating the implications of ASU 2011-11 and its impact on the fund’s financial statement disclosures.
NOTE 2—Bank Lines of Credit:
The fund participates with other Dreyfus-managed funds in a $210 million unsecured credit facility led by Citibank, N.A. and a $300 million unsecured credit facility provided by The Bank of New York Mellon, a subsidiary of BNY Mellon and an affiliate of Dreyfus (each, a “Facility”), each to be utilized primarily for temporary or emergency purposes, including the financing of redemptions. Prior to October 10, 2012, the unsecured credit facility with Citibank, N.A., was $225 million. In connection therewith, the fund has agreed to pay its pro rata portion of commitment fees for each Facility. Interest is charged to the fund based on rates determined pursuant to the terms of the respective Facility at the time of borrowing. During the period ended November 30, 2012, the fund did not borrow under the Facilities.
NOTE 3—Management Fee, Sub-Investment Advisory Fee and Other Transactions With Affiliates:
(a) Pursuant to a management agreement with Dreyfus, the management fee is computed at the annual rate of .85% of the value of the fund’s average daily net assets and is payable monthly. Dreyfus had contractually agreed, from December 1, 2011 through April 1, 2012, to waive receipt of its fees and/or assume the expenses of the fund so that the direct expenses of none of the classes (excluding Rule 12b-1 Distribution Plan fees, Shareholder Services Plan fees, taxes, interest expense, brokerage commissions, commitment fees on borrowings and extraordinary
The Fund 27
NOTES TO FINANCIAL STATEMENTS (continued)
expenses) exceed an annual rate of 1.25% of the value of the fund’s average daily net assets. During the period ended November 30, 2012, there was no reduction in expenses pursuant to the undertaking.
Pursuant to a sub-investment advisory agreement between Dreyfus and Walter Scott, Dreyfus pays Walter Scott a monthly fee at an annual percentage of the value of the fund’s average daily net assets.
During the period ended November 30, 2012, the Distributor retained $15,764 from commissions earned on sales of the fund’s Class A shares and $6,621 from CDSCs on redemptions of the fund’s Class C shares.
(b) Under the Distribution Plan adopted pursuant to Rule 12b-1 under the Act, Class C shares pay the Distributor for distributing its shares at an annual rate of .75% of the value of the average daily net assets of Class C shares. During the period ended November 30, 2012, Class C shares were charged $168,480, pursuant to the Distribution Plan.
(c) Under the Shareholder Services Plan, Class A and Class C shares pay the Distributor at an annual rate of .25% of the value of their average daily net assets for the provision of certain services.The services provided may include personal services relating to shareholder accounts, such as answering shareholder inquiries regarding the fund and providing reports and other information, and services related to the maintenance of shareholder accounts.The Distributor may make payments to Service Agents (securities dealers, financial institutions or other industry professionals) with respect to these services. The Distributor determines the amounts to be paid to Service Agents. During the period ended November 30, 2012, Class A and Class C shares were charged $428,505 and $56,160, respectively, pursuant to the Shareholder Services Plan.
The fund has arrangements with the transfer agent and the custodian whereby the fund may receive earnings credits when positive cash balances are maintained, which are used to offset transfer agency and custody fees. For financial reporting purposes, the fund includes net earnings credits as an expense offset in the Statement of Operations.
28
The fund compensates Dreyfus Transfer, Inc., a wholly-owned subsidiary of Dreyfus, under a transfer agency agreement for providing transfer agency services for the fund and, since May 29, 2012, cash management services related to fund subscriptions and redemptions. During the period ended November 30, 2012, the fund was charged $50,946 for transfer agency services and $2,350 for cash management services. Cash management fees were partially offset by earnings credits of $293.These fees are included in Shareholder servicing costs in the Statement of Operations.
The fund compensates The Bank of New York Mellon under a custody agreement for providing custodial services for the fund. During the period ended November 30, 2012, the fund was charged $465,587 pursuant to the custody agreement.
Prior to May 29, 2012, the fund compensated The Bank of New York Mellon under a cash management agreement for performing cash management services related to fund subscriptions and redemptions. During the period ended November 30, 2012, the fund was charged $4,363 pursuant to the cash management agreement, which is included in Shareholder servicing costs in the Statement of Operations.These fees were partially offset by earnings credits of $162.
During the period ended November 30, 2012, the fund was charged $8,650 for services performed by the Chief Compliance Officer and his staff.
The components of “Due to The Dreyfus Corporation and affiliates” in the Statement of Assets and Liabilities consist of: management fees $1,448,360, Distribution Plan fees $14,223, Shareholder Services Plan fees $40,648, custodian fees $166,583, Chief Compliance Officer fees $3,318 and transfer agency fees $11,040.
(d) Each Board member also serves as a Board member of other funds within the Dreyfus complex. Annual retainer fees and attendance fees are allocated to each fund based on net assets.
The Fund 29
NOTES TO FINANCIAL STATEMENTS (continued)
NOTE 4—Securities Transactions:
The aggregate amount of purchases and sales of investment securities, excluding short-term securities and forward contracts, during the period ended November 30, 2012, amounted to $666,870,501 and $90,481,273, respectively.
Derivatives: A derivative is a financial instrument whose performance is derived from the performance of another asset. Each type of derivative instrument that was held by the fund during the period ended November 30, 2012 is discussed below.
Forward Foreign Currency Exchange Contracts: The fund enters into forward contracts in order to hedge its exposure to changes in foreign currency exchange rates on its foreign portfolio holdings, to settle foreign currency transactions or as a part of its investment strategy. When executing forward contracts, the fund is obligated to buy or sell a foreign currency at a specified rate on a certain date in the future. With respect to sales of forward contracts, the fund incurs a loss if the value of the contract increases between the date the forward contract is opened and the date the forward contract is closed.The fund realizes a gain if the value of the contract decreases between those dates.With respect to purchases of forward contracts, the fund incurs a loss if the value of the contract decreases between the date the forward contract is opened and the date the forward contract is closed.The fund realizes a gain if the value of the contract increases between those dates. Any realized or unrealized gains or losses which occurred during the period are reflected in the Statement of Operations. The fund is exposed to foreign currency risk as a result of changes in value of underlying financial instruments.The fund is also exposed to credit risk associated with counterparty nonperformance on these forward contracts, which is typically limited to the unrealized gain on each open contract. At November 30, 2012, there were no forward contracts outstanding.
30
The following summarizes the average market value of derivatives outstanding during the period ended November 30, 2012:
| |
| | Average Market Value ($) |
| Forward contracts | 8,713,963 |
At November 30, 2012, the cost of investments for federal income tax purposes was $1,876,910,898; accordingly, accumulated net unrealized appreciation on investments was $249,028,391, consisting of $304,991,187 gross unrealized appreciation and $55,962,796 gross unrealized depreciation.
The Fund 31
REPORT OF INDEPENDENT REGISTERED
PUBLIC ACCOUNTING FIRM
Shareholders and Board of Directors
International Stock Fund
We have audited the accompanying statement of assets and liabilities, including the statement of investments, of International Stock Fund (one of the series comprising Strategic Funds, Inc.) as of November 30, 2012, and the related statement of operations for the year then ended, the statement of changes in net assets for each of the two years in the period then ended, and the financial highlights for each of the five years in the period then ended.These financial statements and financial highlights are the responsibility of the Fund’s management. Our responsibility is to express an opinion on these financial statements and financial highlights based on our audits.
We conducted our audits in accordance with the standards of the Public Company Accounting Oversight Board (United States).Those standards require that we plan and perform the audit to obtain reasonable assurance about whether the financial statements and financial highlights are free of material misstatement.We were not engaged to perform an audit of the Fund’s internal control over financial reporting. Our audits included consideration of internal control over financial reporting as a basis for designing audit procedures that are appropriate in the circumstances, but not for the purpose of expressing an opinion on the effectiveness of the Fund’s internal control over financial reporting. Accordingly, we express no such opinion.An audit also includes examining, on a test basis, evidence supporting the amounts and disclosures in the financial statements and financial highlights, assessing the accounting principles used and significant estimates made by management, and evaluating the overall financial statement presentation. Our procedures included confirmation of securities owned as of November 30, 2012 by correspondence with the custodian and others. We believe that our audits provide a reasonable basis for our opinion.
In our opinion, the financial statements and financial highlights referred to above present fairly, in all material respects, the financial position of International Stock Fund at November 30, 2012, the results of its operations for the year then ended, the changes in its net assets for each of the two years in the period then ended, and the financial highlights for each of the five years in the period then ended, in conformity with U.S. generally accepted accounting principles.

New York, New York
January 28, 2013
32
IMPORTANT TAX INFORMATION (Unaudited)
In accordance with federal tax law, the fund elects to provide each shareholder with their portion of the fund’s foreign taxes paid and the income sourced from foreign countries. Accordingly, the fund hereby reports the following information regarding its fiscal year ended November 30, 2012:
—the total amount of taxes paid to foreign countries was $2,991,761
—the total amount of income sourced from foreign countries was $52,715,435.
Where required by federal tax law rules, shareholders will receive notification of their proportionate share of foreign taxes paid and foreign sourced income for the 2012 calendar year with Form 1099-DIV which will be mailed in early 2013.
For the fiscal year ended November 30, 2012, certain dividends paid by the fund may be subject to a maximum tax rate of 15%, as provided for by the Jobs and Growth Tax Relief Reconciliation Act of 2003. Of the distributions paid during the fiscal year, $16,065,505 represents the maximum amount that may be considered qualified dividend income.
The Fund 33
INFORMATION ABOUT THE RENEWAL OF THE
FUND’S MANAGEMENT AND SUB-INVESTMENT
ADVISORY AGREEMENTS (Unaudited)
At a meeting of the fund’s Board of Directors held on November 5-6, 2012, the Board considered the renewal of the fund’s Management Agreement, pursuant to which Dreyfus provides the fund with investment advisory and administrative services (the “Agreement”), and the Sub-Investment Advisory Agreement (together, the “Agreements”), between Dreyfus and Walter Scott & Partners Limited (the “Sub-Adviser”), pursuant to which the Sub-Adviser provides day-to-day management of the fund’s investments.The Board members, none of whom are “interested persons” (as defined in the Investment Company Act of 1940, as amended) of the fund, were assisted in their review by independent legal counsel and met with counsel in executive session separate from representatives of Dreyfus and the Sub-Adviser. In considering the renewal of the Agreements, the Board considered all factors that it believed to be relevant, including those discussed below.The Board did not identify any one factor as dispositive, and each Board member may have attributed different weights to the factors considered.
Analysis of Nature, Extent, and Quality of Services Provided to the Fund.The Board considered information previously provided to them in presentations from Dreyfus representatives regarding the nature, extent, and quality of the services provided to funds in the Dreyfus fund complex, and Dreyfus representatives confirmed that there had been no material changes in this information. Dreyfus provided the number of open accounts in the fund, the fund’s asset size and the allocation of fund assets among distribution channels. Dreyfus also had previously provided information regarding the diverse intermediary relationships and distribution channels of funds in the Dreyfus fund complex (such as retail direct or intermediary, in which intermediaries typically are paid by the fund and/or Dreyfus) and Dreyfus’ corresponding need for broad, deep, and diverse resources to be able to provide ongoing shareholder services to each intermediary or distribution channel, as applicable to the fund.
The Board also considered research support available to, and portfolio management capabilities of, the fund’s portfolio management personnel and that Dreyfus also provides oversight of day-to-day fund operations,
34
including fund accounting and administration and assistance in meeting legal and regulatory requirements.The Board also considered Dreyfus’ extensive administrative, accounting, and compliance infrastructures, as well as Dreyfus’ supervisory activities over the Sub-Adviser.The Board also considered portfolio management’s brokerage policies and practices (including policies and practices regarding soft dollars) and the standards applied in seeking best execution.
Comparative Analysis of the Fund’s Performance and Management Fee and Expense Ratio.The Board reviewed reports prepared by Lipper, Inc. (“Lipper”), an independent provider of investment company data, which included information comparing (1) the fund’s performance with the performance of a group of comparable funds (the “Performance Group”) and with a broader group of funds (the “Performance Universe”), all for various periods ended September 30, 2012, and (2) the fund’s actual and contractual management fees and total expenses with those of a group of comparable funds (the “Expense Group”) and with a broader group of funds (the “Expense Universe”), the information for which was derived in part from fund financial statements available to Lipper as of the date of its analysis. Dreyfus previously had furnished the Board with a description of the methodology Lipper used to select the Performance Group and Performance Universe and the Expense Group and Expense Universe.
Dreyfus representatives stated that the usefulness of performance comparisons may be affected by a number of factors, including different investment limitations that may be applicable to the fund and comparison funds. The Board discussed the results of the comparisons and noted that the fund’s total return performance was variously above, at and below the Performance Group median and the Performance Universe median for the various time periods. Dreyfus also provided a comparison of the fund’s calendar year returns to the fund’s benchmark index and noted that the fund’s returns were higher in four years and lower in one year than those of the benchmark index.
The Fund 35
INFORMATION ABOUT THE RENEWAL OF THE FUND’S MANAGEMENT AND
SUB-INVESTMENT ADVISORY AGREEMENTS (Unaudited) (continued)
The Board also reviewed the range of actual and contractual management fees and total expenses of the Expense Group and Expense Universe funds and discussed the results of the comparisons.The Board noted that the fund’s contractual management fee was below the Expense Group median, the fund’s actual management fee was below the Expense Group median and at the Expense Universe median, and the fund’s total expenses were below the Expense Group median and the Expense Universe median.
Dreyfus representatives reviewed with the Board the management or investment advisory fees (1) paid by funds advised or administered by Dreyfus that are in the same Lipper category as the fund and (2) paid to Dreyfus or the Sub-Adviser or its affiliates for advising any separate accounts and/or other types of client portfolios that are considered to have similar investment strategies and policies as the fund (the “Similar Clients”), and explained the nature of the Similar Clients.They discussed differences in fees paid and the relationship of the fees paid in light of any differences in the services provided and other relevant factors.The Board considered the relevance of the fee information provided for the Similar Clients to evaluate the appropriateness and reasonableness of the fund’s management fee.
The Board considered the fee to the Sub-Adviser in relation to the fee paid to Dreyfus by the fund and the respective services provided by the Sub-Adviser and Dreyfus.The Board also noted the Sub-Adviser’s fee is paid by Dreyfus (out of its fee from the fund) and not the fund.
Analysis of Profitability and Economies of Scale. Dreyfus representatives reviewed the expenses allocated and profit received by Dreyfus and the resulting profitability percentage for managing the fund and the aggregate profitability percentage to Dreyfus of managing the funds in the Dreyfus fund complex, and the method used to determine the expenses and profit. The Board concluded that the profitability results were not unreasonable, given the services rendered and service levels provided by Dreyfus. The Board also had been provided with information prepared by an independent consulting firm regarding
36
Dreyfus’ approach to allocating costs to, and determining the profitability of, individual funds and the entire Dreyfus fund complex.The consulting firm also had analyzed where any economies of scale might emerge in connection with the management of a fund.
The Board’s counsel stated that the Board should consider the profitability analysis (1) as part of the evaluation of whether the fees under the Agreements bear a reasonable relationship to the mix of services provided by Dreyfus and the Sub-Adviser, including the nature, extent and quality of such services, and (2) in light of the relevant circumstances for the fund and the extent to which economies of scale would be realized if the fund grows and whether fee levels reflect these economies of scale for the benefit of fund shareholders. Since Dreyfus, and not the fund, pays the Sub-Adviser pursuant to the Sub-Investment Advisory Agreement, the Board did not consider the Sub-Adviser’s profitability to be relevant to its deliberations. Dreyfus representatives also noted that, as a result of shared and allocated costs among funds in the Dreyfus fund complex, the extent of economies of scale could depend substantially on the level of assets in the complex as a whole, so that increases and decreases in complex-wide assets can affect potential economies of scale in a manner that is disproportionate to, or even in the opposite direction from, changes in the fund’s asset level.The Board also considered potential benefits to Dreyfus and the Sub-Adviser from acting as investment adviser and sub-investment adviser, respectively, and noted the soft dollar arrangements in effect for trading the fund’s investments.
At the conclusion of these discussions, the Board agreed that it had been furnished with sufficient information to make an informed business decision with respect to the renewal of the Agreements. Based on the discussions and considerations as described above, the Board concluded and determined as follows.
The Fund 37
INFORMATION ABOUT THE RENEWAL OF THE FUND’S MANAGEMENT AND
SUB-INVESTMENT ADVISORY AGREEMENTS (Unaudited) (continued)
The Board was satisfied with the fund’s performance, in light of the considerations described above.
The Board concluded that the fees paid to Dreyfus and the Sub- Adviser were reasonable in light of the considerations described above.
The Board determined that the economies of scale which may accrue to Dreyfus and its affiliates in connection with the management of the fund had been adequately considered by Dreyfus in connection with the fee rate charged to the fund pursuant to the Agreement and that, to the extent in the future it were determined that material economies of scale had not been shared with the fund, the Board would seek to have those economies of scale shared with the fund.
In evaluating the Agreements, the Board considered these conclusions and determinations and also relied on its previous knowledge, gained through meetings and other interactions with Dreyfus and its affiliates and the Sub-Adviser, of the fund and the services provided to the fund by Dreyfus and the Sub-Adviser.The Board also relied on information received on a routine and regular basis throughout the year relating to the operations of the fund and the investment management and other services provided under the Agreements, including information on the investment performance of the fund in comparison to similar mutual funds and benchmark performance indices; general market outlook as applicable to the fund; and compliance reports. In addition, it should be noted that the Board’s consideration of the contractual fee arrangements for this fund had the benefit of a number of years of reviews of prior or similar agreements during which lengthy discussions took place between the Board and Dreyfus representatives. Certain aspects of the arrangements may receive greater scrutiny in some years than in others, and the Board’s conclusions may be based, in part, on their consideration of the same or similar arrangements in prior years.The Board determined that renewal of the Agreements for the ensuing year was in the best interests of the fund and its shareholders.
38
BOARD MEMBERS INFORMATION (Unaudited)
|
| Joseph S. DiMartino (69) |
| Chairman of the Board (1995) |
| Principal Occupation During Past 5Years: |
| • Corporate Director and Trustee |
| Other Public Company Board Memberships During Past 5Years: |
| • CBIZ (formerly, Century Business Services, Inc.), a provider of outsourcing functions for small |
| and medium size companies, Director (1997-present) |
| • Sunair Services Corporation, a provider of certain outdoor-related services to homes and |
| businesses, Director (2005-2009) |
| • The Newark Group, a provider of a national market of paper recovery facilities, paperboard |
| mills and paperboard converting plants, Director (2000-2010) |
| No. of Portfolios for which Board Member Serves: 157 |
| ——————— |
| William Hodding Carter III (77) |
| Board Member (1988) |
| Principal Occupation During Past 5Years: |
| • Professor of Leadership & Public Policy, University of North Carolina, Chapel Hill (2006-present) |
| No. of Portfolios for which Board Member Serves: 27 |
| ——————— |
| Gordon J. Davis (71) |
| Board Member (2006) |
| Principal Occupation During Past 5Years: |
| • Partner in the law firm of Venable, LLP (2012-present) |
| • Partner in the law firm of Dewey & LeBoeuf, LLP (1994-2012) |
| Other Public Company Board Memberships During Past 5 Years: |
| • Consolidated Edison, Inc., a utility company, Director (1997-present) |
| • The Phoenix Companies, Inc., a life insurance company, Director (2000-present) |
| No. of Portfolios for which Board Member Serves: 50 |
| ——————— |
| Joni Evans (70) |
| Board Member (2006) |
| Principal Occupation During Past 5Years: |
| • Chief Executive Officer, www.wowOwow.com an online community dedicated to women’s |
| conversations and publications (2007-present) |
| • Principal, Joni Evans Ltd. (publishing) (2006-present) |
| No. of Portfolios for which Board Member Serves: 27 |
The Fund 39
BOARD MEMBERS INFORMATION (Unaudited) (continued)
|
| Ehud Houminer (72) |
| Board Member (1994) |
| Principal Occupation During Past 5Years: |
| • Executive-in-Residence at the Columbia Business School, Columbia University (1992-present) |
| Other Public Company Board Memberships During Past 5Years: |
| • Avnet Inc., an electronics distributor, Director (1993-2012) |
| No. of Portfolios for which Board Member Serves: 73 |
| ——————— |
| Richard C. Leone (72) |
| Board Member (1984) |
| Principal Occupation During Past 5Years: |
| • Senior Fellow and former President of The Century Foundation (formerly,The Twentieth |
| Century Fund, Inc.), a tax exempt research foundation engaged in the study of economic, |
| foreign policy and domestic issues |
| Other Public Company Board Memberships During Past 5Years: |
| • Partnership for a Secure America, Director |
| No. of Portfolios for which Board Member Serves: 27 |
| ——————— |
| Hans C. Mautner (75) |
| Board Member (1984) |
| Principal Occupation During Past 5Years: |
| • President—International Division and an Advisory Director of Simon Property Group, a real |
| estate investment company (1998-2010) |
| • Chairman and Chief Executive Officer of Simon Global Limited (1999-2010) |
| No. of Portfolios for which Board Member Serves: 27 |
| ——————— |
| Robin A. Melvin (49) |
| Board Member (1995) |
| Principal Occupation During Past 5Years: |
| • Director, Boisi Family Foundation, a private family foundation that supports youth-serving orga- |
| nizations that promote the self sufficiency of youth from disadvantaged circumstances (1995-2012) |
| No. of Portfolios for which Board Member Serves: 100 |
40
|
| Burton N.Wallack (62) |
| Board Member (2006) |
| Principal Occupation During Past 5Years: |
| • President and Co-owner of Wallack Management Company, a real estate management company |
| No. of Portfolios for which Board Member Serves: 27 |
| ——————— |
| John E. Zuccotti (75) |
| Board Member (1984) |
| Principal Occupation During Past 5Years: |
| • Chairman of Brookfield Properties, Inc. |
| • Senior Counsel of Weil, Gotshal & Manges, LLP |
| • Emeritus Chairman of the Real Estate Board of New York |
| Other Public Company Board Memberships During Past 5Years: |
| • Emigrant Savings Bank, Director (2004-present) |
| • Doris Duke Charitable Foundation,Trustee (2006-present) |
| • New York Private Bank & Trust, Director |
| No. of Portfolios for which Board Member Serves: 27 |
| ——————— |
| Once elected all Board Members serve for an indefinite term, but achieve Emeritus status upon reaching age 80.The |
| address of the Board Members and Officers is c/o The Dreyfus Corporation, 200 Park Avenue, NewYork, NewYork |
| 10166.Additional information about the Board Members is available in the fund’s Statement of Additional Information |
| which can be obtained from Dreyfus free of charge by calling this toll free number: 1-800-DREYFUS. |
| David W. Burke, Emeritus Board Member |
| Arnold S. Hiatt, Emeritus Board Member |
The Fund 41
OFFICERS OF THE FUND (Unaudited)
42

The Fund 43
Item 2. Code of Ethics.
The Registrant has adopted a code of ethics that applies to the Registrant's principal executive officer, principal financial officer, principal accounting officer or controller, or persons performing similar functions. There have been no amendments to, or waivers in connection with, the Code of Ethics during the period covered by this Report.
Item 3. Audit Committee Financial Expert.
The Registrant's Board has determined that Ehud Houminer, a member of the Audit Committee of the Board, is an audit committee financial expert as defined by the Securities and Exchange Commission (the "SEC"). Ehud Houminer is "independent" as defined by the SEC for purposes of audit committee financial expert determinations.
Item 4. Principal Accountant Fees and Services.
(a) Audit Fees. The aggregate fees billed for each of the last two fiscal years (the "Reporting Periods") for professional services rendered by the Registrant's principal accountant (the "Auditor") for the audit of the Registrant's annual financial statements or services that are normally provided by the Auditor in connection with the statutory and regulatory filings or engagements for the Reporting Periods, were $142,464 in 2011 and $144,962 in 2012.
(b) Audit-Related Fees. The aggregate fees billed in the Reporting Periods for assurance and related services by the Auditor that are reasonably related to the performance of the audit of the Registrant's financial statements and are not reported under paragraph (a) of this Item 4 were $24,000 in 2011 and $48,000 in 2012. These services consisted of one or more of the following: (i) agreed upon procedures related to compliance with Internal Revenue Code section 817(h), (ii) security counts required by Rule 17f-2 under the Investment Company Act of 1940, as amended, (iii) advisory services as to the accounting or disclosure treatment of Registrant transactions or events and (iv) advisory services to the accounting or disclosure treatment of the actual or potential impact to the Registrant of final or proposed rules, standards or interpretations by the Securities and Exchange Commission, the Financial Accounting Standards Boards or other regulatory or standard-setting bodies.
The aggregate fees billed in the Reporting Periods for non-audit assurance and related services by the Auditor to the Registrant's investment adviser (not including any sub-investment adviser whose role is primarily portfolio management and is subcontracted with or overseen by another investment adviser), and any entity controlling, controlled by or under common control with the investment adviser that provides ongoing services to the Registrant ("Service Affiliates"), that were reasonably related to the performance of the annual audit of the Service Affiliate, which required pre-approval by the Audit Committee were $0 in 2011 and $0 in 2012.
(c) Tax Fees. The aggregate fees billed in the Reporting Periods for professional services rendered by the Auditor for tax compliance, tax advice, and tax planning ("Tax Services") were $11,489 in 2011 and $19,386 in 2012. These services consisted of: (i) review or preparation of U.S. federal, state, local and excise tax returns; (ii) U.S. federal, state and local tax planning, advice and assistance regarding statutory, regulatory or administrative developments; (iii) tax advice regarding tax qualification matters and/or treatment of various financial instruments held or proposed to be acquired or held, and (iv) determination of Passive Foreign Investment Companies. The aggregate fees billed in the Reporting Periods for Tax Services by the Auditor to Service Affiliates, which required pre-approval by the Audit Committee were $0 in 2011 and $0 in 2012.
(d) All Other Fees. The aggregate fees billed in the Reporting Periods for products and services provided by the Auditor, other than the services reported in paragraphs (a) through (c) of this Item, were $766 in 2011 and $444 in 2012. [These services consisted of a review of the Registrant's anti-money laundering program].
The aggregate fees billed in the Reporting Periods for Non-Audit Services by the Auditor to Service Affiliates, other than the services reported in paragraphs (b) through (c) of this Item, which required pre-approval by the Audit Committee, were $0 in 2011 and $200,000 in 2012.
(e)(1) Audit Committee Pre-Approval Policies and Procedures. The Registrant's Audit Committee has established policies and procedures (the "Policy") for pre-approval (within specified fee limits) of the Auditor's engagements for non-audit services to the Registrant and Service Affiliates without specific case-by-case consideration. The pre-approved services in the Policy can include pre-approved audit services, pre-approved audit-related services, pre-approved tax services and pre-approved all other services. Pre-approval considerations include whether the proposed services are compatible with maintaining the Auditor's independence. Pre-approvals pursuant to the Policy are considered annually.
(e)(2) Note: None of the services described in paragraphs (b) through (d) of this Item 4 were approved by the Audit Committee pursuant to paragraph (c)(7)(i)(C) of Rule 2-01 of Regulation S-X.
(f) None of the hours expended on the principal accountant's engagement to audit the registrant's financial statements for the most recent fiscal year were attributed to work performed by persons other than the principal account's full-time, permanent employees.
Non-Audit Fees. The aggregate non-audit fees billed by the Auditor for services rendered to the Registrant, and rendered to Service Affiliates, for the Reporting Periods were $19,415,177 in 2011 and $50,505,978 in 2012.
Auditor Independence. The Registrant's Audit Committee has considered whether the provision of non-audit services that were rendered to Service Affiliates, which were not pre-approved (not requiring pre-approval), is compatible with maintaining the Auditor's independence.
Item 5. Audit Committee of Listed Registrants.
Not applicable. [CLOSED-END FUNDS ONLY]
Item 6. Investments.
(a) Not applicable.
Item 7. Disclosure of Proxy Voting Policies and Procedures for Closed-End Management Investment Companies.
Not applicable. [CLOSED-END FUNDS ONLY]
Item 8. Portfolio Managers of Closed-End Management Investment Companies.
Not applicable. [CLOSED-END FUNDS ONLY, beginning with reports for periods ended on and after December 31, 2005]
Item 9. Purchases of Equity Securities by Closed-End Management Investment Companies and Affiliated Purchasers.
Not applicable. [CLOSED-END FUNDS ONLY]
Item 10. Submission of Matters to a Vote of Security Holders.
There have been no material changes to the procedures applicable to Item 10.
Item 11. Controls and Procedures.
(a) The Registrant's principal executive and principal financial officers have concluded, based on their evaluation of the Registrant's disclosure controls and procedures as of a date within 90 days of the filing date of this report, that the Registrant's disclosure controls and procedures are reasonably designed to ensure that information required to be disclosed by the Registrant on Form N-CSR is recorded, processed, summarized and reported within the required time periods and that information required to be disclosed by the Registrant in the reports that it files or submits on Form N-CSR is accumulated and communicated to the Registrant's management, including its principal executive and principal financial officers, as appropriate to allow timely decisions regarding required disclosure.
(b) There were no changes to the Registrant's internal control over financial reporting that occurred during the second fiscal quarter of the period covered by this report that have materially affected, or are reasonably likely to materially affect, the Registrant's internal control over financial reporting.
Item 12. Exhibits.
(a)(1) Code of ethics referred to in Item 2.
(a)(2) Certifications of principal executive and principal financial officers as required by Rule 30a-2(a) under the Investment Company Act of 1940.
(a)(3) Not applicable.
(b) Certification of principal executive and principal financial officers as required by Rule 30a-2(b) under the Investment Company Act of 1940.
SIGNATURES
Pursuant to the requirements of the Securities Exchange Act of 1934 and the Investment Company Act of 1940, the Registrant has duly caused this Report to be signed on its behalf by the undersigned, thereunto duly authorized.
STRATEGIC FUNDS, INC
By: /s/ Bradley J. Skapyak |
Bradley J. Skapyak, President |
Date: | January 24, 2013 |
|
Pursuant to the requirements of the Securities Exchange Act of 1934 and the Investment Company Act of 1940, this Report has been signed below by the following persons on behalf of the Registrant and in the capacities and on the dates indicated. |
|
By: /s/ Bradley J. Skapyak |
Bradley J. Skapyak, President |
Date: | January 24, 2013 |
|
By: /s/ James Windels |
James Windels, Treasurer |
Date: | January 24, 2013 |
|
EXHIBIT INDEX
(a)(1) Code of ethics referred to in Item 2.
(a)(2) Certifications of principal executive and principal financial officers as required by Rule 30a-2(a) under the Investment Company Act of 1940. (EX-99.CERT)
(b) Certification of principal executive and principal financial officers as required by Rule 30a-2(b) under the Investment Company Act of 1940. (EX-99.906CERT)