UNITED STATES
SECURITIES AND EXCHANGE COMMISSION
Washington, D.C. 20549
FORM N-CSR
CERTIFIED SHAREHOLDER REPORT OF REGISTERED MANAGEMENT
INVESTMENT COMPANIES
Investment Company Act file number | 811-3940 |
| |
| Strategic Funds, Inc. | |
| (Exact name of Registrant as specified in charter) | |
| | |
| c/o The Dreyfus Corporation 200 Park Avenue New York, New York 10166 | |
| (Address of principal executive offices) (Zip code) | |
| | |
| John Pak, Esq. 200 Park Avenue New York, New York 10166 | |
| (Name and address of agent for service) | |
|
Registrant's telephone number, including area code: | (212) 922-6000 |
| |
Date of fiscal year end: | 8/31 | |
Date of reporting period: | 8/31/2013 | |
| | | | | | | |
The following N-CSR relates only to the Registrant’s series listed below and does not affect the other series of the Registrant, which have different fiscal year ends and, therefore, different N-CSR reporting requirements. Separate N-CSR Forms will be filed for these series, as appropriate.
Dreyfus Conservative Allocation Fund
Dreyfus Growth Allocation Fund
Dreyfus Moderate Allocation Fund
FORM N-CSR
Item 1. Reports to Stockholders.
Dreyfus
Conservative
Allocation Fund
ANNUAL REPORT August 31, 2013

Save time. Save paper. View your next shareholder report online as soon as it’s available. Log into www.dreyfus.com and sign up for Dreyfus eCommunications. It’s simple and only takes a few minutes.
The views expressed in this report reflect those of the portfolio manager only through the end of the period covered and do not necessarily represent the views of Dreyfus or any other person in the Dreyfus organization. Any such views are subject to change at any time based upon market or other conditions and Dreyfus disclaims any responsibility to update such views.These views may not be relied on as investment advice and, because investment decisions for a Dreyfus fund are based on numerous factors, may not be relied on as an indication of trading intent on behalf of any Dreyfus fund.
Not FDIC-Insured • Not Bank-Guaranteed • May Lose Value
| |
| Contents |
| |
| | THE FUND |
| 2 | A Letter from the President |
| 3 | Discussion of Fund Performance |
| 6 | Fund Performance |
| 7 | Understanding Your Fund’s Expenses |
| 7 | Comparing Your Fund’s Expenses |
| With Those of Other Funds |
| 8 | Statement of Investments |
| 9 | Statement of Assets and Liabilities |
| 10 | Statement of Operations |
| 11 | Statement of Changes in Net Assets |
| 12 | Financial Highlights |
| 13 | Notes to Financial Statements |
| 23 | Report of Independent Registered |
| | Public Accounting Firm |
| 24 | Important Tax Information |
| 25 | Board Members Information |
| 28 | Officers of the Fund |
| |
| FOR MORE INFORMATION |
|
| | Back Cover |
Dreyfus
Conservative
Allocation Fund
The Fund
A LETTER FROM THE PRESIDENT
Dear Shareholder:
We are pleased to present this annual report for Dreyfus Conservative Allocation Fund, covering the 12-month period from September 1, 2012, through August 31, 2013. For information about how the fund performed during the reporting period, as well as general market perspectives, we provide a Discussion of Fund Performance on the pages that follow.
U.S. equities fared quite well over the past year, weathering periodic bouts of volatility after setting new record highs in the spring for many broad measures of stock market performance. Low interest rates, muted inflationary pressures, and a strong U.S. dollar helped fuel the market’s gains, as did a declining unemployment rate, rebounding housing markets, and increased production of domestic oil and natural gas.
In our analysis, the U.S. economy is nearing an inflection point to a somewhat faster growth rate.We expect a reduced fiscal drag in 2014 and beyond, and the stimulative monetary policy of the past five years should continue to support economic expansion, particularly in interest rate-sensitive industry groups. For information on how these developments may affect your investments, we urge you to discuss these matters with your financial advisor.
Thank you for your continued confidence and support.
Sincerely,
J. Charles Cardona
President
The Dreyfus Corporation
September 16, 2013
2
DISCUSSION OF FUND PERFORMANCE
For the period of September 1, 2012, through August 31, 2013, as provided by Richard B. Hoey and Keith L. Stransky, CFA, Dreyfus Investment Committee Members
Fund and Market Performance Overview
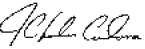
For the 12-month period ended August 31, 2013, Dreyfus Conservative Allocation Fund produced a total return of 5.19%.1 In comparison, the fund’s benchmark, the Standard & Poor’s 500 Composite Stock Price Index produced a total return of 18.70% for the same period.The fund also utilizes a customized blended index composed of 40% Standard & Poor’s 500 Composite Stock Price Index and 60% Barclays U.S. Aggregate Bond Index, and this blended index returned 6.00% for the same period.2
U.S. stocks rallied over much of the reporting period, and bonds generally lost a degree of value as investors responded to improving economic data. The fund modestly underperformed its blended benchmark, mainly due to shortfalls in Dreyfus Appreciation Fund and Dreyfus International Stock Fund.
The Fund’s Investment Approach
Dreyfus Conservative Allocation Fund seeks current income with some consideration for capital appreciation. In pursuing its goal, the fund normally allocates 40% of its assets to equity securities and 60% of its assets to fixed income securities.
The fund achieves its targeted asset allocation mix by investing in other mutual funds that are advised by The Dreyfus Corporation (Dreyfus). In turn, the underlying funds invest in a wide range of equity and fixed income securities, including U.S. large-, mid-, and small-cap equities; international, global, and emerging-market equities; and U.S. and international fixed income securities.
The Dreyfus Investment Committee selects the underlying funds based on their investment objectives and management policies, portfolio holdings, risk/reward profiles, historical performance, and other factors.The fund may invest in any of 31 underlying funds identified by the Dreyfus Investment Committee, which generally will select only certain, and not all, of the underlying funds for investment at any given time.
The Fund 3
DISCUSSION OF FUND PERFORMANCE (continued)
Recovering Economy Fueled Equity Market’s Gains
The reporting period began near the outset of a sustained rally among stocks and higher yielding bonds as investors responded positively to improved U.S. employment and housing market data. In addition, investors were encouraged by an aggressively accommodative monetary policy from the Federal Reserve Board (the “Fed”), including the launch of a new round of quantitative easing. Improving conditions in overseas markets also contributed to greater investor optimism.
Economic data remained favorable, and stocks generally continued to rally, through the spring of 2013. By mid-May, several broad measures of stock market performance reached new record highs. In late May, remarks by Fed chairman Ben Bernanke were interpreted as a signal that U.S. monetary policymakers were likely to back away from their quantitative easing program sooner than expected. Consequently, most financial markets encountered heightened volatility in June, erasing some of the stock market’s previous gains and causing bonds to lose value. Financial markets generally stabilized in July and August when investors returned their focus to company and market fundamentals.
Fund Participated Substantially in Market’s Gains
Although the fund participated significantly in the blended benchmark’s gains, relative performance was constrained by Dreyfus Appreciation Fund, where a high-quality bias and disappointing security selections in the energy sector hurt results. Dreyfus International Stock Fund also lagged market averages, due mainly to shortfalls in China and underweighted exposure to Europe. A mildly overweighted position and poor stock selections in the emerging markets also hurt relative performance.
The fund achieved better results from its modest emphasis on stocks over bonds throughout the reporting period. Positions in small- and mid-cap stocks were particularly helpful. The fund received especially positive contributions from Dreyfus Opportunistic Midcap Value Fund, which achieved above-average results in the financials sector, and Dreyfus StrategicValue Fund, which was bolstered by successful security selections in the financials and energy sectors.
Within the fund’s bond component, relatively strong results from Dreyfus Intermediate-Term Income Fund were largely offset by the underperformance of Dreyfus Bond Market Index Fund.
4
The Dreyfus Investment Committee made three tactical changes to the fund’s investment allocations during the reporting period. In December, we shifted assets from Dreyfus Global Absolute Return Fund into Dreyfus Short-Intermediate Government Bond and Dreyfus Mid-Cap Index Fund.This move generally contributed positively to relative performance. In February, we shifted assets from an S&P 500 Index Fund to Dreyfus Disciplined Stock Fund, believing that active management should provide higher returns. In June, we reduced the fund’s position in Dreyfus Research Growth Fund and added to Global REITS, reflecting an improved outlook for housing markets.
Maintaining a Constructive Posture
Europe’s financial troubles have eased, and the U.S. economy has continued to grow. These developments generally portend well for stocks, reinforcing our confidence in the fund’s current bias toward equities. At the same time, we are aware of recently increased stock valuations and geopolitical risks in various regions of the world.We are carefully watching these and other developments in domestic and global markets, and we stand prepared to adjust the fund’s holdings as warranted.
September 16, 2013
Equity funds are subject generally to market, market sector, market liquidity, issuer and investment style risks, among
other factors, to varying degrees, all of which are more fully described in the fund’s prospectus. Stocks of small- and/or
midcap companies often experience sharper price fluctuations than stocks of large-cap companies.
Asset allocation and diversification cannot assure a profit or protect against loss.
The ability of the fund to achieve its investment goal depends, in part, on the ability of the Dreyfus Investment
Committee to allocate effectively the fund’s assets among the asset classes and the underlying funds.There can be no
assurance that the actual allocations will be effective in achieving the fund’s investment goal.
Bond funds are subject generally to interest rate, credit, liquidity and market risks, to varying degrees, all of which are
more fully described in the fund’s prospectus. Generally, all other factors being equal, bond prices are inversely related
to interest-rate changes and rate increases can cause price declines.
Investing internationally involves special risks, including changes in currency exchange rates, political, economic and
social instability, a lack of comprehensive company information, differing auditing and legal standards and less market
liquidity. Emerging markets tend to be more volatile than the markets of more mature economies, and generally have
less diverse and less mature economic structures and less stable political systems than those of developed countries.
1 Total return includes reinvestment of dividends and any capital gains paid. Past performance is no guarantee of future
results. Share price and investment return fluctuate such that upon redemption fund shares may be worth more or less
than their original cost. Return figure provided reflects the absorption of certain fund expenses by The Dreyfus
Corporation pursuant to an agreement in effect through January 1, 2014, at which time it may be extended,
terminated or modified. Had these expenses not been absorbed, the fund’s return would have been lower.
2 SOURCE: LIPPER INC. — Reflects reinvestment of dividends and, where applicable, capital gain distributions.
The Standard & Poor’s 500 Composite Stock Price Index is a widely accepted, unmanaged index of U.S. stock
market performance.The Barclays U.S.Aggregate Bond Index is a widely accepted, unmanaged total return index of
corporate, U.S. government and U.S. government agency debt instruments, mortgage-backed securities and asset-backed
securities with an average maturity of 1-10 years. Investors cannot invest directly in any index.
The Fund 5
Years Ended 8/31
Comparison of change in value of $10,000 investment in Dreyfus Conservative Allocation Fund with the Standard & Poor’s 500 Composite Stock Price Index and the Customized Blended Index
| | | | | |
| Average Annual Total Returns as of 8/31/13 | | | | | |
| | Inception | | | From | |
| | Date | 1 | Year | Inception | |
| Fund | 10/1/09 | 5.19 | % | 6.77 | % |
| Standard & Poor’s 500 | | | | | |
| Composite Stock Price Index | 9/30/09 | 18.70 | % | 14.13 | %†† |
| Customized Blended Index | 9/30/09 | 6.00 | % | 8.18 | %†† |
† Source: Lipper Inc.
Past performance is not predictive of future performance.The fund’s performance shown in the graph and table does not
reflect the deduction of taxes that a shareholder would pay on fund distributions or the redemption of fund shares.
The above graph compares a $10,000 investment made in Dreyfus Conservative Allocation Fund on 10/1/09
(inception date) to a $10,000 investment made in two different indices: (1) the Standard & Poor’s 500 Composite
Stock Price Index (the “S&P 500 Index”) and (2) the Customized Blended Index.The Customized Blended Index is
calculated on a year-to-date basis.All dividends and capital gain distributions are reinvested.
The fund’s performance shown in the line graph above takes into account all applicable fees and expenses.The S&P 500
Index is a widely accepted, unmanaged index of U.S. stock market performance.The Customized Blended Index is
composed of the S&P 500 Index, 40% and the Barclays U.S.Aggregate Bond Index (the “Barclays Index”), 60%.
The Barclays Index is a widely accepted, unmanaged index of corporate, government and government agency debt
instruments, mortgage-backed securities and asset-backed securities with an average maturity of 1-10 years. Unlike a
mutual fund, the indices are not subject to charges, fees and other expenses. Investors cannot invest directly in any index.
Further information relating to fund performance, including expense reimbursements, if applicable, is contained in the
Financial Highlights section of the prospectus and elsewhere in this report.
† † For comparative purposes, the value of each index on 9/30/09 is used as the beginning value on 10/1/09.6
UNDERSTANDING YOUR FUND’S EXPENSES (Unaudited)
As a mutual fund investor, you pay ongoing expenses, such as management fees and other expenses. Using the information below, you can estimate how these expenses affect your investment and compare them with the expenses of other funds.You also may pay one-time transaction expenses, including sales charges (loads) and redemption fees, which are not shown in this section and would have resulted in higher total expenses. For more information, see your fund’s prospectus or talk to your financial adviser.
Review your fund’s expenses
The table below shows the expenses you would have paid on a $1,000 investment in Dreyfus Conservative Allocation Fund from March 1, 2013 to August 31, 2013. It also shows how much a $1,000 investment would be worth at the close of the period, assuming actual returns and expenses.
Expenses and Value of a $1,000 Investment
assuming actual returns for the six months ended August 31, 2013
| | |
| Expenses paid per $1,000† | $ | 1.21 |
| Ending value (after expenses) | $ | 1,006.10 |
COMPARING YOUR FUND’S EXPENSES WITH THOSE OF OTHER FUNDS (Unaudited)
Using the SEC’s method to compare expenses
The Securities and Exchange Commission (SEC) has established guidelines to help investors assess fund expenses. Per these guidelines, the table below shows your fund’s expenses based on a $1,000 investment, assuming a hypothetical 5% annualized return. You can use this information to compare the ongoing expenses (but not transaction expenses or total cost) of investing in the fund with those of other funds.All mutual fund shareholder reports will provide this information to help you make this comparison. Please note that you cannot use this information to estimate your actual ending account balance and expenses paid during the period.
Expenses and Value of a $1,000 Investment
assuming a hypothetical 5% annualized return for the six months ended August 31, 2013
| | |
| Expenses paid per $1,000† | $ | 1.22 |
| Ending value (after expenses) | $ | 1,024.00 |
† Expenses are equal to the fund's annualized expense ratio of .24%, multiplied by the average account value over the
period, multiplied by 184/365 (to reflect the one-half year period).
The Fund 7
STATEMENT OF INVESTMENTS
August 31, 2013
| | | | | | | |
| Registered Investment Companies—100.2% | Shares | | | | Value ($) | |
| Dreyfus Appreciation Fund, Investor Shares | 31,320 | | a | | 1,476,755 | |
| Dreyfus Bond Market Index Fund, BASIC Shares | 536,975 | | a | | 5,632,868 | |
| Dreyfus Disciplined Stock Fund | | 24,340 | | a | | 900,580 | |
| Dreyfus Emerging Markets Debt Local Currency Fund, Cl. I | | 111,106 | | a | | 1,503,270 | |
| Dreyfus Emerging Markets Fund, Cl. I | | 69,965 | | a | | 626,185 | |
| Dreyfus Global Real Estate Securities Fund, Cl. I | 79,763 | | a | | 634,117 | |
| Dreyfus High Yield Fund, Cl. I | | 266,999 | | a | | 1,756,851 | |
| Dreyfus Intermediate Term Income Fund, Cl. I | 403,178 | | a | | 5,442,901 | |
| Dreyfus International Bond Fund, Cl. I | | 95,930 | | a | | 1,571,338 | |
| Dreyfus International Equity Fund, Cl. I | 8,296 | | a | | 261,076 | |
| Dreyfus International Stock Index Fund | 26,909 | | a | | 416,553 | |
| Dreyfus International Value Fund, Cl. I | 20,147 | | a | | 231,897 | |
| Dreyfus MidCap Index Fund | | 4,532 | | a | | 152,991 | |
| Dreyfus Opportunistic Midcap Value Fund, Cl. I | 13,881 | | a | | 529,150 | |
| Dreyfus Research Growth Fund, Cl. Z | | 141,401 | | a | | 1,705,293 | |
| Dreyfus Short-Intermediate Government Fund | 18,985 | | a | | 198,957 | |
| Dreyfus Small Cap Stock Index Fund | | 20,162 | | a | | 534,101 | |
| Dreyfus Strategic Value Fund, Cl. I | | 38,221 | | a | | 1,427,932 | |
| Dreyfus Structured Midcap Fund, Cl. I | | 19,048 | | a | | 512,379 | |
| Dreyfus U.S. Equity Fund, Cl. I | | 74,556 | | a | | 1,333,805 | |
| Dreyfus/Newton International Equity Fund, Cl. I | 22,733 | | a | | 430,333 | |
| Dreyfus/The Boston Company | | | | | | | |
| Small/Mid Cap Growth Fund, Cl. I | | 30,561 | | a | | 552,538 | |
| International Stock Fund, Cl. I | | 22,797 | | a | | 336,711 | |
| |
| Total Investments (cost $26,660,369) | 100.2 | % | | | 28,168,581 | |
| Liabilities, Less Cash and Receivables | (.2 | %) | | | (52,248 | ) |
| Net Assets | | 100.0 | % | | | 28,116,333 | |
| |
| a Investment in affiliated mutual fund. | | | | | | | |
| |
| |
| Portfolio Summary (Unaudited)† | | | | | | |
| | Value (%) | | | | | Value (%) | |
| Mutual Funds: Domestic | 78.8 | Mutual Funds: Foreign | | | | 21.4 | |
| | | | | | | 100.2 | |
| † Based on net assets. | | | | | | | |
| See notes to financial statements. | | | | | | | |
8
STATEMENT OF ASSETS AND LIABILITIES
August 31, 2013
| | |
| | Cost | Value |
| Assets ($): | | |
| Investments in securities—See Statement of | | |
| Investments—Note 1(c) | 26,660,369 | 28,168,581 |
| Cash | | 374 |
| Receivable for shares of Capital Stock subscribed | | 26 |
| Prepaid expenses | | 4,886 |
| | | 28,173,867 |
| Liabilities ($): | | |
| Due to The Dreyfus Corporation and affiliates—Note 3(b) | | 7,776 |
| Accrued expenses | | 49,758 |
| | | 57,534 |
| Net Assets ($) | | 28,116,333 |
| Composition of Net Assets ($): | | |
| Paid-in capital | | 26,236,614 |
| Accumulated undistributed investment income—net | | 264,637 |
| Accumulated net realized gain (loss) on investments | | 106,870 |
| Accumulated net unrealized appreciation | | |
| (depreciation) on investments | | 1,508,212 |
| Net Assets ($) | | 28,116,333 |
| Shares Outstanding | | |
| (100 million shares of $.001 par value Common Stock authorized) | | 1,890,621 |
| Net Asset Value, offering and redemption price per share ($) | | 14.87 |
| |
| See notes to financial statements. | | |
The Fund 9
STATEMENT OF OPERATIONS
Year Ended August 31, 2013
| | |
| Investment Income ($): | | |
| Income: | | |
| Cash dividends from affiliated issuers | 571,190 | |
| Expenses: | | |
| Shareholder servicing costs—Note 3(b) | 75,623 | |
| Professional fees | 42,348 | |
| Registration fees | 18,319 | |
| Prospectus and shareholders' reports | 10,830 | |
| Custodian fees—Note 3(b) | 2,554 | |
| Directors' fees and expenses—Note 3(c) | 1,984 | |
| Miscellaneous | 15,756 | |
| Total Expenses | 167,414 | |
| Less—reduction in expenses due to undertaking—Note 3(a) | (81,013 | ) |
| Less—waiver of shareholder servicing fees—Note 3(b) | (8,554 | ) |
| Less—reduction in fees due to earnings credits—Note 3(b) | (77 | ) |
| Net Expenses | 77,770 | |
| Investment Income—Net | 493,420 | |
| Realized and Unrealized Gain (Loss) on Investments—Note 4 ($): | | |
| Net realized gain (loss) on investments in affiliated issuers | (59,494 | ) |
| Capital gain distributions from affiliated issuers | 405,080 | |
| Net Realized Gain (Loss) | 345,586 | |
| Net unrealized appreciation (depreciation) on investments in affiliated issuers | 304,409 | |
| Net Realized and Unrealized Gain (Loss) on Investments | 649,995 | |
| Net Increase in Net Assets Resulting from Operations | 1,143,415 | |
| |
| See notes to financial statements. | | |
10
STATEMENT OF CHANGES IN NET ASSETS
| | | | |
| | Year Ended August 31, | |
| | 2013 | | 2012 | |
| Operations ($): | | | | |
| Investment income—net | 493,420 | | 310,032 | |
| Net realized gain (loss) on | | | | |
| investments in affiliated issuers | 345,586 | | 111,553 | |
| Net unrealized appreciation (depreciation) | | | | |
| on investments in affiliated issuers | 304,409 | | 884,774 | |
| Net Increase (Decrease) in Net Assets | | | | |
| Resulting from Operations | 1,143,415 | | 1,306,359 | |
| Dividends to Shareholders from ($): | | | | |
| Investment income—net | (441,100 | ) | (333,599 | ) |
| Net realized gain on investments | (162,672 | ) | (90,661 | ) |
| Total Dividends | (603,772 | ) | (424,260 | ) |
| Capital Stock Transactions ($): | | | | |
| Net proceeds from shares sold | 9,191,156 | | 5,659,094 | |
| Dividends reinvested | 583,262 | | 406,145 | |
| Cost of shares redeemed | (3,007,506 | ) | (3,015,029 | ) |
| Increase (Decrease) in Net Assets | | | | |
| from Capital Stock Transactions | 6,766,912 | | 3,050,210 | |
| Total Increase (Decrease) in Net Assets | 7,306,555 | | 3,932,309 | |
| Net Assets ($): | | | | |
| Beginning of Period | 20,809,778 | | 16,877,469 | |
| End of Period | 28,116,333 | | 20,809,778 | |
| Undistributed investment income—net | 264,637 | | 139,745 | |
| Capital Share Transactions (Shares): | | | | |
| Shares sold | 618,415 | | 405,840 | |
| Shares issued for dividends reinvested | 40,253 | | 29,923 | |
| Shares redeemed | (201,362 | ) | (215,978 | ) |
| Net Increase (Decrease) in Shares Outstanding | 457,306 | | 219,785 | |
| See notes to financial statements. | | | | |
The Fund 11
FINANCIAL HIGHLIGHTS
The following table describes the performance for the fiscal periods indicated. Total return shows how much your investment in the fund would have increased (or decreased) during each period, assuming you had reinvested all dividends and distributions.These figures have been derived from the fund’s financial statements.
| | | | | | | | |
| | | | Year Ended August 31, | | | |
| | 2013 | | 2012 | | 2011 | | 2010 | a |
| Per Share Data ($): | | | | | | | | |
| Net asset value, beginning of period | 14.52 | | 13.91 | | 12.99 | | 12.50 | |
| Investment Operations: | | | | | | | | |
| Investment income—netb | .30 | | .23 | | .25 | | .20 | |
| Net realized and unrealized | | | | | | | | |
| gain (loss) on investments | .45 | | .71 | | 1.00 | | .41 | |
| Total from Investment Operations | .75 | | .94 | | 1.25 | | .61 | |
| Distributions: | | | | | | | | |
| Dividends from investment income—net | (.29 | ) | (.26 | ) | (.28 | ) | (.12 | ) |
| Dividends from net realized | | | | | | | | |
| gain on investments | (.11 | ) | (.07 | ) | (.05 | ) | — | |
| Total Distributions | (.40 | ) | (.33 | ) | (.33 | ) | (.12 | ) |
| Net asset value, end of period | 14.87 | | 14.52 | | 13.91 | | 12.99 | |
| Total Return (%) | 5.19 | | 6.89 | | 9.61 | | 4.91 | c |
| Ratios/Supplemental Data (%): | | | | | | | | |
| Ratio of total expenses | | | | | | | | |
| to average net assetsd | .68 | | .84 | | 1.06 | | 2.76 | e |
| Ratio of net expenses | | | | | | | | |
| to average net assetsd | .31 | | .71 | | .73 | | .71 | e |
| Ratio of net investment income | | | | | | | | |
| to average net assetsd | 1.99 | | 1.64 | | 1.79 | | 1.84 | e |
| Portfolio Turnover Rate | 37.15 | | 25.89 | | 20.04 | | 36.82 | c |
| Net Assets, end of period ($ x 1,000) | 28,116 | | 20,810 | | 16,877 | | 7,432 | |
a From October 1, 2009 (commencement of operations) to August 31, 2010.
b Based on average shares outstanding at each month end.
c Not annualized.
d Amounts do not include the activity of the underlying funds.
e Annualized.
See notes to financial statements.
12
NOTES TO FINANCIAL STATEMENTS
NOTE 1—Significant Accounting Policies:
Dreyfus Conservative Allocation Fund (the “fund”) is a separate diversified series of Strategic Funds, Inc. (the “Company”) which is registered under the Investment Company Act of 1940, as amended (the “Act”), as an open-end management investment company and operates as a series company currently offering nine series, including the fund.The fund’s investment objective is to seek current income with some consideration for capital appreciation. The Dreyfus Corporation (the “Manager” or “Dreyfus”), a wholly-owned subsidiary of The Bank of New York Mellon Corporation (“BNY Mellon”), serves as the fund’s investment adviser. MBSC Securities Corporation (the “Distributor”), a wholly-owned subsidiary of the Manager, is the distributor of the fund’s shares, which are sold to the public without a sales charge.
The Company accounts separately for the assets, liabilities and operations of each series. Expenses directly attributable to each series are charged to that series’ operations; expenses which are applicable to all series are allocated among them on a pro rata basis.
The Financial Accounting Standards Board (“FASB”) Accounting Standards Codification is the exclusive reference of authoritative U.S. generally accepted accounting principles (“GAAP”) recognized by the FASB to be applied by nongovernmental entities. Rules and interpretive releases of the Securities and Exchange Commission (“SEC”) under authority of federal laws are also sources of authoritative GAAP for SEC registrants. The fund’s financial statements are prepared in accordance with GAAP, which may require the use of management estimates and assumptions.Actual results could differ from those estimates.
The Company enters into contracts that contain a variety of indemnifications.The fund’s maximum exposure under these arrangements is unknown.The fund does not anticipate recognizing any loss related to these arrangements.
The Fund 13
NOTES TO FINANCIAL STATEMENTS (continued)
(a) Portfolio valuation: The fair value of a financial instrument is the amount that would be received to sell an asset or paid to transfer a liability in an orderly transaction between market participants at the measurement date (i.e., the exit price). GAAP establishes a fair value hierarchy that prioritizes the inputs of valuation techniques used to measure fair value.This hierarchy gives the highest priority to unadjusted quoted prices in active markets for identical assets or liabilities (Level 1 measurements) and the lowest priority to unobservable inputs (Level 3 measurements).
Additionally, GAAP provides guidance on determining whether the volume and activity in a market has decreased significantly and whether such a decrease in activity results in transactions that are not orderly. GAAP requires enhanced disclosures around valuation inputs and techniques used during annual and interim periods.
Various inputs are used in determining the value of the fund’s investments relating to fair value measurements.These inputs are summarized in the three broad levels listed below:
Level 1—unadjusted quoted prices in active markets for identical investments.
Level 2—other significant observable inputs (including quoted prices for similar investments, interest rates, prepayment speeds, credit risk, etc.).
Level 3—significant unobservable inputs (including the fund’s own assumptions in determining the fair value of investments).
The inputs or methodology used for valuing securities are not necessarily an indication of the risk associated with investing in those securities.
Investments are valued at the net asset value of each underlying fund determined as of the close of the NewYork Stock Exchange (generally 4 p.m., Eastern time) on the valuation date and are generally categorized within Level 1 of the fair value hierarchy.
14
The following is a summary of the inputs used as of August 31, 2013 in valuing the fund’s investments:
| | | | |
| | | Level 2—Other | Level 3— | |
| | Level 1— | Significant | Significant | |
| | Unadjusted | Observable | Unobservable | |
| | Quoted Prices | Inputs | Inputs | Total |
| Assets ($) | | | | |
| Investments in Securities: | | | |
| Mutual Funds | 28,168,581 | — | — | 28,168,581 |
At August 31, 2013, there were no transfers between Level 1 and Level 2 of the fair value hierarchy.
(b) Securities transactions and investment income: Securities transactions are recorded on a trade date basis. Realized gains and losses from securities transactions are recorded on the identified cost basis. Dividend income is recognized on the ex-dividend date and interest income, including, where applicable, accretion of discount and amortization of premium on investments, is recognized on the accrual basis.
(c) Affiliated issuers: Investments in other investment companies advised by Dreyfus are defined as “affiliated” under the Act. Investments in affiliated investment companies during the period ended August 31, 2013 were as follows:
| | | | | | |
| Affiliated | | | | | | |
| Investment | Value | | | | Net Realized | |
| Company | 8/31/2012 | ($) | Purchases ($)† | Sales ($) | Gain (Loss) ($) | |
| Dreyfus | | | | | | |
| Appreciation Fund, | | | | | | |
| Investor Shares | 1,074,982 | | 424,451 | 95,341 | (479 | ) |
| Dreyfus BASIC S&P | | | | | | |
| 500 Stock | | | | | | |
| Index Fund | 607,266 | | 131,185 | 789,200 | 53,053 | |
| Dreyfus Bond Market | | | | | | |
| Index Fund, | | | | | | |
| BASIC Shares | 4,593,092 | | 1,729,786 | 372,095 | (8,853 | ) |
| Dreyfus Disciplined | | | | | | |
| Stock Fund | — | | 884,045 | 39,337 | 132 | |
The Fund 15
NOTES TO FINANCIAL STATEMENTS (continued)
| | | | | | |
| Affiliated | | | | | | |
| Investment | Value | | | | Net Realized | |
| Company | 8/31/2012 | ($) | Purchases ($)† | Sales ($) | Gain (Loss) ($) | |
| Dreyfus Emerging | | | | | | |
| Markets Debt | | | | | | |
| Local Currency | | | | | | |
| Fund, Cl. I | 1,211,563 | | 530,238 | 113,501 | (3,523 | ) |
| Dreyfus Emerging | | | | | | |
| Markets Fund, Cl. I | 388,496 | | 365,713 | 85,315 | (5,469 | ) |
| Dreyfus Global | | | | | | |
| Absolute | | | | | | |
| Return Fund, Cl. I | 260,261 | | 23,697 | 276,108 | (1,890 | ) |
| Dreyfus Global Real | | | | | | |
| Estate Securities | | | | | | |
| Fund, Cl. I | 146,471 | | 514,712 | 12,485 | (219 | ) |
| Dreyfus High Yield | | | | | | |
| Fund, Cl. I | 1,283,573 | | 578,979 | 113,501 | (1,619 | ) |
| Dreyfus Intermediate | | | | | | |
| Term Income | | | | | | |
| Fund, Cl. I | — | | 5,902,259 | 195,958 | (5,017 | ) |
| Dreyfus International | | | | | | |
| Bond Fund, Cl. I | 1,225,507 | | 529,454 | 113,501 | (3,683 | ) |
| Dreyfus International | | | | | | |
| Equity Fund, Cl. I | 166,098 | | 76,752 | 17,025 | (363 | ) |
| Dreyfus International | | | | | | |
| Stock Index Fund | 271,302 | | 128,241 | 28,375 | (925 | ) |
| Dreyfus International | | | | | | |
| Value Fund, Cl. I | 143,041 | | 75,977 | 17,025 | (733 | ) |
| Dreyfus MidCap | | | | | | |
| Core Fund, Cl. I | 328,211 | | 153,639 | 514,566 | 66,822 | |
| Dreyfus MidCap | | | | | | |
| Index Fund | — | | 146,942 | 8,002 | (6 | ) |
| Dreyfus Opportunistic | | | | | | |
| Midcap Value | | | | | | |
| Fund, Cl. I | 328,394 | | 121,196 | 28,375 | (308 | ) |
| Dreyfus Research | | | | | | |
| Growth Fund, Cl. Z | 1,487,868 | | 525,520 | 575,499 | 32,778 | |
| Dreyfus Short- | | | | | | |
| Intermediate | | | | | | |
| Government Fund | — | | 212,956 | 11,855 | (51 | ) |
| Dreyfus Small Cap | | | | | | |
| Stock Index Fund | 341,799 | | 135,385 | 28,375 | 49 | |
| Dreyfus Strategic | | | | | | |
| Value Fund, Cl. I | 878,512 | | 359,223 | 81,721 | 282 | |
| Dreyfus Structured | | | | | | |
| Midcap Fund Cl. I | — | | 516,858 | 6,087 | (66 | ) |
| Dreyfus Total Return | | | | | | |
| Advantage | | | | | | |
| Fund, Cl. I | 4,352,802 | | 1,480,737 | 5,510,898 | (178,669 | ) |
16
| | | | | | | | |
| Affiliated | | | | | | | | |
| Investment | | Value | | | | | Net Realized | |
| Company | | 8/31/2012 | ($) | Purchases ($)† | | Sales ($) | Gain (Loss) ($) | |
| Dreyfus U.S. Equity | | | | | | | |
| Fund, Cl. I | | 890,485 | | 335,265 | | 77,181 | 149 | |
| Dreyfus/Newton | | | | | | | | |
| International | | | | | | | | |
| Equity Fund, Cl. I | 284,173 | | 124,596 | | 28,375 | (532 | ) |
| Dreyfus/The Boston | | | | | | | |
| Company Small/ | | | | | | | |
| Mid Cap Growth | | | | | | | |
| Fund, Cl. I | | 357,052 | | 148,399 | | 28,376 | (138 | ) |
| International Stock | | | | | | | |
| Fund, Cl. I | | 237,048 | | 100,243 | | 22,701 | (216 | ) |
| TOTAL | | 20,857,996 | | 16,256,448 | | 9,190,778 | (59,494 | ) |
| |
| † Includes reinvested dividends/distributions. | | | | | | |
| |
| | | Change in Net | | | | | | |
| Affiliated | | Unrealized | | | | | | |
| Investment | | Appreciation | | Value | | Net | Dividends/ | |
| Company | (Depreciation) ($) | | 8/31/2013 | ($) | Assets (%) | Distributions ($) | |
| Dreyfus | | | | | | | | |
| Appreciation Fund, | | | | | | | |
| Investor Shares | 73,142 | | 1,476,755 | | 5.3 | 22,209 | |
| Dreyfus BASIC | | | | | | | | |
| S&P 500 Stock | | | | | | | |
| Index Fund | | (2,304 | ) | — | | — | 7,096 | |
| Dreyfus Bond | | | | | | | | |
| Market Index | | | | | | | | |
| Fund, BASIC Shares | (309,062 | ) | 5,632,868 | | 20.0 | 159,928 | |
| Dreyfus Disciplined | | | | | | | |
| Stock Fund | | 55,740 | | 900,580 | | 3.2 | 3,007 | |
| Dreyfus Emerging | | | | | | | |
| Markets Debt Local | | | | | | | |
| Currency Fund, Cl. I | (121,507 | ) | 1,503,270 | | 5.3 | 51,380 | |
| Dreyfus Emerging | | | | | | | |
| Markets Fund, Cl. I | (37,240 | ) | 626,185 | | 2.2 | 5,771 | |
| Dreyfus Global | | | | | | | | |
| Absolute Return | | | | | | | |
| Fund, Cl. I | | (5,960 | ) | — | | — | — | |
| Dreyfus Global | | | | | | | | |
| Real Estate | | | | | | | | |
| Securities Fund, Cl. I | (14,362 | ) | 634,117 | | 2.3 | 9,119 | |
| Dreyfus High | | | | | | | | |
| Yield Fund, Cl. I | 9,419 | | 1,756,851 | | 6.3 | 100,121 | |
| Dreyfus Intermediate | | | | | | | |
| Term Income | | | | | | | | |
| Fund, Cl. I | | (258,383 | ) | 5,442,901 | | 19.4 | 45,690 | |
The Fund 17
NOTES TO FINANCIAL STATEMENTS (continued)
| | | | | | | |
| | | Change in Net | | | | | |
| Affiliated | | Unrealized | | | | | |
| Investment | | Appreciation | | Value | | Net | Dividends/ |
| Company | (Depreciation) ($) | | 8/31/2013 | ($) | Assets (%) | Distributions ($) |
| Dreyfus International | | | | | | |
| Bond Fund, Cl. I | (66,439 | ) | 1,571,338 | | 5.6 | 50,596 |
| Dreyfus International | | | | | | |
| Equity Fund, Cl. I | 35,614 | | 261,076 | | .9 | 4,924 |
| Dreyfus | | | | | | | |
| International | | | | | | | |
| Stock Index Fund | 46,310 | | 416,553 | | 1.5 | 8,527 |
| Dreyfus International | | | | | | |
| Value Fund, Cl. I | 30,637 | | 231,897 | | .8 | 4,148 |
| Dreyfus MidCap | | | | | | | |
| Core Fund, Cl. I | (34,106 | ) | — | | — | 58,505 |
| Dreyfus MidCap | | | | | | | |
| Index Fund | | 14,057 | | 152,991 | | .5 | 5,148 |
| Dreyfus Opportunistic | | | | | | |
| Midcap Value Fund, Cl. I 108,243 | | 529,150 | | 1.9 | 1,481 |
| Dreyfus Research | | | | | | |
| Growth Fund, Cl. Z | 234,626 | | 1,705,293 | | 6.1 | 8,353 |
| Dreyfus Short- | | | | | | | |
| Intermediate | | | | | | | |
| Government Fund | (2,093 | ) | 198,957 | | .7 | 885 |
| Dreyfus Small Cap | | | | | | |
| Stock Index Fund | 85,243 | | 534,101 | | 1.9 | 15,671 |
| Dreyfus Strategic | | | | | | |
| Value Fund, Cl. I | 271,636 | | 1,427,932 | | 5.1 | 14,445 |
| Dreyfus Structured | | | | | | |
| Midcap Fund Cl. I | 1,674 | | 512,379 | | 1.8 | — |
| Dreyfus Total Return | | | | | | |
| Advantage Fund, Cl. I | (143,972 | ) | — | | — | 351,587 |
| Dreyfus U.S. Equity | | | | | | |
| Fund, Cl. I | | 185,087 | | 1,333,805 | | 4.7 | 9,641 |
| Dreyfus/Newton | | | | | | | |
| International | | | | | | | |
| Equity Fund, Cl. I | 50,471 | | 430,333 | | 1.5 | 4,882 |
| Dreyfus/The Boston | | | | | | |
| Company Small/ | | | | | | |
| Mid Cap Growth | | | | | | |
| Fund, Cl. I | | 75,601 | | 552,538 | | 2.0 | 28,685 |
| International | | | | | | | |
| Stock Fund, Cl. I | 22,337 | | 336,711 | | 1.2 | 4,471 |
| TOTAL | | 304,409 | | 28,168,581 | | 100.2 | 976,270 |
(d) Dividends to shareholders: Dividends are recorded on the ex-dividend date. Dividends from investment income-net and dividends from net realized capital gains, if any, are normally declared and paid
18
annually, but the fund may make distributions on a more frequent basis to comply with the distribution requirements of the Internal Revenue Code of 1986, as amended (the “Code”).To the extent that net realized capital gains can be offset by capital loss carryovers, it is the policy of the fund not to distribute such gains. Income and capital gain distributions are determined in accordance with income tax regulations, which may differ from GAAP.
(e) Federal income taxes: It is the policy of the fund to continue to qualify as a regulated investment company, if such qualification is in the best interests of its shareholders, by complying with the applicable provisions of the Code, and to make distributions of taxable income sufficient to relieve it from substantially all federal income and excise taxes.
As of and during the period ended August 31, 2013, the fund did not have any liabilities for any uncertain tax positions.The fund recognizes interest and penalties, if any, related to uncertain tax positions as income tax expense in the Statement of Operations. During the period, the fund did not incur any interest or penalties.
Each tax year in the four-year period ended August 31, 2013 remains subject to examination by the Internal Revenue Service and state taxing authorities.
At August 31, 2013, the components of accumulated earnings on a tax basis were as follows: undistributed ordinary income $345,747, undistributed capital gains $194,063 and unrealized appreciation $1,339,909.
The tax character of distributions paid to shareholders during the fiscal periods ended August 31, 2013 and August 31, 2012 were as follows: ordinary income $441,713 and $369,837, and long-term capital gains $162,059 and $54,423, respectively.
During the period ended August 31, 2013, as a result of permanent book to tax differences, primarily due to the tax treatment for short-term capital gain distributions from regulated investment company holdings, the fund increased accumulated undistributed investment income-net by $72,572 and decreased accumulated net realized gain (loss) on invest-
The Fund 19
NOTES TO FINANCIAL STATEMENTS (continued)
ments by the same amount. Net assets and net asset value per share were not affected by this reclassification.
NOTE 2—Bank Lines of Credit:
The fund participates with other Dreyfus-managed funds in a $210 million unsecured credit facility led by Citibank, N.A. and a $300 million unsecured credit facility provided by The Bank of New York Mellon, a subsidiary of BNY Mellon and an affiliate of Dreyfus (each, a “Facility”), each to be utilized primarily for temporary or emergency purposes, including the financing of redemptions. Prior to October 10, 2012, the unsecured credit facility with Citibank, N.A. was $225 million. In connection therewith, the fund has agreed to pay its pro rata portion of commitment fees for each Facility. Interest is charged to the fund based on rates determined pursuant to the terms of the respective Facility at the time of borrowing. During the period ended August 31, 2013, the fund did not borrow under the Facilities.
NOTE 3—Management Fee and Other Transactions With Affiliates:
(a) Pursuant to a management agreement with the Manager, there is no management fee paid to the Manager.The fund invests in other mutual funds advised by the Manager. All fees and expenses of the underlying funds are reflected in the underlying funds’ net asset values.
The Manager had agreed, from September 1, 2012 through October 31, 2012, to assume the expenses of the fund so that the total annual fund’s and underlying funds’ operating expenses (excluding taxes, interest expense, brokerage commissions, commitment fees on borrowings and extraordinary expenses) did not exceed 1.40% of the value of the fund’s average daily net assets.Thereafter, the Manager has contractually agreed, from November 1, 2012 through January 1, 2014, to assume the expenses of the fund so that the total annual fund’s and underlying funds’ operating expenses (exclusive of certain expenses as described above) do not exceed .93% of the value of the fund’s average daily net assets. The reduction in expenses, pursuant to the undertaking, amounted to $81,013 during the period ended August 31, 2013.
20
(b) Under the Shareholder Services Plan, the fund pays the Distributor at an annual rate of .25% of the value of the fund’s average daily net assets for the provision of certain services. The services provided may include personal services relating to shareholder accounts, such as answering shareholder inquiries regarding the fund’s shares and providing reports and other information, and services related to the maintenance of shareholder accounts.The Distributor may make payments to Service Agents (securities dealers, financial institutions or other industry professionals) with respect to these services.The Distributor determines the amounts to be paid to Service Agents. Fees paid to the Distributor will be waived to the extent that the fund invests in an underlying affiliated fund with a Shareholder Services Plan. During the period ended August 31, 2013, the fund was charged $62,001 pursuant to the Shareholder Services Plan of which $8,554 was waived due to the fund’s investment in certain of the underlying funds.
The fund has arrangements with the transfer agent and the custodian whereby the fund may receive earnings credits when positive cash balances are maintained, which are used to offset transfer agency and custody fees. For financial reporting purposes, the fund includes net earnings credits as an expense offset in the Statement of Operations.
The fund compensates Dreyfus Transfer, Inc., a wholly-owned subsidiary of the Manager, under a transfer agency agreement for providing transfer agency services for the fund and cash management services related to fund subscriptions and redemptions. During the period ended August 31, 2013, the fund was charged $8,684 for transfer agency services and $620 for cash management services.These fees are included in Shareholder servicing costs in the Statement of Operations. Cash management fees were partially offset by earnings credits of $75.
The fund compensatesThe Bank of NewYork Mellon under a custody agreement for providing custodial services for the fund. During the period ended August 31, 2013, the fund was charged $2,554 pursuant to the custody agreement.
The Fund 21
NOTES TO FINANCIAL STATEMENTS (continued)
The fund compensates The Bank of New York Mellon under a cash management agreement for performing certain cash management services related to fund subscriptions and redemptions. During the period ended August 31, 2013, the fund was charged $321 pursuant to the cash management agreement, which is included in Shareholder servicing costs in the Statement of Operations.These fees were partially offset by earnings credits of $2.
During the period ended August 31, 2013, the fund was charged $8,973 for services performed by the Chief Compliance Officer and his staff.
The components of “Due toThe Dreyfus Corporation and affiliates” in the Statement of Assets and Liabilities consist of: Shareholder Services Plan fees $5,978, custodian fees $1,227, Chief Compliance Officer fees $6,172 and transfer agency fees $3,192, which are offset against an expense reimbursement currently in effect in the amount of $8,793.
(c) Each Board member also serves as a Board member of other funds within the Dreyfus complex. Annual retainer fees and attendance fees are allocated to each fund based on net assets.
NOTE 4—Securities Transactions:
The aggregate amount of purchases and sales of investment securities, excluding short-term securities, during the period ended August 31, 2013, amounted to $16,256,448 and $9,190,778, respectively.
At August 31, 2013, the cost of investments for federal income tax purposes was $26,828,672; accordingly, accumulated net unrealized appreciation on investments was $1,339,909, consisting of $2,016,548 gross unrealized appreciation and $676,639 gross unrealized depreciation.
22
REPORT OF INDEPENDENT REGISTERED
PUBLIC ACCOUNTING FIRM
Shareholders and Board of Directors Dreyfus Conservative Allocation Fund
We have audited the accompanying statement of assets and liabilities, including the statement of investments, of Dreyfus Conservative Allocation Fund (one of the series comprising Strategic Funds, Inc.) as of August 31, 2013, and the related statement of operations for the year then ended, the statement of changes in net assets for each of the two years in the period the ended, and the financial highlights for each of the periods indicated therein.These financial statements and financial highlights are the responsibility of the Fund’s management. Our responsibility is to express an opinion on these financial statements and financial highlights based on our audits.
We conducted our audits in accordance with the standards of the Public Company Accounting Oversight Board (United States).Those standards require that we plan and perform the audit to obtain reasonable assurance about whether the financial statements and financial highlights are free of material misstatement.We were not engaged to perform an audit of the Fund’s internal control over financial reporting. Our audits included consideration of internal control over financial reporting as a basis for designing audit procedures that are appropriate in the circumstances, but not for the purpose of expressing an opinion on the effectiveness of the Fund’s internal control over financial reporting. Accordingly, we express no such opinion.An audit also includes examining, on a test basis, evidence supporting the amounts and disclosures in the financial statements and financial highlights, assessing the accounting principles used and significant estimates made by management, and evaluating the overall financial statement presentation. Our procedures included confirmation of securities owned as of August 31, 2013 by correspondence with the custodian and others.We believe that our audits provide a reasonable basis for our opinion.
In our opinion, the financial statements and financial highlights referred to above present fairly, in all material respects, the financial position of Dreyfus Conservative Allocation Fund at August 31, 2013, the results of its operations for the year then ended, the changes in its net assets for each of the two years in the period then ended, and the financial highlights for each of the indicated periods, in conformity with U.S. generally accepted accounting principles.

New York, New York
October 28, 2013
The Fund 23
IMPORTANT TAX INFORMATION (Unaudited)
For federal tax purposes, the fund hereby reports 91.37% of the ordinary dividends paid during the fiscal year ended August 31, 2013 as qualifying for the corporate dividends received deduction. Also, certain dividends paid by the fund may be subject to a maximum tax rate of 15%, as provided for by the Jobs and Growth Tax Relief Reconciliation Act of 2003. Of the distributions paid during the fiscal year, $441,713 represents the maximum amount that may be considered qualified dividend income.The fund also hereby reports $.0004 per share as a short-term capital gain distribution and $.1057 per share as a long-term capital gain distribution paid on December 31, 2012. Shareholders will receive notification in early 2014 of the percentage applicable to the preparation of their 2013 income tax returns.
24
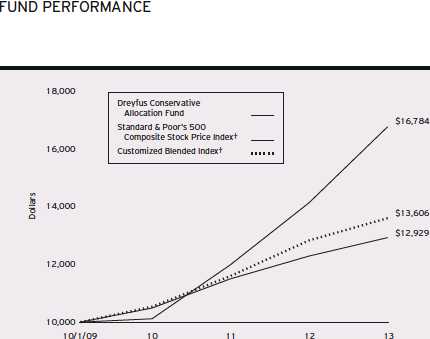
BOARD MEMBERS INFORMATION (Unaudited)
The Fund 25
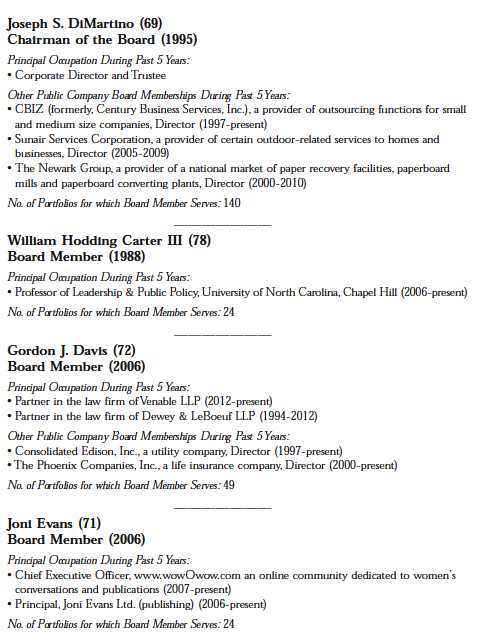
BOARD MEMBERS INFORMATION (Unaudited) (continued)
26

The Fund 27
OFFICERS OF THE FUND (Unaudited)
28

The Fund 29
For More Information
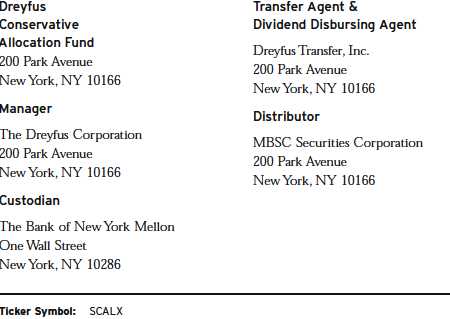
Telephone Call your financial representative or 1-800-DREYFUS
Mail The Dreyfus Family of Funds, 144 Glenn Curtiss Boulevard, Uniondale, NY 11556-0144
The fund files its complete schedule of portfolio holdings with the Securities and Exchange Commission (“SEC”) for the first and third quarters of each fiscal year on Form N-Q. The fund’s Forms N-Q are available on the SEC’s website at http://www.sec.gov and may be reviewed and copied at the SEC’s Public Reference Room in Washington, DC. Information on the operation of the Public Reference Room may be obtained by calling 1-800-SEC-0330.
A description of the policies and procedures that the fund uses to determine how to vote proxies relating to portfolio securities, and information regarding how the fund voted these proxies for the most recent 12-month period ended June 30 is available at http://www.dreyfus.com and on the SEC’s website at http://www.sec.gov. The description of the policies and procedures is also available without charge, upon request, by calling 1-800-DREYFUS.

|
| © 2013 MBSC Securities Corporation |
Dreyfus
Growth Allocation Fund
ANNUAL REPORT August 31, 2013

Save time. Save paper. View your next shareholder report online as soon as it’s available. Log into www.dreyfus.com and sign up for Dreyfus eCommunications. It’s simple and only takes a few minutes.
The views expressed in this report reflect those of the portfolio manager only through the end of the period covered and do not necessarily represent the views of Dreyfus or any other person in the Dreyfus organization. Any such views are subject to change at any time based upon market or other conditions and Dreyfus disclaims any responsibility to update such views.These views may not be relied on as investment advice and, because investment decisions for a Dreyfus fund are based on numerous factors, may not be relied on as an indication of trading intent on behalf of any Dreyfus fund.
Not FDIC-Insured • Not Bank-Guaranteed • May Lose Value
| |
| Contents |
| |
| | THE FUND |
| 2 | A Letter from the President |
| 3 | Discussion of Fund Performance |
| 6 | Fund Performance |
| 7 | Understanding Your Fund’s Expenses |
| 7 | Comparing Your Fund’s Expenses |
| With Those of Other Funds |
| 8 | Statement of Investments |
| 9 | Statement of Assets and Liabilities |
| 10 | Statement of Operations |
| 11 | Statement of Changes in Net Assets |
| 12 | Financial Highlights |
| 13 | Notes to Financial Statements |
| 23 | Report of Independent Registered |
| | Public Accounting Firm |
| 24 | Important Tax Information |
| 25 | Board Members Information |
| 28 | Officers of the Fund |
| |
| FOR MORE INFORMATION |
|
| | Back Cover |
Dreyfus
Growth Allocation Fund
The Fund
A LETTER FROM THE PRESIDENT
Dear Shareholder:
We are pleased to present this annual report for Dreyfus Growth Allocation Fund, covering the 12-month period from September 1, 2012, through August 31, 2013. For information about how the fund performed during the reporting period, as well as general market perspectives, we provide a Discussion of Fund Performance on the pages that follow.
U.S. equities fared quite well over the past year, weathering periodic bouts of volatility after setting new record highs in the spring for many broad measures of stock market performance. Low interest rates, muted inflationary pressures, and a strong U.S. dollar helped fuel the market’s gains, as did a declining unemployment rate, rebounding housing markets, and increased production of domestic oil and natural gas.
In our analysis, the U.S. economy is nearing an inflection point to a somewhat faster growth rate.We expect a reduced fiscal drag in 2014 and beyond, and the stimulative monetary policy of the past five years should continue to support economic expansion, particularly in interest rate-sensitive industry groups. For information on how these developments may affect your investments, we urge you to discuss these matters with your financial advisor.
Thank you for your continued confidence and support.
Sincerely,

J. Charles Cardona
President
The Dreyfus Corporation
September 16, 2013
2
DISCUSSION OF FUND PERFORMANCE
For the period of September 1, 2012, through August 31, 2013, as provided by Richard B. Hoey and Keith L. Stransky, CFA, Dreyfus Investment Committee Members
Fund and Market Performance Overview
For the 12-month period ended August 31, 2013, Dreyfus Growth Allocation Fund produced a total return of 11.64%.1 In comparison, the fund’s benchmark, the Standard & Poor’s 500 Composite Stock Price Index produced a total return of 18.70% for the same period. The fund also utilizes a customized blended index composed of 80% Standard & Poor’s 500 Composite Stock Price Index and 20% Barclays U.S.Aggregate Bond Index, and this blended index returned 14.47% for the same period.2
U.S. stocks rallied over much of the reporting period, and bonds generally lost a degree of value as investors responded to improving economic data.The fund underperformed its blended benchmark, mainly due to shortfalls in Dreyfus Appreciation Fund and Dreyfus International Stock Fund.
The Fund’s Investment Approach
Dreyfus Growth Allocation Fund seeks long-term capital appreciation with some consideration for current income. In pursuing its goal, the fund normally allocates 80% of its assets to equity securities and 20% of its assets to fixed income securities.
The fund achieves its targeted asset allocation mix by investing in other mutual funds that are advised by The Dreyfus Corporation (Dreyfus). In turn, the underlying funds invest in a wide range of equity and fixed income securities, including U.S. large-, mid-, and small-cap equities; international, global, and emerging-market equities; and U.S. and international fixed income securities.
The Dreyfus Investment Committee selects the underlying funds based on their investment objectives and management policies, portfolio holdings, risk/reward profiles, historical performance, and other factors.The fund may invest in any of 31 underlying funds identified by the Dreyfus Investment Committee, which generally will select only certain, and not all, of the underlying funds for investment at any given time.
The Fund 3
DISCUSSION OF FUND PERFORMANCE (continued)
Recovering Economy Fueled Equity Market’s Gains
The reporting period began near the outset of a sustained rally among stocks and higher yielding bonds as investors responded positively to improved U.S. employment and housing market data. In addition, investors were encouraged by an aggressively accommodative monetary policy from the Federal Reserve Board (the “Fed”), including the launch of a new round of quantitative easing. Improving conditions in overseas markets also contributed to greater investor optimism.
Economic data remained favorable, and stocks generally continued to rally, through the spring of 2013. By mid-May, several broad measures of stock market performance reached new record highs. In late May, remarks by Fed chairman Ben Bernanke were interpreted as a signal that U.S. monetary policymakers were likely to back away from their quantitative easing program sooner than expected. Consequently, most financial markets encountered heightened volatility in June, erasing some of the stock market’s previous gains and causing bonds to lose value. Financial markets generally stabilized in July and August when investors returned their focus to company and market fundamentals.
Fund Participated Substantially in Market’s Gains
Although the fund participated significantly in the blended benchmark’s gains, relative performance was constrained by Dreyfus Appreciation Fund, where a high-quality bias and disappointing security selections in the energy sector hurt results. Dreyfus International Stock Fund also lagged market averages, due mainly to shortfalls in China and underweighted exposure to Europe. A mildly overweighted position and poor stock selections in the emerging markets also hurt relative performance.
The fund achieved better results from its emphasis on stocks over bonds throughout the reporting period. Positions in small- and mid-cap stocks were particularly helpful. The fund received especially positive contributions from Dreyfus Opportunistic MidcapValue Fund, which achieved above-average results in the financials sector, and Dreyfus StrategicValue Fund, which was bolstered by successful security selections in the financials and energy sectors.
Within the fund’s bond component, relatively strong results from Dreyfus Intermediate-Term Income Fund were largely offset by the underperformance of Dreyfus Bond Market Index Fund.
4
The Dreyfus Investment Committee made three tactical changes to the fund’s investment allocations during the reporting period. In December, we shifted assets from Dreyfus Global Absolute Return Fund into Dreyfus Short-Intermediate Government Bond and Dreyfus Mid-Cap Index Fund.This move generally contributed positively to relative performance. In February, we shifted assets from an S&P 500 Index Fund to Dreyfus Disciplined Stock Fund, believing that active management should provide higher returns. In June, we reduced the fund’s position in Dreyfus Research Growth Fund and added to Global REITS, reflecting an improved outlook for housing markets.
Maintaining a Constructive Posture
Europe’s financial troubles have eased, and the U.S. economy has continued to grow. These developments generally portend well for stocks, reinforcing our confidence in the fund’s current bias toward equities. At the same time, we are aware of recently increased stock valuations and geopolitical risks in various regions of the world.We are carefully watching these and other developments in domestic and global markets, and we stand prepared to adjust the fund’s holdings as warranted.
September 16, 2013
Equity funds are subject generally to market, market sector, market liquidity, issuer and investment style risks, among
other factors, to varying degrees, all of which are more fully described in the fund’s prospectus. Stocks of small- and/or
midcap companies often experience sharper price fluctuations than stocks of large-cap companies.
Asset allocation and diversification cannot assure a profit or protect against loss.
The ability of the fund to achieve its investment goal depends, in part, on the ability of the Dreyfus Investment
Committee to allocate effectively the fund’s assets among the asset classes and the underlying funds.There can be no
assurance that the actual allocations will be effective in achieving the fund’s investment goal.The underlying funds
may not achieve their investment objectives, and their performance may be lower than that of the asset class the
underlying funds were selected to represent.
Bond funds are subject generally to interest rate, credit, liquidity and market risks, to varying degrees, all of which are
more fully described in the fund’s prospectus. Generally, all other factors being equal, bond prices are inversely related
to interest-rate changes, and rate increases can cause price declines.
Investing internationally involves special risks, including changes in currency exchange rates, political, economic and
social instability, a lack of comprehensive company information, differing auditing and legal standards and less market
liquidity. Emerging markets tend to be more volatile than the markets of more mature economies, and generally have
less diverse and less mature economic structures and less stable political systems than those of developed countries.
1 Total return includes reinvestment of dividends and any capital gains paid. Past performance is no guarantee of future
results. Share price and investment return fluctuate such that upon redemption fund shares may be worth more or less
than their original cost. Return figure provided reflects the absorption of certain fund expenses by The Dreyfus
Corporation pursuant to an agreement in effect through January 1, 2014, at which time it may be extended,
terminated or modified. Had these expenses not been absorbed, the fund’s return would have been lower.
2 SOURCE: LIPPER INC. — Reflects reinvestment of dividends and, where applicable, capital gain distributions.
The Standard & Poor’s 500 Composite Stock Price Index is a widely accepted, unmanaged index of U.S. stock
market performance.The Barclays U.S.Aggregate Bond Index is a widely accepted, unmanaged total return index of
corporate, U.S. government and U.S. government agency debt instruments, mortgage-backed securities and asset-backed
securities with an average maturity of 1-10 years. Investors cannot invest directly in any index.
The Fund 5
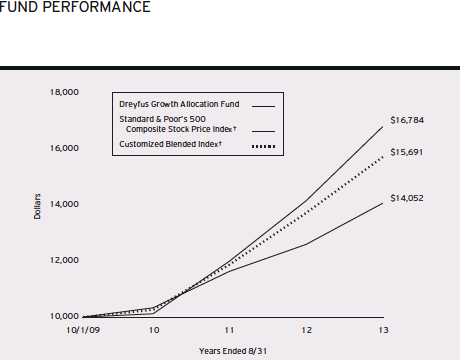
Comparison of change in value of $10,000 investment in Dreyfus Growth Allocation Fund with the Standard & Poor’s 500 Composite Stock Price Index and the Customized Blended Index
| | | | | |
| Average Annual Total Returns as of 8/31/13 | | | | | |
| | Inception | | | From | |
| | Date | 1 | Year | Inception | |
| Fund | 10/1/09 | 11.64 | % | 9.07 | % |
| Standard & Poor’s 500 | | | | | |
| Composite Stock Price Index | 9/30/09 | 18.70 | % | 14.13 | %†† |
| Customized Blended Index | 9/30/09 | 14.47 | % | 12.19 | %†† |
† Source: Lipper Inc.
Past performance is not predictive of future performance.The fund’s performance shown in the graph and table does not
reflect the deduction of taxes that a shareholder would pay on fund distributions or the redemption of fund shares.
The above graph compares a $10,000 investment made in Dreyfus Growth Allocation Fund on 10/1/09 (inception
date) to a $10,000 investment made in two different indices: (1) the Standard & Poor’s 500 Composite Stock Price
Index (the “S&P 500 Index”) and (2) the Customized Blended Index.The Customized Blended Index is calculated
on a year-to-date basis.All dividends and capital gain distributions are reinvested.
The fund’s performance shown in the line graph above takes into account all applicable fees and expenses.The S&P 500
Index is a widely accepted, unmanaged index of U.S. stock market performance.The Customized Blended Index is
composed of the S&P 500 Index, 80%, and the Barclays U.S.Aggregate Bond Index (the “Barclays Index”), 20%.
The Barclays Index is a widely accepted, unmanaged index of corporate, government and government agency debt
instruments, mortgage-backed securities and asset-backed securities with an average maturity of 1-10 years. Unlike a
mutual fund, the indices are not subject to charges, fees and other expenses. Investors cannot invest directly in any index.
Further information relating to fund performance, including expense reimbursements, if applicable, is contained in the
Financial Highlights section of the prospectus and elsewhere in this report.
††For comparative purposes, the value of each index on 9/30/09 is used as the beginning value on 10/1/09.6
UNDERSTANDING YOUR FUND’S EXPENSES (Unaudited)
As a mutual fund investor, you pay ongoing expenses, such as management fees and other expenses. Using the information below, you can estimate how these expenses affect your investment and compare them with the expenses of other funds.You also may pay one-time transaction expenses, including sales charges (loads) and redemption fees, which are not shown in this section and would have resulted in higher total expenses. For more information, see your fund’s prospectus or talk to your financial adviser.
Review your fund’s expenses
The table below shows the expenses you would have paid on a $1,000 investment in Dreyfus Growth Allocation Fund from March 1, 2013 to August 31, 2013. It also shows how much a $1,000 investment would be worth at the close of the period, assuming actual returns and expenses.
Expenses and Value of a $1,000 Investment
assuming actual returns for the six months ended August 31, 2013
| | |
| Expenses paid per $1,000† | $ | 1.39 |
| Ending value (after expenses) | $ | 1,035.40 |
COMPARING YOUR FUND’S EXPENSES WITH THOSE OF OTHER FUNDS (Unaudited)
Using the SEC’s method to compare expenses
The Securities and Exchange Commission (SEC) has established guidelines to help investors assess fund expenses. Per these guidelines, the table below shows your fund’s expenses based on a $1,000 investment, assuming a hypothetical 5% annualized return. You can use this information to compare the ongoing expenses (but not transaction expenses or total cost) of investing in the fund with those of other funds.All mutual fund shareholder reports will provide this information to help you make this comparison. Please note that you cannot use this information to estimate your actual ending account balance and expenses paid during the period.
Expenses and Value of a $1,000 Investment
assuming a hypothetical 5% annualized return for the six months ended August 31, 2013
| | |
| Expenses paid per $1,000† | $ | 1.38 |
| Ending value (after expenses) | $ | 1,023.84 |
† Expenses are equal to the fund’s annualized expense ratio of .27%, multiplied by the average account value over the
period, multiplied by 184/365 (to reflect the one-half year period).
The Fund 7
STATEMENT OF INVESTMENTS
August 31, 2013
| | | | | | | |
| Registered Investment Companies—100.4% | Shares | | | Value ($) | |
| Dreyfus Appreciation Fund, Investor Shares | | 38,208 | | a | 1,801,490 | |
| Dreyfus Bond Market Index Fund, BASIC Shares | | 81,117 | | a | 850,922 | |
| Dreyfus Disciplined Stock Fund | | | 29,080 | | a | 1,075,943 | |
| Dreyfus Emerging Markets Debt Local Currency Fund, Cl. I | 26,503 | | a | 358,581 | |
| Dreyfus Emerging Markets Fund, Cl. I | | | 146,552 | | a | 1,311,640 | |
| Dreyfus Global Real Estate Securities Fund, Cl. I | | 150,974 | | a | 1,200,243 | |
| Dreyfus High Yield Fund, Cl. I | | | 63,615 | | a | 418,589 | |
| Dreyfus Intermediate Term Income Fund, Cl. I | | 96,167 | | a | 1,298,245 | |
| Dreyfus International Bond Fund, Cl. I | | | 22,898 | | a | 375,073 | |
| Dreyfus International Equity Fund, Cl. I | | 11,934 | | a | 375,554 | |
| Dreyfus International Stock Index Fund | | 38,198 | | a | 591,312 | |
| Dreyfus International Value Fund, Cl. I | | 27,935 | | a | 321,527 | |
| Dreyfus MidCap Index Fund | | | 22,516 | | a | 760,140 | |
| Dreyfus Opportunistic Midcap Value Fund, Cl. I | | 19,205 | | a | 732,104 | |
| Dreyfus Research Growth Fund, Cl. Z | | | 192,400 | | a | 2,320,350 | |
| Dreyfus Short-Intermediate Government Fund | | 94,744 | | a | 992,915 | |
| Dreyfus Small Cap Stock Index Fund | | | 23,852 | | a | 631,831 | |
| Dreyfus Strategic Value Fund, Cl. I | | | 44,080 | | a | 1,646,828 | |
| Dreyfus Structured Midcap Fund, Cl. I | | | 22,628 | | a | 608,682 | |
| Dreyfus U.S. Equity Fund, Cl. I | | | 88,531 | | a | 1,583,820 | |
| Dreyfus/Newton International Equity Fund, Cl. I | | 32,125 | | a | 608,129 | |
| Dreyfus/The Boston Company | | | | | | | |
| Small/Mid Cap Growth Fund, Cl. I | | | 36,259 | | a | 655,572 | |
| International Stock Fund, Cl. I | | | 32,479 | | a | 479,715 | |
| |
| Total Investments (cost $18,611,695) | | 100.4 | % | | 20,999,205 | |
| Liabilities, Less Cash and Receivables | | (.4 | %) | | (87,548 | ) |
| Net Assets | | | 100.0 | % | | 20,911,657 | |
| |
| a Investment in affiliated mutual fund. | | | | | | | |
| |
| |
| Portfolio Summary (Unaudited)† | | | | | | |
| | Value (%) | | | | | Value (%) | |
| Mutual Funds: Domestic | 73.5 | Mutual Funds: Foreign | | | 26.9 | |
| | | | | | | 100.4 | |
| † Based on net assets. | | | | | | | |
| See notes to financial statements. | | | | | | | |
8
STATEMENT OF ASSETS AND LIABILITIES
August 31, 2013
| | | |
| | Cost | Value | |
| Assets ($): | | | |
| Investments in affiliated issuers—See Statement of | | | |
| Investments—Note 1(c) | 18,611,695 | 20,999,205 | |
| Cash | | 3,218 | |
| Prepaid expenses | | 3,531 | |
| | | 21,005,954 | |
| Liabilities ($): | | | |
| Due to The Dreyfus Corporation and affiliates—Note 3(b) | | 9,072 | |
| Payable for shares of Common Stock redeemed | | 37,837 | |
| Accrued expenses | | 47,388 | |
| | | 94,297 | |
| Net Assets ($) | | 20,911,657 | |
| Composition of Net Assets ($): | | | |
| Paid-in capital | | 18,464,604 | |
| Accumulated undistributed investment income—net | | 76,518 | |
| Accumulated net realized gain (loss) on investments | | (16,975 | ) |
| Accumulated net unrealized appreciation | | | |
| (depreciation) on investments | | 2,387,510 | |
| Net Assets ($) | | 20,911,657 | |
| Shares Outstanding | | | |
| (100 million shares of $.001 par value Common Stock authorized) | | 1,277,426 | |
| Net Asset Value, offering and redemption price per share ($) | | 16.37 | |
| |
| See notes to financial statements. | | | |
The Fund 9
STATEMENT OF OPERATIONS
Year Ended August 31, 2013
| | |
| Investment Income ($): | | |
| Income: | | |
| Cash dividends from affiliated issuers | 288,181 | |
| Expenses: | | |
| Shareholder servicing costs—Note 3(b) | 56,850 | |
| Professional fees | 42,175 | |
| Registration fees | 18,078 | |
| Prospectus and shareholders’ reports | 8,225 | |
| Custodian fees—Note 3(b) | 1,979 | |
| Directors’ fees and expenses—Note 3(c) | 1,249 | |
| Loan commitment fees—Note 2 | 178 | |
| Miscellaneous | 16,955 | |
| Total Expenses | 145,689 | |
| Less—reduction in expenses due to undertaking—Note 3(a) | (77,356 | ) |
| Less—waiver of shareholder servicing fees—Note 3(b) | (12,739 | ) |
| Less—reduction in fees due to earnings credits—Note 3(b) | (68 | ) |
| Net Expenses | 55,526 | |
| Investment Income—Net | 232,655 | |
| Realized and Unrealized Gain (Loss) on Investments—Note 4 ($): | | |
| Net realized gain (loss) on investments in affiliated issuers | 24,135 | |
| Capital gain distributions from affiliated issuers | 196,600 | |
| Net Realized Gain (Loss) | 220,735 | |
| Net unrealized appreciation (depreciation) | | |
| on investments in affiliated issuers | 1,384,829 | |
| Net Realized and Unrealized Gain (Loss) on Investments | 1,605,564 | |
| Net Increase in Net Assets Resulting from Operations | 1,838,219 | |
| |
| See notes to financial statements. | | |
10
STATEMENT OF CHANGES IN NET ASSETS
| | | | |
| | Year Ended August 31, | |
| | 2013 | | 2012 | |
| Operations ($): | | | | |
| Investment income—net | 232,655 | | 110,494 | |
| Net realized gain (loss) on | | | | |
| investments in affiliated issuers | 220,735 | | 144,912 | |
| Net unrealized appreciation (depreciation) | | | | |
| on investments in affiliated issuers | 1,384,829 | | 848,662 | |
| Net Increase (Decrease) in Net Assets | | | | |
| Resulting from Operations | 1,838,219 | | 1,104,068 | |
| Dividends to Shareholders from ($): | | | | |
| Investment income—net | (200,070 | ) | (162,231 | ) |
| Net realized gain on investments | (239,050 | ) | (92,381 | ) |
| Total Dividends | (439,120 | ) | (254,612 | ) |
| Capital Stock Transactions ($): | | | | |
| Net proceeds from shares sold | 5,567,055 | | 3,983,446 | |
| Dividends reinvested | 426,370 | | 241,740 | |
| Cost of shares redeemed | (1,513,581 | ) | (2,198,040 | ) |
| Increase (Decrease) in Net Assets | | | | |
| from Capital Stock Transactions | 4,479,844 | | 2,027,146 | |
| Total Increase (Decrease) in Net Assets | 5,878,943 | | 2,876,602 | |
| Net Assets ($): | | | | |
| Beginning of Period | 15,032,714 | | 12,156,112 | |
| End of Period | 20,911,657 | | 15,032,714 | |
| Undistributed investment income—net | 76,518 | | 5,158 | |
| Capital Share Transactions (Shares): | | | | |
| Shares sold | 348,110 | | 275,802 | |
| Shares issued for dividends reinvested | 27,995 | | 17,443 | |
| Shares redeemed | (95,434 | ) | (151,664 | ) |
| Net Increase (Decrease) in Shares Outstanding | 280,671 | | 141,581 | |
| |
| See notes to financial statements. | | | | |
The Fund 11
FINANCIAL HIGHLIGHTS
The following table describes the performance for the fiscal periods indicated. Total return shows how much your investment in the fund would have increased (or decreased) during each period, assuming you had reinvested all dividends and distributions.These figures have been derived from the fund’s financial statements.
| | | | | | | | |
| | | | Year Ended August 31, | | | |
| | 2013 | | 2012 | | 2011 | | 2010 | a |
| Per Share Data ($): | | | | | | | | |
| Net asset value, beginning of period | 15.08 | | 14.21 | | 12.78 | | 12.50 | |
| Investment Operations: | | | | | | | | |
| Investment income—netb | .21 | | .12 | | .10 | | .10 | |
| Net realized and unrealized | | | | | | | | |
| gain (loss) on investments | 1.52 | | 1.03 | | 1.51 | | .31 | |
| Total from Investment Operations | 1.73 | | 1.15 | | 1.61 | | .41 | |
| Distributions: | | | | | | | | |
| Dividends from investment income—net | (.20 | ) | (.18 | ) | (.11 | ) | (.13 | ) |
| Dividends from net realized | | | | | | | | |
| gain on investments | (.24 | ) | (.10 | ) | (.07 | ) | — | |
| Total Distributions | (.44 | ) | (.28 | ) | (.18 | ) | (.13 | ) |
| Net asset value, end of period | 16.37 | | 15.08 | | 14.21 | | 12.78 | |
| Total Return (%) | 11.64 | | 8.29 | | 12.56 | | 3.26 | c |
| Ratios/Supplemental Data (%): | | | | | | | | |
| Ratio of total expenses to average net assetsd | .81 | | 1.01 | | 1.26 | | 3.33 | e |
| Ratio of net expenses to average net assetsd | .31 | | .58 | | .63 | | .57 | e |
| Ratio of net investment income | | | | | | | | |
| to average net assetsd | 1.30 | | .82 | | .65 | | .85 | e |
| Portfolio Turnover Rate | 39.25 | | 30.83 | | 21.83 | | 45.65 | c |
| Net Assets, end of period ($ x 1,000) | 20,912 | | 15,033 | | 12,156 | | 5,301 | |
a From October 1, 2009 (commencement of initial offering) to August 31, 2010.
b Based on average shares outstanding at each month end.
c Not annualized.
d Amounts do not include the activity of the underlying funds.
e Annualized.
See notes to financial statements.
12
NOTES TO FINANCIAL STATEMENTS
NOTE 1—Significant Accounting Policies:
Dreyfus Growth Allocation Fund (the “fund”) is a separate diversified series of Dreyfus Strategic Funds, Inc. (the “Company”), which is registered under the Investment Company Act of 1940, as amended (the “Act”), as an open-end management investment company and operates as a series company currently offering nine series, including the fund.The fund’s investment objective is to seek long-term capital appreciation with some consideration for current income. The Dreyfus Corporation (the “Manager” or “Dreyfus”), a wholly-owned subsidiary of The Bank of New York Mellon Corporation (“BNY Mellon”), serves as the fund’s investment adviser. MBSC Securities Corporation (the “Distributor”), a wholly-owned subsidiary of the Manager, is the distributor of the fund’s shares, which are sold to the public without a sales charge.
The Company accounts separately for the assets, liabilities and operations of each series. Expenses directly attributable to each series are charged to that series’ operations; expenses which are applicable to all series are allocated among them on a pro rata basis.
The Financial Accounting Standards Board (“FASB”) Accounting Standards Codification is the exclusive reference of authoritative U.S. generally accepted accounting principles (“GAAP”) recognized by the FASB to be applied by nongovernmental entities. Rules and interpretive releases of the Securities and Exchange Commission (“SEC”) under authority of federal laws are also sources of authoritative GAAP for SEC registrants. The fund’s financial statements are prepared in accordance with GAAP, which may require the use of management estimates and assumptions.Actual results could differ from those estimates.
The Company enters into contracts that contain a variety of indemnifications.The fund’s maximum exposure under these arrangements is unknown.The fund does not anticipate recognizing any loss related to these arrangements.
The Fund 13
NOTES TO FINANCIAL STATEMENTS (continued)
(a) Portfolio valuation: The fair value of a financial instrument is the amount that would be received to sell an asset or paid to transfer a liability in an orderly transaction between market participants at the measurement date (i.e., the exit price). GAAP establishes a fair value hierarchy that prioritizes the inputs of valuation techniques used to measure fair value.This hierarchy gives the highest priority to unadjusted quoted prices in active markets for identical assets or liabilities (Level 1 measurements) and the lowest priority to unobservable inputs (Level 3 measurements).
Additionally, GAAP provides guidance on determining whether the volume and activity in a market has decreased significantly and whether such a decrease in activity results in transactions that are not orderly. GAAP requires enhanced disclosures around valuation inputs and techniques used during annual and interim periods.
Various inputs are used in determining the value of the fund’s investments relating to fair value measurements.These inputs are summarized in the three broad levels listed below:
Level 1—unadjusted quoted prices in active markets for identical investments.
Level 2—other significant observable inputs (including quoted prices for similar investments, interest rates, prepayment speeds, credit risk, etc.).
Level 3—significant unobservable inputs (including the fund’s own assumptions in determining the fair value of investments).
The inputs or methodology used for valuing securities are not necessarily an indication of the risk associated with investing in those securities.
Investments are valued at the net asset value of each underlying fund determined as of the close of the NewYork Stock Exchange (generally 4 p.m., Eastern time) on the valuation date and are generally categorized within Level 1 of the fair value hierarchy.
14
The following is a summary of the inputs used as of August 31, 2013 in valuing the fund’s investments:
| | | | |
| | | Level 2—Other | Level 3— | |
| | Level 1— | Significant | Significant | |
| | Unadjusted | Observable | Unobservable | |
| | Quoted Prices | Inputs | Inputs | Total |
| Assets ($) | | | | |
| Investments in Securities: | | | |
| Mutual Funds | 20,999,205 | — | — | 20,999,205 |
At August 31, 2013, there were no transfers between Level 1 and Level 2 of the fair value hierarchy.
(b) Securities transactions and investment income: Securities transactions are recorded on a trade date basis. Realized gains and losses from securities transactions are recorded on the identified cost basis. Dividend income is recognized on the ex-dividend date and interest income, including, where applicable, accretion of discount and amortization of premium on investments, is recognized on the accrual basis.
(c) Affiliated issuers: Investments in other investment companies advised by Dreyfus are defined as “affiliated” under the Act. Investments in affiliated investment companies during the period ended August 31, 2013 were as follows:
| | | | | | |
| Affiliated | | | | | | |
| Investment | Value | | | | Net Realized | |
| Company | 8/31/2012 | ($) | Purchases ($)† | Sales ($) | Gain (Loss) ($) | |
| Dreyfus | | | | | | |
| Appreciation Fund, | | | | | | |
| Investor Shares | 1,346,928 | | 597,025 | 230,341 | (569 | ) |
| Dreyfus BASIC | | | | | | |
| S&P 500 Stock | | | | | | |
| Index Fund | 739,407 | | 130,151 | 928,713 | 61,949 | |
| Dreyfus Bond Market | | | | | | |
| Index Fund, | | | | | | |
| BASIC Shares | 698,125 | | 318,317 | 119,009 | (4,200 | ) |
| Dreyfus Disciplined | | | | | | |
| Stock Fund | — | | 1,123,405 | 113,905 | 1,440 | |
The Fund 15
NOTES TO FINANCIAL STATEMENTS (continued)
| | | | | | |
| Affiliated | | | | | | |
| Investment | Value | | | | Net Realized | |
| Company | 8/31/2012 | ($) | Purchases ($)† | Sales ($) | Gain (Loss) ($) | |
| Dreyfus Emerging | | | | | | |
| Markets Debt Local | | | | | | |
| Currency Fund, Cl. I | 294,503 | | 147,714 | 54,843 | (5,131 | ) |
| Dreyfus | | | | | | |
| Emerging Markets | | | | | | |
| Fund, Cl. I | 1,023,082 | | 594,481 | 234,728 | (57,105 | ) |
| Dreyfus Global | | | | | | |
| Absolute Return | | | | | | |
| Fund, Cl. I | 1,324,893 | | 53,920 | 1,339,168 | (8,458 | ) |
| Dreyfus Global Real | | | | | | |
| Estate Securities | | | | | | |
| Fund, Cl. I | 747,586 | | 599,594 | 126,687 | (6,531 | ) |
| Dreyfus High Yield | | | | | | |
| Fund, Cl. I | 311,822 | | 159,326 | 54,843 | (1,505 | ) |
| Dreyfus Intermediate | | | | | | |
| Term Income | | | | | | |
| Fund, Cl. I | — | | 1,511,182 | 152,180 | (7,139 | ) |
| Dreyfus International | | | | | | |
| Bond Fund, Cl. I | 297,920 | | 147,607 | 54,843 | (2,224 | ) |
| Dreyfus International | | | | | | |
| Equity Fund, Cl. I | 244,962 | | 129,067 | 49,359 | (871 | ) |
| Dreyfus International | | | | | | |
| Stock Index Fund | 393,511 | | 215,414 | 82,265 | (2,692 | ) |
| Dreyfus International | | | | | | |
| Value Fund, Cl. I | 202,098 | | 127,720 | 49,359 | (2,260 | ) |
| Dreyfus MidCap | | | | | | |
| Core Fund, Cl. I | 398,294 | | 149,652 | 586,481 | 79,950 | |
| Dreyfus MidCap | | | | | | |
| Index Fund | — | | 782,098 | 91,468 | 987 | |
| Dreyfus Opportunistic | | | | | | |
| Midcap Value | | | | | | |
| Fund, Cl. I | 478,154 | | 171,777 | 68,554 | 950 | |
| Dreyfus Research | | | | | | |
| Growth Fund, Cl. Z | 1,789,094 | | 742,877 | 537,602 | 9,849 | |
| Dreyfus | | | | | | |
| Short-Intermediate | | | | | | |
| Government Fund | — | | 1,140,646 | 137,325 | (1,074 | ) |
| Dreyfus Small Cap | | | | | | |
| Stock Index Fund | 413,193 | | 187,784 | 68,554 | 1,825 | |
| Dreyfus Strategic | | | | | | |
| Value Fund, Cl. I | 1,030,144 | | 504,968 | 197,435 | 6,204 | |
| Dreyfus Structured | | | | | | |
| Midcap Fund, Cl. I | — | | 659,856 | 53,725 | (2,402 | ) |
| Dreyfus Total | | | | | | |
| Return Advantage | | | | | | |
| Fund, Cl. I | 1,058,061 | | 289,041 | 1,272,265 | (39,409 | ) |
16
| | | | | | | | | |
| Affiliated | | | | | | | | | |
| Investment | | | Value | | | | | Net Realized | |
| Company | | | 8/31/2012 | ($) | Purchases ($)† | | Sales ($) | Gain (Loss) ($) | |
| Dreyfus U.S. | | | | | | | | | |
| Equity Fund, Cl. I | | 1,079,775 | | 472,774 | | 186,466 | 3,737 | |
| Dreyfus/Newton | | | | | | | | | |
| International | | | | | | | | | |
| Equity Fund, Cl. I | | 409,583 | | 210,280 | | 82,265 | (736 | ) |
| Dreyfus/The Boston | | | | | | | | |
| Company | | | | | | | | | |
| Small/Mid Cap | | | | | | | | | |
| Growth Fund, Cl. I | | 432,621 | | 203,142 | | 68,554 | 1,430 | |
| International | | | | | | | | | |
| Stock Fund, Cl. I | | 344,321 | | 169,095 | | 65,812 | (1,880 | ) |
| TOTAL | | 15,058,077 | | 11,538,913 | | 7,006,749 | 24,135 | |
| |
| † Includes reinvested dividends/distributions. | | | | | | |
| |
| |
| | | Change in Net | | | | | | |
| Affiliated | | | Unrealized | | | | | | |
| Investment | | | Appreciation | | Value | | Net | Dividends/ | |
| Company | (Depreciation) ($) | | 8/31/2013 | ($) | Assets (%) | Distributions ($) | |
| Dreyfus Appreciation | | | | | | | | |
| Fund, Investor Shares | 88,447 | | 1,801,490 | | 8.6 | 26,778 | |
| Dreyfus BASIC | | | | | | | | | |
| S&P 500 Stock | | | | | | | | |
| Index Fund | | | (2,794 | ) | — | | — | 8,316 | |
| Dreyfus Bond Market | | | | | | | | |
| Index Fund, | | | | | | | | | |
| BASIC Shares | | | (42,311 | ) | 850,922 | | 4.1 | 23,537 | |
| Dreyfus Disciplined | | | | | | | | |
| Stock Fund | | | 65,003 | | 1,075,943 | | 5.2 | 3,607 | |
| Dreyfus Emerging | | | | | | | | |
| Markets Debt Local | | | | | | | | |
| Currency Fund, Cl. I | | (23,662 | ) | 358,581 | | 1.7 | 11,941 | |
| Dreyfus Emerging | | | | | | | | |
| Markets Fund, Cl. I | | (14,090 | ) | 1,311,640 | | 6.3 | 13,373 | |
| Dreyfus Global | | | | | | | | | |
| Absolute Return | | | | | | | | |
| Fund, Cl. I | | | (31,187 | ) | — | | — | — | |
| Dreyfus Global Real | | | | | | | | |
| Estate Securities | | | | | | | | |
| Fund, Cl. I | | | (13,719 | ) | 1,200,243 | | 5.7 | 44,508 | |
| Dreyfus High Yield | | | | | | | | |
| Fund, Cl. I | | | 3,789 | | 418,589 | | 2.0 | 23,554 | |
| Dreyfus Intermediate | | | | | | | | |
| Term Income | | | | | | | | | |
| Fund, Cl. I | | | (53,618 | ) | 1,298,245 | | 6.2 | 11,905 | |
The Fund 17
NOTES TO FINANCIAL STATEMENTS (continued)
| | | | | | | |
| | | Change in Net | | | | | |
| Affiliated | | Unrealized | | | | | |
| Investment | | Appreciation | | Value | | Net | Dividends/ |
| Company | (Depreciation) ($) | | 8/31/2013 | ($) | Assets (%) | Distributions ($) |
| Dreyfus International | | | | | | |
| Bond Fund, Cl. I | (13,387 | ) | 375,073 | | 1.8 | 11,835 |
| Dreyfus International | | | | | | |
| Equity Fund, Cl. I | 51,755 | | 375,554 | | 1.8 | 6,872 |
| Dreyfus International | | | | | | |
| Stock Index Fund | 67,344 | | 591,312 | | 2.8 | 11,755 |
| Dreyfus International | | | | | | |
| Value Fund, Cl. I | 43,328 | | 321,527 | | 1.5 | 5,524 |
| Dreyfus MidCap Core | | | | | | |
| Fund, Cl. I | | (41,415 | ) | — | | — | 68,138 |
| Dreyfus MidCap | | | | | | | |
| Index Fund | | 68,523 | | 760,140 | | 3.6 | 24,781 |
| Dreyfus Opportunistic | | | | | | |
| Midcap Value | | | | | | | |
| Fund, Cl. I | | 149,777 | | 732,104 | | 3.5 | 2,061 |
| Dreyfus Research | | | | | | |
| Growth Fund, Cl. Z | 316,132 | | 2,320,350 | | 11.1 | 9,703 |
| Dreyfus | | | | | | | |
| Short-Intermediate | | | | | | |
| Government Fund | (9,332 | ) | 992,915 | | 4.8 | 3,176 |
| Dreyfus Small Cap | | | | | | |
| Stock Index Fund | 97,583 | | 631,831 | | 3.0 | 18,068 |
| Dreyfus Strategic | | | | | | |
| Value Fund, Cl. I | 302,947 | | 1,646,828 | | 7.9 | 16,186 |
| Dreyfus Structured | | | | | | |
| Midcap Fund, Cl. I | 4,953 | | 608,682 | | 2.9 | — |
| Dreyfus Total Return | | | | | | |
| Advantage Fund, Cl. I | (35,428 | ) | — | | — | 81,802 |
| Dreyfus U.S. Equity | | | | | | |
| Fund, Cl. I | | 214,000 | | 1,583,820 | | 7.6 | 11,146 |
| Dreyfus/Newton | | | | | | | |
| International | | | | | | | |
| Equity Fund, Cl. I | 71,267 | | 608,129 | | 2.9 | 6,621 |
| Dreyfus/The Boston | | | | | | |
| Company Small/Mid Cap | | | | | |
| Growth Fund, Cl. I | 86,933 | | 655,572 | | 3.1 | 33,426 |
| International Stock | | | | | | |
| Fund, Cl. I | | 33,991 | | 479,715 | | 2.3 | 6,168 |
| TOTAL | | 1,384,829 | | 20,999,205 | | 100.4 | 484,781 |
(d) Dividends to shareholders: Dividends are recorded on the ex-dividend date. Dividends from investment income-net and dividends from net realized capital gains, if any, are normally declared and paid
18
annually, but the fund may make distributions on a more frequent basis to comply with the distribution requirements of the Internal Revenue Code of 1986, as amended (the “Code”).To the extent that net realized capital gains can be offset by capital loss carryovers, it is the policy of the fund not to distribute such gains. Income and capital gain distributions are determined in accordance with income tax regulations, which may differ from GAAP.
(e) Federal income taxes: It is the policy of the fund to continue to qualify as a regulated investment company, if such qualification is in the best interests of its shareholders, by complying with the applicable provisions of the Code, and to make distributions of taxable income sufficient to relieve it from substantially all federal income and excise taxes.
As of and during the period ended August 31, 2013, the fund did not have any liabilities for any uncertain tax positions.The fund recognizes interest and penalties, if any, related to uncertain tax positions as income tax expense in the Statement of Operations. During the period, the fund did not incur any interest or penalties.
Each tax year in the four-year period ended August 31, 2013 remains subject to examination by the Internal Revenue Service and state taxing authorities.
At August 31, 2013, the components of accumulated earnings on a tax basis were as follows: undistributed ordinary income $177,279, undistributed capital gains $167,184 and unrealized appreciation $2,102,590.
The tax character of distributions paid to shareholders during the fiscal periods ended August 31, 2013 and August 31, 2012 were as follows: ordinary income $200,070 and $196,660, and long-term capital gains $239,050 and $57,952, respectively.
During the period ended August 31, 2013, as a result of permanent book to tax differences, primarily due to the tax treatment for short-term capital gain distributions from regulated investment company holdings, the fund increased accumulated undistributed investment
The Fund 19
NOTES TO FINANCIAL STATEMENTS (continued)
income-net by $38,775 and decreased accumulated net realized gain (loss) on investments by the same amount. Net assets and net asset value per share were not affected by this reclassification.
NOTE 2—Bank Lines of Credit:
The fund participates with other Dreyfus-managed funds in a $210 million unsecured credit facility led by Citibank, N.A. and a $300 million unsecured credit facility provided by The Bank of New York Mellon, a subsidiary of BNY Mellon and an affiliate of Dreyfus (each, a “Facility”), each to be utilized primarily for temporary or emergency purposes, including the financing of redemptions. Prior to October 10, 2012, the unsecured credit facility with Citibank, N.A. was $225 million. In connection therewith, the fund has agreed to pay its pro rata portion of commitment fees for each Facility. Interest is charged to the fund based on rates determined pursuant to the terms of the respective Facility at the time of borrowing. During the period ended August 31, 2013, the fund did not borrow under the Facilities.
NOTE 3—Management Fee and Other Transactions With Affiliates:
(a) Pursuant to a management agreement with the Manager, there is no management fee paid to the Manager.The fund invests in other mutual funds advised by the Manager.All fees and expenses of the underlying funds are reflected in the underlying funds’ net asset values.
The Manager had agreed, from September 1, 2012 through October 31, 2012, to assume the expenses of the fund so that the total annual fund’s and underlying funds’ operating expenses (excluding taxes, interest expense, brokerage commissions, commitment fees on borrowings and extraordinary expenses) did not exceed 1.50% of the value of the fund’s average daily net assets.Thereafter, the Manager has contractually agreed, from November 1, 2012 through January 1, 2014, to assume the expenses of the fund so that the total annual fund’s and underlying funds’ operating expenses (exclusive of certain expenses as described
20
above) do not exceed 1.17% of the value of the fund’s average daily net assets.The reduction in expenses, pursuant to the undertaking, amounted to $77,356 during the period ended August 31, 2013.
(b) Under the Shareholder Services Plan, the fund pays the Distributor at an annual rate of .25% of the value of the fund’s average daily net assets for the provision of certain services.The services provided may include personal services relating to shareholder accounts, such as answering shareholder inquiries regarding the fund’s shares and providing reports and other information, and services related to the maintenance of shareholder accounts.The Distributor may make payments to Service Agents (securities dealers, financial institutions or other industry professionals) with respect to these services. The Distributor determines the amounts to be paid to Service Agents. Fees paid to the Distributor will be waived to the extent that the fund invests in an underlying affiliated fund with a Shareholder Services Plan. During the period ended August 31, 2013, the fund was charged $44,701 pursuant to the Shareholder Services Plan of which $12,739 was waived due to the fund’s investment in certain of the underlying funds.
The fund has arrangements with the transfer agent and the custodian whereby the fund may receive earnings credits when positive cash balances are maintained, which are used to offset transfer agency and custody fees. For financial reporting purposes, the fund includes net earnings credits as an expense offset in the Statement of Operations.
The fund compensates Dreyfus Transfer, Inc., a wholly-owned subsidiary of the Manager, under a transfer agency agreement for providing transfer agency services for the fund and cash management services related to fund subscriptions and redemptions. During the period ended August 31, 2013, the fund was charged $10,428 for transfer agency services and $553 for cash management services.These fees are included in Shareholder servicing costs in the Statement of Operations. Cash management fees were partially offset by earnings credits of $66.
The Fund 21
NOTES TO FINANCIAL STATEMENTS (continued)
The fund compensatesThe Bank of NewYork Mellon under a custody agreement for providing custodial services for the fund. During the period ended August 31, 2013, the fund was charged $1,979 pursuant to the custody agreement.
The fund compensates The Bank of New York Mellon under a cash management agreement for performing certain cash management services related to fund subscriptions and redemptions. During the period ended August 31, 2013, the fund was charged $289 pursuant to the cash management agreement, which is included in Shareholder servicing costs in the Statement of Operations.These fees were partially offset by earnings credits of $2.
During the period ended August 31, 2013, the fund was charged $8,973 for services performed by the Chief Compliance Officer and his staff.
The components of “Due toThe Dreyfus Corporation and affiliates” in the Statement of Assets and Liabilities consist of: Shareholder Services Plan fees $4,523, custodian fees $1,003, Chief Compliance Officer fees $6,172 and transfer agency fees $2,430, which are offset against an expense reimbursement currently in effect in the amount of $5,056.
(c) Each Board member also serves as a Board member of other funds within the Dreyfus complex. Annual retainer fees and attendance fees are allocated to each fund based on net assets.
NOTE 4—Securities Transactions:
The aggregate amount of purchases and sales of investment securities, excluding short-term securities, during the period ended August 31, 2013, amounted to $11,538,913 and $7,006,749, respectively.
At August 31, 2013, the cost of investments for federal income tax purposes was $18,896,615; accordingly, accumulated net unrealized appreciation on investments was $2,102,590, consisting of $2,570,355 gross unrealized appreciation and $467,765 gross unrealized depreciation.
22
REPORT OF INDEPENDENT REGISTERED
PUBLIC ACCOUNTING FIRM
Shareholders and Board of Directors
Dreyfus Growth Allocation Fund
We have audited the accompanying statement of assets and liabilities, including the statement of investments, of Dreyfus Growth Allocation Fund (one of the series comprising Strategic Funds, Inc.) as of August 31, 2013, and the related statement of operations for the year then ended, the statement of changes in net assets for each of the two years in the period then ended, and the financial highlights for each of the periods indicated therein. These financial statements and financial highlights are the responsibility of the Fund’s management. Our responsibility is to express an opinion on these financial statements and financial highlights based on our audits.
We conducted our audits in accordance with the standards of the Public Company Accounting Oversight Board (United States).Those standards require that we plan and perform the audit to obtain reasonable assurance about whether the financial statements and financial highlights are free of material misstatement.We were not engaged to perform an audit of the Fund’s internal control over financial reporting. Our audits included consideration of internal control over financial reporting as a basis for designing audit procedures that are appropriate in the circumstances, but not for the purpose of expressing an opinion on the effectiveness of the Fund’s internal control over financial reporting. Accordingly, we express no such opinion.An audit also includes examining, on a test basis, evidence supporting the amounts and disclosures in the financial statements and financial highlights, assessing the accounting principles used and significant estimates made by management, and evaluating the overall financial statement presentation. Our procedures included confirmation of securities owned as of August 31, 2013 by correspondence with the custodian and others. We believe that our audits provide a reasonable basis for our opinion.
In our opinion, the financial statements and financial highlights referred to above present fairly, in all material respects, the financial position of Dreyfus Growth Allocation Fund at August 31, 2013, the results of its operations for the year then ended, the changes in its net assets for each of the two years in the period then ended, and the financial highlights for each of the indicated periods, in conformity with U.S. generally accepted accounting principles.
New York, New York
October 28, 2013
The Fund 23
IMPORTANT TAX INFORMATION (Unaudited)
For federal tax purposes, the fund hereby reports 77.38% of the ordinary dividends paid during the fiscal year ended August 31, 2013 as qualifying for the corporate dividends received deduction. Also, certain dividends paid by the fund may be subject to a maximum tax rate of 15%, as provided for by the Jobs and Growth Tax Relief Reconciliation Act of 2003. Of the distributions paid during the fiscal year, $200,070 represents the maximum amount that may be considered qualified dividend income.The fund also hereby reports $.2355 per share as a long-term capital gain distribution paid on December 31, 2012. Shareholders will receive notification in early 2014 of the percentage applicable to the preparation of their 2013 income tax returns.
24
BOARD MEMBERS INFORMATION (Unaudited)
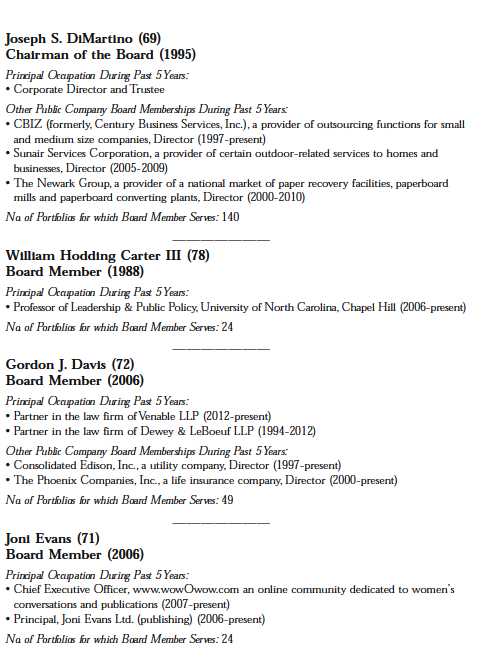
The Fund 25
BOARD MEMBERS INFORMATION (Unaudited) (continued)
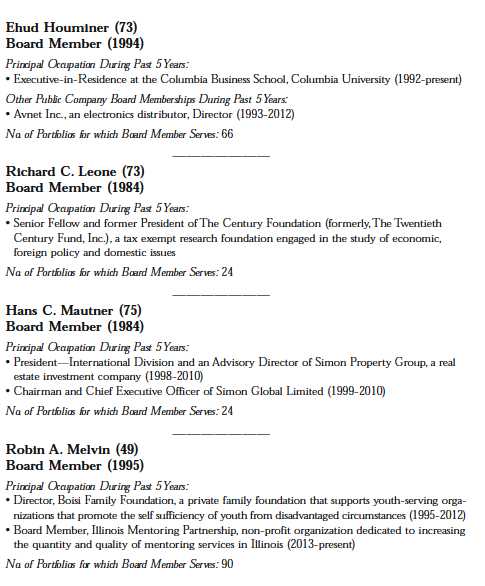
26
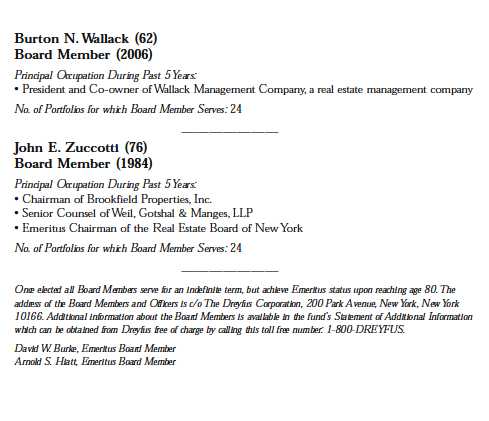
TheFund 27
OFFICERS OF THE FUND (Unaudited)
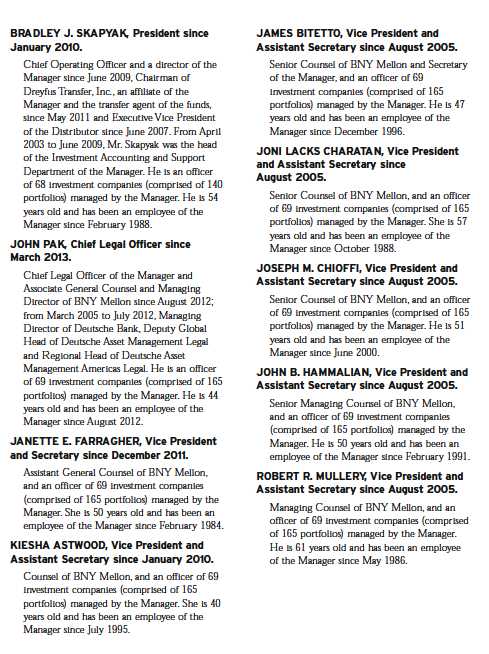
28

The Fund 29
For More Information

Ticker Symbol: SGALX
Telephone Call your financial representative or 1-800-DREYFUS
Mail The Dreyfus Family of Funds, 144 Glenn Curtiss Boulevard, Uniondale, NY 11556-0144
The fund files its complete schedule of portfolio holdings with the Securities and Exchange Commission (“SEC”) for the first and third quarters of each fiscal year on Form N-Q. The fund’s Forms N-Q are available on the SEC’s website at http://www.sec.gov and may be reviewed and copied at the SEC’s Public Reference Room in Washington, DC. Information on the operation of the Public Reference Room may be obtained by calling 1-800-SEC-0330.
A description of the policies and procedures that the fund uses to determine how to vote proxies relating to portfolio securities, and information regarding how the fund voted these proxies for the most recent 12-month period ended June 30 is available at http://www.dreyfus.com and on the SEC’s website at http://www.sec.gov. The description of the policies and procedures is also available without charge, upon request, by calling 1-800-DREYFUS.
|
| © 2013 MBSC Securities Corporation |
Dreyfus
Moderate Allocation Fund
ANNUAL REPORT August 31, 2013

Save time. Save paper. View your next shareholder report online as soon as it’s available. Log into www.dreyfus.com and sign up for Dreyfus eCommunications. It’s simple and only takes a few minutes.
The views expressed in this report reflect those of the portfolio manager only through the end of the period covered and do not necessarily represent the views of Dreyfus or any other person in the Dreyfus organization. Any such views are subject to change at any time based upon market or other conditions and Dreyfus disclaims any responsibility to update such views.These views may not be relied on as investment advice and, because investment decisions for a Dreyfus fund are based on numerous factors, may not be relied on as an indication of trading intent on behalf of any Dreyfus fund.
Not FDIC-Insured • Not Bank-Guaranteed • May Lose Value
| |
| Contents |
| |
| | THE FUND |
| 2 | A Letter from the President |
| 3 | Discussion of Fund Performance |
| 6 | Fund Performance |
| 7 | Understanding Your Fund’s Expenses |
| 7 | Comparing Your Fund’s Expenses |
| With Those of Other Funds |
| 8 | Statement of Investments |
| 9 | Statement of Assets and Liabilities |
| 10 | Statement of Operations |
| 11 | Statement of Changes in Net Assets |
| 12 | Financial Highlights |
| 13 | Notes to Financial Statements |
| 23 | Report of Independent Registered |
| | Public Accounting Firm |
| 24 | Important Tax Information |
| 25 | Board Members Information |
| 28 | Officers of the Fund |
| |
| FOR MORE INFORMATION |
|
| | Back Cover |
Dreyfus
Moderate Allocation Fund
The Fund
A LETTER FROM THE PRESIDENT
Dear Shareholder:
We are pleased to present this annual report for Dreyfus Moderate Allocation Fund, covering the 12-month period from September 1, 2012, through August 31, 2013. For information about how the fund performed during the reporting period, as well as general market perspectives, we provide a Discussion of Fund Performance on the pages that follow.
U.S. equities fared quite well over the past year, weathering periodic bouts of volatility after setting new record highs in the spring for many broad measures of stock market performance. Low interest rates, muted inflationary pressures, and a strong U.S. dollar helped fuel the market’s gains, as did a declining unemployment rate, rebounding housing markets, and increased production of domestic oil and natural gas.
In our analysis, the U.S. economy is nearing an inflection point to a somewhat faster growth rate.We expect a reduced fiscal drag in 2014 and beyond, and the stimulative monetary policy of the past five years should continue to support economic expansion, particularly in interest rate-sensitive industry groups. For information on how these developments may affect your investments, we urge you to discuss these matters with your financial advisor.
Thank you for your continued confidence and support.
Sincerely,

J. Charles Cardona
President
The Dreyfus Corporation
September 16, 2013
2
DISCUSSION OF FUND PERFORMANCE
For the period of September 1, 2012, through August 31, 2013, as provided by Richard B. Hoey and Keith L. Stransky, CFA, Dreyfus Investment Committee Members
Fund and Market Performance Overview
For the 12-month period ended August 31, 2013, Dreyfus Moderate Allocation Fund produced a total return of 8.16%.1 In comparison, the fund’s benchmark, the Standard & Poor’s 500 Composite Stock Price Index produced a total return of 18.70% for the same period. The fund also utilizes a customized blended index composed of 60% Standard & Poor’s 500 Composite Stock Price Index and 40% Barclays U.S.Aggregate Bond Index, and this blended index returned 10.23% for the same period.2
U.S. stocks rallied over much of the reporting period and bonds generally lost a degree of value as investors responded to improving economic data.The fund underperformed its blended benchmark, mainly due to shortfalls in Dreyfus Appreciation Fund and Dreyfus International Stock Fund.
The Fund’s Investment Approach
Dreyfus Moderate Allocation Fund seeks a balance of current income and capital appreciation. In pursuing its goal, the fund normally allocates 60% of its assets to equity securities and 40% of its assets to fixed income securities.
The fund achieves its targeted asset allocation mix by investing in other mutual funds that are advised by The Dreyfus Corporation (Dreyfus). In turn, the underlying funds invest in a wide range of equity and fixed income securities, including U.S. large-, mid-, and small-cap equities; international, global, and emerging-market equities; and U.S. and international fixed income securities.
The fund’s portfolio managers, who comprise the Dreyfus Investment Committee, select the underlying funds based on their investment objectives and management policies, portfolio holdings, risk/reward profiles, historical performance, and other factors.The fund may invest in any of 31 underlying funds identified by the Dreyfus Investment Committee, which generally will select only certain, and not all, of the underlying funds for investment at any given time.
The Fund 3
DISCUSSION OF FUND PERFORMANCE (continued)
Recovering Economy Fueled Equity Market’s Gains
The reporting period began near the outset of a sustained rally among stocks and higher yielding bonds as investors responded positively to improved U.S. employment and housing market data. In addition, investors were encouraged by an aggressively accommodative monetary policy from the Federal Reserve Board (the “Fed”), including the launch of a new round of quantitative easing. Improving conditions in overseas markets also contributed to greater investor optimism.
Economic data remained favorable, and stocks generally continued to rally, through the spring of 2013. Consequently, by mid-May several broad measures of stock market performance reached new record highs. In late May, remarks by Fed chairman Ben Bernanke were interpreted as a signal that U.S. monetary policymakers were likely to back away from their quantitative easing program sooner than expected. Consequently, most financial markets encountered heightened volatility in June, erasing some of the stock market’s previous gains and causing bonds to lose value. Financial markets generally stabilized in July and August when investors returned their focus to company and market fundamentals.
Fund Participated Substantially in Market’s Gains
Although the fund participated significantly in the blended benchmark’s gains, relative performance was constrained by Dreyfus Appreciation Fund, where a high-quality bias and disappointing security selections in the energy sector hurt results. Dreyfus International Stock Fund also lagged market averages, due mainly to shortfalls in China and underweighted exposure to Europe. A mildly overweighted position and poor stock selections in the emerging markets also hurt relative performance.
The fund achieved better results from its modest emphasis on stocks over bonds throughout the reporting period. Positions in small- and mid-cap stocks were particularly helpful. The fund received especially positive contributions from Dreyfus Opportunistic MidcapValue Fund, which achieved above-average results in the financials sector, and Dreyfus StrategicValue Fund, which was bolstered by successful security selections in the financials and energy sectors.
Within the fund’s bond component, relatively strong results from Dreyfus Intermediate-Term Income Fund were largely offset by the underperformance of Dreyfus Bond Market Index Fund.
4
The Dreyfus Investment Committee made three tactical changes to the fund’s investment allocations during the reporting period. In December, we shifted assets from Dreyfus Global Absolute Return Fund into Dreyfus Short-Intermediate Government Bond and Dreyfus Mid-Cap Index Fund.This move generally contributed positively to relative performance. In February, we shifted assets from an S&P 500 Index Fund to Dreyfus Disciplined Stock Fund, believing that active management should provide higher returns. In June, we reduced the fund’s position in Dreyfus Research Growth and added to Global REITS, reflecting an improved outlook for housing markets.
Maintaining a Constructive Posture
Europe’s financial troubles have eased, and the U.S. economy has continued to grow. These developments generally portend well for stocks, reinforcing our confidence in the fund’s current bias toward equities. At the same time, we are aware of recently increased stock valuations and geopolitical risks in various regions of the world.We are carefully watching these and other developments in domestic and global markets, and we stand prepared to adjust the fund’s holdings as warranted.
September 16, 2013
Equity funds are subject generally to market, market sector, market liquidity, issuer and investment style risks, among
other factors, to varying degrees, all of which are more fully described in the fund’s prospectus. Stocks of small- and/or
midcap companies often experience sharper price fluctuations than stocks of large-cap companies.
Asset allocation and diversification cannot assure a profit or protect against loss.
The ability of the fund to achieve its investment goal depends, in part, on the ability of the Dreyfus Investment
Committee to allocate effectively the fund’s assets among the asset classes and the underlying funds.There can be no
assurance that the actual allocations will be effective in achieving the fund’s investment goal.
Bond funds are subject generally to interest rate, credit, liquidity and market risks, to varying degrees, all of which are
more fully described in the fund’s prospectus. Generally, all other factors being equal, bond prices are inversely related
to interest-rate changes, and rate increases can cause price declines.
Investing internationally involves special risks, including changes in currency exchange rates, political, economic and
social instability, a lack of comprehensive company information, differing auditing and legal standards and less market
liquidity. Emerging markets tend to be more volatile than the markets of more mature economies, and generally have
less diverse and less mature economic structures and less stable political systems than those of developed countries.
1 Total return includes reinvestment of dividends and any capital gains paid. Past performance is no guarantee of future
results. Share price and investment return fluctuate such that upon redemption fund shares may be worth more or less
than their original cost. Return figure provided reflects the absorption of certain fund expenses by The Dreyfus
Corporation pursuant to an agreement in effect through January 1, 2014, at which time it may be extended,
terminated or modified. Had these expenses not been absorbed, the fund’s return would have been lower.
2 SOURCE: LIPPER INC. — Reflects reinvestment of dividends and, where applicable, capital gain distributions.
The Standard & Poor’s 500 Composite Stock Price Index is a widely accepted, unmanaged index of U.S. stock
market performance.The Barclays U.S.Aggregate Bond Index is a widely accepted, unmanaged total return index of
corporate, U.S. government and U.S. government agency debt instruments, mortgage-backed securities and asset-backed
securities with an average maturity of 1-10 years. Investors cannot invest directly in any index.
The Fund 5
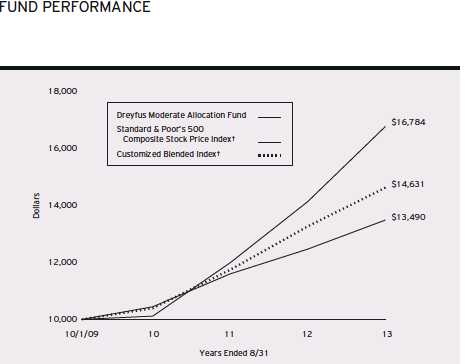
Comparison of change in value of $10,000 investment in Dreyfus Moderate Allocation Fund with the Standard & Poor’s 500 Composite Stock Price Index and the Customized Blended Index
| | | | | |
| Average Annual Total Returns as of 8/31/13 | | | | | |
| | Inception | | | From | |
| | Date | 1 | Year | Inception | |
| Fund | 10/1/09 | 8.16 | % | 7.94 | % |
| Standard & Poor’s 500 | | | | | |
| Composite Stock Price Index | 9/30/09 | 18.70 | % | 14.13 | %†† |
| Customized Blended Index | 9/30/09 | 10.23 | % | 10.20 | %†† |
† Source: Lipper Inc.
Past performance is not predictive of future performance.The fund’s performance shown in the graph and table does not
reflect the deduction of taxes that a shareholder would pay on fund distributions or the redemption of fund shares.
The above graph compares a $10,000 investment made in Dreyfus Moderate Allocation Fund on 10/1/09 (inception
date) to a $10,000 investment made in two different indices: (1) the Standard & Poor’s 500 Composite Stock Price
Index (the “S&P 500 Index”) and (2) the Customized Blended Index.The Customized Blended Index is calculated
on a year-to-date basis.All dividends and capital gain distributions are reinvested.
The fund’s performance shown in the line graph above takes into account all applicable fees and expenses.The S&P 500
Index is a widely accepted, unmanaged index of U.S. stock market performance.The Customized Blended Index is
composed of the S&P 500 Index, 60%, and the Barclays U.S.Aggregate Bond Index (“Barclays Index”), 40%.The
Barclays Index is a widely accepted, unmanaged index of corporate, government and government agency debt instruments,
mortgage-backed securities and asset-backed securities with an average maturity of 1-10 years. Unlike a mutual fund, the
indices are not subject to charges, fees and other expenses. Investors cannot invest directly in any index. Further
information relating to fund performance, including expense reimbursements, if applicable, is contained in the Financial
Highlights section of the prospectus and elsewhere in this report.
† † For comparative purposes, the value of each index on 9/30/09 is used as the beginning value on 10/1/09.6
UNDERSTANDING YOUR FUND’S EXPENSES (Unaudited)
As a mutual fund investor, you pay ongoing expenses, such as management fees and other expenses. Using the information below, you can estimate how these expenses affect your investment and compare them with the expenses of other funds.You also may pay one-time transaction expenses, including sales charges (loads) and redemption fees, which are not shown in this section and would have resulted in higher total expenses. For more information, see your fund’s prospectus or talk to your financial adviser.
Review your fund’s expenses
The table below shows the expenses you would have paid on a $1,000 investment in Dreyfus Moderate Allocation Fund from March 1, 2013 to August 31, 2013. It also shows how much a $1,000 investment would be worth at the close of the period, assuming actual returns and expenses.
Expenses and Value of a $1,000 Investment
assuming actual returns for the six months ended August 31, 2013
| | |
| Expenses paid per $1,000† | $ | 1.22 |
| Ending value (after expenses) | $ | 1,018.90 |
COMPARING YOUR FUND’S EXPENSES WITH THOSE OF OTHER FUNDS (Unaudited)
Using the SEC’s method to compare expenses
The Securities and Exchange Commission (SEC) has established guidelines to help investors assess fund expenses. Per these guidelines, the table below shows your fund’s expenses based on a $1,000 investment, assuming a hypothetical 5% annualized return. You can use this information to compare the ongoing expenses (but not transaction expenses or total cost) of investing in the fund with those of other funds.All mutual fund shareholder reports will provide this information to help you make this comparison. Please note that you cannot use this information to estimate your actual ending account balance and expenses paid during the period.
Expenses and Value of a $1,000 Investment
assuming a hypothetical 5% annualized return for the six months ended August 31, 2013
| | |
| Expenses paid per $1,000† | $ | 1.22 |
| Ending value (after expenses) | $ | 1,024.00 |
† Expenses are equal to the fund's annualized expense ratio of .24% multiplied by the average account value over the
period, multiplied by 184/365 (to reflect the one-half year period).
The Fund 7
STATEMENT OF INVESTMENTS
August 31, 2013
| | | | | | | |
| Registered Investment Companies—99.9% | Shares | | | | Value ($) |
| Dreyfus Appreciation Fund, Investor Shares | | 85,867 | | a | | 4,048,643 |
| Dreyfus Bond Market Index Fund, BASIC Shares | | 652,099 | | a | | 6,840,517 |
| Dreyfus Disciplined Stock Fund | | | 65,994 | | a | | 2,441,765 |
| Dreyfus Emerging Markets Debt Local Currency Fund, Cl. I | | | 150,861 | | a | | 2,041,149 |
| Dreyfus Emerging Markets Fund, Cl. I | | | 315,521 | | a | | 2,823,908 |
| Dreyfus Global Real Estate Securities Fund, Cl. I | | 292,491 | | a | | 2,325,307 |
| Dreyfus High Yield Fund, Cl. I | | | 359,390 | | a | | 2,364,783 |
| Dreyfus Intermediate Term Income Fund, Cl. I | | 548,675 | | a | | 7,407,111 |
| Dreyfus International Bond Fund, Cl. I | | | 130,456 | | a | | 2,136,877 |
| Dreyfus International Equity Fund, Cl. I | | 25,875 | | a | | 814,276 |
| Dreyfus International Stock Index Fund | | 83,251 | | a | | 1,288,721 |
| Dreyfus International Value Fund, Cl. I | | 62,419 | | a | | 718,439 |
| Dreyfus MidCap Index Fund | | | 37,150 | | a | | 1,254,188 |
| Dreyfus Opportunistic Midcap Value Fund, Cl. I | | 34,412 | | a | | 1,311,804 |
| Dreyfus Research Growth Fund, Cl. Z | | | 407,352 | | a | | 4,912,664 |
| Dreyfus Short-Intermediate Government Fund | | 157,204 | | a | | 1,647,496 |
| Dreyfus Small Cap Stock Index Fund | | | 53,532 | | a | | 1,418,058 |
| Dreyfus Strategic Value Fund, Cl. I | | | 102,472 | | a | | 3,828,340 |
| Dreyfus Structured Midcap Fund, Cl. I | | | 50,853 | | a | | 1,367,955 |
| Dreyfus U.S. Equity Fund, Cl. I | | | 199,857 | | a | | 3,575,438 |
| Dreyfus/Newton International Equity Fund, Cl. I | | 69,525 | | a | | 1,316,111 |
| Dreyfus/The Boston Company | | | | | | | |
| Small/Mid Cap Growth Fund, Cl. I | | | 81,014 | | a | | 1,464,730 |
| International Stock Fund, Cl. I | | | 69,698 | | a | | 1,029,434 |
| |
| Total Investments (cost $54,251,078) | | 99.9 | % | | | 58,377,714 |
| Cash and Receivables (Net) | | | .1 | % | | | 37,407 |
| Net Assets | | | 100.0 | % | | | 58,415,121 |
| a Investment in affiliated mutual fund. | | | | | | | |
| |
| |
| Portfolio Summary (Unaudited)† | | | | | | |
| | Value (%) | | | | | | Value (%) |
| Mutual Funds: Domestic | 75.1 | Mutual Funds: Foreign | | | | 24.8 |
| | | | | | | | 99.9 |
| |
| † Based on net assets. | | | | | | | |
| See notes to financial statements. | | | | | | | |
8
STATEMENT OF ASSETS AND LIABILITIES
August 31, 2013
| | |
| | Cost | Value |
| Assets ($): | | |
| Investments in securities—See Statement of | | |
| Investments—Note 1(c) | 54,251,078 | 58,377,714 |
| Cash | | 102,711 |
| Prepaid expenses | | 4,296 |
| | | 58,484,721 |
| Liabilities ($): | | |
| Due to The Dreyfus Corporation and affiliates—Note 3(b) | | 16,321 |
| Payable for shares of Common Stock redeemed | | 2,012 |
| Accrued expenses | | 51,267 |
| | | 69,600 |
| Net Assets ($) | | 58,415,121 |
| Composition of Net Assets ($): | | |
| Paid-in capital | | 53,742,680 |
| Accumulated undistributed investment income—net | | 358,669 |
| Accumulated net realized gain (loss) on investments | | 187,136 |
| Accumulated net unrealized appreciation | | |
| (depreciation) on investments | | 4,126,636 |
| Net Assets ($) | | 58,415,121 |
| Shares Outstanding | | |
| (100 million shares of $.001 par value Common Stock authorized) | | 3,727,340 |
| Net Asset Value, offering and redemption price per share ($) | | 15.67 |
| |
| See notes to financial statements. | | |
The Fund 9
STATEMENT OF OPERATIONS
Year Ended August 31, 2013
| | |
| Investment Income ($): | | |
| Income: | | |
| Cash dividends from affiliated issuers | 950,230 | |
| Expenses: | | |
| Shareholder servicing costs—Note 3(b) | 144,156 | |
| Professional fees | 42,779 | |
| Registration fees | 22,975 | |
| Prospectus and shareholders' reports | 12,415 | |
| Directors' fees and expenses—Note 3(c) | 4,047 | |
| Custodian fees—Note 3(b) | 2,589 | |
| Loan commitment fees—Note 2 | 306 | |
| Miscellaneous | 16,455 | |
| Total Expenses | 245,722 | |
| Less—reduction in expenses due to undertaking—Note 3(a) | (81,143 | ) |
| Less—waiver of shareholder servicing fees—Note 3(b) | (25,093 | ) |
| Less—reduction in fees due to earnings credits—Note 3(b) | (127 | ) |
| Net Expenses | 139,359 | |
| Investment Income—Net | 810,871 | |
| Realized and Unrealized Gain (Loss) on Investments—Note 4 ($): | | |
| Net realized gain (loss) on investments in affiliated issuers | (22,863 | ) |
| Capital gain distributions from affiliated issuers | 663,570 | |
| Net Realized Gain (Loss) | 640,707 | |
| Net unrealized appreciation (depreciation) on investments in affiliated issuers | 1,994,132 | |
| Net Realized and Unrealized Gain (Loss) on Investments | 2,634,839 | |
| Net Increase in Net Assets Resulting from Operations | 3,445,710 | |
| |
| See notes to financial statements. | | |
10
STATEMENT OF CHANGES IN NET ASSETS
| | | | |
| | Year Ended August 31, | |
| | 2013 | | 2012 | |
| Operations ($): | | | | |
| Investment income—net | 810,871 | | 402,992 | |
| Net realized gain (loss) on | | | | |
| investments in affiliated issuers | 640,707 | | 189,050 | |
| Net unrealized appreciation (depreciation) | | | | |
| on investments in affiliated issuers | 1,994,132 | | 1,744,954 | |
| Net Increase (Decrease) in Net Assets | | | | |
| Resulting from Operations | 3,445,710 | | 2,336,996 | |
| Dividends to Shareholders from ($): | | | | |
| Investment income—net | (710,162 | ) | (461,135 | ) |
| Net realized gain on investments | (371,011 | ) | (193,285 | ) |
| Total Dividends | (1,081,173 | ) | (654,420 | ) |
| Capital Stock Transactions ($): | | | | |
| Net proceeds from shares sold | 25,769,874 | | 10,597,642 | |
| Dividends reinvested | 1,056,139 | | 634,801 | |
| Cost of shares redeemed | (6,164,666 | ) | (5,365,776 | ) |
| Increase (Decrease) in Net Assets | | | | |
| from Capital Stock Transactions | 20,661,347 | | 5,866,667 | |
| Total Increase (Decrease) in Net Assets | 23,025,884 | | 7,549,243 | |
| Net Assets ($): | | | | |
| Beginning of Period | 35,389,237 | | 27,839,994 | |
| End of Period | 58,415,121 | | 35,389,237 | |
| Undistributed investment income—net | 358,669 | | 134,331 | |
| Capital Share Transactions (Shares): | | | | |
| Shares sold | 1,670,196 | | 741,910 | |
| Shares issued for dividends reinvested | 70,645 | | 46,167 | |
| Shares redeemed | (397,016 | ) | (375,691 | ) |
| Net Increase (Decrease) in Shares Outstanding | 1,343,825 | | 412,386 | |
| |
| See notes to financial statements. | | | | |
The Fund 11
FINANCIAL HIGHLIGHTS
The following table describes the performance for the fiscal periods indicated. Total return shows how much your investment in the fund would have increased (or decreased) during each period, assuming you had reinvested all dividends and distributions.These figures have been derived from the fund’s financial statements.
| | | | | | | | |
| | | | Year Ended August 31, | | | |
| | 2013 | | 2012 | | 2011 | | 2010 | a |
| Per Share Data ($): | | | | | | | | |
| Net asset value, beginning of period | 14.85 | | 14.12 | | 12.93 | | 12.50 | |
| Investment Operations: | | | | | | | | |
| Investment income—netb | .26 | | .18 | | .18 | | .14 | |
| Net realized and unrealized | | | | | | | | |
| gain (loss) on investments | .94 | | .86 | | 1.25 | | .41 | |
| Total from Investment Operations | 1.20 | | 1.04 | | 1.43 | | .55 | |
| Distributions: | | | | | | | | |
| Dividends from investment income—net | (.25 | ) | (.22 | ) | (.20 | ) | (.12 | ) |
| Dividends from net realized | | | | | | | | |
| gain on investments | (.13 | ) | (.09 | ) | (.04 | ) | — | |
| Total Distributions | (.38 | ) | (.31 | ) | (.24 | ) | (.12 | ) |
| Net asset value, end of period | 15.67 | | 14.85 | | 14.12 | | 12.93 | |
| Total Return (%) | 8.16 | | 7.57 | | 11.02 | | 4.43 | c |
| Ratios/Supplemental Data (%): | | | | | | | | |
| Ratio of total expenses | | | | | | | | |
| to average net assetsd | .51 | | .63 | | .74 | | 1.96 | e |
| Ratio of net expenses | | | | | | | | |
| to average net assetsd | .29 | | .59 | | .63 | | .65 | e |
| Ratio of net investment income | | | | | | | | |
| to average net assetsd | 1.68 | | 1.27 | | 1.25 | | 1.27 | e |
| Portfolio Turnover Rate | 31.25 | | 28.82 | | 17.48 | | 31.21 | c |
| Net Assets, end of period ($ x 1,000) | 58,415 | | 35,389 | | 27,840 | | 11,200 | |
a From October 1, 2009 (commencement of operations) to August 31, 2010.
b Based on average shares outstanding at each month end.
c Not annualized.
d Amounts do not include the activity of the underlying funds.
e Annualized.
See notes to financial statements.
12
NOTES TO FINANCIAL STATEMENTS
NOTE 1—Significant Accounting Policies:
Dreyfus Moderate Allocation Fund (the “fund”) is a separate diversified series of Strategic Funds, Inc. (the “Company”) which is registered under the Investment Company Act of 1940, as amended (the “Act”), as an open-end management investment company and operates as a series company currently offering nine series, including the fund.The fund’s investment objective is to seek current income with some consideration for capital appreciation. The Dreyfus Corporation (the “Manager” or “Dreyfus”), a wholly-owned subsidiary of The Bank of New York Mellon Corporation (“BNY Mellon”), serves as the fund’s investment adviser. MBSC Securities Corporation (the “Distributor”), a wholly-owned subsidiary of the Manager, is the distributor of the fund’s shares, which are sold to the public without a sales charge.
The Company accounts separately for the assets, liabilities and operations of each series. Expenses directly attributable to each series are charged to that series’ operations; expenses which are applicable to all series are allocated among them on a pro rata basis.
The Financial Accounting Standards Board (“FASB”) Accounting Standards Codification is the exclusive reference of authoritative U.S. generally accepted accounting principles (“GAAP”) recognized by the FASB to be applied by nongovernmental entities. Rules and interpretive releases of the Securities and Exchange Commission (“SEC”) under authority of federal laws are also sources of authoritative GAAP for SEC registrants. The fund’s financial statements are prepared in accordance with GAAP, which may require the use of management estimates and assumptions.Actual results could differ from those estimates.
The Company enters into contracts that contain a variety of indemnifications.The fund’s maximum exposure under these arrangements is unknown.The fund does not anticipate recognizing any loss related to these arrangements.
The Fund 13
NOTES TO FINANCIAL STATEMENTS (continued)
(a) Portfolio valuation: The fair value of a financial instrument is the amount that would be received to sell an asset or paid to transfer a liability in an orderly transaction between market participants at the measurement date (i.e., the exit price). GAAP establishes a fair value hierarchy that prioritizes the inputs of valuation techniques used to measure fair value.This hierarchy gives the highest priority to unadjusted quoted prices in active markets for identical assets or liabilities (Level 1 measurements) and the lowest priority to unobservable inputs (Level 3 measurements).
Additionally, GAAP provides guidance on determining whether the volume and activity in a market has decreased significantly and whether such a decrease in activity results in transactions that are not orderly. GAAP requires enhanced disclosures around valuation inputs and techniques used during annual and interim periods.
Various inputs are used in determining the value of the fund’s investments relating to fair value measurements.These inputs are summarized in the three broad levels listed below:
Level 1—unadjusted quoted prices in active markets for identical investments.
Level 2—other significant observable inputs (including quoted prices for similar investments, interest rates, prepayment speeds, credit risk, etc.).
Level 3—significant unobservable inputs (including the fund’s own assumptions in determining the fair value of investments).
The inputs or methodology used for valuing securities are not necessarily an indication of the risk associated with investing in those securities.
Investments are valued at the net asset value of each underlying fund determined as of the close of the NewYork Stock Exchange (generally 4 p.m., Eastern time) on the valuation date and are generally categorized within Level 1 of the fair value hierarchy.
14
The following is a summary of the inputs used as of August 31, 2013 in valuing the fund’s investments:
| | | | |
| | | Level 2—Other | Level 3— | |
| | Level 1— | Significant | Significant | |
| | Unadjusted | Observable | Unobservable | |
| | Quoted Prices | Inputs | Inputs | Total |
| Assets ($) | | | | |
| Investments in Securities: | | | |
| Mutual Funds | 58,377,714 | — | — | 58,377,714 |
At August 31, 2013, there were no transfers between Level 1 and Level 2 of the fair value hierarchy.
(b) Securities transactions and investment income: Securities transactions are recorded on a trade date basis. Realized gains and losses from securities transactions are recorded on the identified cost basis. Dividend income is recognized on the ex-dividend date and interest income, including, where applicable, accretion of discount and amortization of premium on investments, is recognized on the accrual basis.
(c) Affiliated issuers: Investments in other investment companies advised by Dreyfus are defined as “affiliated” under the Act. Investments in affiliated investment companies during the period ended August 31, 2013 were as follows:
| | | | | | |
| Affiliated | | | | | | |
| Investment | Value | | | | Net Realized | |
| Company | 8/31/2012 | ($) | Purchases ($)† | Sales ($) | Gain (Loss) ($) | |
| Dreyfus | | | | | | |
| Appreciation Fund, | | | | | | |
| Investor Shares | 2,513,432 | | 1,481,189 | 129,387 | (1,079 | ) |
| Dreyfus BASIC S&P | | | | | | |
| 500 Stock | | | | | | |
| Index Fund | 1,392,358 | | 471,456 | 1,991,431 | 132,881 | |
| Dreyfus Bond Market | | | | | | |
| Index Fund, | | | | | | |
| BASIC Shares | 4,717,540 | | 2,726,369 | 231,048 | (6,734 | ) |
| Dreyfus Disciplined | | | | | | |
| Stock Fund | — | | 2,339,119 | 41,430 | (419 | ) |
The Fund 15
NOTES TO FINANCIAL STATEMENTS (continued)
| | | | | | |
| Affiliated | | | | | | |
| Investment | Value | | | | Net Realized | |
| Company | 8/31/2012 | ($) | Purchases ($)† | Sales ($) | Gain (Loss) ($) | |
| Dreyfus Emerging | | | | | | |
| Markets Debt Local | | | | | | |
| Currency Fund, Cl. I | 1,378,085 | | 913,863 | 77,017 | (3,580 | ) |
| Dreyfus Emerging | | | | | | |
| Markets Fund, Cl. I | 1,716,411 | | 1,414,036 | 125,921 | (19,959 | ) |
| Dreyfus Global | | | | | | |
| Absolute | | | | | | |
| Return Fund, Cl. I | 1,785,072 | | 415,575 | 2,144,772 | (15,155 | ) |
| Dreyfus Global Real | | | | | | |
| Estate Securities | | | | | | |
| Fund, Cl. I | 999,462 | | 1,428,871 | 50,831 | (1,896 | ) |
| Dreyfus High Yield | | | | | | |
| Fund, Cl. I | 1,460,676 | | 975,378 | 77,016 | (1,567 | ) |
| Dreyfus Intermediate | | | | | | |
| Term Income | | | | | | |
| Fund, Cl. I | — | | 7,863,247 | 109,403 | (4,518 | ) |
| Dreyfus International | | | | | | |
| Bond Fund, Cl. I | 1,397,448 | | 913,367 | 77,016 | (3,120 | ) |
| Dreyfus International | | | | | | |
| Equity Fund, Cl. I | 437,602 | | 300,858 | 25,993 | (738 | ) |
| Dreyfus International | | | | | | |
| Stock Index Fund | 700,429 | | 502,072 | 43,321 | (1,633 | ) |
| Dreyfus International | | | | | | |
| Value Fund, Cl. I | 360,545 | | 298,180 | 25,993 | (1,327 | ) |
| Dreyfus MidCap | | | | | | |
| Core Fund, Cl. I | 748,317 | | 470,455 | 1,297,431 | 153,779 | |
| Dreyfus MidCap | | | | | | |
| Index Fund | — | | 1,179,047 | 34,283 | (514 | ) |
| Dreyfus Opportunistic | | | | | | |
| Midcap Value | | | | | | |
| Fund, Cl. I | 671,677 | | 427,326 | 38,507 | (447 | ) |
| Dreyfus Research | | | | | | |
| Growth Fund, Cl. Z | 3,337,757 | | 1,852,360 | 965,955 | 23,451 | |
| Dreyfus Short- | | | | | | |
| Intermediate | | | | | | |
| Government Fund | — | | 1,716,303 | 51,581 | (235 | ) |
| Dreyfus Small Cap | | | | | | |
| Stock Index Fund | 775,955 | | 463,796 | 38,509 | (257 | ) |
| Dreyfus Strategic | | | | | | |
| Value Fund, Cl. I | 1,993,138 | | 1,257,849 | 110,903 | (614 | ) |
| Dreyfus Structured | | | | | | |
| Midcap Fund Cl. I | — | | 1,377,032 | 13,163 | (211 | ) |
| Dreyfus Total Return | | | | | | |
| Advantage Fund, Cl. I | 4,959,878 | | 2,500,194 | 7,043,533 | (265,976 | ) |
| Dreyfus U.S. Equity | | | | | | |
| Fund, Cl. I | 2,029,670 | | 1,177,712 | 104,742 | (693 | ) |
16
| | | | | | | | |
| Affiliated | | | | | | | | |
| Investment | | Value | | | | | Net Realized | |
| Company | | 8/31/2012 | ($) | Purchases ($)† | | Sales ($) | Gain (Loss) ($) | |
| Dreyfus/Newton | | | | | | | | |
| International | | | | | | | | |
| Equity Fund, Cl. I | 728,765 | | 491,028 | | 43,322 | (985 | ) |
| Dreyfus/The Boston | | | | | | | |
| Company Small/Mid Cap | | | | | | |
| Growth Fund, Cl. I | 812,170 | | 495,878 | | 38,508 | (657 | ) |
| International Stock | | | | | | | |
| Fund, Cl. I | | 608,632 | | 394,539 | | 34,657 | (660 | ) |
| TOTAL | | 35,525,019 | | 35,847,099 14,965,673 | (22,863 | ) |
| |
| † Includes reinvested dividends/distributions. | | | | | | |
| |
| |
| | Change in Net | | | | | | |
| Affiliated | | Unrealized | | | | | | |
| Investment | | Appreciation | | Value | | Net | Dividends/ | |
| Company | (Depreciation) ($) | | 8/31/2013 | ($) | Assets (%) | Distributions ($) | |
| Dreyfus | | | | | | | | |
| Appreciation Fund, | | | | | | | |
| Investor Shares | 184,488 | | 4,048,643 | | 6.9 | 57,034 | |
| Dreyfus BASIC S&P | | | | | | | |
| 500 Stock Index Fund | (5,264 | ) | — | | — | 18,198 | |
| Dreyfus Bond | | | | | | | | |
| Market Index Fund, | | | | | | | |
| BASIC Shares | | (365,610 | ) | 6,840,517 | | 11.7 | 183,235 | |
| Dreyfus Disciplined | | | | | | | |
| Stock Fund | | 144,495 | | 2,441,765 | | 4.2 | 8,089 | |
| Dreyfus Emerging | | | | | | | |
| Markets Debt Local | | | | | | | |
| Currency Fund, Cl. I | (170,202 | ) | 2,041,149 | | 3.5 | 66,152 | |
| Dreyfus Emerging | | | | | | | |
| Markets Fund, Cl. I | (160,659 | ) | 2,823,908 | | 4.8 | 28,027 | |
| Dreyfus Global Absolute | | | | | | | |
| Return Fund, Cl. I | (40,720 | ) | — | | — | — | |
| Dreyfus Global Real | | | | | | | |
| Estate Securities | | | | | | | |
| Fund, Cl. I | | (50,299 | ) | 2,325,307 | | 4.0 | 69,781 | |
| Dreyfus High Yield | | | | | | | |
| Fund, Cl. I | | 7,312 | | 2,364,783 | | 4.0 | 127,666 | |
| Dreyfus Intermediate | | | | | | | |
| Term Income | | | | | | | | |
| Fund, Cl. I | | (342,215 | ) | 7,407,111 | | 12.7 | 60,701 | |
| Dreyfus International | | | | | | | |
| Bond Fund, Cl. I | (93,802 | ) | 2,136,877 | | 3.7 | 65,657 | |
| Dreyfus International | | | | | | | |
| Equity Fund, Cl. I | 102,547 | | 814,276 | | 1.4 | 14,755 | |
The Fund 17
NOTES TO FINANCIAL STATEMENTS (continued)
| | | | | | |
| | Change in Net | | | | | |
| Affiliated | Unrealized | | | | | |
| Investment | Appreciation | | Value | | Net | Dividends/ |
| Company | (Depreciation) ($) | | 8/31/2013 | ($) | Assets (%) | Distributions ($) |
| Dreyfus International | | | | | | |
| Stock Index Fund | 131,174 | | 1,288,721 | | 2.2 | 25,234 |
| Dreyfus International | | | | | | |
| Value Fund, Cl. I | 87,034 | | 718,439 | | 1.2 | 12,077 |
| Dreyfus MidCap | | | | | | |
| Core Fund, Cl. I | (75,120 | ) | — | | — | 151,536 |
| Dreyfus MidCap | | | | | | |
| Index Fund | 109,938 | | 1,254,188 | | 2.1 | 40,462 |
| Dreyfus Opportunistic | | | | | |
| Midcap Value | | | | | | |
| Fund, Cl. I | 251,755 | | 1,311,804 | | 2.3 | 3,471 |
| Dreyfus Research | | | | | | |
| Growth Fund, Cl. Z | 665,051 | | 4,912,664 | | 8.4 | 21,303 |
| Dreyfus Short- | | | | | | |
| Intermediate | | | | | | |
| Government Fund | (16,991 | ) | 1,647,496 | | 2.8 | 7,090 |
| Dreyfus Small Cap | | | | | | |
| Stock Index Fund | 217,073 | | 1,418,058 | | 2.4 | 39,940 |
| Dreyfus Strategic | | | | | | |
| Value Fund, Cl. I | 688,870 | | 3,828,340 | | 6.6 | 37,144 |
| Dreyfus Structured | | | | | | |
| Midcap Fund Cl. I | 4,297 | | 1,367,955 | | 2.3 | — |
| Dreyfus Total Return | | | | | | |
| Advantage | | | | | | |
| Fund, Cl. I | (150,563 | ) | — | | — | 452,141 |
| Dreyfus U.S. Equity | | | | | | |
| Fund, Cl. I | 473,491 | | 3,575,438 | | 6.1 | 24,825 |
| Dreyfus/Newton | | | | | | |
| International | | | | | | |
| Equity Fund, Cl. I | 140,625 | | 1,316,111 | | 2.3 | 14,191 |
| Dreyfus/The Boston | | | | | | |
| Company Small/Mid Cap | | | | | |
| Growth Fund, Cl. I | 195,847 | | 1,464,730 | | 2.5 | 72,022 |
| International Stock | | | | | | |
| Fund, Cl. I | 61,580 | | 1,029,434 | | 1.8 | 13,069 |
| TOTAL | 1,994,132 | | 58,377,714 | | 99.9 | 1,613,800 |
(d) Dividends to shareholders: Dividends are recorded on the ex-dividend date. Dividends from investment income-net and dividends from net realized capital gains, if any, are normally declared and paid annually, but the fund may make distributions on a more frequent basis
18
to comply with the distribution requirements of the Internal Revenue Code of 1986, as amended (the “Code”).To the extent that net realized capital gains can be offset by capital loss carryovers, it is the policy of the fund not to distribute such gains. Income and capital gain distributions are determined in accordance with income tax regulations, which may differ from GAAP.
(e) Federal income taxes: It is the policy of the fund to continue to qualify as a regulated investment company, if such qualification is in the best interests of its shareholders, by complying with the applicable provisions of the Code, and to make distributions of taxable income sufficient to relieve it from substantially all federal income and excise taxes.
As of and during the period ended August 31, 2013, the fund did not have any liabilities for any uncertain tax positions. The fund recognizes interest and penalties, if any, related to uncertain tax positions as income tax expense in the Statement of Operations. During the period, the fund did not incur any interest or penalties.
Each tax year in the four-year period ended August 31, 2013 remains subject to examination by the Internal Revenue Service and state taxing authorities.
At August 31, 2013, the components of accumulated earnings on a tax basis were as follows: undistributed ordinary income $498,881, undistributed capital gains $380,505 and unrealized appreciation $3,793,055.
The tax character of distributions paid to shareholders during the fiscal periods ended August 31, 2013 and August 31, 2012 were as follows: ordinary income $711,611 and $543,406, and long-term capital gains $369,562 and $111,014, respectively.
During the period ended August 31, 2013, as a result of permanent book to tax differences, primarily due to the tax treatment for short-term capital gain distributions from regulated investment company holdings, the fund increased accumulated undistributed investment income-net by
The Fund 19
NOTES TO FINANCIAL STATEMENTS (continued)
$123,629 and decreased accumulated net realized gain (loss) on investments by the same amount. Net assets and net asset value per share were not affected by this reclassification.
NOTE 2—Bank Lines of Credit:
The fund participates with other Dreyfus-managed funds in a $210 million unsecured credit facility led by Citibank, N.A. and a $300 million unsecured credit facility provided by The Bank of New York Mellon, a subsidiary of BNY Mellon and an affiliate of Dreyfus (each, a “Facility”), each to be utilized primarily for temporary or emergency purposes, including the financing of redemptions. Prior to October 10, 2012, the unsecured credit facility with Citibank, N.A. was $225 million. In connection therewith, the fund has agreed to pay its pro rata portion of commitment fees for each Facility. Interest is charged to the fund based on rates determined pursuant to the terms of the respective Facility at the time of borrowing. During the period ended August 31, 2013, the fund did not borrow under the Facilities.
NOTE 3—Management Fee and Other Transactions With Affiliates:
(a) Pursuant to a management agreement with the Manager, there is no management fee paid to the Manager.The fund invests in other mutual funds advised by the Manager. All fees and expenses of the underlying funds are reflected in the underlying funds’ net asset values.
The Manager had agreed, from September 1, 2012 through October 31, 2012, to assume the expenses of the fund so that the total annual fund’s and underlying funds’ operating expenses (excluding taxes, interest expense, brokerage commissions, commitment fees on borrowings and extraordinary expenses) did not exceed 1.45% of the value of the fund’s average daily net assets.Thereafter, the Manager has contractually agreed, from November 1, 2012 through January 1, 2014, to assume the expenses of the fund so that the total annual fund’s and underlying funds’ operating expenses (exclusive of certain expenses as described above) do not exceed
20
1.05% of the value of the fund’s average daily net assets.The reduction in expenses, pursuant to the undertaking, amounted to $81,143 during the period ended August 31, 2013.
(b) Under the Shareholder Services Plan, the fund pays the Distributor at an annual rate of .25% of the value of the fund’s average daily net assets for the provision of certain services.The services provided may include personal services relating to shareholder accounts, such as answering shareholder inquiries regarding the fund’s shares and providing reports and other information, and services related to the maintenance of shareholder accounts.The Distributor may make payments to Service Agents (securities dealers, financial institutions or other industry professionals) with respect to these services.The Distributor determines the amounts to be paid to Service Agents. Fees paid to the Distributor will be waived to the extent that the fund invests in an underlying affiliated fund with a Shareholder Services Plan. During the period ended August 31, 2013, the fund was charged $120,689 pursuant to the Shareholder Services Plan of which $25,093 was waived due to the fund’s investment in certain of the underlying funds.
The fund has arrangements with the transfer agent and the custodian whereby the fund may receive earnings credits when positive cash balances are maintained, which are used to offset transfer agency and custody fees. For financial reporting purposes, the fund includes net earnings credits as an expense offset in the Statement of Operations.
The fund compensates DreyfusTransfer, Inc., a wholly-owned subsidiary of the Manager, under a transfer agency agreement for providing transfer agency services for the fund and cash management services related to fund subscriptions and redemptions. During the period ended August 31, 2013, the fund was charged $14,446 for transfer agency services and $1,031 for cash management services. These fees are included in Shareholder servicing costs in the Statement of Operations. Cash management fees were partially offset by earnings credits of $124.
The Fund 21
NOTES TO FINANCIAL STATEMENTS (continued)
The fund compensatesThe Bank of NewYork Mellon under a custody agreement for providing custodial services for the fund. During the period ended August 31, 2013, the fund was charged $2,589 pursuant to the custody agreement.
The fund compensates The Bank of New York Mellon under a cash management agreement for performing certain cash management services related to fund subscriptions and redemptions. During the period ended August 31, 2013, the fund was charged $529 pursuant to the cash management agreement, which is included in Shareholder servicing costs in the Statement of Operations.These fees were partially offset by earnings credits of $3.
During the period ended August 31, 2013, the fund was charged $8,973 for services performed by the Chief Compliance Officer and his staff.
The components of “Due toThe Dreyfus Corporation and affiliates” in the Statement of Assets and Liabilities consist of: Shareholder Services Plan fees $12,424, custodian fees $1,040, Chief Compliance Officer fees $6,172 and transfer agency fees $5,604, which are offset against an expense reimbursement currently in effect in the amount of $8,919.
(c) Each Board member also serves as a Board member of other funds within the Dreyfus complex. Annual retainer fees and attendance fees are allocated to each fund based on net assets.
NOTE 4—Securities Transactions:
The aggregate amount of purchases and sales of investment securities, excluding short-term securities, during the period ended August 31, 2013, amounted to $35,847,099 and $14,965,673, respectively.
At August 31, 2013, the cost of investments for federal income tax purposes was $54,584,659; accordingly, accumulated net unrealized appreciation on investments was $3,793,055, consisting of $5,083,743 gross unrealized appreciation and $1,290,688 gross unrealized depreciation.
22
REPORT OF INDEPENDENT REGISTERED
PUBLIC ACCOUNTING FIRM
Shareholders and Board of Directors
Dreyfus Moderate Allocation Fund
We have audited the accompanying statement of assets and liabilities, including the statement of investments, of Dreyfus Moderate Allocation Fund (one of the series comprising Strategic Funds, Inc.) as of August 31, 2013, and the related statement of operations for the year then ended, the statement of changes in net assets for each of the two years in the period the ended, and the financial highlights for each of the periods indicated therein.These financial statements and financial highlights are the responsibility of the Fund’s management. Our responsibility is to express an opinion on these financial statements and financial highlights based on our audits.
We conducted our audits in accordance with the standards of the Public Company Accounting Oversight Board (United States).Those standards require that we plan and perform the audit to obtain reasonable assurance about whether the financial statements and financial highlights are free of material misstatement.We were not engaged to perform an audit of the Fund’s internal control over financial reporting. Our audits included consideration of internal control over financial reporting as a basis for designing audit procedures that are appropriate in the circumstances, but not for the purpose of expressing an opinion on the effectiveness of the Fund’s internal control over financial reporting. Accordingly, we express no such opinion.An audit also includes examining, on a test basis, evidence supporting the amounts and disclosures in the financial statements and financial highlights, assessing the accounting principles used and significant estimates made by management, and evaluating the overall financial statement presentation. Our procedures included confirmation of securities owned as of August 31, 2013 by correspondence with the custodian and others.We believe that our audits provide a reasonable basis for our opinion.
In our opinion, the financial statements and financial highlights referred to above present fairly, in all material respects, the financial position of Dreyfus Moderate Allocation Fund at August 31, 2013, the results of its operations for the year then ended, the changes in its net assets for each of the two years in the period then ended, and the financial highlights for each of the indicated periods, in conformity with U.S. generally accepted accounting principles.
New York, New York
October 28, 2013
The Fund 23
IMPORTANT TAX INFORMATION (Unaudited)
For federal tax purposes, the fund hereby reports 90.37% of the ordinary dividends paid during the fiscal year ended August 31, 2013 as qualifying for the corporate dividends received deduction. Also, certain dividends paid by the fund may be subject to a maximum tax rate of 15%, as provided for by the Jobs and Growth Tax Relief Reconciliation Act of 2003. Of the distributions paid during the fiscal year, $711,611 represents the maximum amount that may be considered qualified dividend income.The fund also hereby reports $.0005 per share as a short-term capital gain distribution and $.1276 per share as a long-term capital gain distribution paid on December 31, 2012. Shareholders will receive notification in early 2014 of the percentage applicable to the preparation of their 2013 income tax returns.
24
BOARD MEMBERS INFORMATION (Unaudited)
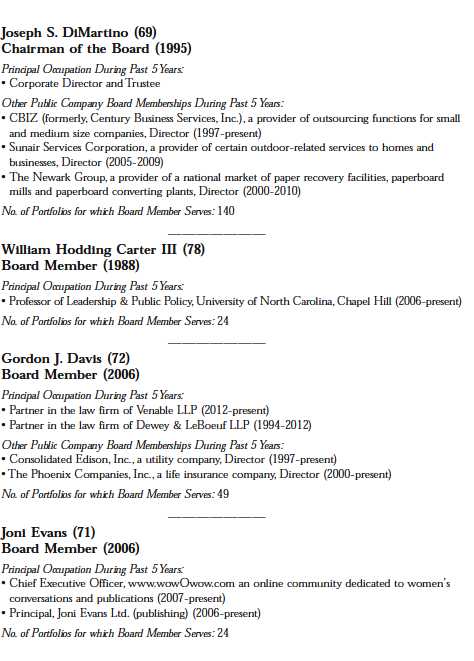
The Fund 25
BOARD MEMBERS INFORMATION (Unaudited) (continued)
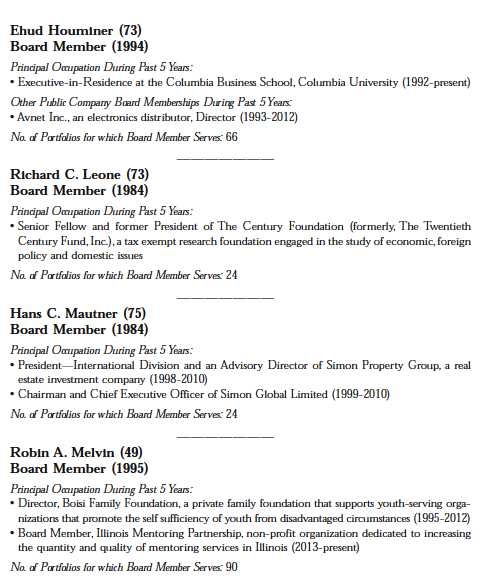
26
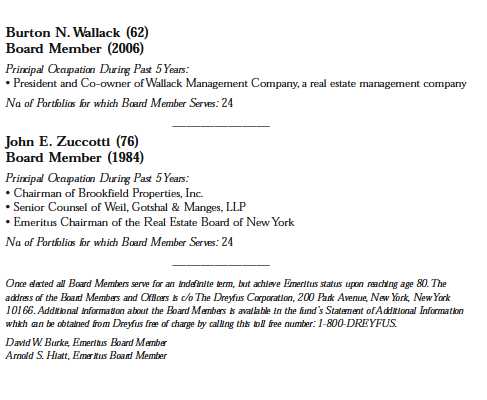
The Fund 27
OFFICERS OF THE FUND (Unaudited)

28
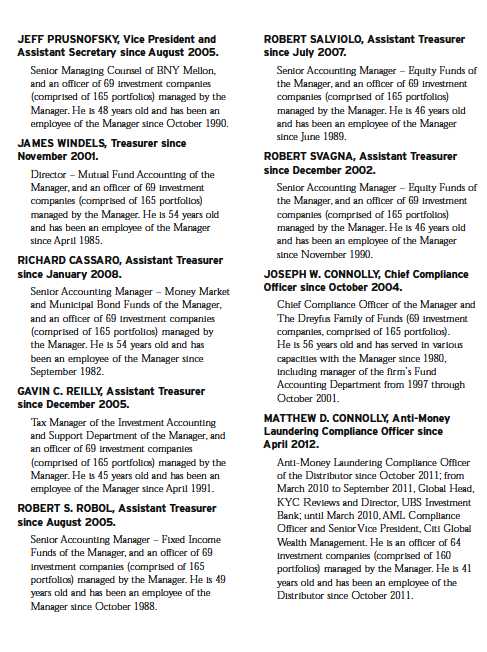
The Fund 29
For More Information
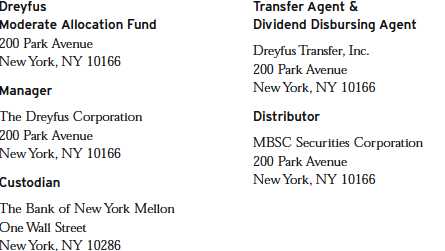
Ticker Symbol: SMDAX
Telephone Call your financial representative or 1-800-DREYFUS
Mail The Dreyfus Family of Funds, 144 Glenn Curtiss Boulevard, Uniondale, NY 11556-0144
The fund files its complete schedule of portfolio holdings with the Securities and Exchange Commission (“SEC”) for the first and third quarters of each fiscal year on Form N-Q. The fund’s Forms N-Q are available on the SEC’s website at http://www.sec.gov and may be reviewed and copied at the SEC’s Public Reference Room in Washington, DC. Information on the operation of the Public Reference Room may be obtained by calling 1-800-SEC-0330.
A description of the policies and procedures that the fund uses to determine how to vote proxies relating to portfolio securities, and information regarding how the fund voted these proxies for the most recent 12-month period ended June 30 is available at http://www.dreyfus.com and on the SEC’s website at http://www.sec.gov. The description of the policies and procedures is also available without charge, upon request, by calling 1-800-DREYFUS.

|
| © 2013 MBSC Securities Corporation |
Item 2. Code of Ethics.
The Registrant has adopted a code of ethics that applies to the Registrant's principal executive officer, principal financial officer, principal accounting officer or controller, or persons performing similar functions. There have been no amendments to, or waivers in connection with, the Code of Ethics during the period covered by this Report.
Item 3. Audit Committee Financial Expert.
The Registrant's Board has determined that Ehud Houminer, a member of the Audit Committee of the Board, is an audit committee financial expert as defined by the Securities and Exchange Commission (the "SEC"). Ehud Houminer is "independent" as defined by the SEC for purposes of audit committee financial expert determinations.
Item 4. Principal Accountant Fees and Services.
(a) Audit Fees. The aggregate fees billed for each of the last two fiscal years (the "Reporting Periods") for professional services rendered by the Registrant's principal accountant (the "Auditor") for the audit of the Registrant's annual financial statements or services that are normally provided by the Auditor in connection with the statutory and regulatory filings or engagements for the Reporting Periods, were $92,571 in 2012 and $94,782 in 2013.
(b) Audit-Related Fees. The aggregate fees billed in the Reporting Periods for assurance and related services by the Auditor that are reasonably related to the performance of the audit of the Registrant's financial statements and are not reported under paragraph (a) of this Item 4 were $ 18,000 in 2012 and $18,000 in 2013. These services consisted of one or more of the following: (i) agreed upon procedures related to compliance with Internal Revenue Code section 817(h), (ii) security counts required by Rule 17f-2 under the Investment Company Act of 1940, as amended, (iii) advisory services as to the accounting or disclosure treatment of Registrant transactions or events and (iv) advisory services to the accounting or disclosure treatment of the actual or potential impact to the Registrant of final or proposed rules, standards or interpretations by the Securities and Exchange Commission, the Financial Accounting Standards Boards or other regulatory or standard-setting bodies.
The aggregate fees billed in the Reporting Periods for non-audit assurance and related services by the Auditor to the Registrant's investment adviser (not including any sub-investment adviser whose role is primarily portfolio management and is subcontracted with or overseen by another investment adviser), and any entity controlling, controlled by or under common control with the investment adviser that provides ongoing services to the Registrant ("Service Affiliates"), that were reasonably related to the performance of the annual audit of the Service Affiliate, which required pre-approval by the Audit Committee were $0 in 2012 and $0 in 2013.
(c) Tax Fees. The aggregate fees billed in the Reporting Periods for professional services rendered by the Auditor for tax compliance, tax advice, and tax planning ("Tax Services") were $9,747 in 2012 and $12,010 in 2013. These services consisted of: (i) review or preparation of U.S. federal, state, local and excise tax returns; (ii) U.S. federal, state and local tax planning, advice and assistance regarding statutory, regulatory or administrative developments; (iii) tax advice regarding tax qualification matters and/or treatment of various financial instruments held or proposed to be acquired or held, and (iv) determination of Passive Foreign Investment Companies. The aggregate fees billed in the Reporting Periods for Tax Services by the Auditor to Service Affiliates, which required pre-approval by the Audit Committee were $0 in 2012 and $0 in 2013.
(d) All Other Fees. The aggregate fees billed in the Reporting Periods for products and services provided by the Auditor, other than the services reported in paragraphs (a) through (c) of this Item, were $213 in 2012 and $247 in 2013. [These services consisted of a review of the Registrant's anti-money laundering program].
The aggregate fees billed in the Reporting Periods for Non-Audit Services by the Auditor to Service Affiliates, other than the services reported in paragraphs (b) through (c) of this Item, which required pre-approval by the Audit Committee, were $200,000 in 2012 and $0 in 2013.
(e)(1) Audit Committee Pre-Approval Policies and Procedures. The Registrant's Audit Committee has established policies and procedures (the "Policy") for pre-approval (within specified fee limits) of the Auditor's engagements for non-audit services to the Registrant and Service Affiliates without specific case-by-case consideration. The pre-approved services in the Policy can include pre-approved audit services, pre-approved audit-related services, pre-approved tax services and pre-approved all other services. Pre-approval considerations include whether the proposed services are compatible with maintaining the Auditor's independence. Pre-approvals pursuant to the Policy are considered annually.
(e)(2) Note: None of the services described in paragraphs (b) through (d) of this Item 4 were approved by the Audit Committee pursuant to paragraph (c)(7)(i)(C) of Rule 2-01 of Regulation S-X.
(f) None of the hours expended on the principal accountant's engagement to audit the registrant's financial statements for the most recent fiscal year were attributed to work performed by persons other than the principal account's full-time, permanent employees.
Non-Audit Fees. The aggregate non-audit fees billed by the Auditor for services rendered to the Registrant, and rendered to Service Affiliates, for the Reporting Periods were $42,473,667 in 2012 and $51,569,616 in 2013.
Auditor Independence. The Registrant's Audit Committee has considered whether the provision of non-audit services that were rendered to Service Affiliates, which were not pre-approved (not requiring pre-approval), is compatible with maintaining the Auditor's independence.
Item 5. Audit Committee of Listed Registrants.
Not applicable. [CLOSED-END FUNDS ONLY]
Item 6. Investments.
(a) Not applicable.
Item 7. Disclosure of Proxy Voting Policies and Procedures for Closed-End Management Investment Companies.
Not applicable. [CLOSED-END FUNDS ONLY]
Item 8. Portfolio Managers of Closed-End Management Investment Companies.
Not applicable. [CLOSED-END FUNDS ONLY, beginning with reports for periods ended on and after December 31, 2005]
Item 9. Purchases of Equity Securities by Closed-End Management Investment Companies and Affiliated Purchasers.
Not applicable. [CLOSED-END FUNDS ONLY]
Item 10. Submission of Matters to a Vote of Security Holders.
There have been no material changes to the procedures applicable to Item 10.
Item 11. Controls and Procedures.
(a) The Registrant's principal executive and principal financial officers have concluded, based on their evaluation of the Registrant's disclosure controls and procedures as of a date within 90 days of the filing date of this report, that the Registrant's disclosure controls and procedures are reasonably designed to ensure that information required to be disclosed by the Registrant on Form N-CSR is recorded, processed, summarized and reported within the required time periods and that information required to be disclosed by the Registrant in the reports that it files or submits on Form N-CSR is accumulated and communicated to the Registrant's management, including its principal executive and principal financial officers, as appropriate to allow timely decisions regarding required disclosure.
(b) There were no changes to the Registrant's internal control over financial reporting that occurred during the second fiscal quarter of the period covered by this report that have materially affected, or are reasonably likely to materially affect, the Registrant's internal control over financial reporting.
Item 12. Exhibits.
(a)(1) Code of ethics referred to in Item 2.
(a)(2) Certifications of principal executive and principal financial officers as required by Rule 30a-2(a) under the Investment Company Act of 1940.
(a)(3) Not applicable.
(b) Certification of principal executive and principal financial officers as required by Rule 30a-2(b) under the Investment Company Act of 1940.
SIGNATURES
Pursuant to the requirements of the Securities Exchange Act of 1934 and the Investment Company Act of 1940, the Registrant has duly caused this Report to be signed on its behalf by the undersigned, thereunto duly authorized.
Strategic Funds, Inc.;
By: /s/ Bradley J. Skapyak |
Bradley J. Skapyak President |
Date: | October 22, 2013 |
|
Pursuant to the requirements of the Securities Exchange Act of 1934 and the Investment Company Act of 1940, this Report has been signed below by the following persons on behalf of the Registrant and in the capacities and on the dates indicated. |
|
By: /s/ Bradley J. Skapyak |
Bradley J. Skapyak President |
Date: | October 22, 2013 |
|
By: /s/ James Windels |
James Windels Treasurer |
Date: | October 22, 2013 |
|
EXHIBIT INDEX
(a)(1) Code of ethics referred to in Item 2.
(a)(2) Certifications of principal executive and principal financial officers as required by Rule 30a-2(a) under the Investment Company Act of 1940. (EX-99.CERT)
(b) Certification of principal executive and principal financial officers as required by Rule 30a-2(b) under the Investment Company Act of 1940. (EX-99.906CERT)