UNITED STATES
SECURITIES AND EXCHANGE COMMISSION
Washington, D.C. 20549
FORM N-CSR
CERTIFIED SHAREHOLDER REPORT OF REGISTERED MANAGEMENT
INVESTMENT COMPANIES
Investment Company Act file number | 811-3940 |
| |
| Strategic Funds, Inc. | |
| (Exact name of Registrant as specified in charter) | |
| | |
| c/o The Dreyfus Corporation 200 Park Avenue New York, New York 10166 | |
| (Address of principal executive offices) (Zip code) | |
| | |
| John Pak, Esq. 200 Park Avenue New York, New York 10166 | |
| (Name and address of agent for service) | |
|
Registrant's telephone number, including area code: | (212) 922-6000 |
| |
Date of fiscal year end: | 11/30 | |
Date of reporting period: | 11/30/13 | |
| | | | | | | |
The following N-CSR relates only to the Registrant’s series listed below and does not affect the other series of the Registrant, which have different fiscal year ends and, therefore, different N-CSR reporting requirements. Separate N-CSR Forms will be filed for these series, as appropriate.
International Stock Fund
Global Stock Fund
Dreyfus U.S. Equity Fund
Dreyfus Select Managers Small Cap Value Fund
FORM N-CSR
Item 1. Reports to Stockholders.
ANNUAL REPORT November 30, 2013

Save time. Save paper. View your next shareholder report online as soon as it’s available. Log into www.dreyfus.com and sign up for Dreyfus eCommunications. It’s simple and only takes a few minutes.
The views expressed in this report reflect those of the portfolio manager only through the end of the period covered and do not necessarily represent the views of Dreyfus or any other person in the Dreyfus organization. Any such views are subject to change at any time based upon market or other conditions and Dreyfus disclaims any responsibility to update such views.These views may not be relied on as investment advice and, because investment decisions for a Dreyfus fund are based on numerous factors, may not be relied on as an indication of trading intent on behalf of any Dreyfus fund.
|
| Not FDIC-Insured • Not Bank-Guaranteed • May LoseValue |
| | Contents |
| | THE FUND |
| 2 | A Letter from the President |
| 3 | Discussion of Fund Performance |
| 6 | Fund Performance |
| 8 | UnderstandingYour Fund’s Expenses |
| 8 | ComparingYour Fund’s Expenses With Those of Other Funds |
| 9 | Statement of Investments |
| 13 | Statement of Assets and Liabilities |
| 14 | Statement of Operations |
| 15 | Statement of Changes in Net Assets |
| 17 | Financial Highlights |
| 21 | Notes to Financial Statements |
| 33 | Report of Independent Registered Public Accounting Firm |
| 34 | Important Tax Information |
| 35 | Information About the Renewal of the Fund’s Management and Sub-Investment Advisory Agreements |
| 41 | Board Members Information |
| 44 | Officers of the Fund |
| | FOR MORE INFORMATION |
| | Back Cover |
International
Stock Fund
The Fund
A LETTER FROM THE PRESIDENT
Dear Shareholder:
We are pleased to present this annual report for International Stock Fund, covering the 12-month period from December 1, 2012, through November 30, 2013. For information about how the fund performed during the reporting period, as well as general market perspectives, we provide a Discussion of Fund Performance on the pages that follow.
Improving global economic conditions drove developed stock markets higher over much of the reporting period. Europe appeared to put the worst of its sovereign debt and banking crises behind it, and Japan embarked on a new economic course designed to reflate its long-stagnant domestic economy. However, the world’s emerging markets struggled with the effects of local economic slowdowns. As a result, equity market returns varied widely from one country to another over the past 12 months.
We currently expect global economic conditions to continue to improve in 2014, with stronger growth in many developed countries fueled by past and continuing monetary ease. The emerging markets seem poised for more moderate economic expansion. In the United States, we anticipate accelerating growth supported by the fading drags of tighter federal fiscal policies and downsizing on the state and local levels. For more information on how these observations may affect your investments, we encourage you to speak with your financial advisor.
Thank you for your continued confidence and support.

J. Charles Cardona
President
The Dreyfus Corporation
December 16, 2013
2
DISCUSSION OF FUND PERFORMANCE
For the reporting period of December 1, 2012, through November 30, 2013, as provided by Charlie Macquaker and Roy Leckie of Walter Scott & Partners Limited (Walter Scott), Sub-investment adviser
Fund and Market Performance Overview
For the 12-month period ended November 30, 2013, International Stock Fund’s Class A shares achieved a return of 11.65%, Class C shares returned 10.78% and Class I shares returned 12.13%.1 In comparison, the fund’s benchmark index, the Morgan Stanley Capital International Europe, Australasia, Far East Index (the “MSCI EAFE Index”), achieved an 24.84% return over the same period.2 The fund’s Class Y shares produced a total return of 8.49% for the period since their inception of July 1, 2013, through November 30, 2013.
Stocks throughout the developed world responded positively to a recovering global economy during the reporting period. The fund’s returns lagged its benchmark, mainly due to its focus on what we determine to be high-quality growth companies at a time when more speculative value-oriented stocks fared better.
The Fund’s Investment Approach
The fund seeks long-term real return by investing in high-quality companies believed to be capable of sustainable growth and wealth creation over a long time horizon.The fund invests in stocks of foreign companies that are predominantly located in the world’s developed markets outside of the United States.When selecting stocks,Walter Scott seeks companies with fundamental strengths that indicate the potential for sustainable growth.The firm focuses on individual stock selection through extensive fundamental research. Candidates are initially selected for research if they meet certain broad absolute and trend criteria. Financial statements are analyzed in an effort to identify the nature of their cash generation and to understand the variables that could add value to their businesses. Companies meeting the financial criteria are subjected to a detailed investigation of products, costs and pricing, competition, industry position, and outlook.
DISCUSSION OF FUND PERFORMANCE (continued)
Recovering Global Economy Fueled Markets’ Gains
International stocks rallied over the reporting period in response to aggressively accommodative monetary policies adopted by many central banks, which produced ample liquidity in financial markets. With bonds considered relatively unattractive due to rising long-term interest rates, investors flocked to equities to put their capital to work. Consequently, stock prices climbed sharply in most developed markets.
Europe seemed to put the worst of its financial crisis behind it, as evidenced by the end of a regional recession and rebounding stock prices in previously hard hit nations. Japan’s stock market was lifted by stimulative fiscal and monetary policies from a new government seeking to end years of economic stagnation. While the United States is not part of the MSCI EAFE Index, it led the global economic recovery as domestic growth was supported by employment gains and rebounding housing markets. In contrast, many emerging markets struggled with economic slowdowns during the reporting period.
Quality Bias Dampened Relative Performance
The fund’s relatively conservative investment approach tends to outperform market averages during downturns but typically lags during rallies.The reporting period was no exception, as industry leaders with histories of consistent growth generally fell out of favor among investors seeking more speculative opportunities. For example, in Japan, the fund maintained its emphasis on multinational companies with leadership positions in key export markets, but investors generally favored domestically focused companies that could benefit from newly stimulative fiscal and monetary policies. In Europe, the fund’s positions in global leaders in core nations trailed their lower quality counterparts in peripheral countries, where stocks rebounded from depressed levels.
Some of the fund’s greatest laggards for the reporting period were domiciled in Japan. Electronics producer Canon encountered competitive pressures in its cameras and printers segments, and energy producer INPEX was hurt by a weakening yen and sluggish demand from nearby emerging markets. In Australia, soft drinks bottler Coca-Cola Amatil encountered intensifying competitive pressures, while medical equipment maker Cochlear saw auditory implant procedures temporarily postponed in anticipation of a new product. In the emerging markets, China Shenhua Energy struggled amid an international glut of coal.
4
The fund achieved better results from Japanese auto parts maker Denso, which prospered in an environment of rising global car and truck sales.Also in Japan, real estate manager Mitsubishi Estate benefited from government efforts to reflate the domestic economy, and electronic equipment manufacturer Keyence proved well positioned for the global trend toward factory automation. Swiss pharmaceutical developer Roche Holding gained value when it more firmly established itself as a leader in oncology, and German apparel maker Adidas raised prices and profit margins.
High Confidence in Portfolio Holdings
Although we at Walter Scott remain more skeptical than the consensus view regarding the sustainability of economic recoveries in Japan and Europe, we have continued to identify opportunities among industry leaders that, in our analysis, are poised to benefit from positive secular trends.As of the reporting period’s end, we have found a number of companies meeting our investment criteria in the energy, consumer staples, consumer discretionary, and health care sectors, but relatively few in the financials, industrials, telecommunications services, and materials sectors. From a regional perspective, the fund held overweighted exposure to the emerging markets,Asia/Pacific markets, and Canada, and underweighted positions in Europe, the United Kingdom, and Japan.
December 16, 2013
Please note, the position in any security highlighted with italicized typeface was sold during the reporting period. Equity funds are subject generally to market, market sector, market liquidity, issuer and investment style risks, among other factors, to varying degrees, all of which are more fully described in the fund’s prospectus.
Investing internationally involves special risks, including changes in currency exchange rates, political, economic and social instability, a lack of comprehensive company information, differing auditing and legal standards and less market liquidity.
|
| 1 Total return includes reinvestment of dividends and any capital gains paid, and does not take into consideration the |
| maximum initial sales charge in the case of Class A shares, or the applicable contingent deferred sales charge imposed |
| on redemptions in the case of Class C shares. Had these charges been reflected, returns would have been lower. Past |
| performance is no guarantee of future results. Share price and investment return fluctuate such that upon redemption, |
| fund shares may be worth more or less than their original cost. |
| 2 SOURCE: LIPPER INC. — Reflects reinvestment of net dividends and, where applicable, capital gain |
| distributions.The Morgan Stanley Capital International Europe,Australasia, Far East (MSCI EAFE) Index is an |
| unmanaged index composed of a sample of companies representative of the market structure of European and Pacific |
| Basin countries. Returns are calculated on a month-end basis. Investors cannot invest directly in any index. |
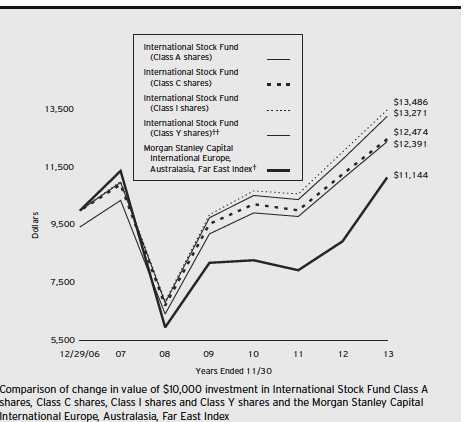
FUND PERFORMANCE
| |
| † | Source: Lipper Inc. |
| †† | The total return figures presented for ClassY shares of the fund reflect the performance of the fund’s Class A shares |
| | for the period prior to 7/1/13 (the inception date for ClassY shares). |
Past performance is not predictive of future performance.
The above graph compares a $10,000 investment made in each of the Class A, Class C, Class I and ClassY shares of International Stock Fund on 12/29/06 (inception date) to a $10,000 investment made in the Morgan Stanley Capital International Europe, Australasia, Far East Index (the “Index”) on that date. All dividends and capital gain distributions are reinvested.
On April 29, 2013, the Board authorized the fund to offer ClassY shares, as a new class of shares, to certain investors, including certain institutional investors. On July 1, 2013, ClassY shares were offered at net asset value and are not subject to certain fees, including Distribution Plan and Shareholder Services Plan fees.
The fund’s performance shown in the line graph above takes into account the maximum initial sales charge on Class A shares and all other applicable fees and expenses on all classes.The Index is an unmanaged, market capitalization weighted index that is designed to measure the performance of publicly traded stocks issued by companies in developed markets excluding the U.S. and Canada. Unlike a mutual fund, the Index is not subject to charges, fees and other expenses. Investors cannot invest directly in any index. Further information relating to fund performance, including expense reimbursements, if applicable, is contained in the Financial Highlights section of the prospectus and elsewhere in this report.
6
| | | | | | | |
| Average Annual Total Returns as of 11/30/13 | | | | | | |
| |
| | Inception | | | | | From | |
| | Date | 1 Year | | 5 Years | | Inception | |
| Class A shares | | | | | | | |
| with maximum sales charge (5.75%) | 12/29/06 | 5.24 | % | 12.77 | % | 3.15 | % |
| without sales charge | 12/29/06 | 11.65 | % | 14.10 | % | 4.03 | % |
| Class C shares | | | | | | | |
| with applicable redemption charge † | 12/29/06 | 9.78 | % | 13.25 | % | 3.25 | % |
| without redemption | 12/29/06 | 10.78 | % | 13.25 | % | 3.25 | % |
| Class I shares | 12/29/06 | 12.13 | % | 14.52 | % | 4.42 | % |
| Class Y shares | 7/1/13 | 12.72 | %†† | 14.32 | %†† | 4.17 | %†† |
| Morgan Stanley Capital | | | | | | | |
| International Europe, | | | | | | | |
| Australasia, Far East Index | 12/31/06 | 24.84 | % | 13.42 | % | 1.58 | % |
Past performance is not predictive of future performance.The fund’s performance shown in the graph and table does not reflect the deduction of taxes that a shareholder would pay on fund distributions or the redemption of fund shares.
| |
| † | The maximum contingent deferred sales charge for Class C shares is 1% for shares redeemed within one year of the |
| | date of purchase. |
| †† | The total return performance figures presented for ClassY shares of the fund reflect the performance of the fund’s |
| | Class A shares for the period prior to 7/1/13 (the inception date for ClassY shares). |
UNDERSTANDING YOUR FUND’S EXPENSES (Unaudited)
As a mutual fund investor, you pay ongoing expenses, such as management fees and other expenses. Using the information below, you can estimate how these expenses affect your investment and compare them with the expenses of other funds.You also may pay one-time transaction expenses, including sales charges (loads) and redemption fees, which are not shown in this section and would have resulted in higher total expenses. For more information, see your fund’s prospectus or talk to your financial adviser.
Review your fund’s expenses
The table below shows the expenses you would have paid on a $1,000 investment in International Stock Fund from June 1, 2013 to November 30, 2013. It also shows how much a $1,000 investment would be worth at the close of the period, assuming actual returns and expenses.
Expenses and Value of a $1,000 Investment
assuming actual returns for the six months ended November 30, 2013†
| | | | | | | | |
| | | Class A | | Class C | | Class I | | Class Y |
| Expenses paid per $1,000†† | $ | 6.67 | $ | 10.53 | $ | 4.76 | $ | 3.95 |
| Ending value (after expenses) | $ | 1,062.80 | $ | 1,058.30 | $ | 1,065.00 | $ | 1,084.90 |
COMPARING YOUR FUND’S EXPENSES
WITH THOSE OF OTHER FUNDS (Unaudited)
Using the SEC’s method to compare expenses
The Securities and Exchange Commission (SEC) has established guidelines to help investors assess fund expenses. Per these guidelines, the table below shows your fund’s expenses based on a $1,000 investment, assuming a hypothetical 5% annualized return. You can use this information to compare the ongoing expenses (but not transaction expenses or total cost) of investing in the fund with those of other funds.All mutual fund shareholder reports will provide this information to help you make this comparison. Please note that you cannot use this information to estimate your actual ending account balance and expenses paid during the period.
Expenses and Value of a $1,000 Investment
assuming a hypothetical 5% annualized return for the six months ended November 30, 2013
| | | | | | | | |
| | | Class A | | Class C | | Class I | | Class Y |
| Expenses paid per $1,000†††† | $ | 6.53 | $ | 10.30 | $ | 4.66 | $ | 4.61 |
| Ending value (after expenses) | $ | 1,018.60 | $ | 1,014.84 | $ | 1,020.46 | $ | 1,020.51 |
| |
| † | From July 1, 2013 (commencement of initial offering) to November 30, 2013 for ClassY shares. |
| †† | Expenses are equal to the fund’s annualized expense ratio of 1.29% for Class A, 2.04% for Class C and .92% |
| | for Class I, multiplied by the average account value over the period, multiplied by 183/365 (to reflect the one-half |
| | year period). Expenses are equal to the fund’s annualized expense ratio of .91% for ClassY, multiplied by the average |
| | account value over the period, multiplied by 152/365 (to reflect the actual days in the period). |
| ††† | Please note that while ClassY shares commenced operations on July 1, 2013, the hypothetical expenses paid during |
| | the period reflect projected activity for the full six month period for purposes of comparability.This projection assumes |
| | that annualized expense ratios were in effect during the period June 1, 2013 to November 30, 2013. |
| †††† Expenses are equal to the fund’s annualized expense ratio of 1.29% for Class A, 2.04% for Class C, .92% for |
| | Class I and .91% for Class Y, multiplied by the average account value over the period, multiplied by 183/365 (to |
| | reflect the one-half year period). |
8
STATEMENT OF INVESTMENTS
November 30, 2013
| | |
| Common Stocks—96.9% | Shares | Value ($) |
| Australia—8.0% | | |
| Coca-Cola Amatil | 4,763,000 | 52,416,411 |
| Cochlear | 356,600 | 18,982,312 |
| CSL | 1,019,000 | 63,750,109 |
| Woodside Petroleum | 1,692,000 | 57,601,310 |
| Woolworths | 2,180,100 | 66,855,606 |
| | | 259,605,748 |
| Belgium—1.5% | | |
| Colruyt | 849,000 | 47,875,506 |
| Brazil—1.5% | | |
| Petroleo Brasileiro, ADR | 2,917,800 | 48,260,412 |
| Canada—2.1% | | |
| Suncor Energy | 1,982,200 | 67,941,955 |
| China—3.2% | | |
| China Shenhua Energy, Cl. H | 10,513,000 | 35,664,639 |
| CNOOC | 33,191,000 | 67,987,060 |
| | | 103,651,699 |
| Denmark—2.0% | | |
| Novo Nordisk, Cl. B | 368,000 | 65,928,557 |
| Finland—.9% | | |
| Kone, Cl. B | 318,000 | 29,231,595 |
| France—7.3% | | |
| Air Liquide | 450,100 | 62,750,034 |
| Danone | 815,000 | 59,225,208 |
| Essilor International | 507,576 | 53,251,546 |
| L’Oreal | 366,700 | 61,362,482 |
| | | 236,589,270 |
| Germany—4.3% | | |
| Adidas | 603,300 | 73,385,624 |
| SAP | 791,000 | 65,510,028 |
| | | 138,895,652 |
STATEMENT OF INVESTMENTS (continued)
| | |
| Common Stocks (continued) | Shares | Value ($) |
| Hong Kong—8.4% | | |
| AIA Group | 13,518,200 | 68,527,808 |
| China Mobile | 5,678,500 | 61,161,134 |
| CLP Holdings | 6,249,000 | 51,224,945 |
| Hang Lung Properties | 8,857,000 | 29,761,156 |
| Hong Kong & China Gas | 25,634,026 | 60,443,337 |
| | | 271,118,380 |
| Italy—.5% | | |
| Tenaris, ADR | 388,800 | 17,422,128 |
| Japan—19.5% | | |
| AEON Mall | 953,590 | 27,412,978 |
| Chugai Pharmaceutical | 628,000 | 14,988,140 |
| Daito Trust Construction | 644,500 | 61,150,276 |
| Denso | 1,270,300 | 63,611,099 |
| FANUC | 409,400 | 68,896,051 |
| Honda Motor | 1,597,100 | 67,503,958 |
| INPEX | 5,600,000 | 64,940,212 |
| Keyence | 98,520 | 39,573,410 |
| Komatsu | 2,912,300 | 60,523,078 |
| Mitsubishi Estate | 1,066,000 | 29,593,479 |
| Shimamura | 204,300 | 20,959,471 |
| Shin-Etsu Chemical | 971,500 | 56,140,173 |
| Tokio Marine Holdings | 1,759,700 | 58,401,874 |
| | | 633,694,199 |
| Singapore—1.9% | | |
| DBS Group Holdings | 2,401,226 | 32,874,896 |
| Oversea-Chinese Banking | 3,539,061 | 29,443,995 |
| | | 62,318,891 |
10
| | |
| Common Stocks (continued) | Shares | Value ($) |
| Spain—2.3% | | |
| Inditex | 477,000 | 76,060,480 |
| Sweden—2.2% | | |
| Hennes & Mauritz, Cl. B | 1,718,000 | 72,812,702 |
| Switzerland—9.7% | | |
| Nestle | 879,000 | 64,198,808 |
| Novartis | 839,000 | 66,322,098 |
| Roche Holding | 238,400 | 66,464,784 |
| SGS | 11,090 | 24,996,547 |
| Swatch Group-BR | 52,100 | 34,143,204 |
| Syngenta | 153,000 | 60,092,674 |
| | | 316,218,115 |
| Taiwan—2.0% | | |
| Taiwan Semiconductor Manufacturing, ADR | 3,648,400 | 64,686,132 |
| United Kingdom—19.6% | | |
| BG Group | 3,575,000 | 73,034,992 |
| Burberry Group | 2,506,000 | 62,616,170 |
| Centrica | 9,895,000 | 54,775,228 |
| Compass Group | 4,369,900 | 65,856,330 |
| HSBC Holdings | 5,347,000 | 59,661,926 |
| Reckitt Benckiser Group | 895,900 | 71,964,608 |
| SABMiller | 1,185,000 | 61,137,646 |
| Smith & Nephew | 4,995,000 | 66,653,944 |
| Standard Chartered | 2,544,000 | 60,297,874 |
| Tesco | 10,811,000 | 61,552,983 |
| | | 637,551,701 |
| Total Common Stocks | | |
| (cost $2,632,848,695) | | 3,149,863,122 |
STATEMENT OF INVESTMENTS (continued)
| | | |
| Other Investment—2.9% | Shares | | Value ($) |
| Registered Investment Company; | | | |
| Dreyfus Institutional Preferred | | | |
| Plus Money Market Fund | | | |
| (cost $93,800,000) | 93,800,000 | a | 93,800,000 |
| |
| Total Investments (cost $2,726,648,695) | 99.8 | % | 3,243,663,122 |
| Cash and Receivables (Net) | .2 | % | 6,986,273 |
| Net Assets | 100.0 | % | 3,250,649,395 |
|
| ADR—American Depository Receipts |
| BR—Bearer Certificate |
| a Investment in affiliated money market mutual fund. |
12
| | | |
| Portfolio Summary (Unaudited)† | | |
| |
| | Value (%) | | Value (%) |
| Consumer Staples | 16.8 | Materials | 5.5 |
| Consumer Discretionary | 16.5 | Information Technology | 5.2 |
| Financial | 14.1 | Utilities | 5.1 |
| Energy | 13.3 | Money Market Investment | 2.9 |
| Health Care | 12.8 | Telecommunication Services | 1.9 |
| Industrial | 5.7 | | 99.8 |
|
| † Based on net assets. |
| See notes to financial statements. |
|
| STATEMENT OF ASSETS AND LIABILITIES |
| November 30, 2013 |
| | | |
| | Cost | Value | |
| Assets ($): | | | |
| Investments in securities—See Statement of Investments: | | | |
| Unaffiliated issuers | 2,632,848,695 | 3,149,863,122 | |
| Affiliated issuers | 93,800,000 | 93,800,000 | |
| Cash | | 1,327,629 | |
| Cash denominated in foreign currencies | 1,632,744 | 1,622,930 | |
| Dividends receivable | | 5,412,826 | |
| Receivable for shares of Common Stock subscribed | | 2,360,002 | |
| Prepaid expenses | | 133,929 | |
| | | 3,254,520,438 | |
| Liabilities ($): | | | |
| Due to The Dreyfus Corporation and affiliates—Note 3(c) | | 2,724,229 | |
| Payable for shares of Common Stock redeemed | | 749,714 | |
| Accrued expenses | | 397,100 | |
| | | 3,871,043 | |
| Net Assets ($) | | 3,250,649,395 | |
| Composition of Net Assets ($): | | | |
| Paid-in capital | | 2,762,989,007 | |
| Accumulated undistributed investment income—net | | 36,794,406 | |
| Accumulated net realized gain (loss) on investments | | (66,179,326 | ) |
| Accumulated net unrealized appreciation (depreciation) | | | |
| on investments and foreign currency transactions | | 517,045,308 | |
| Net Assets ($) | | 3,250,649,395 | |
| | | | |
| Net Asset Value Per Share | | | | |
| | Class A | Class C | Class I | Class Y |
| Net Assets ($) | 284,574,952 | 35,904,790 | 2,930,168,568 | 1,085 |
| Shares Outstanding | 18,279,838 | 2,352,710 | 186,332,443 | 69 |
| Net Asset Value Per Share ($) | 15.57 | 15.26 | 15.73 | 15.72 |
| See notes to financial statements. | | | | |
|
| STATEMENT OF OPERATIONS |
| Year Ended November 30, 2013 |
| | |
| Investment Income ($): | | |
| Income: | | |
| Cash dividends (net of $5,601,151 foreign taxes withheld at source): | | |
| Unaffiliated issuers | 69,759,988 | |
| Affiliated issuers | 68,608 | |
| Interest | 35,435 | |
| Total Income | 69,864,031 | |
| Expenses: | | |
| Management fee—Note 3(a) | 24,104,015 | |
| Shareholder servicing costs—Note 3(c) | 1,404,473 | |
| Custodian fees—Note 3(c) | 822,894 | |
| Registration fees | 260,014 | |
| Distribution fees—Note 3(b) | 243,922 | |
| Directors’ fees and expenses—Note 3(d) | 213,437 | |
| Professional fees | 169,286 | |
| Prospectus and shareholders’ reports | 97,950 | |
| Loan commitment fees—Note 2 | 27,924 | |
| Miscellaneous | 119,371 | |
| Total Expenses | 27,463,286 | |
| Less—reduction in fees due to earnings credits—Note 3(c) | (294 | ) |
| Net Expenses | 27,462,992 | |
| Investment Income—Net | 42,401,039 | |
| Realized and Unrealized Gain (Loss) on Investments—Note 4 ($): | | |
| Net realized gain (loss) on investments and foreign currency transactions | (1,708,326 | ) |
| Net realized gain (loss) on forward foreign currency exchange contracts | 1,680,989 | |
| Net Realized Gain (Loss) | (27,337 | ) |
| Net unrealized appreciation (depreciation) on | | |
| investments and foreign currency transactions | 260,328,361 | |
| Net Realized and Unrealized Gain (Loss) on Investments | 260,301,024 | |
| Net Increase in Net Assets Resulting from Operations | 302,702,063 | |
| See notes to financial statements. | | |
14
STATEMENT OF CHANGES IN NET ASSETS
| | | | |
| | Year Ended November 30, | |
| | 2013 | a | 2012 | |
| Operations ($): | | | | |
| Investment income—net | 42,401,039 | | 32,588,010 | |
| Net realized gain (loss) on investments | (27,337 | ) | (26,607,763 | ) |
| Net unrealized appreciation | | | | |
| (depreciation) on investments | 260,328,361 | | 229,692,690 | |
| Net Increase (Decrease) in Net Assets | | | | |
| Resulting from Operations | 302,702,063 | | 235,672,937 | |
| Dividends to Shareholders from ($): | | | | |
| Investment income—net: | | | | |
| Class A | (2,453,861 | ) | (1,727,130 | ) |
| Class C | (156,624 | ) | (33,444 | ) |
| Class I | (32,893,538 | ) | (14,304,931 | ) |
| Total Dividends | (35,504,023 | ) | (16,065,505 | ) |
| Capital Stock Transactions ($): | | | | |
| Net proceeds from shares sold: | | | | |
| Class A | 147,162,705 | | 69,431,573 | |
| Class C | 13,865,416 | | 6,334,328 | |
| Class I | 1,149,860,399 | | 952,851,615 | |
| Class Y | 1,000 | | — | |
| Dividends reinvested: | | | | |
| Class A | 2,370,457 | | 1,702,274 | |
| Class C | 110,933 | | 23,020 | |
| Class I | 22,258,109 | | 7,414,889 | |
| Cost of shares redeemed: | | | | |
| Class A | (62,177,277 | ) | (108,468,076 | ) |
| Class C | (4,965,563 | ) | (8,328,062 | ) |
| Class I | (418,895,968 | ) | (338,580,321 | ) |
| Increase (Decrease) in Net Assets | | | | |
| from Capital Stock Transactions | 849,590,211 | | 582,381,240 | |
| Total Increase (Decrease) in Net Assets | 1,116,788,251 | | 801,988,672 | |
| Net Assets ($): | | | | |
| Beginning of Period | 2,133,861,144 | | 1,331,872,472 | |
| End of Period | 3,250,649,395 | | 2,133,861,144 | |
| Undistributed investment income—net | 36,794,406 | | 29,866,773 | |
STATEMENT OF CHANGES IN NET ASSETS (continued)
| | | | |
| | Year Ended November 30, | |
| | 2013 | a | 2012 | |
| Capital Share Transactions: | | | | |
| Class Ab | | | | |
| Shares sold | 9,880,843 | | 5,272,552 | |
| Shares issued for dividends reinvested | 164,615 | | 140,566 | |
| Shares redeemed | (4,140,282 | ) | (8,325,957 | ) |
| Net Increase (Decrease) in Shares Outstanding | 5,905,176 | | (2,912,839 | ) |
| Class Cb | | | | |
| Shares sold | 951,707 | | 485,056 | |
| Shares issued for dividends reinvested | 7,807 | | 1,923 | |
| Shares redeemed | (336,282 | ) | (648,380 | ) |
| Net Increase (Decrease) in Shares Outstanding | 623,232 | | (161,401 | ) |
| Class I | | | | |
| Shares sold | 77,060,413 | | 72,715,136 | |
| Shares issued for dividends reinvested | 1,535,042 | | 608,776 | |
| Shares redeemed | (27,918,325 | ) | (25,572,016 | ) |
| Net Increase (Decrease) in Shares Outstanding | 50,677,130 | | 47,751,896 | |
| Class Y | | | | |
| Shares sold | 69 | | — | |
|
| a Effective July 1, 2013, the fund commenced offering ClassY shares. |
| b During the period ended November 30, 2013, 6,275 Class C shares representing $95,883 were exchanged for |
| 6,174 Class A shares. |
See notes to financial statements.
16
FINANCIAL HIGHLIGHTS
The following tables describe the performance for each share class for the fiscal periods indicated.All information (except portfolio turnover rate) reflects financial results for a single fund share.Total return shows how much your investment in the fund would have increased (or decreased) during each period, assuming you had reinvested all dividends and distributions.These figures have been derived from the fund’s financial statements.
| | | | | | | | | | |
| | | | Year Ended November 30, | | | |
| Class A Shares | 2013 | | 2012 | | 2011 | | 2010 | | 2009 | |
| Per Share Data ($): | | | | | | | | | | |
| Net asset value, beginning of period | 14.13 | | 12.58 | | 12.83 | | 11.97 | | 8.43 | |
| Investment Operations: | | | | | | | | | | |
| Investment income—neta | .17 | | .21 | | .15 | | .09 | | .05 | |
| Net realized and unrealized | | | | | | | | | | |
| gain (loss) on investments | 1.46 | | 1.46 | | (.31 | ) | .86 | | 3.58 | |
| Total from Investment Operations | 1.63 | | 1.67 | | (.16 | ) | .95 | | 3.63 | |
| Distributions: | | | | | | | | | | |
| Dividends from investment income—net | (.19 | ) | (.12 | ) | (.09 | ) | (.09 | ) | (.09 | ) |
| Net asset value, end of period | 15.57 | | 14.13 | | 12.58 | | 12.83 | | 11.97 | |
| Total Return (%)b | 11.65 | | 13.40 | | (1.32 | ) | 7.99 | | 43.33 | |
| Ratios/Supplemental Data (%): | | | | | | | | | | |
| Ratio of total expenses | | | | | | | | | | |
| to average net assets | 1.30 | | 1.31 | | 1.27 | | 1.34 | | 1.43 | |
| Ratio of net expenses | | | | | | | | | | |
| to average net assets | 1.30 | | 1.31 | | 1.27 | | 1.34 | | 1.42 | |
| Ratio of net investment income | | | | | | | | | | |
| to average net assets | 1.14 | | 1.62 | | 1.08 | | .69 | | .50 | |
| Portfolio Turnover Rate | 2.58 | | 5.47 | | 5.07 | | 5.91 | | 21.67 | |
| Net Assets, end of period ($ x 1,000) | 284,575 | | 174,825 | | 192,351 | | 124,347 | | 18,059 | |
| |
| a | Based on average shares outstanding at each month end. |
| b | Exclusive of sales charge. |
See notes to financial statements.
FINANCIAL HIGHLIGHTS (continued)
| | | | | | | | | | |
| | | | Year Ended November 30, | | | |
| Class C Shares | 2013 | | 2012 | | 2011 | | 2010 | | 2009 | |
| Per Share Data ($): | | | | | | | | | | |
| Net asset value, beginning of period | 13.86 | | 12.33 | | 12.64 | | 11.83 | | 8.32 | |
| Investment Operations: | | | | | | | | | | |
| Investment income (loss)—neta | .06 | | .12 | | .04 | | (.02 | ) | (.01 | ) |
| Net realized and unrealized | | | | | | | | | | |
| gain (loss) on investments | 1.43 | | 1.43 | | (.30 | ) | .87 | | 3.53 | |
| Total from Investment Operations | 1.49 | | 1.55 | | (.26 | ) | .85 | | 3.52 | |
| Distributions: | | | | | | | | | | |
| Dividends from investment income—net | (.09 | ) | (.02 | ) | (.05 | ) | (.04 | ) | (.01 | ) |
| Net asset value, end of period | 15.26 | | 13.86 | | 12.33 | | 12.64 | | 11.83 | |
| Total Return (%)b | 10.78 | | 12.58 | | (2.08 | ) | 7.18 | | 42.31 | |
| Ratios/Supplemental Data (%): | | | | | | | | | | |
| Ratio of total expenses | | | | | | | | | | |
| to average net assets | 2.04 | | 2.06 | | 2.05 | | 2.13 | | 2.25 | |
| Ratio of net expenses | | | | | | | | | | |
| to average net assets | 2.04 | | 2.06 | | 2.05 | | 2.13 | | 2.22 | |
| Ratio of net investment income (loss) | | | | | | | | | | |
| to average net assets | .42 | | .90 | | .33 | | (.12 | ) | (.13 | ) |
| Portfolio Turnover Rate | 2.58 | | 5.47 | | 5.07 | | 5.91 | | 21.67 | |
| Net Assets, end of period ($ x 1,000) | 35,905 | | 23,962 | | 23,319 | | 13,959 | | 1,224 | |
| |
| a | Based on average shares outstanding at each month end. |
| b | Exclusive of sales charge. |
See notes to financial statements.
18
| | | | | | | | | | |
| | | | | | Year Ended November 30, | | | |
| Class I Shares | 2013 | | 2012 | | 2011 | | 2010 | | 2009 | |
| Per Share Data ($): | | | | | | | | | | |
| Net asset value, | | | | | | | | | | |
| beginning of period | 14.26 | | 12.70 | | 12.93 | | 12.04 | | 8.47 | |
| Investment Operations: | | | | | | | | | | |
| Investment income—neta | .23 | | .26 | | .19 | | .14 | | .12 | |
| Net realized and unrealized | | | | | | | | | | |
| gain (loss) on investments | 1.48 | | 1.46 | | (.31 | ) | .86 | | 3.57 | |
| Total from Investment Operations | 1.71 | | 1.72 | | (.12 | ) | 1.00 | | 3.69 | |
| Distributions: | | | | | | | | | | |
| Dividends from | | | | | | | | | | |
| investment income—net | (.24 | ) | (.16 | ) | (.11 | ) | (.11 | ) | (.12 | ) |
| Net asset value, end of period | 15.73 | | 14.26 | | 12.70 | | 12.93 | | 12.04 | |
| Total Return (%) | 12.13 | | 13.74 | | (1.01 | ) | 8.38 | | 43.98 | |
| Ratios/Supplemental Data (%): | | | | | | | | | | |
| Ratio of total expenses | | | | | | | | | | |
| to average net assets | .92 | | .93 | | .93 | | .97 | | 1.01 | |
| Ratio of net expenses | | | | | | | | | | |
| to average net assets | .92 | | .93 | | .93 | | .97 | | 1.01 | |
| Ratio of net investment income | | | | | | | | | | |
| to average net assets | 1.54 | | 1.96 | | 1.41 | | 1.11 | | 1.18 | |
| Portfolio Turnover Rate | 2.58 | | 5.47 | | 5.07 | | 5.91 | | 21.67 | |
| Net Assets, end of period | | | | | | | | | | |
| ($ x 1,000) | 2,930,169 | | 1,935,074 | | 1,116,202 | | 688,992 | | 339,535 | |
| |
| a Based on average shares outstanding at each month end. | | | | | | | |
| See notes to financial statements. | | | | | | | | | | |
FINANCIAL HIGHLIGHTS (continued)
| |
| | Period Ended |
| Class Y Shares | November 30, 2013a |
| Per Share Data ($): | |
| Net asset value, beginning of period | 14.49 |
| Investment Operations: | |
| Investment income—netb | .06 |
| Net realized and unrealized gain (loss) on investments | 1.17 |
| Total from Investment Operations | 1.23 |
| Net asset value, end of period | 15.72 |
| Total Return (%)c | 8.49 |
| Ratios/Supplemental Data (%): | |
| Ratio of total expenses to average net assetsd | .91 |
| Ratio of net expenses to average net assetsd | .91 |
| Ratio of net investment income to average net assetsd | .93 |
| Portfolio Turnover Rate | 2.58 |
| Net Assets, end of period ($ x 1,000) | 1 |
| |
| a | From July 1, 2013 (commencement of initial offering) to November 30, 2013. |
| b | Based on average shares outstanding at each month end. |
| c | Not annualized. |
| d | Annualized. |
See notes to financial statements.
20
NOTES TO FINANCIAL STATEMENTS
NOTE 1—Significant Accounting Policies:
International Stock Fund (the “fund”) is a separate diversified series of Strategic Funds, Inc. (the “Company”), which is registered under the Investment Company Act of 1940, as amended (the “Act”), as an open-end management investment company and operates as a series company currently offering nine series, including the fund.The fund’s investment objective seeks long-term total return. The Dreyfus Corporation (the “Manager” or “Dreyfus”), a wholly-owned subsidiary of The Bank of New York Mellon Corporation (“BNY Mellon”), serves as the fund’s investment adviser. Walter Scott & Partners Limited (“Walter Scott”), a subsidiary of BNY Mellon and an affiliate of Dreyfus, serves as the fund’s sub-investment adviser.
At a meeting held on April 29, 2013, the Company’s Board of Directors (the “Board”) approved, effective July 1, 2013: (a) for the fund to offer Class Y shares; and, (b) an increase in the authorized shares of the fund from 400 million to 500 million and authorized 100 million Class Y shares. The Board also approved, effective July 29, 2013, an increase in the authorized shares of the fund from 500 million to 600 million and to increase Class I shares from 200 million to 300 million.
MBSC Securities Corporation (the “Distributor”), a wholly-owned subsidiary of Dreyfus, is the distributor of the fund’s shares.The fund is authorized to issue 600 million shares of $.001 par value Common Stock.The fund currently offers four classes of shares: Class A (100 million shares authorized), Class C (100 million shares authorized), Class I (300 million shares authorized) and Class Y (100 million shares authorized). Class A shares generally are subject to a sales charge imposed at the time of purchase. Class C shares are subject to a contingent deferred sales charge (“CDSC”) on Class C shares redeemed within one year of purchase. Class I and ClassY shares are offered at net asset value generally to institutional investors. Other differences between the classes include the services offered to and the expenses borne by each class, the allocation of certain transfer agency costs and certain voting rights.
NOTES TO FINANCIAL STATEMENTS (continued)
Income, expenses (other than expenses attributable to a specific class), and realized and unrealized gains or losses on investments are allocated to each class of shares based on its relative net assets.
As of November 30, 2013, MBC Investments Corp., an indirect subsidiary of BNY Mellon, held all of the outstanding Class Y shares of the fund.
The Company accounts separately for the assets, liabilities and operations of each series. Expenses directly attributable to each series are charged to that series’ operations; expenses which are applicable to all series are allocated among them on a pro rata basis.
The Financial Accounting Standards Board (“FASB”) Accounting Standards Codification is the exclusive reference of authoritative U.S. generally accepted accounting principles (“GAAP”) recognized by the FASB to be applied by nongovernmental entities. Rules and interpretive releases of the Securities and Exchange Commission (“SEC”) under authority of federal laws are also sources of authoritative GAAP for SEC registrants. The fund’s financial statements are prepared in accordance with GAAP, which may require the use of management estimates and assumptions.Actual results could differ from those estimates.
The Company enters into contracts that contain a variety of indemnifications. The fund’s maximum exposure under these arrangements is unknown.The fund does not anticipate recognizing any loss related to these arrangements.
(a) Portfolio valuation: The fair value of a financial instrument is the amount that would be received to sell an asset or paid to transfer a liability in an orderly transaction between market participants at the measurement date (i.e., the exit price). GAAP establishes a fair value hierarchy that prioritizes the inputs of valuation techniques used to measure fair value. This hierarchy gives the highest priority to unadjusted quoted prices in active markets for identical assets or liabilities (Level 1 measurements) and the lowest priority to unobservable inputs (Level 3 measurements).
22
Additionally, GAAP provides guidance on determining whether the volume and activity in a market has decreased significantly and whether such a decrease in activity results in transactions that are not orderly. GAAP requires enhanced disclosures around valuation inputs and techniques used during annual and interim periods.
Various inputs are used in determining the value of the fund’s investments relating to fair value measurements.These inputs are summarized in the three broad levels listed below:
Level 1—unadjusted quoted prices in active markets for identical investments.
Level 2—other significant observable inputs (including quoted prices for similar investments, interest rates, prepayment speeds, credit risk, etc.).
Level 3—significant unobservable inputs (including the fund’s own assumptions in determining the fair value of investments).
The inputs or methodology used for valuing securities are not necessarily an indication of the risk associated with investing in those securities.
Changes in valuation techniques may result in transfers in or out of an assigned level within the disclosure hierarchy. Valuation techniques used to value the fund’s investments are as follows:
Investments in securities are valued at the last sales price on the securities exchange or national securities market on which such securities are primarily traded. Securities listed on the National Market System for which market quotations are available are valued at the official closing price or, if there is no official closing price that day, at the last sales price. Securities not listed on an exchange or the national securities market, or securities for which there were no transactions, are valued at the average of the most recent bid and asked prices, except for open short positions, where the asked price is used for valuation purposes. Bid price is used when no asked price is available. Registered invest-
NOTES TO FINANCIAL STATEMENTS (continued)
ment companies that are not traded on an exchange are valued at their net asset value. All of the preceding securities are categorized within Level 1 of the fair value hierarchy.
Fair valuing of securities may be determined with the assistance of a pricing service using calculations based on indices of domestic securities and other appropriate indicators, such as prices of relevant ADRs and financial futures. Utilizing these techniques may result in transfers between Level 1 and Level 2 of the fair value hierarchy.
When market quotations or official closing prices are not readily available, or are determined not to reflect accurately fair value, such as when the value of a security has been significantly affected by events after the close of the exchange or market on which the security is principally traded (for example, a foreign exchange or market), but before the fund calculates its net asset value, the fund may value these investments at fair value as determined in accordance with the procedures approved by the Board. Certain factors may be considered when fair valuing investments such as: fundamental analytical data, the nature and duration of restrictions on disposition, an evaluation of the forces that influence the market in which the securities are purchased and sold, and public trading in similar securities of the issuer or comparable issuers. These securities are either categorized within Level 2 or 3 of the fair value hierarchy depending on the relevant inputs used.
For restricted securities where observable inputs are limited, assumptions about market activity and risk are used and are categorized within Level 3 of the fair value hierarchy.
Investments denominated in foreign currencies are translated to U.S. dollars at the prevailing rates of exchange.
Forward foreign currency exchange contracts (“forward contracts”) are valued at the forward rate and are generally categorized within Level 2 of the fair value hierarchy.
24
The following is a summary of the inputs used as of November 30, 2013 in valuing the fund’s investments:
| | | | |
| | | Level 2—Other | Level 3— | |
| | Level 1— | Significant | Significant | |
| | Unadjusted | Observable | Unobservable | |
| | Quoted Prices | Inputs | Inputs | Total |
| Assets ($) | | | | |
| Investments in Securities: | | | |
| Equity Securities— | | | | |
| Foreign | | | | |
| Common | | | | |
| Stocks† | 3,149,863,122 | — | — | 3,149,863,122 |
| Mutual Funds | 93,800,000 | — | — | 93,800,000 |
| |
| † See Statement of Investments for additional detailed categorizations. | |
At November 30, 2013, there were no transfers between Level 1 and Level 2 of the fair value hierarchy.
(b) Foreign currency transactions: The fund does not isolate that portion of the results of operations resulting from changes in foreign exchange rates on investments from the fluctuations arising from changes in the market prices of securities held. Such fluctuations are included with the net realized and unrealized gain or loss on investments.
Net realized foreign exchange gains or losses arise from sales of foreign currencies, currency gains or losses realized on securities transactions between trade and settlement date, and the difference between the amounts of dividends, interest and foreign withholding taxes recorded on the fund’s books and the U.S. dollar equivalent of the amounts actually received or paid. Net unrealized foreign exchange gains and losses arise from changes in the value of assets and liabilities other than investments resulting from changes in exchange rates. Foreign currency gains and losses on foreign currency transactions are also included with net realized and unrealized gain or loss on investments.
NOTES TO FINANCIAL STATEMENTS (continued)
(c) Securities transactions and investment income: Securities transactions are recorded on a trade date basis. Realized gains and losses from securities transactions are recorded on the identified cost basis. Dividend income is recognized on the ex-dividend date and interest income, including, where applicable, accretion of discount and amortization of premium on investments, is recognized on the accrual basis.
(d) Affiliated issuers: Investments in other investment companies advised by Dreyfus are defined as “affiliated” under the Act. Investments in affiliated investment companies during the period ended November 30, 2013 were as follows:
| | | | | |
| Affiliated | | | | | |
| Investment | Value ($) | | | Value | Net |
| Company | 11/30/2012 | Purchases ($) | Sales ($) | 11/30/2013 ($) | Assets (%) |
| Dreyfus | | | | | |
| Institutional | | | | | |
| Preferred | | | | | |
| Plus Money | | | | | |
| Market | | | | | |
| Fund | 47,720,000 | 850,450,000 | 804,370,000 | 93,800,000 | 2.9 |
(e) Risk: Investing in foreign markets may involve special risks and considerations not typically associated with investing in the U.S.These risks include revaluation of currencies, high rates of inflation, repatriation restrictions on income and capital, and adverse political and economic developments. Moreover, securities issued in these markets may be less liquid, subject to government ownership controls and delayed settlements, and their prices may be more volatile than those of comparable securities in the U.S.
(f) Dividends to shareholders: Dividends are recorded on the ex-dividend date. Dividends from investment income-net and dividends from net realized capital gains, if any, are normally declared and paid annually, but the fund may make distributions on a more frequent basis to comply with the distribution requirements of the Internal Revenue Code of 1986, as amended (the “Code”).To the extent that net realized capital gains can be offset by capital loss carryovers, it is the policy of the fund not to distribute such gains. Income and capital gain dis-
26
tributions are determined in accordance with income tax regulations, which may differ from GAAP.
(g) Federal income taxes: It is the policy of the fund to continue to qualify as a regulated investment company, if such qualification is in the best interests of its shareholders, by complying with the applicable provisions of the Code, and to make distributions of taxable income sufficient to relieve it from substantially all federal income and excise taxes.
As of and during the period ended November 30, 2013, the fund did not have any liabilities for any uncertain tax positions. The fund recognizes interest and penalties, if any, related to uncertain tax positions as income tax expense in the Statement of Operations. During the period ended November 30, 2013, the fund did not incur any interest or penalties.
Each tax year in the four-year period ended November 30, 2013 remains subject to examination by the Internal Revenue Service and state taxing authorities.
At November 30, 2013, the components of accumulated earnings on a tax basis were as follows: undistributed ordinary income $46,743,520, accumulated capital losses $63,676,108 and unrealized appreciation $504,592,976.
Under the Regulated Investment Company Modernization Act of 2010 (the “2010 Act”), the fund is permitted to carry forward capital losses incurred in taxable years beginning after December 22, 2010 (“post-enactment losses”) for an unlimited period. Furthermore, post-enactment capital loss carryovers retain their character as either short-term or long-term capital losses rather than short-term as they were under previous statute.The 2010 Act requires post-enactment losses to be utilized before the utilization of losses incurred in taxable years prior to the effective date of the 2010 Act (“pre-enactment losses”).As a result of this ordering rule, pre-enactment losses may be more likely to expire unused.
NOTES TO FINANCIAL STATEMENTS (continued)
The accumulated capital loss carryover is available for federal income tax purposes to be applied against future net realized capital gains, if any, realized subsequent to November 30, 2013. If not applied, $598,805 of the carryover expires in fiscal year 2016, $15,114,500 expires in fiscal year 2017 and $16,297,830 expires in fiscal year 2019. The fund has $5,721,194 of post-enactment short-term capital losses and $25,943,779 of post-enactment long-term capital losses which can be carried forward for an unlimited period.
The tax character of distributions paid to shareholders during the fiscal periods ended November 30, 2013 and November 30, 2012 were as follows: ordinary income $35,504,023 and $16,065,505, respectively.
During the period ended November 30, 2013, as a result of permanent book to tax differences, primarily due to the tax treatment for foreign currency gains and losses, the fund increased accumulated undistributed investment income-net by $30,617 and decreased accumulated net realized gain (loss) on investments by the same amount. Net assets and net asset value per share were not affected by this reclassification.
(h) Accounting Pronouncement: In January 2013, FASB issued Accounting Standards Update No. 2013-01 (“ASU 2013-01”), “Clarifying the Scope of Disclosures about Offsetting Assets and Liabilities”, which replaced Accounting Standards Update No. 2011-11 (“ASU 2011-11”), “Disclosures about Offsetting Assets and Liabilities”. ASU 2013-01 is effective for fiscal years beginning on or after January 1, 2013, and interim periods within those annual periods.ASU 2011-11 was intended to enhance disclosure requirements on the offsetting of financial assets and liabilities.ASU 2013-01 limits the scope of the new balance sheet offsetting disclosures to derivatives, repurchase agreements, and securities lending transactions to the extent that they are (1) offset in the financial statements or (2) subject to enforceable master netting arrangements (“MNA”) or similar agreements. Management is currently evaluating the application of ASU 2013-01 and its impact on the fund’s financial statements.
28
NOTE 2—Bank Lines of Credit:
The fund participates with other Dreyfus-managed funds in a $265 million unsecured credit facility led by Citibank, N.A. and a $300 million unsecured credit facility provided by The Bank of New York Mellon, a subsidiary of BNY Mellon and an affiliate of Dreyfus (each, a “Facility”), each to be utilized primarily for temporary or emergency purposes, including the financing of redemptions. Prior to October 9, 2013, the unsecured credit facility with Citibank, N.A. was $210 million. In connection therewith, the fund has agreed to pay its pro rata portion of commitment fees for each Facility. Interest is charged to the fund based on rates determined pursuant to the terms of the respective Facility at the time of borrowing. During the period ended November 30, 2013, the fund did not borrow under the Facilities.
NOTE 3—Management Fee, Sub-Investment Advisory Fee and Other Transactions With Affiliates:
(a) Pursuant to a management agreement with Dreyfus, the management fee is computed at the annual rate of .85% of the value of the fund’s average daily net assets and is payable monthly.
Pursuant to a sub-investment advisory agreement between Dreyfus and Walter Scott, Dreyfus pays Walter Scott a monthly fee at an annual percentage of the value of the fund’s average daily net assets.
During the period ended November 30, 2013, the Distributor retained $15,844 from commissions earned on sales of the fund’s Class A shares and $5,646 from CDSCs on redemptions of the fund’s Class C shares.
(b) Under the Distribution Plan adopted pursuant to Rule 12b-1 under the Act, Class C shares pay the Distributor for distributing its shares at an annual rate of .75% of the value of its average daily net assets. During the period ended November 30, 2013, Class C shares were charged $243,922, pursuant to the Distribution Plan.
NOTES TO FINANCIAL STATEMENTS (continued)
(c) Under the Shareholder Services Plan, Class A and Class C shares pay the Distributor at an annual rate of .25% of the value of their average daily net assets for the provision of certain services. The services provided may include personal services relating to shareholder accounts, such as answering shareholder inquiries regarding the fund and providing reports and other information, and services related to the maintenance of shareholder accounts. The Distributor may make payments to Service Agents (securities dealers, financial institutions or other industry professionals) with respect to these services. The Distributor determines the amounts to be paid to Service Agents. During the period ended November 30, 2013, Class A and Class C shares were charged $604,029 and $81,307, respectively, pursuant to the Shareholder Services Plan.
The fund has arrangements with the transfer agent and the custodian whereby the fund may receive earnings credits when positive cash balances are maintained, which are used to offset transfer agency and custody fees. For financial reporting purposes, the fund includes net earnings credits as an expense offset in the Statement of Operations.
The fund compensates DreyfusTransfer, Inc., a wholly-owned subsidiary of Dreyfus, under a transfer agency agreement for providing transfer agency and cash management services for the fund. The majority of transfer agency fees are comprised of amounts paid on a per account basis, while cash management fees are related to fund subscriptions and redemptions. During the period ended November 30, 2013, the fund was charged $67,590 for transfer agency services and $2,166 for cash management services.These fees are included in Shareholder servicing costs in the Statement of Operations. Cash management fees were partially offset by earnings credits of $291.
The fund compensates The Bank of NewYork Mellon under a custody agreement for providing custodial services for the fund.These fees are determined based on net assets, geographic region and transaction activity. During the period ended November 30, 2013, the fund was charged $822,894 pursuant to the custody agreement.
30
The fund compensated The Bank of New York Mellon under a cash management agreement that was in effect until September 30, 2013 for performing certain cash management services related to fund subscriptions and redemptions. During the period ended November 30, 2013, the fund was charged $1,071 pursuant to the cash management agreement, which is included in Shareholder servicing costs in the Statement of Operations. These fees were partially offset by earnings credits of $3.
During the period ended November 30, 2013, the fund was charged $9,055 for services performed by the Chief Compliance Officer and his staff.
The components of “Due to The Dreyfus Corporation and affiliates” in the Statement of Assets and Liabilities consist of: management fees $2,256,243, Distribution Plan fees $22,091, Shareholder Services Plan fees $65,630, custodian fees $355,080, Chief Compliance Officer fees $3,833 and transfer agency fees $21,352.
(d) Each Board member also serves as a Board member of other funds within the Dreyfus complex. Annual retainer fees and attendance fees are allocated to each fund based on net assets.
NOTE 4—Securities Transactions:
The aggregate amount of purchases and sales of investment securities, excluding short-term securities and forward contracts, during the period ended November 30, 2013, amounted to $881,721,875 and $70,224,287, respectively.
Derivatives: A derivative is a financial instrument whose performance is derived from the performance of another asset. Each type of derivative instrument that was held by the fund during the period ended November 30, 2013 is discussed below.
Forward Foreign Currency Exchange Contracts: The fund enters into forward contracts in order to hedge its exposure to changes in foreign currency exchange rates on its foreign portfolio holdings, to settle
NOTES TO FINANCIAL STATEMENTS (continued)
foreign currency transactions or as a part of its investment strategy. When executing forward contracts, the fund is obligated to buy or sell a foreign currency at a specified rate on a certain date in the future. With respect to sales of forward contracts, the fund incurs a loss if the value of the contract increases between the date the forward contract is opened and the date the forward contract is closed.The fund realizes a gain if the value of the contract decreases between those dates.With respect to purchases of forward contracts, the fund incurs a loss if the value of the contract decreases between the date the forward contract is opened and the date the forward contract is closed.The fund realizes a gain if the value of the contract increases between those dates. Any realized or unrealized gains or losses which occurred during the period are reflected in the Statement of Operations. The fund is exposed to foreign currency risk as a result of changes in value of underlying financial instruments.The fund is also exposed to credit risk associated with counterparty nonperformance on these forward contracts, which is generally limited to the unrealized gain on each open contract. At November 30, 2013, there were no forward contracts outstanding.
The following summarizes the average market value of derivatives outstanding during the period ended November 30, 2013:
| |
| | Average Market Value ($) |
| Forward contracts | 10,572,723 |
At November 30, 2013, the cost of investments for federal income tax purposes was $2,739,101,027; accordingly, accumulated net unrealized appreciation on investments was $504,562,095, consisting of $586,893,219 gross unrealized appreciation and $82,331,124 gross unrealized depreciation.
32
REPORT OF INDEPENDENT REGISTERED
PUBLIC ACCOUNTING FIRM
Shareholders and Board of Directors
International Stock Fund
We have audited the accompanying statement of assets and liabilities, including the statement of investments, of International Stock Fund (one of the series comprising Strategic Funds, Inc.) as of November 30, 2013, and the related statement of operations for the year then ended, the statement of changes in net assets for each of the two years in the period then ended, and the financial highlights for each of the periods indicated therein. These financial statements and financial highlights are the responsibility of the Fund’s management. Our responsibility is to express an opinion on these financial statements and financial highlights based on our audits.
We conducted our audits in accordance with the standards of the Public Company Accounting Oversight Board (United States).Those standards require that we plan and perform the audit to obtain reasonable assurance about whether the financial statements and financial highlights are free of material misstatement.We were not engaged to perform an audit of the Fund’s internal control over financial reporting. Our audits included consideration of internal control over financial reporting as a basis for designing audit procedures that are appropriate in the circumstances, but not for the purpose of expressing an opinion on the effectiveness of the Fund’s internal control over financial reporting. Accordingly, we express no such opinion.An audit also includes examining, on a test basis, evidence supporting the amounts and disclosures in the financial statements and financial highlights, assessing the accounting principles used and significant estimates made by management, and evaluating the overall financial statement presentation. Our procedures included confirmation of securities owned as of November 30, 2013 by correspondence with the custodian and others. We believe that our audits provide a reasonable basis for our opinion.
In our opinion, the financial statements and financial highlights referred to above present fairly, in all material respects, the financial position of International Stock Fund at November 30, 2013, the results of its operations for the year then ended, the changes in its net assets for each of the two years in the period then ended, and the financial highlights for each of the indicated periods, in conformity with U.S. generally accepted accounting principles.

|
| NewYork, NewYork |
| January 27, 2014 |
IMPORTANT TAX INFORMATION (Unaudited)
In accordance with federal tax law, the fund elects to provide each shareholder with their portion of the fund’s foreign taxes paid and the income sourced from foreign countries. Accordingly, the fund hereby reports the following information regarding its fiscal year ended November 30, 2013:
—the total amount of taxes paid to foreign countries was $5,384,262
—the total amount of income sourced from foreign countries was $75,361,140.
Where required by federal tax law rules, shareholders will receive notification of their proportionate share of foreign taxes paid and foreign sourced income for the 2013 calendar year with Form 1099-DIV which will be mailed in early 2014.
For the fiscal year ended November 30, 2013, certain dividends paid by the fund may be subject to a maximum tax rate of 15%, as provided for by the Jobs and Growth Tax Relief Reconciliation Act of 2003. Of the distributions paid during the fiscal year, $35,504,023 represents the maximum amount that may be considered qualified dividend income.
34
|
| INFORMATION ABOUT THE RENEWAL OF THE |
| FUND’S MANAGEMENT AND SUB-INVESTMENT |
| ADVISORY AGREEMENTS (Unaudited) |
At a meeting of the fund’s Board of Directors held on November 4-5, 2013, the Board considered the renewal of the fund’s Management Agreement, pursuant to which Dreyfus provides the fund with investment advisory and administrative services (the “Agreement”), and the Sub-Investment Advisory Agreement (together, the “Agreements”), pursuant to which Walter Scott & Partners Limited (the “Sub-Adviser”) provides day-to-day management of the fund’s investments.The Board members, none of whom are “interested persons” (as defined in the Investment Company Act of 1940, as amended) of the fund, were assisted in their review by independent legal counsel and met with counsel in executive session separate from representatives of Dreyfus and the Sub-Adviser. In considering the renewal of the Agreements, the Board considered all factors that it believed to be relevant, including those discussed below.The Board did not identify any one factor as dispositive, and each Board member may have attributed different weights to the factors considered.
Analysis of Nature, Extent, and Quality of Services Provided to the Fund. The Board considered information provided to them at the meeting and in previous presentations from Dreyfus representatives regarding the nature, extent, and quality of the services provided to funds in the Dreyfus fund complex. Dreyfus provided the number of open accounts in the fund, the fund’s asset size and the allocation of fund assets among distribution channels. Dreyfus also had previously provided information regarding the diverse intermediary relationships and distribution channels of funds in the Dreyfus fund complex (such as retail direct or intermediary, in which intermediaries typically are paid by the fund and/or Dreyfus) and Dreyfus’ corresponding need for broad, deep, and diverse resources to be able to provide ongoing shareholder services to each intermediary or distribution channel, as applicable to the fund.
The Board also considered research support available to, and portfolio management capabilities of, the fund’s portfolio management personnel and that Dreyfus also provides oversight of day-to-day fund operations,
|
| INFORMATION ABOUT THE RENEWAL OF THE FUND’S MANAGEMENT AND |
| SUB-INVESTMENT ADVISORY AGREEMENTS (Unaudited) (continued) |
including fund accounting and administration and assistance in meeting legal and regulatory requirements.The Board also considered Dreyfus’ extensive administrative, accounting, and compliance infrastructures, as well as Dreyfus’ supervisory activities over the Sub-Adviser.The Board also considered portfolio management’s brokerage policies and practices (including policies and practices regarding soft dollars) and the standards applied in seeking best execution.
Comparative Analysis of the Fund’s Performance and Management Fee and Expense Ratio. The Board reviewed reports prepared by Lipper, Inc. (“Lipper”), an independent provider of investment company data, which included information comparing (1) the fund’s performance with the performance of a group of comparable funds (the “Performance Group”) and with a broader group of funds (the “Performance Universe”), all for various periods ended September 30, 2013, and (2) the fund’s actual and contractual management fees and total expenses with those of a group of comparable funds (the “Expense Group”) and with a broader group of funds (the “Expense Universe”), the information for which was derived in part from fund financial statements available to Lipper as of the date of its analysis. Dreyfus previously had furnished the Board with a description of the methodology Lipper used to select the Performance Group and Performance Universe and the Expense Group and Expense Universe.
Dreyfus representatives stated that the usefulness of performance comparisons may be affected by a number of factors, including different investment limitations that may be applicable to the fund and comparison funds.They also noted that performance generally should be considered over longer periods of time, although it is possible that long-term performance can be adversely affected by even one period of significant underperformance so that a single investment decision or theme has the ability to affect disproportionately long-term performance. The Board discussed the results of the comparisons and noted that the fund’s total return performance was below the Performance Group and Performance Universe medians for the one- and two- year periods and above the
36
Performance Group and Performance Universe medians for the three-, four- and five-year periods. Dreyfus also provided a comparison of the fund’s calendar year total returns to the returns of the fund’s benchmark index and noted that the fund’s performance was above the returns of the benchmark in four of the five years.
The Board received a presentation from a representative of the Sub-Adviser describing the fund’s investment strategy and performance generally over the past two calendar years as well as the appeal to fund shareholders of the Sub-Adviser’s low beta and benchmark-agnostic investment approach, as reflected in the fund’s continuing net asset growth since inception. During this presentation, the Board noted how the Sub-Adviser’s benchmark-agnostic investment approach can be expected to result in periods of significant outperformance and underperformance from time to time.
The Board also reviewed the range of actual and contractual management fees and total expenses of the Expense Group and Expense Universe funds and discussed the results of the comparisons.The Board noted that the fund’s contractual management fee was slightly below the Expense Group median, the fund’s actual management fee was at the Expense Group median and slightly above the Expense Universe median, and the fund’s total expenses were below the Expense Group and Expense Universe medians (lowest in the Expense Group).
Dreyfus representatives reviewed with the Board the management or investment advisory fees (1) paid by funds advised or administered by Dreyfus that are in the same Lipper category as the fund and (2) paid to Dreyfus or the Sub-Adviser or its affiliates for advising any separate accounts and/or other types of client portfolios that are considered to have similar investment strategies and policies as the fund (the “Similar Clients”), and explained the nature of the Similar Clients.They discussed differences in fees paid and the relationship of the fees paid in light of any differences in the services provided and other relevant factors.The
|
| INFORMATION ABOUT THE RENEWAL OF THE FUND’S MANAGEMENT AND |
| SUB-INVESTMENT ADVISORY AGREEMENTS (Unaudited) (continued) |
Board considered the relevance of the fee information provided for the Similar Clients to evaluate the appropriateness and reasonableness of the fund’s management fee.
The Board considered the fee to the Sub-Adviser in relation to the fee paid to Dreyfus by the fund and the respective services provided by the Sub-Adviser and Dreyfus.The Board also noted the Sub-Adviser’s fee is paid by Dreyfus (out of its fee from the fund) and not the fund.
Analysis of Profitability and Economies of Scale. Dreyfus representatives reviewed the expenses allocated and profit received by Dreyfus and the resulting profitability percentage for managing the fund and the aggregate profitability percentage to Dreyfus of managing the funds in the Dreyfus fund complex, and the method used to determine the expenses and profit. The Board concluded that the profitability results were not unreasonable, given the services rendered and service levels provided by Dreyfus. The Board also had been provided with information prepared by an independent consulting firm regarding Dreyfus’ approach to allocating costs to, and determining the profitability of, individual funds and the entire Dreyfus fund complex.The consulting firm also had analyzed where any economies of scale might emerge in connection with the management of a fund.
The Board considered on the advice of its counsel the profitability analysis (1) as part of its evaluation of whether the fees under the Agreements bear a reasonable relationship to the mix of services provided by Dreyfus and the Sub-Adviser, including the nature, extent, and quality of such services, and (2) in light of the relevant circumstances for the fund and the extent to which economies of scale would be realized if the fund grows and whether fee levels reflect these economies of scale for the benefit of fund shareholders. Since Dreyfus, and not the fund, pays the Sub-Adviser pursuant to the Sub-Investment Advisory Agreement, the Board did not consider the Sub-Adviser’s profitability to be relevant to its deliberations. Dreyfus representatives also noted that, as a result of shared and allocated costs among funds in the Dreyfus fund complex, the extent of economies of scale could depend substantially on
38
the level of assets in the complex as a whole, so that increases and decreases in complex-wide assets can affect potential economies of scale in a manner that is disproportionate to, or even in the opposite direction from, changes in the fund’s asset level.The Board also considered potential benefits to Dreyfus and the Sub-Adviser from acting as investment adviser and sub-investment adviser, respectively, and noted the soft dollar arrangements in effect for trading the fund’s investments.
At the conclusion of these discussions, the Board agreed that it had been furnished with sufficient information to make an informed business decision with respect to the renewal of the Agreements. Based on the discussions and considerations as described above, the Board concluded and determined as follows.
The Board concluded that the nature, extent, and quality of the services provided by Dreyfus and the Sub-Adviser are adequate and appropriate.
The Board generally was satisfied with the fund’s overall performance, in light of the considerations described above.
The Board concluded that the fees paid to Dreyfus and the Sub- Adviser were reasonable in light of the considerations described above.
The Board determined that the economies of scale which may accrue to Dreyfus and its affiliates in connection with the management of the fund had been adequately considered by Dreyfus in connection with the fee rate charged to the fund pursuant to the Agreement and that, to the extent in the future it were determined that material economies of scale had not been shared with the fund, the Board would seek to have those economies of scale shared with the fund.
In evaluating the Agreements, the Board considered these conclusions and determinations and also relied on its previous knowledge, gained through meetings and other interactions with Dreyfus and its affiliates and the Sub-Adviser, of the fund and the services provided to the fund by Dreyfus and the Sub-Adviser.The Board also relied on information received on a routine and regular basis throughout the year relating to
|
| INFORMATION ABOUT THE RENEWAL OF THE FUND’S MANAGEMENT AND |
| SUB-INVESTMENT ADVISORY AGREEMENTS (Unaudited) (continued) |
the operations of the fund and the investment management and other services provided under the Agreements, including information on the investment performance of the fund in comparison to similar mutual funds and benchmark performance indices; general market outlook as applicable to the fund; and compliance reports. In addition, the Board’s consideration of the contractual fee arrangements for this fund had the benefit of a number of years of reviews of prior or similar agreements during which lengthy discussions took place between the Board and Dreyfus representatives. Certain aspects of the arrangements may receive greater scrutiny in some years than in others, and the Board’s conclusions may be based, in part, on their consideration of the same or similar arrangements in prior years.The Board determined that renewal of the Agreements was in the best interests of the fund and its shareholders.
40
BOARD MEMBERS INFORMATION (Unaudited)
|
| Joseph S. DiMartino (70) |
| Chairman of the Board (1995) |
| Principal Occupation During Past 5Years: |
| • Corporate Director and Trustee |
| Other Public Company Board Memberships During Past 5Years: |
| • CBIZ (formerly, Century Business Services, Inc.), a provider of outsourcing functions for small |
| and medium size companies, Director (1997-present) |
| • The Newark Group, a provider of a national market of paper recovery facilities, paperboard mills |
| and paperboard converting plants, Director (2000-2010) |
| • Sunair Services Corporation, a provider of certain outdoor-related services to homes and |
| businesses, Director (2005-2009) |
| No. of Portfolios for which Board Member Serves: 141 |
| ——————— |
| William Hodding Carter III (78) |
| Board Member (1988) |
| Principal Occupation During Past 5Years: |
| • Professor of Leadership & Public Policy, University of North Carolina, Chapel Hill (2006-present) |
| No. of Portfolios for which Board Member Serves: 24 |
| ——————— |
| Gordon J. Davis (72)† |
| Board Member (2006) |
| Principal Occupation During Past 5Years: |
| • Partner in the law firm ofVenable LLP (2012-present) |
| • Partner in the law firm of Dewey & LeBoeuf LLP (1994-2012) |
| Other Public Company Board Memberships During Past 5Years: |
| • Consolidated Edison, Inc., a utility company, Director (1997-present) |
| • The Phoenix Companies, Inc., a life insurance company, Director (2000-present) |
| No. of Portfolios for which Board Member Serves: 49 |
| † Mr. Davis is deemed to be an “interested person” (as defined in the Act) of the fund as a result of his affiliation with |
| Venable LLP, which provides legal services to the fund. |
| ——————— |
| Joni Evans (71) |
| Board Member (2006) |
| Principal Occupation During Past 5Years: |
| • Chief Executive Officer, www.wowOwow.com an online community dedicated to women’s |
| conversations and publications (2007-present) |
| • Principal, Joni Evans Ltd. (publishing) (2006-present) |
| No. of Portfolios for which Board Member Serves: 24 |
BOARD MEMBERS INFORMATION (Unaudited) (continued)
|
| Ehud Houminer (73) |
| Board Member (1994) |
| Principal Occupation During Past 5Years: |
| • Executive-in-Residence at the Columbia Business School, Columbia University (1992-present) |
| Other Public Company Board Memberships During Past 5Years: |
| • Avnet Inc., an electronics distributor, Director (1993-2012) |
| No. of Portfolios for which Board Member Serves: 66 |
| ——————— |
| Richard C. Leone (73) |
| Board Member (1984) |
| Principal Occupation During Past 5Years: |
| • Senior Fellow and former President of The Century Foundation (formerly, The Twentieth |
| Century Fund, Inc.), a tax exempt research foundation engaged in the study of economic, foreign |
| policy and domestic issues |
| No. of Portfolios for which Board Member Serves: 24 |
| ——————— |
| Hans C. Mautner (76) |
| Board Member (1984) |
| Principal Occupation During Past 5Years: |
| • President—International Division and an Advisory Director of Simon Property Group, a real |
| estate investment company (1998-2010) |
| • Chairman and Chief Executive Officer of Simon Global Limited, a real estate company (1999-2010) |
| No. of Portfolios for which Board Member Serves: 24 |
| ——————— |
| Robin A. Melvin (50) |
| Board Member (1995) |
| Principal Occupation During Past 5Years: |
| • Board Member, Illinois Mentoring Partnership, non-profit organization dedicated to increasing |
| the quantity and quality of mentoring services in Illinois (2013-present) |
| • Director, Boisi Family Foundation, a private family foundation that supports youth-serving orga- |
| nizations that promote the self sufficiency of youth from disadvantaged circumstances (1995-2012) |
| No. of Portfolios for which Board Member Serves: 90 |
42
|
| Burton N. Wallack (63) |
| Board Member (2006) |
| Principal Occupation During Past 5Years: |
| • President and Co-owner of Wallack Management Company, a real estate management company |
| No. of Portfolios for which Board Member Serves: 24 |
| ——————— |
| John E. Zuccotti (76) |
| Board Member (1984) |
| Principal Occupation During Past 5Years: |
| • Chairman of Brookfield Properties, Inc. |
| • Senior Counsel of Weil, Gotshal & Manges, LLP |
| • Emeritus Chairman of the Real Estate Board of NewYork |
| Other Public Company Board Memberships During Past 5Years: |
| • Wellpoint, Inc., a health benefits company, Director (2005-2010) |
| No. of Portfolios for which Board Member Serves: 24 |
| ——————— |
Once elected all Board Members serve for an indefinite term, but achieve Emeritus status upon reaching age 80.The address of the Board Members and Officers is c/o The Dreyfus Corporation, 200 Park Avenue, NewYork, NewYork 10166. Additional information about the Board Members is available in the fund’s Statement of Additional Information which can be obtained from Dreyfus free of charge by calling this toll free number: 1-800-DREYFUS.
David W. Burke, Emeritus Board Member
Arnold S. Hiatt, Emeritus Board Member
OFFICERS OF THE FUND (Unaudited)
BRADLEY J. SKAPYAK, President since January 2010.
Chief Operating Officer and a director of the Manager since June 2009, Chairman of Dreyfus Transfer, Inc., an affiliate of the Manager and the transfer agent of the funds, since May 2011 and Executive Vice President of the Distributor since June 2007. From April 2003 to June 2009, Mr. Skapyak was the head of the Investment Accounting and Support Department of the Manager. He is an officer of 68 investment companies (comprised of 141 portfolios) managed by the Manager. He is 55 years old and has been an employee of the Manager since February 1988.
JOHN PAK, Chief Legal Officer since March 2013.
Chief Legal Officer of the Manager and Associate General Counsel and Managing Director of BNY Mellon since August 2012; from March 2005 to July 2012, Managing Director of Deutsche Bank, Deputy Global Head of Deutsche Asset Management Legal and Regional Head of Deutsche Asset Management Americas Legal. He is an officer of 69 investment companies (comprised of 166 portfolios) managed by the Manager. He is 45 years old and has been an employee of the Manager since August 2012.
JANETTE E. FARRAGHER, Vice President and Secretary since December 2011.
Assistant General Counsel of BNY Mellon, and an officer of 69 investment companies (comprised of 166 portfolios) managed by the Manager. She is 50 years old and has been an employee of the Manager since February 1984.
KIESHA ASTWOOD, Vice President and Assistant Secretary since January 2010.
Counsel of BNY Mellon, and an officer of 69 investment companies (comprised of 166 portfolios) managed by the Manager. She is 40 years old and has been an employee of the Manager since July 1995.
JAMES BITETTO, Vice President and Assistant Secretary since August 2005.
Senior Counsel of BNY Mellon and Secretary of the Manager, and an officer of 69 investment companies (comprised of 166 portfolios) managed by the Manager. He is 47 years old and has been an employee of the Manager since December 1996.
JONI LACKS CHARATAN, Vice President and Assistant Secretary since August 2005.
Senior Counsel of BNY Mellon, and an officer of 69 investment companies (comprised of 166 portfolios) managed by the Manager. She is 58 years old and has been an employee of the Manager since October 1988.
JOSEPH M. CHIOFFI, Vice President and Assistant Secretary since August 2005.
Senior Counsel of BNY Mellon, and an officer of 69 investment companies (comprised of 166 portfolios) managed by the Manager. He is 52 years old and has been an employee of the Manager since June 2000.
JOHN B. HAMMALIAN, Vice President and Assistant Secretary since August 2005.
Senior Managing Counsel of BNY Mellon, and an officer of 69 investment companies (comprised of 166 portfolios) managed by the Manager. He is 50 years old and has been an employee of the Manager since February 1991.
ROBERT R. MULLERY, Vice President and Assistant Secretary since August 2005.
Managing Counsel of BNY Mellon, and an officer of 69 investment companies (comprised of 166 portfolios) managed by the Manager. He is 61 years old and has been an employee of the Manager since May 1986.
44
JEFF PRUSNOFSKY, Vice President and Assistant Secretary since August 2005.
Senior Managing Counsel of BNY Mellon, and an officer of 69 investment companies (comprised of 166 portfolios) managed by the Manager. He is 48 years old and has been an employee of the Manager since October 1990.
JAMES WINDELS, Treasurer since November 2001.
Director – Mutual Fund Accounting of the Manager, and an officer of 69 investment companies (comprised of 166 portfolios) managed by the Manager. He is 55 years old and has been an employee of the Manager since April 1985.
RICHARD CASSARO, Assistant Treasurer since January 2008.
Senior Accounting Manager – Money Market and Municipal Bond Funds of the Manager, and an officer of 69 investment companies (comprised of 166 portfolios) managed by the Manager. He is 54 years old and has been an employee of the Manager since September 1982.
GAVIN C. REILLY, Assistant Treasurer since December 2005.
Tax Manager of the Investment Accounting and Support Department of the Manager, and an officer of 69 investment companies (comprised of 166 portfolios) managed by the Manager. He is 45 years old and has been an employee of the Manager since April 1991.
ROBERT S. ROBOL, Assistant Treasurer since December 2002.
Senior Accounting Manager – Fixed Income Funds of the Manager, and an officer of 69 investment companies (comprised of 166 portfolios) managed by the Manager. He is 49 years old and has been an employee of the Manager since October 1988.
ROBERT SALVIOLO, Assistant Treasurer since July 2007.
Senior Accounting Manager – Equity Funds of the Manager, and an officer of 69 investment companies (comprised of 166 portfolios) managed by the Manager. He is 46 years old and has been an employee of the Manager since June 1989.
ROBERT SVAGNA, Assistant Treasurer since December 2002.
Senior Accounting Manager – Equity Funds of the Manager, and an officer of 69 investment companies (comprised of 166 portfolios) managed by the Manager. He is 46 years old and has been an employee of the Manager since November 1990.
JOSEPH W. CONNOLLY, Chief Compliance Officer since October 2004.
Chief Compliance Officer of the Manager and The Dreyfus Family of Funds (69 investment companies, comprised of 166 portfolios). He is 56 years old and has served in various capacities with the Manager since 1980, including manager of the firm’s Fund Accounting Department from 1997 through October 2001.
MATTHEW D. CONNOLLY, Anti-Money Laundering Compliance Officer since April 2012.
Anti-Money Laundering Compliance Officer of the Distributor since October 2011; from March 2010 to September 2011, Global Head, KYC Reviews and Director, UBS Investment Bank; until March 2010, AML Compliance Officer and Senior Vice President, Citi Global Wealth Management. He is an officer of 64 investment companies (comprised of 161 portfolios) managed by the Manager. He is 41 years old and has been an employee of the Distributor since October 2011.
For More Information
Telephone Call your financial representative or 1-800-DREYFUS
Mail The Dreyfus Family of Funds, 144 Glenn Curtiss Boulevard, Uniondale, NY 11556-0144
The fund files its complete schedule of portfolio holdings with the Securities and Exchange Commission (“SEC”) for the first and third quarters of each fiscal year on Form N-Q. The fund’s Forms N-Q are available on the SEC’s website at http://www.sec.gov and may be reviewed and copied at the SEC’s Public Reference Room in Washington, DC. Information on the operation of the Public Reference Room may be obtained by calling 1-800-SEC-0330.
A description of the policies and procedures that the fund uses to determine how to vote proxies relating to portfolio securities, and information regarding how the fund voted these proxies for the most recent 12-month period ended June 30 is available at http://www.dreyfus.com and on the SEC’s website at http://www.sec.gov. The description of the policies and procedures is also available without charge, upon request, by calling 1-800-DREYFUS.

Global Stock Fund
ANNUAL REPORT November 30, 2013

Save time. Save paper. View your next shareholder report online as soon as it’s available. Log into www.dreyfus.com and sign up for Dreyfus eCommunications. It’s simple and only takes a few minutes.
The views expressed in this report reflect those of the portfolio manager only through the end of the period covered and do not necessarily represent the views of Dreyfus or any other person in the Dreyfus organization. Any such views are subject to change at any time based upon market or other conditions and Dreyfus disclaims any responsibility to update such views.These views may not be relied on as investment advice and, because investment decisions for a Dreyfus fund are based on numerous factors, may not be relied on as an indication of trading intent on behalf of any Dreyfus fund.
|
| Not FDIC-Insured • Not Bank-Guaranteed • May Lose Value |
| | Contents |
| | THE FUND |
| 2 | A Letter from the President |
| 3 | Discussion of Fund Performance |
| 6 | Fund Performance |
| 8 | Understanding Your Fund’s Expenses |
| 8 | Comparing Your Fund’s Expenses With Those of Other Funds |
| 9 | Statement of Investments |
| 12 | Statement of Assets and Liabilities |
| 13 | Statement of Operations |
| 14 | Statement of Changes in Net Assets |
| 16 | Financial Highlights |
| 20 | Notes to Financial Statements |
| 32 | Report of Independent Registered Public Accounting Firm |
| 33 | Important Tax Information |
| 34 | Information About the Renewal of the Fund’s Management and Sub-Investment Advisory Agreements |
| 40 | Board Members Information |
| 43 | Officers of the Fund |
| | FOR MORE INFORMATION |
| | Back Cover |
Global Stock Fund
The Fund
A LETTER FROM THE PRESIDENT
Dear Shareholder:
We are pleased to present this annual report for Global Stock Fund, covering the 12-month period from December 1, 2012, through November 30, 2013. For information about how the fund performed during the reporting period, as well as general market perspectives, we provide a Discussion of Fund Performance on the pages that follow.
Improving global economic conditions drove developed stock markets higher over much of the reporting period. Europe appeared to put the worst of its sovereign debt and banking crises behind it, and Japan embarked on a new economic course designed to reflate its long-stagnant domestic economy. However, the world’s emerging markets struggled with the effects of local economic slowdowns. As a result, equity market returns varied widely from one country to another over the past 12 months.
We currently expect global economic conditions to continue to improve in 2014, with stronger growth in many developed countries fueled by past and continuing monetary ease. The emerging markets seem poised for more moderate economic expansion. In the United States, we anticipate accelerating growth supported by the fading drags of tighter federal fiscal policies and downsizing on the state and local levels. For more information on how these observations may affect your investments, we encourage you to speak with your financial advisor.
Thank you for your continued confidence and support.

J. Charles Cardona
President
The Dreyfus Corporation
December 16, 2013
2
DISCUSSION OF FUND PERFORMANCE
For the reporting period of December 1, 2012, through November 30, 2013, as provided by Charlie Macquaker and Roy Leckie of Walter Scott & Partners Limited (Walter Scott), Sub-investment adviser
Fund and Market Performance Overview
For the 12-month period ended November 30, 2013, Global Stock Fund’s Class A shares produced a total return of 20.60%, Class C shares returned 19.72%, and Class I shares returned 20.93%.1 In comparison, the fund’s benchmark, the Morgan Stanley Capital International World Index (the “MSCI World Index”), achieved a 26.38% return over the same period.2 The fund’s Class Y shares produced a total return of 11.40% for the period since their inception of July 1, 2013, through November 30, 2013.
Stocks throughout the developed world responded positively to a recovering global economy during the reporting period. The fund’s returns lagged its benchmark, mainly due to its focus on what we determine to be high-quality growth companies at a time when more speculative value-oriented stocks fared better.
The Fund’s Investment Approach
The fund seeks long-term real returns by investing in high-quality companies that we believe are capable of sustainable growth and wealth creation over a long time horizon. The firm focuses on individual stock selection through extensive fundamental research. Candidates are initially selected for research if they meet certain broad absolute and trend criteria. Financial statements are analyzed in an effort to identify the nature of the cash generation that is looked for in any investment and to understand the variables that demonstrate robust financial health and define long-term competitive advantage. Companies meeting the financial criteria are then subjected to a detailed investigation of products, costs and pricing, competition, industry position, and outlook.
Recovering Global Economy Fueled Markets’ Gains
Global stocks rallied over the reporting period in response to aggressively accommodative monetary policies adopted by many central banks, which helped to produce
DISCUSSION OF FUND PERFORMANCE (continued)
ample liquidity in the financial markets.With bonds considered relatively unattractive due to rising long-term interest rates, investors flocked to equities to put their capital to work. Consequently, stock prices climbed sharply in most developed markets.
The United States led the global economic recovery, as domestic growth was supported by employment gains, rebounding housing markets, and a massive quantitative easing program. Europe seemed to put the worst of its financial crisis behind it, as evidenced by the end of a regional recession, greater confidence in the banking system, and rebounding stock prices in previously hard hit nations. Japan’s stock market was lifted by stimulative fiscal and monetary policies from a new government seeking to reflate the domestic economy after years of stagnation. In contrast, many emerging markets struggled with economic slowdowns and capital outflows during the reporting period.
Quality Bias Dampened Relative Performance
The fund’s relatively conservative investment approach tends to outperform market averages during downturns but typically lags during rallies.The reporting period was no exception, as industry leaders with histories of consistent growth generally fell out of favor among investors seeking more speculative opportunities. For example, in Japan, the fund maintained its emphasis on multinational companies with leadership positions in key export markets, but investors generally favored domestically focused companies that seemed likely to benefit from the new government’s stimulative fiscal and monetary policies. In Europe, the fund’s positions in global leaders based in core nations trailed their lower quality counterparts in peripheral countries, where stocks rebounded from depressed levels.
Several of the fund’s greatest laggards for the reporting period were domiciled in Japan. Construction machinery manufacturer Komatsu and industrial conglomerate Daikin Industries were hurt by sluggish demand from Asian emerging markets, and electronics producer Canon encountered competitive pressures in its cameras and printers segments. In the emerging markets, China Shenhua Energy suffered amid an international glut of coal, and Brazilian energy giant Petroleo Brasileiro was hurt by elevated production costs and government-imposed price controls on imported oil.
The fund achieved better results in the United States, which accounted for four of its top five performers over the reporting period. Software developer Adobe Systems benefited from a change in its distribution model to “software as a service,”
4
footwear maker NIKE achieved strong sales in North American markets, payments processor MasterCard benefited from higher transaction volumes, and technology leader Google continued to generate consistently strong results from online advertising sales and its Android smartphone operating system. The fund also received a strong contribution to performance from Japanese auto parts maker Denso, which prospered when vehicle sales climbed globally.
High Confidence in Portfolio Holdings
Although we at Walter Scott remain more skeptical than the consensus view regarding the sustainability of economic recoveries in Japan and Europe, we have continued to identify opportunities among industry leaders throughout the world that, in our analysis, are poised to benefit from positive secular trends.As of the reporting period’s end, we have found a number of companies meeting our investment criteria in the information technology, energy, and health care sectors, but relatively few in the financials, industrials, and telecommunications services sectors. From a regional perspective, the fund held overweighted exposure to the emerging markets, Asia/Pacific markets, and Japan, and underweighted positions in the United States, Canada, and Europe.
December 16, 2013
Please note, the position in any security highlighted with italicized typeface was sold during the reporting period. Equity funds are subject generally to market, market sector, market liquidity, issuer and investment style risks, among other factors, to varying degrees, all of which are more fully described in the fund’s prospectus.
Investing internationally involves special risks, including changes in currency exchange rates, political, economic and social instability, a lack of comprehensive company information, differing auditing and legal standards and less market liquidity.These risks generally are greater with emerging market countries than with more economically and politically established foreign countries.
|
| 1 Total return includes reinvestment of dividends and any capital gains paid and does not take into consideration the |
| maximum initial sales charge in the case of Class A shares, or the applicable contingent deferred sales charge imposed |
| on redemptions in the case of Class C shares. Had these charges been reflected, returns would have been lower. Past |
| performance is no guarantee of future results. Share price, yield and investment return fluctuate such that upon |
| redemption, fund shares may be worth more or less than their original cost. |
| 2 SOURCE: LIPPER INC. — Reflects reinvestment of net dividends and, where applicable, capital gain |
| distributions.The Morgan Stanley Capital International (MSCI) World Index is an unmanaged index of global stock |
| market performance, including the United States, Canada, Europe,Australia, New Zealand and the Far East. |
| Investors cannot invest directly in any index. |
FUND PERFORMANCE
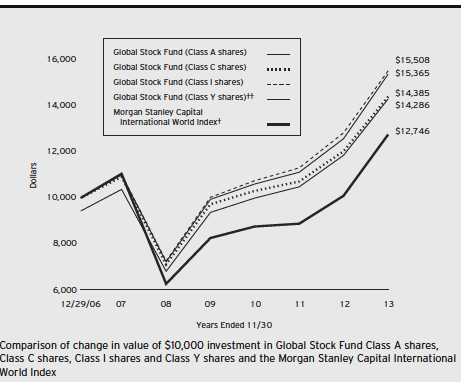
| |
| † | Source: Lipper Inc. |
| †† | The total return figures presented for ClassY shares of the fund reflect the performance of the fund’s Class A shares |
| | for the period prior to 7/1/13 (the inception date for ClassY shares). |
Past performance is not predictive of future performance.
The above graph compares a $10,000 investment made in each of the Class A, Class C, Class I and ClassY shares of Global Stock Fund on 12/29/06 (inception date) to a $10,000 investment made in the Morgan Stanley Capital International World Index (the “Index”) on that date. All dividends and capital gain distributions are reinvested.
On April 29, 2013, the Board authorized the fund to offer ClassY shares, as a new class of shares, to certain investors, including certain institutional investors. On July 1, 2013, ClassY shares were offered at net asset value and are not subject to certain fees, including Distribution Plan and Shareholder Services Plan fees.
The fund’s performance shown in the line graph above takes into account the maximum initial sales charge on Class A shares and all other applicable fees and expenses on all classes.The Index is an unmanaged index of global stock market performance, including the United States, Canada, Australia, New Zealand and the Far East and includes net dividends reinvested. Unlike a mutual fund, the Index is not subject to charges, fees and other expenses. Investors cannot invest directly in any index. Further information relating to fund performance, including expense reimbursements, if applicable, is contained in the Financial Highlights section of the prospectus and elsewhere in this report.
6
| | | | | | | |
| Average Annual Total Returns as of 11/30/13 | | | | | | |
| |
| | Inception | | | | | From | |
| | Date | 1 Year | | 5 Years | | Inception | |
| Class A shares | | | | | | | |
| with maximum sales charge (5.75%) | 12/29/06 | 13.64 | % | 14.63 | % | 5.29 | % |
| without sales charge | 12/29/06 | 20.60 | % | 15.99 | % | 6.19 | % |
| Class C shares | | | | | | | |
| with applicable redemption charge † | 12/29/06 | 18.72 | % | 15.13 | % | 5.40 | % |
| without redemption | 12/29/06 | 19.72 | % | 15.13 | % | 5.40 | % |
| Class I shares | 12/29/06 | 20.93 | % | 16.42 | % | 6.55 | % |
| Class Y shares | 7/1/13 | 22.28 | %†† | 16.31 | %†† | 6.40 | %†† |
| Morgan Stanley Capital | | | | | | | |
| International World Index | 12/31/06 | 26.38 | % | 15.27 | % | 3.57 | % |
Past performance is not predictive of future performance.The fund’s performance shown in the graph and table does not reflect the deduction of taxes that a shareholder would pay on fund distributions or the redemption of fund shares.
| |
| † | The maximum contingent deferred sales charge for Class C shares is 1% for shares redeemed within one year of the |
| | date of purchase. |
| †† | The total return performance figures presented for ClassY shares of the fund reflect the performance of the fund’s |
| | Class A shares for the period prior to 7/1/13 (the inception date for ClassY shares). |
UNDERSTANDING YOUR FUND’S EXPENSES (Unaudited)
As a mutual fund investor, you pay ongoing expenses, such as management fees and other expenses. Using the information below, you can estimate how these expenses affect your investment and compare them with the expenses of other funds.You also may pay one-time transaction expenses, including sales charges (loads) and redemption fees, which are not shown in this section and would have resulted in higher total expenses. For more information, see your fund’s prospectus or talk to your financial adviser.
Review your fund’s expenses
The table below shows the expenses you would have paid on a $1,000 investment in Global Stock Fund from June 1, 2013 to November 30, 2013. It also shows how much a $1,000 investment would be worth at the close of the period, assuming actual returns and expenses.
Expenses and Value of a $1,000 Investment
assuming actual returns for the six months ended November 30, 2013 †
| | | | | | | | |
| | | Class A | | Class C | | Class I | | Class Y |
| Expenses paid per $1,000†† | $ | 6.54 | $ | 10.52 | $ | 4.80 | $ | 3.96 |
| Ending value (after expenses) | $ | 1,102.80 | $ | 1,098.60 | $ | 1,104.50 | $ | 1,114.00 |
COMPARING YOUR FUND’S EXPENSES
WITH THOSE OF OTHER FUNDS (Unaudited)
Using the SEC’s method to compare expenses
The Securities and Exchange Commission (SEC) has established guidelines to help investors assess fund expenses. Per these guidelines, the table below shows your fund’s expenses based on a $1,000 investment, assuming a hypothetical 5% annualized return. You can use this information to compare the ongoing expenses (but not transaction expenses or total cost) of investing in the fund with those of other funds.All mutual fund shareholder reports will provide this information to help you make this comparison. Please note that you cannot use this information to estimate your actual ending account balance and expenses paid during the period.
Expenses and Value of a $1,000 Investment
assuming a hypothetical 5% annualized return for the six months ended November 30, 2013
| | | | | | | | |
| | | Class A | | Class C | | Class I | | Class Y |
| Expenses paid per $1,000†††† | $ | 6.28 | $ | 10.10 | $ | 4.61 | $ | 4.56 |
| Ending value (after expenses) | $ | 1,018.85 | $ | 1,015.04 | $ | 1,020.51 | $ | 1,020.56 |
| |
| | From July 1, 2013 (commencement of initial offering) to November 30, 2013 for ClassY shares. |
| †† | Expenses are equal to the fund’s annualized expense ratio of 1.24% for Class A, 2.00% for Class C and .91% |
| | for Class I, multiplied by the average account value over the period, multiplied by 183/365 (to reflect the one-half |
| | year period). Expenses are equal to the fund’s annualized expense ratio of .90% for ClassY, multiplied by the |
| | average account value over the period, multiplied by 152/365 (to reflect the actual days in the period). |
| ††† | Please note that while ClassY shares commenced operations on July 1, 2013, the hypothetical expenses paid |
| | during the period reflect projected activity for the full six month period for purposes of comparability.This projection |
| | assumes that annualized expense ratios were in effect during the period June 1, 2013 to November 30, 2013. |
| †††† | Expenses are equal to the fund’s annualized expense ratio of 1.24% for Class A, 2.00% for Class C, .91% for |
| | Class I and .90% for ClassY, multiplied by the average account value over the period, multiplied by 183/365 (to |
| | reflect the one-half year period). |
8
|
| STATEMENT OF INVESTMENTS |
| November 30, 2013 |
| | |
| Common Stocks—97.6% | Shares | Value ($) |
| Australia—3.5% | | |
| CSL | 515,200 | 32,231,654 |
| Woodside Petroleum | 790,000 | 26,894,229 |
| | | 59,125,883 |
| Brazil—1.0% | | |
| Petroleo Brasileiro, ADR | 1,044,300 | 17,272,722 |
| Canada—1.2% | | |
| Suncor Energy | 611,200 | 20,949,512 |
| China—2.9% | | |
| China Shenhua Energy, Cl. H | 4,950,500 | 16,794,235 |
| CNOOC | 15,694,000 | 32,146,935 |
| | | 48,941,170 |
| Denmark—2.1% | | |
| Novo Nordisk, Cl. B | 198,400 | 35,544,092 |
| France—2.9% | | |
| Essilor International | 182,100 | 19,104,738 |
| L’Oreal | 182,300 | 30,505,537 |
| | | 49,610,275 |
| Hong Kong—6.5% | | |
| AIA Group | 7,017,000 | 35,571,277 |
| China Mobile | 2,855,500 | 30,755,590 |
| CLP Holdings | 1,301,000 | 10,664,691 |
| Hong Kong & China Gas | 14,047,434 | 33,122,920 |
| | | 110,114,478 |
| Japan—11.4% | | |
| Chugai Pharmaceutical | 371,100 | 8,856,845 |
| Denso | 512,700 | 25,673,786 |
| FANUC | 201,200 | 33,859,027 |
| Honda Motor | 825,400 | 34,886,837 |
| Keyence | 33,557 | 13,479,140 |
| Komatsu | 1,357,500 | 28,211,406 |
| Mitsubishi Estate | 587,000 | 16,295,846 |
| Shin-Etsu Chemical | 559,400 | 32,326,107 |
| | | 193,588,994 |
| Singapore—1.9% | | |
| DBS Group Holdings | 2,390,369 | 32,726,254 |
STATEMENT OF INVESTMENTS (continued)
| | | |
| Common Stocks (continued) | Shares | | Value ($) |
| Spain—2.1% | | | |
| Inditex | 226,000 | | 36,037,041 |
| Sweden—2.2% | | | |
| Hennes & Mauritz, Cl. B | 861,000 | | 36,491,116 |
| Switzerland—8.1% | | | |
| Nestle | 453,700 | | 33,136,518 |
| Novartis | 150,700 | | 11,912,682 |
| Roche Holding | 128,700 | | 35,880,947 |
| SGS | 5,000 | | 11,269,859 |
| Swatch Group-BR | 23,400 | | 15,334,951 |
| Syngenta | 76,400 | | 30,007,061 |
| | | | 137,542,018 |
| Taiwan—2.0% | | | |
| Taiwan Semiconductor Manufacturing, ADR | 1,932,800 | | 34,268,544 |
| United Kingdom—9.5% | | | |
| BG Group | 1,678,000 | | 34,280,480 |
| HSBC Holdings | 2,834,000 | | 31,621,825 |
| Reckitt Benckiser Group | 435,700 | | 34,998,303 |
| Standard Chartered | 1,319,000 | | 31,262,931 |
| Tesco | 5,322,000 | | 30,301,080 |
| | | | 162,464,619 |
| United States—40.3% | | | |
| Adobe Systems | 678,900 | a | 38,547,942 |
| Amphenol, Cl. A | 165,400 | | 14,059,000 |
| Automatic Data Processing | 422,900 | | 33,840,458 |
| C.R. Bard | 79,700 | | 11,068,736 |
| Cisco Systems | 1,258,100 | | 26,734,625 |
| Colgate-Palmolive | 517,800 | | 34,076,418 |
| EOG Resources | 200,500 | | 33,082,500 |
| Fastenal | 210,000 | | 9,771,300 |
| Google, Cl. A | 35,400 | a | 37,509,486 |
| Intuitive Surgical | 42,600 | a | 16,055,940 |
| Johnson & Johnson | 341,000 | | 32,279,060 |
| MasterCard, Cl. A | 49,200 | | 37,431,852 |
| Microsoft | 967,600 | | 36,894,588 |
| NIKE, Cl. B | 490,600 | | 38,826,084 |
| Oracle | 950,200 | | 33,532,558 |
| Praxair | 260,500 | | 32,890,730 |
10
| | | |
| Common Stocks (continued) | Shares | | Value ($) |
| United States (continued) | | | |
| Precision Castparts | 139,500 | | 36,053,775 |
| QUALCOMM | 458,600 | | 33,743,788 |
| Schlumberger | 379,500 | | 33,555,390 |
| Sigma-Aldrich | 166,400 | | 14,350,336 |
| Stryker | 448,300 | | 33,362,486 |
| The TJX Companies | 564,100 | | 35,470,608 |
| Wal-Mart Stores | 417,800 | | 33,845,978 |
| | | | 686,983,638 |
| Total Common Stocks | | | |
| (cost $1,303,015,508) | | | 1,661,660,356 |
| |
| Other Investment—2.2% | | | |
| Registered Investment Company; | | | |
| Dreyfus Institutional Preferred | | | |
| Plus Money Market Fund | | | |
| (cost $38,300,000) | 38,300,000 | b | 38,300,000 |
| Total Investments (cost $1,341,315,508) | 99.8 | % | 1,699,960,356 |
| Cash and Receivables (Net) | .2 | % | 3,364,157 |
| Net Assets | 100.0 | % | 1,703,324,513 |
| |
| ADR—American Depository Receipts |
| BR—Bearer Certificate |
| a | Non-income producing security. |
| b | Investment in affiliated money market mutual fund. |
| | | |
| Portfolio Summary (Unaudited)† | | |
| |
| | Value (%) | | Value (%) |
| Information Technology | 20.0 | Industrial | 7.0 |
| Health Care | 13.9 | Materials | 6.4 |
| Consumer Discretionary | 13.1 | Utilities | 2.6 |
| Energy | 12.6 | Money Market Investment | 2.2 |
| Consumer Staples | 11.5 | Telecommunication Services | 1.8 |
| Financial | 8.7 | | 99.8 |
|
| † Based on net assets. |
| See notes to financial statements. |
|
| STATEMENT OF ASSETS AND LIABILITIES |
| November 30, 2013 |
| | | | | |
| | | | Cost | Value | |
| Assets ($): | | | | | |
| Investments in securities—See Statement of Investments: | | | |
| Unaffiliated issuers | | | 1,303,015,508 1,661,660,356 | |
| Affiliated issuers | | | 38,300,000 | 38,300,000 | |
| Cash | | | | 500,098 | |
| Cash denominated in foreign currencies | | 737,146 | 733,986 | |
| Dividends receivable | | | | 2,513,228 | |
| Receivable for shares of Common Stock subscribed | | | 1,312,963 | |
| Prepaid expenses | | | | 73,898 | |
| | | | 1,705,094,529 | |
| Liabilities ($): | | | | | |
| Due to The Dreyfus Corporation and affiliates—Note 3(c) | | 1,342,380 | |
| Payable for shares of Common Stock redeemed | | | 205,703 | |
| Accrued expenses | | | | 221,933 | |
| | | | | 1,770,016 | |
| Net Assets ($) | | | 1,703,324,513 | |
| Composition of Net Assets ($): | | | | | |
| Paid-in capital | | | 1,333,154,689 | |
| Accumulated undistributed investment income—net | | | 13,734,250 | |
| Accumulated net realized gain (loss) on investments | | | (2,228,523 | ) |
| Accumulated net unrealized appreciation (depreciation) | | | |
| on investments and foreign currency transactions | | | 358,664,097 | |
| Net Assets ($) | | | 1,703,324,513 | |
| |
| |
| Net Asset Value Per Share | | | | | |
| | Class A | Class C | Class I | Class Y | |
| Net Assets ($) | 89,024,040 | 23,543,015 | 1,567,608,039 | 23,149,419 | |
| Shares Outstanding | 4,939,637 | 1,337,129 | 85,751,924 | 1,267,093 | |
| Net Asset Value Per Share ($) | 18.02 | 17.61 | 18.28 | 18.27 | |
| |
| See notes to financial statements. | | | | | |
12
|
| STATEMENT OF OPERATIONS |
| Year Ended November 30, 2013 |
| | |
| Investment Income ($): | | |
| Income: | | |
| Cash dividends (net of $1,572,645 foreign taxes withheld at source): | | |
| Unaffiliated issuers | 26,459,843 | |
| Affiliated issuers | 36,026 | |
| Interest | 13,244 | |
| Total Income | 26,509,113 | |
| Expenses: | | |
| Management fee—Note 3(a) | 11,110,680 | |
| Shareholder servicing costs—Note 3(c) | 431,344 | |
| Custodian fees—Note 3(c) | 262,364 | |
| Registration fees | 152,090 | |
| Distribution fees—Note 3(b) | 143,618 | |
| Professional fees | 99,723 | |
| Directors’ fees and expenses—Note 3(d) | 93,562 | |
| Prospectus and shareholders’ reports | 20,274 | |
| Loan commitment fees—Note 2 | 12,518 | |
| Miscellaneous | 50,081 | |
| Total Expenses | 12,376,254 | |
| Less—reduction in fees due to earnings credits—Note 3(c) | (71 | ) |
| Net Expenses | 12,376,183 | |
| Investment Income—Net | 14,132,930 | |
| Realized and Unrealized Gain (Loss) on Investments—Note 4 ($): | | |
| Net realized gain (loss) on investments and foreign currency transactions | 3,590,507 | |
| Net realized gain (loss) on forward foreign currency exchange contracts | (701,339 | ) |
| Net Realized Gain (Loss) | 2,889,168 | |
| Net unrealized appreciation (depreciation) on | | |
| investments and foreign currency transactions | 226,811,107 | |
| Net Realized and Unrealized Gain (Loss) on Investments | 229,700,275 | |
| Net Increase in Net Assets Resulting from Operations | 243,833,205 | |
| |
| See notes to financial statements. | | |
STATEMENT OF CHANGES IN NET ASSETS
| | | | |
| | Year Ended November 30, | |
| | 2013 | a | 2012 | |
| Operations ($): | | | | |
| Investment income—net | 14,132,930 | | 6,765,358 | |
| Net realized gain (loss) on investments | 2,889,168 | | (1,806,095 | ) |
| Net unrealized appreciation | | | | |
| (depreciation) on investments | 226,811,107 | | 73,510,804 | |
| Net Increase (Decrease) in Net Assets | | | | |
| Resulting from Operations | 243,833,205 | | 78,470,067 | |
| Dividends to Shareholders from ($): | | | | |
| Investment income—net: | | | | |
| Class A | (320,140 | ) | (361,165 | ) |
| Class C | — | | (5,282 | ) |
| Class I | (6,883,220 | ) | (5,003,982 | ) |
| Net realized gain on investments: | | | | |
| Class A | — | | (446,761 | ) |
| Class C | — | | (130,675 | ) |
| Class I | — | | (4,313,537 | ) |
| Total Dividends | (7,203,360 | ) | (10,261,402 | ) |
| Capital Stock Transactions ($): | | | | |
| Net proceeds from shares sold: | | | | |
| Class A | 35,004,750 | | 25,765,348 | |
| Class C | 6,888,808 | | 3,753,627 | |
| Class I | 818,048,770 | | 281,322,507 | |
| Class Y | 23,098,999 | | — | |
| Dividends reinvested: | | | | |
| Class A | 309,658 | | 778,549 | |
| Class C | — | | 91,613 | |
| Class I | 4,696,246 | | 4,912,548 | |
| Cost of shares redeemed: | | | | |
| Class A | (21,347,106 | ) | (19,549,231 | ) |
| Class C | (2,640,193 | ) | (3,380,751 | ) |
| Class I | (143,116,756 | ) | (151,541,785 | ) |
| Increase (Decrease) in Net Assets | | | | |
| from Capital Stock Transactions | 720,943,176 | | 142,152,425 | |
| Total Increase (Decrease) in Net Assets | 957,573,021 | | 210,361,090 | |
| Net Assets ($): | | | | |
| Beginning of Period | 745,751,492 | | 535,390,402 | |
| End of Period | 1,703,324,513 | | 745,751,492 | |
| Undistributed investment income—net | 13,734,250 | | 6,631,320 | |
14
| | | | |
| | Year Ended November 30, | |
| | 2013 | a | 2012 | |
| Capital Share Transactions: | | | | |
| Class Ab | | | | |
| Shares sold | 2,125,139 | | 1,825,152 | |
| Shares issued for dividends reinvested | 20,095 | | 59,567 | |
| Shares redeemed | (1,319,501 | ) | (1,387,430 | ) |
| Net Increase (Decrease) in Shares Outstanding | 825,733 | | 497,289 | |
| Class Cb | | | | |
| Shares sold | 421,400 | | 270,088 | |
| Shares issued for dividends reinvested | — | | 7,107 | |
| Shares redeemed | (163,680 | ) | (245,232 | ) |
| Net Increase (Decrease) in Shares Outstanding | 257,720 | | 31,963 | |
| Class I | | | | |
| Shares sold | 50,129,888 | | 19,533,004 | |
| Shares issued for dividends reinvested | 301,235 | | 371,881 | |
| Shares redeemed | (8,528,852 | ) | (10,561,836 | ) |
| Net Increase (Decrease) in Shares Outstanding | 41,902,271 | | 9,343,049 | |
| Class Y | | | | |
| Shares sold | 1,267,093 | | — | |
|
| a Effective July 1, 2013, the fund commenced offering ClassY shares. |
| b During the period ended November 30, 2013, 10,068 Class C shares representing $168,940 were exchanged for |
| 9,874 Class A shares. |
See notes to financial statements.
FINANCIAL HIGHLIGHTS
The following tables describe the performance for each share class for the fiscal periods indicated. All information (except portfolio turnover rate) reflects financial results for a single fund share.Total return shows how much your investment in the fund would have increased (or decreased) during each period, assuming you had reinvested all dividends and distributions.These figures have been derived from the fund’s financial statements.
| | | | | | | | | | |
| | | | Year Ended November 30, | | | |
| Class A Shares | 2013 | | 2012 | | 2011 | | 2010 | | 2009 | |
| Per Share Data ($): | | | | | | | | | | |
| Net asset value, beginning of period | 15.02 | | 13.51 | | 12.99 | | 12.23 | | 8.91 | |
| Investment Operations: | | | | | | | | | | |
| Investment income—neta | .13 | | .11 | | .11 | | .07 | | .06 | |
| Net realized and unrealized | | | | | | | | | | |
| gain (loss) on investments | 2.95 | | 1.62 | | .52 | | .75 | | 3.28 | |
| Total from Investment Operations | 3.08 | | 1.73 | | .63 | | .82 | | 3.34 | |
| Distributions: | | | | | | | | | | |
| Dividends from investment income—net | (.08 | ) | (.10 | ) | (.07 | ) | (.06 | ) | (.02 | ) |
| Dividends from net realized | | | | | | | | | | |
| gain on investments | — | | (.12 | ) | (.04 | ) | — | | — | |
| Total Distributions | (.08 | ) | (.22 | ) | (.11 | ) | (.06 | ) | (.02 | ) |
| Net asset value, end of period | 18.02 | | 15.02 | | 13.51 | | 12.99 | | 12.23 | |
| Total Return (%)b | 20.60 | | 13.08 | | 4.86 | | 6.70 | | 37.57 | |
| Ratios/Supplemental Data (%): | | | | | | | | | | |
| Ratio of total expenses | | | | | | | | | | |
| to average net assets | 1.24 | | 1.28 | | 1.27 | | 1.32 | | 1.38 | |
| Ratio of net expenses | | | | | | | | | | |
| to average net assets | 1.24 | | 1.28 | | 1.27 | | 1.32 | | 1.38 | |
| Ratio of net investment income | | | | | | | | | | |
| to average net assets | .76 | | .80 | | .80 | | .56 | | .53 | |
| Portfolio Turnover Rate | 6.39 | | 6.05 | | 8.54 | | 7.50 | | 12.75 | |
| Net Assets, end of period ($ x 1,000) | 89,024 | | 61,806 | | 48,872 | | 37,152 | | 8,212 | |
| |
| a | Based on average shares outstanding at each month end. |
| b | Exclusive of sales charge. |
See notes to financial statements.
16
| | | | | | | | | | |
| | | | Year Ended November 30, | | | |
| Class C Shares | 2013 | | 2012 | | 2011 | | 2010 | | 2009 | |
| Per Share Data ($): | | | | | | | | | | |
| Net asset value, beginning of period | 14.71 | | 13.24 | | 12.78 | | 12.07 | | 8.83 | |
| Investment Operations: | | | | | | | | | | |
| Investment income (loss)—neta | .00 | b | .01 | | .01 | | (.02 | ) | (.01 | ) |
| Net realized and unrealized | | | | | | | | | | |
| gain (loss) on investments | 2.90 | | 1.59 | | .50 | | .73 | | 3.25 | |
| Total from Investment Operations | 2.90 | | 1.60 | | .51 | | .71 | | 3.24 | |
| Distributions: | | | | | | | | | | |
| Dividends from investment income—net | — | | (.01 | ) | (.01 | ) | (.00 | )b | — | |
| Dividends from net realized | | | | | | | | | | |
| gain on investments | — | | (.12 | ) | (.04 | ) | — | | — | |
| Total Distributions | — | | (.13 | ) | (.05 | ) | (.00 | )b | — | |
| Net asset value, end of period | 17.61 | | 14.71 | | 13.24 | | 12.78 | | 12.07 | |
| Total Return (%)c | 19.72 | | 12.21 | | 4.01 | | 5.90 | | 36.69 | |
| Ratios/Supplemental Data (%): | | | | | | | | | | |
| Ratio of total expenses | | | | | | | | | | |
| to average net assets | 2.01 | | 2.05 | | 2.03 | | 2.09 | | 2.12 | |
| Ratio of net expenses | | | | | | | | | | |
| to average net assets | 2.01 | | 2.05 | | 2.03 | | 2.09 | | 2.09 | |
| Ratio of net investment income | | | | | | | | | | |
| (loss) to average net assets | .00 | d | .05 | | .05 | | (.17 | ) | (.11 | ) |
| Portfolio Turnover Rate | 6.39 | | 6.05 | | 8.54 | | 7.50 | | 12.75 | |
| Net Assets, end of period ($ x 1,000) | 23,543 | | 15,883 | | 13,872 | | 10,243 | | 1,873 | |
| |
| a | Based on average shares outstanding at each month end. |
| b | Amount represents less than $.01 per share. |
| c | Exclusive of sales charge. |
| d | Amount represents less than .01%. |
See notes to financial statements.
FINANCIAL HIGHLIGHTS (continued)
| | | | | | | | | | |
| | | | Year Ended November 30, | | | |
| Class I Shares | 2013 | | 2012 | | 2011 | | 2010 | | 2009 | |
| Per Share Data ($): | | | | | | | | | | |
| Net asset value, beginning of period | 15.24 | | 13.70 | | 13.15 | | 12.36 | | 8.99 | |
| Investment Operations: | | | | | | | | | | |
| Investment income—neta | .19 | | .16 | | .16 | | .12 | | .11 | |
| Net realized and unrealized | | | | | | | | | | |
| gain (loss) on investments | 2.98 | | 1.64 | | .53 | | .76 | | 3.31 | |
| Total from Investment Operations | 3.17 | | 1.80 | | .69 | | .88 | | 3.42 | |
| Distributions: | | | | | | | | | | |
| Dividends from investment income—net | (.13 | ) | (.14 | ) | (.10 | ) | (.09 | ) | (.05 | ) |
| Dividends from net realized | | | | | | | | | | |
| gain on investments | — | | (.12 | ) | (.04 | ) | — | | — | |
| Total Distributions | (.13 | ) | (.26 | ) | (.14 | ) | (.09 | ) | (.05 | ) |
| Net asset value, end of period | 18.28 | | 15.24 | | 13.70 | | 13.15 | | 12.36 | |
| Total Return (%) | 20.93 | | 13.49 | | 5.23 | | 7.12 | | 38.22 | |
| Ratios/Supplemental Data (%): | | | | | | | | | | |
| Ratio of total expenses | | | | | | | | | | �� |
| to average net assets | .91 | | .93 | | .93 | | .96 | | .99 | |
| Ratio of net expenses | | | | | | | | | | |
| to average net assets | .91 | | .93 | | .93 | | .96 | | .99 | |
| Ratio of net investment income | | | | | | | | | | |
| to average net assets | 1.12 | | 1.14 | | 1.13 | | .94 | | 1.05 | |
| Portfolio Turnover Rate | 6.39 | | 6.05 | | 8.54 | | 7.50 | | 12.75 | |
| Net Assets, end of period ($ x 1,000) | 1,567,608 | | 668,063 | | 472,646 | | 364,688 | | 263,694 | |
| |
| a Based on average shares outstanding at each month end. | | | | | | | | | |
| See notes to financial statements. | | | | | | | | | | |
18
| |
| | Period Ended |
| Class Y Shares | November 30, 2013 a |
| Per Share Data ($): | |
| Net asset value, beginning of period | 16.40 |
| Investment Operations: | |
| Investment income—netb | .01 |
| Net realized and unrealized gain (loss) on investments | 1.86 |
| Total from Investment Operations | 1.87 |
| Net asset value, end of period | 18.27 |
| Total Return (%)c | 11.40 |
| Ratios/Supplemental Data (%): | |
| Ratio of total expenses to average net assetsd | .90 |
| Ratio of net expenses to average net assetsd | .90 |
| Ratio of net investment income | |
| to average net assetsd | .83 |
| Portfolio Turnover Rate | 6.39 |
| Net Assets, end of period ($ x 1,000) | 23,149 |
| |
| a | From July 1, 2013 (commencement of initial offering) to November 30, 2013. |
| b | Based on average shares outstanding at each month end. |
| c | Not annualized. |
| d | Annualized. |
See notes to financial statements.
NOTES TO FINANCIAL STATEMENTS
NOTE 1—Significant Accounting Policies:
Global Stock Fund (the “fund”) is a separate diversified series of Strategic Funds, Inc. (the “Company”), which is registered under the Investment Company Act of 1940, as amended (the “Act”), as an open-end management investment company and operates as a series company currently offering nine series, including the fund.The fund’s investment objective is to seek long-term total return. The Dreyfus Corporation (the “Manager” or “Dreyfus”), a wholly-owned subsidiary of The Bank of NewYork Mellon Corporation (“BNY Mellon”), serves as the fund’s investment adviser.Walter Scott & Partners Limited (“Walter Scott”), a subsidiary of BNY Mellon and an affiliate of Dreyfus, serves as the fund’s sub-investment adviser.
At a meeting held on April 29, 2013, the Company’s Board of Directors (the “Board”) approved, effective July 1, 2013: (a) for the fund to offer Class Y shares; and, (b) an increase in the authorized shares of the fund from 300 million to 400 million and authorized 100 million Class Y shares. At a meeting held on September 25, 2013, the Board approved to increase the authorized shares of the fund from 400 million to 500 million and increase Class I shares from 100 million to 200 million.
MBSC Securities Corporation (the “Distributor”), a wholly-owned subsidiary of Dreyfus, is the distributor of the fund’s shares.The fund is authorized to issue 500 million shares of $.001 par value Common Stock.The fund currently offers four classes of shares: Class A (100 million shares authorized), Class C (100 million shares authorized), Class I (200 million shares authorized) and Class Y (100 million shares authorized). Class A shares generally are subject to a sales charge imposed at the time of purchase. Class C shares are subject to a contingent deferred sales charge (“CDSC”) on Class C shares redeemed within one year of purchase. Class I and ClassY shares are offered at net asset value generally to institutional investors. Other differences between the classes include the services offered to and the expenses borne by each class, the allocation of certain transfer agency costs and certain voting rights. Income, expenses (other than expenses attributable to a specific class),
20
and realized and unrealized gains or losses on investments are allocated to each class of shares based on its relative net assets.
As of November 30, 2013, MBC Investments Corp., an indirect subsidiary of BNY Mellon, held all of the outstanding Class Y shares of the fund.
The Company accounts separately for the assets, liabilities and operations of each series. Expenses directly attributable to each series are charged to that series’ operations; expenses which are applicable to all series are allocated among them on a pro rata basis.
The Financial Accounting Standards Board (“FASB”) Accounting Standards Codification is the exclusive reference of authoritative U.S. generally accepted accounting principles (“GAAP”) recognized by the FASB to be applied by nongovernmental entities. Rules and interpretive releases of the Securities and Exchange Commission (“SEC”) under authority of federal laws are also sources of authoritative GAAP for SEC registrants. The fund’s financial statements are prepared in accordance with GAAP, which may require the use of management estimates and assumptions.Actual results could differ from those estimates.
The Company enters into contracts that contain a variety of indemnifications. The fund’s maximum exposure under these arrangements is unknown.The fund does not anticipate recognizing any loss related to these arrangements.
(a) Portfolio valuation: The fair value of a financial instrument is the amount that would be received to sell an asset or paid to transfer a liability in an orderly transaction between market participants at the measurement date (i.e., the exit price). GAAP establishes a fair value hierarchy that prioritizes the inputs of valuation techniques used to measure fair value. This hierarchy gives the highest priority to unadjusted quoted prices in active markets for identical assets or liabilities (Level 1 measurements) and the lowest priority to unobservable inputs (Level 3 measurements).
NOTES TO FINANCIAL STATEMENTS (continued)
Additionally, GAAP provides guidance on determining whether the volume and activity in a market has decreased significantly and whether such a decrease in activity results in transactions that are not orderly. GAAP requires enhanced disclosures around valuation inputs and techniques used during annual and interim periods.
Various inputs are used in determining the value of the fund’s investments relating to fair value measurements.These inputs are summarized in the three broad levels listed below:
Level 1—unadjusted quoted prices in active markets for identical investments.
Level 2—other significant observable inputs (including quoted prices for similar investments, interest rates, prepayment speeds, credit risk, etc.).
Level 3—significant unobservable inputs (including the fund’s own assumptions in determining the fair value of investments).
The inputs or methodology used for valuing securities are not necessarily an indication of the risk associated with investing in those securities.
Changes in valuation techniques may result in transfers in or out of an assigned level within the disclosure hierarchy. Valuation techniques used to value the fund’s investments are as follows:
Investments in securities are valued at the last sales price on the securities exchange or national securities market on which such securities are primarily traded. Securities listed on the National Market System for which market quotations are available are valued at the official closing price or, if there is no official closing price that day, at the last sales price. Securities not listed on an exchange or the national securities market, or securities for which there were no transactions, are valued at the average of the most recent bid and asked prices, except for open short positions, where the asked price is used for valuation purposes. Bid price is used when no asked price is available. Registered invest-
22
ment companies that are not traded on an exchange are valued at their net asset value. All of the preceding securities are categorized within Level 1 of the fair value hierarchy.
Fair valuing of securities may be determined with the assistance of a pricing service using calculations based on indices of domestic securities and other appropriate indicators, such as prices of relevant ADRs and financial futures. Utilizing these techniques may result in transfers between Level 1 and Level 2 of the fair value hierarchy.
When market quotations or official closing prices are not readily available, or are determined not to reflect accurately fair value, such as when the value of a security has been significantly affected by events after the close of the exchange or market on which the security is principally traded (for example, a foreign exchange or market), but before the fund calculates its net asset value, the fund may value these investments at fair value as determined in accordance with the procedures approved by the Board. Certain factors may be considered when fair valuing investments such as: fundamental analytical data, the nature and duration of restrictions on disposition, an evaluation of the forces that influence the market in which the securities are purchased and sold, and public trading in similar securities of the issuer or comparable issuers. These securities are either categorized within Level 2 or 3 of the fair value hierarchy depending on the relevant inputs used.
For restricted securities where observable inputs are limited, assumptions about market activity and risk are used and are categorized within Level 3 of the fair value hierarchy.
Investments denominated in foreign currencies are translated to U.S. dollars at the prevailing rates of exchange.
Forward foreign currency exchange contracts (“forward contracts”) are valued at the forward rate and are generally categorized within Level 2 of the fair value hierarchy.
NOTES TO FINANCIAL STATEMENTS (continued)
The following is a summary of the inputs used as of November 30, 2013 in valuing the fund’s investments:
| | | | |
| | | Level 2—Other | Level 3— | |
| | Level 1— | Significant | Significant | |
| | Unadjusted | Observable | Unobservable | |
| | Quoted Prices | Inputs | Inputs | Total |
| Assets ($) | | | | |
| Investments in Securities: | | | |
| Equity Securities— | | | | |
| Domestic | | | | |
| Common Stocks† | 686,983,638 | — | — | 686,983,638 |
| Equity Securities— | | | | |
| Foreign | | | | |
| Common Stocks† | 974,676,718 | — | — | 974,676,718 |
| Mutual Funds | 38,300,000 | — | — | 38,300,000 |
| |
| † See Statement of Investments for additional detailed categorizations. | |
At November 30, 2013, there were no transfers between Level 1 and Level 2 of the fair value hierarchy.
(b) Foreign currency transactions: The fund does not isolate that portion of the results of operations resulting from changes in foreign exchange rates on investments from the fluctuations arising from changes in the market prices of securities held. Such fluctuations are included with the net realized and unrealized gain or loss on investments.
Net realized foreign exchange gains or losses arise from sales of foreign currencies, currency gains or losses realized on securities transactions between trade and settlement date, and the difference between the amounts of dividends, interest and foreign withholding taxes recorded on the fund’s books and the U.S. dollar equivalent of the amounts actually received or paid. Net unrealized foreign exchange gains and losses arise from changes in the value of assets and liabilities other than investments resulting from changes in exchange rates. Foreign currency gains and losses on foreign currency transactions are also included with net realized and unrealized gain or loss on investments.
(c) Securities transactions and investment income: Securities transactions are recorded on a trade date basis. Realized gains and losses from
24
securities transactions are recorded on the identified cost basis. Dividend income is recognized on the ex-dividend date and interest income, including, where applicable, accretion of discount and amortization of premium on investments, is recognized on the accrual basis.
(d) Affiliated issuers: Investments in other investment companies advised by Dreyfus are defined as “affiliated” under the Act. Investments in affiliated investment companies during the period ended November 30, 2013 were as follows:
| | | | | |
| Affiliated | | | | | |
| Investment | Value | | | Value | Net |
| Company | 11/30/2012 ($) | Purchases ($) | Sales ($) | 11/30/2013 ($) | Assets (%) |
| Dreyfus | | | | | |
| Institutional | | | | | |
| Preferred | | | | | |
| Plus Money | | | | | |
| Market | | | | | |
| Fund | 15,460,000 | 769,905,000 | 747,065,000 | 38,300,000 | 2.2 |
(e) Risk: Investing in foreign markets may involve special risks and considerations not typically associated with investing in the U.S.These risks include revaluation of currencies, high rates of inflation, repatriation restrictions on income and capital, and adverse political and economic developments. Moreover, securities issued in these markets may be less liquid, subject to government ownership controls and delayed settlements, and their prices may be more volatile than those of comparable securities in the U.S.
(f) Dividends to shareholders: Dividends are recorded on the ex-dividend date. Dividends from investment income-net and dividends from net realized capital gains, if any, are normally declared and paid annually, but the fund may make distributions on a more frequent basis to comply with the distribution requirements of the Internal Revenue Code of 1986, as amended (the “Code”).To the extent that net realized capital gains can be offset by capital loss carryovers, it is the policy of the fund not to distribute such gains. Income and capital gain distributions are determined in accordance with income tax regulations, which may differ from GAAP.
NOTES TO FINANCIAL STATEMENTS (continued)
(g) Federal income taxes: It is the policy of the fund to continue to qualify as a regulated investment company, if such qualification is in the best interests of its shareholders, by complying with the applicable provisions of the Code, and to make distributions of taxable income sufficient to relieve it from substantially all federal income and excise taxes.
As of and during the period ended November 30, 2013, the fund did not have any liabilities for any uncertain tax positions.The fund recognizes interest and penalties, if any, related to uncertain tax positions as income tax expense in the Statement of Operations. During the period ended November 30, 2013, the fund did not incur any interest or penalties.
Each tax year in the four-year period ended November 30, 2013 remains subject to examination by the Internal Revenue Service and state taxing authorities.
At November 30, 2013, the components of accumulated earnings on a tax basis were as follows: undistributed ordinary income $13,734,250, accumulated capital losses $2,035,266 and unrealized appreciation $358,470,840.
Under the Regulated Investment Company Modernization Act of 2010 (the “2010 Act”), the fund is permitted to carry forward capital losses incurred in taxable years beginning after December 22, 2010 (“post-enactment losses”) for an unlimited period. Furthermore, post-enactment capital loss carryovers retain their character as either short-term or long-term capital losses rather than short-term as they were under previous statute.
The accumulated capital loss carryover is available for federal income tax purposes to be applied against future net realized capital gains, if any, realized subsequent to November 30, 2013. The fund has $2,035,266 of post-enactment long-term capital losses which can be carried forward for an unlimited period.
The tax character of distributions paid to shareholders during the fiscal periods ended November 30, 2013 and November 30, 2012 were as
26
follows: ordinary income $7,203,360 and $7,714,574, and long-term capital gains $0 and $2,546,828, respectively.
During the period ended November 30, 2013, as a result of permanent book to tax differences, primarily due to the tax treatment for foreign currency gains and losses, the fund increased accumulated undistributed investment income-net by $173,360 and decreased accumulated net realized gain (loss) on investments by the same amount. Net assets and net asset value per share were not affected by this reclassification.
(h) Accounting Pronouncement: In January 2013, FASB issued Accounting Standards Update No. 2013-01 (“ASU 2013-01”), “Clarifying the Scope of Disclosures about Offsetting Assets and Liabilities”, which replaced Accounting Standards Update No. 2011-11 (“ASU 2011-11”), “Disclosures about Offsetting Assets and Liabilities”. ASU 2013-01 is effective for fiscal years beginning on or after January 1, 2013, and interim periods within those annual periods.ASU 2011-11 was intended to enhance disclosure requirements on the offsetting of financial assets and liabilities.ASU 2013-01 limits the scope of the new balance sheet offsetting disclosures to derivatives, repurchase agreements, and securities lending transactions to the extent that they are (1) offset in the financial statements or (2) subject to enforceable master netting arrangements (“MNA”) or similar agreements. Management is currently evaluating the application of ASU 2013-01 and its impact on the fund’s financial statements.
NOTE 2—Bank Lines of Credit:
The fund participates with other Dreyfus-managed funds in a $265 million unsecured credit facility led by Citibank, N.A. and a $300 million unsecured credit facility provided by The Bank of New York Mellon, a subsidiary of BNY Mellon and an affiliate of Dreyfus (each, a “Facility”), each to be utilized primarily for temporary or emergency purposes, including the financing of redemptions. Prior to October 9, 2013, the unsecured credit facility with Citibank, N.A. was $210 million. In con-
NOTES TO FINANCIAL STATEMENTS (continued)
nection therewith, the fund has agreed to pay its pro rata portion of commitment fees for each Facility. Interest is charged to the fund based on rates determined pursuant to the terms of the respective Facility at the time of borrowing. During the period ended November 30, 2013, the fund did not borrow under the Facilities.
NOTE 3—Management Fee, Sub-Investment Advisory Fee and Other Transactions With Affiliates:
(a) Pursuant to a management agreement with Dreyfus, the management fee is computed at the annual rate of .85% of the value of the fund’s average daily net assets and is payable monthly.
Pursuant to a sub-investment advisory agreement between Dreyfus and Walter Scott, Dreyfus pays Walter Scott a monthly fee at an annual percentage of the value of the fund’s average daily net assets.
During the period ended November 30, 2013, the Distributor retained $17,066 from commissions earned on sales of the fund’s Class A shares and $1,766 from CDSCs on redemptions of the fund’s Class C shares.
(b) Under the Distribution Plan adopted pursuant to Rule 12b-1 under the Act, Class C shares pay the Distributor for distributing its shares at an annual rate of .75% of the value of its average daily net assets. During the period ended November 30, 2013, Class C shares were charged $143,618, pursuant to the Distribution Plan.
(c) Under the Shareholder Services Plan, Class A and Class C shares pay the Distributor at an annual rate of .25% of the value of their average daily net assets for the provision of certain services.The services provided may include personal services relating to shareholder accounts, such as answering shareholder inquiries regarding the fund and providing reports and other information, and services related to the maintenance of shareholder accounts.The Distributor may make payments to Service Agents (securities dealers, financial institutions or other industry professionals) with respect to these services.The Distributor determines the amounts to
28
be paid to Service Agents. During the period ended November 30, 2013, Class A and Class C shares were charged $183,542 and $47,873, respectively, pursuant to the Shareholder Services Plan.
The fund has arrangements with the transfer agent and the custodian whereby the fund may receive earnings credits when positive cash balances are maintained, which are used to offset transfer agency and custody fees. For financial reporting purposes, the fund includes net earnings credits as an expense offset in the Statement of Operations.
The fund compensates DreyfusTransfer, Inc., a wholly-owned subsidiary of Dreyfus, under a transfer agency agreement for providing transfer agency and cash management services for the fund. The majority of transfer agency fees are comprised of amounts paid on a per account basis, while cash management fees are related to fund subscriptions and redemptions. During the period ended November 30, 2013, the fund was charged $16,065 for transfer agency services and $599 for cash management services.These fees are included in Shareholder servicing costs in the Statement of Operations. Cash management fees were partially offset by earnings credits of $71.
The fund compensates The Bank of NewYork Mellon under a custody agreement for providing custodial services for the fund.These fees are determined based on net assets, geographic region and transaction activity. During the period ended November 30, 2013, the fund was charged $262,364 pursuant to the custody agreement.
The fund compensated The Bank of New York Mellon under a cash management agreement that was in effect until September 30, 2013 for performing certain cash management services related to fund subscriptions and redemptions. During the period ended November 30, 2013, the fund was charged $262 pursuant to the cash management agreement, which is included in Shareholder servicing costs in the Statement of Operations.
NOTES TO FINANCIAL STATEMENTS (continued)
During the period ended November 30, 2013, the fund was charged $9,055 for services performed by the Chief Compliance Officer and his staff.
The components of “Due to The Dreyfus Corporation and affiliates” in the Statement of Assets and Liabilities consist of: management fees $1,178,317, Distribution Plan fees $14,202, Shareholder Services Plan fees $22,801, custodian fees $117,605, Chief Compliance Officer fees $3,833 and transfer agency fees $5,622.
(d) Each Board member also serves as a Board member of other funds within the Dreyfus complex. Annual retainer fees and attendance fees are allocated to each fund based on net assets.
NOTE 4—Securities Transactions:
The aggregate amount of purchases and sales of investment securities, excluding short-term securities and forward contracts, during the period ended November 30, 2013, amounted to $784,636,268 and $80,448,871, respectively.
Derivatives: A derivative is a financial instrument whose performance is derived from the performance of another asset. Each type of derivative instrument that was held by the fund during the period ended November 30, 2013 is discussed below.
Forward Foreign Currency Exchange Contracts: The fund enters into forward contracts in order to hedge its exposure to changes in foreign currency exchange rates on its foreign portfolio holdings, to settle foreign currency transactions or as a part of its investment strategy.When executing forward contracts, the fund is obligated to buy or sell a foreign currency at a specified rate on a certain date in the future.With respect to sales of forward contracts, the fund incurs a loss if the value of the contract increases between the date the forward contract is opened and
30
the date the forward contract is closed. The fund realizes a gain if the value of the contract decreases between those dates.With respect to purchases of forward contracts, the fund incurs a loss if the value of the contract decreases between the date the forward contract is opened and the date the forward contract is closed.The fund realizes a gain if the value of the contract increases between those dates.Any realized or unrealized gains or losses which occurred during the period are reflected in the Statement of Operations.The fund is exposed to foreign currency risk as a result of changes in value of underlying financial instruments.The fund is also exposed to credit risk associated with counterparty nonper-formance on these forward contracts, which is generally limited to the unrealized gain on each open contract. At November 30, 2013, there were no forward contracts outstanding.
The following summarizes the average market value of derivatives outstanding during the period ended November 30, 2013:
| |
| | Average Market Value ($) |
| Forward contracts | 10,590,796 |
At November 30, 2013, the cost of investments for federal income tax purposes was $1,341,508,765; accordingly, accumulated net unrealized appreciation on investments was $358,451,591, consisting of $373,243,722 gross unrealized appreciation and $14,792,131 gross unrealized depreciation.
|
| REPORT OF INDEPENDENT REGISTERED |
| PUBLIC ACCOUNTING FIRM |
Shareholders and Board of Directors
Global Stock Fund
We have audited the accompanying statement of assets and liabilities, including the statement of investments, of Global Stock Fund (one of the series comprising Strategic Funds, Inc.) as of November 30, 2013, and the related statement of operations for the year then ended, the statement of changes in net assets for each of the two years in the period then ended, and the financial highlights for each of the periods indicated therein. These financial statements and financial highlights are the responsibility of the Fund’s management. Our responsibility is to express an opinion on these financial statements and financial highlights based on our audits.
We conducted our audits in accordance with the standards of the Public Company Accounting Oversight Board (United States).Those standards require that we plan and perform the audit to obtain reasonable assurance about whether the financial statements and financial highlights are free of material misstatement.We were not engaged to perform an audit of the Fund’s internal control over financial reporting. Our audits included consideration of internal control over financial reporting as a basis for designing audit procedures that are appropriate in the circumstances, but not for the purpose of expressing an opinion on the effectiveness of the Fund’s internal control over financial reporting. Accordingly, we express no such opinion. An audit also includes examining, on a test basis, evidence supporting the amounts and disclosures in the financial statements and financial highlights, assessing the accounting principles used and significant estimates made by management, and evaluating the overall financial statement presentation. Our procedures included confirmation of securities owned as of November 30, 2013 by correspondence with the custodian and others. We believe that our audits provide a reasonable basis for our opinion.
In our opinion, the financial statements and financial highlights referred to above present fairly, in all material respects, the financial position of Global Stock Fund at November 30, 2013, the results of its operations for the year then ended, the changes in its net assets for each of the two years in the period then ended, and the financial highlights for each of the indicated periods, in conformity with U.S. generally accepted accounting principles.

New York, New York
January 27, 2014
32
IMPORTANT TAX INFORMATION (Unaudited)
In accordance with federal tax law, the fund elects to provide each shareholder with their portion of the fund’s foreign taxes paid and the income sourced from foreign countries. Accordingly, the fund hereby reports the following information regarding its fiscal year ended November 30, 2013:
—the total amount of taxes paid to foreign countries was $1,572,645.
—the total amount of income sourced from foreign countries was $20,231,490.
Where required by federal tax law rules, shareholders will receive notification of their proportionate share of foreign taxes paid and foreign sourced income for the 2013 calendar year with Form 1099-DIV which will be mailed in early 2014.
For the fiscal year ended November 30, 2013, certain dividends paid by the fund may be subject to a maximum tax rate of 15%, as provided for by the Jobs and Growth Tax Relief Reconciliation Act of 2003. Of the distributions paid during the fiscal year, $7,203,360 represents the maximum amount that may be considered qualified dividend income.
|
| INFORMATION ABOUT THE RENEWAL OF THE |
| FUND’S MANAGEMENT AND SUB-INVESTMENT |
| ADVISORY AGREEMENTS (Unaudited) |
At a meeting of the fund’s Board of Directors held on November 4-5, 2013, the Board considered the renewal of the fund’s Management Agreement, pursuant to which Dreyfus provides the fund with investment advisory and administrative services (the “Agreement”), and the Sub-Investment Advisory Agreement (together, the “Agreements”), pursuant to which Walter Scott & Partners Limited (the “Sub-Adviser”) provides day-to-day management of the fund’s investments.The Board members, none of whom are “interested persons” (as defined in the Investment Company Act of 1940, as amended) of the fund, were assisted in their review by independent legal counsel and met with counsel in executive session separate from representatives of Dreyfus and the Sub-Adviser. In considering the renewal of the Agreements, the Board considered all factors that it believed to be relevant, including those discussed below.The Board did not identify any one factor as dispositive, and each Board member may have attributed different weights to the factors considered.
Analysis of Nature, Extent, and Quality of Services Provided to the Fund. The Board considered information provided to them at the meeting and in previous presentations from Dreyfus representatives regarding the nature, extent, and quality of the services provided to funds in the Dreyfus fund complex. Dreyfus provided the number of open accounts in the fund, the fund’s asset size and the allocation of fund assets among distribution channels. Dreyfus also had previously provided information regarding the diverse intermediary relationships and distribution channels of funds in the Dreyfus fund complex (such as retail direct or intermediary, in which intermediaries typically are paid by the fund and/or Dreyfus) and Dreyfus’ corresponding need for broad, deep, and diverse resources to be able to provide ongoing shareholder services to each intermediary or distribution channel, as applicable to the fund.
The Board also considered research support available to, and portfolio management capabilities of, the fund’s portfolio management personnel and that Dreyfus also provides oversight of day-to-day fund operations, including fund accounting and administration and assistance in meeting
34
legal and regulatory requirements. The Board also considered Dreyfus’ extensive administrative, accounting, and compliance infrastructures, as well as Dreyfus’ supervisory activities over the Sub-Adviser.The Board also considered portfolio management’s brokerage policies and practices (including policies and practices regarding soft dollars) and the standards applied in seeking best execution.
Comparative Analysis of the Fund’s Performance and Management Fee and Expense Ratio. The Board reviewed reports prepared by Lipper, Inc. (“Lipper”), an independent provider of investment company data, which included information comparing (1) the fund’s performance with the performance of a group of comparable funds (the “Performance Group”) and with a broader group of funds (the “Performance Universe”), all for various periods ended September 30, 2013, and (2) the fund’s actual and contractual management fees and total expenses with those of a group of comparable funds (the “Expense Group”) and with a broader group of funds (the “Expense Universe”), the information for which was derived in part from fund financial statements available to Lipper as of the date of its analysis. Dreyfus previously had furnished the Board with a description of the methodology Lipper used to select the Performance Group and Performance Universe and the Expense Group and Expense Universe.
Dreyfus representatives stated that the usefulness of performance comparisons may be affected by a number of factors, including different investment limitations that may be applicable to the fund and comparison funds. They also noted that performance generally should be considered over longer periods of time, although it is possible that long-term performance can be adversely affected by even one period of significant underperformance so that a single investment decision or theme has the ability to affect disproportionately long-term performance. The Board discussed the results of the comparisons and noted that the fund’s total return performance was below the Performance Group and Performance Universe medians for all periods except the five-year period when the fund’s performance was above the Performance Group and
|
| INFORMATION ABOUT THE RENEWAL OF THE FUND’S MANAGEMENT AND |
| SUB-INVESTMENT ADVISORY AGREEMENTS (Unaudited) (continued) |
Performance Universe medians. The Board noted the proximity of the fund’s performance to the medians, particularly the Performance Group median, in certain of the periods of underperformance. Dreyfus also provided a comparison of the fund’s calendar year total returns to the returns of the fund’s benchmark index and noted that the fund’s performance was above the returns of the benchmark in four of the five years.
The Board received a presentation from a representative of the Sub-Adviser describing the fund’s investment strategy and performance generally over the past two calendar years as well as the appeal to fund shareholders of the Sub-Adviser’s low beta and benchmark-agnostic investment approach, as reflected in the fund’s continuing net asset growth since inception. During this presentation, the Board noted how the Sub-Adviser’s benchmark-agnostic investment approach can be expected to result in periods of significant outperformance and underperformance from time to time.
The Board also reviewed the range of actual and contractual management fees and total expenses of the Expense Group and Expense Universe funds and discussed the results of the comparisons.The Board noted that the fund’s contractual management fee was slightly below the Expense Group median, the fund’s actual management fee was slightly below the Expense Group median and slightly above Expense Universe median, and the fund’s total expenses were below the Expense Group and Expense Universe medians (lowest in the Expense Group).
Dreyfus representatives reviewed with the Board the management or investment advisory fees (1) paid by funds advised or administered by Dreyfus that are in the same Lipper category as the fund and (2) paid to Dreyfus or the Sub-Adviser or its affiliates for advising any separate accounts and/or other types of client portfolios that are considered to have similar investment strategies and policies as the fund (the “Similar Clients”), and explained the nature of the Similar Clients.They discussed differences in fees paid and the relationship of the fees paid in light of any differences in the services provided and other relevant factors.The
36
Board considered the relevance of the fee information provided for the Similar Clients to evaluate the appropriateness and reasonableness of the fund’s management fee.
The Board considered the fee to the Sub-Adviser in relation to the fee paid to Dreyfus by the fund and the respective services provided by the Sub-Adviser and Dreyfus.The Board also noted the Sub-Adviser’s fee is paid by Dreyfus (out of its fee from the fund) and not the fund.
Analysis of Profitability and Economies of Scale. Dreyfus representatives reviewed the expenses allocated and profit received by Dreyfus and the resulting profitability percentage for managing the fund and the aggregate profitability percentage to Dreyfus of managing the funds in the Dreyfus fund complex, and the method used to determine the expenses and profit. The Board concluded that the profitability results were not unreasonable, given the services rendered and service levels provided by Dreyfus. The Board also had been provided with information prepared by an independent consulting firm regarding Dreyfus’ approach to allocating costs to, and determining the profitability of, individual funds and the entire Dreyfus fund complex.The consulting firm also had analyzed where any economies of scale might emerge in connection with the management of a fund.
The Board considered on the advice of its counsel the profitability analysis (1) as part of its evaluation of whether the fees under the Agreements bear a reasonable relationship to the mix of services provided by Dreyfus and the Sub-Adviser, including the nature, extent, and quality of such services, and (2) in light of the relevant circumstances for the fund and the extent to which economies of scale would be realized if the fund grows and whether fee levels reflect these economies of scale for the benefit of fund shareholders. Since Dreyfus, and not the fund, pays the Sub-Adviser pursuant to the Sub-Investment Advisory Agreement, the Board did not consider the Sub-Adviser’s profitability to be relevant to its deliberations. Dreyfus representatives also noted
|
| INFORMATION ABOUT THE RENEWAL OF THE FUND’S MANAGEMENT AND |
| SUB-INVESTMENT ADVISORY AGREEMENTS (Unaudited) (continued) |
that, as a result of shared and allocated costs among funds in the Dreyfus fund complex, the extent of economies of scale could depend substantially on the level of assets in the complex as a whole, so that increases and decreases in complex-wide assets can affect potential economies of scale in a manner that is disproportionate to, or even in the opposite direction from, changes in the fund’s asset level.The Board also considered potential benefits to Dreyfus and the Sub-Adviser from acting as investment adviser and sub-investment adviser, respectively, and noted the soft dollar arrangements in effect for trading the fund’s investments.
At the conclusion of these discussions, the Board agreed that it had been furnished with sufficient information to make an informed business decision with respect to the renewal of the Agreements. Based on the discussions and considerations as described above, the Board concluded and determined as follows.
The Board concluded that the nature, extent, and quality of the services provided by Dreyfus and the Sub-Adviser are adequate and appropriate.
The Board generally was satisfied with the fund’s performance, in light of the considerations described above.
The Board concluded that the fees paid to Dreyfus and the Sub- Adviser were reasonable in light of the considerations described above.
The Board determined that the economies of scale which may accrue to Dreyfus and its affiliates in connection with the management of the fund had been adequately considered by Dreyfus in connection with the fee rate charged to the fund pursuant to the Agreement and that, to the extent in the future it were determined that material economies of scale had not been shared with the fund, the Board would seek to have those economies of scale shared with the fund.
In evaluating the Agreements, the Board considered these conclusions and determinations and also relied on its previous knowledge, gained through meetings and other interactions with Dreyfus and its affiliates
38
and the Sub-Adviser, of the fund and the services provided to the fund by Dreyfus and the Sub-Adviser.The Board also relied on information received on a routine and regular basis throughout the year relating to the operations of the fund and the investment management and other services provided under the Agreements, including information on the investment performance of the fund in comparison to similar mutual funds and benchmark performance indices; general market outlook as applicable to the fund; and compliance reports. In addition, the Board’s consideration of the contractual fee arrangements for this fund had the benefit of a number of years of reviews of prior or similar agreements during which lengthy discussions took place between the Board and Dreyfus representatives. Certain aspects of the arrangements may receive greater scrutiny in some years than in others, and the Board’s conclusions may be based, in part, on their consideration of the same or similar arrangements in prior years.The Board determined that renewal of the Agreements was in the best interests of the fund and its shareholders.
BOARD MEMBERS INFORMATION (Unaudited)
|
| Joseph S. DiMartino (70) |
| Chairman of the Board (1995) |
| Principal Occupation During Past 5Years: |
| • Corporate Director and Trustee |
| Other Public Company Board Memberships During Past 5Years: |
| • CBIZ (formerly, Century Business Services, Inc.), a provider of outsourcing functions for small |
| and medium size companies, Director (1997-present) |
| • The Newark Group, a provider of a national market of paper recovery facilities, paperboard |
| mills and paperboard converting plants, Director (2000-2010) |
| • Sunair Services Corporation, a provider of certain outdoor-related services to homes and |
| businesses, Director (2005-2009) |
| No. of Portfolios for which Board Member Serves: 141 |
| ——————— |
| William Hodding Carter III (78) |
| Board Member (1988) |
| Principal Occupation During Past 5Years: |
| • Professor of Leadership & Public Policy, University of North Carolina, Chapel Hill (2006-present) |
| No. of Portfolios for which Board Member Serves: 24 |
| ——————— |
| Gordon J. Davis (72)† |
| Board Member (2006) |
| Principal Occupation During Past 5Years: |
| • Partner in the law firm of Venable LLP (2012-present) |
| • Partner in the law firm of Dewey & LeBoeuf LLP (1994-2012) |
| Other Public Company Board Memberships During Past 5Years: |
| • Consolidated Edison, Inc., a utility company, Director (1997-present) |
| • The Phoenix Companies, Inc., a life insurance company, Director (2000-present) |
| No. of Portfolios for which Board Member Serves: 49 |
| † Mr. Davis is deemed to be an “interested person” (as defined in the Act) of the fund as a result of his affiliation with |
| Venable LLP, which provides legal services to the fund. |
| ——————— |
| Joni Evans (71) |
| Board Member (2006) |
| Principal Occupation During Past 5Years: |
| • Chief Executive Officer, www.wowOwow.com an online community dedicated to women’s |
| conversations and publications (2007-present) |
| • Principal, Joni Evans Ltd. (publishing) (2006-present) |
| No. of Portfolios for which Board Member Serves: 24 |
40
|
| Ehud Houminer (73) |
| Board Member (1994) |
| Principal Occupation During Past 5Years: |
| • Executive-in-Residence at the Columbia Business School, Columbia University (1992-present) |
| Other Public Company Board Memberships During Past 5Years: |
| • Avnet Inc., an electronics distributor, Director (1993-2012) |
| No. of Portfolios for which Board Member Serves: 66 |
| ——————— |
| Richard C. Leone (73) |
| Board Member (1984) |
| Principal Occupation During Past 5Years: |
| • Senior Fellow and former President of The Century Foundation (formerly,The Twentieth |
| Century Fund, Inc.), a tax exempt research foundation engaged in the study of economic, |
| foreign policy and domestic issues |
| No. of Portfolios for which Board Member Serves: 24 |
| ——————— |
| Hans C. Mautner (76) |
| Board Member (1984) |
| Principal Occupation During Past 5Years: |
| • President—International Division and an Advisory Director of Simon Property Group, a real |
| estate investment company (1998-2010) |
| • Chairman and Chief Executive Officer of Simon Global Limited, a real estate company (1999-2010) |
| No. of Portfolios for which Board Member Serves: 24 |
| ——————— |
| Robin A. Melvin (50) |
| Board Member (1995) |
| Principal Occupation During Past 5Years: |
| • Board Member, Illinois Mentoring Partnership, non-profit organization dedicated to increasing |
| the quantity and quality of mentoring services in Illinois (2013-present) |
| • Director, Boisi Family Foundation, a private family foundation that supports youth-serving orga- |
| nizations that promote the self sufficiency of youth from disadvantaged circumstances (1995-2012) |
| No. of Portfolios for which Board Member Serves: 90 |
BOARD MEMBERS INFORMATION (Unaudited) (continued)
|
| Burton N. Wallack (63) |
| Board Member (2006) |
| Principal Occupation During Past 5Years: |
| • President and Co-owner of Wallack Management Company, a real estate management company |
| No. of Portfolios for which Board Member Serves: 24 |
| ——————— |
| John E. Zuccotti (76) |
| Board Member (1984) |
| Principal Occupation During Past 5Years: |
| • Chairman of Brookfield Properties, Inc. |
| • Senior Counsel of Weil, Gotshal & Manges, LLP |
| • Emeritus Chairman of the Real Estate Board of New York |
| Other Public Company Board Memberships During Past 5Years: |
| • Wellpoint, Inc., a health benefits company, Director (2005-2010) |
| No. of Portfolios for which Board Member Serves: 24 |
| ——————— |
Once elected all Board Members serve for an indefinite term, but achieve Emeritus status upon reaching age 80.The address of the Board Members and Officers is c/o The Dreyfus Corporation, 200 Park Avenue, NewYork, NewYork 10166. Additional information about the Board Members is available in the fund’s Statement of Additional Information which can be obtained from Dreyfus free of charge by calling this toll free number: 1-800-DREYFUS.
David W. Burke, Emeritus Board Member
Arnold S. Hiatt, Emeritus Board Member
42
OFFICERS OF THE FUND (Unaudited)
BRADLEY J. SKAPYAK, President since January 2010.
Chief Operating Officer and a director of the Manager since June 2009, Chairman of Dreyfus Transfer, Inc., an affiliate of the Manager and the transfer agent of the funds, since May 2011 and Executive Vice President of the Distributor since June 2007. From April 2003 to June 2009, Mr. Skapyak was the head of the Investment Accounting and Support Department of the Manager. He is an officer of 68 investment companies (comprised of 141 portfolios) managed by the Manager. He is 55 years old and has been an employee of the Manager since February 1988.
JOHN PAK, Chief Legal Officer since March 2013.
Chief Legal Officer of the Manager and Associate General Counsel and Managing Director of BNY Mellon since August 2012; from March 2005 to July 2012, Managing Director of Deutsche Bank, Deputy Global Head of Deutsche Asset Management Legal and Regional Head of Deutsche Asset Management Americas Legal. He is an officer of 69 investment companies (comprised of 166 portfolios) managed by the Manager. He is 45 years old and has been an employee of the Manager since August 2012.
JANETTE E. FARRAGHER, Vice President and Secretary since December 2011.
Assistant General Counsel of BNY Mellon, and an officer of 69 investment companies (comprised of 166 portfolios) managed by the Manager. She is 50 years old and has been an employee of the Manager since February 1984.
KIESHA ASTWOOD, Vice President and Assistant Secretary since January 2010.
Counsel of BNY Mellon, and an officer of 69 investment companies (comprised of 166 portfolios) managed by the Manager. She is 40 years old and has been an employee of the Manager since July 1995.
JAMES BITETTO, Vice President and Assistant Secretary since August 2005.
Senior Counsel of BNY Mellon and Secretary of the Manager, and an officer of 69 investment companies (comprised of 166 portfolios) managed by the Manager. He is 47 years old and has been an employee of the Manager since December 1996.
JONI LACKS CHARATAN, Vice President and Assistant Secretary since August 2005.
Senior Counsel of BNY Mellon, and an officer of 69 investment companies (comprised of 166 portfolios) managed by the Manager. She is 58 years old and has been an employee of the Manager since October 1988.
JOSEPH M. CHIOFFI, Vice President and Assistant Secretary since August 2005.
Senior Counsel of BNY Mellon, and an officer of 69 investment companies (comprised of 166 portfolios) managed by the Manager. He is 52 years old and has been an employee of the Manager since June 2000.
JOHN B. HAMMALIAN, Vice President and Assistant Secretary since August 2005.
Senior Managing Counsel of BNY Mellon, and an officer of 69 investment companies (comprised of 166 portfolios) managed by the Manager. He is 50 years old and has been an employee of the Manager since February 1991.
ROBERT R. MULLERY, Vice President and Assistant Secretary since August 2005.
Managing Counsel of BNY Mellon, and an officer of 69 investment companies (comprised of 166 portfolios) managed by the Manager. He is 61 years old and has been an employee of the Manager since May 1986.
OFFICERS OF THE FUND (Unaudited) (continued)
JEFF PRUSNOFSKY, Vice President and Assistant Secretary since August 2005.
Senior Managing Counsel of BNY Mellon, and an officer of 69 investment companies (comprised of 166 portfolios) managed by the Manager. He is 48 years old and has been an employee of the Manager since October 1990.
JAMES WINDELS, Treasurer since November 2001.
Director – Mutual Fund Accounting of the Manager, and an officer of 69 investment companies (comprised of 166 portfolios) managed by the Manager. He is 55 years old and has been an employee of the Manager since April 1985.
RICHARD CASSARO, Assistant Treasurer since January 2008.
Senior Accounting Manager – Money Market and Municipal Bond Funds of the Manager, and an officer of 69 investment companies (comprised of 166 portfolios) managed by the Manager. He is 54 years old and has been an employee of the Manager since September 1982.
GAVIN C. REILLY, Assistant Treasurer since December 2005.
Tax Manager of the Investment Accounting and Support Department of the Manager, and an officer of 69 investment companies (comprised of 166 portfolios) managed by the Manager. He is 45 years old and has been an employee of the Manager since April 1991.
ROBERT S. ROBOL, Assistant Treasurer since December 2002.
Senior Accounting Manager – Fixed Income Funds of the Manager, and an officer of 69 investment companies (comprised of 166 portfolios) managed by the Manager. He is 49 years old and has been an employee of the Manager since October 1988.
ROBERT SALVIOLO, Assistant Treasurer since July 2007.
Senior Accounting Manager – Equity Funds of the Manager, and an officer of 69 investment companies (comprised of 166 portfolios) managed by the Manager. He is 46 years old and has been an employee of the Manager since June 1989.
ROBERT SVAGNA, Assistant Treasurer since December 2002.
Senior Accounting Manager – Equity Funds of the Manager, and an officer of 69 investment companies (comprised of 166 portfolios) managed by the Manager. He is 46 years old and has been an employee of the Manager since November 1990.
JOSEPH W. CONNOLLY, Chief Compliance Officer since October 2004.
Chief Compliance Officer of the Manager and The Dreyfus Family of Funds (69 investment companies, comprised of 166 portfolios). He is 56 years old and has served in various capacities with the Manager since 1980, including manager of the firm’s Fund Accounting Department from 1997 through October 2001.
MATTHEW D. CONNOLLY, Anti-Money Laundering Compliance Officer since April 2012.
Anti-Money Laundering Compliance Officer of the Distributor since October 2011; from March 2010 to September 2011, Global Head, KYC Reviews and Director, UBS Investment Bank; until March 2010, AML Compliance Officer and Senior Vice President, Citi Global Wealth Management. He is an officer of 64 investment companies (comprised of 161 portfolios) managed by the Manager. He is 41 years old and has been an employee of the Distributor since October 2011.
44
For More Information
Telephone Call your financial representative or 1-800-DREYFUS
Mail The Dreyfus Family of Funds, 144 Glenn Curtiss Boulevard, Uniondale, NY 11556-0144
The fund files its complete schedule of portfolio holdings with the Securities and Exchange Commission (“SEC”) for the first and third quarters of each fiscal year on Form N-Q. The fund’s Forms N-Q are available on the SEC’s website at http://www.sec.gov and may be reviewed and copied at the SEC’s Public Reference Room in Washington, DC. Information on the operation of the Public Reference Room may be obtained by calling 1-800-SEC-0330.
A description of the policies and procedures that the fund uses to determine how to vote proxies relating to portfolio securities, and information regarding how the fund voted these proxies for the most recent 12-month period ended June 30 is available at http://www.dreyfus.com and on the SEC’s website at http://www.sec.gov. The description of the policies and procedures is also available without charge, upon request, by calling 1-800-DREYFUS.

ANNUAL REPORT November 30, 2013

Save time. Save paper. View your next shareholder report online as soon as it’s available. Log into www.dreyfus.com and sign up for Dreyfus eCommunications. It’s simple and only takes a few minutes.
The views expressed in this report reflect those of the portfolio manager only through the end of the period covered and do not necessarily represent the views of Dreyfus or any other person in the Dreyfus organization. Any such views are subject to change at any time based upon market or other conditions and Dreyfus disclaims any responsibility to update such views.These views may not be relied on as investment advice and, because investment decisions for a Dreyfus fund are based on numerous factors, may not be relied on as an indication of trading intent on behalf of any Dreyfus fund.
|
| Not FDIC-Insured • Not Bank-Guaranteed • May Lose Value |
| | Contents |
| | THE FUND |
| 2 | A Letter from the President |
| 3 | Discussion of Fund Performance |
| 6 | Fund Performance |
| 8 | Understanding Your Fund’s Expenses |
| 8 | Comparing Your Fund’s Expenses With Those of Other Funds |
| 9 | Statement of Investments |
| 13 | Statement of Assets and Liabilities |
| 14 | Statement of Operations |
| 15 | Statement of Changes in Net Assets |
| 17 | Financial Highlights |
| 21 | Notes to Financial Statements |
| 31 | Report of Independent Registered Public Accounting Firm |
| 32 | Important Tax Information |
| 33 | Information About the Renewal of the Fund’s Management and Sub-Investment Advisory Agreements |
| 39 | Board Members Information |
| 42 | Officers of the Fund |
| | FOR MORE INFORMATION |
| | Back Cover |
Dreyfus
U.S. Equity Fund
The Fund
A LETTER FROM THE PRESIDENT
Dear Shareholder:
We are pleased to present this annual report for Dreyfus U.S. Equity Fund, covering the 12-month period from December 1, 2012, through November 30, 2013. For information about how the fund performed during the reporting period, as well as general market perspectives, we provide a Discussion of Fund Performance on the pages that follow.
Although expectations of higher long-term interest rates and a more moderately stimulative monetary policy sparked volatility in the U.S stock market at times during the reporting period, improved U.S. economic conditions drove stock prices substantially higher for the reporting period overall. Even the 16-day U.S. government shutdown in October failed to derail the market’s advance, enabling some broad measures of stock market performance to reach new record highs by the reporting period’s end. Stocks across most capitalization ranges and investment styles produced strong results.
We currently expect U.S. economic conditions to continue to improve in 2014, with accelerating growth supported by the fading drags of tighter federal fiscal policies and downsizing on the state and local levels. Moreover, inflation is likely to remain muted, so monetary policy can remain stimulative. Globally, we anticipate stronger growth in many developed countries due to past and continuing monetary ease, while emerging markets seem poised for more moderate economic expansion. For more information on how these observations may affect your investments, we encourage you to speak with your financial advisor.
Thank you for your continued confidence and support.

J. Charles Cardona
President
The Dreyfus Corporation
December 16, 2013
2
DISCUSSION OF FUND PERFORMANCE
For the reporting period of December 1, 2012, through November 30, 2013, as provided by Charlie Macquaker and Roy Leckie of Walter Scott & Partners Limited (Walter Scott), Sub-investment adviser
Fund and Market Performance Overview
For the 12-month period ended November 30, 2013, Dreyfus U.S. Equity Fund’s Class A shares achieved a return of 28.20%, Class C shares returned 27.19%, and Class I shares returned 28.75%.1 In comparison, the fund’s benchmark, the Morgan Stanley Capital International USA Index (“MSCI USA Index”), achieved a 29.52% return over the same period.2 The fund’s Class Y shares produced a total return of 13.50% for the period since their inception of July 1, 2013, through November 30, 2013.
U.S. stocks responded positively to stronger economic growth during the reporting period.The fund’s returns lagged its benchmark, mainly due to lack of exposure to large banks and shortfalls in the consumer discretionary sector.
The Fund’s Investment Approach
The fund seeks long-term real returns by investing in stocks of companies that are located in the United States.When selecting stocks,Walter Scott seeks companies with fundamental strengths that indicate the potential for sustainable growth. The firm focuses on individual stock selection through extensive fundamental research. Candidates are initially selected for research if they meet certain broad absolute and trend criteria. Financial statements are analyzed in an effort to identify the nature of their cash generation and to understand the variables that add value to their businesses. Companies meeting the financial criteria are subjected to a detailed investigation of their products, costs and pricing, competition, industry position, and outlook.
Recovering Economy Fueled Market’s Gains
U.S. stocks rallied in response to aggressively accommodative monetary policies adopted by the Federal Reserve Board (the “Fed”) and other central banks, which produced ample liquidity in financial markets. With bonds considered relatively unattractive due to rising long-term interest rates, investors flocked to equities to put their capital to work. Consequently, stock prices climbed sharply.
DISCUSSION OF FUND PERFORMANCE (continued)
The United States led the global economic recovery, as domestic growth was supported by employment gains, rebounding housing markets, and greater manufacturing activity. Investors were particularly encouraged by a new round of quantitative easing that was launched by the Fed during the fall of 2012. However, in May 2013, the Fed indicated that it would back away from its quantitative easing program sooner than expected, sparking heightened stock market volatility. Equity markets generally stabilized over the summer, and stocks advanced strongly in the fall when the Fed refrained from tapering its bond purchasing program. Even a federal government shutdown in October failed to derail the rally, enabling some broad measures of U.S. stock market performance to reach new record highs by the reporting period’s end.
U.S.-based exporters and multinational companies also benefited from improving conditions in overseas markets, as Europe seemed to put the worst of its financial crisis behind it and a new government in Japan implemented stimulative fiscal and monetary policies. In contrast, many emerging markets struggled with economic slowdowns during the reporting period.
Security Selections Produced Mixed Results
The fund’s relatively conservative investment approach tends to outperform market averages during downturns but typically lags during rallies.The reporting period was no exception, as industry leaders with histories of consistent growth generally fell out of favor among investors seeking more speculative opportunities. For example, the fund held none of the large banks that led the financials sector higher despite what we regarded as unfavorable business fundamentals.
Moreover, the fund encountered disappointments in the consumer discretionary sector, where discount retailer Family Dollar Stores struggled with intensifying competitive pressures and a shift in its product mix to goods with lower profit margins. Apparel seller Urban Outfitters reported disappointing same-store sales data, which overshadowed strength in its online operations. Accessories retailer Coach was hurt by concerns regarding the company’s profit margins and growth prospects. In the industrials sector, logistics specialist C.H. Robinson Worldwide struggled with rising costs and greater competition.
On a more positive note, federal regulators approved three new products from biotechnology firm Celgene in 2013. Aerospace company Boeing posted strong
4
financial results due to rising aircraft orders. Software developer Adobe Systems benefited from a change in its distribution model to “software as a service.” Agricultural retailer Tractor Supply saw rising demand from hobbyist farmers. Footwear maker NIKE achieved strong sales in North American markets.
During the reporting period, we added specialty chemicals company FMC Corp., data management specialist Teradata, medical devices developer Intuitive Surgical, and industrial supplies provider W.W. Grainger to the portfolio, and we eliminated positions in energy services provider CARBO Ceramics and semiconductors maker Intel.
High Confidence in Portfolio Holdings
Although we at Walter Scott remain more skeptical than the consensus view regarding the sustainability of economic recoveries in Japan and Europe, we are more optimistic regarding the United States. Indeed, we have continued to identify ample opportunities among industry leaders that, in our analysis, are poised to benefit from positive cyclical and secular trends.As of the reporting period’s end, we have found a number of U.S. companies meeting our investment criteria in the industrials sector, but relatively few in the financials sector.
December 16, 2013
Equity funds are subject generally to market, market sector, market liquidity, issuer and investment style risks, among other factors, to varying degrees, all of which are more fully described in the fund’s prospectus.
|
| 1 Total return includes reinvestment of dividends and any capital gains paid, and does not take into consideration the |
| maximum initial sales charge in the case of Class A shares, or the applicable contingent deferred sales charge imposed |
| on redemptions in the case of Class C shares. Had these charges been reflected, returns would have been lower. Past |
| performance is no guarantee of future results. Share price and investment return fluctuate such that upon redemption, |
| fund shares may be worth more or less than their original cost. Return figure for Class C shares reflect the absorption |
| of certain fund expenses by The Dreyfus Corporation pursuant to an undertaking in effect through July 1, 2014, at |
| which time it may be extended, terminated or modified. Had these expenses not been absorbed, Class C’s return |
| would have been lower. |
| 2 SOURCE: LIPPER INC. — Reflects reinvestment of net dividends and, where applicable, capital gain |
| distributions.The Morgan Stanley Capital International USA (MSCI USA) Index is an unmanaged, market |
| capitalization weighted index that is designed to measure the performance of publicly traded stocks issued by |
| companies in the United States. Investors cannot invest directly in any index. |
FUND PERFORMANCE
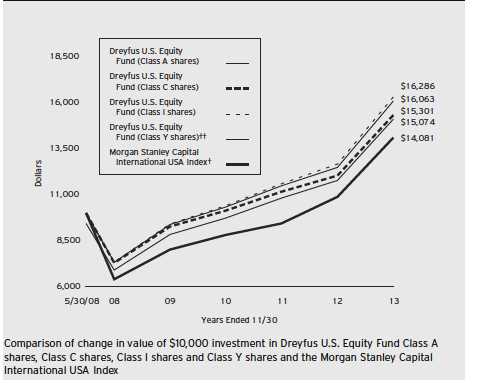
| |
| † | Source: Lipper Inc. |
| †† | The total return figures presented for ClassY shares of the fund reflect the performance of the fund’s Class A shares |
| | for the period prior to 7/1/13 (the inception date for ClassY shares). |
Past performance is not predictive of future performance.
The above graph compares a $10,000 investment made in each of the Class A, Class C, Class I and ClassY shares of Dreyfus U.S. Equity Fund on 5/30/08 (inception date) to a $10,000 investment made in the Morgan Stanley Capital International USA Index (the “Index”) on that date. All dividends and capital gain distributions are reinvested. On April 29, 2013, the Board authorized the fund to offer ClassY shares, as a new class of shares, to certain investors, including certain institutional investors. On July 1, 2013, ClassY shares were offered at net asset value and are not subject to certain fees, including Distribution Plan and Shareholder Services Plan fees.
The fund’s performance shown in the line graph above takes into account the maximum initial sales charge on Class A shares and all other applicable fees and expenses on all classes.The Index is an unmanaged, market capitalization-weighted index that is designed to measure the performance of publicly traded stocks issued by companies in the United States. Unlike a mutual fund, the Index is not subject to charges, fees and other expenses. Investors cannot invest directly in any index. Further information relating to fund performance, including expense reimbursements, if applicable, is contained in the Financial Highlights section of the prospectus and elsewhere in this report.
6
| | | | | | | |
| Average Annual Total Returns as of 11/30/13 | | | | | | |
| |
| | Inception | | | | | From | |
| | Date | 1 Year | | 5 Years | | Inception | |
| Class A shares | | | | | | | |
| with maximum sales charge (5.75%) | 5/30/08 | 20.85 | % | 15.56 | % | 7.75 | % |
| without sales charge | 5/30/08 | 28.20 | % | 16.94 | % | 8.91 | % |
| Class C shares | | | | | | | |
| with applicable redemption charge † | 5/30/08 | 26.19 | % | 15.99 | % | 8.04 | % |
| without redemption | 5/30/08 | 27.19 | % | 15.99 | % | 8.04 | % |
| Class I shares | 5/30/08 | 28.75 | % | 17.32 | % | 9.27 | % |
| Class Y shares | 7/1/13 | 28.79 | %†† | 17.05 | %†† | 9.00 | %†† |
| Morgan Stanley Capital | | | | | | | |
| International USA Index | 5/31/08 | 29.52 | % | 17.10 | % | 6.42 | % |
Past performance is not predictive of future performance.The fund’s performance shown in the graph and table does not reflect the deduction of taxes that a shareholder would pay on fund distributions or the redemption of fund shares.
| |
| † | The maximum contingent deferred sales charge for Class C shares is 1% for shares redeemed within one year of the |
| | date of purchase. |
| †† | The total return performance figures presented for ClassY shares of the fund reflect the performance of the fund’s |
| | Class A shares for the period prior to 7/1/13 (the inception date for ClassY shares). |
UNDERSTANDING YOUR FUND’S EXPENSES (Unaudited)
As a mutual fund investor, you pay ongoing expenses, such as management fees and other expenses. Using the information below, you can estimate how these expenses affect your investment and compare them with the expenses of other funds.You also may pay one-time transaction expenses, including sales charges (loads) and redemption fees, which are not shown in this section and would have resulted in higher total expenses. For more information, see your fund’s prospectus or talk to your financial adviser.
Review your fund’s expenses
The table below shows the expenses you would have paid on a $1,000 investment in Dreyfus U.S. Equity Fund from June 1, 2013 to November 30, 2013. It also shows how much a $1,000 investment would be worth at the close of the period, assuming actual returns and expenses.
Expenses and Value of a $1,000 Investment
assuming actual returns for the six months ended November 30, 2013 †
| | | | | | | | |
| | | Class A | | Class C | | Class I | | Class Y |
| Expenses paid per $1,000†† | $ | 6.02 | $ | 9.90 | $ | 4.22 | $ | 3.38 |
| Ending value (after expenses) | $ | 1,126.60 | $ | 1,122.60 | $ | 1,129.10 | $ | 1,135.00 |
COMPARING YOUR FUND’S EXPENSES
WITH THOSE OF OTHER FUNDS (Unaudited)
Using the SEC’s method to compare expenses
The Securities and Exchange Commission (SEC) has established guidelines to help investors assess fund expenses. Per these guidelines, the table below shows your fund’s expenses based on a $1,000 investment, assuming a hypothetical 5% annualized return. You can use this information to compare the ongoing expenses (but not transaction expenses or total cost) of investing in the fund with those of other funds.All mutual fund shareholder reports will provide this information to help you make this comparison. Please note that you cannot use this information to estimate your actual ending account balance and expenses paid during the period.
Expenses and Value of a $1,000 Investment
assuming a hypothetical 5% annualized return for the six months ended November 30, 2013
| | | | | | | | |
| | | Class A | | Class C | | Class I | | Class Y |
| Expenses paid per $1,000†††† | $ | 5.72 | $ | 9.40 | $ | 4.00 | $ | 3.85 |
| Ending value (after expenses) | $ | 1,019.40 | $ | 1,015.74 | $ | 1,021.11 | $ | 1,021.26 |
| |
| † | From July 1, 2013 (commencement of initial offering) to November 30, 2013 for ClassY shares. |
| †† | Expenses are equal to the fund’s annualized expense ratio of 1.13% for Class A, 1.86% for Class C and .79% |
| | for Class I, multiplied by the average account value over the period, multiplied by 183/365 (to reflect the one-half |
| | year period). Expenses are equal to the fund’s annualized expense ratio of .76% for ClassY, multiplied by the average |
| | account value over the period, multiplied by 152/365 (to reflect the actual days in the period). |
| ††† | Please note that while ClassY shares commenced operations on July 1, 2013, the hypothetical expenses paid during |
| | the period reflect projected activity for the full six month period for purposes of comparability.This projection assumes |
| | that annualized expense ratios were in effect during the period June 1, 2013 to November 30, 2013. |
| †††† | Expenses are equal to the fund’s annualized expense ratio of 1.13% for Class A, 1.86% for Class C, .79% for |
| | Class I and .76% for Class Y, multiplied by the average account value over the period, multiplied by 183/365 (to |
| | reflect the one-half year period). |
8
|
| STATEMENT OF INVESTMENTS |
| November 30, 2013 |
| | | |
| Common Stocks—96.9% | Shares | | Value ($) |
| Capital Goods—17.9% | | | |
| Boeing | 152,900 | | 20,526,825 |
| Donaldson | 404,100 | | 16,863,093 |
| Emerson Electric | 242,700 | | 16,258,473 |
| Fastenal | 370,500 | | 17,239,365 |
| Flowserve | 279,600 | | 19,957,848 |
| MSC Industrial Direct, Cl. A | 175,400 | | 13,479,490 |
| Precision Castparts | 67,860 | | 17,538,417 |
| Rockwell Collins | 203,800 | | 14,822,374 |
| W.W. Grainger | 39,000 | | 10,058,880 |
| | | | 146,744,765 |
| Consumer Durables & Apparel—4.2% | | | |
| Coach | 277,000 | | 16,038,300 |
| NIKE, Cl. B | 235,700 | | 18,653,298 |
| | | | 34,691,598 |
| Consumer Services—4.7% | | | |
| McDonald’s | 152,700 | | 14,868,399 |
| Panera Bread, Cl. A | 43,300 | a | 7,659,337 |
| Starbucks | 192,200 | | 15,656,612 |
| | | | 38,184,348 |
| Energy—8.1% | | | |
| Apache | 182,500 | | 16,696,925 |
| EOG Resources | 101,460 | | 16,740,900 |
| Occidental Petroleum | 165,500 | | 15,715,880 |
| Schlumberger | 197,750 | | 17,485,055 |
| | | | 66,638,760 |
| Food & Staples Retailing—1.9% | | | |
| Wal-Mart Stores | 188,900 | | 15,302,789 |
| Food, Beverage & Tobacco—2.0% | | | |
| Coca-Cola | 417,800 | | 16,791,382 |
| Health Care Equipment & Services—11.3% | | | |
| C.R. Bard | 124,650 | | 17,311,392 |
| Intuitive Surgical | 20,200 | a | 7,613,380 |
| Meridian Bioscience | 636,600 | b | 15,647,628 |
STATEMENT OF INVESTMENTS (continued)
| | | |
| Common Stocks (continued) | Shares | | Value ($) |
| Health Care Equipment & Services (continued) | | | |
| ResMed | 356,800 | b | 17,415,408 |
| Stryker | 218,100 | | 16,231,002 |
| Varian Medical Systems | 241,900 | a | 18,880,295 |
| | | | 93,099,105 |
| Household & Personal Products—2.0% | | | |
| Colgate-Palmolive | 247,200 | | 16,268,232 |
| Materials—7.5% | | | |
| FMC | 220,500 | | 16,065,630 |
| Monsanto | 139,100 | | 15,764,203 |
| Praxair | 119,000 | | 15,024,940 |
| Sigma-Aldrich | 174,000 | | 15,005,760 |
| | | | 61,860,533 |
| Pharmaceuticals, Biotech & Life Sciences—4.0% | | | |
| Celgene | 109,800 | a | 17,762,346 |
| Johnson & Johnson | 160,500 | | 15,192,930 |
| | | | 32,955,276 |
| Retailing—7.3% | | | |
| Family Dollar Stores | 210,400 | | 14,679,608 |
| The TJX Companies | 315,300 | | 19,826,064 |
| Tractor Supply | 120,200 | | 8,799,842 |
| Urban Outfitters | 431,600 | a | 16,841,032 |
| | | | 60,146,546 |
| Software & Services—16.7% | | | |
| Adobe Systems | 291,300 | a | 16,540,014 |
| Automatic Data Processing | 222,200 | | 17,780,444 |
10
| | | |
| Common Stocks (continued) | Shares | | Value ($) |
| Software & Services (continued) | | | |
| Google, Cl. A | 16,960 | a | 17,970,646 |
| MasterCard, Cl. A | 28,370 | | 21,584,180 |
| Microsoft | 433,100 | | 16,514,103 |
| Oracle | 543,500 | | 19,180,115 |
| Paychex | 372,000 | | 16,267,560 |
| Teradata | 241,600 | a | 11,026,624 |
| | | | 136,863,686 |
| Technology Hardware & | | | |
| Equipment—5.3% | | | |
| Amphenol, Cl. A | 172,800 | | 14,688,000 |
| Cisco Systems | 592,700 | | 12,594,875 |
| QUALCOMM | 218,500 | | 16,077,230 |
| | | | 43,360,105 |
| Transportation—4.0% | | | |
| C.H. Robinson Worldwide | 299,300 | b | 17,547,959 |
| Expeditors International of Washington | 354,000 | | 15,377,760 |
| | | | 32,925,719 |
| Total Common Stocks | | | |
| (cost $568,447,625) | | | 795,832,844 |
| |
| Other Investment—3.0% | | | |
| Registered Investment Company; | | | |
| Dreyfus Institutional Preferred | | | |
| Plus Money Market Fund | | | |
| (cost $24,553,000) | 24,553,000 | c | 24,553,000 |
STATEMENT OF INVESTMENTS (continued)
| | | | |
| Investment of Cash Collateral | | | | |
| for Securities Loaned—4.6% | Shares | | Value ($) | |
| Registered Investment Company; | | | | |
| Dreyfus Institutional Cash | | | | |
| Advantage Fund | | | | |
| (cost $37,652,600) | 37,652,600 | c | 37,652,600 | |
| |
| Total Investments (cost $630,653,225) | 104.5 | % | 858,038,444 | |
| Liabilities, Less Cash and Receivables | (4.5 | %) | (36,707,733 | ) |
| Net Assets | 100.0 | % | 821,330,711 | |
|
| a Non-income producing security. |
| b Security, or portion thereof, on loan.At November 30, 2013, the value of the fund’s securities on loan was |
| $36,946,226 and the value of the collateral held by the fund was $37,652,600. |
| c Investment in affiliated money market mutual fund. |
| | | |
| Portfolio Summary (Unaudited)† | | |
| |
| | Value (%) | Value (%) |
| Capital Goods | 17.9 | Consumer Services | 4.7 |
| Software & Services | 16.7 | Consumer Durables & Apparel | 4.2 |
| Health Care Equipment & Services | 11.3 | Pharmaceuticals, Biotech & Life Sciences | 4.0 |
| Energy | 8.1 | Transportation | 4.0 |
| Money Market Investments | 7.6 | Food, Beverage & Tobacco | 2.0 |
| Materials | 7.5 | Household & Personal Products | 2.0 |
| Retailing | 7.3 | Food & Staples Retailing | 1.9 |
| Technology Hardware & Equipment | 5.3 | | 104.5 |
| |
| † Based on net assets. | | | |
| See notes to financial statements. | | | |
12
|
| STATEMENT OF ASSETS AND LIABILITIES |
| November 30, 2013 |
| | | | |
| | | | Cost | Value |
| Assets ($): | | | | |
| Investments in securities—See Statement of Investments (including | | |
| securities on loan, valued at $36,946,226)—Note 1(b): | | | |
| Unaffiliated issuers | | | 568,447,625 795,832,844 |
| Affiliated issuers | | | 62,205,600 | 62,205,600 |
| Cash | | | | 446,869 |
| Dividends and securities lending income receivable | | | 1,141,025 |
| Receivable for shares of Common Stock subscribed | | | 122,197 |
| Prepaid expenses | | | | 22,719 |
| | | | 859,771,254 |
| Liabilities ($): | | | | |
| Due to The Dreyfus Corporation and affiliates—Note 3(c) | | | 530,007 |
| Liability for securities on loan—Note 1(b) | | | | 37,652,600 |
| Payable for shares of Common Stock redeemed | | | 168,885 |
| Accrued expenses | | | | 89,051 |
| | | | | 38,440,543 |
| Net Assets ($) | | | 821,330,711 |
| Composition of Net Assets ($): | | | | |
| Paid-in capital | | | 585,925,320 |
| Accumulated undistributed investment income—net | | | 4,611,574 |
| Accumulated net realized gain (loss) on investments | | | 3,408,598 |
| Accumulated net unrealized appreciation | | | | |
| (depreciation) on investments | | | 227,385,219 |
| Net Assets ($) | | | 821,330,711 |
| |
| |
| Net Asset Value Per Share | | | | |
| | Class A | Class C | Class I | Class Y |
| Net Assets ($) | 2,445,801 | 1,016,493 | 817,867,282 | 1,135 |
| Shares Outstanding | 124,328 | 53,401 | 41,377,096 | 57.44 |
| Net Asset Value Per Share ($) | 19.67 | 19.04 | 19.77 | 19.76 |
| |
| See notes to financial statements. | | | | |
|
| STATEMENT OF OPERATIONS |
| Year Ended November 30, 2013 |
| | |
| Investment Income ($): | | |
| Income: | | |
| Cash dividends: | | |
| Unaffiliated issuers | 10,483,010 | |
| Affiliated issuers | 17,138 | |
| Income from securities lending—Note 1(b) | 316,068 | |
| Total Income | 10,816,216 | |
| Expenses: | | |
| Management fee—Note 3(a) | 5,059,714 | |
| Registration fees | 66,960 | |
| Professional fees | 66,478 | |
| Directors’ fees and expenses—Note 3(d) | 51,719 | |
| Custodian fees—Note 3(c) | 49,733 | |
| Shareholder servicing costs—Note 3(c) | 13,082 | |
| Prospectus and shareholders’ reports | 7,273 | |
| Loan commitment fees—Note 2 | 7,076 | |
| Distribution fees—Note 3(b) | 3,420 | |
| Miscellaneous | 22,002 | |
| Total Expenses | 5,347,457 | |
| Less—reduction in expenses due to undertaking—Note 3(a) | (616 | ) |
| Less—reduction in fees due to earnings credits—Note 3(c) | (15 | ) |
| Net Expenses | 5,346,826 | |
| Investment Income—Net | 5,469,390 | |
| Realized and Unrealized Gain (Loss) on Investments—Note 4 ($): | | |
| Net realized gain (loss) on investments | 6,813,165 | |
| Net unrealized appreciation (depreciation) on investments | 157,019,159 | |
| Net Realized and Unrealized Gain (Loss) on Investments | 163,832,324 | |
| Net Increase in Net Assets Resulting from Operations | 169,301,714 | |
| |
| See notes to financial statements. | | |
14
STATEMENT OF CHANGES IN NET ASSETS
| | | | |
| | Year Ended November 30, | |
| | 2013 | a | 2012 | |
| Operations ($): | | | | |
| Investment income—net | 5,469,390 | | 4,547,140 | |
| Net realized gain (loss) on investments | 6,813,165 | | (733,670 | ) |
| Net unrealized appreciation | | | | |
| (depreciation) on investments | 157,019,159 | | 36,376,747 | |
| Net Increase (Decrease) in Net Assets | | | | |
| Resulting from Operations | 169,301,714 | | 40,190,217 | |
| Dividends to Shareholders from ($): | | | | |
| Investment income—net: | | | | |
| Class A | (11,577 | ) | — | |
| Class I | (5,289,594 | ) | (1,914,449 | ) |
| Total Dividends | (5,301,171 | ) | (1,914,449 | ) |
| Capital Stock Transactions ($): | | | | |
| Net proceeds from shares sold: | | | | |
| Class A | 1,448,507 | | 1,520,589 | |
| Class C | 680,433 | | 119,955 | |
| Class I | 223,234,167 | | 200,047,673 | |
| Class Y | 1,000 | | — | |
| Dividends reinvested: | | | | |
| Class A | 10,342 | | — | |
| Class I | 1,722,258 | | 606,842 | |
| Cost of shares redeemed: | | | | |
| Class A | (1,281,984 | ) | (782,606 | ) |
| Class C | (55,422 | ) | (75,248 | ) |
| Class I | (105,535,449 | ) | (80,298,753 | ) |
| Increase (Decrease) in Net Assets | | | | |
| from Capital Stock Transactions | 120,223,852 | | 121,138,452 | |
| Total Increase (Decrease) in Net Assets | 284,224,395 | | 159,414,220 | |
| Net Assets ($): | | | | |
| Beginning of Period | 537,106,316 | | 377,692,096 | |
| End of Period | 821,330,711 | | 537,106,316 | |
| Undistributed investment income—net | 4,611,574 | | 4,443,355 | |
STATEMENT OF CHANGES IN NET ASSETS (continued)
| | | | |
| | Year Ended November 30, | |
| | 2013 | a | 2012 | |
| Capital Share Transactions: | | | | |
| Class A | | | | |
| Shares sold | 81,245 | | 101,027 | |
| Shares issued for dividends reinvested | 675 | | — | |
| Shares redeemed | (74,757 | ) | (53,436 | ) |
| Net Increase (Decrease) in Shares Outstanding | 7,163 | | 47,591 | |
| Class C | | | | |
| Shares sold | 38,087 | | 8,430 | |
| Shares redeemed | (3,229 | ) | (5,290 | ) |
| Net Increase (Decrease) in Shares Outstanding | 34,858 | | 3,140 | |
| Class I | | | | |
| Shares sold | 12,849,116 | | 13,460,380 | |
| Shares issued for dividends reinvested | 112,272 | | 42,645 | |
| Shares redeemed | (6,076,012 | ) | (5,385,690 | ) |
| Net Increase (Decrease) in Shares Outstanding | 6,885,376 | | 8,117,335 | |
| Class Y | | | | |
| Shares sold | 57.44 | | — | |
| a Effective July 1, 2013, the fund commenced offering ClassY shares. | | | |
| See notes to financial statements. | | | | |
16
FINANCIAL HIGHLIGHTS
The following tables describe the performance for each share class for the fiscal periods indicated.All information (except portfolio turnover rate) reflects financial results for a single fund share.Total return shows how much your investment in the fund would have increased (or decreased) during each period, assuming you had reinvested all dividends and distributions.These figures have been derived from the fund’s financial statements.
| | | | | | | | | |
| | | | Year Ended November 30, | | | |
| Class A Shares | 2013 | | 2012 | 2011 | | 2010 | | 2009 | |
| Per Share Data ($): | | | | | | | | | |
| Net asset value, beginning of period | 15.45 | | 14.20 | 12.83 | | 11.68 | | 9.14 | |
| Investment Operations: | | | | | | | | | |
| Investment income—neta | .08 | | .08 | .04 | | .01 | | .04 | |
| Net realized and unrealized | | | | | | | | | |
| gain (loss) on investments | 4.25 | | 1.17 | 1.39 | | 1.16 | | 2.53 | |
| Total from Investment Operations | 4.33 | | 1.25 | 1.43 | | 1.17 | | 2.57 | |
| Distributions: | | | | | | | | | |
| Dividends from investment income—net | (.11 | ) | — | — | | (.02 | ) | (.03 | ) |
| Dividends from net realized | | | | | | | | | |
| gain on investments | — | | — | (.06 | ) | — | | — | |
| Total Distributions | (.11 | ) | — | (.06 | ) | (.02 | ) | (.03 | ) |
| Net asset value, end of period | 19.67 | | 15.45 | 14.20 | | 12.83 | | 11.68 | |
| Total Return (%)b | 28.20 | | 8.80 | 11.17 | | 10.01 | | 28.19 | |
| Ratios/Supplemental Data (%): | | | | | | | | | |
| Ratio of total expenses | | | | | | | | | |
| to average net assets | 1.15 | | 1.22 | 1.15 | | 1.76 | | 4.65 | |
| Ratio of net expenses | | | | | | | | | |
| to average net assets | 1.14 | | 1.22 | 1.15 | | 1.40 | | 1.40 | |
| Ratio of net investment income | | | | | | | | | |
| to average net assets | .48 | | .57 | .29 | | .04 | | .42 | |
| Portfolio Turnover Rate | 7.13 | | 5.73 | 10.61 | | 13.62 | | 31.79 | |
| Net Assets, end of period ($ x 1,000) | 2,446 | | 1,810 | 988 | | 2,424 | | 3,884 | |
| |
| a | Based on average shares outstanding at each month end. |
| b | Exclusive of sales charge. |
See notes to financial statements.
FINANCIAL HIGHLIGHTS (continued)
| | | | | | | | | | |
| | | | Year Ended November 30, | | | |
| Class C Shares | 2013 | | 2012 | | 2011 | | 2010 | | 2009 | |
| Per Share Data ($): | | | | | | | | | | |
| Net asset value, beginning of period | 14.97 | | 13.88 | | 12.65 | | 11.58 | | 9.11 | |
| Investment Operations: | | | | | | | | | | |
| Investment (loss)—neta | (.06 | ) | (.05 | ) | (.06 | ) | (.09 | ) | (.03 | ) |
| Net realized and unrealized | | | | | | | | | | |
| gain (loss) on investments | 4.13 | | 1.14 | | 1.35 | | 1.16 | | 2.50 | |
| Total from Investment Operations | 4.07 | | 1.09 | | 1.29 | | 1.07 | | 2.47 | |
| Distributions: | | | | | | | | | | |
| Dividends from net realized | | | | | | | | | | |
| gain on investments | — | | — | | (.06 | ) | — | | — | |
| Net asset value, end of period | 19.04 | | 14.97 | | 13.88 | | 12.65 | | 11.58 | |
| Total Return (%)b | 27.19 | | 7.85 | | 10.22 | | 9.24 | | 27.11 | |
| Ratios/Supplemental Data (%): | | | | | | | | | | |
| Ratio of total expenses | | | | | | | | | | |
| to average net assets | 2.02 | | 2.08 | | 1.94 | | 2.52 | | 5.83 | |
| Ratio of net expenses | | | | | | | | | | |
| to average net assets | 1.93 | | 2.08 | | 1.94 | | 2.15 | | 2.15 | |
| Ratio of net investment (loss) | | | | | | | | | | |
| to average net assets | (.34 | ) | (.33 | ) | (.47 | ) | (.71 | ) | (.27 | ) |
| Portfolio Turnover Rate | 7.13 | | 5.73 | | 10.61 | | 13.62 | | 31.79 | |
| Net Assets, end of period ($ x 1,000) | 1,016 | | 278 | | 214 | | 312 | | 497 | |
| |
| a | Based on average shares outstanding at each month end. |
| b | Exclusive of sales charge. |
See notes to financial statements.
18
| | | | | | | | | | |
| | | | Year Ended November 30, | | | |
| Class I Shares | 2013 | | 2012 | | 2011 | | 2010 | | 2009 | |
| Per Share Data ($): | | | | | | | | | | |
| Net asset value, beginning of period | 15.51 | | 14.27 | | 12.88 | | 11.70 | | 9.16 | |
| Investment Operations: | | | | | | | | | | |
| Investment income—neta | .14 | | .14 | | .09 | | .07 | | .05 | |
| Net realized and unrealized | | | | | | | | | | |
| gain (loss) on investments | 4.27 | | 1.17 | | 1.38 | | 1.15 | | 2.54 | |
| Total from Investment Operations | 4.41 | | 1.31 | | 1.47 | | 1.22 | | 2.59 | |
| Distributions: | | | | | | | | | | |
| Dividends from investment income—net | (.15 | ) | (.07 | ) | (.02 | ) | (.04 | ) | (.05 | ) |
| Dividends from net realized | | | | | | | | | | |
| gain on investments | — | | — | | (.06 | ) | — | | — | |
| Total Distributions | (.15 | ) | (.07 | ) | (.08 | ) | (.04 | ) | (.05 | ) |
| Net asset value, end of period | 19.77 | | 15.51 | | 14.27 | | 12.88 | | 11.70 | |
| Total Return (%) | 28.75 | | 9.23 | | 11.46 | | 10.47 | | 28.36 | |
| Ratios/Supplemental Data (%): | | | | | | | | | | |
| Ratio of total expenses | | | | | | | | | | |
| to average net assets | .79 | | .80 | | .82 | | .94 | | 3.77 | |
| Ratio of net expenses | | | | | | | | | | |
| to average net assets | .79 | | .80 | | .82 | | .94 | | 1.15 | |
| Ratio of net investment income | | | | | | | | | | |
| to average net assets | .81 | | .95 | | .67 | | .56 | | .54 | |
| Portfolio Turnover Rate | 7.13 | | 5.73 | | 10.61 | | 13.62 | | 31.79 | |
| Net Assets, end of period ($ x 1,000) | 817,867 | | 535,019 | | 376,490 | | 144,771 | | 1,870 | |
| |
| a Based on average shares outstanding at each month end. | | | | | | | | | |
| See notes to financial statements. | | | | | | | | | | |
FINANCIAL HIGHLIGHTS (continued)
| |
| | Period Ended |
| Class Y Shares | November 30, 2013a |
| Per Share Data ($): | |
| Net asset value, beginning of period | 17.41 |
| Investment Operations: | |
| Investment income—netb | .06 |
| Net realized and unrealized gain (loss) on investments | 2.29 |
| Total from Investment Operations | 2.35 |
| Net asset value, end of period | 19.76 |
| Total Return (%)c | 13.50 |
| Ratios/Supplemental Data (%): | |
| Ratio of total expenses to average net assetsd | .76 |
| Ratio of net expenses to average net assetsd | .76 |
| Ratio of net investment income to average net assetsd | .78 |
| Portfolio Turnover Rate | 7.13 |
| Net Assets, end of period ($ x 1,000) | 1 |
| |
| a | From July 1, 2013 (commencement of initial offering) to November 30, 2013. |
| b | Based on average shares outstanding at each month end. |
| c | Not annualized. |
| d | Annualized. |
See notes to financial statements.
20
NOTES TO FINANCIAL STATEMENTS
NOTE 1—Significant Accounting Policies:
Dreyfus U.S. Equity Fund (the “fund”) is a separate diversified series of Strategic Funds, Inc. (the “Company”), which is registered under the Investment Company Act of 1940, as amended (the “Act”), as an open-end management investment company and operates as a series company currently offering nine series, including the fund.The fund’s investment objective is to seek long-term total return. The Dreyfus Corporation (the “Manager” or “Dreyfus”), a wholly-owned subsidiary of The Bank of New York Mellon Corporation (“BNY Mellon”), serves as the fund’s investment adviser. Walter Scott & Partners Limited (“Walter Scott”), a subsidiary of BNY Mellon and an affiliate of Dreyfus, serves as the fund’s sub-investment adviser.
At a meeting held on April 29, 2013, the Company’s Board of Directors (the “Board”) approved, effective July 1, 2013: (a) for the fund to offer Class Y shares; and, (b) an increase in the authorized shares of the fund from 300 million to 400 million and authorized 100 million Class Y shares.
MBSC Securities Corporation (the “Distributor”), a wholly-owned subsidiary of Dreyfus, is the distributor of the fund’s shares.The fund is authorized to issue 100 million shares of $.001 par value Common Stock in each of the following classes of shares: Class A, Class C, Class I and ClassY. Class A shares generally are subject to a sales charge imposed at the time of purchase. Class C shares are subject to a contingent deferred sales charge (“CDSC”) on Class C shares redeemed within one year of purchase. Class I and ClassY shares are offered at net asset value generally to institutional investors. Other differences between the classes include the services offered to and the expenses borne by each class, the allocation of certain transfer agency costs and certain voting rights. Income, expenses (other than expenses attributable to a specific class), and realized and unrealized gains or losses on investments are allocated to each class of shares based on its relative net assets.
NOTES TO FINANCIAL STATEMENTS (continued)
The Company accounts separately for the assets, liabilities and operations of each series. Expenses directly attributable to each series are charged to that series’ operations; expenses which are applicable to all series are allocated among them on a pro rata basis.
The Financial Accounting Standards Board (“FASB”) Accounting Standards Codification is the exclusive reference of authoritative U.S. generally accepted accounting principles (“GAAP”) recognized by the FASB to be applied by nongovernmental entities. Rules and interpretive releases of the Securities and Exchange Commission (“SEC”) under authority of federal laws are also sources of authoritative GAAP for SEC registrants. The fund’s financial statements are prepared in accordance with GAAP, which may require the use of management estimates and assumptions.Actual results could differ from those estimates.
The Company enters into contracts that contain a variety of indemnifications. The fund’s maximum exposure under these arrangements is unknown.The fund does not anticipate recognizing any loss related to these arrangements.
(a) Portfolio valuation: The fair value of a financial instrument is the amount that would be received to sell an asset or paid to transfer a liability in an orderly transaction between market participants at the measurement date (i.e., the exit price). GAAP establishes a fair value hierarchy that prioritizes the inputs of valuation techniques used to measure fair value. This hierarchy gives the highest priority to unadjusted quoted prices in active markets for identical assets or liabilities (Level 1 measurements) and the lowest priority to unobservable inputs (Level 3 measurements).
Additionally, GAAP provides guidance on determining whether the volume and activity in a market has decreased significantly and whether such a decrease in activity results in transactions that are not orderly. GAAP requires enhanced disclosures around valuation inputs and techniques used during annual and interim periods.
22
Various inputs are used in determining the value of the fund’s investments relating to fair value measurements.These inputs are summarized in the three broad levels listed below:
Level 1—unadjusted quoted prices in active markets for identical investments.
Level 2—other significant observable inputs (including quoted prices for similar investments, interest rates, prepayment speeds, credit risk, etc.).
Level 3—significant unobservable inputs (including the fund’s own assumptions in determining the fair value of investments).
The inputs or methodology used for valuing securities are not necessarily an indication of the risk associated with investing in those securities.
Changes in valuation techniques may result in transfers in or out of an assigned level within the disclosure hierarchy. Valuation techniques used to value the fund’s investments are as follows:
Investments in securities are valued at the last sales price on the securities exchange or national securities market on which such securities are primarily traded. Securities listed on the National Market System for which market quotations are available are valued at the official closing price or, if there is no official closing price that day, at the last sales price. Securities not listed on an exchange or the national securities market, or securities for which there were no transactions, are valued at the average of the most recent bid and asked prices, except for open short positions, where the asked price is used for valuation purposes. Bid price is used when no asked price is available. Registered investment companies that are not traded on an exchange are valued at their net asset value. All of the preceding securities are categorized within Level 1 of the fair value hierarchy.
Fair valuing of securities may be determined with the assistance of a pricing service using calculations based on indices of domestic securities
NOTES TO FINANCIAL STATEMENTS (continued)
and other appropriate indicators, such as prices of relevant American Depository Receipts and financial futures. Utilizing these techniques may result in transfers between Level 1 and Level 2 of the fair value hierarchy.
When market quotations or official closing prices are not readily available, or are determined not to reflect accurately fair value, such as when the value of a security has been significantly affected by events after the close of the exchange or market on which the security is principally traded (for example, a foreign exchange or market), but before the fund calculates its net asset value, the fund may value these investments at fair value as determined in accordance with the procedures approved by the Board. Certain factors may be considered when fair valuing investments such as: fundamental analytical data, the nature and duration of restrictions on disposition, an evaluation of the forces that influence the market in which the securities are purchased and sold, and public trading in similar securities of the issuer or comparable issuers. These securities are either categorized within Level 2 or 3 of the fair value hierarchy depending on the relevant inputs used.
For restricted securities where observable inputs are limited, assumptions about market activity and risk are used and are categorized within Level 3 of the fair value hierarchy.
The following is a summary of the inputs used as of November 30, 2013 in valuing the fund’s investments:
| | | | |
| | | Level 2—Other | Level 3— | |
| | Level 1— | Significant | Significant | |
| | Unadjusted | Observable | Unobservable | |
| | Quoted Prices | Inputs | Inputs | Total |
| Assets ($) | | | | |
| Investments in Securities: | | | |
| Equity Securities— | | | | |
| Domestic | | | | |
| Common Stocks† | 795,832,844 | — | — | 795,832,844 |
| Mutual Funds | 62,205,600 | — | — | 62,205,600 |
| |
| † | See Statement of Investments for additional detailed categorizations. |
24
At November 30, 2013, there were no transfers between Level 1 and Level 2 of the fair value hierarchy.
(b) Securities transactions and investment income: Securities transactions are recorded on a trade date basis. Realized gains and losses from securities transactions are recorded on the identified cost basis. Dividend income is recognized on the ex-dividend date and interest income, including, where applicable, accretion of discount and amortization of premium on investments, is recognized on the accrual basis.
Pursuant to a securities lending agreement with The Bank of New York Mellon, a subsidiary of BNY Mellon and an affiliate of Dreyfus, the fund may lend securities to qualified institutions. It is the fund’s policy that, at origination, all loans are secured by collateral of at least 102% of the value of U.S. securities loaned and 105% of the value of foreign securities loaned. Collateral equivalent to at least 100% of the market value of securities on loan is maintained at all times. Collateral is either in the form of cash, which can be invested in certain money market mutual funds managed by Dreyfus or U.S. Government and Agency securities.The fund is entitled to receive all dividends, interest and distributions on securities loaned, in addition to income earned as a result of the lending transaction. Should a borrower fail to return the securities in a timely manner, The Bank of New York Mellon is required to replace the securities for the benefit of the fund or credit the fund with the market value of the unreturned securities and is subrogated to the fund’s rights against the borrower and the collateral. During the period ended November 30, 2013,The Bank of NewYork Mellon earned $69,357 from lending portfolio securities, pursuant to the securities lending agreement.
(c) Affiliated issuers: Investments in other investment companies advised by Dreyfus are defined as “affiliated” under the Act. Investments
NOTES TO FINANCIAL STATEMENTS (continued)
in affiliated investment companies during the period ended November 30, 2013 were as follows:
| | | | | |
| Affiliated | | | | | |
| Investment | Value | | | Value | Net |
| Company | 11/30/2012 ($) | Purchases ($) | Sales ($) | 11/30/2013 ($) | Assets (%) |
| Dreyfus | | | | | |
| Institutional | | | | | |
| Preferred | | | | | |
| Plus Money | | | | | |
| Market | | | | | |
| Fund | 18,726,000 | 168,277,000 | 162,450,000 | 24,553,000 | 3.0 |
| Dreyfus | | | | | |
| Institutional | | | | | |
| Cash | | | | | |
| Advantage | | | | | |
| Fund | 4,361,023 | 255,188,230 | 221,896,653 | 37,652,600 | 4.6 |
| Total | 23,087,023 | 423,465,230 | 384,346,653 | 62,205,600 | 7.6 |
(d) Dividends to shareholders: Dividends are recorded on the ex-dividend date. Dividends from investment income-net and dividends from net realized capital gains, if any, are normally declared and paid annually, but the fund may make distributions on a more frequent basis to comply with the distribution requirements of the Internal Revenue Code of 1986, as amended (the “Code”).To the extent that net realized capital gains can be offset by capital loss carryovers, it is the policy of the fund not to distribute such gains. Income and capital gain distributions are determined in accordance with income tax regulations, which may differ from GAAP.
(e) Federal income taxes: It is the policy of the fund to continue to qualify as a regulated investment company, if such qualification is in the best interests of its shareholders, by complying with the applicable provisions of the Code, and to make distributions of taxable income sufficient to relieve it from substantially all federal income and excise taxes.
As of and during the period ended November 30, 2013, the fund did not have any liabilities for any uncertain tax positions.The fund recognizes interest and penalties, if any, related to uncertain tax positions as income tax expense in the Statement of Operations. During the period ended November 30, 2013, the fund did not incur any interest or penalties.
26
Each tax year in the four-year period ended November 30, 2013 remains subject to examination by the Internal Revenue Service and state taxing authorities.
At November 30, 2013, the components of accumulated earnings on a tax basis were as follows: undistributed ordinary income $4,611,574, undistributed capital gains $3,416,296 and unrealized appreciation $227,377,521.
The tax character of distributions paid to shareholders during the fiscal periods ended November 30, 2013 and November 30, 2012 were as follows: ordinary income $5,301,171 and $1,914,449, respectively.
NOTE 2—Bank Lines of Credit:
The fund participates with other Dreyfus-managed funds in a $265 million unsecured credit facility led by Citibank, N.A. and a $300 million unsecured credit facility provided by The Bank of New York Mellon (each, a “Facility”), each to be utilized primarily for temporary or emergency purposes, including the financing of redemptions. Prior to October 9, 2013, the unsecured credit facility with Citibank, N.A. was $210 million. In connection therewith, the fund has agreed to pay its pro rata portion of commitment fees for each Facility. Interest is charged to the fund based on rates determined pursuant to the terms of the respective Facility at the time of borrowing. During the period ended November 30, 2013, the fund did not borrow under the Facilities.
NOTE 3—Management Fee, Sub-Investment Advisory Fee and Other Transactions With Affiliates:
(a) Pursuant to a management agreement with Dreyfus, the management fee is computed at the annual rate of .75% of the value of the fund’s average daily net assets and is payable monthly. Dreyfus had contractually agreed from, December 1, 2012 through April 1, 2013, to waive receipt of its fees and/or assume the direct expenses of the fund, so that the expenses of none of the classes (excluding Rule 12b-1 Distribution Plan fees, Shareholder Services Plan fees, taxes, interest
NOTES TO FINANCIAL STATEMENTS (continued)
expense, brokerage commissions, commitment fees on borrowings and extraordinary expenses) exceeded 1.15% of the value of the fund’s average daily net assets. Thereafter, Dreyfus has contractually agreed, from April 2, 2013 through July 1, 2014, to waive receipt of its fees and/or assume the direct expenses of the fund, so that the expenses of none of the classes (excluding certain expenses as described above) exceed .90% of the value of the fund’s average daily net assets. The reduction in expenses, pursuant to the undertaking, amounted to $616 during the period ended November 30, 2013.
Pursuant to a sub-investment advisory agreement between Dreyfus and Walter Scott, Dreyfus pays Walter Scott a monthly fee at an annual percentage of the fund’s average daily net assets.
During the period ended November 30, 2013, the Distributor retained $1,445 from commissions earned on sales of the fund’s Class A shares.
(b) Under the Distribution Plan adopted pursuant to Rule 12b-1 under the Act, Class C shares pay the Distributor for distributing its shares at an annual rate of .75% of the value of its average daily net assets. During the period ended November 30, 2013, Class C shares were charged $3,420, pursuant to the Distribution Plan.
(c) Under the Shareholder Services Plan, Class A and Class C shares pay the Distributor at an annual rate of .25% of the value of their average daily net assets for the provision of certain services. The services provided may include personal services relating to shareholder accounts, such as answering shareholder inquiries regarding the fund and providing reports and other information, and services related to the maintenance of shareholder accounts. The Distributor may make payments to Service Agents (securities dealers, financial institutions or other industry professionals) with respect to these services. The Distributor determines the amounts to be paid to Service Agents. During the period ended November 30, 2013, Class A and Class C shares were charged $4,577 and $1,140, respectively, pursuant to the Shareholder Services Plan.
28
The fund has arrangements with the transfer agent and the custodian whereby the fund may receive earnings credits when positive cash balances are maintained, which are used to offset transfer agency and custody fees. For financial reporting purposes, the fund includes net earnings credits as an expense offset in the Statement of Operations.
The fund compensates DreyfusTransfer, Inc., a wholly-owned subsidiary of Dreyfus, under a transfer agency agreement for providing transfer agency and cash management services for the fund. The majority of transfer agency fees are comprised of amounts paid on a per account basis, while cash management fees are related to fund subscriptions and redemptions. During the period ended November 30, 2013, the fund was charged $4,773 for transfer agency services and $124 for cash management services.These fees are included in Shareholder servicing costs in the Statement of Operations. Cash management fees were partially offset by earnings credits of $15.
The fund compensates The Bank of NewYork Mellon under a custody agreement for providing custodial services for the fund.These fees are determined based on net assets, geographic region and transaction activity. During the period ended November 30, 2013, the fund was charged $49,733 pursuant to the custody agreement.
The fund compensated The Bank of New York Mellon under a cash management agreement that was in effect until September 30, 2013 for performing certain cash management services related to fund subscriptions and redemptions. During the period ended November 30, 2013, the fund was charged $56 pursuant to the cash management agreement, which is included in Shareholder servicing costs in the Statement of Operations.
During the period ended November 30, 2013, the fund was charged $9,055 for services performed by the Chief Compliance Officer and his staff.
NOTES TO FINANCIAL STATEMENTS (continued)
The components of “Due to The Dreyfus Corporation and affiliates” in the Statement of Assets and Liabilities consist of: management fees $501,795, Distribution Plan fees $598, Shareholder Services Plan fees $699, custodian fees $22,124, Chief Compliance Officer fees $3,833 and transfer agency fees $1,326, which are offset against an expense reimbursement currently in effect in the amount of $368.
(d) Each Board member also serves as a Board member of other funds within the Dreyfus complex. Annual retainer fees and attendance fees are allocated to each fund based on net assets.
NOTE 4—Securities Transactions:
The aggregate amount of purchases and sales of investment securities, excluding short-term securities, during the period ended November 30, 2013, amounted to $156,184,256 and $46,506,166, respectively.
At November 30, 2013, the cost of investments for federal income tax purposes was $630,660,923; accordingly, accumulated net unrealized appreciation on investments was $227,377,521, consisting of $231,559,478 gross unrealized appreciation and $4,181,957 gross unrealized depreciation.
30
|
| REPORT OF INDEPENDENT REGISTERED |
| PUBLIC ACCOUNTING FIRM |
Shareholders and Board of Directors
Dreyfus U.S. Equity Fund
We have audited the accompanying statement of assets and liabilities, including the statement of investments, of Dreyfus U.S. Equity Fund (one of the series comprising Strategic Funds, Inc.) as of November 30, 2013, and the related statement of operations for the year then ended, the statement of changes in net assets for each of the two years in the period then ended, and the financial highlights for each of the periods indicated therein. These financial statements and financial highlights are the responsibility of the Fund’s management. Our responsibility is to express an opinion on these financial statements and financial highlights based on our audits.
We conducted our audits in accordance with the standards of the Public Company Accounting Oversight Board (United States).Those standards require that we plan and perform the audit to obtain reasonable assurance about whether the financial statements and financial highlights are free of material misstatement.We were not engaged to perform an audit of the Fund’s internal control over financial reporting. Our audits included consideration of internal control over financial reporting as a basis for designing audit procedures that are appropriate in the circumstances, but not for the purpose of expressing an opinion on the effectiveness of the Fund’s internal control over financial reporting. Accordingly, we express no such opinion. An audit also includes examining, on a test basis, evidence supporting the amounts and disclosures in the financial statements and financial highlights, assessing the accounting principles used and significant estimates made by management, and evaluating the overall financial statement presentation. Our procedures included confirmation of securities owned as of November 30, 2013 by correspondence with the custodian and others. We believe that our audits provide a reasonable basis for our opinion.
In our opinion, the financial statements and financial highlights referred to above present fairly, in all material respects, the financial position of Dreyfus U.S. Equity Fund at November 30, 2013, the results of its operations for the year then ended, the changes in its net assets for each of the two years in the period then ended, and the financial highlights for each of the indicated periods, in conformity with U.S. generally accepted accounting principles.

New York, New York
January 27, 2014
IMPORTANT TAX INFORMATION (Unaudited)
For federal tax purposes, the fund hereby reports 100% of the ordinary dividends paid during the fiscal year ended November 30, 2013 as qualifying for the corporate dividends received deduction.Also, certain dividends paid by the fund may be subject to a maximum tax rate of 15%, as provided for by the Jobs and Growth Tax Relief Reconciliation Act of 2003. Of the distributions paid during the fiscal year, $5,301,171 represents the maximum amount that may be considered qualified dividend income. Shareholders will receive notification in early 2014 of the percentage applicable to the preparation of their 2013 income tax returns.
32
|
| INFORMATION ABOUT THE RENEWAL OF THE |
| FUND’S MANAGEMENT AND SUB-INVESTMENT |
| ADVISORY AGREEMENTS (Unaudited) |
At a meeting of the fund’s Board of Directors held on November 4-5, 2013, the Board considered the renewal of the fund’s Management Agreement, pursuant to which Dreyfus provides the fund with investment advisory and administrative services (the “Agreement”), and the Sub-Investment Advisory Agreement (together, the “Agreements”), pursuant to which Walter Scott & Partners Limited (the “Sub-Adviser”) provides day-to-day management of the fund’s investments.The Board members, none of whom are “interested persons” (as defined in the Investment Company Act of 1940, as amended) of the fund, were assisted in their review by independent legal counsel and met with counsel in executive session separate from representatives of Dreyfus and the Sub-Adviser. In considering the renewal of the Agreements, the Board considered all factors that it believed to be relevant, including those discussed below. The Board did not identify any one factor as dispositive, and each Board member may have attributed different weights to the factors considered.
Analysis of Nature, Extent, and Quality of Services Provided to the Fund. The Board considered information provided to them at the meeting and in previous presentations from Dreyfus representatives regarding the nature, extent, and quality of the services provided to funds in the Dreyfus fund complex. Dreyfus provided the number of open accounts in the fund, the fund’s asset size and the allocation of fund assets among distribution channels. Dreyfus also had previously provided information regarding the diverse intermediary relationships and distribution channels of funds in the Dreyfus fund complex (such as retail direct or intermediary, in which intermediaries typically are paid by the fund and/or Dreyfus) and Dreyfus’ corresponding need for broad, deep, and diverse resources to be able to provide ongoing shareholder services to each intermediary or distribution channel, as applicable to the fund.
The Board also considered research support available to, and portfolio management capabilities of, the fund’s portfolio management personnel and that Dreyfus also provides oversight of day-to-day fund operations,
|
| INFORMATION ABOUT THE RENEWAL OF THE FUND’S MANAGEMENT AND |
| SUB-INVESTMENT ADVISORY AGREEMENTS (Unaudited) (continued) |
including fund accounting and administration and assistance in meeting legal and regulatory requirements. The Board also considered Dreyfus’ extensive administrative, accounting, and compliance infrastructures, as well as Dreyfus’ supervisory activities over the Sub-Adviser.The Board also considered portfolio management’s brokerage policies and practices (including policies and practices regarding soft dollars) and the standards applied in seeking best execution.
Comparative Analysis of the Fund’s Performance and Management Fee and Expense Ratio. The Board reviewed reports prepared by Lipper, Inc. (“Lipper”), an independent provider of investment company data, which included information comparing (1) the fund’s performance with the performance of a group of comparable funds (the “Performance Group”) and with a broader group of funds (the “Performance Universe”), all for various periods ended September 30, 2013, and (2) the fund’s actual and contractual management fees and total expenses with those of a group of comparable funds (the “Expense Group”) and with a broader group of funds (the “Expense Universe”), the information for which was derived in part from fund financial statements available to Lipper as of the date of its analysis. Dreyfus previously had furnished the Board with a description of the methodology Lipper used to select the Performance Group and Performance Universe and the Expense Group and Expense Universe.
Dreyfus representatives stated that the usefulness of performance comparisons may be affected by a number of factors, including different investment limitations that may be applicable to the fund and comparison funds. The Board discussed the results of the comparisons and noted that the fund’s total return performance was below the Performance Group and Performance Universe medians for all periods except for the three-year period when the fund’s performance was above the Performance Group median and the one-year period when the fund’s performance was above the Performance Universe median. Dreyfus also provided a comparison of the fund’s calendar year total
34
returns to the returns of the fund’s benchmark index and noted that the fund’s performance was above the returns of the benchmark in two of the four years.
The Board received a presentation from a representative of the Sub-Adviser describing the fund’s investment strategy and performance generally over the past two calendar years as well as the appeal to fund shareholders of the Sub-Adviser’s low beta and benchmark-agnostic investment approach, as reflected in the fund’s continuing net asset growth since inception. During this presentation, the Board noted how the Sub-Adviser’s benchmark-agnostic investment approach can be expected to result in periods of significant outperformance and underperformance from time to time.
The Board also reviewed the range of actual and contractual management fees and total expenses of the Expense Group and Expense Universe funds and discussed the results of the comparisons.The Board noted that the fund’s contractual management fee was below the Expense Group median, the fund’s actual management fee was below the Expense Group median and slightly above the Expense Universe median, and the fund’s total expenses were below the Expense Group and Expense Universe medians (lowest in the Expense Group).
Dreyfus representatives noted that Dreyfus has contractually agreed to waive receipt of its fees and/or assume the expenses of the fund, until July 1, 2014, so that annual direct fund operating expenses (excluding Rule 12b-1 fees, shareholder services fees, taxes, interest, brokerage commissions, commitment fees on borrowings, acquired fund fees and extraordinary expenses) do not exceed .90% of the fund’s average daily net assets.
Dreyfus representatives reviewed with the Board the management or investment advisory fees (1) paid by funds advised or administered by Dreyfus that are in the same Lipper category as the fund and (2) paid to Dreyfus or the Sub-Adviser or its affiliates for advising any separate
|
| INFORMATION ABOUT THE RENEWAL OF THE FUND’S MANAGEMENT AND |
| SUB-INVESTMENT ADVISORY AGREEMENTS (Unaudited) (continued) |
accounts and/or other types of client portfolios that are considered to have similar investment strategies and policies as the fund (the “Similar Clients”), and explained the nature of the Similar Clients.They discussed differences in fees paid and the relationship of the fees paid in light of any differences in the services provided and other relevant factors.The Board considered the relevance of the fee information provided for the Similar Clients to evaluate the appropriateness and reasonableness of the fund’s management fee.
The Board considered the fee to the Sub-Adviser in relation to the fee paid to Dreyfus by the fund and the respective services provided by the Sub-Adviser and Dreyfus.The Board also noted the Sub-Adviser’s fee is paid by Dreyfus (out of its fee from the fund) and not the fund.
Analysis of Profitability and Economies of Scale. Dreyfus representatives reviewed the expenses allocated and profit received by Dreyfus and the resulting profitability percentage for managing the fund and the aggregate profitability percentage to Dreyfus of managing the funds in the Dreyfus fund complex, and the method used to determine the expenses and profit. The Board concluded that the profitability results were not unreasonable, given the services rendered and service levels provided by Dreyfus. The Board also had been provided with information prepared by an independent consulting firm regarding Dreyfus’ approach to allocating costs to, and determining the profitability of, individual funds and the entire Dreyfus fund complex.The consulting firm also had analyzed where any economies of scale might emerge in connection with the management of a fund.
The Board considered on the advice of its counsel the profitability analysis (1) as part of its evaluation of whether the fees under the Agreements bear a reasonable relationship to the mix of services provided by Dreyfus and the Sub-Adviser, including the nature, extent, and quality of such services, and (2) in light of the relevant circumstances for the fund and the extent to which economies of scale would be realized if the fund grows and whether fee levels reflect these economies of scale
36
for the benefit of fund shareholders. Since Dreyfus, and not the fund, pays the Sub-Adviser pursuant to the Sub-Investment Advisory Agreement, the Board did not consider the Sub-Adviser’s profitability to be relevant to its deliberations. Dreyfus representatives also noted that, as a result of shared and allocated costs among funds in the Dreyfus fund complex, the extent of economies of scale could depend substantially on the level of assets in the complex as a whole, so that increases and decreases in complex-wide assets can affect potential economies of scale in a manner that is disproportionate to, or even in the opposite direction from, changes in the fund’s asset level.The Board also considered potential benefits to Dreyfus and the Sub-Adviser from acting as investment adviser and sub-investment adviser, respectively, and noted the soft dollar arrangements in effect for trading the fund’s investments.
At the conclusion of these discussions, the Board agreed that it had been furnished with sufficient information to make an informed business decision with respect to the renewal of the Agreements. Based on the discussions and considerations as described above, the Board concluded and determined as follows.
The Board concluded that the nature, extent, and quality of the services provided by Dreyfus and the Sub-Adviser are adequate and appropriate.
The Board generally was satisfied with the fund’s overall performance, in light of the considerations described above.
The Board concluded that the fees paid to Dreyfus and the Sub- Adviser were reasonable in light of the considerations described above.
The Board determined that the economies of scale which may accrue to Dreyfus and its affiliates in connection with the management of the fund had been adequately considered by Dreyfus in connection with the fee rate charged to the fund pursuant to the Agreement and that, to the extent in the future it were determined that material economies of scale had not been shared with the fund, the Board would seek to have those economies of scale shared with the fund.
|
| INFORMATION ABOUT THE RENEWAL OF THE FUND’S MANAGEMENT AND |
| SUB-INVESTMENT ADVISORY AGREEMENTS (Unaudited) (continued) |
In evaluating the Agreements, the Board considered these conclusions and determinations and also relied on its previous knowledge, gained through meetings and other interactions with Dreyfus and its affiliates and the Sub-Adviser, of the fund and the services provided to the fund by Dreyfus and the Sub-Adviser.The Board also relied on information received on a routine and regular basis throughout the year relating to the operations of the fund and the investment management and other services provided under the Agreements, including information on the investment performance of the fund in comparison to similar mutual funds and benchmark performance indices; general market outlook as applicable to the fund; and compliance reports. In addition, the Board’s consideration of the contractual fee arrangements for this fund had the benefit of a number of years of reviews of prior or similar agreements during which lengthy discussions took place between the Board and Dreyfus representatives. Certain aspects of the arrangements may receive greater scrutiny in some years than in others, and the Board’s conclusions may be based, in part, on their consideration of the same or similar arrangements in prior years.The Board determined that renewal of the Agreements was in the best interests of the fund and its shareholders.
38
BOARD MEMBERS INFORMATION (Unaudited)
|
| Joseph S. DiMartino (70) |
| Chairman of the Board (1995) |
| Principal Occupation During Past 5Years: |
| • Corporate Director and Trustee |
| Other Public Company Board Memberships During Past 5Years: |
| • CBIZ (formerly, Century Business Services, Inc.), a provider of outsourcing functions for small |
| and medium size companies, Director (1997-present) |
| • The Newark Group, a provider of a national market of paper recovery facilities, paperboard |
| mills and paperboard converting plants, Director (2000-2010) |
| • Sunair Services Corporation, a provider of certain outdoor-related services to homes and |
| businesses, Director (2005-2009) |
| No. of Portfolios for which Board Member Serves: 141 |
| ——————— |
| William Hodding Carter III (78) |
| Board Member (1988) |
| Principal Occupation During Past 5Years: |
| • Professor of Leadership & Public Policy, University of North Carolina, Chapel Hill (2006-present) |
| No. of Portfolios for which Board Member Serves: 24 |
| ——————— |
| Gordon J. Davis (72)† |
| Board Member (2006) |
| Principal Occupation During Past 5Years: |
| • Partner in the law firm of Venable LLP (2012-present) |
| • Partner in the law firm of Dewey & LeBoeuf LLP (1994-2012) |
| Other Public Company Board Memberships During Past 5Years: |
| • Consolidated Edison, Inc., a utility company, Director (1997-present) |
| • The Phoenix Companies, Inc., a life insurance company, Director (2000-present) |
| No. of Portfolios for which Board Member Serves: 49 |
| † Mr. Davis is deemed to be an “interested person” (as defined in the Act) of the fund as a result of his affiliation with |
| Venable LLP, which provides legal services to the fund. |
| ——————— |
| Joni Evans (71) |
| Board Member (2006) |
| Principal Occupation During Past 5Years: |
| • Chief Executive Officer, www.wowOwow.com an online community dedicated to women’s |
| conversations and publications (2007-present) |
| • Principal, Joni Evans Ltd. (publishing) (2006-present) |
| No. of Portfolios for which Board Member Serves: 24 |
BOARD MEMBERS INFORMATION (Unaudited) (continued)
|
| Ehud Houminer (73) |
| Board Member (1994) |
| Principal Occupation During Past 5Years: |
| • Executive-in-Residence at the Columbia Business School, Columbia University (1992-present) |
| Other Public Company Board Memberships During Past 5Years: |
| • Avnet Inc., an electronics distributor, Director (1993-2012) |
| No. of Portfolios for which Board Member Serves: 66 |
| ——————— |
| Richard C. Leone (73) |
| Board Member (1984) |
| Principal Occupation During Past 5Years: |
| • Senior Fellow and former President of The Century Foundation (formerly, The Twentieth |
| Century Fund, Inc.), a tax exempt research foundation engaged in the study of economic, foreign |
| policy and domestic issues |
| No. of Portfolios for which Board Member Serves: 24 |
| ——————— |
| Hans C. Mautner (76) |
| Board Member (1984) |
| Principal Occupation During Past 5Years: |
| • President—International Division and an Advisory Director of Simon Property Group, a real |
| estate investment company (1998-2010) |
| • Chairman and Chief Executive Officer of Simon Global Limited, a real estate company (1999-2010) |
| No. of Portfolios for which Board Member Serves: 24 |
| ——————— |
| Robin A. Melvin (50) |
| Board Member (1995) |
| Principal Occupation During Past 5Years: |
| • Board Member, Illinois Mentoring Partnership, non-profit organization dedicated to increasing |
| the quantity and quality of mentoring services in Illinois (2013-present) |
| • Director, Boisi Family Foundation, a private family foundation that supports youth-serving orga- |
| nizations that promote the self sufficiency of youth from disadvantaged circumstances (1995-2012) |
| No. of Portfolios for which Board Member Serves: 90 |
40
|
| Burton N. Wallack (63) |
| Board Member (2006) |
| Principal Occupation During Past 5Years: |
| • President and Co-owner of Wallack Management Company, a real estate management company |
| No. of Portfolios for which Board Member Serves: 24 |
| ——————— |
| John E. Zuccotti (76) |
| Board Member (1984) |
| Principal Occupation During Past 5Years: |
| • Chairman of Brookfield Properties, Inc. |
| • Senior Counsel of Weil, Gotshal & Manges, LLP |
| • Emeritus Chairman of the Real Estate Board of New York |
| Other Public Company Board Memberships During Past 5Years: |
| • Wellpoint, Inc., a health benefits company, Director (2005-2010) |
| No. of Portfolios for which Board Member Serves: 24 |
| ——————— |
Once elected all Board Members serve for an indefinite term, but achieve Emeritus status upon reaching age 80.The address of the Board Members and Officers is c/o The Dreyfus Corporation, 200 Park Avenue, NewYork, NewYork 10166. Additional information about the Board Members is available in the fund’s Statement of Additional Information which can be obtained from Dreyfus free of charge by calling this toll free number: 1-800-DREYFUS.
David W. Burke, Emeritus Board Member
Arnold S. Hiatt, Emeritus Board Member
OFFICERS OF THE FUND (Unaudited)
BRADLEY J. SKAPYAK, President since January 2010.
Chief Operating Officer and a director of the Manager since June 2009, Chairman of Dreyfus Transfer, Inc., an affiliate of the Manager and the transfer agent of the funds, since May 2011 and Executive Vice President of the Distributor since June 2007. From April 2003 to June 2009, Mr. Skapyak was the head of the Investment Accounting and Support Department of the Manager. He is an officer of 68 investment companies (comprised of 141 portfolios) managed by the Manager. He is 55 years old and has been an employee of the Manager since February 1988.
JOHN PAK, Chief Legal Officer since March 2013.
Chief Legal Officer of the Manager and Associate General Counsel and Managing Director of BNY Mellon since August 2012; from March 2005 to July 2012, Managing Director of Deutsche Bank, Deputy Global Head of Deutsche Asset Management Legal and Regional Head of Deutsche Asset Management Americas Legal. He is an officer of 69 investment companies (comprised of 166 portfolios) managed by the Manager. He is 45 years old and has been an employee of the Manager since August 2012.
JANETTE E. FARRAGHER, Vice President and Secretary since December 2011.
Assistant General Counsel of BNY Mellon, and an officer of 69 investment companies (comprised of 166 portfolios) managed by the Manager. She is 50 years old and has been an employee of the Manager since February 1984.
KIESHA ASTWOOD, Vice President and Assistant Secretary since January 2010.
Counsel of BNY Mellon, and an officer of 69 investment companies (comprised of 166 portfolios) managed by the Manager. She is 40 years old and has been an employee of the Manager since July 1995.
JAMES BITETTO, Vice President and Assistant Secretary since August 2005.
Senior Counsel of BNY Mellon and Secretary of the Manager, and an officer of 69 investment companies (comprised of 166 portfolios) managed by the Manager. He is 47 years old and has been an employee of the Manager since December 1996.
JONI LACKS CHARATAN, Vice President and Assistant Secretary since August 2005.
Senior Counsel of BNY Mellon, and an officer of 69 investment companies (comprised of 166 portfolios) managed by the Manager. She is 58 years old and has been an employee of the Manager since October 1988.
JOSEPH M. CHIOFFI, Vice President and Assistant Secretary since August 2005.
Senior Counsel of BNY Mellon, and an officer of 69 investment companies (comprised of 166 portfolios) managed by the Manager. He is 52 years old and has been an employee of the Manager since June 2000.
JOHN B. HAMMALIAN, Vice President and Assistant Secretary since August 2005.
Senior Managing Counsel of BNY Mellon, and an officer of 69 investment companies (comprised of 166 portfolios) managed by the Manager. He is 50 years old and has been an employee of the Manager since February 1991.
ROBERT R. MULLERY, Vice President and Assistant Secretary since August 2005.
Managing Counsel of BNY Mellon, and an officer of 69 investment companies (comprised of 166 portfolios) managed by the Manager. He is 61 years old and has been an employee of the Manager since May 1986.
42
JEFF PRUSNOFSKY, Vice President and Assistant Secretary since September 2003.
Senior Managing Counsel of BNY Mellon, and an officer of 69 investment companies (comprised of 166 portfolios) managed by the Manager. He is 48 years old and has been an employee of the Manager since October 1990.
JAMES WINDELS, Treasurer since September 2003.
Director – Mutual Fund Accounting of the Manager, and an officer of 69 investment companies (comprised of 166 portfolios) managed by the Manager. He is 55 years old and has been an employee of the Manager since April 1985.
RICHARD CASSARO, Assistant Treasurer since January 2008.
Senior Accounting Manager – Money Market and Municipal Bond Funds of the Manager, and an officer of 69 investment companies (comprised of 166 portfolios) managed by the Manager. He is 54 years old and has been an employee of the Manager since September 1982.
GAVIN C. REILLY, Assistant Treasurer since December 2005.
Tax Manager of the Investment Accounting and Support Department of the Manager, and an officer of 69 investment companies (comprised of 166 portfolios) managed by the Manager. He is 45 years old and has been an employee of the Manager since April 1991.
ROBERT S. ROBOL, Assistant Treasurer since August 2005.
Senior Accounting Manager – Fixed Income Funds of the Manager, and an officer of 69 investment companies (comprised of 166 portfolios) managed by the Manager. He is 49 years old and has been an employee of the Manager since October 1988.
ROBERT SALVIOLO, Assistant Treasurer since July 2007.
Senior Accounting Manager – Equity Funds of the Manager, and an officer of 69 investment companies (comprised of 166 portfolios) managed by the Manager. He is 46 years old and has been an employee of the Manager since June 1989.
ROBERT SVAGNA, Assistant Treasurer since September 2002.
Senior Accounting Manager – Equity Funds of the Manager, and an officer of 69 investment companies (comprised of 166 portfolios) managed by the Manager. He is 46 years old and has been an employee of the Manager since November 1990.
JOSEPH W. CONNOLLY, Chief Compliance Officer since October 2004.
Chief Compliance Officer of the Manager and The Dreyfus Family of Funds (69 investment companies, comprised of 166 portfolios). He is 56 years old and has served in various capacities with the Manager since 1980, including manager of the firm’s Fund Accounting Department from 1997 through October 2001.
MATTHEW D. CONNOLLY, Anti-Money Laundering Compliance Officer since April 2012.
Anti-Money Laundering Compliance Officer of the Distributor since October 2011; from March 2010 to September 2011, Global Head, KYC Reviews and Director, UBS Investment Bank; until March 2010, AML Compliance Officer and Senior Vice President, Citi Global Wealth Management. He is an officer of 64 investment companies (comprised of 161 portfolios) managed by the Manager. He is 41 years old and has been an employee of the Distributor since October 2011.
For More Information
Telephone Call your financial representative or 1-800-DREYFUS
Mail The Dreyfus Family of Funds, 144 Glenn Curtiss Boulevard, Uniondale, NY 11556-0144
The fund files its complete schedule of portfolio holdings with the Securities and Exchange Commission (“SEC”) for the first and third quarters of each fiscal year on Form N-Q. The fund’s Forms N-Q are available on the SEC’s website at http://www.sec.gov and may be reviewed and copied at the SEC’s Public Reference Room in Washington, DC. Information on the operation of the Public Reference Room may be obtained by calling 1-800-SEC-0330.
A description of the policies and procedures that the fund uses to determine how to vote proxies relating to portfolio securities, and information regarding how the fund voted these proxies for the most recent 12-month period ended June 30 is available at http://www.dreyfus.com and on the SEC’s website at http://www.sec.gov. The description of the policies and procedures is also available without charge, upon request, by calling 1-800-DREYFUS.
| |
| | ® |
| © 2014 MBSC Securities Corporation | 6011AR1113 |
|
| Dreyfus |
| Select Managers |
| Small Cap Value Fund |
ANNUAL REPORT November 30, 2013

Save time. Save paper. View your next shareholder report online as soon as it’s available. Log into www.dreyfus.com and sign up for Dreyfus eCommunications. It’s simple and only takes a few minutes.
The views expressed in this report reflect those of the portfolio manager only through the end of the period covered and do not necessarily represent the views of Dreyfus or any other person in the Dreyfus organization. Any such views are subject to change at any time based upon market or other conditions and Dreyfus disclaims any responsibility to update such views.These views may not be relied on as investment advice and, because investment decisions for a Dreyfus fund are based on numerous factors, may not be relied on as an indication of trading intent on behalf of any Dreyfus fund.
|
| Not FDIC-Insured • Not Bank-Guaranteed • May LoseValue |
| | Contents |
| | THE FUND |
| 2 | A Letter from the President |
| 3 | Discussion of Fund Performance |
| 6 | Fund Performance |
| 8 | UnderstandingYour Fund’s Expenses |
| 8 | ComparingYour Fund’s Expenses With Those of Other Funds |
| 9 | Statement of Investments |
| 25 | Statement of Assets and Liabilities |
| 26 | Statement of Operations |
| 27 | Statement of Changes in Net Assets |
| 29 | Financial Highlights |
| 33 | Notes to Financial Statements |
| 44 | Report of Independent Registered Public Accounting Firm |
| 45 | Important Tax Information |
| 46 | Information About the Renewal of the Fund’s Management, Portfolio Allocation Management and Sub-Invesment Advisory Agreements |
| 52 | Board Members Information |
| 55 | Officers of the Fund |
| | FOR MORE INFORMATION |
| | Back Cover |
Dreyfus
Select Managers
Small Cap Value Fund
The Fund
A LETTER FROM THE PRESIDENT
Dear Shareholder:
We are pleased to present this annual report for Dreyfus Select Managers Small Cap Value Fund, covering the 12-month period from December 1, 2012, through November 30, 2013. For information about how the fund performed during the reporting period, as well as general market perspectives, we provide a Discussion of Fund Performance on the pages that follow.
Although expectations of higher long-term interest rates and a more moderately stimulative monetary policy sparked volatility in the U.S. stock market at times during the reporting period, improved U.S. economic conditions drove stock prices substantially higher for the reporting period overall. Even the 16-day U.S. government shutdown in October failed to derail the market’s advance, enabling some broad measures of stock market performance to reach new record highs by the reporting period’s end. Stocks across most capitalization ranges and investment styles produced strong results.
We currently expect U.S. economic conditions to continue to improve in 2014, with accelerating growth supported by the fading drags of tighter federal fiscal policies and downsizing on the state and local levels. Moreover, inflation is likely to remain muted, so monetary policy can remain stimulative. Globally, we anticipate stronger growth in many developed countries due to past and continuing monetary ease, while emerging markets seem poised for more moderate economic expansion. For more information on how these observations may affect your investments, we encourage you to speak with your financial advisor.
Thank you for your continued confidence and support.

J. Charles Cardona
President
The Dreyfus Corporation
December 16, 2013
2
DISCUSSION OF FUND PERFORMANCE
For the reporting period of December 1, 2012, through November 30, 2013, as provided by Keith L. Stransky and Robert B. Mayerick, Portfolio Allocation Managers, EACM Advisors LLC
Fund and Market Performance Overview
For the 12-month period ended November 30, 2013, Dreyfus Select Managers Small Cap Value Fund’s Class A shares produced a total return of 40.73%, Class C shares returned 39.69%, and Class I shares returned 41.27%.1 In comparison, the Russell 2000Value Index (the “Index”), the fund’s benchmark, returned 37.60% for the same period.2 The fund’s Class Y shares produced a total return of 16.61% for the period since its inception of July 1, 2013, through November 30, 2013.
U.S. stocks responded positively to stronger economic growth during the reporting period.The fund outperformed its benchmark, as its underlying investment managers proved successful in nine out of 10 market sectors.
The Fund’s Investment Approach
The fund seeks capital appreciation.To pursue its goal, the fund normally invests at least 80% of its net assets in the stocks of small-cap companies.The fund uses a “multi-manager” approach by selecting one or more sub-advisers to manage its assets.As the fund’s portfolio allocation managers, we seek sub-advisers that complement one another’s style of investing, consistent with the fund’s investment goal.We monitor and evaluate the performance of the sub-advisers and will make corresponding recommendations to Dreyfus and the fund’s Board based on our evaluations.
The fund’s assets are currently under the day-to-day portfolio management of seven sub-advisers, each acting independently of one another and using their own methodology to select portfolio investments.As of the end of the reporting period, 17% of the fund’s assets are under the management ofThompson, Siegel, andWalmsley, LLC, which employs a combination of quantitative and qualitative security selection methods based on a four-factor valuation model. Approximately 22% of the fund’s assets are under the management of Walthausen & Co., LLC, which uses a proprietary valuation model to identify companies that are trading at a discount to their intrinsic values. Approximately 14% of the fund’s assets are under the management of Neuberger Berman Management LLC, which uses fundamental analysis and a bottom-up stock selection process to identify publicly traded small-cap companies selling at a material
DISCUSSION OF FUND PERFORMANCE (continued)
discount to their intrinsic value.Approximately 18% of the fund’s assets are under the management of Lombardia Capital Partners, which uses fundamental analysis and a bottom-up value-oriented approach in seeking stocks trading below their intrinsic values.Approximately 9% of the fund’s assets are under the management of Iridian Asset Management LLC, which employs bottom-up stock selection and a disciplined valuation process to identify and invest in corporate change.Approximately 12% of the fund’s assets are under the management of Vulcan Value Partners, LLC, which seeks companies with sustainable competitive advantages that may enable them to earn superior cash returns on capital. Approximately 8% of the fund’s assets are under the management of Kayne Anderson Rudnick Investment Management, LLC, which employs a fundamental, bottom-up, research-driven investment process in seeking to identify high-quality companies whose securities are trading at attractive valuations. These percentages can change over time, within ranges described in the prospectus.
Please note that subsequent to the reporting period covered herein, Vulcan Value Partners, LLC, notified Dreyfus that it will terminate its services effective March 26, 2014. Accordingly, the new target percentages of the fund’s assets to be allocated to the fund’s remaining sub-advisers by that date will be 19% to Neuberger Berman Management LLC, 12% to Iridian Asset Management LLC, 14% to Kayne Anderson Rudnick Invesment Management, 20% to Lombardia Capital Partners, 15% to Thompson Siegel & Walmsley LLC, and 20% to Walthausen & Company, LLC.
Recovering Economy Fueled Market’s Gains
U.S. stocks rallied early in the reporting period amid an economic rebound fueled by falling unemployment rates and recovering housing markets. However, stocks saw heightened volatility in June 2013, after the Federal Reserve Board (the “Fed”) indicated in May that it would back away from its ongoing quantitative easing program sooner than expected. Equities generally stabilized over the summer, and they advanced strongly in the fall when the Fed unexpectedly refrained from tapering its bond purchasing program. Even a federal government shutdown in October failed to derail the rally, enabling some broad measures of stock market performance to reach record highs by the reporting period’s end.
Security Selections Produced Favorable Results
In this environment, allocations of the fund’s assets among its underlying investment managers proved well positioned, and we made no strategic changes over the reporting
4
period.The fund’s investment managers were especially successful in the financials sector, where relative performance benefited from underweighted exposure to real estate financial trusts (“REITs”), which comprise the largest single industry group in the Index’s financials sector. Conversely, the fund held an overweighted position in the information technology sector, where strong stock selections included GT Advanced Technologies, whose sapphire-based materials are used in an expanding array of electronics. In addition, technology services provider SYNNEX Corp. gained value after acquiring a business that will be accretive to earnings.
The fund’s relative results proved disappointing only in the consumer discretionary sector, where retailers such as rent-to-own operator Rent-A-Center, women’s apparel seller Ascena Retail Group, and clothing retailer Chico’s FAS struggled with sluggish store traffic.
Finding Opportunities in a Rising Market
Although valuations have expanded, on average, after the reporting period’s gains, we currently expect earnings of small-cap companies to grow at a relatively robust rate as the economic recovery gains additional traction. Indeed, the fund’s underlying investment managers report that they continue to identify ample opportunities among individual companies meeting their respective value-oriented investment criteria.
December 16, 2013
Equity funds are subject generally to market, market sector, market liquidity, issuer and investment style risks, among other factors, to varying degrees, all of which are more fully described in the fund’s prospectus.
The prices of small company stocks tend to be more volatile than the prices of large company stocks, mainly because these companies have less established and more volatile earnings histories.They also tend to be less liquid than larger company stocks.
|
| 1 Total return includes reinvestment of dividends and any capital gains paid, and does not take into consideration the |
| maximum initial sales charge in the case of Class A shares, or the applicable contingent deferred sales charge imposed |
| on redemptions in the case of Class C shares. Had these charges been reflected, returns would have been lower. Past |
| performance is no guarantee of future results. Share price and investment return fluctuate such that upon redemption, |
| fund shares may be worth more or less than their original cost. Return figures provided reflect the absorption of certain |
| fund expenses by The Dreyfus Corporation pursuant to an undertaking in effect through July 1, 2014, at which time |
| it may be extended, terminated or modified. Had these expenses not been absorbed, the fund’s returns would have |
| been lower for Class A, C andY shares. |
| 2 SOURCE: LIPPER INC. — Reflects the reinvestment of dividends and, where applicable, capital gain |
| distributions.The Russell 2000 Value Index is an unmanaged index, which measures the performance of those |
| Russell 2000 companies with lower price-to-book ratios and lower forecasted growth values. Investors cannot invest |
| directly in any index. |
FUND PERFORMANCE
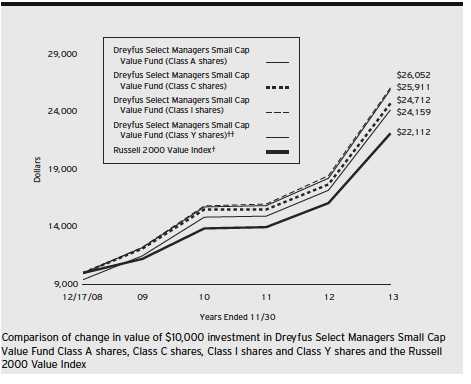
| |
| † | Source: Lipper Inc. |
| †† | The total return figures presented for ClassY shares of the fund reflect the performance of the fund’s Class A shares |
| | for the period prior to 7/1/13 (the inception date for ClassY shares). |
Past performance is not predictive of future performance.
The above graph compares a $10,000 investment made in each of the Class A, Class C, Class I and ClassY shares of Dreyfus Select Managers Small Cap Value Fund on 12/17/08 (inception date) to a $10,000 investment made in the Russell 2000 Value Index (the “Index”) on that date. All dividends and capital gain distributions are reinvested.
On April 29, 2013, the Board authorized the fund to offer ClassY shares, as a new class of shares, to certain investors, including certain institutional investors. On July 1, 2013, ClassY shares were offered at net asset value and are not subject to certain fees, including Distribution Plan and Shareholder Services Plan fees.
The fund’s performance shown in the line graph above takes into account the maximum initial sales charge on Class A shares and all other applicable fees and expenses on all classes.The Index is an unmanaged index, which measures the performance of those Russell 2000 companies with lower price-to-book ratios and lower forecasted growth values. Unlike a mutual fund, the Index is not subject to charges, fees and other expenses. Investors cannot invest directly in any index. These factors can contribute to the Index potentially outperforming the fund. Further information relating to fund performance, including expense reimbursements, if applicable, is contained in the Financial Highlights section of the prospectus and elsewhere in this report.
6
| | | | | |
| Average Annual Total Returns as of 11/30/13 | | | | |
| | Inception | | | From | |
| | Date | 1 Year | | Inception | |
| Class A shares | | | | | |
| with maximum sales charge (5.75%) | 12/17/08 | 32.61 | % | 19.51 | % |
| without sales charge | 12/17/08 | 40.73 | % | 20.94 | % |
| Class C shares | | | | | |
| with applicable redemption charge † | 12/17/08 | 38.69 | % | 20.05 | % |
| without redemption | 12/17/08 | 39.69 | % | 20.05 | % |
| Class I shares | 12/17/08 | 41.27 | % | 21.34 | % |
| Class Y shares | 7/1/13 | 42.28 | %†† | 21.21 | %†† |
| Russell 2000 Value Index | 12/31/08 | 37.60 | % | 17.52 | %††† |
Past performance is not predictive of future performance.The fund’s performance shown in the graph and table does not reflect the deduction of taxes that a shareholder would pay on fund distributions or the redemption of fund shares.
| |
| † | The maximum contingent deferred sales charge for Class C shares is 1% for shares redeemed within one year of the |
| | date of purchase. |
| †† | The total return performance figures presented for ClassY shares of the fund reflect the performance of the fund’s |
| | Class A shares for the period prior to 7/1/13 (the inception date for ClassY shares). |
| ††† | For comparative purposes, the value of the Index as of 12/31/08 is used as the beginning value on 12/17/08. |
UNDERSTANDING YOUR FUND’S EXPENSES (Unaudited)
As a mutual fund investor, you pay ongoing expenses, such as management fees and other expenses. Using the information below, you can estimate how these expenses affect your investment and compare them with the expenses of other funds.You also may pay one-time transaction expenses, including sales charges (loads) and redemption fees, which are not shown in this section and would have resulted in higher total expenses. For more information, see your fund’s prospectus or talk to your financial adviser.
Review your fund’s expenses
The table below shows the expenses you would have paid on a $1,000 investment in Dreyfus Select Managers Small CapValue Fund from June 1, 2013 to November 30, 2013. It also shows how much a $1,000 investment would be worth at the close of the period, assuming actual returns and expenses.
Expenses and Value of a $1,000 Investment
assuming actual returns for the six months ended November 30, 2013 †
| | | | | | | | |
| | | Class A | | Class C | | Class I | | Class Y |
| Expenses paid per $1,000†† | $ | 7.01 | $ | 11.12 | $ | 5.17 | $ | 4.47 |
| Ending value (after expenses) | $ | 1,167.70 | $ | 1,163.50 | $ | 1,170.10 | $ | 1,166.10 |
COMPARING YOUR FUND’S EXPENSES
WITH THOSE OF OTHER FUNDS (Unaudited)
Using the SEC’s method to compare expenses
The Securities and Exchange Commission (SEC) has established guidelines to help investors assess fund expenses. Per these guidelines, the table below shows your fund’s expenses based on a $1,000 investment, assuming a hypothetical 5% annualized return. You can use this information to compare the ongoing expenses (but not transaction expenses or total cost) of investing in the fund with those of other funds.All mutual fund shareholder reports will provide this information to help you make this comparison. Please note that you cannot use this information to estimate your actual ending account balance and expenses paid during the period.
Expenses and Value of a $1,000 Investment
assuming a hypothetical 5% annualized return for the six months ended November 30, 2013
| | | | | | | | |
| | | Class A | | Class C | | Class I | | Class Y |
| Expenses paid per $1,000†††† | $ | 6.53 | $ | 10.35 | $ | 4.81 | $ | 5.01 |
| Ending value (after expenses) | $ | 1,018.60 | $ | 1,014.79 | $ | 1,020.31 | $ | 1,020.10 |
| |
| † | From July 1, 2013 (commencement of initial offering) to November 30, 2013 for ClassY shares. |
| †† | Expenses are equal to the fund’s annualized expense ratio of 1.29% for Class A, 2.05% for Class C and .95% |
| | for Class I, multiplied by the average account value over the period, multiplied by 183/365 (to reflect the one-half |
| | year period). Expenses are equal to the fund’s annualized expense ratio of .99% for ClassY, multiplied by the |
| | average account value over the period, multiplied by 152/365 (to reflect the actual days in the period). |
| ††† | Please note that while ClassY shares commenced operations on July 1, 2013, the hypothetical expenses paid |
| | during the period reflect projected activity for the full six month period for purposes of comparability.This projection |
| | assumes that annualized expense ratios were in effect during the period June 1, 2013 to November 30, 2013. |
| †††† | Expenses are equal to the fund’s annualized expense ratio of 1.29% for Class A, 2.05% for Class C, .95% for |
| | Class I and .99% for ClassY, multiplied by the average account value over the period, multiplied by 183/365 (to |
| | reflect the one-half year period). |
8
STATEMENT OF INVESTMENTS
November 30, 2013
| | | |
| Common Stocks—95.5% | Shares | | Value ($) |
| Automobiles & Components—1.0% | | | |
| Dana Holding | 47,600 | | 965,328 |
| Gentherm | 69,000 | a | 1,667,040 |
| Modine Manufacturing | 89,600 | a | 1,189,888 |
| Thor Industries | 43,841 | | 2,370,483 |
| Visteon | 6,490 | a | 510,374 |
| | | | 6,703,113 |
| Banks—9.3% | | | |
| BancorpSouth | 10,517 | | 251,461 |
| Bank of Hawaii | 12,520 | | 740,558 |
| Bank of the Ozarks | 12,600 | | 707,490 |
| BankUnited | 36,700 | | 1,184,676 |
| BBCN Bancorp | 113,559 | | 1,895,300 |
| BofI Holding | 16,300 | a | 1,335,948 |
| Bryn Mawr Bank | 53,520 | | 1,620,586 |
| Centerstate Banks | 91,120 | | 962,227 |
| City Holding | 25,450 | b | 1,252,394 |
| City National | 13,400 | | 1,023,224 |
| Columbia Banking System | 56,700 | | 1,571,724 |
| Comerica | 31,827 | | 1,443,354 |
| Community Bank System | 47,875 | b | 1,860,422 |
| CVB Financial | 125,100 | | 2,019,114 |
| Dime Community Bancshares | 67,230 | | 1,130,809 |
| East West Bancorp | 68,101 | | 2,334,502 |
| F.N.B | 112,130 | | 1,425,172 |
| First Commonwealth Financial | 150,600 | | 1,409,616 |
| First Financial Bankshares | 39,950 | b | 2,651,881 |
| First Merchants | 39,447 | | 835,882 |
| First Midwest Bancorp | 51,418 | | 944,034 |
| First Niagara Financial Group | 310,708 | | 3,461,287 |
| FirstMerit | 98,800 | | 2,268,448 |
| Flushing Financial | 33,145 | | 716,263 |
| Great Southern Bancorp | 12,740 | | 378,251 |
| Hancock Holding | 95,943 | | 3,377,194 |
| Heritage Financial | 43,750 | | 752,500 |
| Heritage Financial Group | 51,649 | | 912,638 |
STATEMENT OF INVESTMENTS (continued)
| | | |
| Common Stocks (continued) | Shares | | Value ($) |
| Banks (continued) | | | |
| Huntington Bancshares | 176,410 | | 1,619,444 |
| IBERIABANK | 29,800 | | 1,868,460 |
| Independent Bank | 13,740 | | 524,456 |
| Investors Bancorp | 33,682 | | 810,726 |
| MGIC Investment | 71,800 | a | 582,298 |
| National Bank Holdings, Cl. A | 37,679 | | 798,041 |
| Ocwen Financial | 60,150 | a | 3,408,099 |
| PacWest Bancorp | 21,790 | b | 896,441 |
| Park Sterling | 124,609 | | 883,478 |
| Rockville Financial | 58,148 | | 867,568 |
| SVB Financial Group | 14,500 | a | 1,467,980 |
| TCF Financial | 98,200 | | 1,538,794 |
| Texas Capital Bancshares | 55,700 | a | 3,128,669 |
| Trustmark | 34,418 | | 965,425 |
| Umpqua Holdings | 81,500 | b | 1,500,415 |
| Union First Market Bankshares | 28,544 | b | 736,721 |
| Westamerica Bancorporation | 27,500 | b | 1,522,950 |
| Wilshire Bancorp | 63,030 | | 666,227 |
| Wintrust Financial | 38,600 | | 1,750,896 |
| | | | 66,004,043 |
| Capital Goods—12.1% | | | |
| AAON | 50,380 | | 1,550,193 |
| Aegion | 21,454 | a | 467,054 |
| Aerovironment | 38,150 | a | 1,150,985 |
| Albany International, Cl. A | 52,390 | | 1,925,856 |
| CAI International | 34,960 | a | 804,080 |
| CLARCOR | 27,800 | | 1,682,734 |
| Columbus McKinnon | 69,050 | a | 1,912,685 |
| Curtiss-Wright | 46,671 | | 2,462,829 |
| Donaldson | 28,554 | | 1,191,558 |
| DXP Enterprises | 15,100 | a | 1,479,498 |
| Dycom Industries | 24,550 | a | 694,765 |
| EnerSys | 24,156 | | 1,723,531 |
| ESCO Technologies | 29,300 | | 997,958 |
| Flow International | 225,980 | a | 908,440 |
| Foster Wheeler | 23,240 | a | 704,869 |
10
| | | | |
| Common Stocks (continued) | Shares | | Value ($) |
| Capital Goods (continued) | | | | |
| Franklin Electric | 18,843 | | 838,515 |
| FreightCar America | 64,144 | | 1,493,272 |
| Generac Holdings | 34,200 | | 1,821,492 |
| General Cable | 32,420 | | 944,719 |
| Gibraltar Industries | 49,285 | a | 872,344 |
| Graco | 31,700 | | 2,448,191 |
| GrafTech International | 115,626 | a,b | 1,332,011 |
| Granite Construction | 26,270 | | 820,937 |
| Greenbrier Cos. | 58,900 | a | 1,840,625 |
| H&E Equipment Services | 58,900 | a | 1,680,417 |
| Harsco | 30,000 | | 784,500 |
| Hexcel | 56,392 | a | 2,477,300 |
| Hyster-Yale Materials Handling | 26,570 | | 2,214,875 |
| II-VI | 31,020 | a | 507,177 |
| ITT | 44,200 | | 1,804,244 |
| John Bean Technologies | 76,400 | | 2,258,384 |
| KBR | 49,100 | | 1,661,053 |
| Lawson Products | 37,730 | a | 481,812 |
| Lincoln Electric Holdings | 10,600 | | 757,688 |
| Lindsay | 52,351 | b | 3,999,093 |
| LSI Industries | 63,885 | | 555,161 |
| Lydall | 38,121 | a | 679,697 |
| Manitowoc | 49,000 | | 1,008,910 |
| Meritor | 81,300 | a | 647,961 |
| Miller Industries | 46,980 | | 893,560 |
| Moog, Cl. A | 9,820 | a | 674,339 |
| Mueller Water Products, Cl. A | 379,050 | | 3,263,621 |
| National Presto Industries | 10,540 | b | 807,469 |
| NCI Building Systems | 106,900 | a | 1,809,817 |
| Nordson | 7,975 | | 575,157 |
| Orbital Sciences | 83,250 | a | 1,954,710 |
| Orion Marine Group | 67,433 | a | 800,430 |
| Regal-Beloit | 10,000 | | 735,800 |
| Spirit Aerosystems Holdings, Cl. A | 68,230 | a | 2,227,027 |
| Standex International | 32,950 | | 1,941,414 |
| Sun Hydraulics | 25,000 | | 1,074,250 |
STATEMENT OF INVESTMENTS (continued)
| | | |
| Common Stocks (continued) | Shares | | Value ($) |
| Capital Goods (continued) | | | |
| Teledyne Technologies | 16,000 | a | 1,483,680 |
| Textron | 69,970 | | 2,325,103 |
| Titan International | 8,850 | | 152,663 |
| TriMas | 50,240 | a | 1,837,779 |
| Trinity Industries | 12,580 | | 653,028 |
| Tutor Perini | 85,100 | a | 2,084,099 |
| Twin Disc | 31,100 | | 893,503 |
| Valmont Industries | 4,070 | | 588,970 |
| Wabash National | 73,600 | a | 893,504 |
| Woodward | 99,689 | | 4,276,658 |
| | | | 85,533,994 |
| Commercial & Professional Services—3.8% | | | |
| ABM Industries | 52,800 | | 1,468,368 |
| Acacia Research | 38,850 | b | 578,088 |
| ACCO Brands | 140,219 | a | 844,118 |
| CBIZ | 165,230 | a,b | 1,480,461 |
| CDI | 40,500 | | 635,445 |
| Ceco Environmental | 33,280 | | 530,150 |
| Clean Harbors | 17,300 | a | 912,921 |
| Corporate Executive Board | 31,800 | | 2,341,434 |
| Covanta Holding | 76,000 | | 1,360,400 |
| Deluxe | 91,453 | | 4,544,299 |
| Ennis | 39,932 | | 740,339 |
| FTI Consulting | 55,878 | a | 2,509,481 |
| ICF International | 32,200 | a | 1,164,996 |
| Insperity | 137,250 | | 4,838,063 |
| Korn/Ferry International | 84,497 | a | 1,956,950 |
| Tetra Tech | 38,851 | a | 1,110,750 |
| US Ecology | 1,407 | | 54,141 |
| | | | 27,070,404 |
| Consumer Durables & Apparel—2.8% | | | |
| Crocs | 18,100 | a | 249,780 |
| CSS Industries | 40,200 | | 1,251,828 |
| Deckers Outdoor | 23,000 | a,b | 1,900,720 |
| Harman International Industries | 23,133 | | 1,874,698 |
12
| | | |
| Common Stocks (continued) | Shares | | Value ($) |
| Consumer Durables & Apparel (continued) | | | |
| Iconix Brand Group | 93,335 | a | 3,703,533 |
| JAKKS Pacific | 175,929 | b | 1,136,501 |
| Leapfrog Enterprises | 135,263 | a,b | 1,164,614 |
| M.D.C. Holdings | 18,930 | | 572,065 |
| M/I Homes | 103,380 | a | 2,271,259 |
| Smith & Wesson Holding | 51,300 | a,b | 606,366 |
| Tupperware Brands | 25,071 | | 2,289,985 |
| UCP, Cl. A | 8,636 | | 129,367 |
| Unifi | 75,850 | a | 2,104,079 |
| Universal Electronics | 15,600 | a | 592,956 |
| | | | 19,847,751 |
| Consumer Services—2.3% | | | |
| American Public Education | 15,500 | a | 700,445 |
| Capella Education | 29,840 | a | 1,961,085 |
| DeVry Education Group | 15,740 | | 559,400 |
| Hillenbrand | 83,280 | | 2,340,168 |
| Ignite Restaurant Group | 14,455 | a | 178,519 |
| Interval Leisure Group | 75,500 | | 2,021,890 |
| LifeLock | 73,900 | a | 1,272,558 |
| Outerwall | 25,700 | a,b | 1,757,880 |
| Regis | 50,650 | | 809,894 |
| Ruby Tuesday | 88,200 | a | 621,810 |
| Ruth’s Hospitality Group | 47,029 | | 676,277 |
| Universal Technical Institute | 135,822 | | 1,976,210 |
| Wendy’s | 198,415 | | 1,708,353 |
| | | | 16,584,489 |
| Diversified Financials—5.7% | | | |
| Ares Capital | 173,256 | | 3,184,445 |
| Ashmore Group | 604,500 | | 3,897,256 |
| Asta Funding | 38,390 | | 327,083 |
| Cash America International | 38,200 | | 1,436,702 |
| DFC Global | 67,900 | a | 679,679 |
| Eaton Vance | 114,732 | | 4,796,945 |
| Encore Capital Group | 43,600 | a,b | 2,079,284 |
| Fifth Street Finance | 68,808 | b | 657,804 |
STATEMENT OF INVESTMENTS (continued)
| | | |
| Common Stocks (continued) | Shares | | Value ($) |
| Diversified Financials (continued) | | | |
| First Cash Financial Services | 64,900 | a | 4,126,342 |
| ING US | 30,590 | | 1,068,815 |
| Janus Capital Group | 93,818 | | 1,020,740 |
| MSCI | 35,551 | a | 1,578,109 |
| NASDAQ OMX Group | 91,563 | | 3,597,510 |
| New Mountain Finance | 12,834 | | 193,408 |
| PHH | 97,890 | a,b | 2,353,276 |
| PICO Holdings | 38,187 | a | 925,271 |
| Stifel Financial | 70,409 | a | 3,152,211 |
| Waddell & Reed Financial, Cl. A | 11,582 | | 738,121 |
| Walter Investment Management | 72,539 | a | 2,765,912 |
| World Acceptance | 18,473 | a,b | 1,705,427 |
| | | | 40,284,340 |
| Energy—5.3% | | | |
| Adams Resources & Energy | 3,000 | | 171,660 |
| Atwood Oceanics | 26,277 | a | 1,381,119 |
| Bill Barrett | 65,650 | a,b | 1,765,328 |
| Cal Dive International | 346,800 | a,b | 641,580 |
| Callon Petroleum | 27,181 | a | 180,754 |
| CARBO Ceramics | 19,400 | | 2,386,782 |
| Delek US Holdings | 34,000 | | 1,028,840 |
| Energy XXI | 58,100 | | 1,577,996 |
| EPL Oil & Gas | 69,527 | a | 1,991,948 |
| ERA Group | 62,450 | a | 2,037,743 |
| GulfMark Offshore, Cl. A | 18,056 | | 891,244 |
| Helix Energy Solutions Group | 50,400 | a | 1,119,384 |
| ION Geophysical | 175,800 | a | 678,588 |
| Kodiak Oil & Gas | 42,201 | a | 478,559 |
| McDermott International | 145,820 | a | 1,188,433 |
| Natural Gas Services Group | 14,870 | a | 441,044 |
| Newpark Resources | 243,150 | a,b | 2,932,389 |
| PDC Energy | 29,630 | a | 1,745,503 |
| PetroQuest Energy | 100,880 | a | 413,608 |
| Rosetta Resources | 6,786 | a | 343,168 |
14
| | | |
| Common Stocks (continued) | Shares | | Value ($) |
| Energy (continued) | | | |
| Stone Energy | 67,535 | a | 2,234,058 |
| Synergy Resources | 192,100 | a | 1,813,424 |
| Tesco | 34,280 | a | 612,926 |
| TETRA Technologies | 135,300 | a | 1,669,602 |
| Tidewater | 37,575 | | 2,143,278 |
| Ultra Petroleum | 31,640 | a,b | 647,671 |
| Warren Resources | 266,219 | a | 865,212 |
| Western Refining | 22,600 | b | 882,982 |
| World Fuel Services | 71,700 | | 2,753,280 |
| WPX Energy | 33,910 | a | 630,387 |
| | | | 37,648,490 |
| Exchange-Traded Funds—.1% | | | |
| iShares Russell 2000 ETF | 4,565 | | 518,173 |
| Food & Staples Retailing—.7% | | | |
| Andersons | 13,800 | | 1,173,966 |
| Safeway | 59,300 | | 2,073,721 |
| Spartan Stores | 46,991 | | 1,090,191 |
| Village Super Market, Cl. A | 16,200 | | 627,426 |
| | | | 4,965,304 |
| Food, Beverage & Tobacco—1.2% | | | |
| Crimson Wine Group | 85,620 | a | 736,332 |
| Darling International | 147,780 | a | 3,063,479 |
| Hillshire Brands | 26,730 | | 893,317 |
| National Beverage | 76,500 | | 1,615,680 |
| Seaboard | 190 | | 536,750 |
| TreeHouse Foods | 23,500 | a | 1,648,525 |
| | | | 8,494,083 |
| Health Care Equipment & Services—4.5% | | | |
| Accuray | 68,570 | a,b | 547,189 |
| Air Methods | 38,400 | b | 2,148,864 |
| Allscripts Healthcare Solutions | 153,230 | a | 2,289,256 |
| AmSurg | 36,094 | a | 1,744,062 |
| AngioDynamics | 53,379 | a | 824,706 |
| Antares Pharma | 203,010 | a,b | 799,859 |
STATEMENT OF INVESTMENTS (continued)
| | | | |
| Common Stocks (continued) | Shares | | Value ($) |
| Health Care Equipment & Services (continued) | | | | |
| Chemed | 74,069 | b | 5,772,197 |
| CryoLife | 68,759 | | 759,787 |
| Given Imaging | 31,800 | a | 744,120 |
| HealthSouth | 16,630 | | 595,188 |
| Hill-Rom Holdings | 50,834 | | 2,105,036 |
| Invacare | 39,304 | | 880,410 |
| Kindred Healthcare | 116,784 | | 1,966,642 |
| Magellan Health Services | 32,900 | a | 2,013,480 |
| Owens & Minor | 58,200 | b | 2,221,494 |
| Patterson | 15,000 | | 622,350 |
| Providence Service | 39,800 | a | 1,091,316 |
| Symmetry Medical | 148,737 | a | 1,459,110 |
| Syneron Medical | 86,950 | a | 1,016,446 |
| Team Health Holdings | 25,500 | a | 1,191,615 |
| Teleflex | 6,140 | | 603,623 |
| WellCare Health Plans | 9,121 | a | 677,690 |
| | | | | 32,074,440 |
| Household & Personal Products—1.0% | | | | |
| Elizabeth Arden | 12,400 | a | 490,172 |
| Medifast | 58,000 | a | 1,571,220 |
| Nu Skin Enterprises, Cl. A | 18,580 | | 2,375,267 |
| WD-40 | 35,300 | | 2,656,678 |
| | | | | 7,093,337 |
| Insurance—6.3% | | | | |
| American Equity Investment Life Holding | 111,115 | | 2,634,537 |
| American Financial Group | 10,630 | | 612,926 |
| American National Insurance | 7,950 | | 918,622 |
| Argo Group International Holdings | 17,644 | | 834,385 |
| Aspen Insurance Holdings | 26,500 | | 1,071,130 |
| Assurant | 9,310 | | 604,591 |
| Endurance Specialty Holdings | 41,910 | | 2,384,679 |
| Everest Re Group | 22,933 | | 3,596,582 |
| FBL Financial Group, Cl. A | 7,373 | | 338,494 |
| Fidelity National Financial, Cl. A | 51,100 | | 1,485,477 |
16
| | | |
| Common Stocks (continued) | Shares | | Value ($) |
| Insurance (continued) | | | |
| The Hanover Insurance Group | 35,806 | | 2,159,460 |
| HCC Insurance Holdings | 36,342 | | 1,671,005 |
| Horace Mann Educators | 85,040 | | 2,612,429 |
| Maiden Holdings | 97,700 | | 1,236,882 |
| Montpelier Re Holdings | 111,903 | | 3,251,901 |
| Navigators Group | 61,553 | a | 4,114,203 |
| Platinum Underwriters Holdings | 44,380 | | 2,813,692 |
| Primerica | 43,150 | | 1,856,745 |
| ProAssurance | 28,612 | | 1,375,665 |
| RLI | 47,460 | | 4,788,239 |
| Stewart Information Services | 76,869 | | 2,449,046 |
| Tower Group International | 98,631 | b | 410,305 |
| Validus Holdings | 38,125 | | 1,526,906 |
| | | | 44,747,901 |
| Materials—6.7% | | | |
| American Vanguard | 69,280 | | 1,990,414 |
| AptarGroup | 8,290 | | 538,187 |
| Avery Dennison | 53,390 | | 2,610,771 |
| Balchem | 17,600 | | 1,041,040 |
| Carpenter Technology | 8,960 | | 540,198 |
| Chemtura | 66,200 | a | 1,747,680 |
| Crown Holdings | 46,000 | a | 2,030,440 |
| Cytec Industries | 13,800 | | 1,234,824 |
| FutureFuel | 85,300 | | 1,426,216 |
| Glatfelter | 79,904 | | 2,236,513 |
| Greif, Cl. A | 24,291 | | 1,334,790 |
| Headwaters | 154,000 | a | 1,487,640 |
| Intrepid Potash | 118,190 | b | 1,826,035 |
| Kaiser Aluminum | 57,170 | | 3,848,684 |
| KMG Chemicals | 121,601 | | 2,210,706 |
| Kraton Performance Polymers | 90,210 | a | 2,100,991 |
| LSB Industries | 52,690 | a | 1,690,295 |
| Materion | 61,880 | | 1,779,669 |
| Mercer International | 195,075 | a | 1,853,213 |
STATEMENT OF INVESTMENTS (continued)
| | | |
| Common Stocks (continued) | Shares | | Value ($) |
| Materials (continued) | | | |
| NewMarket | 2,700 | | 874,665 |
| Olin | 115,350 | b | 2,864,141 |
| Olympic Steel | 27,640 | | 775,855 |
| PolyOne | 60,850 | | 1,975,191 |
| RPM International | 18,128 | | 717,869 |
| Sealed Air | 59,600 | | 1,913,756 |
| Sensient Technologies | 9,309 | | 457,444 |
| Sonoco Products | 27,418 | | 1,098,365 |
| Stillwater Mining | 59,390 | a | 666,950 |
| Worthington Industries | 64,730 | | 2,714,129 |
| | | | 47,586,671 |
| Media—1.4% | | | |
| E.W. Scripps, Cl. A | 64,500 | a | 1,307,415 |
| John Wiley & Sons, Cl. A | 31,387 | | 1,599,482 |
| LIN Media, Cl. A | 56,800 | a | 1,484,752 |
| Live Nation | 164,521 | a | 3,022,251 |
| Media General, Cl. A | 104,600 | a,b | 1,893,260 |
| Starz | 32,320 | a | 914,010 |
| | | | 10,221,170 |
| Pharmaceuticals, Biotech & | | | |
| Life Sciences—3.0% | | | |
| Acorda Therapeutics | 43,200 | a | 1,503,792 |
| Affymetrix | 109,400 | a | 928,806 |
| Cambrex | 196,770 | a | 3,837,015 |
| Charles River Laboratories International | 45,700 | a | 2,384,169 |
| Flamel Technologies, ADR | 278,584 | a,b | 2,042,021 |
| Furiex Pharmaceuticals | 50,700 | a | 2,281,500 |
| Impax Laboratories | 27,390 | a | 658,456 |
| Mallinckrodt | 11,560 | a | 600,658 |
| Nordion | 160,110 | a | 1,317,705 |
| PerkinElmer | 38,238 | | 1,454,574 |
| Questcor Pharmaceuticals | 12,600 | b | 730,926 |
| Sagent Pharmaceuticals | 32,810 | a | 745,115 |
| Santarus | 35,300 | a | 1,135,954 |
18
| | | |
| Common Stocks (continued) | Shares | | Value ($) |
| Pharmaceuticals, Biotech & | | | |
| Life Sciences (continued) | | | |
| Theravance | 15,820 | a,b | 597,363 |
| XOMA | 173,620 | a,b | 829,904 |
| | | | 21,047,958 |
| Real Estate—2.8% | | | |
| Altisource Portfolio Solutions | 25,973 | a | 4,181,134 |
| AV Homes | 49,870 | a | 1,005,878 |
| Capstead Mortgage | 82,500 | c | 992,475 |
| EPR Properties | 19,900 | c | 1,000,771 |
| First Potomac Realty Trust | 86,163 | c | 1,033,956 |
| Hersha Hospitality Trust | 364,287 | c | 2,087,364 |
| LaSalle Hotel Properties | 70,549 | c | 2,209,595 |
| Lexington Realty Trust | 163,600 | c | 1,680,172 |
| Medical Properties Trust | 125,595 | c | 1,659,110 |
| Newcastle Investment | 286,200 | c | 1,571,238 |
| Omega Healthcare Investors | 46,789 | c | 1,529,532 |
| Ramco-Gershenson Properties Trust | 52,554 | c | 840,864 |
| | | | 19,792,089 |
| Retailing—3.6% | | | |
| American Eagle Outfitters | 54,540 | | 887,366 |
| Ascena Retail Group | 99,311 | a | 2,115,324 |
| Barnes & Noble | 34,700 | a | 582,266 |
| Chico’s FAS | 48,100 | | 898,989 |
| Children’s Place Retail Stores | 33,600 | a | 1,848,000 |
| Express | 38,900 | a | 957,329 |
| Finish Line, Cl. A | 30,732 | | 811,632 |
| Genesco | 26,164 | a | 1,959,945 |
| JOS. A. Bank Clothiers | 29,872 | a | 1,697,327 |
| Office Depot | 258,778 | a | 1,407,752 |
| PEP Boys-Manny Moe & Jack | 36,600 | a | 501,420 |
| RadioShack | 651,370 | a,b | 1,895,487 |
| Rent-A-Center | 100,139 | | 3,410,734 |
| Select Comfort | 97,329 | a | 2,054,615 |
| Sonic Automotive, Cl. A | 97,605 | | 2,315,191 |
STATEMENT OF INVESTMENTS (continued)
| | | |
| Common Stocks (continued) | Shares | | Value ($) |
| Retailing (continued) | | | |
| Stage Stores | 68,600 | | 1,441,286 |
| Travelcenters of America | 95,500 | a | 1,015,165 |
| | | | 25,799,828 |
| Semiconductors & Semiconductor | | | |
| Equipment—3.5% | | | |
| Amkor Technology | 320,860 | a | 1,925,160 |
| Axcelis Technologies | 596,935 | a | 1,331,165 |
| Cabot Microelectronics | 102,320 | a | 4,611,562 |
| Ceva | 29,100 | a | 465,309 |
| ChipMOS Technologies | 57,500 | | 1,177,600 |
| Cirrus Logic | 48,800 | a,b | 984,784 |
| FormFactor | 279,502 | a | 1,514,901 |
| Freescale Semiconductor | 56,070 | a,b | 816,379 |
| GT Advanced Technologies | 341,690 | a,b | 3,351,979 |
| Ikanos Communications | 79,100 | a | 107,576 |
| Integrated Silicon Solution | 60,392 | a | 715,041 |
| Kulicke & Soffa Industries | 63,250 | a | 798,215 |
| LTX-Credence | 142,242 | a | 1,026,987 |
| Mellanox Technologies | 14,160 | a,b | 551,390 |
| Rambus | 123,950 | a | 1,064,731 |
| Silicon Image | 214,100 | a | 1,160,422 |
| Spansion, Cl. A | 65,740 | a | 814,519 |
| Teradyne | 62,441 | a,b | 1,063,371 |
| Ultratech | 47,200 | a | 1,248,912 |
| | | | 24,730,003 |
| Software & Services—8.0% | | | |
| Accelrys | 87,000 | a | 846,510 |
| ACI Worldwide | 57,328 | a | 3,699,376 |
| American Software, Cl. A | 104,123 | | 1,004,787 |
| AVG Technologies | 58,500 | a | 1,010,880 |
| Bankrate | 27,650 | a,b | 518,161 |
| Broadridge Financial Solutions | 16,220 | | 618,793 |
| CACI International, Cl. A | 26,678 | a | 1,914,680 |
| Cadence Design Systems | 62,900 | a,b | 833,425 |
20
| | | |
| Common Stocks (continued) | Shares | | Value ($) |
| Software & Services (continued) | | | |
| Cass Information Systems | 40,368 | | 2,533,092 |
| Computer Services | 29,035 | | 975,576 |
| Comverse | 47,593 | a | 1,594,366 |
| Convergys | 133,550 | | 2,740,446 |
| CoreLogic | 60,200 | a | 2,120,846 |
| Covisint | 12,600 | | 159,894 |
| Digital River | 97,200 | a | 1,736,964 |
| DST Systems | 31,000 | | 2,737,300 |
| Fair Isaac | 49,033 | | 2,893,437 |
| FalconStor Software | 635,915 | a | 941,154 |
| Global Payments | 9,776 | | 616,377 |
| Hackett Group | 23,473 | | 146,706 |
| Heartland Payment Systems | 55,069 | b | 2,473,149 |
| Jack Henry & Associates | 44,700 | | 2,537,619 |
| Monotype Imaging Holdings | 21,000 | | 654,150 |
| NeuStar, Cl. A | 57,034 | a | 2,780,408 |
| Rovi | 96,210 | a | 1,770,264 |
| SeaChange International | 74,900 | a | 1,111,516 |
| SS&C Technologies Holdings | 45,300 | a | 1,952,883 |
| SYKES Enterprises | 60,900 | a | 1,348,326 |
| Syntel | 29,000 | | 2,562,730 |
| TIBCO Software | 22,700 | a | 548,659 |
| Unwired Planet | 428,046 | a | 650,630 |
| ValueClick | 248,937 | a | 5,327,252 |
| VeriFone Systems | 36,920 | a | 945,521 |
| Verint Systems | 52,838 | a | 2,003,623 |
| | | | 56,309,500 |
| Technology Hardware & | | | |
| Equipment—7.0% | | | |
| Anixter International | 14,161 | a | 1,251,832 |
| ARRIS Group | 84,500 | a | 1,733,940 |
| Aviat Networks | 410,918 | a | 1,039,623 |
| Badger Meter | 31,825 | | 1,748,147 |
| Black Box | 48,548 | | 1,359,829 |
STATEMENT OF INVESTMENTS (continued)
| | | |
| Common Stocks (continued) | Shares | | Value ($) |
| Technology Hardware & | | | |
| Equipment (continued) | | | |
| Brocade Communications Systems | 172,200 | a | 1,513,638 |
| Ceragon Networks | 60,600 | a | 158,772 |
| Ciena | 42,600 | a | 946,146 |
| Cognex | 34,792 | | 1,146,396 |
| CTS | 88,945 | | 1,617,020 |
| Diebold | 21,914 | | 747,925 |
| Dolby Laboratories, Cl. A | 23,400 | b | 840,762 |
| Electronics for Imaging | 34,115 | a | 1,350,954 |
| Emulex | 201,340 | a,b | 1,501,996 |
| GSI Group | 67,570 | a | 741,919 |
| Infinera | 136,300 | a,b | 1,267,590 |
| Ingram Micro, Cl. A | 49,125 | a | 1,151,490 |
| InvenSense | 62,300 | a,b | 1,077,167 |
| Itron | 21,140 | a | 895,279 |
| Ituran Location and Control | 104,340 | b | 2,069,062 |
| Lexmark International, Cl. A | 66,340 | | 2,346,446 |
| Mercury Systems | 69,300 | a | 758,142 |
| Methode Electronics | 48,800 | | 1,411,784 |
| Oplink Communications | 78,345 | a | 1,270,756 |
| OSI Systems | 7,400 | a | 567,580 |
| Park Electrochemical | 45,120 | | 1,340,515 |
| Plantronics | 33,794 | | 1,511,605 |
| Plexus | 30,920 | a | 1,248,241 |
| Pulse Electronics | 46,557 | a,b | 157,828 |
| QLogic | 125,941 | a | 1,562,928 |
| Quantum | 605,119 | a | 756,399 |
| ScanSource | 34,399 | a | 1,444,414 |
| Sierra Wireless | 60,300 | a | 1,154,745 |
| SYNNEX | 37,280 | a | 2,466,445 |
| Vishay Intertechnology | 330,753 | a,b | 4,276,637 |
| Vishay Precision Group | 41,720 | a | 709,240 |
22
| | | |
| Common Stocks (continued) | Shares | | Value ($) |
| Technology Hardware & | | | |
| Equipment (continued) | | | |
| Zebra Technologies, Cl. A | 41,888 | a | 2,171,474 |
| | | | 49,314,666 |
| Telecommunication | | | |
| Services—.1% | | | |
| MagicJack VocalTec | 37,150 | a,b | 426,111 |
| Transportation—1.4% | | | |
| Air Transport Services Group | 120,838 | a | 940,120 |
| Arkansas Best | 21,465 | | 698,471 |
| Atlas Air Worldwide Holdings | 16,200 | a | 622,080 |
| Con-way | 19,600 | | 811,244 |
| Danaos | 126,611 | a | 563,419 |
| JetBlue Airways | 114,600 | a,b | 1,018,794 |
| Landstar System | 40,100 | | 2,250,813 |
| Ryder System | 19,900 | | 1,389,816 |
| SkyWest | 36,051 | | 609,262 |
| Werner Enterprises | 44,653 | | 1,074,798 |
| | | | 9,978,817 |
| Utilities—1.9% | | | |
| Atmos Energy | 29,133 | | 1,294,962 |
| Dynegy | 32,700 | a,b | 700,107 |
| Empire District Electric | 50,844 | | 1,154,159 |
| NorthWestern | 28,800 | | 1,266,624 |
| NRG Energy | 36,621 | | 968,992 |
| Ormat Technologies | 44,600 | b | 1,118,568 |
| PNM Resources | 57,600 | | 1,340,352 |
| Portland General Electric | 83,890 | | 2,500,761 |
| Questar | 54,500 | | 1,227,340 |
| UNS Energy | 45,300 | | 2,168,964 |
| | | | 13,740,829 |
| Total Common Stocks | | | |
| (cost $509,996,904) | | | 676,517,504 |
STATEMENT OF INVESTMENTS (continued)
| | | | |
| Investment of Cash Collateral | | | | |
| for Securities Loaned—7.7% | Shares | | Value ($) | |
| Registered Investment Company; | | | | |
| Dreyfus Institutional Cash Advantage Fund | | | | |
| (cost $54,693,360) | 54,693,360 | d | 54,693,360 | |
| Total Investments (cost $564,690,264) | 103.2 | % | 731,210,864 | |
| Liabilities, Less Cash and Receivables | (3.2 | %) | (22,856,180 | ) |
| Net Assets | 100.0 | % | 708,354,684 | |
ADR—American Depository Receipts
ETF—Exchange-Traded Funds
|
| a Non-income producing security. |
| b Security, or portion thereof, on loan.At November 30, 2013, the value of the fund’s securities on loan was |
| $55,067,807 and the value of the collateral held by the fund was $56,504,231, consisting of cash collateral of |
| $54,693,360 and U.S. Government & Agency securities valued at $1,810,871. |
| c Investment in real estate investment trust. |
| d Investment in affiliated money market mutual fund. |
| | | |
| Portfolio Summary (Unaudited)† | | |
| |
| | Value (%) | Value (%) |
| Capital Goods | 12.1 | Pharmaceuticals, Biotech & Life Sciences | 3.0 |
| Banks | 9.3 | Consumer Durables & Apparel | 2.8 |
| Software & Services | 8.0 | Real Estate | 2.8 |
| Money Market Investment | 7.7 | Consumer Services | 2.3 |
| Technology Hardware & Equipment | 7.0 | Utilities | 1.9 |
| Materials | 6.7 | Media | 1.4 |
| Insurance | 6.3 | Transportation | 1.4 |
| Diversified Financials | 5.7 | Food, Beverage & Tobacco | 1.2 |
| Energy | 5.3 | Automobiles & Components | 1.0 |
| Health Care Equipment & Services | 4.5 | Household & Personal Products | 1.0 |
| Commercial & Professional Services | 3.8 | Food & Staples Retailing | .7 |
| Retailing | 3.6 | Exchange-Traded Funds | .1 |
| Semiconductors & | | Telecommunication Services | .1 |
| Semiconductor Equipment | 3.5 | | 103.2 |
| |
| † Based on net assets. | | | |
| See notes to financial statements. | | | |
24
|
| STATEMENT OF ASSETS AND LIABILITIES |
| November 30, 2013 |
| | | | | |
| | | | Cost | | Value |
| Assets ($): | | | | | |
| Investments in securities—See Statement of Investments (including | | | |
| securities on loan, valued at $55,067,807)—Note 1(b): | | | | |
| Unaffiliated issuers | | 509,996,904 | 676,517,504 |
| Affiliated issuers | | | 54,693,360 | 54,693,360 |
| Cash | | | | 31,871,607 |
| Receivable for investment securities sold | | | | | 1,807,490 |
| Dividends and securities lending income receivable | | | | 773,548 |
| Receivable for shares of Common Stock subscribed | | | | 67,495 |
| Prepaid expenses | | | | | 34,910 |
| | | | | 765,765,914 |
| Liabilities ($): | | | | | |
| Due to The Dreyfus Corporation and affiliates—Note 3(c) | | | | 553,986 |
| Liability for securities on loan—Note 1(b) | | | | 54,693,360 |
| Payable for investment securities purchased | | | | 1,758,043 |
| Payable for shares of Common Stock redeemed | | | | 314,883 |
| Accrued expenses | | | | | 90,958 |
| | | | | 57,411,230 |
| Net Assets ($) | | | | 708,354,684 |
| Composition of Net Assets ($): | | | | | |
| Paid-in capital | | | | 485,476,604 |
| Accumulated undistributed investment income—net | | | | 3,455,876 |
| Accumulated net realized gain (loss) on investments | | | 52,899,430 |
| Accumulated net unrealized appreciation (depreciation) | | | | |
| on investments and foreign currency transactions | | | 166,522,774 |
| Net Assets ($) | | | | 708,354,684 |
| |
| |
| Net Asset Value Per Share | | | | | |
| | Class A | Class C | | Class I | Class Y |
| Net Assets ($) | 1,515,953 | 231,184 | 706,606,381 | 1,166 |
| Shares Outstanding | 57,743 | 9,179 | 26,617,034 | 43.94 |
| Net Asset Value Per Share ($) | 26.25 | 25.19 | 26.55 | 26.54 |
| |
| See notes to financial statements. | | | | | |
|
| STATEMENT OF OPERATIONS |
| Year Ended November 30, 2013 |
| | |
| Investment Income ($): | | |
| Income: | | |
| Cash dividends (net of $18,454 foreign taxes withheld at source): | 8,298,146 | |
| Income from securities lending—Note 1(b) | 558,379 | |
| Total Income | 8,856,525 | |
| Expenses: | | |
| Management fee—Note 3(a) | 5,132,977 | |
| Custodian fees—Note 3(c) | 90,598 | |
| Registration fees | 64,541 | |
| Professional fees | 61,539 | |
| Directors’ fees and expenses—Note 3(d) | 45,004 | |
| Prospectus and shareholders’ reports | 16,977 | |
| Shareholder servicing costs—Note 3(c) | 7,975 | |
| Loan commitment fees—Note 2 | 5,210 | |
| Distribution fees—Note 3(b) | 1,287 | |
| Miscellaneous | 23,932 | |
| Total Expenses | 5,450,040 | |
| Less—reduction in expenses due to undertaking—Note 3(a) | (450 | ) |
| Less—reduction in fees due to earnings credits—Note 3(c) | (11 | ) |
| Net Expenses | 5,449,579 | |
| Investment Income—Net | 3,406,946 | |
| Realized and Unrealized Gain (Loss) on Investments—Note 4 ($): | | |
| Net realized gain (loss) on investments and foreign currency transactions | 57,242,086 | |
| Net unrealized appreciation (depreciation) on investments and | | |
| foreign currency transactions | 133,980,280 | |
| Net Realized and Unrealized Gain (Loss) on Investments | 191,222,366 | |
| Net Increase in Net Assets Resulting from Operations | 194,629,312 | |
| |
| See notes to financial statements. | | |
26
STATEMENT OF CHANGES IN NET ASSETS
| | | | |
| | Year Ended November 30, | |
| | 2013 | a | 2012 | |
| Operations ($): | | | | |
| Investment income—net | 3,406,946 | | 1,908,421 | |
| Net realized gain (loss) on investments | 57,242,086 | | 18,752,627 | |
| Net unrealized appreciation | | | | |
| (depreciation) on investments | 133,980,280 | | 28,174,786 | |
| Net Increase (Decrease) in Net Assets | | | | |
| Resulting from Operations | 194,629,312 | | 48,835,834 | |
| Dividends to Shareholders from ($): | | | | |
| Investment income—net: | | | | |
| Class A | (8 | ) | — | |
| Class I | (1,841,668 | ) | (639,291 | ) |
| Net realized gain on investments: | | | | |
| Class A | (41,592 | ) | (75,831 | ) |
| Class C | (6,501 | ) | (14,596 | ) |
| Class I | (21,618,710 | ) | (25,288,419 | ) |
| Total Dividends | (23,508,479 | ) | (26,018,137 | ) |
| Capital Stock Transactions ($): | | | | |
| Net proceeds from shares sold: | | | | |
| Class A | 474,459 | | 118,438 | |
| Class C | 76,163 | | 506 | |
| Class I | 161,203,345 | | 147,573,196 | |
| Class Y | 1,000 | | — | |
| Dividends reinvested: | | | | |
| Class A | 41,600 | | 75,831 | |
| Class C | 6,501 | | 14,596 | |
| Class I | 11,970,795 | | 13,220,617 | |
| Cost of shares redeemed: | | | | |
| Class A | (250,905 | ) | (421,174 | ) |
| Class C | (67,468 | ) | (22,518 | ) |
| Class I | (67,007,781 | ) | (50,912,127 | ) |
| Increase (Decrease) in Net Assets | | | | |
| from Capital Stock Transactions | 106,447,709 | | 109,647,365 | |
| Total Increase (Decrease) in Net Assets | 277,568,542 | | 132,465,062 | |
| Net Assets ($): | | | | |
| Beginning of Period | 430,786,142 | | 298,321,080 | |
| End of Period | 708,354,684 | | 430,786,142 | |
| Undistributed investment income—net | 3,455,876 | | 1,890,606 | |
STATEMENT OF CHANGES IN NET ASSETS (continued)
| | | | |
| | Year Ended November 30, | |
| | 2013 | a | 2012 | |
| Capital Share Transactions: | | | | |
| Class Ab | | | | |
| Shares sold | 21,746 | | 6,248 | |
| Shares issued for dividends reinvested | 2,155 | | 4,401 | |
| Shares redeemed | (11,476 | ) | (22,730 | ) |
| Net Increase (Decrease) in Shares Outstanding | 12,425 | | (12,081 | ) |
| Class Cb | | | | |
| Shares sold | 3,519 | | 30 | |
| Shares issued for dividends reinvested | 349 | | 869 | |
| Shares redeemed | (3,372 | ) | (1,216 | ) |
| Net Increase (Decrease) in Shares Outstanding | 496 | | (317 | ) |
| Class I | | | | |
| Shares sold | 7,324,503 | | 7,796,955 | |
| Shares issued for dividends reinvested | 614,943 | | 761,027 | |
| Shares redeemed | (2,977,564 | ) | (2,677,729 | ) |
| Net Increase (Decrease) in Shares Outstanding | 4,961,882 | | 5,880,253 | |
| Class Y | | | | |
| Shares sold | 43.94 | | — | |
|
| a Effective July 1, 2013, the fund commenced offering ClassY shares. |
| b During the period ended November 30, 2013, 1,060 Class C shares representing $22,840 were exchanged for |
| 1,021 Class A shares. |
See notes to financial statements.
28
FINANCIAL HIGHLIGHTS
The following tables describe the performance for each share class for the fiscal periods indicated.All information (except portfolio turnover rate) reflects financial results for a single fund share.Total return shows how much your investment in the fund would have increased (or decreased) during each period, assuming you had reinvested all dividends and distributions.These figures have been derived from the fund’s financial statements.
| | | | | | | | | | |
| | | | Year Ended November 30, | | | |
| Class A Shares | 2013 | | 2012 | | 2011 | | 2010 | | 2009 | a |
| Per Share Data ($): | | | | | | | | | | |
| Net asset value, beginning of period | 19.62 | | 18.66 | | 19.63 | | 15.24 | | 12.50 | |
| Investment Operations: | | | | | | | | | | |
| Investment income (loss)—netb | .06 | | .02 | | (.04 | ) | (.05 | ) | (.00 | )c |
| Net realized and unrealized | | | | | | | | | | |
| gain (loss) on investments | 7.57 | | 2.56 | | .23 | | 4.47 | | 2.74 | |
| Total from Investment Operations | 7.63 | | 2.58 | | .19 | | 4.42 | | 2.74 | |
| Distributions: | | | | | | | | | | |
| Dividends from investment income—net | (.00 | )c | — | | — | | — | | — | |
| Dividends from net realized | | | | | | | | | | |
| gain on investments | (1.00 | ) | (1.62 | ) | (1.16 | ) | (.03 | ) | — | |
| Total Distributions | (1.00 | ) | (1.62 | ) | (1.16 | ) | (.03 | ) | — | |
| Net asset value, end of period | 26.25 | | 19.62 | | 18.66 | | 19.63 | | 15.24 | |
| Total Return (%)d | 40.73 | | 15.04 | | .62 | | 29.05 | | 21.92 | e |
| Ratios/Supplemental Data (%): | | | | | | | | | | |
| Ratio of total expenses | | | | | | | | | | |
| to average net assets | 1.33 | | 1.40 | | 1.29 | | 1.34 | | 2.94 | f |
| Ratio of net expenses | | | | | | | | | | |
| to average net assets | 1.30 | | 1.36 | | 1.27 | | 1.32 | | 1.40 | f |
| Ratio of net investment income | | | | | | | | | | |
| (loss) to average net assets | .25 | | .12 | | (.18 | ) | (.27 | ) | (.02 | )f |
| Portfolio Turnover Rate | 68.30 | | 74.74 | | 67.49 | | 56.03 | | 48.43 | e |
| Net Assets, end of period ($ x 1,000) | 1,516 | | 889 | | 1,071 | | 7,308 | | 6,289 | |
| |
| a | From December 17, 2008 (commencement of operations) to November 30, 2009. |
| b | Based on average shares outstanding at each month end. |
| c | Amount represents less than $.01 per share. |
| d | Exclusive of sales charge. |
| e | Not annualized. |
| f | Annualized. |
See notes to financial statements.
FINANCIAL HIGHLIGHTS (continued)
| | | | | | | | | | |
| | | | Year Ended November 30, | | | |
| Class C Shares | 2013 | | 2012 | | 2011 | | 2010 | | 2009 | a |
| Per Share Data ($): | | | | | | | | | | |
| Net asset value, beginning of period | 19.00 | | 18.25 | | 19.34 | | 15.13 | | 12.50 | |
| Investment Operations: | | | | | | | | | | |
| Investment (loss)—netb | (.10 | ) | (.12 | ) | (.18 | ) | (.18 | ) | (.10 | ) |
| Net realized and unrealized | | | | | | | | | | |
| gain (loss) on investments | 7.29 | | 2.49 | | .25 | | 4.42 | | 2.73 | |
| Total from Investment Operations | 7.19 | | 2.37 | | .07 | | 4.24 | | 2.63 | |
| Distributions: | | | | | | | | | | |
| Dividends from net realized | | | | | | | | | | |
| gain on investments | (1.00 | ) | (1.62 | ) | (1.16 | ) | (.03 | ) | — | |
| Net asset value, end of period | 25.19 | | 19.00 | | 18.25 | | 19.34 | | 15.13 | |
| Total Return (%)c | 39.69 | | 14.16 | | (.03 | ) | 28.07 | | 21.04 | d |
| Ratios/Supplemental Data (%): | | | | | | | | | | |
| Ratio of total expenses | | | | | | | | | | |
| to average net assets | 2.16 | | 2.15 | | 2.03 | | 2.10 | | 3.70 | e |
| Ratio of net expenses | | | | | | | | | | |
| to average net assets | 2.06 | | 2.12 | | 2.02 | | 2.08 | | 2.15 | e |
| Ratio of net investment (loss) | | | | | | | | | | |
| to average net assets | (.48 | ) | (.64 | ) | (.92 | ) | (1.02 | ) | (.77 | )e |
| Portfolio Turnover Rate | 68.30 | | 74.74 | | 67.49 | | 56.03 | | 48.43 | d |
| Net Assets, end of period ($ x 1,000) | 231 | | 165 | | 164 | | 916 | | 617 | |
| |
| a | From December 17, 2008 (commencement of operations) to November 30, 2009. |
| b | Based on average shares outstanding at each month end. |
| c | Exclusive of sales charge. |
| d | Not annualized. |
| e | Annualized. |
See notes to financial statements.
30
| | | | | | | | | | |
| | | | Year Ended November 30, | | | |
| Class I Shares | 2013 | | 2012 | | 2011 | | 2010 | | 2009 | a |
| Per Share Data ($): | | | | | | | | | | |
| Net asset value, beginning of period | 19.84 | | 18.83 | | 19.72 | | 15.28 | | 12.50 | |
| Investment Operations: | | | | | | | | | | |
| Investment income—netb | .14 | | .10 | | .04 | | .00 | c | .03 | |
| Net realized and unrealized | | | | | | | | | | |
| gain (loss) on investments | 7.65 | | 2.57 | | .23 | | 4.47 | | 2.75 | |
| Total from Investment Operations | 7.79 | | 2.67 | | .27 | | 4.47 | | 2.78 | |
| Distributions: | | | | | | | | | | |
| Dividends from investment income—net | (.08 | ) | (.04 | ) | — | | (.00 | )c | — | |
| Dividends from net realized | | | | | | | | | | |
| gain on investments | (1.00 | ) | (1.62 | ) | (1.16 | ) | (.03 | ) | — | |
| Total Distributions | (1.08 | ) | (1.66 | ) | (1.16 | ) | (.03 | ) | — | |
| Net asset value, end of period | 26.55 | | 19.84 | | 18.83 | | 19.72 | | 15.28 | |
| Total Return (%) | 41.27 | | 15.45 | | 1.04 | | 29.32 | | 22.24 | d |
| Ratios/Supplemental Data (%): | | | | | | | | | | |
| Ratio of total expenses | | | | | | | | | | |
| to average net assets | .95 | | .99 | | .99 | | 1.07 | | 1.91 | e |
| Ratio of net expenses | | | | | | | | | | |
| to average net assets | .95 | | .99 | | .99 | | 1.06 | | 1.15 | e |
| Ratio of net investment income | | | | | | | | | | |
| to average net assets | .60 | | .52 | | .20 | | .02 | | .26 | e |
| Portfolio Turnover Rate | 68.30 | | 74.74 | | 67.49 | | 56.03 | | 48.43 | d |
| Net Assets, end of period ($ x 1,000) | 706,606 | | 429,732 | | 297,086 | | 243,304 | | 63,379 | |
| |
| a | From December 17, 2008 (commencement of operations) to November 30, 2009. |
| b | Based on average shares outstanding at each month end. |
| c | Amount represents less than $.01 per share. |
| d | Not annualized. |
| e | Annualized. |
See notes to financial statements.
FINANCIAL HIGHLIGHTS (continued)
| |
| | Period Ended |
| Class Y Shares | November 30, 2013 a |
| Per Share Data ($): | |
| Net asset value, beginning of period | 22.76 |
| Investment Operations: | |
| Investment income—netb | .02 |
| Net realized and unrealized | |
| gain (loss) on investments | 3.76 |
| Total from Investment Operations | 3.78 |
| Net asset value, end of period | 26.54 |
| Total Return (%)c | 16.61 |
| Ratios/Supplemental Data (%): | |
| Ratio of total expenses to average net assetsd | 1.01 |
| Ratio of net expenses to average net assetsd | .99 |
| Ratio of net investment income | |
| to average net assetsd | .07 |
| Portfolio Turnover Rate | 68.30 |
| Net Assets, end of period ($ x 1,000) | 1 |
| |
| a | From July 1, 2013 (commencement of initial offering) to November 30, 2013. |
| b | Based on average shares outstanding at each month end. |
| c | Not annualized. |
| d | Annualized. |
See notes to financial statements.
32
NOTES TO FINANCIAL STATEMENTS
NOTE 1—Significant Accounting Policies:
Dreyfus Select Managers Small CapValue Fund (the “fund”) is a separate non-diversified series of Strategic Funds, Inc. (the “Company”), which is registered under the Investment Company Act of 1940, as amended (the “Act”), as an open-end management investment company and operates as a series company currently offering nine series, including the fund.The fund’s investment objective is to seek capital appreciation.The Dreyfus Corporation (the “Manager” or “Dreyfus”), a wholly-owned subsidiary of The Bank of New York Mellon Corporation (“BNY Mellon”), serves as the fund’s investment adviser. EACM Advisors LLC (“EACM”), a subsidiary of BNY Mellon and an affiliate of Dreyfus, serves as the fund’s portfolio allocation manager.Thompson, Siegel and Walmsley, LLC (“TS&W”), Walthausen & Co., LLC (“Walthausen”), Neuberger Berman Management LLC (“Neuberger Berman”), Lombardia Capital Partners, LLC (“Lombardia”), Iridian Asset Management LLC (“Iridian”), Vulcan Value Partners, LLC (“Vulcan”) and Kayne Anderson Rudnick Investment Management, LLC (“Kayne”) serve as the fund’s sub-investment advisers, each managing an allocated portion of the fund’s portfolio.
At a meeting held on April 29, 2013, the Company’s Board of Directors (the “Board”) approved, effective July 1, 2013: (a) for the fund to offer Class Y shares; and, (b) an increase in the authorized shares of the fund from 300 million to 400 million and authorized 100 million Class Y shares.
MBSC Securities Corporation (the “Distributor”), a wholly-owned subsidiary of Dreyfus, is the distributor of the fund’s shares.The fund is authorized to issue 100 million shares of $.001 par value Common Stock in each of the following classes of shares: Class A, Class C, Class I and Class Y. Class A shares generally are subject to a sales charge imposed at the time of purchase. Class C shares are subject to a contingent deferred sales charge (“CDSC”) imposed on Class C shares
NOTES TO FINANCIAL STATEMENTS (continued)
redeemed within one year of purchase. Class I and Class Y shares are offered at net asset value generally to institutional investors. Other differences between the classes include the services offered to and the expenses borne by each class, the allocation of certain transfer agency costs and certain voting rights. Income, expenses (other than expenses attributable to a specific class), and realized and unrealized gains or losses on investments are allocated to each class of shares based on its relative net assets.
As of November 30, 2013, MBC Investments Corp., an indirect subsidiary of BNY Mellon, held all of the outstanding Class Y shares of the fund.
The Company accounts separately for the assets, liabilities and operations of each series. Expenses directly attributable to each series are charged to that series’ operations; expenses which are applicable to all series are allocated among them on a pro rata basis.
The Financial Accounting Standards Board (“FASB”) Accounting Standards Codification is the exclusive reference of authoritative U.S. generally accepted accounting principles (“GAAP”) recognized by the FASB to be applied by nongovernmental entities. Rules and interpretive releases of the Securities and Exchange Commission (“SEC”) under authority of federal laws are also sources of authoritative GAAP for SEC registrants. The fund’s financial statements are prepared in accordance with GAAP, which may require the use of management estimates and assumptions.Actual results could differ from those estimates.
The Company enters into contracts that contain a variety of indemnifications. The fund’s maximum exposure under these arrangements is unknown.The fund does not anticipate recognizing any loss related to these arrangements.
(a) Portfolio valuation: The fair value of a financial instrument is the amount that would be received to sell an asset or paid to transfer a liability in an orderly transaction between market participants at the
34
measurement date (i.e., the exit price). GAAP establishes a fair value hierarchy that prioritizes the inputs of valuation techniques used to measure fair value. This hierarchy gives the highest priority to unadjusted quoted prices in active markets for identical assets or liabilities (Level 1 measurements) and the lowest priority to unobservable inputs (Level 3 measurements).
Additionally, GAAP provides guidance on determining whether the volume and activity in a market has decreased significantly and whether such a decrease in activity results in transactions that are not orderly. GAAP requires enhanced disclosures around valuation inputs and techniques used during annual and interim periods.
Various inputs are used in determining the value of the fund’s investments relating to fair value measurements.These inputs are summarized in the three broad levels listed below:
Level 1—unadjusted quoted prices in active markets for identical investments.
Level 2—other significant observable inputs (including quoted prices for similar investments, interest rates, prepayment speeds, credit risk, etc.).
Level 3—significant unobservable inputs (including the fund’s own assumptions in determining the fair value of investments).
The inputs or methodology used for valuing securities are not necessarily an indication of the risk associated with investing in those securities.
Changes in valuation techniques may result in transfers in or out of an assigned level within the disclosure hierarchy. Valuation techniques used to value the fund’s investments are as follows:
Investments in securities are valued at the last sales price on the securities exchange or national securities market on which such securities are primarily traded. Securities listed on the National Market System for which market quotations are available are valued at the official closing
NOTES TO FINANCIAL STATEMENTS (continued)
price or, if there is no official closing price that day, at the last sales price. Securities not listed on an exchange or the national securities market, or securities for which there were no transactions, are valued at the average of the most recent bid and asked prices, except for open short positions, where the asked price is used for valuation purposes. Bid price is used when no asked price is available. Registered investment companies that are not traded on an exchange are valued at their net asset value. All of the preceding securities are categorized within Level 1 of the fair value hierarchy.
Fair valuing of securities may be determined with the assistance of a pricing service using calculations based on indices of domestic securities and other appropriate indicators, such as prices of relevant ADRs and financial futures. Utilizing these techniques may result in transfers between Level 1 and Level 2 of the fair value hierarchy.
When market quotations or official closing prices are not readily available, or are determined not to reflect accurately fair value, such as when the value of a security has been significantly affected by events after the close of the exchange or market on which the security is principally traded (for example, a foreign exchange or market), but before the fund calculates its net asset value, the fund may value these investments at fair value as determined in accordance with the procedures approved by the Board. Certain factors may be considered when fair valuing investments such as: fundamental analytical data, the nature and duration of restrictions on disposition, an evaluation of the forces that influence the market in which the securities are purchased and sold, and public trading in similar securities of the issuer or comparable issuers. These securities are either categorized within Level 2 or 3 of the fair value hierarchy depending on the relevant inputs used.
For restricted securities where observable inputs are limited, assumptions about market activity and risk are used and are categorized within Level 3 of the fair value hierarchy.
36
The following is a summary of the inputs used as of November 30, 2013 in valuing the fund’s investments:
| | | | |
| | | Level 2—Other | Level 3— | |
| | Level 1— | Significant | Significant | |
| | Unadjusted | Observable | Unobservable | |
| | Quoted Prices | Inputs | Inputs | Total |
| Assets ($) | | | | |
| Investments in Securities: | | | |
| Equity Securities— | | | | |
| Domestic | | | | |
| Common Stocks† | 656,242,860 | — | — | 656,242,860 |
| Equity Securities— | | | | |
| Foreign | | | | |
| Common Stocks† | 19,756,471 | — | — | 19,756,471 |
| Exchange-Traded | | | | |
| Funds | 518,173 | — | — | 518,173 |
| Mutual Funds | 54,693,360 | — | — | 54,693,360 |
| |
| † See Statement of Investments for additional detailed categorizations. | |
At November 30, 2012, $425,585 of exchange traded domestic equity securities were classified within Level 2 of the fair value hierarchy pursuant to the fund’s fair valuation procedures.
(b) Securities transactions and investment income: Securities transactions are recorded on a trade date basis. Realized gains and losses from securities transactions are recorded on the identified cost basis. Dividend income is recognized on the ex-dividend date and interest income, including, where applicable, accretion of discount and amortization of premium on investments, is recognized on the accrual basis.
Pursuant to a securities lending agreement with The Bank of New York Mellon, a subsidiary of BNY Mellon and an affiliate of Dreyfus, the fund may lend securities to qualified institutions. It is the fund’s policy that, at origination, all loans are secured by collateral of at least 102% of the value of U.S. securities loaned and 105% of the value of foreign securities loaned. Collateral equivalent to at least 100% of the
NOTES TO FINANCIAL STATEMENTS (continued)
market value of securities on loan is maintained at all times. Collateral is either in the form of cash, which can be invested in certain money market mutual funds managed by Dreyfus or U.S. Government and Agency securities.The fund is entitled to receive all dividends, interest and distributions on securities loaned, in addition to income earned as a result of the lending transaction. Should a borrower fail to return the securities in a timely manner, The Bank of New York Mellon is required to replace the securities for the benefit of the fund or credit the fund with the market value of the unreturned securities and is subrogated to the fund’s rights against the borrower and the collateral. During the period ended November 30, 2013,The Bank of NewYork Mellon earned $133,897 from lending portfolio securities, pursuant to the securities lending agreement.
(d) Affiliated issuers: Investments in other investment companies advised by Dreyfus are defined as “affiliated” under the Act. Investments in affiliated investment companies during the period ended November 30, 2013 were as follows:
| | | | | |
| Affiliated | | | | | |
| Investment | Value | | | Value | Net |
| Company | 11/30/2012 ($) | Purchases ($) | Sales ($) | 11/30/2013 ($) | Assets (%) |
| Dreyfus | | | | | |
| Institutional | | | | | |
| Cash | | | | | |
| Advantage | | | | | |
| Fund | 43,410,240 | 201,661,792 | 190,378,672 | 54,693,360 | 7.7 |
(d) Dividends to shareholders: Dividends are recorded on the ex-dividend date. Dividends from investment income-net and dividends from net realized capital gains, if any, are normally declared and paid annually, but the fund may make distributions on a more frequent basis to comply with the distribution requirements of the Internal Revenue Code of 1986, as amended (the “Code”).To the extent that net realized capital gains can be offset by capital loss carryovers, it is the policy of the fund not to distribute such gains. Income and capital gain distributions are determined in accordance with income tax regulations, which may differ from GAAP.
38
(e) Federal income taxes: It is the policy of the fund to continue to qualify as a regulated investment company, if such qualification is in the best interests of its shareholders, by complying with the applicable provisions of the Code, and to make distributions of taxable income sufficient to relieve it from substantially all federal income and excise taxes.
As of and during the period ended November 30, 2013, the fund did not have any liabilities for any uncertain tax positions.The fund recognizes interest and penalties, if any, related to uncertain tax positions as income tax expense in the Statement of Operations. During the period ended November 30, 2013, the fund did not incur any interest or penalties.
Each tax year in the four-year period ended November 30, 2013 remains subject to examination by the Internal Revenue Service and state taxing authorities.
At November 30, 2013, the components of accumulated earnings on a tax basis were as follows: undistributed ordinary income $30,562,390, undistributed capital gains $29,790,496 and unrealized appreciation $162,525,194.
The tax character of distributions paid to shareholders during the fiscal periods ended November 30, 2013 and November 30, 2012 were as follows: ordinary income $11,546,395 and $7,650,223, and long-term capital gains $11,962,084 and $18,367,914, respectively.
NOTE 2—Bank Lines of Credit:
The fund participates with other Dreyfus-managed funds in a $265 million unsecured credit facility led by Citibank, N.A. and a $300 million unsecured credit facility provided by The Bank of New York Mellon (each, a “Facility”), each to be utilized primarily for temporary or emergency purposes, including the financing of redemptions. Prior to October 9, 2013, the unsecured credit facility with Citibank, N.A. was $210 million. In connection therewith, the fund has agreed to pay its pro
NOTES TO FINANCIAL STATEMENTS (continued)
rata portion of commitment fees for each Facility. Interest is charged to the fund based on rates determined pursuant to the terms of the respective Facility at the time of borrowing. During the period ended November 30, 2013, the fund did not borrow under the Facilities.
NOTE 3—Management Fee, Sub-Investment Advisory Fee and Other Transactions With Affiliates:
(a) Pursuant to a management agreement with Dreyfus, the management fee is computed at the annual rate of .90% of the value of the fund’s average daily net assets and is payable monthly. Dreyfus had contractually agreed, from December 1, 2012 through April 1, 2013, to waive receipt of its fees and/or assume the expenses of the fund so that the expenses of none of the classes (excluding Rule 12b-1 Distribution Plan fees, Shareholder Services Plan fees, taxes, interest expense, brokerage commissions, commitment fees on borrowings and extraordinary expenses) exceeded 1.15% of the value of the fund’s average daily net assets. Thereafter, Dreyfus has contractually agreed from April 2, 2013 through July 1, 2014, to waive receipt of its fees and/or assume the expenses of the fund so that the expenses of none of the classes (excluding certain expenses as described above) exceed 1.05% of the value of the fund’s average daily net assets.The reduction in expenses, pursuant to the undertaking, amounted to $450 during the period ended November 30, 2013.
Pursuant to a Portfolio Allocation Agreement between Dreyfus and EACM, Dreyfus pays EACM a monthly fee at an annual percentage of the value of the fund’s average daily net assets.
Pursuant to separate Sub-Investment Advisory Agreements between Dreyfus and TS&W, Walthausen, Neuberger Berman, Lombardia, Iridian, Vulcan and Kayne, Dreyfus pays each sub-investment adviser separate monthly fees at an annual percentage of the value of the fund’s average daily net assets managed by such sub-investment adviser.
During the period ended November 30, 2013, the Distributor retained $827 from commissions earned on sales of the fund’s Class A shares.
40
(b) Under the Distribution Plan adopted pursuant to Rule 12b-1 under the Act, Class C shares pay the Distributor for distributing its shares at an annual rate of .75% of the value of its average daily net assets. During the period ended November 30, 2013, Class C shares were charged $1,287 pursuant to the Distribution Plan.
(c) Under the Shareholder Services Plan, Class A and Class C shares pay the Distributor at an annual rate of .25% of the value of their average daily net assets for the provision of certain services.The services provided may include personal services relating to shareholder accounts, such as answering shareholder inquiries regarding the fund and providing reports and other information, and services related to the maintenance of shareholder accounts.The Distributor may make payments to Service Agents (securities dealers, financial institutions or other industry professionals) with respect to these services. The Distributor determines the amounts to be paid to Service Agents. During the period ended November 30, 2013, Class A and Class C shares were charged $3,009 and $429, respectively, pursuant to the Shareholder Services Plan.
The fund has arrangements with the transfer agent and the custodian whereby the fund may receive earnings credits when positive cash balances are maintained, which are used to offset transfer agency and custody fees. For financial reporting purposes, the fund includes net earnings credits as an expense offset in the Statement of Operations.
The fund compensates DreyfusTransfer, Inc., a wholly-owned subsidiary of Dreyfus, under a transfer agency agreement for providing transfer agency and cash management services for the fund. The majority of transfer agency fees are comprised of amounts paid on a per account basis, while cash management fees are related to fund subscriptions and redemptions. During the period ended November 30, 2013, the fund was charged $2,840 for transfer agency services and $102 for cash management services.These fees are included in Shareholder servicing costs in the Statement of Operations. Cash management fees were partially offset by earnings credits of $11.
NOTES TO FINANCIAL STATEMENTS (continued)
The fund compensates The Bank of NewYork Mellon under a custody agreement for providing custodial services for the fund.These fees are determined based on net assets, geographic region and transaction activity. During the period ended November 30, 2013, the fund was charged $90,598 pursuant to the custody agreement.
The fund compensated The Bank of New York Mellon under a cash management agreement that was in effect until September 30, 2013 for performing certain cash management services related to fund subscriptions and redemptions. During the period ended November 30, 2013, the fund was charged $39 pursuant to the cash management agreement, which is included in Shareholder servicing costs in the Statement of Operations.
During the period ended November 30, 2013, the fund was charged $9,055 for services performed by the Chief Compliance Officer and his staff.
The components of “Due to The Dreyfus Corporation and affiliates” in the Statement of Assets and Liabilities consist of: management fees $509,514, Distribution Plan fees $139, Shareholder Services Plan fees $347, custodian fees $39,374, Chief Compliance Officer fees $3,833 and transfer agency fees $827, which are offset against an expense reimbursement currently in effect in the amount of $48.
(d) Each Board member also serves as a Board member of other funds within the Dreyfus complex. Annual retainer fees and attendance fees are allocated to each fund based on net assets.
NOTE 4—Securities Transactions:
The aggregate amount of purchases and sales of investment securities, excluding short-term securities, during the period ended November 30, 2013, amounted to $443,908,052 and $372,437,512, respectively.
42
At November 30, 2013, the cost of investments for federal income tax purposes was $568,687,844; accordingly, accumulated net unrealized appreciation on investments was $162,523,020, consisting of $176,343,225 gross unrealized appreciation and $13,820,205 gross unrealized depreciation.
NOTE 5—Subsequent Event:
On December 26, 2013,VulcanValue Partners, LLC (“Vulcan”) resigned as a sub-investment adviser of the fund, effective March 26, 2014.The portion of the assets of the fund under Vulcan’s management will be allocated to certain of the fund’s six other Sub-Advisers, as determined by the Portfolio Allocation Manager.
|
| REPORT OF INDEPENDENT REGISTERED |
| PUBLIC ACCOUNTING FIRM |
Shareholders and Board of Directors
Dreyfus Select Managers Small Cap Value Fund
We have audited the accompanying statement of assets and liabilities, including the statement of investments, of Dreyfus Select Managers Small CapValue Fund (one of the series comprising Strategic Funds, Inc.) as of November 30, 2013, and the related statement of operations for the year then ended, the statement of changes in net assets for each of the two years in the period then ended, and the financial highlights for each of the periods indicated therein. These financial statements and financial highlights are the responsibility of the Fund’s management. Our responsibility is to express an opinion on these financial statements and financial highlights based on our audits.
We conducted our audits in accordance with the standards of the Public Company Accounting Oversight Board (United States).Those standards require that we plan and perform the audit to obtain reasonable assurance about whether the financial statements and financial highlights are free of material misstatement.We were not engaged to perform an audit of the Fund’s internal control over financial reporting. Our audits included consideration of internal control over financial reporting as a basis for designing audit procedures that are appropriate in the circumstances, but not for the purpose of expressing an opinion on the effectiveness of the Fund’s internal control over financial reporting. Accordingly, we express no such opinion.An audit also includes examining, on a test basis, evidence supporting the amounts and disclosures in the financial statements and financial highlights, assessing the accounting principles used and significant estimates made by management, and evaluating the overall financial statement presentation. Our procedures included confirmation of securities owned as of November 30, 2013 by correspondence with the custodian and others. We believe that our audits provide a reasonable basis for our opinion.
In our opinion, the financial statements and financial highlights referred to above present fairly, in all material respects, the financial position of Dreyfus Select Managers Small CapValue Fund at November 30, 2013, the results of its operations for the year then ended, the changes in its net assets for each of the two years in the period then ended, and the financial highlights for each of the indicated periods, in conformity with U.S. generally accepted accounting principles.

NewYork, NewYork
January 27, 2014
44
IMPORTANT TAX INFORMATION (Unaudited)
For federal tax purposes the fund hereby reports 39.85% of the ordinary dividends paid during the fiscal year ended November 30, 2013 as qualifying for the corporate dividends received deduction. Also, certain dividends paid by the fund may be subject to a maximum tax rate of 15%, as provided for by the Jobs and Growth Tax Relief Reconciliation Act of 2003. Of the distributions paid during the fiscal year, $4,089,326 represents the maximum amount that may be considered qualified dividend income. Shareholders will receive notification in early 2014 of the percentage applicable to the preparation of their 2013 income tax returns. Also, the fund hereby reports $.4463 per share as a short-term capital gain distribution and $.5437 per share as a long-term capital gain distribution paid on December 31, 2012 and the fund also reports $.0015 per share as a short-term capital gain distribution and $.0075 per share as a long-term capital gain distribution paid on March 20, 2013.
|
| INFORMATION ABOUT THE RENEWAL OF THE FUND’S |
| MANAGEMENT, PORTFOLIO ALLOCATION MANAGEMENT |
| AND SUB-INVESTMENT ADVISORY AGREEMENTS (Unaudited) |
At a meeting of the fund’s Board of Directors held on November 4-5, 2013, the Board considered the renewal of (a) the fund’s Management Agreement, pursuant to which Dreyfus provides the fund with investment advisory and administrative services (the “Management Agreement”); (b) Dreyfus’ Portfolio Allocation Management Agreement (the “Allocation Agreement”) with EACM Advisors, LLC (“EACM”), pursuant to which EACM is responsible for evaluating and recommending sub-advisers to provide the fund with day-to-day portfolio management services, recommending the percentage of fund assets to be allocated to each sub-adviser, monitoring and evaluating the performance of the sub-advisers, and recommending whether a sub-adviser should be terminated; and (c) Dreyfus’ separate Sub-Investment Advisory Agreements with each of Thomson, Siegel and Walmsley, LLC, Walthausen & Co., LLC, Neuberger Berman Management, LLC, Lombardia Capital Partners, LLC, Iridian Asset Management, LLC, Vulcan Value Partners, LLC and Kayne Rudnick Anderson Investment Management, LLC (collectively, the “Sub-Advisers”), pursuant to which each Sub-Adviser serves as a sub-investment adviser to the fund and provides day-to-day management of a percentage of the fund’s portfolio (collectively with the Management Agreement and the Allocation Agreement, the “ Agreements”).The Board members, none of whom are “interested persons” (as defined in the Investment Company Act of 1940, as amended) of the fund, were assisted in their review by independent legal counsel and met with counsel in executive session separate from representatives of Dreyfus, EACM or the Sub-Advisers. In considering the renewal of the Agreements, the Board considered all factors that it believed to be relevant, including those discussed below.The Board did not identify any one factor as dispositive, and each Board member may have attributed different weights to the factors considered.
Analysis of Nature, Extent, and Quality of Services Provided to the Fund. The Board considered information provided to them at the meeting and in previous presentations from Dreyfus representatives regarding the nature, extent, and quality of the services provided to funds in the Dreyfus fund complex. Dreyfus provided the number of
46
open accounts in the fund, the fund’s asset size and the allocation of fund assets among distribution channels. Dreyfus also had previously provided information regarding the diverse intermediary relationships and distribution channels of funds in the Dreyfus fund complex (such as retail direct or intermediary, in which intermediaries typically are paid by the fund and/or Dreyfus) and Dreyfus’ corresponding need for broad, deep, and diverse resources to be able to provide ongoing shareholder services to each intermediary or distribution channel, as applicable to the fund.
The Board also considered research support available to, and portfolio management capabilities of, the fund’s portfolio management personnel and that Dreyfus also provides oversight of day-to-day fund operations, including fund accounting and administration and assistance in meeting legal and regulatory requirements.The Board also considered Dreyfus’ extensive administrative, accounting, and compliance infrastructures, as well as Dreyfus’ supervisory activities over EACM and the Sub-Advisers and EACM’s evaluations and recommendations to Dreyfus regarding the Sub-Advisers and EACM’s supervisory activities over the Sub-Advisers.The Board also considered the Sub-Advisers’ brokerage policies and practices (including policies and practices regarding soft dollars) of the respective Sub-Advisers and the respective standards applied in seeking best execution.
Comparative Analysis of the Fund’s Performance and Management Fee and Expense Ratio. The Board reviewed reports prepared by Lipper, Inc. (“Lipper”), an independent provider of investment company data, which included information comparing (1) the fund’s performance with the performance of a group of comparable funds (the “Performance Group”) and with a broader group of funds (the “Performance Universe”), all for various periods ended September 30, 2013, and (2) the fund’s actual and contractual management fees and total expenses with those of a group of comparable funds (the “Expense Group”) and with a broader group of funds (the “Expense Universe”), the information for which was derived in part from fund
|
| INFORMATION ABOUT THE RENEWAL OF THE FUND’S MANAGEMENT, |
| PORTFOLIO ALLOCATION MANAGEMENT AND SUB-INVESTMENT |
| ADVISORY AGREEMENTS (Unaudited) (continued) |
financial statements available to Lipper as of the date of its analysis. Dreyfus previously had furnished the Board with a description of the methodology Lipper used to select the Performance Group and Performance Universe and the Expense Group and Expense Universe.
Dreyfus representatives stated that the usefulness of performance comparisons may be affected by a number of factors, including different investment limitations that may be applicable to the fund and comparison funds.The Board discussed the results of the comparisons and noted that the fund’s total return performance was above the Performance Group and Performance Universe medians, and ranked in the first or second quartile in the Performance Group, for all periods. Dreyfus also provided a comparison of the fund’s calendar year total returns to the returns of the fund’s benchmark index.
The Board also reviewed the range of actual and contractual management fees and total expenses of the Expense Group and Expense Universe funds and discussed the results of the comparisons.The Board noted that the fund’s contractual management fee was above the Expense Group median, the fund’s actual management fee was above the Expense Group and Expense Universe medians, and the fund’s total expenses were below the Expense Group and Expense Universe medians.
Dreyfus representatives noted that Dreyfus has contractually agreed to waive receipt of its fees and/or assume the expenses of the fund, until July 1, 2014, so that annual direct fund operating expenses (excluding Rule 12b-1 fees, shareholder services plan fees, taxes, interest, brokerage commissions, commitment fees on borrowings, acquired fund fees and extraordinary expenses) do not exceed 1.05% of the fund’s average daily net assets.
Dreyfus representatives reviewed with the Board the management or investment advisory fees (1) paid by funds advised or administered by Dreyfus that are in the same Lipper category as the fund and (2) paid to Dreyfus, EACM, or the Sub-Advisers or their affiliates for advising any separate accounts and/or other types of client portfolios that are
48
considered to have similar investment strategies and policies as the fund (the “Similar Clients”), and explained the nature of the Similar Clients.They discussed differences in fees paid and the relationship of the fees paid in light of any differences in the services provided and other relevant factors. The Board considered the relevance of the fee information provided for the Similar Clients to evaluate the appropriateness and reasonableness of the fund’s management fee.
The Board considered the fee paid to EACM and to each Sub-Adviser in relation to the fee paid to Dreyfus by the fund and the respective services provided by the Sub-Advisers, EACM and Dreyfus.The Board also reviewed and considered the individual performance of the respective Sub-Advisers as to the portion of the fund’s assets under their manage-ment.The Board also noted that EACM’s and each Sub-Adviser’s fee is paid by Dreyfus (out of its fee from the fund) and not the fund.
Analysis of Profitability and Economies of Scale. Dreyfus representatives reviewed the expenses allocated and profit received by Dreyfus and the resulting profitability percentage for managing the fund and the aggregate profitability percentage to Dreyfus of managing the funds in the Dreyfus fund complex, and the method used to determine the expenses and profit. The Board concluded that the profitability results were not unreasonable, given the services rendered and service levels provided by Dreyfus. The Board also had been provided with information prepared by an independent consulting firm regarding Dreyfus’ approach to allocating costs to, and determining the profitability of, individual funds and the entire Dreyfus fund complex.The consulting firm also had analyzed where any economies of scale might emerge in connection with the management of a fund.
The Board considered on the advice of its counsel the profitability analysis (1) as part of its evaluation of whether the fees under the Agreements bear a reasonable relationship to the mix of services provided by Dreyfus, EACM and the Sub-Advisers, including the nature,
|
| INFORMATION ABOUT THE RENEWAL OF THE FUND’S MANAGEMENT, |
| PORTFOLIO ALLOCATION MANAGEMENT AND SUB-INVESTMENT |
| ADVISORY AGREEMENTS (Unaudited) (continued) |
extent, and quality of such services, and (2) in light of the relevant circumstances for the fund and the extent to which economies of scale would be realized if the fund grows and whether fee levels reflect these economies of scale for the benefit of fund shareholders. Since Dreyfus, and not the fund, pays EACM and each Sub-Adviser pursuant to respective Agreements, the Board did not consider EACM’s or any Sub-Adviser’s profitability to be relevant to its deliberations. Dreyfus representatives also noted that, as a result of shared and allocated costs among funds in the Dreyfus fund complex, the extent of economies of scale could depend substantially on the level of assets in the complex as a whole, so that increases and decreases in complex-wide assets can affect potential economies of scale in a manner that is disproportionate to, or even in the opposite direction from, changes in the fund’s asset level.The Board also considered potential benefits to Dreyfus and each Sub-Adviser from acting as investment adviser and sub-investment adviser, respectively, and EACM from acting as portfolio allocation manager, and noted the soft dollar arrangements in effect among the various Sub-Advisers for trading the fund’s investments.
At the conclusion of these discussions, the Board agreed that it had been furnished with sufficient information to make an informed business decision with respect to the renewal of the Agreements. Based on the discussions and considerations as described above, the Board concluded and determined as follows.
The Board concluded that the nature, extent, and quality of the services provided by Dreyfus, EACM, and the Sub-Advisers are adequate and appropriate.
The Board was satisfied with the fund’s performance.
The Board concluded that the fees paid to Dreyfus, EACM and the Sub-Advisers were reasonable in light of the considerations described above.
50
The Board determined that the economies of scale which may accrue to Dreyfus and its affiliates in connection with the management of the fund had been adequately considered by Dreyfus in connection with the fee rate charged to the fund pursuant to the Agreement and that, to the extent in the future it were determined that material economies of scale had not been shared with the fund, the Board would seek to have those economies of scale shared with the fund.
In evaluating the Agreements, the Board considered these conclusions and determinations and also relied on its previous knowledge, gained through meetings and other interactions with Dreyfus and its affiliates and the Sub-Adviser, of the fund and the services provided to the fund by Dreyfus and the Sub-Adviser.The Board also relied on information received on a routine and regular basis throughout the year relating to the operations of the fund and the investment management and other services provided under the Agreements, including information on the investment performance of the fund in comparison to similar mutual funds and benchmark performance indices; general market outlook as applicable to the fund; and compliance reports. In addition, the Board’s consideration of the contractual fee arrangements for this fund had the benefit of a number of years of reviews of prior or similar agreements during which lengthy discussions took place between the Board and Dreyfus representatives. Certain aspects of the arrangements may receive greater scrutiny in some years than in others, and the Board’s conclusions may be based, in part, on their consideration of the same or similar arrangements in prior years.The Board determined that renewal of the Agreements was in the best interests of the fund and its shareholders.
BOARD MEMBERS INFORMATION (Unaudited)
|
| Joseph S. DiMartino (70) |
| Chairman of the Board (1995) |
| Principal Occupation During Past 5Years: |
| • Corporate Director and Trustee |
| Other Public Company Board Memberships During Past 5Years: |
| • CBIZ (formerly, Century Business Services, Inc.), a provider of outsourcing functions for small |
| and medium size companies, Director (1997-present) |
| • The Newark Group, a provider of a national market of paper recovery facilities, paperboard |
| mills and paperboard converting plants, Director (2000-2010) |
| • Sunair Services Corporation, a provider of certain outdoor-related services to homes and |
| businesses, Director (2005-2009) |
| No. of Portfolios for which Board Member Serves: 141 |
| ——————— |
| William Hodding Carter III (78) |
| Board Member (1988) |
| Principal Occupation During Past 5Years: |
| • Professor of Leadership & Public Policy, University of North Carolina, Chapel Hill (2006-present) |
| No. of Portfolios for which Board Member Serves: 24 |
| ——————— |
| Gordon J. Davis (72)† |
| Board Member (2006) |
| Principal Occupation During Past 5Years: |
| • Partner in the law firm ofVenable LLP (2012-present) |
| • Partner in the law firm of Dewey & LeBoeuf LLP (1994-2012) |
| Other Public Company Board Memberships During Past 5Years: |
| • Consolidated Edison, Inc., a utility company, Director (1997-present) |
| • The Phoenix Companies, Inc., a life insurance company, Director (2000-present) |
| No. of Portfolios for which Board Member Serves: 49 |
| † Mr. Davis is deemed to be an “interested person” (as defined in the Act) of the fund as a result of his affiliation with |
| Venable LLP, which provides legal services to the fund. |
| ——————— |
| Joni Evans (71) |
| Board Member (2006) |
| Principal Occupation During Past 5Years: |
| • Chief Executive Officer, www.wowOwow.com an online community dedicated to women’s |
| conversations and publications (2007-present) |
| • Principal, Joni Evans Ltd. (publishing) (2006-present) |
| No. of Portfolios for which Board Member Serves: 24 |
52
|
| Ehud Houminer (73) |
| Board Member (1994) |
| Principal Occupation During Past 5Years: |
| • Executive-in-Residence at the Columbia Business School, Columbia University (1992-present) |
| Other Public Company Board Memberships During Past 5Years: |
| • Avnet Inc., an electronics distributor, Director (1993-2012) |
| No. of Portfolios for which Board Member Serves: 66 |
| ——————— |
| Richard C. Leone (73) |
| Board Member (1984) |
| Principal Occupation During Past 5Years: |
| • Senior Fellow and former President of The Century Foundation (formerly,The Twentieth |
| Century Fund, Inc.), a tax exempt research foundation engaged in the study of economic, |
| foreign policy and domestic issues |
| No. of Portfolios for which Board Member Serves: 24 |
| ——————— |
| Hans C. Mautner (76) |
| Board Member (1984) |
| Principal Occupation During Past 5Years: |
| • President—International Division and an Advisory Director of Simon Property Group, a real |
| estate investment company (1998-2010) |
| • Chairman and Chief Executive Officer of Simon Global Limited, a real estate company (1999-2010) |
| No. of Portfolios for which Board Member Serves: 24 |
| ——————— |
| Robin A. Melvin (50) |
| Board Member (1995) |
| Principal Occupation During Past 5Years: |
| • Board Member, Illinois Mentoring Partnership, non-profit organization dedicated to increasing |
| the quantity and quality of mentoring services in Illinois (2013-present) |
| • Director, Boisi Family Foundation, a private family foundation that supports youth-serving orga- |
| nizations that promote the self sufficiency of youth from disadvantaged circumstances (1995-2012) |
| No. of Portfolios for which Board Member Serves: 90 |
BOARD MEMBERS INFORMATION (Unaudited) (continued)
|
| Burton N. Wallack (63) |
| Board Member (2006) |
| Principal Occupation During Past 5Years: |
| • President and Co-owner of Wallack Management Company, a real estate management company |
| No. of Portfolios for which Board Member Serves: 24 |
| ——————— |
| John E. Zuccotti (76) |
| Board Member (1984) |
| Principal Occupation During Past 5Years: |
| • Chairman of Brookfield Properties, Inc. |
| • Senior Counsel of Weil, Gotshal & Manges, LLP |
| • Emeritus Chairman of the Real Estate Board of NewYork |
| Other Public Company Board Memberships During Past 5Years: |
| • Wellpoint, Inc., a health benefits company, Director (2005-2010) |
| No. of Portfolios for which Board Member Serves: 24 |
| ——————— |
Once elected all Board Members serve for an indefinite term, but achieve Emeritus status upon reaching age 80.The address of the Board Members and Officers is c/o The Dreyfus Corporation, 200 Park Avenue, NewYork, NewYork 10166. Additional information about the Board Members is available in the fund’s Statement of Additional Information which can be obtained from Dreyfus free of charge by calling this toll free number: 1-800-DREYFUS.
David W. Burke, Emeritus Board Member
Arnold S. Hiatt, Emeritus Board Member
54
OFFICERS OF THE FUND (Unaudited)
BRADLEY J. SKAPYAK, President since January 2010.
Chief Operating Officer and a director of the Manager since June 2009, Chairman of Dreyfus Transfer, Inc., an affiliate of the Manager and the transfer agent of the funds, since May 2011 and Executive Vice President of the Distributor since June 2007. From April 2003 to June 2009, Mr. Skapyak was the head of the Investment Accounting and Support Department of the Manager. He is an officer of 68 investment companies (comprised of 141 portfolios) managed by the Manager. He is 55 years old and has been an employee of the Manager since February 1988.
JOHN PAK, Chief Legal Officer since March 2013.
Chief Legal Officer of the Manager and Associate General Counsel and Managing Director of BNY Mellon since August 2012; from March 2005 to July 2012, Managing Director of Deutsche Bank, Deputy Global Head of Deutsche Asset Management Legal and Regional Head of Deutsche Asset Management Americas Legal. He is an officer of 69 investment companies (comprised of 166 portfolios) managed by the Manager. He is 45 years old and has been an employee of the Manager since August 2012.
JANETTE E. FARRAGHER, Vice President and Secretary since December 2011.
Assistant General Counsel of BNY Mellon, and an officer of 69 investment companies (comprised of 166 portfolios) managed by the Manager. She is 50 years old and has been an employee of the Manager since February 1984.
KIESHA ASTWOOD, Vice President and Assistant Secretary since January 2010.
Counsel of BNY Mellon, and an officer of 69 investment companies (comprised of 166 portfolios) managed by the Manager. She is 40 years old and has been an employee of the Manager since July 1995.
JAMES BITETTO, Vice President and Assistant Secretary since August 2005.
Senior Counsel of BNY Mellon and Secretary of the Manager, and an officer of 69 investment companies (comprised of 166 portfolios) managed by the Manager. He is 47 years old and has been an employee of the Manager since December 1996.
JONI LACKS CHARATAN, Vice President and Assistant Secretary since August 2005.
Senior Counsel of BNY Mellon, and an officer of 69 investment companies (comprised of 166 portfolios) managed by the Manager. She is 58 years old and has been an employee of the Manager since October 1988.
JOSEPH M. CHIOFFI, Vice President and Assistant Secretary since August 2005.
Senior Counsel of BNY Mellon, and an officer of 69 investment companies (comprised of 166 portfolios) managed by the Manager. He is 52 years old and has been an employee of the Manager since June 2000.
JOHN B. HAMMALIAN, Vice President and Assistant Secretary since August 2005.
Senior Managing Counsel of BNY Mellon, and an officer of 69 investment companies (comprised of 166 portfolios) managed by the Manager. He is 50 years old and has been an employee of the Manager since February 1991.
ROBERT R. MULLERY, Vice President and Assistant Secretary since August 2005.
Managing Counsel of BNY Mellon, and an officer of 69 investment companies (comprised of 166 portfolios) managed by the Manager. He is 61 years old and has been an employee of the Manager since May 1986.
OFFICERS OF THE FUND (Unaudited) (continued)
JEFF PRUSNOFSKY, Vice President and Assistant Secretary since August 2005.
Senior Managing Counsel of BNY Mellon, and an officer of 69 investment companies (comprised of 166 portfolios) managed by the Manager. He is 48 years old and has been an employee of the Manager since October 1990.
JAMES WINDELS, Treasurer since November 2001.
Director – Mutual Fund Accounting of the Manager, and an officer of 69 investment companies (comprised of 166 portfolios) managed by the Manager. He is 55 years old and has been an employee of the Manager since April 1985.
RICHARD CASSARO, Assistant Treasurer since January 2008.
Senior Accounting Manager – Money Market and Municipal Bond Funds of the Manager, and an officer of 69 investment companies (comprised of 166 portfolios) managed by the Manager. He is 54 years old and has been an employee of the Manager since September 1982.
GAVIN C. REILLY, Assistant Treasurer since December 2005.
Tax Manager of the Investment Accounting and Support Department of the Manager, and an officer of 69 investment companies (comprised of 166 portfolios) managed by the Manager. He is 45 years old and has been an employee of the Manager since April 1991.
ROBERT S. ROBOL, Assistant Treasurer since December 2002.
Senior Accounting Manager – Fixed Income Funds of the Manager, and an officer of 69 investment companies (comprised of 166 portfolios) managed by the Manager. He is 49 years old and has been an employee of the Manager since October 1988.
ROBERT SALVIOLO, Assistant Treasurer since July 2007.
Senior Accounting Manager – Equity Funds of the Manager, and an officer of 69 investment companies (comprised of 166 portfolios) managed by the Manager. He is 46 years old and has been an employee of the Manager since June 1989.
ROBERT SVAGNA, Assistant Treasurer since December 2002.
Senior Accounting Manager – Equity Funds of the Manager, and an officer of 69 investment companies (comprised of 166 portfolios) managed by the Manager. He is 46 years old and has been an employee of the Manager since November 1990.
JOSEPH W. CONNOLLY, Chief Compliance Officer since October 2004.
Chief Compliance Officer of the Manager and The Dreyfus Family of Funds (69 investment companies, comprised of 166 portfolios). He is 56 years old and has served in various capacities with the Manager since 1980, including manager of the firm’s Fund Accounting Department from 1997 through October 2001.
MATTHEW D. CONNOLLY, Anti-Money Laundering Compliance Officer since April 2012.
Anti-Money Laundering Compliance Officer of the Distributor since October 2011; from March 2010 to September 2011, Global Head, KYC Reviews and Director, UBS Investment Bank; until March 2010, AML Compliance Officer and Senior Vice President, Citi Global Wealth Management. He is an officer of 64 investment companies (comprised of 161 portfolios) managed by the Manager. He is 41 years old and has been an employee of the Distributor since October 2011.
56
For More Information
Telephone Call your financial representative or 1-800-DREYFUS
Mail The Dreyfus Family of Funds, 144 Glenn Curtiss Boulevard, Uniondale, NY 11556-0144
The fund files its complete schedule of portfolio holdings with the Securities and Exchange Commission (“SEC”) for the first and third quarters of each fiscal year on Form N-Q. The fund’s Forms N-Q are available on the SEC’s website at http://www.sec.gov and may be reviewed and copied at the SEC’s Public Reference Room in Washington, DC. Information on the operation of the Public Reference Room may be obtained by calling 1-800-SEC-0330.
Item 2. Code of Ethics.
The Registrant has adopted a code of ethics that applies to the Registrant's principal executive officer, principal financial officer, principal accounting officer or controller, or persons performing similar functions. There have been no amendments to, or waivers in connection with, the Code of Ethics during the period covered by this Report.
Item 3. Audit Committee Financial Expert.
The Registrant's Board has determined that Ehud Houminer, a member of the Audit Committee of the Board, is an audit committee financial expert as defined by the Securities and Exchange Commission (the "SEC"). Ehud Houminer is "independent" as defined by the SEC for purposes of audit committee financial expert determinations.
Item 4. Principal Accountant Fees and Services.
(a) Audit Fees. The aggregate fees billed for each of the last two fiscal years (the "Reporting Periods") for professional services rendered by the Registrant's principal accountant (the "Auditor") for the audit of the Registrant's annual financial statements or services that are normally provided by the Auditor in connection with the statutory and regulatory filings or engagements for the Reporting Periods, were $144,962 in 2012 and $148,340 in 2013.
(b) Audit-Related Fees. The aggregate fees billed in the Reporting Periods for assurance and related services by the Auditor that are reasonably related to the performance of the audit of the Registrant's financial statements and are not reported under paragraph (a) of this Item 4 were $48,000 in 2012 and $28,800 in 2013. These services consisted of one or more of the following: (i) agreed upon procedures related to compliance with Internal Revenue Code section 817(h), (ii) security counts required by Rule 17f-2 under the Investment Company Act of 1940, as amended, (iii) advisory services as to the accounting or disclosure treatment of Registrant transactions or events and (iv) advisory services to the accounting or disclosure treatment of the actual or potential impact to the Registrant of final or proposed rules, standards or interpretations by the Securities and Exchange Commission, the Financial Accounting Standards Boards or other regulatory or standard-setting bodies.
The aggregate fees billed in the Reporting Periods for non-audit assurance and related services by the Auditor to the Registrant's investment adviser (not including any sub-investment adviser whose role is primarily portfolio management and is subcontracted with or overseen by another investment adviser), and any entity controlling, controlled by or under common control with the investment adviser that provides ongoing services to the Registrant ("Service Affiliates"), that were reasonably related to the performance of the annual audit of the Service Affiliate, which required pre-approval by the Audit Committee were $0 in 2012 and $0 in 2013.
(c) Tax Fees. The aggregate fees billed in the Reporting Periods for professional services rendered by the Auditor for tax compliance, tax advice, and tax planning ("Tax Services") were $19,386 in 2012 and $19,119 in 2013. These services consisted of: (i) review or preparation of U.S. federal, state, local and excise tax returns; (ii) U.S. federal, state and local tax planning, advice and assistance regarding statutory, regulatory or administrative developments; (iii) tax advice regarding tax qualification matters and/or treatment of various financial instruments held or proposed to be acquired or held, and (iv) determination of Passive Foreign Investment Companies. The aggregate fees billed in the Reporting Periods for Tax Services by the Auditor to Service Affiliates, which required pre-approval by the Audit Committee were $0 in 2012 and $0 in 2013.
(d) All Other Fees. The aggregate fees billed in the Reporting Periods for products and services provided by the Auditor, other than the services reported in paragraphs (a) through (c) of this Item, were $444 in 2012 and $532 in 2013. [These services consisted of a review of the Registrant's anti-money laundering program].
The aggregate fees billed in the Reporting Periods for Non-Audit Services by the Auditor to Service Affiliates, other than the services reported in paragraphs (b) through (c) of this Item, which required pre-approval by the Audit Committee, were $200,000 in 2012 and $0 in 2013.
(e)(1) Audit Committee Pre-Approval Policies and Procedures. The Registrant's Audit Committee has established policies and procedures (the "Policy") for pre-approval (within specified fee limits) of the Auditor's engagements for non-audit services to the Registrant and Service Affiliates without specific case-by-case consideration. The pre-approved services in the Policy can include pre-approved audit services, pre-approved audit-related services, pre-approved tax services and pre-approved all other services. Pre-approval considerations include whether the proposed services are compatible with maintaining the Auditor's independence. Pre-approvals pursuant to the Policy are considered annually.
(e)(2) Note: None of the services described in paragraphs (b) through (d) of this Item 4 were approved by the Audit Committee pursuant to paragraph (c)(7)(i)(C) of Rule 2-01 of Regulation S-X.
(f) None of the hours expended on the principal accountant's engagement to audit the registrant's financial statements for the most recent fiscal year were attributed to work performed by persons other than the principal account's full-time, permanent employees.
Non-Audit Fees. The aggregate non-audit fees billed by the Auditor for services rendered to the Registrant, and rendered to Service Affiliates, for the Reporting Periods were $50,505,978 in 2012 and $51,023,448 in 2013.
Auditor Independence. The Registrant's Audit Committee has considered whether the provision of non-audit services that were rendered to Service Affiliates, which were not pre-approved (not requiring pre-approval), is compatible with maintaining the Auditor's independence.
Item 5. Audit Committee of Listed Registrants.
Not applicable. [CLOSED-END FUNDS ONLY]
Item 6. Investments.
(a) Not applicable.
Item 7. Disclosure of Proxy Voting Policies and Procedures for Closed-End Management Investment Companies.
Not applicable. [CLOSED-END FUNDS ONLY]
Item 8. Portfolio Managers of Closed-End Management Investment Companies.
Not applicable. [CLOSED-END FUNDS ONLY, beginning with reports for periods ended on and after December 31, 2005]
Item 9. Purchases of Equity Securities by Closed-End Management Investment Companies and Affiliated Purchasers.
Not applicable. [CLOSED-END FUNDS ONLY]
Item 10. Submission of Matters to a Vote of Security Holders.
There have been no material changes to the procedures applicable to Item 10.
Item 11. Controls and Procedures.
(a) The Registrant's principal executive and principal financial officers have concluded, based on their evaluation of the Registrant's disclosure controls and procedures as of a date within 90 days of the filing date of this report, that the Registrant's disclosure controls and procedures are reasonably designed to ensure that information required to be disclosed by the Registrant on Form N-CSR is recorded, processed, summarized and reported within the required time periods and that information required to be disclosed by the Registrant in the reports that it files or submits on Form N-CSR is accumulated and communicated to the Registrant's management, including its principal executive and principal financial officers, as appropriate to allow timely decisions regarding required disclosure.
(b) There were no changes to the Registrant's internal control over financial reporting that occurred during the second fiscal quarter of the period covered by this report that have materially affected, or are reasonably likely to materially affect, the Registrant's internal control over financial reporting.
Item 12. Exhibits.
(a)(1) Code of ethics referred to in Item 2.
(a)(2) Certifications of principal executive and principal financial officers as required by Rule 30a-2(a) under the Investment Company Act of 1940.
(a)(3) Not applicable.
(b) Certification of principal executive and principal financial officers as required by Rule 30a-2(b) under the Investment Company Act of 1940.
SIGNATURES
Pursuant to the requirements of the Securities Exchange Act of 1934 and the Investment Company Act of 1940, the Registrant has duly caused this Report to be signed on its behalf by the undersigned, thereunto duly authorized.
STRATEGIC FUNDS, INC
By: /s/ Bradley J. Skapyak |
Bradley J. Skapyak President |
Date: | January 23, 2014 |
|
Pursuant to the requirements of the Securities Exchange Act of 1934 and the Investment Company Act of 1940, this Report has been signed below by the following persons on behalf of the Registrant and in the capacities and on the dates indicated. |
|
By: /s/ Bradley J. Skapyak |
Bradley J. Skapyak President |
Date: | January 23, 2014 |
|
By: /s/James Windels |
James Windels Treasurer |
Date: | January 23, 2014 |
|
EXHIBIT INDEX
(a)(1) Code of ethics referred to in Item 2.
(a)(2) Certifications of principal executive and principal financial officers as required by Rule 30a-2(a) under the Investment Company Act of 1940. (EX-99.CERT)
(b) Certification of principal executive and principal financial officers as required by Rule 30a-2(b) under the Investment Company Act of 1940. (EX-99.906CERT)