UNITED STATES
SECURITIES AND EXCHANGE COMMISSION
Washington, D.C. 20549
FORM N-CSR
CERTIFIED SHAREHOLDER REPORT OF REGISTERED MANAGEMENT
INVESTMENT COMPANIES
Investment Company Act file number 811- 3940
Strategic Funds, Inc.
(Exact name of Registrant as specified in charter)
c/o The Dreyfus Corporation
200 Park Avenue
New York, New York 10166
(Address of principal executive offices) (Zip code)
John Pak, Esq.
200 Park Avenue
New York, New York 10166
(Name and address of agent for service)
Registrant's telephone number, including area code: (212) 922-6000
Date of fiscal year end: 5/31
Date of reporting period: 5/31/14
The following N-CSR relates only to the Registrant’s series listed below and does not affect the other series of the Registrant, which have different fiscal year ends and, therefore, different N-CSR reporting requirements. Separate N-CSR Forms will be filed for these series, as appropriate.
Dreyfus Select Managers Small Cap Growth Fund
FORM N-CSR
Item 1. Reports to Stockholders.
Dreyfus
Select Managers
Small Cap Growth Fund
ANNUAL REPORT May 31, 2014

Save time. Save paper. View your next shareholder report online as soon as it’s available. Log into www.dreyfus.com and sign up for Dreyfus eCommunications. It’s simple and only takes a few minutes.
The views expressed in this report reflect those of the portfolio manager only through the end of the period covered and do not necessarily represent the views of Dreyfus or any other person in the Dreyfus organization. Any such views are subject to change at any time based upon market or other conditions and Dreyfus disclaims any responsibility to update such views.These views may not be relied on as investment advice and, because investment decisions for a Dreyfus fund are based on numerous factors, may not be relied on as an indication of trading intent on behalf of any Dreyfus fund.
Not FDIC-Insured • Not Bank-Guaranteed • May Lose Value
| |
| Contents |
| |
| | THE FUND |
| 2 | A Letter from the President |
| 3 | Discussion of Fund Performance |
| 6 | Fund Performance |
| 8 | Understanding Your Fund’s Expenses |
| 8 | Comparing Your Fund’s Expenses |
| With Those of Other Funds |
| 9 | Statement of Investments |
| 24 | Statement of Assets and Liabilities |
| 25 | Statement of Operations |
| 26 | Statement of Changes in Net Assets |
| 28 | Financial Highlights |
| 32 | Notes to Financial Statements |
| 43 | Report of Independent Registered |
| | Public Accounting Firm |
| 44 | Important Tax Information |
| 45 | Board Members Information |
| 48 | Officers of the Fund |
| |
| FOR MORE INFORMATION |
|
| | Back Cover |
Dreyfus
Select Managers
Small Cap Growth Fund
The Fund
A LETTER FROM THE PRESIDENT
Dear Shareholder:
We are pleased to present this annual report for Dreyfus Select Managers Small Cap Growth Fund, covering the 12-month period from June 1, 2013, through May 31, 2014. For information about how the fund performed during the reporting period, as well as general market perspectives, we provide a Discussion of Fund Performance on the pages that follow.
The past year witnessed a gradual strengthening of U.S. and global economic data, heightened market volatility stemming from a shift to a more moderately accommodative monetary policy from the Federal Reserve Board, generally strong corporate earnings growth, and impressive gains from U.S. stocks.Although U.S. GDP growth generally stalled over the opening months of 2014 due to harsh winter weather, the expiration of extended unemployment benefits, and the deceleration of inventory accumulation by businesses, investors largely appeared to shrug off these disappointments as some broad measures of large-cap U.S. stock market performance either achieved or approached new all-time highs by the reporting period’s end.
We already have seen evidence that the economic recovery’s pause over the winter of 2014 may prove temporary, and we currently expect to see accelerating growth as past financial stresses continue to fade and fiscal drags abate in the public sector. However, stocks generally have risen to higher valuations after the sustained market rally, and in our judgment, selectivity is likely to be key to successful equity investing in the months ahead. As always, we encourage you to discuss our observations and appropriate investment strategies with your financial advisor.
Thank you for your continued confidence and support.

J. Charles Cardona
President
The Dreyfus Corporation
June 16, 2014
2
DISCUSSION OF FUND PERFORMANCE
For the period of June 1, 2013, through May 31, 2014, as provided by Keith L. Stransky and Robert B. Mayerick, Portfolio Allocation Managers, EACM Advisors LLC
Fund and Market Performance Overview
For the 12-month period ended May 31, 2014, Dreyfus Select Managers Small Cap Growth Fund’s Class A shares produced a total return of 11.87%, Class C shares returned 10.99%, and Class I shares returned 12.18%.1 In comparison, the total return of the Russell 2000® Growth Index (the “Index”), the fund’s benchmark, was 16.71% for the same period.2 The fund’s Class Y shares produced a total return of 8.68% for the period since their inception on July 1, 2013, through May 31, 2014.
Equities generally rallied in a recovering U.S. economy over the reporting period. The fund lagged its benchmark, primarily due to shortfalls in the information technology and industrials sectors.
The Fund’s Investment Approach
The fund seeks long-term capital appreciation.To pursue its goal, the fund normally invests at least 80% of its assets in the stocks of small-cap companies.
The fund uses a “multi-manager” approach by selecting one or more sub-advisers to manage its assets. We seek sub-advisers that complement one another’s style of investing. We monitor and evaluate the performance of the sub-advisers and will make corresponding recommendations to Dreyfus and the fund’s Board.
The fund’s assets are currently under the day-to-day portfolio management of seven sub-advisers, each of whom acts independently and uses their own methodology to select investments. At the end of the reporting period, 22% of the fund’s assets are under the management of Riverbridge Partners, LLC, which employs a bottom-up approach to stock selection and focuses on companies that are building their earnings power and intrinsic value over long periods of time.Approximately 21% of the fund’s assets are under the management of Geneva Capital Management Ltd., which employs bottom-up fundamental analysis supplemented by top-down considerations to identify companies that perform well over long periods of time.Approximately 9% of the fund’s assets are under the management of Cupps Capital Management, LLC,
The Fund 3
DISCUSSION OF FUND PERFORMANCE (continued)
which employs a proprietary investment framework to evaluate the attractiveness of stocks. Nicholas Investment Partners, L.P., which employs quantitative/qualitative analysis to identify companies experiencing positive change in seeking above-expected growth, manages 17% of the fund’s assets. EAM Investors, LLC, which manages 23% of the fund’s assets, chooses investments through bottom-up fundamental analysis using a blend of a quantitative discovery process and a qualitative analysis process. During the reporting period, the fund added two investment managers, with 4% of assets being managed by Granite Investment Partners, LLC, which seeks attractively valued small-cap companies with catalysts for growth, and another 4% of assets managed by Rice Hall James & Associates, which seeks growing companies whose value, in the view of the manager, has not yet been fully appreciated in the marketplace.These percentages will increase over time, within ranges described in the prospectus.
Market Environment – Late Period Rotation
Stocks climbed sharply over the reporting period during a sustained U.S. economic recovery fueled by falling unemployment, rebounding housing markets, and historically low short-term interest rates. However, the reporting period began in the midst of pronounced market weakness stemming from the Federal Reserve Board’s (the “Fed”) plans to back gradually away from its massive quantitative easing program. Equity markets generally stabilized over the summer of 2013, and improving economic data drove stocks higher in the fall.
The rally stalled in January 2014 when concerns resurfaced regarding economic and political instability in the emerging markets, but stocks generally rebounded as investors’ worst fears did not materialize. However, market sentiment during the renewed rally shifted away from smaller, more speculative companies and toward large-cap stocks. Consequently, small-cap stocks trailed large-cap stocks, on average, for the reporting period overall.
Stock Selections Undermined Relative Results
Although the fund participated substantially in the small-cap market’s gains, disappointments in the information technology sector hindered relative performance. For example, network automation controller Infoblox fell sharply after cutting its profit outlook amid concerns about government spending, and digital marketing company Rocket Fuel reported weaker-than-expected quarterly results due to sluggish demand.
4
In the industrials sector, printing management provider InnerWorkings encountered weakness in Europe, and engineered equipment manufacturer Chart Industries saw lower sales in China.
The fund achieved better relative results in the consumer discretionary sector, where electric carmaker Tesla Motors advanced after posting rapid growth and announcing plans for a new battery plant in Texas. In the financial sector, real estate developer Howard Hughes reported strong sales at a large residential development while real estate and capital markets services provider HFF benefited from rising financial markets.
Finding Growth Opportunities Among Smaller Companies
We remain constructive regarding small-cap growth stocks, which may be poised for additional gains due to their focus on domestic revenue sources at a time when the U.S. economy has recovered more robustly than most overseas markets. Moreover, we expect heightened mergers-and-acquisitions activity as larger companies seek to fuel future growth. Indeed, in our view, recently lagging performance among small-cap stocks has created a firmer foundation for future gains.
June 16, 2014
Please note, the position in any security highlighted with italicized typeface was sold during the reporting period.
Equity funds are subject generally to market, market sector, market liquidity, issuer, and investment style risks, among
other factors, to varying degrees, all of which are more fully described in the fund’s prospectus.
The prices of small company stocks tend to be more volatile than the prices of large company stocks, mainly because
these companies have less established and more volatile earnings histories.They also tend to be less liquid than larger
company stocks.
1 Total return includes reinvestment of dividends and any capital gains paid, and does not take into consideration the
maximum initial sales charge in the case of Class A shares, or the applicable contingent deferred sales charge imposed
on redemptions in the case of Class C shares. Had these charges been reflected, returns would have been lower. Past
performance is no guarantee of future results. Share price and investment return fluctuate such that upon redemption,
fund shares may be worth more or less than their original cost. Return figures provided reflect the absorption of certain
fund expenses by The Dreyfus Corporation pursuant to an undertaking in effect through October 1, 2014, at which
time it may be extended, terminated, or modified. Had these expenses not been absorbed, the fund’s Class A, C, and
Y returns would have been lower.
2 SOURCE: LIPPER INC. — The Russell 2000 Growth Index is an unmanaged index, which measures the
performance of those Russell 2000 companies with higher price-to-book ratios and higher forecasted growth values.
The total return figure cited for this index assumes change in security prices and reinvestment of dividends, but does
not reflect the costs of managing a mutual fund. Investors cannot invest directly in any index.
The Fund 5
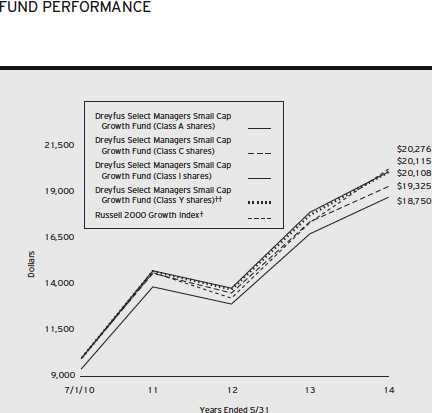
Comparison of change in value of $10,000 investment in Dreyfus Select Managers Small Cap Growth Fund Class A shares, Class C shares, Class I shares and Class Y shares and the Russell 2000 Growth Index
| |
| † | Source: Lipper Inc. |
| †† | The total return figures presented for ClassY shares of the fund reflect the performance of the fund’s Class A shares |
| | for the period prior to 7/1/13 (the inception date for ClassY shares), adjusted to reflect the applicable sales load for |
| | Class A shares. |
Past performance is not predictive of future performance.
The above graph compares a $10,000 investment made in each of the Class A, Class C, Class I and ClassY shares of
Dreyfus Select Managers Small Cap Growth Fund on 7/1/10 (inception date) to a $10,000 investment made in the
Russell 2000 Growth Index (the “Index”) on that date. All dividends and capital gain distributions are reinvested.
On April 29, 2013, the Board authorized the fund to offer ClassY shares, as a new class of shares, to certain investors,
including certain institutional investors. On July 1, 2013, ClassY shares were offered at net asset value and are not
subject to certain fees, including Distribution Plan and Shareholder Services Plan fees.
The fund’s performance shown in the line graph above takes into account the maximum initial sales charge on Class A
shares and all other applicable fees and expenses on all classes.The Index is an unmanaged index, which measures the
performance of those Russell 2000 companies with higher price-to-book ratios and higher forecasted growth values. Unlike
a mutual fund, the Index is not subject to charges, fees and other expenses. Investors cannot invest directly in any index.
Further information relating to fund performance, including expense reimbursements, if applicable, is contained in the
Financial Highlights section of the prospectus and elsewhere in this report.
6
| | | | | |
| Average Annual Total Returns as of 5/31/14 | | | | |
| | Inception | | | From | |
| | Date | 1 Year | | Inception | |
| Class A shares | | | | | |
| with maximum sales charge (5.75%) | 7/1/10 | 5.44 | % | 17.39 | % |
| without sales charge | 7/1/10 | 11.87 | % | 19.17 | % |
| Class C shares | | | | | |
| with applicable redemption charge † | 7/1/10 | 9.99 | % | 18.30 | % |
| without redemption | 7/1/10 | 10.99 | % | 18.30 | % |
| Class I shares | 7/1/10 | 12.18 | % | 19.52 | % |
| Class Y shares | 7/1/13 | 13.09 | %†† | 19.51 | %†† |
| Russell 2000 Growth Index | 6/30/10 | 16.71 | % | 19.78 | %††† |
Past performance is not predictive of future performance.The fund’s performance shown in the graph and table does not
reflect the deduction of taxes that a shareholder would pay on fund distributions or the redemption of fund shares. In
addition to the performance of Class A shares shown with and without a maximum sales charge, the fund’s performance
shown in the table takes into account all other applicable fees and expenses on all classes.
| |
| † | The maximum contingent deferred sales charge for Class C shares is 1% for shares redeemed within one year of the |
| | date of purchase. |
| †† | The total return performance figures presented for ClassY shares of the fund reflect the performance of the fund’s |
| | Class A shares for the period prior to 7/1/13 (the inception date for ClassY shares), adjusted to reflect the |
| | applicable sales load for Class A shares. |
| ††† | For comparative purposes, the value of the Index as of 6/30/10 is used as the beginning value on 7/1/10. |
The Fund 7
UNDERSTANDING YOUR FUND’S EXPENSES (Unaudited)
As a mutual fund investor, you pay ongoing expenses, such as management fees and other expenses. Using the information below, you can estimate how these expenses affect your investment and compare them with the expenses of other funds.You also may pay one-time transaction expenses, including sales charges (loads) and redemption fees, which are not shown in this section and would have resulted in higher total expenses. For more information, see your fund’s prospectus or talk to your financial adviser.
Review your fund’s expenses
The table below shows the expenses you would have paid on a $1,000 investment in Dreyfus Select Managers Small Cap Growth Fund from December 1, 2013 to May 31, 2014. It also shows how much a $1,000 investment would be worth at the close of the period, assuming actual returns and expenses.
Expenses and Value of a $1,000 Investment
assuming actual returns for the six months ended May 31, 2014
| | | | | | | | |
| | | Class A | | Class C | | Class I | | Class Y |
| Expenses paid per $1,000† | $ | 6.24 | $ | 9.82 | $ | 4.71 | $ | 5.00 |
| Ending value (after expenses) | $ | 926.00 | $ | 922.10 | $ | 927.10 | $ | 927.20 |
COMPARING YOUR FUND’S EXPENSES WITH THOSE OF OTHER FUNDS (Unaudited)
Using the SEC’s method to compare expenses
The Securities and Exchange Commission (SEC) has established guidelines to help investors assess fund expenses. Per these guidelines, the table below shows your fund’s expenses based on a $1,000 investment, assuming a hypothetical 5% annualized return. You can use this information to compare the ongoing expenses (but not transaction expenses or total cost) of investing in the fund with those of other funds.All mutual fund shareholder reports will provide this information to help you make this comparison. Please note that you cannot use this information to estimate your actual ending account balance and expenses paid during the period.
Expenses and Value of a $1,000 Investment
assuming a hypothetical 5% annualized return for the six months ended May 31, 2014
| | | | | | | | |
| | | Class A | | Class C | | Class I | | Class Y |
| Expenses paid per $1,000† | $ | 6.54 | $ | 10.30 | $ | 4.94 | $ | 5.24 |
| Ending value (after expenses) | $ | 1,018.45 | $ | 1,014.71 | $ | 1,020.04 | $ | 1,019.75 |
|
| † Expenses are equal to the fund’s annualized expense ratio of 1.30% for Class A, 2.05% for Class C, .98% for |
| Class I and 1.04% for ClassY, multiplied by the average account value over the period, multiplied by 182/365 (to |
| reflect the one-half year period). |
8
STATEMENT OF INVESTMENTS
May 31, 2014
| | | |
| Common Stocks—98.3% | Shares | | Value ($) |
| Automobiles & Components—1.2% | | | |
| Dorman Products | 28,585 | a | 1,518,721 |
| Gentex | 76,473 | | 2,211,599 |
| Gentherm | 10,290 | a | 423,228 |
| Motorcar Parts of America | 29,996 | a | 714,505 |
| Tesla Motors | 2,296 | a,b | 477,040 |
| | | | 5,345,093 |
| Banks—2.3% | | | |
| Bank of the Ozarks | 52,830 | | 3,119,083 |
| BofI Holding | 23,324 | a | 1,791,984 |
| Boston Private Financial Holdings | 22,620 | | 285,917 |
| Clifton Bancorp | 48,800 | | 586,576 |
| PacWest Bancorp | 18,335 | | 741,101 |
| Radian Group | 55,676 | | 802,848 |
| Texas Capital Bancshares | 55,587 | a | 2,846,055 |
| Umpqua Holdings | 37,752 | | 625,551 |
| | | | 10,799,115 |
| Capital Goods—11.4% | | | |
| Acuity Brands | 26,274 | | 3,297,650 |
| Aerovironment | 8,895 | a | 285,707 |
| Apogee Enterprises | 8,039 | | 241,974 |
| Astec Industries | 8,505 | | 339,435 |
| Astronics | 28,945 | a | 1,587,923 |
| Barnes Group | 74,558 | | 2,786,978 |
| Beacon Roofing Supply | 99,776 | a | 3,442,272 |
| Builders FirstSource | 111,755 | a | 802,401 |
| Chart Industries | 20,677 | a | 1,486,470 |
| Continental Building Products | 45,387 | | 703,045 |
| Curtiss-Wright | 12,028 | | 801,426 |
| Donaldson | 41,245 | | 1,679,909 |
| DXP Enterprises | 5,382 | a | 374,426 |
| Dycom Industries | 17,894 | a | 532,346 |
| Encore Wire | 6,310 | | 306,666 |
| Esterline Technologies | 6,044 | a | 673,604 |
The Fund 9
STATEMENT OF INVESTMENTS (continued)
| | | |
| Common Stocks (continued) | Shares | | Value ($) |
| Capital Goods (continued) | | | |
| Exelis | 37,036 | | 632,575 |
| GenCorp | 19,791 | a,b | 368,310 |
| Generac Holdings | 19,717 | | 959,824 |
| Graham | 4,287 | | 127,753 |
| Greenbrier Cos. | 32,549 | a | 1,806,469 |
| H&E Equipment Services | 77,326 | a | 2,679,346 |
| Hexcel | 13,817 | a | 567,188 |
| Hyster-Yale Materials Handling | 7,678 | | 645,566 |
| ITT | 17,226 | | 752,432 |
| Manitex International | 45,765 | a | 761,987 |
| MasTec | 36,083 | a | 1,298,988 |
| Meritor | 92,634 | a | 1,279,276 |
| Middleby | 11,427 | a | 2,728,996 |
| Mueller Water Products, Cl. A | 45,953 | | 387,384 |
| NCI Building Systems | 41,854 | a | 701,054 |
| Orbital Sciences | 30,029 | a | 786,159 |
| Plug Power | 70,432 | a,b | 306,379 |
| Polypore International | 16,035 | a,b | 712,756 |
| Power Solutions International | 14,518 | a | 1,132,259 |
| PowerSecure International | 16,626 | a | 134,504 |
| Primoris Services | 64,316 | | 1,863,234 |
| Proto Labs | 62,033 | a | 4,092,938 |
| RBC Bearings | 34,122 | | 2,046,296 |
| Rush Enterprises, Cl. A | 9,877 | a | 327,719 |
| Sparton | 6,959 | a | 204,873 |
| Standex International | 9,671 | | 714,107 |
| Taser International | 73,329 | a | 973,076 |
| Trex | 14,245 | a | 440,313 |
| Tutor Perini | 48,942 | a | 1,499,094 |
| Watsco | 6,949 | | 699,278 |
| Woodward | 29,164 | | 1,303,631 |
| | | | 52,275,996 |
10
| | | |
| Common Stocks (continued) | Shares | | Value ($) |
| Commercial & Professional Services—5.5% | | | |
| Acacia Research | 14,364 | b | 231,835 |
| Advisory Board | 68,417 | a | 3,310,699 |
| ARC Document Solutions | 31,353 | a | 194,389 |
| Barrett Business Services | 3,753 | | 176,991 |
| Ceco Environmental | 39,692 | | 568,389 |
| Corporate Executive Board | 9,088 | | 619,529 |
| EnerNOC | 11,225 | a | 215,408 |
| Franklin Covey | 4,463 | a | 97,070 |
| Healthcare Services Group | 137,874 | | 4,103,131 |
| Huron Consulting Group | 5,931 | a | 402,596 |
| InnerWorkings | 94,930 | a | 714,823 |
| Korn/Ferry International | 37,754 | a | 1,146,589 |
| Mobile Mini | 75,545 | | 3,289,984 |
| On Assignment | 19,850 | a | 699,712 |
| Paylocity Holding | 11,741 | | 228,597 |
| Resources Connection | 19,018 | | 235,823 |
| Ritchie Brothers Auctioneers | 128,945 | b | 2,959,288 |
| Rollins | 106,390 | | 3,262,981 |
| Steelcase, Cl. A | 15,520 | | 254,373 |
| Team | 35,103 | a | 1,471,518 |
| Tetra Tech | 5,951 | | 158,356 |
| WageWorks | 26,957 | a | 1,091,220 |
| | | | 25,433,301 |
| Consumer Durables & Apparel—2.5% | | | |
| Brown Shoe Company | 24,259 | | 682,891 |
| Callaway Golf | 78,721 | b | 631,343 |
| Cavco Industries | 4,152 | a | 318,749 |
| Deckers Outdoor | 7,150 | a | 552,623 |
| G-III Apparel Group | 19,731 | a | 1,446,677 |
| Hanesbrands | 8,124 | | 689,159 |
| Iconix Brand Group | 4,466 | a | 187,304 |
| iRobot | 24,640 | a,b | 870,531 |
The Fund 11
STATEMENT OF INVESTMENTS (continued)
| | | | |
| Common Stocks (continued) | Shares | | | Value ($) |
| Consumer Durables & Apparel (continued) | | | | |
| Kate Spade & Company | 35,199 | a | | 1,281,596 |
| La-Z-Boy | 22,085 | | | 539,316 |
| Movado Group | 21,745 | | | 832,616 |
| Nautilus | 65,223 | a | | 706,365 |
| Oxford Industries | 13,925 | | | 890,225 |
| Skechers USA, Cl. A | 31,567 | a | | 1,404,731 |
| Universal Electronics | 7,574 | a | | 344,465 |
| | | | | 11,378,591 |
| Consumer Services—5.0% | | | | |
| Bob Evans Farms | 6,843 | b | | 305,677 |
| Bravo Brio Restaurant Group | 21,195 | a | | 334,881 |
| Bright Horizons Family Solutions | 9,632 | a | | 375,455 |
| Capella Education | 6,451 | | | 369,255 |
| Century Casinos | 24,254 | a | | 148,920 |
| Cheesecake Factory | 59,055 | | | 2,708,853 |
| Chuy’s Holdings | 71,588 | a | | 2,338,780 |
| Del Frisco’s Restaurant Group | 54,950 | a | | 1,484,199 |
| Denny’s | 26,085 | a | | 169,552 |
| Domino’s Pizza | 17,160 | | | 1,243,242 |
| Fiesta Restaurant Group | 28,319 | a | | 1,140,406 |
| Grand Canyon Education | 104,734 | a | | 4,613,533 |
| Jack in the Box | 12,863 | | | 742,581 |
| K12 | 59,850 | a | | 1,374,156 |
| Life Time Fitness | 20,858 | a,b | | 1,109,646 |
| Panera Bread, Cl. A | 6,415 | a | | 985,408 |
| Popeyes Louisiana Kitchen | 17,364 | a | | 745,263 |
| Red Robin Gourmet Burgers | 16,980 | a | | 1,223,918 |
| Scientific Games, Cl. A | 89,315 | a | | 799,369 |
| Sonic | 31,797 | a | | 661,378 |
| Vail Resorts | 2,318 | | | 161,541 |
| | | | | 23,036,013 |
| Diversified Financials—3.4% | | | | |
| Affiliated Managers Group | 5,233 | a | | 986,944 |
| Financial Engines | 67,816 | | | 2,760,111 |
12
| | | | |
| Common Stocks (continued) | Shares | | | Value ($) |
| Diversified Financials (continued) | | | | |
| Gamco Investors, Cl. A | 2,006 | | | 152,657 |
| GFI Group | 34,167 | | | 115,484 |
| Hercules Technology Growth Capital | 15,407 | b | | 234,803 |
| HFF, Cl. A | 28,985 | | | 936,795 |
| ICG Group | 64,966 | a | | 1,255,143 |
| Janus Capital Group | 45,625 | b | | 532,900 |
| Marcus & Millichap | 13,282 | | | 270,289 |
| MarketAxess Holdings | 44,510 | | | 2,374,608 |
| Portfolio Recovery Associates | 93,482 | a | | 5,215,360 |
| SLM | 83,421 | | | 718,255 |
| | | | | 15,553,349 |
| Energy—5.5% | | | | |
| Athlon Energy | 31,311 | | | 1,360,776 |
| Basic Energy Services | 34,928 | a | | 950,042 |
| Bonanza Creek Energy | 32,928 | a | | 1,765,599 |
| C&J Energy Services | 23,899 | a | | 731,548 |
| Callon Petroleum | 68,751 | a | | 725,323 |
| Clayton Williams Energy | 7,076 | a | | 881,599 |
| Diamondback Energy | 27,585 | a | | 2,082,116 |
| Dril-Quip | 17,165 | a | | 1,754,606 |
| Geospace Technologies | 4,868 | a,b | | 246,905 |
| Goodrich Petroleum | 27,757 | a,b | | 804,953 |
| Gulfport Energy | 32,153 | a | | 1,978,374 |
| Hornbeck Offshore Services | 17,577 | a | | 795,183 |
| Matador Resources | 39,482 | a | | 982,312 |
| Oasis Petroleum | 16,783 | a | | 830,758 |
| Pacific Ethanol | 67,212 | a,b | | 875,772 |
| Patterson-UTI Energy | 26,664 | | | 882,312 |
| PDC Energy | 11,346 | a | | 728,300 |
| Resolute Energy | 84,921 | a | | 706,543 |
| RigNet | 15,720 | a | | 745,442 |
| Sanchez Energy | 31,813 | a,b | | 1,095,322 |
| SM Energy | 24,447 | | | 1,853,327 |
| Stone Energy | 21,945 | a | | 974,139 |
The Fund 13
STATEMENT OF INVESTMENTS (continued)
| | | | |
| Common Stocks (continued) | Shares | | | Value ($) |
| Energy (continued) | | | | |
| Synergy Resources | 34,212 | a | | 401,649 |
| Targa Resources | 8,758 | | | 1,006,820 |
| | | | | 25,159,720 |
| Exchange-Traded Funds—.1% | | | | |
| iShares Russell 2000 ETF | 4,453 | b | | 502,565 |
| Food & Staples Retailing—1.0% | | | | |
| Chefs’ Warehouse | 3,815 | a,b | | 70,501 |
| Fresh Market | 39,674 | a,b | | 1,216,008 |
| Rite Aid | 54,658 | a | | 456,941 |
| United Natural Foods | 43,455 | a | | 2,929,302 |
| | | | | 4,672,752 |
| Food, Beverage & Tobacco—1.3% | | | | |
| Boulder Brands | 24,454 | a | | 331,841 |
| Cal-Maine Foods | 10,473 | | | 730,596 |
| Diamond Foods | 9,027 | a,b | | 288,413 |
| Hain Celestial Group | 3,971 | a | | 360,249 |
| Inventure Foods | 31,260 | a | | 384,498 |
| J&J Snack Foods | 23,307 | | | 2,183,167 |
| SunOpta | 27,821 | a | | 374,192 |
| TreeHouse Foods | 20,332 | a | | 1,523,883 |
| | | | | 6,176,839 |
| Health Care Equipment & Services—11.2% | | | | |
| Abaxis | 37,940 | | | 1,567,681 |
| ABIOMED | 83,338 | a | | 1,900,106 |
| Acadia Healthcare | 37,802 | a | | 1,611,878 |
| athenahealth | 12,279 | a | | 1,558,328 |
| Bio-Reference Labs | 70,436 | a,b | | 1,884,867 |
| Cantel Medical | 73,531 | | | 2,555,202 |
| Cardiovascular Systems | 25,064 | a | | 703,045 |
| Castlight Health, Cl. B | 19,384 | b | | 294,249 |
| Chemed | 35,215 | | | 3,101,737 |
| CONMED | 15,299 | | | 686,925 |
| Cyberonics | 10,592 | a | | 643,994 |
| DexCom | 63,819 | a | | 2,154,529 |
| Globus Medical, Cl. A | 58,238 | a | | 1,408,195 |
14
| | | | |
| Common Stocks (continued) | Shares | | | Value ($) |
| Health Care Equipment & Services (continued) | | | | |
| Health Net | 17,893 | a | | 715,362 |
| iCAD | 37,076 | a | | 245,443 |
| Insulet | 46,161 | a | | 1,690,878 |
| IPC The Hospitalist | 66,521 | a | | 2,903,642 |
| Kindred Healthcare | 30,090 | | | 746,834 |
| Masimo | 41,935 | a | | 1,033,278 |
| Medidata Solutions | 91,297 | a | | 3,530,455 |
| MEDNAX | 64,377 | a | | 3,710,046 |
| Molina Healthcare | 7,700 | a | | 331,793 |
| MWI Veterinary Supply | 17,965 | a | | 2,506,297 |
| Neogen | 107,870 | a | | 4,076,407 |
| Novadaq Technologies | 88,335 | a | | 1,287,041 |
| NuVasive | 8,281 | a | | 276,089 |
| Oxford Immunotec Global | 18,839 | b | | 327,422 |
| Providence Service | 25,568 | a | | 1,027,834 |
| Quality Systems | 11,990 | | | 186,684 |
| Quidel | 13,666 | a,b | | 310,218 |
| RadNet | 102,460 | a | | 651,646 |
| Select Medical Holdings | 55,073 | | | 834,356 |
| Spectranetics | 33,314 | a | | 714,252 |
| STAAR Surgical | 90,290 | a | | 1,393,175 |
| STERIS | 12,622 | | | 675,529 |
| Tandem Diabetes Care | 14,829 | b | | 240,823 |
| Team Health Holdings | 18,627 | a | | 945,693 |
| Teleflex | 2,583 | | | 275,451 |
| Trinity Biotech, ADR | 31,124 | | | 746,665 |
| | | | | 51,454,049 |
| Household & Personal Products—.1% | | | | |
| Medifast | 12,572 | a | | 395,138 |
| Insurance—.1% | | | | |
| eHealth | 8,817 | a | | 324,642 |
| Stewart Information Services | 7,974 | | | 255,806 |
| | | | | 580,448 |
| Materials—3.6% | | | | |
| Balchem | 55,191 | | | 3,043,231 |
The Fund 15
STATEMENT OF INVESTMENTS (continued)
| | | | |
| Common Stocks (continued) | Shares | | | Value ($) |
| Materials (continued) | | | | |
| Berry Plastics Group | 29,554 | a | | 697,770 |
| Clearwater Paper | 11,721 | a | | 727,522 |
| Eagle Materials | 10,911 | | | 948,930 |
| Flotek Industries | 33,825 | a | | 959,953 |
| Glatfelter | 26,308 | | | 692,427 |
| Globe Specialty Metals | 16,168 | | | 323,198 |
| Haynes International | 4,792 | | | 254,455 |
| Headwaters | 41,216 | a | | 532,923 |
| Kaiser Aluminum | 3,901 | | | 267,101 |
| KapStone Paper and Packaging | 25,420 | a | | 738,451 |
| Marrone Bio Innovations | 26,308 | b | | 285,968 |
| PolyOne | 52,241 | | | 2,096,431 |
| Senomyx | 41,334 | a,b | | 283,551 |
| Sensient Technologies | 37,338 | | | 2,046,122 |
| Stillwater Mining | 40,060 | a | | 673,409 |
| US Silica Holdings | 37,932 | | | 1,918,221 |
| | | | | 16,489,663 |
| Media—1.6% | | | | |
| Carmike Cinemas | 26,607 | a | | 915,281 |
| Cumulus Media, Cl. A | 244,199 | a | | 1,543,338 |
| Lamar Advertising, Cl. A | 13,645 | | | 673,244 |
| Live Nation Entertainment | 60,433 | a | | 1,433,471 |
| MDC Partners, Cl. A | 68,876 | | | 1,447,774 |
| New York Times, Cl. A | 53,883 | | | 800,701 |
| Rentrak | 5,782 | a | | 298,756 |
| Scholastic | 8,611 | | | 274,519 |
| | | | | 7,387,084 |
| Pharmaceuticals, Biotech & | | | | |
| Life Sciences—9.0% | | | | |
| ACADIA Pharmaceuticals | 21,172 | a,b | | 437,202 |
| Accelerate Diagnostics | 15,386 | a,b | | 366,648 |
| Aegerion Pharmaceuticals | 8,805 | a,b | | 289,244 |
| Agios Phamaceuticals | 22,629 | b | | 795,636 |
| Alkermes | 13,862 | a | | 635,018 |
| Alnylam Pharmaceuticals | 8,750 | a | | 518,787 |
| Anacor Pharmaceuticals | 5,787 | a,b | | 78,124 |
16
| | | | |
| Common Stocks (continued) | Shares | | | Value ($) |
| Pharmaceuticals, Biotech & | | | | |
| Life Sciences (continued) | | | | |
| Aratana Therapeutics | 28,547 | | | 401,371 |
| BioDelivery Sciences International | 88,933 | a,b | | 851,089 |
| Cambrex | 15,437 | a | | 331,741 |
| Cepheid | 139,193 | a | | 6,270,644 |
| Charles River Laboratories International | 13,064 | a | | 699,969 |
| Chimerix | 23,168 | a,b | | 427,450 |
| Clovis Oncology | 10,204 | a | | 522,547 |
| Dyax | 32,965 | a | | 271,961 |
| Enanta Pharmaceuticals | 20,476 | a,b | | 777,678 |
| Exact Sciences | 18,548 | a,b | | 250,027 |
| Fluidigm | 8,301 | a | | 230,270 |
| Foundation Medicine | 2,259 | b | | 53,606 |
| Horizon Pharma | 90,450 | a,b | | 1,283,485 |
| ICON | 8,590 | a | | 363,099 |
| Insmed | 89,175 | a | | 1,171,760 |
| InterMune | 53,696 | a | | 2,127,435 |
| Keryx Biopharmaceuticals | 63,924 | a,b | | 843,797 |
| KYTHERA Biopharmaceuticals | 3,055 | a,b | | 102,251 |
| Lannett Company | 42,157 | a | | 1,761,319 |
| Merrimack Pharmaceuticals | 11,670 | a,b | | 90,676 |
| Myriad Genetics | 5,015 | a,b | | 166,297 |
| Nektar Therapeutics | 83,357 | a,b | | 977,778 |
| Novavax | 157,996 | a | | 744,161 |
| NPS Pharmaceuticals | 60,497 | a | | 1,883,272 |
| Ophthotech | 17,595 | b | | 716,116 |
| Orexigen Therapeutics | 59,625 | a,b | | 385,177 |
| Pacira Pharmaceuticals | 12,773 | a | | 991,313 |
| PAREXEL International | 50,838 | a | | 2,564,777 |
| PTC Therapeutics | 29,593 | | | 701,650 |
| Questcor Pharmaceuticals | 3,994 | b | | 359,979 |
| Receptos | 18,635 | | | 554,578 |
| Repligen | 68,737 | a,b | | 1,322,500 |
| Retrophin | 44,198 | a | | 646,175 |
| Revance Therapeutics | 29,018 | | | 913,777 |
| Salix Pharmaceuticals | 6,714 | a | | 765,933 |
The Fund 17
STATEMENT OF INVESTMENTS (continued)
| | | |
| Common Stocks (continued) | Shares | | Value ($) |
| Pharmaceuticals, Biotech & | | | |
| Life Sciences (continued) | | | |
| Sangamo BioSciences | 15,684 | a,b | 206,088 |
| Sunesis Pharmaceuticals | 62,447 | a,b | 319,729 |
| Techne | 48,748 | | 4,279,587 |
| TESARO | 23,795 | a | 633,899 |
| TherapeuticsMD | 106,202 | a,b | 431,180 |
| | | | 41,516,800 |
| Real Estate—1.2% | | | |
| Capstead Mortgage | 19,071 | b,c | 251,165 |
| Columbia Property Trust | 30,909 | | 812,598 |
| FelCor Lodging Trust | 71,018 | c | 698,817 |
| Howard Hughes | 14,659 | a | 2,170,705 |
| NorthStar Realty Finance | 55,453 | c | 917,747 |
| Strategic Hotels & Resorts | 40,955 | a,c | 446,409 |
| | | | 5,297,441 |
| Retailing—3.9% | | | |
| Bebe Stores | 36,200 | | 148,420 |
| Big Lots | 16,702 | a | 708,833 |
| Core-Mark Holding Company | 3,761 | | 310,959 |
| Finish Line, Cl. A | 26,509 | | 760,013 |
| Five Below | 66,873 | a,b | 2,420,803 |
| Hibbett Sports | 40,568 | a | 2,133,471 |
| HomeAway | 25,936 | a | 798,829 |
| LKQ | 37,711 | a | 1,046,103 |
| MarineMax | 18,197 | a | 292,426 |
| Monro Muffler Brake | 61,709 | | 3,332,903 |
| Pool | 6,435 | | 371,493 |
| Restoration Hardware Holdings | 18,045 | a | 1,199,632 |
| Shutterfly | 22,483 | a | 924,951 |
| Tile Shop Holdings | 100,110 | a | 1,493,641 |
| Tuesday Morning | 40,743 | a | 658,407 |
| Vitamin Shoppe | 28,326 | a | 1,217,451 |
| | | | 17,818,335 |
18
| | | |
| Common Stocks (continued) | Shares | | Value ($) |
| Semiconductors & Semiconductor | | | |
| Equipment—5.4% | | | |
| Advanced Energy Industries | 13,505 | a | 264,293 |
| Ambarella | 23,014 | a,b | 596,983 |
| Applied Optoelectronics | 37,705 | | 807,264 |
| Atmel | 102,745 | a | 861,003 |
| Cabot Microelectronics | 44,660 | a | 1,921,720 |
| Canadian Solar | 21,465 | a | 552,724 |
| Cavium | 32,534 | a | 1,593,516 |
| Ceva | 16,462 | a | 257,630 |
| FormFactor | 147,303 | a | 1,069,420 |
| GT Advanced Technologies | 103,423 | a,b | 1,743,712 |
| Integrated Device Technology | 98,560 | a | 1,310,848 |
| Lattice Semiconductor | 184,560 | a | 1,459,869 |
| Monolithic Power Systems | 22,918 | a | 900,448 |
| ON Semiconductor | 14,438 | a | 125,466 |
| Pixelworks | 122,478 | a | 761,813 |
| Power Integrations | 34,795 | | 1,749,841 |
| Semtech | 76,765 | a | 1,991,284 |
| Spansion, Cl. A | 113,760 | a | 2,167,128 |
| SunEdison | 86,193 | a | 1,697,140 |
| SunPower | 17,102 | a | 570,181 |
| Synaptics | 18,184 | a,b | 1,237,967 |
| Teradyne | 52,253 | b | 930,103 |
| Veeco Instruments | 7,975 | a | 265,727 |
| | | | 24,836,080 |
| Software & Services—13.7% | | | |
| ACI Worldwide | 7,117 | a | 386,524 |
| Acxiom | 33,863 | a | 769,706 |
| Advent Software | 4,727 | | 143,039 |
| Aspen Technology | 35,466 | a | 1,524,683 |
| Attunity | 16,551 | a | 142,835 |
| Benefitfocus | 10,739 | b | 397,773 |
| Bottomline Technologies | 54,213 | a | 1,562,419 |
The Fund 19
STATEMENT OF INVESTMENTS (continued)
| | | | |
| Common Stocks (continued) | Shares | | | Value ($) |
| Software & Services (continued) | | | | |
| Cadence Design Systems | 41,182 | a | 687,328 |
| Callidus Software | 110,327 | a | 1,159,536 |
| Cass Information Systems | 27,344 | | 1,378,684 |
| ChannelAdvisor | 40,800 | | 846,192 |
| Concur Technologies | 23,915 | a | 2,041,624 |
| Constant Contact | 18,602 | a | 549,503 |
| Cornerstone OnDemand | 4,045 | a | 162,569 |
| CoStar Group | 10,572 | a | 1,676,191 |
| Dealertrack Technologies | 79,131 | a | 3,142,291 |
| Demandware | 49,272 | a | 3,000,172 |
| Descartes Systems Group | 20,388 | a | 272,588 |
| Digital River | 14,125 | a | 222,327 |
| E2open | 20,334 | a,b | 357,472 |
| Ebix | 53,475 | b | 836,349 |
| Envestnet | 61,633 | a | 2,498,602 |
| FactSet Research Systems | 7,468 | b | 800,122 |
| Guidewire Software | 21,963 | a | 829,542 |
| iGATE | 25,261 | a | 880,851 |
| Interactive Intelligence Group | 35,110 | a | 1,779,726 |
| Intralinks Holdings | 68,043 | a | 592,655 |
| j2 Global | 4,461 | b | 211,273 |
| Liquidity Services | 12,705 | a,b | 195,403 |
| Manhattan Associates | 27,307 | a | 886,385 |
| MAXIMUS | 94,058 | | 4,202,511 |
| Mentor Graphics | 25,280 | | 535,683 |
| Monotype Imaging Holdings | 8,776 | | 225,982 |
| Move | 20,360 | a | 266,309 |
| NetSuite | 12,561 | a | 1,011,035 |
| NeuStar, Cl. A | 9,391 | a,b | 263,136 |
| NIC | 74,435 | | 1,233,388 |
| Pegasystems | 82,338 | | 1,748,859 |
| Points International | 8,234 | a,b | 202,145 |
| Proofpoint | 32,358 | a | 1,032,867 |
| Rocket Fuel | 7,758 | b | 193,950 |
| SciQuest | 62,338 | a | 1,055,382 |
20
| | | |
| Common Stocks (continued) | Shares | | Value ($) |
| Software & Services (continued) | | | |
| SeaChange International | 51,284 | a | 491,301 |
| Shutterstock | 9,551 | a,b | 621,197 |
| SPS Commerce | 40,145 | a | 2,283,849 |
| Stamps.com | 13,831 | a | 447,018 |
| Tableau Software, Cl. A | 15,933 | | 924,751 |
| Tyler Technologies | 43,324 | a | 3,384,904 |
| Ultimate Software Group | 49,024 | a | 6,232,422 |
| Varonis Systems | 6,520 | | 159,675 |
| VeriFone Systems | 40,095 | a | 1,315,517 |
| Verint Systems | 53,928 | a | 2,498,484 |
| VistaPrint | 6,330 | a,b | 253,327 |
| Web.com Group | 22,788 | a | 784,819 |
| Yelp | 28,705 | a | 1,898,836 |
| | | | 63,201,711 |
| Technology Hardware & Equipment—4.9% | | | |
| Agilysys | 10,742 | a | 155,866 |
| Anixter International | 8,337 | | 858,711 |
| ARRIS Group | 48,251 | a | 1,597,591 |
| Aruba Networks | 21,052 | a | 389,778 |
| Belden | 11,230 | | 808,448 |
| CDW | 28,273 | | 831,509 |
| Cognex | 47,436 | a | 1,707,696 |
| Cray | 22,373 | a | 627,339 |
| Digi International | 97,835 | a | 869,753 |
| EchoStar, Cl. A | 15,671 | a | 800,318 |
| Electronics For Imaging | 30,095 | a | 1,224,565 |
| FEI | 7,473 | | 623,622 |
| Finisar | 22,693 | a | 538,959 |
| FLIR Systems | 22,625 | | 789,839 |
| InvenSense | 44,230 | a,b | 853,639 |
| Ituran Location and Control | 3,119 | | 73,203 |
| Maxwell Technologies | 54,084 | a | 938,898 |
| National Instruments | 102,702 | | 2,941,385 |
| Sanmina | 37,845 | a | 770,146 |
| ShoreTel | 193,089 | a | 1,343,900 |
The Fund 21
STATEMENT OF INVESTMENTS (continued)
| | | | |
| Common Stocks (continued) | Shares | | | Value ($) |
| Technology Hardware & Equipment (continued) | | | | |
| Sierra Wireless | 8,515 | a,b | 159,912 |
| Sonus Networks | 70,366 | a | 258,243 |
| Stratasys | 20,487 | a,b | 1,905,701 |
| Super Micro Computer | 61,988 | a | 1,332,742 |
| ViaSat | 3,640 | a | 197,397 |
| | | | | 22,599,160 |
| Telecommunication Services—.3% | | | | |
| Cogent Communications Holdings | 18,001 | | 660,096 |
| inContact | 25,988 | a | 220,118 |
| RingCentral, Cl. A | 31,610 | b | 384,694 |
| | | | | 1,264,908 |
| Transportation—3.9% | | | | |
| Allegiant Travel | 22,830 | | 2,625,450 |
| Avis Budget Group | 13,985 | a | 800,362 |
| Echo Global Logistics | 140,577 | a | 2,609,109 |
| Forward Air | 24,150 | | 1,083,369 |
| Genesee & Wyoming, Cl. A | 23,363 | a | 2,274,388 |
| Heartland Express | 37,449 | | 809,835 |
| JetBlue Airways | 18,090 | a | 174,749 |
| Marten Transport | 74,885 | | 1,803,980 |
| Old Dominion Freight Line | 26,743 | a | 1,710,482 |
| Roadrunner Transportation Systems | 55,335 | a | 1,445,350 |
| Spirit Airlines | 19,669 | a | 1,161,847 |
| Swift Transportation | 12,440 | a | 308,014 |
| Werner Enterprises | 18,883 | | 498,511 |
| XPO Logistics | 24,221 | a,b | 608,674 |
| | | | | 17,914,120 |
| Utilities—.2% | | | | |
| American States Water | 8,898 | | 269,431 |
| Dynegy | 19,063 | a | 642,423 |
| | | | | 911,854 |
| Total Common Stocks | | | | |
| (cost $369,863,607) | | | | 452,000,125 |
22
| | | | |
| Investment of Cash Collateral | | | | |
| for Securities Loaned—5.9% | Shares | | Value ($) | |
| Registered Investment Company; | | | | |
| Dreyfus Institutional Cash Advantage Fund | | | | |
| (cost $27,274,600) | 27,274,600 | d | 27,274,600 | |
| Total Investments (cost $397,138,207) | 104.2 | % | 479,274,725 | |
| Liabilities, Less Cash and Receivables | (4.2 | %) | (19,265,250 | ) |
| Net Assets | 100.0 | % | 460,009,475 | |
ADR—American Depository Receipts
ETF—Exchange-Traded Fund
a Non-income producing security.
b Security, or portion thereof, on loan. At May 31, 2014, the value of the fund’s securities on loan was $26,058,863
and the value of the collateral held by the fund was $27,550,294, consisting of cash collateral of $27,274,600 and
U.S. Government & Agency securities valued at $275,694.
c Investment in real estate investment trust.
d Investment in affiliated money market mutual fund.
| | | |
| Portfolio Summary (Unaudited)† | | |
| |
| Value (%) | | Value (%) |
| Software & Services | 13.7 | Diversified Financials | 3.4 |
| Capital Goods | 11.4 | Consumer Durables & Apparel | 2.5 |
| Health Care Equipment & Services | 11.2 | Banks | 2.3 |
| Pharmaceuticals, Biotech & Life Sciences | 9.0 | Media | 1.6 |
| Money Market Investment | 5.9 | Food, Beverage & Tobacco | 1.3 |
| Commercial & Professional Services | 5.5 | Automobiles & Components | 1.2 |
| Energy | 5.5 | Real Estate | 1.2 |
| Semiconductors & | | Food & Staples Retailing | 1.0 |
| Semiconductor Equipment | 5.4 | Telecommunication Services | .3 |
| Consumer Services | 5.0 | Utilities | .2 |
| Technology Hardware & Equipment | 4.9 | Exchange-Traded Funds | .1 |
| Retailing | 3.9 | Household & Personal Products | .1 |
| Transportation | 3.9 | Insurance | .1 |
| Materials | 3.6 | | 104.2 |
| |
| † Based on net assets. | | | |
| See notes to financial statements. | | | |
The Fund 23
STATEMENT OF ASSETS AND LIABILITIES
May 31, 2014
| | | | |
| | | | Cost | Value |
| Assets ($): | | | | |
| Investments in securities—See Statement of Investments (including | | |
| securities on loan, valued at $26,058,863)—Note 1(b): | | | |
| Unaffiliated issuers | | | 369,863,607 452,000,125 |
| Affiliated issuers | | | 27,274,600 | 27,274,600 |
| Cash | | | | 9,753,041 |
| Receivable for investment securities sold | | | | 5,949,108 |
| Receivable for shares of Common Stock subscribed | | | 430,473 |
| Dividends and securities lending income receivable | | | 309,008 |
| Prepaid expenses | | | | 46,628 |
| | | | 495,762,983 |
| Liabilities ($): | | | | |
| Due to The Dreyfus Corporation and affiliates—Note 3(c) | | | 372,262 |
| Liability for securities on loan—Note 1(b) | | | | 27,274,600 |
| Payable for investment securities purchased | | | 8,013,973 |
| Payable for shares of Common Stock redeemed | | | 55,671 |
| Accrued expenses | | | | 37,002 |
| | | | | 35,753,508 |
| Net Assets ($) | | | 460,009,475 |
| Composition of Net Assets ($): | | | | |
| Paid-in capital | | | 361,374,122 |
| Accumulated net realized gain (loss) on investments | | | 16,498,835 |
| Accumulated net unrealized appreciation | | | | |
| (depreciation) on investments | | | | 82,136,518 |
| Net Assets ($) | | | 460,009,475 |
| |
| |
| Net Asset Value Per Share | | | | |
| | Class A | Class C | Class I | Class Y |
| Net Assets ($) | 4,742,078 | 429,586 | 453,864,970 | 972,841 |
| Shares Outstanding | 201,399 | 18,802 | 19,046,387 | 40,851 |
| Net Asset Value Per Share ($) | 23.55 | 22.85 | 23.83 | 23.81 |
| |
| See notes to financial statements. | | | | |
24
| | |
| STATEMENT OF OPERATIONS | | |
| Year Ended May 31, 2014 | | |
| |
| |
| |
| |
| Investment Income ($): | | |
| Income: | | |
| Cash dividends (net of $17,360 foreign taxes withheld at source) | 1,587,541 | |
| Income from securities lending—Note 1(b) | 739,527 | |
| Total Income | 2,327,068 | |
| Expenses: | | |
| Management fee—Note 3(a) | 4,005,253 | |
| Custodian fees—Note 3(c) | 120,255 | |
| Professional fees | 88,609 | |
| Registration fees | 68,614 | |
| Directors’ fees and expenses—Note 3(d) | 33,699 | |
| Prospectus and shareholders’ reports | 19,972 | |
| Shareholder servicing costs—Note 3(c) | 14,485 | |
| Loan commitment fees—Note 2 | 4,424 | |
| Distribution fees—Note 3(b) | 1,559 | |
| Miscellaneous | 21,441 | |
| Total Expenses | 4,378,311 | |
| Less—reduction in expenses due to undertaking—Note 3(a) | (2,701 | ) |
| Less—reduction in fees due to earnings credits—Note 3(c) | (11 | ) |
| Net Expenses | 4,375,599 | |
| Investment (Loss)—Net | (2,048,531 | ) |
| Realized and Unrealized Gain (Loss) on Investments—Note 4 ($): | | |
| Net realized gain (loss) on investments | 40,328,441 | |
| Net unrealized appreciation (depreciation) on investments | 4,034,369 | |
| Net Realized and Unrealized Gain (Loss) on Investments | 44,362,810 | |
| Net Increase in Net Assets Resulting from Operations | 42,314,279 | |
| |
| See notes to financial statements. | | |
The Fund 25
STATEMENT OF CHANGES IN NET ASSETS
| | | | |
| | | | Year Ended May 31, | |
| | 2014 | a | 2013 | |
| Operations ($): | | | | |
| Investment (loss)—net | (2,048,531 | ) | (659,669 | ) |
| Net realized gain (loss) on investments | 40,328,441 | | 8,775,193 | |
| Net unrealized appreciation | | | | |
| (depreciation) on investments | 4,034,369 | | 65,403,208 | |
| Net Increase (Decrease) in Net Assets | | | | |
| Resulting from Operations | 42,314,279 | | 73,518,732 | |
| Dividends to Shareholders from ($): | | | | |
| Net realized gain on investments: | | | | |
| Class A | (117,849 | ) | — | |
| Class C | (11,167 | ) | — | |
| Class I | (22,586,266 | ) | — | |
| Class Y | (57 | ) | — | |
| Total Dividends | (22,715,339 | ) | — | |
| Capital Stock Transactions ($): | | | | |
| Net proceeds from shares sold: | | | | |
| Class A | 5,361,188 | | 676,781 | |
| Class C | 457,590 | | 25,490 | |
| Class I | 119,283,672 | | 134,063,168 | |
| Class Y | 982,102 | | — | |
| Dividends reinvested: | | | | |
| Class A | 115,639 | | — | |
| Class C | 10,992 | | — | |
| Class I | 11,988,560 | | — | |
| Cost of shares redeemed: | | | | |
| Class A | (1,074,701 | ) | (613,082 | ) |
| Class C | (42,049 | ) | (51,050 | ) |
| Class I | (60,071,260 | ) | (33,883,374 | ) |
| Class Y | (4,825 | ) | — | |
| Increase (Decrease) in Net Assets | | | | |
| from Capital Stock Transactions | 77,006,908 | | 100,217,933 | |
| Total Increase (Decrease) in Net Assets | 96,605,848 | | 173,736,665 | |
| Net Assets ($): | | | | |
| Beginning of Period | 363,403,627 | | 189,666,962 | |
| End of Period | 460,009,475 | | 363,403,627 | |
| Accumulated investment (loss)—net | — | | (561,103 | ) |
26
| | | | |
| | | | Year Ended May 31, | |
| | 2014 | a | 2013 | |
| Capital Share Transactions: | | | | |
| Class Ab | | | | |
| Shares sold | 209,944 | | 36,749 | |
| Shares issued for dividends reinvested | 4,614 | | — | |
| Shares redeemed | (43,311 | ) | (31,680 | ) |
| Net Increase (Decrease) in Shares Outstanding | 171,247 | | 5,069 | |
| Class Cb | | | | |
| Shares sold | 18,615 | | 1,398 | |
| Shares issued for dividends reinvested | 450 | | — | |
| Shares redeemed | (1,720 | ) | (2,698 | ) |
| Net Increase (Decrease) in Shares Outstanding | 17,345 | | (1,300 | ) |
| Class I | | | | |
| Shares sold | 4,719,753 | | 6,979,448 | |
| Shares issued for dividends reinvested | 473,295 | | — | |
| Shares redeemed | (2,372,287 | ) | (1,738,932 | ) |
| Net Increase (Decrease) in Shares Outstanding | 2,820,761 | | 5,240,516 | |
| Class Y | | | | |
| Shares sold | 41,048 | | — | |
| Shares redeemed | (197 | ) | — | |
| Net Increase (Decrease) in Shares Outstanding | 40,851 | | — | |
a Effective July 1, 2013, the fund commenced offering ClassY shares.
b During the period ended May 31, 2013, 865 Class C shares representing $18,835 were exchanged for 847
Class A shares.
See notes to financial statements.
The Fund 27
FINANCIAL HIGHLIGHTS
The following tables describe the performance for each share class for the fiscal periods indicated. All information (except portfolio turnover rate) reflects financial results for a single fund share.Total return shows how much your investment in the fund would have increased (or decreased) during each period, assuming you had reinvested all dividends and distributions.These figures have been derived from the fund’s financial statements.
| | | | | | | | |
| | | | Year Ended May 31, | | | |
| Class A Shares | 2014 | | 2013 | | 2012 | | 2011 | a |
| Per Share Data ($): | | | | | | | | |
| Net asset value, beginning of period | 22.16 | | 17.13 | | 18.36 | | 12.50 | |
| Investment Operations: | | | | | | | | |
| Investment (loss)—netb | (.19 | ) | (.11 | ) | (.13 | ) | (.15 | ) |
| Net realized and unrealized | | | | | | | | |
| gain (loss) on investments | 2.90 | | 5.14 | | (1.10 | ) | 6.06 | |
| Total from Investment Operations | 2.71 | | 5.03 | | (1.23 | ) | 5.91 | |
| Distributions: | | | | | | | | |
| Dividends from net realized | | | | | | | | |
| gain on investments | (1.32 | ) | — | | — | | (.05 | ) |
| Net asset value, end of period | 23.55 | | 22.16 | | 17.13 | | 18.36 | |
| Total Return (%)c | 11.87 | | 29.36 | | (6.70 | ) | 47.31 | d |
| Ratios/Supplemental Data (%): | | | | | | | | |
| Ratio of total expenses to average net assets | 1.38 | | 1.34 | | 1.43 | | 2.95 | e |
| Ratio of net expenses to average net assets | 1.30 | | 1.33 | | 1.34 | | 1.40 | e |
| Ratio of net investment | | | | | | | | |
| (loss) to average net assets | (.75 | ) | (.56 | ) | (.78 | ) | (1.03 | )e |
| Portfolio Turnover Rate | 121.33 | | 111.48 | | 107.62 | | 70.41 | d |
| Net Assets, end of period ($ x 1,000) | 4,742 | | 668 | | 430 | | 758 | |
a From July 1, 2010 (commencement of operations) to May 31, 2011.
b Based on average shares outstanding at each month end.
c Exclusive of sales charge.
d Not annualized.
e Annualized.
See notes to financial statements.
28
| | | | | | | | |
| | | | Year Ended May 31, | | | |
| Class C Shares | 2014 | | 2013 | | 2012 | | 2011 | a |
| Per Share Data ($): | | | | | | | | |
| Net asset value, beginning of period | 21.70 | | 16.89 | | 18.22 | | 12.50 | |
| Investment Operations: | | | | | | | | |
| Investment (loss)—netb | (.36 | ) | (.23 | ) | (.26 | ) | (.26 | ) |
| Net realized and unrealized | | | | | | | | |
| gain (loss) on investments | 2.83 | | 5.04 | | (1.07 | ) | 6.03 | |
| Total from Investment Operations | 2.47 | | 4.81 | | (1.33 | ) | 5.77 | |
| Distributions: | | | | | | | | |
| Dividends from net realized | | | | | | | | |
| gain on investments | (1.32 | ) | — | | — | | (.05 | ) |
| Net asset value, end of period | 22.85 | | 21.70 | | 16.89 | | 18.22 | |
| Total Return (%)c | 10.99 | | 28.48 | | (7.30 | ) | 46.19 | d |
| Ratios/Supplemental Data (%): | | | | | | | | |
| Ratio of total expenses to average net assets | 2.34 | | 2.25 | | 2.16 | | 3.73 | e |
| Ratio of net expenses to average net assets | 2.03 | | 2.02 | | 2.07 | | 2.15 | e |
| Ratio of net investment (loss) | | | | | | | | |
| to average net assets | (1.48 | ) | (1.28 | ) | (1.56 | ) | (1.77 | )e |
| Portfolio Turnover Rate | 121.33 | | 111.48 | | 107.62 | | 70.41 | d |
| Net Assets, end of period ($ x 1,000) | 430 | | 32 | | 47 | | 214 | |
a From July 1, 2010 (commencement of operations) to May 31, 2011.
b Based on average shares outstanding at each month end.
c Exclusive of sales charge.
d Not annualized.
e Annualized.
See notes to financial statements.
The Fund 29
FINANCIAL HIGHLIGHTS (continued)
| | | | | | | | |
| | | | Year Ended May 31, | | | |
| Class I Shares | 2014 | | 2013 | | 2012 | | 2011 | a |
| Per Share Data ($): | | | | | | | | |
| Net asset value, beginning of period | 22.35 | | 17.22 | | 18.40 | | 12.50 | |
| Investment Operations: | | | | | | | | |
| Investment (loss)—netb | (.12 | ) | (.05 | ) | (.06 | ) | (.13 | ) |
| Net realized and unrealized | | | | | | | | |
| gain (loss) on investments | 2.92 | | 5.18 | | (1.12 | ) | 6.08 | |
| Total from Investment Operations | 2.80 | | 5.13 | | (1.18 | ) | 5.95 | |
| Distributions: | | | | | | | | |
| Dividends from net realized | | | | | | | | |
| gain on investments | (1.32 | ) | — | | — | | (.05 | ) |
| Net asset value, end of period | 23.83 | | 22.35 | | 17.22 | | 18.40 | |
| Total Return (%) | 12.18 | | 29.79 | | (6.41 | ) | 47.63 | c |
| Ratios/Supplemental Data (%): | | | | | | | | |
| Ratio of total expenses to average net assets | .98 | | .99 | | 1.03 | | 1.77 | d |
| Ratio of net expenses to average net assets | .98 | | .99 | | 1.02 | | 1.15 | d |
| Ratio of net investment (loss) | | | | | | | | |
| to average net assets | (.45 | ) | (.25 | ) | (.34 | ) | (.84 | )d |
| Portfolio Turnover Rate | 121.33 | | 111.48 | | 107.62 | | 70.41 | c |
| Net Assets, end of period ($ x 1,000) | 453,865 | | 362,704 | | 189,191 | | 111,480 | |
a From July 1, 2010 (commencement of operations) to May 31, 2011.
b Based on average shares outstanding at each month end.
c Not annualized.
d Annualized.
See notes to financial statements.
30
| | |
| | Period Ended | |
| Class Y Shares | May 31, 2014a | |
| Per Share Data ($): | | |
| Net asset value, beginning of period | 23.06 | |
| Investment Operations: | | |
| Investment (loss)—netb | (.02 | ) |
| Net realized and unrealized | | |
| gain (loss) on investments | 2.09 | |
| Total from Investment Operations | 2.07 | |
| Distributions: | | |
| Dividends from net realized gain on investments | (1.32 | ) |
| Net asset value, end of period | 23.81 | |
| Total Return (%) | 8.68 | c |
| Ratios/Supplemental Data (%): | | |
| Ratio of total expenses to average net assets | 1.16 | d |
| Ratio of net expenses to average net assets | 1.04 | d |
| Ratio of net investment (loss) | | |
| to average net assets | (.08 | )d |
| Portfolio Turnover Rate | 121.33 | |
| Net Assets, end of period ($ x 1,000) | 973 | |
a From July 1, 2013 (commencement of initial offering) to May 31, 2014.
b Based on average shares outstanding at each month end.
c Not annualized.
d Annualized.
See notes to financial statements.
The Fund 31
NOTES TO FINANCIAL STATEMENTS
NOTE 1—Significant Accounting Policies:
Dreyfus Select Managers Small Cap Growth Fund (the “fund”) is a separate non-diversified series of Strategic Funds, Inc. (the “Company”), which is registered under the Investment Company Act of 1940, as amended (the “Act”), as an open-end management investment company and operates as a series company currently offering nine series, including the fund. The fund’s investment objective is to seek capital appreciation.The Dreyfus Corporation (the “Manager” or “Dreyfus”), a wholly-owned subsidiary of The Bank of New York Mellon Corporation (“BNY Mellon”), serves as the fund’s investment adviser. EACM Advisors LLC (“EACM”), a subsidiary of BNY Mellon and an affiliate of Dreyfus, serves as the fund’s portfolio allocation manager. Riverbridge Partners, LLC (“Riverbridge”), Geneva Capital Management Ltd. (“Geneva”), Cupps Capital Management, LLC (“CCM”), Nicholas Investment Partners, L.P. (“Nicholas”), EAM Investors, LLC (“EAM”), Granite Investment Partners, LLC (“Granite”) and Rice Hall James & Associates (“Rice Hall”), serve as the fund’s sub-investment advisers, each managing an allocated portion of the fund’s portfolio. At a July 29, 2013 meeting, the Company’s Board of Directors (the “Board”) voted to terminate the fund’s sub-investment advisory agreement with King Investment Advisors, Inc. effective September 30, 2013. At a November 4-5, 2013 meeting, the Board approved a new sub-investment advisory agreement with Granite and Rice Hall, which became effective on November 15, 2013.
MBSC Securities Corporation (the “Distributor”), a wholly-owned subsidiary of Dreyfus, is the distributor of the fund’s shares.The fund is authorized to issue 325 million shares of $.001 par value Common Stock.The fund currently offers four classes of shares: Class A (75 million shares authorized), Class C (75 million shares authorized), Class I (75 million shares authorized) and Class Y (100 million shares authorized). Class A shares generally are subject to a sales charge imposed at the time of purchase. Class C shares are subject to a contingent deferred sales charge (“CDSC”) imposed on Class C shares redeemed within one year of purchase. Class I and ClassY shares are sold at net asset value per share
32
generally to institutional investors. Other differences between the classes include the services offered to and the expenses borne by each class, the allocation of certain transfer agency costs, and certain voting rights. Income, expenses (other than expenses attributable to a specific class), and realized and unrealized gains or losses on investments are allocated to each class of shares based on its relative net assets.
As of May 31, 2014, MBC Investments Corp., an indirect subsidiary of BNY Mellon, held all of the outstanding Class Y shares of the fund.
The Company accounts separately for the assets, liabilities and operations of each series. Expenses directly attributable to each series are charged to that series’ operations; expenses which are applicable to all series are allocated among them on a pro rata basis.
The Financial Accounting Standards Board (“FASB”) Accounting Standards Codification is the exclusive reference of authoritative U.S. generally accepted accounting principles (“GAAP”) recognized by the FASB to be applied by nongovernmental entities. Rules and interpretive releases of the Securities and Exchange Commission (“SEC”) under authority of federal laws are also sources of authoritative GAAP for SEC registrants. The fund’s financial statements are prepared in accordance with GAAP, which may require the use of management estimates and assumptions.Actual results could differ from those estimates.
The Company enters into contracts that contain a variety of indemnifications. The fund’s maximum exposure under these arrangements is unknown.The fund does not anticipate recognizing any loss related to these arrangements.
(a) Portfolio valuation: The fair value of a financial instrument is the amount that would be received to sell an asset or paid to transfer a liability in an orderly transaction between market participants at the measurement date (i.e., the exit price). GAAP establishes a fair value hierarchy that prioritizes the inputs of valuation techniques used to measure fair value. This hierarchy gives the highest priority to unad-
The Fund 33
NOTES TO FINANCIAL STATEMENTS (continued)
justed quoted prices in active markets for identical assets or liabilities (Level 1 measurements) and the lowest priority to unobservable inputs (Level 3 measurements).
Additionally, GAAP provides guidance on determining whether the volume and activity in a market has decreased significantly and whether such a decrease in activity results in transactions that are not orderly. GAAP requires enhanced disclosures around valuation inputs and techniques used during annual and interim periods.
Various inputs are used in determining the value of the fund’s investments relating to fair value measurements.These inputs are summarized in the three broad levels listed below:
Level 1—unadjusted quoted prices in active markets for identical investments.
Level 2—other significant observable inputs (including quoted prices for similar investments, interest rates, prepayment speeds, credit risk, etc.).
Level 3—significant unobservable inputs (including the fund’s own assumptions in determining the fair value of investments).
The inputs or methodology used for valuing securities are not necessarily an indication of the risk associated with investing in those securities.
Changes in valuation techniques may result in transfers in or out of an assigned level within the disclosure hierarchy. Valuation techniques used to value the fund’s investments are as follows:
Investments in securities are valued at the last sales price on the securities exchange or national securities market on which such securities are primarily traded. Securities listed on the National Market System for which market quotations are available are valued at the official closing price or, if there is no official closing price that day, at the last sales price. Securities not listed on an exchange or the national securities market,
34
or securities for which there were no transactions, are valued at the average of the most recent bid and asked prices, except for open short positions, where the asked price is used for valuation purposes. Bid price is used when no asked price is available. Registered investment companies that are not traded on an exchange are valued at their net asset value. All of the preceding securities are generally categorized within Level 1 of the fair value hierarchy.
Fair valuing of securities may be determined with the assistance of a pricing service using calculations based on indices of domestic securities and other appropriate indicators, such as prices of relevant ADRs and financial futures. Utilizing these techniques may result in transfers between Level 1 and Level 2 of the fair value hierarchy.
When market quotations or official closing prices are not readily available, or are determined not to reflect accurately fair value, such as when the value of a security has been significantly affected by events after the close of the exchange or market on which the security is principally traded (for example, a foreign exchange or market), but before the fund calculates its net asset value, the fund may value these investments at fair value as determined in accordance with the procedures approved by the Board. Certain factors may be considered when fair valuing investments such as: fundamental analytical data, the nature and duration of restrictions on disposition, an evaluation of the forces that influence the market in which the securities are purchased and sold, and public trading in similar securities of the issuer or comparable issuers. These securities are either categorized within Level 2 or 3 of the fair value hierarchy depending on the relevant inputs used.
For restricted securities where observable inputs are limited, assumptions about market activity and risk are used and are generally categorized within Level 3 of the fair value hierarchy.
The Fund 35
NOTES TO FINANCIAL STATEMENTS (continued)
The following is a summary of the inputs used as of May 31, 2014 in valuing the fund’s investments:
| | | | |
| | | Level 2—Other | Level 3— | |
| | Level 1— | Significant | Significant | |
| | Unadjusted | Observable | Unobservable | |
| | Quoted Prices | Inputs | Inputs | Total |
| Assets ($) | | | | |
| Investments in Securities: | | | |
| Equity Securities— | | | | |
| Domestic | | | | |
| Common Stocks† | 442,478,180 | — | — | 442,478,180 |
| Equity Securities— | | | | |
| Foreign | | | | |
| Common Stocks† | 9,019,380 | — | — | 9,019,380 |
| Exchange-Traded | | | | |
| Funds | 502,565 | — | — | 502,565 |
| Mutual Funds | 27,274,600 | — | — | 27,274,600 |
| |
| † See Statement of Investments for additional detailed categorizations. | |
At May 31, 2014, there were no transfers between Level 1 and Level 2 of the fair value hierarchy.
(b) Securities transactions and investment income: Securities transactions are recorded on a trade date basis. Realized gains and losses from securities transactions are recorded on the identified cost basis. Dividend income is recognized on the ex-dividend date and interest income, including, where applicable, accretion of discount and amortization of premium on investments, is recognized on the accrual basis.
Pursuant to a securities lending agreement with The Bank of New York Mellon, a subsidiary of BNY Mellon and an affiliate of Dreyfus, the fund may lend securities to qualified institutions. It is the fund’s policy that, at origination, all loans are secured by collateral of at least 102% of the value of U.S. securities loaned and 105% of the value of foreign securities loaned. Collateral equivalent to at least 100% of the market value of securities on loan is maintained at all times. Collateral is either in the form of cash, which can be invested in certain money
36
market mutual funds managed by Dreyfus or U.S. Government and Agency securities.The fund is entitled to receive all dividends, interest and distributions on securities loaned, in addition to income earned as a result of the lending transaction. Should a borrower fail to return the securities in a timely manner, The Bank of New York Mellon is required to replace the securities for the benefit of the fund or credit the fund with the market value of the unreturned securities and is subrogated to the fund’s rights against the borrower and the collateral. During the period ended May 31, 2014, The Bank of New York Mellon earned $177,610 from lending portfolio securities, pursuant to the securities lending agreement.
(c) Affiliated issuers: Investments in other investment companies advised by Dreyfus are defined as “affiliated” under the Act. Investments in affiliated investment companies during the period ended May 31, 2014 were as follows:
| | | | | |
| Affiliated | | | | | |
| Investment | Value | | | Value | Net |
| Company | 5/31/2013($) | Purchases ($) | Sales ($) | 5/31/2014 ($) | Assets (%) |
| Dreyfus | | | | | |
| Institutional | | | | | |
| Cash | | | | | |
| Advantage | | | | | |
| Fund | 49,047,750 | 196,550,819 | 218,323,969 | 27,274,600 | 5.9 |
(d) Dividends to shareholders: Dividends are recorded on the ex-dividend date. Dividends from investment income–net and dividends from net realized capital gains, if any, are normally declared and paid annually, but the fund may make distributions on a more frequent basis to comply with the distribution requirements of the Internal Revenue Code of 1986, as amended (the “Code”).To the extent that net realized capital gains can be offset by capital loss carryovers, it is the policy of the fund not to distribute such gains. Income and capital gain distributions are determined in accordance with income tax regulations, which may differ from GAAP.
The Fund 37
NOTES TO FINANCIAL STATEMENTS (continued)
(e) Federal income taxes: It is the policy of the fund to continue to qualify as a regulated investment company, if such qualification is in the best interests of its shareholders, by complying with the applicable provisions of the Code, and to make distributions of taxable income sufficient to relieve it from substantially all federal income and excise taxes.
As of and during the period ended May 31, 2014, the fund did not have any liabilities for any uncertain tax positions.The fund recognizes interest and penalties, if any, related to uncertain tax positions as income tax expense in the Statement of Operations. During the period ended May 31, 2014, the fund did not incur any interest or penalties.
Each tax year in the four-year period ended May 31, 2014 remains subject to examination by the Internal Revenue Service and state taxing authorities.
At May 31, 2014, the components of accumulated earnings on a tax basis were as follows: undistributed ordinary income $2,410,709, undistributed capital gains $17,079,746 and unrealized appreciation $79,144,898.
The tax character of distributions paid to shareholders during the fiscal periods ended May 31, 2014 and May 31, 2013 were as follows: ordinary income $8,801,203 and $0, and long-term capital gains $13,914,136 and $0, respectively.
During the period ended May 31, 2014, as a result of permanent book to tax differences, primarily due to the tax treatment for net operating losses, the fund increased accumulated undistributed investment income-net by $2,609,634 and decreased accumulated net realized gain (loss) on investments by the same amount. Net assets and net asset value per share were not affected by this reclassification.
NOTE 2—Bank Lines of Credit:
The fund participates with other Dreyfus-managed funds in a $265 million unsecured credit facility led by Citibank, N.A. and a $300 million unsecured credit facility provided by The Bank of New York
38
Mellon (each, a “Facility”), each to be utilized primarily for temporary or emergency purposes, including the financing of redemptions. Prior to October 9, 2013, the unsecured credit facility with Citibank, N.A. was $210 million. In connection therewith, the fund has agreed to pay its pro rata portion of commitment fees for each Facility. Interest is charged to the fund based on rates determined pursuant to the terms of the respective Facility at the time of borrowing. During the period ended May 31, 2014, the fund did not borrow under the Facilities.
NOTE 3—Management Fee, Sub-Investment Advisory Fee and Other Transactions with Affiliates:
(a) Pursuant to a management agreement with Dreyfus, the management fee is computed at the annual rate of .90% of the value of the fund’s average daily net assets and is payable monthly. Dreyfus has contractually agreed, from June 1, 2013 through October 1, 2014, to waive receipt of its fees and/or assume the direct expenses of the fund, so that the expenses of none of the classes (excluding Rule 12b-1 Distribution Plan fees, Shareholder Services Plan fees, taxes, interest expense, brokerage commissions, commitment fees on borrowings and extraordinary expenses) exceed 1.05% of the value of the fund’s average daily net assets. The reduction in expenses, pursuant to the undertaking, amounted to $2,701 during the period ended May 31, 2014.
Pursuant to a Portfolio Allocation Agreement between Dreyfus and EACM, Dreyfus pays EACM a monthly fee at an annual percentage of the value of the fund’s average daily net assets.
Pursuant to separate Sub-Investment Advisory Agreements between Dreyfus and Riverbridge, Geneva, CCM, Nicholas, EAM, Granite and Rice Hall, each serves as the fund’s sub-adviser responsible for the day-to–day management of a portion of the fund’s portfolio. Dreyfus has obtained an exemptive order from the SEC, upon which the fund may rely, to use a manager of managers approach that permits Dreyfus, subject
The Fund 39
NOTES TO FINANCIAL STATEMENTS (continued)
to certain conditions and approval by the Board, to enter into and materially amend sub-investment advisory agreements with one or more sub-advisers who are either unaffiliated with Dreyfus or are wholly-owned subsidiaries (as defined under the Act) of Dreyfus’ ultimate parent company, BNY Mellon, without obtaining shareholder approval. The order also relieves the fund from disclosing the sub-investment advisory fee paid by Dreyfus to an unaffiliated sub-adviser in documents filed with the SEC and provided to shareholders. In addition, pursuant to the order, it is not necessary to disclose the sub-investment advisory fee payable by Dreyfus separately to a sub-adviser that is a wholly-owned subsidiary of BNY Mellon in documents filed with the SEC and provided to shareholders; such fees are to be aggregated with fees payable to Dreyfus. Dreyfus has ultimate responsibility (subject to oversight by the Board) to supervise any sub-adviser and recommend the hiring, termination, and replacement of any sub-adviser to the Board.
During the period ended May 31, 2014, the Distributor retained $2,639 from commissions earned on sales of the fund’s Class A shares.
(b) Under the Distribution Plan adopted pursuant to Rule 12b-1 under the Act, Class C shares pay the Distributor for distributing its shares at an annual rate of .75% of the value of its average daily net assets. During the period ended May 31, 2014, Class C shares were charged $1,559 pursuant to the Distribution Plan.
(c) Under the Shareholder Services Plan, Class A and Class C shares pay the Distributor at an annual rate of .25% of the value of their average daily net assets for the provision of certain services.The services provided may include personal services relating to shareholder accounts, such as answering shareholder inquiries regarding the fund and providing reports and other information, and services related to the maintenance of shareholder accounts.The Distributor may make payments to Service Agents (securities dealers, financial institutions or other industry professionals) with respect to these services. The Distributor determines the amounts to be paid to Service Agents. During the period ended May 31, 2014, Class A and Class C shares were charged $6,249 and $520, respectively, pursuant to the Shareholder Services Plan.
40
The fund has arrangements with the transfer agent and the custodian whereby the fund may receive earnings credits when positive cash balances are maintained, which are used to offset transfer agency and custody fees. For financial reporting purposes, the fund includes net earnings credits as an expense offset in the Statement of Operations.
The fund compensates DreyfusTransfer, Inc., a wholly-owned subsidiary of Dreyfus, under a transfer agency agreement for providing transfer agency and cash management services for the fund. The majority of transfer agency fees are comprised of amounts paid on a per account basis, while cash management fees are related to fund subscriptions and redemptions. During the period ended May 31, 2014, the fund was charged $3,813 for transfer agency services and $141 for cash management services.These fees are included in Shareholder servicing costs in the Statement of Operations. Cash management fees were partially offset by earnings credits of $11.
The fund compensates The Bank of NewYork Mellon under a custody agreement for providing custodial services for the fund.These fees are determined based on net assets, geographic region and transaction activity. During the period ended May 31, 2014, the fund was charged $120,255 pursuant to the custody agreement.
The fund compensated The Bank of New York Mellon under a cash management agreement that was in effect until September 30, 2013 for performing certain cash management services related to fund subscriptions and redemptions. During the period ended May 31, 2014, the fund was charged $11 pursuant to the cash management agreement, which is included in Shareholder servicing costs in the Statement of Operations.
During the period ended May 31, 2014, the fund was charged $9,157 for services performed by the Chief Compliance Officer and his staff.
The components of “Due to The Dreyfus Corporation and affiliates” in the Statement of Assets and Liabilities consist of: management fees $345,140, Distribution Plan fees $255, Shareholder Services Plan fees
The Fund 41
NOTES TO FINANCIAL STATEMENTS (continued)
$1,081, custodian fees $24,000, Chief Compliance Officer fees $1,472 and transfer agency fees $1,050, which are offset against an expense reimbursement currently in effect in the amount of $736.
(d) Each Board member also serves as a Board member of other funds within the Dreyfus complex. Annual retainer fees and attendance fees are allocated to each fund based on net assets.
NOTE 4—Securities Transactions:
The aggregate amount of purchases and sales of investment securities, excluding short-term securities, during the period ended May 31, 2014, amounted to $579,059,420 and $526,921,292, respectively.
At May 31, 2014, the cost of investments for federal income tax purposes was $400,129,827; accordingly, accumulated net unrealized appreciation on investments was $79,144,898, consisting of $96,725,954 gross unrealized appreciation and $17,581,056 gross unrealized depreciation.
42
REPORT OF INDEPENDENT REGISTERED
PUBLIC ACCOUNTING FIRM
Shareholders and Board of Directors
Dreyfus Select Managers Small Cap Growth Fund
We have audited the accompanying statement of assets and liabilities, including the statement of investments, of Dreyfus Select Managers Small Cap Growth Fund (one of the series comprising Strategic Funds, Inc.) as of May 31, 2014, and the related statement of operations for the year then ended, the statement of changes in net assets for each of the two years in the period then ended, and the financial highlights for each of the periods indicated therein.These financial statements and financial highlights are the responsibility of the Fund’s management. Our responsibility is to express an opinion on these financial statements and financial highlights based on our audits.
We conducted our audits in accordance with the standards of the Public Company Accounting Oversight Board (United States).Those standards require that we plan and perform the audit to obtain reasonable assurance about whether the financial statements and financial highlights are free of material misstatement.We were not engaged to perform an audit of the Fund’s internal control over financial reporting. Our audits included consideration of internal control over financial reporting as a basis for designing audit procedures that are appropriate in the circumstances, but not for the purpose of expressing an opinion on the effectiveness of the Fund’s internal control over financial reporting. Accordingly, we express no such opinion. An audit also includes examining, on a test basis, evidence supporting the amounts and disclosures in the financial statements and financial highlights, assessing the accounting principles used and significant estimates made by management, and evaluating the overall financial statement presentation. Our procedures included confirmation of securities owned as of May 31, 2014 by correspondence with the custodian and others.We believe that our audits provide a reasonable basis for our opinion.
In our opinion, the financial statements and financial highlights referred to above present fairly, in all material respects, the financial position of Dreyfus Select Managers Small Cap Growth Fund at May 31, 2014, the results of its operations for the year then ended, the changes in its net assets for each of the two years in the period then ended, and the financial highlights for each of the indicated periods, in conformity with U.S. generally accepted accounting principles.
New York, New York
July 25, 2014
The Fund 43
IMPORTANT TAX INFORMATION (Unaudited)
For federal tax purposes, the fund hereby reports 12.01% of the ordinary dividends paid during the fiscal year ended May 31, 2014 as qualifying for the corporate dividends received deduction. Also, certain dividends paid by the fund may be subject to a maximum tax rate of 15%, as provided for by the Jobs and Growth Tax Relief Reconciliation Act of 2003. Of the distributions paid during the fiscal year, $1,441,509 represents the maximum amount that may be considered qualified dividend income. Shareholders will receive notification in early 2015 of the percentage applicable to the preparation of their 2014 income tax returns. Also, the fund hereby reports $.5109 per share as a short-term capital gain distribution and $.8077 per share as a long-term capital gain distribution paid on December 4, 2013.
44
BOARD MEMBERS INFORMATION (Unaudited)
INDEPENDENT BOARD MEMBERS
Joseph S. DiMartino (70) Chairman of the Board (1995)
Principal Occupation During Past 5Years:
• Corporate Director and Trustee
Other Public Company Board Memberships During Past 5Years:
CBIZ (formerly, Century Business Services, Inc.), a provider of outsourcing functions for small and medium size companies, Director (1997-present)
The Newark Group, a provider of a national market of paper recovery facilities, paperboard mills and paperboard converting plants, Director (2000-2010)
Sunair Services Corporation, a provider of certain outdoor-related services to homes and businesses, Director (2005-2009)
No. of Portfolios for which Board Member Serves: 146
———————
William Hodding Carter III (79) Board Member (1988)
Principal Occupation During Past 5Years:
• Professor of Leadership & Public Policy, University of North Carolina, Chapel Hill (2006-present)
No. of Portfolios for which Board Member Serves: 24
———————
Joni Evans (72)
Board Member (2006)
Principal Occupation During Past 5Years:
Chief Executive Officer, www.wowOwow.com an online community dedicated to women’s conversations and publications (2007-present)
Principal, Joni Evans Ltd. (publishing) (2006-present)
No. of Portfolios for which Board Member Serves: 24
———————
Ehud Houminer (73)
Board Member (1994)
Principal Occupation During Past 5Years:
• Executive-in-Residence at the Columbia Business School, Columbia University (1992-present)
Other Public Company Board Membership During Past 5Years:
• Avnet Inc., an electronics distributor, Director (1993-2012)
No. of Portfolios for which Board Member Serves: 66
The Fund 45
BOARD MEMBERS INFORMATION (Unaudited) (continued) INDEPENDENT BOARD MEMBERS (continued)
Richard C. Leone (74)
Board Member (1984)
Principal Occupation During Past 5Years:
Senior Fellow of The Century Foundation (formerly, The Twentieth Century Fund, Inc.), a tax exempt research foundation engaged in the study of economic, foreign policy and domestic issues
President—The Century Foundation (1989-2011)
No. of Portfolios for which Board Member Serves: 24
———————
Hans C. Mautner (76)
Board Member (1984)
Principal Occupation During Past 5Years:
• President—International Division and an Advisory Director of Simon Property Group, a real estate investment company (1998-2010) • Chairman and Chief Executive Officer of Simon Global Limited, a real estate company (1999-2010)
No. of Portfolios for which Board Member Serves: 24
———————
Robin A. Melvin (50)
Board Member (1995)
Principal Occupation During Past 5Years:
Board Member, Illinois Mentoring Partnership, non-profit organization dedicated to increasing the quantity and quality of mentoring services in Illinois (2013-present)
Director, Boisi Family Foundation, a private family foundation that supports youth-serving orga- nizations that promote the self sufficiency of youth from disadvantaged circumstances (1995-2012)
No. of Portfolios for which Board Member Serves: 113
———————
Burton N. Wallack (63)
Board Member (2006)
Principal Occupation During Past 5Years:
No. of Portfolios for which Board Member Serves: 24
———————
John E. Zuccotti (76)
Board Member (1984)
Principal Occupation During Past 5Years:
Chairman of Brookfield Properties, Inc. (1996-present)
Senior Counsel of Weil, Gotshal & Manges, LLP (1997-present)
Other Public Company Board Membership During Past 5Years:
• Wellpoint, Inc., a health benefits company, Director (2005-2010)
No. of Portfolios for which Board Member Serves: 24
46
INTERESTED BOARD MEMBER
Gordon J. Davis (72)
Board Member (2006)
Principal Occupation During Past 5Years:
Other Public Company Board Memberships During Past 5Years:
Consolidated Edison, Inc., a utility company, Director (1997-present)
The Phoenix Companies, Inc., a life insurance company, Director (2000-present)
No. of Portfolios for which Board Member Serves: 59
Gordon J. Davis is deemed to be an “interested person” (as defined in the Act) of the fund as a result of his affiliation with Venable LLP, which provides legal services to the fund.
———————
Once elected all Board Members serve for an indefinite term, but achieve Emeritus status upon reaching age 80.The address of the Board Members and Officers is c/o The Dreyfus Corporation, 200 Park Avenue, NewYork, NewYork 10166. Additional information about the Board Members is available in the fund’s Statement of Additional Information which can be obtained from Dreyfus free of charge by calling this toll free number: 1-800-DREYFUS.
Arnold S. Hiatt, Emeritus Board Member
The Fund 47
OFFICERS OF THE FUND (Unaudited)
48
The Fund 49
For More Information
Telephone Call your financial representative or 1-800-DREYFUS
Mail The Dreyfus Family of Funds, 144 Glenn Curtiss Boulevard, Uniondale, NY 11556-0144
The fund files its complete schedule of portfolio holdings with the Securities and Exchange
Commission (“SEC”) for the first and third quarters of each fiscal year on Form N-Q. The
fund’s Forms N-Q are available on the SEC’s website at http://www.sec.gov and may be
reviewed and copied at the SEC’s Public Reference Room in Washington, DC. Information on
the operation of the Public Reference Room may be obtained by calling 1-800-SEC-0330.
A description of the policies and procedures that the fund uses to determine
how to vote proxies relating to portfolio securities, and information regarding
how the fund voted these proxies for the most recent 12-month period ended
June 30 is available at http://www.dreyfus.com and on the SEC’s website at
http://www.sec.gov. The description of the policies and procedures is also
available without charge, upon request, by calling 1-800-DREYFUS.

© 2014 MBSC Securities Corporation
Item 2. Code of Ethics.
The Registrant has adopted a code of ethics that applies to the Registrant's principal executive officer, principal financial officer, principal accounting officer or controller, or persons performing similar functions. There have been no amendments to, or waivers in connection with, the Code of Ethics during the period covered by this Report.
Item 3. Audit Committee Financial Expert.
The Registrant's Board has determined that Ehud Houminer, a member of the Audit Committee of the Board, is an audit committee financial expert as defined by the Securities and Exchange Commission (the "SEC"). Ehud Houminer is "independent" as defined by the SEC for purposes of audit committee financial expert determinations.
Item 4. Principal Accountant Fees and Services.
(a) Audit Fees. The aggregate fees billed for each of the last two fiscal years (the "Reporting Periods") for professional services rendered by the Registrant's principal accountant (the "Auditor") for the audit of the Registrant's annual financial statements or services that are normally provided by the Auditor in connection with the statutory and regulatory filings or engagements for the Reporting Periods, were and $31,594 in 2013 and $32,226 in 2014.
(b) Audit-Related Fees. The aggregate fees billed in the Reporting Periods for assurance and related services by the Auditor that are reasonably related to the performance of the audit of the Registrant's financial statements and are not reported under paragraph (a) of this Item 4 were $6,000 in 2013 and $7,320 in 2014. These services consisted of one or more of the following: (i) agreed upon procedures related to compliance with Internal Revenue Code section 817(h), (ii) security counts required by Rule 17f-2 under the Investment Company Act of 1940, as amended, (iii) advisory services as to the accounting or disclosure treatment of Registrant transactions or events and (iv) advisory services to the accounting or disclosure treatment of the actual or potential impact to the Registrant of final or proposed rules, standards or interpretations by the Securities and Exchange Commission, the Financial Accounting Standards Boards or other regulatory or standard-setting bodies.
The aggregate fees billed in the Reporting Periods for non-audit assurance and related services by the Auditor to the Registrant's investment adviser (not including any sub-investment adviser whose role is primarily portfolio management and is subcontracted with or overseen by another investment adviser), and any entity controlling, controlled by or under common control with the investment adviser that provides ongoing services to the Registrant ("Service Affiliates"), that were reasonably related to the performance of the annual audit of the Service Affiliate, which required pre-approval by the Audit Committee were $0 in 2013 and $0 in 2014.
(c) Tax Fees. The aggregate fees billed in the Reporting Periods for professional services rendered by the Auditor for tax compliance, tax advice, and tax planning ("Tax Services") were $3,040 in 2013 and $4,249 in 2014. These services consisted of: (i) review or preparation of U.S. federal, state, local and excise tax returns; (ii) U.S. federal, state and local tax planning, advice and assistance regarding statutory, regulatory or administrative developments; (iii) tax advice regarding tax qualification matters and/or treatment of various financial instruments held or proposed to be acquired or held, and (iv) determination of Passive Foreign Investment Companies. The aggregate fees billed in the Reporting Periods for Tax Services by the Auditor to Service Affiliates, which required pre-approval by the Audit Committee were $0 in 2013 and $0 in 2014.
(d) All Other Fees. The aggregate fees billed in the Reporting Periods for products and services provided by the Auditor, other than the services reported in paragraphs (a) through (c) of this Item, were $0 in 2013 and $125 in 2014. These services included a review of the Registrant's anti-money laundering program.
The aggregate fees billed in the Reporting Periods for Non-Audit Services by the Auditor to Service Affiliates, other than the services reported in paragraphs (b) through (c) of this Item, which required pre-approval by the Audit Committee, were $200,000 in 2013 and $0 in 2014.
(e)(1) Audit Committee Pre-Approval Policies and Procedures. The Registrant's Audit Committee has established policies and procedures (the "Policy") for pre-approval (within specified fee limits) of the Auditor's engagements for non-audit services to the Registrant and Service Affiliates without specific case-by-case consideration. The pre-approved services in the Policy can include pre-approved audit services, pre-approved audit-related services, pre-approved tax services and pre-approved all other services. Pre-approval considerations include whether the proposed services are compatible with maintaining the Auditor's independence. Pre-approvals pursuant to the Policy are considered annually.
(e)(2) Note: None of the services described in paragraphs (b) through (d) of this Item 4 were approved by the Audit Committee pursuant to paragraph (c)(7)(i)(C) of Rule 2-01 of Regulation S-X.
(f) None of the hours expended on the principal accountant's engagement to audit the registrant's financial statements for the most recent fiscal year were attributed to work performed by persons other than the principal account's full-time, permanent employees.
Non-Audit Fees. The aggregate non-audit fees billed by the Auditor for services rendered to the Registrant, and rendered to Service Affiliates, for the Reporting Periods were $49,714,645 in 2013 and $40,974,357 in 2014.
Auditor Independence. The Registrant's Audit Committee has considered whether the provision of non-audit services that were rendered to Service Affiliates, which were not pre-approved (not requiring pre-approval), is compatible with maintaining the Auditor's independence.
Item 5. Audit Committee of Listed Registrants.
Not applicable. [CLOSED-END FUNDS ONLY]
Item 6. Investments.
(a) Not applicable.
Item 7. Disclosure of Proxy Voting Policies and Procedures for Closed-End Management Investment Companies.
Not applicable. [CLOSED-END FUNDS ONLY]
Item 8. Portfolio Managers of Closed-End Management Investment Companies.
Not applicable. [CLOSED-END FUNDS ONLY, beginning with reports for periods ended on and after December 31, 2005]
Item 9. Purchases of Equity Securities by Closed-End Management Investment Companies and Affiliated Purchasers.
Not applicable. [CLOSED-END FUNDS ONLY]
Item 10. Submission of Matters to a Vote of Security Holders.
There have been no material changes to the procedures applicable to Item 10.
Item 11. Controls and Procedures.
(a) The Registrant's principal executive and principal financial officers have concluded, based on their evaluation of the Registrant's disclosure controls and procedures as of a date within 90 days of the filing date of this report, that the Registrant's disclosure controls and procedures are reasonably designed to ensure that information required to be disclosed by the Registrant on Form N-CSR is recorded, processed, summarized and reported within the required time periods and that information required to be disclosed by the Registrant in the reports that it files or submits on Form N-CSR is accumulated and communicated to the Registrant's management, including its principal executive and principal financial officers, as appropriate to allow timely decisions regarding required disclosure.
(b) There were no changes to the Registrant's internal control over financial reporting that occurred during the second fiscal quarter of the period covered by this report that have materially affected, or are reasonably likely to materially affect, the Registrant's internal control over financial reporting.
Item 12. Exhibits.
(a)(1) Code of ethics referred to in Item 2.
(a)(2) Certifications of principal executive and principal financial officers as required by Rule 30a-2(a) under the Investment Company Act of 1940.
(a)(3) Not applicable.
(b) Certification of principal executive and principal financial officers as required by Rule 30a-2(b) under the Investment Company Act of 1940.
SIGNATURES
Pursuant to the requirements of the Securities Exchange Act of 1934 and the Investment Company Act of 1940, the Registrant has duly caused this Report to be signed on its behalf by the undersigned, thereunto duly authorized.
Strategic Funds, Inc.
By: /s/ Bradley J. Skapyak
Bradley J. Skapyak,
President
Date: July 21, 2014
Pursuant to the requirements of the Securities Exchange Act of 1934 and the Investment Company Act of 1940, this Report has been signed below by the following persons on behalf of the Registrant and in the capacities and on the dates indicated.
By: /s/ Bradley J. Skapyak
Bradley J. Skapyak,
President
Date: July 21, 2014
By: /s/ James Windels
James Windels,
Treasurer
Date: July 21-, 2014
EXHIBIT INDEX
(a)(1) Code of ethics referred to in Item 2.
(a)(2) Certifications of principal executive and principal financial officers as required by Rule 30a-2(a) under the Investment Company Act of 1940. (EX-99.CERT)
(b) Certification of principal executive and principal financial officers as required by Rule 30a-2(b) under the Investment Company Act of 1940. (EX-99.906CERT)