UNITED STATES
SECURITIES AND EXCHANGE COMMISSION
Washington, D.C. 20549
FORM N-CSR
CERTIFIED SHAREHOLDER REPORT OF REGISTERED MANAGEMENT
INVESTMENT COMPANIES
Investment Company Act file number | 811- 3940 |
| |
| Strategic Funds, Inc. | |
| (Exact name of Registrant as specified in charter) | |
| | |
| c/o The Dreyfus Corporation 200 Park Avenue New York, New York 10166 | |
| (Address of principal executive offices) (Zip code) | |
| | |
| John Pak, Esq. 200 Park Avenue New York, New York 10166 | |
| (Name and address of agent for service) | |
|
Registrant's telephone number, including area code: | (212) 922-6000 |
| |
Date of fiscal year end: | 12/31 | |
Date of reporting period: | 12/31/13 | |
| | | | | | | |
The following N-CSR relates only to the Registrant’s series listed below and does not affect the other series of the Registrant, which have different fiscal year ends and, therefore, different N-CSR reporting requirements. Separate N-CSR Forms will be filed for these series, as appropriate.
Dreyfus Active MidCap Fund
FORM N-CSR
Item 1. Reports to Stockholders.
The views expressed in this report reflect those of the portfolio manager only through the end of the period covered and do not necessarily represent the views of Dreyfus or any other person in the Dreyfus organization. Any such views are subject to change at any time based upon market or other conditions and Dreyfus disclaims any responsibility to update such views.These views may not be relied on as investment advice and, because investment decisions for a Dreyfus fund are based on numerous factors, may not be relied on as an indication of trading intent on behalf of any Dreyfus fund.
| | Contents |
| | THE FUND |
| 2 | A Letter from the President |
| 3 | Discussion of Fund Performance |
| 6 | Fund Performance |
| 8 | Understanding Your Fund’s Expenses |
| 8 | Comparing Your Fund’s Expenses With Those of Other Funds |
| 9 | Statement of Investments |
| 15 | Statement of Assets and Liabilities |
| 16 | Statement of Operations |
| 17 | Statement of Changes in Net Assets |
| 19 | Financial Highlights |
| 22 | Notes to Financial Statements |
| 34 | Report of Independent Registered Public Accounting Firm |
| 35 | Important Tax Information |
| 36 | Information About the Renewal of the Fund’s Management Agreement |
| 41 | Board Members Information |
| 44 | Officers of the Fund |
| | FOR MORE INFORMATION |
| | Back Cover |
Dreyfus
Active MidCap Fund
The Fund
A LETTER FROM THE PRESIDENT
Dear Shareholder:
We are pleased to present this annual report for Dreyfus Active MidCap Fund, covering the 12-month period from January 1, 2013, through December 31, 2013. For information about how the fund performed during the reporting period, as well as general market perspectives, we provide a Discussion of Fund Performance on the pages that follow.
The year 2013 proved to be outstanding for U.S. equities. Large-cap stocks delivered their strongest calendar-year performance in well over a decade, and small- and midcap stocks fared even better in an environment of low short-term interest rates, rising corporate earnings, sustained economic growth, and low inflation. In our view, 2013 provided ample evidence of the value of patience and discipline in equity investing, as those who favored a long-term perspective over a focus on news headlines and short-term volatility reaped the rewards provided by rising markets.
Will stocks continue to rally in 2014? We believe that they can. We expect the domestic economy to continue to strengthen over the next year, particularly if U.S. fiscal policy is less restrictive and short-term interest rates remain near historical lows. Stronger growth could convince businesses and consumers to spend more freely, unleashing pent up demand as economic uncertainty wanes. However, we caution that gains in 2014 are unlikely to match those of the past year, and a highly selective approach to security selection could be key to greater relative investment success in the months ahead. As always, we urge you to speak with your financial adviser to identify the investment strategies that are right for you.
Thank you for your continued confidence and support.
Sincerely,

J. Charles Cardona
President
The Dreyfus Corporation
January 15, 2014
2
DISCUSSION OF FUND PERFORMANCE
For the period of January 1, 2013, through December 31, 2013, as provided by Warren Chiang, C.Wesley Boggs, and Ronald Gala, Portfolio Managers
Fund and Market Performance Overview
For the 12-month period ended December 31, 2013, Dreyfus Active MidCap Fund’s Class A shares achieved a total return of 35.50%, Class C shares returned 34.32%, and Class I shares returned 35.73%.1 In comparison, the fund’s benchmark, the Russell Midcap Index (the “Index”), achieved a total return of 34.76% for the same period.2
U.S. equities markets rallied strongly in 2013 as U.S. economic growth accelerated in the midst of an aggressively accommodative monetary policy from the Federal Reserve Board (the “Fed”). Midcap stocks produced modestly higher returns than their larger-cap counterparts during the year. The fund’s Class A and Class I shares outperformed the benchmark, primarily due to the success of our disciplined security selection process in the financials and information technology sectors.
The Fund’s Investment Approach
The fund seeks to maximize capital appreciation by investing in midsize companies, as represented by the Russell Midcap Index. In pursuing this goal, we use quantitative models designed to identify equity securities with attractive long-term relative valuations, sustainable earnings, and behavioral factors, such as stock buybacks and analysts’ earnings revisions, that may indicate potential misvaluations. We generally maintain sector concentrations that are roughly in line with the Index.We periodically reapply these models and adjust the fund’s holdings. Stocks no longer favored by the models are sold, and highly rated stocks are purchased.The fund’s models are enhanced from time to time as suggested by our team’s ongoing research efforts.
Economic Growth and Fed Policy Fueled Rising Market
Equity markets climbed sharply in 2013 during a sustained economic recovery that saw U.S. GDP accelerate from a 1.1% annualized rate during the first quarter of the year to 4.1% for the third quarter. Economic gains were fueled by falling unemployment,
The Fund 3
DISCUSSION OF FUND PERFORMANCE (continued)
rebounding housing markets, low short-term interest rates, and a massive, open-ended quantitative easing program from the Fed.
After rallying during the first four months of the year, stocks encountered heightened volatility in late May 2013 when relatively hawkish remarks by Fed Chairman Ben Bernanke were widely interpreted as a signal that monetary policymakers would begin to back away from quantitative easing sooner than most analysts had expected. As a result, equities lost value in June before stabilizing over the summer. Stocks resumed their advance in the fall, when the Fed unexpectedly refrained from tapering its bond purchasing program. Even a 16-day federal government shutdown in October failed to derail the rally.
Equities continued to advance over the final two months of the year amid new releases of encouraging economic data.A modest reduction in the Fed’s bond buying program in mid-December had little impact on stock prices, enabling several major measures of stock market performance to end the year near record highs.
Strong Stock Selections Drove Fund Performance
The fund’s quantitatively driven security selection and risk management processes delivered relatively robust performance throughout the year. Quality, valuation and behavioral metrics enhanced returns by enabling the fund to identify attractive individual stocks across several market sectors.
In the financials sector, asset management firm Waddell & Reed Financial, Cl. A announced strong third quarter earnings and increased both margins and assets under management. Another top financial holding, banking institution KeyCorp, exceeded most analysts’ expectations. In the information technology sector, relative returns were led by communications equipment maker Harris, which rose sharply after the company delivered better-than-expected revenues and won awards for new products in its research and development pipeline. Internet networking and data storage firm Brocade Communications Systems benefited from improved operating efficiencies as well as a significant increase in its share buyback program. Notably strong performers in the consumer staples sector included tax-related services provider H&R Block, while apparel maker Hanesbrands fared well in the consumer discretionary sector.
4
On the other hand, some of the fund’s other consumer discretionary holdings, such as apparel retailers American Eagle Outfitters and Abercrombie & Fitch, produced more disappointing results, causing the fund to lag its benchmark in the sector. Other relatively weak holdings during 2013 included medical device maker Thoratec, which posted weaker-than-expected earnings, and fertilizer company CF Industries Holdings, which was sold out of the fund and subsequently rebounded at the end of the year.
Maintaining Our Disciplined Approach
We were pleased to see U.S. equities deliver their best returns in more than a decade during 2013, and encouraged by the even more robust performance of midcap stocks. Despite the rally in equities, our bottom-up, quantitative investment process has continued to identify individual companies with attractive valuations and high levels of earnings quality. Using this process, and by diversifying the fund’s assets across market sectors we believe we can continue to capture opportunities for solid gains while managing unrewarded risks.
January 15, 2014
|
| Please note, the position in any security highlighted with italicized typeface was sold during the reporting period. |
| Equity funds are subject generally to market, market sector, market liquidity, issuer and investment style risks, among |
| other factors, to varying degrees, all of which are more fully described in the fund’s prospectus. |
| Stocks of midcap companies often experience sharper price fluctuations than stocks of large-cap companies. |
| 1 Total return includes reinvestment of dividends and any capital gains paid, and does not take into consideration the |
| maximum initial sales charge in the case of Class A shares or the applicable contingent deferred sales charge imposed on |
| redemptions in the case of Class C shares. Had these charges been reflected, returns would have been lower. Past |
| performance is no guarantee of future results. Share price and investment return fluctuate such that upon redemption fund |
| shares may be worth more or less than their original cost. Return figures provided reflect the absorption of certain fund |
| expenses by The Dreyfus Corporation pursuant to an agreement in effect through May 1, 2014, at which time it may be |
| extended, terminated or modified. Had these expenses not been absorbed, the fund’s returns would have been lower. |
| 2 SOURCE: LIPPER INC. — Reflects reinvestment of dividends and, where applicable, capital gain distributions. |
| The Russell Midcap Index is a widely accepted, unmanaged index of medium-cap stock market performance. Investors |
| cannot invest directly in an index. |
The Fund 5
FUND PERFORMANCE
|
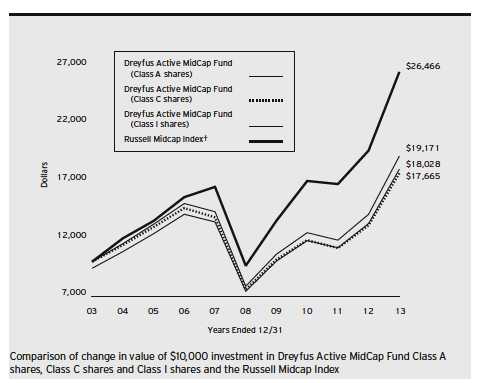
| † Source: Lipper Inc. |
| Past performance is not predictive of future performance. |
| The above graph compares a $10,000 investment made in each of the Class A, Class C and Class I shares of Dreyfus |
| Active MidCap Fund on 12/31/03 to a $10,000 investment made in the Russell Midcap Index (the “Index”) on |
| that date.All dividends and capital gain distributions are reinvested. |
| The fund’s performance shown in the line graph above takes into account the maximum initial sales charge on Class A |
| shares and all other applicable fees and expenses on all classes.The Index is a widely accepted, unmanaged index of |
| medium-cap stock market performance. Unlike a mutual fund, the Index is not subject to charges, fees and other expenses. |
| Investors cannot invest directly in any index. Further information relating to fund performance, including expense |
| reimbursements, if applicable, is contained in the Financial Highlights section of the prospectus and elsewhere in this report. |
6
| | | | | | |
| Average Annual Total Returns as of 12/31/13 | | | | | |
| | 1 Year | | 5 Years | | 10 Years | |
| Class A shares | | | | | | |
| with maximum sales charge (5.75%) | 27.72 | % | 17.99 | % | 6.07 | % |
| without sales charge | 35.50 | % | 19.39 | % | 6.70 | % |
| Class C shares | | | | | | |
| with applicable redemption charge † | 33.32 | % | 18.39 | % | 5.86 | % |
| without redemption | 34.32 | % | 18.39 | % | 5.86 | % |
| Class I shares | 35.73 | % | 19.46 | % | 6.73 | % |
| Russell Midcap Index | 34.76 | % | 22.36 | % | 10.22 | % |
|
| Past performance is not predictive of future performance.The fund’s performance shown in the graph and table does not |
| reflect the deduction of taxes that a shareholder would pay on fund distributions or the redemption of fund shares. |
| † The maximum contingent deferred sales charge for Class C shares is 1% for shares redeemed within one year of the |
| date of purchase. |
The Fund 7
UNDERSTANDING YOUR FUND’S EXPENSES (Unaudited)
As a mutual fund investor, you pay ongoing expenses, such as management fees and other expenses. Using the information below, you can estimate how these expenses affect your investment and compare them with the expenses of other funds.You also may pay one-time transaction expenses, including sales charges (loads) and redemption fees, which are not shown in this section and would have resulted in higher total expenses. For more information, see your fund’s prospectus or talk to your financial adviser.
Review your fund’s expenses
The table below shows the expenses you would have paid on a $1,000 investment in Dreyfus Active MidCap Fund from July 1, 2013 to December 31, 2013. It also shows how much a $1,000 investment would be worth at the close of the period, assuming actual returns and expenses.
| | | | | | |
| Expenses and Value of a $1,000 Investment | | | | |
| assuming actual returns for the six months ended December 31, 2013 | | |
| | | Class A | | Class C | | Class I |
| Expenses paid per $1,000† | $ | 6.28 | $ | 10.89 | $ | 5.13 |
| Ending value (after expenses) | $ | 1,166.10 | $ | 1,160.80 | $ | 1,167.10 |
COMPARING YOUR FUND’S EXPENSES
WITH THOSE OF OTHER FUNDS (Unaudited)
Using the SEC’s method to compare expenses
The Securities and Exchange Commission (SEC) has established guidelines to help investors assess fund expenses. Per these guidelines, the table below shows your fund’s expenses based on a $1,000 investment, assuming a hypothetical 5% annualized return. You can use this information to compare the ongoing expenses (but not transaction expenses or total cost) of investing in the fund with those of other funds.All mutual fund shareholder reports will provide this information to help you make this comparison. Please note that you cannot use this information to estimate your actual ending account balance and expenses paid during the period.
| | | | | | |
| Expenses and Value of a $1,000 Investment | | | | |
| assuming a hypothetical 5% annualized return for the six months ended December 31, 2013 |
| | | Class A | | Class C | | Class I |
| Expenses paid per $1,000† | $ | 5.85 | $ | 10.16 | $ | 4.79 |
| Ending value (after expenses) | $ | 1,019.41 | $ | 1,015.12 | $ | 1,020.47 |
|
| † Expenses are equal to the fund’s annualized expense ratio of 1.15% for Class A, 2.00% for Class C, and .94% for |
| Class I, multiplied by the average account value over the period, multiplied by 184/365 (to reflect the one-half year |
| period). |
8
STATEMENT OF INVESTMENTS
December 31, 2013
| | | |
| Common Stocks—99.6% | Shares | | Value ($) |
| Automobiles & Components—1.1% | | | |
| Lear | 63,000 | | 5,101,110 |
| Banks—6.6% | | | |
| Comerica | 97,700 | | 4,644,658 |
| Fifth Third Bancorp | 312,600 | | 6,573,978 |
| KeyCorp | 242,300 | | 3,251,666 |
| Popular | 110,700 | a | 3,180,411 |
| Regions Financial | 750,300 | | 7,420,467 |
| SunTrust Banks | 152,700 | | 5,620,887 |
| | | | 30,692,067 |
| Capital Goods—11.8% | | | |
| AECOM Technology | 180,300 | a | 5,306,229 |
| AGCO | 81,100 | | 4,800,309 |
| Dover | 16,100 | | 1,554,294 |
| Flowserve | 47,100 | | 3,712,893 |
| Fluor | 15,500 | | 1,244,495 |
| L-3 Communications Holdings | 41,000 | | 4,381,260 |
| Lennox International | 81,600 | | 6,940,896 |
| Lincoln Electric Holdings | 86,200 | | 6,149,508 |
| Masco | 287,400 | | 6,544,098 |
| Oshkosh | 47,700 | | 2,403,126 |
| Rockwell Automation | 29,700 | | 3,509,352 |
| Valmont Industries | 36,100 | | 5,383,232 |
| WABCO Holdings | 34,000 | a | 3,175,940 |
| | | | 55,105,632 |
| Consumer Durables & Apparel—2.9% | | | |
| Hanesbrands | 104,600 | | 7,350,242 |
| PulteGroup | 297,600 | | 6,062,112 |
| | | | 13,412,354 |
| Consumer Services—4.2% | | | |
| Bally Technologies | 50,400 | a | 3,953,880 |
| Starwood Hotels & Resorts Worldwide | 102,800 | b | 8,167,460 |
| Wyndham Worldwide | 105,100 | | 7,744,819 |
| | | | 19,866,159 |
| Diversified Financials—6.6% | | | |
| Moody’s | 106,500 | | 8,357,055 |
The Fund 9
STATEMENT OF INVESTMENTS (continued)
| | | |
| Common Stocks (continued) | Shares | | Value ($) |
| Diversified Financials (continued) | | | |
| SLM | 275,500 | | 7,240,140 |
| T. Rowe Price Group | 95,700 | | 8,016,789 |
| Waddell & Reed Financial, Cl. A | 112,600 | | 7,332,512 |
| | | | 30,946,496 |
| Energy—5.0% | | | |
| Chesapeake Energy | 278,600 | | 7,561,204 |
| Denbury Resources | 304,100 | a | 4,996,363 |
| EQT | 43,700 | | 3,923,386 |
| Kosmos Energy | 102,600 | a | 1,147,068 |
| Marathon Petroleum | 41,100 | | 3,770,103 |
| RPC | 110,900 | c | 1,979,565 |
| | | | 23,377,689 |
| Food & Staples Retailing—1.3% | | | |
| Kroger | 153,400 | | 6,063,902 |
| Food, Beverage & Tobacco—4.8% | | | |
| Coca-Cola Enterprises | 60,700 | | 2,678,691 |
| Green Mountain Coffee Roasters | 44,600 | c | 3,370,868 |
| Hershey | 23,200 | | 2,255,736 |
| Hillshire Brands | 180,800 | | 6,045,952 |
| J.M. Smucker | 31,300 | | 3,243,306 |
| Tootsie Roll Industries | 24,900 | c | 810,246 |
| Tyson Foods, Cl. A | 114,200 | | 3,821,132 |
| | | | 22,225,931 |
| Health Care Equipment & Services—4.7% | | | |
| CareFusion | 69,000 | a | 2,747,580 |
| Cigna | 18,500 | | 1,618,380 |
| Edwards Lifesciences | 6,200 | a | 407,712 |
| Health Net | 109,400 | a | 3,245,898 |
| Hill-Rom Holdings | 80,200 | | 3,315,468 |
| ResMed | 129,600 | c | 6,101,568 |
| Sirona Dental Systems | 61,700 | a | 4,331,340 |
| | | | 21,767,946 |
10
| | | |
| Common Stocks (continued) | Shares | | Value ($) |
| Household & Personal Products—2.2% | | | |
| Avon Products | 172,400 | | 2,968,728 |
| Energizer Holdings | 67,300 | | 7,284,552 |
| | | | 10,253,280 |
| Insurance—2.7% | | | |
| Everest Re Group | 14,800 | | 2,306,876 |
| Principal Financial Group | 41,000 | | 2,021,710 |
| Unum Group | 47,600 | | 1,669,808 |
| XL Group | 207,400 | | 6,603,616 |
| | | | 12,602,010 |
| Materials—5.4% | | | |
| International Flavors & Fragrances | 42,100 | | 3,619,758 |
| Olin | 101,900 | c | 2,939,815 |
| Packaging Corporation of America | 104,800 | | 6,631,744 |
| Scotts Miracle-Gro, Cl. A | 105,100 | | 6,539,322 |
| Worthington Industries | 135,600 | | 5,706,048 |
| | | | 25,436,687 |
| Media—.3% | | | |
| Valassis Communications | 43,000 | c | 1,472,750 |
| Pharmaceuticals, Biotech & | | | |
| Life Sciences—7.5% | | | |
| Agilent Technologies | 143,500 | | 8,206,765 |
| Charles River Laboratories International | 81,100 | a | 4,301,544 |
| Covance | 43,000 | a | 3,786,580 |
| Mettler-Toledo International | 29,200 | a | 7,083,628 |
| Perrigo Company | 23,300 | | 3,575,618 |
| Salix Pharmaceuticals | 5,300 | a | 476,682 |
| United Therapeutics | 68,600 | a | 7,757,288 |
| | | | 35,188,105 |
| Real Estate—3.9% | | | |
| Apartment Investment & Management, Cl. A | 95,700 | b | 2,479,587 |
| Camden Property Trust | 36,700 | b | 2,087,496 |
| CBL & Associates Properties | 249,100 | b | 4,473,836 |
The Fund 11
STATEMENT OF INVESTMENTS (continued)
| | | | |
| Common Stocks (continued) | Shares | | | Value ($) |
| Real Estate (continued) | | | | |
| Corrections Corporation of America | 175,179 | | b | 5,617,991 |
| HCP | 66,400 | | b | 2,411,648 |
| Kimco Realty | 37,900 | | b | 748,525 |
| Weyerhaeuser | 14,700 | | b | 464,079 |
| | | | | 18,283,162 |
| Retailing—7.0% | | | | |
| Bed Bath & Beyond | 95,900 | | a | 7,700,770 |
| GameStop, Cl. A | 34,100 | | | 1,679,766 |
| Gap | 139,200 | | | 5,439,936 |
| Macy’s | 83,600 | | | 4,464,240 |
| O’Reilly Automotive | 59,600 | | a | 7,671,116 |
| PetSmart | 37,000 | | | 2,691,750 |
| Urban Outfitters | 83,500 | a | | 3,097,850 |
| | | | | 32,745,428 |
| Semiconductors & Semiconductor | | | | |
| Equipment—.8% | | | | |
| International Rectifier | 66,000 | a | | 1,720,620 |
| LSI | 207,100 | | | 2,282,242 |
| | | | | 4,002,862 |
| Software & Services—10.0% | | | | |
| CA | 186,000 | | | 6,258,900 |
| Cadence Design Systems | 437,600 | a | | 6,135,152 |
| DST Systems | 66,800 | | | 6,061,432 |
| Fiserv | 108,800 | | a | 6,424,640 |
| Intuit | 110,100 | | | 8,402,832 |
| NeuStar, Cl. A | 48,100 | a | | 2,398,266 |
| Rovi | 93,700 | | a | 1,844,953 |
12
| | | |
| Common Stocks (continued) | Shares | | Value ($) |
| Software & Services (continued) | | | |
| Symantec | 287,500 | | 6,779,250 |
| VeriSign | 37,300 | a | 2,229,794 |
| | | | 46,535,219 |
| Technology Hardware & Equipment—4.5% | | | |
| Harris | 108,200 | | 7,553,442 |
| NetApp | 122,000 | c | 5,019,080 |
| SanDisk | 117,200 | | 8,267,288 |
| | | | 20,839,810 |
| Transportation—.4% | | | |
| Matson | 70,400 | | 1,838,144 |
| Utilities—5.9% | | | |
| AES | 94,600 | | 1,372,646 |
| Edison International | 155,300 | | 7,190,390 |
| IDACORP | 48,200 | | 2,498,688 |
| Pinnacle West Capital | 104,100 | | 5,508,972 |
| Public Service Enterprise Group | 6,600 | | 211,464 |
| UGI | 108,500 | | 4,498,410 |
| Wisconsin Energy | 150,100 | | 6,205,134 |
| | | | 27,485,704 |
| Total Common Stocks | | | |
| (cost $375,203,160) | | | 465,242,447 |
| |
| Other Investment—.4% | | | |
| Registered Investment Company; | | | |
| Dreyfus Institutional Preferred | | | |
| Plus Money Market Fund | | | |
| (cost $1,744,544) | 1,744,544 | d | 1,744,544 |
The Fund 13
STATEMENT OF INVESTMENTS (continued)
| | | | |
| Investment of Cash Collateral | | | | |
| for Securities Loaned—2.7% | Shares | | Value ($) | |
| Registered Investment Company; | | | | |
| Dreyfus Institutional Cash | | | | |
| Advantage Fund | | | | |
| (cost $12,683,642) | 12,683,642 | d | 12,683,642 | |
| |
| Total Investments (cost $389,631,346) | 102.7 | % | 479,670,633 | |
| Liabilities, Less Cash and Receivables | (2.7 | %) | (12,671,815 | ) |
| Net Assets | 100.0 | % | 466,998,818 | |
|
| a Non-income producing security. |
| b Investment in real estate investment trust. |
| c Security, or portion thereof, on loan.At December 31, 2013, the value of the fund’s securities on loan was |
| $16,878,382 and the value of the collateral held by the fund was $17,274,477, consisting of cash collateral of |
| $12,683,642 and U.S. Government & Agency securities valued at $4,590,835. |
| d Investment in affiliated money market mutual fund. |
| | | |
| Portfolio Summary (Unaudited)† | | |
| |
| | Value (%) | | Value (%) |
| Capital Goods | 11.8 | Consumer Services | 4.2 |
| Software & Services | 10.0 | Real Estate | 3.9 |
| Pharmaceuticals, Biotech & | | Money Market Investments | 3.1 |
| Life Sciences | 7.5 | Consumer Durables & Apparel | 2.9 |
| Retailing | 7.0 | Insurance | 2.7 |
| Banks | 6.6 | Household & Personal Products | 2.2 |
| Diversified Financials | 6.6 | Food & Staples Retailing | 1.3 |
| Utilities | 5.9 | Automobiles & Components | 1.1 |
| Materials | 5.4 | Semiconductors & Semiconductor | |
| Energy | 5.0 | Equipment | .8 |
| Food, Beverage & Tobacco | 4.8 | Transportation | .4 |
| Health Care Equipment & Services | 4.7 | Media | .3 |
| Technology Hardware & Equipment | 4.5 | | 102.7 |
|
| † Based on net assets. |
| See notes to financial statements. |
14
STATEMENT OF ASSETS AND LIABILITIES
December 31, 2013
| | | | |
| | | Cost | Value | |
| Assets ($): | | | | |
| Investments in securities—See Statement of Investments (including | | | |
| securities on loan, valued at $16,878,382)—Note 1(b): | | | |
| Unaffiliated issuers | | 375,203,160 | 465,242,447 | |
| Affiliated issuers | | 14,428,186 | 14,428,186 | |
| Dividends and securities lending income receivable | | | 572,493 | |
| Receivable for shares of Common Stock subscribed | | 46,314 | |
| Prepaid expenses and other assets | | | 50,886 | |
| | | | 480,340,326 | |
| Liabilities ($): | | | | |
| Due to The Dreyfus Corporation and affiliates—Note 3(c) | | 447,574 | |
| Cash overdraft due to Custodian | | | 47,404 | |
| Liability for securities on loan—Note 1(b) | | | 12,683,642 | |
| Payable for shares of Common Stock redeemed | | | 85,206 | |
| Accrued expenses | | | 77,682 | |
| | | | 13,341,508 | |
| Net Assets ($) | | | 466,998,818 | |
| Composition of Net Assets ($): | | | | |
| Paid-in capital | | | 460,340,022 | |
| Accumulated undistributed investment income—net | | | 236,019 | |
| Accumulated net realized gain (loss) on investments | | (83,616,510 | ) |
| Accumulated net unrealized appreciation | | | | |
| (depreciation) on investments | | | 90,039,287 | |
| Net Assets ($) | | | 466,998,818 | |
| |
| |
| Net Asset Value Per Share | | | | |
| | Class A | Class C | Class I | |
| Net Assets ($) | 457,146,297 | 4,596,979 | 5,255,542 | |
| Shares Outstanding | 9,309,482 | 98,702 | 105,843 | |
| Net Asset Value Per Share ($) | 49.11 | 46.57 | 49.65 | |
|
| See notes to financial statements. |
The Fund 15
STATEMENT OF OPERATIONS
Year Ended December 31, 2013
| | |
| Investment Income ($): | | |
| Income: | | |
| Cash dividends (net of $606 foreign taxes withheld at source): | | |
| Unaffiliated issuers | 7,701,052 | |
| Affiliated issuers | 936 | |
| Income from securities lending—Note 1(b) | 104,392 | |
| Total Income | 7,806,380 | |
| Expenses: | | |
| Management fee—Note 3(a) | 3,208,858 | |
| Shareholder servicing costs—Note 3(c) | 1,463,006 | |
| Professional fees | 58,673 | |
| Prospectus and shareholders’ reports | 49,351 | |
| Registration fees | 47,102 | |
| Distribution fees—Note 3(b) | 34,576 | |
| Custodian fees—Note 3(c) | 33,346 | |
| Directors’ fees and expenses—Note 3(d) | 30,861 | |
| Loan commitment fees—Note 2 | 4,298 | |
| Miscellaneous | 18,572 | |
| Total Expenses | 4,948,643 | |
| Less—reduction in expenses due to undertaking—Note 3(a) | (2,104 | ) |
| Less—reduction in fees due to earnings credits—Note 3(c) | (1,576 | ) |
| Net Expenses | 4,944,963 | |
| Investment Income—Net | 2,861,417 | |
| Realized and Unrealized Gain (Loss) on Investments—Note 4 ($): | | |
| Net realized gain (loss) on investments | 77,389,265 | |
| Net unrealized appreciation (depreciation) on investments | 47,419,459 | |
| Net Realized and Unrealized Gain (Loss) on Investments | 124,808,724 | |
| Net Increase in Net Assets Resulting from Operations | 127,670,141 | |
|
| See notes to financial statements. |
16
STATEMENT OF CHANGES IN NET ASSETS
| | | | |
| | Year Ended December 31, | |
| | 2013 | | 2012 | a |
| Operations ($): | | | | |
| Investment income—net | 2,861,417 | | 4,409,943 | |
| Net realized gain (loss) on investments | 77,389,265 | | 21,681,065 | |
| Net unrealized appreciation | | | | |
| (depreciation) on investments | 47,419,459 | | 37,935,724 | |
| Net Increase (Decrease) in Net Assets | | | | |
| Resulting from Operations | 127,670,141 | | 64,026,732 | |
| Dividends to Shareholders from ($): | | | | |
| Investment income—net: | | | | |
| Class A | (2,788,360 | ) | (4,309,703 | ) |
| Class C | — | | (9,784 | ) |
| Class I | (44,334 | ) | (46,426 | ) |
| Total Dividends | (2,832,694 | ) | (4,365,913 | ) |
| Capital Stock Transactions ($): | | | | |
| Net proceeds from shares sold: | | | | |
| Class A | 15,252,980 | | 10,659,686 | |
| Class C | 400,129 | | 204,009 | |
| Class I | 4,764,088 | | 1,660,310 | |
| Dividends reinvested: | | | | |
| Class A | 2,637,844 | | 4,057,872 | |
| Class C | — | | 9,054 | |
| Class I | 37,566 | | 37,346 | |
| Cost of shares redeemed: | | | | |
| Class A | (47,365,328 | ) | (60,270,439 | ) |
| Class B | — | | (814,981 | ) |
| Class C | (1,959,556 | ) | (2,392,493 | ) |
| Class I | (4,340,812 | ) | (1,804,835 | ) |
| Increase (Decrease) in Net Assets | | | | |
| from Capital Stock Transactions | (30,573,089 | ) | (48,654,471 | ) |
| Total Increase (Decrease) in Net Assets | 94,264,358 | | 11,006,348 | |
| Net Assets ($): | | | | |
| Beginning of Period | 372,734,460 | | 361,728,112 | |
| End of Period | 466,998,818 | | 372,734,460 | |
| Undistributed investment income—net | 236,019 | | 207,296 | |
The Fund 17
STATEMENT OF CHANGES IN NET ASSETS (continued)
| | | | |
| | Year Ended December 31, | |
| | 2013 | | 2012 | a |
| Capital Share Transactions: | | | | |
| Class Ab,c | | | | |
| Shares sold | 355,021 | | 302,526 | |
| Shares issued for dividends reinvested | 54,817 | | 111,477 | |
| Shares redeemed | (1,097,154 | ) | (1,741,944 | ) |
| Net Increase (Decrease) in Shares Outstanding | (687,316 | ) | (1,327,941 | ) |
| Class Bc | | | | |
| Shares redeemed | — | | (24,863 | ) |
| Class Cb | | | | |
| Shares sold | 9,722 | | 6,131 | |
| Shares issued for dividends reinvested | — | | 261 | |
| Shares redeemed | (47,455 | ) | (73,715 | ) |
| Net Increase (Decrease) in Shares Outstanding | (37,733 | ) | (67,323 | ) |
| Class I | | | | |
| Shares sold | 110,722 | | 47,697 | |
| Shares issued for dividends reinvested | 782 | | 1,015 | |
| Shares redeemed | (97,199 | ) | (51,812 | ) |
| Net Increase (Decrease) in Shares Outstanding | 14,305 | | (3,100 | ) |
| |
| a | Effective as of the close of business on March 13, 2012, the fund no longer offers Class B shares. |
| b | During the period ended December 31, 2013, 22,801 Class C shares representing $952,637 were exchanged for |
| | 21,616 Class A shares. |
| c | During the period ended December 31, 2012, 13,490 Class B shares representing $442,296 were automatically |
| | converted to 12,856 Class A shares. |
| See notes to financial statements. |
18
FINANCIAL HIGHLIGHTS
The following tables describe the performance for each share class for the fiscal periods indicated.All information (except portfolio turnover rate) reflects financial results for a single fund share.Total return shows how much your investment in the fund would have increased (or decreased) during each period, assuming you had reinvested all dividends and distributions.These figures have been derived from the fund’s financial statements.
| | | | | | | | | | |
| | | | Year Ended December 31, | | | |
| Class A Shares | 2013 | | 2012 | | 2011 | | 2010 | | 2009 | |
| Per Share Data ($): | | | | | | | | | | |
| Net asset value, beginning of period | 36.47 | | 31.08 | | 32.85 | | 28.02 | | 20.87 | |
| Investment Operations: | | | | | | | | | | |
| Investment income—neta | .29 | | .41 | | .07 | | .08 | | .21 | |
| Net realized and unrealized | | | | | | | | | | |
| gain (loss) on investments | 12.65 | | 5.41 | | (1.78 | ) | 4.86 | | 7.15 | |
| Total from Investment Operations | 12.94 | | 5.82 | | (1.71 | ) | 4.94 | | 7.36 | |
| Distributions: | | | | | | | | | | |
| Dividends from investment income—net | (.30 | ) | (.43 | ) | (.06 | ) | (.11 | ) | (.21 | ) |
| Net asset value, end of period | 49.11 | | 36.47 | | 31.08 | | 32.85 | | 28.02 | |
| Total Return (%)b | 35.50 | | 18.74 | | (5.21 | ) | 17.62 | | 35.24 | |
| Ratios/Supplemental Data (%): | | | | | | | | | | |
| Ratio of total expenses | | | | | | | | | | |
| to average net assets | 1.15 | | 1.20 | | 1.24 | | 1.22 | | 1.32 | |
| Ratio of net expenses | | | | | | | | | | |
| to average net assets | 1.15 | | 1.20 | | 1.24 | | 1.18 | | 1.21 | |
| Ratio of net investment income | | | | | | | | | | |
| to average net assets | .68 | | 1.19 | | .20 | | .28 | | .90 | |
| Portfolio Turnover Rate | 74.57 | | 68.84 | | 83.46 | | 124.37 | | 189.84 | |
| Net Assets, end of period ($ x 1,000) | 457,146 | | 364,625 | | 351,999 | | 424,220 | | 445,290 | |
| |
| a | Based on average shares outstanding at each month end. |
| b | Exclusive of sales charge. |
| See notes to financial statements. |
The Fund 19
FINANCIAL HIGHLIGHTS (continued)
| | | | | | | | | | |
| | | | Year Ended December 31, | | | |
| Class C Shares | 2013 | | 2012 | | 2011 | | 2010 | | 2009 | |
| Per Share Data ($): | | | | | | | | | | |
| Net asset value, beginning of period | 34.67 | | 29.51 | | 31.38 | | 26.91 | | 20.07 | |
| Investment Operations: | | | | | | | | | | |
| Investment income (loss)—neta | (.06 | ) | .08 | | (.19 | ) | (.15 | ) | .02 | |
| Net realized and unrealized | | | | | | | | | | |
| gain (loss) on investments | 11.96 | | 5.15 | | (1.68 | ) | 4.62 | | 6.83 | |
| Total from Investment Operations | 11.90 | | 5.23 | | (1.87 | ) | 4.47 | | 6.85 | |
| Distributions: | | | | | | | | | | |
| Dividends from investment income—net | — | | (.07 | ) | — | | — | | (.01 | ) |
| Net asset value, end of period | 46.57 | | 34.67 | | 29.51 | | 31.38 | | 26.91 | |
| Total Return (%)b | 34.32 | | 17.69 | | (5.93 | ) | 16.61 | | 34.13 | |
| Ratios/Supplemental Data (%): | | | | | | | | | | |
| Ratio of total expenses | | | | | | | | | | |
| to average net assets | 2.04 | | 2.07 | | 2.04 | | 2.05 | | 2.14 | |
| Ratio of net expenses | | | | | | | | | | |
| to average net assets | 2.00 | | 2.07 | | 2.04 | | 2.01 | | 2.03 | |
| Ratio of net investment income | | | | | | | | | | |
| (loss) to average net assets | (.16 | ) | .23 | | (.61 | ) | (.54 | ) | .09 | |
| Portfolio Turnover Rate | 74.57 | | 68.84 | | 83.46 | | 124.37 | | 189.84 | |
| Net Assets, end of period ($ x 1,000) | 4,597 | | 4,730 | | 6,014 | | 7,919 | | 8,407 | |
| |
| a | Based on average shares outstanding at each month end. |
| b | Exclusive of sales charge. |
| See notes to financial statements. |
20
| | | | | | | | | | |
| | | | Year Ended December 31, | | | |
| Class I Shares | 2013 | | 2012 | | 2011 | | 2010 | | 2009 | |
| Per Share Data ($): | | | | | | | | | | |
| Net asset value, beginning of period | 36.92 | | 31.47 | | 33.26 | | 28.36 | | 21.10 | |
| Investment Operations: | | | | | | | | | | |
| Investment income—neta | .36 | | .48 | | .09 | | .10 | | .16 | |
| Net realized and unrealized | | | | | | | | | | |
| gain (loss) on investments | 12.81 | | 5.48 | | (1.80 | ) | 4.91 | | 7.23 | |
| Total from Investment Operations | 13.17 | | 5.96 | | (1.71 | ) | 5.01 | | 7.39 | |
| Distributions: | | | | | | | | | | |
| Dividends from investment income—net | (.44 | ) | (.51 | ) | (.08 | ) | (.11 | ) | (.13 | ) |
| Net asset value, end of period | 49.65 | | 36.92 | | 31.47 | | 33.26 | | 28.36 | |
| Total Return (%) | 35.73 | | 18.94 | | (5.14 | ) | 17.66 | | 35.01 | |
| Ratios/Supplemental Data (%): | | | | | | | | | | |
| Ratio of total expenses | | | | | | | | | | |
| to average net assets | .95 | | 1.04 | | 1.19 | | 1.18 | | 1.61 | |
| Ratio of net expenses | | | | | | | | | | |
| to average net assets | .95 | | 1.04 | | 1.17 | | 1.13 | | 1.50 | |
| Ratio of net investment income | | | | | | | | | | |
| to average net assets | .80 | | 1.36 | | .25 | | .33 | | .70 | |
| Portfolio Turnover Rate | 74.57 | | 68.84 | | 83.46 | | 124.37 | | 189.84 | |
| Net Assets, end of period ($ x 1,000) | 5,256 | | 3,380 | | 2,978 | | 4,602 | | 4,112 | |
|
| a Based on average shares outstanding at each month end. |
| See notes to financial statements. |
The Fund 21
NOTES TO FINANCIAL STATEMENTS
NOTE 1—Significant Accounting Policies:
Dreyfus Active MidCap Fund (the “fund”) is a separate diversified series of Strategic Funds, Inc. (the “Company”), which is registered under the Investment Company Act of 1940, as amended (the “Act”), as an open-end management investment company and operates as a series company currently offering nine series, including the fund.The fund’s investment objective is to maximize capital appreciation. The Dreyfus Corporation (the “Manager” or “Dreyfus”), a wholly-owned subsidiary of The Bank of New York Mellon Corporation (“BNY Mellon”), serves as the fund’s investment adviser.
MBSC Securities Corporation (the “Distributor”), a wholly-owned subsidiary of the Manager, is the distributor of the fund’s shares. The fund is authorized to issue 70 million shares of $.001 par value Common Stock.The fund currently offers three classes of shares: Class A (40 million shares authorized), Class C (15 million shares authorized) and Class I (15 million shares authorized). Class A shares generally are subject to a sales charge imposed at the time of purchase. Class C shares are subject to a contingent deferred sales charge (“CDSC”) imposed on Class C shares redeemed within one year of purchase. Class I shares are sold at net asset value per share only to institutional investors. Other differences between the classes include the services offered to and the expenses borne by each class, the allocation of certain transfer agency costs and certain voting rights. Income, expenses (other than expenses attributable to a specific class), and realized and unrealized gains or losses on investments are allocated to each class of shares based on its relative net assets.
The Company accounts separately for the assets, liabilities and operations of each series. Expenses directly attributable to each series are charged to that series’ operations; expenses which are applicable to all series are allocated among them on a pro rata basis.
The Financial Accounting Standards Board (“FASB”) Accounting Standards Codification is the exclusive reference of authoritative U.S. generally accepted accounting principles (“GAAP”) recognized by the FASB to be applied by nongovernmental entities. Rules and interpretive
22
releases of the Securities and Exchange Commission (“SEC”) under authority of federal laws are also sources of authoritative GAAP for SEC registrants. The fund’s financial statements are prepared in accordance with GAAP, which may require the use of management estimates and assumptions.Actual results could differ from those estimates.
The Company enters into contracts that contain a variety of indemnifications. The fund’s maximum exposure under these arrangements is unknown.The fund does not anticipate recognizing any loss related to these arrangements.
(a) Portfolio valuation: The fair value of a financial instrument is the amount that would be received to sell an asset or paid to transfer a liability in an orderly transaction between market participants at the measurement date (i.e., the exit price). GAAP establishes a fair value hierarchy that prioritizes the inputs of valuation techniques used to measure fair value. This hierarchy gives the highest priority to unadjusted quoted prices in active markets for identical assets or liabilities (Level 1 measurements) and the lowest priority to unobservable inputs (Level 3 measurements).
Additionally, GAAP provides guidance on determining whether the volume and activity in a market has decreased significantly and whether such a decrease in activity results in transactions that are not orderly. GAAP requires enhanced disclosures around valuation inputs and techniques used during annual and interim periods.
Various inputs are used in determining the value of the fund’s investments relating to fair value measurements. These inputs are summarized in the three broad levels listed below:
Level 1—unadjusted quoted prices in active markets for identical investments.
Level 2—other significant observable inputs (including quoted prices for similar investments, interest rates, prepayment speeds, credit risk, etc.).
Level 3—significant unobservable inputs (including the fund’s own assumptions in determining the fair value of investments).
The Fund 23
NOTES TO FINANCIAL STATEMENTS (continued)
The inputs or methodology used for valuing securities are not necessarily an indication of the risk associated with investing in those securities.
Changes in valuation techniques may result in transfers in or out of an assigned level within the disclosure hierarchy. Valuation techniques used to value the fund’s investments are as follows:
Investments in securities are valued at the last sales price on the securities exchange or national securities market on which such securities are primarily traded. Securities listed on the National Market System for which market quotations are available are valued at the official closing price or, if there is no official closing price that day, at the last sales price. Securities not listed on an exchange or the national securities market, or securities for which there were no transactions, are valued at the average of the most recent bid and asked prices, except for open short positions, where the asked price is used for valuation purposes. Bid price is used when no asked price is available. Registered investment companies that are not traded on an exchange are valued at their net asset value. All of the preceding securities are categorized within Level 1 of the fair value hierarchy.
Fair valuing of securities may be determined with the assistance of a pricing service using calculations based on indices of domestic securities and other appropriate indicators, such as prices of relevant American Depository Receipts and financial futures. Utilizing these techniques may result in transfers between Level 1 and Level 2 of the fair value hierarchy.
When market quotations or official closing prices are not readily available, or are determined not to reflect accurately fair value, such as when the value of a security has been significantly affected by events after the close of the exchange or market on which the security is principally traded (for example, a foreign exchange or market), but before the fund calculates its net asset value, the fund may value these investments at fair value as determined in accordance with the procedures approved by the Company’s Board of Directors (the “Board”). Certain factors may be considered when fair valuing investments such
24
as: fundamental analytical data, the nature and duration of restrictions on disposition, an evaluation of the forces that influence the market in which the securities are purchased and sold, and public trading in similar securities of the issuer or comparable issuers. These securities are either categorized within Level 2 or 3 of the fair value hierarchy depending on the relevant inputs used.
For restricted securities where observable inputs are limited, assumptions about market activity and risk are used and are categorized within Level 3 of the fair value hierarchy.
The following is a summary of the inputs used as of December 31, 2013 in valuing the fund’s investments:
| | | | |
| | | Level 2—Other | Level 3— | |
| | Level 1— | Significant | Significant | |
| | Unadjusted | Observable | Unobservable | |
| | Quoted Prices | Inputs | Inputs | Total |
| Assets ($) | | | | |
| Investments in Securities: | | | |
| Equity Securities— | | | | |
| Domestic | | | | |
| Common Stocks† | 465,242,447 | — | — | 465,242,447 |
| Mutual Funds† | 14,428,186 | — | — | 14,428,186 |
| |
| † | See Statement of Investments for additional detailed categorizations. |
At December 31, 2013, there were no transfers between Level 1 and Level 2 of the fair value hierarchy.
(b) Securities transactions and investment income: Securities transactions are recorded on a trade date basis. Realized gains and losses from securities transactions are recorded on the identified cost basis. Dividend income is recognized on the ex-dividend date and interest income, including, where applicable, accretion of discount and amortization of premium on investments, is recognized on the accrual basis.
Pursuant to a securities lending agreement with The Bank of New York Mellon, a subsidiary of BNY Mellon and an affiliate of Dreyfus, the fund may lend securities to qualified institutions. It is the fund’s
The Fund 25
NOTES TO FINANCIAL STATEMENTS (continued)
policy that, at origination, all loans are secured by collateral of at least 102% of the value of U.S. securities loaned and 105% of the value of foreign securities loaned. Collateral equivalent to at least 100% of the market value of securities on loan is maintained at all times. Collateral is either in the form of cash, which can be invested in certain money market mutual funds managed by the Manager or U.S. Government and Agency securities. The fund is entitled to receive all dividends, interest and distributions on securities loaned, in addition to income earned as a result of the lending transaction. Should a borrower fail to return the securities in a timely manner, The Bank of New York Mellon is required to replace the securities for the benefit of the fund or credit the fund with the market value of the unreturned securities and is subrogated to the fund’s rights against the borrower and the collateral. During the period ended December 31, 2013,The Bank of New York Mellon earned $22,497 from lending portfolio securities, pursuant to the securities lending agreement.
(c) Affiliated issuers: Investments in other investment companies advised by Dreyfus are defined as “affiliated” under the Act. Investments in affiliated investment companies during the period ended December 31, 2013 were as follows:
| | | | | |
| Affiliated | | | | | |
| Investment | Value | | | Value | Net |
| Company | 12/31/2012 ($) | Purchases ($) | Sales ($) | 12/31/2013 ($) | Assets (%) |
| Dreyfus | | | | | |
| Institutional | | | | | |
| Preferred | | | | | |
| Plus Money | | | | | |
| Market Fund | 940,243 | 35,181,999 | 34,377,698 | 1,744,544 | .4 |
| Dreyfus | | | | | |
| Institutional | | | | | |
| Cash | | | | | |
| Advantage | | | | | |
| Fund | 19,841,872 | 105,882,588 | 113,040,818 | 12,683,642 | 2.7 |
| Total | 20,782,115 | 141,064,587 | 147,418,516 | 14,428,186 | 3.1 |
(d) Dividends to shareholders: Dividends are recorded on the ex-dividend date. Dividends from investment income-net and dividends from net realized capital gains, if any, are normally declared and paid
26
annually, but the fund may make distributions on a more frequent basis to comply with the distribution requirements of the Internal Revenue Code of 1986, as amended (the “Code”).To the extent that net realized capital gains can be offset by capital loss carryovers, it is the policy of the fund not to distribute such gains. Income and capital gain distributions are determined in accordance with income tax regulations, which may differ from GAAP.
(e) Federal income taxes: It is the policy of the fund to continue to qualify as a regulated investment company, if such qualification is in the best interests of its shareholders, by complying with the applicable provisions of the Code, and to make distributions of taxable income sufficient to relieve it from substantially all federal income and excise taxes.
As of and during the period ended December 31, 2013, the fund did not have any liabilities for any uncertain tax positions. The fund recognizes interest and penalties, if any, related to uncertain tax positions as income tax expense in the Statement of Operations. During the period ended December 31, 2013, the fund did not incur any interest or penalties.
Each tax year in the four-year period ended December 31, 2013 remains subject to examination by the Internal Revenue Service and state taxing authorities.
At December 31, 2013, the components of accumulated earnings on a tax basis were as follows: undistributed ordinary income $143,406, accumulated capital losses $83,616,510 and unrealized appreciation $90,039,287.
Under the Regulated Investment Company Modernization Act of 2010 (the “2010 Act”), the fund is permitted to carry forward capital losses incurred in taxable years beginning after December 22, 2010 (“post-enactment losses”) for an unlimited period. Furthermore, post-enactment capital loss carryovers retain their character as either short-term or long-term capital losses rather than short-term as they were
The Fund 27
NOTES TO FINANCIAL STATEMENTS (continued)
under previous statute.The 2010 Act requires post-enactment losses to be utilized before the utilization of losses incurred in taxable years prior to the effective date of the 2010 Act (“pre-enactment losses”).As a result of this ordering rule, pre-enactment losses may be more likely to expire unused.
The accumulated capital loss carryover is available for federal income tax purposes to be applied against future net realized capital gains, if any, realized subsequent to December 31, 2013. If not applied, the carryover expires in fiscal year 2017.
The tax character of distributions paid to shareholders during the fiscal periods ended December 31, 2013 and December 31, 2012 were as follows: ordinary income $2,832,694 and $4,365,913, respectively.
NOTE 2—Bank Lines of Credit:
The fund participates with other Dreyfus-managed funds in a $265 million unsecured credit facility led by Citibank, N.A. and a $300 million unsecured credit facility provided by The Bank of New York Mellon (each, a “Facility”), each to be utilized primarily for temporary or emergency purposes, including the financing of redemptions. Prior to October 9, 2013, the unsecured credit facility with Citibank, N.A. was $210 million. In connection therewith, the fund has agreed to pay its pro rata portion of commitment fees for each Facility. Interest is charged to the fund based on rates determined pursuant to the terms of the respective Facility at the time of borrowing. During the period ended December 31, 2013, the fund did not borrow under the Facilities.
NOTE 3—Management Fee and Other Transactions With Affiliates:
(a) Pursuant to a management agreement with the Manager, the management fee is computed at the annual rate of .75% of the value of the fund’s average daily net assets and is payable monthly.
The Manager has contractually agreed, from January 1, 2013 through May 1, 2014, to waive receipt of its fees and/or assume the direct expenses of the fund, so that the expenses of none of the classes
28
(excluding Rule 12b-1 Distribution Plan fees, Shareholder Services Plan fees, taxes, interest expense, brokerage commissions, commitment fees on borrowings and extraordinary expenses) exceed 1.00% of the value of the fund’s average daily net assets.The reduction in expenses, pursuant to the undertaking, amounted to $2,104 during the period ended December 31, 2013.
During the period ended December 31, 2013, the Distributor retained $6,906 from commissions earned on sales of the fund’s Class A shares and $40 from CDSCs on redemptions of the fund’s Class C shares.
(b) Under the Distribution Plan adopted pursuant to Rule 12b-1 under the Act, Class C shares pay the Distributor for distributing its shares at an annual rate of .75% of the value of its average daily net assets. During the period ended December 31, 2013, Class C shares were charged $34,576 pursuant to the Distribution Plan.
(c) Under the Shareholder Services Plan, Class A and Class C shares pay the Distributor at an annual rate of .25% of the value of their average daily net assets for the provision of certain services. The services provided may include personal services relating to shareholder accounts, such as answering shareholder inquiries regarding the fund and providing reports and other information, and services related to the maintenance of shareholder accounts. The Distributor may make payments to Service Agents (securities dealers, financial institutions or other industry professionals) with respect to these services. The Distributor determines the amounts to be paid to Service Agents. During the period ended December 31, 2013, Class A and Class C shares were charged $1,045,416 and $11,525, respectively, pursuant to the Shareholder Services Plan.
The fund has arrangements with the transfer agent and the custodian whereby the fund may receive earnings credits when positive cash balances are maintained, which are used to offset transfer agency and custody fees. For financial reporting purposes, the fund includes net earnings credits as an expense offset in the Statement of Operations.
The Fund 29
NOTES TO FINANCIAL STATEMENTS (continued)
The fund compensates Dreyfus Transfer, Inc., a wholly-owned subsidiary of the Manager, under a transfer agency agreement for providing transfer agency and cash management services for the fund. The majority of transfer agency fees are comprised of amounts paid on a per account basis, while cash management fees are related to fund subscriptions and redemptions. During the period ended December 31, 2013, the fund was charged $250,342 for transfer agency services and $14,855 for cash management services.These fees are included in Shareholder servicing costs in the Statement of Operations. Cash management fees were partially offset by earnings credits of $1,569.
The fund compensates The Bank of NewYork Mellon under a custody agreement for providing custodial services for the fund.These fees are determined based on net assets, geographic region and transaction activity. During the period ended December 31, 2013, the fund was charged $33,346 pursuant to the custody agreement.
The fund compensated The Bank of New York Mellon under a cash management agreement that was in effect until September 30, 2013 for performing certain cash management services related to fund subscriptions and redemptions. During the period ended December 31, 2013, the fund was charged $5,204 pursuant to the cash management agreement, which is included in Shareholder servicing costs in the Statement of Operations.These fees were partially offset by earnings credits of $7.
During the period ended December 31, 2013, the fund was charged $9,093 for services performed by the Chief Compliance Officer and his staff.
The components of “Due to The Dreyfus Corporation and affiliates” in the Statement of Assets and Liabilities consist of: management fees $291,865, Distribution Plan fees $2,853, Shareholder Services Plan fees $96,210, custodian fees $16,313, Chief Compliance Officer fees $2,299 and transfer agency fees $38,134, which are offset against an expense reimbursement currently in effect in the amount of $100.
30
(d) Each Board member also serves as a Board member of other funds within the Dreyfus complex. Annual retainer fees and attendance fees are allocated to each fund based on net assets.
NOTE 4—Securities Transactions:
The aggregate amount of purchases and sales of investment securities, excluding short-term securities, during the period ended December 31, 2013, amounted to $316,647,611 and $346,434,258, respectively.
At December 31, 2013, the cost of investments for federal income tax purposes was $389,631,346; accordingly, accumulated net unrealized appreciation on investments was $90,039,287, consisting of $96,113,688 gross unrealized appreciation and $6,074,401 gross unrealized depreciation.
NOTE 5—Pending Legal Matters:
The fund and many other entities have been named as defendants in numerous pending litigations as a result of their participation in the leveraged buyout transaction (“LBO”) of the Tribune Company (“Tribune”).The cases allege that Tribune took on billions of dollars of debt in the LBO to purchase its own stock from shareholders at $34 per share.The LBO was closed in a two-step transaction with shares being repurchased by Tribune in a tender offer in June 2007 and in a go-private merger in December 2007. In 2008, approximately one year after the LBO was concluded,Tribune filed for bankruptcy protection under Chapter 11. Thereafter, in approximately June 2011, certain Tribune creditors filed dozens of complaints in various courts throughout the country alleging that the payments made to shareholders in the LBO were “fraudulent conveyances” under state and/or federal law, and that the shareholders must return the payments they received for their shares to satisfy the plaintiffs’ unpaid claims.These cases have been consolidated for coordinated pre-trial proceedings in a multi-district litigation in the
The Fund 31
NOTES TO FINANCIAL STATEMENTS (continued)
United States District Court for the Southern District of New York titled In re Tribune Company Fraudulent Conveyance Litigation (S.D.N.Y. Nos. 11-md-2296 and 12-mc-2296 (RJS) (“Tribune MDL”)). On March 27, 2013, the Tribune MDL was reassigned from Judge William H. Pauley to Judge Richard J. Sullivan. No explanation was given for the reassignment.
In addition, there was a case pending in United States Bankruptcy Court for the District of Delaware brought by the Unsecured Creditors Committee of the Tribune Company that has since been transferred to the Tribune MDL (formerly The Official Committee of Unsecured Creditors of Tribune Co. v. FitzSimons, et al., Bankr. D. Del. Adv. Pro. No. 10-54010 (KJC)) (“FitzSimons case”).The case was originally filed on November 1, 2010. In a Fourth Amended Complaint filed in November 2012, among other claims, the Creditors Committee sought recovery under the Bankruptcy Code for alleged “fraudulent conveyances” from more than 5,000 Tribune shareholders (“Shareholder Defendants”), including the fund, and a defendants’ class of all shareholders who tendered their Tribune stock in the LBO and received cash in exchange.There were 35 other counts in the Fourth Amended Complaint that did not relate to claims against Shareholder Defendants, but instead were brought against parties directly involved in approval or execution of the leveraged buy-out. On January 10, 2013, pursuant to the Tribune bankruptcy plan, Mark S. Kirchner, as Litigation Trustee for the Tribune Litigation Trust, became the successor plaintiff to the Creditors Committee in this case. The case is now proceeding as: Mark S. Kirchner, as LitigationTrustee for the Tribune Litigation Trust v. FitzSimons, et al., S.D.N.Y. No. 12-cv-2652 (RJS). On August 1, 2013, the plaintiff filed a Fifth Amended Complaint with the Court.The Fifth Amended Complaint contains more detailed allegations regarding the steps Tribune took in consideration and execution of the LBO, but does not change the legal basis for the claim previously alleged against the Shareholder Defendants.
On November 6, 2012, a motion to dismiss was filed in the Tribune MDL. Oral argument on the motion to dismiss was held on May 23, 2013. On September 23, 2013, Judge Sullivan granted the motion to
32
dismiss on standing grounds, after rejecting defendants’ preemption arguments. By granting the motion, Judge Sullivan dismissed nearly 50 cases in the Tribune MDL, including all cases with Deutsche Bank Trust Company Americas or William A. Niese as the lead plaintiff.The fund was a defendant in at least one of the dismissed cases.The motion had no effect on the FitzSimons case, which had been stayed.
On September 30, 2013, plaintiffs appealed the motion to dismiss decision to the U.S. Court of Appeals for the Second Circuit. On October 28, 2013, certain defendants cross-appealed from Judge Sullivan’s decision, seeking review of the arguments that Judge Sullivan rejected in his decision. Briefing on the appeal and cross appeal is scheduled for completion in April 2014.
On November 11, 2013, Judge Sullivan entered Master Case Order No. 4 in the Tribune MDL. Master Case Order No. 4 addressed numerous procedural and administrative tasks for the cases that remain in the Tribune MDL, including the FitzSimons case. Under Master Case Order No. 4, the parties – through their executive committees and liaison counsel – are to attempt to negotiate a protocol for motions to dismiss and other procedural issues. If the parties are unable to come to agreement on some or all of these issues, they will submit their proposals to the Court and the Court will enter an order on how the FitzSimons case will proceed.
As of January 30, 2014, no answers to the Fifth Amended Complaint in the FitzSimons case may be filed at this time, and no briefing schedule for any further motions has been set.
At this stage in the proceedings, it is not possible to assess with any reasonable certainty the probable outcomes of the pending litigations. Consequently, at this time, management is unable to estimate the possible loss that may result.
The Fund 33
REPORT OF INDEPENDENT REGISTERED
PUBLIC ACCOUNTING FIRM
Shareholders and Board of Directors
Dreyfus Active MidCap Fund
We have audited the accompanying statement of assets and liabilities, including the statement of investments, of Dreyfus Active MidCap Fund (one of the series comprising Strategic Funds, Inc.) as of December 31, 2013, and the related statement of operations for the year then ended, the statement of changes in net assets for each of the two years in the period then ended, and the financial highlights for each of the five years in the period then ended.These financial statements and financial highlights are the responsibility of the Fund’s management. Our responsibility is to express an opinion on these financial statements and financial highlights based on our audits.
We conducted our audits in accordance with the standards of the Public Company Accounting Oversight Board (United States).Those standards require that we plan and perform the audit to obtain reasonable assurance about whether the financial statements and financial highlights are free of material misstatement.We were not engaged to perform an audit of the Fund’s internal control over financial reporting. Our audits included consideration of internal control over financial reporting as a basis for designing audit procedures that are appropriate in the circumstances, but not for the purpose of expressing an opinion on the effectiveness of the Fund’s internal control over financial reporting. Accordingly, we express no such opinion. An audit also includes examining, on a test basis, evidence supporting the amounts and disclosures in the financial statements and financial highlights, assessing the accounting principles used and significant estimates made by management, and evaluating the overall financial statement presentation. Our procedures included confirmation of securities owned as of December 31, 2013 by correspondence with the custodian and others. We believe that our audits provide a reasonable basis for our opinion.
In our opinion, the financial statements and financial highlights referred to above present fairly, in all material respects, the financial position of Dreyfus Active MidCap Fund at December 31, 2013, the results of its operations for the year then ended, the changes in its net assets for each of the two years in the period then ended, and the financial highlights for each of the five years in the period then ended, in conformity with U. S. generally accepted accounting principles.
New York, New York
February 27, 2014
34
IMPORTANT TAX INFORMATION (Unaudited)
In accordance with federal tax law, the fund hereby reports 100% of the ordinary dividends paid during the fiscal year ended December 31, 2013 as qualifying for the corporate dividends received deduction. For the fiscal year ended December 31, 2013, certain dividends paid by the fund may be subject to a maximum tax rate of 15%, as provided for by the Jobs and Growth Tax Relief Reconciliation Act of 2003. Of the distributions paid during the fiscal year, $2,832,694 represents the maximum amount that may be considered qualified dividend income. Shareholders will receive notification in early 2014 of the percentage applicable to the preparation of their 2013 income tax returns.
The Fund 35
INFORMATION ABOUT THE RENEWAL OF THE
FUND’S MANAGEMENT AGREEMENT (Unaudited)
At a meeting of the fund’s Board of Directors held on November 4-5, 2013, the Board considered the renewal of the fund’s Management Agreement pursuant to which Dreyfus provides the fund with investment advisory and administrative services (the “Agreement”). The Board members, none of whom are “interested persons” (as defined in the Investment Company Act of 1940, as amended) of the fund, were assisted in their review by independent legal counsel and met with counsel in executive session separate from Dreyfus representatives. In considering the renewal of the Agreement, the Board considered all factors that it believed to be relevant, including those discussed below. The Board did not identify any one factor as dispositive, and each Board member may have attributed different weights to the factors considered.
Analysis of Nature, Extent, and Quality of Services Provided to the Fund. The Board considered information provided to them at the meeting and in previous presentations from Dreyfus representatives regarding the nature, extent, and quality of the services provided to funds in the Dreyfus fund complex. Dreyfus provided the number of open accounts in the fund, the fund’s asset size and the allocation of fund assets among distribution channels. Dreyfus also had previously provided information regarding the diverse intermediary relationships and distribution channels of funds in the Dreyfus fund complex (such as retail direct or intermediary, in which intermediaries typically are paid by the fund and/or Dreyfus) and Dreyfus’ corresponding need for broad, deep, and diverse resources to be able to provide ongoing shareholder services to each intermediary or distribution channel, as applicable to the fund.
The Board also considered research support available to, and portfolio management capabilities of, the fund’s portfolio management personnel and that Dreyfus also provides oversight of day-to-day fund operations, including fund accounting and administration and assistance in meeting legal and regulatory requirements.The Board also considered Dreyfus’ extensive administrative, accounting, and compliance infrastructures. The Board also considered portfolio management’s brokerage policies
36
and practices (including policies and practices regarding soft dollars) and the standards applied in seeking best execution.
Comparative Analysis of the Fund’s Performance and Management Fee and Expense Ratio. The Board reviewed reports prepared by Lipper, Inc. (“Lipper”), an independent provider of investment company data, which included information comparing (1) the fund’s performance with the performance of a group of comparable funds (the “Performance Group”) and with a broader group of funds (the “Performance Universe”), all for various periods ended September 30, 2013 and (2) the fund’s actual and contractual management fees and total expenses with those of a group of comparable funds (the “Expense Group”) and with a broader group of funds (the “Expense Universe”), the information for which was derived in part from fund financial statements available to Lipper as of the date of its analysis. Dreyfus previously had furnished the Board with a description of the methodology Lipper used to select the Performance Group and Performance Universe and the Expense Group and Expense Universe.
Dreyfus representatives stated that the usefulness of performance comparisons may be affected by a number of factors, including different investment limitations that may be applicable to the fund and comparison funds. The Board discussed the results of the comparisons and noted that the fund’s total return performance was below the Performance Group median for all periods except for the one-year period when the fund’s performance was at the Performance Group median, and below the Performance Universe median for all periods except for the one- and two-year periods when the fund’s performance was above the Performance Universe median. Dreyfus also provided a comparison of the fund’s calendar year total returns to the returns of the fund’s benchmark index.
The Board also reviewed the range of actual and contractual management fees and total expenses of the Expense Group and Expense Universe funds and discussed the results of the comparisons.The Board
The Fund 37
INFORMATION ABOUT THE RENEWAL OF THE FUND’S
MANAGEMENT AGREEMENT (Unaudited) (continued)
noted that the fund’s contractual management fee was at the Expense Group median, the fund’s actual management fee was at the Expense Group median and slightly above the Expense Universe median and the fund’s total expenses were below the Expense Group and Expense Universe medians (lowest in the Expense Group).
Dreyfus representatives noted that Dreyfus has contractually agreed to waive receipt of its fees and/or assume the expenses of the fund, until May 1, 2014, so that annual direct fund operating expenses (excluding Rule 12b-1 fees, shareholder services fees, taxes, interest, brokerage commissions, commitment fees on borrowings, acquired fund fees and extraordinary expenses) do not exceed 1.00% of the fund’s average daily net assets.
Dreyfus representatives reviewed with the Board the management or investment advisory fees (1) paid by funds advised or administered by Dreyfus that are in the same Lipper category as the fund and (2) paid to Dreyfus or the Dreyfus-affiliated primary employer of the fund’s primary portfolio manager(s) for advising any separate accounts and/or other types of client portfolios that are considered to have similar investment strategies and policies as the fund (the “Similar Clients”), and explained the nature of the Similar Clients. They discussed differences in fees paid and the relationship of the fees paid in light of any differences in the services provided and other relevant factors.The Board considered the relevance of the fee information provided for the Similar Clients to evaluate the appropriateness and reasonableness of the fund’s management fee.
Analysis of Profitability and Economies of Scale. Dreyfus representatives reviewed the expenses allocated and profit received by Dreyfus and the resulting profitability percentage for managing the fund and the aggregate profitability percentage to Dreyfus of managing the funds in the Dreyfus fund complex, and the method used to determine the expenses and profit. The Board concluded that the profitability results were not unreasonable, given the services rendered and service levels provided by Dreyfus. The Board also had been provided with
38
information prepared by an independent consulting firm regarding Dreyfus’ approach to allocating costs to, and determining the profitability of, individual funds and the entire Dreyfus fund complex.The consulting firm also had analyzed where any economies of scale might emerge in connection with the management of a fund.
The Board considered on the advice of its counsel the profitability analysis (1) as part of its evaluation of whether the fees under the Agreement bear a reasonable relationship to the mix of services provided by Dreyfus, including the nature, extent and quality of such services, and (2) in light of the relevant circumstances for the fund and the extent to which economies of scale would be realized if the fund grows and whether fee levels reflect these economies of scale for the benefit of fund shareholders. Dreyfus representatives also noted that, as a result of shared and allocated costs among funds in the Dreyfus fund complex, the extent of economies of scale could depend substantially on the level of assets in the complex as a whole, so that increases and decreases in complex-wide assets can affect potential economies of scale in a manner that is disproportionate to, or even in the opposite direction from, changes in the fund’s asset level.The Board also considered potential benefits to Dreyfus from acting as investment adviser and noted that there were no soft dollar arrangements in effect for trading the fund’s investments.
At the conclusion of these discussions, the Board agreed that it had been furnished with sufficient information to make an informed business decision with respect to the renewal of the Agreement. Based on the discussions and considerations as described above, the Board concluded and determined as follows.
• The Board concluded that the nature, extent and quality of the services provided by Dreyfus are adequate and appropriate.
• The Board generally was satisfied with the fund’s improved performance in recent periods.
• The Board concluded that the fee paid to Dreyfus was reasonable in light of the considerations described above.
The Fund 39
INFORMATION ABOUT THE RENEWAL OF THE FUND’S
MANAGEMENT AGREEMENT (Unaudited) (continued)
• The Board determined that the economies of scale which may accrue to Dreyfus and its affiliates in connection with the management of the fund had been adequately considered by Dreyfus in connection with the fee rate charged to the fund pursuant to the Agreement and that, to the extent in the future it were determined that material economies of scale had not been shared with the fund, the Board would seek to have those economies of scale shared with the fund.
In evaluating the Agreement, the Board considered these conclusions and determinations and also relied on its previous knowledge, gained through meetings and other interactions with Dreyfus and its affiliates, of the fund and the services provided to the fund by Dreyfus. The Board also relied on information received on a routine and regular basis throughout the year relating to the operations of the fund and the investment management and other services provided under the Agreement, including information on the investment performance of the fund in comparison to similar mutual funds and benchmark performance indices; general market outlook as applicable to the fund; and compliance reports. In addition, the Board’s consideration of the contractual fee arrangements for this fund had the benefit of a number of years of reviews of prior or similar agreements during which lengthy discussions took place between the Board and Dreyfus representatives. Certain aspects of the arrangements may receive greater scrutiny in some years than in others, and the Board’s conclusions may be based, in part, on their consideration of the same or similar arrangements in prior years. The Board determined that renewal of the Agreement was in the best interests of the fund and its shareholders.
40
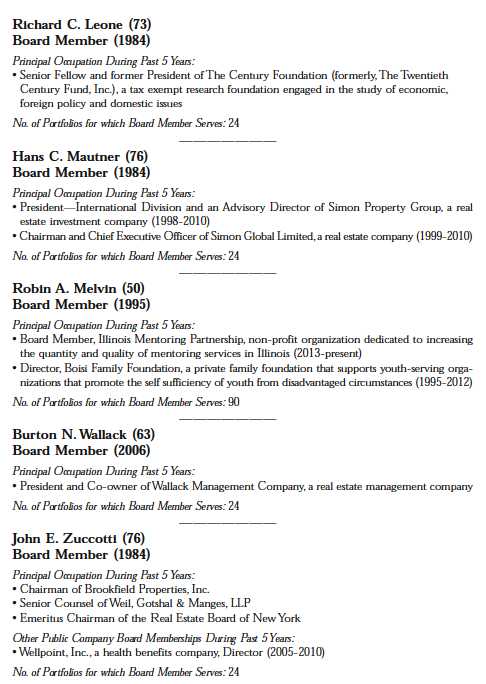
BOARD MEMBERS INFORMATION (Unaudited)
INDEPENDENT BOARD MEMBERS

The Fund 41
BOARD MEMBERS INFORMATION (Unaudited) (continued)
INDEPENDENT BOARD MEMBERS
42
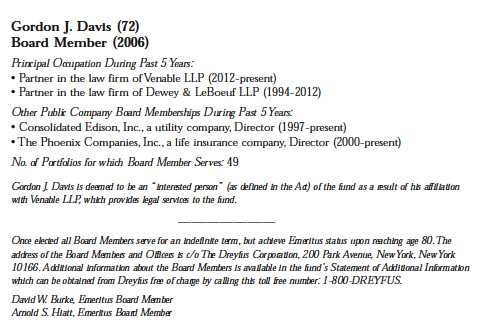
INTERESTED BOARD MEMBER
The Fund 43
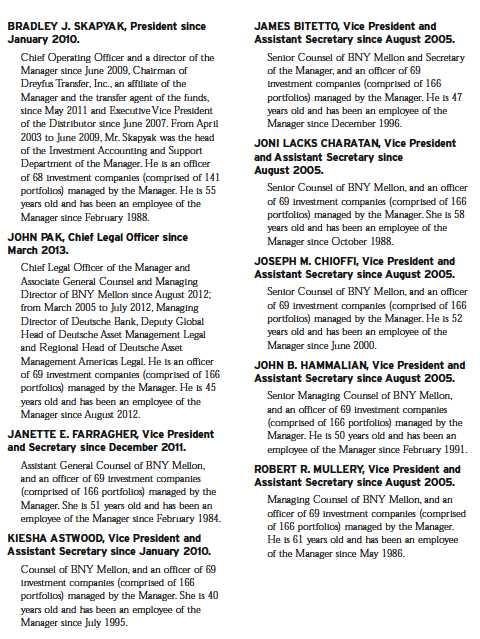
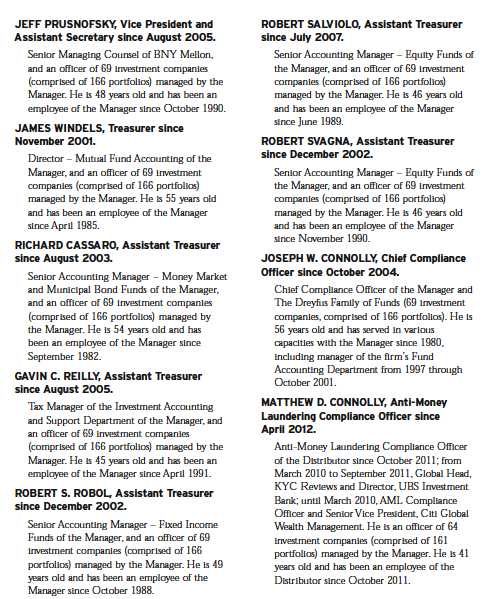
OFFICERS OF THE FUND (Unaudited)
44
The Fund 45
Item 2. Code of Ethics.
The Registrant has adopted a code of ethics that applies to the Registrant's principal executive officer, principal financial officer, principal accounting officer or controller, or persons performing similar functions. There have been no amendments to, or waivers in connection with, the Code of Ethics during the period covered by this Report.
Item 3. Audit Committee Financial Expert.
The Registrant's Board has determined that Ehud Houminer, a member of the Audit Committee of the Board, is an audit committee financial expert as defined by the Securities and Exchange Commission (the "SEC"). Ehud Houminer is "independent" as defined by the SEC for purposes of audit committee financial expert determinations.
Item 4. Principal Accountant Fees and Services.
(a) Audit Fees. The aggregate fees billed for each of the last two fiscal years (the "Reporting Periods") for professional services rendered by the Registrant's principal accountant (the "Auditor") for the audit of the Registrant's annual financial statements or services that are normally provided by the Auditor in connection with the statutory and regulatory filings or engagements for the Reporting Periods, were $30,857 in 2012 and $31,594 in 2013.
(b) Audit-Related Fees. The aggregate fees billed in the Reporting Periods for assurance and related services by the Auditor that are reasonably related to the performance of the audit of the Registrant's financial statements and are not reported under paragraph (a) of this Item 4 were $6,000 in 2012 and $6,000 in 2013. These services consisted of one or more of the following: (i) agreed upon procedures related to compliance with Internal Revenue Code section 817(h), (ii) security counts required by Rule 17f-2 under the Investment Company Act of 1940, as amended, (iii) advisory services as to the accounting or disclosure treatment of Registrant transactions or events and (iv) advisory services to the accounting or disclosure treatment of the actual or potential impact to the Registrant of final or proposed rules, standards or interpretations by the Securities and Exchange Commission, the Financial Accounting Standards Boards or other regulatory or standard-setting bodies.
The aggregate fees billed in the Reporting Periods for non-audit assurance and related services by the Auditor to the Registrant's investment adviser (not including any sub-investment adviser whose role is primarily portfolio management and is subcontracted with or overseen by another investment adviser), and any entity controlling, controlled by or under common control with the investment adviser that provides ongoing services to the Registrant ("Service Affiliates"), that were reasonably related to the performance of the annual audit of the Service Affiliate, which required pre-approval by the Audit Committee were $0 in 2012 and $0 in 2013.
(c) Tax Fees. The aggregate fees billed in the Reporting Periods for professional services rendered by the Auditor for tax compliance, tax advice, and tax planning ("Tax Services") were $3,334 in 2012 and $3,841 in 2013. These services consisted of: (i) review or preparation of U.S. federal, state, local and excise tax returns; (ii) U.S. federal, state and local tax planning, advice and assistance regarding statutory, regulatory or administrative developments; (iii) tax advice regarding tax qualification matters and/or treatment of various financial instruments held or proposed to be acquired or held, and (iv) determination of Passive Foreign Investment Companies. The aggregate fees billed in the Reporting Periods for Tax Services by the Auditor to Service Affiliates, which required pre-approval by the Audit Committee were $0 in 2012 and $0 in 2013.
(d) All Other Fees. The aggregate fees billed in the Reporting Periods for products and services provided by the Auditor, other than the services reported in paragraphs (a) through (c) of this Item, were $1,802 in 2012 and $1,753 in 2013. [These services consisted of a review of the Registrant's anti-money laundering program].
The aggregate fees billed in the Reporting Periods for Non-Audit Services by the Auditor to Service Affiliates, other than the services reported in paragraphs (b) through (c) of this Item, which required pre-approval by the Audit Committee, were $200,000 in 2012 and $0 in 2013.
(e)(1) Audit Committee Pre-Approval Policies and Procedures. The Registrant's Audit Committee has established policies and procedures (the "Policy") for pre-approval (within specified fee limits) of the Auditor's engagements for non-audit services to the Registrant and Service Affiliates without specific case-by-case consideration. The pre-approved services in the Policy can include pre-approved audit services, pre-approved audit-related services, pre-approved tax services and pre-approved all other services. Pre-approval considerations include whether the proposed services are compatible with maintaining the Auditor's independence. Pre-approvals pursuant to the Policy are considered annually.
(e)(2) Note: None of the services described in paragraphs (b) through (d) of this Item 4 were approved by the Audit Committee pursuant to paragraph (c)(7)(i)(C) of Rule 2-01 of Regulation S-X.
(f) None of the hours expended on the principal accountant's engagement to audit the registrant's financial statements for the most recent fiscal year were attributed to work performed by persons other than the principal account's full-time, permanent employees.
Non-Audit Fees. The aggregate non-audit fees billed by the Auditor for services rendered to the Registrant, and rendered to Service Affiliates, for the Reporting Periods were $49,204,697 in 2012 and $50,384,343 in 2013.
Auditor Independence. The Registrant's Audit Committee has considered whether the provision of non-audit services that were rendered to Service Affiliates, which were not pre-approved (not requiring pre-approval), is compatible with maintaining the Auditor's independence.
Item 5. Audit Committee of Listed Registrants.
Not applicable. [CLOSED-END FUNDS ONLY]
Item 6. Investments.
(a) Not applicable.
Item 7. Disclosure of Proxy Voting Policies and Procedures for Closed-End Management Investment Companies.
Not applicable. [CLOSED-END FUNDS ONLY]
Item 8. Portfolio Managers of Closed-End Management Investment Companies.
Not applicable. [CLOSED-END FUNDS ONLY, beginning with reports for periods ended on and after December 31, 2005]
Item 9. Purchases of Equity Securities by Closed-End Management Investment Companies and Affiliated Purchasers.
Not applicable. [CLOSED-END FUNDS ONLY]
Item 10. Submission of Matters to a Vote of Security Holders.
There have been no material changes to the procedures applicable to Item 10.
Item 11. Controls and Procedures.
(a) The Registrant's principal executive and principal financial officers have concluded, based on their evaluation of the Registrant's disclosure controls and procedures as of a date within 90 days of the filing date of this report, that the Registrant's disclosure controls and procedures are reasonably designed to ensure that information required to be disclosed by the Registrant on Form N-CSR is recorded, processed, summarized and reported within the required time periods and that information required to be disclosed by the Registrant in the reports that it files or submits on Form N-CSR is accumulated and communicated to the Registrant's management, including its principal executive and principal financial officers, as appropriate to allow timely decisions regarding required disclosure.
(b) There were no changes to the Registrant's internal control over financial reporting that occurred during the second fiscal quarter of the period covered by this report that have materially affected, or are reasonably likely to materially affect, the Registrant's internal control over financial reporting.
Item 12. Exhibits.
(a)(1) Code of ethics referred to in Item 2.
(a)(2) Certifications of principal executive and principal financial officers as required by Rule 30a-2(a) under the Investment Company Act of 1940.
(a)(3) Not applicable.
(b) Certification of principal executive and principal financial officers as required by Rule 30a-2(b) under the Investment Company Act of 1940.
SIGNATURES
Pursuant to the requirements of the Securities Exchange Act of 1934 and the Investment Company Act of 1940, the Registrant has duly caused this Report to be signed on its behalf by the undersigned, thereunto duly authorized.
STRATEGIC FUNDS, INC
By: /s/ Bradley J. Skapyak |
Bradley J. Skapyak President |
Date: | February 21, 2014 |
|
Pursuant to the requirements of the Securities Exchange Act of 1934 and the Investment Company Act of 1940, this Report has been signed below by the following persons on behalf of the Registrant and in the capacities and on the dates indicated. |
|
By: /s/ Bradley J. Skapyak |
Bradley J. Skapyak President |
Date: | February 21, 2014 |
|
By: /s/ James Windels |
James Windels Treasurer |
Date: | February 21, 2014 |
|
EXHIBIT INDEX
(a)(1) Code of ethics referred to in Item 2.
(a)(2) Certifications of principal executive and principal financial officers as required by Rule 30a-2(a) under the Investment Company Act of 1940. (EX-99.CERT)
(b) Certification of principal executive and principal financial officers as required by Rule 30a-2(b) under the Investment Company Act of 1940. (EX-99.906CERT)