UNITED STATES
SECURITIES AND EXCHANGE COMMISSION
Washington, D.C. 20549
FORM N-CSR
CERTIFIED SHAREHOLDER REPORT OF REGISTERED MANAGEMENT
INVESTMENT COMPANIES
Investment Company Act file number | 811-3940 | |||||
|
| |||||
| Strategic Funds, Inc. |
| ||||
| (Exact name of Registrant as specified in charter) |
| ||||
|
|
| ||||
|
c/o The Dreyfus Corporation 200 Park Avenue New York, New York 10166 |
| ||||
| (Address of principal executive offices) (Zip code) |
| ||||
|
|
| ||||
| Janette E. Farragher, Esq. 200 Park Avenue New York, New York 10166 |
| ||||
| (Name and address of agent for service) |
| ||||
| ||||||
Registrant's telephone number, including area code: | (212) 922-6000 | |||||
|
| |||||
Date of fiscal year end:
| 11/30 |
| ||||
Date of reporting period: | 11/30/11 |
| ||||
The following N-CSR relates only to the Registrant’s series listed below and does not affect the other series of the Registrant, which have different fiscal year ends and, therefore, different N-CSR reporting requirements. Separate N-CSR Forms will be filed for these series, as appropriate.
Dreyfus Select Managers Small Cap Value Fund
Dreyfus U.S. Equity Fund
Global Stock Fund
International Stock Fund
| Dreyfus |
| Select Managers |
| Small Cap Value Fund |
ANNUAL REPORT November 30, 2011
Save time. Save paper. View your next shareholder report online as soon as it’s available. Log into www.dreyfus.com and sign up for Dreyfus eCommunications. It’s simple and only takes a few minutes.
The views expressed in this report reflect those of the portfolio manager only through the end of the period covered and do not necessarily represent the views of Dreyfus or any other person in the Dreyfus organization. Any such views are subject to change at any time based upon market or other conditions and Dreyfus disclaims any responsibility to update such views.These views may not be relied on as investment advice and, because investment decisions for a Dreyfus fund are based on numerous factors, may not be relied on as an indication of trading intent on behalf of any Dreyfus fund.
Contents | |
THE FUND | |
| 2 | A Letter from the Chairman and CEO |
| 3 | Discussion of Fund Performance |
| 6 | Fund Performance |
| 8 | Understanding Your Fund’s Expenses |
| 8 | Comparing Your Fund’s Expenses With Those of Other Funds |
| 9 | Statement of Investments |
| 20 | Statement of Assets and Liabilities |
| 21 | Statement of Operations |
| 22 | Statement of Changes in Net Assets |
| 24 | Financial Highlights |
| 27 | Notes to Financial Statements |
| 37 | Report of Independent Registered Public Accounting Firm |
| 38 | Important Tax Information |
| 39 | Information About the Renewal of the Fund’s Management, Portfolio Allocation Management and Sub-Invesment Advisory Agreements |
| 47 | Board Members Information |
| 50 | Officers of the Fund |
FOR MORE INFORMATION | |
Back Cover |
| Dreyfus |
| Select Managers |
| Small Cap Value Fund |
The Fund

A LETTER FROM THE CHAIRMAN AND CEO
Dear Shareholder:
We are pleased to present this annual report for Dreyfus Select Managers Small CapValue Fund, covering the 12-month period from December 1, 2010, through November 30, 2011. For information about how the fund performed during the reporting period, as well as general market perspectives, we provide a Discussion of Fund Performance on the pages that follow.
Equity markets proved volatile during much of 2011 as investors struggled with persistently sluggish U.S. and global economic growth. An escalating sovereign debt crisis in Europe, monetary tightening in China and India and a contentious debate regarding taxes, spending and borrowing in the United States sparked a flight to quality in which equity investors flocked to relatively safe havens, such as mega-cap multinational companies. In contrast, small- and mid-cap stocks also advanced, but to a lesser degree.
The economic outlook currently remains clouded by uncertainty regarding the ability of European policymakers to contain the region’s debt crisis. However, conditions in the United States seem to be improving as inflationary pressures have receded, consumer confidence has strengthened and the unemployment rate has declined.To assess the potential impact of these and other developments on your long-term investment targets, we encourage you, as always, to speak with your financial advisor.
Thank you for your continued confidence and support.
Jonathan R. Baum
Chairman and Chief Executive Officer
The Dreyfus Corporation
December 15, 2011
2

DISCUSSION OF FUND PERFORMANCE
For the period from December 1, 2010, through November 30, 2011, as provided by Keith L. Stransky and Robert B. Mayerick, Portfolio Allocation Managers, EACM Advisors LLC
Fund and Market Performance Overview
For the 12-month period ended November 30, 2011, Dreyfus Select Managers Small CapValue Fund’s Class A shares produced a total return of 0.62%, Class C shares returned –0.03% and Class I shares returned 1.04%.1 In comparison, the total return of the Russell 2000Value Index (the “Index”), the fund’s benchmark, was 0.77% for the same period.2
Stocks rallied through the first quarter of 2011 amid expectations of economic recovery, but macroeconomic disappointments later erased most of those gains. Small-cap value stocks were hit particularly hard during the market downturn. The fund produced returns that were roughly in line with its benchmark.
The Fund’s Investment Approach
The fund seeks capital appreciation.To pursue its goal, the fund normally invests at least 80% of its net assets in the stocks of small-cap companies. The fund uses a “multi-manager” approach by selecting one or more sub-advisers to manage its assets. As the fund’s portfolio allocation managers, we seek sub-advisers that complement one another’s style of investing, consistent with the fund’s investment goal. We monitor and evaluate the performance of the sub-advisers and will make recommendations to Dreyfus and the fund’s Board based on our evaluations.
The fund’s assets are currently under the day-to-day management of five sub-advisers, each acting independently of one another and using its own methodology to select portfolio investments. As of the end of the reporting period, 22% of the fund’s assets are under the management of Thompson, Siegel and Walmsley, LLC, which employs a combination of quantitative and qualitative security selection methods based on a four-factor valuation model.Approximately 25% of the fund’s assets are under the management of Walthausen & Co., LLC, which uses a proprietary valuation model to identify companies that are trading at a discount to
The Fund 3
DISCUSSION OF FUND PERFORMANCE (continued)
their intrinsic values. Approximately 17% of the fund’s assets are under the management of Neuberger Berman Management LLC, which uses fundamental analysis and a bottom-up stock selection process to identify publicly traded small-cap companies selling at a material discount to their intrinsic value. Approximately 30% of the fund’s assets are under the management of Lombardia Capital Partners, which uses fundamental analysis and a bottom-up value-oriented approach in seeking stocks trading below their intrinsic values. Finally, 7% of the fund’s assets are under the management of Iridian Asset Management LLC, which employs bottom-up stock selection and a disciplined valuation process to identify and invest in corporate change. These percentages can change over time, within ranges described in the prospectus.
Shifting Sentiment Sparked Volatility
Upturns in economic data and corporate earnings supported stocks into the first quarter of 2011. The market rally was interrupted in February, when political unrest in the Middle East led to sharply rising energy prices, and in March, when natural disasters in Japan threatened the global industrial supply chain. Still, equities generally recovered quickly from these unexpected shocks.
Investor sentiment began to deteriorate in earnest in late April, when Greece and other European countries struggled with a resurgent debt crisis. Investors also worried when a contentious political debate over U.S. government spending and borrowing intensified. Stocks suffered bouts of heightened volatility as investors shifted their focus to traditionally defensive investments, such as blue-chip stocks and U.S. Treasury securities. Although volatility was particularly severe in August and September, better economic data in October sparked a renewed rally, helping the benchmark produce a modestly positive return for the reporting period overall.
Small-Cap Value Stocks Fell Out of Favor
In this challenging climate, value-oriented small-cap stocks generally fell out of favor with investors, who preferred large companies with strong current earnings seemingly without regard to valuations.
Nonetheless, the fund identified strong performers in the financials sector, where subprime loan servicer Ocwen Financial advanced after
4
introducing a new loan modification program for distressed homeowners, and consumer finance company World Acceptance encountered strong demand for short-term, nonbank loans. In the energy sector, service providers Brigham Exploration and Global Industries were acquired at premiums to their then-prevailing stock prices.
The fund produced more disappointing results in the information technology sector, as solar equipment maker Power-One was hurt by expectations of lower capital spending throughout its industry. E-commerce solutions provider Digital River was hindered by lower consumer spending in the sluggish economy. Overweighted exposure to technology companies also dampened the fund’s relative performance.
At the end of July, Riverbridge Partners LLC was terminated as a sub-adviser, and assets under Riverbridge’s day-to-day management were allocated to Iridian Asset Management LLC.
Valuations at Historically Attractive Levels
We ended the reporting period with a cautiously optimistic outlook for 2012. Although economic uncertainty persists, we see attractive valuations of companies that we believe are fundamentally sound and potentially poised to advance if investor sentiment normalizes.
December 15, 2011
| Please note, the position in any security highlighted with italicized typeface was sold during the | |
| reporting period. | |
| Equity funds are subject generally to market, market sector, market liquidity, issuer and investment | |
| style risks, among other factors, to varying degrees, all of which are more fully described in the | |
| fund’s prospectus. | |
| The prices of small company stocks tend to be more volatile than the prices of large company | |
| stocks, mainly because these companies have less established and more volatile earnings histories. | |
| They also tend to be less liquid than larger company stocks. | |
| 1 | Total return includes reinvestment of dividends and any capital gains paid, and does not take into |
| consideration the maximum initial sales charge in the case of Class A shares, or the applicable | |
| contingent deferred sales charge imposed on redemptions in the case of Class C shares. Had these | |
| charges been reflected, returns would have been lower. Past performance is no guarantee of future | |
| results. Share price and investment return fluctuate such that upon redemption, fund shares may be | |
| worth more or less than their original cost. | |
| 2 | SOURCE: LIPPER INC. — Reflects the reinvestment of dividends and, where applicable, |
| capital gain distributions.The Russell 2000 Value Index is an unmanaged index, which measures | |
| the performance of those Russell 2000 companies with lower price-to-book ratios and lower | |
| forecasted growth values. Investors cannot invest directly in any index. |
The Fund 5
FUND PERFORMANCE
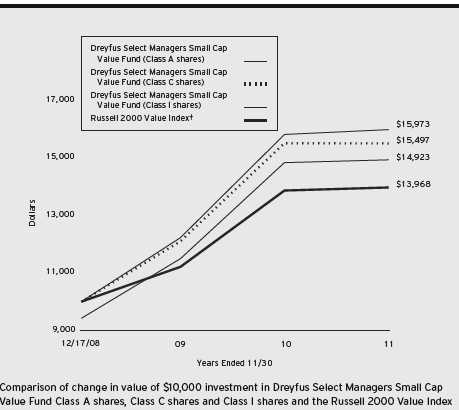
† Source: Lipper Inc.
Past performance is not predictive of future performance.
The above graph compares a $10,000 investment made in each of the Class A, Class C and Class I shares of Dreyfus Select Managers Small Cap Value Fund on 12/17/08 (inception date) to a $10,000 investment made in the Russell 2000 Value Index (the “Index”) on that date. For comparative purposes, the value of the Index on 12/31/08 is used as the beginning value on 12/17/08.All dividends and capital gain distributions are reinvested.
The fund’s performance shown in the line graph above takes into account the maximum initial sales charge on Class A shares and all other applicable fees and expenses on all classes.The Index is an unmanaged index, which measures the performance of those Russell 2000 companies with lower price-to-book ratios and lower forecasted growth values. Unlike a mutual fund, the Index is not subject to charges, fees and other expenses. Investors cannot invest directly in any index. These factors can contribute to the Index potentially outperforming the fund. Further information relating to fund performance, including expense reimbursements, if applicable, is contained in the Financial Highlights section of the prospectus and elsewhere in this report.
6
| Average Annual Total Returns as of 11/30/11 | |||||
| Inception | From | ||||
| Date | 1 | Year | Inception | ||
| Class A shares | |||||
| with maximum sales charge (5.75%) | 12/17/08 | –5.18 | % | 14.53 | % |
| without sales charge | 12/17/08 | 0.62 | % | 16.85 | % |
| Class C shares | |||||
| with applicable redemption charge † | 12/17/08 | –0.97 | % | 16.01 | % |
| without redemption | 12/17/08 | -0.03 | % | 16.01 | % |
| Class I shares | 12/17/08 | 1.04 | % | 17.21 | % |
| Russell 2000 Value Index | 12/31/08 | 0.77 | % | 12.14 | %†† |
Past performance is not predictive of future performance.The fund’s performance shown in the graph and table does not reflect the deduction of taxes that a shareholder would pay on fund distributions or the redemption of fund shares.
| † | The maximum contingent deferred sales charge for Class C shares is 1% for shares redeemed within one year of the |
| date of purchase. | |
| †† | For comparative purposes, the value of the Index as of 12/31/08 is used as the beginning value on 12/17/08. |
The Fund 7
UNDERSTANDING YOUR FUND’S EXPENSES (Unaudited)
As a mutual fund investor, you pay ongoing expenses, such as management fees and other expenses. Using the information below, you can estimate how these expenses affect your investment and compare them with the expenses of other funds.You also may pay one-time transaction expenses, including sales charges (loads) and redemption fees, which are not shown in this section and would have resulted in higher total expenses. For more information, see your fund’s prospectus or talk to your financial adviser.
Review your fund’s expenses
The table below shows the expenses you would have paid on a $1,000 investment in Dreyfus Select Managers Small CapValue Fund from June 1, 2011 to November 30, 2011. It also shows how much a $1,000 investment would be worth at the close of the period, assuming actual returns and expenses.
Expenses and Value of a $1,000 Investment
assuming actual returns for the six months ended November 30, 2011
| Class A | Class C | Class I | ||||
| Expenses paid per $1,000† | $ | 6.51 | $ | 9.87 | $ | 4.64 |
| Ending value (after expenses) | $ | 868.30 | $ | 865.70 | $ | 870.10 |
COMPARING YOUR FUND’S EXPENSES
WITH THOSE OF OTHER FUNDS (Unaudited)
Using the SEC’s method to compare expenses
The Securities and Exchange Commission (SEC) has established guidelines to help investors assess fund expenses. Per these guidelines, the table below shows your fund’s expenses based on a $1,000 investment, assuming a hypothetical 5% annualized return. You can use this information to compare the ongoing expenses (but not transaction expenses or total cost) of investing in the fund with those of other funds.All mutual fund shareholder reports will provide this information to help you make this comparison. Please note that you cannot use this information to estimate your actual ending account balance and expenses paid during the period.
Expenses and Value of a $1,000 Investment
assuming a hypothetical 5% annualized return for the six months ended November 30, 2011
| Class A | Class C | Class I | ||||
| Expenses paid per $1,000† | $ | 7.03 | $ | 10.66 | $ | 5.01 |
| Ending value (after expenses) | $ | 1,018.10 | $ | 1,014.49 | $ | 1,020.10 |
| † Expenses are equal to the fund’s annualized expense ratio of 1.39% for Class A, 2.11% for Class C and .99% |
| for Class I, multiplied by the average account value over the period, multiplied by 183/365 (to reflect the one-half |
| year period). |
8
STATEMENT OF INVESTMENTS
November 30, 2011
| Common Stocks—97.7% | Shares | Value ($) | |
| Consumer Discretionary—14.8% | |||
| American Eagle Outfitters | 22,340 | 310,749 | |
| Amerigon | 35,300 | a | 553,504 |
| Asbury Automotive Group | 40,500 | a | 798,660 |
| Ascena Retail Group | 64,336 | a | 1,770,527 |
| Avery Dennison | 38,000 | 995,980 | |
| Barrett Business Services | 52,173 | 996,504 | |
| Bebe Stores | 38,960 | 286,746 | |
| Brown Shoe | 27,430 | 230,138 | |
| Cabela’s | 37,530 | a | 884,582 |
| Carter’s | 46,400 | a | 1,845,328 |
| Chico’s FAS | 73,860 | 768,144 | |
| Coinstar | 25,000 | a,b | 1,067,250 |
| Collective Brands | 19,350 | a | 269,932 |
| Convergys | 53,700 | a | 693,804 |
| Cracker Barrel Old Country Store | 33,938 | 1,614,091 | |
| CSS Industries | 44,100 | 937,125 | |
| Drew Industries | 24,160 | 524,272 | |
| Ennis | 40,806 | 605,969 | |
| FTI Consulting | 37,405 | a | 1,604,300 |
| G-III Apparel Group | 17,600 | a | 324,368 |
| H&E Equipment Services | 19,980 | a | 253,946 |
| Helen of Troy | 36,400 | a | 1,087,268 |
| Interval Leisure Group | 52,720 | a | 738,607 |
| JOS. A. Bank Clothiers | 17,165 | a | 845,891 |
| Kirkland’s | 28,650 | a | 357,265 |
| Korn/Ferry International | 94,237 | a | 1,586,009 |
| Krispy Kreme Doughnuts | 33,520 | a | 252,070 |
| Lifetime Brands | 46,015 | 548,499 | |
| Meredith | 55,268 | b | 1,602,772 |
| Nu Skin Enterprises, Cl. A | 16,190 | 772,911 | |
| OfficeMax | 165,900 | a | 771,435 |
| Pantry | 41,050 | a | 507,788 |
| PEP Boys-Manny Moe & Jack | 276,375 | 3,139,620 | |
| Pier 1 Imports | 68,500 | a | 930,915 |
| Quiksilver | 133,800 | a | 413,442 |
| RadioShack | 64,900 | b | 745,052 |
The Fund 9
STATEMENT OF INVESTMENTS (continued)
| Common Stocks (continued) | Shares | Value ($) | |
| Consumer Discretionary (continued) | |||
| Rent-A-Center | 129,826 | 4,667,245 | |
| Ruby Tuesday | 31,420 | a | 230,309 |
| Ruth’s Hospitality Group | 67,341 | a | 334,011 |
| Sally Beauty Holdings | 68,220 | a | 1,371,222 |
| Select Comfort | 38,600 | a | 715,258 |
| Shuffle Master | 100,500 | a | 1,114,545 |
| Shutterfly | 9,000 | a | 243,720 |
| Skechers USA, Cl. A | 16,170 | a | 217,648 |
| Talbots | 68,200 | a | 135,718 |
| Titan International | 9,450 | b | 203,553 |
| Universal Technical Institute | 69,330 | a | 886,037 |
| Valassis Communications | 34,800 | a,b | 668,508 |
| Visteon | 4,090 | a | 228,836 |
| Wabash National | 61,549 | a | 451,770 |
| Wendy’s | 143,500 | 711,760 | |
| Wet Seal, Cl. A | 55,730 | a | 192,269 |
| 44,007,872 | |||
| Consumer Staples—1.6% | |||
| Andersons | 30,000 | 1,328,700 | |
| Constellation Brands, Cl. A | 50,000 | a | 973,500 |
| Flowers Foods | 63,570 | 1,256,779 | |
| Nash Finch | 41,931 | 1,163,585 | |
| Overhill Farms | 41,025 | a | 163,279 |
| 4,885,843 | |||
| Energy—5.5% | |||
| Atmos Energy | 37,128 | 1,270,149 | |
| Basic Energy Services | 21,100 | a | 397,524 |
| Berry Petroleum, Cl. A | 33,894 | 1,487,269 | |
| Cal Dive International | 193,100 | a | 455,716 |
| Callon Petroleum | 120,698 | a | 648,148 |
| Covanta Holding | 53,000 | 791,290 | |
| CVR Energy | 34,800 | a | 633,360 |
| Energy XXI | 23,000 | a | 723,120 |
| Georesources | 36,320 | a | 1,035,483 |
| Gulfport Energy | 47,530 | a | 1,509,077 |
| ION Geophysical | 93,200 | a | 541,492 |
| McDermott International | 23,800 | a | 269,178 |
10
| Common Stocks (continued) | Shares | Value ($) | |
| Energy (continued) | |||
| Newpark Resources | 108,800 | a | 974,848 |
| Northern Oil and Gas | 59,690 | a,b | 1,461,808 |
| Ormat Technologies | 43,000 | b | 816,140 |
| Parker Drilling | 78,788 | a | 548,364 |
| PetroQuest Energy | 34,880 | a | 239,626 |
| Stone Energy | 10,160 | a | 287,426 |
| Tetra Technologies | 102,900 | a | 944,622 |
| TransGlobe Energy | 50,700 | a | 413,205 |
| USEC | 125,600 | a | 177,096 |
| Venoco | 55,500 | a | 517,260 |
| Warren Resources | 128,089 | a | 365,054 |
| 16,507,255 | |||
| Exchange Traded Funds—1.0% | |||
| iShares Russell 2000 Index Fund | 38,215 | b | 2,817,592 |
| Financial—26.4% | |||
| Alterra Capital Holdings | 36,200 | 830,790 | |
| Altisource Portfolio Solutions | 37,233 | a | 1,772,663 |
| American Equity | |||
| Investment Life Holding | 175,196 | 1,937,668 | |
| Ares Capital | 95,693 | 1,488,983 | |
| Aspen Insurance Holdings | 12,080 | 320,362 | |
| Asta Funding | 60,630 | 502,623 | |
| Astoria Financial | 56,000 | 422,240 | |
| BancorpSouth | 35,972 | b | 352,526 |
| Bank of Hawaii | 37,825 | 1,609,454 | |
| BankUnited | 1,700 | 36,873 | |
| Brandywine Realty Trust | 50,300 | c | 438,113 |
| Brookline Bancorp | 34,350 | 276,174 | |
| Bryn Mawr Bank | 53,520 | 990,655 | |
| Capstead Mortgage | 52,400 | c | 653,952 |
| Cash America International | 12,800 | 636,288 | |
| CBIZ | 167,172 | a | 1,006,375 |
| Center Financial | 67,300 | a | 496,001 |
| Centerstate Banks | 50,110 | 282,620 | |
| City Holding | 29,000 | b | 944,240 |
| City National | 2,900 | 123,018 | |
| Columbia Banking System | 111,555 | 2,007,990 |
The Fund 11
STATEMENT OF INVESTMENTS (continued)
| Common Stocks (continued) | Shares | Value ($) | |
| Financial (continued) | |||
| Comerica | 30,327 | 764,847 | |
| Community Bank System | 90,705 | 2,396,427 | |
| CoreLogic | 75,600 | a | 1,003,968 |
| Cullen/Frost Bankers | 25,952 | 1,312,393 | |
| CVB Financial | 125,100 | 1,229,733 | |
| Delphi Financial Group, Cl. A | 88,249 | 2,426,848 | |
| Deluxe | 80,407 | 1,838,104 | |
| Dime Community Bancshares | 67,230 | 796,003 | |
| Donegal Group, Cl. A | 42,964 | 586,459 | |
| Encore Capital Group | 36,200 | a | 789,160 |
| F.N.B. | 108,973 | 1,161,652 | |
| FBL Financial Group, Cl. A | 29,852 | 1,014,371 | |
| Fidelity National Financial, Cl. A | 16,700 | 265,029 | |
| Fifth Street Finance | 21,090 | b | 206,260 |
| First Bancorp | 20,700 | 243,846 | |
| First Cash Financial Services | 16,900 | a | 613,470 |
| First Commonwealth Financial | 26,450 | 122,992 | |
| First Financial Bankshares | 34,620 | b | 1,142,460 |
| First Financial Holdings | 30,160 | 246,407 | |
| First Merchants | 37,325 | 302,333 | |
| First Midwest Bancorp | 31,420 | 298,490 | |
| First Niagara Financial Group | 50,600 | 445,280 | |
| First Potomac Realty Trust | 54,438 | c | 692,996 |
| Flushing Financial | 21,250 | 274,975 | |
| Glimcher Realty Trust | 158,592 | c | 1,379,750 |
| Hancock Holding | 38,350 | 1,171,017 | |
| HCC Insurance Holdings | 67,759 | 1,821,362 | |
| Heritage Financial Group | 24,534 | b | 267,543 |
| Horace Mann Educators | 31,500 | 384,615 | |
| Huntington Bancshares | 145,700 | 764,925 | |
| IBERIABANK | 21,300 | 1,061,166 | |
| Investment Technology Group | 72,888 | a | 776,257 |
| Investors Bancorp | 16,170 | a | 221,367 |
| Knight Capital Group, Cl. A | 65,755 | a | 830,486 |
| LaSalle Hotel Properties | 47,300 | c | 1,107,293 |
| Lender Processing Services | 140,230 | 2,658,761 | |
| Medical Properties Trust | 131,549 | c | 1,257,608 |
12
| Common Stocks (continued) | Shares | Value ($) | |
| Financial (continued) | |||
| MGIC Investment | 83,900 | a | 241,632 |
| Nara Bancorp | 74,335 | a | 696,519 |
| National Western Life Insurance | 6,100 | 884,744 | |
| Net 1 UEPS Technologies | 43,300 | a | 285,780 |
| Ocwen Financial | 256,040 | a | 3,372,047 |
| Omega Healthcare Investors | 158,625 | c | 2,844,146 |
| Parkway Properties | 76,244 | c | 770,827 |
| Piper Jaffray | 13,990 | a | 289,593 |
| Platinum Underwriters Holdings | 33,250 | 1,144,797 | |
| Primerica | 77,390 | 1,776,874 | |
| PS Business Parks | 13,000 | c | 685,100 |
| RLI | 16,800 | b | 1,190,616 |
| Rockville Financial | 25,250 | 256,288 | |
| SVB Financial Group | 34,541 | a | 1,624,809 |
| TCF Financial | 53,500 | 538,210 | |
| Texas Capital Bancshares | 42,300 | a | 1,220,778 |
| Tower Group | 110,665 | 2,322,858 | |
| Trustmark | 57,294 | 1,281,094 | |
| Umpqua Holdings | 66,300 | 828,750 | |
| Union First Market Bankshares | 23,348 | 305,625 | |
| Validus Holdings | 15,001 | 451,380 | |
| Waddell & Reed Financial, Cl. A | 33,906 | 921,565 | |
| Walter Investment Management | 40,100 | 896,636 | |
| Washington Federal | 17,080 | 222,211 | |
| Wintrust Financial | 39,500 | 1,097,705 | |
| World Acceptance | 23,169 | a | 1,589,857 |
| 78,746,702 | |||
| Health Care—6.3% | |||
| Accuray | 62,390 | a | 250,184 |
| Affymetrix | 95,500 | a | 431,660 |
| Air Methods | 8,400 | a | 678,048 |
| Amedisys | 24,200 | a | 287,254 |
| AmSurg | 83,534 | a | 2,178,567 |
| Atrion Corp | 1,280 | 310,810 | |
| Cambrex | 162,782 | a | 1,124,824 |
| Charles River Laboratories International | 20,700 | a | 586,845 |
| Chemed | 8,400 | 450,744 |
The Fund 13
STATEMENT OF INVESTMENTS (continued)
| Common Stocks (continued) | Shares | Value ($) | |
| Health Care (continued) | |||
| CryoLife | 58,862 | a | 242,511 |
| Cynosure, Cl. A | 11,170 | a | 136,833 |
| Furiex Pharmaceuticals | 16,440 | a | 295,920 |
| Halozyme Therapeutics | 23,160 | a,b | 219,557 |
| Health Management Associates, Cl. A | 119,700 | a | 983,934 |
| Hill-Rom Holdings | 33,835 | 1,069,186 | |
| IRIS International | 28,700 | a | 278,677 |
| Kindred Healthcare | 138,741 | a | 1,720,388 |
| Magellan Health Services | 32,900 | a | 1,666,714 |
| Medical Action Industries | 29,049 | a | 137,983 |
| Medicines | 14,620 | a | 276,464 |
| Medicis Pharmaceutical, Cl. A | 15,900 | 519,135 | |
| Merit Medical Systems | 28,720 | a | 398,921 |
| Myriad Genetics | 11,340 | a | 240,975 |
| Nektar Therapeutics | 36,970 | a,b | 184,850 |
| Pacific Biosciences of California | 69,870 | a | 199,130 |
| Questcor Pharmaceuticals | 14,200 | a | 638,290 |
| Rigel Pharmaceuticals | 16,810 | a | 128,092 |
| SXC Health Solutions | 11,200 | a | 658,784 |
| Symmetry Medical | 197,747 | a | 1,548,359 |
| Syneron Medical | 25,890 | a | 279,612 |
| Universal American | 53,150 | 697,859 | |
| 18,821,110 | |||
| Industrial—18.8% | |||
| AAON | 41,982 | 919,826 | |
| Actuant, Cl. A | 52,350 | 1,199,862 | |
| Aegion | 29,997 | a | 454,755 |
| Aerovironment | 15,900 | a | 485,109 |
| American Reprographics | 255,630 | a | 1,204,018 |
| Atlas Air Worldwide Holdings | 14,500 | a | 612,625 |
| Bristow Group | 54,311 | 2,501,565 | |
| CAI International | 46,460 | a | 712,696 |
| Ceradyne | 40,980 | a | 1,218,745 |
| Crown Holdings | 28,400 | a | 917,604 |
| CTS | 153,011 | 1,302,124 | |
| Danaos | 122,000 | a | 402,600 |
| Ducommun | 26,905 | a | 322,053 |
14
| Common Stocks (continued) | Shares | Value ($) | |
| Industrial (continued) | |||
| EnerSys | 105,297 | a | 2,532,393 |
| ESCO Technologies | 28,200 | 764,220 | |
| Flow International | 118,908 | a | 311,539 |
| Foster Wheeler | 8,270 | a | 153,408 |
| Franklin Electric | 15,741 | 740,929 | |
| Gibraltar Industries | 26,390 | a | 357,585 |
| Global Power Equipment Group | 49,420 | a | 1,150,498 |
| Granite Construction | 34,277 | 853,497 | |
| Greif, Cl. A | 18,114 | 844,475 | |
| Hawaiian Holdings | 101,800 | a | 605,710 |
| Heartland Payment Systems | 46,200 | 1,041,810 | |
| Hubbell, Cl. B | 13,600 | 889,712 | |
| iRobot | 29,900 | a | 949,325 |
| ITT | 26,600 | 536,522 | |
| John Bean Technologies | 70,880 | 1,166,685 | |
| KBR | 33,200 | 959,480 | |
| Kelly Services, Cl. A | 51,400 | 744,272 | |
| Knoll | 32,155 | 487,470 | |
| LeCroy | 31,700 | a | 286,885 |
| LSI Industries | 33,417 | 216,876 | |
| Lydall | 89,290 | a | 803,610 |
| Manitowoc | 43,700 | 483,759 | |
| McGrath Rentcorp | 46,750 | 1,308,532 | |
| Medifast | 47,300 | a,b | 657,943 |
| Miller Industries | 24,950 | 401,445 | |
| Myers Industries | 56,950 | 698,207 | |
| NACCO Industries, Cl. A | 12,850 | 1,019,647 | |
| Navistar International | 22,400 | a | 833,952 |
| Old Dominion Freight Line | 33,750 | a | 1,309,837 |
| Orbital Sciences | 57,584 | a | 855,122 |
| Orion Marine Group | 35,540 | a | 213,595 |
| Pall | 16,090 | 876,744 | |
| Park Electrochemical | 50,465 | 1,384,760 | |
| Pulse Electronics | 91,743 | 277,981 | |
| RSC Holdings | 92,100 | a | 1,119,936 |
| Ryder System | 14,300 | 747,604 | |
| Sauer-Danfoss | 25,690 | a | 965,687 |
The Fund 15
STATEMENT OF INVESTMENTS (continued)
| Common Stocks (continued) | Shares | Value ($) | |
| Industrial (continued) | |||
| School Specialty | 51,230 | a | 214,141 |
| Sealed Air | 53,600 | 944,432 | |
| Seaspan | 24,900 | b | 260,952 |
| SkyWest | 36,147 | 438,463 | |
| Sonoco Products | 37,416 | 1,215,272 | |
| Spirit Aerosystems Holdings, Cl. A | 36,600 | a | 714,066 |
| Standex International | 55,410 | 1,769,241 | |
| Steelcase, Cl. A | 31,700 | 248,528 | |
| Teledyne Technologies | 18,500 | a | 1,048,580 |
| Tennant | 23,400 | 982,332 | |
| Textron | 50,000 | 971,500 | |
| Thomas & Betts | 30,607 | a | 1,591,870 |
| Thor Industries | 48,983 | 1,185,389 | |
| Tutor Perini | 108,542 | a | 1,789,858 |
| Twin Disc | 18,250 | 773,800 | |
| United Rentals | 7,530 | a,b | 211,894 |
| 56,165,552 | |||
| Information Technology—11.6% | |||
| Acacia Research | 24,650 | a | 858,313 |
| Accelrys | 83,600 | a | 596,068 |
| Acxiom | 94,150 | a | 1,171,226 |
| American Software, Cl. A | 119,436 | 1,008,040 | |
| AXT | 80,900 | a | 340,589 |
| Benchmark Electronics | 57,651 | a | 796,160 |
| Brocade Communications Systems | 243,980 | a | 1,312,612 |
| CACI International, Cl. A | 22,141 | a | 1,248,310 |
| Cadence Design Systems | 74,200 | a | 811,748 |
| Cardtronics | 44,900 | a | 1,220,382 |
| DDI | 120,340 | 1,084,263 | |
| Digital River | 44,400 | a | 709,956 |
| Dolby Laboratories, Cl. A | 6,300 | a | 207,396 |
| DST Systems | 19,000 | 903,070 | |
| Electronics for Imaging | 69,295 | a | 1,024,873 |
| Emulex | 26,520 | a | 209,508 |
| FalconStor Software | 118,388 | a | 336,222 |
| FormFactor | 82,400 | a | 487,808 |
| GT Advanced Technologies | 159,070 | a,b | 1,228,020 |
16
| Common Stocks (continued) | Shares | Value ($) | |
| Information Technology (continued) | |||
| IEC Electronics | 34,739 | a | 191,064 |
| Ikanos Communications | 91,200 | a | 76,882 |
| Integrated Silicon Solution | 64,444 | a | 601,263 |
| Internap Network Services | 47,040 | a | 244,138 |
| International Rectifier | 70,277 | a | 1,477,926 |
| Intersil, Cl. A | 66,400 | 705,832 | |
| Itron | 19,040 | a | 674,587 |
| LTX-Credence | 37,840 | a | 230,446 |
| Magma Design Automation | 56,140 | a | 321,121 |
| Magnachip Semiconductor | 28,550 | a | 228,686 |
| MEMC Electronic Materials | 105,500 | a | 439,935 |
| Mercury Computer Systems | 31,800 | a | 438,522 |
| NetScout Systems | 23,700 | a | 418,779 |
| Online Resources | 88,750 | a | 235,188 |
| Openwave Systems | 142,950 | a | 234,438 |
| Plexus | 20,754 | a | 563,471 |
| Power-One | 295,080 | a | 1,257,041 |
| Radisys | 39,860 | a | 172,992 |
| Schawk | 24,430 | 309,039 | |
| Scientific Games, Cl. A | 81,400 | a | 700,040 |
| SeaChange International | 70,300 | a | 563,103 |
| Silicon Image | 166,400 | a | 817,024 |
| Spansion, Cl. A | 41,140 | a | 359,564 |
| Standard Microsystems | 72,382 | a | 1,811,721 |
| SYNNEX | 37,280 | a | 1,094,168 |
| TeleCommunication Systems, Cl. A | 82,600 | a | 222,194 |
| Teradyne | 13,570 | a | 182,652 |
| Ultratech | 34,600 | a | 802,720 |
| Verint Systems | 38,300 | a | 1,083,507 |
| Vishay Intertechnology | 250,970 | a | 2,482,093 |
| 34,494,700 | |||
| Materials—5.7% | |||
| American Vanguard | 35,250 | 449,790 | |
| Chemtura | 59,200 | a | 689,680 |
| Cytec Industries | 14,200 | 669,672 | |
| Ferro | 37,420 | a | 217,410 |
| Glatfelter | 111,574 | 1,617,823 |
The Fund 17
STATEMENT OF INVESTMENTS (continued)
| Common Stocks (continued) | Shares | Value ($) | |
| Materials (continued) | |||
| Hexcel | 101,475 | a | 2,528,757 |
| Horsehead Holding | 23,980 | a | 222,774 |
| KapStone Paper and Packaging | 51,430 | a | 852,709 |
| Lawson Products | 9,080 | 143,101 | |
| Mercer International | 53,030 | a | 314,468 |
| Metalico | 53,180 | a | 187,725 |
| Olympic Steel | 10,630 | 252,356 | |
| Omnova Solutions | 215,020 | a | 935,337 |
| PolyOne | 85,610 | 921,164 | |
| RPM International | 64,344 | 1,518,518 | |
| RTI International Metals | 46,830 | a | 1,278,459 |
| Schweitzer-Mauduit International | 13,204 | 940,389 | |
| Sensient Technologies | 23,177 | 875,395 | |
| Solutia | 69,740 | a | 1,110,261 |
| Stillwater Mining | 16,710 | a | 182,306 |
| Westlake Chemical | 12,700 | 533,400 | |
| Worthington Industries | 22,080 | 388,387 | |
| Xerium Technologies | 40,555 | a,b | 300,513 |
| 17,130,394 | |||
| Telecommunications—2.9% | |||
| Arris Group | 81,400 | a | 875,050 |
| Aviat Networks | 86,200 | a | 151,712 |
| Black Box | 50,963 | 1,453,974 | |
| Ciena | 45,200 | a | 547,372 |
| Comverse Technology | 45,900 | a | 300,645 |
| DigitalGlobe | 30,700 | a | 457,430 |
| Extreme Networks | 113,838 | a | 343,791 |
| Infinera | 93,700 | a | 646,530 |
| Oplink Communications | 70,260 | a | 1,159,993 |
| Plantronics | 32,771 | 1,129,289 | |
| Powerwave Technologies | 61,140 | a | 141,845 |
| Premiere Global Services | 44,650 | a | 369,256 |
| RF Micro Devices | 119,700 | a | 745,731 |
| Sierra Wireless | 51,300 | a,b | 346,788 |
| 8,669,406 | |||
| Utilities—3.1% | |||
| Cleco | 34,100 | 1,232,374 |
18
| Common Stocks (continued) | Shares | Value ($) | ||
| Utilities (continued) | ||||
| Empire District Electric | 33,106 | 696,881 | ||
| GenOn Energy | 335,750 | a | 913,240 | |
| Hawaiian Electric Industries | 51,094 | 1,323,846 | ||
| NorthWestern | 32,800 | 1,144,064 | ||
| Pike Electric | 24,560 | a | 167,008 | |
| Portland General Electric | 54,223 | 1,358,286 | ||
| Southwest Gas | 27,000 | 1,091,610 | ||
| UniSource Energy | 34,200 | 1,261,296 | ||
| 9,188,605 | ||||
| Total Common Stocks | ||||
| (cost $287,067,323) | 291,435,031 | |||
| Investment of Cash Collateral | ||||
| for Securities Loaned—3.8% | ||||
| Registered Investment Company; | ||||
| Dreyfus Institutional Cash Advantage Fund | ||||
| (cost $11,415,857) | 11,415,857 | d | 11,415,857 | |
| Total Investments (cost $298,483,180) | 101.5 | % | 302,850,888 | |
| Liabilities, Less Cash and Receivables | (1.5 | %) | (4,529,808 | ) |
| Net Assets | 100.0 | % | 298,321,080 | |
| a Non-income producing security. |
| b Security, or portion thereof, on loan.At November 30, 2011, the value of the fund’s securities on loan was |
| $11,755,643 and the value of the collateral held by the fund was $11,415,857.The fund received additional |
| collateral subsequent to year end which resulted in the value of the collateral to be at least 100% of the value of the |
| securities on loan. |
| c Investment in real estate investment trust. |
| d Investment in affiliated money market mutual fund. |
| Portfolio Summary (Unaudited)† | |||
| Value (%) | Value (%) | ||
| Financial | 26.4 | Money Market Investment | 3.8 |
| Industrial | 18.8 | Utilities | 3.1 |
| Consumer Discretionary | 14.8 | Telecommunications | 2.9 |
| Information Technology | 11.6 | Consumer Staples | 1.6 |
| Health Care | 6.3 | Exchange Traded Funds | 1.0 |
| Materials | 5.7 | ||
| Energy | 5.5 | 101.5 | |
† Based on net assets.
See notes to financial statements.
The Fund 19
STATEMENT OF ASSETS AND LIABILITIES
November 30, 2011
| Cost | Value | |
| Assets ($): | ||
| Investments in securities—See Statement of Investments (including | ||
| securities on loan, valued at $11,755,643)—Note 1(b): | ||
| Unaffiliated issuers | 287,067,323 | 291,435,031 |
| Affiliated issuers | 11,415,857 | 11,415,857 |
| Cash | 6,686,862 | |
| Receivable for investment securities sold | 1,765,136 | |
| Dividends and securities lending income receivable | 451,213 | |
| Receivable for shares of Common Stock subscribed | 326,280 | |
| Prepaid expenses | 23,713 | |
| 312,104,092 | ||
| Liabilities ($): | ||
| Due to The Dreyfus Corporation and affiliates—Note 3(c) | 257,590 | |
| Liability for securities on loan—Note 1(b) | 11,415,857 | |
| Payable for investment securities purchased | 1,438,636 | |
| Payable for shares of Common Stock redeemed | 605,536 | |
| Accrued expenses | 65,393 | |
| 13,783,012 | ||
| Net Assets ($) | 298,321,080 | |
| Composition of Net Assets ($): | ||
| Paid-in capital | 269,381,530 | |
| Accumulated undistributed investment income—net | 621,476 | |
| Accumulated net realized gain (loss) on investments | 23,950,366 | |
| Accumulated net unrealized appreciation | ||
| (depreciation) on investments | 4,367,708 | |
| Net Assets ($) | 298,321,080 |
| Net Asset Value Per Share | |||
| Class A | Class C | Class I | |
| Net Assets ($) | 1,071,316 | 164,248 | 297,085,516 |
| Shares Outstanding | 57,399 | 9,000 | 15,774,899 |
| Net Asset Value Per Share ($) | 18.66 | 18.25 | 18.83 |
| See notes to financial statements. | |||
20
STATEMENT OF OPERATIONS
Year Ended November 30, 2011
| Investment Income ($): | ||
| Income: | ||
| Cash dividends (net of $516 foreign taxes withheld at source) | 3,487,756 | |
| Income from securities lending—Note 1(b) | 11,234 | |
| Total Income | 3,498,990 | |
| Expenses: | ||
| Management fee—Note 3(a) | 2,639,977 | |
| Custodian fees—Note 3(c) | 96,557 | |
| Professional fees | 55,381 | |
| Registration fees | 48,523 | |
| Directors’ fees and expenses—Note 3(d) | 29,877 | |
| Shareholder servicing costs—Note 3(c) | 17,572 | |
| Prospectus and shareholders’ reports | 14,197 | |
| Loan commitment fees—Note 2 | 4,465 | |
| Distribution fees—Note 3(b) | 4,329 | |
| Miscellaneous | 14,968 | |
| Total Expenses | 2,925,846 | |
| Less—reduction in management fee due to undertaking—Note 3(a) | (671 | ) |
| Less—reduction in fees due to earnings credits—Note 3(c) | (8 | ) |
| Net Expenses | 2,925,167 | |
| Investment Income—Net | 573,823 | |
| Realized and Unrealized Gain (Loss) on Investments—Note 4 ($): | ||
| Net realized gain (loss) on investments | 24,412,345 | |
| Net unrealized appreciation (depreciation) on investments | (24,681,280 | ) |
| Net Realized and Unrealized Gain (Loss) on Investments | (268,935 | ) |
| Net Increase in Net Assets Resulting from Operations | 304,888 | |
| See notes to financial statements. |
The Fund 21
STATEMENT OF CHANGES IN NET ASSETS
| Year Ended November 30, | ||||
| 2011 | 2010 | |||
| Operations ($): | ||||
| Investment income (loss)—net | 573,823 | (861 | ) | |
| Net realized gain (loss) on investments | 24,412,345 | 14,989,457 | ||
| Net unrealized appreciation | ||||
| (depreciation) on investments | (24,681,280 | ) | 26,294,770 | |
| Net Increase (Decrease) in Net Assets | ||||
| Resulting from Operations | 304,888 | 41,283,366 | ||
| Dividends to Shareholders from ($): | ||||
| Investment income—net: | ||||
| Class I Shares | — | (30,748 | ) | |
| Net realized gain on investments: | ||||
| Class A Shares | (443,790 | ) | (12,873 | ) |
| Class C Shares | (61,614 | ) | (1,273 | ) |
| Class I Shares | (14,742,480 | ) | (185,975 | ) |
| Total Dividends | (15,247,884 | ) | (230,869 | ) |
| Capital Stock Transactions ($): | ||||
| Net proceeds from shares sold: | ||||
| Class A Shares | 830,601 | 315,680 | ||
| Class C Shares | 146,384 | 328,152 | ||
| Class I Shares | 119,134,231 | 169,243,747 | ||
| Dividends reinvested: | ||||
| Class A Shares | 43,161 | 393 | ||
| Class C Shares | 15,022 | 24 | ||
| Class I Shares | 6,759,296 | 93,789 | ||
| Cost of shares redeemed: | ||||
| Class A Shares | (7,562,568 | ) | (1,016,298 | ) |
| Class C Shares | (958,764 | ) | (215,052 | ) |
| Class I Shares | (56,671,319 | ) | (28,560,012 | ) |
| Increase (Decrease) in Net Assets | ||||
| from Capital Stock Transactions | 61,736,044 | 140,190,423 | ||
| Total Increase (Decrease) in Net Assets | 46,793,048 | 181,242,920 | ||
| Net Assets ($): | ||||
| Beginning of Period | 251,528,032 | 70,285,112 | ||
| End of Period | 298,321,080 | 251,528,032 | ||
| Undistributed investment income—net | 621,476 | 35,855 | ||
22
| Year Ended November 30, | ||||
| 2011 | 2010 | |||
| Capital Share Transactions: | ||||
| Class A | ||||
| Shares sold | 40,242 | 17,720 | ||
| Shares issued for dividends reinvested | 2,167 | 23 | ||
| Shares redeemed | (357,221 | ) | (58,129 | ) |
| Net Increase (Decrease) in Shares Outstanding | (314,812 | ) | (40,386 | ) |
| Class C | ||||
| Shares sold | 7,198 | 18,361 | ||
| Shares issued for dividends reinvested | 766 | 1 | ||
| Shares redeemed | (46,318 | ) | (11,799 | ) |
| Net Increase (Decrease) in Shares Outstanding | (38,354 | ) | 6,563 | |
| Class I | ||||
| Shares sold | 6,040,831 | 9,763,895 | ||
| Shares issued for dividends reinvested | 337,627 | 5,573 | ||
| Shares redeemed | (2,940,158 | ) | (1,581,931 | ) |
| Net Increase (Decrease) in Shares Outstanding | 3,438,300 | 8,187,537 | ||
| See notes to financial statements. | ||||
The Fund 23
FINANCIAL HIGHLIGHTS
The following tables describe the performance for each share class for the fiscal periods indicated.All information (except portfolio turnover rate) reflects financial results for a single fund share.Total return shows how much your investment in the fund would have increased (or decreased) during each period, assuming you had reinvested all dividends and distributions.These figures have been derived from the fund’s financial statements.
| Year Ended November 30, | ||||||
| Class A Shares | 2011 | 2010 | 2009 | a | ||
| Per Share Data ($): | ||||||
| Net asset value, beginning of period | 19.63 | 15.24 | 12.50 | |||
| Investment Operations: | ||||||
| Investment (loss)—netb | (.04 | ) | (.05 | ) | (.00 | )c |
| Net realized and unrealized gain | ||||||
| (loss) on investments | .23 | 4.47 | 2.74 | |||
| Total from Investment Operations | .19 | 4.42 | 2.74 | |||
| Distributions: | ||||||
| Dividends from net realized gain on investments | (1.16 | ) | (.03 | ) | — | |
| Net asset value, end of period | 18.66 | 19.63 | 15.24 | |||
| Total Return (%)d | .62 | 29.05 | 21.92 | e | ||
| Ratios/Supplemental Data (%): | ||||||
| Ratio of total expenses to average net assets | 1.29 | 1.34 | 2.94 | f | ||
| Ratio of net expenses to average net assets | 1.27 | 1.32 | 1.40 | f | ||
| Ratio of net investment (loss) to average net assets | (.18 | ) | (.27 | ) | (.02 | )f |
| Portfolio Turnover Rate | 67.49 | 56.03 | 48.43 | e | ||
| Net Assets, end of period ($ x 1,000) | 1,071 | 7,308 | 6,289 | |||
| a | From December 17, 2008 (commencement of operations) to November 30, 2009. |
| b | Based on average shares outstanding at each month end. |
| c | Amount represents less than $.01 per share. |
| d | Exclusive of sales charge. |
| e | Not annualized. |
| f | Annualized. |
See notes to financial statements.
24
| Year Ended November 30, | ||||||
| Class C Shares | 2011 | 2010 | 2009 | a | ||
| Per Share Data ($): | ||||||
| Net asset value, beginning of period | 19.34 | 15.13 | 12.50 | |||
| Investment Operations: | ||||||
| Investment (loss)—netb | (.18 | ) | (.18 | ) | (.10 | ) |
| Net realized and unrealized gain | ||||||
| (loss) on investments | .25 | 4.42 | 2.73 | |||
| Total from Investment Operations | .07 | 4.24 | 2.63 | |||
| Distributions: | ||||||
| Dividends from net realized gain on investments | (1.16 | ) | (.03 | ) | — | |
| Net asset value, end of period | 18.25 | 19.34 | 15.13 | |||
| Total Return (%)c | (.03 | ) | 28.07 | 21.04 | d | |
| Ratios/Supplemental Data (%): | ||||||
| Ratio of total expenses to average net assets | 2.03 | 2.10 | 3.70 | e | ||
| Ratio of net expenses to average net assets | 2.02 | 2.08 | 2.15 | e | ||
| Ratio of net investment (loss) to average net assets | (.92 | ) | (1.02 | ) | (.77 | )e |
| Portfolio Turnover Rate | 67.49 | 56.03 | 48.43 | d | ||
| Net Assets, end of period ($ x 1,000) | 164 | 916 | 617 | |||
| a | From December 17, 2008 (commencement of operations) to November 30, 2009. |
| b | Based on average shares outstanding at each month end. |
| c | Exclusive of sales charge. |
| d | Not annualized. |
| e | Annualized. |
See notes to financial statements.
The Fund 25
FINANCIAL HIGHLIGHTS (continued)
| Year Ended November 30, | ||||||
| Class I Shares | 2011 | 2010 | 2009 | a | ||
| Per Share Data ($): | ||||||
| Net asset value, beginning of period | 19.72 | 15.28 | 12.50 | |||
| Investment Operations: | ||||||
| Investment income—netb | .04 | .00 | c | .03 | ||
| Net realized and unrealized gain | ||||||
| (loss) on investments | .23 | 4.47 | 2.75 | |||
| Total from Investment Operations | .27 | 4.47 | 2.78 | |||
| Distributions: | ||||||
| Dividends from investment income—net | — | (.00 | )c | — | ||
| Dividends from net realized gain on investments | (1.16 | ) | (.03 | ) | — | |
| Total Distributions | (1.16 | ) | (.03 | ) | — | |
| Net asset value, end of period | 18.83 | 19.72 | 15.28 | |||
| Total Return (%) | 1.04 | 29.32 | 22.24 | d | ||
| Ratios/Supplemental Data (%): | ||||||
| Ratio of total expenses to average net assets | .99 | 1.07 | 1.91 | e | ||
| Ratio of net expenses to average net assets | .99 | 1.06 | 1.15 | e | ||
| Ratio of net investment income to average net assets | .20 | .02 | .26 | e | ||
| Portfolio Turnover Rate | 67.49 | 56.03 | 48.43 | d | ||
| Net Assets, end of period ($ x 1,000) | 297,086 | 243,304 | 63,379 | |||
| a | From December 17, 2008 (commencement of operations) to November 30, 2009. |
| b | Based on average shares outstanding at each month end. |
| c | Amount represents less than $.01 per share. |
| d | Not annualized. |
| e | Annualized. |
See notes to financial statements.
26
NOTES TO FINANCIAL STATEMENTS
NOTE 1—Significant Accounting Policies:
Dreyfus Select Managers Small CapValue Fund (the “fund”) is a separate non-diversified series of Strategic Funds, Inc. (the “Company”) which is registered under the Investment Company Act of 1940, as amended (the “Act”), as an open-end management investment company and operates as a series company currently offering nine series, including the fund. The fund’s investment objective is to seek capital appreciation. The Dreyfus Corporation (the “Manager” or “Dreyfus”), a wholly-owned subsidiary of The Bank of New York Mellon Corporation (“BNY Mellon”), serves as the fund’s investment adviser. EACM Advisors LLC (“EACM”), a subsidiary of BNY Mellon and an affiliate of Dreyfus, serves as the fund’s portfolio allocation manager.Thompson, Seigel and Walmsley, LLC (“TS&W”), Walthausen & Co., LLC (“Walthausen”), Neuberger Berman Management LLC (“Neuberger Berman”), Lombardia Capital Partners, LLC (“Lombardia”) and Iridian Asset Management LLC (“Iridian”) serve as the fund’s sub-investment advisers, each managing an allocated portion of the fund’s portfolio. Effective July 29, 2011, the Board of Directors terminated the fund’s sub-investment advisory agreement with Riverbridge Partners, LLC and approved a new sub-investment advisory agreement with Iridian.
MBSC Securities Corporation (the “Distributor”), a wholly-owned subsidiary of Dreyfus, is the distributor of the fund’s shares.The fund is authorized to issue 100 million shares of $.001 par value Common Stock in each of the following classes of shares: Class A, Class C and Class I. Class A shares are subject to a sales charge imposed at the time of purchase. Class C shares are subject to a contingent deferred sales charge (“CDSC”) imposed on Class C shares redeemed within one year of purchase. Class I shares are sold at net asset value per share only to institutional investors. Other differences between the classes include the services offered to and the expenses borne by each class, the allocation of certain transfer agency costs and certain voting rights. Income, expenses (other than expenses attributable to a specific class), and realized and unrealized gains or losses on investments are allocated to each class of shares based on its relative net assets.
The Fund 27
NOTES TO FINANCIAL STATEMENTS (continued)
The Company accounts separately for the assets, liabilities and operations of each series. Expenses directly attributable to each series are charged to that series’ operations; expenses which are applicable to all series are allocated among them on a pro rata basis.
The Financial Accounting Standards Board (“FASB”) Accounting Standards Codification (“ASC”) is the exclusive reference of authoritative U.S. generally accepted accounting principles (“GAAP”) recognized by the FASB to be applied by nongovernmental entities. Rules and interpretive releases of the Securities and Exchange Commission (“SEC”) under authority of federal laws are also sources of authoritative GAAP for SEC registrants. The fund’s financial statements are prepared in accordance with GAAP, which may require the use of management estimates and assumptions. Actual results could differ from those estimates.
The Company enters into contracts that contain a variety of indemnifications.The fund’s maximum exposure under these arrangements is unknown.The fund does not anticipate recognizing any loss related to these arrangements.
(a) Portfolio valuation: The fair value of a financial instrument is the amount that would be received to sell an asset or paid to transfer a liability in an orderly transaction between market participants at the measurement date (i.e. the exit price). GAAP establishes a fair value hierarchy that prioritizes the inputs of valuation techniques used to measure fair value.This hierarchy gives the highest priority to unadjusted quoted prices in active markets for identical assets or liabilities (Level 1 measurements) and the lowest priority to unobservable inputs (Level 3 measurements).
Additionally, GAAP provides guidance on determining whether the volume and activity in a market has decreased significantly and whether such a decrease in activity results in transactions that are not orderly. GAAP requires enhanced disclosures around valuation inputs and techniques used during annual and interim periods.
28
Various inputs are used in determining the value of the fund’s investments relating to fair value measurements.These inputs are summarized in the three broad levels listed below:
Level 1—unadjusted quoted prices in active markets for identical investments.
Level 2—other significant observable inputs (including quoted prices for similar investments, interest rates, prepayment speeds, credit risk, etc.).
Level 3—significant unobservable inputs (including the fund’s own assumptions in determining the fair value of investments).
The inputs or methodology used for valuing securities are not necessarily an indication of the risk associated with investing in those securities.
Changes in valuation techniques may result in transfers in or out of an assigned level within the disclosure hierarchy. Valuation techniques used to value the fund’s investments are as follows:
Investments in securities are valued at the last sales price on the securities exchange or national securities market on which such securities are primarily traded. Securities listed on the National Market System for which market quotations are available are valued at the official closing price or, if there is no official closing price that day, at the last sales price. Securities not listed on an exchange or the national securities market, or securities for which there were no transactions, are valued at the average of the most recent bid and asked prices, except for open short positions, where the asked price is used for valuation purposes. Bid price is used when no asked price is available. Registered investment companies that are not traded on an exchange are valued at their net asset value.All preceding securities are categorized within Level 1 of the fair value hierarchy.
Fair valuing of securities may be determined with the assistance of a pricing service using calculations based on indices of domestic securities and other appropriate indicators, such as prices of relevant
The Fund 29
NOTES TO FINANCIAL STATEMENTS (continued)
American Depository Receipts and futures contracts. Utilizing these techniques may result in transfers between Level 1 and Level 2 of the fair value hierarchy.
When market quotations or official closing prices are not readily available, or are determined not to reflect accurately fair value, such as when the value of a security has been significantly affected by events after the close of the exchange or market on which the security is principally traded (for example, a foreign exchange or market), but before the fund calculates its net asset value, the fund may value these investments at fair value as determined in accordance with the procedures approved by the Board of Directors. Certain factors may be considered when fair valuing investments such as: fundamental analytical data, the nature and duration of restrictions on disposition, an evaluation of the forces that influence the market in which the securities are purchased and sold, and public trading in similar securities of the issuer or comparable issuers. These securities are either categorized as Level 2 or 3 depending on the relevant inputs used.
For restricted securities where observable inputs are limited, assumptions about market activity and risk are used and are categorized within Level 3 of the fair value hierarchy.
The following is a summary of the inputs used as of November 30, 2011 in valuing the fund’s investments:
| Level 2—Other | Level 3— | |||
| Level 1— | Significant | Significant | ||
| Unadjusted | Observable | Unobservable | ||
| Quoted Prices | Inputs | Inputs | Total | |
| Assets ($) | ||||
| Investments in Securities: | ||||
| Equity Securities— | ||||
| Domestic† | 286,314,034 | — | — | 286,314,034 |
| Equity Securities— | ||||
| Foreign† | 2,303,405 | — | — | 2,303,405 |
| Mutual Fund/ | ||||
| Exchange Traded | ||||
| Funds | 14,233,449 | — | — | 14,233,449 |
| † | See Statement of Investments for additional detailed categorizations. |
30
In May 2011, FASB issued Accounting Standards Update (“ASU”) No. 2011-04 “Amendments to Achieve Common Fair Value Measurement and Disclosure Requirements in GAAP and International Financial Reporting Standards (“IFRS”)” (“ASU 2011-04”). ASU 2011-04 includes common requirements for measurement of and disclosure about fair value between GAAP and IFRS.ASU 2011-04 will require reporting entities to disclose the following information for fair value measurements categorized within Level 3 of the fair value hierarchy: quantitative information about the unobservable inputs used in the fair value measurement, the valuation processes used by the reporting entity and a narrative description of the sensitivity of the fair value measurement to changes in unobservable inputs and the interrelationships between those unobservable inputs. In addition, ASU 2011-04 will require reporting entities to make disclosures about amounts and reasons for all transfers in and out of Level 1 and Level 2 fair value measurements.The new and revised disclosures are effective for interim and annual reporting periods beginning after December 15, 2011. At this time, management is evaluating the implications of ASU 2011-04 and its impact on the financial statements.
(b) Securities transactions and investment income: Securities transactions are recorded on a trade date basis. Realized gains and losses from securities transactions are recorded on the identified cost basis. Dividend income is recognized on the ex-dividend date and interest income, including, where applicable, accretion of discount and amortization of premium on investments, is recognized on the accrual basis.
Pursuant to a securities lending agreement with The Bank of New York Mellon, a subsidiary of BNY Mellon and an affiliate of Dreyfus, the fund may lend securities to qualified institutions. It is the fund’s policy that, at origination, all loans are secured by collateral of at least 102% of the value of U.S. securities loaned and 105% of the value of foreign securities loaned. Collateral equivalent to at least 100% of the market value of securities on loan is maintained at all times. Collateral is either in the form of cash, which can be invested in certain money market mutual funds managed by the Manager, U.S. Government and
TheFund 31
NOTES TO FINANCIAL STATEMENTS (continued)
Agency securities or letters of credit.The fund is entitled to receive all income on securities loaned, in addition to income earned as a result of the lending transaction. Although each security loaned is fully collateralized, the fund bears the risk of delay in recovery of, or loss of rights in, the securities loaned should a borrower fail to return the securities in a timely manner. During the period ended November 30, 2011, The Bank of New York Mellon earned $3,745 from lending portfolio securities, pursuant to the securities lending agreement.
(c) Affiliated issuers: Investments in other investment companies advised by Dreyfus are defined as “affiliated” in the Act.
The fund may invest in shares of certain affiliated investment companies also advised or managed by Dreyfus. Investments in affiliated investment companies for the period ended November 30, 2011 were as follows:
| Affiliated | ||||||
| Investment | Value | Value | Net | |||
| Company | 11/30/2010 | ($) | Purchases ($) | Sales($) | 11/30/2011 ($) | Assets (%) |
| Dreyfus | ||||||
| Institutional | ||||||
| Cash | ||||||
| Advantage | ||||||
| Fund | — | 27,319,159 | 15,903,302 | 11,415,857 | 3.8 |
(d) Dividends to shareholders: Dividends are recorded on the ex-dividend date. Dividends from investment income-net and dividends from net realized capital gains, if any, are normally declared and paid annually, but the fund may make distributions on a more frequent basis to comply with the distribution requirements of the Internal Revenue Code of 1986, as amended (the “Code”). To the extent that net realized capital gains can be offset by capital loss carryovers, it is the policy of the fund not to distribute such gains. Income and capital gain distributions are determined in accordance with income tax regulations, which may differ from GAAP.
32
(e) Federal income taxes: It is the policy of the fund to continue to qualify as a regulated investment company, if such qualification is in the best interests of its shareholders, by complying with the applicable provisions of the Code, and to make distributions of taxable income sufficient to relieve it from substantially all federal income and excise taxes.
As of and during the period ended November 30, 2011, the fund did not have any liabilities for any uncertain tax positions.The fund recognizes interest and penalties, if any, related to uncertain tax positions as income tax expense in the Statement of Operations. During the period, the fund did not incur any interest or penalties.
Each of the tax years in the three-year period ended November 30, 2011 remains subject to examination by the Internal Revenue Service and state taxing authorities.
At November 30, 2011, the components of accumulated earnings on a tax basis were as follows: undistributed ordinary income $7,649,914, undistributed capital gains $18,367,440 and unrealized appreciation $2,929,965. In addition, the fund had $7,769 of passive foreign investment company losses realized after October 31, 2011, which were deferred for tax purposes to the first day of the following fiscal year.
The tax character of distributions paid to shareholders during the fiscal periods ended November 30, 2011 and November 30, 2010 were as follows: ordinary income $11,066,759 and $230,864 and long-term capital gains $4,181,125 and $5, respectively.
During the period ended November 30, 2011, as a result of permanent book to tax differences, primarily due to net operating losses, the fund increased accumulated undistributed investment income-net by $11,798 and decreased accumulated net realized gain (loss) on investments by the same amount. Net assets and net asset value per share were not affected by this reclassification.
The Fund 33
NOTES TO FINANCIAL STATEMENTS (continued)
NOTE 2—Bank Lines of Credit:
The fund participates with other Dreyfus-managed funds in a $225 million unsecured credit facility led by Citibank, N.A. and a $300 million unsecured credit facility provided by The Bank of New York Mellon (each, a “Facility”), each to be utilized primarily for temporary or emergency purposes, including the financing of redemptions. In connection therewith, the fund has agreed to pay its pro rata portion of commitment fees for each Facility. Interest is charged to the fund based on rates determined pursuant to the terms of the respective Facility at the time of borrowing. During the period ended November 30, 2011, the fund did not borrow under the Facilities.
NOTE 3—Management Fee, Sub-Investment Advisory Fee and Other Transactions With Affiliates:
(a) Pursuant to a management agreement with Dreyfus, the management fee is computed at the annual rate of .90% of the value of the fund’s average daily net assets and is payable monthly. Dreyfus has contractually agreed, until April 1, 2012, to waive receipt of its fees and/or assume the expenses of the fund so that the direct expenses of none of the classes (excluding Rule 12b-1 fees, shareholder services fees, taxes, interest expense, brokerage commissions, commitment fees on borrowings and extraordinary expenses) exceed 1.15% of the value of the fund’s average daily net assets.The reduction in management fee, pursuant to the undertaking amounted to $671 during the period ended November 30, 2011.
Pursuant to separate Sub-Investment Advisory Agreements between Dreyfus and TS&W, Walthausen, Neuberger Berman, Lombardia and Iridian, Dreyfus pays TS&W, Walthausen, Neuberger Berman, Lombardia and Iridian separate monthly fees at an annual percentage of the fund’s average daily net assets. Dreyfus paid Riverbridge a monthly fee at an annual percentage of the fund’s average daily net assets, which was terminated on July 29, 2011.
34
During the period ended November 30, 2011, the Distributor retained $241 from commissions earned on sales of the fund’s Class A shares.
(b) Under the Distribution Plan (the “Plan”) adopted pursuant to Rule 12b-1 under the Act, Class C shares pay the Distributor for distributing its shares at an annual rate of .75% of the value of the average daily net assets of Class C shares. During the period ended November 30, 2011, Class C shares were charged $4,329 pursuant to the Plan.
(c) Under the Shareholder Services Plan, Class A and Class C shares pay the Distributor at an annual rate of .25% of the value of their average daily net assets for the provision of certain services. The services provided may include personal services relating to shareholder accounts, such as answering shareholder inquiries regarding Class A and Class C shares and providing reports and other information, and services related to the maintenance of shareholder accounts. The Distributor may make payments to Service Agents (a securities dealer, financial institution or other industry professional) in respect of these services.The Distributor determines the amounts to be paid to Service Agents. During the period ended November 30, 2011, Class A and Class C shares were charged $10,357 and $1,443, respectively, pursuant to the Shareholder Services Plan.
The fund compensates DreyfusTransfer, Inc., a wholly-owned subsidiary of Dreyfus, under a transfer agency agreement for providing personnel and facilities to perform transfer agency services for the fund. During the period ended November 30, 2011, the fund was charged $3,330 pursuant to the transfer agency agreement, which is included in Shareholder servicing costs in the Statement of Operations.
The fund has arrangements with the custodian and cash management bank whereby the fund may receive earnings credits when positive cash balances are maintained, which are used to offset custody and cash management fees. For financial reporting purposes, the fund includes net earnings credits as an expense offset in the Statement of Operations.
The Fund 35
NOTES TO FINANCIAL STATEMENTS (continued)
The fund compensates The Bank of New York Mellon under cash management agreements for performing cash management services related to fund subscriptions and redemptions. During the period ended November 30, 2011, the fund was charged $230 pursuant to the cash management agreements, which is included in Shareholder servicing costs in the Statement of Operations.These fees were partially offset by earnings credits of $8.
The fund also compensates The Bank of New York Mellon under a custody agreement for providing custodial services for the fund. During the period ended November 30, 2011, the fund was charged $96,557 pursuant to the custody agreement.
During the period ended November 30, 2011, the fund was charged $6,356 for services performed by the Chief Compliance Officer.
The components of “Due to The Dreyfus Corporation and affiliates” in the Statement of Assets and Liabilities consist of: management fees $218,605, Rule 12b-1 distribution plan fees $100, shareholder services plan fees $250, custodian fees $33,087, chief compliance officer fees $4,743 and transfer agency per account fees $825, which are offset against an expense reimbursement currently in effect in the amount of $20.
(d) Each Board member also serves as a Board member of other funds within the Dreyfus complex. Annual retainer fees and attendance fees are allocated to each fund based on net assets.
NOTE 4—Securities Transactions:
The aggregate amount of purchases and sales of investment securities, excluding short-term securities, during the period ended November 30, 2011, amounted to $241,250,337 and $194,103,304, respectively.
At November 30, 2011, the cost of investments for federal income tax purposes was $299,920,923; accordingly, accumulated net unrealized appreciation on investments was $2,929,965, consisting of $34,196,333 gross unrealized appreciation and $31,266,368 gross unrealized depreciation.
36
REPORT OF INDEPENDENT REGISTERED
PUBLIC ACCOUNTING FIRM
Shareholders and Board of Directors
Dreyfus Select Managers Small Cap Value Fund
We have audited the accompanying statement of assets and liabilities, including the statement of investments, of Dreyfus Select Managers Small Cap Value Fund (one of the series comprising Strategic Funds, Inc.) as of November 30, 2011, and the related statement of operations for the year then ended, the statement of changes in net assets for each of the two years in the period then ended and financial highlights for each of the periods indicated therein. These financial statements and financial highlights are the responsibility of the Fund’s management. Our responsibility is to express an opinion on these financial statements and financial highlights based on our audits.
We conducted our audits in accordance with the standards of the Public Company Accounting Oversight Board (United States).Those standards require that we plan and perform the audit to obtain reasonable assurance about whether the financial statements and financial highlights are free of material misstatement. We were not engaged to perform an audit of the Fund’s internal control over financial reporting. Our audits included consideration of internal control over financial reporting as a basis for designing audit procedures that are appropriate in the circumstances, but not for the purpose of expressing an opinion on the effectiveness of the Fund’s internal control over financial reporting. Accordingly, we express no such opinion. An audit also includes examining, on a test basis, evidence supporting the amounts and disclosures in the financial statements and financial highlights, assessing the accounting principles used and significant estimates made by management, and evaluating the overall financial statement presentation. Our procedures included confirmation of securities owned as of November 30, 2011 by correspondence with the custodian and others.We believe that our audits provide a reasonable basis for our opinion.
In our opinion, the financial statements and financial highlights referred to above present fairly, in all material respects, the financial position of Dreyfus Select Managers Small CapValue Fund at November 30, 2011, the results of its operations for the year then ended, the changes in its net assets for each of the two years in the period then ended and the financial highlights for each of the indicated periods, in conformity with U.S. generally accepted accounting principles.

New York, New York
January 27, 2012
The Fund 37
IMPORTANT TAX INFORMATION (Unaudited)
For federal tax purposes the fund hereby designates 16.38% of the ordinary dividends paid during the fiscal year ended November 30, 2011 as qualifying for the corporate dividends received deduction. Also certain dividends paid by the fund may be subject to a maximum tax rate of 15%, as provided for by the Jobs and Growth Tax Relief Reconciliation Act of 2003. Of the distributions paid during the fiscal year, $1,729,964 represents the maximum amount that may be considered qualified dividend income. Shareholders will receive notification in early 2012 of the percentage applicable to the preparation of their 2011 income tax returns.Also, the fund hereby designates $.8454 per share as a short-term capital gain distribution paid and also designates $.3194 per share as a long-term capital gain distribution paid on December 31, 2010.
38
INFORMATION ABOUT THE RENEWAL OF THE FUND’S
MANAGEMENT, PORTFOLIO ALLOCATION MANAGEMENT
AND SUB-INVESTMENT ADVISORY AGREEMENTS (Unaudited)
At a meeting of the fund’s Board of Directors held on November 7-8, 2011, the Board considered the renewal of (a) the fund’s Management Agreement, pursuant to which Dreyfus provides the fund with investment advisory and administrative services; (b) Dreyfus’ Portfolio Allocation Management Agreement (the “Allocation Agreement”) with EACM Advisors, LLC (“EACM”), pursuant to which EACM is responsible for evaluating and recommending sub-advisers to provide the fund with day-to-day portfolio management services, recommending the percentage of fund assets to be allocated to each sub-adviser, monitoring and evaluating the performance of the sub-advisers, and recommending whether a sub-adviser should be terminated; and (c) Dreyfus’ separate Sub-Investment Advisory Agreements with each ofThomson, Siegel and Walmsley, LLC, Walthausen & Co., LLC, Neuberger Berman Management, LLC, and Lombardia Capital Partners, LLC (collectively, the “Sub-Advisers”), pursuant to which each Sub-Adviser serves as sub-investment adviser and provide day-to-day management of a percentage of the fund’s portfolio (collectively, the “Sub-Advisory Agreements”). The Board members, none of whom are “interested persons” (as defined in the Investment Company Act of 1940, as amended) of the fund, were assisted in their review by independent legal counsel and met with counsel in executive session separate from representatives of Dreyfus and EACM. In considering the renewal of the Agreements, the Board considered all factors that it believed to be relevant, including those discussed below.The Board did not identify any one factor as dispositive, and each Board member may have attributed different weights to the factors considered.
Analysis of Nature, Extent, and Quality of Services Provided to the Fund.The Board considered information previously provided to them in a presentation from Dreyfus representatives regarding the nature, extent, and quality of the services provided to funds in the Dreyfus fund complex, and representatives of Dreyfus and EACM confirmed that there had been no material changes in this information. Dreyfus provided the number of open accounts in the fund, the fund’s asset size, and
The Fund 39
INFORMATION ABOUT THE RENEWAL OF THE FUND’S MANAGEMENT,
PORTFOLIO ALLOCATION MANAGEMENT AND SUB-INVESTMENT
ADVISORY AGREEMENTS (Unaudited) (continued)
the allocation of fund assets among distribution channels. Dreyfus also had previously provided information regarding the diverse intermediary relationships and distribution channels of funds in the Dreyfus fund complex and Dreyfus’ corresponding need for broad, deep, and diverse resources to be able to provide ongoing shareholder services to each distribution channel, including the distribution channel(s) for the fund.
The Board also considered research support available to, and portfolio management capabilities of, the personnel associated with Dreyfus, EACM, and the Sub-Advisers, as applicable, and that Dreyfus provides oversight of day-to-day fund operations, including fund accounting and administration and assistance in meeting legal and regulatory requirements. The Board also considered Dreyfus’s extensive administrative, accounting, and compliance infrastructures, Dreyfus supervisory activities over EACM and the Sub-Advisers, and EACM’s evaluations and recommendations to Dreyfus regarding the Sub-Advisers and EACM’s supervisory activities over the Sub-Advisers.The Board also considered portfolio management’s brokerage policies and practices (including policies and practices regarding soft dollars) and the standards applied in seeking best execution.
Comparative Analysis of the Fund’s Performance and Management Fee and Expense Ratio. The Board reviewed reports prepared by Lipper, Inc. (“Lipper”), an independent provider of investment company data, which included information comparing (1) the fund’s performance with the performance of a group of comparable funds (the “Performance Group”) and with a broader group of funds (the “Performance Universe”), all for various periods ended September 30, 2011, and (2) the fund’s actual and contractual management fees and total expenses with those of a group of comparable funds (the “Expense Group”) and with a broader group of funds (the “Expense Universe”), the information for which was derived in part from fund financial statements available to Lipper as of September 30, 2011. Dreyfus previously had furnished the Board with a description of the methodology Lipper used to select the Performance Group and Performance Universe and the Expense Group and Expense Universe.
40
Dreyfus representatives stated that the usefulness of performance comparisons may be affected by a number of factors, including different investment limitations that may be applicable to the fund and comparison funds. The Board discussed the results of the comparisons and noted that the fund’s total return performance was below or at the Performance Group median and below the Performance Universe median for the 1-year and 2- year time periods.The Board noted that the Fund commenced operations in December 2008. Dreyfus also provided a comparison of the fund’s actual total return for its two calendar years of existence to the return of the fund’s benchmark index, and the Board noted the fund’s return was higher in each calendar year.
The Board also reviewed the range of actual and contractual management fees and total expenses of the Expense Group and Expense Universe funds and discussed the results of the comparisons. They noted that the fund’s contractual management fee was below the Expense Group median, the fund’s actual management fee was above the Expense Group median and the Expense Universe median, and the fund’s actual total expenses were below the Expense Group median and the Expense Universe median.
Dreyfus representatives reviewed with the Board members the management or investment advisory fees paid to Dreyfus or its affiliates or the respective Sub-Advisers by funds in the same Lipper category as the fund, or by separate accounts and/or other types of client portfolios managed by Dreyfus, EACM, or one of the respective Sub-Advisers considered to have similar investment strategies and policies as the fund (the “Similar Accounts”), and explained the nature of the Similar Accounts. Dreyfus representatives noted that neither Dreyfus nor EACM advise any separate accounts and/or other types of client portfolios with similar investment strategies and policies as the fund.They discussed differences in fees paid and the relationship of the fees paid in light of any differences in the services provided and other relevant factors. The Board considered the relevance of the fee information provided for the Similar Accounts to evaluate the appropriateness and reasonableness of the fund’s management fee.
The Fund 41
INFORMATION ABOUT THE RENEWAL OF THE FUND’S MANAGEMENT,
PORTFOLIO ALLOCATION MANAGEMENT AND SUB-INVESTMENT
ADVISORY AGREEMENTS (Unaudited) (continued)
The Board considered the fee to EACM and to each Sub-Adviser in relation to the fee paid to Dreyfus by the fund and the respective services provided by EACM and each Sub-Adviser and Dreyfus. The Board also noted EACM’s and each Sub-Adviser’s fee is paid by Dreyfus (out of its fee from the fund) and not the fund.
Analysis of Profitability and Economies of Scale. Dreyfus’ representatives reviewed the expenses allocated and profit received by Dreyfus and the resulting profitability percentage for managing the fund, and the method used to determine the expenses and profit. The Board concluded that the profitability results were not unreasonable given the services rendered and service levels provided by Dreyfus. The Board also noted the expense limitation arrangement and its effect on Dreyfus’ profitability. The Board previously had been provided with information prepared by an independent consulting firm regarding Dreyfus’ approach to allocating costs to, and determining the profitability of, individual funds and the entire Dreyfus fund complex.The consulting firm also had analyzed where any economies of scale might emerge in connection with the management of a fund.
The Board’s counsel stated that the Board should consider the profitability analysis (1) as part of their evaluation of whether the fees under the Agreements bear a reasonable relationship to the mix of services provided by Dreyfus, EACM, and the Sub-Advisers, including the nature, extent and quality of such services, and (2) in light of the relevant circumstances for the fund and the extent to which economies of scale would be realized if the fund grows and whether fee levels reflect these economies of scale for the benefit of fund shareholders. Since Dreyfus, and not the fund, pays EACM and each Sub-Adviser pursuant to the respective Agreements, the Board did not consider EACM’s or any Sub-Adviser’s profitability to be relevant to its deliberations. Dreyfus representatives noted that, as a result of shared and allocated costs among funds in the Dreyfus funds complex, the extent of economies of scale could depend substantially on the level of assets in the complex as a whole, so that increases and decreases in complex-wide assets can affect potential economies of scale in a manner that is
42
disproportionate to, or even in the opposite direction from, changes in the fund’s asset level. The Board members also considered potential benefits to Dreyfus and each Sub-Adviser from acting as investment adviser and sub-investment adviser, respectively, and EACM from acting as portfolio allocation manager, and noted the soft dollar arrangements in effect for trading the fund’s investments.
At the conclusion of these discussions, the Board agreed that it had been furnished with sufficient information to make an informed business decision with respect to the renewal of the Agreements. Based on the discussions and considerations as described above, the Board concluded and determined as follows.
The Board concluded that the nature, extent, and quality of the services provided by Dreyfus, EACM, and the Sub-Advisers are adequate and appropriate.
The Board was satisfied with the fund’s performance, in light of the considerations described above.
The Board concluded that the fees paid to Dreyfus, EACM, and the Sub-Advisers were reasonable in light of the considerations described above.
The Board determined that the economies of scale which may accrue to Dreyfus and its affiliates in connection with the management of the fund had been adequately considered by Dreyfus in connection with the fee rate charged to the fund pursuant to the Agreement and that, to the extent in the future it were determined that material economies of scale had not been shared with the fund, the Board would seek to have those economies of scale shared with the fund.
The Board considered these conclusions and determinations, along with the information received on a routine and regular basis throughout the year. In addition, it should be noted that the Board’s consideration of the contractual fee arrangements for this fund had the benefit of a number of years of reviews of prior or similar agreements during which lengthy discussions took place between the Board and Dreyfus’ representatives. Certain aspects of the arrangements may receive greater scrutiny in
The Fund 43
INFORMATION ABOUT THE RENEWAL OF THE FUND’S MANAGEMENT,
PORTFOLIO ALLOCATION MANAGEMENT AND SUB-INVESTMENT
ADVISORY AGREEMENTS (Unaudited) (continued)
some years than in others, and the Board’s conclusions may be based, in part, on their consideration of the same or similar arrangements in prior years.The Board determined that renewal of the Agreements was in the best interests of the fund and its shareholders.
APPROVAL OF AN ADDITONAL SUB-INVESTMENT ADVISER
At a meeting of the fund’s Board of Directors held on July 18, 2011, the Board considered the approval of a Sub-Investment Advisory Agreement with Iridian Asset Management, LLC (the “Sub-Adviser”), pursuant to which the Sub-Adviser would serve as an additional sub-investment adviser and provide day-to-day management of a percentage of the fund’s portfolio (the “Sub-Advisory Agreement”).The Board members, none of whom are “interested persons” (as defined in the Investment Company Act of 1940, as amended) of the fund, were assisted in their review by independent legal counsel and met with counsel in executive session separate from representatives of Dreyfus and EACM. In considering approval of the Sub-Advisory Agreement, the Board considered all factors that it believed to be relevant, including those discussed below.
Analysis of Nature, Extent, and Quality of Services to be Provided to the Fund.The Board considered information previously provided to them in a presentation from Dreyfus representatives regarding the nature, extent, and quality of the services provided to funds in the Dreyfus fund complex, and representatives of Dreyfus confirmed that there had been no material changes in this information. Dreyfus also had previously provided information regarding the diverse intermediary relationships and distribution channels of funds in the Dreyfus fund complex and Dreyfus’ corresponding need for broad, deep, and diverse resources to be able to provide ongoing shareholder services to each distribution channel, including the distribution channel(s) for the fund.
The Board considered the portfolio management and research capabilities of the Sub-Adviser, the Sub-Adviser’s portfolio management’s brokerage policies and practices (including policies and practices
44
regarding soft dollars) and the standards applied in seeking best execution, and that Dreyfus and EACM would supervise the Sub-Adviser’s activities with respect to the fund.
Comparative Analysis of Performance and Fees. Representatives of Dreyfus and EACM reviewed the investment strategies to be employed by the Sub-Adviser in managing its portion of the fund’s assets. The Board considered EACM’s presentation regarding the Sub-Adviser’s portfolio management and research resources and capabilities, experience in managing small cap equity funds, historical investment performance in the strategy to be employed for the fund, reputation and financial condition, brokerage and trading policies and practices, and internal compliance programs, as well as Dreyfus’ and EACM’s recommendation and supervision of, and relationship with, the Sub-Adviser.
Dreyfus representatives reviewed with the Board members the advisory fees paid to the Sub-Adviser for funds in the same Lipper category as the fund, or by separate accounts and/or other types of client portfolios managed by the Sub-Adviser considered to have similar investment strategies and policies as the fund (the “Similar Accounts”), and explained the nature of the Similar Accounts. Dreyfus representatives noted that neither Dreyfus nor EACM advise any separate accounts and/or other types of client portfolios considered to have similar investment strategies and policies as the fund.They discussed differences in fees paid and the relationship of the fees paid in light of any differences in the services provided and other relevant factors
The Board considered the fee to the Sub-Adviser in relation to the fee paid to Dreyfus by the fund and the respective services to be provided by the Sub-Adviser and Dreyfus.The Board noted the Sub-Adviser’s fee would be paid by Dreyfus (out of its fee from the fund) and not the fund and would be at the same rate as that payable to the fund’s other sub-advisers.
The Fund 45
INFORMATION ABOUT THE RENEWAL OF THE FUND’S MANAGEMENT,
PORTFOLIO ALLOCATION MANAGEMENT AND SUB-INVESTMENT
ADVISORY AGREEMENTS (Unaudited) (continued)
Analysis of Profitability. Since Dreyfus, and not the fund, would pay the Sub-Adviser, the Board did not consider the Sub-Adviser’s profitability to be relevant to its deliberations.
At the conclusion of these discussions, the Board agreed that it had been furnished with sufficient information to make an informed business decision with respect to approval of the Sub-Advisory Agreement. Based on the discussions and considerations as described above, the Board concluded and determined as follows.
The Board concluded that the nature, extent, and quality of the services to be provided by the Sub-Adviser are adequate and appropriate, in light of the considerations described above.
The Board concluded that the fee to be paid to the Sub-Adviser is reasonable, in light of the considerations described above, and that consideration of total expense ratios, profitability, and economics of scale were not relevant to the determination.
The Board considered these conclusions and determinations and, without any one factor being dispositive, determined that approval of the Sub-Advisory Agreement was in the best interests of the fund and its shareholders.
46
BOARD MEMBERS INFORMATION (Unaudited)
| Joseph S. DiMartino (68) |
| Chairman of the Board (1995) |
| Principal Occupation During Past 5Years: |
| • Corporate Director and Trustee |
| Other Public Company Board Memberships During Past 5Years: |
| • CBIZ (formerly, Century Business Services, Inc.), a provider of outsourcing functions for small |
| and medium size companies, Director (1997-present) |
| • Sunair Services Corporation, a provider of certain outdoor-related services to homes and |
| businesses, Director (2005-2009) |
| • The Newark Group, a provider of a national market of paper recovery facilities, paperboard |
| mills and paperboard converting plants, Director (2000-2010) |
| No. of Portfolios for which Board Member Serves: 164 |
| ——————— |
| David W. Burke (75) |
| Board Member (1994) |
| Principal Occupation During Past 5Years: |
| • Corporate Director and Trustee |
| No. of Portfolios for which Board Member Serves: 82 |
| ——————— |
| William Hodding Carter III (76) |
| Board Member (1988) |
| Principal Occupation During Past 5Years: |
| • Professor of Leadership & Public Policy, University of North Carolina, Chapel Hill (2006-present) |
| • President and Chief Executive Officer of the John S. and James L. Knight Foundation (1998-2006) |
| No. of Portfolios for which Board Member Serves: 29 |
| ——————— |
| Gordon J. Davis (70) |
| Board Member (2006) |
| Principal Occupation During Past 5Years: |
| • Partner in the law firm of Dewey & LeBoeuf LLP |
| Other Public Company Board Memberships During Past 5Years: |
| • Consolidated Edison, Inc., a utility company, Director (1997-present) |
| • The Phoenix Companies, Inc., a life insurance company, Director (2000-present) |
| No. of Portfolios for which Board Member Serves: 43 |
The Fund 47
BOARD MEMBERS INFORMATION (Unaudited) (continued)
| Joni Evans (69) |
| Board Member (2006) |
| Principal Occupation During Past 5Years: |
| • Chief Executive Officer, www.wowOwow.com an online community dedicated to women’s |
| conversations and publications (2007-present) |
| • Principal, Joni Evans Ltd. (publishing) (2006-present) |
| • Senior Vice President of the William Morris Agency (1994-2006) |
| No. of Portfolios for which Board Member Serves: 29 |
| ——————— |
| Ehud Houminer (71) |
| Board Member (1994) |
| Principal Occupation During Past 5Years: |
| • Executive-in-Residence at the Columbia Business School, Columbia University (1992-present) |
| Other Public Company Board Memberships During Past 5Years: |
| • Avnet Inc., an electronics distributor, Director (1993-present) |
| No. of Portfolios for which Board Member Serves: 64 |
| ——————— |
| Richard C. Leone (71) |
| Board Member (1984) |
| Principal Occupation During Past 5Years: |
| • Senior Fellow of The Century Foundation (formerly, The Twentieth Century Fund, Inc.), a tax |
| exempt research foundation engaged in the study of economic, foreign policy and domestic issues |
| Other Public Company Board Memberships During Past 5Years: |
| • Partnership for a Secure America, Director |
| No. of Portfolios for which Board Member Serves: 29 |
| ——————— |
| Hans C. Mautner (74) |
| Board Member (1984) |
| Principal Occupation During Past 5Years: |
| • President—International Division and an Advisory Director of Simon Property Group, a real |
| estate investment company (1998-2010) |
| • Chairman and Chief Executive Officer of Simon Global Limited (1999-2010) |
| No. of Portfolios for which Board Member Serves: 29 |
48
| Robin A. Melvin (48) |
| Board Member (1995) |
| Principal Occupation During Past 5Years: |
| • Director, Boisi Family Foundation, a private family foundation that supports youth-serving |
| organizations that promote the self sufficiency of youth from disadvantaged circumstances |
| (1995-present) |
| No. of Portfolios for which Board Member Serves: 53 |
| ——————— |
| Burton N.Wallack (61) |
| Board Member (2006) |
| Principal Occupation During Past 5Years: |
| • President and Co-owner of Wallack Management Company, a real estate management company |
| No. of Portfolios for which Board Member Serves: 29 |
| ——————— |
| John E. Zuccotti (74) |
| Board Member (1984) |
| Principal Occupation During Past 5Years: |
| • Chairman of Brookfield Properties, Inc. |
| • Senior Counsel of Weil, Gotshal & Manges, LLP |
| • Emeritus Chairman of the Real Estate Board of New York |
| Other Public Company Board Memberships During Past 5Years: |
| • Emigrant Savings Bank, Director (2004-present) |
| • Doris Duke Charitable Foundation,Trustee (2006-present) |
| No. of Portfolios for which Board Member Serves: 29 |
| ——————— |
| Once elected all Board Members serve for an indefinite term, but achieve Emeritus status upon reaching age 80.The |
| address of the Board Members and Officers is in c/o The Dreyfus Corporation, 200 Park Avenue, NewYork, NewYork |
| 10166.Additional information about the Board Members is available in the fund’s Statement of Additional Information |
| which can be obtained from Dreyfus free of charge by calling this toll free number: 1-800-DREYFUS. |
| Arnold S. Hiatt, Emeritus Board Member |
The Fund 49
OFFICERS OF THE FUND (Unaudited)

50
The Fund 51
NOTES
| Dreyfus |
| U.S. Equity Fund |
ANNUAL REPORT November 30, 2011
Save time. Save paper. View your next shareholder report online as soon as it’s available. Log into www.dreyfus.com and sign up for Dreyfus eCommunications. It’s simple and only takes a few minutes.
The views expressed in this report reflect those of the portfolio manager only through the end of the period covered and do not necessarily represent the views of Dreyfus or any other person in the Dreyfus organization. Any such views are subject to change at any time based upon market or other conditions and Dreyfus disclaims any responsibility to update such views.These views may not be relied on as investment advice and, because investment decisions for a Dreyfus fund are based on numerous factors, may not be relied on as an indication of trading intent on behalf of any Dreyfus fund.
Contents | |
THE FUND | |
| 2 | A Letter from the Chairman and CEO |
| 3 | Discussion of Fund Performance |
| 6 | Fund Performance |
| 8 | Understanding Your Fund’s Expenses |
| 8 | Comparing Your Fund’s Expenses With Those of Other Funds |
| 9 | Statement of Investments |
| 12 | Statement of Assets and Liabilities |
| 13 | Statement of Operations |
| 14 | Statement of Changes in Net Assets |
| 16 | Financial Highlights |
| 19 | Notes to Financial Statements |
| 29 | Report of Independent Registered Public Accounting Firm |
| 30 | Important Tax Information |
| 31 | Information About the Renewal of the Fund’s Management and Sub-Investment Advisory Agreements |
| 36 | Board Members Information |
| 39 | Officers of the Fund |
FOR MORE INFORMATION | |
Back Cover |
| Dreyfus |
| U.S. Equity Fund |
The Fund

A LETTER FROM THE CHAIRMAN AND CEO
Dear Shareholder:
We are pleased to present this annual report for Dreyfus U.S. Equity Fund, covering the 12-month period from December 1, 2010, through November 30, 2011. For information about how the fund performed during the reporting period, as well as general market perspectives, we provide a Discussion of Fund Performance on the pages that follow.
Equity markets proved volatile during much of 2011 as investors struggled with persistently sluggish U.S. and global economic growth. An escalating sovereign debt crisis in Europe, monetary tightening in China and India and a contentious debate regarding taxes, spending and borrowing in the United States sparked a flight to quality in which equity investors flocked to relatively safe havens, such as mega-cap multinational companies. In contrast, small- and mid-cap stocks also advanced, but to a lesser degree.
The economic outlook currently remains clouded by uncertainty regarding the ability of European policymakers to contain the region’s debt crisis. However, conditions in the United States seem to be improving as inflationary pressures have receded, consumer confidence has strengthened and the unemployment rate has declined.To assess the potential impact of these and other developments on your long-term investment targets, we encourage you, as always, to speak with your financial advisor.
Thank you for your continued confidence and support.

Jonathan R. Baum
Chairman and Chief Executive Officer
The Dreyfus Corporation
December 15, 2011
2

DISCUSSION OF FUND PERFORMANCE
For the period of December 1, 2010, through November 30, 2011, as provided by Charlie Macquaker and Roy Leckie of Walter Scott & Partners Limited (Walter Scott), Sub-investment adviser
Fund and Market Performance Overview
For the 12-month period ended November 30, 2011, Dreyfus U.S. Equity Fund’s Class A shares achieved a return of 11.17%, Class C shares returned 10.22% and Class I shares returned 11.46%.1 In comparison, the fund’s benchmark, the Morgan Stanley Capital International USA Index (“MSCI USA Index”), achieved a 7.13% return over the same period.2 U.S. stock prices proved volatile during the reporting period due to adverse macroeconomic events, particularly a resurgent sovereign debt crisis in Europe.The fund produced higher returns than its benchmark, primarily due to a relatively defensive investment posture during the market downturn over the summer of 2011.
The Fund’s Investment Approach
The fund seeks long-term total returns by investing in stocks of companies that are located in the United States.When selecting stocks, Walter Scott seeks companies with fundamental strengths that indicate the potential for sustainable growth. The firm focuses on individual stock selection through extensive fundamental research. Candidates are initially selected for research if they meet certain broad absolute and trend criteria. Financial statements are analyzed in an effort to identify the nature of their cash generation and to understand the variables that add value to their businesses. Companies meeting the financial criteria are subjected to a detailed investigation of their products, costs and pricing, competition, industry position and outlook.
Macroeconomic Developments Challenged Global Markets
Improving economic data and rising corporate earnings generally supported U.S. stock prices into the first quarter of 2011. However, the rally was interrupted in February by higher energy prices stemming from unrest in the Middle East, and again in March, when natural and nuclear disasters in Japan disrupted the global industrial supply chain. Still, investors proved resilient, and stocks generally rebounded from these unexpected shocks.
The Fund 3
DISCUSSION OF FUND PERFORMANCE (continued)
Investor sentiment deteriorated in earnest in April, as investors grew increasingly concerned about a sovereign debt crisis in Europe, where Greece and other members of the European Union saw their borrowing costs soar, pushing them to the brink of insolvency. Investors also reacted cautiously to disappointing economic data in the United States and a contentious political debate regarding U.S. government spending and borrowing. In the emerging markets, China and India raised short-term interest rates to prevent an acceleration of inflation, threatening a major engine of global growth.
As investors became more risk-averse, they turned to traditional safe havens, such as U.S. Treasury securities. Consequently, riskier assets, including stocks, generally declined over the reporting period’s second half. Partial rebounds in October and November mitigated those losses, enabling the benchmark to produce respectable returns for the reporting period overall.
Stock Selection Strategy Proved Effective in Downturn
Companies that met near-term expectations tended to hold up well in this environment, but those that fell short were punished, often regardless of attractive valuations and longer-term fundamental strengths. Walter Scott’s bottom-up security selection process identified no opportunities in the financials sector, helping to avoid the industry group’s weakness. The stock selection strategy proved particularly successful in the consumer discretionary and industrial sectors, but lagged market averages among health care companies.
The fund’s top individual performers for the reporting period included retailer Tractor Supply, which achieved robust store growth and boosted sales through the addition of branded livestock feed to its offerings. U.S. payments processor MasterCard benefited as consumers increasingly use credit cards instead of cash. Industrial company Fastenal achieved favorable results from store growth and the innovative use of vending machines for sales of fasteners. Energy services company CARBO Ceramics encountered rising demand for materials used in the extraction of natural gas from shale formations. Casual dining chain Panera Bread trimmed costs even as it opened new stores.
Disappointments during the reporting period included audio technology specialist Dolby Laboratories, which tumbled when Microsoft
4
announced that the company’s software would not be part of the Windows 8 operating system. Medical devices maker Resmed was hurt when consumers postponed elective medical procedures, including tests for sleep apnea. Also in the health care sector, life sciences company Meridian Bioscience declined sharply following its announcement that earnings expectations for the year should be revised downwards. Independent energy company Apache saw its share price fall along with crude oil and natural gas prices.
Finding Opportunities Among High-Quality Companies
Despite headwinds including high unemployment and deleveraging among governments and individuals, the investment team atWalter Scott continues to find attractive opportunities in the U.S. stock market.The firm’s belief that companies with high growth rates, rising profits and healthy balance sheets can prosper in good times and bad permits an optimistic outlook for the fund’s holdings. In the collective judgment of the investment team, improved market momentum and confidence have buoyed investor sentiment, and barring a new and serious crisis, stocks with strong fundamentals and growth prospects should gain in value over the foreseeable future.
December 15, 2011
| Please note, the position in any security highlighted in italicized typeface was sold during the | |
| reporting period. | |
| Equity funds are subject generally to market, market sector, market liquidity, issuer and investment | |
| style risks, among other factors, to varying degrees, all of which are more fully described in the | |
| fund’s prospectus. | |
| 1 | Total return includes reinvestment of dividends and any capital gains paid, and does not take into |
| consideration the maximum initial sales charge in the case of Class A shares, or the applicable | |
| contingent deferred sales charge imposed on redemptions in the case of Class C shares. Had these | |
| charges been reflected, returns would have been lower. Past performance is no guarantee of future | |
| results. Share price and investment return fluctuate such that upon redemption, fund shares may be | |
| worth more or less than their original cost. | |
| 2 | SOURCE: LIPPER INC. – Reflects reinvestment of net dividends and, where applicable, |
| capital gain distributions.The Morgan Stanley Capital International USA (MSCI USA) Index | |
| is an unmanaged, market capitalization weighted index that is designed to measure the | |
| performance of publicly traded stocks issued by companies in the United States. Investors cannot | |
| invest directly in any index. |
The Fund 5
FUND PERFORMANCE
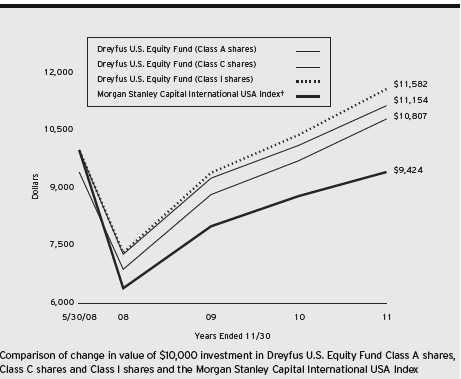
† Source: Lipper Inc.
Past performance is not predictive of future performance.
The above graph compares a $10,000 investment made in each of the Class A, Class C and Class I shares of Dreyfus U.S. Equity Fund on 5/30/08 (inception date) to a $10,000 investment made in the Morgan Stanley Capital International USA Index (the “Index”) on that date.All dividends and capital gain distributions are reinvested.
The fund’s performance shown in the line graph above takes into account the maximum initial sales charge on Class A shares and all other applicable fees and expenses on all classes.The Index is an unmanaged, market capitalization-weighted index that is designed to measure the performance of publicly traded stocks issued by companies in the United States. Unlike a mutual fund, the Index is not subject to charges, fees and other expenses. Investors cannot invest directly in any index. Further information relating to fund performance, including expense reimbursements, if applicable, is contained in the Financial Highlights section of the prospectus and elsewhere in this report.
6
| Average Annual Total Returns as of 11/30/11 | |||||
| Inception | From | ||||
| Date | 1 | Year | Inception | ||
| Class A shares | |||||
| with maximum sales charge (5.75%) | 5/30/08 | 4.80 | % | 2.24 | % |
| without sales charge | 5/30/08 | 11.17 | % | 3.98 | % |
| Class C shares | |||||
| with applicable redemption charge† | 5/30/08 | 9.22 | % | 3.17 | % |
| without redemption | 5/30/08 | 10.22 | % | 3.17 | % |
| Class I shares | 5/30/08 | 11.46 | % | 4.28 | % |
| Morgan Stanley Capital | |||||
| International USA Index | 5/31/08 | 7.13 | % | –1.68 | % |
Past performance is not predictive of future performance.The fund’s performance shown in the graph and table does not reflect the deduction of taxes that a shareholder would pay on fund distributions or the redemption of fund shares.
| † The maximum contingent deferred sales charge for Class C shares is 1% for shares redeemed within one year of the |
| date of purchase. |
The Fund 7
UNDERSTANDING YOUR FUND’S EXPENSES (Unaudited)
As a mutual fund investor, you pay ongoing expenses, such as management fees and other expenses. Using the information below, you can estimate how these expenses affect your investment and compare them with the expenses of other funds.You also may pay one-time transaction expenses, including sales charges (loads) and redemption fees, which are not shown in this section and would have resulted in higher total expenses. For more information, see your fund’s prospectus or talk to your financial adviser.
Review your fund’s expenses
The table below shows the expenses you would have paid on a $1,000 investment in Dreyfus U.S. Equity Fund from June 1, 2011 to November 30, 2011. It also shows how much a $1,000 investment would be worth at the close of the period, assuming actual returns and expenses.
Expenses and Value of a $1,000 Investment
assuming actual returns for the six months ended November 30, 2011
| Class A | Class C | Class I | ||||
| Expenses paid per $1,000† | $ | 5.99 | $ | 10.13 | $ | 4.06 |
| Ending value (after expenses) | $ | 975.30 | $ | 971.30 | $ | 977.40 |
COMPARING YOUR FUND’S EXPENSES
WITH THOSE OF OTHER FUNDS (Unaudited)
Using the SEC’s method to compare expenses
The Securities and Exchange Commission (SEC) has established guidelines to help investors assess fund expenses. Per these guidelines, the table below shows your fund’s expenses based on a $1,000 investment, assuming a hypothetical 5% annualized return. You can use this information to compare the ongoing expenses (but not transaction expenses or total cost) of investing in the fund with those of other funds.All mutual fund shareholder reports will provide this information to help you make this comparison. Please note that you cannot use this information to estimate your actual ending account balance and expenses paid during the period.
Expenses and Value of a $1,000 Investment
assuming a hypothetical 5% annualized return for the six months ended November 30, 2011
| Class A | Class C | Class I | ||||
| Expenses paid per $1,000† | $ | 6.12 | $ | 10.35 | $ | 4.15 |
| Ending value (after expenses) | $ | 1,019.00 | $ | 1,014.79 | $ | 1,020.96 |
| † Expenses are equal to the fund’s annualized expense ratio of 1.21% for Class A, 2.05% for Class C and .82% |
| for Class I, multiplied by the average account value over the period, multiplied by 183/365 (to reflect the one-half |
| year period). |
8
STATEMENT OF INVESTMENTS
November 30, 2011
| Common Stocks—94.0% | Shares | Value ($) | ||
| Consumer Discretionary—17.2% | ||||
| Coach | 117,000 | 7,323,030 | ||
| Family Dollar Stores | 143,700 | 8,538,654 | ||
| McDonald’s | 79,300 | 7,574,736 | ||
| NIKE, Cl. B | 74,500 | 7,165,410 | ||
| Panera Bread, Cl. A | 35,700 | a | 5,118,666 | |
| Starbucks | 175,400 | 7,626,392 | ||
| TJX | 142,300 | 8,779,910 | ||
| Tractor Supply | 69,900 | 5,048,877 | ||
| Urban Outfitters | 295,000 | a | 7,959,100 | |
| 65,134,775 | ||||
| Consumer Staples—8.0% | ||||
| Coca-Cola | 111,000 | 7,462,530 | ||
| Colgate-Palmolive | 84,800 | 7,759,200 | ||
| PepsiCo | 119,500 | 7,648,000 | ||
| Wal-Mart Stores | 122,700 | 7,227,030 | ||
| 30,096,760 | ||||
| Energy—10.5% | ||||
| Apache | 79,800 | 7,935,312 | ||
| CARBO Ceramics | 59,100 | 8,411,112 | ||
| EOG Resources | 74,160 | 7,693,358 | ||
| Occidental Petroleum | 81,300 | 8,040,570 | ||
| Schlumberger | 98,150 | 7,393,640 | ||
| 39,473,992 | ||||
| Health Care—15.2% | ||||
| Abbott Laboratories | 138,600 | 7,560,630 | ||
| C.R. Bard | 32,450 | 2,829,316 | ||
| Celgene | 116,100 | a | 7,323,588 | |
| Gilead Sciences | 121,540 | a | 4,843,368 | |
| Johnson & Johnson | 115,900 | 7,501,048 | ||
| Meridian Bioscience | 267,400 | 5,115,362 | ||
| Resmed | 269,600 | a | 7,023,080 | |
| Stryker | 152,800 | 7,461,224 | ||
| Varian Medical Systems | 125,500 | a | 7,809,865 | |
| 57,467,481 |
The Fund 9
STATEMENT OF INVESTMENTS (continued)
| Common Stocks (continued) | Shares | Value ($) | |
| Industrial—16.0% | |||
| Boeing | 113,000 | 7,761,970 | |
| C.H. Robinson Worldwide | 109,900 | 7,529,249 | |
| Donaldson | 120,600 | 8,243,010 | |
| Emerson Electric | 144,900 | 7,571,025 | |
| Fastenal | 174,500 | 7,267,925 | |
| MSC Industrial Direct, Cl. A | 108,200 | 7,523,146 | |
| Precision Castparts | 43,260 | 7,127,085 | |
| Rockwell Collins | 136,800 | 7,510,320 | |
| 60,533,730 | |||
| Information Technology—23.1% | |||
| Adobe Systems | 262,800 | a | 7,205,976 |
| Amphenol, Cl. A | 123,300 | 5,589,189 | |
| Automatic Data Processing | 144,900 | 7,402,941 | |
| Cisco Systems | 412,000 | 7,679,680 | |
| FLIR Systems | 187,500 | 5,036,250 | |
| Google, Cl. A | 13,460 | a | 8,067,789 |
| Intel | 298,700 | 7,440,617 | |
| MasterCard, Cl. A | 23,470 | 8,790,689 | |
| Microsoft | 280,900 | 7,185,422 | |
| Oracle | 264,700 | 8,298,345 | |
| Paychex | 244,600 | 7,120,306 | |
| QUALCOMM | 134,300 | 7,359,640 | |
| 87,176,844 | |||
| Materials—4.0% | |||
| Monsanto | 102,500 | 7,528,625 | |
| Praxair | 74,500 | 7,599,000 | |
| 15,127,625 | |||
| Total Common Stocks | |||
| (cost $321,021,894) | 355,011,207 |
10
| Other Investment—5.1% | Shares | Value ($) | |
| Registered Investment Company; | |||
| Dreyfus Institutional Preferred | |||
| Plus Money Market Fund | |||
| (cost $19,448,000) | 19,448,000 | b | 19,448,000 |
| Total Investments (cost $340,469,894) | 99.1 | % | 374,459,207 |
| Cash and Receivables (Net) | .9 | % | 3,232,889 |
| Net Assets | 100.0 | % | 377,692,096 |
| a | Non-income producing security. |
| b | Investment in affiliated money market mutual fund. |
| Portfolio Summary (Unaudited)† | |||
| Value (%) | Value (%) | ||
| Information Technology | 23.1 | Consumer Staples | 8.0 |
| Consumer Discretionary | 17.2 | Money Market Investment | 5.1 |
| Industrial | 16.0 | Materials | 4.0 |
| Health Care | 15.2 | ||
| Energy | 10.5 | 99.1 | |
| † Based on net assets. |
| See notes to financial statements. |
The Fund 11
STATEMENT OF ASSETS AND LIABILITIES
November 30, 2011
| Cost | Value | |||
| Assets ($): | ||||
| Investments in securities—See Statement of Investments: | ||||
| Unaffiliated issuers | 321,021,894 | 355,011,207 | ||
| Affiliated issuers | 19,448,000 | 19,448,000 | ||
| Cash | 312,526 | |||
| Receivable for investment securities sold | 2,167,105 | |||
| Dividends receivable | 686,073 | |||
| Receivable for shares of Common Stock subscribed | 494,363 | |||
| Prepaid expenses | 10,242 | |||
| 378,129,516 | ||||
| Liabilities ($): | ||||
| Due to The Dreyfus Corporation and affiliates—Note 3(c) | 236,766 | |||
| Payable for shares of Common Stock redeemed | 119,558 | |||
| Accrued expenses | 81,096 | |||
| 437,420 | ||||
| Net Assets ($) | 377,692,096 | |||
| Composition of Net Assets ($): | ||||
| Paid-in capital | 344,563,016 | |||
| Accumulated undistributed investment income—net | 1,810,664 | |||
| Accumulated net realized gain (loss) on investments | (2,670,897 | ) | ||
| Accumulated net unrealized appreciation | ||||
| (depreciation) on investments | 33,989,313 | |||
| Net Assets ($) | 377,692,096 | |||
| Net Asset Value Per Share | ||||
| Class A | Class C | Class I | ||
| Net Assets ($) | 988,268 | 213,809 | 376,490,019 | |
| Shares Outstanding | 69,574 | 15,403 | 26,374,385 | |
| Net Asset Value Per Share ($) | 14.20 | 13.88 | 14.27 | |
| See notes to financial statements. | ||||
12
| STATEMENT OF OPERATIONS | ||
| Year Ended November 30, 2011 | ||
| Investment Income ($): | ||
| Income: | ||
| Cash dividends: | ||
| Unaffiliated issuers | 4,146,571 | |
| Affiliated issuers | 12,457 | |
| Total Income | 4,159,028 | |
| Expenses: | ||
| Management fee—Note 3(a) | 2,095,379 | |
| Registration fees | 61,829 | |
| Professional fees | 59,267 | |
| Custodian fees—Note 3(c) | 29,783 | |
| Directors’ fees and expenses—Note 3(d) | 26,687 | |
| Prospectus and shareholders’ reports | 7,990 | |
| Shareholder servicing costs—Note 3(c) | 7,090 | |
| Loan commitment fees—Note 2 | 4,196 | |
| Distribution fees—Note 3(b) | 1,625 | |
| Miscellaneous | 13,188 | |
| Total Expenses | 2,307,034 | |
| Less—reduction in fees due to earnings credits—Note 3(c) | (4 | ) |
| Net Expenses | 2,307,030 | |
| Investment Income—Net | 1,851,998 | |
| Realized and Unrealized Gain (Loss) on Investments—Note 4 ($): | ||
| Net realized gain (loss) on investments | (2,670,897 | ) |
| Net unrealized appreciation (depreciation) on investments | 25,300,645 | |
| Net Realized and Unrealized Gain (Loss) on Investments | 22,629,748 | |
| Net Increase in Net Assets Resulting from Operations | 24,481,746 | |
| See notes to financial statements. | ||
The Fund 13
STATEMENT OF CHANGES IN NET ASSETS
| Year Ended November 30, | ||||
| 2011 | 2010 | |||
| Operations ($): | ||||
| Investment income—net | 1,851,998 | 235,200 | ||
| Net realized gain (loss) on investments | (2,670,897 | ) | 950,030 | |
| Net unrealized appreciation | ||||
| (depreciation) on investments | 25,300,645 | 8,688,285 | ||
| Net Increase (Decrease) in Net Assets | ||||
| Resulting from Operations | 24,481,746 | 9,873,515 | ||
| Dividends to Shareholders from ($): | ||||
| Investment income—net: | ||||
| Class A Shares | — | (5,953 | ) | |
| Class I Shares | (274,865 | ) | (7,080 | ) |
| Net realized gain on investments: | ||||
| Class A Shares | (11,303 | ) | — | |
| Class C Shares | (1,516 | ) | — | |
| Class I Shares | (752,726 | ) | — | |
| Total Dividends | (1,040,410 | ) | (13,033 | ) |
| Capital Stock Transactions ($): | ||||
| Net proceeds from shares sold: | ||||
| Class A Shares | 460,558 | 220,658 | ||
| Class C Shares | 150,798 | 27,800 | ||
| Class I Shares | 249,266,465 | 137,915,540 | ||
| Dividends reinvested: | ||||
| Class A Shares | 1,717 | 183 | ||
| Class C Shares | 322 | — | ||
| Class I Shares | 668,490 | 5,399 | ||
| Cost of shares redeemed: | ||||
| Class A Shares | (2,101,246 | ) | (1,948,355 | ) |
| Class C Shares | (281,394 | ) | (243,105 | ) |
| Class I Shares | (41,422,323 | ) | (4,581,770 | ) |
| Increase (Decrease) in Net Assets | ||||
| from Capital Stock Transactions | 206,743,387 | 131,396,350 | ||
| Total Increase (Decrease) in Net Assets | 230,184,723 | 141,256,832 | ||
| Net Assets ($): | ||||
| Beginning of Period | 147,507,373 | 6,250,541 | ||
| End of Period | 377,692,096 | 147,507,373 | ||
| Undistributed investment income—net | 1,810,664 | 235,120 | ||
14
| Year Ended November 30, | ||||
| 2011 | 2010 | |||
| Capital Share Transactions: | ||||
| Class A | ||||
| Shares sold | 33,007 | 18,541 | ||
| Shares issued for dividends reinvested | 127 | 15 | ||
| Shares redeemed | (152,404 | ) | (162,126 | ) |
| Net Increase (Decrease) in Shares Outstanding | (119,270 | ) | (143,570 | ) |
| Class C | ||||
| Shares sold | 11,125 | 2,301 | ||
| Shares issued for dividends reinvested | 24 | — | ||
| Shares redeemed | (20,449 | ) | (20,518 | ) |
| Net Increase (Decrease) in Shares Outstanding | (9,300 | ) | (18,217 | ) |
| Class I | ||||
| Shares sold | 18,119,105 | 11,457,984 | ||
| Shares issued for dividends reinvested | 49,481 | 447 | ||
| Shares redeemed | (3,038,221 | ) | (374,153 | ) |
| Net Increase (Decrease) in Shares Outstanding | 15,130,365 | 11,084,278 | ||
| See notes to financial statements. | ||||
The Fund 15
FINANCIAL HIGHLIGHTS
The following tables describe the performance for each share class for the fiscal periods indicated.All information (except portfolio turnover rate) reflects financial results for a single fund share.Total return shows how much your investment in the fund would have increased (or decreased) during each period, assuming you had reinvested all dividends and distributions.These figures have been derived from the fund’s financial statements.
| Year Ended November 30, | ||||||||
| Class A Shares | 2011 | 2010 | 2009 | 2008 | a | |||
| Per Share Data ($): | ||||||||
| Net asset value, beginning of period | 12.83 | 11.68 | 9.14 | 12.50 | ||||
| Investment Operations: | ||||||||
| Investment income—netb | .04 | .01 | .04 | .02 | ||||
| Net realized and unrealized | ||||||||
| gain (loss) on investments | 1.39 | 1.16 | 2.53 | (3.38 | ) | |||
| Total from Investment Operations | 1.43 | 1.17 | 2.57 | (3.36 | ) | |||
| Distributions: | ||||||||
| Dividends from investment income—net | — | (.02 | ) | (.03 | ) | — | ||
| Dividends from net realized | ||||||||
| gain on investments | (.06 | ) | — | — | — | |||
| Total Distributions | (.06 | ) | (.02 | ) | (.03 | ) | — | |
| Net asset value, end of period | 14.20 | 12.83 | 11.68 | 9.14 | ||||
| Total Return (%)c | 11.17 | 10.01 | 28.19 | (26.88 | )d | |||
| Ratios/Supplemental Data (%): | ||||||||
| Ratio of total expenses to average net assets | 1.15 | 1.76 | 4.65 | 5.54 | e | |||
| Ratio of net expenses to average net assets | 1.15 | 1.40 | 1.40 | 1.40 | e | |||
| Ratio of net investment income | ||||||||
| to average net assets | .29 | .04 | .42 | .33 | e | |||
| Portfolio Turnover Rate | 10.61 | 13.62 | 31.79 | 7.98 | d | |||
| Net Assets, end of period ($ x 1,000) | 988 | 2,424 | 3,884 | 2,618 | ||||
| a | From May 30, 2008 (commencement of operations) to November 30, 2008. |
| b | Based on average shares outstanding at each month end. |
| c | Exclusive of sales charge. |
| d | Not annualized. |
| e | Annualized. |
See notes to financial statements.
16
| Year Ended November 30, | ||||||||
| Class C Shares | 2011 | 2010 | 2009 | 2008 | a | |||
| Per Share Data ($): | ||||||||
| Net asset value, beginning of period | 12.65 | 11.58 | 9.11 | 12.50 | ||||
| Investment Operations: | ||||||||
| Investment (loss)—netb | (.06 | ) | (.09 | ) | (.03 | ) | (.02 | ) |
| Net realized and unrealized | ||||||||
| gain (loss) on investments | 1.35 | 1.16 | 2.50 | (3.37 | ) | |||
| Total from Investment Operations | 1.29 | 1.07 | 2.47 | (3.39 | ) | |||
| Distributions: | ||||||||
| Dividends from net realized | ||||||||
| gain on investments | (.06 | ) | — | — | — | |||
| Net asset value, end of period | 13.88 | 12.65 | 11.58 | 9.11 | ||||
| Total Return (%)c | 10.22 | 9.24 | 27.11 | (27.12 | )d | |||
| Ratios/Supplemental Data (%): | ||||||||
| Ratio of total expenses to average net assets | 1.94 | 2.52 | 5.83 | 6.30 | e | |||
| Ratio of net expenses to average net assets | 1.94 | 2.15 | 2.15 | 2.14 | e | |||
| Ratio of net investment (loss) | ||||||||
| to average net assets | (.47 | ) | (.71 | ) | (.27 | ) | (.41 | )e |
| Portfolio Turnover Rate | 10.61 | 13.62 | 31.79 | 7.98 | d | |||
| Net Assets, end of period ($ x 1,000) | 214 | 312 | 497 | 374 | ||||
| a | From May 30, 2008 (commencement of operations) to November 30, 2008. |
| b | Based on average shares outstanding at each month end. |
| c | Exclusive of sales charge. |
| d | Not annualized. |
| e | Annualized. |
See notes to financial statements.
The Fund 17
FINANCIAL HIGHLIGHTS (continued)
| Year Ended November 30, | ||||||||
| Class I Shares | 2011 | 2010 | 2009 | 2008 | a | |||
| Per Share Data ($): | ||||||||
| Net asset value, beginning of period | 12.88 | 11.70 | 9.16 | 12.50 | ||||
| Investment Operations: | ||||||||
| Investment income—netb | .09 | .07 | .05 | .03 | ||||
| Net realized and unrealized | ||||||||
| gain (loss) on investments | 1.38 | 1.15 | 2.54 | (3.37 | ) | |||
| Total from Investment Operations | 1.47 | 1.22 | 2.59 | (3.34 | ) | |||
| Distributions: | ||||||||
| Dividends from investment income—net | (.02 | ) | (.04 | ) | (.05 | ) | — | |
| Dividends from net realized | ||||||||
| gain on investments | (.06 | ) | — | — | — | |||
| Total Distributions | (.08 | ) | (.04 | ) | (.05 | ) | — | |
| Net asset value, end of period | 14.27 | 12.88 | 11.70 | 9.16 | ||||
| Total Return (%) | 11.46 | 10.47 | 28.36 | (26.72 | )c | |||
| Ratios/Supplemental Data (%): | ||||||||
| Ratio of total expenses to average net assets | .82 | .94 | 3.77 | 5.25 | d | |||
| Ratio of net expenses to average net assets | .82 | .94 | 1.15 | 1.14 | d | |||
| Ratio of net investment income | ||||||||
| to average net assets | .67 | .56 | .54 | .59 | d | |||
| Portfolio Turnover Rate | 10.61 | 13.62 | 31.79 | 7.98 | c | |||
| Net Assets, end of period ($ x 1,000) | 376,490 | 144,771 | 1,870 | 366 | ||||
| a | From May 30, 2008 (commencement of operations) to November 30, 2008. |
| b | Based on average shares outstanding at each month end. |
| c | Not annualized. |
| d Annualized. | |
See notes to financial statements.
18
NOTES TO FINANCIAL STATEMENTS
NOTE 1—Significant Accounting Policies:
Dreyfus U.S. Equity Fund (the “fund”) is a separate diversified series of Strategic Funds, Inc. (the “Company”) which is registered under the Investment Company Act of 1940, as amended (the “Act”), as an open-end management investment company and operates as a series company currently offering nine series, including the fund.The fund’s investment objective is to seek long-term total return. The Dreyfus Corporation (the “Manager” or “Dreyfus”), a wholly-owned subsidiary ofThe Bank of New York Mellon Corporation (“BNY Mellon”), serves as the fund’s investment adviser. Walter Scott & Partners Limited (“Walter Scott”), a subsidiary of BNY Mellon and an affiliate of Dreyfus, serves as the fund’s sub-investment adviser.
MBSC Securities Corporation (the “Distributor”), a wholly-owned subsidiary of Dreyfus, is the distributor of the fund’s shares.The fund is authorized to issue 100 million shares of $.001 par value Common Stock in each of the following classes of shares: Class A, Class C and Class I. Class A shares are subject to a sales charge imposed at the time of purchase. Class C shares are subject to a contingent deferred sales charge (“CDSC”) on Class C shares redeemed within one year of purchase. Class I shares are sold at net asset value per share only to institutional investors. Other differences between the classes include the services offered to and the expenses borne by each class, the allocation of certain transfer agency costs and certain voting rights. Income, expenses (other than expenses attributable to a specific class), and realized and unrealized gains or losses on investments are allocated to each class of shares based on its relative net assets.
As of November 30, 2011, MBC Investments Corp., an indirect subsidiary of BNY Mellon, held 19,245 Class A and 1,975 Class C shares of the fund.
The Fund 19
NOTES TO FINANCIAL STATEMENTS (continued)
The Company accounts separately for the assets, liabilities and operations of each series. Expenses directly attributable to each series are charged to that series’ operations; expenses which are applicable to all series are allocated among them on a pro rata basis.
The Financial Accounting Standards Board (“FASB”) Accounting Standards Codification (“ASC”) is the exclusive reference of authoritative U.S. generally accepted accounting principles (“GAAP”) recognized by the FASB to be applied by nongovernmental entities. Rules and interpretive releases of the Securities and Exchange Commission (“SEC”) under authority of federal laws are also sources of authoritative GAAP for SEC registrants. The fund’s financial statements are prepared in accordance with GAAP, which may require the use of management estimates and assumptions.Actual results could differ from those estimates.
The Company enters into contracts that contain a variety of indemnifications.The fund’s maximum exposure under these arrangements is unknown.The fund does not anticipate recognizing any loss related to these arrangements.
(a) Portfolio valuation: The fair value of a financial instrument is the amount that would be received to sell an asset or paid to transfer a liability in an orderly transaction between market participants at the measurement date (i.e. the exit price). GAAP establishes a fair value hierarchy that prioritizes the inputs of valuation techniques used to measure fair value.This hierarchy gives the highest priority to unadjusted quoted prices in active markets for identical assets or liabilities (Level 1 measurements) and the lowest priority to unobservable inputs (Level 3 measurements).
Additionally, GAAP provides guidance on determining whether the volume and activity in a market has decreased significantly and whether such a decrease in activity results in transactions that are not orderly. GAAP requires enhanced disclosures around valuation inputs and techniques used during annual and interim periods.
20
Various inputs are used in determining the value of the fund’s investments relating to fair value measurements.These inputs are summarized in the three broad levels listed below:
Level 1—unadjusted quoted prices in active markets for identical investments.
Level 2—other significant observable inputs (including quoted prices for similar investments, interest rates, prepayment speeds, credit risk, etc.).
Level 3—significant unobservable inputs (including the fund’s own assumptions in determining the fair value of investments).
The inputs or methodology used for valuing securities are not necessarily an indication of the risk associated with investing in those securities.
Changes in valuation techniques may result in transfers in or out of an assigned level within the disclosure hierarchy. Valuation techniques used to value the fund’s investments are as follows:
Investments in securities are valued at the last sales price on the securities exchange or national securities market on which such securities are primarily traded. Securities listed on the National Market System for which market quotations are available are valued at the official closing price or, if there is no official closing price that day, at the last sales price. Securities not listed on an exchange or the national securities market, or securities for which there were no transactions, are valued at the average of the most recent bid and asked prices, except for open short positions, where the asked price is used for valuation purposes. Bid price is used when no asked price is available. Registered investment companies that are not traded on an exchange are valued at their net asset value.All preceding securities are categorized within Level 1 of the fair value hierarchy.
Fair valuing of securities may be determined with the assistance of a pricing service using calculations based on indices of domestic securi-
The Fund 21
NOTES TO FINANCIAL STATEMENTS (continued)
ties and other appropriate indicators, such as prices of relevant American Depository Receipts and futures contracts. Utilizing these techniques may result in transfers between Level 1 and Level 2 of the fair value hierarchy.
When market quotations or official closing prices are not readily available, or are determined not to reflect accurately fair value, such as when the value of a security has been significantly affected by events after the close of the exchange or market on which the security is principally traded (for example, a foreign exchange or market), but before the fund calculates its net asset value, the fund may value these investments at fair value as determined in accordance with the procedures approved by the Board of Directors. Certain factors may be considered when fair valuing investments such as: fundamental analytical data, the nature and duration of restrictions on disposition, an evaluation of the forces that influence the market in which the securities are purchased and sold, and public trading in similar securities of the issuer or comparable issuers. These securities are either categorized as Level 2 or 3 depending on the relevant inputs used.
For restricted securities where observable inputs are limited, assumptions about market activity and risk are used and are categorized within Level 3 of the fair value hierarchy.
The following is a summary of the inputs used as of November 30, 2011 in valuing the fund’s investments:
| Level 2—Other | Level 3— | |||
| Level 1— | Significant | Significant | ||
| Unadjusted | Observable | Unobservable | ||
| Quoted Prices | Inputs | Inputs | Total | |
| Assets ($) | ||||
| Investments in Securities: | ||||
| Equity Securities— | ||||
| Domestic† | 355,011,207 | — | — | 355,011,207 |
| Mutual Funds | 19,448,000 | — | — | 19,448,000 |
| † | See Statement of Investments for additional detailed categorizations. |
In May 2011, FASB issued Accounting Standards Update (“ASU”) No. 2011-04 “Amendments to Achieve Common FairValue Measurement
22
and Disclosure Requirements in GAAP and International Financial Reporting Standards (“IFRS”)” (“ASU 2011-04”). ASU 2011-04 includes common requirements for measurement of and disclosure about fair value between GAAP and IFRS. ASU 2011-04 will require reporting entities to disclose the following information for fair value measurements categorized within Level 3 of the fair value hierarchy: quantitative information about the unobservable inputs used in the fair value measurement, the valuation processes used by the reporting entity and a narrative description of the sensitivity of the fair value measurement to changes in unobservable inputs and the interrelationships between those unobservable inputs. In addition, ASU 2011-04 will require reporting entities to make disclosures about amounts and reasons for all transfers in and out of Level 1 and Level 2 fair value measurements.The new and revised disclosures are effective for interim and annual reporting periods beginning after December 15, 2011. At this time, management is evaluating the implications of ASU 2011-04 and its impact on the financial statements.
(b) Securities transactions and investment income: Securities transactions are recorded on a trade date basis. Realized gains and losses from securities transactions are recorded on the identified cost basis. Dividend income is recognized on the ex-dividend date and interest income, including, where applicable, accretion of discount and amortization of premium on investments, is recognized on the accrual basis.
(c) Affiliated issuers: Investments in other investment companies advised by Dreyfus are defined as “affiliated” in the Act.
The fund may invest in shares of certain affiliated investment companies also advised or managed by Dreyfus. Investments in affiliated investment companies for the period ended November 30, 2011 were as follows:
| Affiliated | |||||||
| Investment | Value | Value | Net | ||||
| Company | 11/30/2010 | ($) | Purchases ($) | Sales ($) | 11/30/2011 | ($) | Assets (%) |
| Dreyfus | |||||||
| Institutional | |||||||
| Preferred | |||||||
| Plus Money | |||||||
| Market Fund | 4,612,000 | 205,834,000 | 190,998,000 | 19,448,000 | 5.1 |
The Fund 23
NOTES TO FINANCIAL STATEMENTS (continued)
(d) Dividends to shareholders: Dividends are recorded on the ex-dividend date. Dividends from investment income-net and dividends from net realized capital gains, if any, are normally declared and paid annually, but the fund may make distributions on a more frequent basis to comply with the distribution requirements of the Internal Revenue Code of 1986, as amended (the “Code”).To the extent that net realized capital gains can be offset by capital loss carryovers, it is the policy of the fund not to distribute such gains. Income and capital gain distributions are determined in accordance with income tax regulations, which may differ from GAAP.
(e) Federal income taxes: It is the policy of the fund to continue to qualify as a regulated investment company, if such qualification is in the best interests of its shareholders, by complying with the applicable provisions of the Code, and to make distributions of taxable income sufficient to relieve it from substantially all federal income and excise taxes.
As of and during the period ended November 30, 2011, the fund did not have any liabilities for any uncertain tax positions.The fund recognizes interest and penalties, if any, related to uncertain tax positions as income tax expense in the Statement of Operations. During the period, the fund did not incur any interest or penalties.
Each of the tax years in the four-year period ended November 30, 2011 remains subject to examination by the Internal Revenue Service and state taxing authorities.
At November 30, 2011, the components of accumulated earnings on a tax basis were as follows: undistributed ordinary income $1,810,664, accumulated capital losses $1,927,220 and unrealized appreciation $33,981,615. In addition, the fund had $735,979 of capital losses realized after October 31, 2011, which were deferred for tax purposes to the first day of the following fiscal year.
The accumulated capital loss carryover is available for federal income tax purposes to be applied against future net securities profits, if any, realized subsequent to November 30, 2011. If not applied, the carryover expires in fiscal 2019.
24
Under the recently enacted Regulated Investment Company Modernization Act of 2010 (the “2010 Act”), the fund will be permitted to carry forward capital losses incurred in taxable years beginning after December 22, 2010 (“post-enactment losses”) for an unlimited period. However, the 2010 Act requires post-enactment losses to be utilized before the utilization of losses incurred in taxable years prior to the effective date of the 2010 Act. As a result of this ordering rule, capital loss carryovers related to taxable years beginning prior to the effective date of the 2010 Act may be more likely to expire unused.
The tax character of distributions paid to shareholders during the fiscal periods ended November 30, 2011 and November 30, 2010 were as follows: ordinary income $1,040,410 and $13,033, respectively.
During the period ended November 30, 2011, as a result of permanent book to tax differences, primarily due to the tax treatment for dividend reclassification, the fund decreased accumulated undistributed investment income-net by $1,589 and increased accumulated net realized gain (loss) on investments by the same amount. Net assets and net asset value per share were not affected by this reclassification.
NOTE 2—Bank Lines of Credit:
The fund participates with other Dreyfus-managed funds in a $225 million unsecured credit facility led by Citibank, N.A. and a $300 million unsecured credit facility provided by The Bank of New York Mellon, a subsidiary of BNY Mellon and an affiliate of Dreyfus (each, a “Facility”), each to be utilized primarily for temporary or emergency purposes, including the financing of redemptions. In connection therewith, the fund has agreed to pay its pro rata portion of commitment fees for each Facility. Interest is charged to the fund based on rates determined pursuant to the terms of the respective Facility at the time of borrowing. During the period ended November 30, 2011, the fund did not borrow under the Facilities.
The Fund 25
NOTES TO FINANCIAL STATEMENTS (continued)
NOTE 3—Management Fee, Sub-Investment Advisory Fee and Other Transactions With Affiliates:
(a) Pursuant to a management agreement with Dreyfus, the management fee is computed at the annual rate of .75% of the value of the fund’s average daily net assets and is payable monthly. Dreyfus has contractually agreed, until April 1, 2012, to waive receipt of its fees and/or assume the expenses of the fund so that the expenses of none of the classes (excluding Rule 12b-1 distribution plan fees, shareholder services fees, taxes, interest expense, brokerage commissions, commitment fees on borrowings and extraordinary expenses) exceed 1.15% of the value of the fund’s average daily net assets. During the period ended November 30, 2011, there was no expense reimbursement pursuant to the undertaking.
Pursuant to a sub-investment advisory agreement between Dreyfus and Walter Scott, Dreyfus pays Walter Scott a monthly fee at an annual percentage of the fund’s average daily net assets.
During the period ended November 30, 2011, the Distributor retained $382 from commissions earned on sales of the fund’s Class A shares.
(b) Under the Distribution Plan (the “Plan”) adopted pursuant to Rule 12b-1 under the Act, Class C shares pay the Distributor for distributing its shares at an annual rate of .75% of the value of the average daily net assets of Class C shares. During the period ended November 30, 2011, Class C shares were charged $1,625 pursuant to the Plan.
(c) Under the Shareholder Services Plan, Class A and Class C shares pay the Distributor at an annual rate of .25% of the value of their average daily net assets for the provision of certain services. The services provided may include personal services relating to shareholder accounts, such as answering shareholder inquiries regarding Class A and Class C shares and providing reports and other information, and services related to the maintenance of shareholder accounts. The Distributor may make payments to Service Agents (a securities dealer,
26
financial institution or other industry professional) in respect of these services.The Distributor determines the amounts to be paid to Service Agents. During the period ended November 30, 2011, Class A and Class C shares were charged $3,933 and $542, respectively, pursuant to the Shareholder Services Plan.
The fund compensates Dreyfus Transfer, Inc., a wholly-owned subsidiary of Dreyfus, under a transfer agency agreement for providing personnel and facilities to perform transfer agency services for the fund. During the period ended November 30, 2011, the fund was charged $1,447 pursuant to the transfer agency agreement, which is included in Shareholder servicing costs in the Statement of Operations.
The fund has arrangements with the custodian and cash management bank whereby the fund may receive earnings credits when positive cash balances are maintained, which are used to offset custody and cash management fees. For financial reporting purposes, the fund includes net earnings credits as an expense offset in the Statement of Operations.
The fund compensates The Bank of New York Mellon under a cash management agreement for performing cash management services related to fund subscriptions and redemptions. During the period ended November 30, 2011, the fund was charged $117 pursuant to the cash management agreement, which is included in Shareholder servicing costs in the Statement of Operations.These fees were partially offset by earnings credits of $4.
The fund also compensates The Bank of New York Mellon under a custody agreement for providing custodial services for the fund. During the period ended November 30, 2011, the fund was charged $29,783 pursuant to the custody agreement.
During the period ended November 30, 2011, the fund was charged $6,356 for services performed by the Chief Compliance Officer.
The Fund 27
NOTES TO FINANCIAL STATEMENTS (continued)
The components of “Due to The Dreyfus Corporation and affiliates” in the Statement of Assets and Liabilities consist of: management fees $223,482, Rule 12b-1 distribution plan fees $123, shareholder services plan fees $233, custodian fees $8,000, chief compliance officer fees $4,743 and transfer agency per account fees $185.
(d) Each Board member also serves as a Board member of other funds within the Dreyfus complex. Annual retainer fees and attendance fees are allocated to each fund based on net assets.
NOTE 4—Securities Transactions:
The aggregate amount of purchases and sales of investment securities, excluding short-term securities, during the period ended November 30, 2011, amounted to $219,170,092 and $28,498,957, respectively.
At November 30, 2011, the cost of investments for federal income tax purposes was $340,477,592; accordingly, accumulated net unrealized appreciation on investments was $33,981,615, consisting of $39,845,875 gross unrealized appreciation and $5,864,260 gross unrealized depreciation.
28
REPORT OF INDEPENDENT REGISTERED
PUBLIC ACCOUNTING FIRM
Shareholders and Board of Directors
Dreyfus U.S. Equity Fund
We have audited the accompanying statement of assets and liabilities, including the statement of investments, of Dreyfus U.S. Equity Fund (one of the series comprising Strategic Funds, Inc.) as of November 30, 2011, and the related statement of operations for the year then ended, the statement of changes in net assets for each of the two years in the period then ended and financial highlights for each of the periods indicated therein. These financial statements and financial highlights are the responsibility of the Fund’s management. Our responsibility is to express an opinion on these financial statements and financial highlights based on our audits.
We conducted our audits in accordance with the standards of the Public Company Accounting Oversight Board (United States). Those standards require that we plan and perform the audit to obtain reasonable assurance about whether the financial statements and financial highlights are free of material misstatement. We were not engaged to perform an audit of the Fund’s internal control over financial reporting. Our audits included consideration of internal control over financial reporting as a basis for designing audit procedures that are appropriate in the circumstances, but not for the purpose of expressing an opinion on the effectiveness of the Fund’s internal control over financial reporting. Accordingly, we express no such opinion. An audit also includes examining, on a test basis, evidence supporting the amounts and disclosures in the financial statements and financial highlights, assessing the accounting principles used and significant estimates made by management, and evaluating the overall financial statement presentation. Our procedures included confirmation of securities owned as of November 30, 2011 by correspondence with the custodian and others.We believe that our audits provide a reasonable basis for our opinion.
In our opinion, the financial statements and financial highlights referred to above present fairly, in all material respects, the financial position of Dreyfus U.S. Equity Fund at November 30, 2011, the results of its operations for the year then ended, the changes in its net assets for each of the two years in the period then ended, and the financial highlights for each of the indicated periods, in conformity with U.S. generally accepted accounting principles.
![]()
New York, New York
January 27, 2012
The Fund 29
IMPORTANT TAX INFORMATION (Unaudited)
For federal tax purposes, the fund hereby designates 70.04% of the ordinary dividends paid during the fiscal year ended November 30, 2011 as qualifying for the corporate dividends received deduction. Also, certain dividends paid by the fund may be subject to a maximum tax rate of 15%, as provided for by the Jobs and Growth Tax Relief Reconciliation Act of 2003. Of the distributions paid during the fiscal year, $728,717 represents the maximum amount that may be considered qualified dividend income. Shareholders will receive notification in early 2012 of the percentage applicable to the preparation of their 2011 income tax returns.Also, the fund hereby designates $.0597 per share as a short-term capital gain distribution paid on December 30, 2010.
30
INFORMATION ABOUT THE RENEWAL OF THE
FUND’S MANAGEMENT AND SUB-INVESTMENT
ADVISORY AGREEMENTS (Unaudited)
At a meeting of the fund’s Board of Directors held on November 7-8, 2011, the Board considered the renewal of the fund’s Management Agreement with Dreyfus pursuant to which Dreyfus provides the fund with investment advisory and administrative services, and of Dreyfus’ Sub-Investment Advisory Agreement with Walter Scott & Partners Limited (“Walter Scott”)(the “Sub-Advisory Agreement”), pursuant to which Walter Scott serves as sub-investment adviser and provides day-to-day management of the fund’s portfolio (collectively, the “Agreements”). The Board members, none of whom are “interested persons” (as defined in the Investment Company Act of 1940, as amended) of the fund, were assisted in their review by independent legal counsel and met with counsel in executive session separate from representatives of Dreyfus and Walter Scott. In considering the renewal of the Agreements, the Board considered all factors that it believed to be relevant, including those discussed below.The Board did not identify any one factor as dispositive, and each Board member may have attributed different weights to the factors considered.
Analysis of Nature, Extent and Quality of Services Provided to the Fund.The Board considered information previously provided to them in a presentation from Dreyfus representatives regarding the nature, extent, and quality of the services provided to funds in the Dreyfus fund complex, and by Walter Scott to the fund pursuant to the Sub-Advisory Agreement, and representatives of Dreyfus and Walter Scott confirmed that there had been no material changes in this information. Dreyfus provided the number of open accounts in the fund, the fund’s asset size and the allocation of fund assets among distribution channels. Dreyfus also had previously provided information regarding the diverse intermediary relationships and distribution channels of funds in the Dreyfus fund complex and Dreyfus’ corresponding need for broad, deep, and diverse resources to be able to provide ongoing shareholder services to each distribution channel, including the distribution channel(s) for the fund.
The Fund 31
INFORMATION ABOUT THE RENEWAL OF THE FUND’S MANAGEMENT AND
SUB-INVESTMENT ADVISORY AGREEMENTS (Unaudited) (continued)
The Board also considered research support available to, and portfolio management capabilities of, the fund’s portfolio management personnel and that Dreyfus also provides oversight of day-to-day fund operations, including fund accounting and administration and assistance in meeting legal and regulatory requirements.The Board members also considered Dreyfus’ extensive administrative, accounting, and compliance infrastructures, and Dreyfus’ supervisory activities over Walter Scott. The Board also considered portfolio management’s brokerage policies and practices (including policies and practices regarding soft dollars) and the standards applied in seeking best execution.
Comparative Analysis of the Fund’s Performance and Management Fee and Expense Ratio.The Board reviewed reports prepared by Lipper, Inc. (“Lipper”), an independent provider of investment company data, which included information comparing (1) the fund’s performance with the performance of a group of comparable funds (the “Performance Group”) and with a broader group of funds (the “Performance Universe”), all for various periods ended September 30, 2011, and (2) the fund’s actual and contractual management fees and total expenses with those of a group of comparable funds (the “Expense Group”) and with a broader group of funds (the “Expense Universe”), the information for which was derived in part from fund financial statements available to Lipper as of September 30, 2011. Dreyfus previously had furnished the Board with a description of the methodology Lipper used to select the Performance Group and Performance Universe and the Expense Group and Expense Universe.
Dreyfus representatives stated that the usefulness of performance comparisons may be affected by a number of factors, including different investment limitations that may be applicable to the fund and comparison funds.The Board members discussed the results of the comparisons and noted that the fund’s total return performance was above the Performance Group median and the Performance Universe median for the various time periods.The Board also noted that the fund commenced operations in May 2008 and the fund’s number one ranking in the Performance Group for the 1-year and 3-year periods.
32
Dreyfus also provided information showing the fund’s total return for its two calendar years of operation compared with the return of the fund’s benchmark index, and the Board noted that the fund’s return was higher in one of the two years.
The Board also reviewed the range of actual and contractual management fees and total expenses of the Expense Group and Expense Universe funds and discussed the results of the comparisons. They noted that the fund’s contractual management fee was at the Expense Group median, the fund’s actual management fee was above the Expense Group median and the Expense Universe median, and the fund’s actual total expenses were below the Expense Group median and above the Expense Universe median.
Dreyfus representatives noted that there were no funds in the same Lipper category as the fund managed by Dreyfus,Walter Scott, or their affiliates, nor any separate accounts and/or other types of client portfolios advised by Dreyfus or Walter Scott considered to have similar investment strategies and policies as the fund.
The Board considered the fee toWalter Scott in relation to the fee paid to Dreyfus by the fund and the respective services provided by Walter Scott and Dreyfus.The Board also noted Walter Scott’s fee is paid by Dreyfus (out of its fee from the fund) and not the fund.
Analysis of Profitability and Economies of Scale. Dreyfus’ representatives reviewed the expenses allocated and profit received by Dreyfus and the resulting profitability percentage for managing the fund, and the method used to determine the expenses and profit. The Board concluded that the profitability results were not unreasonable given the services rendered and service levels provided by Dreyfus. The Board previously had been provided with information prepared by an independent consulting firm regarding Dreyfus’ approach to allocating costs to, and determining the profitability of, individual funds and the entire Dreyfus fund complex. The consulting firm also had analyzed where any economies of scale might emerge in connection with the management of a fund.
TheFund 33
INFORMATION ABOUT THE RENEWAL OF THE FUND’S MANAGEMENT AND
SUB-INVESTMENT ADVISORY AGREEMENTS (Unaudited) (continued)
The Board’s counsel stated that the Board should consider the profitability analysis (1) as part of their evaluation of whether the fees under the Agreements bear a reasonable relationship to the mix of services provided by Dreyfus and Walter Scott, including the nature, extent and quality of such services, and (2) in light of the relevant circumstances for the fund and the extent to which economies of scale would be realized if the fund grows and whether fee levels reflect these economies of scale for the benefit of fund shareholders. Since Dreyfus, and not the fund, pays Walter Scott pursuant to the Sub-Advisory Agreement, the Board did not considerWalter Scott’s profitability to be relevant to its deliberations. Dreyfus representatives noted that, as a result of shared and allocated costs among funds in the Dreyfus funds complex, the extent of economies of scale could depend substantially on the level of assets in the complex as a whole, so that increases and decreases in complex-wide assets can affect potential economies of scale in a manner that is disproportionate to, or even in the opposite direction from, changes in the fund’s asset level.The Board also considered potential benefits to Dreyfus andWalter Scott from acting as investment adviser and sub-investment adviser, respectively, and noted there were no soft dollar arrangements in effect for trading the fund’s investments.
At the conclusion of these discussions, the Board agreed that it had been furnished with sufficient information to make an informed business decision with respect to the renewal of the Agreements. Based on the discussions and considerations as described above, the Board concluded and determined as follows.
The Board concluded that the nature, extent, and quality of the services provided by Dreyfus and Walter Scott are adequate and appropriate.
The Board was satisfied with the fund’s performance, in light of the considerations described above.
34
The Board concluded that the fees paid to Dreyfus were reasonable in light of the considerations described above.
The Board determined that the economies of scale which may accrue to Dreyfus and its affiliates in connection with the management of the fund had been adequately considered by Dreyfus in connection with the fee rate charged to the fund pursuant to the Agreement and that, to the extent in the future it were determined that material economies of scale had not been shared with the fund, the Board would seek to have those economies of scale shared with the fund.
The Board considered these conclusions and determinations, along with information received on a routine and regular basis throughout the year. In addition, it should be noted that the Board’s consideration of the contractual fee arrangements for this fund had the benefit of a number of years of reviews of prior or similar agreements during which lengthy discussions took place between the Board and Dreyfus representatives. Certain aspects of the arrangements may receive greater scrutiny in some years than in others, and the Board’s conclusions may be based, in part, on their consideration of the same or similar arrangements in prior years.The Board determined that renewal of the Agreements was in the best interests of the fund and its shareholders.
The Fund 35
BOARD MEMBERS INFORMATION (Unaudited)
| Joseph S. DiMartino (68) |
| Chairman of the Board (1995) |
| Principal Occupation During Past 5Years: |
| • Corporate Director and Trustee |
| Other Public Company Board Memberships During Past 5Years: |
| • CBIZ (formerly, Century Business Services, Inc.), a provider of outsourcing functions for small |
| and medium size companies, Director (1997-present) |
| • Sunair Services Corporation, a provider of certain outdoor-related services to homes and |
| businesses, Director (2005-2009) |
| • The Newark Group, a provider of a national market of paper recovery facilities, paperboard |
| mills and paperboard converting plants, Director (2000-2010) |
| No. of Portfolios for which Board Member Serves: 164 |
| ——————— |
| David W. Burke (75) |
| Board Member (1994) |
| Principal Occupation During Past 5Years: |
| • Corporate Director and Trustee |
| No. of Portfolios for which Board Member Serves: 82 |
| ——————— |
| William Hodding Carter III (76) |
| Board Member (1988) |
| Principal Occupation During Past 5Years: |
| • Professor of Leadership & Public Policy, University of North Carolina, Chapel Hill (2006-present) |
| • President and Chief Executive Officer of the John S. and James L. Knight Foundation (1998-2006) |
| No. of Portfolios for which Board Member Serves: 29 |
| ——————— |
| Gordon J. Davis (70) |
| Board Member (2006) |
| Principal Occupation During Past 5Years: |
| • Partner in the law firm of Dewey & LeBoeuf LLP |
| Other Public Company Board Memberships During Past 5Years: |
| • Consolidated Edison, Inc., a utility company, Director (1997-present) |
| • The Phoenix Companies, Inc., a life insurance company, Director (2000-present) |
| No. of Portfolios for which Board Member Serves: 43 |
36
| Joni Evans (69) |
| Board Member (2006) |
| Principal Occupation During Past 5Years: |
| • Chief Executive Officer, www.wowOwow.com an online community dedicated to women’s |
| conversations and publications (2007-present) |
| • Principal, Joni Evans Ltd. (publishing) (2006-present) |
| • Senior Vice President of the William Morris Agency (1994-2006) |
| No. of Portfolios for which Board Member Serves: 29 |
| ——————— |
| Ehud Houminer (71) |
| Board Member (1994) |
| Principal Occupation During Past 5Years: |
| • Executive-in-Residence at the Columbia Business School, Columbia University (1992-present) |
| Other Public Company Board Memberships During Past 5Years: |
| • Avnet Inc., an electronics distributor, Director (1993-present) |
| No. of Portfolios for which Board Member Serves: 64 |
| ——————— |
| Richard C. Leone (71) |
| Board Member (1984) |
| Principal Occupation During Past 5Years: |
| • Senior Fellow of The Century Foundation (formerly,The Twentieth Century Fund, Inc.), a tax |
| exempt research foundation engaged in the study of economic, foreign policy and domestic issues |
| Other Public Company Board Memberships During Past 5Years: |
| • Partnership for a Secure America, Director |
| No. of Portfolios for which Board Member Serves: 29 |
| ——————— |
| Hans C. Mautner (74) |
| Board Member (1984) |
| Principal Occupation During Past 5Years: |
| • President—International Division and an Advisory Director of Simon Property Group, a real |
| estate investment company (1998-2010) |
| • Chairman and Chief Executive Officer of Simon Global Limited (1999-2010) |
| No. of Portfolios for which Board Member Serves: 29 |
The Fund 37
BOARD MEMBERS INFORMATION (Unaudited) (continued)
| Robin A. Melvin (48) |
| Board Member (1995) |
| Principal Occupation During Past 5Years: |
| • Director, Boisi Family Foundation, a private family foundation that supports youth-serving |
| organizations that promote the self sufficiency of youth from disadvantaged circumstances |
| (1995-present) |
| No. of Portfolios for which Board Member Serves: 53 |
| ——————— |
| Burton N.Wallack (61) |
| Board Member (2006) |
| Principal Occupation During Past 5Years: |
| • President and Co-owner of Wallack Management Company, a real estate management company |
| No. of Portfolios for which Board Member Serves: 29 |
| ——————— |
| John E. Zuccotti (74) |
| Board Member (1984) |
| Principal Occupation During Past 5Years: |
| • Chairman of Brookfield Properties, Inc. |
| • Senior Counsel of Weil, Gotshal & Manges, LLP |
| • Emeritus Chairman of the Real Estate Board of New York |
| Other Public Company Board Memberships During Past 5Years: |
| • Emigrant Savings Bank, Director (2004-present) |
| • Doris Duke Charitable Foundation,Trustee (2006-present) |
| No. of Portfolios for which Board Member Serves: 29 |
| ——————— |
| Once elected all Board Members serve for an indefinite term, but achieve Emeritus status upon reaching age 80.The |
| address of the Board Members and Officers is in c/o The Dreyfus Corporation, 200 Park Avenue, NewYork, NewYork |
| 10166.Additional information about the Board Members is available in the fund’s Statement of Additional Information |
| which can be obtained from Dreyfus free of charge by calling this toll free number: 1-800-DREYFUS. |
| Arnold S. Hiatt, Emeritus Board Member |
38
OFFICERS OF THE FUND (Unaudited)
The Fund 39
OFFICERS OF THE FUND (Unaudited) (continued)
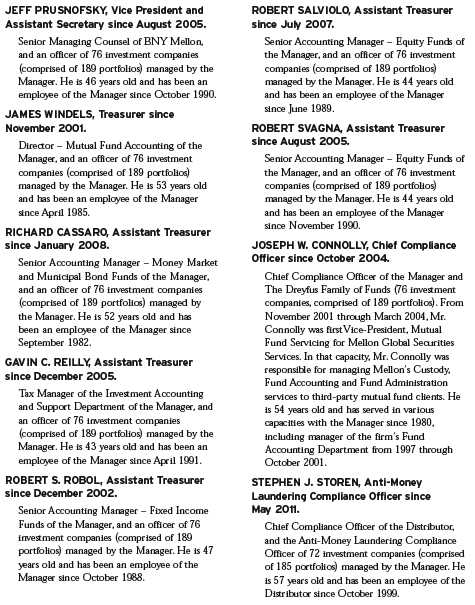
40
| Global Stock Fund |
ANNUAL REPORT November 30, 2011
Save time. Save paper. View your next shareholder report online as soon as it’s available. Log into www.dreyfus.com and sign up for Dreyfus eCommunications. It’s simple and only takes a few minutes.
The views expressed in this report reflect those of the portfolio manager only through the end of the period covered and do not necessarily represent the views of Dreyfus or any other person in the Dreyfus organization. Any such views are subject to change at any time based upon market or other conditions and Dreyfus disclaims any responsibility to update such views.These views may not be relied on as investment advice and, because investment decisions for a Dreyfus fund are based on numerous factors, may not be relied on as an indication of trading intent on behalf of any Dreyfus fund.
| Not FDIC-Insured • Not Bank-Guaranteed • May Lose Value |
Contents | |
THE FUND | |
| 2 | A Letter from the Chairman and CEO |
| 3 | Discussion of Fund Performance |
| 6 | Fund Performance |
| 8 | Understanding Your Fund’s Expenses |
| 8 | Comparing Your Fund’s Expenses With Those of Other Funds |
| 9 | Statement of Investments |
| 12 | Statement of Assets and Liabilities |
| 13 | Statement of Operations |
| 14 | Statement of Changes in Net Assets |
| 16 | Financial Highlights |
| 19 | Notes to Financial Statements |
| 32 | Report of Independent Registered Public Accounting Firm |
| 33 | Important Tax Information |
| 34 | Information About the Renewal of the Fund’s Management and Sub-Investment Advisory Agreements |
| 39 | Board Members Information |
| 42 | Officers of the Fund |
FOR MORE INFORMATION | |
Back Cover |
| Global Stock Fund |
The Fund

A LETTER FROM THE CHAIRMAN AND CEO
Dear Shareholder:
We present to you this annual report for Global Stock Fund, covering the 12-month period from December 1, 2010, through November 30, 2011. For information about how the fund performed during the reporting period, as well as general market perspectives, we provide a Discussion of Fund Performance on the pages that follow.
Global financial markets proved volatile for much of 2011 as investors struggled with persistently sluggish economic growth and global credit concerns. An escalating sovereign debt crisis in Europe, monetary tightening in China and India and a contentious debate regarding taxes, spending and borrowing in the United States sparked a flight to quality in which investors flocked to traditional safe havens, such as the sovereign debt of developed nations, while riskier stocks and higher yielding bonds generally suffered. Consequently, most international stocks lost value over the reporting period.
The global economic outlook currently remains clouded by uncertainty regarding the ability of European policymakers to contain the region’s debt crisis. Meanwhile, conditions in other parts of the world seem to be improving as commodity prices have moderated, inflationary pressures have receded in the emerging markets and consumer confidence has strengthened in the United States.To assess the potential impact of these and other developments on your investments, we encourage you, as always, to speak with your financial advisor.
Thank you for your continued confidence and support.

Jonathan R. Baum
Chairman and Chief Executive Officer
The Dreyfus Corporation
December 15, 2011
2

DISCUSSION OF FUND PERFORMANCE
For the period of December 1, 2010, through November 30, 2011, as provided by Charlie Macquaker and Roy Leckie of Walter Scott & Partners Limited (Walter Scott), Sub-investment adviser
Fund and Market Performance Overview
For the 12-month period ended November 30, 2011, Global Stock Fund’s Class A shares produced a total return of 4.86%, Class C shares returned 4.01% and Class I shares returned 5.23%.1 In comparison, the fund’s benchmark index, the Morgan Stanley Capital International World Index (the “MSCIWorld Index”), achieved a 1.46% return over the same period.2 Stock prices proved volatile during the reporting period due to adverse macroeconomic events, particularly a resurgent sovereign debt crisis in Europe.The fund produced higher returns than its benchmark, primarily due to a relatively defensive investment posture during the market downturn over the summer of 2011.
The Fund’s Investment Approach
The fund seeks long-term total returns by investing in high-quality companies capable of sustainable growth and wealth creation over a long time horizon. The firm focuses on individual stock selection through extensive fundamental research. Candidates are initially selected for research if they meet certain broad absolute and trend criteria. Financial statements are analyzed in an effort to identify the nature of the cash generation that is looked for in any investment and to understand the variables that demonstrate robust financial health and define long-term competitive advantage. Companies meeting the financial criteria are then subjected to a detailed investigation of products, costs and pricing, competition, industry position and outlook.
Macroeconomic Developments Challenged Global Markets
Improving economic data and rising corporate earnings generally supported global stock prices into the first quarter of 2011. However, the rally was interrupted in February by higher energy prices stemming from unrest in the Middle East, and again in March, when natural and nuclear disasters in Japan disrupted the global industrial supply chain. Still, investors proved resilient, and many markets rebounded from these unexpected shocks.
The Fund 3
DISCUSSION OF FUND PERFORMANCE (continued)
Investor sentiment deteriorated in earnest in April, as investors grew increasingly concerned about a sovereign debt crisis in Europe, where Greece and other members of the European Union saw their borrowing costs soar, pushing them to the brink of insolvency. Global investors also reacted cautiously to a contentious political debate in the United States regarding government spending and borrowing. In the emerging markets, China and India raised short-term interest rates to prevent an acceleration of inflation, threatening a major engine of global growth.
As investors became more risk-averse, they turned to traditional safe havens, such as U.S. Treasury securities and the German bund. Consequently, riskier assets, including stocks, generally declined in most markets over the reporting period’s second half. Partial rebounds in October and November mitigated those losses to a degree, enabling the benchmark to post a positive absolute return for the reporting period overall.
Stock Selection Strategy Proved Effective in Downturn
Companies that met near-term expectations tended to hold up well in this environment, but those that fell short were punished, often regardless of attractive valuations and longer-term fundamental strengths. Walter Scott’s bottom-up security selection process identified relatively few opportunities in Europe, helping to avoid the brunt of the region’s weakness.The fund also maintained light exposure to the financials and materials sectors, which ranked among the MSCI World Index’s worst performing industry groups. Conversely, our process identified a number of opportunities in the traditionally defensive health care sector and in the information technology sector, particularly in the United States, where new technological trends helped drive stock prices higher.
The fund’s top individual performer for the reporting period was U.S. payments processor MasterCard, which benefited as consumers increasingly used credit cards instead of cash. U.S. industrial company Fastenal achieved favorable results from store growth and the innovative use of vending machines for sales of fasteners. U.K. grocery chain WM Morrison Supermarkets adapted well to the financial challenges being faced by its customer base. U.S. parts manufacturer Precision Castparts benefited from sales of components used in new aircraft. U.K. energy producer BG Group increased production in Brazil and Australia.
4
Disappointments during the reporting period included Japanese video game maker Nintendo, where sales of new hardware and software fell short of expectations. U.K.-based banks HSBC Holdings and Standard Chartered were hurt by the debt crisis despite relatively light exposure to Europe’s problems. Japanese air conditioning systems specialist Daikin Industries suffered from disruption due to the earthquake and tsunami. Chinese energy giant CNOOC was negatively impacted by a series of oil spills, in contrast to their previously exemplary record, albeit that the actions were the primary responsibility of others.
Finding Opportunities in Many Global Markets
Despite headwinds including high unemployment and deleveraging among governments and individuals, we have continued to find attractive opportunities in most equity markets.The investment team at Walter Scott believes that market leading, cash generative companies with high growth rates, rising profits and healthy balance sheets can prosper in good times and bad, and therfore the investment team can be optimistic about the fund’s holdings. In the team’s collective judgment, improved market momentum, confidence and liquidity have buoyed investor sentiment, and barring a new and serious crisis, stocks with market leading positions, strong fundamentals and growth prospects should gain in value over the foreseeable future.
December 15, 2011
| Equity funds are subject generally to market, market sector, market liquidity, issuer and investment | |
| style risks, among other factors, to varying degrees, all of which are more fully described in the | |
| fund’s prospectus. | |
| Investing internationally involves special risks, including changes in currency exchange rates, | |
| political, economic and social instability, a lack of comprehensive company information, differing | |
| auditing and legal standards and less market liquidity.These risks generally are greater with | |
| emerging market countries than with more economically and politically established foreign countries. | |
| 1 | Total return includes reinvestment of dividends and any capital gains paid, and does not take into |
| consideration the maximum initial sales charge in the case of Class A shares, or the applicable | |
| contingent deferred sales charge imposed on redemptions in the case of Class C shares. Had these | |
| charges been reflected, returns would have been lower. Past performance is no guarantee of future | |
| results. Share price and investment return fluctuate such that upon redemption, fund shares may be | |
| worth more or less than their original cost. | |
| 2 | SOURCE: LIPPER INC. — Reflects reinvestment of net dividends and, where applicable, |
| capital gain distributions.The Morgan Stanley Capital International (MSCI) World Index is an | |
| unmanaged index of global stock market performance, including the United States, Canada, | |
| Europe,Australia, New Zealand and the Far East. Investors cannot invest directly in any index. |
The Fund 5
FUND PERFORMANCE
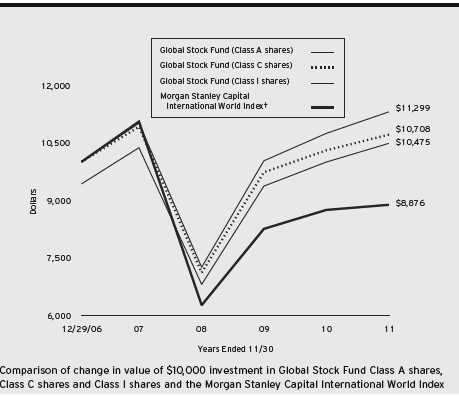
† Source: Lipper Inc.
Past performance is not predictive of future performance.
The above graph compares a $10,000 investment made in each of the Class A, Class C and Class I shares of Global Stock Fund on 12/29/06 (inception date) to a $10,000 investment made in the Morgan Stanley Capital International World Index (the “Index”) on that date.All dividends and capital gain distributions are reinvested.
The fund’s performance shown in the line graph above takes into account the maximum initial sales charge on Class A shares and all other applicable fees and expenses on all classes.The Index is an unmanaged index of global stock market performance, including the United States, Canada,Australia, New Zealand and the Far East and includes net dividends reinvested. Unlike a mutual fund, the Index is not subject to charges, fees and other expenses. Investors cannot invest directly in any index. Further information relating to fund performance, including expense reimbursements, if applicable, is contained in the Financial Highlights section of the prospectus and elsewhere in this report.
6
| Average Annual Total Returns as of 11/30/11 | |||||
| Inception | From | ||||
| Date | 1 | Year | Inception | ||
| Class A shares | |||||
| with maximum sales charge (5.75%) | 12/29/06 | –1.15 | % | 0.95 | % |
| without sales charge | 12/29/06 | 4.86 | % | 2.17 | % |
| Class C shares | |||||
| with applicable redemption charge † | 12/29/06 | 3.01 | % | 1.40 | % |
| without redemption | 12/29/06 | 4.01 | % | 1.40 | % |
| Class I shares | 12/29/06 | 5.23 | % | 2.51 | % |
| Morgan Stanley Capital | |||||
| International World Index | 12/31/06 | 1.46 | % | –2.40 | % |
Past performance is not predictive of future performance.The fund’s performance shown in the graph and table does not reflect the deduction of taxes that a shareholder would pay on fund distributions or the redemption of fund shares.
| † The maximum contingent deferred sales charge for Class C shares is 1% for shares redeemed within one year of the |
| date of purchase. |
The Fund 7
UNDERSTANDING YOUR FUND’S EXPENSES (Unaudited)
As a mutual fund investor, you pay ongoing expenses, such as management fees and other expenses. Using the information below, you can estimate how these expenses affect your investment and compare them with the expenses of other funds.You also may pay one-time transaction expenses, including sales charges (loads) and redemption fees, which are not shown in this section and would have resulted in higher total expenses. For more information, see your fund’s prospectus or talk to your financial adviser.
Review your fund’s expenses
The table below shows the expenses you would have paid on a $1,000 investment in Global Stock Fund from June 1, 2011 to November 30, 2011. It also shows how much a $1,000 investment would be worth at the close of the period, assuming actual returns and expenses.
Expenses and Value of a $1,000 Investment
assuming actual returns for the six months ended November 30, 2011
| Class A | Class C | Class I | ||||
| Expenses paid per $1,000† | $ | 6.11 | $ | 9.68 | $ | 4.51 |
| Ending value (after expenses) | $ | 933.70 | $ | 930.40 | $ | 935.80 |
COMPARING YOUR FUND’S EXPENSES
WITH THOSE OF OTHER FUNDS (Unaudited)
Using the SEC’s method to compare expenses
The Securities and Exchange Commission (SEC) has established guidelines to help investors assess fund expenses. Per these guidelines, the table below shows your fund’s expenses based on a $1,000 investment, assuming a hypothetical 5% annualized return. You can use this information to compare the ongoing expenses (but not transaction expenses or total cost) of investing in the fund with those of other funds.All mutual fund shareholder reports will provide this information to help you make this comparison. Please note that you cannot use this information to estimate your actual ending account balance and expenses paid during the period.
Expenses and Value of a $1,000 Investment
assuming a hypothetical 5% annualized return for the six months ended November 30, 2011
| Class A | Class C | Class I | ||||
| Expenses paid per $1,000† | $ | 6.38 | $ | 10.10 | $ | 4.71 |
| Ending value (after expenses) | $ | 1,018.75 | $ | 1,015.04 | $ | 1,020.41 |
| † Expenses are equal to the fund’s annualized expense ratio of 1.26% for Class A, 2.00% for Class C and .93% |
| for Class I, multiplied by the average account value over the period, multiplied by 183/365 (to reflect the one-half |
| year period). |
8
STATEMENT OF INVESTMENTS
November 30, 2011
| Common Stocks—96.7% | Shares | Value ($) |
| Australia—3.8% | ||
| CSL | 305,300 | 10,016,118 |
| Woodside Petroleum | 298,000 | 10,384,529 |
| 20,400,647 | ||
| Brazil—2.0% | ||
| Petroleo Brasileiro, ADR | 432,800 | 10,850,296 |
| Canada—1.9% | ||
| Suncor Energy | 346,700 | 10,442,300 |
| China—1.0% | ||
| China Shenhua Energy, Cl. H | 1,182,000 | 5,224,117 |
| Denmark—2.2% | ||
| Novo Nordisk, Cl. B | 103,800 | 11,779,149 |
| France—3.6% | ||
| Cie Generale d’Optique Essilor International | 115,000 | 8,206,890 |
| L’Oreal | 102,100 | 11,019,298 |
| 19,226,188 | ||
| Hong Kong—6.5% | ||
| China Mobile | 1,082,000 | 10,666,482 |
| CLP Holdings | 940,500 | 8,352,960 |
| CNOOC | 5,591,000 | 10,783,699 |
| Hong Kong & China Gas | 2,107,880 | 4,890,683 |
| 34,693,824 | ||
| Japan—15.6% | ||
| Canon | 244,700 | 11,073,820 |
| Chugai Pharmaceutical | 371,100 | 5,670,005 |
| Daikin Industries | 183,200 | 5,398,742 |
| Denso | 376,900 | 10,772,462 |
| FANUC | 64,400 | 10,572,381 |
| Honda Motor | 331,600 | 10,482,904 |
| Keyence | 20,870 | 5,338,361 |
| Mitsubishi Estate | 616,000 | 10,308,713 |
| Nintendo | 18,300 | 2,774,973 |
| Shin-Etsu Chemical | 224,600 | 11,276,110 |
| 83,668,471 | ||
| Singapore—1.0% | ||
| DBS Group Holdings | 553,285 | 5,508,645 |
The Fund 9
STATEMENT OF INVESTMENTS (continued)
| Common Stocks (continued) | Shares | Value ($) | ||
| Spain—1.8% | ||||
| Inditex | 111,700 | 9,460,302 | ||
| Sweden—2.1% | ||||
| Hennes & Mauritz, Cl. B | 353,000 | 11,163,210 | ||
| Switzerland—4.4% | ||||
| Nestle | 172,000 | 9,629,816 | ||
| Novartis | 100,600 | 5,418,702 | ||
| SGS | 5,000 | 8,422,723 | ||
| 23,471,241 | ||||
| United Kingdom—10.4% | ||||
| BG Group | 455,800 | 9,714,685 | ||
| HSBC Holdings | 1,352,000 | 10,489,088 | ||
| Reckitt Benckiser Group | 181,000 | 9,141,013 | ||
| Standard Chartered | 491,200 | 10,665,696 | ||
| Tesco | 1,515,000 | 9,631,121 | ||
| WM Morrison Supermarkets | 1,200,500 | 6,064,748 | ||
| 55,706,351 | ||||
| United States—40.4% | ||||
| Abbott Laboratories | 211,000 | 11,510,050 | ||
| Adobe Systems | 372,300 | a | 10,208,466 | |
| Amphenol, Cl. A | 165,400 | 7,497,582 | ||
| Automatic Data Processing | 194,600 | 9,942,114 | ||
| C.R. Bard | 79,700 | 6,949,043 | ||
| Cisco Systems | 624,900 | 11,648,136 | ||
| Colgate-Palmolive | 111,700 | 10,220,550 | ||
| EOG Resources | 117,100 | 12,147,954 | ||
| Fastenal | 210,000 | 8,746,500 | ||
| FLIR Systems | 151,500 | 4,069,290 | ||
| Gilead Sciences | 163,802 | a | 6,527,510 | |
| Google, Cl. A | 19,000 | a | 11,388,410 | |
| Intel | 445,300 | 11,092,423 | ||
| Johnson & Johnson | 145,600 | 9,423,232 | ||
| MasterCard, Cl. A | 29,700 | 11,124,135 | ||
| Microsoft | 376,700 | 9,635,986 | ||
| NIKE, Cl. B | 110,900 | 10,666,362 |
10
| Common Stocks (continued) | Shares | Value ($) | |
| United States (continued) | |||
| Oracle | 340,100 | 10,662,135 | |
| Precision Castparts | 67,400 | 11,104,150 | |
| Schlumberger | 122,800 | 9,250,524 | |
| TJX | 179,400 | 11,068,980 | |
| Wal-Mart Stores | 185,200 | 10,908,280 | |
| 215,791,812 | |||
| Total Common Stocks | |||
| (cost $459,074,282) | 517,386,553 | ||
| Other Investment—1.7% | |||
| Registered Investment Company; | |||
| Dreyfus Institutional Preferred | |||
| Plus Money Market Fund | |||
| (cost $9,200,000) | 9,200,000 | b | 9,200,000 |
| Total Investments (cost $468,274,282) | 98.4 | % | 526,586,553 |
| Cash and Receivables (Net) | 1.6 | % | 8,803,849 |
| Net Assets | 100.0 | % | 535,390,402 |
ADR—American Depository Receipts
| a | Non-income producing security. |
| b | Investment in affiliated money market mutual fund. |
| Portfolio Summary (Unaudited)† | |||
| Value (%) | Value (%) | ||
| Information Technology | 21.7 | Financial | 6.9 |
| Energy | 14.7 | Utilities | 2.5 |
| Health Care | 14.2 | Materials | 2.1 |
| Consumer Staples | 12.4 | Telecommunication Services | 2.0 |
| Consumer Discretionary | 11.9 | Money Market Investment | 1.7 |
| Industrials | 8.3 | 98.4 | |
| † Based on net assets. | |||
| See notes to financial statements. | |||
The Fund 11
STATEMENT OF ASSETS AND LIABILITIES
November 30, 2011
| Cost | Value | ||
| Assets ($): | |||
| Investments in securities—See Statement of Investments: | |||
| Unaffiliated issuers | 459,074,282 | 517,386,553 | |
| Affiliated issuers | 9,200,000 | 9,200,000 | |
| Cash | 255,920 | ||
| Cash denominated in foreign currencies | 155,589 | 156,173 | |
| Receivable for shares of Common Stock subscribed | 3,553,016 | ||
| Receivable for investment securities sold | 4,446,945 | ||
| Dividends receivable | 1,315,070 | ||
| Prepaid expenses | 27,717 | ||
| 536,341,394 | |||
| Liabilities ($): | |||
| Due to The Dreyfus Corporation and affiliates—Note 3(c) | 433,203 | ||
| Payable for shares of Common Stock redeemed | 422,991 | ||
| Unrealized depreciation on forward foreign | |||
| currency exchange contracts—Note 4 | 5,785 | ||
| Interest payable—Note 2 | 77 | ||
| Accrued expenses | 88,936 | ||
| 950,992 | |||
| Net Assets ($) | 535,390,402 | ||
| Composition of Net Assets ($): | |||
| Paid-in capital | 470,059,088 | ||
| Accumulated undistributed investment income—net | 5,364,574 | ||
| Accumulated net realized gain (loss) on investments | 1,624,554 | ||
| Accumulated net unrealized appreciation (depreciation) | |||
| on investments and foreign currency transactions | 58,342,186 | ||
| Net Assets ($) | 535,390,402 | ||
| Net Asset Value Per Share | |||
| Class A | Class C | Class I | |
| Net Assets ($) | 48,872,025 | 13,872,441 | 472,645,936 |
| Shares Outstanding | 3,616,615 | 1,047,446 | 34,506,604 |
| Net Asset Value Per Share ($) | 13.51 | 13.24 | 13.70 |
| See notes to financial statements. | |||
12
STATEMENT OF OPERATIONS
Year Ended November 30, 2011
| Investment Income ($): | ||
| Income: | ||
| Cash dividends (net of $589,752 foreign taxes withheld at source): | ||
| Unaffiliated issuers | 10,298,403 | |
| Affiliated issuers | 12,791 | |
| Interest | 82 | |
| Total Income | 10,311,276 | |
| Expenses: | ||
| Management fee—Note 3(a) | 4,247,215 | |
| Shareholder servicing costs—Note 3(c) | 248,636 | |
| Custodian fees—Note 3(c) | 114,454 | |
| Distribution fees—Note 3(b) | 99,587 | |
| Professional fees | 77,125 | |
| Registration fees | 58,329 | |
| Directors’ fees and expenses—Note 3(d) | 47,036 | |
| Prospectus and shareholders’ reports | 15,729 | |
| Loan commitment fees—Note 2 | 6,751 | |
| Interest expense—Note 2 | 116 | |
| Miscellaneous | 27,463 | |
| Total Expenses | 4,942,441 | |
| Less—reduction in fees due to earnings credits—Note 3(c) | (53 | )�� |
| Net Expenses | 4,942,388 | |
| Investment Income—Net | 5,368,888 | |
| Realized and Unrealized Gain (Loss) on Investments—Note 4 ($): | ||
| Net realized gain (loss) on investments and foreign currency transactions | 1,938,967 | |
| Net realized gain (loss) on forward foreign currency exchange contracts | (95,526 | ) |
| Net Realized Gain (Loss) | 1,843,441 | |
| Net unrealized appreciation (depreciation) | ||
| on investments and foreign currency transactions | 11,853,826 | |
| Net unrealized appreciation (depreciation) on | ||
| forward foreign currency exchange contracts | (5,750 | ) |
| Net Unrealized Appreciation (Depreciation) | 11,848,076 | |
| Net Realized and Unrealized Gain (Loss) on Investments | 13,691,517 | |
| Net Increase in Net Assets Resulting from Operations | 19,060,405 | |
| See notes to financial statements. | ||
The Fund 13
STATEMENT OF CHANGES IN NET ASSETS
| Year Ended November 30, | ||||
| 2011 | 2010 | |||
| Operations ($): | ||||
| Investment income—net | 5,368,888 | 3,141,956 | ||
| Net realized gain (loss) on investments | 1,843,441 | 2,691,714 | ||
| Net unrealized appreciation | ||||
| (depreciation) on investments | 11,848,076 | 18,111,107 | ||
| Net Increase (Decrease) in Net Assets | ||||
| Resulting from Operations | 19,060,405 | 23,944,777 | ||
| Dividends to Shareholders from ($): | ||||
| Investment income—net: | ||||
| Class A Shares | (217,775 | ) | (42,464 | ) |
| Class C Shares | (10,303 | ) | (426 | ) |
| Class I Shares | (2,828,840 | ) | (1,883,788 | ) |
| Net realized gain on investments: | ||||
| Class A Shares | (121,894 | ) | — | |
| Class C Shares | (33,756 | ) | — | |
| Class I Shares | (1,159,738 | ) | — | |
| Total Dividends | (4,372,306 | ) | (1,926,678 | ) |
| Capital Stock Transactions ($): | ||||
| Net proceeds from shares sold: | ||||
| Class A Shares | 22,110,809 | 34,047,530 | ||
| Class C Shares | 6,607,448 | 9,123,000 | ||
| Class I Shares | 183,142,487 | 131,991,193 | ||
| Dividends reinvested: | ||||
| Class A Shares | 326,342 | 41,282 | ||
| Class C Shares | 32,739 | 288 | ||
| Class I Shares | 1,452,989 | 533,463 | ||
| Cost of shares redeemed: | ||||
| Class A Shares | (12,193,628 | ) | (6,678,358 | ) |
| Class C Shares | (3,247,869 | ) | (1,069,292 | ) |
| Class I Shares | (89,612,012 | ) | (51,703,102 | ) |
| Increase (Decrease) in Net Assets | ||||
| from Capital Stock Transactions | 108,619,305 | 116,286,004 | ||
| Total Increase (Decrease) in Net Assets | 123,307,404 | 138,304,103 | ||
| Net Assets ($): | ||||
| Beginning of Period | 412,082,998 | 273,778,895 | ||
| End of Period | 535,390,402 | 412,082,998 | ||
| Undistributed investment income—net | 5,364,574 | 3,054,605 | ||
14
| Year Ended November 30, | ||||
| 2011 | 2010 | |||
| Capital Share Transactions: | ||||
| Class A | ||||
| Shares sold | 1,631,287 | 2,722,607 | ||
| Shares issued for dividends reinvested | 24,013 | 3,318 | ||
| Shares redeemed | (898,291 | ) | (537,677 | ) |
| Net Increase (Decrease) in Shares Outstanding | 757,009 | 2,188,248 | ||
| Class C | ||||
| Shares sold | 487,100 | 734,684 | ||
| Shares issued for dividends reinvested | 2,439 | 24 | ||
| Shares redeemed | (243,895 | ) | (88,164 | ) |
| Net Increase (Decrease) in Shares Outstanding | 245,644 | 646,544 | ||
| Class I | ||||
| Shares sold | 13,282,493 | 10,475,370 | ||
| Shares issued for dividends reinvested | 105,749 | 42,507 | ||
| Shares redeemed | (6,619,481 | ) | (4,112,607 | ) |
| Net Increase (Decrease) in Shares Outstanding | 6,768,761 | 6,405,270 | ||
| See notes to financial statements. | ||||
The Fund 15
FINANCIAL HIGHLIGHTS
The following tables describe the performance for each share class for the fiscal periods indicated.All information (except portfolio turnover rate) reflects financial results for a single fund share.Total return shows how much your investment in the fund would have increased (or decreased) during each period, assuming you had reinvested all dividends and distributions.These figures have been derived from the fund’s financial statements.
| Year Ended November 30, | ||||||||||
| Class A Shares | 2011 | 2010 | 2009 | 2008 | 2007 | a | ||||
| Per Share Data ($): | ||||||||||
| Net asset value, beginning of period | 12.99 | 12.23 | 8.91 | 13.73 | 12.50 | |||||
| Investment Operations: | ||||||||||
| Investment income—netb | .11 | .07 | .06 | .05 | .04 | |||||
| Net realized and unrealized | ||||||||||
| gain (loss) on investments | .52 | .75 | 3.28 | (4.70 | ) | 1.19 | ||||
| Total from Investment Operations | .63 | .82 | 3.34 | (4.65 | ) | 1.23 | ||||
| Distributions: | ||||||||||
| Dividends from investment income—net | (.07 | ) | (.06 | ) | (.02 | ) | (.08 | ) | — | |
| Dividends from net realized | ||||||||||
| gain on investments | (.04 | ) | — | — | (.09 | ) | — | |||
| Total Distributions | (.11 | ) | (.06 | ) | (.02 | ) | (.17 | ) | — | |
| Net asset value, end of period | 13.51 | 12.99 | 12.23 | 8.91 | 13.73 | |||||
| Total Return (%)c | 4.86 | 6.70 | 37.57 | (34.32 | ) | 9.92 | d | |||
| Ratios/Supplemental Data (%): | ||||||||||
| Ratio of total expenses | ||||||||||
| to average net assets | 1.27 | 1.32 | 1.38 | 1.59 | 2.40 | e | ||||
| Ratio of net expenses | ||||||||||
| to average net assets | 1.27 | 1.32 | 1.38 | 1.47 | 1.46 | e | ||||
| Ratio of net investment income | ||||||||||
| to average net assets | .80 | .56 | .53 | .44 | .29 | e | ||||
| Portfolio Turnover Rate | 8.54 | 7.50 | 12.75 | 15.54 | 14.53 | d | ||||
| Net Assets, end of period ($ x 1,000) | 48,872 | 37,152 | 8,212 | 3,329 | 5,132 | |||||
| a | From December 29, 2006 (commencement of operations) to November 30, 2007. |
| b | Based on average shares outstanding at each month end. |
| c | Exclusive of sales charge. |
| d | Not annualized. |
| e | Annualized. |
See notes to financial statements.
16
| Year Ended November 30, | ||||||||||
| Class C Shares | 2011 | 2010 | 2009 | 2008 | 2007 | a | ||||
| Per Share Data ($): | ||||||||||
| Net asset value, beginning of period | 12.78 | 12.07 | 8.83 | 13.64 | 12.50 | |||||
| Investment Operations: | ||||||||||
| Investment income (loss)—netb | .01 | (.02 | ) | (.01 | ) | (.04 | ) | (.06 | ) | |
| Net realized and unrealized | ||||||||||
| gain (loss) on investments | .50 | .73 | 3.25 | (4.68 | ) | 1.20 | ||||
| Total from Investment Operations | .51 | .71 | 3.24 | (4.72 | ) | 1.14 | ||||
| Distributions: | ||||||||||
| Dividends from investment income—net | (.01 | ) | (.00 | )c | — | — | — | |||
| Dividends from net realized | ||||||||||
| gain on investments | (.04 | ) | — | — | (.09 | ) | — | |||
| Total Distributions | (.05 | ) | (.00 | )c | — | (.09 | ) | — | ||
| Net asset value, end of period | 13.24 | 12.78 | 12.07 | 8.83 | 13.64 | |||||
| Total Return (%)d | 4.01 | 5.90 | 36.69 | (34.82 | ) | 9.12 | e | |||
| Ratios/Supplemental Data (%): | ||||||||||
| Ratio of total expenses | ||||||||||
| to average net assets | 2.03 | 2.09 | 2.12 | 2.36 | 3.16 | f | ||||
| Ratio of net expenses | ||||||||||
| to average net assets | 2.03 | 2.09 | 2.09 | 2.22 | 2.20 | f | ||||
| Ratio of net investment income | ||||||||||
| (loss) to average net assets | .05 | (.17 | ) | (.11 | ) | (.29 | ) | (.46 | )f | |
| Portfolio Turnover Rate | 8.54 | 7.50 | 12.75 | 15.54 | 14.53 | e | ||||
| Net Assets, end of period ($ x 1,000) | 13,872 | 10,243 | 1,873 | 695 | 925 | |||||
| a | From December 29, 2006 (commencement of operations) to November 30, 2007. |
| b | Based on average shares outstanding at each month end. |
| c | Amount represents less than $.01 per share. |
| d | Exclusive of sales charge. |
| e | Not annualized. |
| f | Annualized. |
See notes to financial statements.
The Fund 17
FINANCIAL HIGHLIGHTS (continued)
| Year Ended November 30, | ||||||||||
| Class I Shares | 2011 | 2010 | 2009 | 2008 | 2007 | a,b | ||||
| Per Share Data ($): | ||||||||||
| Net asset value, beginning of period | 13.15 | 12.36 | 8.99 | 13.76 | 12.50 | |||||
| Investment Operations: | ||||||||||
| Investment income—netc | .16 | .12 | .11 | .10 | .07 | |||||
| Net realized and unrealized | ||||||||||
| gain (loss) on investments | .53 | .76 | 3.31 | (4.76 | ) | 1.19 | ||||
| Total from Investment Operations | .69 | .88 | 3.42 | (4.66 | ) | 1.26 | ||||
| Distributions: | ||||||||||
| Dividends from investment income—net | (.10 | ) | (.09 | ) | (.05 | ) | (.02 | ) | — | |
| Dividends from net realized | ||||||||||
| gain on investments | (.04 | ) | — | — | (.09 | ) | — | |||
| Total Distributions | (.14 | ) | (.09 | ) | (.05 | ) | (.11 | ) | — | |
| Net asset value, end of period | 13.70 | 13.15 | 12.36 | 8.99 | 13.76 | |||||
| Total Return (%) | 5.23 | 7.12 | 38.22 | (34.12 | ) | 10.08 | d | |||
| Ratios/Supplemental Data (%): | ||||||||||
| Ratio of total expenses | ||||||||||
| to average net assets | .93 | .96 | .99 | 1.17 | 2.05 | e | ||||
| Ratio of net expenses | ||||||||||
| to average net assets | .93 | .96 | .99 | 1.15 | 1.18 | e | ||||
| Ratio of net investment income | ||||||||||
| to average net assets | 1.13 | .94 | 1.05 | .83 | .58 | e | ||||
| Portfolio Turnover Rate | 8.54 | 7.50 | 12.75 | 15.54 | 14.53 | d | ||||
| Net Assets, end of period ($ x 1,000) | 472,646 | 364,688 | 263,694 | 72,656 | 18,312 | |||||
| a | From December 29, 2006 (commencement of operations) to November 30, 2007. |
| b | Effective June 1, 2007, Class R shares were redesignated as Class I shares. |
| c | Based on average shares outstanding at each month end. |
| d | Not annualized. |
| e | Annualized. |
See notes to financial statements.
18
NOTES TO FINANCIAL STATEMENTS
NOTE 1—Significant Accounting Policies:
Global Stock Fund (the “fund”) is a separate diversified series of Strategic Funds, Inc. (the “Company”) which is registered under the Investment Company Act of 1940, as amended (the “Act”), as an open-end management investment company and operates as a series company currently offering nine series, including the fund.The fund’s investment objective is to seek long-term total return. The Dreyfus Corporation (the “Manager” or “Dreyfus”), a wholly-owned subsidiary of The Bank of New York Mellon Corporation (“BNY Mellon”), serves as the fund’s investment adviser. Walter Scott & Partners Limited (“Walter Scott”), a subsidiary of BNY Mellon and an affiliate of Dreyfus, serves as the fund’s sub-investment adviser.
MBSC Securities Corporation (the “Distributor”), a wholly-owned subsidiary of Dreyfus, is the distributor of the fund’s shares.The fund is authorized to issue 100 million shares of $.001 par value Common Stock in each of the following classes of shares: Class A, Class C and Class I. Class A shares are subject to a sales charge imposed at the time of purchase. Class C shares are subject to a contingent deferred sales charge (“CDSC”) on Class C shares redeemed within one year of purchase. Class I shares are sold at net asset value per share only to institutional investors. Other differences between the classes include the services offered to and the expenses borne by each class, the allocation of certain transfer agency costs and certain voting rights. Income, expenses (other than expenses attributable to a specific class), and realized and unrealized gains or losses on investments are allocated to each class of shares based on its relative net assets.
The Company accounts separately for the assets, liabilities and operations of each series. Expenses directly attributable to each series are
The Fund 19
NOTES TO FINANCIAL STATEMENTS (continued)
charged to that series’ operations; expenses which are applicable to all series are allocated among them on a pro rata basis.
The Financial Accounting Standards Board (“FASB”) Accounting Standards Codification (“ASC”) is the exclusive reference of authoritative U.S. generally accepted accounting principles (“GAAP”) recognized by the FASB to be applied by nongovernmental entities. Rules and interpretive releases of the Securities and Exchange Commission (“SEC”) under authority of federal laws are also sources of authoritative GAAP for SEC registrants. The fund’s financial statements are prepared in accordance with GAAP, which may require the use of management estimates and assumptions.Actual results could differ from those estimates.
The Company enters into contracts that contain a variety of indemnifications.The fund’s maximum exposure under these arrangements is unknown.The fund does not anticipate recognizing any loss related to these arrangements.
(a) Portfolio valuation: The fair value of a financial instrument is the amount that would be received to sell an asset or paid to transfer a liability in an orderly transaction between market participants at the measurement date (i.e. the exit price). GAAP establishes a fair value hierarchy that prioritizes the inputs of valuation techniques used to measure fair value.This hierarchy gives the highest priority to unadjusted quoted prices in active markets for identical assets or liabilities (Level 1 measurements) and the lowest priority to unobservable inputs (Level 3 measurements).
Additionally, GAAP provides guidance on determining whether the volume and activity in a market has decreased significantly and whether such a decrease in activity results in transactions that are not orderly. GAAP requires enhanced disclosures around valuation inputs and techniques used during annual and interim periods.
20
Various inputs are used in determining the value of the fund’s investments relating to fair value measurements.These inputs are summarized in the three broad levels listed below:
Level 1—unadjusted quoted prices in active markets for identical investments.
Level 2—other significant observable inputs (including quoted prices for similar investments, interest rates, prepayment speeds, credit risk, etc.).
Level 3—significant unobservable inputs (including the fund’s own assumptions in determining the fair value of investments).
The inputs or methodology used for valuing securities are not necessarily an indication of the risk associated with investing in those securities.
Changes in valuation techniques may result in transfers in or out of an assigned level within the disclosure hierarchy. Valuation techniques used to value the fund’s investments are as follows:
Investments in securities are valued at the last sales price on the securities exchange or national securities market on which such securities are primarily traded. Securities listed on the National Market System for which market quotations are available are valued at the official closing price or, if there is no official closing price that day, at the last sales price. Securities not listed on an exchange or the national securities market, or securities for which there were no transactions, are valued at the average of the most recent bid and asked prices, except for open short positions, where the asked price is used for valuation purposes. Bid price is used when no asked price is available. Registered investment companies that are not traded on an exchange are valued at their net asset value. All preceding securities are categorized within Level 1 of the fair value hierarchy.
The Fund 21
NOTES TO FINANCIAL STATEMENTS (continued)
Fair valuing of securities may be determined with the assistance of a pricing service using calculations based on indices of domestic securities and other appropriate indicators, such as prices of relevant ADRs and futures contracts. Utilizing these techniques may result in transfers between Level 1 and Level 2 of the fair value hierarchy.
When market quotations or official closing prices are not readily available, or are determined not to reflect accurately fair value, such as when the value of a security has been significantly affected by events after the close of the exchange or market on which the security is principally traded (for example, a foreign exchange or market), but before the fund calculates its net asset value, the fund may value these investments at fair value as determined in accordance with the procedures approved by the Board of Directors. Certain factors may be considered when fair valuing investments such as: fundamental analytical data, the nature and duration of restrictions on disposition, an evaluation of the forces that influence the market in which the securities are purchased and sold, and public trading in similar securities of the issuer or comparable issuers. These securities are either categorized as Level 2 or 3 depending on the relevant inputs used.
For restricted securities where observable inputs are limited, assumptions about market activity and risk are used and are categorized within Level 3 of the fair value hierarchy.
Investments denominated in foreign currencies are translated to U.S. dollars at the prevailing rates of exchange. Forward foreign currency exchange contracts (“forward contracts”) are valued at the forward rate. These securities are generally categorized within Level 2 of the fair value hierarchy.
22
The following is a summary of the inputs used as of November 30, 2011 in valuing the fund’s investments:
| Level 2—Other | Level 3— | |||||
| Level 1— | Significant | Significant | ||||
| Unadjusted | Observable | Unobservable | ||||
| Quoted Prices | Inputs | Inputs | Total | |||
| Assets ($) | ||||||
| Investments in Securities: | ||||||
| Equity Securities— | ||||||
| Domestic† | 215,791,812 | — | — | 215,791,812 | ||
| Equity Securities— | ||||||
| Foreign† | 152,099,037 | 149,495,704 | †† | — | 301,594,741 | |
| Mutual Funds | 9,200,000 | — | — | 9,200,000 | ||
| Liabilities ($) | ||||||
| Other Financial | ||||||
| Instruments: | ||||||
| Forward Foreign | ||||||
| Currency Exchange | ||||||
| Contracts††† | — | (5,785 | ) | — | (5,785 | ) |
| † | See Statement of Investments for additional detailed categorizations. |
| †† | Securities classified as Level 2 at period end as the values were determined pursuant to the |
| fund’s fair valuation procedures. | |
| ††† | Amount shown represents unrealized (depreciation) at period end. |
In May 2011, FASB issued Accounting Standards Update (“ASU”) No. 2011-04 “Amendments to Achieve Common FairValue Measurement and Disclosure Requirements in GAAP and International Financial Reporting Standards (“IFRS”)” (“ASU 2011-04”). ASU 2011-04 includes common requirements for measurement of and disclosure about fair value between GAAP and IFRS. ASU 2011-04 will require reporting entities to disclose the following information for fair value measurements categorized within Level 3 of the fair value hierarchy:
The Fund 23
NOTES TO FINANCIAL STATEMENTS (continued)
quantitative information about the unobservable inputs used in the fair value measurement, the valuation processes used by the reporting entity and a narrative description of the sensitivity of the fair value measurement to changes in unobservable inputs and the interrelationships between those unobservable inputs. In addition, ASU 2011-04 will require reporting entities to make disclosures about amounts and reasons for all transfers in and out of Level 1 and Level 2 fair value measurements.The new and revised disclosures are effective for interim and annual reporting periods beginning after December 15, 2011. At this time, management is evaluating the implications of ASU 2011-04 and its impact on the financial statements.
(b) Foreign currency transactions: The fund does not isolate that portion of the results of operations resulting from changes in foreign exchange rates on investments from the fluctuations arising from changes in market prices of securities held. Such fluctuations are included with the net realized and unrealized gain or loss on investments.
Net realized foreign exchange gains or losses arise from sales of foreign currencies, currency gains or losses realized on securities transactions between trade and settlement date and the difference between the amounts of dividends, interest and foreign withholding taxes recorded on the fund’s books and the U.S. dollar equivalent of the amounts actually received or paid. Net unrealized foreign exchange gains or losses arise from changes in the value of assets and liabilities other than investments resulting from changes in exchange rates. Foreign currency gains and losses on investments are included with net realized and unrealized gain or loss on investments.
(c) Securities transactions and investment income: Securities transactions are recorded on a trade date basis. Realized gains and losses from securities transactions are recorded on the identified cost basis. Dividend income is recognized on the ex-dividend date and interest income, including, where applicable, accretion of discount and amortization of premium on investments, is recognized on the accrual basis.
24
Investing in foreign markets may involve special risks and considerations not typically associated with investing in the U.S. These risks include revaluation of currencies, high rates of inflation, repatriation restrictions on income and capital, and adverse political and economic developments. Moreover, securities issued in these markets may be less liquid, subject to government ownership controls and delayed settlements, and their prices may be more volatile than those of comparable securities in the U.S.
(d) Affiliated issuers: Investments in other investment companies advised by Dreyfus are defined as “affiliated” in the Act.
The fund may invest in shares of certain affiliated investment companies also advised or managed by Dreyfus. Investments in affiliated investment companies for the period ended November 30, 2011 were as follows:
| Affiliated | |||||
| Investment | Value | Value | Net | ||
| Company | 11/30/2010($) | Purchases ($) | Sales ($) | 11/30/2011($) | Assets (%) |
| Dreyfus | |||||
| Institutional | |||||
| Preferred | |||||
| Plus Money | |||||
| Market | |||||
| Fund | 13,140,000 | 147,130,000 | 151,070,000 | 9,200,000 | 1.7 |
(e) Dividends to shareholders: Dividends are recorded on the ex-dividend date. Dividends from investment income-net and dividends from net realized capital gains, if any, are normally declared and paid annually, but the fund may make distributions on a more frequent basis to comply with the distribution requirements of the Internal Revenue Code of 1986, as amended (the “Code”).To the extent that net realized capital gains can be offset by capital loss carryovers, it is the policy of the fund not to distribute such gains. Income and capital gain distributions are determined in accordance with income tax regulations, which may differ from GAAP.
| The Fund | 25 |
NOTES TO FINANCIAL STATEMENTS (continued)
(f) Federal income taxes: It is the policy of the fund to continue to qualify as a regulated investment company, if such qualification is in the best interests of its shareholders, by complying with the applicable provisions of the Code, and to make distributions of taxable income sufficient to relieve it from substantially all federal income and excise taxes.
As of and during the period ended November 30, 2011, the fund did not have any liabilities for any uncertain tax positions.The fund recognizes interest and penalties, if any, related to uncertain tax positions as income tax expense in the Statement of Operations. During the period, the fund did not incur any interest or penalties.
Each of the tax years in the four-year period ended November 30, 2011 remains subject to examination by the Internal Revenue Service and state taxing authorities.
At November 30, 2011, the components of accumulated earnings on a tax basis were as follows: undistributed ordinary income $7,695,710, undistributed capital gains $2,546,828 and unrealized appreciation $58,144,287. In addition, the fund had $3,055,511 of capital losses realized after October 31, 2011, which were deferred for tax purposes to the first day of the following fiscal year.
The tax character of distributions paid to shareholders during the fiscal periods ended November 30, 2011 and November 30, 2010 were as follows: ordinary income $3,941,459 and $1,926,678 and long-term capital gains $430,847 and $0, respectively.
During the period ended November 30, 2011, as a result of permanent book to tax differences, primarily due to the tax treatment for foreign currency gains and losses, the fund decreased accumulated undistributed investment income-net by $2,001 and increased accumulated net realized gain (loss) on investments by the same amount. Net assets and net asset value per share were not affected by this reclassification.
26
NOTE 2—Bank Lines of Credit:
The fund participates with other Dreyfus-managed funds in a $225 million unsecured credit facility led by Citibank, N.A. and a $300 million unsecured credit facility provided by The Bank of NewYork Mellon, a subsidiary of BNY Mellon and an affiliate of Dreyfus (each, a “Facility”), each to be utilized primarily for temporary or emergency purposes, including the financing of redemptions. In connection therewith, the fund has agreed to pay its pro rata portion of commitment fees for each Facility. Interest is charged to the fund based on rates determined pursuant to the terms of the respective Facility at the time of borrowing.
The average amount of borrowings outstanding under the Facilities during the period ended November 30, 2011, was approximately $8,200, with a related weighted average annualized interest rate of 1.41%.
NOTE 3—Management Fee, Sub-Investment Advisory Fee and Other Transactions With Affiliates:
(a) Pursuant to a management agreement with Dreyfus, the management fee is computed at the annual rate of .85% of the value of the fund’s average daily net assets and is payable monthly. Dreyfus has contractually agreed, until April 1, 2012, to waive receipt of its fees and/or assume the expenses of the fund so that the direct expenses of none of the classes (excluding Rule 12b-1 fees, shareholder services fees, taxes, interest expense, brokerage commissions, commitment fees on borrowings and extraordinary expenses) exceed 1.25% of the value of the fund’s average daily net assets. During the period ended November 30, 2011, there was no reduction in management fee pursuant to the undertaking.
During the period ended November 30, 2011, the Distributor retained $16,253 from commissions earned on sales of the fund’s Class A shares and $2,609 from CDSCs on redemptions of the fund’s Class C shares.
The Fund 27
NOTES TO FINANCIAL STATEMENTS (continued)
Pursuant to a sub-investment advisory agreement between Dreyfus and Walter Scott, Dreyfus pays Walter Scott a monthly fee at an annual percentage of the fund’s average daily net assets.
(b) Under the Distribution Plan (the “Plan”) adopted pursuant to Rule 12b-1 under the Act, Class C shares pay the Distributor for distributing its shares at an annual rate of .75% of the value of the average daily net assets of Class C shares. During the period ended November 30, 2011, Class C shares were charged $99,587, pursuant to the Plan.
(c) Under the Shareholder Services Plan, Class A and Class C shares pay the Distributor at an annual rate of .25% of the value of their average daily net assets for the provision of certain services. The services provided may include personal services relating to shareholder accounts, such as answering shareholder inquiries regarding Class A and Class C shares and providing reports and other information, and services related to the maintenance of shareholder accounts. The Distributor may make payments to Service Agents (a securities dealer, financial institution or other industry professional) in respect of these services.The Distributor determines the amounts to be paid to Service Agents. During the period ended November 30, 2011, Class A and Class C shares were charged $115,423 and $33,196, respectively, pursuant to the Shareholder Services Plan.
The fund compensates Dreyfus Transfer, Inc., a wholly-owned subsidiary of Dreyfus, under a transfer agency agreement for providing personnel and facilities to perform transfer agency services for the fund. During the period ended November 30, 2011, the fund was charged $13,806 pursuant to the transfer agency agreement, which is included in Shareholder servicing costs in the Statement of Operations.
The fund has arrangements with the custodian and cash management bank whereby the fund may receive earnings credits when positive cash balances are maintained, which are used to offset custody and cash management fees. For financial reporting purposes, the fund includes net earnings credits as an expense offset in the Statement of Operations.
28
The fund compensates The Bank of New York Mellon under a cash management agreement for performing cash management services related to fund subscriptions and redemptions. During the period ended November 30, 2011, the fund was charged $1,530 pursuant to the cash management agreement, which is included in Shareholder servicing costs in the Statement of Operations.These fees were partially offset by earnings credits of $53.
The fund also compensates The Bank of New York Mellon under a custody agreement for providing custodial services for the fund. During the period ended November 30, 2011, the fund was charged $114,454 pursuant to the custody agreement.
During the period ended November 30, 2011, the fund was charged $6,356 for services performed by the Chief Compliance Officer.
The components of “Due toThe Dreyfus Corporation and affiliates” in the Statement of Assets and Liabilities consist of: management fees $366,658, Rule 12b-1 distribution plan fees $8,261, shareholder services plan fees $12,637, custodian fees $38,165, chief compliance officer fees $4,743 and transfer agency per account fees $2,739.
(d) Each Board member also serves as a Board member of other funds within the Dreyfus complex. Annual retainer fees and attendance fees are allocated to each fund based on net assets.
NOTE 4—Securities Transactions:
The aggregate amount of purchases and sales of investment securities, excluding short-term securities and forward contracts, during the period ended November 30, 2011, amounted to $149,565,347 and $41,861,127, respectively.
Forward Foreign Currency Exchange Contracts: The fund enters into forward contracts in order to hedge its exposure to changes in foreign currency exchange rates on its foreign portfolio holdings, to settle foreign currency transactions or as a part of its investment strategy.
The Fund 29
NOTES TO FINANCIAL STATEMENTS (continued)
When executing forward contracts, the fund is obligated to buy or sell a foreign currency at a specified rate on a certain date in the future. With respect to sales of forward contracts, the fund incurs a loss if the value of the contract increases between the date the forward contract is opened and the date the forward contract is closed.The fund realizes a gain if the value of the contract decreases between those dates.With respect to purchases of forward contracts, the fund incurs a loss if the value of the contract decreases between the date the forward contract is opened and the date the forward contract is closed.The fund realizes a gain if the value of the contract increases between those dates. Any realized gain or loss which occurred during the period is reflected in the Statement of Operations.The fund is exposed to foreign currency risk as a result of changes in value of underlying financial instruments. The fund is also exposed to credit risk associated with counterparty nonperformance on these forward contracts, which is typically limited to the unrealized gain on each open contract.
The following summarizes open forward contracts at November 30, 2011:
| Forward Foreign | ||||||||
| Currency | Foreign | |||||||
| Exchange | Number of | Currency | Unrealized | |||||
| Contracts | Contracts | Amounts | Proceeds ($) | Value ($) (Depreciation) ($) | ||||
| Sales: | ||||||||
| Japanese Yen, | ||||||||
| Expiring: | ||||||||
| 12/1/2011 | a | 1 | 35,684,954 | 457,445 | 460,095 | (2,650 | ) | |
| 12/2/2011 | a | 1 | 44,555,965 | 571,894 | 574,470 | (2,576 | ) | |
| 12/5/2011 | a | 1 | 38,134,922 | 491,123 | 491,682 | (559 | ) | |
| (5,785 | ) | |||||||
Counterparty:
| a | National Australia Bank |
30
The following summarizes the average market value of derivatives outstanding during the period ended November 30, 2011:
| Average Market Value ($) | |
| Forward contracts | 206,216 |
At November 30, 2011, the cost of investments for federal income tax purposes was $468,477,966; accordingly, accumulated net unrealized appreciation on investments was $58,108,587, consisting of $73,430,481 gross unrealized appreciation and $15,321,894 gross unrealized depreciation.
The Fund 31
REPORT OF INDEPENDENT REGISTERED
PUBLIC ACCOUNTING FIRM
Shareholders and Board of Directors
Global Stock Fund
We have audited the accompanying statement of assets and liabilities, including the statement of investments, of Global Stock Fund (one of the series comprising Strategic Funds, Inc.) as of November 30, 2011, and the related statement of operations for the year then ended, the statement of changes in net assets for each of the two years in the period then ended and financial highlights for each of the periods indicated therein.These financial statements and financial highlights are the responsibility of the Fund’s management. Our responsibility is to express an opinion on these financial statements and financial highlights based on our audits.
We conducted our audits in accordance with the standards of the Public Company Accounting Oversight Board (United States).Those standards require that we plan and perform the audit to obtain reasonable assurance about whether the financial statements and financial highlights are free of material misstatement.We were not engaged to perform an audit of the Fund’s internal control over financial reporting. Our audits included consideration of internal control over financial reporting as a basis for designing audit procedures that are appropriate in the circumstances, but not for the purpose of expressing an opinion on the effectiveness of the Fund’s internal control over financial reporting. Accordingly, we express no such opinion. An audit also includes examining, on a test basis, evidence supporting the amounts and disclosures in the financial statements and financial highlights, assessing the accounting principles used and significant estimates made by management, and evaluating the overall financial statement presentation. Our procedures included confirmation of securities owned as of November 30, 2011 by correspondence with the custodian and others. We believe that our audits provide a reasonable basis for our opinion.
In our opinion, the financial statements and financial highlights referred to above present fairly, in all material respects, the financial position of Global Stock Fund at November 30, 2011, the results of its operations for the year then ended, the changes in its net assets for each of the two years in the period then ended and the financial highlights for each of the indicated periods, in conformity with U.S. generally accepted accounting principles.
New York, New York
January 27, 2012
32
IMPORTANT TAX INFORMATION (Unaudited)
In accordance with federal tax law, the fund elects to provide each shareholder with their portion of the fund’s foreign taxes paid and the income sourced from foreign countries. Accordingly, the fund hereby makes the following designations regarding its fiscal year ended November 30, 2011:
—the total amount of taxes paid to foreign countries was $589,752
—the total amount of income sourced from foreign countries was $7,836,076.
Where required by federal tax law rules, shareholders will receive notification of their proportionate share of foreign taxes paid and foreign sourced income for the 2011 calendar year with Form 1099-DIV which will be mailed in early 2012.
For the fiscal year ended November 30, 2011, certain dividends paid by the fund may be subject to a maximum tax rate of 15%, as provided for by the Jobs and Growth Tax Relief Reconciliation Act of 2003. Of the distributions paid during the fiscal year, $3,941,459 represents the maximum amount that may be considered qualified dividend income. Also, the fund hereby designates $.0271 per share as a short-term capital gain distribution paid and also designates $.0132 per share as a long-term capital gain distribution paid on December 31, 2010.
The Fund 33
INFORMATION ABOUT THE RENEWAL OF THE
FUND’S MANAGEMENT AND SUB-INVESTMENT
ADVISORY AGREEMENTS (Unaudited)
At a meeting of the fund’s Board of Directors held on November 7-8, 2011, the Board considered the renewal of the fund’s Management Agreement with Dreyfus pursuant to which Dreyfus provides the fund with investment advisory and administrative services, and of Dreyfus’ Sub-Investment Advisory Agreement with Walter Scott & Partners Limited (“Walter Scott”)(the “Sub-Advisory Agreement”), pursuant to which Walter Scott serves as sub-investment adviser and provides day-to-day management of the fund’s portfolio (collectively, the “Agreements”). The Board members, none of whom are “interested persons” (as defined in the Investment Company Act of 1940, as amended) of the fund, were assisted in their review by independent legal counsel and met with counsel in executive session separate from representatives of Dreyfus and Walter Scott. In considering the renewal of the Agreements, the Board considered all factors that it believed to be relevant, including those discussed below.The Board did not identify any one factor as dispositive, and each Board member may have attributed different weights to the factors considered.
Analysis of Nature, Extent and Quality of Services Provided to the Fund.The Board considered information previously provided to them in a presentation from Dreyfus representatives regarding the nature, extent, and quality of the services provided to funds in the Dreyfus fund complex, and by Walter Scott to the fund pursuant to the Sub-Advisory Agreement, and representatives of Dreyfus and Walter Scott confirmed that there had been no material changes in this information. Dreyfus provided the number of open accounts in the fund, the fund’s asset size and the allocation of fund assets among distribution channels. Dreyfus also had previously provided information regarding the diverse intermediary relationships and distribution channels of funds in the Dreyfus fund complex and Dreyfus’ corresponding need for broad, deep, and diverse resources to be able to provide ongoing shareholder services to each distribution channel, including the distribution channel(s) for the fund.
34
The Board also considered research support available to, and portfolio management capabilities of, the fund’s portfolio management personnel and that Dreyfus also provides oversight of day-to-day fund operations, including fund accounting and administration and assistance in meeting legal and regulatory requirements.The Board also considered Dreyfus’ extensive administrative, accounting, and compliance infrastructures, and Dreyfus’ supervisory activities over Walter Scott. The Board also considered portfolio management’s brokerage policies and practices (including policies and practices regarding soft dollars) and the standards applied in seeking best execution.
Comparative Analysis of the Fund’s Performance and Management Fee and Expense Ratio.The Board reviewed reports prepared by Lipper, Inc. (“Lipper”), an independent provider of investment company data, which included information comparing (1) the fund’s performance with the performance of a group of comparable funds (the “Performance Group”) and with a broader group of funds (the “Performance Universe”), all for various periods ended September 30, 2011, and (2) the fund’s actual and contractual management fees and total expenses with those of a group of comparable funds (the “Expense Group”) and with a broader group of funds (the “Expense Universe”), the information for which was derived in part from fund financial statements available to Lipper as of September 30, 2011. Dreyfus previously had furnished the Board with a description of the methodology Lipper used to select the Performance Group and Performance Universe and the Expense Group and Expense Universe.
Dreyfus representatives stated that the usefulness of performance comparisons may be affected by a number of factors, including different investment limitations that may be applicable to the fund and comparison funds.The Board discussed the results of the comparisons and noted that the fund’s total return performance was in the first quartile (the first quartile being the highest performance ranking) in the Performance
The Fund 35
INFORMATION ABOUT THE RENEWAL OF THE FUND’S MANAGEMENT AND
SUB-INVESTMENT ADVISORY AGREEMENTS (Unaudited) (continued)
Group and the Performance Universe for the various periods. Dreyfus also provided a comparison of the fund’s calendar year total returns to the returns of the fund’s benchmark index.
The Board also reviewed the range of actual and contractual management fees and total expenses of the Expense Group and Expense Universe funds and discussed the results of the comparisons. They noted that the fund’s contractual management fee was below the Expense Group median, the fund’s actual management fee was at the Expense Group median and was above the Expense Universe median, and the fund’s actual total expenses were below the Expense Group median and the Expense Universe median.
Dreyfus representatives reviewed with the Board members the management or investment advisory fees paid to Dreyfus,Walter Scott, or their affiliates by funds in the same Lipper category as the fund (the “Similar Accounts”), and they explained the nature of the Similar Accounts. Dreyfus representatives noted that neither Dreyfus nor Walter Scott advise any separate accounts and/or other types of client portfolios considered to have similar investment strategies and policies as the fund.They discussed differences in fees paid and the relationship of the fees paid in light of any differences in the services provided and other relevant factors.The Board considered the relevance of the fee information provided for the Similar Accounts to evaluate the appropriateness and reasonableness of the fund’s management fee.
The Board considered the fee toWalter Scott in relation to the fee paid to Dreyfus by the fund and the respective services provided by Walter Scott and Dreyfus.The Board also noted Walter Scott’s fee is paid by Dreyfus (out of its fee from the fund) and not the fund.
Analysis of Profitability and Economies of Scale. Dreyfus’ representatives reviewed the expenses allocated and profit received by Dreyfus and the resulting profitability percentage for managing the fund, and
36
the method used to determine the expenses and profit. The Board concluded that the profitability results were not unreasonable given the services rendered and service levels provided by Dreyfus. The Board previously had been provided with information prepared by an independent consulting firm regarding Dreyfus’ approach to allocating costs to, and determining the profitability of, individual funds and the entire Dreyfus fund complex. The consulting firm also had analyzed where any economies of scale might emerge in connection with the management of a fund.
The Board’s counsel stated that the Board should consider the profitability analysis (1) as part of their evaluation of whether the fees under the Agreements bear a reasonable relationship to the mix of services provided by Dreyfus and Walter Scott, including the nature, extent and quality of such services, and (2) in light of the relevant circumstances for the fund and the extent to which economies of scale would be realized if the fund grows and whether fee levels reflect these economies of scale for the benefit of fund shareholders. Since Dreyfus, and not the fund, pays Walter Scott pursuant to the Sub-Advisory Agreement, the Board did not consider Walter Scott’s profitability to be relevant to its deliberations. Dreyfus representatives noted that, as a result of shared and allocated costs among funds in the Dreyfus funds complex, the extent of economies of scale could depend substantially on the level of assets in the complex as a whole, so that increases and decreases in complex-wide assets can affect potential economies of scale in a manner that is disproportionate to, or even in the opposite direction from, changes in the fund’s asset level. The Board also considered potential benefits to Dreyfus and Walter Scott from acting as investment adviser and sub-investment adviser, respectively, and noted there were no soft dollar arrangements in effect for trading the fund’s investments.
The Fund 37
INFORMATION ABOUT THE RENEWAL OF THE FUND’S MANAGEMENT AND
SUB-INVESTMENT ADVISORY AGREEMENTS (Unaudited) (continued)
At the conclusion of these discussions, the Board agreed that it had been furnished with sufficient information to make an informed business decision with respect to the renewal of the Agreements. Based on the discussions and considerations as described above, the Board concluded and determined as follows.
The Board concluded that the nature, extent, and quality of the services provided by Dreyfus and Walter Scott are adequate and appropriate.
The Board was satisfied with the fund’s performance, in light of the considerations described above.
The Board concluded that the fees paid to Dreyfus and Walter Scott were reasonable in light of the considerations described above.
The Board determined that the economies of scale which may accrue to Dreyfus and its affiliates in connection with the management of the fund had been adequately considered by Dreyfus in connection with the fee rate charged to the fund pursuant to the Agreement and that, to the extent in the future it were determined that material economies of scale had not been shared with the fund, the Board would seek to have those economies of scale shared with the fund.
The Board considered these conclusions and determinations, along with information received on a routine and regular basis throughout the year. In addition, it should be noted that the Board’s consideration of the contractual fee arrangements for this fund had the benefit of a number of years of reviews of prior or similar agreements during which lengthy discussions took place between the Board and Dreyfus representatives. Certain aspects of the arrangements may receive greater scrutiny in some years than in others, and the Board’s conclusions may be based, in part, on their consideration of the same or similar arrangements in prior years.The Board determined that renewal of the Agreements was in the best interests of the fund and its shareholders.
38
BOARD MEMBERS INFORMATION (Unaudited)
| Joseph S. DiMartino (68) |
| Chairman of the Board (1995) |
| Principal Occupation During Past 5Years: |
| • Corporate Director and Trustee |
| Other Public Company Board Memberships During Past 5Years: |
| • CBIZ (formerly, Century Business Services, Inc.), a provider of outsourcing functions for small |
| and medium size companies, Director (1997-present) |
| • Sunair Services Corporation, a provider of certain outdoor-related services to homes and |
| businesses, Director (2005-2009) |
| • The Newark Group, a provider of a national market of paper recovery facilities, paperboard |
| mills and paperboard converting plants, Director (2000-2010) |
| No. of Portfolios for which Board Member Serves: 164 |
| ——————— |
| David W. Burke (75) |
| Board Member (1994) |
| Principal Occupation During Past 5Years: |
| • Corporate Director and Trustee |
| No. of Portfolios for which Board Member Serves: 82 |
| ——————— |
| William Hodding Carter III (76) |
| Board Member (1988) |
| Principal Occupation During Past 5Years: |
| • Professor of Leadership & Public Policy, University of North Carolina, Chapel Hill (2006-present) |
| • President and Chief Executive Officer of the John S. and James L. Knight Foundation (1998-2006) |
| No. of Portfolios for which Board Member Serves: 29 |
| ——————— |
| Gordon J. Davis (70) |
| Board Member (2006) |
| Principal Occupation During Past 5Years: |
| • Partner in the law firm of Dewey & LeBoeuf LLP |
| Other Public Company Board Memberships During Past 5Years: |
| • Consolidated Edison, Inc., a utility company, Director (1997-present) |
| • The Phoenix Companies, Inc., a life insurance company, Director (2000-present) |
| No. of Portfolios for which Board Member Serves: 43 |
The Fund 39
BOARD MEMBERS INFORMATION (Unaudited) (continued)
| Joni Evans (69) |
| Board Member (2006) |
| Principal Occupation During Past 5Years: |
| • Chief Executive Officer, www.wowOwow.com an online community dedicated to women’s |
| conversations and publications (2007-present) |
| • Principal, Joni Evans Ltd. (publishing) (2006-present) |
| • Senior Vice President of the William Morris Agency (1994-2006) |
| No. of Portfolios for which Board Member Serves: 29 |
| ——————— |
| Ehud Houminer (71) |
| Board Member (1994) |
| Principal Occupation During Past 5Years: |
| • Executive-in-Residence at the Columbia Business School, Columbia University (1992-present) |
| Other Public Company Board Memberships During Past 5Years: |
| • Avnet Inc., an electronics distributor, Director (1993-present) |
| No. of Portfolios for which Board Member Serves: 64 |
| ——————— |
| Richard C. Leone (71) |
| Board Member (1984) |
| Principal Occupation During Past 5Years: |
| • Senior Fellow of The Century Foundation (formerly,The Twentieth Century Fund, Inc.), a tax |
| exempt research foundation engaged in the study of economic, foreign policy and domestic issues |
| Other Public Company Board Memberships During Past 5Years: |
| • Partnership for a Secure America, Director |
| No. of Portfolios for which Board Member Serves: 29 |
| ——————— |
| Hans C. Mautner (74) |
| Board Member (1984) |
| Principal Occupation During Past 5Years: |
| • President—International Division and an Advisory Director of Simon Property Group, a real |
| estate investment company (1998-2010) |
| • Chairman and Chief Executive Officer of Simon Global Limited (1999-2010) |
| No. of Portfolios for which Board Member Serves: 29 |
40
| Robin A. Melvin (48) |
| Board Member (1995) |
| Principal Occupation During Past 5Years: |
| • Director, Boisi Family Foundation, a private family foundation that supports youth-serving |
| organizations that promote the self sufficiency of youth from disadvantaged circumstances |
| (1995-present) |
| No. of Portfolios for which Board Member Serves: 53 |
| ——————— |
| Burton N.Wallack (61) |
| Board Member (2006) |
| Principal Occupation During Past 5Years: |
| • President and Co-owner of Wallack Management Company, a real estate management company |
| No. of Portfolios for which Board Member Serves: 29 |
| ——————— |
| John E. Zuccotti (74) |
| Board Member (1984) |
| Principal Occupation During Past 5Years: |
| • Chairman of Brookfield Properties, Inc. |
| • Senior Counsel of Weil, Gotshal & Manges, LLP |
| • Emeritus Chairman of the Real Estate Board of New York |
| Other Public Company Board Memberships During Past 5Years: |
| • Emigrant Savings Bank, Director (2004-present) |
| • Doris Duke Charitable Foundation,Trustee (2006-present) |
| No. of Portfolios for which Board Member Serves: 29 |
| ——————— |
| Once elected all Board Members serve for an indefinite term, but achieve Emeritus status upon reaching age 80.The |
| address of the Board Members and Officers is in c/o The Dreyfus Corporation, 200 Park Avenue, NewYork, NewYork |
| 10166.Additional information about the Board Members is available in the fund’s Statement of Additional Information |
| which can be obtained from Dreyfus free of charge by calling this toll free number: 1-800-DREYFUS. |
| Arnold S. Hiatt, Emeritus Board Member |
The Fund 41
OFFICERS OF THE FUND (Unaudited)
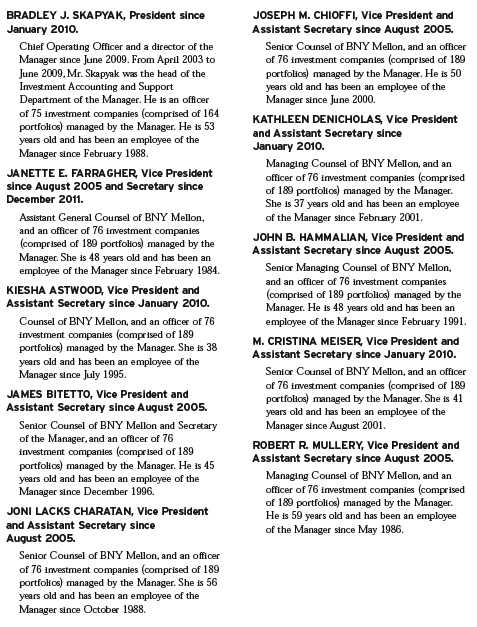
42
The Fund 43
NOTES
| International |
| Stock Fund |
ANNUAL REPORT November 30, 2011
Save time. Save paper. View your next shareholder report online as soon as it’s available. Log into www.dreyfus.com and sign up for Dreyfus eCommunications. It’s simple and only takes a few minutes.
The views expressed in this report reflect those of the portfolio manager only through the end of the period covered and do not necessarily represent the views of Dreyfus or any other person in the Dreyfus organization. Any such views are subject to change at any time based upon market or other conditions and Dreyfus disclaims any responsibility to update such views.These views may not be relied on as investment advice and, because investment decisions for a Dreyfus fund are based on numerous factors, may not be relied on as an indication of trading intent on behalf of any Dreyfus fund.
Contents | |
THE FUND | |
| 2 | A Letter from the Chairman and CEO |
| 3 | Discussion of Fund Performance |
| 6 | Fund Performance |
| 8 | Understanding Your Fund’s Expenses |
| 8 | Comparing Your Fund’s Expenses With Those of Other Funds |
| 9 | Statement of Investments |
| 13 | Statement of Assets and Liabilities |
| 14 | Statement of Operations |
| 15 | Statement of Changes in Net Assets |
| 17 | Financial Highlights |
| 20 | Notes to Financial Statements |
| 33 | Report of Independent Registered Public Accounting Firm |
| 34 | Important Tax Information |
| 35 | Information About the Renewal of the Fund’s Management and Sub-Investment Advisory Agreements |
| 40 | Board Members Information |
| 43 | Officers of the Fund |
FOR MORE INFORMATION | |
Back Cover |
| International |
| Stock Fund |
The Fund

A LETTER FROM THE CHAIRMAN AND CEO
Dear Shareholder:
We present to you this annual report for International Stock Fund, covering the 12-month period from December 1, 2010, through November 30, 2011. For information about how the fund performed during the reporting period, as well as general market perspectives, we provide a Discussion of Fund Performance on the pages that follow.
Global financial markets proved volatile for much of 2011 as investors struggled with persistently sluggish economic growth and global credit concerns. An escalating sovereign debt crisis in Europe, monetary tightening in China and India and a contentious debate regarding taxes, spending and borrowing in the United States sparked a flight to quality in which investors flocked to traditional safe havens, such as the sovereign debt of developed nations, while riskier stocks and higher yielding bonds generally suffered. Consequently, most international stocks lost value over the reporting period.
The global economic outlook currently remains clouded by uncertainty regarding the ability of European policymakers to contain the region’s debt crisis. Meanwhile, conditions in other parts of the world seem to be improving as commodity prices have moderated, inflationary pressures have receded in the emerging markets and consumer confidence has strengthened in the United States.To assess the potential impact of these and other developments on your investments, we encourage you, as always, to speak with your financial advisor.
Thank you for your continued confidence and support.

Jonathan R. Baum
Chairman and Chief Executive Officer
The Dreyfus Corporation
December 15, 2011
2

DISCUSSION OF FUND PERFORMANCE
For the period of December 1, 2010, through November 30, 2011, as provided by Charlie Macquaker and Roy Leckie of Walter Scott & Partners Limited (Walter Scott), Sub-investment adviser
Fund and Market Performance Overview
For the 12-month period ended November 30, 2011, International Stock Fund’s Class A shares achieved a return of –1.32%, Class C shares returned –2.08% and Class I shares returned –1.01%.1 In comparison, the fund’s benchmark index, the Morgan Stanley Capital International Europe,Australasia, Far East Index (the “MSCI EAFE Index”), achieved a –4.12% return over the same period.2 Stock prices proved volatile during the reporting period due to adverse macroeconomic events, particularly a resurgent sovereign debt crisis in Europe.The fund produced higher returns than its benchmark, primarily due to a relatively defensive investment posture during the market downturn over the summer of 2011.
The Fund’s Investment Approach
The fund seeks long-term total return by investing in high-quality companies capable of sustainable growth and wealth creation over a long time horizon. The fund invests in stocks of foreign companies that are predominantly located in the world’s developed markets outside of the United States.When selecting stocks,Walter Scott seeks companies with fundamental strengths that indicate the potential for sustainable growth. The firm focuses on individual stock selection through extensive fundamental research. Candidates are initially selected for research if they meet certain broad absolute and trend criteria. Financial statements are analyzed in an effort to identify the nature of their cash generation and to understand the variables that add value to their businesses. Companies meeting the financial criteria are subjected to a detailed investigation of products, costs and pricing, competition, industry position and outlook.
Macroeconomic Developments Challenged Global Markets
Improving economic data and rising corporate earnings generally supported international stock prices into the first quarter of 2011. However, the rally was interrupted in February by higher energy prices stemming
The Fund 3
DISCUSSION OF FUND PERFORMANCE (continued)
from unrest in the Middle East, and again in March, when natural and nuclear disasters in Japan disrupted the global industrial supply chain. Still, investors proved resilient, and many markets rebounded from these unexpected shocks.
Investor sentiment deteriorated in earnest in April, as investors grew increasingly concerned about a sovereign debt crisis in Europe, where Greece and other members of the European Union saw their borrowing costs soar, pushing them to the brink of insolvency. Global investors also reacted cautiously to a contentious political debate in the United States regarding government spending and borrowing. In the emerging markets, China and India raised short-term interest rates to prevent an acceleration of inflation, threatening a major engine of global growth.
As investors became more risk-averse, they turned to traditional safe havens, such as U.S. Treasury securities and the German bund. Consequently, riskier assets, including stocks, generally declined in most markets over the reporting period’s second half. Partial rebounds in October and November mitigated the benchmark’s losses for the reporting period overall.
Stock Selection Strategy Proved Effective in Downturn
Companies that met near-term expectations tended to hold up well in this environment, but those that fell short were punished, often regardless of attractive valuations and longer-term fundamental strengths.Walter Scott’s bottom-up security selection process identified relatively few opportunities in continental Europe, helping to avoid the brunt of the region’s weakness.The fund also maintained light exposure to the financials and materials sectors, which ranked among the MSCI EAFE Index’s worst performing industry groups. Conversely, the research process identified a number of opportunities in the health care and energy sectors.
The fund’s top individual performers for the reporting period included Japan’s Daito Trust Construction, which benefited from rebuilding efforts after the earthquake and tsunami. Swiss medical devices producer Synthes was acquired by a large U.S. health care company at a premium to its then-prevailing stock price. U.K. apparel maker Burberry Group encountered rising consumer spending in the United States and emerging markets. Japanese energy company Inpex climbed as investors anticipated a national switch from nuclear power to natural
4
gas. Enterprise software developer SAP benefited from interest in companies aligned to growth in “cloud computing.” Disappointments during the reporting period included Japanese video game maker Nintendo, where sales of new hardware and software fell short of expectations. Hong Kong-based apparel retailer Esprit Holdings struggled with wholesale distribution problems and weak European markets. Scotland’s Cairn Energy was impacted by delays in the sale of assets in India and a disappointing exploration campaign in Greenland.Australian hearing devices manufacturer Cochlear was hurt by a product recall.
Finding Opportunities in Many International Markets
Despite headwinds including high unemployment and deleveraging among governments and individuals, we have continued to find attractive opportunities in most equity markets.Walter Scott’s investment process is grounded in the belief that companies with high growth rates, rising profits, strong cash generation and healthy balance sheets can prosper in good times and bad, and therefore the investment team can be optimistic about the fund’s holdings. In the team’s collective judgment, improved market momentum, confidence and liquidity have buoyed investor sentiment, and barring a new and serious crisis, stocks with market leading positions, strong fundamentals and growth prospects should gain in value over the foreseeable future.
December 15, 2011
| Equity funds are subject generally to market, market sector, market liquidity, issuer and investment | |
| style risks, among other factors, to varying degrees, all of which are more fully described in the | |
| fund’s prospectus. | |
| Investing internationally involves special risks, including changes in currency exchange rates, | |
| political, economic and social instability, a lack of comprehensive company information, differing | |
| auditing and legal standards and less market liquidity. | |
| 1 | Total return includes reinvestment of dividends and any capital gains paid, and does not take into |
| consideration the maximum initial sales charge in the case of Class A shares, or the applicable | |
| contingent deferred sales charge imposed on redemptions in the case of Class C shares. Had these | |
| charges been reflected, returns would have been lower. Past performance is no guarantee of future | |
| results. Share price and investment return fluctuate such that upon redemption, fund shares may be | |
| worth more or less than their original cost. | |
| 2 | SOURCE: LIPPER INC. – Reflects reinvestment of net dividends and, where applicable, |
| capital gain distributions.The Morgan Stanley Capital International Europe,Australasia, Far | |
| East (MSCI EAFE) Index is an unmanaged index composed of a sample of companies | |
| representative of the market structure of European and Pacific Basin countries. Returns are | |
| calculated on a month-end basis. Investors cannot invest directly in any index. |
The Fund 5
FUND PERFORMANCE
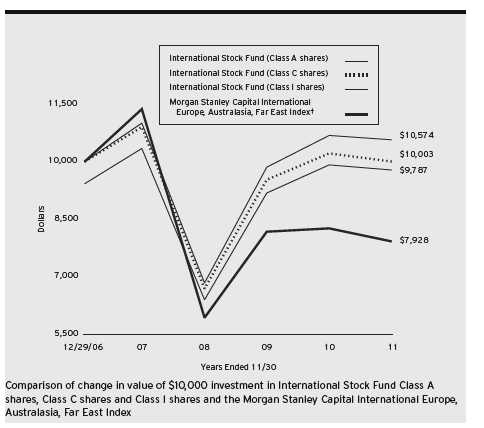
† Source: Lipper Inc.
Past performance is not predictive of future performance.
The above graph compares a $10,000 investment made in each of the Class A, Class C and Class I shares of International Stock Fund on 12/29/06 (inception date) to a $10,000 investment made in the Morgan Stanley Capital International Europe,Australasia, Far East Index (the “Index”) on that date.All dividends and capital gain distributions are reinvested.
The fund’s performance shown in the line graph above takes into account the maximum initial sales charge on Class A shares and all other applicable fees and expenses on all classes.The Index is an unmanaged, market capitalization weighted index that is designed to measure the performance of publicly traded stocks issued by companies in developed markets excluding the U.S. and Canada. Unlike a mutual fund, the Index is not subject to charges, fees and other expenses. Investors cannot invest directly in any index. Further information relating to fund performance, including expense reimbursements, if applicable, is contained in the Financial Highlights section of the prospectus and elsewhere in this report.
6
| Average Annual Total Returns as of 11/30/11 | |||||
| Inception | From | ||||
| Date | 1 | Year | Inception | ||
| Class A shares | |||||
| with maximum sales charge (5.75%) | 12/29/06 | –6.98 | % | –0.44 | % |
| without sales charge | 12/29/06 | –1.32 | % | 0.77 | % |
| Class C shares | |||||
| with applicable redemption charge † | 12/29/06 | –3.06 | % | 0.01 | % |
| without redemption | 12/29/06 | –2.08 | % | 0.01 | % |
| Class I shares | 12/29/06 | –1.01 | % | 1.14 | % |
| Morgan Stanley Capital International | |||||
| Europe, Australasia, Far East Index | 12/31/06 | –4.12 | % | –4.61 | % |
Past performance is not predictive of future performance.The fund’s performance shown in the graph and table does not reflect the deduction of taxes that a shareholder would pay on fund distributions or the redemption of fund shares.
| † The maximum contingent deferred sales charge for Class C shares is 1% for shares redeemed within one year of the |
| date of purchase. |
The Fund 7
UNDERSTANDING YOUR FUND’S EXPENSES (Unaudited)
As a mutual fund investor, you pay ongoing expenses, such as management fees and other expenses. Using the information below, you can estimate how these expenses affect your investment and compare them with the expenses of other funds.You also may pay one-time transaction expenses, including sales charges (loads) and redemption fees, which are not shown in this section and would have resulted in higher total expenses. For more information, see your fund’s prospectus or talk to your financial adviser.
Review your fund’s expenses
The table below shows the expenses you would have paid on a $1,000 investment in International Stock Fund from June 1, 2011 to November 30, 2011. It also shows how much a $1,000 investment would be worth at the close of the period, assuming actual returns and expenses.
Expenses and Value of a $1,000 Investment
assuming actual returns for the six months ended November 30, 2011
| Class A | Class C | Class I | ||||
| Expenses paid per $1,000† | $ | 6.00 | $ | 9.64 | $ | 4.41 |
| Ending value (after expenses) | $ | 870.60 | $ | 867.10 | $ | 872.20 |
COMPARING YOUR FUND’S EXPENSES
WITH THOSE OF OTHER FUNDS (Unaudited)
Using the SEC’s method to compare expenses
The Securities and Exchange Commission (SEC) has established guidelines to help investors assess fund expenses. Per these guidelines, the table below shows your fund’s expenses based on a $1,000 investment, assuming a hypothetical 5% annualized return. You can use this information to compare the ongoing expenses (but not transaction expenses or total cost) of investing in the fund with those of other funds.All mutual fund shareholder reports will provide this information to help you make this comparison. Please note that you cannot use this information to estimate your actual ending account balance and expenses paid during the period.
Expenses and Value of a $1,000 Investment
assuming a hypothetical 5% annualized return for the six months ended November 30, 2011
| Class A | Class C | Class I | ||||
| Expenses paid per $1,000† | $ | 6.48 | $ | 10.40 | $ | 4.76 |
| Ending value (after expenses) | $ | 1,018.65 | $ | 1,014.74 | $ | 1,020.36 |
| † Expenses are equal to the fund’s annualized expense ratio of 1.28% for Class A, 2.06% for Class C and .94% |
| for Class I , multiplied by the average account value over the period, multiplied by 183/365 (to reflect the one-half |
| year period). |
8
STATEMENT OF INVESTMENTS
November 30, 2011
| Common Stocks—97.5% | Shares | Value ($) |
| Australia—7.3% | ||
| Coca-Cola Amatil | 2,096,000 | 25,598,519 |
| Cochlear | 280,800 | 16,337,881 |
| CSL | 877,400 | 28,785,266 |
| Woodside Petroleum | 757,000 | 26,379,490 |
| 97,101,156 | ||
| Belgium—1.6% | ||
| Colruyt | 556,000 | 21,008,479 |
| Brazil—2.3% | ||
| Petroleo Brasileiro, ADR | 1,222,600 | 30,650,582 |
| Canada—2.1% | ||
| Suncor Energy | 941,600 | 28,360,167 |
| China—1.1% | ||
| China Shenhua Energy, Cl. H | 3,223,000 | 14,244,779 |
| Denmark—2.3% | ||
| Novo Nordisk, Cl. B | 265,000 | 30,072,009 |
| Finland—1.0% | ||
| Kone, Cl. B | 242,000 | 13,576,141 |
| France—6.5% | ||
| Cie Generale d’Optique | ||
| Essilor International | 286,000 | 20,410,180 |
| Danone | 417,000 | 27,481,175 |
| L’Oreal | 263,600 | 28,449,432 |
| Vallourec | 143,800 | 9,800,374 |
| 86,141,161 | ||
| Germany—4.2% | ||
| Adidas | 391,000 | 27,456,847 |
| SAP | 484,900 | 28,913,126 |
| 56,369,973 | ||
| Hong Kong—6.5% | ||
| China Mobile | 2,518,500 | 24,827,667 |
| CLP Holdings | 2,137,500 | 18,984,001 |
The Fund 9
STATEMENT OF INVESTMENTS (continued)
| Common Stocks (continued) | Shares | Value ($) |
| Hong Kong (continued) | ||
| CNOOC | 14,692,000 | 28,337,348 |
| Hong Kong & China Gas | 6,058,915 | 14,057,836 |
| 86,206,852 | ||
| Japan—26.9% | ||
| AEON Mall | 521,600 | 12,184,592 |
| Canon | 618,800 | 28,003,595 |
| Chugai Pharmaceutical | 628,000 | 9,595,158 |
| Daikin Industries | 361,800 | 10,661,926 |
| Daito Trust Construction | 289,900 | 25,863,720 |
| Denso | 870,300 | 24,874,697 |
| FANUC | 168,300 | 27,629,375 |
| Honda Motor | 934,700 | 29,548,763 |
| Hoya | 588,300 | 12,555,556 |
| INPEX | 4,300 | 28,898,142 |
| Keyence | 76,200 | 19,491,285 |
| Komatsu | 1,274,500 | 32,449,759 |
| Mitsubishi Estate | 1,477,000 | 24,717,482 |
| Nintendo | 45,400 | 6,884,360 |
| Shimamura | 159,900 | 15,136,094 |
| Shin-Etsu Chemical | 555,700 | 27,899,084 |
| Tokio Marine Holdings | 899,000 | 21,809,500 |
| 358,203,088 | ||
| Luxembourg—1.1% | ||
| Tenaris, ADR | 388,800 | 14,494,464 |
| Singapore—2.0% | ||
| DBS Group Holdings | 1,187,338 | 11,821,437 |
| Oversea-Chinese Banking | 2,269,061 | 14,502,766 |
| 26,324,203 |
10
| Common Stocks (continued) | Shares | Value ($) | |
| Spain—2.0% | |||
| Inditex | 308,700 | 26,144,987 | |
| Sweden—2.0% | |||
| Hennes & Mauritz, Cl. B | 855,500 | 27,054,182 | |
| Switzerland—6.2% | |||
| Nestle | 467,000 | 26,146,070 | |
| Novartis | 503,000 | 27,093,509 | |
| Roche Holding | 19,000 | 3,163,201 | |
| SGS | 8,290 | 13,964,875 | |
| Synthes | 76,800 | a | 12,685,114 |
| 83,052,769 | |||
| Taiwan—2.1% | |||
| Taiwan Semiconductor | |||
| Manufacturing, ADR | 2,179,900 | 28,164,308 | |
| United Kingdom—20.3% | |||
| BG Group | 1,280,000 | 27,281,256 | |
| Burberry Group | 996,000 | 19,845,307 | |
| Cairn Energy | 5,500,000 | b | 23,496,603 |
| Centrica | 5,890,000 | 27,888,765 | |
| HSBC Holdings | 3,160,000 | 24,515,916 | |
| Reckitt Benckiser Group | 537,000 | 27,120,021 | |
| SABMiller | 788,000 | 27,692,935 | |
| Smith & Nephew | 3,150,000 | 28,713,190 | |
| Standard Chartered | 1,240,000 | 26,924,803 | |
| Tesco | 4,360,000 | 27,717,285 | |
| WM Morrison Supermarkets | 1,945,000 | 9,825,852 | |
| 271,021,933 | |||
| Total Common Stocks | |||
| (cost $1,271,156,661) | 1,298,191,233 |
The Fund 11
STATEMENT OF INVESTMENTS (continued)
| Other Investment—1.9% | Shares | Value ($) | |
| Registered Investment Company; | |||
| Dreyfus Institutional Preferred | |||
| Plus Money Market Fund | |||
| (cost $25,700,000) | 25,700,000 | c | 25,700,000 |
| Total Investments (cost $1,296,856,661) | 99.4 | % | 1,323,891,233 |
| Cash and Receivables (Net) | .6 | % | 7,981,239 |
| Net Assets | 100.0 | % | 1,331,872,472 |
ADR—American Depository Receipts
| a Security exempt from registration under Rule 144A of the Securities Act of 1933.This security may be resold in |
| transactions exempt from registration, normally to qualified institutional buyers.At November 30, 2011, this security |
| was valued at $12,685,114 or 1.0% of net assets. |
| b Non-income producing security. |
| c Investment in affiliated money market mutual fund. |
| Portfolio Summary (Unaudited)† | |||
| Value (%) | Value (%) | ||
| Energy | 16.7 | Industrial | 8.1 |
| Consumer Staples | 16.6 | Utilities | 4.6 |
| Health Care | 13.3 | Materials | 2.1 |
| Consumer Discretionary | 12.8 | Telecommunication Services | 1.8 |
| Financial | 12.2 | Money Market Investment | 1.9 |
| Information Technology | 9.3 | 99.4 | |
| † Based on net assets. | |||
| See notes to financial statements. | |||
12
STATEMENT OF ASSETS AND LIABILITIES
November 30, 2011
| Cost | Value | |||
| Assets ($): | ||||
| Investments in securities—See Statement of Investments: | ||||
| Unaffiliated issuers | 1,271,156,661 | 1,298,191,233 | ||
| Affiliated issuers | 25,700,000 | 25,700,000 | ||
| Cash | 1,559,814 | |||
| Cash denominated in foreign currencies | 859,016 | 862,409 | ||
| Receivable for investment securities sold | 3,755,892 | |||
| Receivable for shares of Common Stock subscribed | 3,538,616 | |||
| Dividends receivable | 2,713,708 | |||
| Prepaid expenses | 52,553 | |||
| 1,336,374,225 | ||||
| Liabilities ($): | ||||
| Due to The Dreyfus Corporation and affiliates—Note 3(c) | 1,107,487 | |||
| Payable for shares of Common Stock redeemed | 3,190,283 | |||
| Unrealized depreciation on forward foreign | ||||
| currency exchange contracts—Note 4 | 14,241 | |||
| Accrued expenses | 189,742 | |||
| 4,501,753 | ||||
| Net Assets ($) | 1,331,872,472 | |||
| Composition of Net Assets ($): | ||||
| Paid-in capital | 1,331,017,556 | |||
| Accumulated undistributed investment income—net | 13,815,202 | |||
| Accumulated net realized gain (loss) on investments | (39,984,543 | ) | ||
| Accumulated net unrealized appreciation (depreciation) | ||||
| on investments and foreign currency transactions | 27,024,257 | |||
| Net Assets ($) | 1,331,872,472 | |||
| Net Asset Value Per Share | ||||
| Class A | Class C | Class I | ||
| Net Assets ($) | 192,351,185 | 23,318,810 | 1,116,202,477 | |
| Shares Outstanding | 15,287,501 | 1,890,879 | 87,903,417 | |
| Net Asset Value Per Share ($) | 12.58 | 12.33 | 12.70 | |
| See notes to financial statements. | ||||
The Fund 13
STATEMENT OF OPERATIONS
Year Ended November 30, 2011
| Investment Income ($): | ||
| Income: | ||
| Cash dividends (net of $2,225,924 foreign taxes withheld at source): | ||
| Unaffiliated issuers | 27,459,725 | |
| Affiliated issuers | 37,898 | |
| Interest | 465 | |
| Total Income | 27,498,088 | |
| Expenses: | ||
| Management fee—Note 3(a) | 9,951,170 | |
| Shareholder servicing costs—Note 3(c) | 842,572 | |
| Custodian fees—Note 3(c) | 372,661 | |
| Distribution fees—Note 3(b) | 170,815 | |
| Registration fees | 124,749 | |
| Professional fees | 111,387 | |
| Directors’ fees and expenses—Note 3(d) | 99,316 | |
| Prospectus and shareholders’ reports | 34,808 | |
| Loan commitment fees—Note 2 | 15,048 | |
| Miscellaneous | 57,811 | |
| Total Expenses | 11,780,337 | |
| Less—reduction in fees due to earnings credits—Note 3(c) | (155 | ) |
| Net Expenses | 11,780,182 | |
| Investment Income—Net | 15,717,906 | |
| Realized and Unrealized Gain (Loss) on Investments—Note 4 ($): | ||
| Net realized gain (loss) on investments and foreign currency transactions | (18,757,290 | ) |
| Net realized gain (loss) on forward foreign currency exchange contracts | (1,137,222 | ) |
| Net Realized Gain (Loss) | (19,894,512 | ) |
| Net unrealized appreciation (depreciation) on | ||
| investments and foreign currency transactions | (41,769,393 | ) |
| Net unrealized appreciation (depreciation) on | ||
| forward foreign currency exchange contracts | (4,835 | ) |
| Net Unrealized Appreciation (Depreciation) | (41,774,228 | ) |
| Net Realized and Unrealized Gain (Loss) on Investments | (61,668,740 | ) |
| Net (Decrease) in Net Assets Resulting from Operations | (45,950,834 | ) |
| See notes to financial statements. | ||
14
STATEMENT OF CHANGES IN NET ASSETS
| Year Ended November 30, | ||||
| 2011 | 2010 | |||
| Operations ($): | ||||
| Investment income—net | 15,717,906 | 5,938,209 | ||
| Net realized gain (loss) on investments | (19,894,512 | ) | 1,543,935 | |
| Net unrealized appreciation | ||||
| (depreciation) on investments | (41,774,228 | ) | 42,144,376 | |
| Net Increase (Decrease) in Net Assets | ||||
| Resulting from Operations | (45,950,834 | ) | 49,626,520 | |
| Dividends to Shareholders from ($): | ||||
| Investment income—net: | ||||
| Class A Shares | (891,065 | ) | (142,971 | ) |
| Class C Shares | (62,687 | ) | (4,254 | ) |
| Class I Shares | (5,951,410 | ) | (3,306,609 | ) |
| Total Dividends | (6,905,162 | ) | (3,453,834 | ) |
| Capital Stock Transactions ($): | ||||
| Net proceeds from shares sold: | ||||
| Class A Shares | 141,281,526 | 115,912,183 | ||
| Class C Shares | 15,822,744 | 13,275,616 | ||
| Class I Shares | 597,266,958 | 354,816,585 | ||
| Dividends reinvested: | ||||
| Class A Shares | 878,594 | 141,708 | ||
| Class C Shares | 42,711 | 2,713 | ||
| Class I Shares | 2,081,783 | 1,027,427 | ||
| Cost of shares redeemed: | ||||
| Class A Shares | (64,098,053 | ) | (15,383,858 | ) |
| Class C Shares | (4,950,839 | ) | (974,987 | ) |
| Class I Shares | (130,894,151 | ) | (46,510,527 | ) |
| Increase (Decrease) in Net Assets | ||||
| from Capital Stock Transactions | 557,431,273 | 422,306,860 | ||
| Total Increase (Decrease) in Net Assets | 504,575,277 | 468,479,546 | ||
| Net Assets ($): | ||||
| Beginning of Period | 827,297,195 | 358,817,649 | ||
| End of Period | 1,331,872,472 | 827,297,195 | ||
| Undistributed investment income—net | 13,815,202 | 4,615,945 | ||
The Fund 15
STATEMENT OF CHANGES IN NET ASSETS (continued)
| Year Ended November 30, | ||||
| 2011 | 2010 | |||
| Capital Share Transactions: | ||||
| Class A | ||||
| Shares sold | 10,369,700 | 9,443,427 | ||
| Shares issued for dividends reinvested | 64,508 | 11,750 | ||
| Shares redeemed | (4,837,020 | ) | (1,273,189 | ) |
| Net Increase (Decrease) in Shares Outstanding | 5,597,188 | 8,181,988 | ||
| Class C | ||||
| Shares sold | 1,171,466 | 1,084,430 | ||
| Shares issued for dividends reinvested | 3,178 | 227 | ||
| Shares redeemed | (387,816 | ) | (84,101 | ) |
| Net Increase (Decrease) in Shares Outstanding | 786,828 | 1,000,556 | ||
| Class I | ||||
| Shares sold | 44,375,224 | 28,823,704 | ||
| Shares issued for dividends reinvested | 151,955 | 84,841 | ||
| Shares redeemed | (9,928,482 | ) | (3,809,868 | ) |
| Net Increase (Decrease) in Shares Outstanding | 34,598,697 | 25,098,677 | ||
| See notes to financial statements. | ||||
16
FINANCIAL HIGHLIGHTS
The following tables describe the performance for each share class for the fiscal periods indicated.All information (except portfolio turnover rate) reflects financial results for a single fund share.Total return shows how much your investment in the fund would have increased (or decreased) during each period, assuming you had reinvested all dividends and distributions.These figures have been derived from the fund’s financial statements.
| Year Ended November 30, | ||||||||||
| Class A Shares | 2011 | 2010 | 2009 | 2008 | 2007 | a | ||||
| Per Share Data ($): | ||||||||||
| Net asset value, beginning of period | 12.83 | 11.97 | 8.43 | 13.72 | 12.50 | |||||
| Investment Operations: | ||||||||||
| Investment income—netb | .15 | .09 | .05 | .09 | .07 | |||||
| Net realized and unrealized | ||||||||||
| gain (loss) on investments | (.31 | ) | .86 | 3.58 | (5.28 | ) | 1.15 | |||
| Total from Investment Operations | (.16 | ) | .95 | 3.63 | (5.19 | ) | 1.22 | |||
| Distributions: | ||||||||||
| Dividends from investment income—net | (.09 | ) | (.09 | ) | (.09 | ) | (.02 | ) | — | |
| Dividends from net realized | ||||||||||
| gain on investments | — | — | — | (.08 | ) | — | ||||
| Total Distributions | (.09 | ) | (.09 | ) | (.09 | ) | (.10 | ) | — | |
| Net asset value, end of period | 12.58 | 12.83 | 11.97 | 8.43 | 13.72 | |||||
| Total Return (%)c | (1.32 | ) | 7.99 | 43.33 | (38.07 | ) | 9.76 | d | ||
| Ratios/Supplemental Data (%): | ||||||||||
| Ratio of total expenses | ||||||||||
| to average net assets | 1.27 | 1.34 | 1.43 | 1.43 | 1.75 | e | ||||
| Ratio of net expenses | ||||||||||
| to average net assets | 1.27 | 1.34 | 1.42 | 1.41 | 1.47 | e | ||||
| Ratio of net investment income | ||||||||||
| to average net assets | 1.08 | .69 | .50 | .79 | .50 | e | ||||
| Portfolio Turnover Rate | 5.07 | 5.91 | 21.67 | 13.18 | 13.34 | d | ||||
| Net Assets, end of period ($ x 1,000) | 192,351 | 124,347 | 18,059 | 1,126 | 1,396 | |||||
| a | From December 29, 2006 (commencement of operations) to November 30, 2007. |
| b | Based on average shares outstanding at each month end. |
| c | Exclusive of sales charge. |
| d | Not annualized. |
| e | Annualized. |
See notes to financial statements.
The Fund 17
FINANCIAL HIGHLIGHTS (continued)
| Year Ended November 30, | ||||||||||
| Class C Shares | 2011 | 2010 | 2009 | 2008 | 2007 | a | ||||
| Per Share Data ($): | ||||||||||
| Net asset value, beginning of period | 12.64 | 11.83 | 8.32 | 13.64 | 12.50 | |||||
| Investment Operations: | ||||||||||
| Investment income (loss)—netb | .04 | (.02 | ) | (.01 | ) | .00 | c | (.04 | ) | |
| Net realized and unrealized | ||||||||||
| gain (loss) on investments | (.30 | ) | .87 | 3.53 | (5.24 | ) | 1.18 | |||
| Total from Investment Operations | (.26 | ) | .85 | 3.52 | (5.24 | ) | 1.14 | |||
| Distributions: | ||||||||||
| Dividends from investment income—net | (.05 | ) | (.04 | ) | (.01 | ) | — | — | ||
| Dividends from net realized | ||||||||||
| gain on investments | — | — | — | (.08 | ) | — | ||||
| Total Distributions | (.05 | ) | (.04 | ) | (.01 | ) | (.08 | ) | — | |
| Net asset value, end of period | 12.33 | 12.64 | 11.83 | 8.32 | 13.64 | |||||
| Total Return (%)d | (2.08 | ) | 7.18 | 42.31 | (38.58 | ) | 9.04 | e | ||
| Ratios/Supplemental Data (%): | ||||||||||
| Ratio of total expenses | ||||||||||
| to average net assets | 2.05 | 2.13 | 2.25 | 2.24 | 2.50 | f | ||||
| Ratio of net expenses | ||||||||||
| to average net assets | 2.05 | 2.13 | 2.22 | 2.20 | 2.21 | f | ||||
| Ratio of net investment income | ||||||||||
| (loss) to average net assets | .33 | (.12 | ) | (.13 | ) | .03 | (.31 | )f | ||
| Portfolio Turnover Rate | 5.07 | 5.91 | 21.67 | 13.18 | 13.34 | e | ||||
| Net Assets, end of period ($ x 1,000) | 23,319 | 13,959 | 1,224 | 197 | 445 | |||||
| a | From December 29, 2006 (commencement of operations) to November 30, 2007. |
| b | Based on average shares outstanding at each month end. |
| c | Amount represents less than $.01 per share. |
| d | Exclusive of sales charge. |
| e | Not annualized. |
| f | Annualized. |
See notes to financial statements.
18
| Year Ended November 30, | ||||||||||
| Class I Shares | 2011 | 2010 | 2009 | 2008 | 2007 | a,b | ||||
| Per Share Data ($): | ||||||||||
| Net asset value, beginning of period | 12.93 | 12.04 | 8.47 | 13.76 | 12.50 | |||||
| Investment Operations: | ||||||||||
| Investment income—netc | .19 | .14 | .12 | .14 | .11 | |||||
| Net realized and unrealized | ||||||||||
| gain (loss) on investments | (.31 | ) | .86 | 3.57 | (5.30 | ) | 1.15 | |||
| Total from Investment Operations | (.12 | ) | 1.00 | 3.69 | (5.16 | ) | 1.26 | |||
| Distributions: | ||||||||||
| Dividends from investment income—net | (.11 | ) | (.11 | ) | (.12 | ) | (.05 | ) | — | |
| Dividends from net realized | ||||||||||
| gain on investments | — | — | — | (.08 | ) | — | ||||
| Total Distributions | (.11 | ) | (.11 | ) | (.12 | ) | (.13 | ) | — | |
| Net asset value, end of period | 12.70 | 12.93 | 12.04 | 8.47 | 13.76 | |||||
| Total Return (%) | (1.01 | ) | 8.38 | 43.98 | (37.82 | ) | 10.08 | d | ||
| Ratios/Supplemental Data (%): | ||||||||||
| Ratio of total expenses | ||||||||||
| to average net assets | .93 | .97 | 1.01 | 1.03 | 1.38 | e | ||||
| Ratio of net expenses | ||||||||||
| to average net assets | .93 | .97 | 1.01 | 1.02 | 1.16 | e | ||||
| Ratio of net investment income | ||||||||||
| to average net assets | 1.41 | 1.11 | 1.18 | 1.19 | .81 | e | ||||
| Portfolio Turnover Rate | 5.07 | 5.91 | 21.67 | 13.18 | 13.34 | d | ||||
| Net Assets, end of period ($ x 1,000) | 1,116,202 | 688,992 | 339,535 | 119,650 | 69,201 | |||||
| a | From December 29, 2006 (commencement of operations) to November 30, 2007. |
| b | Effective June 1, 2007, Class R shares were redesignated as Class I shares. |
| c | Based on average shares outstanding at each month end. |
| d | Not annualized. |
| e | Annualized. |
See notes to financial statements.
The Fund 19
NOTES TO FINANCIAL STATEMENTS
NOTE 1—Significant Accounting Policies:
International Stock Fund (the “fund”) is a separate diversified series of Strategic Funds, Inc. (the “Company”) which is registered under the Investment Company Act of 1940, as amended (the “Act”), as an open-end management investment company and operates as a series company currently offering nine series, including the fund.The fund’s investment objective is to seek long-term total return. The Dreyfus Corporation (the “Manager” or “Dreyfus”), a wholly-owned subsidiary of The Bank of New York Mellon Corporation (“BNY Mellon”), serves as the fund’s investment adviser. Walter Scott & Partners Limited (“Walter Scott”), a subsidiary of BNY Mellon and an affiliate of Dreyfus, serves as the fund’s sub-investment adviser.
On October 19, 2011, the Board of Directors approved an increase in the authorized shares of the fund from 300 million to 400 million and an increase in the authorized shares for Class I from 100 million to 200 million.
MBSC Securities Corporation (the “Distributor”), a wholly-owned subsidiary of Dreyfus, is the distributor of the fund’s shares.The fund is authorized to issue 400 million shares of $.001 par value Common Stock.The fund currently offers three classes of shares: Class A (100 million shares authorized), Class C (100 million shares authorized) and Class I (200 million shares authorized). Class A shares are subject to a sales charge imposed at the time of purchase. Class C shares are subject to a contingent deferred sales charge (“CDSC”) on Class C shares redeemed within one year of purchase. Class I shares are sold at net asset value per share only to institutional investors. Other differences between the classes include the services offered to and the expenses borne by each class, the allocation of certain transfer agency costs and certain voting rights. Income, expenses (other than expenses attributable to a specific class), and realized and unrealized gains or losses on investments are allocated to each class of shares based on its relative net assets.
20
The Company accounts separately for the assets, liabilities and operations of each series. Expenses directly attributable to each series are charged to that series’ operations; expenses which are applicable to all series are allocated among them on a pro rata basis.
The Financial Accounting Standards Board (“FASB”) Accounting Standards Codification (“ASC”) is the exclusive reference of authoritative U.S. generally accepted accounting principles (“GAAP”) recognized by the FASB to be applied by nongovernmental entities. Rules and interpretive releases of the Securities and Exchange Commission (“SEC”) under authority of federal laws are also sources of authoritative GAAP for SEC registrants. The fund’s financial statements are prepared in accordance with GAAP, which may require the use of management estimates and assumptions.Actual results could differ from those estimates.
The Company enters into contracts that contain a variety of indemnifications.The fund’s maximum exposure under these arrangements is unknown.The fund does not anticipate recognizing any loss related to these arrangements.
(a) Portfolio valuation: The fair value of a financial instrument is the amount that would be received to sell an asset or paid to transfer a liability in an orderly transaction between market participants at the measurement date (i.e. the exit price). GAAP establishes a fair value hierarchy that prioritizes the inputs of valuation techniques used to measure fair value. This hierarchy gives the highest priority to unadjusted quoted prices in active markets for identical assets or liabilities (Level 1 measurements) and the lowest priority to unobservable inputs (Level 3 measurements).
Additionally, GAAP provides guidance on determining whether the volume and activity in a market has decreased significantly and whether such a decrease in activity results in transactions that are not orderly. GAAP requires enhanced disclosures around valuation inputs and techniques used during annual and interim periods.
The Fund 21
NOTES TO FINANCIAL STATEMENTS (continued)
Various inputs are used in determining the value of the fund’s investments relating to fair value measurements.These inputs are summarized in the three broad levels listed below:
Level 1—unadjusted quoted prices in active markets for identical investments.
Level 2—other significant observable inputs (including quoted prices for similar investments, interest rates, prepayment speeds, credit risk, etc.).
Level 3—significant unobservable inputs (including the fund’s own assumptions in determining the fair value of investments).
The inputs or methodology used for valuing securities are not necessarily an indication of the risk associated with investing in those securities.
Changes in valuation techniques may result in transfers in or out of an assigned level within the disclosure hierarchy. Valuation techniques used to value the fund’s investments are as follows:
Investments in securities are valued at the last sales price on the securities exchange or national securities market on which such securities are primarily traded. Securities listed on the National Market System for which market quotations are available are valued at the official closing price or, if there is no official closing price that day, at the last sales price. Securities not listed on an exchange or the national securities market, or securities for which there were no transactions, are valued at the average of the most recent bid and asked prices, except for open short positions, where the asked price is used for valuation purposes. Bid price is used when no asked price is available. Registered investment companies that are not traded on an exchange are valued at their net asset value.All preceding securities are categorized within Level 1 of the fair value hierarchy.
22
Fair valuing of securities may be determined with the assistance of a pricing service using calculations based on indices of domestic securities and other appropriate indicators, such as prices of relevant ADRs and futures contracts. Utilizing these techniques may result in transfers between Level 1 and Level 2 of the fair value hierarchy.
When market quotations or official closing prices are not readily available, or are determined not to reflect accurately fair value, such as when the value of a security has been significantly affected by events after the close of the exchange or market on which the security is principally traded (for example, a foreign exchange or market), but before the fund calculates its net asset value, the fund may value these investments at fair value as determined in accordance with the procedures approved by the Board of Directors. Certain factors may be considered when fair valuing investments such as: fundamental analytical data, the nature and duration of restrictions on disposition, an evaluation of the forces that influence the market in which the securities are purchased and sold, and public trading in similar securities of the issuer or comparable issuers.These securities are either categorized as Level 2 or 3 depending on the relevant inputs used.
For restricted securities where observable inputs are limited, assumptions about market activity and risk are used and are categorized within Level 3 of the fair value hierarchy.
Investments denominated in foreign currencies are translated to U.S. dollars at the prevailing rates of exchange. Forward foreign currency exchange contracts (“forward contracts”) are valued at the forward rate. These securities are generally categorized within Level 2 of the fair value hierarchy.
The Fund 23
NOTES TO FINANCIAL STATEMENTS (continued)
The following is a summary of the inputs used as of November 30, 2011 in valuing the fund’s investments:
| Level 2—Other | Level 3— | |||||
| Level 1— | Significant | Significant | ||||
| Unadjusted | Observable Unobservable | |||||
| Quoted Prices | Inputs | Inputs | Total | |||
| Assets ($) | ||||||
| Investments in Securities: | ||||||
| Equity Securities— | ||||||
| Foreign† | 716,111,155 | 582,080,078 | †† | — | 1,298,191,233 | |
| Mutual Funds | 25,700,000 | — | — | 25,700,000 | ||
| Liabilities ($) | ||||||
| Other Financial | ||||||
| Instruments: | ||||||
| Forward Foreign | ||||||
| Currency Exchange | ||||||
| Contracts††† | — | (14,241 | ) | — | (14,241 | ) |
| † | See Statement of Investments for additional detailed categorizations. |
| †† | Securities classified as Level 2 at period end as the values were determined pursuant to the |
| fund’s fair valuation procedures. | |
| ††† | Amount shown represents unrealized (depreciation) at period end. |
In May 2011, FASB issued Accounting Standards Update (“ASU”) No. 2011-04 “Amendments to Achieve Common FairValue Measurement and Disclosure Requirements in GAAP and International Financial Reporting Standards (“IFRS”)” (“ASU 2011-04”). ASU 2011-04 includes common requirements for measurement of and disclosure about fair value between GAAP and IFRS. ASU 2011-04 will require reporting entities to disclose the following information for fair value measurements categorized within Level 3 of the fair value hierarchy: quantitative information about the unobservable inputs used in the fair value measurement, the valuation processes used by the reporting entity and a narrative description of the sensitivity of the fair value measurement to changes in unobservable inputs and the interrelationships between those unobservable inputs. In addition, ASU 2011-04 will require reporting entities to make disclosures about amounts and reasons for all transfers in and out of Level 1 and Level 2 fair value measurements.The new and revised disclosures are effective for interim
24
and annual reporting periods beginning after December 15, 2011. At this time, management is evaluating the implications of ASU 2011-04 and its impact on the financial statements.
(b) Foreign currency transactions: The fund does not isolate that portion of the results of operations resulting from changes in foreign exchange rates on investments from the fluctuations arising from changes in market prices of securities held. Such fluctuations are included with the net realized and unrealized gain or loss on investments.
Net realized foreign exchange gains or losses arise from sales of foreign currencies, currency gains or losses realized on securities transactions between trade and settlement date and the difference between the amounts of dividends, interest and foreign withholding taxes recorded on the fund’s books and the U.S. dollar equivalent of the amounts actually received or paid. Net unrealized foreign exchange gains or losses arise from changes in the value of assets and liabilities other than investments resulting from changes in exchange rates. Foreign currency gains and losses on investments are included with net realized and unrealized gain or loss on investments.
(c) Securities transactions and investment income: Securities transactions are recorded on a trade date basis. Realized gains and losses from securities transactions are recorded on the identified cost basis. Dividend income is recognized on the ex-dividend date and interest income, including, where applicable, accretion of discount and amortization of premium on investments, is recognized on the accrual basis.
Investing in foreign markets may involve special risks and considerations not typically associated with investing in the U.S. These risks include revaluation of currencies, high rates of inflation, repatriation restrictions on income and capital, and adverse political and economic developments. Moreover, securities issued in these markets may be less liquid, subject to government ownership controls and delayed settlements, and their prices may be more volatile than those of comparable securities in the U.S.
The Fund 25
NOTES TO FINANCIAL STATEMENTS (continued)
(d) Affiliated issuers: Investments in other investment companies advised by Dreyfus are defined as “affiliated” in the Act.
The fund may invest in shares of certain affiliated investment companies also advised or managed by Dreyfus. Investments in affiliated investment companies for the period ended November 30, 2011 were as follows:
| Affiliated | |||||
| Investment | Value | Value | Net | ||
| Company | 11/30/2010($) | Purchases ($) | Sales($) | 11/30/2011 ($) | Assets (%) |
| Dreyfus | |||||
| Institutional | |||||
| Preferred | |||||
| Plus Money | |||||
| Market | |||||
| Fund | 19,650,000 | 499,550,000 | 493,500,000 | 25,700,000 | 1.9 |
(e) Dividends to shareholders: Dividends are recorded on the ex-dividend date. Dividends from investment income-net and dividends from net realized capital gains, if any, are normally declared and paid annually, but the fund may make distributions on a more frequent basis to comply with the distribution requirements of the Internal Revenue Code of 1986, as amended (the “Code”).To the extent that net realized capital gains can be offset by capital loss carryovers, it is the policy of the fund not to distribute such gains. Income and capital gain distributions are determined in accordance with income tax regulations, which may differ from GAAP.
(f) Federal income taxes: It is the policy of the fund to continue to qualify as a regulated investment company, if such qualification is in the best interests of its shareholders, by complying with the applicable provisions of the Code, and to make distributions of taxable income sufficient to relieve it from substantially all federal income and excise taxes.
As of and during the period ended November 30, 2011, the fund did not have any liabilities for any uncertain tax positions.The fund recognizes interest and penalties, if any, related to uncertain tax positions as income tax expense in the Statement of Operations. During the period, the fund did not incur any interest or penalties.
26
Each of the tax years in the four-year period ended November 30, 2011 remains subject to examination by the Internal Revenue Service and state taxing authorities.
At November 30, 2011, the components of accumulated earnings on a tax basis were as follows: undistributed ordinary income $16,044,136, accumulated capital losses $32,011,135 and unrealized appreciation $21,110,585. In addition, the fund had $4,288,670 of capital losses realized after October 31, 2011, which were deferred for tax purposes to the first day of the following fiscal year.
The accumulated capital loss carryover is available for federal income tax purposes to be applied against future net securities profits, if any, realized subsequent to November 30, 2011. If not applied, $598,805 of the carryover expires in fiscal 2016, $15,114,500 expires in fiscal 2017 and $16,297,830 expires in fiscal 2019.
Under the recently enacted Regulated Investment Company Modernization Act of 2010 (the “2010 Act”), the fund will be permitted to carry forward capital losses incurred in taxable years beginning after December 22, 2010 (“post-enactment losses”) for an unlimited period. However, the 2010 Act requires post-enactment losses to be utilized before the utilization of losses incurred in taxable years prior to the effective date of the 2010 Act. As a result of this ordering rule, capital loss carryovers related to taxable years beginning prior to the effective date of the 2010 Act may be more likely to expire unused.
The tax character of distributions paid to shareholders during the fiscal periods ended November 30, 2011 and November 30, 2010 were as follows: ordinary income $6,905,162 and $3,453,834, respectively.
During the period ended November 30, 2011, as a result of permanent book to tax differences, primarily due to the tax treatment for foreign currency gains and losses, the fund increased accumulated undistributed investment income-net by $386,513 and decreased accumulated
The Fund 27
NOTES TO FINANCIAL STATEMENTS (continued)
net realized gain (loss) on investments by the same amount. Net assets and net asset value per share were not affected by this reclassification.
NOTE 2—Bank Lines of Credit:
The fund participates with other Dreyfus-managed funds in a $225 million unsecured credit facility led by Citibank, N.A. and a $300 million unsecured credit facility provided by The Bank of New York Mellon, a subsidiary of BNY Mellon and an affiliate of Dreyfus (each, a “Facility”), each to be utilized primarily for temporary or emergency purposes, including the financing of redemptions. In connection therewith, the fund has agreed to pay its pro rata portion of commitment fees for each Facility. Interest is charged to the fund based on rates determined pursuant to the terms of the respective Facility at the time of borrowing. During the period ended November 30, 2011, the fund did not borrow under the Facilities.
NOTE 3—Management Fee, Sub-Investment Advisory Fee and Other Transactions With Affiliates:
(a) Pursuant to a management agreement with Dreyfus, the management fee is computed at the annual rate of .85% of the value of the fund’s average daily net assets and is payable monthly. Dreyfus has contractually agreed, until April 1, 2012, to waive receipt of its fees and/or assume the expenses of the fund so that the direct expenses of none of the classes (excluding Rule 12b-1 fees, shareholder services fees, taxes, interest expense, brokerage commissions, commitment fees on borrowings and extraordinary expenses) exceed 1.25% of the value of the fund’s average daily net assets. During the period ended November 30, 2011, there was no reduction in management fee pursuant to the undertaking.
During the period ended November 30, 2011, the Distributor retained $39,225 from commissions earned on sales of the fund’s Class A shares and $13,803 from CDSCs on redemptions of the fund’s Class C shares.
Pursuant to a sub-investment advisory agreement between Dreyfus and Walter Scott, Dreyfus pays Walter Scott a monthly fee at an annual percentage of the fund’s average daily net assets.
28
(b) Under the Distribution Plan (the “Plan”) adopted pursuant to Rule 12b-1 under the Act, Class C shares pay the Distributor for distributing its shares at an annual rate of .75% of the value of the average daily net assets of Class C shares. During the period ended November 30, 2011, Class C shares were charged $170,815, pursuant to the Plan.
(c) Under the Shareholder Services Plan, Class A and Class C shares pay the Distributor at an annual rate of .25% of the value of their average daily net assets for the provision of certain services.The services provided may include personal services relating to shareholder accounts, such as answering shareholder inquiries regarding Class A and Class C shares and providing reports and other information, and services related to the maintenance of shareholder accounts.The Distributor may make payments to Service Agents (a securities dealer, financial institution or other industry professional) in respect of these services. The Distributor determines the amounts to be paid to Service Agents. During the period ended November 30, 2011, Class A and Class C shares were charged $450,646 and $56,938, respectively, pursuant to the Shareholder Services Plan.
The fund compensates Dreyfus Transfer, Inc., a wholly-owned subsidiary of Dreyfus, under a transfer agency agreement for providing personnel and facilities to perform transfer agency services for the fund. During the period ended November 30, 2011, the fund was charged $33,813 pursuant to the transfer agency agreement, which is included in Shareholder servicing costs in the Statement of Operations.
The fund has arrangements with the custodian and cash management bank whereby the fund may receive earnings credits when positive cash balances are maintained, which are used to offset custody and cash management fees. For financial reporting purposes, the fund includes net earnings credits as an expense offset in the Statement of Operations.
The fund compensates The Bank of New York Mellon under a cash management agreement for performing cash management services related to fund subscriptions and redemptions. During the period
The Fund 29
NOTES TO FINANCIAL STATEMENTS (continued)
ended November 30, 2011, the fund was charged $4,800 pursuant to the cash management agreement, which is included in Shareholder servicing costs in the Statement of Operations. These fees were partially offset by earnings credits of $155.
The fund also compensates The Bank of New York Mellon under a custody agreement for providing custodial services for the fund. During the period ended November 30, 2011, the fund was charged $372,661 pursuant to the custody agreement.
During the period ended November 30, 2011, the fund was charged $6,356 for services performed by the Chief Compliance Officer.
The components of “Due to The Dreyfus Corporation and affiliates” in the Statement of Assets and Liabilities consist of: management fees $916,750, Rule 12b-1 distribution plan fees $14,289, shareholder services plan fees $43,620, custodian fees $120,435, chief compliance officer fees $4,743 and transfer agency per account fees $7,650.
(d) Each Board member also serves as a Board member of other funds within the Dreyfus complex. Annual retainer fees and attendance fees are allocated to each fund based on net assets.
(e) A 2% redemption fee was previously charged and retained by the fund on certain shares redeemed within sixty days following the date of issuance, including redemptions made through the use of the fund’s exchange privilege. The fee was terminated on December 15, 2010. During the period ended November 30, 2011, redemption fees charged and retained by the fund amounted to $7,484.
NOTE 4—Securities Transactions:
The aggregate amount of purchases and sales of investment securities, excluding short-term securities and forward contracts, during the period ended November 30, 2011, amounted to $616,856,951 and $57,537,083, respectively.
30
Forward Foreign Currency Exchange Contracts: The fund enters into forward contracts in order to hedge its exposure to changes in foreign currency exchange rates on its foreign portfolio holdings, to settle foreign currency transactions or as a part of its investment strategy. When executing forward contracts, the fund is obligated to buy or sell a foreign currency at a specified rate on a certain date in the future. With respect to sales of forward contracts, the fund incurs a loss if the value of the contract increases between the date the forward contract is opened and the date the forward contract is closed.The fund realizes a gain if the value of the contract decreases between those dates.With respect to purchases of forward contracts, the fund incurs a loss if the value of the contract decreases between the date the forward contract is opened and the date the forward contract is closed.The fund realizes a gain if the value of the contract increases between those dates. Any realized gain or loss which occurred during the period is reflected in the Statement of Operations.The fund is exposed to foreign currency risk as a result of changes in value of underlying financial instruments. The fund is also exposed to credit risk associated with counterparty nonperformance on these forward contracts, which is typically limited to the unrealized gain on each open contract.
The following summarizes open forward contracts at November 30, 2011:
| Forward Foreign | ||||||||
| Currency | Foreign | |||||||
| Exchange | Number of | Currency | Unrealized | |||||
| Contracts | Contracts | Amounts | Proceeds ($) | Value ($) (Depreciation) ($) | ||||
| Sales: | ||||||||
| Japanese Yen, | ||||||||
| Expiring: | ||||||||
| 12/1/2011 | a | 1 | 87,485,694 | 1,121,479 | 1,127,974 | (6,495 | ) | |
| 12/2/2011 | a | 1 | 110,217,386 | 1,414,687 | 1,421,060 | (6,373 | ) | |
| 12/5/2011 | a | 1 | 93,603,899 | 1,205,485 | 1,206,858 | (1,373 | ) | |
| (14,241 | ) | |||||||
Counterparty:
| a | National Australia Bank |
The Fund 31
NOTES TO FINANCIAL STATEMENTS (continued)
The following summarizes the average market value of derivatives outstanding during the period ended November 30, 2011:
| Average Market Value ($) | |
| Forward contracts | 8,933,540 |
At November 30, 2011, the cost of investments for federal income tax purposes was $1,302,784,574; accordingly, accumulated net unrealized appreciation on investments was $21,106,659, consisting of $100,633,838 gross unrealized appreciation and $79,527,179 gross unrealized depreciation.
32
REPORT OF INDEPENDENT REGISTERED
PUBLIC ACCOUNTING FIRM
Shareholders and Board of Directors
International Stock Fund
We have audited the accompanying statement of assets and liabilities, including the statement of investments, of International Stock Fund (one of the series comprising Strategic Funds, Inc.) as of November 30, 2011, and the related statement of operations for the year then ended, the statement of changes in net assets for each of the two years in the period then ended and financial highlights for each of the periods indicated therein. These financial statements and financial highlights are the responsibility of the Fund’s management. Our responsibility is to express an opinion on these financial statements and financial highlights based on our audits.
We conducted our audits in accordance with the standards of the Public Company Accounting Oversight Board (United States).Those standards require that we plan and perform the audit to obtain reasonable assurance about whether the financial statements and financial highlights are free of material misstatement.We were not engaged to perform an audit of the Fund’s internal control over financial reporting. Our audits included consideration of internal control over financial reporting as a basis for designing audit procedures that are appropriate in the circumstances, but not for the purpose of expressing an opinion on the effectiveness of the Fund’s internal control over financial reporting. Accordingly, we express no such opinion.An audit also includes examining, on a test basis, evidence supporting the amounts and disclosures in the financial statements and financial highlights, assessing the accounting principles used and significant estimates made by management, and evaluating the overall financial statement presentation. Our procedures included confirmation of securities owned as of November 30, 2011 by correspondence with the custodian and others.We believe that our audits provide a reasonable basis for our opinion.
In our opinion, the financial statements and financial highlights referred to above present fairly, in all material respects, the financial position of International Stock Fund at November 30, 2011, the results of its operations for the year then ended, the changes in its net assets for each of the two years in the period then ended and the financial highlights for each of the indicated periods, in conformity with U.S. generally accepted accounting principles.

New York, New York
January 27, 2012
The Fund 33
IMPORTANT TAX INFORMATION (Unaudited)
In accordance with federal tax law, the fund elects to provide each shareholder with their portion of the fund’s foreign taxes paid and the income sourced from foreign countries. Accordingly, the fund hereby makes the following designations regarding its fiscal year ended November 30, 2011:
—the total amount of taxes paid to foreign countries was $2,225,924
—the total amount of income sourced from foreign countries was $29,686,520.
Where required by federal tax law rules, shareholders will receive notification of their proportionate share of foreign taxes paid and foreign sourced income for the 2011 calendar year with Form 1099-DIV which will be mailed in early 2012.
For the fiscal year ended November 30, 2011, certain dividends paid by the fund may be subject to a maximum tax rate of 15%, as provided for by the Jobs and Growth Tax Relief Reconciliation Act of 2003. Of the distributions paid during the fiscal year, $6,905,162 represents the maximum amount that may be considered qualified dividend income.
34
INFORMATION ABOUT THE RENEWAL OF THE
FUND’S MANAGEMENT AND SUB-INVESTMENT
ADVISORY AGREEMENTS (Unaudited)
At a meeting of the fund’s Board of Directors held on November 7-8, 2011, the Board considered the renewal of the fund’s Management Agreement with Dreyfus pursuant to which Dreyfus provides the fund with investment advisory and administrative services, and of Dreyfus’ Sub-Investment Advisory Agreement with Walter Scott & Partners Limited (“Walter Scott”)(the “Sub-Investment Advisory Agreement”), pursuant to which Walter Scott serves as sub-investment adviser and provides day-to-day management of the fund’s portfolio (collectively, the “Agreements”).The Board members, none of whom are “interested persons” (as defined in the Investment Company Act of 1940, as amended) of the fund, were assisted in their review by independent legal counsel and met with counsel in executive session separate from representatives of Dreyfus and Walter Scott. In considering the renewal of the Agreements, the Board considered all factors that it believed to be relevant, including those discussed below.The Board did not identify any one factor as dispositive, and each Board member may have attributed different weights to the factors considered.
Analysis of Nature, Extent and Quality of Services Provided to the Fund.The Board considered information previously provided to them in a presentation from Dreyfus representatives regarding the nature, extent, and quality of the services provided to funds in the Dreyfus fund complex, and byWalter Scott to the fund pursuant to the Sub-Advisory Agreement, and representatives of Dreyfus and Walter Scott confirmed that there had been no material changes in this information. Dreyfus provided the number of open accounts in the fund, the fund’s asset size and the allocation of fund assets among distribution channels. Dreyfus also had previously provided information regarding the diverse intermediary relationships and distribution channels of funds in the Dreyfus fund complex and Dreyfus’ corresponding need for broad, deep, and diverse resources to be able to provide ongoing shareholder services to each distribution channel, including the distribution channel(s) for the fund.
The Fund 35
INFORMATION ABOUT THE RENEWAL OF THE FUND’S MANAGEMENT AND
SUB-INVESTMENT ADVISORY AGREEMENTS (Unaudited) (continued)
The Board also considered research support available to, and portfolio management capabilities of, the fund’s portfolio management personnel and that Dreyfus also provides oversight of day-to-day fund operations, including fund accounting and administration and assistance in meeting legal and regulatory requirements.The Board also considered Dreyfus’ extensive administrative, accounting, and compliance infrastructures, and Dreyfus’ supervisory activities over Walter Scott. The Board also considered portfolio management’s brokerage policies and practices (including policies and practices regarding soft dollars) and the standards applied in seeking best execution.
Comparative Analysis of the Fund’s Performance and Management Fee and Expense Ratio. The Board reviewed reports prepared by Lipper, Inc. (“Lipper”), an independent provider of investment company data, which included information comparing (1) the fund’s performance with the performance of a group of comparable funds (the “Performance Group”) and with a broader group of funds (the “Performance Universe”), all for various periods ended September 30, 2011, and (2) the fund’s actual and contractual management fees and total expenses with those of a group of comparable funds (the “Expense Group”) and with a broader group of funds (the “Expense Universe”), the information for which was derived in part from fund financial statements available to Lipper as of September 30, 2011. Dreyfus previously had furnished the Board with a description of the methodology Lipper used to select the Performance Group and Performance Universe and the Expense Group and Expense Universe.
Dreyfus representatives stated that the usefulness of performance comparisons may be affected by a number of factors, including different investment limitations that may be applicable to the fund and comparison funds.The Board discussed the results of the comparisons and noted that the fund’s total return performance was above the Performance Group median and the Performance Universe median for the various periods. The Board also noted that the fund commenced operations in December 2006 and ranked first in the
36
Performance Group for the 3-year and 4-year time periods. Dreyfus also provided a comparison of the fund’s calendar year total returns to the returns of the fund’s benchmark index.
The Board also reviewed the range of actual and contractual management fees and total expenses of the Expense Group and Expense Universe funds and discussed the results of the comparisons. They noted that the fund’s contractual management fee was below the Expense Group median, the fund’s actual management fee was below the Expense Group median and above the Expense Universe median, and the fund’s actual total expenses were below the Expense Group median and the Expense Universe median.
Dreyfus representatives noted that there were no funds in the same Lipper category as the fund managed by Dreyfus,Walter Scott, or their affiliates, nor any separate accounts and/or other types of client portfolios advised by Dreyfus or Walter Scott considered to have similar investment strategies and policies as the fund.
The Board considered the fee toWalter Scott in relation to the fee paid to Dreyfus by the fund and the respective services provided by Walter Scott and Dreyfus.The Board also noted Walter Scott’s fee is paid by Dreyfus (out of its fee from the fund) and not the fund.
Analysis of Profitability and Economies of Scale. Dreyfus’ representatives reviewed the expenses allocated and profit received by Dreyfus and the resulting profitability percentage for managing the fund, and the method used to determine the expenses and profit. The Board concluded that the profitability results were not unreasonable given the services rendered and service levels provided by Dreyfus. The Board previously had been provided with information prepared by an independent consulting firm regarding Dreyfus’ approach to allocating costs to, and determining the profitability of, individual funds and the entire Dreyfus fund complex. The consulting firm also had analyzed where any economies of scale might emerge in connection with the management of a fund.
The Fund 37
INFORMATION ABOUT THE RENEWAL OF THE FUND’S MANAGEMENT AND
SUB-INVESTMENT ADVISORY AGREEMENTS (Unaudited) (continued)
The Board’s counsel stated that the Board should consider the profitability analysis (1) as part of their evaluation of whether the fees under the Agreements bear a reasonable relationship to the mix of services provided by Dreyfus and Walter Scott, including the nature, extent and quality of such services, and (2) in light of the relevant circumstances for the fund and the extent to which economies of scale would be realized if the fund grows and whether fee levels reflect these economies of scale for the benefit of fund shareholders. Since Dreyfus, and not the fund, pays Walter Scott pursuant to the Sub-Advisory Agreement, the Board did not consider Walter Scott’s profitability to be relevant to its deliberations. Dreyfus representatives noted that, as a result of shared and allocated costs among funds in the Dreyfus funds complex, the extent of economies of scale could depend substantially on the level of assets in the complex as a whole, so that increases and decreases in complex-wide assets can affect potential economies of scale in a manner that is disproportionate to, or even in the opposite direction from, changes in the fund’s asset level. The Board also considered potential benefits to Dreyfus and Walter Scott from acting as investment adviser and sub-investment adviser, respectively, and noted there were no soft dollar arrangements in effect for trading the fund’s investments.
At the conclusion of these discussions, the Board agreed that it had been furnished with sufficient information to make an informed business decision with respect to the renewal of the Agreements. Based on the discussions and considerations as described above, the Board concluded and determined as follows.
The Board concluded that the nature, extent, and quality of the services provided by Dreyfus and Walter Scott are adequate and appropriate.
The Board was satisfied with the fund’s performance, in light of the considerations described above.
The Board concluded that the fees paid to Dreyfus and Walter Scott were reasonable in light of the considerations described above.
38
The Board determined that the economies of scale which may accrue to Dreyfus and its affiliates in connection with the management of the fund had been adequately considered by Dreyfus in connection with the fee rate charged to the fund pursuant to the Agreement and that, to the extent in the future it were determined that material economies of scale had not been shared with the fund, the Board would seek to have those economies of scale shared with the fund.
The Board considered these conclusions and determinations, along with information received on a routine and regular basis throughout the year. In addition, it should be noted that the Board’s consideration of the contractual fee arrangements for this fund had the benefit of a number of years of reviews of prior or similar agreements during which lengthy discussions took place between the Board and Dreyfus representatives. Certain aspects of the arrangements may receive greater scrutiny in some years than in others, and the Board’s conclusions may be based, in part, on their consideration of the same or similar arrangements in prior years.The Board determined that renewal of the Agreements was in the best interests of the fund and its shareholders.
The Fund 39
BOARD MEMBERS INFORMATION (Unaudited)
| Joseph S. DiMartino (68) |
| Chairman of the Board (1995) |
| Principal Occupation During Past 5Years: |
| • Corporate Director and Trustee |
| Other Public Company Board Memberships During Past 5Years: |
| • CBIZ (formerly, Century Business Services, Inc.), a provider of outsourcing functions for small |
| and medium size companies, Director (1997-present) |
| • Sunair Services Corporation, a provider of certain outdoor-related services to homes and busi- |
| nesses, Director (2005-2009) |
| • The Newark Group, a provider of a national market of paper recovery facilities, paperboard |
| mills and paperboard converting plants, Director (2000-2010) |
| No. of Portfolios for which Board Member Serves: 164 |
| ——————— |
| David W. Burke (75) |
| Board Member (1994) |
| Principal Occupation During Past 5Years: |
| • Corporate Director and Trustee |
| No. of Portfolios for which Board Member Serves: 82 |
| ——————— |
| William Hodding Carter III (76) |
| Board Member (1988) |
| Principal Occupation During Past 5Years: |
| • Professor of Leadership & Public Policy, University of North Carolina, Chapel Hill (2006-present) |
| • President and Chief Executive Officer of the John S. and James L. Knight Foundation (1998-2006) |
| No. of Portfolios for which Board Member Serves: 29 |
| ——————— |
| Gordon J. Davis (70) |
| Board Member (2006) |
| Principal Occupation During Past 5Years: |
| • Partner in the law firm of Dewey & LeBoeuf LLP |
| Other Public Company Board Memberships During Past 5Years: |
| • Consolidated Edison, Inc., a utility company, Director (1997-present) |
| • The Phoenix Companies, Inc., a life insurance company, Director (2000-present) |
| No. of Portfolios for which Board Member Serves: 43 |
40
| Joni Evans (69) |
| Board Member (2006) |
| Principal Occupation During Past 5Years: |
| • Chief Executive Officer, www.wowOwow.com an online community dedicated to women’s |
| conversations and publications (2007-present) |
| • Principal, Joni Evans Ltd. (publishing) (2006-present) |
| • Senior Vice President of the William Morris Agency (1994-2006) |
| No. of Portfolios for which Board Member Serves: 29 |
| ——————— |
| Ehud Houminer (71) |
| Board Member (1994) |
| Principal Occupation During Past 5Years: |
| • Executive-in-Residence at the Columbia Business School, Columbia University (1992-present) |
| Other Public Company Board Memberships During Past 5Years: |
| • Avnet Inc., an electronics distributor, Director (1993-present) |
| No. of Portfolios for which Board Member Serves: 64 |
| ——————— |
| Richard C. Leone (71) |
| Board Member (1984) |
| Principal Occupation During Past 5Years: |
| • Senior Fellow of The Century Foundation (formerly,The Twentieth Century Fund, Inc.), a tax |
| exempt research foundation engaged in the study of economic, foreign policy and domestic issues |
| Other Public Company Board Memberships During Past 5Years: |
| • Partnership for a Secure America, Director |
| No. of Portfolios for which Board Member Serves: 29 |
| ——————— |
| Hans C. Mautner (74) |
| Board Member (1984) |
| Principal Occupation During Past 5Years: |
| • President—International Division and an Advisory Director of Simon Property Group, a real |
| estate investment company (1998-2010) |
| • Chairman and Chief Executive Officer of Simon Global Limited (1999-2010) |
| No. of Portfolios for which Board Member Serves: 29 |
The Fund 41
BOARD MEMBERS INFORMATION (Unaudited) (continued)
| Robin A. Melvin (48) |
| Board Member (1995) |
| Principal Occupation During Past 5Years: |
| • Director, Boisi Family Foundation, a private family foundation that supports youth-serving |
| organizations that promote the self sufficiency of youth from disadvantaged circumstances |
| (1995-present) |
| No. of Portfolios for which Board Member Serves: 53 |
| ——————— |
| Burton N.Wallack (61) |
| Board Member (2006) |
| Principal Occupation During Past 5Years: |
| • President and Co-owner of Wallack Management Company, a real estate management company |
| No. of Portfolios for which Board Member Serves: 29 |
| ——————— |
| John E. Zuccotti (74) |
| Board Member (1984) |
| Principal Occupation During Past 5Years: |
| • Chairman of Brookfield Properties, Inc. |
| • Senior Counsel of Weil, Gotshal & Manges, LLP |
| • Emeritus Chairman of the Real Estate Board of New York |
| Other Public Company Board Memberships During Past 5Years: |
| • Emigrant Savings Bank, Director (2004-present) |
| • Doris Duke Charitable Foundation,Trustee (2006-present) |
| No. of Portfolios for which Board Member Serves: 29 |
| ——————— |
| Once elected all Board Members serve for an indefinite term, but achieve Emeritus status upon reaching age 80.The |
| address of the Board Members and Officers is in c/o The Dreyfus Corporation, 200 Park Avenue, NewYork, NewYork |
| 10166.Additional information about the Board Members is available in the fund’s Statement of Additional Information |
| which can be obtained from Dreyfus free of charge by calling this toll free number: 1-800-DREYFUS. |
| Arnold S. Hiatt, Emeritus Board Member |
42
OFFICERS OF THE FUND (Unaudited)
The Fund 43
OFFICERS OF THE FUND (Unaudited) (continued)
44
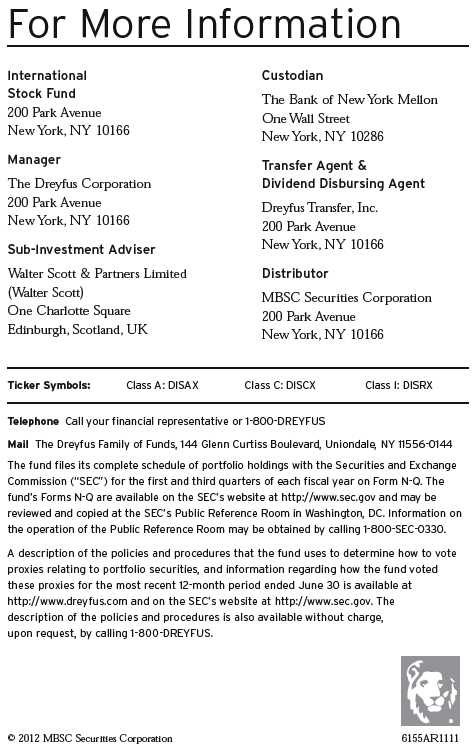
Item 2. Code of Ethics.
The Registrant has adopted a code of ethics that applies to the Registrant's principal executive officer, principal financial officer, principal accounting officer or controller, or persons performing similar functions. There have been no amendments to, or waivers in connection with, the Code of Ethics during the period covered by this Report.
Item 3. Audit Committee Financial Expert.
The Registrant's Board has determined that Ehud Houminer, a member of the Audit Committee of the Board, is an audit committee financial expert as defined by the Securities and Exchange Commission (the "SEC"). Ehud Houminer is "independent" as defined by the SEC for purposes of audit committee financial expert determinations.
Item 4. Principal Accountant Fees and Services.
(a) Audit Fees. The aggregate fees billed for each of the last two fiscal years (the "Reporting Periods") for professional services rendered by the Registrant's principal accountant (the "Auditor") for the audit of the Registrant's annual financial statements or services that are normally provided by the Auditor in connection with the statutory and regulatory filings or engagements for the Reporting Periods, were $130,934 in 2010 and $142,464 in 2011.
(b) Audit-Related Fees. The aggregate fees billed in the Reporting Periods for assurance and related services by the Auditor that are reasonably related to the performance of the audit of the Registrant's financial statements and are not reported under paragraph (a) of this Item 4 were $21,528 in 2010 and $24,000 in 2011. These services consisted of one or more of the following: (i) agreed upon procedures related to compliance with Internal Revenue Code section 817(h), (ii) security counts required by Rule 17f-2 under the Investment Company Act of 1940, as amended, (iii) advisory services as to the accounting or disclosure treatment of Registrant transactions or events and (iv) advisory services to the accounting or disclosure treatment of the actual or potential impact to the Registrant of final or proposed rules, standards or interpretations by the Securities and Exchange Commission, the Financial Accounting Standards Boards or other regulatory or standard-setting bodies.
The aggregate fees billed in the Reporting Periods for non-audit assurance and related services by the Auditor to the Registrant's investment adviser (not including any sub-investment adviser whose role is primarily portfolio management and is subcontracted with or overseen by another investment adviser), and any entity controlling, controlled by or under common control with the investment adviser that provides ongoing services to the Registrant ("Service Affiliates"), that were reasonably related to the performance of the annual audit of the Service Affiliate, which required pre-approval by the Audit Committee were $0 in 2010 and $0 in 2011.
(c) Tax Fees. The aggregate fees billed in the Reporting Periods for professional services rendered by the Auditor for tax compliance, tax advice, and tax planning ("Tax Services") were $14,543 in 2010 and $11,489 in 2011. These services consisted of: (i) review or preparation of U.S. federal, state, local and excise tax returns; (ii) U.S. federal, state and local tax planning, advice and assistance regarding statutory, regulatory or administrative developments; (iii) tax advice regarding tax qualification matters and/or treatment of various financial instruments held or proposed to be acquired or held, and (iv) determination of Passive Foreign Investment Companies. The aggregate fees billed in the Reporting Periods for Tax Services by the Auditor to Service Affiliates, which required pre-approval by the Audit Committee were $0 in 2010 and $0 in 2011.
(d) All Other Fees. The aggregate fees billed in the Reporting Periods for products and services provided by the Auditor, other than the services reported in paragraphs (a) through (c) of this Item, were $371 in 2010 and $766 in 2011. [These services consisted of a review of the Registrant's anti-money laundering program].
The aggregate fees billed in the Reporting Periods for Non-Audit Services by the Auditor to Service Affiliates, other than the services reported in paragraphs (b) through (c) of this Item, which required pre-approval by the Audit Committee, were $0 in 2010 and $0 in 2011.
(e)(1) Audit Committee Pre-Approval Policies and Procedures. The Registrant's Audit Committee has established policies and procedures (the "Policy") for pre-approval (within specified fee limits) of the Auditor's engagements for non-audit services to the Registrant and Service Affiliates without specific case-by-case consideration. The pre-approved services in the Policy can include pre-approved audit services, pre-approved audit-related services, pre-approved tax services and pre-approved all other services. Pre-approval considerations include whether the proposed services are compatible with maintaining the Auditor's independence. Pre-approvals pursuant to the Policy are considered annually.
(e)(2) Note: None of the services described in paragraphs (b) through (d) of this Item 4 were approved by the Audit Committee pursuant to paragraph (c)(7)(i)(C) of Rule 2-01 of Regulation S-X.
(f) None of the hours expended on the principal accountant's engagement to audit the registrant's financial statements for the most recent fiscal year were attributed to work performed by persons other than the principal account's full-time, permanent employees.
Non-Audit Fees. The aggregate non-audit fees billed by the Auditor for services rendered to the Registrant, and rendered to Service Affiliates, for the Reporting Periods were $33,851,490 in 2010 and $17,593,159 in 2011.
Auditor Independence. The Registrant's Audit Committee has considered whether the provision of non-audit services that were rendered to Service Affiliates, which were not pre-approved (not requiring pre-approval), is compatible with maintaining the Auditor's independence.
Item 5. Audit Committee of Listed Registrants.
Not applicable. [CLOSED-END FUNDS ONLY]
Item 6. Investments.
(a) Not applicable.
Item 7. Disclosure of Proxy Voting Policies and Procedures for Closed-End Management Investment Companies.
Not applicable. [CLOSED-END FUNDS ONLY]
Item 8. Portfolio Managers of Closed-End Management Investment Companies.
Not applicable. [CLOSED-END FUNDS ONLY, beginning with reports for periods ended on and after December 31, 2005]
Item 9. Purchases of Equity Securities by Closed-End Management Investment Companies and Affiliated Purchasers.
Not applicable. [CLOSED-END FUNDS ONLY]
Item 10. Submission of Matters to a Vote of Security Holders.
There have been no material changes to the procedures applicable to Item 10.
Item 11. Controls and Procedures.
(a) The Registrant's principal executive and principal financial officers have concluded, based on their evaluation of the Registrant's disclosure controls and procedures as of a date within 90 days of the filing date of this report, that the Registrant's disclosure controls and procedures are reasonably designed to ensure that information required to be disclosed by the Registrant on Form N-CSR is recorded, processed, summarized and reported within the required time periods and that information required to be disclosed by the Registrant in the reports that it files or submits on Form N-CSR is accumulated and communicated to the Registrant's management, including its principal executive and principal financial officers, as appropriate to allow timely decisions regarding required disclosure.
(b) There were no changes to the Registrant's internal control over financial reporting that occurred during the second fiscal quarter of the period covered by this report that have materially affected, or are reasonably likely to materially affect, the Registrant's internal control over financial reporting.
Item 12. Exhibits.
(a)(1) Code of ethics referred to in Item 2.
(a)(2) Certifications of principal executive and principal financial officers as required by Rule 30a-2(a) under the Investment Company Act of 1940.
(a)(3) Not applicable.
(b) Certification of principal executive and principal financial officers as required by Rule 30a-2(b) under the Investment Company Act of 1940.
SIGNATURES
Pursuant to the requirements of the Securities Exchange Act of 1934 and the Investment Company Act of 1940, the Registrant has duly caused this Report to be signed on its behalf by the undersigned, thereunto duly authorized.
STRATEGIC FUNDS, INC
By: /s/ Bradley J. Skapyak | |
Bradley J. Skapyak, President
| |
Date: | January 17, 2012 |
| |
Pursuant to the requirements of the Securities Exchange Act of 1934 and the Investment Company Act of 1940, this Report has been signed below by the following persons on behalf of the Registrant and in the capacities and on the dates indicated. | |
| |
By: /s/ Bradley J. Skapyak | |
Bradley J. Skapyak, President
| |
Date: | January 17, 2012 |
| |
By: /s/ James Windels | |
James Windels, Treasurer
| |
Date: | _ January 17, 2012 |
| |
EXHIBIT INDEX
(a)(1) Code of ethics referred to in Item 2.
(a)(2) Certifications of principal executive and principal financial officers as required by Rule 30a-2(a) under the Investment Company Act of 1940. (EX-99.CERT)
(b) Certification of principal executive and principal financial officers as required by Rule 30a-2(b) under the Investment Company Act of 1940. (EX-99.906CERT)