UNITED STATES
SECURITIES AND EXCHANGE COMMISSION
Washington, D.C. 20549
FORM N-CSR
CERTIFIED SHAREHOLDER REPORT OF REGISTERED MANAGEMENT
INVESTMENT COMPANIES
Investment Company Act file number | 811-3940 |
| |
| Strategic Funds, Inc. | |
| (Exact name of Registrant as specified in charter) | |
| | |
| c/o The Dreyfus Corporation 200 Park Avenue New York, New York 10166 | |
| (Address of principal executive offices) (Zip code) | |
| | |
| Michael A. Rosenberg, Esq. 200 Park Avenue New York, New York 10166 | |
| (Name and address of agent for service) | |
|
Registrant's telephone number, including area code: | (212) 922-6000 |
| |
Date of fiscal year end: | 11/30 | |
Date of reporting period: | 11/30/10 | |
| | | | | | |
The following N-CSR relates only to the Registrant’s series listed below and does not affect the other series of the Registrant, which have different fiscal year ends and, therefore, different N-CSR reporting requirements. Separate N-CSR Forms will be filed for these series, as appropriate.
Dreyfus Select Managers Small Cap Value Fund
Dreyfus U.S. Equity Fund
Global Stock Fund
International Stock Fund
FORM N-CSR
Item 1. Reports to Stockholders.
|
| Dreyfus |
| Select Managers |
| Small Cap Value Fund |
ANNUAL REPORT November 30, 2010

Save time. Save paper. View your next shareholder report online as soon as it’s available. Log into www.dreyfus.com and sign up for Dreyfus eCommunications. It’s simple and only takes a few minutes.
The views expressed in this report reflect those of the portfolio manager only through the end of the period covered and do not necessarily represent the views of Dreyfus or any other person in the Dreyfus organization. Any such views are subject to change at any time based upon market or other conditions and Dreyfus disclaims any responsibility to update such views.These views may not be relied on as investment advice and, because investment decisions for a Dreyfus fund are based on numerous factors, may not be relied on as an indication of trading intent on behalf of any Dreyfus fund.

| | Contents |
| | THE FUND |
| 2 | A Letter from the Chairman and CEO |
| 3 | Discussion of Fund Performance |
| 6 | Fund Performance |
| 8 | Understanding Your Fund’s Expenses |
| 8 | Comparing Your Fund’s Expenses With Those of Other Funds |
| 9 | Statement of Investments |
| 20 | Statement of Assets and Liabilities |
| 21 | Statement of Operations |
| 22 | Statement of Changes in Net Assets |
| 24 | Financial Highlights |
| 27 | Notes to Financial Statements |
| 36 | Report of Independent Registered Public Accounting Firm |
| 37 | Important Tax Information |
| 38 | Information About the Review and Approval of the Fund’s Management Agreement, Portfolio Allocation Management Agreement and Sub-Invesment Advisory Agreements |
| 46 | Board Members Information |
| 49 | Officers of the Fund |
| | FOR MORE INFORMATION |
| | Back Cover |
|
| Dreyfus |
| Select Managers |
| Small Cap Value Fund |

A LETTER FROM THE CHAIRMAN AND CEO
Dear Shareholder:
We are pleased to present this annual report for Dreyfus Select Managers Small CapValue Fund, covering the 12-month period from December 1, 2009, through November 30, 2010.
Stocks throughout the global markets delivered respectable returns during the reporting period, despite periodic bouts of market volatility stemming from economic uncertainty and events. Although GDP growth in most countries was positive throughout the reporting period, the global economic recovery has been milder than historical averages, in particular in the U.S. Most notably, heavy sovereign debt burdens recently renewed credit concerns in Europe, effectively barring some governments from adopting more stimulative fiscal policies. However, robust demand from the world’s emerging markets has taken up some of the slack, supporting corporate earnings and stock prices.
We are cautiously optimistic regarding global economic and market prospects in 2011. Global expansion should gain a degree of momentum, led by financially strong emerging markets countries, while “debt hangover” countries in the developed world may face continued economic challenges. Monetary policy remains stimulative in most markets, and inflation-adjusted interest rates and inflation remain low. So is your portfolio positioned accordingly given these recent global economic events?Talk with your financial advisor, who can help you evaluate your portfolio investments within the new global economic framework to help meet your individual investment needs and future capital goals.
For information about how the fund performed during the reporting period, as well as general market perspectives, we provide a Discussion of Fund Performance on the pages that follow.
Thank you for your continued confidence and support.

Jonathan R. Baum
Chairman and Chief Executive Officer
The Dreyfus Corporation
December 15, 2010
2

DISCUSSION OF FUND PERFORMANCE
For the period of December 1, 2009, through November 30, 2010, as provided by Keith L. Stransky and Robert B. Mayerick, Portfolio Allocation Managers, EACM Advisors LLC
Market and Fund Performance Overview
For the 12-month period ended November 30, 2010, Dreyfus Select Managers Small CapValue Fund’s Class A shares produced a total return of 29.05%, Class C shares returned 28.07% and Class I shares returned 29.32%.1 In comparison, the total return of the Russell 2000Value Index (the “Index”), the fund’s benchmark, was 23.66% for the same period.2
Small-cap stocks generally encountered heightened volatility due to economic concerns, but rising corporate earnings and the prospect of further easing of U.S. monetary policy helped the Index end the reporting period with substantial gains. The fund produced higher returns than its benchmark, mainly the result of overweighted exposure and strong stock selections in the industrials and health care sectors.
The Fund’s Investment Approach
The fund seeks capital appreciation.To pursue its goal, the fund normally invests at least 80% of its assets in the stocks of small-cap companies.The fund uses a “multi-manager” approach by selecting one or more sub-advisers to manage its assets.As the fund’s portfolio allocation managers, we seek sub-advisers that complement one another’s style of investing, consistent with the fund’s investment goal.We monitor and evaluate the performance of the sub-advisers and will recommend to Dreyfus and the fund’s board any changes based on our evaluations.
The fund’s assets currently are allocated among five sub-advisers, each acting independently of one another and using its own methodology to select portfolio investments. Currently, 25% of the fund’s assets are allocated to Thompson, Siegel and Walmsley, LLC, which employs a combination of quantitative and qualitative security selection methods based on a four-factor valuation model. 30% is allocated to Walthausen & Co., LLC, which uses a proprietary valuation model to identify companies that are trading at a discount to their intrinsic values. 30%
TheFund 3
DISCUSSION OF FUND PERFORMANCE (continued)
is allocated to Neuberger Berman Management LLC, which uses fundamental analysis and a bottom-up stock selection process to identify publicly traded small-cap companies selling at a material discount to their intrinsic value. 10% of the fund’s assets are allocated to Lombardia Capital Partners, which uses fundamental analysis and a bottom-up value-oriented approach in seeking stocks trading below their intrinsic values. Finally, 5% of the fund’s assets are allocated to Riverbridge Partners, LLC, which focuses on companies that are building their earnings power and intrinsic value over long periods of time.
Economic Concerns Sparked Heightened Market Volatility
Early in the reporting period, sustained global and domestic economic recoveries helped fuel a market rally that lifted small-cap stocks. However, in the spring of 2010, investors faced renewed global economic uncertainty when Europe was roiled by a sovereign debt crisis and mixed data in the United States regarding unemployment and housing markets suggested that stubborn economic headwinds might constrain already mild domestic growth.As a result, U.S. stocks posted sharp declines through the summer.
The market reversed course again in the fall, climbing amid growing corporate earnings and consumer spending. In addition, investors looked forward to new monetary stimulus from the Federal Reserve Board. Renewed optimism sparked a broad-based market rally, enabling the Index to post double-digit gains by the reporting period’s end.
Fund Added Value in Industrials Sector
The fund participated more fully than the benchmark in the market rally. Results were especially strong in the industrials sector, where an overweighted position helped bolster the fund’s exposure to companies that prospered amid robust global demand for industrial equipment and materials.The fund’s top individual performer for the reporting period was Ladish Inc., a maker of jet engine components that posted better-than-expected earnings before receiving an acquisition offer from Allegheny Technologies. Another industrial holding, friction products provider Hawk Corp., was acquired during the reporting period by Carlisle Companies. In each case, the acquirers apparently recognized, as the fund’s subadvisers did, that the stocks were trading below their intrinsic values. In the health care sector, the fund’s relative perfor-
4
mance benefited from Questcor Pharmaceuticals, which more than tripled in value after receiving regulatory approval for a new treatment for neurological disorders.
On the other hand, the fund encountered some disappointments during the reporting period. Lackluster stock selection in the overweighted technology sector undermined relative performance; examples included Hutchinson Technology, which saw weaker demand for its disk drive suspension assemblies, and mobile technology specialist Telecommunications Systems, which lagged due to quarterly earnings that fell short of analysts’ expectations.
Positioned for a Slow Recovery
Although we expect the U.S. economy to remain sluggish, we remain optimistic about the prospects of U.S. stocks. In our judgment, rising corporate earnings could lead to greater mergers-and-acquisitions activity, potentially benefiting small-cap stocks as larger companies begin to deploy some of their massive cash reserves. We believe that these factors—as well as the fund’s exposure to some of the industry’s top portfolio managers—make the fund an attractive investment vehicle in today’s marketplace.
December 15, 2010
| |
| | Please note, the position in any security highlighted with italicized typeface was sold during the |
| | reporting period. |
| | Equity funds are subject generally to market, market sector, market liquidity, issuer and investment |
| | style risks, among other factors, to varying degrees, all of which are more fully described in the |
| | fund’s prospectus. |
| | The prices of small company stocks tend to be more volatile than the prices of large company |
| | stocks, mainly because these companies have less established and more volatile earnings histories. |
| | They also tend to be less liquid than larger company stocks. |
| 1 | Total return includes reinvestment of dividends and any capital gains paid, and does not take into |
| | consideration the maximum initial sales charge in the case of Class A shares, or the applicable |
| | contingent deferred sales charge imposed on redemptions in the case of Class C shares. Had these |
| | charges been reflected, returns would have been lower. Past performance is no guarantee of future |
| | results. Share price and investment return fluctuate such that upon redemption, fund shares may be |
| | worth more or less than their original cost. Return figures provided reflect the absorption of certain |
| | fund expenses by The Dreyfus Corporation pursuant to an undertaking in effect through April 1, |
| | 2011, at which time it may be extended, terminated or modified. Had these expenses not been |
| | absorbed, the fund’s returns would have been lower. |
| 2 | SOURCE: LIPPER INC. — Reflects the reinvestment of dividends and, where applicable, |
| | capital gain distributions.The Russell 2000 Value Index is an unmanaged index, which measures |
| | the performance of those Russell 2000 companies with lower price-to-book ratios and lower |
| | forecasted growth values. Investors cannot invest directly in any index. |
TheFund 5
FUND PERFORMANCE
|
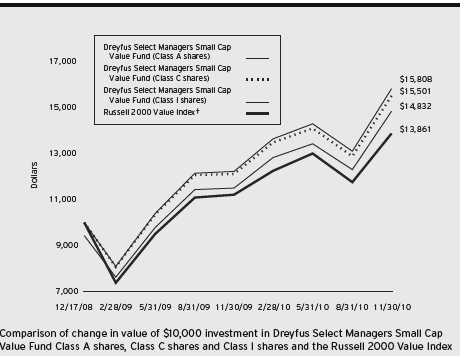
| † Source: Lipper Inc. |
| Past performance is not predictive of future performance. |
| The above graph compares a $10,000 investment made in Class A, Class C and Class I shares of Dreyfus Select |
| Managers Small Cap Value Fund on 12/17/08 (inception date) to a $10,000 investment made in the Russell 2000 |
| Value Index (the “Index”) on that date. For comparative purposes, the value of the Index on 12/31/08 is used as the |
| beginning value on 12/17/08.All dividends and capital gain distributions are reinvested. |
| The fund’s performance shown in the line graph above takes into account the maximum initial sales charge on Class A |
| shares and all other applicable fees and expenses on all classes.The Index is an unmanaged index, which measures the |
| performance of those Russell 2000 companies with lower price-to-book ratios and lower forecasted growth values. Unlike |
| a mutual fund, the Index is not subject to charges, fees and other expenses. Investors cannot invest directly in any index. |
| These factors can contribute to the Index potentially outperforming the fund. Further information relating to fund |
| performance, including expense reimbursements, if applicable, is contained in the Financial Highlights section of the |
| prospectus and elsewhere in this report. |
6
| | | |
| Average Annual Total Returns as of 11/30/10 | | |
| |
| | Inception | | From |
| | Date | 1 Year | Inception |
| Class A shares | | | |
| with maximum sales charge (5.75%) | 12/17/08 | 21.63% | 22.40% |
| without sales charge | 12/17/08 | 29.05% | 26.16% |
| Class C shares | | | |
| with applicable redemption charge † | 12/17/08 | 27.07% | 25.21% |
| without redemption | 12/17/08 | 28.07% | 25.21% |
| Class I shares | 12/17/08 | 29.32% | 26.47% |
| Russell 2000 Value Index†† | 12/31/08 | 23.66% | 18.57% |
Past performance is not predictive of future performance.The fund’s performance shown in the graph and table does not reflect the deduction of taxes that a shareholder would pay on fund distributions or the redemption of fund shares.
| |
| † | The maximum contingent deferred sales charge for Class C shares is 1% for shares redeemed within one year of the |
| | date of purchase. |
| †† | For comparative purposes, the value of the Index as of 12/31/08 is used as the beginning value on 12/17/08. |
TheFund 7
UNDERSTANDING YOUR FUND’S EXPENSES (Unaudited)
As a mutual fund investor, you pay ongoing expenses, such as management fees and other expenses. Using the information below, you can estimate how these expenses affect your investment and compare them with the expenses of other funds.You also may pay one-time transaction expenses, including sales charges (loads) and redemption fees, which are not shown in this section and would have resulted in higher total expenses. For more information, see your fund’s prospectus or talk to your financial adviser.
Review your fund’s expenses
The table below shows the expenses you would have paid on a $1,000 investment in Dreyfus Select Managers Small CapValue Fund from June 1, 2010 to November 30, 2010. It also shows how much a $1,000 investment would be worth at the close of the period, assuming actual returns and expenses.
Expenses and Value of a $1,000 Investment
assuming actual returns for the six months ended November 30, 2010
| | | |
| | Class A | Class C | Class I |
| Expenses paid per $1,000† | $ 6.70 | $ 10.74 | $ 5.39 |
| Ending value (after expenses) | $1,105.30 | $1,100.70 | $1,106.60 |
COMPARING YOUR FUND’S EXPENSES
WITH THOSE OF OTHER FUNDS (Unaudited)
Using the SEC’s method to compare expenses
The Securities and Exchange Commission (SEC) has established guidelines to help investors assess fund expenses. Per these guidelines, the table below shows your fund’s expenses based on a $1,000 investment, assuming a hypothetical 5% annualized return. You can use this information to compare the ongoing expenses (but not transaction expenses or total cost) of investing in the fund with those of other funds.All mutual fund shareholder reports will provide this information to help you make this comparison. Please note that you cannot use this information to estimate your actual ending account balance and expenses paid during the period.
Expenses and Value of a $1,000 Investment
assuming a hypothetical 5% annualized return for the six months ended November 30, 2010
| | | |
| | Class A | Class C | Class I |
| Expenses paid per $1,000† | $ 6.43 | $ 10.30 | $ 5.16 |
| Ending value (after expenses) | $1,018.70 | $1,014.84 | $1,019.95 |
|
| † Expenses are equal to the fund’s annualized expense ratio of 1.27% for Class A, 2.04% for Class C and 1.02% |
| for Class I, multiplied by the average account value over the period, multiplied by 183/365 (to reflect the one-half |
| year period). |
8
STATEMENT OF INVESTMENTS
November 30, 2010
| | |
| Common Stocks—97.3% | Shares | Value ($) |
| Consumer Discretionary—16.7% | | |
| Aaron’s | 27,950 | 557,882 |
| Advance Auto Parts | 22,200 | 1,464,978 |
| Ambassadors Group | 88,620 | 975,706 |
| American Reprographics | 32,613 a | 229,269 |
| Avery Dennison | 38,600 | 1,449,044 |
| Barrett Business Services | 16,067 | 238,274 |
| Brink’s | 30,900 | 758,286 |
| Cabela’s | 60,190 a | 1,339,227 |
| Capella Education | 3,473 a | 190,286 |
| Carter’s | 54,400 a | 1,722,304 |
| CEC Entertainment | 5,503 a | 206,473 |
| Cheesecake Factory | 13,900 a | 442,993 |
| Chico’s FAS | 32,200 | 388,010 |
| Cinemark Holdings | 43,900 | 770,445 |
| Coinstar | 16,200 a | 1,043,928 |
| Conn’s | 14,959 a | 47,869 |
| Convergys | 64,700 a | 833,983 |
| Cooper | 24,600 | 1,316,100 |
| Corinthian Colleges | 149,700 a | 618,261 |
| CPI | 26,730 | 760,736 |
| Cracker Barrel Old Country Store | 4,896 | 257,823 |
| CSS Industries | 44,100 | 805,707 |
| Diebold | 23,600 | 741,512 |
| Digital River | 17,700 a | 651,714 |
| Dress Barn | 22,193 a | 548,167 |
| Drew Industries | 56,000 a | 1,131,200 |
| FTI Consulting | 42,739 a | 1,523,218 |
| Genesco | 9,123 a | 350,871 |
| Gentex | 24,775 | 520,027 |
| Grand Canyon Education | 11,737 a | 223,472 |
| Hillenbrand | 29,701 | 573,526 |
| Interval Leisure Group | 80,400 a | 1,332,228 |
| JOS. A. Bank Clothiers | 18,501 a | 833,285 |
| Kirkland’s | 24,900 a | 297,555 |
| Korn/Ferry International | 21,834 a | 378,165 |
TheFund 9
STATEMENT OF INVESTMENTS (continued)
| | |
| Common Stocks (continued) | Shares | Value ($) |
| Consumer Discretionary (continued) | | |
| Lifetime Brands | 61,645 a | 908,647 |
| LKQ | 19,400 a | 418,555 |
| Meredith | 9,549 | 321,037 |
| Nobel Learning Communities | 62,100 a | 432,837 |
| Nu Skin Enterprises, Cl. A | 6,747 | 213,273 |
| OfficeMax | 74,500 a | 1,273,205 |
| PEP Boys-Manny Moe & Jack | 157,405 | 1,950,248 |
| Polaris Industries | 1,771 | 128,734 |
| Quiksilver | 108,100 a | 464,830 |
| Rent-A-Center | 61,172 | 1,703,028 |
| Ruth’s Hospitality Group | 50,382 a | 248,887 |
| Sally Beauty Holdings | 110,300 a | 1,516,625 |
| Shuffle Master | 73,300 a | 786,509 |
| Shutterfly | 27,200 a | 897,600 |
| Snap-On | 7,300 | 386,389 |
| Stein Mart | 6,915 a | 68,458 |
| TNS | 14,043 a | 269,906 |
| True Religion Apparel | 32,000 a | 717,760 |
| Universal Technical Institute | 58,360 | 1,208,636 |
| Valassis Communications | 25,900 a | 843,045 |
| ValueClick | 63,200 a | 982,128 |
| Warner Music Group | 125,800 a | 606,356 |
| | | 41,869,217 |
| Consumer Staples—2.4% | | |
| Chiquita Brands International | 23,360 a | 261,165 |
| Constellation Brands, Cl. A | 93,300 a | 1,922,913 |
| Flowers Foods | 39,400 | 1,032,280 |
| Landec | 136,350 a | 853,551 |
| Nash Finch | 6,319 | 233,487 |
| Overhill Farms | 41,025 a | 215,381 |
| Sensient Technologies | 12,347 | 419,428 |
| United Natural Foods | 12,125 a | 453,960 |
| USANA Health Sciences | 2,510 a | 105,721 |
| Zhongpin | 23,500 a | 449,085 |
| | | 5,946,971 |
10
| | | |
| Common Stocks (continued) | Shares | | Value ($) |
| Energy—5.9% | | | |
| Andersons | 23,100 | | 746,592 |
| Atmos Energy | 11,429 | | 343,670 |
| Berry Petroleum, Cl. A | 8,136 | | 310,063 |
| Brigham Exploration | 96,000 | a | 2,414,400 |
| Cal Dive International | 34,510 | a | 184,628 |
| Global Industries | 87,900 a | 547,617 |
| GMX Resources | 68,092 a | 301,648 |
| Gulfport Energy | 47,950 a | 893,788 |
| Holly | 24,100 | | 866,154 |
| Newpark Resources | 75,300 a | 430,716 |
| Northern Oil and Gas | 83,100 a | 1,898,835 |
| Ormat Technologies | 16,300 | | 436,840 |
| Pantry | 32,200 a | 661,388 |
| Southern Union | 41,100 | | 970,371 |
| Stone Energy | 12,633 a | 260,998 |
| Tetra Technologies | 119,200 a | 1,311,200 |
| Venoco | 44,500 a | 774,745 |
| Whiting Petroleum | 13,300 a | 1,463,665 |
| | | | 14,817,318 |
| Financial—19.0% | | | |
| Alterra Capital Holdings | 36,200 | | 736,308 |
| Altisource Portfolio Solutions | 37,233 a | 1,011,993 |
| American Equity Investment Life Holding | 92,166 | | 1,011,983 |
| Ares Capital | 25,324 | | 416,073 |
| Asta Funding | 60,630 | | 433,504 |
| Baldwin & Lyons, Cl. B | 8,875 | | 205,279 |
| BancorpSouth | 13,197 | | 169,581 |
| Bank of Hawaii | 10,286 | | 445,384 |
| BioMed Realty Trust | 45,700 b | 805,691 |
| Brandywine Realty Trust | 50,300 b | 556,318 |
| Broadridge Financial Solutions | 42,700 | | 879,193 |
| Bryn Mawr Bank | 53,520 | | 898,601 |
| Capstead Mortgage | 52,400 b | 615,700 |
| Cash America International | 25,900 | | 937,580 |
| Center Financial | 21,791 a | 136,412 |
TheFund 11
STATEMENT OF INVESTMENTS (continued)
| | |
| Common Stocks (continued) | Shares | Value ($) |
| Financial (continued) | | |
| City Holding | 18,300 | 586,881 |
| Columbia Banking System | 89,725 | 1,564,804 |
| Community Bank System | 55,254 | 1,330,516 |
| CoreLogic | 57,500 | 1,047,075 |
| Cullen/Frost Bankers | 7,332 | 392,555 |
| CVB Financial | 125,100 | 984,537 |
| Delphi Financial Group, Cl. A | 27,172 | 697,777 |
| Deluxe | 27,640 | 585,692 |
| Donegal Group, Cl. A | 14,111 | 209,831 |
| EastGroup Properties | 8,433 b | 336,224 |
| Euronet Worldwide | 35,000 a | 572,600 |
| F.N.B | 33,550 | 294,234 |
| FBL Financial Group, Cl. A | 8,487 | 226,773 |
| First Bancorp/NC | 20,700 | 299,943 |
| First Cash Financial Services | 22,300 a | 642,017 |
| First Niagara Financial Group | 59,700 | 739,384 |
| First Potomac Realty Trust | 10,876 b | 171,188 |
| Glimcher Realty Trust | 55,901 b | 457,270 |
| Global Cash Access Holdings | 32,999 a | 75,238 |
| Hallmark Financial Services | 104,000 a | 913,120 |
| Harleysville Group | 11,230 | 399,676 |
| HCC Insurance Holdings | 20,916 | 587,321 |
| Horace Mann Educators | 42,100 | 687,493 |
| Huntington Bancshares | 123,200 | 718,872 |
| IBERIABANK | 15,800 | 796,478 |
| Investment Technology Group | 16,954 a | 249,224 |
| Knight Capital Group, Cl. A | 29,597 a | 388,905 |
| LaSalle Hotel Properties | 37,700 b | 897,260 |
| Lender Processing Services | 35,700 | 1,098,489 |
| Meadowbrook Insurance Group | 115 | 1,088 |
| Medical Properties Trust | 11,049 b | 115,794 |
| MGIC Investment | 83,900 a | 714,828 |
| National Western Life Insurance | 6,100 | 1,017,053 |
| Net 1 UEPS Technologies | 43,300 a | 526,095 |
| Ocwen Financial | 318,250 a | 2,800,600 |
| Omega Healthcare Investors | 54,683 b | 1,154,358 |
12
| | |
| Common Stocks (continued) | Shares | Value ($) |
| Financial (continued) | | |
| Park National | 14,625 | 988,065 |
| Parkway Properties | 20,366 b | 323,616 |
| Platinum Underwriters Holdings | 16,100 | 696,003 |
| Portfolio Recovery Associates | 6,123 a | 388,015 |
| PS Business Parks | 13,000 b | 673,660 |
| RLI | 16,800 | 974,064 |
| SLM | 104,900 a | 1,211,595 |
| Sterling Bancorp | 21,000 | 197,190 |
| Sterling Bancshares | 254,800 | 1,512,238 |
| Suffolk Bancorp | 14,900 | 382,632 |
| SVB Financial Group | 27,936 a | 1,255,164 |
| TCF Financial | 52,500 | 714,525 |
| Texas Capital Bancshares | 38,800 a | 732,544 |
| Tower Group | 58,480 | 1,504,106 |
| Umpqua Holdings | 63,000 | 667,170 |
| Waddell & Reed Financial, Cl. A | 7,129 | 219,573 |
| Wintrust Financial | 24,800 | 710,520 |
| World Acceptance | 26,403 a | 1,163,316 |
| | | 47,854,789 |
| Health Care—8.3% | | |
| Abaxis | 10,598 a | 286,146 |
| Affymetrix | 69,100 a | 287,456 |
| Allscripts Healthcare Solutions | 18,600 a | 326,430 |
| Amedisys | 15,600 a | 442,728 |
| AmSurg | 19,815 a | 364,200 |
| AngioDynamics | 20,800 a | 290,576 |
| Beckman Coulter | 22,000 | 1,203,620 |
| Bio-Reference Laboratories | 10,525 a | 220,709 |
| Cambrex | 173,382 a | 740,341 |
| Celera | 65,100 a | 369,117 |
| Cepheid | 34,800 a | 685,212 |
| Charles River Laboratories International | 45,100 a | 1,472,515 |
| Chemed | 37,750 | 2,300,485 |
| Genoptix | 24,200 a | 413,094 |
| Health Management Associates, Cl. A | 103,000 a | 917,730 |
| HealthSpring | 37,600 a | 1,008,808 |
TheFund 13
STATEMENT OF INVESTMENTS (continued)
| | |
| Common Stocks (continued) | Shares | Value ($) |
| Health Care (continued) | | |
| Hill-Rom Holdings | 28,325 | 1,121,103 |
| IPC The Hospitalist | 6,950 a | 225,319 |
| Magellan Health Services | 32,900 a | 1,602,230 |
| Mednax | 7,300 a | 446,760 |
| MEDTOX Scientific | 5,675 | 65,830 |
| Neogen | 12,300 a | 456,945 |
| Owens & Minor | 34,740 | 981,405 |
| PDL BioPharma | 11,581 | 66,938 |
| Quality Systems | 3,175 | 204,756 |
| Questcor Pharmaceuticals | 76,700 a | 1,092,208 |
| RehabCare Group | 30,889 a | 624,884 |
| SXC Health Solutions | 21,600 a | 828,360 |
| Symmetry Medical | 40,090 a | 327,535 |
| Techne | 4,725 | 283,831 |
| Theragenics | 179,200 a | 249,088 |
| West Pharmaceutical Services | 27,500 | 1,042,800 |
| | | 20,949,159 |
| Industrial—16.6% | | |
| AAON | 24,675 | 632,914 |
| Aerovironment | 15,400 a | 380,380 |
| Allegiant Travel | 15,270 | 762,431 |
| Beacon Roofing Supply | 18,000 a | 309,420 |
| Bristow Group | 30,926 a | 1,357,961 |
| CAI International | 46,610 a | 953,174 |
| Ceradyne | 37,100 a | 980,182 |
| CoStar Group | 4,100 a | 216,234 |
| Covanta Holding | 62,500 | 982,500 |
| Crown Holdings | 50,500 a | 1,567,015 |
| Curtiss-Wright | 27,720 | 861,260 |
| Danaos | 143,900 a | 548,259 |
| Dresser-Rand Group | 29,900 a | 1,134,107 |
| Dynamex | 6,400 a | 154,560 |
| Echo Global Logistics | 6,033 a | 69,078 |
| EnerNOC | 6,903 a | 169,331 |
| EnerSys | 48,498 a | 1,464,155 |
| Ennis | 36,215 | 618,190 |
14
| | |
| Common Stocks (continued) | Shares | Value ($) |
| Industrial (continued) | | |
| ESCO Technologies | 15,000 | 526,200 |
| Forward Air | 6,725 | 185,072 |
| Franklin Electric | 7,395 | 287,739 |
| Glatfelter | 29,753 | 370,127 |
| Global Power Equipment Group | 28,600 a | 569,712 |
| Granite Construction | 22,030 | 558,901 |
| Hexcel | 55,975 a | 959,971 |
| Hubbell, Cl. B | 22,700 | 1,283,912 |
| Innerworkings | 26,800 a | 165,356 |
| John Bean Technologies | 43,400 | 800,730 |
| KBR | 39,200 | 1,061,536 |
| Knoll | 80,445 | 1,234,831 |
| L.B. Foster, Cl. A | 23,195 a | 804,635 |
| Littelfuse | 1,165 | 53,905 |
| Lydall | 114,930 a | 830,944 |
| Manitowoc | 48,000 | 527,040 |
| McGrath Rentcorp | 51,200 | 1,429,504 |
| Miller Industries | 24,950 | 349,799 |
| Mobile Mini | 8,300 a | 149,981 |
| Navistar International | 26,900 a | 1,376,742 |
| Pall | 28,200 | 1,276,614 |
| Park Electrochemical | 15,779 | 432,345 |
| Parker Drilling | 59,183 a | 236,732 |
| Polypore International | 13,900 a | 441,742 |
| Resources Connection | 17,750 | 296,957 |
| Ritchie Brothers Auctioneers | 12,625 | 252,752 |
| Rollins | 23,125 | 624,838 |
| Ryder System | 29,200 | 1,258,812 |
| School Specialty | 73,560 a | 929,063 |
| Seaspan | 29,500 | 374,060 |
| SkyWest | 23,843 | 386,018 |
| Sonoco Products | 9,347 | 306,208 |
| Standex International | 73,820 | 2,207,218 |
| Teledyne Technologies | 21,800 a | 876,796 |
| Textainer Group Holdings | 36,945 | 1,027,810 |
| Textron | 68,400 | 1,529,424 |
TheFund 15
STATEMENT OF INVESTMENTS (continued)
| | |
| Common Stocks (continued) | Shares | Value ($) |
| Industrial (continued) | | |
| Thomas & Betts | 29,598 a | 1,315,632 |
| Tutor Perini | 17,970 | 342,328 |
| Xerium Technologies | 75,635 a | 984,768 |
| | | 41,787,905 |
| Information Technology—16.4% | | |
| Acacia Research | 41,800 a | 1,139,050 |
| Accelrys | 98,700 a | 831,054 |
| American Software, Cl. A | 35,860 | 240,621 |
| ANSYS | 7,500 a | 363,750 |
| Arris Group | 92,400 a | 924,924 |
| Benchmark Electronics | 21,758 a | 349,651 |
| Black Box | 12,969 | 464,679 |
| Brocade Communications Systems | 207,700 a | 1,034,346 |
| Cabot Microelectronics | 5,850 a | 230,900 |
| CACI International, Cl. A | 9,053 a | 455,637 |
| Cadence Design Systems | 85,900 a | 675,174 |
| Cardtronics | 38,600 a | 652,340 |
| Cass Information Systems | 6,400 | 226,304 |
| Ciena | 43,600 a | 660,540 |
| Comtech Telecommunications | 22,800 | 676,248 |
| Comverse Technology | 79,900 a | 614,431 |
| Concur Technologies | 3,850 a | 197,158 |
| Constant Contact | 6,536 a | 167,256 |
| CTS | 65,300 | 671,937 |
| DDI | 94,570 | 992,039 |
| DealerTrack Holdings | 12,500 a | 238,750 |
| Digi International | 29,100 a | 279,360 |
| DST Systems | 28,600 | 1,225,796 |
| Echelon | 14,500 a | 138,185 |
| Electronics for Imaging | 85,645 a | 1,121,093 |
| Fair Isaac | 36,600 | 854,610 |
| Fairchild Semiconductor International | 144,165 a | 2,025,518 |
| FARO Technologies | 6,500 a | 168,805 |
| Forrester Research | 8,500 a | 294,525 |
| Guidance Software | 13,850 a | 84,900 |
| Ikanos Communications | 107,600 a | 118,360 |
16
| | |
| Common Stocks (continued) | Shares | Value ($) |
| Information Technology (continued) | | |
| Infinera | 63,600 a | 518,976 |
| Integrated Silicon Solution | 18,753 a | 149,836 |
| International Rectifier | 2,262 a | 64,150 |
| Intersil, Cl. A | 67,700 | 863,175 |
| ION Geophysical | 139,100 a | 1,000,129 |
| Keynote Systems | 57,200 | 700,128 |
| MAXIMUS | 5,650 | 342,955 |
| MEMC Electronic Materials | 73,800 a | 853,866 |
| Mercury Computer Systems | 37,400 a | 666,094 |
| MTS Systems | 11,863 | 454,590 |
| Multi-Fineline Electronix | 18,100 a | 421,730 |
| Napco Security Technologies | 11,250 a | 18,563 |
| National Instruments | 15,650 | 533,978 |
| Plantronics | 23,300 | 833,441 |
| Power Integrations | 9,700 | 390,813 |
| Power-One | 48,600 a | 459,270 |
| Premiere Global Services | 29,080 a | 205,305 |
| RF Micro Devices | 119,700 a | 839,097 |
| Scientific Games, Cl. A | 113,400 a | 912,870 |
| SeaChange International | 83,100 a | 668,124 |
| Semtech | 21,500 a | 502,885 |
| Sierra Wireless | 53,000 a | 589,360 |
| Standard Microsystems | 30,200 a | 822,950 |
| Stratasys | 8,453 a | 285,880 |
| Tekelec | 67,100 a | 828,685 |
| TeleCommunication Systems, Cl. A | 82,600 a | 384,916 |
| Telvent GIT | 6,650 a | 158,669 |
| TIBCO Software | 37,300 a | 732,572 |
| Ultimate Software Group | 12,200 a | 535,214 |
| Ultratech | 56,300 a | 1,034,231 |
| Verigy | 63,700 a | 545,272 |
| Verint Systems | 69,375 a | 2,282,438 |
| Vishay Intertechnology | 195,150 a | 2,782,839 |
| Zoran | 96,100 a | 661,168 |
| | | 41,162,110 |
TheFund 17
STATEMENT OF INVESTMENTS (continued)
| | |
| Common Stocks (continued) | Shares | Value ($) |
| Materials—6.5% | | |
| Arch Chemicals | 39,300 | 1,364,496 |
| Bemis | 15,450 | 485,439 |
| Boise | 112,700 | 828,345 |
| Cytec Industries | 11,400 | 545,262 |
| Harry Winston Diamond | 47,200 a | 598,024 |
| Horsehead Holding | 59,100 a | 687,333 |
| Innophos Holdings | 9,150 | 311,649 |
| KapStone Paper and Packaging | 54,980 a | 809,306 |
| LSB Industries | 33,579 a | 774,332 |
| Omnova Solutions | 172,670 a | 1,516,043 |
| PolyOne | 46,150 a | 575,029 |
| Royal Gold | 9,300 | 479,136 |
| RPM International | 19,395 | 397,210 |
| RTI International Metals | 34,380 a | 975,361 |
| Schulman (A.) | 36,800 | 745,200 |
| Schweitzer-Mauduit International | 13,204 | 829,343 |
| Solutia | 160,100 a | 3,422,938 |
| Thompson Creek Metals | 65,100 a | 790,965 |
| USEC | 29,200 a | 173,740 |
| Zoltek | 13,000 a | 118,170 |
| | | 16,427,321 |
| Producer Durables—3.6% | | |
| Actuant, Cl. A | 41,000 | 968,830 |
| Atlas Air Worldwide Holdings | 17,600 a | 960,256 |
| Curtiss-Wright | 18,700 | 581,009 |
| Force Protection | 106,300 a | 545,319 |
| Greif, Cl. A | 5,055 | 295,414 |
| Hawaiian Holdings | 101,800 a | 804,220 |
| Intermec | 43,200 a | 488,592 |
| Old Dominion Freight Line | 33,750 a | 974,700 |
| Orbital Sciences | 44,784 a | 729,979 |
| Orion Marine Group | 29,600 a | 397,824 |
| Sealed Air | 57,800 | 1,343,850 |
| Team | 14,243 a | 289,987 |
| Tennant | 22,400 | 764,736 |
| | | 9,144,716 |
18
| | |
| Common Stocks (continued) | Shares | Value ($) |
| Utilities—1.9% | | |
| Cleco | 31,700 | 961,461 |
| CMS Energy | 40,800 | 733,176 |
| Hawaiian Electric Industries | 22,359 | 489,439 |
| OGE Energy | 14,100 | 627,591 |
| Portland General Electric | 15,733 | 333,068 |
| Southwest Gas | 20,800 | 728,624 |
| UniSource Energy | 26,300 | 924,971 |
| | | 4,798,330 |
| Total Common Stocks | | |
| (cost $215,728,577) | | 244,757,836 |
| |
| Warrants—.0% | | |
| Industrial | | |
| Xerium Technologies (5/25/14) | | |
| (cost $0) | 17,156 a | 19,729 |
| Total Investments (cost $215,728,577) | 97.3% | 244,777,565 |
| Cash and Receivables (Net) | 2.7% | 6,750,467 |
| Net Assets | 100.0% | 251,528,032 |
| |
| a | Non-income producing security. |
| b | Investment in real estate investment trust. |
| | | |
| Portfolio Summary (Unaudited)† | | |
| |
| | Value (%) | | Value (%) |
| Financial | 19.0 | Energy | 5.9 |
| Consumer Discretionary | 16.7 | Producer Durables | 3.6 |
| Industrial | 16.6 | Consumer Staples | 2.4 |
| Information Technology | 16.4 | Utilities | 1.9 |
| Health Care | 8.3 | | |
| Materials | 6.5 | | 97.3 |
|
| † Based on net assets. |
| See notes to financial statements. |
TheFund 19
STATEMENT OF ASSETS AND LIABILITIES
November 30, 2010
| | |
| | Cost | Value |
| Assets ($): | | |
| Investments in securities—See Statement of Investments | 215,728,577 | 244,777,565 |
| Cash | | 6,397,337 |
| Receivable for investment securities sold | | 8,934,850 |
| Dividends receivable | | 343,809 |
| Receivable for shares of Common Stock subscribed | | 312,600 |
| Prepaid expenses | | 30,215 |
| | | 260,796,376 |
| Liabilities ($): | | |
| Due to The Dreyfus Corporation and affiliates—Note 3(c) | | 207,872 |
| Payable for investment securities purchased | | 8,735,300 |
| Payable for shares of Common Stock redeemed | | 247,153 |
| Accrued expenses | | 78,019 |
| | | 9,268,344 |
| Net Assets ($) | | 251,528,032 |
| Composition of Net Assets ($): | | |
| Paid-in capital | | 207,645,486 |
| Accumulated undistributed investment income—net | | 35,855 |
| Accumulated net realized gain (loss) on investments | | 14,797,703 |
| Accumulated net unrealized appreciation | | |
| (depreciation) on investments | | 29,048,988 |
| Net Assets ($) | | 251,528,032 |
| | | |
| Net Asset Value Per Share | | | |
| | Class A | Class C | Class I |
| Net Assets ($) | 7,307,605 | 916,047 | 243,304,380 |
| Shares Outstanding | 372,211 | 47,354 | 12,336,599 |
| Net Asset Value Per Share ($) | 19.63 | 19.34 | 19.72 |
See notes to financial statements.
20
STATEMENT OF OPERATIONS
Year Ended November 30, 2010
| |
| Investment Income ($): | |
| Income: | |
| Cash dividends (net of $1,058 foreign taxes withheld at source) | 1,958,690 |
| Expenses: | |
| Management fee—Note 3(a) | 1,644,081 |
| Custodian fees—Note 3(c) | 139,966 |
| Professional fees | 73,642 |
| Registration fees | 55,400 |
| Shareholder servicing costs—Note 3(c) | 21,962 |
| Prospectus and shareholders’ reports | 20,621 |
| Directors’ fees and expenses—Note 3(d) | 15,832 |
| Distribution fees—Note 3(b) | 6,397 |
| Loan commitment fees—Note 2 | 659 |
| Miscellaneous | 8,370 |
| Total Expenses | 1,986,930 |
| Less—reduction in management fee due to undertaking—Note 3(a) | (27,373) |
| Less—reduction in fees due to earnings credits—Note 3(c) | (6) |
| Net Expenses | 1,959,551 |
| Investment (Loss)—Net | (861) |
| Realized and Unrealized Gain (Loss) on Investments—Note 4 ($): | |
| Net realized gain (loss) on investments | 14,989,457 |
| Net unrealized appreciation (depreciation) on investments | 26,294,770 |
| Net Realized and Unrealized Gain (Loss) on Investments | 41,284,227 |
| Net Increase in Net Assets Resulting from Operations | 41,283,366 |
| |
| See notes to financial statements. | |
TheFund 21
STATEMENT OF CHANGES IN NET ASSETS
| | |
| | Year Ended November 30, |
| | 2010 | 2009a |
| Operations ($): | | |
| Investment income (loss)—net | (861) | 31,580 |
| Net realized gain (loss) on investments | 14,989,457 | 41,230 |
| Net unrealized appreciation | | |
| (depreciation) on investments | 26,294,770 | 2,754,218 |
| Net Increase (Decrease) in Net Assets | | |
| Resulting from Operations | 41,283,366 | 2,827,028 |
| Dividends to Shareholders from ($): | | |
| Investment income—net: | | |
| Class I Shares | (30,748) | — |
| Net realized gain on investments: | | |
| Class A Shares | (12,873) | — |
| Class C Shares | (1,273) | — |
| Class I Shares | (185,975) | — |
| Total Dividends | (230,869) | — |
| Capital Stock Transactions ($): | | |
| Net proceeds from shares sold: | | |
| Class A Shares | 315,680 | 5,163,231 |
| Class C Shares | 328,152 | 512,567 |
| Class I Shares | 169,243,747 | 62,682,484 |
| Dividends reinvested: | | |
| Class A Shares | 393 | — |
| Class C Shares | 24 | — |
| Class I Shares | 93,789 | — |
| Cost of shares redeemed: | | |
| Class A Shares | (1,016,298) | — |
| Class C Shares | (215,052) | — |
| Class I Shares | (28,560,012) | (900,198) |
| Increase (Decrease) in Net Assets | | |
| from Capital Stock Transactions | 140,190,423 | 67,458,084 |
| Total Increase (Decrease) in Net Assets | 181,242,920 | 70,285,112 |
| Net Assets ($): | | |
| Beginning of Period | 70,285,112 | — |
| End of Period | 251,528,032 | 70,285,112 |
| Undistributed investment income—net | 35,855 | 34,437 |
22
| | |
| | Year Ended November 30, |
| | 2010 | 2009a |
| Capital Share Transactions: | | |
| Class A | | |
| Shares sold | 17,720 | 412,597 |
| Shares issued for dividends reinvested | 23 | — |
| Shares redeemed | (58,129) | — |
| Net Increase (Decrease) in Shares Outstanding | (40,386) | 412,597 |
| Class C | | |
| Shares sold | 18,361 | 40,791 |
| Shares issued for dividends reinvested | 1 | — |
| Shares redeemed | (11,799) | — |
| Net Increase (Decrease) in Shares Outstanding | 6,563 | 40,791 |
| Class I | | |
| Shares sold | 9,763,895 | 4,211,462 |
| Shares issued for dividends reinvested | 5,573 | — |
| Shares redeemed | (1,581,931) | (62,400) |
| Net Increase (Decrease) in Shares Outstanding | 8,187,537 | 4,149,062 |
| |
| a From December 17, 2008 (commencement of operations) to November 30, 2009. | |
| See notes to financial statements. | | |
TheFund 23
FINANCIAL HIGHLIGHTS
The following tables describe the performance for each share class for the fiscal periods indicated.All information (except portfolio turnover rate) reflects financial results for a single fund share.Total return shows how much your investment in the fund would have increased (or decreased) during each period, assuming you had reinvested all dividends and distributions.These figures have been derived from the fund’s financial statements.
| | |
| | Year Ended November 30, |
| Class A Shares | 2010 | 2009a |
| Per Share Data ($): | | |
| Net asset value, beginning of period | 15.24 | 12.50 |
| Investment Operations: | | |
| Investment (loss)—netb | (.05) | (.00)c |
| Net realized and unrealized | | |
| gain (loss) on investments | 4.47 | 2.74 |
| Total from Investment Operations | 4.42 | 2.74 |
| Distributions: | | |
| Dividends from net realized gain on investments | (.03) | — |
| Net asset value, end of period | 19.63 | 15.24 |
| Total Return (%)d | 29.05 | 21.92e |
| Ratios/Supplemental Data (%): | | |
| Ratio of total expenses to average net assets | 1.34 | 2.94f |
| Ratio of net expenses to average net assets | 1.32 | 1.40f |
| Ratio of net investment (loss) to average net assets | (.27) | (.02)f |
| Portfolio Turnover Rate | 56.03 | 48.43e |
| Net Assets, end of period ($ x 1,000) | 7,308 | 6,289 |
| |
| a | From December 17, 2008 (commencement of operations) to November 30, 2009. |
| b | Based on average shares outstanding at each month end. |
| c | Amount represents less than $.01 per share. |
| d | Exclusive of sales charge. |
| e | Not annualized. |
| f | Annualized. |
See notes to financial statements.
24
| | |
| | Year Ended November 30, |
| Class C Shares | 2010 | 2009a |
| Per Share Data ($): | | |
| Net asset value, beginning of period | 15.13 | 12.50 |
| Investment Operations: | | |
| Investment (loss)—netb | (.18) | (.10) |
| Net realized and unrealized | | |
| gain (loss) on investments | 4.42 | 2.73 |
| Total from Investment Operations | 4.24 | 2.63 |
| Distributions: | | |
| Dividends from net realized gain on investments | (.03) | — |
| Net asset value, end of period | 19.34 | 15.13 |
| Total Return (%)c | 28.07 | 21.04d |
| Ratios/Supplemental Data (%): | | |
| Ratio of total expenses to average net assets | 2.10 | 3.70e |
| Ratio of net expenses to average net assets | 2.08 | 2.15e |
| Ratio of net investment (loss) to average net assets | (1.02) | (.77)e |
| Portfolio Turnover Rate | 56.03 | 48.43d |
| Net Assets, end of period ($ x 1,000) | 916 | 617 |
| |
| a | From December 17, 2008 (commencement of operations) to November 30, 2009. |
| b | Based on average shares outstanding at each month end. |
| c | Exclusive of sales charge. |
| d | Not annualized. |
| e | Annualized. |
See notes to financial statements.
TheFund 25
FINANCIAL HIGHLIGHTS (continued)
| | |
| | Year Ended November 30, |
| Class I Shares | 2010 | 2009a |
| Per Share Data ($): | | |
| Net asset value, beginning of period | 15.28 | 12.50 |
| Investment Operations: | | |
| Investment income—netb | .00c | .03 |
| Net realized and unrealized | | |
| gain (loss) on investments | 4.47 | 2.75 |
| Total from Investment Operations | 4.47 | 2.78 |
| Distributions: | | |
| Dividends from investment income—net | (.00)c | — |
| Dividends from net realized gain on investments | (.03) | — |
| Total Distributions | (.03) | — |
| Net asset value, end of period | 19.72 | 15.28 |
| Total Return (%) | 29.32 | 22.24d |
| Ratios/Supplemental Data (%): | | |
| Ratio of total expenses to average net assets | 1.07 | 1.91e |
| Ratio of net expenses to average net assets | 1.06 | 1.15e |
| Ratio of net investment income | | |
| to average net assets | .02 | .26e |
| Portfolio Turnover Rate | 56.03 | 48.43d |
| Net Assets, end of period ($ x 1,000) | 243,304 | 63,379 |
| |
| a | From December 17, 2008 (commencement of operations) to November 30, 2009. |
| b | Based on average shares outstanding at each month end. |
| c | Amount represents less than $.01 per share. |
| d | Not annualized. |
| e | Annualized. |
See notes to financial statements.
26
NOTES TO FINANCIAL STATEMENTS
NOTE 1—Significant Accounting Policies:
Dreyfus Select Managers Small CapValue Fund (the “fund”) is a separate diversified series of Strategic Funds, Inc. (the “Company”) which is registered under the Investment Company Act of 1940, as amended (the “Act”), as an open-end management investment company and operates as a series company currently offering ten series, including the fund.The fund’s investment objective is to seek capital appreciation.The Dreyfus Corporation (the “Manager” or “Dreyfus”), a wholly-owned subsidiary ofThe Bank of NewYork Mellon Corporation (“BNY Mellon”), serves as the fund’s investment adviser. EACM Advisors LLC (“EACM”), a subsidiary of BNY Mellon and an affiliate of Dreyfus, serves as the fund’s portfolio allocation manager. Thompson, Seigel and Walmsley, LLC (“TS&W”), Walthausen & Co., LLC (“Walthausen”), Riverbrid ge Partners, LLC (“Riverbridge”), Neuberger Berman Management LLC (“Neuberger Berman”) and Lombardia Capital Partners, LLC (“Lombardia”) serve as the fund’s sub-investment advisers, each managing an allocated portion of the fund’s portfolio.
MBSC Securities Corporation (the “Distributor”), a wholly-owned subsidiary of Dreyfus, is the distributor of the fund’s shares.The fund is authorized to issue 100 million shares of $.001 par value Common Stock in each of the following classes of shares: Class A, Class C and Class I. Class A shares are subject to a sales charge imposed at the time of purchase. Class C shares are subject to a contingent deferred sales charge (“CDSC”) imposed on Class C shares redeemed within one year of purchase. Class I shares are sold at net asset value per share only to institutional investors. Other differences between the classes include the services offered to and the expenses borne by each class, the allocation of certain transfer agency costs and certain voting rights. Income, expenses (other than expenses attributable to a specific class), and realized and unrealized gains or losses on investments a re allocated to each class of shares based on its relative net assets.
TheFund 27
NOTES TO FINANCIAL STATEMENTS (continued)
As of November 30, 2010, MBC Investments Corp., an indirect subsidiary of BNY Mellon, held 343,947 Class A and 40,000 Class C shares.
The Company accounts separately for the assets, liabilities and operations of each series. Expenses directly attributable to each series are charged to that series’ operations; expenses which are applicable to all series are allocated among them on a pro rata basis.
The Financial Accounting Standards Board (“FASB”) Accounting Standards Codification (“ASC”) is the exclusive reference of authoritative U.S. generally accepted accounting principles (“GAAP”) recognized by the FASB to be applied by nongovernmental entities. Rules and interpretive releases of the Securities and Exchange Commission (“SEC”) under authority of federal laws are also sources of authoritative GAAP for SEC registrants. The fund’s financial statements are prepared in accordance with GAAP, which may require the use of management estimates and assumptions.Actual results could differ from those estimates.
The Company enters into contracts that contain a variety of indemnifications.The fund’s maximum exposure under these arrangements is unknown.The fund does not anticipate recognizing any loss related to these arrangements.
(a) Portfolio valuation: Investments in securities are valued at the last sales price on the securities exchange or national securities market on which such securities are primarily traded. Securities listed on the National Market System for which market quotations are available are valued at the official closing price or, if there is no official closing price that day, at the last sales price. Securities not listed on an exchange or the national securities market, or securities for which there were no transactions, are valued at the average of the most recent bid and asked prices, except for open short positions, where the asked price is used for valuation purposes. Bid price is used when no asked price is available. Registered investment companies that are not traded on an exchange are
28
valued at their net asset value.When market quotations or official closing prices are not readily available, or are determined not to reflect accurately fair value, such as when the value of a security has been significantly affected by events after the close of the exchange or market on which the security is principally traded (for example, a foreign exchange or market),but before the fund calculates its net asset value, the fund may value these investments at fair value as determined in accordance with the procedures approved by the Board of Directors. Fair valuing of securities may be determined with the assistance of a pricing service using calculations based on indices of domestic securities and other appropriate indicators, such as prices of relevant American Depository Receipts and futures contracts. For other securities that are fair valued by the Board of Directors, certain factors may be considered such as: fundamental analytical data, the nature and duration of restrictions on disposition, an evaluation of the forces that influence the market in which the securities are purchased and sold, and public trading in similar securities of the issuer or comparable issuers.
The fair value of a financial instrument is the amount that would be received to sell an asset or paid to transfer a liability in an orderly transaction between market participants at the measurement date (i.e. the exit price). GAAP establishes a fair value hierarchy that prioritizes the inputs of valuation techniques used to measure fair value.This hierarchy gives the highest priority to unadjusted quoted prices in active markets for identical assets or liabilities (Level 1 measurements) and the lowest priority to unobservable inputs (Level 3 measurements).
Additionally, GAAP provides guidance on determining whether the volume and activity in a market has decreased significantly and whether such a decrease in activity results in transactions that are not orderly. GAAP requires enhanced disclosures around valuation inputs and techniques used during annual and interim periods.
TheFund 29
NOTES TO FINANCIAL STATEMENTS (continued)
Various inputs are used in determining the value of the fund’s investments relating to fair value measurements.These inputs are summarized in the three broad levels listed below:
Level 1—unadjusted quoted prices in active markets for identical investments.
Level 2—other significant observable inputs (including quoted prices for similar investments, interest rates, prepayment speeds, credit risk, etc.).
Level 3—significant unobservable inputs (including the fund’s own assumptions in determining the fair value of investments).
The inputs or methodology used for valuing securities are not necessarily an indication of the risk associated with investing in those securities.
The following is a summary of the inputs used as of November 30, 2010, in valuing the fund’s investments:
| | | | |
| | | Level 2—Other | Level 3— | |
| | Level 1— | Significant | Significant | |
| | Unadjusted | Observable | Unobservable | |
| | Quoted Prices | Inputs | Inputs | Total |
| Assets ($) | | | | |
| Investments in Securities: | | | |
| Equity Securities— | | | | |
| Domestic† | 239,925,295 | — | — | 239,925,295 |
| Equity Securities— | | | | |
| Foreign† | 4,832,541 | — | — | 4,832,541 |
| Warrants† | 19,729 | — | — | 19,729 |
† See Statement of Investments for additional detailed categorizations classification.
In January 2010, FASB issued Accounting Standards Update (“ASU”) No. 2010-06 “Improving Disclosures about FairValue Measurements”. The portions of ASU No. 2010-06 which require reporting entities to prepare new disclosures surrounding amounts and reasons for significant transfers in and out of Level 1 and Level 2 fair value measurements as well as inputs and valuation techniques used to measure fair value for both recurring and nonrecurring fair value measurements that fall in either Level 2 or Level 3 have been adopted by the fund. No significant
30
transfers between Level 1 or Level 2 fair value measurements occurred at November 30, 2010. The remaining portion of ASU No. 2010-06 requires reporting entities to make new disclosures about information on purchases, sales, issuances and settlements on a gross basis in the reconciliation of activity in Level 3 fair value measurements. These new and revised disclosures are required to be implemented for fiscal years beginning after December 15, 2010. Management is currently evaluating the impact that the adoption of this remaining portion of ASU No. 2010-06 may have on the fund’s financial statement disclosures.
(b) Securities transactions and investment income: Securities transactions are recorded on a trade date basis. Realized gains and losses from securities transactions are recorded on the identified cost basis. Dividend income is recognized on the ex-dividend date and interest income, including, where applicable, accretion of discount and amortization of premium on investments, is recognized on the accrual basis.
(c) Affiliated issuers: Investments in other investment companies advised by Dreyfus are defined as “affiliated” in the Act.
(d) Dividends to shareholders: Dividends are recorded on the ex-dividend date. Dividends from investment income-net and dividends from net realized capital gains, if any, are normally declared and paid annually, but the fund may make distributions on a more frequent basis to comply with the distribution requirements of the Internal Revenue Code of 1986, as amended (the “Code”).To the extent that net realized capital gains can be offset by capital loss carryovers, it is the policy of the fund not to distribute such gains. Income and capital gain distributions are determined in accordance with income tax regulations, which may differ from GAAP.
(e) Federal income taxes: It is the policy of the fund to continue to qualify as a regulated investment company, if such qualification is in the best interests of its shareholders, by complying with the applicable provisions of the Code, and to make distributions of taxable income sufficient to relieve it from substantially all federal income and excise taxes.
TheFund 31
NOTES TO FINANCIAL STATEMENTS (continued)
As of and during the period ended November 30, 2010, the fund did not have any liabilities for any uncertain tax positions.The fund recognizes interest and penalties, if any, related to uncertain tax positions as income tax expense in the Statement of Operations. During the period, the fund did not incur any interest or penalties.
Each of the tax years in the two-year period ended November 30, 2010 remains subject to examination by the Internal Revenue Service and state taxing authorities.
At November 30, 2010, the components of accumulated earnings on a tax basis were as follows: undistributed ordinary income $11,065,459, undistributed capital gains $4,179,197 and unrealized appreciation $28,637,890.
The tax character of distributions paid to shareholders during the fiscal periods ended November 30, 2010 and November 30, 2009 were as follows: ordinary income $230,864 and $0 and long-term capital gains $5 and $0, respectively.
During the period ended November 30, 2010, as a result of permanent book to tax differences, primarily due to the tax treatment for real estate investment trusts and dividend reclassification, the fund increased accumulated undistributed investment income-net by $33,027 and decreased accumulated net realized gain (loss) on investments by the same amount. Net assets and net asset value per share were not affected by this reclassification.
NOTE 2—Bank Lines of Credit:
The fund participates with other Dreyfus-managed funds in a $225 million unsecured credit facility led by Citibank, N.A. and a $300 million unsecured credit facility provided by The Bank of New York Mellon, a subsidiary of BNY Mellon and an affiliate of Dreyfus (each, a “Facility”), each to be utilized primarily for temporary or emergency purposes, including the financing of redemptions. In connection therewith, the fund has agreed to pay its pro rata portion of commitment fees for each Facility. Interest is charged to the fund based on
32
rates determined pursuant to the terms of the respective Facility at the time of borrowing. During the period ended November 30, 2010, the fund did not borrow under the Facilities.
NOTE 3—Management Fee, Sub-Investment Advisory Fee and Other Transactions With Affiliates:
(a) Pursuant to a management agreement with Dreyfus, the management fee is computed at the annual rate of .90% of the value of the fund’s average daily net assets and is payable monthly. Dreyfus has contractually agreed, until April 1, 2011, to waive receipt of its fees and/or assume the expenses of the fund so that annual fund operating expenses (excluding Rule 12b-1 fees, shareholder services fees, taxes, interest, brokerage commissions, commitment fees on borrowings and extraordinary expenses) do not exceed 1.15% of the value of the fund’s average daily net assets.The reduction in management fee, pursuant to the undertaking, amounted to $27,373 during the period ended November 30, 2010.
Pursuant to separate Sub-Investment Advisory Agreements (each, a “Sub-Investment Advisory Agreement”) between Dreyfus and each of TS&W, Walthausen, Riverbridge, Neuberger Berman and Lombardia, each Sub-Investment Advisory Agreement will continue for successive annual periods ended November 30, 2010, except the Sub-Investment Advisory Agreement with each of Neuberger Berman and Lombardia have an initial term extending through November 30, 2011. Dreyfus pays TS&W, Walthausen, Riverbridge, Neuberger Berman and Lombardia separate monthly fees at an annual percentage rate based on the average daily net assets of the fund under the Sub-Adviser’s management.
During the period ended November 30, 2010, the Distributor retained $24 from commissions earned on sales of the fund’s Class A shares.
(b) Under the Distribution Plan (the “Plan”) adopted pursuant to Rule 12b-1 under the Act, Class C shares pay the Distributor for distributing its shares at an annual rate of .75% of the value of the average daily net assets of Class C shares. During the period ended November 30, 2010, Class C shares were charged $6,397 pursuant to the Plan.
TheFund 33
NOTES TO FINANCIAL STATEMENTS (continued)
(c) Under the Shareholder Services Plan, Class A and Class C shares pay the Distributor at an annual rate of .25% of the value of their average daily net assets for the provision of certain services. The services provided may include personal services relating to shareholder accounts, such as answering shareholder inquiries regarding Class A and Class C shares and providing reports and other information, and services related to the maintenance of shareholder accounts. The Distributor may make payments to Service Agents (a securities dealer, financial institution or other industry professional) in respect of these services.The Distributor determines the amounts to be paid to Service Agents. During the period ended November 30, 2010, Class A and Class C shares were charged $18,033 and $2,132, respectively, pursuant to the Shar eholder Services Plan.
The fund compensates Dreyfus Transfer, Inc., a wholly-owned subsidiary of Dreyfus, under a transfer agency agreement for providing personnel and facilities to perform transfer agency services for the fund. During the period ended November 30, 2010, the fund was charged $1,142 pursuant to the transfer agency agreement, which is included in Shareholder servicing costs in the Statement of Operations.
The fund has arrangements with the custodian and cash management bank whereby the fund may receive earnings credits when positive cash balances are maintained, which are used to offset custody and cash management fees. For financial reporting purposes, the fund includes net earnings credits as an expense offset in the Statement of Operations.
The fund compensates The Bank of New York Mellon under a cash management agreement for performing cash management services related to fund subscriptions and redemptions. During the period ended November 30, 2010, the fund was charged $94 pursuant to the cash management agreement, which is included in Shareholder servicing costs in the Statement of Operations.These fees were partially offset by earnings credits of $6.
34
The fund also compensates The Bank of New York Mellon under a custody agreement for providing custodial services for the fund. During the period ended November 30, 2010, the fund was charged $139,966 pursuant to the custody agreement.
During the period ended November 30, 2010, the fund was charged $6,399 for services performed by the Chief Compliance Officer.
The components of “Due to The Dreyfus Corporation and affiliates” in the Statement of Assets and Liabilities consist of: management fees $184,268, Rule 12b-1 distribution plan fees $563, shareholder services plan fees $1,683, custodian fees $19,996, chief compliance officer fees $1,152 and transfer agency per account fees $210.
(d) Each Board member also serves as a Board member of other funds within the Dreyfus complex. Annual retainer fees and attendance fees are allocated to each fund based on net assets.
NOTE 4—Securities Transactions:
The aggregate amount of purchases and sales of investment securities, excluding short-term securities, during the period ended November 30, 2010, amounted to $233,834,373 and $97,476,815, respectively.
The provisions of ASC Topic 815 “Derivatives and Hedging” require qualitative disclosures about objectives and strategies for using derivatives, quantitative disclosures about fair value amounts of gains and losses on derivative instruments and disclosures about credit-risk-related contingent features in derivative agreements.The fund held no derivatives during the period ended November 30, 2010.
At November 30, 2010, the cost of investments for federal income tax purposes was $216,139,675; accordingly, accumulated net unrealized appreciation on investments was $28,637,890, consisting of $38,758,455 gross unrealized appreciation and $10,120,565 gross unrealized depreciation.
TheFund 35
REPORT OF INDEPENDENT REGISTERED
PUBLIC ACCOUNTING FIRM
Shareholders and Board of Directors
Dreyfus Select Managers Small Cap Value Fund
We have audited the accompanying statement of assets and liabilities, including the statement of investments, of Dreyfus Select Managers Small CapValue Fund (one of the series comprising Strategic Funds, Inc.) as of November 30, 2010, and the related statement of operations for the year then ended and the statement of changes in net assets and financial highlights for the year then ended and for the period from December 17, 2008 (commencement of operations) to November 30, 2009. These financial statements and financial highlights are the responsibility of the Fund’s management. Our responsibility is to express an opinion on these financial statements and financial highlights based on our audits.
We conducted our audits in accordance with the standards of the Public Company Accounting Oversight Board (United States).Those standards require that we plan and perform the audit to obtain reasonable assurance about whether the financial statements and financial highlights are free of material misstatement. We were not engaged to perform an audit of the Fund’s internal control over financial reporting. Our audits included consideration of internal control over financial reporting as a basis for designing audit procedures that are appropriate in the circumstances, but not for the purpose of expressing an opinion on the effectiveness of the Fund’s internal control over financial reporting. Accordingly, we express no such opinion. An audit also includes examining, on a test basis, evidence supporting the amounts and disclosures in the financial statements and financial highlights, assessing the accounting principles used and significant estimates made by management, and evaluating the overall financial statement presentation. Our procedures included confirmation of securities owned as of November 30, 2010 by correspondence with the custodian and others.We believe that our audits provide a reasonable basis for our opinion.
In our opinion, the financial statements and financial highlights referred to above present fairly, in all material respects, the financial position of Dreyfus Select Managers Small CapValue Fund at November 30, 2010, the results of its operations for the year then ended, and the changes in its net assets and the financial highlights for the year then ended and for the period from December 17, 2008 to November 30, 2009, in conformity with U.S. generally accepted accounting principles.

New York, New York
January 25, 2011
36
IMPORTANT TAX INFORMATION (Unaudited)
For federal tax purposes the fund hereby designates 99.60% of the ordinary dividends paid during the fiscal year ended November 30, 2010 as qualifying for the corporate dividends received deduction. Also certain dividends paid by the fund may be subject to a maximum tax rate of 15%, as provided for by the Jobs and Growth Tax Relief Reconciliation Act of 2003. Of the distributions paid during the fiscal year, $230,864 represents the maximum amount that may be considered qualified dividend income. Shareholders will receive notification in early 2011 of the percentage applicable to the preparation of their 2010 income tax returns.Also, the fund hereby designates $.0312 per share as a short-term capital gain distribution paid on December 30, 2010 and also designates $5 as a long-term capital gain distribution for reporting purposes.
TheFund 37
INFORMATION ABOUT THE REVIEW AND APPROVAL OF
THE FUND’S MANAGEMENT AGREEMENT, PORTFOLIO
ALLOCATION MANAGEMENT AGREEMENT AND
SUB-INVESMENT ADVISORY AGREEMENTS (Unaudited)
At a meeting of the fund’s Board of Directors held on November 8-9, 2010, the Board considered the renewal of (a) the fund’s Management Agreement, pursuant to which Dreyfus provides the fund with investment advisory and administrative services; (b) Dreyfus’ Portfolio Allocation Management Agreement (the “Allocation Agreement”) with EACM, pursuant to which EACM is responsible for evaluating and recommending sub-advisers to provide the fund with day-to-day portfolio management services, recommending the percentage of fund assets to be allocated to each sub-adviser, monitoring and evaluating the performance of the sub-advisers, and recommending whether a sub-adviser should be terminated; and (c) Dreyfus’ separate Sub-Investment Advisory Agreements with each of Thomson, Siegel and Walmsley, LLC, Riverbridge Partners, LLC and Walthausen & Co., LLC (collectively, the “Sub-Advisers& #148;), pursuant to which each Sub-Adviser serves sub-investment adviser and provide day-to-day management of a percentage of the fund’s portfolio (collectively, the “Sub-Advisory Agreements”). The Board members, none of whom are “interested persons” (as defined in the Investment Company Act of 1940, as amended) of the fund, were assisted in their review by independent legal counsel and met with counsel in executive session separate from representatives of Dreyfus and EACM. In considering the renewal of the Agreements, the Board considered all factors that it believed to be relevant, including those discussed below.The Board did not identify any one factor as dispositive, and each Board member may have attributed different weights to the factors considered.
Analysis of Nature, Extent, and Quality of Services Provided to the Fund. The Board members considered information previously provided to them in a presentation from representatives of Dreyfus regarding the nature, extent, and quality of the services provided to funds in the Dreyfus fund complex, and representatives of Dreyfus and EACM confirmed that there had been no material changes in this information. Dreyfus provided the number of open accounts in the fund, the fund’s asset size, and the allocation of fund assets among distribution channels. Dreyfus also had previously provided information regarding
38
the diverse intermediary relationships and distribution channels of funds in the Dreyfus fund complex and Dreyfus’ corresponding need for broad, deep, and diverse resources to be able to provide ongoing shareholder services to each distribution channel, including the distribution channel(s) for the fund.
The Board members also considered research support available to, and portfolio management capabilities of, the personnel associated with Dreyfus, EACM, and the Sub-Advisers, as applicable, and that Dreyfus provides oversight of day-to-day fund operations, including fund accounting and administration and assistance in meeting legal and regulatory requirements. The Board members also considered Dreyfus’ extensive administrative, accounting, and compliance infrastructures, Dreyfus supervisory activities over EACM and the Sub-Advisers, and EACM’s evaluations and recommendations to Dreyfus regarding the Sub-Advisers and EACM’s supervisory activities over the Sub-Advisers. The Board also considered portfolio management’s brokerage policies and practices (including policies and practices regarding soft dollars) and the standards applied in seeking best execution.
Comparative Analysis of the Fund’s Performance and Management Fee and Expense Ratio.The Board members reviewed reports prepared by Lipper, Inc. (“Lipper”), an independent provider of investment company data, which included information comparing (1) the fund’s performance with the performance of a group of comparable funds (the “Performance Group”) and with a broader group of funds (the “Performance Universe”), all for various periods ended September 30, 2010, and (2) the fund’s actual and contractual management fees and total expenses with those of a group of comparable funds (the “Expense Group”) and with a broader group of funds (the “Expense Universe”), the information for which was derived in part from fund financial statements available to Lipper as of September 30 , 2010. Dreyfus previously had furnished the Board with a description of the methodology Lipper used to select the Performance Group and Performance Universe and the Expense Group and Expense Universe.
TheFund 39
INFORMATION ABOUT THE REVIEW AND APPROVAL OF THE FUND’S
MANAGEMENT AGREEMENT, PORTFOLIO ALLOCATION
MANAGEMENT AGREEMENT AND SUB-INVESTMENT
ADVISORY AGREEMENTS (Unaudited) (continued)
Dreyfus representatives stated that the usefulness of performance comparisons may be affected by a number of factors, including different investment limitations that may be applicable to the fund and comparison funds.The Board members discussed the results of the comparisons and noted that the fund’s total return performance was above the Performance Group and Performance Universe medians for the reported time periods.The Board noted that the Fund commenced operations in December 2008. Dreyfus also provided a comparison of the fund’s total return for its one calendar year of existence to the return of the fund’s benchmark index, and the Board noted the fund’s return was higher.
The Board members also reviewed the range of actual and contractual management fees and total expenses of the Expense Group and Expense Universe funds and discussed the results of the comparisons.They noted that the fund’s contractual management fee was below the Expense Group median, the fund’s actual management fee was above the Expense Group and Expense Universe median, and the fund’s total expenses were below the Expense Group and Expense Universe medi-ans.The Board also considered the current fee waiver and expense reimbursement arrangement undertaken by Dreyfus.
Representatives of Dreyfus reviewed with the Board members the management or investment advisory fees paid to Dreyfus or its affiliates or the respective Sub-Advisers by funds in the same Lipper category as the fund, or by separate accounts and/or other types of client portfolios managed by Dreyfus, EACM, or one of the respective Sub-Advisers considered to have similar investment strategies and policies as the fund (the “Similar Accounts”), and explained the nature of the Similar Accounts. Representatives of Dreyfus noted that neither Dreyfus nor EACM manage any institutional separate accounts with similar investment strategies and policies as the fund.They discussed differences in fees paid and the relationship of the fees paid in light of any differences in the services provided and other relevant factors.The Board members considered the relevance of the fee information provided for the Similar Account s to evaluate the appropriateness and reasonableness of the fund’s management fee.
40
The Board considered the fee to EACM and to each Sub-Adviser in relation to the fee paid to Dreyfus by the fund and the respective services provided by EACM and each Sub-Adviser and Dreyfus. The Board also noted EACM’s and each Sub-Adviser’s fee is paid by Dreyfus (out of its fee from the fund) and not the fund.
Analysis of Profitability and Economies of Scale. Dreyfus’ representatives reviewed the expenses allocated and profit received by Dreyfus and the resulting profitability percentage for managing the fund, and the method used to determine the expenses and profit. The Board concluded that the profitability results were not unreasonable given the services rendered and service levels provided by Dreyfus. The Board also noted the expense limitation arrangement and its effect on Dreyfus’ profitability. The Board previously had been provided with information prepared by an independent consulting firm regarding Dreyfus’ approach to allocating costs to, and determining the profitability of, individual funds and the entire Dreyfus fund complex.The consulting firm also had analyzed where any economies of scale might emerge in conn ection with the management of a fund.
The Board’s counsel stated that the Board members should consider the profitability analysis (1) as part of their evaluation of whether the fees under the Agreements bear a reasonable relationship to the mix of services provided by Dreyfus, EACM, and the Sub-Advisers, including the nature, extent and quality of such services, and (2) in light of the relevant circumstances for the fund and the extent to which economies of scale would be realized if the fund grows and whether fee levels reflect these economies of scale for the benefit of fund shareholders. Since Dreyfus, and not the fund, pays EACM and each Sub-Adviser pursuant to the respective Agreements, the Board did not consider EACM’s or any Sub-Adviser’s profitability to be relevant to its deliberations. Dreyfus representatives noted that, as a result of shared and allocated costs among funds in the Dreyfus funds complex, the extent of economie s of scale could depend substantially on the level of assets in the complex as a whole, so that increases and decreases in complex-
TheFund 41
INFORMATION ABOUT THE REVIEW AND APPROVAL OF THE FUND’S
MANAGEMENT AGREEMENT, PORTFOLIO ALLOCATION
MANAGEMENT AGREEMENT AND SUB-INVESTMENT
ADVISORY AGREEMENTS (Unaudited) (continued)
wide assets can affect potential economies of scale in a manner that is disproportionate to, or even in the opposite direction from, changes in the fund’s asset level. The Board members also considered potential benefits to Dreyfus and each Sub-Adviser from acting as investment adviser and sub-investment adviser, respectively, and EACM from acting as portfolio allocation manager, and noted the soft dollar arrangements in effect for trading the fund’s investments.
At the conclusion of these discussions, the Board agreed that it had been furnished with sufficient information to make an informed business decision with respect to the renewal of the Agreements. Based on the discussions and considerations as described above, the Board concluded and determined as follows.
The Board concluded that the nature, extent, and quality of the services provided by Dreyfus, EACM, and the Sub-Advisers are adequate and appropriate.
The Board was satisfied with the fund’s performance, in light of the considerations described above.
The Board concluded that the fees paid to Dreyfus, EACM, and the Sub-Advisers were reasonable in light of the considerations described above.
The Board determined that the economies of scale which may accrue to Dreyfus and its affiliates in connection with the management of the fund had been adequately considered by Dreyfus in connection with the fee rate charged to the fund pursuant to the Agreement and that, to the extent in the future it were determined that material economies of scale had not been shared with the fund, the Board would seek to have those economies of scale shared with the fund.
The Board members considered these conclusions and determinations, along with the information received on a routine and regular basis throughout the year. In addition, it should be noted that the Board’s consideration of the contractual fee arrangements for this fund had the benefit of a number of years of reviews of prior or similar agreements
42
during which lengthy discussions took place between the Board members and Dreyfus’ representatives. Certain aspects of the arrangements may receive greater scrutiny in some years than in others, and the Board members’ conclusions may be based, in part, on their consideration of the same or similar arrangements in prior years. The Board members determined that renewal of the Agreements was in the best interests of the fund and its shareholders.
APPROVAL OF ADDITONAL SUB-INVESTMENT ADVISER
At a meeting of the fund’s Board of Directors held on July 19, 2010, the Board considered the approval of a Sub-Investment Advisory Agreement with Lombardia Capital Partners, LLC (the “Sub-Adviser”), pursuant to which the Sub-Adviser would serve as an additional sub-investment adviser and provide day-to-day management of a percentage of the fund’s portfolio (the “Sub-Advisory Agreement”).The Board members, none of whom are “interested persons” (as defined in the Investment Company Act of 1940, as amended) of the fund, were assisted in their review by independent legal counsel and met with counsel in executive session separate from representatives of Dreyfus and EACM. In considering approval of the Agreement, the Board considered all factors that it believed to be relevant, including those discussed below.
Analysis of Nature, Extent, and Quality of Services to be Provided to the Fund.The Board members considered information previously provided to them in a presentation from representatives of Dreyfus regarding the nature, extent, and quality of the services provided to funds in the Dreyfus fund complex, and representatives of Dreyfus confirmed that there had been no material changes in this information. Dreyfus also had previously provided information regarding the diverse intermediary relationships and distribution channels of funds in the Dreyfus fund complex and Dreyfus’ corresponding need for broad, deep, and diverse resources to be able to provide ongoing shareholder services to each distribution channel, including the distribution channel(s) for the fund.
TheFund 43
INFORMATION ABOUT THE REVIEW AND APPROVAL OF THE FUND’S
MANAGEMENT AGREEMENT, PORTFOLIO ALLOCATION
MANAGEMENT AGREEMENT AND SUB-INVESTMENT
ADVISORY AGREEMENTS (Unaudited) (continued)
The Board members considered the portfolio management and research capabilities of the Sub-Adviser, the Sub-Adviser’s portfolio management’s brokerage policies and practices (including policies and practices regarding soft dollars) and the standards applied in seeking best execution, and that Dreyfus and EACM would supervise the Sub-Adviser’s activities with respect to the fund.
Comparative Analysis of Performance and Fees. Representatives of Dreyfus and EACM reviewed the investment strategies to be employed by the Sub-Adviser in managing its portion of the fund’s assets. The Board members noted the Sub-Adviser’s reputation and experience with respect to small cap equity investing, the experience and expertise of the primary portfolio manager for the Sub-Adviser who would manage the portion of the fund’s assets, stocks, and EACM’s experience and reputation in selecting, evaluating, and overseeing investment managers.
Representatives of Dreyfus reviewed with the Board members the advisory fees paid to the Sub-Adviser for funds in the same Lipper category as the fund, or by separate accounts and/or other types of client portfolios managed by the Sub-Adviser considered to have similar investment strategies and policies as the fund (the “Similar Accounts”), and explained the nature of the Similar Accounts. Representatives of Dreyfus noted that neither Dreyfus nor EACM manage any institutional separate accounts considered to have similar investment strategies and policies as the fund.They discussed differences in fees paid and the relationship of the fees paid in light of any differences in the services provided and other relevant factors. Representatives of Dreyfus also reviewed with the Board members the small cap composite performance record for the Sub-Adviser.
The Board considered the fee to the Sub-Adviser in relation to the fee paid to Dreyfus by the fund and the respective services to be provided by the Sub-Adviser and Dreyfus. The Board noted the Sub-Adviser’s fee would be paid by Dreyfus (out of its fee from the fund) and not the fund.
44
Analysis of Profitability. Since Dreyfus, and not the fund, would pay the Sub-Adviser, the Board did not consider the Sub-Adviser’s profitability to be relevant to its deliberations.
At the conclusion of these discussions, the Board agreed that it had been furnished with sufficient information to make an informed business decision with respect to approval of the Sub-Advisory Agreement. Based on the discussions and considerations as described above, the Board concluded and determined as follows.
The Board concluded that the nature, extent, and quality of the ser- vices to be provided by the Sub-Adviser are adequate and appropriate, in light of the considerations described above.
The Board concluded that the fee to be paid to the Sub-Adviser is reasonable, in light of the considerations described above.
The Board members considered these conclusions and determinations and, without any one factor being dispositive, determined that approval of the Sub-Advisory Agreement was in the best interests of the fund and its shareholders.
TheFund 45
BOARD MEMBERS INFORMATION (Unaudited)
|
| Joseph S. DiMartino (67) |
| Chairman of the Board (1995) |
| Principal Occupation During Past 5Years: |
| • Corporate Director and Trustee |
| Other Public Company Board Memberships During Past 5Years: |
| • CBIZ (formerly, Century Business Services, Inc.), a provider of outsourcing functions for small |
| and medium size companies, Director (1997-present) |
| • The Newark Group, a provider of a national market of paper recovery facilities, paperboard |
| mills and paperboard converting plants, Director (2000-2010) |
| • Sunair Services Corporation, a provider of certain outdoor-related services to homes and |
| businesses, Director (2005-2009) |
| No. of Portfolios for which Board Member Serves: 170 |
| ——————— |
| David W. Burke (74) |
| Board Member (1994) |
| Principal Occupation During Past 5Years: |
| • Corporate Director and Trustee |
| No. of Portfolios for which Board Member Serves: 85 |
| ——————— |
| William Hodding Carter III (75) |
| Board Member (1988) |
| Principal Occupation During Past 5Years: |
| • Professor of Leadership & Public Policy, University of North Carolina, Chapel Hill (2006-present) |
| • President and Chief Executive Officer of the John S. and James L. Knight Foundation (1998-2006) |
| No. of Portfolios for which Board Member Serves: 30 |
| ——————— |
| Gordon J. Davis (69) |
| Board Member (2006) |
| Principal Occupation During Past 5Years: |
| • Partner in the law firm of Dewey & LeBoeuf LLP |
| Other Public Company Board Memberships During Past 5Years: |
| • Consolidated Edison, Inc., a utility company, Director (1997-present) |
| • The Phoenix Companies, Inc., a life insurance company, Director (2000-present) |
| No. of Portfolios for which Board Member Serves: 45 |
46
|
| Joni Evans (68) |
| Board Member (2006) |
| Principal Occupation During Past 5Years: |
| • Chief Executive Officer, www.wowOwow.com an online community dedicated to women’s |
| conversations and publications |
| • Principal, Joni Evans Ltd. (publishing) |
| • Senior Vice President of the William Morris Agency (1994-2006) |
| No. of Portfolios for which Board Member Serves: 30 |
| ——————— |
| Ehud Houminer (70) |
| Board Member (1994) |
| Principal Occupation During Past 5Years: |
| • Executive-in-Residence at the Columbia Business School, Columbia University |
| Other Public Company Board Memberships During Past 5Years: |
| • Avnet Inc., an electronics distributor, Director (1993-present) |
| No. of Portfolios for which Board Member Serves: 63 |
| ——————— |
| Richard C. Leone (70) |
| Board Member (1984) |
| Principal Occupation During Past 5Years: |
| • President of The Century Foundation (formerly,The Twentieth Century Fund, Inc.), a tax |
| exempt research foundation engaged in the study of economic, foreign policy and domestic issues |
| Other Public Company Board Memberships During Past 5Years: |
| • Partnership for a Secure America, Director |
| No. of Portfolios for which Board Member Serves: 30 |
| ——————— |
| Hans C. Mautner (73) |
| Board Member (1984) |
| Principal Occupation During Past 5Years: |
| • President—International Division and an Advisory Director of Simon Property Group, a real |
| estate investment company |
| • Chairman and Chief Executive Officer of Simon Global Limited |
| No. of Portfolios for which Board Member Serves: 30 |
TheFund 47
BOARD MEMBERS INFORMATION (Unaudited) (continued)
|
| Robin A. Melvin (47) |
| Board Member (1995) |
| Principal Occupation During Past 5Years: |
| • Director, Boisi Family Foundation, a private family foundation that supports youth-serving |
| organizations that promote the self sufficiency of youth from disadvantaged circumstances |
| (1995-present) |
| • SeniorVice President, Mentor, a national non-profit youth mentoring organization (1992-2005) |
| No. of Portfolios for which Board Member Serves: 41 |
| ——————— |
| Burton N. Wallack (60) |
| Board Member (2006) |
| Principal Occupation During Past 5Years: |
| • President and Co-owner of Wallack Management Company, a real estate management company |
| No. of Portfolios for which Board Member Serves: 30 |
| ——————— |
| John E. Zuccotti (73) |
| Board Member (1984) |
| Principal Occupation During Past 5Years: |
| • Chairman of Brookfield Financial Properties, Inc. |
| • Senior Counsel of Weil, Gotshal & Manges, LLP |
| • Emeritus Chairman of the Real Estate Board of New York |
| Other Public Company Board Memberships During Past 5Years: |
| • Wellpoint, Inc., a health benefits company, Director (2005-present) |
| No. of Portfolios for which Board Member Serves: 30 |
| ——————— |
| Once elected all Board Members serve for an indefinite term, but achieve Emeritus status upon reaching age 80.The |
| address of the Board Members and Officers is in c/o The Dreyfus Corporation, 200 Park Avenue, NewYork, NewYork |
| 10166.Additional information about the Board Members is available in the fund’s Statement of Additional Information |
| which can be obtained from Dreyfus free of charge by calling this toll free number: 1-800-554-4611. |
| Arnold S. Hiatt, Emeritus Board Member |
48
OFFICERS OF THE FUND (Unaudited)
TheFund 49
OFFICERS OF THE FUND (Unaudited) (continued)
50

TheFund 51
Save time. Save paper. View your next shareholder report online as soon as it’s available. Log into www.dreyfus.com and sign up for Dreyfus eCommunications. It’s simple and only takes a few minutes.
The views expressed in this report reflect those of the portfolio manager only through the end of the period covered and do not necessarily represent the views of Dreyfus or any other person in the Dreyfus organization. Any such views are subject to change at any time based upon market or other conditions and Dreyfus disclaims any responsibility to update such views.These views may not be relied on as investment advice and, because investment decisions for a Dreyfus fund are based on numerous factors, may not be relied on as an indication of trading intent on behalf of any Dreyfus fund.
Not FDIC-Insured • Not Bank-Guaranteed • May Lose Value
| | Contents |
| | THE FUND |
| 2 | A Letter from the Chairman and CEO |
| 3 | Discussion of Fund Performance |
| 6 | Fund Performance |
| 8 | Understanding Your Fund’s Expenses |
| 8 | Comparing Your Fund’s Expenses With Those of Other Funds |
| 9 | Statement of Investments |
| 12 | Statement of Assets and Liabilities |
| 13 | Statement of Operations |
| 14 | Statement of Changes in Net Assets |
| 16 | Financial Highlights |
| 19 | Notes to Financial Statements |
| 28 | Report of Independent Registered Public Accounting Firm |
| 29 | Important Tax Information |
| 30 | Information About the Review and Approval of the Fund’s Management Agreement and Sub-Investment Advisory Agreement |
| 35 | Board Members Information |
| 38 | Officers of the Fund |
| | FOR MORE INFORMATION |
| | Back Cover |
Dreyfus
U.S. Equity Fund
The Fund

A LETTER FROM THE CHAIRMAN AND CEO
Dear Shareholder:
We are pleased to present this annual report for Dreyfus U.S. Equity Fund, covering the twelve-month period from December 1, 2009, through November 30, 2010.
Stocks throughout the global markets delivered respectable returns during the reporting period, despite periodic bouts of market volatility stemming from economic uncertainty and events. Although GDP growth in most countries was positive throughout the reporting period, the global economic recovery has been milder than historical averages, in particular in the U.S. Most notably, heavy sovereign debt burdens recently renewed credit concerns in Europe, effectively barring some governments from adopting more stimulative fiscal policies. However, robust demand from the world’s emerging markets has taken up some of the slack, supporting corporate earnings and stock prices.
We are cautiously optimistic regarding global economic and market prospects in 2011. Global expansion should gain a degree of momentum, led by financially strong emerging markets countries, while “debt hangover” countries in the developed world may face continued economic challenges. Monetary policy remains stimulative in most markets, and inflation-adjusted interest rates and inflation remain low. So is your portfolio positioned accordingly given these recent global economic events? Talk with your financial advisor, who can help you evaluate your portfolio investments within the new global economic framework to help meet your individual investment needs and future capital goals.
For information about how the fund performed during the reporting period, as well as general market perspectives, we provide a Discussion of Fund Performance on the pages that follow.
Thank you for your continued confidence and support.

Jonathan R. Baum
Chairman and Chief Executive Officer
The Dreyfus Corporation
December 15, 2010
2

DISCUSSION OF FUND PERFORMANCE
For the period of December 1, 2009, through November 30, 2010, as provided by Jane Henderson and Roy Leckie ofWalter Scott & Partners Limited (Walter Scott), Sub-investment adviser
Fund and Market Performance Overview
For the 12-month period ended November 30, 2010, Dreyfus U.S. Equity Fund’s Class A shares achieved a return of 10.01%, Class C shares returned 9.24% and Class I shares returned 10.47%.1 In comparison, the fund’s benchmark, the Morgan Stanley Capital International USA Index (“MSCI USA Index”), achieved a 9.79% return over the same period.2
Despite periodic bouts of heightened market volatility, a slowly recovering economy and improving investor sentiment enabled U.S. stocks to produce respectable gains, on average, over the reporting period.The fund produced returns that were roughly in line with its benchmark, as strong relative performance in the financials and industrials sectors was mostly offset by lagging returns in the information technology sector and, to a lesser extent, the consumer staples and materials sectors.
The Fund’s Investment Approach
The fund seeks long-term real returns by investing in stocks of companies that are located in the United States.When selecting stocks, Walter Scott seeks companies with fundamental strengths that indicate the potential for sustainable growth. The firm focuses on individual stock selection through extensive fundamental research. Candidates are initially selected for research if they meet certain broad absolute and trend criteria. Financial statements are analyzed in an effort to identify the nature of their cash generation and to understand the variables that add value to their businesses. Companies meeting the financial criteria are subjected to a detailed investigation of their products, costs and pricing, competition, industry position and outlook.
Heightened Market Volatility in a Slow-Growth Economy
Although the reporting period began in the midst of an economic recovery, investor confidence was shaken in the spring of 2010 by several new
TheFund 3
DISCUSSION OF FUND PERFORMANCE (continued)
global developments. Europe was roiled by a sovereign debt crisis when Greece and, later, Ireland found themselves unable to finance heavy debt burdens, requiring intervention by the International Monetary Fund and European Union. Investors worried for a time that inflation-fighting efforts in China might dampen a major engine of global growth. In the United States, disappointing housing and employment data continued to weigh on already mild growth, and a catastrophic oil spill in the Gulf of Mexico added to domestic uncertainty. As investor sentiment deteriorated during the spring and summer, U.S. stocks generally declined.
However, investors’ fears may have been overblown, as corporate earnings generally continued to improve, and the U.S. and global economies remained on mildly upward trajectories. Market sentiment also was buoyed by a massive new monetary stimulus program from the Federal Reserve Board. As a result, U.S. equity markets rallied in the fall, more than erasing the reporting period’s earlier losses.
Security Selections Boosted Fund’s Results
The fund’s bottom-up security selection process proved particularly effective in the financials sector, where few companies met our investment criteria, enabling the fund to avoid the full brunt of the industry group’s weakness. The fund also scored a number of successes in the better-performing industrials sector, which advanced along with demand for construction materials and equipment in the emerging markets. For example, nuts-and-bolts distributor Fastenal rallied from previously depressed levels when investors recognized that its prospects were brighter than they had expected.
The fund also received strongly positive contributions to performance from individual stocks across a number of other market sectors. Technology company Dolby Laboratories posted strong earnings growth due to licensing fees from sales of wide screen televisions and Microsoft’s upgraded Windows operating system. In the health care sector,Varian Medical Systems gained value as greater adoption of its medical equipment worldwide prompted the company to raise the earnings guidance it provides to analysts. In the consumer discretionary sector, ubiquitous coffee chain Starbucks advanced after implementing an aggressive restructuring plan.
4
As is to be expected in a volatile market environment, the fund encountered some disappointments during the reporting period. Agricultural products firm Monsanto lagged due to competitive pressures in overseas markets, oil services contractor Diamond Offshore Drilling was punished in the wake of the Gulf oil spill, and medical researcher Covance trailed market averages when large pharmaceutical companies reduced spending on research and development in the sluggish economy.
Finding Opportunities Among Industry Leaders
Although we do not anticipate a return to recessionary conditions in the year 2011, sustainable corporate earnings growth may become more difficult to achieve in a slow-growth economy, especially as fewer opportunities for cost reductions present themselves. We believe that most companies must increase revenues in order to achieve further bottom-line growth, but demand from consumers and businesses may remain tepid in light of weak domestic housing and labor markets. Consequently, we have intensified our focus on high-quality, well-established companies that, based on our analysis, can continue to grow earnings either through leadership positions in their markets or ample pricing power.
December 15, 2010
| |
| | Please note, the position in any security highlighted in italicized typeface was sold during the |
| | reporting period. |
| | Equity funds are subject generally to market, market sector, market liquidity, issuer and investment |
| | style risks, among other factors, to varying degrees, all of which are more fully described in the |
| | fund’s prospectus. |
| 1 | Total return includes reinvestment of dividends and any capital gains paid, and does not take into |
| | consideration the maximum initial sales charge in the case of Class A shares, or the applicable |
| | contingent deferred sales charge imposed on redemptions in the case of Class C shares. Had these |
| | charges been reflected, returns would have been lower. Past performance is no guarantee of future |
| | results. Share price and investment return fluctuate such that upon redemption, fund shares may be |
| | worth more or less than their original cost. Return figures provided reflect the absorption of certain |
| | fund expenses by The Dreyfus Corporation pursuant to an undertaking in effect through April 1, |
| | 2011, at which time it may be extended, terminated or modified. Had these expenses not been |
| | absorbed, the fund’s returns would have been lower. |
| 2 | SOURCE: LIPPER INC. – Reflects reinvestment of net dividends and, where applicable, |
| | capital gain distributions.The Morgan Stanley Capital International USA (MSCI USA) Index |
| | is an unmanaged, market capitalization weighted index that is designed to measure the |
| | performance of publicly traded stocks issued by companies in the United States. Investors cannot |
| | invest directly in any index. |
TheFund 5
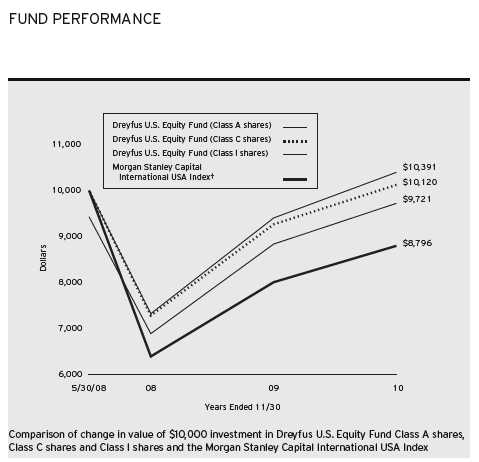
† Source: Lipper Inc.
Past performance is not predictive of future performance.
The above graph compares a $10,000 investment made in Class A, Class C and Class I shares of Dreyfus U.S. Equity Fund on 5/30/08 (inception date) to a $10,000 investment made in the Morgan Stanley Capital International USA Index (the “Index”) on that date.All dividends and capital gain distributions are reinvested.
The fund’s performance shown in the line graph takes into account the maximum initial sales charge on Class A shares and all other applicable fees and expenses on all classes.The Index is an unmanaged, market capitalization-weighted index that is designed to measure the performance of publicly traded stocks issued by companies in the United States. Unlike a mutual fund, the Index is not subject to charges, fees and other expenses. Investors cannot invest directly in any index. Further information relating to fund performance, including expense reimbursements, if applicable, is contained in the Financial Highlights section of the prospectus and elsewhere in this report.
6
| | | |
| Average Annual Total Returns as of 11/30/10 | | |
| |
| | Inception | | From |
| | Date | 1 Year | Inception |
| Class A shares | | | |
| with maximum sales charge (5.75%) | 5/30/08 | 3.71% | –1.13% |
| without sales charge | 5/30/08 | 10.01% | 1.24% |
| Class C shares | | | |
| with applicable redemption charge† | 5/30/08 | 8.24% | 0.48% |
| without redemption | 5/30/08 | 9.24% | 0.48% |
| Class I shares | 5/30/08 | 10.47% | 1.55% |
| Morgan Stanley Capital | | | |
| International USA Index†† | 5/31/08 | 9.79% | –5.00% |
| |
| Past performance is not predictive of future performance.The fund’s performance shown in the graph and table does not |
| reflect the deduction of taxes that a shareholder would pay on fund distributions or the redemption of fund shares. |
| † | The maximum contingent deferred sales charge for Class C shares is 1% for shares redeemed within one year of the |
| | date of purchase. |
| †† | For comparative purposes, the value of the Index as of 5/31/08 is used as the beginning value on 5/30/08. |
TheFund 7
UNDERSTANDING YOUR FUND’S EXPENSES (Unaudited)
As a mutual fund investor, you pay ongoing expenses, such as management fees and other expenses. Using the information below, you can estimate how these expenses affect your investment and compare them with the expenses of other funds.You also may pay one-time transaction expenses, including sales charges (loads) and redemption fees, which are not shown in this section and would have resulted in higher total expenses. For more information, see your fund’s prospectus or talk to your financial adviser.
Review your fund’s expenses
The table below shows the expenses you would have paid on a $1,000 investment in Dreyfus U.S. Equity Fund from June 1, 2010 to November 30, 2010. It also shows how much a $1,000 investment would be worth at the close of the period, assuming actual returns and expenses.
| | | |
| Expenses and Value of a $1,000 Investment | | |
| assuming actual returns for the six months ended November 30, 2010 | |
| | Class A | Class C | Class I |
| Expenses paid per $1,000† | $ 7.34 | $ 11.25 | $ 4.88 |
| Ending value (after expenses) | $1,090.10 | $1,086.80 | $1,093.40 |
|
| COMPARING YOUR FUND’S EXPENSES |
| WITH THOSE OF OTHER FUNDS (Unaudited) |
Using the SEC’s method to compare expenses
The Securities and Exchange Commission (SEC) has established guidelines to help investors assess fund expenses. Per these guidelines, the table below shows your fund’s expenses based on a $1,000 investment, assuming a hypothetical 5% annualized return. You can use this information to compare the ongoing expenses (but not transaction expenses or total cost) of investing in the fund with those of other funds.All mutual fund shareholder reports will provide this information to help you make this comparison. Please note that you cannot use this information to estimate your actual ending account balance and expenses paid during the period.
| | | |
| Expenses and Value of a $1,000 Investment | | |
| assuming a hypothetical 5% annualized return for the six months ended November 30, 2010 |
| | Class A | Class C | Class I |
| Expenses paid per $1,000† | $ 7.08 | $ 10.86 | $ 4.71 |
| Ending value (after expenses) | $1,018.05 | $1,014.29 | $1,020.41 |
† Expenses are equal to the fund’s annualized expense ratio of 1.40% for Class A, 2.15% for Class C and .93% for Class I, multiplied by the average account value over the period, multiplied by 183/365 (to reflect the one-half year period).
8
|
| STATEMENT OF INVESTMENTS |
| November 30, 2010 |
| | |
| Common Stocks—96.1% | Shares | Value ($) |
| Consumer Discretionary—14.9% | | |
| Family Dollar Stores | 61,100 | 3,067,220 |
| McDonald’s | 32,700 | 2,560,410 |
| NIKE, Cl. B | 38,400 | 3,307,392 |
| Panera Bread, Cl. A | 33,900 a | 3,398,136 |
| Starbucks | 111,000 | 3,396,600 |
| TJX | 69,200 | 3,156,212 |
| Tractor Supply | 71,500 | 3,036,605 |
| | | 21,922,575 |
| Consumer Staples—7.2% | | |
| Colgate-Palmolive | 34,900 | 2,671,595 |
| PepsiCo | 35,400 | 2,287,902 |
| Wal-Mart Stores | 51,700 | 2,796,453 |
| Walgreen | 84,300 | 2,937,855 |
| | | 10,693,805 |
| Energy—10.3% | | |
| Apache | 28,000 | 3,013,920 |
| CARBO Ceramics | 33,400 | 3,244,810 |
| EOG Resources | 32,960 | 2,931,792 |
| Occidental Petroleum | 30,800 | 2,715,636 |
| Schlumberger | 42,550 | 3,290,817 |
| | | 15,196,975 |
| Health Care—18.6% | | |
| Abbott Laboratories | 50,500 | 2,348,755 |
| C.R. Bard | 32,450 | 2,753,383 |
| Celgene | 45,900 a | 2,725,542 |
| Gilead Sciences | 70,700 a | 2,580,550 |
| Johnson & Johnson | 47,000 | 2,892,850 |
| Medtronic | 83,800 | 2,809,814 |
| Meridian Bioscience | 138,700 | 3,081,914 |
| Resmed | 73,800 a | 2,357,910 |
| Stryker | 56,800 | 2,845,112 |
| Varian Medical Systems | 45,400 a | 2,988,682 |
| | | 27,384,512 |
TheFund 9
STATEMENT OF INVESTMENTS (continued)
| | |
| Common Stocks (continued) | Shares | Value ($) |
| Industrial—13.9% | | |
| Boeing | 45,900 | 2,927,043 |
| C.H. Robinson Worldwide | 43,100 | 3,176,901 |
| Donaldson | 66,400 | 3,604,856 |
| Fastenal | 35,500 | 1,899,960 |
| MSC Industrial Direct, Cl. A | 48,500 | 2,916,790 |
| Precision Castparts | 24,760 | 3,418,613 |
| Rockwell Collins | 45,800 | 2,567,548 |
| | | 20,511,711 |
| Materials—5.8% | | |
| Ecolab | 60,700 | 2,902,067 |
| Monsanto | 47,400 | 2,840,208 |
| Praxair | 30,200 | 2,779,910 |
| | | 8,522,185 |
| Technology—25.4% | | |
| Adobe Systems | 101,000 a | 2,800,730 |
| Amphenol, Cl. A | 72,300 | 3,617,169 |
| Automatic Data Processing | 70,000 | 3,119,900 |
| Cisco Systems | 101,800 a | 1,950,488 |
| Dolby Laboratories, Cl. A | 37,700 a | 2,386,033 |
| FLIR Systems | 104,600 a | 2,803,803 |
| Google, Cl. A | 4,460 a | 2,478,466 |
| Intel | 130,100 | 2,747,712 |
| MasterCard, Cl. A | 13,470 | 3,192,794 |
| Microsoft | 110,600 | 2,788,226 |
| Oracle | 118,300 | 3,198,832 |
| Paychex | 106,300 | 3,033,802 |
| QUALCOMM | 71,900 | 3,360,606 |
| | | 37,478,561 |
| Total Common Stocks | | |
| (cost $133,021,656) | | 141,710,324 |
10
| | |
| Other Investment—3.1% | Shares | Value ($) |
| Registered Investment Company; | | |
| Dreyfus Institutional Preferred | | |
| Plus Money Market Fund | | |
| (cost $4,612,000) | 4,612,000 b | 4,612,000 |
| |
| Total Investments (cost $137,633,656) | 99.2% | 146,322,324 |
| Cash and Receivables (Net) | .8% | 1,185,049 |
| Net Assets | 100.0% | 147,507,373 |
| |
| a | Non-income producing security. |
| b | Investment in affiliated money market mutual fund. |
| | | |
| Portfolio Summary (Unaudited)† | | |
| |
| | Value (%) | | Value (%) |
| Technology | 25.4 | Consumer Staples | 7.2 |
| Health Care | 18.6 | Materials | 5.8 |
| Consumer Discretionary | 14.9 | Money Market Investment | 3.1 |
| Industrial | 13.9 | | |
| Energy | 10.3 | | 99.2 |
|
| † Based on net assets. |
| See notes to financial statements. |
TheFund 11
|
| STATEMENT OF ASSETS AND LIABILITIES |
| November 30, 2010 |
| | | |
| | | Cost | Value |
| Assets ($): | | | |
| Investments in securities—See Statement of Investments: | | |
| Unaffiliated issuers | | 133,021,656 | 141,710,324 |
| Affiliated issuers | | 4,612,000 | 4,612,000 |
| Cash | | | 1,063,273 |
| Dividends and interest receivable | | | 206,020 |
| Receivable for shares of Common Stock subscribed | | | 64,134 |
| Prepaid expenses | | | 14,251 |
| | | | 147,670,002 |
| Liabilities ($): | | | |
| Due to The Dreyfus Corporation and affiliates—Note 3(c) | | 91,655 |
| Payable for shares of Common Stock redeemed | | | 15,135 |
| Accrued expenses | | | 55,839 |
| | | | 162,629 |
| Net Assets ($) | | | 147,507,373 |
| Composition of Net Assets ($): | | | |
| Paid-in capital | | | 137,819,629 |
| Accumulated undistributed investment income—net | | | 235,120 |
| Accumulated net realized gain (loss) on investments | | | 763,956 |
| Accumulated net unrealized appreciation | | | |
| (depreciation) on investments | | | 8,688,668 |
| Net Assets ($) | | | 147,507,373 |
| |
| |
| Net Asset Value Per Share | | | |
| | Class A | Class C | Class I |
| Net Assets ($) | 2,423,664 | 312,428 | 144,771,281 |
| Shares Outstanding | 188,844 | 24,703 | 11,244,020 |
| Net Asset Value Per Share ($) | 12.83 | 12.65 | 12.88 |
| |
| See notes to financial statements. | | | |
12
|
| STATEMENT OF OPERATIONS |
| Year Ended November 30, 2010 |
| |
| Investment Income ($): | |
| Income: | |
| Cash dividends: | |
| Unaffiliated issuers | 688,005 |
| Affiliated issuers | 7,306 |
| Total Income | 695,311 |
| Expenses: | |
| Management fee—Note 3(a) | 349,427 |
| Registration fees | 46,005 |
| Auditing fees | 40,132 |
| Shareholder servicing costs—Note 3(c) | 11,630 |
| Custodian fees—Note 3(c) | 6,661 |
| Prospectus and shareholders’ reports | 6,635 |
| Distribution fees—Note 3(b) | 3,659 |
| Legal fees | 1,906 |
| Directors’ fees and expenses—Note 3(d) | 887 |
| Loan commitment fees—Note 2 | 101 |
| Miscellaneous | 8,036 |
| Total Expenses | 475,079 |
| Less—reduction in management fee due to undertaking—Note 3(a) | (14,964) |
| Less—reduction in fees due to earnings credits—Note 3(c) | (4) |
| Net Expenses | 460,111 |
| Investment Income—Net | 235,200 |
| Realized and Unrealized Gain (Loss) on Investments—Note 4 ($): | |
| Net realized gain (loss) on investments | 950,030 |
| Net unrealized appreciation (depreciation) on investments | 8,688,285 |
| Net Realized and Unrealized Gain (Loss) on Investments | 9,638,315 |
| Net Increase in Net Assets Resulting from Operations | 9,873,515 |
| |
| See notes to financial statements. | |
TheFund 13
STATEMENT OF CHANGES IN NET ASSETS
| | |
| | Year Ended November 30, |
| | 2010 | 2009a |
| Operations ($): | | |
| Investment income—net | 235,200 | 16,389 |
| Net realized gain (loss) on investments | 950,030 | (120,977) |
| Net unrealized appreciation | | |
| (depreciation) on investments | 8,688,285 | 1,289,284 |
| Net Increase (Decrease) in Net Assets | | |
| Resulting from Operations | 9,873,515 | 1,184,696 |
| Dividends to Shareholders from ($): | | |
| Investment income—net: | | |
| Class A Shares | (5,953) | (8,282) |
| Class I Shares | (7,080) | (1,800) |
| Class T Shares | — | (520) |
| Total Dividends | (13,033) | (10,602) |
| Capital Stock Transactions ($): | | |
| Net proceeds from shares sold: | | |
| Class A Shares | 220,658 | 589,868 |
| Class C Shares | 27,800 | 21,427 |
| Class I Shares | 137,915,540 | 1,270,836 |
| Dividends reinvested: | | |
| Class A Shares | 183 | 162 |
| Class I Shares | 5,399 | — |
| Cost of shares redeemed: | | |
| Class A Shares | (1,948,355) | (163,960) |
| Class C Shares | (243,105) | — |
| Class I Shares | (4,581,770) | (8,622) |
| Class T Shares | — | (357,200) |
| Increase (Decrease) in Net Assets | | |
| from Capital Stock Transactions | 131,396,350 | 1,352,511 |
| Total Increase (Decrease) in Net Assets | 141,256,832 | 2,526,605 |
| Net Assets ($): | | |
| Beginning of Period | 6,250,541 | 3,723,936 |
| End of Period | 147,507,373 | 6,250,541 |
| Undistributed investment income—net | 235,120 | 12,940 |
14
| | |
| | Year Ended November 30, |
| | 2010 | 2009a |
| Capital Share Transactions: | | |
| Class Ab | | |
| Shares sold | 18,541 | 63,854 |
| Shares issued for dividends reinvested | 15 | 18 |
| Shares redeemed | (162,126) | (17,796) |
| Net Increase (Decrease) in Shares Outstanding | (143,570) | 46,076 |
| Class C | | |
| Shares sold | 2,301 | 1,812 |
| Shares redeemed | (20,518) | — |
| Net Increase (Decrease) in Shares Outstanding | (18,217) | 1,812 |
| Class I | | |
| Shares sold | 11,457,984 | 120,473 |
| Shares issued for dividends reinvested | 447 | — |
| Shares redeemed | (374,153) | (731) |
| Net Increase (Decrease) in Shares Outstanding | 11,084,278 | 119,742 |
| Class Tb | | |
| Shares redeemed | — | (40,000) |
| |
| a | Effective as of the close of business on February 4, 2009, the fund no longer offers Class T shares. |
| b | On the close of business on February 4, 2009, 40,000 Class T shares representing $357,200 were converted to |
| | 40,000 Class A shares. |
| See notes to financial statements. |
TheFund 15
FINANCIAL HIGHLIGHTS
The following tables describe the performance for each share class for the fiscal periods indicated.All information (except portfolio turnover rate) reflects financial results for a single fund share.Total return shows how much your investment in the fund would have increased (or decreased) during each period, assuming you had reinvested all dividends and distributions.These figures have been derived from the fund’s financial statements.
| | | |
| | Year Ended November 30, |
| Class A Shares | 2010 | 2009 | 2008a |
| Per Share Data ($): | | | |
| Net asset value, beginning of period | 11.68 | 9.14 | 12.50 |
| Investment Operations: | | | |
| Investment income—netb | .01 | .04 | .02 |
| Net realized and unrealized | | | |
| gain (loss) on investments | 1.16 | 2.53 | (3.38) |
| Total from Investment Operations | 1.17 | 2.57 | (3.36) |
| Distributions: | | | |
| Dividends from investment income—net | (.02) | (.03) | — |
| Net asset value, end of period | 12.83 | 11.68 | 9.14 |
| Total Return (%)c | 10.01 | 28.19 | (26.88)d |
| Ratios/Supplemental Data (%): | | | |
| Ratio of total expenses to average net assets | 1.76 | 4.65 | 5.54e |
| Ratio of net expenses to average net assets | 1.40 | 1.40 | 1.40e |
| Ratio of net investment income | | | |
| to average net assets | .04 | .42 | .33e |
| Portfolio Turnover Rate | 13.62 | 31.79 | 7.98d |
| Net Assets, end of period ($ x 1,000) | 2,424 | 3,884 | 2,618 |
| |
| a | From May 30, 2008 (commencement of operations) to November 30, 2008. |
| b | Based on average shares outstanding at each month end. |
| c | Exclusive of sales charge. |
| d | Not annualized. |
| e | Annualized. |
| See notes to financial statements. |
16
| | | |
| | Year Ended November 30, |
| Class C Shares | 2010 | 2009 | 2008a |
| Per Share Data ($): | | | |
| Net asset value, beginning of period | 11.58 | 9.11 | 12.50 |
| Investment Operations: | | | |
| Investment (loss)—netb | (.09) | (.03) | (.02) |
| Net realized and unrealized | | | |
| gain (loss) on investments | 1.16 | 2.50 | (3.37) |
| Total from Investment Operations | 1.07 | 2.47 | (3.39) |
| Net asset value, end of period | 12.65 | 11.58 | 9.11 |
| Total Return (%)c | 9.24 | 27.11 | (27.12)d |
| Ratios/Supplemental Data (%): | | | |
| Ratio of total expenses to average net assets | 2.52 | 5.83 | 6.30e |
| Ratio of net expenses to average net assets | 2.15 | 2.15 | 2.14e |
| Ratio of net investment (loss) | | | |
| to average net assets | (.71) | (.27) | (.41)e |
| Portfolio Turnover Rate | 13.62 | 31.79 | 7.98d |
| Net Assets, end of period ($ x 1,000) | 312 | 497 | 374 |
| |
| a | From May 30, 2008 (commencement of operations) to November 30, 2008. |
| b | Based on average shares outstanding at each month end. |
| c | Exclusive of sales charge. |
| d | Not annualized. |
| e | Annualized. |
| See notes to financial statements. |
TheFund 17
FINANCIAL HIGHLIGHTS (continued)
| | | |
| | Year Ended November 30, |
| Class I Shares | 2010 | 2009 | 2008a |
| Per Share Data ($): | | | |
| Net asset value, beginning of period | 11.70 | 9.16 | 12.50 |
| Investment Operations: | | | |
| Investment income—netb | .07 | .05 | .03 |
| Net realized and unrealized | | | |
| gain (loss) on investments | 1.15 | 2.54 | (3.37) |
| Total from Investment Operations | 1.22 | 2.59 | (3.34) |
| Distributions: | | | |
| Dividends from investment income—net | (.04) | (.05) | — |
| Net asset value, end of period | 12.88 | 11.70 | 9.16 |
| Total Return (%) | 10.47 | 28.36 | (26.72)c |
| Ratios/Supplemental Data (%): | | | |
| Ratio of total expenses to average net assets | .94 | 3.77 | 5.25d |
| Ratio of net expenses to average net assets | .94 | 1.15 | 1.14d |
| Ratio of net investment income | | | |
| to average net assets | .56 | .54 | .59d |
| Portfolio Turnover Rate | 13.62 | 31.79 | 7.98c |
| Net Assets, end of period ($ x 1,000) | 144,771 | 1,870 | 366 |
| |
| a | From May 30, 2008 (commencement of operations) to November 30, 2008. |
| b | Based on average shares outstanding at each month end. |
| c | Not annualized. |
| d | Annualized. |
| See notes to financial statements. |
18
NOTES TO FINANCIAL STATEMENTS
NOTE 1—Significant Accounting Policies:
Dreyfus U.S. Equity Fund (the “fund”) is a separate diversified series of Strategic Funds, Inc. (the “Company”) which is registered under the Investment Company Act of 1940, as amended (the “Act”), as an open-end management investment company and operates as a series company currently offering ten series, including the fund.The fund’s investment objective is to seek long-term total return. The Dreyfus Corporation (the “Manager” or “Dreyfus”), a wholly-owned subsidiary of The Bank of New York Mellon Corporation (“BNY Mellon”), serves as the fund’s investment adviser. Walter Scott & Partners Limited (“Walter Scott”), a subsidiary of BNY Mellon and an affiliate of Dreyfus, serves as the fund’s sub-investment adviser.
MBSC Securities Corporation (the “Distributor”), a wholly-owned subsidiary of Dreyfus, is the distributor of the fund’s shares.The fund is authorized to issue 100 million shares of $.001 par value Common Stock in each of the following classes of shares: Class A, Class C and Class I. Class A shares are subject to a sales charge imposed at the time of purchase. Class C shares are subject to a contingent deferred sales charge (“CDSC”) on Class C shares redeemed within one year of purchase. Class I shares are sold primarily to bank trust departments and other financial service providers (including The Bank of New York Mellon, a subsidiary of BNY Mellon and an affiliate of Dreyfus), acting on behalf of customers having a qualified trust or an investment account or relationship at such institution, and bear no distribution or shareholder services fees. Class I shares are offered without a front- end sales charge or CDSC. Other differences between the classes include the services offered to and the expenses borne by each class, the allocation of certain transfer agency costs and certain voting rights. Income, expenses (other than expenses attributable to a specific class), and realized and unrealized gains or losses on investments are allocated to each class of shares based on its relative net assets.
TheFund 19
NOTES TO FINANCIAL STATEMENTS (continued)
As of November 30, 2010, MBC Investments Corp., an indirect subsidiary of BNY Mellon, held 160,000 Class A and 20,000 Class C shares of the fund.
The Company accounts separately for the assets, liabilities and operations of each series. Expenses directly attributable to each series are charged to that series’ operations; expenses which are applicable to all series are allocated among them on a pro rata basis.
The Financial Accounting Standards Board (“FASB”) Accounting Standards Codification (“ASC”) is the exclusive reference of authoritative U.S. generally accepted accounting principles (“GAAP”) recognized by the FASB to be applied by nongovernmental entities. Rules and interpretive releases of the Securities and Exchange Commission (“SEC”) under authority of federal laws are also sources of authoritative GAAP for SEC registrants. The fund’s financial statements are prepared in accordance with GAAP, which may require the use of management estimates and assumptions.Actual results could differ from those estimates.
The Company enters into contracts that contain a variety of indemnifications.The fund’s maximum exposure under these arrangements is unknown.The fund does not anticipate recognizing any loss related to these arrangements.
(a) Portfolio valuation: Investments in securities are valued at the last sales price on the securities exchange or national securities market on which such securities are primarily traded. Securities listed on the National Market System for which market quotations are available are valued at the official closing price or, if there is no official closing price that day, at the last sales price. Securities not listed on an exchange or the national securities market, or securities for which there were no transactions, are valued at the average of the most recent bid and asked prices, except for open short positions, where the asked price is used for valuation purposes. Bid price is used when no asked price is available. Registered investment companies that are not traded on an
20
exchange are valued at their net asset value.When market quotations or official closing prices are not readily available, or are determined not to reflect accurately fair value, such as when the value of a security has been significantly affected by events after the close of the exchange or market on which the security is principally traded (for example, a foreign exchange or market), but before the fund calculates its net asset value, the fund may value these investments at fair value as determined in accordance with the procedures approved by the Board of Directors. Fair valuing of securities may be determined with the assistance of a pricing service using calculations based on indices of domestic securities and other appropriate indicators, such as prices of relevant American Depository Receipts and futures contracts. For other securities that are fair valued by the Board of Directors, certain factors may be co nsidered such as: fundamental analytical data, the nature and duration of restrictions on disposition, an evaluation of the forces that influence the market in which the securities are purchased and sold and public trading in similar securities of the issuer or comparable issuers.
The fair value of a financial instrument is the amount that would be received to sell an asset or paid to transfer a liability in an orderly transaction between market participants at the measurement date (i.e. the exit price). GAAP establishes a fair value hierarchy that prioritizes the inputs of valuation techniques used to measure fair value.This hierarchy gives the highest priority to unadjusted quoted prices in active markets for identical assets or liabilities (Level 1 measurements) and the lowest priority to unobservable inputs (Level 3 measurements).
Additionally, GAAP provides guidance on determining whether the volume and activity in a market has decreased significantly and whether such a decrease in activity results in transactions that are not orderly. GAAP requires enhanced disclosures around valuation inputs and techniques used during annual and interim periods.
TheFund 21
NOTES TO FINANCIAL STATEMENTS (continued)
Various inputs are used in determining the value of the fund’s investments relating to fair value measurements.These inputs are summarized in the three broad levels listed below:
Level 1—unadjusted quoted prices in active markets for identical investments.
Level 2—other significant observable inputs (including quoted prices for similar investments, interest rates, prepayment speeds, credit risk, etc.).
Level 3—significant unobservable inputs (including the fund’s own assumptions in determining the fair value of investments).
The inputs or methodology used for valuing securities are not necessarily an indication of the risk associated with investing in those securities.
The following is a summary of the inputs used as of November 30, 2010 in valuing the fund’s investments:
| | | | |
| | | Level 2—Other | Level 3— | |
| | Level 1— | Significant | Significant | |
| | Unadjusted | Observable | Unobservable | |
| | Quoted Prices | Inputs | Inputs | Total |
| Assets ($) | | | | |
| Investments in Securities: | | | |
| Equity Securities— | | | | |
| Domestic† | 141,710,324 | — | — | 141,710,324 |
| Mutual Funds | 4,612,000 | — | — | 4,612,000 |
| † See Statement of Investments for industry classification. | | |
In January 2010, FASB issued Accounting Standards Update (“ASU”) No. 2010-06 “Improving Disclosures about Fair Value Measurements”. The portions of ASU No. 2010-06 which require reporting entities to prepare new disclosures surrounding amounts and reasons for significant transfers in and out of Level 1 and Level 2 fair value measurements as well as inputs and valuation techniques used to measure fair value for both recurring and nonrecurring fair value measurements that fall in either Level 2 or Level 3 have been adopted by the fund. No significant transfers between Level 1 or Level 2 fair value measurements occurred at November 30, 2010. The remaining portion of ASU No. 2010-06
22
requires reporting entities to make new disclosures about information on purchases, sales, issuances and settlements on a gross basis in the reconciliation of activity in Level 3 fair value measurements.These new and revised disclosures are required to be implemented for fiscal years beginning after December 15, 2010. Management is currently evaluating the impact that the adoption of this remaining portion of ASU No. 2010-06 may have on the fund’s financial statement disclosures.
(b) Securities transactions and investment income: Securities transactions are recorded on a trade date basis. Realized gains and losses from securities transactions are recorded on the identified cost basis. Dividend income is recognized on the ex-dividend date and interest income, including, where applicable, accretion of discount and amortization of premium on investments, is recognized on the accrual basis.
(c) Affiliated issuers: Investments in other investment companies advised by Dreyfus are defined as “affiliated” in the Act.
The fund may invest in shares of certain affiliated investment companies also advised or managed by Dreyfus. Investments in affiliated investment companies for the period ended November 30, 2010 were as follows:
| | | | | |
| Affiliated | | | | | |
| Investment | Value | | | Value | Net |
| Company | 11/30/2009 ($) | Purchases ($) | Sales ($) | 11/30/2010 ($) | Assets (%) |
| Dreyfus | | | | | |
| Institutional | | | | | |
| Preferred | | | | | |
| Plus Money | | | | | |
| Market Fund | 186,000 | 89,765,000 | 85,339,000 | 4,612,000 | 3.1 |
(d) Dividends to shareholders: Dividends are recorded on the ex-dividend date. Dividends from investment income-net and dividends from net realized capital gains, if any, are normally declared and paid annually, but the fund may make distributions on a more frequent basis to comply with the distribution requirements of the Internal Revenue Code of 1986, as amended (the “Code”).To the extent that net realized capital gains can be offset by capital loss carryovers, it is the policy
TheFund 23
NOTES TO FINANCIAL STATEMENTS (continued)
of the fund not to distribute such gains. Income and capital gain distributions are determined in accordance with income tax regulations, which may differ from GAAP.
(e) Federal income taxes: It is the policy of the fund to continue to qualify as a regulated investment company, if such qualification is in the best interests of its shareholders, by complying with the applicable provisions of the Code, and to make distributions of taxable income sufficient to relieve it from substantially all federal income and excise taxes.
As of and during the period ended November 30, 2010, the fund did not have any liabilities for any uncertain tax positions.The fund recognizes interest and penalties, if any, related to uncertain tax positions as income tax expense in the Statement of Operations. During the period, the fund did not incur any interest or penalties.
Each of the tax years in the three-year period ended November 30, 2010 remains subject to examination by the Internal Revenue Service and state taxing authorities.
At November 30, 2010, the components of accumulated earnings on a tax basis were as follows: undistributed ordinary income $999,076 and unrealized appreciation $8,688,668.
The tax character of distributions paid to shareholders during the fiscal periods ended November 30, 2010 and November 30, 2009 were as follows: ordinary income $13,033 and $10,602, respectively.
During the period ended November 30, 2010, as a result of permanent book to tax differences, primarily due to the tax treatment for excise tax paid, the fund increased accumulated undistributed investment income-net by $13 and decreased paid-in capital by the same amount. Net assets and net asset value per share were not affected by this reclassification.
NOTE 2—Bank Lines of Credit:
The fund participates with other Dreyfus-managed funds in a $225 million unsecured credit facility led by Citibank, N.A. and a $300 million unsecured credit facility provided by The Bank of New York
24
Mellon (each, a “Facility”), each to be utilized primarily for temporary or emergency purposes, including the financing of redemptions. In connection therewith, the fund has agreed to pay its pro rata portion of commitment fees for each Facility. Interest is charged to the fund based on rates determined pursuant to the terms of the respective Facility at the time of borrowing. During the period ended November 30, 2010, the fund did not borrow under the Facilities.
NOTE 3—Management Fee, Sub-Investment Advisory Fee and Other Transactions With Affiliates:
(a) Pursuant to a management agreement with Dreyfus, the management fee is computed at the annual rate of .75% of the value of the fund’s average daily net assets and is payable monthly. Dreyfus has contractually agreed, until April 1, 2011, to waive receipt of its fees and/or assume the expenses of the fund so that annual fund operating expenses (excluding Rule 12b-1 distribution plan fees, shareholder services fees, taxes, interest, brokerage commissions, commitment fees on borrowings and extraordinary expenses) do not exceed 1.15% of the value of the fund’s average daily net assets.The reduction in management fee, pursuant to the undertaking, amounted to $14,964 during the period ended November 30, 2010.
Pursuant to a sub-investment advisory agreement between Dreyfus and Walter Scott, Dreyfus pays Walter Scott a monthly fee at an annual percentage of the fund’s average daily net assets.
During the period ended November 30, 2010, the Distributor retained $38 from commissions earned on sales of the fund’s Class A shares.
(b) Under the Distribution Plan (the “Plan”) adopted pursuant to Rule 12b-1 under the Act, Class C shares pay the Distributor for distributing its shares at an annual rate of .75% of the value of the average daily net assets of Class C shares. During the period ended November 30, 2010, Class C shares were charged $3,659, pursuant to the Plan.
(c) Under the Shareholder Services Plan, Class A and Class C shares pay the Distributor at an annual rate of .25% of the value of their average
TheFund 25
NOTES TO FINANCIAL STATEMENTS (continued)
daily net assets for the provision of certain services.The services provided may include personal services relating to shareholder accounts, such as answering shareholder inquiries regarding Class A and Class C shares and providing reports and other information, and services related to the maintenance of shareholder accounts. The Distributor may make payments to Service Agents (a securities dealer, financial institution or other industry professional) in respect of these services. The Distributor determines the amounts to be paid to Service Agents. During the period ended November 30, 2010, Class A and Class C shares were charged $9,257 and $1,219, respectively, pursuant to the Shareholder Services Plan.
The fund compensates Dreyfus Transfer, Inc., a wholly-owned subsidiary of Dreyfus, under a transfer agency agreement for providing personnel and facilities to perform transfer agency services for the fund. During the period ended November 30, 2010, the fund was charged $484 pursuant to the transfer agency agreement, which is included in Shareholder servicing costs in the Statement of Operations.
The fund has arrangements with the custodian and cash management bank whereby the fund may receive earnings credits when positive cash balances are maintained, which are used to offset custody and cash management fees. For financial reporting purposes, the fund includes net earnings credits as an expense offset in the Statement of Operations.
The fund compensates The Bank of New York Mellon under a cash management agreement for performing cash management services related to fund subscriptions and redemptions. During the period ended November 30, 2010, the fund was charged $62 pursuant to the cash management agreement, which is included in Shareholder servicing costs in the Statement of Operations.These fees were partially offset by earnings credits of $4.
The fund also compensates The Bank of New York Mellon under a custody agreement for providing custodial services for the fund. During the period ended November 30, 2010, the fund was charged $6,661 pursuant to the custody agreement.
26
During the period ended November 30, 2010, the fund was charged $6,399 for services performed by the Chief Compliance Officer.
The components of “Due to The Dreyfus Corporation and affiliates” in the Statement of Assets and Liabilities consist of: management fees $85,960, Rule 12b-1 distribution plan fees $195, shareholder services plan fees $563, custodian fees $3,680, chief compliance officer fees $1,152 and transfer agency per account fees $105.
(d) Each Board member also serves as a Board member of other funds within the Dreyfus complex. Annual retainer fees and attendance fees are allocated to each fund based on net assets.
NOTE 4—Securities Transactions:
The aggregate amount of purchases and sales of investment securities, excluding short-term securities, during the period ended November 30, 2010, amounted to $132,180,573 and $6,195,103, respectively.
The provisions of ASC Topic 815 “Derivatives and Hedging” require qualitative disclosures about objectives and strategies for using derivatives, quantitative disclosures about fair value amounts of gains and losses on derivative instruments and disclosures about credit-risk-related contingent features in derivative agreements.The fund held no derivatives during the period ended November 30, 2010.
At November 30, 2010, the cost of investments for federal income tax purposes was $137,633,656; accordingly, accumulated net unrealized appreciation on investments was $8,688,668, consisting of $10,378,055 gross unrealized appreciation and $1,689,387 gross unrealized depreciation.
TheFund 27
|
| REPORT OF INDEPENDENT REGISTERED |
| PUBLIC ACCOUNTING FIRM |
Shareholders and Board of Directors
Dreyfus U.S. Equity Fund
We have audited the accompanying statement of assets and liabilities, including the statement of investments, of Dreyfus U.S. Equity Fund (one of the series comprising Strategic Funds, Inc.) as of November 30, 2010, and the related statement of operations for the year then ended, the statement of changes in net assets for each of the two years in the period then ended and financial highlights for each of the periods indicated therein. These financial statements and financial highlights are the responsibility of the Fund’s management. Our responsibility is to express an opinion on these financial statements and financial highlights based on our audits.
We conducted our audits in accordance with the standards of the Public Company Accounting Oversight Board (United States).Those standards require that we plan and perform the audit to obtain reasonable assurance about whether the financial statements and financial highlights are free of material misstatement. We were not engaged to perform an audit of the Fund’s internal control over financial reporting. Our audits included consideration of internal control over financial reporting as a basis for designing audit procedures that are appropriate in the circumstances, but not for the purpose of expressing an opinion on the effectiveness of the Fund’s internal control over financial reporting. Accordingly, we express no such opinion. An audit also includes examining, on a test basis, evidence supporting the amounts and disclosures in the financial statements and financial highlights, assessing the accounting principles used and significant estimates made by management, and evaluating the overall financial statement presentation. Our procedures included confirmation of securities owned as of November 30, 2010 by correspondence with the custodian and others.We believe that our audits provide a reasonable basis for our opinion.
In our opinion, the financial statements and financial highlights referred to above present fairly, in all material respects, the financial position of Dreyfus U.S. Equity Fund at November 30, 2010, the results of its operations for the year then ended, the changes in its net assets for each of the two years in the period then ended, and the financial highlights for each of the indicated periods, in conformity with U.S. generally accepted accounting principles.
New York, New York
January 25, 2011
28
IMPORTANT TAX INFORMATION (Unaudited)
For federal tax purposes the fund hereby designates 99.78% of the ordinary dividends paid during the fiscal year ended November 30, 2010 as qualifying for the corporate dividends received deduction. Also certain dividends paid by the fund may be subject to a maximum tax rate of 15%, as provided for by the Jobs and Growth Tax Relief Reconciliation Act of 2003. Of the distributions paid during the fiscal year, $13,033 represents the maximum amount that may be considered qualified dividend income. Shareholders will receive notification in early 2011 of the percentage applicable to the preparation of their 2010 income tax returns.
TheFund 29
|
| INFORMATION ABOUT THE REVIEW AND APPROVAL |
| OF THE FUND’S MANAGEMENT AGREEMENT AND |
| SUB-INVESTMENT ADVISORY AGREEMENT (Unaudited) |
At a meeting of the fund’s Board of Directors held on November 8-9, 2010, the Board considered the renewal of the fund’s Management Agreement with Dreyfus pursuant to which Dreyfus provides the fund with investment advisory and administrative services, and of Dreyfus’ Sub-Investment Advisory Agreement with Walter Scott & Partners Limited (“Walter Scott”)(the “Sub-Advisory Agreement”), pursuant to which Walter Scott serves as sub-investment adviser and provides day-to-day management of the fund’s portfolio (collectively, the “Agreements”). The Board members, none of whom are “interested persons” (as defined in the Investment Company Act of 1940, as amended) of the fund, were assisted in their review by independent legal counsel and met with counsel in executive session separate from representatives of Dreyfus and Walter Scott. In considering the renewa l of the Agreements, the Board considered all factors that it believed to be relevant, including those discussed below.The Board did not identify any one factor as dispositive, and each Board member may have attributed different weights to the factors considered.
Analysis of Nature, Extent and Quality of Services Provided to the Fund.The Board members considered information previously provided to them in a presentation from representatives of Dreyfus regarding the nature, extent, and quality of the services provided to funds in the Dreyfus fund complex, and by Walter Scott to the fund pursuant to the Sub-Advisory Agreement, and representatives of Dreyfus and Walter Scott confirmed that there had been no material changes in this information. Dreyfus provided the number of open accounts in the fund, the fund’s asset size and the allocation of fund assets among distribution channels. Dreyfus also had previously provided information regarding the diverse intermediary relationships and distribution channels of funds in the Dreyfus fund complex and Dreyfus’ corresponding need for broad, d eep, and diverse resources to be able to provide ongoing shareholder services to each distribution channel, including the distribution channel(s) for the fund.
The Board members also considered research support available to, and portfolio management capabilities of, the fund’s portfolio management
30
personnel and that Dreyfus also provides oversight of day-to-day fund operations, including fund accounting and administration and assistance in meeting legal and regulatory requirements.The Board members also considered Dreyfus’ extensive administrative, accounting, and compliance infrastructures, and Dreyfus’ supervisory activities over Walter Scott.The Board also considered portfolio management’s brokerage policies and practices (including policies and practices regarding soft dollars) and the standards applied in seeking best execution.
Comparative Analysis of the Fund’s Performance and Management Fee and Expense Ratio. The Board members reviewed reports prepared by Lipper, Inc. (“Lipper”), an independent provider of investment company data, which included information comparing (1) the fund’s performance with the performance of a group of comparable funds (the “Performance Group”) and with a broader group of funds (the “Performance Universe”), all for various periods ended September 30, 2010, and (2) the fund’s actual and contractual management fees and total expenses with those of a group of comparable funds (the “Expense Group”) and with a broader group of funds (the “Expense Universe”), the information for which was derived in part from fund financial statements available to Lipper as of September 3 0, 2010. Dreyfus previously had furnished the Board with a description of the methodology Lipper used to select the Performance Group and Performance Universe and the Expense Group and Expense Universe.
Dreyfus representatives stated that the usefulness of performance comparisons may be affected by a number of factors, including different investment limitations that may be applicable to the fund and comparison funds.The Board members discussed the results of the comparisons and noted that the fund’s total return performance was above the Performance Group and Performance Universe medians for the 2-year period, and below the Performance Group and Performance Universe medians for the 1-year period.
TheFund 31
|
| INFORMATION ABOUT THE REVIEW AND APPROVAL OF THE |
| FUND’S MANAGEMENT AGREEMENT AND SUB-INVESTMENT |
| ADVISORY AGREEMENT (Unaudited) (continued) |
Dreyfus also provided information showing that the fund’s total return for its only calendar year of operation compared with the return of the fund’s benchmark index, and the Board noted that the fund’s return was higher.
The Board members also reviewed the range of actual and contractual management fees and total expenses of the Expense Group and Expense Universe funds and discussed the results of the comparisons. They noted that the fund’s contractual management fee was below the Expense Group median, the fund’s actual management fee was at the Expense Group median and was below the Expense Universe median, and the fund’s total expenses were below the Expense Group median and above the Expense Universe median. The Board also considered the current fee waiver and expense reimbursement arrangement undertaken by Dreyfus, the effect of which, similar to the majority of the Expense Group funds, resulted in Dreyfus waiving receipt of its entire management fee for the period reported.
A representative of Dreyfus noted that Dreyfus has contractually agreed to waive receipt of its fees and/or assume the expenses of the fund, until April 1, 2011, so that annual direct fund operating expenses (excluding Rule 12b-1 fees, shareholder services fees, taxes, interest, brokerage commissions, acquired fund fees and extraordinary expenses) do not exceed 1.15% of the fund’s average daily net assets.
Representatives of Dreyfus noted that there were no funds in the same Lipper category as the fund managed by Dreyfus,Walter Scott, or their affiliates, or separate accounts and/or other types of client portfolios managed by Dreyfus or Walter Scott considered to have similar investment strategies and policies as the fund.
The Board considered the fee toWalter Scott in relation to the fee paid to Dreyfus by the fund and the respective services provided by Walter Scott and Dreyfus.The Board also noted Walter Scott’s fee is paid by Dreyfus (out of its fee from the fund) and not the fund.
32
Analysis of Profitability and Economies of Scale. Dreyfus’ representatives reviewed the expenses allocated and profit received by Dreyfus and the resulting profitability percentage for managing the fund, and the method used to determine the expenses and profit. The Board concluded that the profitability results were not unreasonable given the services rendered and service levels provided by Dreyfus. The Board also noted the expense limitation arrangement and its effect on Dreyfus’ profitability. The Board previously had been provided with information prepared by an independent consulting firm regarding Dreyfus’ approach to allocating costs to, and determining the profitability of, individual funds and the entire Dreyfus fund complex.The consulting firm also had analyzed where any economies of scale might emerge in conn ection with the management of a fund.
The Board’s counsel stated that the Board members should consider the profitability analysis (1) as part of their evaluation of whether the fees under the Agreements bear a reasonable relationship to the mix of services provided by Dreyfus andWalter Scott, including the nature, extent and quality of such services, and (2) in light of the relevant circumstances for the fund and the extent to which economies of scale would be realized if the fund grows and whether fee levels reflect these economies of scale for the benefit of fund shareholders. Since Dreyfus, and not the fund, pays Walter Scott pursuant to the Sub-Advisory Agreement, the Board did not consider Walter Scott’s profitability to be relevant to its deliberations. Dreyfus representatives noted that, as a result of shared and allocated costs among funds in the Dreyfus funds complex, the extent of economies of scale could depend substantially on t he level of assets in the complex as a whole, so that increases and decreases in complex-wide assets can affect potential economies of scale in a manner that is disproportionate to, or even in the opposite direction from, changes in the fund’s asset level. The Board members also considered potential benefits to Dreyfus and Walter Scott from acting as investment
TheFund 33
|
| INFORMATION ABOUT THE REVIEW AND APPROVAL OF THE |
| FUND’S MANAGEMENT AGREEMENT AND SUB-INVESTMENT |
| ADVISORY AGREEMENT (Unaudited) (continued) |
adviser and sub-investment adviser, respectively, and noted there were no soft dollar arrangements in effect for trading the fund’s investments.
At the conclusion of these discussions, the Board agreed that it had been furnished with sufficient information to make an informed business decision with respect to the renewal of the Agreements. Based on the discussions and considerations as described above, the Board concluded and determined as follows.
The Board concluded that the nature, extent, and quality of the services provided by Dreyfus and Walter Scott are adequate and appropriate.
The Board was satisfied with the fund’s performance, in light of the considerations described above.
The Board concluded that the fees paid to Dreyfus were reasonable in light of the considerations described above.
The Board determined that the economies of scale which may accrue to Dreyfus and its affiliates in connection with the management of the fund had been adequately considered by Dreyfus in connection with the fee rate charged to the fund pursuant to the Agreement and that, to the extent in the future it were determined that material economies of scale had not been shared with the fund, the Board would seek to have those economies of scale shared with the fund.
The Board members considered these conclusions and determinations, along with information received on a routine and regular basis throughout the year. In addition, it should be noted that the Board’s consideration of the contractual fee arrangements for this fund had the benefit of a number of years of reviews of prior or similar agreements during which lengthy discussions took place between the Board members and Dreyfus representatives. Certain aspects of the arrangements may receive greater scrutiny in some years than in others, and the Board members’ conclusions may be based, in part, on their consideration of the same or similar arrangements in prior years. The Board members determined that renewal of the Agreements was in the best interests of the fund and its shareholders.
34
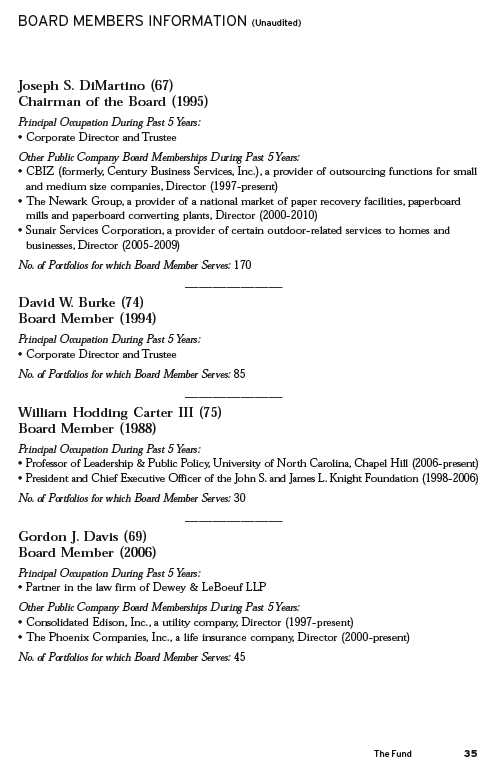
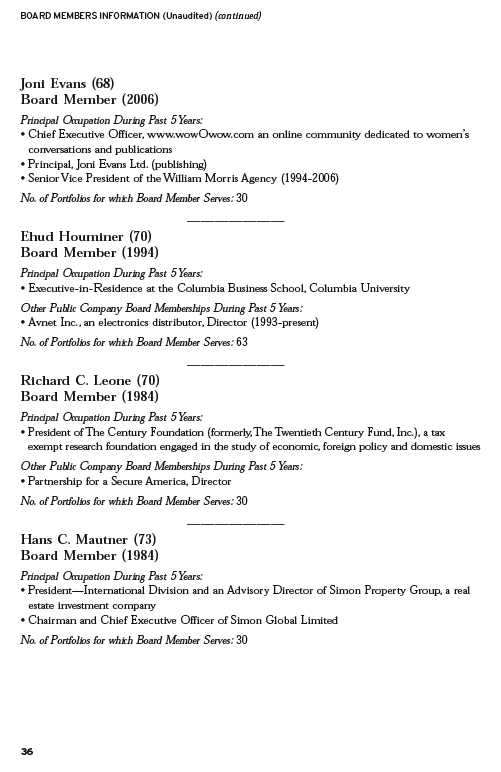

OFFICERS OF THE FUND (Unaudited)
BRADLEY J. SKAPYAK, President since January 2010.
Chief Operating Officer and a director of the Manager since June 2009. From April 2003 to June 2009, Mr. Skapyak was the head of the Investment Accounting and Support Department of the Manager. He is an officer of 76 investment companies (comprised of 170 portfolios) managed by the Manager. He is 52 years old and has been an employee of the Manager since February 1988.
PHILLIP N. MAISANO, Executive Vice President since July 2007.
Chief Investment Officer,Vice Chair and a director of the Manager, and an officer of 76 investment companies (comprised of 170 portfolios) managed by the Manager. Mr. Maisano also is an officer and/or Board member of certain other investment management subsidiaries of The Bank of New York Mellon Corporation, each of which is an affiliate of the Manager. He is 63 years old and has been an employee of the Manager since November 2006. Prior to joining the Manager, Mr. Maisano served as Chairman and Chief Executive Officer of EACM Advisors, an affiliate of the Manager, since August 2004.
MICHAEL A. ROSENBERG, Vice President and Secretary since August 2005.
Assistant General Counsel of BNY Mellon, and an officer of 77 investment companies (comprised of 195 portfolios) managed by the Manager. He is 50 years old and has been an employee of the Manager since October 1991.
KIESHA ASTWOOD, Vice President and Assistant Secretary since January 2010.
Counsel of BNY Mellon, and an officer of 77 investment companies (comprised of 195 portfolios) managed by the Manager. She is 37 years old and has been an employee of the Manager since July 1995.
JAMES BITETTO, Vice President and Assistant Secretary since August 2005.
Senior Counsel of BNY Mellon and Secretary of the Manager, and an officer of 77 investment companies (comprised of 195 portfolios) managed by the Manager. He is 44 years old and has been an employee of the Manager since December 1996.
JONI LACKS CHARATAN, Vice President and Assistant Secretary since August 2005.
Senior Counsel of BNY Mellon, and an officer of 77 investment companies (comprised of 195 portfolios) managed by the Manager. She is 55 years old and has been an employee of the Manager since October 1988.
JOSEPH M. CHIOFFI, Vice President and Assistant Secretary since August 2005.
Senior Counsel of BNY Mellon, and an officer of 77 investment companies (comprised of 195 portfolios) managed by the Manager. He is 49 years old and has been an employee of the Manager since June 2000.
KATHLEEN DENICHOLAS, Vice President and Assistant Secretary since January 2010.
Senior Counsel of BNY Mellon, and an officer of 77 investment companies (comprised of 195 portfolios) managed by the Manager. She is 36 years old and has been an employee of the Manager since February 2001.
JANETTE E. FARRAGHER, Vice President and Assistant Secretary since August 2005.
Assistant General Counsel of BNY Mellon, and an officer of 77 investment companies (comprised of 195 portfolios) managed by the Manager. She is 47 years old and has been an employee of the Manager since February 1984.
38
JOHN B. HAMMALIAN, Vice President and Assistant Secretary since August 2005.
Managing Counsel of BNY Mellon, and an officer of 77 investment companies (comprised of 195 portfolios) managed by the Manager. He is 47 years old and has been an employee of the Manager since February 1991.
M. CRISTINA MEISER, Vice President and Assistant Secretary since January 2010.
Senior Counsel of BNY Mellon, and an officer of 77 investment companies (comprised of 195 portfolios) managed by the Manager. She is 40 years old and has been an employee of the Manager since August 2001.
ROBERT R. MULLERY, Vice President and Assistant Secretary since August 2005.
Managing Counsel of BNY Mellon, and an officer of 77 investment companies (comprised of 195 portfolios) managed by the Manager. He is 58 years old and has been an employee of the Manager since May 1986.
JEFF PRUSNOFSKY, Vice President and Assistant Secretary since August 2005.
Managing Counsel of BNY Mellon, and an officer of 77 investment companies (comprised of 195 portfolios) managed by the Manager. He is 45 years old and has been an employee of the Manager since October 1990.
JAMES WINDELS, Treasurer since November 2001.
Director – Mutual Fund Accounting of the Manager, and an officer of 77 investment companies (comprised of 195 portfolios) managed by the Manager. He is 52 years old and has been an employee of the Manager since April 1985.
RICHARD CASSARO, Assistant Treasurer since January 2008.
Senior Accounting Manager – Money Market and Municipal Bond Funds of the Manager, and an officer of 77 investment companies (comprised of 195 portfolios) managed by the Manager. He is 51 years old and has been an employee of the Manager since September 1982.
GAVIN C. REILLY, Assistant Treasurer since December 2005.
Tax Manager of the Investment Accounting and Support Department of the Manager, and an officer of 77 investment companies (comprised of 195 portfolios) managed by the Manager. He is 42 years old and has been an employee of the Manager since April 1991.
ROBERT ROBOL, Assistant Treasurer since December 2002.
Senior Accounting Manager – Fixed Income Funds of the Manager, and an officer of 77 investment companies (comprised of 195 portfolios) managed by the Manager. He is 46 years old and has been an employee of the Manager since October 1988.
ROBERT SALVIOLO, Assistant Treasurer since July 2007.
Senior Accounting Manager – Equity Funds of the Manager, and an officer of 77 investment companies (comprised of 195 portfolios) managed by the Manager. He is 43 years old and has been an employee of the Manager since June 1989.
TheFund 39
OFFICERS OF THE FUND (Unaudited) (continued)
ROBERT SVAGNA, Assistant Treasurer since August 2005.
Senior Accounting Manager – Equity Funds of the Manager, and an officer of 77 investment companies (comprised of 195 portfolios) managed by the Manager. He is 43 years old and has been an employee of the Manager since November 1990.
JOSEPH W. CONNOLLY, Chief Compliance Officer since October 2004.
Chief Compliance Officer of the Manager and The Dreyfus Family of Funds (77 investment companies, comprised of 195 portfolios). From November 2001 through March 2004, Mr. Connolly was first Vice-President, Mutual Fund Servicing for Mellon Global Securities Services. In that capacity, Mr. Connolly was responsible for managing Mellon’s Custody, Fund Accounting and Fund Administration services to third-party mutual fund clients. He is 53 years old and has served in various capacities with the Manager since 1980, including manager of the firm’s Fund Accounting Department from 1997 through October 2001.
NATALIA GRIBAS, Anti-Money Laundering Compliance Officer since July 2010.
Anti-Money Laundering Compliance Officer of the Distributor, and the Anti-Money Laundering Compliance Officer of 73 investment companies (comprised of 191 portfolios) managed by the Manager. She is 40 years old and has been an employee of the Distributor since September 2008.
40
Global Stock Fund
ANNUAL REPORT November 30, 2010

Save time. Save paper. View your next shareholder report online as soon as it’s available. Log into www.dreyfus.com and sign up for Dreyfus eCommunications. It’s simple and only takes a few minutes.
The views expressed in this report reflect those of the portfolio manager only through the end of the period covered and do not necessarily represent the views of Dreyfus or any other person in the Dreyfus organization. Any such views are subject to change at any time based upon market or other conditions and Dreyfus disclaims any responsibility to update such views.These views may not be relied on as investment advice and, because investment decisions for a Dreyfus fund are based on numerous factors, may not be relied on as an indication of trading intent on behalf of any Dreyfus fund.
| | Contents |
| | THE FUND |
| 2 | A Letter from the Chairman and CEO |
| 3 | Discussion of Fund Performance |
| 6 | Fund Performance |
| 8 | Understanding Your Fund’s Expenses |
| 8 | Comparing Your Fund’s Expenses With Those of Other Funds |
| 9 | Statement of Investments |
| 12 | Statement of Assets and Liabilities |
| 13 | Statement of Operations |
| 14 | Statement of Changes in Net Assets |
| 16 | Financial Highlights |
| 19 | Notes to Financial Statements |
| 30 | Report of Independent Registered Public Accounting Firm |
| 31 | Important Tax Information |
| 32 | Information About the Review and Approval of the Fund’s Management Agreement and Sub-Investment Advisory Agreement |
| 37 | Board Members Information |
| 40 | Officers of the Fund |
| | FOR MORE INFORMATION |
| | Back Cover |

A LETTER FROM THE CHAIRMAN AND CEO
Dear Shareholder:
We are pleased to present this annual report for Global Stock Fund, covering the twelve-month period from December 1, 2009, through November 30, 2010.
Stocks throughout the global markets delivered respectable returns during the reporting period, despite periodic bouts of market volatility stemming from economic uncertainty and events. Although GDP growth in most countries was positive throughout the reporting period, the global economic recovery has been milder than historical averages, in particular in the U.S. Most notably, heavy sovereign debt burdens recently renewed credit concerns in Europe, effectively barring some governments from adopting more stimulative fiscal policies. However, robust demand from the world’s emerging markets has taken up some of the slack, supporting corporate earnings and stock prices.
We are cautiously optimistic regarding global economic and market prospects in 2011. Global expansion should gain a degree of momentum, led by financially strong emerging markets countries, while “debt hangover” countries in the developed world may face continued economic challenges. Monetary policy remains stimulative in most markets, and inflation-adjusted interest rates and inflation remain low. So is your portfolio positioned accordingly given these recent global economic events? Talk with your financial advisor, who can help you evaluate your portfolio investments within the new global economic framework to help meet your individual investment needs and future capital goals.
For information about how the fund performed during the reporting period, as well as general market perspectives, we provide a Discussion of Fund Performance on the pages that follow.
Thank you for your continued confidence and support.
Jonathan R. Baum
Chairman and Chief Executive Officer
The Dreyfus Corporation
December 15, 2010
2

DISCUSSION OF FUND PERFORMANCE
For the period of December 1, 2009, through November 30, 2010, as provided by Jane Henderson and Roy Leckie ofWalter Scott & Partners Limited (Walter Scott), Sub-investment adviser
Fund and Market Performance Overview
For the 12-month period ended November 30, 2010, Global Stock Fund’s Class A shares achieved a return of 6.70%, Class C shares returned 5.90% and Class I shares returned 7.12%.1 In comparison, the fund’s benchmark index, the Morgan Stanley Capital International World Index (the “MSCIWorld Index”), achieved a 5.98% return over the same period.2
Despite early equity market declines, a slowly recovering worldwide economy and improving investor sentiment enabled global stocks to achieve reasonable gains, on average, over the full reporting period.The fund’s Class A and Class I shares produced returns that were higher than the MSCI World Index, due to the success of our bottom-up security selection in Europe and Asia.
The Fund’s Investment Approach
The fund seeks long-term real returns by investing in stocks of companies that are predominantly located in the world’s developed markets.When selecting stocks,Walter Scott seeks companies with fundamental strengths that indicate the potential for sustainable growth. The firm focuses on individual stock selection through extensive fundamental research. Candidates are initially selected for research if they meet certain broad absolute and trend criteria. Financial statements are analyzed in an effort to identify the nature of their cash generation and to understand the variables that add value to their businesses. Companies meeting the financial criteria are subjected to a detailed investigation of their products, cost and pricing, competition, industry position and outlook.
Heightened Volatility in a Slow-Growth Economy
Even as most developed markets remained mired in economic weakness, robust demand for goods and services from the emerging markets supported global manufacturing activity into the first quarter of 2010.
TheFund 3
DISCUSSION OF FUND PERFORMANCE (continued)
As a result, confidence improved among businesses, consumers and investors worldwide. However, investor sentiment deteriorated in the spring of 2010 due to a sovereign debt crisis in Europe, which required intervention by the International Monetary Fund and European Union in the fiscal affairs of Greece and, later, Ireland.An appreciating currency dampened exports in Japan, and high unemployment levels and weak housing markets constrained economic growth in the United States.
Fortunately, the effects of these concerns proved temporary, as still-strong demand from emerging markets and additional stimulative programs from certain central banks sparked a market rally later in the reporting period that more than erased previous losses. In addition, while macroeconomic fundamentals remained questionable, corporations around the world continued to boost their earnings in the wake of cost-cutting measures adopted during the downturn.
Security Selections Boosted Fund’s Results
The fund’s bottom-up security selection process proved particularly effective in Europe, where we avoided those companies most severely affected by the sovereign debt crisis. The fund scored individual successes among industry leaders such as Denmark-based pharmaceutical developer Novo Nordisk, a leader in the manufacturing of insulin, which is used in the treatment of diabetes.The fund also benefited from its investment in Switzerland-based inspection, testing, certification and verification specialist SGS, which gained value amid rising trade volumes. Another Swiss company, consumer product leader Nestlé, boosted the fund’s relative performance as the well-managed company captured greater market share in fast-growing emerging markets.
The fund’s winners in Asia included Japan-based industrial robotic automation specialist Fanuc, which benefited from the shift in China from human labor to machine-based. Hong Kong-based conglomerate Hutchison Whampoa gained value as the company improved profitability at its mobile telecommunications unit. One of China’s leading oil producers, CNOOC Limited, advanced as demand for energy in China intensified and the company discovered new sources of production.
As is to be expected in a volatile market environment, the fund encountered several disappointments during the reporting period. Chief among them was U.S. drug developer Gilead Sciences, which lagged market
4
averages despite reporting strong sales and earnings. U.S. medical devices maker Medtronic lost value when patients deferred hip replacement surgery in the sluggish economy. Finally, Brazilian energy company Petroleo Brasileiro lost value when the company issued new shares to finance new production, thereby diluting the value of existing shares.
Finding Opportunities Among Global Leaders
We expect the subpar global economic recovery to persist, with generally sluggish growth in developed markets and more robust expansion in emerging markets. However, we believe that robust corporate earnings growth may become more difficult to achieve as fewer opportunities for cost reductions present themselves. Rather, most companies in the year 2011 must increase revenues in order to achieve further bottom-line growth, which may be a difficult task in light of fiscal austerity measures in Europe and stubbornly weak housing and labor markets in the United States. Consequently, we have intensified our focus on global companies that, based on our analysis, can improve earnings either through leadership positions in their markets or ample pricing power. In our judgment, this strategy is particularly prudent in a global environment of persistent economic uncertainty.
December 15, 2010
| |
| | Equity funds are subject generally to market, market sector, market liquidity, issuer and investment |
| | style risks, among other factors, to varying degrees, all of which are more fully described in the |
| | fund’s prospectus. |
| | Investing internationally involves special risks, including changes in currency exchange rates, |
| | political, economic and social instability, a lack of comprehensive company information, differing |
| | auditing and legal standards and less market liquidity. |
| 1 | Total return includes reinvestment of dividends and any capital gains paid, and does not take into |
| | consideration the maximum initial sales charge in the case of Class A shares, or the applicable |
| | contingent deferred sales charge imposed on redemptions in the case of Class C shares. Had these |
| | charges been reflected, returns would have been lower. Past performance is no guarantee of future |
| | results. Share price and investment return fluctuate such that upon redemption, fund shares may be |
| | worth more or less than their original cost. |
| 2 | SOURCE: LIPPER INC. — Reflects reinvestment of net dividends and, where applicable, |
| | capital gain distributions.The Morgan Stanley Capital International (MSCI) World Index is an |
| | unmanaged index of global stock market performance, including the United States, Canada, |
| | Europe,Australia, New Zealand and the Far East. Investors cannot invest directly in any index. |
TheFund 5
FUND PERFORMANCE
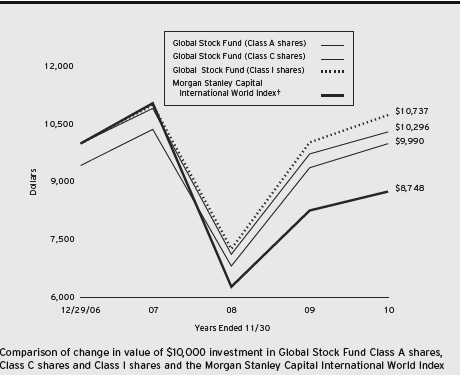
|
| † Source: Lipper Inc. |
| Past performance is not predictive of future performance. |
| The above graph compares a $10,000 investment made in Class A, Class C and Class I shares of Global Stock Fund |
| on 12/29/06 (inception date) to a $10,000 investment made in the Morgan Stanley Capital International World |
| Index (the “Index”) on that date. For comparative purposes, the value of the Index on 12/31/06 is used as the |
| beginning value on 12/29/06.All dividends and capital gain distributions are reinvested. |
| The fund’s performance shown in the line graph takes into account the maximum initial sales charge on Class A shares |
| and all other applicable fees and expenses on all classes.The Index is an unmanaged index of global stock market |
| performance, including the United States, Canada,Australia, New Zealand and the Far East and includes net dividends |
| reinvested. Unlike a mutual fund, the Index is not subject to charges, fees and other expenses. Investors cannot invest |
| directly in any index. Further information relating to fund performance, including expense reimbursements, if applicable, is |
| contained in the Financial Highlights section of the prospectus and elsewhere in this report. |
6
| | | |
| Average Annual Total Returns as of 11/30/10 | | |
| |
| | Inception | | From |
| | Date | 1 Year | Inception |
| Class A shares | | | |
| with maximum sales charge (5.75%) | 12/29/06 | 0.54% | –0.03% |
| without sales charge | 12/29/06 | 6.70% | 1.49% |
| Class C shares | | | |
| with applicable redemption charge † | 12/29/06 | 4.90% | 0.75% |
| without redemption | 12/29/06 | 5.90% | 0.75% |
| Class I shares | 12/29/06 | 7.12% | 1.83% |
| Morgan Stanley Capital | | | |
| International World Index†† | 12/31/06 | 5.98% | –3.36% |
Past performance is not predictive of future performance.The fund’s performance shown in the graph and table does not reflect the deduction of taxes that a shareholder would pay on fund distributions or the redemption of fund shares.
| |
| † | The maximum contingent deferred sales charge for Class C shares is 1% for shares redeemed within one year of the |
| | date of purchase. |
| †† | For comparative purposes, the value of the Index as of 12/31/06 is used as the beginning value on 12/29/06. |
TheFund 7
UNDERSTANDING YOUR FUND’S EXPENSES (Unaudited)
As a mutual fund investor, you pay ongoing expenses, such as management fees and other expenses. Using the information below, you can estimate how these expenses affect your investment and compare them with the expenses of other funds.You also may pay one-time transaction expenses, including sales charges (loads) and redemption fees, which are not shown in this section and would have resulted in higher total expenses. For more information, see your fund’s prospectus or talk to your financial adviser.
Review your fund’s expenses
The table below shows the expenses you would have paid on a $1,000 investment in Global Stock Fund from June 1, 2010 to November 30, 2010. It also shows how much a $1,000 investment would be worth at the close of the period, assuming actual returns and expenses.
Expenses and Value of a $1,000 Investment
assuming actual returns for the six months ended November 30, 2010
| | | |
| | Class A | Class C | Class I |
| Expenses paid per $1,000† | $ 6.99 | $ 10.99 | $ 5.09 |
| Ending value (after expenses) | $1,112.20 | $1,108.40 | $1,114.40 |
COMPARING YOUR FUND’S EXPENSES
WITH THOSE OF OTHER FUNDS (Unaudited)
Using the SEC’s method to compare expenses
The Securities and Exchange Commission (SEC) has established guidelines to help investors assess fund expenses. Per these guidelines, the table below shows your fund’s expenses based on a $1,000 investment, assuming a hypothetical 5% annualized return. You can use this information to compare the ongoing expenses (but not transaction expenses or total cost) of investing in the fund with those of other funds.All mutual fund shareholder reports will provide this information to help you make this comparison. Please note that you cannot use this information to estimate your actual ending account balance and expenses paid during the period.
Expenses and Value of a $1,000 Investment
assuming a hypothetical 5% annualized return for the six months ended November 30, 2010
| | | |
| | Class A | Class C | Class I |
| Expenses paid per $1,000† | $ 6.68 | $ 10.50 | $ 4.86 |
| Ending value (after expenses) | $1,018.45 | $1,014.64 | $1,020.26 |
|
| † Expenses are equal to the fund’s annualized expense ratio of 1.32% for Class A, 2.08% for Class C and .96% |
| for Class I, multiplied by the average account value over the period, multiplied by 183/365 (to reflect the one-half |
| year period). |
8
STATEMENT OF INVESTMENTS
November 30, 2010
| | |
| Common Stocks—96.1% | Shares | Value ($) |
| Australia—3.9% | | |
| CSL | 237,500 | 7,947,019 |
| Woodside Petroleum | 201,638 | 8,107,653 |
| | | 16,054,672 |
| Brazil—1.5% | | |
| Petroleo Brasileiro, ADR | 209,600 | 6,137,088 |
| Canada—1.9% | | |
| Suncor Energy | 235,700 | 7,916,746 |
| Denmark—1.9% | | |
| Novo Nordisk, Cl. B | 79,000 | 7,814,495 |
| France—3.4% | | |
| Cie Generale d’Optique Essilor International | 115,000 | 7,185,354 |
| L’Oreal | 66,100 | 7,029,651 |
| | | 14,215,005 |
| Hong Kong—8.9% | | |
| China Mobile | 678,000 | 6,762,450 |
| CLP Holdings | 940,500 | 7,739,495 |
| CNOOC | 3,993,000 | 8,659,530 |
| Hong Kong & China Gas | 1,916,255 | 4,678,909 |
| Hutchison Whampoa | 865,000 | 8,655,458 |
| | | 36,495,842 |
| Japan—18.5% | | |
| Canon | 157,800 | 7,438,416 |
| Chugai Pharmaceutical | 371,100 | 6,700,109 |
| Daikin Industries | 183,200 | 6,578,038 |
| Denso | 246,500 | 8,049,761 |
| FANUC | 64,400 | 9,226,383 |
| Honda Motor | 234,800 | 8,444,832 |
| Hoya | 180,000 | 4,245,669 |
| Keyence | 20,870 | 5,266,751 |
| Mitsubishi Estate | 477,000 | 8,047,843 |
| Nintendo | 24,300 | 6,599,821 |
| Shin-Etsu Chemical | 117,300 | 5,732,549 |
| | | 76,330,172 |
TheFund 9
STATEMENT OF INVESTMENTS (continued)
| | | |
| Common Stocks (continued) | Shares | | Value ($) |
| Singapore—1.4% | | | |
| DBS Group Holdings | 531,000 | | 5,630,325 |
| Spain—1.6% | | | |
| Inditex | 89,800 | | 6,767,725 |
| Sweden—2.0% | | | |
| Hennes & Mauritz, Cl. B | 239,000 | | 8,067,654 |
| Switzerland—5.3% | | | |
| Nestle | 150,000 | | 8,152,743 |
| Novartis | 100,600 | | 5,337,468 |
| SGS | 5,000 | | 8,185,124 |
| | | | 21,675,335 |
| United Kingdom—10.4% | | | |
| BG Group | 455,800 | | 8,234,744 |
| HSBC Holdings | 734,400 | | 7,405,685 |
| Reckitt Benckiser Group | 126,000 | | 6,663,556 |
| Standard Chartered | 326,025 | | 8,778,181 |
| Tesco | 1,051,000 | | 6,772,893 |
| WM Morrison Supermarkets | 1,200,500 | | 5,079,110 |
| | | | 42,934,169 |
| United States—35.4% | | | |
| Abbott Laboratories | 145,600 | | 6,771,856 |
| Adobe Systems | 297,500 | a | 8,249,675 |
| Amphenol, Cl. A | 85,000 | | 4,252,550 |
| Automatic Data Processing | 145,400 | | 6,480,478 |
| C.R. Bard | 79,700 | | 6,762,545 |
| Cisco Systems | 317,200 a | 6,077,552 |
| EOG Resources | 66,700 | | 5,932,965 |
| Fastenal | 105,000 | | 5,619,600 |
| FLIR Systems | 97,500 | a | 2,613,488 |
| Gilead Sciences | 178,400 | a | 6,511,600 |
| Google, Cl. A | 13,900 | a | 7,724,369 |
| Intel | 300,800 | | 6,352,896 |
| Johnson & Johnson | 102,700 | | 6,321,185 |
| MasterCard, Cl. A | 35,500 | | 8,414,565 |
| Medtronic | 197,600 | | 6,625,528 |
| Microsoft | 284,900 | | 7,182,329 |
10
| | |
| Common Stocks (continued) | Shares | Value ($) |
| United States (continued) | | |
| NIKE, Cl. B | 94,300 | 8,122,059 |
| Oracle | 273,300 | 7,390,032 |
| Precision Castparts | 56,800 | 7,842,376 |
| Schlumberger | 103,200 | 7,981,488 |
| Wal-Mart Stores | 122,200 | 6,609,798 |
| Walgreen | 175,800 | 6,126,630 |
| | | 145,965,564 |
| Total Common Stocks | | |
| (cost $349,524,620) | | 396,004,792 |
| |
| Other Investment—3.2% | | |
| Registered Investment Company; | | |
| Dreyfus Institutional Preferred Plus Money Market Fund | | |
| (cost $13,140,000) | 13,140,000 b | 13,140,000 |
| Total Investments (cost $362,664,620) | 99.3% | 409,144,792 |
| Cash and Receivables (Net) | .7% | 2,938,206 |
| Net Assets | 100.0% | 412,082,998 |
ADR—American Depository Receipts
| |
| a | Non-income producing security. |
| b | Investment in affiliated money market mutual fund. |
| | | |
| Portfolio Summary (Unaudited)† | | |
| |
| | Value (%) | | Value (%) |
| Technology | 21.4 | Financial Services | 7.2 |
| Health Care | 16.5 | Money Market Investment | 3.2 |
| Energy | 12.9 | Utilities | 3.0 |
| Consumer Staples | 11.3 | Telecommunication Services | 1.6 |
| Industrial | 11.2 | Materials | 1.4 |
| Consumer Discretionary | 9.6 | | 99.3 |
| |
| † Based on net assets. | | | |
| See notes to financial statements. | | | |
TheFund 11
STATEMENT OF ASSETS AND LIABILITIES
November 30, 2010
| | |
| | Cost | Value |
| Assets ($): | | |
| Investments in securities—See Statement of Investments: | | |
| Unaffiliated issuers | 349,524,620 | 396,004,792 |
| Affiliated issuers | 13,140,000 | 13,140,000 |
| Cash | | 915,884 |
| Cash denominated in foreign currencies | 158,356 | 158,538 |
| Receivable for investment securities sold | | 1,154,565 |
| Dividends and interest receivable | | 801,470 |
| Receivable for shares of Common Stock subscribed | | 440,550 |
| Unrealized appreciation on forward foreign | | |
| currency exchange contracts—Note 4 | | 132 |
| Prepaid expenses | | 28,370 |
| | | 412,644,301 |
| Liabilities ($): | | |
| Due to The Dreyfus Corporation and affiliates—Note 3(c) | | 357,958 |
| Payable for shares of Common Stock redeemed | | 131,950 |
| Unrealized depreciation on forward foreign | | |
| currency exchange contracts—Note 4 | | 167 |
| Accrued expenses | | 71,228 |
| | | 561,303 |
| Net Assets ($) | | 412,082,998 |
| Composition of Net Assets ($): | | |
| Paid-in capital | | 361,439,783 |
| Accumulated undistributed investment income—net | | 3,054,605 |
| Accumulated net realized gain (loss) on investments | | 1,094,500 |
| Accumulated net unrealized appreciation (depreciation) | | |
| on investments and foreign currency transactions | | 46,494,110 |
| Net Assets ($) | | 412,082,998 |
| | | |
| Net Asset Value Per Share | | | |
| | Class A | Class C | Class I |
| Net Assets ($) | 37,151,848 | 10,243,160 | 364,687,990 |
| Shares Outstanding | 2,859,606 | 801,802 | 27,737,843 |
| Net Asset Value Per Share ($) | 12.99 | 12.78 | 13.15 |
| |
| See notes to financial statements. | | | |
12
STATEMENT OF OPERATIONS
Year Ended November 30, 2010
| |
| Investment Income ($): | |
| Income: | |
| Cash dividends (net of $369,760 foreign taxes withheld at source): | |
| Unaffiliated issuers | 6,645,655 |
| Affiliated issuers | 19,589 |
| Interest | 1,149 |
| Total Income | 6,666,393 |
| Expenses: | |
| Management fee—Note 3(a) | 2,981,750 |
| Custodian fees—Note 3(c) | 179,207 |
| Shareholder servicing costs—Note 3(c) | 119,404 |
| Professional fees | 72,953 |
| Registration fees | 50,271 |
| Distribution fees—Note 3(b) | 48,024 |
| Directors’ fees and expenses—Note 3(d) | 29,501 |
| Prospectus and shareholders’ reports | 13,898 |
| Loan commitment fees—Note 2 | 3,808 |
| Miscellaneous | 25,705 |
| Total Expenses | 3,524,521 |
| Less—reduction in fees due to earnings credits—Note 3(c) | (84) |
| Net Expenses | 3,524,437 |
| Investment Income—Net | 3,141,956 |
| Realized and Unrealized Gain (Loss) on Investments—Note 4 ($): | |
| Net realized gain (loss) on investments and foreign currency transactions | 2,639,726 |
| Net realized gain (loss) on forward foreign currency exchange contracts | 51,988 |
| Net Realized Gain (Loss) | 2,691,714 |
| Net unrealized appreciation (depreciation) on | |
| investments and foreign currency transactions | 18,108,682 |
| Net unrealized appreciation (depreciation) on | |
| forward foreign currency exchange contracts | 2,425 |
| Net Unrealized Appreciation (Depreciation) | 18,111,107 |
| Net Realized and Unrealized Gain (Loss) on Investments | 20,802,821 |
| Net Increase in Net Assets Resulting from Operations | 23,944,777 |
| |
| See notes to financial statements. | |
TheFund 13
STATEMENT OF CHANGES IN NET ASSETS
| | |
| | Year Ended November 30, |
| | 2010 | 2009a |
| Operations ($): | | |
| Investment income—net | 3,141,956 | 1,768,472 |
| Net realized gain (loss) on investments | 2,691,714 | 1,576,357 |
| Net unrealized appreciation | | |
| (depreciation) on investments | 18,111,107 | 55,758,267 |
| Net Increase (Decrease) in Net Assets | | |
| Resulting from Operations | 23,944,777 | 59,103,096 |
| Dividends to Shareholders from ($): | | |
| Investment income—net: | | |
| Class A Shares | (42,464) | (8,168) |
| Class C Shares | (426) | — |
| Class I Shares | (1,883,788) | (425,048) |
| Total Dividends | (1,926,678) | (433,216) |
| Capital Stock Transactions ($): | | |
| Net proceeds from shares sold: | | |
| Class A Shares | 34,047,530 | 6,212,436 |
| Class C Shares | 9,123,000 | 1,048,689 |
| Class I Shares | 131,991,193 | 170,474,722 |
| Dividends reinvested: | | |
| Class A Shares | 41,282 | 5,829 |
| Class C Shares | 288 | — |
| Class I Shares | 533,463 | 166,872 |
| Cost of shares redeemed: | | |
| Class A Shares | (6,678,358) | (2,929,771) |
| Class C Shares | (1,069,292) | (230,707) |
| Class I Shares | (51,703,102) | (36,319,067) |
| Class T Shares | — | (18,311) |
| Increase (Decrease) in Net Assets | | |
| from Capital Stock Transactions | 116,286,004 | 138,410,692 |
| Total Increase (Decrease) in Net Assets | 138,304,103 | 197,080,572 |
| Net Assets ($): | | |
| Beginning of Period | 273,778,895 | 76,698,323 |
| End of Period | 412,082,998 | 273,778,895 |
| Undistributed investment income—net | 3,054,605 | 1,873,415 |
14
| | |
| | Year Ended November 30, |
| | 2010 | 2009a |
| Capital Share Transactions: | | |
| Class Ab | | |
| Shares sold | 2,722,607 | 565,715 |
| Shares issued for dividends reinvested | 3,318 | 628 |
| Shares redeemed | (537,677) | (268,802) |
| Net Increase (Decrease) in Shares Outstanding | 2,188,248 | 297,541 |
| Class C | | |
| Shares sold | 734,684 | 101,758 |
| Shares issued for dividends reinvested | 24 | — |
| Shares redeemed | (88,164) | (25,194) |
| Net Increase (Decrease) in Shares Outstanding | 646,544 | 76,564 |
| Class I | | |
| Shares sold | 10,475,370 | 16,917,733 |
| Shares issued for dividends reinvested | 42,507 | 17,847 |
| Shares redeemed | (4,112,607) | (3,682,516) |
| Net Increase (Decrease) in Shares Outstanding | 6,405,270 | 13,253,064 |
| Class Tb | | |
| Shares redeemed | — | (2,220) |
|
| a Effective as of the close of business on February 4, 2009, the fund no longer offers Class T shares. |
| b On the close of business on February 4, 2009, 2,220 Class T shares representing $18,311 were converted to 2,026 |
| Class A shares. |
See notes to financial statements.
TheFund 15
FINANCIAL HIGHLIGHTS
The following tables describe the performance for each share class for the fiscal periods indicated.All information (except portfolio turnover rate) reflects financial results for a single fund share.Total return shows how much your investment in the fund would have increased (or decreased) during each period, assuming you had reinvested all dividends and distributions.These figures have been derived from the fund’s financial statements.
| | | | |
| | | Year Ended November 30, | |
| Class A Shares | 2010 | 2009 | 2008 | 2007a |
| Per Share Data ($): | | | | |
| Net asset value, beginning of period | 12.23 | 8.91 | 13.73 | 12.50 |
| Investment Operations: | | | | |
| Investment income—netb | .07 | .06 | .05 | .04 |
| Net realized and unrealized | | | | |
| gain (loss) on investments | .75 | 3.28 | (4.70) | 1.19 |
| Total from Investment Operations | .82 | 3.34 | (4.65) | 1.23 |
| Distributions: | | | | |
| Dividends from investment income—net | (.06) | (.02) | (.08) | — |
| Dividends from net realized | | | | |
| gain on investments | — | — | (.09) | — |
| Total Distributions | (.06) | (.02) | (.17) | — |
| Net asset value, end of period | 12.99 | 12.23 | 8.91 | 13.73 |
| Total Return (%)c | 6.70 | 37.57 | (34.32) | 9.92d |
| Ratios/Supplemental Data (%): | | | | |
| Ratio of total expenses to average net assets | 1.32 | 1.38 | 1.59 | 2.40e |
| Ratio of net expenses to average net assets | 1.32 | 1.38 | 1.47 | 1.46e |
| Ratio of net investment income | | | | |
| to average net assets | .56 | .53 | .44 | .29e |
| Portfolio Turnover Rate | 7.50 | 12.75 | 15.54 | 14.53d |
| Net Assets, end of period ($ x 1,000) | 37,152 | 8,212 | 3,329 | 5,132 |
| |
| a | From December 29, 2006 (commencement of operations) to November 30, 2007. |
| b | Based on average shares outstanding at each month end. |
| c | Exclusive of sales charge. |
| d | Not annualized. |
| e | Annualized. |
See notes to financial statements.
16
| | | | |
| | | Year Ended November 30, | |
| Class C Shares | 2010 | 2009 | 2008 | 2007a |
| Per Share Data ($): | | | | |
| Net asset value, beginning of period | 12.07 | 8.83 | 13.64 | 12.50 |
| Investment Operations: | | | | |
| Investment (loss)—netb | (.02) | (.01) | (.04) | (.06) |
| Net realized and unrealized | | | | |
| gain (loss) on investments | .73 | 3.25 | (4.68) | 1.20 |
| Total from Investment Operations | .71 | 3.24 | (4.72) | 1.14 |
| Distributions: | | | | |
| Dividends from investment income—net | (.00)c | — | — | — |
| Dividends from net realized | | | | |
| gain on investments | — | — | (.09) | — |
| Total Distributions | (.00)c | — | (.09) | — |
| Net asset value, end of period | 12.78 | 12.07 | 8.83 | 13.64 |
| Total Return (%)d | 5.90 | 36.69 | (34.82) | 9.12e |
| Ratios/Supplemental Data (%): | | | | |
| Ratio of total expenses to average net assets | 2.09 | 2.12 | 2.36 | 3.16f |
| Ratio of net expenses to average net assets | 2.09 | 2.09 | 2.22 | 2.20f |
| Ratio of net investment (loss) | | | | |
| to average net assets | (.17) | (.11) | (.29) | (.46)f |
| Portfolio Turnover Rate | 7.50 | 12.75 | 15.54 | 14.53e |
| Net Assets, end of period ($ x 1,000) | 10,243 | 1,873 | 695 | 925 |
| |
| a | From December 29, 2006 (commencement of operations) to November 30, 2007. |
| b | Based on average shares outstanding at each month end. |
| c | Amount represents less than $.01 per share. |
| d | Exclusive of sales charge. |
| e | Not annualized. |
| f | Annualized. |
See notes to financial statements.
TheFund 17
FINANCIAL HIGHLIGHTS (continued)
| | | | |
| | | Year Ended November 30, | |
| Class I Shares | 2010 | 2009 | 2008 | 2007a,b |
| Per Share Data ($): | | | | |
| Net asset value, beginning of period | 12.36 | 8.99 | 13.76 | 12.50 |
| Investment Operations: | | | | |
| Investment income—netc | .12 | .11 | .10 | .07 |
| Net realized and unrealized | | | | |
| gain (loss) on investments | .76 | 3.31 | (4.76) | 1.19 |
| Total from Investment Operations | .88 | 3.42 | (4.66) | 1.26 |
| Distributions: | | | | |
| Dividends from investment income—net | (.09) | (.05) | (.02) | — |
| Dividends from net realized | | | | |
| gain on investments | — | — | (.09) | — |
| Total Distributions | (.09) | (.05) | (.11) | — |
| Net asset value, end of period | 13.15 | 12.36 | 8.99 | 13.76 |
| Total Return (%) | 7.12 | 38.22 | (34.12) | 10.08d |
| Ratios/Supplemental Data (%): | | | | |
| Ratio of total expenses to average net assets | .96 | .99 | 1.17 | 2.05e |
| Ratio of net expenses to average net assets | .96 | .99 | 1.15 | 1.18e |
| Ratio of net investment income | | | | |
| to average net assets | .94 | 1.05 | .83 | .58e |
| Portfolio Turnover Rate | 7.50 | 12.75 | 15.54 | 14.53d |
| Net Assets, end of period ($ x 1,000) | 364,688 | 263,694 | 72,656 | 18,312 |
| |
| a | From December 29, 2006 (commencement of operations) to November 30, 2007. |
| b | Effective June 1, 2007, Class R shares were redesignated as Class I shares. |
| c | Based on average shares outstanding at each month end. |
| d | Not annualized. |
| e | Annualized. |
See notes to financial statements.
18
NOTES TO FINANCIAL STATEMENTS
NOTE 1—Significant Accounting Policies:
Global Stock Fund (the “fund”) is a separate diversified series of Strategic Funds, Inc. (the “Company”) which is registered under the Investment Company Act of 1940, as amended (the “Act”), as an open-end management investment company and operates as a series company currently offering ten series, including the fund.The fund’s investment objective is to seek long-term total return. The Dreyfus Corporation (the “Manager” or “Dreyfus”), a wholly-owned subsidiary of The Bank of New York Mellon Corporation (“BNY Mellon”), serves as the fund’s investment adviser. Walter Scott & Partners Limited (“Walter Scott”), a subsidiary of BNY Mellon and an affiliate of Dreyfus, serves as the fund’s sub-investment adviser.
MBSC Securities Corporation (the “Distributor”), a wholly-owned subsidiary of Dreyfus, is the distributor of the fund’s shares.The fund is authorized to issue 100 million shares of $.001 par value Common Stock in each of the following classes of shares: Class A, Class C and Class I. Class A shares are subject to a sales charge imposed at the time of purchase. Class C shares are subject to a contingent deferred sales charge (“CDSC”) on Class C shares redeemed within one year of purchase. Class I shares are sold at net asset value per share only to institutional investors. Other differences between the classes include the services offered to and the expenses borne by each class, the allocation of certain transfer agency costs and certain voting rights. Income, expenses (other than expenses attributable to a specific class), and realized and unrealized gains or losses on investments are alloc ated to each class of shares based on its relative net assets.
The Company accounts separately for the assets, liabilities and operations of each series. Expenses directly attributable to each series are charged to that series’ operations; expenses which are applicable to all series are allocated among them on a pro rata basis.
The Financial Accounting Standards Board (“FASB”) Accounting Standards Codification (“ASC”) is the exclusive reference of authoritative U.S. generally accepted accounting principles (“GAAP”) recognized
TheFund 19
NOTES TO FINANCIAL STATEMENTS (continued)
by the FASB to be applied by nongovernmental entities. Rules and interpretive releases of the Securities and Exchange Commission (“SEC”) under authority of federal laws are also sources of authoritative GAAP for SEC registrants. The fund’s financial statements are prepared in accordance with GAAP, which may require the use of management estimates and assumptions.Actual results could differ from those estimates.
The Company enters into contracts that contain a variety of indemnifications.The fund’s maximum exposure under these arrangements is unknown.The fund does not anticipate recognizing any loss related to these arrangements.
(a) Portfolio valuation: Investments in securities are valued at the last sales price on the securities exchange or national securities market on which such securities are primarily traded. Securities listed on the National Market System for which market quotations are available are valued at the official closing price or, if there is no official closing price that day, at the last sales price. Securities not listed on an exchange or the national securities market, or securities for which there were no transactions, are valued at the average of the most recent bid and asked prices, except for open short positions, where the asked price is used for valuation purposes. Bid price is used when no asked price is available. Registered investment companies that are not traded on an exchange are valued at their net asset value.When market quotations or official closing prices are not readily available, or are determined not to reflect accurately fair value, such as when the value of a security has been significantly affected by events after the close of the exchange or market on which the security is principally traded (for example, a foreign exchange or market), but before the fund calculates its net asset value, the fund may value these investments at fair value as determined in accordance with the procedures approved by the Board of Directors. Fair valuing of securities may be determined with the assistance of a pricing service using calculations based on indices of domestic securities and other appropriate indicators, such as prices of relevant ADRs and futures contracts. For other securities that are fair valued by the Board of Directors, certain
20
factors may be considered such as: fundamental analytical data, the nature and duration of restrictions on disposition, an evaluation of the forces that influence the market in which the securities are purchased and sold and public trading in similar securities of the issuer or comparable issuers. Investments denominated in foreign currencies are translated to U.S. dollars at the prevailing rates of exchange. Forward foreign currency exchange contracts (“forward contracts”) are valued at the forward rate.
The fair value of a financial instrument is the amount that would be received to sell an asset or paid to transfer a liability in an orderly transaction between market participants at the measurement date (i.e. the exit price). GAAP establishes a fair value hierarchy that prioritizes the inputs of valuation techniques used to measure fair value.This hierarchy gives the highest priority to unadjusted quoted prices in active markets for identical assets or liabilities (Level 1 measurements) and the lowest priority to unobservable inputs (Level 3 measurements).
Additionally, GAAP provides guidance on determining whether the volume and activity in a market has decreased significantly and whether such a decrease in activity results in transactions that are not orderly. GAAP requires enhanced disclosures around valuation inputs and techniques used during annual and interim periods.
Various inputs are used in determining the value of the fund’s investments relating to fair value measurements.These inputs are summarized in the three broad levels listed below:
Level 1—unadjusted quoted prices in active markets for identical investments.
Level 2—other significant observable inputs (including quoted prices for similar investments, interest rates, prepayment speeds, credit risk, etc.).
Level 3—significant unobservable inputs (including the fund’s own assumptions in determining the fair value of investments).
TheFund 21
NOTES TO FINANCIAL STATEMENTS (continued)
The inputs or methodology used for valuing securities are not necessarily an indication of the risk associated with investing in those securities.
The following is a summary of the inputs used as of November 30, 2010 in valuing the fund’s investments:
| | | | |
| | | Level 2—Other | Level 3— | |
| | Level 1— | Significant | Significant | |
| | Unadjusted | Observable | Unobservable | |
| | Quoted Prices | Inputs | Inputs | Total |
| Assets ($) | | | | |
| Investments in Securities: | | | |
| Equity Securities— | | | | |
| Domestic† | 145,965,564 | — | — | 145,965,564 |
| Equity Securities— | | | | |
| Foreign† | 250,039,228 | — | — | 250,039,228 |
| Mutual Funds | 13,140,000 | — | — | 13,140,000 |
| Other Financial | | | | |
| Instruments: | | | | |
| Forward Foreign | | | | |
| Currency Exchange | | | |
| Contracts†† | — | 132 | — | 132 |
| Liabilities ($) | | | | |
| Other Financial | | | | |
| Instruments: | | | | |
| Forward Foreign | | | | |
| Currency Exchange | | | |
| Contracts†† | — | (167) | — | (167) |
| |
| † | See Statement of Investments for additional detailed categorizations. |
| †† | Amount shown represents unrealized appreciation (depreciation) at period end. |
In January 2010, FASB issued Accounting Standards Update (“ASU”) No. 2010-06 “Improving Disclosures about FairValue Measurements”. The portions of ASU No. 2010-06 which require reporting entities to prepare new disclosures surrounding amounts and reasons for significant transfers in and out of Level 1 and Level 2 fair value measurements as well as inputs and valuation techniques used to measure fair value for both recurring and nonrecurring fair value measurements that fall in either Level 2 or Level 3 have been adopted by the fund. No significant transfers between Level 1 or Level 2 fair value measurements occurred at November 30, 2010. The remaining portion of ASU No. 2010-06
22
requires reporting entities to make new disclosures about information on purchases, sales, issuances and settlements on a gross basis in the reconciliation of activity in Level 3 fair value measurements. These new and revised disclosures are required to be implemented for fiscal years beginning after December 15, 2010. Management is currently evaluating the impact that the adoption of this remaining portion of ASU No. 2010-06 may have on the fund’s financial statement disclosures.
(b) Foreign currency transactions: The fund does not isolate that portion of the results of operations resulting from changes in foreign exchange rates on investments from the fluctuations arising from changes in market prices of securities held. Such fluctuations are included with the net realized and unrealized gain or loss on investments.
Net realized foreign exchange gains or losses arise from sales of foreign currencies, currency gains or losses realized on securities transactions between trade and settlement date and the difference between the amounts of dividends, interest and foreign withholding taxes recorded on the fund’s books and the U.S. dollar equivalent of the amounts actually received or paid. Net unrealized foreign exchange gains and losses arise from changes in the value of assets and liabilities other than investments resulting from changes in exchange rates. Foreign currency gains and losses on investments are included with net realized and unrealized gain or loss on investments.
(c) Securities transactions and investment income: Securities transactions are recorded on a trade date basis. Realized gains and losses from securities transactions are recorded on the identified cost basis. Dividend income is recognized on the ex-dividend date and interest income, including, where applicable, accretion of discount and amortization of premium on investments, is recognized on the accrual basis.
Investing in foreign markets may involve special risks and considerations not typically associated with investing in the U.S. These risks include revaluation of currencies, high rates of inflation, repatriation restrictions on income and capital, and adverse political and economic
TheFund 23
NOTES TO FINANCIAL STATEMENTS (continued)
developments. Moreover, securities issued in these markets may be less liquid, subject to government ownership controls and delayed settlements, and their prices may be more volatile than those of comparable securities in the U.S.
(d) Affiliated issuers: Investments in other investment companies advised by Dreyfus are defined as “affiliated” in the Act.
The fund may invest in shares of certain affiliated investment companies also advised or managed by Dreyfus. Investments in affiliated investment companies for the period ended November 30, 2010 were as follows:
| | | | | |
| Affiliated | | | | | |
| Investment | Value | | | Value | Net |
| Company | 11/30/2009 ($) | Purchases ($) | Sales ($) | 11/30/2010 ($) | Assets (%) |
| Dreyfus | | | | | |
| Institutional | | | | | |
| Preferred | | | | | |
| Plus Money | | | | | |
| Market Fund | 7,100,000 | 119,440,000 | 113,400,000 | 13,140,000 | 3.2 |
(e) Dividends to shareholders: Dividends are recorded on the ex-dividend date. Dividends from investment income-net and dividends from net realized capital gains, if any, are normally declared and paid annually, but the fund may make distributions on a more frequent basis to comply with the distribution requirements of the Internal Revenue Code of 1986, as amended (the “Code”).To the extent that net realized capital gains can be offset by capital loss carryovers, it is the policy of the fund not to distribute such gains. Income and capital gain distributions are determined in accordance with income tax regulations, which may differ from GAAP.
(f) Federal income taxes: It is the policy of the fund to continue to qualify as a regulated investment company, if such qualification is in the best interests of its shareholders, by complying with the applicable provisions of the Code, and to make distributions of taxable income sufficient to relieve it from substantially all federal income and excise taxes.
24
As of and during the period ended November 30, 2010, the fund did not have any liabilities for any uncertain tax positions.The fund recognizes interest and penalties, if any, related to uncertain tax positions as income tax expense in the Statement of Operations. During the period, the fund did not incur any interest or penalties.
Each of the tax years in the four-year period ended November 30, 2010 remains subject to examination by the Internal Revenue Service and state taxing authorities.
At November 30, 2010, the components of accumulated earnings on a tax basis were as follows: undistributed ordinary income $3,937,918, undistributed capital gains $428,152 and unrealized appreciation $46,277,145.
The tax character of distributions paid to shareholders during the fiscal periods ended November 30, 2010 and November 30, 2009 were as follows: ordinary income $1,926,678 and $433,216, respectively.
During the period ended November 30, 2010, as a result of permanent book to tax differences, primarily due to the tax treatment for foreign currency gains and losses, the fund decreased accumulated undistributed investment income-net by $34,088 and increased accumulated net realized gain (loss) on investments by the same amount. Net assets and net asset value per share were not affected by this reclassification.
NOTE 2—Bank Lines of Credit:
The fund participates with other Dreyfus-managed funds in a $225 million unsecured credit facility led by Citibank, N.A. and a $300 million unsecured credit facility provided by The Bank of New York Mellon, a subsidiary of BNY Mellon and an affiliate of Dreyfus (each, a “Facility”), each to be utilized primarily for temporary or emergency purposes, including the financing of redemptions. In connection
TheFund 25
NOTES TO FINANCIAL STATEMENTS (continued)
therewith, the fund has agreed to pay its pro rata portion of commitment fees for each Facility. Interest is charged to the fund based on rates determined pursuant to the terms of the respective Facility at the time of borrowing. During the period ended November 30, 2010, the fund did not borrow under the Facilities.
NOTE 3—Management Fee, Sub-Investment Advisory Fee and Other Transactions With Affiliates:
(a) Pursuant to a management agreement with Dreyfus, the management fee is computed at the annual rate of .85% of the value of the fund’s average daily net assets and is payable monthly. Dreyfus has contractually agreed, until April 1, 2011, to waive receipt of its fees and/or assume the expenses of the fund so that annual fund operating expenses (excluding Rule 12b-1 fees, shareholder services fees, taxes, interest, brokerage commissions, commitment fees on borrowings and extraordinary expenses) do not exceed 1.25% of the value of the fund’s average daily net assets. During the period ended November 30, 2010, there was no reduction in management fee pursuant to the undertaking.
During the period ended November 30, 2010, the Distributor retained $23,277 from commissions earned on sales of the fund’s Class A shares and $5,077 from CDSCs on redemptions of the fund’s Class C shares.
Pursuant to a sub-investment advisory agreement between Dreyfus and Walter Scott, Dreyfus pays Walter Scott a monthly fee at an annual percentage of the fund’s average daily net assets.
(b) Under the Distribution Plan (the “Plan”) adopted pursuant to Rule 12b-1 under the Act, Class C shares pay the Distributor for distributing its shares at an annual rate of .75% of the value of the average daily net assets of Class C shares. During the period ended November 30, 2010, Class C shares were charged $48,024, pursuant to the Plan.
(c) Under the Shareholder Services Plan, Class A and Class C shares pay the Distributor at an annual rate of .25% of the value of their average daily net assets for the provision of certain services. The services provided may include personal services relating to shareholder
26
accounts, such as answering shareholder inquiries regarding Class A and Class C shares and providing reports and other information, and services related to the maintenance of shareholder accounts. The Distributor may make payments to Service Agents (a securities dealer, financial institution or other industry professional) in respect of these services.The Distributor determines the amounts to be paid to Service Agents. During the period ended November 30, 2010, Class A and Class C shares were charged $57,248 and $16,008, respectively, pursuant to the Shareholder Services Plan.
The fund compensates Dreyfus Transfer, Inc., a wholly-owned subsidiary of Dreyfus, under a transfer agency agreement for providing personnel and facilities to perform transfer agency services for the fund. During the period ended November 30, 2010, the fund was charged $11,830 pursuant to the transfer agency agreement, which is included in Shareholder servicing costs in the Statement of Operations.
The fund has arrangements with the custodian and cash management bank whereby the fund may receive earnings credits when positive cash balances are maintained, which are used to offset custody and cash management fees. For financial reporting purposes, the fund includes net earnings credits as an expense offset in the Statement of Operations.
The fund compensates The Bank of New York Mellon under a cash management agreement for performing cash management services related to fund subscriptions and redemptions. During the period ended November 30, 2010, the fund was charged $1,375 pursuant to the cash management agreement, which is included in Shareholder servicing costs in the Statement of Operations. These fees were partially offset by earnings credits of $84.
The fund also compensates The Bank of New York Mellon under a custody agreement for providing custodial services for the fund. During the period ended November 30, 2010, the fund was charged $179,207 pursuant to the custody agreement.
TheFund 27
NOTES TO FINANCIAL STATEMENTS (continued)
During the period ended November 30, 2010, the fund was charged $6,399 for services performed by the Chief Compliance Officer.
The components of “Due to The Dreyfus Corporation and affiliates” in the Statement of Assets and Liabilities consist of: management fees $293,847, Rule 12b-1 distribution plan fees $6,342, shareholder services plan fees $9,654, custodian fees $43,663, chief compliance officer fees $1,152 and transfer agency per account fees $3,300.
(d) Each Board member also serves as a Board member of other funds within the Dreyfus complex. Annual retainer fees and attendance fees are allocated to each fund based on net assets.
NOTE 4—Securities Transactions:
The aggregate amount of purchases and sales of investment securities, excluding short-term securities and forward contracts, during the period ended November 30, 2010, amounted to $134,246,721 and $25,092,638, respectively.
The provisions of ASC Topic 815 “Derivatives and Hedging” require qualitative disclosures about objectives and strategies for using derivatives, quantitative disclosures about fair value amounts of gains and losses on derivative instruments and disclosures about credit-risk-related contingent features in derivative agreements. The disclosure requirements distinguish between derivatives, which are accounted for as “hedges” and those that do not qualify for hedge accounting. Because investment companies value their derivatives at fair value and recognize changes in fair value through the Statement of Operations, they do not qualify for such accounting. Accordingly, even though a fund’s investments in derivatives may represent economic hedges, they are considered to be non-hedge transactions for purposes of this disclosure.
Forward Foreign Currency Exchange Contracts: The fund enters into forward contracts in order to hedge its exposure to changes in foreign currency exchange rates on its foreign portfolio holdings, to settle foreign currency transactions or as a part of its investment strategy. When executing forward contracts, the fund is obligated to buy or sell a foreign currency at a specified rate on a certain date in the future.
28
With respect to sales of forward contracts, the fund incurs a loss if the value of the contract increases between the date the forward contract is opened and the date the forward contract is closed.The fund realizes a gain if the value of the contract decreases between those dates.With respect to purchases of forward contracts, the fund incurs a loss if the value of the contract decreases between the date the forward contract is opened and the date the forward contract is closed.The fund realizes a gain if the value of the contract increases between those dates. Any realized gain or loss which occurred during the period is reflected in the Statement of Operations.The fund is exposed to foreign currency risk as a result of changes in value of underlying financial instruments. The fund is also exposed to credit risk associated with counterparty nonperformance on these forward contracts, which is typically limited to the unrealized gain on each open contract.The following summarizes open forward contracts at November 30, 2010:
| | | | |
| | Foreign | | | Unrealized |
| Forward Foreign Currency | Currency | | | Appreciation |
| Exchange Contracts | Amounts | Proceeds ($) | Value ($) (Depreciation) ($) |
| Sales: | | | | |
| Hong Kong Dollar, | | | | |
| Expiring 12/1/2010 | 5,703,712 | 734,664 | 734,532 | 132 |
| Hong Kong Dollar, | | | | |
| Expiring 12/2/2010 | 3,261,604 | 419,866 | 420,033 | (167) |
| Gross Unrealized | | | | |
| Appreciation | | | | 132 |
| Gross Unrealized | | | | |
| Depreciation | | | | (167) |
The following summarizes the average market value of derivatives outstanding during the period ended November 30, 2010:
| |
| | Value ($) |
| Forward Contracts | 207,923 |
At November 30, 2010, the cost of investments for federal income tax purposes was $362,881,585; accordingly, accumulated net unrealized appreciation on investments was $46,263,207, consisting of $54,759,040 gross unrealized appreciation and $8,495,833 gross unrealized depreciation.
TheFund 29
REPORT OF INDEPENDENT REGISTERED
PUBLIC ACCOUNTING FIRM
Shareholders and Board of Directors
Global Stock Fund
We have audited the accompanying statement of assets and liabilities, including the statement of investments, of Global Stock Fund (one of the series comprising Strategic Funds, Inc.) as of November 30, 2010, and the related statement of operations for the year then ended, the statement of changes in net assets for each of the two years in the period then ended and financial highlights for each of the periods indicated therein.These financial statements and financial highlights are the responsibility of the Fund’s management. Our responsibility is to express an opinion on these financial statements and financial highlights based on our audits.
We conducted our audits in accordance with the standards of the Public Company Accounting Oversight Board (United States).Those standards require that we plan and perform the audit to obtain reasonable assurance about whether the financial statements and financial highlights are free of material misstatement.We were not engaged to perform an audit of the Fund’s internal control over financial reporting. Our audits included consideration of internal control over financial reporting as a basis for designing audit procedures that are appropriate in the circumstances, but not for the purpose of expressing an opinion on the effectiveness of the Fund’s internal control over financial reporting. Accordingly, we express no such opinion.An audit also includes examining, on a test basis, evidence supporting the amounts and disclosures in the financial statements and financial highlights, assessing the accounting p rinciples used and significant estimates made by management, and evaluating the overall financial statement presentation. Our procedures included confirmation of securities owned as of November 30, 2010 by correspondence with the custodian and others. We believe that our audits provide a reasonable basis for our opinion.
In our opinion, the financial statements and financial highlights referred to above present fairly, in all material respects, the financial position of Global Stock Fund at November 30, 2010, the results of its operations for the year then ended, the changes in its net assets for each of the two years in the period then ended and the financial highlights for each of the indicated periods, in conformity with U.S. generally accepted accounting principles.

New York, New York
January 25, 2011
30
IMPORTANT TAX INFORMATION (Unaudited)
In accordance with federal tax law, the fund elects to provide each shareholder with their portion of the fund’s foreign taxes paid and the income sourced from foreign countries. Accordingly, the fund hereby makes the following designations regarding its fiscal year ended November 30, 2010:
—the total amount of taxes paid to foreign countries was $369,760
—the total amount of income sourced from foreign countries was $5,185,328.
Where required by federal tax law rules, shareholders will receive notification of their proportionate share of foreign taxes paid and foreign sourced income for the 2010 calendar year with Form 1099-DIV which will be mailed in early 2011.
For the fiscal year ended November 30, 2010, certain dividends paid by the fund may be subject to a maximum tax rate of 15%, as provided for by the Jobs and Growth Tax Relief Reconciliation Act of 2003. Of the distributions paid during the fiscal year, $1,926,678 represents the maximum amount that may be considered qualified dividend income.
TheFund 31
INFORMATION ABOUT THE REVIEW AND APPROVAL
OF THE FUND’S MANAGEMENT AGREEMENT AND
SUB-INVESTMENT ADVISORY AGREEMENT (Unaudited)
At a meeting of the fund’s Board of Directors held on November 8-9, 2010, the Board considered the renewal of the fund’s Management Agreement with Dreyfus pursuant to which Dreyfus provides the fund with investment advisory and administrative services, and of Dreyfus’ Sub-Investment Advisory Agreement with Walter Scott & Partners Limited (“Walter Scott”)(the “Sub-Advisory Agreement”), pursuant to which Walter Scott serves as sub-investment adviser and provides day-to-day management of the fund’s portfolio (collectively, the “Agreements”). The Board members, none of whom are “interested persons” (as defined in the Investment Company Act of 1940, as amended) of the fund, were assisted in their review by independent legal counsel and met with counsel in executive session separate from representatives of Dreyfus and Walter Scott. In considering the renewa l of the Agreements, the Board considered all factors that it believed to be relevant, including those discussed below.The Board did not identify any one factor as dispositive, and each Board member may have attributed different weights to the factors considered.
Analysis of Nature, Extent and Quality of Services Provided to the Fund.The Board members considered information previously provided to them in a presentation from representatives of Dreyfus regarding the nature, extent, and quality of the services provided to funds in the Dreyfus fund complex, and by Walter Scott to the fund pursuant to the Sub-Advisory Agreement, and representatives of Dreyfus and Walter Scott confirmed that there had been no material changes in this information. Dreyfus provided the number of open accounts in the fund, the fund’s asset size and the allocation of fund assets among distribution channels. Dreyfus also had previously provided information regarding the diverse intermediary relationships and distribution channels of funds in the Dreyfus fund complex and Dreyfus’ corresponding need for broad, d eep, and diverse resources to be able to provide ongoing shareholder services to each distribution channel, including the distribution channel(s) for the fund.
32
The Board members also considered research support available to, and portfolio management capabilities of, the fund’s portfolio management personnel and that Dreyfus also provides oversight of day-to-day fund operations, including fund accounting and administration and assistance in meeting legal and regulatory requirements.The Board members also considered Dreyfus’ extensive administrative, accounting, and compliance infrastructures, and Dreyfus’ supervisory activities over Walter Scott. The Board also considered portfolio management’s brokerage policies and practices (including policies and practices regarding soft dollars) and the standards applied in seeking best execution.
Comparative Analysis of the Fund’s Performance and Management Fee and Expense Ratio.The Board members reviewed reports prepared by Lipper, Inc. (“Lipper”), an independent provider of investment company data, which included information comparing (1) the fund’s performance with the performance of a group of comparable funds (the “Performance Group”) and with a broader group of funds (the “Performance Universe”), all for various periods ended September 30, 2010, and (2) the fund’s actual and contractual management fees and total expenses with those of a group of comparable funds (the “Expense Group”) and with a broader group of funds (the “Expense Universe”), the information for which was derived in part from fund financial statements available to Lipper as of September 30 , 2010. Dreyfus previously had furnished the Board with a description of the methodology Lipper used to select the Performance Group and Performance Universe and the Expense Group and Expense Universe.
Dreyfus representatives stated that the usefulness of performance comparisons may be affected by a number of factors, including different investment limitations that may be applicable to the fund and comparison funds.The Board members discussed the results of the comparisons and noted that the fund’s total return performance was above the
TheFund 33
INFORMATION ABOUT THE REVIEW AND APPROVAL OF THE
FUND’S MANAGEMENT AGREEMENT AND SUB-INVESTMENT
ADVISORY AGREEMENT (Unaudited) (continued)
Performance Group and Performance Universe medians for the various periods, except for the 1-year period when the fund’s performance was below the Performance Universe median.
The Board also noted that the fund ranked first in the Performance Group for the 2-year and 3-year periods, and ranked second in the Performance Universe for the 3-year period. Dreyfus also provided a comparison of the fund’s calendar year total returns to the returns of the fund’s benchmark index.
The Board members also reviewed the range of actual and contractual management fees and total expenses of the Expense Group and Expense Universe funds and discussed the results of the comparisons. They noted that the fund’s contractual management fee was below the Expense Group median, the fund’s actual management fee approximated the Expense Group median and was above the Expense Universe median, and the fund’s total expenses were below the Expense Group and Expense Universe medians.
Representatives of Dreyfus reviewed with the Board members the management or investment advisory fees paid to Dreyfus, Walter Scott, or their affiliates by funds in the same Lipper category as the fund (the “Similar Accounts”), and they explained the nature of the Similar Accounts. Representatives of Dreyfus noted that there were no institutional separate accounts managed by Dreyfus or Walter Scott considered to have similar investment strategies and policies as the fund. They discussed differences in fees paid and the relationship of the fees paid in light of any differences in the services provided and other relevant factors. The Board members considered the relevance of the fee information provided for the Similar Accounts to evaluate the appropriateness and reasonableness of the fund’s management fee.
The Board considered the fee toWalter Scott in relation to the fee paid to Dreyfus by the fund and the respective services provided by Walter Scott and Dreyfus.The Board also noted Walter Scott’s fee is paid by Dreyfus (out of its fee from the fund) and not the fund.
34
Analysis of Profitability and Economies of Scale. Dreyfus’ representatives reviewed the expenses allocated and profit received by Dreyfus and the resulting profitability percentage for managing the fund, and the method used to determine the expenses and profit. The Board concluded that the profitability results were not unreasonable given the services rendered and service levels provided by Dreyfus.The Board previously had been provided with information prepared by an independent consulting firm regarding Dreyfus’ approach to allocating costs to, and determining the profitability of, individual funds and the entire Dreyfus fund complex. The consulting firm also had analyzed where any economies of scale might emerge in connection with the management of a fund.
The Board’s counsel stated that the Board members should consider the profitability analysis (1) as part of their evaluation of whether the fees under the Agreements bear a reasonable relationship to the mix of services provided by Dreyfus and Walter Scott, including the nature, extent and quality of such services, and (2) in light of the relevant circumstances for the fund and the extent to which economies of scale would be realized if the fund grows and whether fee levels reflect these economies of scale for the benefit of fund shareholders. Since Dreyfus, and not the fund, pays Walter Scott pursuant to the Sub-Advisory Agreement, the Board did not consider Walter Scott’s profitability to be relevant to its deliberations. Dreyfus representatives noted that, as a result of shared and allocated costs among funds in the Dreyfus funds complex, the extent of economies of scale could depend substantially on the level of assets in the complex as a whole, so that increases and decreases in complex-wide assets can affect potential economies of scale in a manner that is disproportionate to, or even in the opposite direction from, changes in the fund’s asset level.The Board members also considered potential benefits to Dreyfus and Walter Scott from acting as investment adviser and sub-investment adviser, respectively, and noted there were no soft dollar arrangements in effect for trading the fund’s investments.
TheFund 35
INFORMATION ABOUT THE REVIEW AND APPROVAL OF THE
FUND’S MANAGEMENT AGREEMENT AND SUB-INVESTMENT
ADVISORY AGREEMENT (Unaudited) (continued)
At the conclusion of these discussions, the Board agreed that it had been furnished with sufficient information to make an informed business decision with respect to the renewal of the Agreements. Based on the discussions and considerations as described above, the Board concluded and determined as follows.
The Board concluded that the nature, extent, and quality of the services provided by Dreyfus and Walter Scott are adequate and appropriate.
The Board was satisfied with the fund’s performance, in light of the considerations described above.
The Board concluded that the fees paid to Dreyfus and Walter Scott were reasonable in light of the considerations described above.
The Board determined that the economies of scale which may accrue to Dreyfus and its affiliates in connection with the management of the fund had been adequately considered by Dreyfus in connection with the fee rate charged to the fund pursuant to the Agreement and that, to the extent in the future it were determined that material economies of scale had not been shared with the fund, the Board would seek to have those economies of scale shared with the fund.
The Board members considered these conclusions and determinations, along with information received on a routine and regular basis throughout the year. In addition, it should be noted that the Board’s consideration of the contractual fee arrangements for this fund had the benefit of a number of years of reviews of prior or similar agreements during which lengthy discussions took place between the Board members and Dreyfus representatives. Certain aspects of the arrangements may receive greater scrutiny in some years than in others, and the Board members’ conclusions may be based, in part, on their consideration of the same or similar arrangements in prior years. The Board members determined that renewal of the Agreements was in the best interests of the fund and its shareholders.
36
BOARD MEMBERS INFORMATION (Unaudited)
|
| Joseph S. DiMartino (67) |
| Chairman of the Board (1995) |
| Principal Occupation During Past 5Years: |
| • Corporate Director and Trustee |
| Other Public Company Board Memberships During Past 5Years: |
| • CBIZ (formerly, Century Business Services, Inc.), a provider of outsourcing functions for small |
| and medium size companies, Director (1997-present) |
| • The Newark Group, a provider of a national market of paper recovery facilities, paperboard |
| mills and paperboard converting plants, Directors (2000-2010) |
| • Sunair Services Corporation, a provider of certain outdoor-related services to homes and |
| businesses, Director (2005-2009) |
| No. of Portfolios for which Board Member Serves: 170 |
| ——————— |
| David W. Burke (74) |
| Board Member (1994) |
| Principal Occupation During Past 5Years: |
| • Corporate Director and Trustee |
| No. of Portfolios for which Board Member Serves: 85 |
| ——————— |
| William Hodding Carter III (75) |
| Board Member (1988) |
| Principal Occupation During Past 5Years: |
| • Professor of Leadership & Public Policy, University of North Carolina, Chapel Hill (2006-present) |
| • President and Chief Executive Officer of the John S. and James L. Knight Foundation (1998-2006) |
| No. of Portfolios for which Board Member Serves: 30 |
| ——————— |
| Gordon J. Davis (69) |
| Board Member (2006) |
| Principal Occupation During Past 5Years: |
| • Partner in the law firm of Dewey & LeBoeuf LLP |
| Other Public Company Board Memberships During Past 5Years: |
| • Consolidated Edison, Inc., a utility company, Director (1997-present) |
| • The Phoenix Companies, Inc., a life insurance company, Director (2000-present) |
| No. of Portfolios for which Board Member Serves: 45 |
TheFund 37
BOARD MEMBERS INFORMATION (Unaudited) (continued)
|
| Joni Evans (68) |
| Board Member (2006) |
| Principal Occupation During Past 5Years: |
| • Chief Executive Officer, www.wowOwow.com an online community dedicated to women’s |
| conversations and publications |
| • Principal, Joni Evans Ltd. (publishing) |
| • Senior Vice President of the William Morris Agency (1994-2006) |
| No. of Portfolios for which Board Member Serves: 30 |
| ——————— |
| Ehud Houminer (70) |
| Board Member (1994) |
| Principal Occupation During Past 5Years: |
| • Executive-in-Residence at the Columbia Business School, Columbia University |
| Other Public Company Board Memberships During Past 5Years: |
| • Avnet Inc., an electronics distributor, Director (1993-present) |
| No. of Portfolios for which Board Member Serves: 63 |
| ——————— |
| Richard C. Leone (70) |
| Board Member (1984) |
| Principal Occupation During Past 5Years: |
| • President of The Century Foundation (formerly,The Twentieth Century Fund, Inc.), a tax |
| exempt research foundation engaged in the study of economic, foreign policy and domestic issues |
| Other Public Company Board Memberships During Past 5Years: |
| • Partnership for a Secure America, Director |
| No. of Portfolios for which Board Member Serves: 30 |
| ——————— |
| Hans C. Mautner (73) |
| Board Member (1984) |
| Principal Occupation During Past 5Years: |
| • President—International Division and an Advisory Director of Simon Property Group, a real |
| estate investment company |
| • Chairman and Chief Executive Officer of Simon Global Limited |
| No. of Portfolios for which Board Member Serves: 30 |
38
|
| Robin A. Melvin (47) |
| Board Member (1995) |
| Principal Occupation During Past 5Years: |
| • Director, Boisi Family Foundation, a private family foundation that supports youth-serving |
| organizations that promote the self sufficiency of youth from disadvantaged circumstances |
| (1995-present) |
| • SeniorVice President, Mentor, a national non-profit youth mentoring organization (1992-2005) |
| No. of Portfolios for which Board Member Serves: 41 |
| ——————— |
| Burton N. Wallack (60) |
| Board Member (2006) |
| Principal Occupation During Past 5Years: |
| • President and Co-owner of Wallack Management Company, a real estate management company |
| No. of Portfolios for which Board Member Serves: 30 |
| ——————— |
| John E. Zuccotti (73) |
| Board Member (1984) |
| Principal Occupation During Past 5Years: |
| • Chairman of Brookfield Financial Properties, Inc. |
| • Senior Counsel of Weil, Gotshal & Manges, LLP |
| • Emeritus Chairman of the Real Estate Board of New York |
| Other Public Company Board Memberships During Past 5Years: |
| • Wellpoint, Inc., a health benefits company, Director (2005-present) |
| No. of Portfolios for which Board Member Serves: 30 |
| ——————— |
| Once elected all Board Members serve for an indefinite term, but achieve Emeritus status upon reaching age 80.The |
| address of the Board Members and Officers is in c/o The Dreyfus Corporation, 200 Park Avenue, NewYork, NewYork |
| 10166.Additional information about the Board Members is available in the fund’s Statement of Additional Information |
| which can be obtained from Dreyfus free of charge by calling this toll free number: 1-800-554-4611. |
| Arnold S. Hiatt, Emeritus Board Member |
TheFund 39
OFFICERS OF THE FUND (Unaudited)
40

TheFund 41
OFFICERS OF THE FUND (Unaudited) (continued)
42
ANNUAL REPORT November 30, 2010

Save time. Save paper. View your next shareholder report online as soon as it’s available. Log into www.dreyfus.com and sign up for Dreyfus eCommunications. It’s simple and only takes a few minutes.
The views expressed in this report reflect those of the portfolio manager only through the end of the period covered and do not necessarily represent the views of Dreyfus or any other person in the Dreyfus organization. Any such views are subject to change at any time based upon market or other conditions and Dreyfus disclaims any responsibility to update such views.These views may not be relied on as investment advice and, because investment decisions for a Dreyfus fund are based on numerous factors, may not be relied on as an indication of trading intent on behalf of any Dreyfus fund.
| | Contents |
| | THE FUND |
| 2 | A Letter from the Chairman and CEO |
| 3 | Discussion of Fund Performance |
| 6 | Fund Performance |
| 8 | Understanding Your Fund’s Expenses |
| 8 | Comparing Your Fund’s Expenses With Those of Other Funds |
| 9 | Statement of Investments |
| 12 | Statement of Assets and Liabilities |
| 13 | Statement of Operations |
| 14 | Statement of Changes in Net Assets |
| 16 | Financial Highlights |
| 19 | Notes to Financial Statements |
| 31 | Report of Independent Registered Public Accounting Firm |
| 32 | Important Tax Information |
| 33 | Information About the Review and Approval of the Fund’s Management Agreement and Sub-Investment Advisory Agreement |
| 38 | Board Members Information |
| 41 | Officers of the Fund |
| | FOR MORE INFORMATION |
| | Back Cover |

A LETTER FROM THE CHAIRMAN AND CEO
Dear Shareholder:
We are pleased to present this annual report for International Stock Fund, covering the twelve-month period from December 1, 2009, through November 30, 2010.
Stocks throughout the global markets delivered respectable returns during the reporting period, despite periodic bouts of market volatility stemming from economic uncertainty and events. Although GDP growth in most countries was positive throughout the reporting period, the global economic recovery has been milder than historical averages, in particular in the U.S. Most notably, heavy sovereign debt burdens recently renewed credit concerns in Europe, effectively barring some governments from adopting more stimulative fiscal policies. However, robust demand from the world’s emerging markets has taken up some of the slack, supporting corporate earnings and stock prices.
We are cautiously optimistic regarding global economic and market prospects in 2011. Global expansion should gain a degree of momentum, led by financially strong emerging markets countries, while “debt hangover” countries in the developed world may face continued economic challenges. Monetary policy remains stimulative in most markets, and inflation-adjusted interest rates and inflation remain low. So is your portfolio positioned accordingly given these recent global economic events? Talk with your financial advisor, who can help you evaluate your portfolio investments within the new global economic framework to help meet your individual investment needs and future capital goals.
For information about how the fund performed during the reporting period, as well as general market perspectives, we provide a Discussion of Fund Performance on the pages that follow.
Thank you for your continued confidence and support.

Jonathan R. Baum
Chairman and Chief Executive Officer
The Dreyfus Corporation
December 15, 2010
2

DISCUSSION OF FUND PERFORMANCE
For the period of December 1, 2009, through November 30, 2010, as provided by Jane Henderson and Roy Leckie ofWalter Scott & Partners Limited (Walter Scott), Sub-investment adviser
Fund and Market Performance Overview
For the 12-month period ended November 30, 2010, International Stock Fund’s Class A shares achieved a return of 7.99%, Class C shares returned 7.18% and Class I shares returned 8.38%.1 In comparison, the fund’s benchmark index, the Morgan Stanley Capital International Europe, Australasia, Far East Index (the “MSCI EAFE Index”), achieved a 1.11% return over the same period.2
Despite early equity market declines, a slowly recovering global economy and improving investor sentiment enabled international stocks to eke out modest gains, on average, over the full reporting period.The fund produced returns that were higher than the MSCI EAFE Index, due to the success of our bottom-up security selection process in all geographic regions.
The Fund’s Investment Approach
The fund seeks long-term real return by investing in stocks of foreign companies that are predominantly located in the world’s developed markets outside of the United States.When selecting stocks,Walter Scott seeks companies with fundamental strengths that indicate the potential for sustainable growth. The firm focuses on individual stock selection through extensive fundamental research. Candidates are initially selected for research if they meet certain broad absolute and trend criteria. Financial statements are analyzed in an effort to identify the nature of their cash generation and to understand the variables that add value to their businesses. Companies meeting the financial criteria are subjected to a detailed investigation of their products, cost and pricing, competition, industry position and outlook.
Heightened Market Volatility in a Slow-Growth Economy
Even as most developed markets remained mired in economic weakness, robust demand for goods and services from the emerging markets
TheFund 3
DISCUSSION OF FUND PERFORMANCE (continued)
supported global manufacturing activity into the first quarter of 2010. As a result, confidence improved among businesses, consumers and investors worldwide. However, investor sentiment deteriorated in the spring of 2010 due to a sovereign debt crisis in Europe, which required intervention by the International Monetary Fund and European Union in the fiscal affairs of Greece and, later, Ireland.An appreciating currency dampened exports in Japan, and high unemployment levels, moribund housing markets and a weakening U.S. dollar constrained imports from international markets into the United States.
Fortunately, the effects of these concerns proved temporary, as still-strong demand from emerging markets and additional stimulative programs from certain central banks sparked a market rally later in the reporting period. In addition, while economic fundamentals remained questionable, global corporations continued to boost their earnings in the wake of cost-cutting measures adopted during the downturn.
Security Selections Boosted Fund’s Results
The fund’s stock-picking process found few opportunities meeting our investment criteria in the financials sector, enabling the fund to largely avoid weakness stemming from Europe’s sovereign debt crisis. In addition, the fund scored individual successes across a variety of markets through investments in growth-oriented companies such as Japan-based industrial robotic automation specialist Fanuc, which benefited from the beginnings of a shift in China from human labor to computer-aided manufacturing.The fund’s results also were bolstered by Denmark-based pharmaceutical developer Novo Nordisk, a leader in the manufacturing of insulin, which is used in the treatment of diabetes. Other winners included Hong Kong-based conglomerate HutchisonWhampoa, which gained value when its mobile telecommunications unit returned to profitability. One of China’s leading oil producers, CNOOC Limited, advanced as demand for energy in China intensified, and the company discovered new sources of production.
As is to be expected in a volatile market environment, the fund encountered some disappointments during the reporting period. Chief among them were Brazilian energy company Petroleo Brasileiro and Japanese oil-and-gas exploration and production company INPEX Corporation, both of which lost value when they issued new shares to finance new
4
production, thereby diluting the value of existing shares. Hong Kong-based retailer Esprit Holdings, which does business primarily in Europe, lagged market averages despite strong performance at the retail level, as the company’s wholesale distribution system continued to struggle with operational issues.
Finding Opportunities Among International Leaders
We expect the subpar global economic recovery to persist, with generally sluggish growth in developed markets and more robust expansion in emerging markets. However, we believe that robust corporate earnings growth may become more difficult to achieve as fewer opportunities for cost reductions present themselves. Rather, most companies in the year 2011 must increase revenues in order to achieve further bottom-line growth, which may be a difficult task in light of fiscal austerity measures in Europe and weak housing and labor markets in the United States. Consequently, we have intensified our focus on non-U.S. companies that, based on our analysis, can grow earnings either through leadership positions in their markets or ample pricing power. In our judgment, this strategy is particularly prudent in a global environment of persistent economic uncertainty.
December 15, 2010
| |
| | Equity funds are subject generally to market, market sector, market liquidity, issuer and investment |
| | style risks, among other factors, to varying degrees, all of which are more fully described in the |
| | fund’s prospectus. |
| | Investing internationally involves special risks, including changes in currency exchange rates, |
| | political, economic and social instability, a lack of comprehensive company information, differing |
| | auditing and legal standards and less market liquidity. |
| 1 | Total return includes reinvestment of dividends and any capital gains paid, and does not take into |
| | consideration the maximum initial sales charge in the case of Class A shares, or the applicable |
| | contingent deferred sales charge imposed on redemptions in the case of Class C shares. Had these |
| | charges been reflected, returns would have been lower. Past performance is no guarantee of future |
| | results. Share price and investment return fluctuate such that upon redemption, fund shares may be |
| | worth more or less than their original cost. |
| 2 | SOURCE: LIPPER INC. – Reflects reinvestment of net dividends and, where applicable, |
| | capital gain distributions.The Morgan Stanley Capital International Europe,Australasia, Far |
| | East (MSCI EAFE) Index is an unmanaged index composed of a sample of companies |
| | representative of the market structure of European and Pacific Basin countries. Returns are |
| | calculated on a month-end basis. Investors cannot invest directly in any index. |
TheFund 5
FUND PERFORMANCE
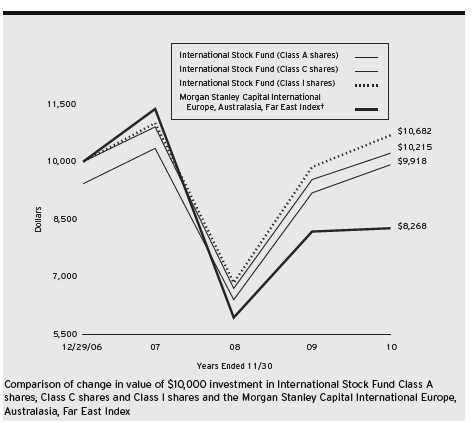
|
| † Source: Lipper Inc. |
| Past performance is not predictive of future performance. |
| The above graph compares a $10,000 investment made in Class A, Class C and Class I shares of International Stock |
| Fund on 12/29/06 (inception date) to a $10,000 investment made in the Morgan Stanley Capital International |
| Europe,Australasia, Far East Index (the “Index”) on that date. For comparative purposes, the value of the Index on |
| 12/31/06 is used as the beginning value on 12/29/06.All dividends and capital gain distributions are reinvested. |
| The fund’s performance shown in the line graph takes into account the maximum initial sales charge on Class A shares |
| and all other applicable fees and expenses on all classes.The Index is an unmanaged, market capitalization weighted index |
| that is designed to measure the performance of publicly traded stocks issued by companies in developed markets excluding |
| the U.S. and Canada. Unlike a mutual fund, the Index is not subject to charges, fees and other expenses. Investors cannot |
| invest directly in any index. Further information relating to fund performance, including expense reimbursements, if |
| applicable, is contained in the Financial Highlights section of the prospectus and elsewhere in this report. |
6
| | | |
| Average Annual Total Returns as of 11/30/10 | | |
| |
| | Inception | | From |
| | Date | 1 Year | Inception |
| Class A shares | | | |
| with maximum sales charge (5.75%) | 12/29/06 | 1.79% | –0.21% |
| without sales charge | 12/29/06 | 7.99% | 1.31% |
| Class C shares | | | |
| with applicable redemption charge † | 12/29/06 | 6.18% | 0.54% |
| without redemption | 12/29/06 | 7.18% | 0.54% |
| Class I shares | 12/29/06 | 8.38% | 1.70% |
| Morgan Stanley Capital International | | | |
| Europe, Australasia, Far East Index†† | 12/31/06 | 1.11% | –4.74% |
Past performance is not predictive of future performance.The fund’s performance shown in the graph and table does not reflect the deduction of taxes that a shareholder would pay on fund distributions or the redemption of fund shares.
| |
| † | The maximum contingent deferred sales charge for Class C shares is 1% for shares redeemed within one year of the |
| | date of purchase. |
| †† | For comparative purposes, the value of the Index as of 12/31/06 is used as the beginning value on 12/29/06. |
TheFund 7
UNDERSTANDING YOUR FUND’S EXPENSES (Unaudited)
As a mutual fund investor, you pay ongoing expenses, such as management fees and other expenses. Using the information below, you can estimate how these expenses affect your investment and compare them with the expenses of other funds.You also may pay one-time transaction expenses, including sales charges (loads) and redemption fees, which are not shown in this section and would have resulted in higher total expenses. For more information, see your fund’s prospectus or talk to your financial adviser.
Review your fund’s expenses
The table below shows the expenses you would have paid on a $1,000 investment in International Stock Fund from June 1, 2010 to November 30, 2010. It also shows how much a $1,000 investment would be worth at the close of the period, assuming actual returns and expenses.
Expenses and Value of a $1,000 Investment
assuming actual returns for the six months ended November 30, 2010
| | | |
| | Class A | Class C | Class I |
| Expenses paid per $1,000† | $ 7.18 | $ 11.39 | $ 5.20 |
| Ending value (after expenses) | $1,137.40 | $1,133.60 | $1,140.20 |
COMPARING YOUR FUND’S EXPENSES
WITH THOSE OF OTHER FUNDS (Unaudited)
Using the SEC’s method to compare expenses
The Securities and Exchange Commission (SEC) has established guidelines to help investors assess fund expenses. Per these guidelines, the table below shows your fund’s expenses based on a $1,000 investment, assuming a hypothetical 5% annualized return. You can use this information to compare the ongoing expenses (but not transaction expenses or total cost) of investing in the fund with those of other funds.All mutual fund shareholder reports will provide this information to help you make this comparison. Please note that you cannot use this information to estimate your actual ending account balance and expenses paid during the period.
Expenses and Value of a $1,000 Investment
assuming a hypothetical 5% annualized return for the six months ended November 30, 2010
| | | |
| | Class A | Class C | Class I |
| Expenses paid per $1,000† | $ 6.78 | $ 10.76 | $ 4.91 |
| Ending value (after expenses) | $1,018.35 | $1,014.39 | $1,020.21 |
|
| † Expenses are equal to the fund’s annualized expense ratio of 1.34% for Class A, 2.13% for Class C and .97% |
| for Class I , multiplied by the average account value over the period, multiplied by 183/365 (to reflect the one-half |
| year period). |
8
STATEMENT OF INVESTMENTS
November 30, 2010
| | |
| Common Stocks—96.8% | Shares | Value ($) |
| Australia—6.1% | | |
| Cochlear | 224,700 | 16,853,038 |
| CSL | 503,200 | 16,837,642 |
| Woodside Petroleum | 411,700 | 16,554,026 |
| | | 50,244,706 |
| Belgium—2.0% | | |
| Colruyt | 333,000 | 16,637,249 |
| Brazil—1.9% | | |
| Petroleo Brasileiro, ADR | 554,800 | 16,244,544 |
| Canada—2.0% | | |
| Suncor Energy | 489,300 | 16,434,722 |
| Denmark—1.9% | | |
| Novo Nordisk, Cl. B | 155,700 | 15,401,478 |
| France—5.5% | | |
| Cie Generale d’Optique Essilor International | 223,500 | 13,964,580 |
| Danone | 280,600 | 16,435,928 |
| L’Oreal | 142,200 | 15,122,790 |
| | | 45,523,298 |
| Germany—3.9% | | |
| Adidas | 248,200 | 15,580,358 |
| SAP | 357,000 | 16,654,655 |
| | | 32,235,013 |
| Hong Kong—9.7% | | |
| China Mobile | 1,631,500 | 16,272,769 |
| CLP Holdings | 1,477,500 | 12,158,536 |
| CNOOC | 7,558,000 | 16,390,867 |
| Esprit Holdings | 3,087,334 | 14,929,543 |
| Hong Kong & China Gas | 2,558,105 | 6,246,110 |
| Hutchison Whampoa | 1,393,000 | 13,938,790 |
| | | 79,936,615 |
| Japan—33.1% | | |
| Aeon Mall | 521,600 | 11,598,729 |
| Canon | 334,000 | 15,744,175 |
| Chugai Pharmaceutical | 628,000 | 11,338,368 |
| Daikin Industries | 361,800 | 12,990,907 |
| Daito Trust Construction | 259,900 | 16,086,534 |
| Denso | 518,700 | 16,938,787 |
TheFund 9
STATEMENT OF INVESTMENTS (continued)
| | |
| Common Stocks (continued) | Shares | Value ($) |
| Japan (continued) | | |
| FANUC | 118,700 | 17,005,771 |
| Hirose Electric | 93,000 | 9,189,987 |
| Honda Motor | 472,500 | 16,993,966 |
| Hoya | 588,300 | 13,876,260 |
| INPEX | 3,230 | 16,615,068 |
| Keyence | 63,500 | 16,024,854 |
| Komatsu | 659,700 | 18,272,011 |
| Mitsubishi Estate | 913,000 | 15,403,943 |
| Nintendo | 65,100 | 17,681,001 |
| Shimamura | 159,900 | 14,597,156 |
| Shin-Etsu Chemical | 339,000 | 16,567,212 |
| Tokio Marine Holdings | 590,800 | 16,709,566 |
| | | 273,634,295 |
| Singapore—1.4% | | |
| DBS Group Holdings | 1,139,512 | 12,082,530 |
| Spain—1.9% | | |
| Inditex | 209,400 | 15,781,311 |
| Sweden—2.0% | | |
| Hennes & Mauritz, Cl. B | 498,200 | 16,817,177 |
| Switzerland—8.0% | | |
| Nestle | 292,500 | 15,897,848 |
| Novartis | 314,000 | 16,659,692 |
| Roche Holding | 19,000 | 2,707,119 |
| SGS | 8,290 | 13,570,936 |
| Synthes | 141,200 | 17,276,302 |
| | | 66,111,897 |
| United Kingdom—17.4% | | |
| BG Group | 901,700 | 16,290,629 |
| Burberry Group | 529,000 | 8,195,427 |
| Cairn Energy | 2,691,300 a | 16,179,615 |
| Centrica | 3,126,100 | 14,932,731 |
| HSBC Holdings | 1,555,300 | 15,683,636 |
| Reckitt Benckiser Group | 290,000 | 15,336,755 |
| Smith & Nephew | 1,812,000 | 16,417,639 |
10
| | |
| Common Stocks (continued) | Shares | Value ($) |
| United Kingdom (continued) | | |
| Standard Chartered | 613,000 | 16,504,946 |
| Tesco | 2,485,100 | 16,014,573 |
| WM Morrison Supermarkets | 1,945,000 | 8,228,962 |
| | | 143,784,913 |
| Total Common Stocks | | |
| (cost $732,117,819) | | 800,869,748 |
| |
| Other Investment—2.4% | | |
| Registered Investment Company; | | |
| Dreyfus Institutional Preferred | | |
| Plus Money Market Fund | | |
| (cost $19,650,000) | 19,650,000 b | 19,650,000 |
| Total Investments (cost $751,767,819) | 99.2% | 820,519,748 |
| Cash and Receivables (Net) | .8% | 6,777,447 |
| Net Assets | 100.0% | 827,297,195 |
ADR—American Depository Receipts
| |
| a | Non-income producing security. |
| b | Investment in affiliated money market mutual fund. |
| | | |
| Portfolio Summary (Unaudited)† | | |
| |
| | Value (%) | | Value (%) |
| Health Care | 15.3 | Industrials | 9.2 |
| Consumer Discretionary | 14.5 | Utilities | 4.0 |
| Energy | 13.9 | Money Market Investment | 2.4 |
| Financial Services | 12.6 | Materials | 2.0 |
| Consumer Staples | 12.5 | Telecommunication Services | 2.0 |
| Technology | 10.8 | | 99.2 |
| |
| † Based on net assets. | | | |
| See notes to financial statements. | | | |
TheFund 11
STATEMENT OF ASSETS AND LIABILITIES
November 30, 2010
| | |
| | Cost | Value |
| Assets ($): | | |
| Investments in securities—See Statement of Investments: | | |
| Unaffiliated issuers | 732,117,819 | 800,869,748 |
| Affiliated issuers | 19,650,000 | 19,650,000 |
| Cash | | 2,439,009 |
| Cash denominated in foreign currencies | 1,468,832 | 1,469,494 |
| Receivable for investment securities sold | | 1,847,317 |
| Dividends and interest receivable | | 1,824,754 |
| Receivable for shares of Common Stock subscribed | | 1,639,131 |
| Unrealized appreciation on forward foreign | | |
| currency exchange contracts—Note 4 | | 212 |
| Prepaid expenses | | 41,998 |
| | | 829,781,663 |
| Liabilities ($): | | |
| Due to The Dreyfus Corporation and affiliates—Note 3(c) | | 718,326 |
| Payable for investment securities purchased | | 1,428,270 |
| Payable for shares of Common Stock redeemed | | 201,620 |
| Unrealized depreciation on forward foreign | | |
| currency exchange contracts—Note 4 | | 9,618 |
| Accrued expenses | | 126,634 |
| | | 2,484,468 |
| Net Assets ($) | | 827,297,195 |
| Composition of Net Assets ($): | | |
| Paid-in capital | | 773,586,283 |
| Accumulated undistributed investment income—net | | 4,615,945 |
| Accumulated net realized gain (loss) on investments | | (19,703,518) |
| Accumulated net unrealized appreciation (depreciation) | | |
| on investments and foreign currency transactions | | 68,798,485 |
| Net Assets ($) | | 827,297,195 |
| | | |
| Net Asset Value Per Share | | | |
| | Class A | Class C | Class I |
| Net Assets ($) | 124,347,115 | 13,958,542 | 688,991,538 |
| Shares Outstanding | 9,690,313 | 1,104,051 | 53,304,720 |
| Net Asset Value Per Share ($) | 12.83 | 12.64 | 12.93 |
| |
| See notes to financial statements. | | | |
12
STATEMENT OF OPERATIONS
Year Ended November 30, 2010
| |
| Investment Income ($): | |
| Income: | |
| Cash dividends (net of $853,758 foreign taxes withheld at source): | |
| Unaffiliated issuers | 11,668,422 |
| Affiliated issuers | 42,558 |
| Total Income | 11,710,980 |
| Expenses: | |
| Management fee—Note 3(a) | 4,806,388 |
| Custodian fees—Note 3(c) | 381,265 |
| Shareholder servicing costs—Note 3(c) | 262,130 |
| Professional fees | 88,481 |
| Registration fees | 80,538 |
| Directors’ fees and expenses—Note 3(d) | 52,531 |
| Distribution fees—Note 3(b) | 44,941 |
| Prospectus and shareholders’ reports | 15,055 |
| Loan commitment fees—Note 2 | 4,698 |
| Miscellaneous | 36,851 |
| Total Expenses | 5,772,878 |
| Less—reduction in fees due to earnings credits—Note 3(c) | (107) |
| Net Expenses | 5,772,771 |
| Investment Income—Net | 5,938,209 |
| Realized and Unrealized Gain (Loss) on Investments—Note 4 ($): | |
| Net realized gain (loss) on investments and foreign currency transactions | 1,629,837 |
| Net realized gain (loss) on forward foreign currency exchange contracts | (85,902) |
| Net Realized Gain (Loss) | 1,543,935 |
| Net unrealized appreciation (depreciation) | |
| on investments and foreign currency transactions | 42,151,738 |
| Net unrealized appreciation (depreciation) on | |
| forward foreign currency exchange contracts | (7,362) |
| Net Unrealized Appreciation (Depreciation) | 42,144,376 |
| Net Realized and Unrealized Gain (Loss) on Investments | 43,688,311 |
| Net Increase in Net Assets Resulting from Operations | 49,626,520 |
| |
| See notes to financial statements. | |
TheFund 13
STATEMENT OF CHANGES IN NET ASSETS
| | |
| | Year Ended November 30, |
| | 2010 | 2009a |
| Operations ($): | | |
| Investment income—net | 5,938,209 | 2,396,899 |
| Net realized gain (loss) on investments | 1,543,935 | (14,951,731) |
| Net unrealized appreciation | | |
| (depreciation) on investments | 42,144,376 | 85,132,414 |
| Net Increase (Decrease) in Net Assets | | |
| Resulting from Operations | 49,626,520 | 72,577,582 |
| Dividends to Shareholders from ($): | | |
| Investment income—net: | | |
| Class A Shares | (142,971) | (14,326) |
| Class C Shares | (4,254) | (315) |
| Class I Shares | (3,306,609) | (1,438,410) |
| Class T Shares | — | (959) |
| Total Dividends | (3,453,834) | (1,454,010) |
| Capital Stock Transactions ($): | | |
| Net proceeds from shares sold: | | |
| Class A Shares | 115,912,183 | 16,902,665 |
| Class C Shares | 13,275,616 | 946,149 |
| Class I Shares | 354,816,585 | 228,631,789 |
| Dividends reinvested: | | |
| Class A Shares | 141,708 | 13,684 |
| Class C Shares | 2,713 | 233 |
| Class I Shares | 1,027,427 | 430,172 |
| Class T Shares | — | 551 |
| Cost of shares redeemed: | | |
| Class A Shares | (15,383,858) | (1,905,577) |
| Class C Shares | (974,987) | (112,519) |
| Class I Shares | (46,510,527) | (78,185,632) |
| Class T Shares | — | (20,033) |
| Increase (Decrease) in Net Assets | | |
| from Capital Stock Transactions | 422,306,860 | 166,701,482 |
| Total Increase (Decrease) in Net Assets | 468,479,546 | 237,825,054 |
| Net Assets ($): | | |
| Beginning of Period | 358,817,649 | 120,992,595 |
| End of Period | 827,297,195 | 358,817,649 |
| Undistributed investment income—net | 4,615,945 | 2,387,702 |
14
| | |
| | Year Ended November 30, |
| | 2010 | 2009a |
| Capital Share Transactions: | | |
| Class Ab | | |
| Shares sold | 9,443,427 | 1,545,517 |
| Shares issued for dividends reinvested | 11,750 | 1,512 |
| Shares redeemed | (1,273,189) | (172,304) |
| Net Increase (Decrease) in Shares Outstanding | 8,181,988 | 1,374,725 |
| Class C | | |
| Shares sold | 1,084,430 | 90,996 |
| Shares issued for dividends reinvested | 227 | 26 |
| Shares redeemed | (84,101) | (11,194) |
| Net Increase (Decrease) in Shares Outstanding | 1,000,556 | 79,828 |
| Class I | | |
| Shares sold | 28,823,704 | 22,570,720 |
| Shares issued for dividends reinvested | 84,841 | 47,481 |
| Shares redeemed | (3,809,868) | (8,544,986) |
| Net Increase (Decrease) in Shares Outstanding | 25,098,677 | 14,073,215 |
| Class Tb | | |
| Shares issued for dividends reinvested | — | 64 |
| Shares redeemed | — | (2,414) |
| Net Increase (Decrease) in Shares Outstanding | — | (2,350) |
|
| a Effective as of the close of business on February 4, 2009, the fund no longer offers Class T shares. |
| b On the close of business on February 4, 2009, 2,414 Class T shares representing $20,033 were converted to 2,316 |
| Class A shares. |
See notes to financial statements.
TheFund 15
FINANCIAL HIGHLIGHTS
The following tables describe the performance for each share class for the fiscal periods indicated.All information (except portfolio turnover rate) reflects financial results for a single fund share.Total return shows how much your investment in the fund would have increased (or decreased) during each period, assuming you had reinvested all dividends and distributions.These figures have been derived from the fund’s financial statements.
| | | | |
| | | Year Ended November 30, | |
| Class A Shares | 2010 | 2009 | 2008 | 2007a |
| Per Share Data ($): | | | | |
| Net asset value, beginning of period | 11.97 | 8.43 | 13.72 | 12.50 |
| Investment Operations: | | | | |
| Investment income—netb | .09 | .05 | .09 | .07 |
| Net realized and unrealized | | | | |
| gain (loss) on investments | .86 | 3.58 | (5.28) | 1.15 |
| Total from Investment Operations | .95 | 3.63 | (5.19) | 1.22 |
| Distributions: | | | | |
| Dividends from investment income—net | (.09) | (.09) | (.02) | — |
| Dividends from net realized | | | | |
| gain on investments | — | — | (.08) | — |
| Total Distributions | (.09) | (.09) | (.10) | — |
| Net asset value, end of period | 12.83 | 11.97 | 8.43 | 13.72 |
| Total Return (%)c | 7.99 | 43.33 | (38.07) | 9.76d |
| Ratios/Supplemental Data (%): | | | | |
| Ratio of total expenses to average net assets | 1.34 | 1.43 | 1.43 | 1.75e |
| Ratio of net expenses to average net assets | 1.34 | 1.42 | 1.41 | 1.47e |
| Ratio of net investment income | | | | |
| to average net assets | .69 | .50 | .79 | .50e |
| Portfolio Turnover Rate | 5.91 | 21.67 | 13.18 | 13.34d |
| Net Assets, end of period ($ x 1,000) | 124,347 | 18,059 | 1,126 | 1,396 |
| |
| a | From December 29, 2006 (commencement of operations) to November 30, 2007. |
| b | Based on average shares outstanding at each month end. |
| c | Exclusive of sales charge. |
| d | Not annualized. |
| e | Annualized. |
See notes to financial statements.
16
| | | | |
| | | Year Ended November 30, | |
| Class C Shares | 2010 | 2009 | 2008 | 2007a |
| Per Share Data ($): | | | | |
| Net asset value, beginning of period | 11.83 | 8.32 | 13.64 | 12.50 |
| Investment Operations: | | | | |
| Investment income (loss)—netb | (.02) | (.01) | .00c | (.04) |
| Net realized and unrealized | | | | |
| gain (loss) on investments | .87 | 3.53 | (5.24) | 1.18 |
| Total from Investment Operations | .85 | 3.52 | (5.24) | 1.14 |
| Distributions: | | | | |
| Dividends from investment income—net | (.04) | (.01) | — | — |
| Dividends from net realized | | | | |
| gain on investments | — | — | (.08) | — |
| Total Distributions | (.04) | (.01) | (.08) | — |
| Net asset value, end of period | 12.64 | 11.83 | 8.32 | 13.64 |
| Total Return (%)d | 7.18 | 42.31 | (38.58) | 9.04e |
| Ratios/Supplemental Data (%): | | | | |
| Ratio of total expenses to average net assets | 2.13 | 2.25 | 2.24 | 2.50f |
| Ratio of net expenses to average net assets | 2.13 | 2.22 | 2.20 | 2.21f |
| Ratio of net investment income | | | | |
| (loss) to average net assets | (.12) | (.13) | .03 | (.31)f |
| Portfolio Turnover Rate | 5.91 | 21.67 | 13.18 | 13.34e |
| Net Assets, end of period ($ x 1,000) | 13,959 | 1,224 | 197 | 445 |
| |
| a | From December 29, 2006 (commencement of operations) to November 30, 2007. |
| b | Based on average shares outstanding at each month end. |
| c | Amount represents less than $.01 per share. |
| d | Exclusive of sales charge. |
| e | Not annualized. |
| f | Annualized. |
See notes to financial statements.
TheFund 17
FINANCIAL HIGHLIGHTS (continued)
| | | | |
| | | Year Ended November 30, | |
| Class I Shares | 2010 | 2009 | 2008 | 2007a,b |
| Per Share Data ($): | | | | |
| Net asset value, beginning of period | 12.04 | 8.47 | 13.76 | 12.50 |
| Investment Operations: | | | | |
| Investment income—netc | .14 | .12 | .14 | .11 |
| Net realized and unrealized | | | | |
| gain (loss) on investments | .86 | 3.57 | (5.30) | 1.15 |
| Total from Investment Operations | 1.00 | 3.69 | (5.16) | 1.26 |
| Distributions: | | | | |
| Dividends from investment income—net | (.11) | (.12) | (.05) | — |
| Dividends from net realized | | | | |
| gain on investments | — | — | (.08) | — |
| Total Distributions | (.11) | (.12) | (.13) | — |
| Net asset value, end of period | 12.93 | 12.04 | 8.47 | 13.76 |
| Total Return (%) | 8.38 | 43.98 | (37.82) | 10.08d |
| Ratios/Supplemental Data (%): | | | | |
| Ratio of total expenses to average net assets | .97 | 1.01 | 1.03 | 1.38e |
| Ratio of net expenses to average net assets | .97 | 1.01 | 1.02 | 1.16e |
| Ratio of net investment income | | | | |
| to average net assets | 1.11 | 1.18 | 1.19 | .81e |
| Portfolio Turnover Rate | 5.91 | 21.67 | 13.18 | 13.34d |
| Net Assets, end of period ($ x 1,000) | 688,992 | 339,535 | 119,650 | 69,201 |
| |
| a | From December 29, 2006 (commencement of operations) to November 30, 2007. |
| b | Effective June 1, 2007, Class R shares were redesignated as Class I shares. |
| c | Based on average shares outstanding at each month end. |
| d | Not annualized. |
| e | Annualized. |
See notes to financial statements.
18
NOTES TO FINANCIAL STATEMENTS
NOTE 1—Significant Accounting Policies:
International Stock Fund (the “fund”) is a separate diversified series of Strategic Funds, Inc. (the “Company”) which is registered under the Investment Company Act of 1940, as amended (the “Act”), as an open-end management investment company and operates as a series company currently offering ten series, including the fund.The fund’s investment objective is to seek long-term total return. The Dreyfus Corporation (the “Manager” or “Dreyfus”), a wholly-owned subsidiary of The Bank of New York Mellon Corporation (“BNY Mellon”), serves as the fund’s investment adviser. Walter Scott & Partners Limited (“Walter Scott”), a subsidiary of BNY Mellon and an affiliate of Dreyfus, serves as the fund’s sub-investment adviser.
MBSC Securities Corporation (the “Distributor”), a wholly-owned subsidiary of Dreyfus, is the distributor of the fund’s shares.The fund is authorized to issue 100 million shares of $.001 par value Common Stock in each of the following classes of shares: Class A, Class C and Class I. Class A shares are subject to a sales charge imposed at the time of purchase. Class C shares are subject to a contingent deferred sales charge (“CDSC”) on Class C shares redeemed within one year of purchase. Class I shares are sold at net asset value per share only to institutional investors. Other differences between the classes include the services offered to and the expenses borne by each class, the allocation of certain transfer agency costs and certain voting rights. Income, expenses (other than expenses attributable to a specific class), and realized and unrealized gains or losses on investments are alloc ated to each class of shares based on its relative net assets.
The Company accounts separately for the assets, liabilities and operations of each series. Expenses directly attributable to each series are charged to that series’ operations; expenses which are applicable to all series are allocated among them on a pro rata basis.
TheFund 19
NOTES TO FINANCIAL STATEMENTS (continued)
The Financial Accounting Standards Board (“FASB”) Accounting Standards Codification (“ASC”) is the exclusive reference of authoritative U.S. generally accepted accounting principles (“GAAP”) recognized by the FASB to be applied by nongovernmental entities. Rules and interpretive releases of the Securities and Exchange Commission (“SEC”) under authority of federal laws are also sources of authoritative GAAP for SEC registrants. The fund’s financial statements are prepared in accordance with GAAP, which may require the use of management estimates and assumptions.Actual results could differ from those estimates.
The Company enters into contracts that contain a variety of indemnifications.The fund’s maximum exposure under these arrangements is unknown.The fund does not anticipate recognizing any loss related to these arrangements.
(a) Portfolio valuation: Investments in securities are valued at the last sales price on the securities exchange or national securities market on which such securities are primarily traded. Securities listed on the National Market System for which market quotations are available are valued at the official closing price or, if there is no official closing price that day, at the last sales price. Securities not listed on an exchange or the national securities market, or securities for which there were no transactions, are valued at the average of the most recent bid and asked prices, except for open short positions, where the asked price is used for valuation purposes. Bid price is used when no asked price is available. Registered investment companies that are not traded on an exchange are valued at their net asset value.When market quotations or official closing prices are not readily available, or are determined not to reflect accurately fair value, such as when the value of a security has been significantly affected by events after the close of the exchange or market on which the security is principally traded (for example, a foreign exchange or market), but before the fund calculates its net asset value, the fund may value these investments at fair value as determined in accordance with the procedures approved by the Board of Directors. Fair valuing of securities may be determined with the assistance of a pricing service using calculations based on indices of domestic securities and other appropri-
20
ate indicators, such as prices of relevant ADRs and futures contracts. For other securities that are fair valued by the Board of Directors, certain factors may be considered such as: fundamental analytical data, the nature and duration of restrictions on disposition, an evaluation of the forces that influence the market in which the securities are purchased and sold and public trading in similar securities of the issuer or comparable issuers. Investments denominated in foreign currencies are translated to U.S. dollars at the prevailing rates of exchange. Forward foreign currency exchange contracts (“forward contracts”) are valued at the forward rate.
The fair value of a financial instrument is the amount that would be received to sell an asset or paid to transfer a liability in an orderly transaction between market participants at the measurement date (i.e. the exit price). GAAP establishes a fair value hierarchy that prioritizes the inputs of valuation techniques used to measure fair value.This hierarchy gives the highest priority to unadjusted quoted prices in active markets for identical assets or liabilities (Level 1 measurements) and the lowest priority to unobservable inputs (Level 3 measurements).
Additionally, GAAP provides guidance on determining whether the volume and activity in a market has decreased significantly and whether such a decrease in activity results in transactions that are not orderly. GAAP requires enhanced disclosures around valuation inputs and techniques used during annual and interim periods.
Various inputs are used in determining the value of the fund’s investments relating to fair value measurements.These inputs are summarized in the three broad levels listed below:
Level 1—unadjusted quoted prices in active markets for identical investments.
Level 2—other significant observable inputs (including quoted prices for similar investments, interest rates, prepayment speeds, credit risk, etc.).
Level 3—significant unobservable inputs (including the fund’s own assumptions in determining the fair value of investments).
TheFund 21
NOTES TO FINANCIAL STATEMENTS (continued)
The inputs or methodology used for valuing securities are not necessarily an indication of the risk associated with investing in those securities.
The following is a summary of the inputs used as of November 30, 2010 in valuing the fund’s investments:
| | | | |
| | | Level 2—Other | Level 3— | |
| | Level 1— | Significant | Significant | |
| | Unadjusted | Observable | Unobservable | |
| | Quoted Prices | Inputs | Inputs | Total |
| Assets ($) | | | | |
| Investments in Securities: | | | |
| Equity Securities— | | | | |
| Foreign† | 800,869,748 | — | — | 800,869,748 |
| Mutual Funds | 19,650,000 | — | — | 19,650,000 |
| Other Financial | | | | |
| Instruments: | | | | |
| Forward Foreign | | | | |
| Currency Exchange | | | |
| Contracts†† | — | 212 | — | 212 |
| Liabilities ($) | | | | |
| Other Financial | | | | |
| Instruments: | | | | |
| Forward Foreign | | | | |
| Currency Exchange | | | |
| Contracts†† | — | (9,618) | — | (9,618) |
| |
| † | See Statement of Investments for additional detailed categorizations. |
| †† | Amount shown represents unrealized appreciation (depreciation) at period end. |
In January 2010, FASB issued Accounting Standards Update (“ASU”) No. 2010-06 “Improving Disclosures about FairValue Measurements”. The portions of ASU No. 2010-06 which require reporting entities to prepare new disclosures surrounding amounts and reasons for significant transfers in and out of Level 1 and Level 2 fair value measurements as well as inputs and valuation techniques used to measure fair value for both recurring and nonrecurring fair value measurements that fall in either Level 2 or Level 3 have been adopted by the fund. No significant transfers between Level 1 or Level 2 fair value measurements occurred at November 30, 2010. The remaining portion of ASU No. 2010-06 requires reporting entities to make new disclosures about information on purchases, sales, issuances and settlements on a gross basis in the rec-
22
onciliation of activity in Level 3 fair value measurements. These new and revised disclosures are required to be implemented for fiscal years beginning after December 15, 2010. Management is currently evaluating the impact that the adoption of this remaining portion of ASU No. 2010-06 may have on the fund’s financial statement disclosures.
(b) Foreign currency transactions: The fund does not isolate that portion of the results of operations resulting from changes in foreign exchange rates on investments from the fluctuations arising from changes in market prices of securities held. Such fluctuations are included with the net realized and unrealized gain or loss on investments.
Net realized foreign exchange gains or losses arise from sales of foreign currencies, currency gains or losses realized on securities transactions between trade and settlement date, and the difference between the amounts of dividends, interest and foreign withholding taxes recorded on the fund’s books and the U.S. dollar equivalent of the amounts actually received or paid. Net unrealized foreign exchange gains or losses arise from changes in the value of assets and liabilities other than investments resulting from changes in exchange rates. Foreign currency gains and losses on investments are included with net realized and unrealized gain or loss on investments.
(c) Securities transactions and investment income: Securities transactions are recorded on a trade date basis. Realized gains and losses from securities transactions are recorded on the identified cost basis. Dividend income is recognized on the ex-dividend date and interest income, including, where applicable, accretion of discount and amortization of premium on investments, is recognized on the accrual basis.
Investing in foreign markets may involve special risks and considerations not typically associated with investing in the U.S. These risks include revaluation of currencies, high rates of inflation, repatriation restrictions on income and capital, and adverse political and economic developments. Moreover, securities issued in these markets may be less liquid, subject to government ownership controls and delayed settlements, and their prices may be more volatile than those of comparable securities in the U.S.
TheFund 23
NOTES TO FINANCIAL STATEMENTS (continued)
(d) Affiliated issuers: Investments in other investment companies advised by Dreyfus are defined as “affiliated” in the Act.
The fund may invest in shares of certain affiliated investment companies also advised or managed by Dreyfus. Investments in affiliated investment companies for the period ended November 30, 2010 were as follows:
| | | | | |
| Affiliated | | | | | |
| Investment | Value | | | Value | Net |
| Company | 11/30/2009 ($) | Purchases ($) | Sales ($) | 11/30/2010 ($) | Assets (%) |
| Dreyfus | | | | | |
| Institutional | | | | | |
| Preferred | | | | | |
| Plus Money | | | | | |
| Market | | | | | |
| Fund | 11,800,000 | 308,850,000 | 301,000,000 | 19,650,000 | 2.4 |
(e) Dividends to shareholders: Dividends are recorded on the ex-dividend date. Dividends from investment income-net and dividends from net realized capital gains, if any, are normally declared and paid annually, but the fund may make distributions on a more frequent basis to comply with the distribution requirements of the Internal Revenue Code of 1986, as amended (the “Code”).To the extent that net realized capital gains can be offset by capital loss carryovers, it is the policy of the fund not to distribute such gains. Income and capital gain distributions are determined in accordance with income tax regulations, which may differ from GAAP.
(f) Federal income taxes: It is the policy of the fund to continue to qualify as a regulated investment company, if such qualification is in the best interests of its shareholders, by complying with the applicable provisions of the Code, and to make distributions of taxable income sufficient to relieve it from substantially all federal income and excise taxes.
As of and during the period ended November 30, 2010, the fund did not have any liabilities for any uncertain tax positions.The fund recognizes interest and penalties, if any, related to uncertain tax positions as income tax expense in the Statement of Operations. During the period, the fund did not incur any interest or penalties.
24
Each of the tax years in the four-year period ended November 30, 2010 remains subject to examination by the Internal Revenue Service and state taxing authorities.
At November 30, 2010, the components of accumulated earnings on a tax basis were as follows: undistributed ordinary income $6,896,869, accumulated capital losses $15,713,305 and unrealized appreciation $62,996,161. In addition, the fund had $468,813 of passive foreign investment company losses realized after October 31, 2010, which were deferred for tax purposes to the first day of the following fiscal year.
The accumulated capital loss carryover is available for federal income tax purposes to be applied against future net securities profits, if any, realized subsequent to November 30, 2010. If not applied, $598,805 of the carryover expires in fiscal 2016 and $15,114,500 expires in fiscal 2017.
The tax character of distributions paid to shareholders during the fiscal periods ended November 30, 2010 and November 30, 2009 were as follows: ordinary income $3,453,834 and $1,454,010, respectively.
During the period ended November 30, 2010, as a result of permanent book to tax differences, primarily due to the tax treatment for foreign currency gains and losses, the fund decreased accumulated undistributed investment income-net by $256,132 and increased accumulated net realized gain (loss) on investments by the same amount. Net assets and net asset value per share were not affected by this reclassification.
NOTE 2—Bank Lines of Credit:
The fund participates with other Dreyfus-managed funds in a $225 million unsecured credit facility led by Citibank, N.A. and a $300 million unsecured credit facility provided by The Bank of New York Mellon, a subsidiary of BNY Mellon and an affiliate of Dreyfus (each, a “Facility”), each to be utilized primarily for temporary or emergency purposes, including the financing of redemptions. In connection
TheFund 25
NOTES TO FINANCIAL STATEMENTS (continued)
therewith, the fund has agreed to pay its pro rata portion of commitment fees for each Facility. Interest is charged to the fund based on rates determined pursuant to the terms of the respective Facility at the time of borrowing. During the period ended November 30, 2010, the fund did not borrow under the Facilities.
NOTE 3—Management Fee, Sub-Investment Advisory Fee and Other Transactions With Affiliates:
(a) Pursuant to a management agreement with Dreyfus, the management fee is computed at the annual rate of .85% of the value of the fund’s average daily net assets and is payable monthly. Dreyfus has contractually agreed, until April 1, 2011, to waive receipt of its fees and/or assume the expenses of the fund so that annual fund operating expenses (excluding Rule 12b-1 fees, shareholder services fees, taxes, interest, brokerage commissions, commitment fees on borrowings and extraordinary expenses) do not exceed 1.25% of the value of the fund’s average daily net assets. During the period ended November 30, 2010, there was no reduction in management fee pursuant to the undertaking.
During the period ended November 30, 2010, the Distributor retained $39,426 from commissions earned on sales of the fund’s Class A shares and $3,439 from CDSCs on redemptions of the fund’s Class C shares.
Pursuant to a sub-investment advisory agreement between Dreyfus and Walter Scott, Dreyfus pays Walter Scott a monthly fee at an annual percentage of the fund’s average daily net assets.
(b) Under the Distribution Plan (the “Plan”) adopted pursuant to Rule 12b-1 under the Act, Class C shares pay the Distributor for distributing its shares at an annual rate of .75% of the value of the average daily net assets of Class C shares. During the period ended November 30, 2010, Class C shares were charged $44,941, pursuant to the Plan.
(c) Under the Shareholder Services Plan, Class A and Class C shares pay the Distributor at an annual rate of .25% of the value of their average
26
daily net assets for the provision of certain services.The services provided may include personal services relating to shareholder accounts, such as answering shareholder inquiries regarding Class A and Class C shares and providing reports and other information, and services related to the maintenance of shareholder accounts.The Distributor may make payments to Service Agents (a securities dealer, financial institution or other industry professional) in respect of these services. The Distributor determines the amounts to be paid to Service Agents. During the period ended November 30, 2010, Class A and Class C shares were charged $152,323 and $14,980, respectively, pursuant to the Shareholder Services Plan.
The fund compensates Dreyfus Transfer, Inc., a wholly-owned subsidiary of Dreyfus, under a transfer agency agreement for providing personnel and facilities to perform transfer agency services for the fund. During the period ended November 30, 2010, the fund was charged $11,225 pursuant to the transfer agency agreement, which is included in Shareholder servicing costs in the Statement of Operations.
The fund has arrangements with the custodian and cash management bank whereby the fund may receive earnings credits when positive cash balances are maintained, which are used to offset custody and cash management fees. For financial reporting purposes, the fund includes net earnings credits as an expense offset in the Statement of Operations.
The fund compensates The Bank of New York Mellon under a cash management agreement for performing cash management services related to fund subscriptions and redemptions. During the period ended November 30, 2010, the fund was charged $1,852 pursuant to the cash management agreement, which is included in Shareholder servicing costs in the Statement of Operations. These fees were partially offset by earnings credits of $107.
TheFund 27
NOTES TO FINANCIAL STATEMENTS (continued)
The fund also compensates The Bank of New York Mellon under a custody agreement for providing custodial services for the fund. During the period ended November 30, 2010, the fund was charged $381,265 pursuant to the custody agreement.
During the period ended November 30, 2010, the fund was charged $6,399 for services performed by the Chief Compliance Officer.
The components of “Due to The Dreyfus Corporation and affiliates” in the Statement of Assets and Liabilities consist of: management fees $580,776, Rule 12b-1 distribution plan fees $8,398, shareholder services plan fees $28,002, custodian fees $97,298, chief compliance officer fees $1,152 and transfer agency per account fees $2,700.
(d) Each Board member also serves as a Board member of other funds within the Dreyfus complex. Annual retainer fees and attendance fees are allocated to each fund based on net assets.
(e) A 2% redemption fee is charged and retained by the fund on certain shares redeemed within sixty days following the date of issuance, including redemptions made through the use of the fund’s exchange privilege. During the period ended November 30, 2010, redemption fees charged and retained by the fund amounted to $89,058.
NOTE 4—Securities Transactions:
The aggregate amount of purchases and sales of investment securities, excluding short-term securities and forward contracts, during the period ended November 30, 2010, amounted to $442,454,703 and $31,861,449, respectively.
The provisions of ASC Topic 815 “Derivatives and Hedging” require qualitative disclosures about objectives and strategies for using deriva-
28
tives, quantitative disclosures about fair value amounts of gains and losses on derivative instruments and disclosures about credit-risk-related contingent features in derivative agreements. The disclosure requirements distinguish between derivatives, which are accounted for as “hedges” and those that do not qualify for hedge accounting. Because investment companies value their derivatives at fair value and recognize changes in fair value through the Statement of Operations, they do not qualify for such accounting. Accordingly, even though a fund’s investments in derivatives may represent economic hedges, they are considered to be non-hedge transactions for purposes of this disclosure.
Forward Foreign Currency Exchange Contracts: The fund enters into forward contracts in order to hedge its exposure to changes in foreign currency exchange rates on its foreign portfolio holdings, to settle foreign currency transactions or as a part of its investment strategy. When executing forward contracts, the fund is obligated to buy or sell a foreign currency at a specified rate on a certain date in the future. With respect to sales of forward contracts, the fund incurs a loss if the value of the contract increases between the date the forward contract is opened and the date the forward contract is closed.The fund realizes a gain if the value of the contract decreases between those dates.With respect to purchases of forward contracts, the fund incurs a loss if the value of the contract decreases between the date the for ward contract is opened and the date the forward contract is closed.The fund realizes a gain if the value of the contract increases between those dates. Any realized gain or loss which occurred during the period is reflected in the Statement of Operations.The fund is exposed to foreign currency risk as a result of changes in value of underlying financial instruments. The fund is also exposed to credit risk associated with counterparty
TheFund 29
NOTES TO FINANCIAL STATEMENTS (continued)
nonperformance on these forward contracts, which is typically limited to the unrealized gain on each open contract.The following summarizes open forward contracts at November 30, 2010:
| | | | |
| | Foreign | | | Unrealized |
| Forward Foreign Currency | Currency | | | Appreciation |
| Exchange Contracts | Amounts | Cost ($) | Value ($) (Depreciation) ($) |
| Purchases; | | | | |
| Euro, | | | | |
| Expiring 12/1/2010 | 365,870 | 484,266 | 474,915 | (9,351) |
| Sales: | | Proceeds ($) | | |
| Hong Kong Dollar, | | | | |
| Expiring 12/1/2010 | 9,141,566 | 1,177,475 | 1,177,263 | 212 |
| Hong Kong Dollar, | | | | |
| Expiring 12/2/2010 | 5,203,035 | 669,786 | 670,053 | (267) |
| Gross Unrealized | | | | |
| Appreciation | | | | 212 |
| Gross Unrealized | | | | |
| Depreciation | | | | (9,618) |
The following summarizes the average market value of derivatives outstanding during the period ended November 30, 2010:
| |
| | Value ($) |
| Forward Contracts | 7,494,907 |
At November 30, 2010, the cost of investments for federal income tax purposes was $757,570,143; accordingly, accumulated net unrealized appreciation on investments was $62,949,605, consisting of $84,390,701 gross unrealized appreciation and $21,441,096 gross unrealized depreciation.
30
REPORT OF INDEPENDENT REGISTERED
PUBLIC ACCOUNTING FIRM
Shareholders and Board of Directors
International Stock Fund
We have audited the accompanying statement of assets and liabilities, including the statement of investments, of International Stock Fund (one of the series comprising Strategic Funds, Inc.) as of November 30, 2010, and the related statement of operations for the year then ended, the statement of changes in net assets for each of the two years in the period then ended and financial highlights for each of the periods indicated therein. These financial statements and financial highlights are the responsibility of the Fund’s management. Our responsibility is to express an opinion on these financial statements and financial highlights based on our audits.
We conducted our audits in accordance with the standards of the Public Company Accounting Oversight Board (United States).Those standards require that we plan and perform the audit to obtain reasonable assurance about whether the financial statements and financial highlights are free of material misstatement.We were not engaged to perform an audit of the Fund’s internal control over financial reporting. Our audits included consideration of internal control over financial reporting as a basis for designing audit procedures that are appropriate in the circumstances, but not for the purpose of expressing an opinion on the effectiveness of the Fund’s internal control over financial reporting. Accordingly, we express no such opinion.An audit also includes examining, on a test basis, evidence supporting the amounts and disclosures in the financial statements and financial highlights, assessing the accounting p rinciples used and significant estimates made by management, and evaluating the overall financial statement presentation. Our procedures included confirmation of securities owned as of November 30, 2010 by correspondence with the custodian and others. We believe that our audits provide a reasonable basis for our opinion.
In our opinion, the financial statements and financial highlights referred to above present fairly, in all material respects, the financial position of International Stock Fund at November 30, 2010, the results of its operations for the year then ended, the changes in its net assets for each of the two years in the period then ended and the financial highlights for each of the indicated periods, in conformity with U.S. generally accepted accounting principles.

New York, New York
January 25, 2011
TheFund 31
IMPORTANT TAX INFORMATION (Unaudited)
In accordance with federal tax law, the fund elects to provide each shareholder with their portion of the fund’s foreign taxes paid and the income sourced from foreign countries. Accordingly, the fund hereby makes the following designations regarding its fiscal year ended November 30, 2010:
—the total amount of taxes paid to foreign countries was $853,758
—the total amount of income sourced from foreign countries was $12,522,538.
Where required by federal tax law rules, shareholders will receive notification of their proportionate share of foreign taxes paid and foreign sourced income for the 2010 calendar year with Form 1099-DIV which will be mailed in early 2011.
For the fiscal year ended November 30, 2010, certain dividends paid by the fund may be subject to a maximum tax rate of 15%, as provided for by the Jobs and Growth Tax Relief Reconciliation Act of 2003. Of the distributions paid during the fiscal year, $3,453,834 represents the maximum amount that may be considered qualified dividend income.
32
INFORMATION ABOUT THE REVIEW AND APPROVAL
OF THE FUND’S MANAGEMENT AGREEMENT AND
SUB-INVESTMENT ADVISORY AGREEMENT (Unaudited)
At a meeting of the fund’s Board of Directors held on November 8-9, 2010, the Board considered the renewal of the fund’s Management Agreement with Dreyfus pursuant to which Dreyfus provides the fund with investment advisory and administrative services, and of Dreyfus’ Sub-Investment Advisory Agreement with Walter Scott & Partners Limited (“Walter Scott”)(the “Sub-Investment Advisory Agreement”), pursuant to which Walter Scott serves as sub-investment adviser and provides day-to-day management of the fund’s portfolio (collectively, the “Agreements”).The Board members, none of whom are “interested persons” (as defined in the Investment Company Act of 1940, as amended) of the fund, were assisted in their review by independent legal counsel and met with counsel in executive session separate from representatives of Dreyfus and Walter Scott. In considering the renewal of the Agreements, the Board considered all factors that it believed to be relevant, including those discussed below.The Board did not identify any one factor as dispositive, and each Board member may have attributed different weights to the factors considered.
Analysis of Nature, Extent and Quality of Services Provided to the Fund.The Board members considered information previously provided to them in a presentation from representatives of Dreyfus regarding the nature, extent, and quality of the services provided to funds in the Dreyfus fund complex, and by Walter Scott to the fund pursuant to the Sub-Advisory Agreement, and representatives of Dreyfus and Walter Scott confirmed that there had been no material changes in this information. Dreyfus provided the number of open accounts in the fund, the fund’s asset size and the allocation of fund assets among distribution channels. Dreyfus also had previously provided information regarding the diverse intermediary relationships and distribution channels of funds in the Dreyfus fund complex and Dreyfus’ corresponding need for broad, d eep, and diverse resources to be able to provide ongoing shareholder services to each distribution channel, including the distribution channel(s) for the fund.
TheFund 33
INFORMATION ABOUT THE REVIEW AND APPROVAL OF THE
FUND’S MANAGEMENT AGREEMENT AND SUB-INVESTMENT
ADVISORY AGREEMENT (Unaudited) (continued)
The Board members also considered research support available to, and portfolio management capabilities of, the fund’s portfolio management personnel and that Dreyfus also provides oversight of day-to-day fund operations, including fund accounting and administration and assistance in meeting legal and regulatory requirements.The Board members also considered Dreyfus’ extensive administrative, accounting, and compliance infrastructures, and Dreyfus’ supervisory activities over Walter Scott. The Board also considered portfolio management’s brokerage policies and practices (including policies and practices regarding soft dollars) and the standards applied in seeking best execution.
Comparative Analysis of the Fund’s Performance and Management Fee and Expense Ratio. The Board members reviewed reports prepared by Lipper, Inc. (“Lipper”), an independent provider of investment company data, which included information comparing (1) the fund’s performance with the performance of a group of comparable funds (the “Performance Group”) and with a broader group of funds (the “Performance Universe”), all for various periods ended September 30, 2010, and (2) the fund’s actual and contractual management fees and total expenses with those of a group of comparable funds (the “Expense Group”) and with a broader group of funds (the “Expense Universe”), the information for which was derived in part from fund financial statements available to Lipper as of September 3 0, 2010. Dreyfus previously had furnished the Board with a description of the methodology Lipper used to select the Performance Group and Performance Universe and the Expense Group and Expense Universe.
Dreyfus representatives stated that the usefulness of performance comparisons may be affected by a number of factors, including different investment limitations that may be applicable to the fund and comparison funds.The Board members discussed the results of the comparisons and noted that the fund’s total return performance was above the Performance Group and Performance Universe medians for the various periods. The Board also noted that the fund ranked first in the
34
Performance Group and second in the Performance Universe, each for the 3-year period. Dreyfus also provided a comparison of the fund’s calendar year total returns to the returns of the fund’s benchmark index.
The Board members also reviewed the range of actual and contractual management fees and total expenses of the Expense Group and Expense Universe funds and discussed the results of the comparisons. They noted that the fund’s contractual management fee was below the Expense Group median, the fund’s actual management fee was at the Expense Group median and was above the Expense Universe median, and the fund’s total expenses were below the Expense Group and Expense Universe medians.
Representatives of Dreyfus noted that there were no funds in the same Lipper category as the fund managed by Dreyfus,Walter Scott, or their affiliates, or separate accounts and/or other types of client portfolios managed by Dreyfus or Walter Scott considered to have similar investment strategies and policies as the fund.
The Board considered the fee toWalter Scott in relation to the fee paid to Dreyfus by the fund and the respective services provided by Walter Scott and Dreyfus.The Board also noted Walter Scott’s fee is paid by Dreyfus (out of its fee from the fund) and not the fund.
Analysis of Profitability and Economies of Scale. Dreyfus’ representatives reviewed the expenses allocated and profit received by Dreyfus and the resulting profitability percentage for managing the fund, and the method used to determine the expenses and profit. The Board concluded that the profitability results were not unreasonable given the services rendered and service levels provided by Dreyfus.The Board previously had been provided with information prepared by an independent consulting firm regarding Dreyfus’ approach to allocating costs to, and determining the profitability of, individual funds and the entire Dreyfus fund complex. The consulting firm also had analyzed where any economies of scale might emerge in connection with the management of a fund.
TheFund 35
INFORMATION ABOUT THE REVIEW AND APPROVAL OF THE
FUND’S MANAGEMENT AGREEMENT AND SUB-INVESTMENT
ADVISORY AGREEMENT (Unaudited) (continued)
The Board’s counsel stated that the Board members should consider the profitability analysis (1) as part of their evaluation of whether the fees under the Agreements bear a reasonable relationship to the mix of services provided by Dreyfus and Walter Scott, including the nature, extent and quality of such services, and (2) in light of the relevant circumstances for the fund and the extent to which economies of scale would be realized if the fund grows and whether fee levels reflect these economies of scale for the benefit of fund shareholders. Since Dreyfus, and not the fund, pays Walter Scott pursuant to the Sub-Advisory Agreement, the Board did not consider Walter Scott’s profitability to be relevant to its deliberations. Dreyfus representatives noted that, as a result of shared and allocated costs among funds in the Dreyfus funds complex, the extent of economies of scale could depend substantially on the level of assets in the complex as a whole, so that increases and decreases in complex-wide assets can affect potential economies of scale in a manner that is disproportionate to, or even in the opposite direction from, changes in the fund’s asset level.The Board members also considered potential benefits to Dreyfus and Walter Scott from acting as investment adviser and sub-investment adviser, respectively, and noted there were no soft dollar arrangements in effect for trading the fund’s investments.
At the conclusion of these discussions, the Board agreed that it had been furnished with sufficient information to make an informed business decision with respect to the renewal of the Agreements. Based on the discussions and considerations as described above, the Board concluded and determined as follows.
The Board concluded that the nature, extent, and quality of the services provided by Dreyfus and Walter Scott are adequate and appropriate.
The Board was satisfied with the fund’s performance, in light of the considerations described above.
The Board concluded that the fees paid to Dreyfus and Walter Scott were reasonable in light of the considerations described above.
36
The Board determined that the economies of scale which may accrue to Dreyfus and its affiliates in connection with the management of the fund had been adequately considered by Dreyfus in connection with the fee rate charged to the fund pursuant to the Agreement and that, to the extent in the future it were determined that material economies of scale had not been shared with the fund, the Board would seek to have those economies of scale shared with the fund.
The Board members considered these conclusions and determinations, along with information received on a routine and regular basis throughout the year. In addition, it should be noted that the Board’s consideration of the contractual fee arrangements for this fund had the benefit of a number of years of reviews of prior or similar agreements during which lengthy discussions took place between the Board members and Dreyfus representatives. Certain aspects of the arrangements may receive greater scrutiny in some years than in others, and the Board members’ conclusions may be based, in part, on their consideration of the same or similar arrangements in prior years. The Board members determined that renewal of the Agreements was in the best interests of the fund and its shareholders.
TheFund 37
BOARD MEMBERS INFORMATION (Unaudited)
|
| Joseph S. DiMartino (67) |
| Chairman of the Board (1995) |
| Principal Occupation During Past 5Years: |
| • Corporate Director and Trustee |
| Other Public Company Board Memberships During Past 5Years: |
| • CBIZ (formerly, Century Business Services, Inc.), a provider of outsourcing functions for small |
| and medium size companies, Director (1997-present) |
| • The Newark Group, a provider of a national market of paper recovery facilities, paperboard |
| mills and paperboard converting plants, Director (2000-2010) |
| • Sunair Services Corporation, a provider of certain outdoor-related services to homes and |
| businesses, Director (2005-2009) |
| No. of Portfolios for which Board Member Serves: 170 |
| ——————— |
| David W. Burke (74) |
| Board Member (1994) |
| Principal Occupation During Past 5Years: |
| • Corporate Director and Trustee |
| No. of Portfolios for which Board Member Serves: 85 |
| ——————— |
| William Hodding Carter III (75) |
| Board Member (1988) |
| Principal Occupation During Past 5Years: |
| • Professor of Leadership & Public Policy, University of North Carolina, Chapel Hill (2006-present) |
| • President and Chief Executive Officer of the John S. and James L. Knight Foundation (1998-2006) |
| No. of Portfolios for which Board Member Serves: 30 |
| ——————— |
| Gordon J. Davis (69) |
| Board Member (2006) |
| Principal Occupation During Past 5Years: |
| • Partner in the law firm of Dewey & LeBoeuf LLP |
| Other Public Company Board Memberships During Past 5Years: |
| • Consolidated Edison, Inc., a utility company, Director (1997-present) |
| • The Phoenix Companies, Inc., a life insurance company, Director (2000-present) |
| No. of Portfolios for which Board Member Serves: 45 |
38
|
| Joni Evans (68) |
| Board Member (2006) |
| Principal Occupation During Past 5Years: |
| • Chief Executive Officer, www.wowOwow.com an online community dedicated to women’s |
| conversations and publications |
| • Principal, Joni Evans Ltd. (publishing) |
| • Senior Vice President of the William Morris Agency (1994-2006) |
| No. of Portfolios for which Board Member Serves: 30 |
| ——————— |
| Ehud Houminer (70) |
| Board Member (1994) |
| Principal Occupation During Past 5Years: |
| • Executive-in-Residence at the Columbia Business School, Columbia University |
| Other Public Company Board Memberships During Past 5Years: |
| • Avnet Inc., an electronics distributor, Director (1993-present) |
| No. of Portfolios for which Board Member Serves: 63 |
| ——————— |
| Richard C. Leone (70) |
| Board Member (1984) |
| Principal Occupation During Past 5Years: |
| • President of The Century Foundation (formerly,The Twentieth Century Fund, Inc.), a tax |
| exempt research foundation engaged in the study of economic, foreign policy and domestic issues |
| Other Public Company Board Memberships During Past 5Years: |
| • Partnership for a Secure America, Director |
| No. of Portfolios for which Board Member Serves: 30 |
| ——————— |
| Hans C. Mautner (73) |
| Board Member (1984) |
| Principal Occupation During Past 5Years: |
| • President—International Division and an Advisory Director of Simon Property Group, a real |
| estate investment company |
| • Chairman and Chief Executive Officer of Simon Global Limited |
| No. of Portfolios for which Board Member Serves: 30 |
TheFund 39
BOARD MEMBERS INFORMATION (Unaudited) (continued)
|
| Robin A. Melvin (47) |
| Board Member (1995) |
| Principal Occupation During Past 5Years: |
| • Director, Boisi Family Foundation, a private family foundation that supports youth-serving |
| organizations that promote the self sufficiency of youth from disadvantaged circumstances |
| (1995-present) |
| • SeniorVice President, Mentor, a national non-profit youth mentoring organization (1992-2005) |
| No. of Portfolios for which Board Member Serves: 41 |
| ——————— |
| Burton N. Wallack (60) |
| Board Member (2006) |
| Principal Occupation During Past 5Years: |
| • President and Co-owner of Wallack Management Company, a real estate management company |
| No. of Portfolios for which Board Member Serves: 30 |
| ——————— |
| John E. Zuccotti (73) |
| Board Member (1984) |
| Principal Occupation During Past 5Years: |
| • Chairman of Brookfield Financial Properties, Inc. |
| • Senior Counsel of Weil, Gotshal & Manges, LLP |
| • Emeritus Chairman of the Real Estate Board of New York |
| Other Public Company Board Memberships During Past 5Years: |
| • Wellpoint, Inc., a health benefits company, Director (2005-present) |
| No. of Portfolios for which Board Member Serves: 30 |
| ——————— |
| Once elected all Board Members serve for an indefinite term, but achieve Emeritus status upon reaching age 80.The |
| address of the Board Members and Officers is in c/o The Dreyfus Corporation, 200 Park Avenue, NewYork, NewYork |
| 10166.Additional information about the Board Members is available in the fund’s Statement of Additional Information |
| which can be obtained from Dreyfus free of charge by calling this toll free number: 1-800-554-4611. |
| Arnold S. Hiatt, Emeritus Board Member |
40
OFFICERS OF THE FUND (Unaudited)
TheFund 41
OFFICERS OF THE FUND (Unaudited) (continued)
42
TheFund 43
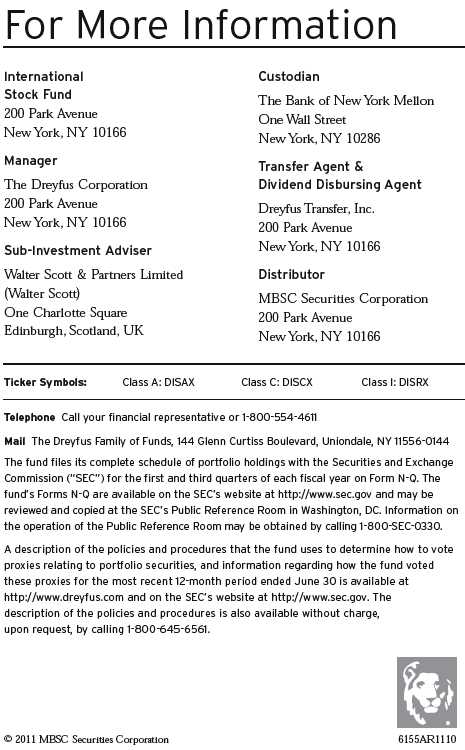
Item 2. Code of Ethics.
The Registrant has adopted a code of ethics that applies to the Registrant's principal executive officer, principal financial officer, principal accounting officer or controller, or persons performing similar functions. There have been no amendments to, or waivers in connection with, the Code of Ethics during the period covered by this Report.
Item 3. Audit Committee Financial Expert.
The Registrant's Board has determined that Ehud Houminer, a member of the Audit Committee of the Board, is an audit committee financial expert as defined by the Securities and Exchange Commission (the "SEC"). Ehud Houminer is "independent" as defined by the SEC for purposes of audit committee financial expert determinations.
Item 4. Principal Accountant Fees and Services.
(a) Audit Fees. The aggregate fees billed for each of the last two fiscal years (the "Reporting Periods") for professional services rendered by the Registrant's principal accountant (the "Auditor") for the audit of the Registrant's annual financial statements or services that are normally provided by the Auditor in connection with the statutory and regulatory filings or engagements for the Reporting Periods, were $ 130,875 in 2009 and $ 130,934 in 2010.
(b) Audit-Related Fees. The aggregate fees billed in the Reporting Periods for assurance and related services by the Auditor that are reasonably related to the performance of the audit of the Registrant's financial statements and are not reported under paragraph (a) of this Item 4 were $ 15,828 in 2009 and $21,528 in 2010. These services consisted of one or more of the following: (i) agreed upon procedures related to compliance with Internal Revenue Code section 817(h), (ii) security counts required by Rule 17f-2 under the Investment Company Act of 1940, as amended, (iii) advisory services as to the accounting or disclosure treatment of Registrant transactions or events and (iv) advisory services to the accounting or disclosure treatment of the actual or potential impact to the Registrant of final or proposed rules, standards or interpretations by the Securities and Exchange Commission, the Financial Accounting Standards Boards or other regulatory or standard-setting bodies.
The aggregate fees billed in the Reporting Periods for non-audit assurance and related services by the Auditor to the Registrant's investment adviser (not including any sub-investment adviser whose role is primarily portfolio management and is subcontracted with or overseen by another investment adviser), and any entity controlling, controlled by or under common control with the investment adviser that provides ongoing services to the Registrant ("Service Affiliates"), that were reasonably related to the performance of the annual audit of the Service Affiliate, which required pre-approval by the Audit Committee were $0 in 2009 and $0 in 2010.
(c) Tax Fees. The aggregate fees billed in the Reporting Periods for professional services rendered by the Auditor for tax compliance, tax advice, and tax planning ("Tax Services") were $13,113 in 2009 and 14,543 in 2010. These services consisted of: (i) review or preparation of U.S. federal, state, local and excise tax returns; (ii) U.S. federal, state and local tax planning, advice and assistance regarding statutory, regulatory or administrative developments; (iii) tax advice regarding tax qualification matters and/or treatment of various financial instruments held or proposed to be acquired or held, and (iv) determination of Passive Foreign Investment Companies. The aggregate fees billed in the Reporting Periods for Tax Services by the Auditor to Service Affiliates, which required pre-approval by the Audit Committee were $0 in 2009 and $0 in 2010.
(d) All Other Fees. The aggregate fees billed in the Reporting Periods for products and services provided by the Auditor, other than the services reported in paragraphs (a) through (c) of this Item, were $59 in 2009 and $371 in 2010. [These services consisted of a review of the Registrant's anti-money laundering program].
The aggregate fees billed in the Reporting Periods for Non-Audit Services by the Auditor to Service Affiliates, other than the services reported in paragraphs (b) through (c) of this Item, which required pre-approval by the Audit Committee, were $0 in 2009 and $0 in 2010.
(e)(1) Audit Committee Pre-Approval Policies and Procedures. The Registrant's Audit Committee has established policies and procedures (the "Policy") for pre-approval (within specified fee limits) of the Auditor's engagements for non-audit services to the Registrant and Service Affiliates without specific case-by-case consideration. The pre-approved services in the Policy can include pre-approved audit services, pre-approved audit-related services, pre-approved tax services and pre-approved all other services. Pre-approval considerations include whether the proposed services are compatible with maintaining the Auditor's independence. Pre-approvals pursuant to the Policy are considered annually.
(e)(2) Note: None of the services described in paragraphs (b) through (d) of this Item 4 were approved by the Audit Committee pursuant to paragraph (c)(7)(i)(C) of Rule 2-01 of Regulation S-X.
(f) None of the hours expended on the principal accountant's engagement to audit the registrant's financial statements for the most recent fiscal year were attributed to work performed by persons other than the principal account's full-time, permanent employees.
Non-Audit Fees. The aggregate non-audit fees billed by the Auditor for services rendered to the Registrant, and rendered to Service Affiliates, for the Reporting Periods were $26,086,988 in 2009 and $33,851,490 in 2010.
Auditor Independence. The Registrant's Audit Committee has considered whether the provision of non-audit services that were rendered to Service Affiliates, which were not pre-approved (not requiring pre-approval), is compatible with maintaining the Auditor's independence.
Item 5. Audit Committee of Listed Registrants.
Not applicable. [CLOSED-END FUNDS ONLY]
Item 6. Investments.
(a) Not applicable.
Item 7. Disclosure of Proxy Voting Policies and Procedures for Closed-End Management Investment Companies.
Not applicable. [CLOSED-END FUNDS ONLY]
Item 8. Portfolio Managers of Closed-End Management Investment Companies.
Not applicable. [CLOSED-END FUNDS ONLY, beginning with reports for periods ended on and after December 31, 2005]
Item 9. Purchases of Equity Securities by Closed-End Management Investment Companies and Affiliated Purchasers.
Not applicable. [CLOSED-END FUNDS ONLY]
Item 10. Submission of Matters to a Vote of Security Holders.
There have been no material changes to the procedures applicable to Item 10.
Item 11. Controls and Procedures.
(a) The Registrant's principal executive and principal financial officers have concluded, based on their evaluation of the Registrant's disclosure controls and procedures as of a date within 90 days of the filing date of this report, that the Registrant's disclosure controls and procedures are reasonably designed to ensure that information required to be disclosed by the Registrant on Form N-CSR is recorded, processed, summarized and reported within the required time periods and that information required to be disclosed by the Registrant in the reports that it files or submits on Form N-CSR is accumulated and communicated to the Registrant's management, including its principal executive and principal financial officers, as appropriate to allow timely decisions regarding required disclosure.
(b) There were no changes to the Registrant's internal control over financial reporting that occurred during the second fiscal quarter of the period covered by this report that have materially affected, or are reasonably likely to materially affect, the Registrant's internal control over financial reporting.
Item 12. Exhibits.
(a)(1) Code of ethics referred to in Item 2.
(a)(2) Certifications of principal executive and principal financial officers as required by Rule 30a-2(a) under the Investment Company Act of 1940.
(a)(3) Not applicable.
(b) Certification of principal executive and principal financial officers as required by Rule 30a-2(b) under the Investment Company Act of 1940.
SIGNATURES
Pursuant to the requirements of the Securities Exchange Act of 1934 and the Investment Company Act of 1940, the Registrant has duly caused this Report to be signed on its behalf by the undersigned, thereunto duly authorized.
STRATEGIC FUNDS, INC
By: /s/ Bradley J. Skapyak |
Bradley J. Skapyak, President |
Date: | January 24, 2011 |
|
Pursuant to the requirements of the Securities Exchange Act of 1934 and the Investment Company Act of 1940, this Report has been signed below by the following persons on behalf of the Registrant and in the capacities and on the dates indicated. |
|
By: /s/ Bradley J. Skapyak |
Bradley J. Skapyak, President |
Date: | January 24, 2011 |
|
By: /s/ James Windels |
James Windels, Treasurer |
Date: | _ January 24, 2011 |
|
EXHIBIT INDEX
(a)(1) Code of ethics referred to in Item 2.
(a)(2) Certifications of principal executive and principal financial officers as required by Rule 30a-2(a) under the Investment Company Act of 1940. (EX-99.CERT)
(b) Certification of principal executive and principal financial officers as required by Rule 30a-2(b) under the Investment Company Act of 1940. (EX-99.906CERT)