UNITED STATES
SECURITIES AND EXCHANGE COMMISSION
Washington, D.C. 20549
FORM N-CSR
CERTIFIED SHAREHOLDER REPORT OF REGISTERED
MANAGEMENT INVESTMENT COMPANIES
Investment Company Act File Number: 811-03942
LORD ABBETT MUNICIPAL INCOME FUND, INC.
(Exact name of Registrant as specified in charter)
90 Hudson Street, Jersey City, NJ 07302-3973
(Address of principal executive offices) (Zip code)
Lawrence B. Stoller, Esq.
Vice President, Secretary, and Chief Legal Officer
90 Hudson Street, Jersey City, New Jersey 07302-3973
(Name and address of agent for service)
Registrant’s telephone number, including area code: (888) 522-2388
Date of fiscal year end: 9/30
Date of reporting period: 9/30/2022
| Item 1: | Report(s) to Shareholders. |

LORD ABBETT
ANNUAL REPORT
Lord Abbett Municipal Income Fund
Short Duration Tax Free Fund
Intermediate Tax Free Fund
National Tax Free Fund
High Income Municipal Bond Fund
Short Duration High Income Municipal Bond Fund
Sustainable Municipal Bond Fund
California Tax Free Fund
New Jersey Tax Free Fund
New York Tax Free Fund
For the period ended September 30, 2022
Table of Contents
Lord Abbett Municipal Income Fund
Lord Abbett Short Duration Tax Free Fund, Lord Abbett Intermediate Tax Free Fund, Lord Abbett National Tax Free Income Fund, Lord Abbett High Income Municipal Bond Fund, Lord Abbett Short Duration High Income Municipal Bond Fund, Lord Abbett Sustainable Municipal Bond Fund, Lord Abbett California Tax Free Income Fund, Lord Abbett New Jersey Tax Free Income Fund, and Lord Abbett New York Tax Free Income Fund
Annual Report
For the period ended September 30, 2022
 From left to right: James L.L. Tullis, Chairman of the Lord Abbett Funds and Douglas B. Sieg Director, President and Chief Executive Officer of the Lord Abbett Funds. | | Dear Shareholders: We are pleased to provide you with this overview of the performance of the Funds for the period ended September 30, 2022. On this page and the following pages, we discuss the major factors that influenced period performance. For detailed and timely information about the Funds, please visit our website at www.lordabbett.com, where you can also access the quarterly commentaries that provide updates on each Fund’s performance and other portfolio related updates. Thank you for investing in Lord Abbett mutual funds. We value the trust that you place in us and look forward to serving your investment needs in the years to come. Best regards, 
Douglas B. Sieg Director, President and Chief Executive Officer |
| | | |
Municipal Bond Market Review
The U.S. economy showed strength at the start of the fiscal year on the back of a better-than-expected recovery from
the pandemic. In the three-month period ending December 31, 2021, real gross domestic product (“GDP”) rose at an annual rate of 6.9%. However, momentum slowed in the new calendar
1
year with the economy contracting in two consecutive quarters, decreasing by 1.6% on an annual basis in the first quarter of 2022 and by 0.6% during the second quarter, according to the Bureau of Economic Analysis. The economy reverted back to growth by the third quarter of 2022 with GDP rising by 2.6%1. The labor market continued to strengthen throughout much of the 12-month period, as the unemployment rate in September of 2022 ticked down to 3.5%, matching the 50-year record low, versus the 4.6% reading in October of 2021, according to the Bureau of Labor Statistics. Inflation readings, as represented by the 12-month percentage change of the Consumer Price Index, continued to increase throughout much of the fiscal year. The period started with a 6.2% reading in October, peaked at 9.1% in June and September showed annual growth of 8.2%.2
The municipal market, as represented by the Bloomberg Municipal Bond Index3, returned -11.50% for the 12-month period ending 9/30/2022. The primary driver of performance over the year was the significant rise in rates across the curve, as AAA-rated general obligation (“GO”) municipal yields4 rose 287 basis points (“bps”) at the 2-year, 258 bps at the 5-year, 213 bps at the 10-year and 222 bps at the 30-year key rate. Given this extreme upward shift in yields, shorter-maturity bonds outperformed longer maturities. Regarding sector performance, the more defensive Electric and Water/Sewer sectors
led over the quarter, with longer duration sectors such as Health Care and Housing underperforming with the continued overall rise in interest rates. In regard to Health Care, the sector has also experienced some fundamental headwinds over the period due to rising cost pressures and labor shortages. In terms of credit quality, lower-quality bonds underperformed, partly as a function of their longer duration along with spread widening, as BBB-rated bonds trailed, and AAA-rated bonds led within the investment grade range. The high yield segment of the municipal bond market, as represented by the Bloomberg High Yield Municipal Bond Index5, returned -15.05% throughout the 12-month period.
For the calendar year-to-date period ended September 30, 2022, municipal bond issuance totaled roughly $301 billion, a decrease compared with the prior calendar year-to-date period, which totaled approximately $359 billion, according to JP Morgan. In the 12-month period ending September 30, 2022, municipal bond funds experienced -$86.9 billion in net outflows, according to the Investment Company Institute, compared to $96.3 billion in net inflows in the previous 12-month period.
The municipal market experienced volatility at the start of the fiscal year with tax exempt yields rising across the curve, following increasing Treasury yields as investors grappled with uncertainties around inflation. Adding to the volatility was some political
2
uncertainty as the Infrastructure Investment and Jobs Act (“Infrastructure Bill”) remained tied up in the House of Representatives.
Markets rebounded in November as the Infrastructure Bill was signed into law by President Biden. The legislation provided for over $1 trillion in total spending (with $550 billion in new spending) for roads and bridges, ports, airports, power grids, water systems, and rail networks, among other initiatives. While market participants were disappointed by the omission of federally subsidized interest payments and tax exempt refunding, the passage of the Infrastructure Bill brought the potential for improvement of the already strong balance sheets of many municipal issuers along with the potential to spur economic growth across the country.
Municipals had a strong finish to 2021, generally outperforming Treasuries as the markets experienced bouts of volatility driven by the discovery and transmission of the Omicron variant and continuing uncertainty regarding inflation. Municipal funds were in demand, closing the year with record inflows of $101.7 billion in 2021 and a streak of positive inflows in 84 of the previous 85 weeks.
The new year marked a clear shift from the low volatility and generally strong environment of 2021, with the first half of 2022 bringing one of the worst performances for the municipal
market on record as measured by total return. Numerous headwinds emerged as inflation expectations began accelerating in tandem with an increasingly hawkish posture by the Federal Reserve while an unexpected geopolitical crisis in Ukraine further heightened inflationary fears and dampened global growth prospects. Throughout the early months of 2022, inflation readings continued to come in higher than anticipated while the market’s expectation of 75 bps of interest rate hikes by the Fed for 2022 was quickly repriced to 225 bps of rate hikes throughout the year and the 10-year U.S. Treasury yield rose to levels not seen since prior to the pandemic. Along the same lines, the demand trend for municipal bonds seen in 2021 reversed and outflows ensued for much of 2022.
While the rates and inflation narrative underpinned most of 2022, the market experienced two brief respites in the back half of May and throughout July in which the municipal market rebounded temporarily and Treasury yields declined. In the latter month, the market experienced its best monthly performance since 2020, longer-dated bonds outperformed and there was positive, but fleeting flows into municipal bond funds. However, markets retreated once again in the last months of the period.
As such, rising rates were the primary headwind for municipal bonds
3
throughout much of 2022, and longer-duration bonds significantly underperformed. While municipal bonds’ price declines were meaningful, they were driven by higher Treasury yields rather than concerns over credit fundamentals. The credit backdrop continued to strengthen throughout 2022 due to above-average, year-over-year tax revenue growth, as numerous states experienced fiscal surpluses, increased pension contributions and returned money to taxpayers for the first time in years. Similarly, upgrades continued to significantly outpace downgrades throughout the year and the par value of defaulted municipal bonds through September decreased meaningfully compared to the same period in 2021.
Short Duration Tax Free
The Short Duration Tax Free Fund returned -5.68%, reflecting performance at the net asset value (NAV) of class A Shares with all distributions reinvested, for the 12-month period ending September 30, 2022. The Fund’s benchmark, the Bloomberg Municipal Bond Short 1-5 Year Index6, returned -5.11% during the same period. The primary driver of underperformance was the Fund’s credit quality allocation. Over the period, lower-rated bonds underperformed higher-rated bonds, particularly in the latter half of the fiscal year. Therefore, the Fund’s overweight allocation to the lower quality,
investment grade credit tiers of ‘BBB’ and ‘A’ detracted from relative performance.
The Fund’s yield curve positioning led to a positive impact on relative performance. As the curve flattened over the period with short-term rates rising more than intermediate and longer-term rates, the Fund’s duration underweight to the 2-year key rate and modest overweight to the intermediate part of the curve contributed to relative returns.
In terms of sector positioning, the Fund’s overweight to the Housing and Industrial Development (IDR) sectors as well as its underweight to pre-refunded bonds detracted from relative performance. Generally, we prefer the higher degree of liquidity of the IDR sector, as buyers outside the tax exempt universe typically actively trade bonds within the segment. However, the Fund’s underperformance within the sector was mainly due to technical pressures as outflows from municipal bond funds ensued throughout much of the year and many IDR bonds experienced notable selling pressure. All of this detraction was offset by security selection within Housing, as holdings of higher quality credits within the sector benefitted relative performance.
Intermediate Tax Free
The Intermediate Tax Free Fund returned -12.36%, reflecting performance at the net asset value (NAV) of class A Shares with all distributions reinvested, for the 12-month period ending
4
September 30, 2022. The Fund’s benchmark, the Bloomberg 1-15 Year Municipal Bond Index7, returned -8.86% during the same period. The primary driver of relative underperformance over the period was the Fund’s duration positioning. Due to uncertainties around monetary policy and inflation, the municipal yield curve shifted upwards significantly over the period. Given this dramatic rise in yields, the strategy’s longer duration relative to the benchmark was the most notable detractor over the one-year period.
The Fund’s overweight to bonds rated ‘BBB’ and below also detracted from relative returns. Over the one-year period, lower-rated bonds underperformed higher-rated bonds, particularly in the latter half of the fiscal year.
Security selection and the Fund’s sector allocation dragged on relative performance over the period. The primary driver of underperformance from a sector perspective was the Fund’s overweight to, as well as security selection, within the Industrial Development (IDR) and Transportation sectors. Generally, we prefer the higher degree of liquidity of the IDR sector, as buyers outside the tax exempt universe typically actively trade bonds within the segment. However, the Fund’s underperformance within the sector was mainly due to technical pressures as outflows from municipal bond funds ensued throughout much of the year and many IDR bonds experienced
notable selling pressure. Additionally, the heavy supply of New York bonds was a headwind within the Transportation sector. While the Fund’s sector allocation and selection within several areas led to a positive impact on relative performance, the themes described above more than offset these factors and led to an overall negative impact on relative performance.
National Tax Free
The National Tax Free Fund returned -16.27%, reflecting performance at the net asset value (NAV) of class A Shares with all distributions reinvested, for the 12-month period ending September 30, 2022. The Fund’s benchmark, the Bloomberg Municipal Bond Index3, returned -11.50% during the same period. The primary driver of relative underperformance over the fiscal year was the Fund’s duration positioning. Due to uncertainties around monetary policy and inflation, the municipal yield curve shifted upwards significantly. Given this dramatic rise in yields, the strategy’s longer duration relative to the benchmark was the most notable detractor over the one-year period and significantly drove the relative underperformance of the Fund.
The Fund’s credit quality allocation also detracted from relative returns. Over the one-year period, lower-rated bonds underperformed higher-rated bonds, particularly in the latter half of the fiscal year. Therefore, the Fund’s overweight to bonds rated ‘BBB’ as well as its exposure
5
to non-investment grade bonds led to a negative impact on performance.
Security selection and the Fund’s sector allocation also dragged on relative performance over the period. The primary driver of relative underperformance from a sector perspective was the Fund’s overweight to, as well as security selection within the Industrial Development (IDR) sector. Generally, we prefer the higher degree of liquidity of the IDR sector, as buyers outside the tax exempt universe typically actively trade bonds within the segment. However, the Fund’s underperformance within the sector was mainly due to technical pressures as outflows from municipal bond funds ensued throughout much of the year and many IDR bonds experienced notable selling pressure. While the Fund’s sector allocation and selection within several areas led to a positive impact on relative performance, the aforementioned detraction more than offset these factors and led to an overall negative impact on relative performance.
High Income Municipal Bond
The High Income Municipal Bond Fund returned -18.19%, reflecting performance at the net asset value (NAV) of Class A Shares with all distributions reinvested, for the 12-month period ending September 30, 2022. The Fund’s benchmark, the Bloomberg High Yield Municipal Bond
Index5, returned -15.05% during the same period. The primary driver of relative underperformance over the fiscal year was the Fund’s duration positioning. Due to uncertainties around monetary policy and inflation, the municipal yield curve shifted upwards significantly. Given this dramatic rise in yields, the strategy’s longer duration relative to the benchmark was the most notable detractor over the one-year period.
Security selection and the Fund’s sector allocation also detracted from relative performance, particularly within the Health Care segment. Over the fiscal year, various Hospital systems experienced cost pressures and labor shortages leading to spreads widening within the sector. The Fund’s exposure to the Industrial Development (IDR) sector also detracted from relative performance. Generally, we prefer the higher degree of liquidity of the IDR sector, as buyers outside the tax exempt universe typically actively trade bonds within the segment. However, the Fund’s underperformance within the sector was mainly due to technical pressures as outflows from municipal bond funds ensued throughout much of the year and many IDR bonds experienced notable selling pressure. While the Fund’s sector allocation and selection within several areas led to a positive impact on relative performance, the themes described above more than offset these factors and led to an overall negative impact on relative performance.
6
While the Fund’s quality allocation dragged on relative performance over the period, the impact on performance was relatively minor in relation to the effects of duration and security selection positioning.
Short Duration High Income Municipal Bond
The Short Duration High Income Municipal Bond Fund returned -10.85%, reflecting performance at the net asset value (NAV) of class A Shares with all distributions reinvested, for the 12-month period ending September 30, 2022. The Fund’s benchmark, the Bloomberg Municipal Bond 1-8 Year Index8, returned -6.47% during the same period. The primary driver of relative underperformance was the Fund’s quality positioning. Over the one-year period, lower-rated bonds underperformed higher-quality bonds, particularly in the latter half of the fiscal year. Therefore, the Fund’s lower quality bias relative to the benchmark and exposure to non-investment grade bonds was the most meaningful detractor from relative performance over the one-year period.
The Fund’s duration positioning also detracted from relative returns. Due to uncertainties around monetary policy and inflation, the municipal yield curve shifted upwards significantly. Given this dramatic rise in yields, the strategy’s longer duration relative to the benchmark led to a negative impact on performance.
Security selection and the Fund’s sector allocation also detracted from relative performance, mainly stemming from the Fund’s exposure to the Industrial Development (IDR) sector. Generally, we prefer the higher degree of liquidity of the IDR sector, as buyers outside the tax exempt universe typically actively trade bonds within the segment. However, the Fund’s underperformance within the sector was mainly due to technical pressures as outflows from municipal bond funds ensued throughout much of the year and many IDR bonds experienced notable selling pressure. While the Fund’s sector allocation and selection within several areas led to a positive impact on relative performance, the aforementioned detraction more than offset these factors and led to an overall negative impact on relative performance.
Sustainable Municipal Bond Fund
The Sustainable Municipal Bond Fund returned -10.85%, reflecting performance at the net asset value (NAV) of class A Shares with all distributions reinvested, for the period starting January 20, 2022, at the Fund’s performance inception, and ending September 30, 2022. The Fund’s benchmark, the Bloomberg 1-15 Year Municipal Bond Index7, returned -8.12% during the same period. The primary driver of relative underperformance over the period was the Fund’s duration positioning. Due to uncertainties around
7
monetary policy and inflation, the municipal yield curve shifted upwards significantly. Given this dramatic rise in yields, the strategy’s longer duration relative to the benchmark was the most notable detractor since inception.
The Fund’s credit quality allocation also detracted from relative returns. Over the period, lower rated bonds underperformed higher rated bonds, particularly in the latter half of the fiscal year. Therefore, the Fund’s overweight to bonds rated ‘BBB’ as well as its exposure to non-investment grade bonds led to a negative impact on performance.
Security selection contributed to relative performance over the period, mainly driven by selection within the Housing sector as well as the Leasing, Water/Sewer and Transportation sectors. The positive impact across many of these sectors was tied to selection of credits with favorable bond structure, including coupon, call protection and convexity profile.
The Fund’s sector allocation dragged modestly on relative performance over the period, primarily due to an overweight to the Health Care and Housing sectors. Over the period, various Hospital systems experienced cost pressures and labor shortages leading to spreads widening within the sector.
California Tax Free
The California Tax Free Fund returned -16.10%, reflecting performance at the net asset value (NAV) of class A Shares
with all distributions reinvested, for the 12-month period ending September 30, 2022. The Fund’s benchmark, the Bloomberg Municipal Bond Index3, returned -11.50% during the same period. The primary driver of relative underperformance over the fiscal year was the Fund’s duration positioning. Due to uncertainties around monetary policy and inflation, the municipal yield curve shifted upwards significantly. Given this dramatic rise in yields, the strategy’s longer duration relative to the benchmark was the most notable detractor over the one-year period and significantly drove the relative underperformance of the Fund.
The Fund’s credit quality allocation also detracted from relative returns. Over the one-year period, lower-rated bonds underperformed higher-rated bonds, particularly in the latter half of the fiscal year. Therefore, the Fund’s overweight to bonds rated ‘BBB’ as well as its exposure to non-investment grade bonds led to a negative impact on performance.
Security selection and the Fund’s sector allocation also dragged on performance over the period. The primary detractor was the Fund’s overweight to, as well as selection within, the Tobacco sector. Within the sector, the Fund’s holdings of select zero coupon and longer maturity bonds, which are more sensitive to rising rates, dragged on performance with the upward shift of the yield curve. Additionally, the Fund’s overweight to, as well as security selection within, the
8
Industrial Development (IDR) sector detracted from relative performance. Generally, we prefer the higher degree of liquidity of the IDR sector, as buyers outside the tax exempt universe typically actively trade bonds within the segment. However, the Fund’s underperformance within the sector was mainly due to technical pressures as outflows from municipal bond funds ensued throughout much of the year and many IDR bonds experienced notable selling pressure. While the Fund’s sector allocation and selection within several areas led to a positive impact on relative performance, the themes described above more than offset these factors and led to an overall negative impact on relative performance.
New Jersey Tax Free
The New Jersey Tax Free Fund returned -15.36%, reflecting performance at the net asset value (NAV) of class A Shares with all distributions reinvested, for the 12-month period ending September 30, 2022. The Fund’s benchmark, the Bloomberg Municipal Bond Index3, returned -11.50% during the same period. The primary driver of relative underperformance over the fiscal year was the Fund’s duration positioning. Due to uncertainties around monetary policy and inflation, the municipal yield curve shifted upwards significantly. Given this dramatic rise in yields, the strategy’s longer duration relative to the benchmark was the most notable detractor over the one-year period.
The Fund’s credit quality allocation also detracted from relative returns. Over the one-year period, lower-rated bonds underperformed higher-rated bonds, particularly in the latter half of the fiscal year. Therefore, the Fund’s overweight to bonds rated ‘BBB’ as well as its exposure to non-investment grade bonds led to a negative impact on performance.
Security selection and the Fund’s sector allocation also dragged on performance over the period. The primary detractor was security selection within the Education sector. Within the Education sector, holdings of select non-investment grade bonds underperformed over the period and detracted from relative returns. Additionally, the Fund’s overweight to non-investment grade bonds within the Special Tax sector led to a negative impact on performance given the underperformance of lower quality bonds throughout the fiscal year. While the Fund’s sector allocation and selection within several areas led to a positive impact on relative performance, the themes described above more than offset these factors and led to an overall negative impact on relative performance.
New York Tax Free
The New York Tax Free Fund returned -15.91%, reflecting performance at the net asset value (NAV) of class A Shares with all distributions reinvested, for the 12-month period ending September 30, 2022. The Fund’s benchmark, the
9
Bloomberg Municipal Bond Index3, returned -11.50% during the same period. The primary driver of relative underperformance over the fiscal year was the Fund’s duration positioning. Due to uncertainties around monetary policy and inflation, the municipal yield curve shifted upwards significantly. Given this dramatic rise in yields, the strategy’s longer duration relative to the benchmark was the most notable detractor over the one-year period.
The Fund’s credit quality allocation also detracted from relative returns. Over the one-year period, lower-rated bonds underperformed higher-rated bonds, particularly in the latter half of the fiscal year. Therefore, the Fund’s overweight to bonds rated ‘BBB’ as well as its exposure to non-investment grade bonds led to a negative impact on performance.
The Fund’s sector allocation dragged on relative returns, primarily driven by an
underweight to the general obligation (“GO”) State and Power sectors as well as an overweight to the Tobacco sector. Within Power in particular, the Fund’s lower quality slant within the sector detracted from relative performance given the underperformance of non-investment grade bonds over the fiscal year.
Security selection led to a positive impact on relative performance. More specifically, selection within the Special Tax, Water/Sewer, and GO Local sectors contributed to performance. Generally, within most of these sectors, holdings of higher quality, investment-grade bonds outperformed and contributed to relative performance.
Each Fund’s portfolio is actively managed and, therefore, holdings and the weightings of a particular issuer or particular sector as a percentage of portfolio assets are subject to change. Sectors may include many industries.
1 U.S. Bureau of Economic Analysis
2 U.S. Bureau of Labor Statistics
3 The Bloomberg Municipal Bond Index is a rules-based, market-value-weighted index engineered for the long-term tax-exempt bond market. Bonds must be rated investment-grade (Baa3/BBB- or higher) by at least two ratings agencies. They must have an outstanding par value of at least $7 million and be issued as part of a transaction of at least $75 million. The bonds must be fixed rate, have a dated-date after December 31, 1990, and must be at least one year from their maturity date.
4 Bloomberg BVAL AAA GO Municipal Yield Curve
5 The Bloomberg High Yield Municipal Bond Index is an unmanaged index consisting of noninvestment-grade, unrated or below Ba1 bonds.
6 The Bloomberg Municipal Bond Short 1-5 Year Index is the Muni Short 1-5 year component of the Municipal Bond index. The Bloomberg Municipal
Bond Index is a rules-based, market-value-weighted index engineered for the long-term tax-exempt bond market. The index is a broad measure of the municipal bond market with maturities of at least one year. To be included in the index, bonds must be rated investment-grade (Baa3/BBB- or higher) by at least two of the following ratings agencies: Moody’s, S&P, Fitch. If only two of the three agencies rate the security, the lower rating is used to determine index eligibility. If only one of the three agencies rates a security, the rating must be investment grade. They must have an outstanding par value of at least $7 million and be issued as part of a transaction of at least $75 million. The bonds must be fixed rate, have a dated-date after December 31, 1990, and must be at least one year from their maturity date.
7 The Bloomberg 1-15 Year Municipal Bond index is the 1-15 year component of the Municipal Bond index. The Bloomberg Municipal Bond Index is a rules-
10
based, market-value-weighted index engineered for the long-term tax-exempt bond market. The index is a broad measure of the municipal bond market with maturities of at least one year. To be included in the index, bonds must be rated investment-grade (Baa3/BBB- or higher) by at least two of the following ratings agencies: Moody’s, S&P, Fitch. If only two of the three agencies rate the security, the lower rating is used to determine index eligibility. If only one of the three agencies rates a security, the rating must be investment-grade. They must have an outstanding par value of at least $7 million and be issued as part of a transaction of at least $75 million. The bonds must be fixed rate, have a dated-date after December 31, 1990, and must be at least one year from their maturity date.
8 The Bloomberg 1-8 Year Municipal Bond Index is the 1-8 year component of the Municipal Bond index. The Bloomberg Municipal Bond Index is a rules-based, market-value-weighted index engineered for the long-term tax-exempt bond market. The index is a broad measure of the municipal bond market with maturities of at least one year. Bonds must have an outstanding par value of at least $7 million and be issued as part of a transaction of at least $75 million. Unless otherwise specified, indexes reflect total return, with all dividends reinvested. Indexes are unmanaged, do not reflect the deduction of fees or expenses, and are not available for direct investment.
Important Performance and Other Information
Performance data quoted in the following pages reflect past performance and are no guarantee of future results. Current performance may be higher or lower than the performance quoted. The investment return and principal value of an investment in the Funds will fluctuate so that shares, on any given day or when redeemed, may be worth more or less than their original cost. You can obtain performance data current to the most recent month end by calling Lord Abbett at 888-522-2388 or referring to www.lordabbett.com.
Except where noted, comparative Fund performance does not account for the deduction of sales charges and would be different if sales charges were included. Each Fund offers classes of shares with distinct pricing options. For a full description of the differences in pricing alternatives, please see each Fund’s prospectus.
During certain periods shown, expense waivers and reimbursements were in place. Without such expense waivers and reimbursements, each Fund’s returns would have been lower.
The annual commentary above discusses the views of the Funds’ management and various portfolio holdings of the Funds as of September 30, 2022. These views and portfolio holdings may have changed after this date. Information provided in the commentary is not a recommendation to buy or sell securities. Because the Funds’ portfolios are actively managed and may change significantly, the Funds may no longer own the securities described above or may have otherwise changed their positions in the securities. For more recent information about the Funds’ portfolio holdings, please visit www.lordabbett.com.
A Note about Risk: See Notes to Financial Statements for a discussion of investment risks. For a more detailed discussion of the risks associated with each Fund, please see each Fund’s prospectus.
Mutual funds are not insured by the FDIC, are not deposits or other obligations of, or guaranteed by, banks, and are subject to investment risks including possible loss of principal amount invested.
11
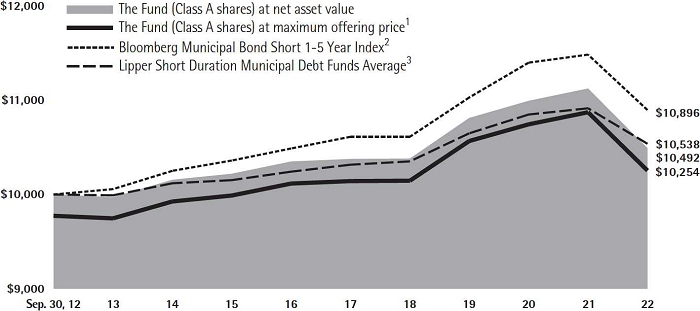
Short Duration Tax Free Fund
Investment Comparison
Below is a comparison of a $10,000 investment in Class A shares to the same investment in the Bloomberg Municipal Bond Short 1-5 Year Index and the Lipper Short Duration Municipal Debt Funds Average, assuming reinvestment of all dividends and distributions. The performance of other classes will be greater than or less than the performance shown in the graph below due to different sales loads and expenses applicable to such classes. The graph and performance table below do not reflect the deduction of taxes that a shareholder would pay on Fund distributions or the redemption of Fund shares. During certain periods, expenses of the Fund have been waived or reimbursed by Lord Abbett; without such waiver or reimbursement of expenses, the Fund’s returns would have been lower. Past performance is no guarantee of future results.
Average Annual Total Returns at Maximum Applicable
Sales Charge for the Periods Ended September 30, 2022
| | 1 Year | 5 Year | 10 Year | Life of Class |
| Class A4 | -7.78% | -0.23% | 0.25% | – |
| Class C5 | -7.28% | -0.42% | -0.15% | – |
| Class F6 | -5.65% | 0.32% | 0.58% | – |
| Class F37 | -5.52% | 0.44% | – | 0.62% |
| Class I6 | -5.55% | 0.41% | 0.68% | – |
1 Reflects the deduction of the maximum initial sales charge of 2.25%.
2 Performance for the unmanaged index does not reflect any fees or expenses. The performance of the index is not necessarily representative of the Fund’s performance.
3 Source: Lipper Inc. The performance of the average is not necessarily representative of the Fund’s performance.
4 Total return, which is the percent change in value, after deduction of the maximum initial sales charge of 2.25% applicable to Class A shares, with all dividends and distributions
reinvested for period shown ended September 30, 2022, is calculated using the SEC required uniform method to compute such return.
5 The 1% CDSC for Class C shares normally applies before the first anniversary of the purchase date. Performance for other periods is at net asset value.
6 Performance is at net asset value.
7 Class F3 shares commenced operations and performance for the class began on April 4, 2017. Performance is at net asset value.
12
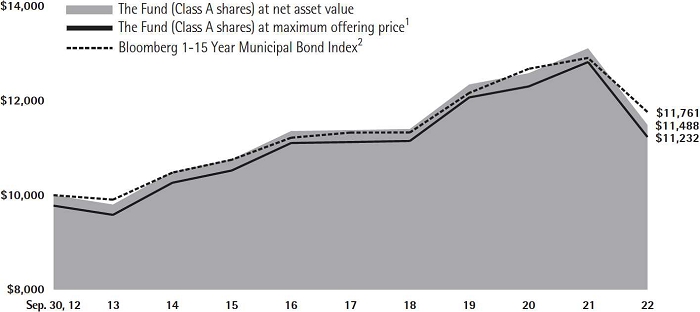
Intermediate Tax Free Fund
Investment Comparison
Below is a comparison of a $10,000 investment in Class A shares to the same investment in the Bloomberg 1-15 Year Municipal Bond Index, assuming reinvestment of all dividends and distributions. The performance of other classes will be greater than or less than the performance shown in the graph below due to different sales loads and expenses applicable to such classes. The graph and performance table below do not reflect the deduction of taxes that a shareholder would pay on Fund distributions or the redemption of Fund shares. During certain periods, expenses of the Fund have been waived or reimbursed by Lord Abbett; without such waiver or reimbursement of expenses, the Fund’s returns would have been lower. Past performance is no guarantee of future results.
Average Annual Total Returns at Maximum Applicable
Sales Charge for the Periods Ended September 30, 2022
| | 1 Year | 5 Year | 10 Year | Life of Class |
| Class A3 | -14.33% | -0.26% | 1.17% | – |
| Class C4 | -13.88% | -0.45% | 0.75% | – |
| Class F5 | -12.37% | 0.27% | 1.49% | – |
| Class F36 | -12.21% | 0.42% | – | 0.95% |
| Class I5 | -12.28% | 0.37% | 1.58% | – |
1 Reflects the deduction of the maximum initial sales charge of 2.25%.
2 Performance for the unmanaged index does not reflect any fees or expenses. The performance of the index is not necessarily representative of the Fund’s performance.
3 Total return, which is the percent change in value, after deduction of the maximum initial sales charge of 2.25% applicable to Class A shares, with all dividends and distributions reinvested for periods shown ended September 30, 2022, is calculated using the SEC required uniform method to compute such return.
4 The 1% CDSC for Class C shares normally applies before the first anniversary of the purchase date. Performance for other periods is at net asset value.
5 Performance is at net asset value.
6 Class F3 shares commenced operations and performance for the class began on April 4, 2017. Performance is at net asset value.
13
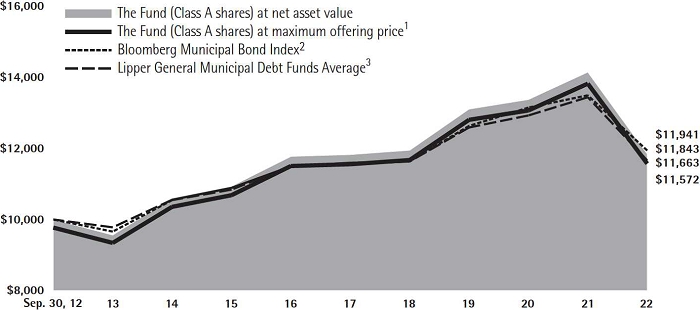
National Tax Free Fund
Investment Comparison
Below is a comparison of a $10,000 investment in Class A shares to the same investment in the Bloomberg Municipal Bond Index and the Lipper General Municipal Debt Funds Average, assuming reinvestment of all dividends and distributions. The performance of other classes will be greater than or less than the performance shown in the graph below due to different sales loads and expenses applicable to such classes. The graph and performance table below do not reflect the deduction of taxes that a shareholder would pay on Fund distributions or the redemption of Fund shares. During certain periods, expenses of the Fund have been waived or reimbursed by Lord Abbett; without such waiver or reimbursement of expenses, the Fund’s returns would have been lower. Past performance is no guarantee of future results.
Average Annual Total Returns at Maximum Applicable
Sales Charge for the Periods Ended September 30, 2022
| | 1 Year | 5 Year | 10 Year | Life of Class |
| Class A4 | -18.17% | -0.42% | 1.47% | – |
| Class C5 | -17.67% | -0.60% | 1.07% | – |
| Class F6 | -16.20% | 0.13% | 1.80% | – |
| Class F37 | -16.07% | 0.28% | – | 0.94% |
| Class I6 | -16.10% | 0.25% | 1.90% | – |
1 Reflects the deduction of the maximum initial sales charge of 2.25%.
2 Performance for the unmanaged index does not reflect any fees or expenses. The performance of the index is not necessarily representative of the Fund’s performance.
3 Source: Lipper Inc. The performance of the average is not necessarily representative of the Fund’s performance.
4 Total return, which is the percent change in value, after deduction of the maximum initial sales charge of 2.25% applicable to Class A shares, with all dividends and distributions reinvested for periods shown ended September 30, 2022, is calculated using the SEC required uniform method to compute such return.
5 The 1% CDSC for Class C shares normally applies before the first anniversary of the purchase date. Performance for other periods is at net asset value.
6 Performance is at net asset value.
7 Class F3 shares commenced operations and performance for the class began on April 4, 2017. Performance is at net asset value.
14
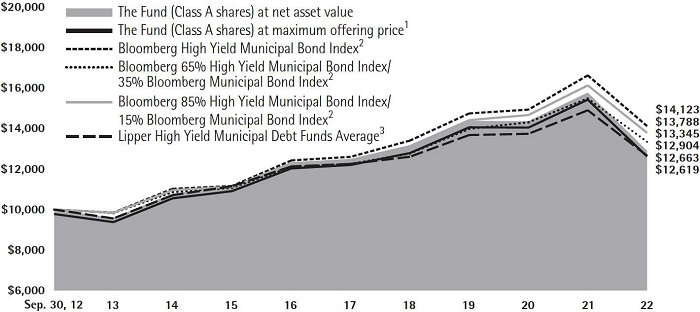
High Income Municipal Bond Fund
Investment Comparison
Below is a comparison of a $10,000 investment in Class A shares to the same investment in the Bloomberg High Yield Municipal Bond Index, Bloomberg 65% High Yield Municipal Bond Index/35% Bloomberg Municipal Bond Index, Bloomberg 85% High Yield Municipal Bond Index/15% Bloomberg Municipal Bond Index and the Lipper High Yield Municipal Debt Funds Average, assuming reinvestment of all dividends and distributions. The Fund believes that the Bloomberg 65% High Yield Municipal Bond Index/35% Bloomberg Municipal Bond Index more closely reflects the Fund’s investment strategies than the Bloomberg 85% High Yield Municipal Bond Index/15% Bloomberg Municipal Bond Index (the “previous blended index”). Therefore, the Fund will remove the previous blended index from the performance table in the future. The performance of other classes will be greater than or less than the performance shown in the graph below due to different sales loads and expenses applicable to such classes. The graph and performance table below do not reflect the deduction of taxes that a shareholder would pay on Fund distributions or the redemption of Fund shares. During certain periods, expenses of the Fund have been waived or reimbursed by Lord Abbett; without such waiver or reimbursement of expenses, the Fund’s returns would have been lower. Past performance is no guarantee of future results.
Average Annual Total Returns at Maximum Applicable
Sales Charge for the Periods Ended September 30, 2022
| | 1 Year | 5 Year | 10 Year | Life of Class |
| Class A4 | -20.05% | 0.22% | 2.35% | – |
| Class C5 | -19.57% | 0.04% | 1.94% | – |
| Class F6 | -18.09% | 0.78% | 2.68% | – |
| Class F37 | -18.01% | 0.91% | – | 1.57% |
| Class I6 | -18.06% | 0.87% | 2.75% | – |
1 Reflects the deduction of the maximum initial sales charge of 2.25%.
2 Performance for the unmanaged index does not reflect any fees or expenses. The performance of the index is not necessarily representative of the Fund’s performance.
3 Source: Lipper Inc. The performance of the average is not necessarily representative of the Fund’s performance.
4 Total return, which is the percent change in value, after deduction of the maximum initial sales charge of 2.25% applicable to Class A shares, with all dividends and distributions reinvested for
periods shown ended September 30, 2022, is calculated using SEC required uniform method to compute such return.
5 The 1% CDSC for Class C shares normally applies before the first anniversary of the purchase date. Performance for other periods is at net asset value.
6 Performance is at net asset value.
7 Class F3 shares commenced operations and performance for the class began on April 4, 2017. Performance is at net asset value.
15
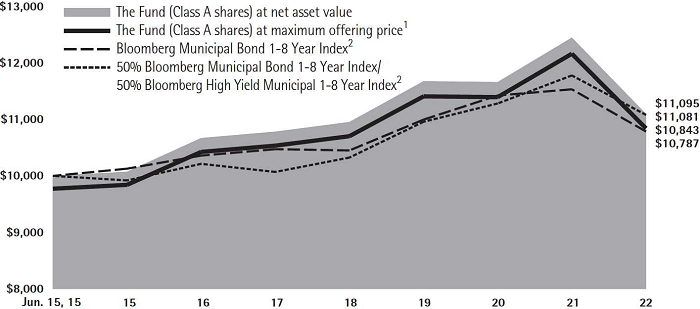
Short Duration High Income Municipal Bond Fund
Investment Comparison
Below is a comparison of a $10,000 investment in Class A shares to the same investment in the Bloomberg Municipal Bond 1-8 Year Index and the 50% Bloomberg Municipal Bond 1-8 Year Index/50% Bloomberg High Yield Municipal 1-8 Year Index, assuming reinvestment of all dividends and distributions. The Fund is adopting the Bloomberg Municipal Bond 1-8 Year Index as its broad-based securities market index. The Fund’s previous blended index, the 50% Bloomberg Municipal Bond 1-8 Year Index/50% Bloomberg Municipal High Yield 1-8 Year Index, is being retained as an additional index. The performance of other classes will be greater than or less than the performance shown in the graph below due to different sales loads and expenses applicable to such classes. The graph and performance table below do not reflect the deduction of taxes that a shareholder would pay on Fund distributions or the redemption of Fund shares. During certain periods, expenses of the Fund have been waived or reimbursed by Lord Abbett; without such waiver or reimbursement of expenses, the Fund’s returns would have been lower. Past performance is no guarantee of future results.
Average Annual Total Returns at Maximum Applicable
Sales Charge for the Periods Ended September 30, 2022
| | 1 Year | 5 Year | 10 Year | Life of Class |
| Class A3 | -12.88% | 0.12% | – | 1.12% |
| Class C4 | -12.35% | -0.10% | – | 0.72% |
| Class F5 | -10.77% | 0.67% | – | 1.53% |
| Class F36 | -10.62% | 0.83% | – | 1.36% |
| Class I5 | -10.61% | 0.79% | – | 1.64% |
1 Reflects the deduction of the maximum initial sales charge of 2.25%.
2 Performance for the unmanaged index does not reflect any fees or expenses. The performance of the index is not necessarily representative of the Fund’s performance.
3 Class A shares commenced operations on June 1, 2015 and performance for the Class began on June 15, 2015. Total return, which is the percent change in value, after deduction of the maximum initial sales charge of 2.25% applicable to Class A shares, with all dividends and distributions reinvested for periods shown ended September 30, 2022, is calculated using SEC required uniform method to compute such return.
4 Class C shares commenced operations on June 1, 2015 and performance for the Class began on June 15, 2015. The 1% CDSC for Class C shares normally applies before the first anniversary of the purchase date. Performance for other periods is at net asset value.
5 Class F and Class I shares commenced operations on June 1, 2015 and performance for each class began on June 15, 2015. Performance is at net asset value.
6 Class F3 shares commenced operations and performance for the class began on April 4, 2017. Performance is at net asset value.
16
Sustainable Municipal Bond Fund
Investment Comparison
Below is a comparison of a $10,000 investment in Class A shares to the same investment in the Bloomberg 1-15 Year Municipal Bond Index, assuming reinvestment of all dividends and distributions. The performance of other classes will be greater than or less than the performance shown in the graph below due to different sales loads and expenses applicable to such classes. The graph and performance table below do not reflect the deduction of taxes that a shareholder would pay on Fund distributions or the redemption of Fund shares. During certain periods, expenses of the Fund have been waived or reimbursed by Lord Abbett; without such waiver or reimbursement of expenses, the Fund’s returns would have been lower. Past performance is no guarantee of future results.

Average Annual Total Returns at Maximum Applicable
Sales Charge for the Periods Ended September 30, 2022 |
| | | Life of Class | |
| Class A3 | -12.86% | |
| Class C4 | -12.26% | |
| Class F5 | -10.78% | |
| Class F35 | -10.69% | |
| Class I5 | -10.71% | |
1 Reflects the deduction of the maximum initial sales charge of 2.25%.
2 Performance for the unmanaged index does not reflect any fees or expenses. The performance of the index is not necessarily representative of the Fund’s performance.
3 Class A shares commenced operations on January 5, 2022 and performance for the Class began on January 20, 2022. Total return, which is the percent change in value, after deduction of the maximum initial sales charge of 2.25% applicable to Class A shares, with all dividends and distributions reinvested for periods
shown ended September 30, 2022, is calculated using SEC required uniform method to compute such return.
4 Class C shares commenced operations on January 5, 2022 and performance for the Class began on January 20, 2022. The 1% CDSC for Class C shares normally applies before the first anniversary of the purchase date. Performance for other periods is at net asset value.
5 Commenced operations on January 5, 2022 and performance for the Classes began on January 20, 2022. Performance is at net asset value.
17
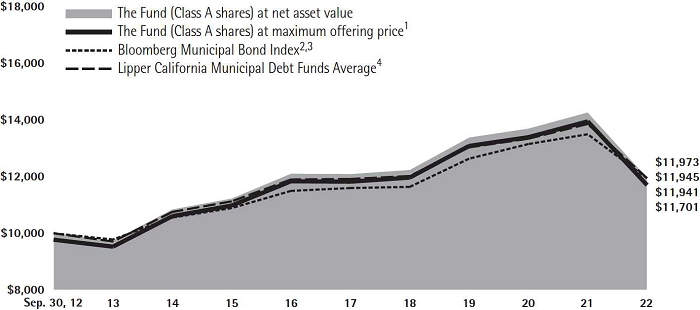
California Tax Free Fund
Investment Comparison
Below is a comparison of a $10,000 investment in Class A shares to the same investment in the Bloomberg Municipal Bond Index and the Lipper California Municipal Debt Funds Average, assuming reinvestment of all dividends and distributions. The performance of other classes will be greater than or less than the performance shown in the graph below due to different sales loads and expenses applicable to such classes. The graph and performance table below do not reflect the deduction of taxes that a shareholder would pay on Fund distributions or the redemption of Fund shares. During certain periods, expenses of the Fund have been waived or reimbursed by Lord Abbett; without such waiver or reimbursement of expenses, the Fund’s returns would have been lower. Past performance is no guarantee of future results.
Average Annual Total Returns at Maximum Applicable
Sales Charge for the Periods Ended September 30, 2022
| | 1 Year | 5 Year | 10 Year | Life of Class |
| Class A5 | -18.01% | -0.65% | 1.58% | – |
| Class C6 | -17.52% | -0.83% | 1.17% | – |
| Class F7 | -16.02% | -0.11% | 1.92% | – |
| Class F38 | -16.00% | 0.01% | – | 0.61% |
| Class I7 | -16.02% | -0.01% | 2.01% | – |
1 Reflects the deduction of the maximum initial sales charge of 2.25%.
2 Performance for the unmanaged index does not reflect any fees or expenses. The performance of the index is not necessarily representative of the Fund’s performance.
3 The Index is composed of municipal bonds from many states while the Fund is a single-state municipal bond portfolio.
4 Source: Lipper Inc. The performance of the average is not necessarily representative of the Fund’s performance.
5 Total return, which is the percent change in value, after deduction of the maximum initial sales charge of 2.25% applicable to Class A shares, with all dividends and distributions
reinvested for periods shown ended September 30, 2022, is calculated using the SEC required uniform method to compute such return.
6 The 1% CDSC for Class C shares normally applies before the first anniversary of the purchase date. Performance for other periods is at net asset value.
7 Performance is at net asset value.
8 Class F3 shares commenced operations and performance for the class began on April 4, 2017. Performance is at net asset value.
18
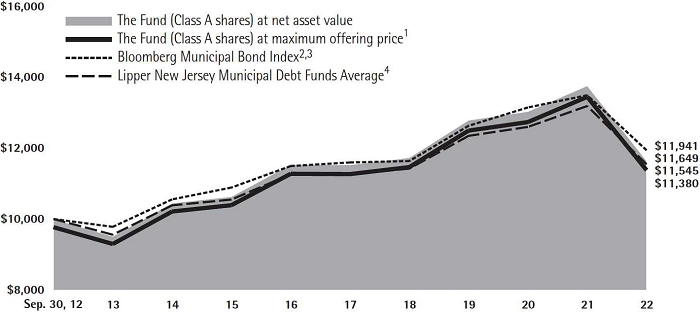
New Jersey Tax Free Fund
Investment Comparison
Below is a comparison of a $10,000 investment in Class A shares to the same investment in the Bloomberg Municipal Bond Index and the Lipper New Jersey Municipal Debt Funds Average, assuming reinvestment of all dividends and distributions. The performance of the other class will be greater than or less than the performance shown in the graph below due to different sales loads and expenses applicable to such classes. The graph and performance table below do not reflect the deduction of taxes that a shareholder would pay on Fund distributions or the redemption of Fund shares. During certain periods, expenses of the Fund have been waived or reimbursed by Lord Abbett; without such waiver or reimbursement of expenses, the Fund’s returns would have been lower. Past performance is no guarantee of future results.
Average Annual Total Returns at Maximum Applicable
Sales Charge for the Periods Ended September 30, 2022
| | 1 Year | 5 Year | 10 Year | Life of Class |
| Class A5 | -17.22% | -0.24% | 1.30% | – |
| Class F6 | -15.28% | 0.30% | 1.64% | – |
| Class F37 | -15.16% | 0.39% | – | 0.99% |
| Class I6 | -15.19% | 0.36% | 1.75% | – |
1 Reflects the deduction of the maximum initial sales charge of 2.25%.
2 Performance for the unmanaged index does not reflect any fees or expenses. The performance of the index is not necessarily representative of the Fund’s performance.
3 The Index is composed of municipal bonds from many states while the Fund is a single-state municipal bond portfolio.
4 Source: Lipper Inc. The performance of the average is not necessarily representative of the Fund’s performance.
5 Total return, which is the percent change in value, after deduction of the maximum initial sales charge of 2.25%
applicable to Class A shares, with all dividends and distributions reinvested for periods shown ended September 30, 2022, is calculated using the SEC required uniform method to compute such return.
6 Performance is at net asset value.
7 Class F3 shares commenced operations and performance for the class began on April 4, 2017. Performance is at net asset value.
19
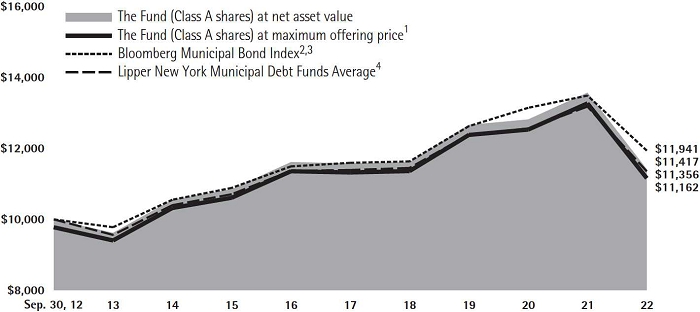
New York Tax Free Fund
Investment Comparison
Below is a comparison of a $10,000 investment in Class A shares to the same investment in the Bloomberg Municipal Bond Index and the Lipper New York Municipal Debt Funds Average, assuming reinvestment of all dividends and distributions. The performance of the other classes will be greater than or less than the performance shown in the graph below due to different sales loads and expenses applicable to such classes. The graph and performance table below do not reflect the deduction of taxes that a shareholder would pay on Fund distributions or the redemption of Fund shares. During certain periods, expenses of the Fund have been waived or reimbursed by Lord Abbett; without such waiver or reimbursement of expenses, the Fund’s returns would have been lower. Past performance is no guarantee of future results.
Average Annual Total Returns at Maximum Applicable
Sales Charge for the Periods Ended September 30, 2022
| | 1 Year | 5 Year | 10 Year | Life of Class |
| Class A5 | -17.82% | -0.74% | 1.10% | – |
| Class C6 | -17.21% | -0.92% | 0.69% | – |
| Class F7 | -15.81% | -0.19% | 1.43% | – |
| Class F38 | -15.70% | -0.06% | – | 0.43% |
| Class I7 | -15.73% | -0.09% | 1.53% | – |
1 Reflects the deduction of the maximum initial sales charge of 2.25%.
2 Performance for the unmanaged index does not reflect any fees or expenses. The performance of the index is not necessarily representative of the Fund’s performance.
3 The Index is composed of municipal bonds from many states while the Fund is a single-state municipal bond portfolio.
4 Source: Lipper Inc. The performance of the average is not necessarily representative of the Fund’s performance.
5 Total return, which is the percent change in value, after deduction of the maximum initial sales charge of 2.25% applicable to Class A shares, with all dividends and distributions
reinvested for periods shown ended September 30, 2022, is calculated using the SEC required uniform method to compute such return.
6 The 1% CDSC for Class C shares normally applies before the first anniversary of the purchase date. Performance for other periods is at net asset value.
7 Performance is at net asset value.
8 Class F3 shares commenced operations and performance for the class began on April 4, 2017. Performance is at net asset value.
20
Expense Example
As a shareholder of a Fund, you incur two types of costs: (1) transaction costs, including sales charges (loads) on purchase payments (these charges vary among the share classes); and (2) ongoing costs, including management fees, distribution and service (12b-1) fees (these charges vary among the share classes), and other Fund expenses. This Example is intended to help you understand your ongoing costs (in dollars) of investing in each Fund and to compare these costs with the ongoing costs of investing in other mutual funds.
The Example is based on an investment of $1,000 invested at the beginning of the period and held for the entire period (April 1, 2022 through September 30, 2022).
Actual Expenses
For each class of each Fund, the first line of the applicable table on the following pages provides information about actual account values and actual expenses. You may use the information in this line, together with the amount you invested, to estimate the expenses that you paid over the period. Simply divide your account value by $1,000 (for example, an $8,600 account value divided by $1,000 = 8.6), then multiply the result by the number in the first line under the heading titled “Expenses Paid During Period 4/1/22 – 9/30/22” to estimate the expenses you paid on your account during this period.
Hypothetical Example for Comparison Purposes
For each class of each Fund, the second line of the applicable table on the following pages provides information about hypothetical account values and hypothetical expenses based on the Fund’s actual expense ratio and an assumed rate of return of 5% per year before expenses, which is not the Fund’s actual return. The hypothetical account values and expenses may not be used to estimate the actual ending account balance or expenses you paid for the period. You may use this information to compare the ongoing costs of investing in each Fund and other funds. To do so, compare this 5% hypothetical example with the 5% hypothetical examples that appear in the shareholder reports of the other funds.
21
Short Duration Tax Free Fund
Please note that the expenses shown in the table are meant to highlight your ongoing costs only and do not reflect any transactional costs, such as sales charges (loads). Therefore, the second line of the table is useful in comparing ongoing costs only, and will not help you determine the relative total costs of owning different funds. In addition, if these transactional costs were included, your costs would have been higher.
| | | Beginning
Account
Value | | Ending
Account
Value | | Expenses
Paid During
Period† | |
| | | 4/1/22 | | 9/30/22 | | 4/1/22 –
9/30/22 | |
| Class A | | | | | | | |
| Actual | | $1,000.00 | | $ 976.40 | | $3.22 | |
| Hypothetical (5% Return Before Expenses) | | $1,000.00 | | $1,021.81 | | $3.29 | |
| Class C | | | | | | | |
| Actual | | $1,000.00 | | $ 972.70 | | $6.33 | |
| Hypothetical (5% Return Before Expenses) | | $1,000.00 | | $1,018.65 | | $6.48 | |
| Class F | | | | | | | |
| Actual | | $1,000.00 | | $ 976.20 | | $2.72 | |
| Hypothetical (5% Return Before Expenses) | | $1,000.00 | | $1,022.31 | | $2.79 | |
| Class F3 | | | | | | | |
| Actual | | $1,000.00 | | $ 976.90 | | $2.03 | |
| Hypothetical (5% Return Before Expenses) | | $1,000.00 | | $1,023.01 | | $2.08 | |
| Class I | | | | | | | |
| Actual | | $1,000.00 | | $ 976.70 | | $2.23 | |
| Hypothetical (5% Return Before Expenses) | | $1,000.00 | | $1,022.81 | | $2.28 | |
| † | For each class of the Fund, net expenses are equal to the annualized expense ratio for such class (0.65% for Class A, 1.28% for Class C, 0.55% for Class F, 0.41% for Class F3, and 0.45% for Class I) multiplied by the average account value over the period, multiplied by 183/365 (to reflect one-half year period). |
Portfolio Holdings Presented by Credit Rating
September 30, 2022
Credit Rating:
S&P or Moody’s(a) | %* | | |
| AAA | 2.89 | % | |
| AA+ | 5.58 | % | |
| AA | 11.49 | % | |
| AA- | 11.18 | % | |
| A+ | 10.67 | % | |
| A | 15.58 | % | |
| A- | 11.27 | % | |
| BBB+ | 7.82 | % | |
Credit Rating:
S&P or Moody’s(a) | %* | | |
| BBB | 3.33 | % | |
| BBB- | 4.02 | % | |
| BB+ | 0.21 | % | |
| BB | 1.60 | % | |
| BB- | 0.58 | % | |
| B+ | 0.08 | % | |
| NR | 13.70 | % | |
| Total | 100.00 | % | |
| (a) | Certain investments have been rated by Fitch IBCA. |
| * | Represents percent of total investments. |
22
Intermediate Tax Free Fund
Please note that the expenses shown in the table are meant to highlight your ongoing costs only and do not reflect any transactional costs, such as sales charges (loads). Therefore, the second line of the table is useful in comparing ongoing costs only, and will not help you determine the relative total costs of owning different funds. In addition, if these transactional costs were included, your costs would have been higher.
| | | Beginning
Account
Value | | Ending
Account
Value | | Expenses
Paid During
Period† | |
| | | 4/1/22 | | 9/30/22 | | 4/1/22 –
9/30/22 | |
| Class A | | | | | | | |
| Actual | | $1,000.00 | | $ 932.90 | | $3.54 | |
| Hypothetical (5% Return Before Expenses) | | $1,000.00 | | $1,021.41 | | $3.70 | |
| Class C | | | | | | | |
| Actual | | $1,000.00 | | $ 929.80 | | $6.58 | |
| Hypothetical (5% Return Before Expenses) | | $1,000.00 | | $1,018.25 | | $6.88 | |
| Class F | | | | | | | |
| Actual | | $1,000.00 | | $ 933.30 | | $3.05 | |
| Hypothetical (5% Return Before Expenses) | | $1,000.00 | | $1,021.91 | | $3.19 | |
| Class F3 | | | | | | | |
| Actual | | $1,000.00 | | $ 934.20 | | $2.18 | |
| Hypothetical (5% Return Before Expenses) | | $1,000.00 | | $1,022.81 | | $2.28 | |
| Class I | | | | | | | |
| Actual | | $1,000.00 | | $ 932.90 | | $2.57 | |
| Hypothetical (5% Return Before Expenses) | | $1,000.00 | | $1,022.41 | | $2.69 | |
| † | For each class of the Fund, net expenses are equal to the annualized expense ratio for such class (0.73% for Class A, 1.36% for Class C, 0.63% for Class F, 0.45% for Class F3, and 0.53% for Class I) multiplied by the average account value over the period, multiplied by 183/365 (to reflect one-half year period). |
Portfolio Holdings Presented by Credit Rating
September 30, 2022
Credit Rating:
S&P or Moody’s(a) | %* | | |
| AAA | 2.07 | % | |
| AA+ | 3.00 | % | |
| AA | 11.51 | % | |
| AA- | 11.33 | % | |
| A+ | 10.45 | % | |
| A | 10.63 | % | |
| A- | 12.13 | % | |
| BBB+ | 11.47 | % | |
| BBB | 3.93 | % | |
| BBB- | 6.82 | % | |
Credit Rating:
S&P or Moody’s(a) | %* | | |
| BB+ | 1.21 | % | |
| BB | 2.55 | % | |
| BB- | 1.58 | % | |
| B+ | 0.70 | % | |
| B | 0.37 | % | |
| B- | 0.40 | % | |
| D | 0.16 | % | |
| NR | 9.69 | % | |
| Total | 100.00 | % | |
| (a) | Certain investments have been rated by Fitch IBCA. |
| * | Represents percent of total investments. |
23
National Tax Free Fund
Please note that the expenses shown in the table are meant to highlight your ongoing costs only and do not reflect any transactional costs, such as sales charges (loads). Therefore, the second line of the table is useful in comparing ongoing costs only, and will not help you determine the relative total costs of owning different funds. In addition, if these transactional costs were included, your costs would have been higher.
| | | Beginning
Account
Value | | Ending
Account
Value | | Expenses
Paid During
Period† | |
| | | 4/1/22 | | 9/30/22 | | 4/1/22 –
9/30/22 | |
| Class A | | | | | | | |
| Actual | | $1,000.00 | | $ 901.10 | | $3.48 | |
| Hypothetical (5% Return Before Expenses) | | $1,000.00 | | $1,021.41 | | $3.70 | |
| Class C | | | | | | | |
| Actual | | $1,000.00 | | $ 897.50 | | $6.52 | |
| Hypothetical (5% Return Before Expenses) | | $1,000.00 | | $1,018.20 | | $6.93 | |
| Class F | | | | | | | |
| Actual | | $1,000.00 | | $ 900.60 | | $3.05 | |
| Hypothetical (5% Return Before Expenses) | | $1,000.00 | | $1,021.86 | | $3.24 | |
| Class F3 | | | | | | | |
| Actual | | $1,000.00 | | $ 902.20 | | $2.29 | |
| Hypothetical (5% Return Before Expenses) | | $1,000.00 | | $1,022.66 | | $2.43 | |
| Class I | | | | | | | |
| Actual | | $1,000.00 | | $ 902.00 | | $2.53 | |
| Hypothetical (5% Return Before Expenses) | | $1,000.00 | | $1,022.41 | | $2.69 | |
| † | For each class of the Fund, net expenses are equal to the annualized expense ratio for such class (0.73% for Class A, 1.37% for Class C, 0.64% for Class F, 0.48% for Class F3, and 0.53% for Class I) multiplied by the average account value over the period, multiplied by 183/365 (to reflect one-half year period). |
Portfolio Holdings Presented by Credit Rating
September 30, 2022
Credit Rating:
S&P or Moody’s(a) | %* | | |
| AAA | 1.55 | % | |
| AA+ | 5.03 | % | |
| AA | 10.95 | % | |
| AA- | 6.29 | % | |
| A+ | 11.69 | % | |
| A | 10.55 | % | |
| A- | 14.32 | % | |
| BBB+ | 11.88 | % | |
| BBB | 7.90 | % | |
| BBB- | 9.47 | % | |
Credit Rating:
S&P or Moody’s(a) | %* | | |
| BB+ | 0.44 | % | |
| BB | 1.16 | % | |
| BB- | 1.62 | % | |
| B+ | 0.53 | % | |
| B | 0.48 | % | |
| B- | 0.50 | % | |
| D | 0.10 | % | |
| NR | 5.54 | % | |
| Total | 100.00 | % | |
| (a) | Certain investments have been rated by Fitch IBCA. |
| * | Represents percent of total investments. |
24
High Income Municipal Bond Fund
Please note that the expenses shown in the table are meant to highlight your ongoing costs only and do not reflect any transactional costs, such as sales charges (loads). Therefore, the second line of the table is useful in comparing ongoing costs only, and will not help you determine the relative total costs of owning different funds. In addition, if these transactional costs were included, your costs would have been higher.
| | | Beginning
Account
Value | | Ending
Account
Value | | Expenses
Paid During
Period† | |
| | | 4/1/22 | | 9/30/22 | | 4/1/22 –
9/30/22 | |
| Class A | | | | | | | |
| Actual | | $1,000.00 | | $ 883.30 | | $3.73 | |
| Hypothetical (5% Return Before Expenses) | | $1,000.00 | | $1,021.11 | | $4.00 | |
| Class C | | | | | | | |
| Actual | | $1,000.00 | | $ 880.40 | | $6.74 | |
| Hypothetical (5% Return Before Expenses) | | $1,000.00 | | $1,017.90 | | $7.23 | |
| Class F | | | | | | | |
| Actual | | $1,000.00 | | $ 883.90 | | $3.26 | |
| Hypothetical (5% Return Before Expenses) | | $1,000.00 | | $1,021.61 | | $3.50 | |
| Class F3 | | | | | | | |
| Actual | | $1,000.00 | | $ 884.20 | | $2.46 | |
| Hypothetical (5% Return Before Expenses) | | $1,000.00 | | $1,022.46 | | $2.64 | |
| Class I | | | | | | | |
| Actual | | $1,000.00 | | $ 884.00 | | $2.74 | |
| Hypothetical (5% Return Before Expenses) | | $1,000.00 | | $1,022.16 | | $2.94 | |
| † | For each class of the Fund, net expenses are equal to the annualized expense ratio for such class (0.79% for Class A, 1.43% for Class C, 0.69% for Class F, 0.52% for Class F3, and 0.58% for Class I) multiplied by the average account value over the period, multiplied by 183/365 (to reflect one-half year period). |
Portfolio Holdings Presented by Credit Rating
September 30, 2022
Credit Rating:
S&P or Moody’s(a) | %* | | |
| AAA | 0.78 | % | |
| AA+ | 0.46 | % | |
| AA | 1.77 | % | |
| AA- | 0.82 | % | |
| A+ | 1.82 | % | |
| A | 2.75 | % | |
| A- | 5.54 | % | |
| BBB+ | 6.23 | % | |
| BBB | 4.72 | % | |
| BBB- | 8.16 | % | |
| BB+ | 5.91 | % | |
Credit Rating:
S&P or Moody’s(a) | %* | | |
| BB | 7.31 | % | |
| BB- | 8.58 | % | |
| B+ | 2.49 | % | |
| B | 1.33 | % | |
| B- | 2.72 | % | |
| CCC+ | 0.37 | % | |
| CCC | 0.07 | % | |
| CCC- | 0.95 | % | |
| D | 0.40 | % | |
| NR | 36.82 | % | |
| Total | 100.00 | % | |
| (a) | Certain investments have been rated by Fitch IBCA. |
| * | Represents percent of total investments. |
25
Short Duration High Income Municipal Bond Fund
Please note that the expenses shown in the table are meant to highlight your ongoing costs only and do not reflect any transactional costs, such as sales charges (loads). Therefore, the second line of the table is useful in comparing ongoing costs only, and will not help you determine the relative total costs of owning different funds. In addition, if these transactional costs were included, your costs would have been higher.
| | | Beginning
Account
Value | | Ending
Account
Value | | Expenses
Paid During
Period† | |
| | | 4/1/22 | | 9/30/22 | | 4/1/22 –
9/30/22 | |
| Class A | | | | | | | |
| Actual | | $1,000.00 | | $ 943.00 | | $3.41 | |
| Hypothetical (5% Return Before Expenses) | | $1,000.00 | | $1,021.56 | | $3.55 | |
| Class C | | | | | | | |
| Actual | | $1,000.00 | | $ 939.70 | | $6.81 | |
| Hypothetical (5% Return Before Expenses) | | $1,000.00 | | $1,018.05 | | $7.08 | |
| Class F | | | | | | | |
| Actual | | $1,000.00 | | $ 943.40 | | $2.92 | |
| Hypothetical (5% Return Before Expenses) | | $1,000.00 | | $1,022.06 | | $3.04 | |
| Class F3 | | | | | | | |
| Actual | | $1,000.00 | | $ 944.20 | | $2.14 | |
| Hypothetical (5% Return Before Expenses) | | $1,000.00 | | $1,022.86 | | $2.23 | |
| Class I | | | | | | | |
| Actual | | $1,000.00 | | $ 943.90 | | $2.44 | |
| Hypothetical (5% Return Before Expenses) | | $1,000.00 | | $1,022.56 | | $2.54 | |
| † | For each class of the Fund, net expenses are equal to the annualized expense ratio for such class (0.70% for Class A, 1.40% for Class C, 0.60% for Class F, 0.44% for Class F3, and 0.50% for Class I) multiplied by the average account value over the period, multiplied by 183/365 (to reflect one-half year period). |
Portfolio Holdings Presented by Credit Rating
September 30, 2022
Credit Rating:
S&P or Moody’s(a) | %* | | |
| AA+ | 0.66 | % | |
| AA | 2.44 | % | |
| AA- | 0.56 | % | |
| A+ | 2.92 | % | |
| A | 5.31 | % | |
| A- | 8.29 | % | |
| BBB+ | 8.62 | % | |
| BBB | 3.62 | % | |
| BBB- | 9.11 | % | |
Credit Rating:
S&P or Moody’s(a) | %* | | |
| BB+ | 3.72 | % | |
| BB | 5.25 | % | |
| BB- | 10.27 | % | |
| B+ | 5.19 | % | |
| B | 4.65 | % | |
| B- | 1.39 | % | |
| CCC+ | 0.15 | % | |
| NR | 27.85 | % | |
| Total | 100.00 | % | |
| (a) | Certain investments have been rated by Fitch IBCA. |
| * | Represents percent of total investments. |
26
Sustainable Municipal Bond Fund
Please note that the expenses shown in the table are meant to highlight your ongoing costs only and do not reflect any transactional costs, such as sales charges (loads). Therefore, the second line of the table is useful in comparing ongoing costs only, and will not help you determine the relative total costs of owning different funds. In addition, if these transactional costs were included, your costs would have been higher.
| | | Beginning Account Value | | Ending Account Value | | Expenses Paid During Period† | |
| | | 4/1/22 | | 9/30/22 | | 4/1/22 – 9/30/22 | |
| Class A | | | | | | | |
| Actual | | $1,000.00 | | $ 936.50 | | $3.06 | |
| Hypothetical (5% Return Before Expenses) | | $1,000.00 | | $1,021.91 | | $3.19 | |
| Class C | | | | | | | |
| Actual | | $1,000.00 | | $ 932.80 | | $6.93 | |
| Hypothetical (5% Return Before Expenses) | | $1,000.00 | | $1,017.90 | | $7.23 | |
| Class F | | | | | | | |
| Actual | | $1,000.00 | | $ 937.00 | | $2.57 | |
| Hypothetical (5% Return Before Expenses) | | $1,000.00 | | $1,022.41 | | $2.69 | |
| Class F3 | | | | | | | |
| Actual | | $1,000.00 | | $ 937.70 | | $1.89 | |
| Hypothetical (5% Return Before Expenses) | | $1,000.00 | | $1,023.11 | | $1.98 | |
| Class I | | | | | | | |
| Actual | | $1,000.00 | | $ 937.50 | | $2.09 | |
| Hypothetical (5% Return Before Expenses) | | $1,000.00 | | $1,022.91 | | $2.18 | |
| † | For each class of the Fund, net expenses are equal to the annualized expense ratio for such class (0.63% for Class A, 1.43% for Class C, 0.53% for Class F, 0.39% for Class F3, and 0.43% for Class I) multiplied by the average account value over the period, multiplied by 183/365 (to reflect one-half year period). |
Portfolio Holdings Presented by Credit Rating
September 30, 2022
Credit Rating:
S&P or Moody’s(a) | %* | | |
| AA+ | 2.95 | % | |
| AA | 3.88 | % | |
| AA- | 6.41 | % | |
| A+ | 16.78 | % | |
| A | 25.18 | % | |
| A- | 10.36 | % | |
Credit Rating:
S&P or Moody’s(a) | %* | | |
| BBB+ | 13.08 | % | |
| BBB- | 7.50 | % | |
| BB+ | 2.32 | % | |
| BB | 9.55 | % | |
| NR | 1.99 | % | |
| Total | 100.00 | % | |
| (a) | Certain investments have been rated by Fitch IBCA. |
| * | Represents percent of total investments. |
27
California Tax Free Fund
Please note that the expenses shown in the table are meant to highlight your ongoing costs only and do not reflect any transactional costs, such as sales charges (loads). Therefore, the second line of the table is useful in comparing ongoing costs only, and will not help you determine the relative total costs of owning different funds. In addition, if these transactional costs were included, your costs would have been higher.
| | | Beginning
Account
Value | | Ending
Account
Value | | Expenses
Paid During
Period† | |
| | | 4/1/22 | | 9/30/22 | | 4/1/22 –
9/30/22 | |
| Class A | | | | | | | |
| Actual | | $1,000.00 | | $ 901.40 | | $3.72 | |
| Hypothetical (5% Return Before Expenses) | | $1,000.00 | | $1,021.16 | | $3.95 | |
| Class C | | | | | | | |
| Actual | | $1,000.00 | | $ 897.70 | | $6.71 | |
| Hypothetical (5% Return Before Expenses) | | $1,000.00 | | $1,018.00 | | $7.13 | |
| Class F | | | | | | | |
| Actual | | $1,000.00 | | $ 901.90 | | $3.24 | |
| Hypothetical (5% Return Before Expenses) | | $1,000.00 | | $1,021.66 | | $3.45 | |
| Class F3 | | | | | | | |
| Actual | | $1,000.00 | | $ 901.50 | | $2.62 | |
| Hypothetical (5% Return Before Expenses) | | $1,000.00 | | $1,022.31 | | $2.79 | |
| Class I | | | | | | | |
| Actual | | $1,000.00 | | $ 901.40 | | $2.76 | |
| Hypothetical (5% Return Before Expenses) | | $1,000.00 | | $1,022.16 | | $2.94 | |
| † | For each class of the Fund, net expenses are equal to the annualized expense ratio for such class (0.78% for Class A, 1.41% for Class C, 0.68% for Class F, 0.55% for Class F3, and 0.58% for Class I) multiplied by the average account value over the period, multiplied by 183/365 (to reflect one-half year period). |
Portfolio Holdings Presented by Credit Rating
September 30, 2022
Credit Rating:
S&P or Moody’s(a) | %* | | |
| AAA | 0.57 | % | |
| AA+ | 1.58 | % | |
| AA | 26.97 | % | |
| AA- | 8.52 | % | |
| A+ | 9.46 | % | |
| A | 9.67 | % | |
| A- | 8.39 | % | |
| BBB+ | 10.96 | % | |
| BBB | 4.13 | % | |
| BBB- | 5.76 | % | |
Credit Rating:
S&P or Moody’s(a) | %* | | |
| BB+ | 0.73 | % | |
| BB | 0.23 | % | |
| BB- | 1.76 | % | |
| B+ | 0.95 | % | |
| CCC | 0.03 | % | |
| CCC- | 0.08 | % | |
| D | 0.14 | % | |
| NR | 10.07 | % | |
| Total | 100.00 | % | |
| (a) | Certain investments have been rated by Fitch IBCA. |
| * | Represents percent of total investments. |
28
New Jersey Tax Free Fund
Please note that the expenses shown in the table are meant to highlight your ongoing costs only and do not reflect any transactional costs, such as sales charges (loads). Therefore, the second line of the table is useful in comparing ongoing costs only, and will not help you determine the relative total costs of owning different funds. In addition, if these transactional costs were included, your costs would have been higher.
| | | Beginning
Account
Value | | Ending
Account
Value | | Expenses
Paid During
Period† | |
| | | 4/1/22 | | 9/30/22 | | 4/1/22 –
9/30/22 | |
| Class A | | | | | | | |
| Actual | | $1,000.00 | | $ 901.10 | | $3.91 | |
| Hypothetical (5% Return Before Expenses) | | $1,000.00 | | $1,020.96 | | $4.15 | |
| Class F | | | | | | | |
| Actual | | $1,000.00 | | $ 901.50 | | $3.43 | |
| Hypothetical (5% Return Before Expenses) | | $1,000.00 | | $1,021.46 | | $3.65 | |
| Class F3 | | | | | | | |
| Actual | | $1,000.00 | | $ 900.30 | | $2.76 | |
| Hypothetical (5% Return Before Expenses) | | $1,000.00 | | $1,022.16 | | $2.94 | |
| Class I | | | | | | | |
| Actual | | $1,000.00 | | $ 902.00 | | $2.96 | |
| Hypothetical (5% Return Before Expenses) | | $1,000.00 | | $1,021.96 | | $3.14 | |
| † | For each class of the Fund, net expenses are equal to the annualized expense ratio for such class (0.82% for Class A, 0.72% for Class F, 0.58% for Class F3, and 0.62% for Class I) multiplied by the average account value over the period, multiplied by 183/365 (to reflect one-half year period). |
Portfolio Holdings Presented by Credit Rating
September 30, 2022
Credit Rating:
S&P or Moody’s(a) | %* | | |
| AAA | 3.01 | % | |
| AA+ | 2.91 | % | |
| AA | 17.37 | % | |
| AA- | 21.16 | % | |
| A+ | 8.39 | % | |
| A | 6.69 | % | |
| A- | 17.40 | % | |
| BBB+ | 8.55 | % | |
Credit Rating:
S&P or Moody’s(a) | %* | | |
| BBB | 3.03 | % | |
| BBB- | 2.31 | % | |
| BB+ | 2.35 | % | |
| BB- | 2.28 | % | |
| D | 0.16 | % | |
| NR | 4.39 | % | |
| Total | 100.00 | % | |
| (a) | Certain investments have been rated by Fitch IBCA. |
| * | Represents percent of total investments. |
29
New York Tax Free Fund
Please note that the expenses shown in the table are meant to highlight your ongoing costs only and do not reflect any transactional costs, such as sales charges (loads). Therefore, the second line of the table is useful in comparing ongoing costs only, and will not help you determine the relative total costs of owning different funds. In addition, if these transactional costs were included, your costs would have been higher.
| | | Beginning
Account
Value | | Ending
Account
Value | | Expenses
Paid During
Period† | |
| | | 4/1/22 | | 9/30/22 | | 4/1/22 –
9/30/22 | |
| Class A | | | | | | | |
| Actual | | $1,000.00 | | $ 900.50 | | $3.76 | |
| Hypothetical (5% Return Before Expenses) | | $1,000.00 | | $1,021.11 | | $4.00 | |
| Class C | | | | | | | |
| Actual | | $1,000.00 | | $ 898.40 | | $6.76 | |
| Hypothetical (5% Return Before Expenses) | | $1,000.00 | | $1,017.95 | | $7.18 | |
| Class F | | | | | | | |
| Actual | | $1,000.00 | | $ 901.10 | | $3.29 | |
| Hypothetical (5% Return Before Expenses) | | $1,000.00 | | $1,021.61 | | $3.50 | |
| Class F3 | | | | | | | |
| Actual | | $1,000.00 | | $ 902.50 | | $2.62 | |
| Hypothetical (5% Return Before Expenses) | | $1,000.00 | | $1,022.31 | | $2.79 | |
| Class I | | | | | | | |
| Actual | | $1,000.00 | | $ 901.50 | | $2.81 | |
| Hypothetical (5% Return Before Expenses) | | $1,000.00 | | $1,022.11 | | $2.99 | |
| † | For each class of the Fund, net expenses are equal to the annualized expense ratio for such class (0.79% for Class A, 1.42% for Class C, 0.69% for Class F, 0.55% for Class F3, and 0.59% for Class I) multiplied by the average account value over the period, multiplied by 183/365 (to reflect one-half year period). |
Portfolio Holdings Presented by Credit Rating
September 30, 2022
Credit Rating:
S&P or Moody’s(a) | %* | | |
| AAA | 6.55 | % | |
| AA+ | 13.51 | % | |
| AA | 13.93 | % | |
| AA- | 9.53 | % | |
| A+ | 3.55 | % | |
| A | 5.82 | % | |
| A- | 12.84 | % | |
| BBB+ | 7.18 | % | |
| BBB | 7.34 | % | |
| BBB- | 7.42 | % | |
Credit Rating:
S&P or Moody’s(a) | %* | | |
| BB+ | 2.09 | % | |
| BB | 0.47 | % | |
| BB- | 0.43 | % | |
| B+ | 0.35 | % | |
| B | 0.65 | % | |
| B- | 0.57 | % | |
| CCC+ | 0.43 | % | |
| NR | 7.34 | % | |
| Total | 100.00 | % | |
| (a) | Certain investments have been rated by Fitch IBCA. |
| * | Represents percent of total investments. |
30
Schedule of Investments
SHORT DURATION TAX FREE FUND September 30, 2022
| Investments | | Interest
Rate | | Maturity
Date | | Credit
Rating:
S&P or
Moody’s(a) | | Principal
Amount | | | Fair
Value | |
| LONG-TERM INVESTMENTS 90.40% | | | | | | | | | | | | | | |
| | | | | | | | | | | | | | | |
| MUNICIPAL BONDS 90.40% | | | | | | | | | | | | | | |
| | | | | | | | | | | | | | | |
| Corporate-Backed 7.99% | | | | | | | | | | | | | | |
| Allegheny Co IDA–US Steel | | 4.875% | | 11/1/2024 | | BB- | | $ | 4,500,000 | | | $ | 4,503,786 | |
| Black Belt Energy Gas Dist–Goldman Sachs | | 4.00% | #(b) | 10/1/2052 | | A2 | | | 24,500,000 | | | | 23,872,425 | |
| Burke Co Dev–Oglethorpe Power | | 1.50% | #(b) | 1/1/2040 | | BBB+ | | | 3,750,000 | | | | 3,462,830 | |
| Charles City EDA–Waste Mgmt | | 2.875% | | 2/1/2029 | | A- | | | 3,500,000 | | | | 3,187,998 | |
| Downtown Doral CDD† | | 3.875% | | 12/15/2023 | | NR | | | 105,000 | | | | 103,752 | |
| Farmington Poll Ctl–NM Pub Svc | | 1.10% | #(b) | 6/1/2040 | | BBB | | | 16,000,000 | | | | 15,684,734 | |
| IN Fin Auth–Republic Services | | 2.75% | #(b) | 5/1/2028 | | BBB+ | | | 15,000,000 | | | | 14,989,674 | |
| LA St John Parish–Marathon Oil | | 2.10% | #(b) | 6/1/2037 | | BBB- | | | 8,000,000 | | | | 7,800,294 | |
| LA St John Parish–Marathon Oil | | 2.125% | #(b) | 6/1/2037 | | BBB- | | | 6,150,000 | | | | 5,999,048 | |
| LA St John Parish–Marathon Oil | | 2.375% | #(b) | 6/1/2037 | | BBB- | | | 4,575,000 | | | | 4,273,465 | |
| Matagorda Co Nav Dist–AEP TX Central | | 2.60% | | 11/1/2029 | | A- | | | 1,400,000 | | | | 1,204,809 | |
| Matagorda Co Nav Dist–AEP TX Central (AMBAC) | | 4.40% | | 5/1/2030 | | A- | | | 1,500,000 | | | | 1,476,602 | |
| Mobile IDB–AL Power | | 1.00% | #(b) | 6/1/2034 | | A1 | | | 3,100,000 | | | | 2,883,234 | |
| Mobile IDB–AL Power | | 2.90% | #(b) | 7/15/2034 | | A1 | | | 20,000,000 | | | | 19,831,010 | |
| Nez Perce Co Poll Ctl–Potlatch | | 2.75% | | 10/1/2024 | | BBB- | | | 11,310,000 | | | | 11,077,877 | |
| NH Bus Fin Auth-United Illuminating | | 2.80% | #(b) | 10/1/2033 | | A- | | | 5,000,000 | | | | 4,957,237 | |
| Niagara Area Dev Corp–Covanta† | | 3.50% | | 11/1/2024 | | B1 | | | 750,000 | | | | 731,517 | |
| OH Air Dev Auth–AEP | | 1.90% | #(b) | 5/1/2026 | | BBB+ | | | 2,000,000 | | | | 1,900,673 | |
| OH Air Dev Auth–AEP | | 2.40% | #(b) | 12/1/2038 | | BBB+ | | | 10,700,000 | | | | 9,331,858 | |
| OH Air Dev Auth–OVEC | | 1.50% | #(b) | 2/1/2026 | | Baa3 | | | 1,000,000 | | | | 906,041 | |
| OR Bus Dev Comn–Intel | | 2.40% | #(b) | 12/1/2040 | | A+ | | | 10,500,000 | | | | 10,393,883 | |
| Selma IDB–Intl Paper | | 2.00% | #(b) | 11/1/2033 | | BBB | | | 2,625,000 | | | | 2,528,360 | |
| St James Parish–Nustar Logistics† | | 5.85% | #(b) | 8/1/2041 | | BB- | | | 3,500,000 | | | | 3,593,074 | |
| Warren Co–Intl Paper | | 2.90% | #(b) | 9/1/2032 | | BBB | | | 4,250,000 | | | | 4,212,147 | |
| WI PFA–American Dream† | | 5.00% | | 12/1/2027 | | NR | | | 1,455,000 | | | | 1,274,394 | |
| Wise Co IDA–VA Elec & Pwr | | 1.20% | #(b) | 11/1/2040 | | A2 | | | 5,470,000 | | | | 5,244,699 | |
| Total | | | | | | | | | | | | | 165,425,421 | |
| | | | | | | | | | | | | | | |
| Education 2.49% | | | | | | | | | | | | | | |
| CA Choice Clean Energy–Morgan Stanley | | 3.697%
(SOFR *.67 + 1.70% | )# | 5/1/2053 | | A1 | | | 15,000,000 | | | | 14,924,304 | (c) |
| California State University | | 0.55% | #(b) | 11/1/2049 | | Aa2 | | | 5,000,000 | | | | 4,206,723 | (c) |
| Cap Trust Agy–Renaissance Chtr Sch† | | 4.00% | | 6/15/2029 | | NR | | | 1,325,000 | | | | 1,224,631 | |
| | See Notes to Financial Statements. | 31 |
Schedule of Investments (continued)
SHORT DURATION TAX FREE FUND September 30, 2022
| Investments | | Interest
Rate | | Maturity
Date | | Credit
Rating:
S&P or
Moody’s(a) | | Principal
Amount | | | Fair
Value | |
| Education (continued) | | | | | | | | | | | | | | |
| Central Plains Energy Proj | | 4.00% | #(b) | 12/1/2049 | | Aa1 | | $ | 10,000,000 | | | $ | 9,955,135 | |
| Chicago Brd Ed | | 5.00% | | 12/1/2022 | | BB | | | 5,935,000 | | | | 5,949,104 | |
| FL HI Ed–Saint Leo Univ | | 5.00% | | 3/1/2023 | | BB+ | | | 410,000 | | | | 410,838 | |
| FL HI Ed–Saint Leo Univ | | 5.00% | | 3/1/2024 | | BB+ | | | 640,000 | | | | 643,079 | |
| FL HI Ed–Saint Leo Univ | | 5.00% | | 3/1/2025 | | BB+ | | | 675,000 | | | | 678,921 | |
| IL Fin Auth–IL Inst of Tech | | 5.00% | | 9/1/2028 | | Baa3 | | | 1,135,000 | | | | 1,162,666 | |
| IL Fin Auth–IL Inst of Tech | | 5.00% | | 9/1/2029 | | Baa3 | | | 630,000 | | | | 646,053 | |
| MA DFA–Williams Clg | | 0.45% | #(b) | 7/1/2041 | | AA+ | | | 3,500,000 | | | | 3,156,726 | |
| Multnomah Co Hsp–Mirabella | | 5.00% | | 10/1/2024 | | NR | | | 660,000 | | | | 661,688 | |
| NC EDA–Campbell Univ | | 5.00% | | 10/1/2025 | | Baa2 | | | 1,700,000 | | | | 1,744,898 | |
| OH Air Dev Auth–Duke Energy | | 4.00% | #(b) | 9/1/2030 | | BBB | | | 1,300,000 | | | | 1,276,093 | |
| OH HI Ed–Dayton Univ (AMBAC) | | 6.49%
(CPI YoY * 1 + 1.10% | )# | 12/1/2022 | | A+ | | | 2,000,000 | | | | 2,001,429 | |
| Univ of CA | | 4.25% | | 5/15/2039 | | AA | | | 3,000,000 | | | | 2,933,259 | |
| Total | | | | | | | | | | | | | 51,575,547 | |
| | | | | | | | | | | | | | | |
| Energy 0.41% | | | | | | | | | | | | | | |
| KY Public Energy Auth–BP | | 4.00% | #(b) | 12/1/2050 | | A2 | | | 5,000,000 | | | | 4,955,094 | |
| PEFA Gas–Goldman Sachs | | 5.00% | #(b) | 9/1/2049 | | A3 | | | 3,500,000 | | | | 3,554,640 | |
| Total | | | | | | | | | | | | | 8,509,734 | |
| | | | | | | | | | | | | | | |
| General Obligation 10.59% | | | | | | | | | | | | | | |
| Auburn BANS | | 3.50% | | 8/16/2023 | | NR | | | 10,000,000 | | | | 9,995,317 | |
| CA State GO | | 5.00% | | 8/1/2026 | | Aa2 | | | 7,485,000 | | | | 7,860,690 | |
| Chicago Brd Ed | | 4.00% | | 12/1/2022 | | BB | | | 4,000,000 | | | | 4,001,199 | |
| Chicago Brd Ed | | 4.00% | | 12/1/2022 | | BB | | | 3,555,000 | | | | 3,556,065 | |
| Chicago Brd Ed | | 5.00% | | 12/1/2022 | | BB | | | 3,670,000 | | | | 3,676,802 | |
| Chicago Brd Ed | | 5.00% | | 12/1/2023 | | BB | | | 3,330,000 | | | | 3,366,595 | |
| Chicago Brd Ed | | 5.00% | | 12/1/2025 | | BB | | | 10,000,000 | | | | 10,223,616 | |
| Chicago Brd Ed (AGM) | | 5.00% | | 12/1/2033 | | AA | | | 1,850,000 | | | | 1,876,365 | |
| Chicago Brd Ed (AGM) | | 5.00% | | 12/1/2034 | | AA | | | 4,300,000 | | | | 4,349,509 | |
| Chicago GO | | 5.00% | | 1/1/2026 | | BBB+ | | | 2,125,000 | | | | 2,168,497 | |
| Chicago GO | | 5.00% | | 1/1/2028 | | BBB+ | | | 4,900,000 | | | | 4,994,234 | |
| Chicago GO | | 5.25% | | 1/1/2023 | | BBB+ | | | 1,235,000 | | | | 1,238,701 | |
| Chicago GO | | 5.25% | | 1/1/2027 | | BBB+ | | | 1,665,000 | | | | 1,684,288 | |
| Chicago Met Water Reclmtn Dist | | 5.00% | | 12/1/2022 | | AA+ | | | 5,000,000 | | | | 5,014,584 | |
| Clark Co SD (AGM) | | 3.00% | | 6/15/2024 | | AA | | | 575,000 | | | | 571,506 | |
| Clark Co SD (AGM) | | 3.00% | | 6/15/2025 | | AA | | | 650,000 | | | | 643,454 | |
| 32 | See Notes to Financial Statements. | |
Schedule of Investments (continued)
SHORT DURATION TAX FREE FUND September 30, 2022
| Investments | | Interest
Rate | | Maturity
Date | | Credit
Rating:
S&P or
Moody’s(a) | | Principal
Amount | | | Fair
Value | |
| General Obligation (continued) | | | | | | | | | | | | | | |
| Clark Co SD (AGM) | | 5.00% | | 6/15/2026 | | AA | | $ | 500,000 | | | $ | 528,692 | |
| Clark Co SD (AGM) | | 5.00% | | 6/15/2027 | | AA | | | 1,000,000 | | | | 1,068,837 | |
| Cook Co GO | | 5.00% | | 11/15/2027 | | A+ | | | 2,000,000 | | | | 2,133,868 | |
| Cook Co GO | | 5.00% | | 11/15/2028 | | A+ | | | 2,300,000 | | | | 2,473,039 | |
| CT State GO | | 4.00% | | 1/15/2026 | | Aa3 | | | 8,245,000 | | | | 8,397,498 | |
| CT State GO | | 5.00% | | 4/15/2025 | | Aa3 | | | 7,000,000 | | | | 7,285,615 | |
| CT State GO | | 5.00% | | 10/15/2026 | | Aa3 | | | 5,000,000 | | | | 5,306,335 | |
| IL State GO | | 5.00% | | 11/1/2023 | | BBB+ | | | 10,000,000 | | | | 10,119,563 | |
| IL State GO | | 5.00% | | 3/1/2025 | | BBB+ | | | 5,500,000 | | | | 5,595,223 | |
| IL State GO | | 5.00% | | 3/1/2026 | | BBB+ | | | 2,500,000 | | | | 2,544,126 | |
| IL State GO | | 5.00% | | 2/1/2028 | | BBB+ | | | 5,990,000 | | | | 6,106,521 | |
| IL State GO | | 5.00% | | 3/1/2029 | | BBB+ | | | 4,010,000 | | | | 4,103,755 | |
| IL State GO | | 5.25% | | 2/1/2030 | | BBB+ | | | 3,000,000 | | | | 3,038,998 | |
| IL State GO | | 5.375% | | 5/1/2023 | | BBB+ | | | 3,000,000 | | | | 3,029,389 | |
| Jersey City GO GTD | | 4.00% | | 12/15/2024 | | Aa3 | | | 5,350,000 | | | | 5,405,029 | |
| MA State GO | | 5.00% | #(b) | 6/1/2044 | | Aa1 | | | 5,000,000 | | | | 5,060,137 | |
| Newark BANS | | 3.75% | | 2/17/2023 | | NR | | | 15,000,000 | | | | 14,999,259 | |
| Newark GO | | 1.25% | | 10/3/2022 | | NR | | | 7,000,000 | | | | 7,000,000 | |
| NJ State GO | | 2.00% | | 6/1/2027 | | A2 | | | 5,000,000 | | | | 4,502,480 | |
| NJ State GO | | 5.00% | | 6/1/2025 | | A2 | | | 4,425,000 | | | | 4,601,287 | |
| NYC GO | | 5.00% | #(b) | 6/1/2044 | | AA | | | 8,500,000 | | | | 8,611,732 | |
| PA State GO | | 5.00% | | 5/1/2027 | | Aa3 | | | 5,000,000 | | | | 5,362,679 | |
| Philadelphia GO | | 5.00% | | 2/1/2025 | | A | | | 2,140,000 | | | | 2,212,340 | |
| Philadelphia GO | | 5.00% | | 2/1/2026 | | A | | | 1,000,000 | | | | 1,045,390 | |
| Philadelphia GO | | 5.00% | | 2/1/2027 | | A | | | 1,250,000 | | | | 1,319,161 | |
| Philadelphia GO | | 5.00% | | 2/1/2028 | | A | | | 2,000,000 | | | | 2,128,669 | |
| Philadelphia Sch Dist | | 5.00% | | 9/1/2023 | | A1 | | | 500,000 | | | | 507,102 | |
| Philadelphia Sch Dist | | 5.00% | | 9/1/2023 | | A1 | | | 1,250,000 | | | | 1,267,755 | |
| Philadelphia Sch Dist | | 5.00% | | 9/1/2024 | | A1 | | | 900,000 | | | | 925,803 | |
| Philadelphia Sch Dist | | 5.00% | | 9/1/2025 | | A1 | | | 1,200,000 | | | | 1,243,537 | |
| Prince Georges Co GO | | 4.00% | | 8/1/2031 | | AAA | | | 7,690,000 | | | | 7,744,080 | |
| San Antonio GO | | 5.00% | | 2/1/2026 | | AAA | | | 4,300,000 | | | | 4,395,821 | |
| Troy GO BANS | | 4.00% | | 7/28/2023 | | NR | | | 7,700,000 | | | | 7,715,967 | |
| Western Placer SD | | 2.00% | | 6/1/2025 | | NR | | | 2,000,000 | | | | 1,883,271 | |
| Western Placer SD | | 2.00% | | 6/1/2025 | | NR | | | 4,750,000 | | | | 4,471,616 | |
| Total | | | | | | | | | | | | | 219,355,996 | |
| | See Notes to Financial Statements. | 33 |
Schedule of Investments (continued)
SHORT DURATION TAX FREE FUND September 30, 2022
| Investments | | Interest
Rate | | Maturity
Date | | Credit
Rating:
S&P or
Moody’s(a) | | Principal
Amount | | | Fair
Value | |
| Health Care 14.93% | | | | | | | | | | | | | | |
| Allegheny Co Hsp–Allegheny Hlth | | 5.00% | | 4/1/2026 | | A | | $ | 2,500,000 | | | $ | 2,607,008 | |
| Allegheny Co Hsp–Univ Pitt Med Ctr | | 5.00% | | 7/15/2029 | | A | | | 4,000,000 | | | | 4,193,193 | |
| Berks Co IDA–Tower Hlth | | 5.00% | #(b) | 2/1/2040 | | BB- | | | 4,000,000 | | | | 3,593,646 | |
| CA Muni Fin–Eisenhower Med Ctr | | 5.00% | | 7/1/2026 | | Baa2 | | | 1,345,000 | | | | 1,381,500 | |
| CA Stwde–Viamonte | | 3.00% | | 7/1/2026 | | AA- | | | 4,500,000 | | | | 4,501,733 | |
| CA Stwde–Viamonte | | 3.00% | | 7/1/2027 | | AA- | | | 2,250,000 | | | | 2,250,998 | |
| Charlotte–Mecklenberg Hosp Auth–Atrium Health | | 5.00% | #(b) | 1/15/2050 | | AA- | | | 10,000,000 | | | | 10,284,122 | |
| Cheyenne Regional Medical Center | | 4.00% | | 5/1/2025 | | A+ | | | 290,000 | | | | 293,633 | |
| Cheyenne Regional Medical Center | | 4.00% | | 5/1/2026 | | A+ | | | 200,000 | | | | 202,430 | |
| Cheyenne Regional Medical Center | | 4.00% | | 5/1/2027 | | A+ | | | 355,000 | | | | 360,198 | |
| CO Hlth Facs–AdventHealth | | 5.00% | #(b) | 11/15/2048 | | AA | | | 13,525,000 | | | | 14,061,163 | |
| CO Hlth Facs–AdventHealth | | 5.00% | #(b) | 11/15/2049 | | AA | | | 2,010,000 | | | | 2,110,373 | |
| CO Hlth Facs–IHC Hlth | | 5.00% | #(b) | 5/15/2062 | | AA+ | | | 13,000,000 | | | | 13,608,815 | |
| Colorado Health Facs Auth Rev Bds Commonspirit Health 2019 B-2 | | 5.00% | #(b) | 8/1/2049 | | A- | | | 8,085,000 | | | | 8,293,561 | |
| Cuyahoga Co Hsp–Metrohealth | | 5.00% | | 2/15/2025 | | BBB | | | 1,500,000 | | | | 1,538,122 | |
| Franklin Co IDA–Menno-Haven | | 5.00% | | 12/1/2023 | | NR | | | 500,000 | | | | 497,913 | |
| Geisinger PA Hlth Auth–Geisinger Health | | 5.00% | #(b) | 4/1/2043 | | AA- | | | 17,000,000 | | | | 17,845,111 | |
| Greeneville Hlth–Ballad Hlth | | 5.00% | | 7/1/2023 | | A- | | | 1,500,000 | | | | 1,516,926 | |
| Harris Co Edu Fac–Hermann Hlth | | 3.03%
(MUNIPSA * 1 +.57% | )# | 12/1/2049 | | A+ | | | 7,770,000 | | | | 7,746,929 | |
| Harris Co Edu Fac–Hermann Hlth | | 3.31%
(MUNIPSA * 1 +.85% | )# | 7/1/2049 | | A+ | | | 11,000,000 | | | | 11,003,310 | |
| IL Fin Auth–Mercy Hlth | | 5.00% | | 12/1/2025 | | A3 | | | 5,830,000 | | | | 6,041,975 | |
| IL Fin Auth–Northshore Univ Hlth | | 5.00% | | 8/15/2028 | | AA- | | | 2,000,000 | | | | 2,145,219 | |
| IL Fin Auth–Northshore Univ Hlth | | 5.00% | | 8/15/2029 | | AA- | | | 2,000,000 | | | | 2,165,749 | |
| IL Fin Auth–Northwestern Mem Hlth | | 5.00% | #(b) | 7/15/2057 | | AA+ | | | 4,000,000 | | | | 4,013,250 | |
| IL Fin Auth–OSF Hlth | | 5.00% | #(b) | 5/15/2050 | | A | | | 4,500,000 | | | | 4,675,249 | |
| IL Fin Auth–Plymouth Place | | 5.00% | | 5/15/2025 | | BB+ | (d) | | 770,000 | | | | 791,476 | |
| IN Fin Auth–Indiana Univ Hlth | | 0.70% | #(b) | 12/1/2046 | | AA | | | 7,000,000 | | | | 6,354,357 | |
| KY EDFA–Owensboro Hlth | | 5.00% | | 6/1/2025 | | Baa2 | | | 1,400,000 | | | | 1,437,829 | |
| Lakeland Regional Health | | 5.00% | | 11/15/2024 | | A2 | | | 2,200,000 | | | | 2,263,509 | |
| Lakeland Regional Health | | 5.00% | | 11/15/2026 | | A2 | | | 1,000,000 | | | | 1,046,320 | |
| Lee Memorial Hlth System | | 5.00% | | 4/1/2025 | | A+ | | | 2,625,000 | | | | 2,703,316 | |
| Lehigh Co–Lehigh Valley Health Network | | 5.00% | | 7/1/2026 | | A+ | | | 1,755,000 | | | | 1,834,149 | |
| Lehigh Co–St. Lukes Hlth | | 3.56%
(MUNIPSA * 1 + 1.10% | )# | 8/15/2038 | | A- | | | 14,790,000 | | | | 14,604,593 | |
| 34 | See Notes to Financial Statements. | |
Schedule of Investments (continued)
SHORT DURATION TAX FREE FUND September 30, 2022
| Investments | | Interest
Rate | | Maturity
Date | | Credit
Rating:
S&P or
Moody’s(a) | | Principal
Amount | | | Fair
Value | |
| Health Care (continued) | | | | | | | | | | | | | | |
| Lenexa Hlth–Lakeview Village | | 5.00% | | 5/15/2025 | | BB+ | (d) | $ | 990,000 | | | $ | 996,933 | |
| MA DFA–Beth Israel Lahey Hlth | | 5.00% | | 7/1/2023 | | A | | | 600,000 | | | | 606,770 | |
| MA DFA–Partners Hlthcare | | 2.96%
(MUNIPSA * 1 +.50% | )# | 7/1/2038 | | AA- | | | 5,000,000 | | | | 4,988,960 | |
| MA DFA–Partners Hlthcare | | 5.00% | #(b) | 7/1/2038 | | AA- | | | 2,000,000 | | | | 2,032,705 | |
| MA DFA–Wellforce Hlth | | 5.00% | | 7/1/2024 | | BBB+ | | | 2,030,000 | | | | 2,074,076 | |
| MA DFA–Wellforce Hlth | | 5.00% | | 7/1/2025 | | BBB+ | | | 800,000 | | | | 823,693 | |
| Maricopa Co IDA–Banner Health | | 3.03%
(MUNIPSA * 1 +.57% | )# | 1/1/2035 | | AA- | | | 4,575,000 | | | | 4,550,299 | |
| MD Hlth & HI ED–Univ of MD Med | | 5.00% | #(b) | 7/1/2045 | | A | | | 6,250,000 | | | | 6,439,156 | |
| MI Fin Auth–Trinity Health | | 5.00% | | 12/1/2026 | | AA- | | | 2,250,000 | | | | 2,380,049 | |
| Miami-Dade Co Pub Facs–Jackson Health | | 5.00% | | 6/1/2026 | | Aa3 | | | 4,165,000 | | | | 4,323,671 | |
| MO Hlth Ed–BJC Hlth | | 4.00% | #(b) | 5/1/2051 | | AA | | | 12,000,000 | | | | 12,121,747 | |
| Monroeville Fin Auth–Univ Pitt Med Ctr | | 3.00% | | 2/15/2023 | | A | | | 2,510,000 | | | | 2,510,006 | |
| Monroeville Fin Auth–Univ Pitt Med Ctr | | 5.00% | | 2/15/2024 | | A | | | 1,015,000 | | | | 1,035,801 | |
| Montgomery Co Hgr Ed–Thomas Jeff U | | 5.00% | | 9/1/2026 | | A | | | 1,150,000 | | | | 1,200,511 | |
| Montgomery Co Hgr Ed–Thomas Jeff U | | 5.00% | | 9/1/2027 | | A | | | 1,500,000 | | | | 1,572,760 | |
| Montgomery Co Hgr Ed–Thomas Jeff U | | 5.00% | | 9/1/2028 | | A | | | 1,850,000 | | | | 1,943,009 | |
| Montgomery Co Hgr Ed–Thomas Jeff U | | 5.00% | | 9/1/2029 | | A | | | 1,000,000 | | | | 1,052,093 | |
| NC Med Care–Caromont Hlth | | 5.00% | #(b) | 2/1/2051 | | AA- | | | 6,190,000 | | | | 6,439,399 | |
| NC Med Care–Southminster | | 5.00% | | 10/1/2023 | | NR | | | 750,000 | | | | 751,720 | |
| NC Med Care–Wake Forest Baptist | | 2.20% | #(b) | 12/1/2048 | | AA- | | | 22,500,000 | | | | 22,459,574 | |
| NJ Hlth–Hackensack Meridian Hlth | | 5.00% | | 7/1/2026 | | AA- | | | 3,900,000 | | | | 4,105,153 | |
| NJ Hlth–St Peters Univ Hsp | | 5.75% | | 7/1/2037 | | BBB- | | | 3,185,000 | | | | 3,193,754 | |
| NJ Hlth Fin Auth–Valley Health | | 5.00% | | 7/1/2026 | | A | | | 1,800,000 | | | | 1,870,963 | |
| NJ Hlth Fin Auth–Valley Health | | 5.00% | | 7/1/2027 | | A | | | 1,250,000 | | | | 1,308,301 | |
| Northampton Co–St. Lukes Univ Hlth | | 2.835%
(1 Mo. LIBOR *.70 + 1.04% | )# | 8/15/2048 | | A- | | | 8,000,000 | | | | 8,009,985 | |
| NY Dorm–Montefiore | | 5.00% | | 8/1/2024 | | BBB- | | | 1,500,000 | | | | 1,519,978 | |
| NY Dorm–Montefiore | | 5.00% | | 9/1/2027 | | BBB- | | | 1,400,000 | | | | 1,411,223 | |
| NY Dorm–Montefiore | | 5.00% | | 9/1/2028 | | BBB- | | | 1,500,000 | | | | 1,504,921 | |
| NY Dorm–Montefiore | | 5.00% | | 9/1/2029 | | BBB- | | | 1,750,000 | | | | 1,741,338 | |
| NY Dorm–Montefiore | | 5.00% | | 9/1/2030 | | BBB- | | | 1,000,000 | | | | 985,635 | |
| NYC IDA–Yankee Stadium (AGM) | | 5.00% | | 3/1/2029 | | AA | | | 2,000,000 | | | | 2,151,824 | |
| OH Hosp Rev–University Hospitals | | 4.00% | | 1/15/2028 | | A | | | 500,000 | | | | 505,011 | |
| OH Hosp Rev–University Hospitals | | 5.00% | | 1/15/2026 | | A | | | 500,000 | | | | 519,901 | |
| OH Hosp Rev–University Hospitals | | 5.00% | | 1/15/2027 | | A | | | 250,000 | | | | 260,780 | |
| | See Notes to Financial Statements. | 35 |
Schedule of Investments (continued)
SHORT DURATION TAX FREE FUND September 30, 2022
| Investments | | Interest
Rate | | Maturity
Date | | Credit
Rating:
S&P or
Moody’s(a) | | Principal
Amount | | | Fair
Value | |
| Health Care (continued) | | | | | | | | | | | | | | |
| OK DFA–OU Med | | 5.00% | | 8/15/2025 | | Ba2 | | $ | 550,000 | | | $ | 539,334 | |
| OK DFA–OU Med | | 5.00% | | 8/15/2026 | | Ba2 | | | 800,000 | | | | 778,641 | |
| Oneida Co–Mohawk Valley Hlth (AGM) | | 5.00% | | 12/1/2027 | | AA | | | 1,400,000 | | | | 1,422,668 | |
| Oneida Co–Mohawk Valley Hlth (AGM) | | 5.00% | | 12/1/2028 | | AA | | | 1,000,000 | | | | 1,016,072 | |
| Oneida Co–Mohawk Valley Hlth (AGM) | | 5.00% | | 12/1/2029 | | AA | | | 1,000,000 | | | | 1,015,871 | |
| PA HI Ed–UPenn Hlth Sys | | 5.00% | | 8/15/2027 | | AA | | | 1,250,000 | | | | 1,332,962 | |
| PA HI Ed–UPenn Hlth Sys | | 5.00% | | 8/15/2028 | | AA | | | 1,565,000 | | | | 1,687,209 | |
| Philadelphia Hsps–Temple Univ Hlth | | 5.00% | | 7/1/2027 | | BBB | | | 5,000,000 | | | | 5,167,571 | |
| SE Port Auth–Memorial Hlth | | 5.00% | | 12/1/2022 | | B+ | (d) | | 805,000 | | | | 807,400 | |
| South Miami Hlth Fac–Baptist Hlth | | 5.00% | | 8/15/2023 | | AA- | | | 1,350,000 | | | | 1,367,486 | |
| Southcentral PA Auth–Wellspan Hlth | | 3.06%
(MUNIPSA * 1 +.60% | )# | 6/1/2049 | | Aa3 | | | 9,000,000 | | | | 8,964,892 | |
| Tulsa IDA–Montereau | | 5.00% | | 11/15/2026 | | BBB- | (d) | | 500,000 | | | | 509,082 | |
| WA Hlth Facs–CommonSpirit | | 3.86%
(MUNIPSA * 1 + 1.40% | )# | 1/1/2035 | | A- | | | 2,000,000 | | | | 2,010,395 | |
| WI Hlth & Ed–Advocate Aurora Hlth | | 5.00% | #(b) | 8/15/2054 | | AA | | | 5,805,000 | | | | 6,046,400 | |
| WI Hlth & Ed–Marshfield Hlth | | 5.00% | #(b) | 2/15/2052 | | A- | | | 9,000,000 | | | | 9,227,756 | |
| Total | | | | | | | | | | | | | 309,253,113 | |
| | | | | | | | | | | | | | | |
| Housing 5.46% | | | | | | | | | | | | | | |
| CA HFA–MFH | | 4.00% | | 3/20/2033 | | BBB+ | | | 955,638 | | | | 909,522 | |
| CT HFA | | 4.00% | | 5/15/2049 | | AAA | | | 3,975,000 | | | | 3,903,707 | |
| FL State Hsg Fin Auth (GNMA) | | 3.00% | | 1/1/2052 | | Aaa | | | 2,655,000 | | | | 2,529,541 | |
| FL State Hsg Fin Auth (GNMA) | | 3.00% | | 7/1/2052 | | Aaa | | | 3,510,000 | | | | 3,320,617 | |
| IA Fin Auth Mtg Rev (GNMA) | | 3.00% | | 1/1/2047 | | AAA | | | 4,260,000 | | | | 4,040,361 | |
| IL HDA (GNMA) | | 3.00% | | 4/1/2051 | | Aaa | | | 9,090,000 | | | | 8,636,138 | |
| MD State Hsg CDA | | 3.50% | | 3/1/2050 | | Aa1 | | | 6,820,000 | | | | 6,627,025 | |
| MD State Hsg CDA | | 4.00% | | 9/1/2049 | | Aa1 | | | 2,645,000 | | | | 2,608,548 | |
| MI State Hsg Dev Auth | | 4.25% | | 12/1/2049 | | AA+ | | | 4,195,000 | | | | 4,166,503 | |
| MN HFA | | 5.00% | | 7/1/2053 | | AA+ | | | 7,285,000 | | | | 7,428,108 | |
| MN HFA (GNMA) | | 4.25% | | 7/1/2049 | | AA+ | | | 3,130,000 | | | | 3,106,925 | |
| MO State Hsg Dev Cmmn (GNMA) | | 3.25% | | 11/1/2052 | | AA+ | | | 1,960,000 | | | | 1,864,968 | |
| MO State Hsg Dev Cmmn (GNMA) | | 4.25% | | 5/1/2047 | | AA+ | | | 3,385,000 | | | | 3,361,816 | |
| NC State Hsg Fin Agy (GNMA) | | 4.00% | | 1/1/2050 | | AA+ | | | 3,220,000 | | | | 3,180,349 | |
| ND State Hsg Fin Agy | | 3.00% | | 7/1/2052 | | Aa1 | | | 4,940,000 | | | | 4,619,252 | |
| ND State Hsg Fin Agy | | 4.00% | | 1/1/2050 | | Aa1 | | | 3,985,000 | | | | 3,912,495 | |
| NM Mortgage Fin Auth (GNMA) | | 3.00% | | 7/1/2052 | | Aaa | | | 7,400,000 | | | | 6,971,107 | |
| NYC HDC (FHA) | | 0.70% | #(b) | 5/1/2060 | | AA+ | | | 2,000,000 | | | | 1,863,119 | |
| 36 | See Notes to Financial Statements. | |
Schedule of Investments (continued)
SHORT DURATION TAX FREE FUND September 30, 2022
| Investments | | Interest
Rate | | Maturity
Date | | Credit
Rating:
S&P or
Moody’s(a) | | Principal
Amount | | | Fair
Value | |
| Housing (continued) | | | | | | | | | | | | | | |
| NYS HFA L-2 (SONYMA) | | 0.75% | | 11/1/2025 | | Aa2 | | $ | 12,350,000 | | | $ | 11,174,349 | |
| NYS HFA M-2 (SONYMA) | | 0.75% | | 11/1/2025 | | Aa2 | | | 5,000,000 | | | | 4,557,915 | |
| NYS Mtg | | 3.50% | | 4/1/2049 | | Aa1 | | | 1,170,000 | | | | 1,148,758 | |
| OH State Fin Agy | | 4.50% | | 3/1/2050 | | Aaa | | | 3,675,000 | | | | 3,672,839 | |
| Phoenix IDA–ASU Std Hsg | | 5.00% | | 7/1/2023 | | Baa3 | | | 100,000 | | | | 100,579 | |
| SC State Hsg Fin Auth | | 4.00% | | 1/1/2050 | | Aaa | | | 3,535,000 | | | | 3,476,231 | |
| WI Hsg & EDA | | 0.50% | #(b) | 11/1/2050 | | AA | | | 2,250,000 | | | | 2,056,595 | |
| WI Hsg & EDA | | 0.61% | #(b) | 11/1/2042 | | AA | | | 2,890,000 | | | | 2,737,978 | |
| WI Hsg & EDA | | 0.81% | #(b) | 11/1/2052 | | AA | | | 8,250,000 | | | | 7,589,952 | |
| WI St Hsg & Eco | | 3.00% | | 3/1/2052 | | AA | | | 3,725,000 | | | | 3,516,317 | |
| Total | | | | | | | | | | | | | 113,081,614 | |
| | | | | | | | | | | | | | | |
| Lease Obligations 3.10% | | | | | | | | | | | | | | |
| CA Pub Wks–Lease Rev | | 5.00% | | 10/1/2026 | | Aa3 | | | 1,500,000 | | | | 1,601,520 | |
| CA Pub Wks–Lease Rev | | 5.00% | | 10/1/2027 | | Aa3 | | | 3,300,000 | | | | 3,566,520 | |
| Nassau Health Care Corp GTD | | 5.00% | | 8/1/2024 | | AA- | | | 4,000,000 | | | | 4,113,525 | |
| Nassau Health Care Corp GTD | | 5.00% | | 8/1/2025 | | AA- | | | 7,000,000 | | | | 7,281,562 | |
| NJ EDA–Sch Facs | | 5.00% | | 11/1/2022 | | A3 | | | 3,275,000 | | | | 3,279,203 | |
| NJ EDA–Sch Facs | | 5.00% | | 3/1/2023 | | A3 | | | 3,565,000 | | | | 3,588,200 | |
| NJ EDA–Sch Facs | | 5.00% | | 3/1/2025 | | A3 | | | 5,205,000 | | | | 5,225,881 | |
| NJ EDA–Sch Facs | | 5.00% | | 6/15/2025 | | A3 | | | 1,250,000 | | | | 1,281,961 | |
| NJ EDA–Sch Facs | | 5.00% | | 6/15/2026 | | A3 | | | 4,000,000 | | | | 4,135,152 | |
| NJ EDA–Sch Facs | | 5.00% | | 6/15/2027 | | A3 | | | 410,000 | | | | 425,050 | |
| NJ EDA–Sch Facs | | 5.00% | | 6/15/2028 | | A3 | | | 400,000 | | | | 417,230 | |
| NJ EDA–Sch Facs | | 5.00% | | 6/15/2029 | | A3 | | | 500,000 | | | | 523,918 | |
| NJ Trans Trust Fund | | 5.00% | | 12/15/2023 | | A3 | | | 1,250,000 | | | | 1,272,025 | |
| NJ Trans Trust Fund | | 5.00% | | 12/15/2024 | | A3 | | | 7,000,000 | | | | 7,166,233 | |
| NJ Trans Trust Fund | | 5.00% | | 12/15/2025 | | A3 | | | 12,500,000 | | | | 12,872,019 | |
| NYC Eductnl Const | | 5.00% | | 4/1/2025 | | AA- | | | 3,510,000 | | | | 3,647,783 | |
| NYC Eductnl Const | | 5.00% | | 4/1/2026 | | AA- | | | 2,690,000 | | | | 2,830,365 | |
| PA COPS | | 5.00% | | 7/1/2023 | | A | | | 500,000 | | | | 506,193 | |
| PA COPS | | 5.00% | | 7/1/2025 | | A | | | 500,000 | | | | 521,159 | |
| Total | | | | | | | | | | | | | 64,255,499 | |
| | | | | | | | | | | | | | | |
| Other Revenue 4.33% | | | | | | | | | | | | | | |
| Black Belt Energy Gas Dist–Morgan Stanley | | 4.00% | #(b) | 12/1/2049 | | A1 | | | 12,325,000 | | | | 12,213,370 | |
| CA Infra & Econ Dev–Academy of Sciences | | 2.81%
(MUNIPSA * 1 +.35% | )# | 8/1/2047 | | A2 | | | 6,000,000 | | | | 5,936,292 | |
| | See Notes to Financial Statements. | 37 |
Schedule of Investments (continued)
SHORT DURATION TAX FREE FUND September 30, 2022
| Investments | | Interest
Rate | | Maturity
Date | | Credit
Rating:
S&P or
Moody’s(a) | | Principal
Amount | | | Fair
Value | |
| Other Revenue (continued) | | | | | | | | | | | | | | |
| CA Infra & Econ Dev–Getty Trust | | 3.00% | #(b) | 10/1/2047 | | AAA | | $ | 5,000,000 | | | $ | 4,940,443 | |
| CA Infra & Econ Dev–LA Co Museum of Art | | 3.16%
(MUNIPSA * 1 +.70% | )# | 12/1/2050 | | A3 | | | 6,500,000 | | | | 6,372,707 | |
| Clifton Higher Ed–Intl Ldrshp Sch | | 5.25% | | 8/15/2026 | | NR | | | 1,605,000 | | | | 1,623,158 | |
| Clifton Higher Ed–Intl Ldrshp Sch | | 5.25% | | 8/15/2028 | | NR | | | 1,920,000 | | | | 1,933,556 | |
| Delhi N Y Cent Sch Dist GO Bd Antic Nts 2022 | | 3.75% | | 6/29/2023 | | NR | | | 10,025,000 | | | | 10,029,956 | |
| IL Fin Auth–Field Museum | | 3.272%
(SOFR *.70 + 1.20% | )# | 11/1/2034 | | A | | | 4,500,000 | | | | 4,451,749 | |
| Lower AL Gas Dist–Goldman Sachs | | 4.00% | #(b) | 12/1/2050 | | A2 | | | 22,250,000 | | | | 21,959,266 | |
| Main St Nat Gas–Macquarie | | 5.00% | | 5/15/2025 | | A3 | | | 4,850,000 | | | | 4,923,648 | |
| Patriots Energy Group Fing Agy | | 4.00% | #(b) | 10/1/2048 | | Aa1 | | | 8,000,000 | | | | 8,018,140 | |
| Pima Co IDA–Edkey Chtr Sch† | | 3.50% | | 7/1/2025 | | NR | | | 1,220,000 | | | | 1,181,485 | |
| Triborough Brdg & Tunl Auth–Payroll Mobility Tax | | 5.00% | #(b) | 5/15/2051 | | AA+ | | | 5,700,000 | | | | 5,961,160 | |
| Total | | | | | | | | | | | | | 89,544,930 | |
| | | | | | | | | | | | | | | |
| Special Tax 1.26% | | | | | | | | | | | | | | |
| Allentown Neighborhood Impt–City Center† | | 5.00% | | 5/1/2023 | | Ba3 | | | 130,000 | | | | 130,549 | |
| Allentown Neighborhood Impt–City Center† | | 5.00% | | 5/1/2028 | | NR | | | 3,575,000 | | | | 3,541,359 | |
| Atlanta Urban Dev Agency–Atlanta Beltline† | | 2.375% | | 7/1/2026 | | NR | | | 275,000 | | | | 256,784 | |
| CT Spl Tax–Trans Infra | | 5.00% | | 10/1/2022 | | AA- | | | 3,400,000 | | | | 3,400,000 | |
| CT Spl Tax–Trans Infra | | 5.00% | | 1/1/2026 | | AA- | | | 5,000,000 | | | | 5,256,223 | |
| CT Spl Tax–Trans Infra | | 5.00% | | 5/1/2026 | | AA- | | | 2,250,000 | | | | 2,376,088 | |
| CT Spl Tax–Trans Infra | | 5.00% | | 5/1/2027 | | AA- | | | 3,000,000 | | | | 3,205,768 | |
| NYC IDA–Queens Stadium (AGM) | | 5.00% | | 1/1/2027 | | AA | | | 1,000,000 | | | | 1,044,373 | |
| NYC IDA–Queens Stadium (AGM) | | 5.00% | | 1/1/2028 | | AA | | | 650,000 | | | | 683,958 | |
| NYC IDA–Queens Stadium (AGM) | | 5.00% | | 1/1/2029 | | AA | | | 850,000 | | | | 900,440 | |
| NYC IDA–Yankee Stadium (FGIC) | | 9.405%
(CPI YoY * 1 + 0.88% | )# | 3/1/2026 | | Baa1 | | | 2,000,000 | | | | 2,014,667 | |
| Peninsula Town Center† | | 4.00% | | 9/1/2023 | | NR | | | 70,000 | | | | 69,012 | |
| Village CDD #12† | | 3.25% | | 5/1/2023 | | NR | | | 165,000 | | | | 164,424 | |
| Village CDD #13† | | 1.875% | | 5/1/2025 | | NR | | | 1,765,000 | | | | 1,637,677 | |
| Village CDD #13 | | 2.625% | | 5/1/2024 | | NR | | | 130,000 | | | | 126,029 | |
| Village CDD #13† | | 2.625% | | 5/1/2030 | | NR | | | 1,490,000 | | | | 1,267,087 | |
| Total | | | | | | | | | | | | | 26,074,438 | |
| 38 | See Notes to Financial Statements. | |
Schedule of Investments (continued)
SHORT DURATION TAX FREE FUND September 30, 2022
| Investments | | Interest
Rate | | Maturity
Date | | Credit
Rating:
S&P or
Moody’s(a) | | Principal
Amount | | | Fair
Value | |
| Tax Revenue 10.32% | | | | | | | | | | | | | | |
| Anaheim PFA Lease Rev (AGM) | | 5.00% | | 9/1/2026 | | AA | | $ | 7,500,000 | | | $ | 7,885,094 | |
| Burnt Hills-Ballston Lake Central School District | | 3.25% | | 6/22/2023 | | NR | | | 10,000,000 | | | | 9,995,502 | |
| Carthage Central School District | | 3.00% | | 6/27/2023 | | NR | | | 10,000,000 | | | | 9,986,487 | |
| Chicago Sales Tax | | 5.00% | | 1/1/2025 | | AA- | | | 5,000,000 | | | | 5,131,772 | |
| CT Spl Tax–Trans Infra | | 5.00% | | 5/1/2025 | | AA- | | | 850,000 | | | | 885,665 | |
| CT Spl Tax–Trans Infra | | 5.00% | | 5/1/2026 | | AA- | | | 1,300,000 | | | | 1,371,952 | |
| East Ramapo Central Sch Dist | | 3.00% | | 5/31/2023 | | NR | | | 20,000,000 | | | | 19,938,702 | |
| East Syracuse-Minoa Central School District | | 3.00% | | 6/28/2023 | | NR | | | 20,000,000 | | | | 19,979,960 | |
| Geneva City SD | | 3.25% | | 6/23/2023 | | NR | | | 11,155,000 | | | | 11,171,267 | |
| Gowanda Central School District | | 3.00% | | 6/20/2023 | | NR | | | 10,000,000 | | | | 9,969,809 | |
| Guam–Business Privilege Tax | | 5.00% | | 1/1/2029 | | Ba1 | | | 750,000 | | | | 750,024 | |
| Hoosick Falls CSD | | 3.75% | | 8/4/2023 | | NR | | | 10,000,000 | | | | 10,000,020 | |
| Horseheads Central School District | | 3.00% | | 6/22/2023 | | NR | | | 10,000,000 | | | | 9,956,089 | |
| Hudson Cnty NJ Impt Auth | | 3.00% | | 8/4/2023 | | NR | | | 6,250,000 | | | | 6,229,130 | |
| IL State Sales Tax | | 5.00% | | 6/15/2024 | | A- | | | 7,260,000 | | | | 7,415,129 | |
| Jefferson Co–Sch Warrant | | 5.00% | | 9/15/2023 | | AA | | | 2,000,000 | | | | 2,033,677 | |
| Johnson City Central School District | | 3.25% | | 6/27/2023 | | NR | | | 10,000,000 | | | | 9,992,206 | |
| MD Dept Trans | | 4.00% | | 9/1/2026 | | AAA | | | 4,750,000 | | | | 4,890,289 | |
| Miami Dade Co Spl Oblig | | 5.00% | | 4/1/2025 | | AA | | | 6,505,000 | | | | 6,779,343 | |
| Middle Country CSD | | 3.50% | | 6/28/2023 | | NR | | | 15,000,000 | | | | 15,030,363 | |
| Monticello Central School District | | 3.25% | | 6/28/2023 | | NR | | | 15,000,000 | | | | 14,992,497 | |
| Newark Mass Transit–Access Tax | | 2.00% | | 12/8/2022 | | NR | | | 6,000,000 | | | | 5,983,649 | |
| NY Dorm–Sch Dist (AGM) | | 5.00% | | 10/1/2024 | | NR | | | 5,000 | | | | 5,173 | |
| NY Dorm–Sch Dist (AGM) | | 5.00% | | 10/1/2024 | | Aa3 | | | 2,245,000 | | | | 2,324,303 | |
| NY Dorm–Sch Dist (AGM) | | 5.00% | | 10/1/2025 | | Aa3 | | | 1,650,000 | | | | 1,727,673 | |
| Onondaga CSD | | 3.75% | | 6/30/2023 | | NR | | | 14,500,000 | | | | 14,504,992 | |
| Sparks–Legends at Sparks Marina† | | 2.50% | | 6/15/2024 | | Ba2 | | | 70,000 | | | | 67,360 | |
| Sparks–Legends at Sparks Marina† | | 2.75% | | 6/15/2028 | | Ba2 | | | 300,000 | | | | 263,333 | |
| VA Small Bus Fing–NTL Senior Lvg | | 5.00% | | 1/1/2023 | | A | (d) | | 925,000 | | | | 927,088 | |
| VA Small Bus Fing–NTL Senior Lvg | | 5.00% | | 1/1/2025 | | A | (d) | | 1,300,000 | | | | 1,328,080 | |
| VA Small Bus Fing–NTL Senior Lvg | | 5.00% | | 1/1/2027 | | A | (d) | | 1,000,000 | | | | 1,034,476 | |
| VA Small Bus Fing–NTL Senior Lvg | | 5.00% | | 1/1/2028 | | A | (d) | | 1,100,000 | | | | 1,145,811 | |
| Total | | | | | | | | | | | | | 213,696,915 | |
| | See Notes to Financial Statements. | 39 |
Schedule of Investments (continued)
SHORT DURATION TAX FREE FUND September 30, 2022
| Investments | | Interest
Rate | | Maturity
Date | | Credit
Rating:
S&P or
Moody’s(a) | | Principal
Amount | | | Fair
Value | |
| Tobacco 0.99% | | | | | | | | | | | | | | |
| Buckeye Ohio Tob Settlement Fing Auth Sr Asset Backed Ref Bds 2020a-2 Cl 1 | | 5.00% | | 6/1/2029 | | A | | $ | 11,210,000 | | | $ | 11,774,919 | |
| Los Angeles Co Tobacco | | 5.00% | | 6/1/2024 | | A | | | 600,000 | | | | 614,155 | |
| Los Angeles Co Tobacco | | 5.00% | | 6/1/2025 | | A | | | 650,000 | | | | 670,626 | |
| Los Angeles Co Tobacco | | 5.00% | | 6/1/2026 | | A | | | 1,125,000 | | | | 1,163,603 | |
| PA Tob Settlement | | 5.00% | | 6/1/2023 | | A1 | | | 1,125,000 | | | | 1,134,419 | |
| PA Tob Settlement | | 5.00% | | 6/1/2024 | | A1 | | | 5,000,000 | | | | 5,099,727 | |
| Tobacco Settlement Fin Corp NJ | | 3.20% | | 6/1/2027 | | BBB+ | | | 20,000 | | | | 19,873 | |
| Total | | | | | | | | | | | | | 20,477,322 | |
| | | | | | | | | | | | | | | |
| Transportation 8.58% | | | | | | | | | | | | | | |
| Bay Area Toll Auth | | 3.71%
(MUNIPSA * 1 + 1.25% | )# | 4/1/2036 | | AA | | | 2,375,000 | | | | 2,397,077 | |
| Central Tex Regl Mobility Auth | | 5.00% | | 1/1/2025 | | BBB+ | | | 2,500,000 | | | | 2,543,598 | |
| Central TX Mobility Auth | | 5.00% | | 1/1/2027 | | BBB+ | | | 2,000,000 | | | | 2,059,232 | |
| Chesapeake Bay Bridge Dist | | 5.00% | | 11/1/2023 | | BBB | | | 9,000,000 | | | | 9,096,701 | |
| Chicago O’Hare Arpt | | 5.00% | | 1/1/2029 | | A+ | | | 2,500,000 | | | | 2,502,536 | |
| Chicago O’Hare Arpt | | 5.00% | | 1/1/2031 | | A+ | | | 4,750,000 | | | | 4,753,993 | |
| Chicago Trans Auth | | 5.00% | | 6/1/2025 | | A | | | 2,000,000 | | | | 2,069,377 | |
| Denver RTD–Eagle P3 | | 3.00% | | 1/15/2026 | | Baa1 | | | 900,000 | | | | 861,368 | |
| Denver RTD–Eagle P3 | | 5.00% | | 7/15/2027 | | Baa1 | | | 1,000,000 | | | | 1,023,733 | |
| DFW Arpt | | 5.00% | | 11/1/2026 | | A+ | | | 1,750,000 | | | | 1,856,201 | |
| DFW Arpt | | 5.00% | | 11/1/2027 | | A+ | | | 1,415,000 | | | | 1,516,567 | |
| E470 Pub Hwy Auth | | 2.333%
(SOFR *.67 + 0.35% | )# | 9/1/2039 | | A | | | 3,375,000 | | | | 3,341,338 | |
| Grand Parkway Trans–BANs | | 5.00% | | 2/1/2023 | | BBB+ | | | 10,030,000 | | | | 10,077,450 | |
| Hampton Rds Trans | | 5.00% | | 7/1/2026 | | Aa2 | | | 15,120,000 | | | | 15,975,187 | |
| IL State GO | | 5.00% | | 11/1/2025 | | BBB+ | | | 3,000,000 | | | | 3,051,582 | |
| IL Toll Hwy Auth | | 5.00% | | 1/1/2024 | | AA- | | | 7,215,000 | | | | 7,366,941 | |
| LA Offshore Term Auth–LOOP | | 1.65% | #(b) | 9/1/2027 | | A3 | | | 3,500,000 | | | | 3,417,426 | |
| MTA NY | | 5.00% | | 11/15/2030 | | A3 | | | 11,075,000 | | | | 11,094,966 | |
| MTA NY | | 5.00% | | 11/15/2033 | | A3 | | | 5,400,000 | | | | 5,399,750 | |
| MTA NY | | 5.00% | #(b) | 11/15/2045 | | A3 | | | 6,500,000 | | | | 6,716,982 | |
| NC Tpk Auth–Triangle Exprs | | 5.00% | | 2/1/2024 | | BBB | | | 20,180,000 | | | | 20,571,740 | |
| NC Tpk Auth–Triangle Exprs (AGM) | | 5.00% | | 1/1/2028 | | AA | | | 1,500,000 | | | | 1,578,380 | |
| New York Transn Dev Corp Spl Fac Rev Bds Terminal 4 John F Kennedy Intl 2020c | | 5.00% | | 12/1/2025 | | Baa1 | | | 400,000 | | | | 411,659 | |
| NJ Tpk Auth | | 2.545%
(1 Mo. LIBOR *.70 +.75% | )# | 1/1/2030 | | AA- | | | 2,500,000 | | | | 2,500,467 | |
| 40 | See Notes to Financial Statements. | |
Schedule of Investments (continued)
SHORT DURATION TAX FREE FUND September 30, 2022
| Investments | | Interest
Rate | | Maturity
Date | | Credit
Rating:
S&P or
Moody’s(a) | | Principal
Amount | | | Fair
Value | |
| Transportation (continued) | | | | | | | | | | | | | | |
| NJ Tpk Auth | | 5.00% | | 1/1/2027 | | AA- | | $ | 3,200,000 | | | $ | 3,389,526 | |
| NJ Tpk Auth | | 5.00% | | 1/1/2028 | | AA- | | | 8,000,000 | | | | 8,360,159 | |
| NJ Trans Trust Fund | | 5.00% | | 6/15/2023 | | A+ | | | 7,210,000 | | | | 7,278,951 | |
| NY Trans Dev Corp–JFK IAT | | 5.00% | | 12/1/2024 | | Baa1 | | | 1,000,000 | | | | 1,025,241 | |
| NY Trans Dev Corp–JFK IAT | | 5.00% | | 12/1/2026 | | Baa1 | | | 1,795,000 | | | | 1,847,559 | |
| NY Trans Dev Corp–JFK IAT | | 5.00% | | 12/1/2028 | | Baa1 | | | 1,390,000 | | | | 1,443,823 | |
| PA Tpk Commn | | 5.00% | | 12/1/2025 | | A1 | | | 150,000 | | | | 157,369 | |
| PA Tpk Commn | | 5.00% | | 12/1/2025 | | A | | | 750,000 | | | | 783,637 | |
| PA Tpk Commn | | 5.00% | | 12/1/2026 | | A1 | | | 400,000 | | | | 424,871 | |
| Pennsylvania St Tpk Commn Tpk Rev Sub Bds 2021 B | | 5.00% | | 12/1/2026 | | A | | | 750,000 | | | | 790,972 | |
| Triborough Brdg & Tunl Auth | | 2.377%
(SOFR *.67 + 0.38% | )# | 1/1/2032 | | AA- | | | 6,609,083 | | | | 6,556,535 | |
| Triborough Brdg & Tunl Auth–Payroll Mobility Tax | | 5.00% | | 8/15/2024 | | NR | | | 20,000,000 | | | | 20,674,268 | |
| TX Surface Trans Corp–I-635 | | 4.00% | | 12/31/2030 | | Baa2 | | | 3,000,000 | | | | 2,836,978 | |
| Total | | | | | | | | | | | | | 177,754,140 | |
| | | | | | | | | | | | | | | |
| Utilities 19.95% | | | | | | | | | | | | | | |
| Appling Co Dev–Oglethorpe Power | | 1.50% | #(b) | 1/1/2038 | | BBB+ | | | 1,250,000 | | | | 1,154,277 | |
| Black Belt Energy Gas Dist–RBC | | 4.00% | #(b) | 7/1/2052 | | Aa1 | | | 3,000,000 | | | | 2,972,997 | |
| Burke Co Dev–GA Power | | 2.875% | #(b) | 12/1/2049 | | BBB+ | | | 5,650,000 | | | | 5,486,078 | |
| Central Plains–Goldman Sachs | | 4.163%
(SOFR *.67 + 2.18% | )# | 5/1/2053 | | A2 | | | 20,000,000 | | | | 19,387,836 | |
| Central Plains–Goldman Sachs | | 5.00% | | 9/1/2027 | | BBB+ | | | 1,305,000 | | | | 1,334,340 | |
| Chicago Water | | 5.00% | | 11/1/2022 | | A | | | 5,680,000 | | | | 5,687,290 | |
| Chicago Water | | 5.00% | | 11/1/2022 | | A | | | 1,000,000 | | | | 1,001,283 | |
| Chicago Water (AGM) | | 5.00% | | 11/1/2028 | | AA | | | 2,500,000 | | | | 2,666,191 | |
| Cleveland Public Pwr (AGM) | | 5.00% | | 11/15/2026 | | AA | | | 1,190,000 | | | | 1,262,820 | |
| Cleveland Public Pwr (AGM) | | 5.00% | | 11/15/2027 | | AA | | | 2,280,000 | | | | 2,444,732 | |
| Cleveland Public Pwr (AGM) | | 5.00% | | 11/15/2029 | | AA | | | 1,000,000 | | | | 1,091,564 | |
| DE EDA–Delmarva Pwr & Light | | 1.05% | #(b) | 1/1/2031 | | A | | | 6,315,000 | | | | 5,862,245 | |
| DE EDA–NRG Energy | | 1.25% | #(b) | 10/1/2040 | | BBB- | | | 10,000,000 | | | | 8,943,264 | |
| DE EDA–NRG Energy | | 1.25% | #(b) | 10/1/2045 | | BBB- | | | 11,000,000 | | | | 9,837,590 | |
| Escambia Co PCR–Gulf Power | | 2.60% | | 6/1/2023 | | A1 | | | 3,000,000 | | | | 2,979,482 | |
| IN Fin Auth–Indy Power & Light | | 0.65% | | 8/1/2025 | | A2 | | | 4,500,000 | | | | 3,994,416 | |
| Jersey City Sewer Proj | | 3.75% | | 5/5/2023 | | NR | | | 15,000,000 | | | | 14,976,174 | |
| KY Muni Pwr–Prarie State Proj | | 3.45% | #(b) | 9/1/2042 | | Baa1 | | | 1,700,000 | | | | 1,626,174 | |
| | See Notes to Financial Statements. | 41 |
Schedule of Investments (continued)
SHORT DURATION TAX FREE FUND September 30, 2022
| Investments | | Interest
Rate | | Maturity
Date | | Credit
Rating:
S&P or
Moody’s(a) | | Principal
Amount | | | Fair
Value | |
| Utilities (continued) | | | | | | | | | | | | | | |
| KY Public Energy Auth–BP | | 4.00% | #(b) | 1/1/2049 | | A2 | | $ | 1,775,000 | | | $ | 1,768,957 | |
| KY Public Energy Auth–Morgan Stanley | | 4.00% | #(b) | 4/1/2048 | | A1 | | | 3,110,000 | | | | 3,103,775 | |
| LA Env Facs–E Baton Rouge Swr | | 0.875% | #(b) | 2/1/2046 | | A+ | | | 15,000,000 | | | | 13,761,123 | |
| Lansing MI Board of Water & Light | | 2.00% | #(b) | 7/1/2051 | | AA- | | | 10,000,000 | | | | 8,993,753 | (c) |
| Long Island Power Auth | | 0.85% | #(b) | 9/1/2050 | | A | | | 10,500,000 | | | | 9,362,260 | |
| Long Island Power Auth | | 1.50% | #(b) | 9/1/2051 | | A | | | 19,000,000 | | | | 16,946,364 | |
| Long Island Power Auth | | 1.65% | #(b) | 9/1/2049 | | A | | | 4,000,000 | | | | 3,823,699 | |
| Long Island Power Auth | | 2.545%
(1 Mo. LIBOR *.70 + 0.75% | )# | 5/1/2033 | | A | | | 10,000,000 | | | | 10,000,061 | |
| Long Island Power Auth | | 2.91%
(MUNIPSA * 1 +.45% | )# | 9/1/2038 | | A | | | 20,000,000 | | | | 19,965,070 | |
| Long Island Power Auth | | 5.00% | | 9/1/2026 | | A | | | 500,000 | | | | 532,244 | |
| Long Island Power Auth | | 5.00% | | 9/1/2027 | | A | | | 500,000 | | | | 539,067 | |
| Long Island Power Auth | | 5.00% | #(b) | 9/1/2052 | | A | | | 20,000,000 | | | | 21,301,918 | |
| Louisa VA IDA–VA Elec & Pwr | | 0.75% | #(b) | 11/1/2035 | | A2 | | | 6,000,000 | | | | 5,490,457 | |
| Louisa VA IDA–VA Elec & Pwr | | 1.90% | #(b) | 11/1/2035 | | A2 | | | 5,000,000 | | | | 4,942,751 | |
| Main St Nat Gas-Citadel† | | 4.00% | #(b) | 8/1/2052 | | BBB- | | | 20,000,000 | | | | 18,826,872 | |
| Mason Cnty Poll Ctrl–Appalachian Power | | 2.75% | | 10/1/2022 | | A- | | | 27,500,000 | | | | 27,500,000 | |
| Monroe Dev Auth–Oglethorpe Power | | 1.50% | #(b) | 1/1/2039 | | BBB+ | | | 1,875,000 | | | | 1,731,415 | |
| NC Wst Rev–Republic Services | | 2.75% | #(b) | 7/1/2034 | | BBB+ | | | 13,500,000 | | | | 13,490,707 | |
| NE Public Power | | 0.60% | #(b) | 1/1/2051 | | A+ | | | 15,000,000 | | | | 14,670,385 | |
| Northern CA Gas–Goldman Sachs | | 4.00% | #(b) | 7/1/2049 | | A2 | | | 5,000,000 | | | | 4,991,572 | |
| Orlando Util Commn | | 1.25% | #(b) | 10/1/2046 | | AA | | | 10,000,000 | | | | 7,992,188 | |
| Philadelphia Gas Works | | 5.00% | | 8/1/2023 | | A | | | 850,000 | | | | 861,102 | |
| Philadelphia Gas Works | | 5.00% | | 8/1/2024 | | A | | | 800,000 | | | | 822,133 | |
| PIttsburgh Water & Swr Auth (AGM) | | 3.11%
(MUNIPSA * 1 +.65% | )# | 9/1/2040 | | AA | | | 17,500,000 | | | | 17,505,738 | |
| PR Elec Pwr Auth(e) | | 5.25% | | 7/1/2018 | | NR | | | 2,000,000 | | | | 1,480,000 | |
| Rockport IN Poll Ctl–IN MI Pwr | | 3.05% | | 6/1/2025 | | A- | | | 3,500,000 | | | | 3,443,870 | |
| San Antonio Elec & Gas | | 2.75% | #(b) | 2/1/2048 | | Aa3 | | | 8,000,000 | | | | 7,995,656 | |
| San Antonio Elec & Gas | | 5.00% | | 2/1/2024 | | Aa2 | | | 1,250,000 | | | | 1,279,983 | |
| San Antonio Water | | 2.625% | #(b) | 5/1/2049 | | AA+ | | | 11,415,000 | | | | 11,317,850 | |
| SE AL Gas Dist–Goldman Sachs | | 3.773%
(SOFR *.67 + 1.79% | )# | 5/1/2053 | | A2 | | | 18,000,000 | | | | 17,278,443 | |
| Texas Municipal Power Agency (AGM) | | 3.00% | | 9/1/2025 | | AA | | | 750,000 | | | | 735,857 | |
| Texas Municipal Power Agency (AGM) | | 3.00% | | 9/1/2026 | | AA | | | 1,100,000 | | | | 1,067,626 | |
| TX Muni Gas Acq & Supply–Macquarie | | 5.00% | | 12/15/2023 | | A3 | | | 3,000,000 | | | | 3,024,055 | |
| 42 | See Notes to Financial Statements. | |
Schedule of Investments (continued)
SHORT DURATION TAX FREE FUND September 30, 2022
| Investments | | | | Interest
Rate | | Maturity
Date | | Credit
Rating:
S&P or
Moody’s(a) | | Principal
Amount | | | Fair
Value | |
| Utilities (continued) | | | | | | | | | | | | | | | | |
| TX Muni Gas Acq & Supply–Macquarie | | 5.00% | | 12/15/2024 | | A3 | | $ | 2,785,000 | | | $ | 2,821,807 | |
| TX Muni Gas Acq & Supply–Macquarie | | 5.00% | | 12/15/2025 | | A3 | | | 4,000,000 | | | | 4,072,132 | |
| TX Muni Gas Acq & Supply–Macquarie | | 5.00% | | 12/15/2026 | | A3 | | | 5,000,000 | | | | 5,110,842 | |
| TX Muni Gas Acq & Supply–Macquarie | | 5.00% | | 12/15/2027 | | A3 | | | 5,875,000 | | | | 6,026,654 | |
| Wise Co IDA–VA Elec & Pwr | | | | 0.75% | #(b) | 10/1/2040 | | A2 | | | 12,000,000 | | | | 10,980,913 | |
| WV EDA–Appalachian Pwr | | | | 0.625% | #(b) | 12/1/2038 | | A- | | | 8,500,000 | | | | 7,416,538 | |
| WV EDA–Appalachian Pwr | | | | 2.55% | #(b) | 3/1/2040 | | A- | | | 2,200,000 | | | | 2,129,253 | |
| York Co IDA–VA Elec & Pwr | | | | 1.90% | #(b) | 5/1/2033 | | A2 | | | 5,500,000 | | | | 5,437,026 | |
| Total | | | | | | | | | | | | | | | 413,250,869 | |
| Total Municipal Bonds (cost $1,961,637,302) | | | | | | | | | | | | | 1,872,255,538 | |
| | | | | | | | | | | | | | | |
| | | Interest
Rate# | | Interest
Rate
Reset
Date(f) | | Final
Maturity
Date | | | | | | | | |
| SHORT-TERM INVESTMENTS 7.35% | | | | | | | | | | | | | | | | |
| | | | | | | | | | | | | | | | | |
| VARIABLE RATE DEMAND NOTES 7.35% | | | | | | | | | | | | | |
| | | | | | | | | | | | | | | | | |
| Corporate-Backed 2.12% | | | | | | | | | | | | | | | | |
| Mobile IDB–AL Power | | 2.900% | | 10/3/2022 | | 12/1/2037 | | A1 | | | 42,965,000 | | | | 42,965,000 | |
| MS Business Fin Corp–PSL | | 3.750% | | 10/6/2022 | | 11/1/2032 | | BBB- | | | 1,000,000 | | | | 1,000,000 | |
| Total | | | | | | | | | | | | | | | 43,965,000 | |
| | | | | | | | | | | | | | | | | |
| General Obligation 2.10% | | | | | | | | | | | | | | | | |
| NYC GO ARS | | 2.750% | | 10/3/2022 | | 4/1/2042 | | AA | | | 10,000,000 | | | | 10,000,000 | |
| NYC GO ARS | | 2.850% | | 10/3/2022 | | 4/1/2042 | | AA | | | 13,000,000 | | | | 13,000,000 | |
| NYC GO ARS | | 2.900% | | 10/3/2022 | | 10/1/2046 | | AA | | | 20,600,000 | | | | 20,600,000 | |
| Total | | | | | | | | | | | | | | | 43,600,000 | |
| | | | | | | | | | | | | | | | | |
| Health Care 3.03% | | | | | | | | | | | | | | | | |
| AL Hlth Care Auth–Baptist Health | | 2.980% | | 10/6/2022 | | 11/1/2042 | | A3 | | | 17,055,000 | | | | 17,055,000 | |
| AR DFA–Baptist Mem Hlth | | 2.980% | | 10/6/2022 | | 9/1/2044 | | BBB+ | | | 26,906,000 | | | | 26,906,000 | |
| Lee Memorial Hlth System | | 2.860% | | 10/6/2022 | | 4/1/2049 | | A+ | | | 18,780,000 | | | | 18,780,000 | |
| Total | | | | | | | | | | | | | | | 62,741,000 | |
| | | | | | | | | | | | | | | | | |
| Utilities 0.10% | | | | | | | | | | | | | | | | |
| Appling Co Dev–GA Power | | 2.960% | | 10/3/2022 | | 9/1/2041 | | BBB+ | | | 2,000,000 | | | | 2,000,000 | |
| Total Short-Term Investments (cost $152,306,000) | | | | | | | | | | | 152,306,000 | |
| Total Investments in Securities 97.75% (cost $2,113,943,302) | | | | | | | | | | | 2,024,561,538 | |
| Other Assets and Liabilities – Net 2.25% | | | | | | | | | | | 46,610,337 | |
| Net Assets 100.00% | | | | | | | | | | | | | | $ | 2,071,171,875 | |
| | See Notes to Financial Statements. | 43 |
Schedule of Investments (continued)
SHORT DURATION TAX FREE FUND September 30, 2022
| AGM | | Insured by–Assured Guaranty Municipal Corporation. |
| AMBAC | | Insured by–AMBAC Assurance Corporation. |
| COPS | | Certificates of Participation. |
| CPI | | Consumer Price Index: Rate fluctuates based on CPI. |
| FGIC | | Insured by–Financial Guaranty Insurance Company. |
| FHA | | Insured by–Federal Housing Administration. |
| GNMA | | Insured by–Government National Mortgage Association. |
| GTD | | Guaranteed. |
| LIBOR | | London Interbank Offered Rate. |
| MUNIPSA | | SIFMA Municipal Swap Index Yield. |
| NR | | Not Rated. |
| SIFMA | | Insured by–Securities Industry and Financial Markets Association. |
| SOFR | | Secured Overnight Financing Rate. |
| SONYMA | | Insured by State of New York Mortgage Agency. |
| YoY | | Year on Year Inflation Rates. |
| # | | Variable rate security. The interest rate represents the rate in effect at September 30, 2022. |
| † | | Security was purchased pursuant to Rule 144A under the Securities Act of 1933 and, unless registered under such Act or exempted from registration, may only be resold to qualified institutional buyers. At September 30, 2022, the total value of Rule 144A securities was $34,333,310, which represents 1.66% of net assets. |
| (a) | | Unaudited. |
| (b) | | Variable Rate is Fixed to Float: Rate remains fixed or at Zero Coupon until designated future date. |
| (c) | | Level 3 Investment as described in Note2(i) in the Notes to Financials. Security valued utilizing third party pricing information without adjustment. Such valuations are based on unobservable inputs. A significant change in third party information could result in a significantly lower or higher value of such Level 3 investments. |
| (d) | | This investment has been rated by Fitch IBCA. |
| (e) | | Defaulted (non-income producing security). |
| (f) | | The interest rate reset date shown represents the date in which the Fund has the right to sell a Variable Rate Demand Note (“VRDN”) back to the issuer for Principal Amount. The interest rate on the VRDN is generally reset daily based on the SIFMA Municipal Swap Index. |
The following is a summary of the inputs used as of September 30, 2022 in valuing the Fund’s investments carried at fair value(1):
| Investment Type(2) | | Level 1 | | | Level 2 | | | Level 3 | | | Total | |
| Long-Term Investments | | | | | | | | | | | | | | | | |
| Municipal Bonds | | | | | | | | | | | | | | | | |
| Education | | $ | – | | | $ | 32,444,520 | | | $ | 19,131,027 | | | $ | 51,575,547 | |
| Utilities | | | – | | | | 404,257,116 | | | | 8,993,753 | | | | 413,250,869 | |
| Remaining Industries | | | – | | | | 1,407,429,122 | | | | – | | | | 1,407,429,122 | |
| Short-Term Investments | | | | | | | | | | | | | | | | |
| Variable Rate Demand Notes | | | – | | | | 152,306,000 | | | | – | | | | 152,306,000 | |
| Total | | $ | – | | | $ | 1,996,436,758 | | | $ | 28,124,780 | | | $ | 2,024,561,538 | |
| | | |
| (1) | | Refer to Note 2(i) for a description of fair value measurements and the three-tier hierarchy of inputs. |
| (2) | | See Schedule of Investments for fair values in each industry. The table above is presented by Investment Type. Industries are presented within an Investment Type should such Investment Type include securities classified as two or more levels within the three-tier fair value hierarchy. When applicable each Level 3 security is identified on the Schedule of Investments along with the valuation technique utilized. |
A reconciliation of Level 3 investments is presented when the Fund has a material amount of Level 3 investments at the beginning or end of the year in relation to the Fund’s net assets.
| 44 | See Notes to Financial Statements. | |
Schedule of Investments (concluded)
SHORT DURATION TAX FREE FUND September 30, 2022
The following is a reconciliation of investments with unobservable inputs (Level 3) that were used in determining fair value:
| Investment Type | | Municipal Bonds | |
| Balance as of October 1, 2021 | | $ | – | |
| Accrued Discounts (Premiums) | | | (141,078 | ) |
| Realized Gain (Loss) | | | – | |
| Change in Unrealized Appreciation (Depreciation) | | | (1,633,883 | ) |
| Purchases | | | 19,350,000 | |
| Sales | | | – | |
| Transfers into Level 3(a) | | | 10,549,741 | |
| Transfers out of Level 3 | | | – | |
| Balance as of September 30, 2022 | | $ | 28,124,780 | |
| Change in unrealized appreciation/ depreciation for the year ended September 30, 2022, related to Level 3 investments held at September 30, 2022 | | $ | (1,633,883 | ) |
| | | |
| (a) | | The Fund recognizes transfers within the fair value hierarchy as of the beginning of the period. Transfers into and out of Level 3 were primarily related to the availability of market quotations in accordance with valuation methodology. |
| | See Notes to Financial Statements. | 45 |
Schedule of Investments
INTERMEDIATE TAX FREE FUND September 30, 2022
| Investments | | Interest
Rate | | | Maturity
Date | | Credit
Rating:
S&P or
Moody’s(a) | | Principal
Amount | | | Fair
Value | |
| LONG-TERM INVESTMENTS 96.80% | | | | | | | | | | | | | | | |
| | | | | | | | | | | | | | | | |
| MUNICIPAL BONDS 96.80% | | | | | | | | | | | | | | | |
| | | | | | | | | | | | | | | | |
| Corporate-Backed 9.36% | | | | | | | | | | | | | | | |
| Allegheny Co IDA–US Steel | | 4.875% | | | 11/1/2024 | | BB- | | $ | 4,300,000 | | | $ | 4,303,618 | |
| AZ IDA | | 3.625% | | | 5/20/2033 | | BBB | | | 14,233,223 | | | | 13,015,812 | |
| Black Belt Energy Gas Dist–Goldman Sachs | | 4.00% | #(b) | | 10/1/2052 | | A2 | | | 32,280,000 | | | | 31,453,138 | |
| Build NYC Res Corp–Pratt Paper AMT† | | 4.50% | | | 1/1/2025 | | NR | | | 2,560,000 | | | | 2,579,842 | |
| Build NYC Res Corp–Pratt Paper AMT† | | 5.00% | | | 1/1/2035 | | NR | | | 550,000 | | | | 553,316 | |
| Burke Co Dev–Oglethorpe Power | | 1.50% | #(b) | | 1/1/2040 | | BBB+ | | | 3,750,000 | | | | 3,462,830 | |
| CA Muni Fin–Waste Mgmt AMT | | 2.40% | #(b) | | 10/1/2044 | | A- | | | 9,850,000 | | | | 8,752,191 | |
| CA Poll Ctl–Waste Mgmt AMT | | 3.00% | | | 11/1/2025 | | A- | | | 9,850,000 | | | | 9,545,284 | |
| Downtown Doral CDD† | | 4.25% | | | 12/15/2028 | | NR | | | 250,000 | | | | 244,866 | |
| Downtown Doral CDD† | | 4.75% | | | 12/15/2038 | | NR | | | 625,000 | | | | 598,698 | |
| FL DFC–Waste Pro AMT† | | 5.00% | | | 5/1/2029 | | NR | | | 2,640,000 | | | | 2,510,548 | |
| Gloucester Co Poll Ctl–Logan AMT | | 5.00% | | | 12/1/2024 | | NR | | | 885,000 | | | | 894,968 | |
| Granite City IL–Waste Mgmt AMT | | 1.25% | | | 5/1/2027 | | A- | | | 5,485,000 | | | | 4,759,382 | |
| Greater Orlando Aviation–Jet Blue | | 5.00% | | | 11/15/2026 | | NR | | | 2,980,000 | | | | 2,987,832 | |
| Henderson Facs–Pratt Paper AMT† | | 3.70% | | | 1/1/2032 | | NR | | | 4,000,000 | | | | 3,725,512 | |
| Henderson Facs–Pratt Paper AMT† | | 4.45% | | | 1/1/2042 | | NR | | | 1,500,000 | | | | 1,360,719 | |
| Hoover IDA–US Steel AMT | | 6.375% | #(b) | | 11/1/2050 | | BB- | | | 8,525,000 | | | | 9,360,847 | |
| Houston Arpt–United Airlines AMT | | 4.00% | | | 7/1/2041 | | B- | (c) | | 2,450,000 | | | | 1,926,171 | |
| Houston Arpt–United Airlines AMT | | 4.00% | | | 7/15/2041 | | B- | (c) | | 5,700,000 | | | | 4,479,908 | |
| Houston Arpt–United Airlines AMT | | 5.00% | | | 7/1/2029 | | Ba3 | | | 2,295,000 | | | | 2,254,933 | |
| IA Fin Auth–Alcoa | | 4.75% | | | 8/1/2042 | | BB+ | | | 1,250,000 | | | | 1,119,514 | |
| IA Fin Auth–Iowa Fertilizer Co | | 4.00% | #(b) | | 12/1/2050 | | BBB- | | | 6,210,000 | | | | 5,645,648 | |
| IN Fin Auth–OVEC | | 2.50% | | | 11/1/2030 | | Baa3 | | | 1,000,000 | | | | 847,294 | |
| IN Fin Auth–OVEC | | 3.00% | | | 11/1/2030 | | Baa3 | | | 3,000,000 | | | | 2,652,405 | |
| IN Fin Auth–OVEC | | 3.00% | | | 11/1/2030 | | Baa3 | | | 9,850,000 | | | | 8,702,636 | |
| IN Fin Auth–US Steel | | 4.125% | | | 12/1/2026 | | BB- | | | 1,625,000 | | | | 1,573,894 | |
| IN Fin Auth–US Steel AMT | | 6.75% | | | 5/1/2039 | | BB- | | | 1,500,000 | | | | 1,668,363 | |
| Indianapolis Local Pub Impt–IND Arpt AMT | | 5.00% | | | 1/1/2026 | | A1 | | | 9,425,000 | | | | 9,612,848 | |
| Indianapolis Local Pub Impt–IND Arpt AMT | | 5.00% | | | 1/1/2027 | | A1 | | | 8,300,000 | | | | 8,449,992 | |
| LA Env Facs–Westlake Chem | | 3.50% | | | 11/1/2032 | | BBB | | | 14,525,000 | | | | 13,314,057 | |
| LA St John Parish–Marathon Oil | | 2.125% | #(b) | | 6/1/2037 | | BBB- | | | 6,850,000 | | | | 6,681,866 | |
| LA St John Parish–Marathon Oil | | 2.20% | #(b) | | 6/1/2037 | | BBB- | | | 6,000,000 | | | | 5,567,504 | |
| LA St John Parish–Marathon Oil | | 2.375% | #(b) | | 6/1/2037 | | BBB- | | | 12,480,000 | | | | 11,657,453 | |
| Liberty Dev Corp–Goldman Sachs | | 5.25% | | | 10/1/2035 | | A2 | | | 10,215,000 | | | | 10,601,144 | |
| 46 | See Notes to Financial Statements. |
Schedule of Investments (continued)
INTERMEDIATE TAX FREE FUND September 30, 2022
| Investments | | Interest
Rate | | | Maturity
Date | | Credit
Rating:
S&P or
Moody’s(a) | | Principal
Amount | | | Fair
Value | |
| Corporate-Backed (continued) | | | | | | | | | | | | | | | |
| MA DFA–Waste Mgmt AMT† | | 1.25% | | | 5/1/2027 | | A- | | $ | 3,250,000 | | | $ | 2,820,053 | |
| Maricopa Co IDA–Commercial Metals AMT† | | 4.00% | | | 10/15/2047 | | BB+ | | | 2,000,000 | | | | 1,538,556 | |
| Matagorda Co Nav Dist–AEP TX Central | | 2.60% | | | 11/1/2029 | | A- | | | 6,800,000 | | | | 5,851,929 | |
| Matagorda Co Nav Dist–AEP TX Central | | 4.00% | | | 6/1/2030 | | A- | | | 8,000,000 | | | | 7,662,566 | |
| Matagorda Co Nav Dist–AEP TX Central (AMBAC) | | 4.40% | | | 5/1/2030 | | A- | | | 3,500,000 | | | | 3,445,404 | |
| MD EDC–Chesapeake Bay Hyatt(d) | | 5.00% | | | 12/1/2016 | | NR | | | 2,570,000 | | | | 1,542,000 | |
| MI Strategic Fd–Waste Mgmt | | 0.58% | #(b) | | 8/1/2027 | | A- | | | 3,000,000 | | | | 2,803,098 | |
| MI Strategic Fund–GPK AMT | | 4.00% | #(b) | | 10/1/2061 | | BB | | | 4,640,000 | | | | 4,470,699 | |
| Mission Econ Dev Corp–Natgasoline AMT† | | 4.625% | | | 10/1/2031 | | BB- | | | 10,000,000 | | | | 9,866,192 | |
| Nez Perce Co Poll Ctl–Potlatch | | 2.75% | | | 10/1/2024 | | BBB- | | | 10,500,000 | | | | 10,284,501 | |
| NH National Fin Auth–Covanta† | | 3.625% | #(b) | | 7/1/2043 | | B | | | 980,000 | | | | 747,490 | |
| NH National Fin Auth–Covanta AMT† | | 3.75% | #(b) | | 7/1/2045 | | B | | | 1,970,000 | | | | 1,529,707 | |
| NH National Fin Auth–Covanta AMT† | | 4.00% | | | 11/1/2027 | | B | | | 4,225,000 | | | | 4,017,527 | |
| NH National Fin Auth–Hsg Sec | | 4.125% | | | 1/20/2034 | | BBB | | | 4,809,507 | | | | 4,459,603 | |
| NH National Fin Auth–NY Electric & Gas AMT | | 4.00% | | | 12/1/2028 | | A- | | | 2,500,000 | | | | 2,462,730 | |
| Niagara Area Dev Corp–Covanta† | | 3.50% | | | 11/1/2024 | | B1 | | | 4,650,000 | | | | 4,535,405 | |
| Niagara Area Dev Corp–Covanta AMT† | | 4.75% | | | 11/1/2042 | | B1 | | | 5,500,000 | | | | 4,808,225 | |
| NJ EDA–Continental Airlines | | 5.25% | | | 9/15/2029 | | Ba3 | | | 11,320,000 | | | | 11,215,892 | |
| NJ EDA–Continental Airlines | | 5.50% | | | 6/1/2033 | | Ba3 | | | 1,500,000 | | | | 1,472,627 | |
| NJ EDA–Sch Facs | | 5.00% | | | 6/15/2030 | | A3 | | | 2,000,000 | | | | 2,146,710 | |
| NJ EDA–Sch Facs | | 5.00% | | | 6/15/2033 | | A3 | | | 2,000,000 | | | | 2,029,859 | |
| NY Energy RDA–NYSEGC | | 3.50% | | | 10/1/2029 | | A- | | | 8,200,000 | | | | 7,804,562 | |
| NY Env Facs–Casella Waste AMT | | 2.75% | #(b) | | 9/1/2050 | | B | | | 1,900,000 | | | | 1,776,174 | |
| NY Env Facs–Casella Waste AMT† | | 2.875% | #(b) | | 12/1/2044 | | B | | | 2,000,000 | | | | 1,679,788 | |
| NY Liberty Dev Corp–3 WTC† | | 5.15% | | | 11/15/2034 | | NR | | | 1,875,000 | | | | 1,828,725 | |
| NY Liberty Dev Corp–3 WTC† | | 7.25% | | | 11/15/2044 | | NR | | | 1,920,000 | | | | 1,935,420 | |
| NY Liberty Dev Corp–4 WTC | | 2.50% | | | 11/15/2036 | | A+ | | | 2,500,000 | | | | 1,801,975 | |
| NY Trans Dev Corp–American Airlines AMT | | 5.00% | | | 8/1/2026 | | B- | | | 2,455,000 | | | | 2,455,036 | |
| NY Trans Dev Corp–American Airlines AMT | | 5.25% | | | 8/1/2031 | | B- | | | 1,990,000 | | | | 1,991,221 | |
| NY Trans Dev Corp–American Airlines AMT | | 5.375% | | | 8/1/2036 | | B- | | | 1,850,000 | | | | 1,815,382 | |
| NYC IDA–TRIPS | | 5.00% | | | 7/1/2028 | | BBB+ | | | 3,500,000 | | | | 3,510,510 | |
| OH Air Dev Auth–AEP | | 1.90% | #(b) | | 5/1/2026 | | BBB+ | | | 3,285,000 | | | | 3,121,855 | |
| OH Air Dev Auth–AEP | | 2.40% | #(b) | | 12/1/2038 | | BBB+ | | | 4,500,000 | | | | 3,924,613 | |
| OH Air Dev Auth–AEP AMT | | 2.50% | #(b) | | 11/1/2042 | | BBB+ | | | 5,800,000 | | | | 5,051,465 | |
| OH Air Dev Auth–AEP AMT | | 2.60% | #(b) | | 6/1/2041 | | BBB+ | | | 19,250,000 | | | | 16,879,282 | |
| | See Notes to Financial Statements. | 47 |
Schedule of Investments (continued)
INTERMEDIATE TAX FREE FUND September 30, 2022
| Investments | | Interest
Rate | | | Maturity
Date | | Credit
Rating:
S&P or
Moody’s(a) | | Principal
Amount | | | Fair
Value | |
| Corporate-Backed (continued) | | | | | | | | | | | | | | | |
| OH Air Dev Auth–OVEC | | 3.25% | | | 9/1/2029 | | Baa3 | | $ | 1,500,000 | | | $ | 1,375,827 | |
| OH Air Quality–Pratt Paper AMT† | | 3.75% | | | 1/15/2028 | | NR | | | 1,290,000 | | | | 1,286,439 | |
| OH Air Quality–Pratt Paper AMT† | | 4.25% | | | 1/15/2038 | | NR | | | 4,955,000 | | | | 4,507,119 | |
| PA Econ Dev–Waste Mgmt AMT | | 0.58% | #(b) | | 8/1/2037 | | A- | | | 5,500,000 | | | | 5,139,012 | |
| PA EDA–Consol Energy AMT† | | 9.00% | #(b) | | 4/1/2051 | | B- | | | 2,375,000 | | | | 2,708,208 | |
| PA EDA–Covanta AMT† | | 3.25% | | | 8/1/2039 | | B | | | 1,035,000 | | | | 755,600 | |
| PA EDA–Procter & Gamble | | 5.375% | | | 3/1/2031 | | AA- | | | 1,365,000 | | | | 1,492,013 | |
| Parish of St James–Nustar Logistics† | | 6.10% | #(b) | | 6/1/2038 | | BB- | | | 2,860,000 | | | | 3,048,547 | |
| Parish of St James–Nustar Logistics† | | 6.10% | #(b) | | 12/1/2040 | | BB- | | | 4,500,000 | | | | 4,796,665 | |
| Phenix City–Meadwestvaco AMT | | 4.125% | | | 5/15/2035 | | BBB | | | 1,500,000 | | | | 1,451,861 | |
| Port Beaumont Nav Dis–Jefferson Rail AMT† | | 2.75% | | | 1/1/2036 | | NR | | | 3,125,000 | | | | 2,233,596 | |
| Port Beaumont Nav Dis–Jefferson Rail AMT† | | 2.875% | | | 1/1/2041 | | NR | | | 2,420,000 | | | | 1,586,117 | |
| Rockdale Co Dev Auth–Pratt Paper AMT† | | 4.00% | | | 1/1/2038 | | NR | | | 5,205,000 | | | | 4,603,749 | |
| Salem Co Poll Ctl–Chambers AMT | | 5.00% | | | 12/1/2023 | | NR | | | 2,990,000 | | | | 3,023,453 | |
| Selma IDB–Intl Paper | | 2.00% | #(b) | | 11/1/2033 | | BBB | | | 1,000,000 | | | | 963,185 | |
| St James Parish–Nustar Logistics† | | 5.85% | #(b) | | 8/1/2041 | | BB- | | | 1,000,000 | | | | 1,026,592 | |
| Sumter Co IDA–Enviva Inc AMT | | 6.00% | #(b) | | 7/15/2052 | | B+ | | | 15,000,000 | | | | 13,799,079 | |
| Tuscaloosa IDA–Hunt Refining† | | 5.25% | | | 5/1/2044 | | NR | | | 3,950,000 | | | | 3,336,878 | |
| VA Small Bus Fing–Covanta AMT† | | 5.00% | #(b) | | 1/1/2048 | | B | | | 440,000 | | | | 403,094 | |
| Valparaiso Facs–Pratt Paper AMT | | 5.875% | | | 1/1/2024 | | NR | | | 325,000 | | | | 330,009 | |
| Valparaiso Facs–Pratt Paper AMT | | 6.75% | | | 1/1/2034 | | NR | | | 5,000,000 | | | | 5,127,831 | |
| VT EDA–Casella Waste AMT† | | 5.00% | #(b) | | 6/1/2052 | | B | | | 5,500,000 | | | | 5,357,132 | |
| Warren Co–Intl Paper | | 2.90% | #(b) | | 9/1/2032 | | BBB | | | 7,500,000 | | | | 7,433,200 | |
| West Pace Coop Dist(d) | | 9.125% | | | 5/1/2039 | | NR | | | 4,900,000 | | | | 3,724,000 | (e) |
| Whiting Env Facs–BP AMT | | 5.00% | #(b) | | 11/1/2045 | | A2 | | | 6,855,000 | | | | 6,860,267 | |
| WI PFA–American Dream† | | 5.00% | | | 12/1/2027 | | NR | | | 5,820,000 | | | | 5,097,576 | |
| WI PFA–American Dream† | | 6.75% | | | 12/1/2042 | | NR | | | 5,000,000 | | | | 4,212,572 | |
| WI PFA–Celanese AMT | | 5.00% | | | 12/1/2025 | | BBB | | | 6,500,000 | | | | 6,628,820 | |
| WI PFA–Sky Harbour AMT | | 4.00% | | | 7/1/2036 | | NR | | | 5,000,000 | | | | 3,928,448 | |
| WI PFA–Sky Harbour AMT | | 4.00% | | | 7/1/2041 | | NR | | | 2,500,000 | | | | 1,818,504 | |
| WI PFA–TRIPS AMT | | 5.00% | | | 7/1/2042 | | BBB+ | | | 7,650,000 | | | | 7,593,137 | |
| WI PFA–TRIPS AMT | | 5.25% | | | 7/1/2028 | | BBB+ | | | 3,750,000 | | | | 3,764,729 | |
| WI PFA- Waste Mgmt AMT | | 1.10% | #(b) | | 7/1/2029 | | A- | | | 8,000,000 | | | | 7,146,824 | |
| Yavapai Co IDA–Waste Mgmt AMT | | 1.30% | | | 6/1/2027 | | A- | | | 4,650,000 | | | | 4,034,404 | |
| Total | | | | | | | | | | | | | | 472,746,301 | |
| 48 | See Notes to Financial Statements. |
Schedule of Investments (continued)
INTERMEDIATE TAX FREE FUND September 30, 2022
| Investments | | Interest
Rate | | | Maturity
Date | | Credit
Rating:
S&P or
Moody’s(a) | | Principal
Amount | | | Fair
Value | |
| Education 5.82% | | | | | | | | | | | | | | | |
| Barrington Cmnty Unit Sch Dist No 220 | | 3.00% | | | 12/1/2032 | | AAA | | $ | 6,310,000 | | | $ | 5,693,782 | |
| CA Choice Clean Energy–Morgan Stanley | | 3.697%
(SOFR * .67 + 1.70% | )# | | 5/1/2053 | | A1 | | | 10,000,000 | | | | 9,949,536 | (e) |
| CA Choice Clean Energy–Morgan Stanley | | 4.00% | #(b) | | 5/1/2053 | | A1 | | | 13,000,000 | | | | 12,712,654 | |
| CA Fin Auth–Biola Univ | | 5.00% | | | 10/1/2028 | | Baa1 | | | 420,000 | | | | 425,082 | |
| CA Fin Auth–Biola Univ | | 5.00% | | | 10/1/2030 | | Baa1 | | | 430,000 | | | | 434,816 | |
| CA Sch Fin–Aspire† | | 5.00% | | | 8/1/2036 | | NR | | | 125,000 | | | | 130,989 | |
| CA Sch Fin–Aspire† | | 5.00% | | | 8/1/2036 | | BBB | | | 1,475,000 | | | | 1,480,537 | |
| CA Sch Fin–Green Dot Charter† | | 5.00% | | | 8/1/2045 | | BBB- | | | 1,805,000 | | | | 1,770,750 | |
| CA State Univ Sys | | 5.00% | | | 11/1/2026 | | Aa2 | | | 2,750,000 | | | | 2,901,053 | |
| California State University | | 0.55% | #(b) | | 11/1/2049 | | Aa2 | | | 6,750,000 | | | | 5,679,077 | (e) |
| Cap Trust Ed–Renaissance Charter† | | 5.00% | | | 6/15/2039 | | NR | | | 2,160,000 | | | | 1,991,774 | |
| Chicago Brd Ed | | 5.00% | | | 12/1/2034 | | BB | | | 3,000,000 | | | | 2,992,277 | |
| Chicago Brd Ed | | 5.00% | | | 12/1/2036 | | BB | | | 9,000,000 | | | | 8,875,430 | |
| Clifton Higher Ed–Intl Ldrshp Sch | | 5.125% | | | 8/15/2030 | | NR | | | 3,500,000 | | | | 3,503,004 | |
| Clifton Higher Ed–Intl Ldrshp Sch | | 5.75% | | | 8/15/2038 | | NR | | | 1,405,000 | | | | 1,420,007 | |
| CT Hlth & Ed–Quinnipiac Univ | | 5.00% | | | 7/1/2033 | | A- | | | 8,230,000 | | | | 8,464,113 | |
| Dutchess Co LDC–Bard College† | | 5.00% | | | 7/1/2040 | | BB+ | | | 1,150,000 | | | | 1,074,162 | |
| Dutchess Co LDC–Bard College† | | 5.00% | | | 7/1/2045 | | BB+ | | | 2,000,000 | | | | 1,820,257 | |
| Frederick Co Ed Fac–Mount St Mary’s Univ† | | 5.00% | | | 9/1/2027 | | BB+ | | | 2,000,000 | | | | 2,005,522 | |
| Frederick Co Ed Fac–Mount St Mary’s Univ† | | 5.00% | | | 9/1/2032 | | BB+ | | | 2,400,000 | | | | 2,355,803 | |
| Fulton Co Dev–GA Tech Athletic Assoc | | 5.00% | | | 10/1/2022 | | A2 | | | 215,000 | | | | 215,000 | |
| IL Fin Auth–IL Inst of Tech | | 4.00% | | | 9/1/2035 | | Baa3 | | | 2,600,000 | | | | 2,273,064 | |
| IL Fin Auth–IL Inst of Tech | | 5.00% | | | 9/1/2030 | | Baa3 | | | 625,000 | | | | 637,280 | |
| IL Fin Auth–IL Inst of Tech | | 5.00% | | | 9/1/2031 | | Baa3 | | | 600,000 | | | | 607,567 | |
| IL Fin Auth–IL Inst of Tech | | 5.00% | | | 9/1/2032 | | Baa3 | | | 500,000 | | | | 503,461 | |
| IL Fin Auth–IL Inst of Tech | | 5.00% | | | 9/1/2033 | | Baa3 | | | 1,000,000 | | | | 1,001,425 | |
| IL Fin Auth–IL Inst of Tech | | 5.00% | | | 9/1/2034 | | Baa3 | | | 2,620,000 | | | | 2,594,071 | |
| IL Fin Auth–IL Inst of Tech | | 5.00% | | | 9/1/2036 | | Baa3 | | | 3,225,000 | | | | 3,172,349 | |
| IL Fin Auth–Noble Chtr Sch | | 5.00% | | | 9/1/2025 | | BBB | | | 940,000 | | | | 952,376 | |
| IL Fin Auth–Univ Chicago | | 5.00% | | | 10/1/2030 | | Aa2 | | | 8,000,000 | | | | 8,209,358 | |
| IN Fin Auth–OVEC | | 4.25% | | | 11/1/2030 | | Baa3 | | | 16,300,000 | | | | 15,659,170 | |
| Lincoln Co–Augustana College | | 4.00% | | | 8/1/2041 | | BBB- | | | 500,000 | | | | 399,908 | |
| MA DFA–Emerson Clg | | 5.00% | | | 1/1/2026 | | BBB+ | | | 5,135,000 | | | | 5,215,319 | |
| MA DFA–Emerson Clg | | 5.00% | | | 1/1/2027 | | BBB+ | | | 2,700,000 | | | | 2,740,121 | |
| MA DFA–Emerson Clg | | 5.00% | | | 1/1/2028 | | BBB+ | | | 1,810,000 | | | | 1,833,306 | |
| MA DFA–Emmanuel College | | 5.00% | | | 10/1/2032 | | Baa2 | | | 5,000,000 | | | | 5,056,772 | |
| | See Notes to Financial Statements. | 49 |
Schedule of Investments (continued)
INTERMEDIATE TAX FREE FUND September 30, 2022
| Investments | | Interest
Rate | | | Maturity
Date | | Credit
Rating:
S&P or
Moody’s(a) | | Principal
Amount | | | Fair
Value | |
| Education (continued) | | | | | | | | | | | | | | | |
| MA DFA–Northeastern Univ | | 5.00% | | | 10/1/2035 | | A1 | | $ | 2,000,000 | | | $ | 2,154,128 | |
| MA DFA–Northeastern Univ | | 5.00% | | | 10/1/2036 | | A1 | | | 1,500,000 | | | | 1,612,630 | |
| MA DFA–Northeastern Univ | | 5.00% | | | 10/1/2037 | | A1 | | | 1,340,000 | | | | 1,425,578 | |
| MA DFA–Northeastern Univ | | 5.00% | | | 10/1/2038 | | A1 | | | 2,250,000 | | | | 2,373,723 | |
| Marietta Dev Auth–Life Univ† | | 5.00% | | | 11/1/2027 | | Ba3 | | | 2,000,000 | | | | 2,021,525 | |
| Marietta Dev Auth–Life Univ† | | 5.00% | | | 11/1/2037 | | Ba3 | | | 1,500,000 | | | | 1,438,588 | |
| Miami-Dade Co Edl Facs Auth–University of Miami (AMBAC) | | 5.25% | | | 4/1/2028 | | A2 | | | 5,000,000 | | | | 5,320,599 | |
| Nova Southeastern Univ | | 5.00% | | | 4/1/2037 | | A- | | | 5,000,000 | | | | 5,108,153 | |
| Nova Southeastern Univ | | 5.00% | | | 4/1/2038 | | A- | | | 2,500,000 | | | | 2,543,593 | |
| NV Dept of Bus & Ind–Somerset Academy† | | 4.50% | | | 12/15/2029 | | BB | | | 585,000 | | | | 568,495 | |
| NV Dept of Bus & Ind–Somerset Academy† | | 5.00% | | | 12/15/2038 | | BB | | | 1,000,000 | | | | 955,214 | |
| NY Dorm–Montefiore | | 4.00% | | | 9/1/2039 | | BBB- | | | 2,300,000 | | | | 1,865,099 | |
| NY Dorm–Mt Sinai Sch Med | | 5.00% | | | 7/1/2026 | | A- | | | 5,000,000 | | | | 5,162,874 | |
| NY Dorm–Mt Sinai Sch Med | | 5.00% | | | 7/1/2027 | | A- | | | 10,000,000 | | | | 10,321,876 | |
| NY Dorm–Pace Univ | | 5.00% | | | 5/1/2023 | | BBB- | | | 980,000 | | | | 984,354 | |
| NY Dorm–Pace Univ | | 5.00% | | | 5/1/2026 | | BBB- | | | 980,000 | | | | 982,972 | |
| NY Dorm–Yeshiva | | 5.00% | | | 7/15/2031 | | BBB- | | | 2,705,000 | | | | 2,758,008 | |
| NY Dorm–Yeshiva | | 5.00% | | | 7/15/2037 | | BBB- | | | 11,000,000 | | | | 10,863,090 | |
| OH Air Dev Auth–Duke Energy | | 4.00% | #(b) | | 9/1/2030 | | BBB | | | 4,100,000 | | | | 4,024,602 | |
| OH Air Dev Auth–Duke Energy AMT | | 4.25% | #(b) | | 11/1/2039 | | BBB | | | 10,500,000 | | | | 10,329,560 | |
| Orange & Ulster Co BOCES | | 3.75% | | | 7/21/2023 | | NR | | | 13,455,000 | | | | 13,437,023 | |
| Penn State Univ | | 5.00% | | | 9/1/2037 | | Aa1 | | | 2,545,000 | | | | 2,688,256 | |
| Private Clgs & Univs Auth–SCAD | | 5.00% | | | 4/1/2029 | | A2 | | | 1,500,000 | | | | 1,540,571 | |
| Private Clgs & Univs Auth–SCAD | | 5.00% | | | 4/1/2031 | | A2 | | | 1,360,000 | | | | 1,396,785 | |
| Troy Cap Res Corp–RPI | | 5.00% | | | 8/1/2024 | | A3 | | | 1,000,000 | | | | 1,021,789 | |
| Troy Cap Res Corp–RPI | | 5.00% | | | 8/1/2025 | | A3 | | | 2,630,000 | | | | 2,705,785 | |
| Troy Cap Res Corp–RPI | | 5.00% | | | 8/1/2026 | | A3 | | | 1,000,000 | | | | 1,038,742 | |
| Troy Cap Res Corp–RPI | | 5.00% | | | 8/1/2027 | | A3 | | | 1,600,000 | | | | 1,659,231 | |
| Univ of Connecticut | | 5.00% | | | 11/1/2032 | | Aa3 | | | 3,740,000 | | | | 4,008,537 | |
| Univ of CT | | 5.00% | | | 4/15/2031 | | Aa3 | | | 8,605,000 | | | | 9,210,350 | |
| Univ of CT | | 5.00% | | | 4/15/2035 | | Aa3 | | | 5,350,000 | | | | 5,642,525 | |
| Univ of Houston | | 5.00% | | | 2/15/2029 | | AA | | | 10,280,000 | | | | 10,774,848 | |
| Univ of Illinois (AGM) | | 4.00% | | | 4/1/2033 | | AA | | | 4,905,000 | | | | 4,860,241 | |
| Univ of Illinois (AGM) | | 4.00% | | | 4/1/2034 | | AA | | | 5,100,000 | | | | 4,952,901 | |
| Univ of North Carolina–Wilmington | | 5.00% | | | 6/1/2023 | | A1 | | | 2,435,000 | | | | 2,464,606 | |
| Univ of North Carolina–Wilmington | | 5.00% | | | 6/1/2024 | | A1 | | | 2,560,000 | | | | 2,627,676 | |
| 50 | See Notes to Financial Statements. |
Schedule of Investments (continued)
INTERMEDIATE TAX FREE FUND September 30, 2022
| Investments | | Interest
Rate | | | Maturity
Date | | Credit
Rating:
S&P or
Moody’s(a) | | Principal
Amount | | | Fair
Value | |
| Education (continued) | | | | | | | | | | | | | | | |
| University of CA | | 4.00% | | | 5/15/2038 | | AA- | | $ | 7,500,000 | | | $ | 7,086,623 | |
| University of CA | | 4.00% | | | 5/15/2040 | | AA | | | 10,000,000 | | | | 9,314,050 | |
| Wayne State Univ | | 4.00% | | | 11/15/2034 | | Aa3 | | | 3,900,000 | | | | 3,822,614 | |
| WV EDA–Wheeling Pwr AMT | | 3.00% | #(b) | | 6/1/2037 | | A- | | | 4,200,000 | | | | 3,851,300 | |
| Total | | | | | | | | | | | | | | 293,670,286 | |
| | | | | | | | | | | | | | | | |
| Financial Services 0.17% | | | | | | | | | | | | | | | |
| Berks Co IDA–Tower Hlth | | 4.00% | | | 11/1/2031 | | BB- | | | 2,280,000 | | | | 1,706,788 | |
| Berks Co IDA–Tower Hlth | | 5.00% | | | 11/1/2030 | | BB- | | | 1,315,000 | | | | 1,097,338 | |
| MA Ed Fin Auth AMT | | 3.625% | | | 7/1/2034 | | AA | | | 1,340,000 | | | | 1,278,187 | |
| NJ Higher Ed Assistance Auth AMT | | 3.75% | | | 12/1/2030 | | Aaa | | | 1,485,000 | | | | 1,448,374 | |
| NJ Higher Ed Assistance Auth AMT | | 4.00% | | | 12/1/2032 | | Aaa | | | 1,695,000 | | | | 1,680,207 | |
| NJ Higher Ed Assistance Auth AMT | | 4.00% | | | 12/1/2034 | | Aaa | | | 1,520,000 | | | | 1,506,734 | |
| Total | | | | | | | | | | | | | | 8,717,628 | |
| | | | | | | | | | | | | | | | |
| General Obligation 16.38% | | | | | | | | | | | | | | | |
| Barrington SD | | 4.00% | | | 12/1/2036 | | AAA | | | 2,650,000 | | | | 2,579,123 | |
| Barrington SD | | 4.00% | | | 12/1/2038 | | AAA | | | 6,415,000 | | | | 6,086,972 | |
| Barrington SD | | 4.00% | | | 12/1/2039 | | AAA | | | 2,000,000 | | | | 1,881,094 | |
| CA State GO | | 3.00% | | | 10/1/2033 | | Aa2 | | | 14,150,000 | | | | 12,804,737 | |
| CA State GO | | 5.00% | | | 10/1/2027 | | Aa2 | | | 10,000,000 | | | | 10,090,592 | |
| CA State GO | | 5.00% | | | 9/1/2030 | | Aa2 | | | 10,000,000 | | | | 10,497,703 | |
| California St GO | | 5.00% | | | 9/1/2035 | | Aa2 | | | 14,000,000 | | | | 15,325,145 | |
| Chabot/Las Positas CCD | | 5.00% | | | 8/1/2023 | | AA | | | 3,000,000 | | | | 3,048,271 | |
| Chabot-Las Positas CCD | | 3.00% | | | 8/1/2038 | | AA | | | 2,500,000 | | | | 1,951,284 | |
| Chicago Brd Ed | | 4.00% | | | 12/1/2037 | | BB | | | 14,000,000 | | | | 12,123,609 | |
| Chicago Brd Ed | | 4.00% | | | 12/1/2038 | | BB | | | 9,225,000 | | | | 7,906,954 | |
| Chicago Brd Ed | | 5.00% | | | 12/1/2029 | | BB | | | 8,000,000 | | | | 8,117,477 | |
| Chicago Brd Ed | | 5.00% | | | 12/1/2029 | | BB | | | 3,000,000 | | | | 3,050,664 | |
| Chicago Brd Ed | | 5.00% | | | 12/1/2030 | | BB | | | 5,100,000 | | | | 5,168,825 | |
| Chicago Brd Ed | | 5.00% | | | 12/1/2031 | | BB | | | 1,500,000 | | | | 1,514,216 | |
| Chicago Brd Ed | | 5.00% | | | 12/1/2032 | | BB | | | 4,845,000 | | | | 4,875,285 | |
| Chicago Brd Ed | | 5.00% | | | 12/1/2033 | | BB | | | 900,000 | | | | 903,891 | |
| Chicago Brd Ed | | 5.00% | | | 12/1/2033 | | BB | | | 3,275,000 | | | | 3,258,180 | |
| Chicago Brd Ed | | 5.00% | | | 12/1/2034 | | BB | | | 475,000 | | | | 475,715 | |
| Chicago Brd Ed | | 5.00% | | | 12/1/2034 | | BB | | | 3,750,000 | | | | 3,716,075 | |
| Chicago Brd Ed | | 5.00% | | | 12/1/2035 | | BB | | | 450,000 | | | | 449,974 | |
| Chicago Brd Ed | | 5.00% | | | 12/1/2036 | | BB | | | 1,000,000 | | | | 986,059 | |
| | See Notes to Financial Statements. | 51 |
Schedule of Investments (continued)
INTERMEDIATE TAX FREE FUND September 30, 2022
| Investments | | Interest
Rate | | | Maturity
Date | | Credit
Rating:
S&P or
Moody’s(a) | | Principal
Amount | | | Fair
Value | |
| General Obligation (continued) | | | | | | | | | | | | | | | |
| Chicago Brd Ed | | 5.00% | | | 12/1/2039 | | BB | | $ | 2,340,000 | | | $ | 2,285,572 | |
| Chicago Brd Ed | | 5.00% | | | 12/1/2046 | | BB | | | 7,500,000 | | | | 7,264,405 | |
| Chicago Brd Ed† | | 6.75% | | | 12/1/2030 | | BB | | | 5,000,000 | | | | 5,558,520 | |
| Chicago Brd Ed (AGM) | | 5.00% | | | 12/1/2027 | | AA | | | 2,860,000 | | | | 2,964,089 | |
| Chicago Brd Ed (AGM) | | 5.00% | | | 12/1/2029 | | AA | | | 4,220,000 | | | | 4,358,578 | |
| Chicago Brd Ed (AGM) | | 5.00% | | | 12/1/2030 | | AA | | | 2,500,000 | | | | 2,561,099 | |
| Chicago Brd Ed (AGM) | | 5.00% | | | 12/1/2032 | | AA | | | 1,250,000 | | | | 1,272,076 | |
| Chicago Brd Ed (AGM) | | 5.00% | | | 12/1/2035 | | AA | | | 3,000,000 | | | | 3,030,179 | |
| Chicago GO | | 4.00% | | | 1/1/2035 | | BBB+ | | | 7,925,000 | | | | 7,031,397 | |
| Chicago GO | | 4.00% | | | 1/1/2036 | | BBB+ | | | 8,195,000 | | | | 7,202,451 | |
| Chicago GO | | 5.00% | | | 1/1/2024 | | BBB+ | | | 15,000,000 | | | | 15,162,816 | |
| Chicago GO | | 5.00% | | | 1/1/2025 | | BBB+ | | | 7,000,000 | | | | 7,125,761 | |
| Chicago GO | | 5.00% | | | 1/1/2028 | | BBB+ | | | 9,000,000 | | | | 9,173,083 | |
| Chicago GO | | 5.00% | | | 1/1/2029 | | BBB+ | | | 7,750,000 | | | | 7,865,577 | |
| Chicago GO | | 5.00% | | | 1/1/2030 | | BBB+ | | | 2,000,000 | | | | 2,013,131 | |
| Chicago GO | | 5.00% | | | 1/1/2031 | | BBB+ | | | 2,210,000 | | | | 2,181,054 | |
| Chicago GO | | 5.00% | | | 1/1/2032 | | BBB+ | | | 3,000,000 | | | | 2,996,894 | |
| Chicago GO | | 5.125% | | | 1/1/2027 | | BBB+ | | | 3,100,000 | | | | 3,127,762 | |
| Chicago GO | | 5.25% | | | 1/1/2028 | | BBB+ | | | 3,845,000 | | | | 3,872,246 | |
| Chicago GO | | 5.25% | | | 1/1/2029 | | BBB+ | | | 2,025,000 | | | | 2,032,511 | |
| Chicago GO | | 5.50% | | | 1/1/2037 | | BBB+ | | | 1,250,000 | | | | 1,253,799 | |
| Chicago GO | | 5.50% | | | 1/1/2049 | | BBB+ | | | 3,750,000 | | | | 3,775,225 | |
| Chicago GO | | 5.625% | | | 1/1/2030 | | BBB+ | | | 1,835,000 | | | | 1,871,882 | |
| Chicago GO | | 5.75% | | | 1/1/2033 | | BBB+ | | | 7,000,000 | | | | 7,117,610 | |
| Chicago GO | | 6.00% | | | 1/1/2038 | | BBB+ | | | 15,890,000 | | | | 16,439,835 | |
| Chicago Met Water Reclmtn Dist | | 5.00% | | | 12/1/2027 | | AA+ | | | 4,600,000 | | | | 4,906,254 | |
| Chicago Met Water Reclmtn Dist | | 5.00% | | | 12/1/2028 | | AA+ | | | 6,715,000 | | | | 7,124,489 | |
| City of Schaumburg | | 3.00% | | | 12/1/2031 | | AAA | | | 1,300,000 | | | | 1,197,847 | |
| City of Skokie | | 3.00% | | | 12/1/2029 | | Aa2 | | | 1,080,000 | | | | 1,026,737 | |
| Clackamas Co Sch Dist–North Clackamas | | 5.00% | | | 6/15/2025 | | AA+ | | | 1,450,000 | | | | 1,494,289 | |
| Clark Co SD (AGM) | | 4.00% | | | 6/15/2036 | | AA | | | 1,250,000 | | | | 1,240,288 | |
| Clark Co SD (AGM) | | 5.00% | | | 6/15/2033 | | AA | | | 1,380,000 | | | | 1,489,453 | |
| Cook Co GO | | 5.00% | | | 11/15/2025 | | A+ | | | 6,000,000 | | | | 6,012,903 | |
| CT State GO | | 4.00% | | | 1/15/2034 | | Aa3 | | | 7,230,000 | | | | 7,121,499 | |
| CT State GO | | 4.00% | | | 1/15/2035 | | Aa3 | | | 5,900,000 | | | | 5,663,382 | |
| CT State GO | | 4.00% | | | 1/15/2036 | | Aa3 | | | 20,000,000 | | | | 18,795,628 | |
| CT State GO | | 4.00% | | | 4/15/2037 | | Aa3 | | | 1,825,000 | | | | 1,706,039 | |
| 52 | See Notes to Financial Statements. |
Schedule of Investments (continued)
INTERMEDIATE TAX FREE FUND September 30, 2022
| Investments | | Interest
Rate | | | Maturity
Date | | Credit
Rating:
S&P or
Moody’s(a) | | Principal
Amount | | | Fair
Value | |
| General Obligation (continued) | | | | | | | | | | | | | | | |
| CT State GO | | 4.00% | | | 6/15/2037 | | Aa3 | | $ | 775,000 | | | $ | 724,467 | |
| CT State GO | | 5.00% | | | 6/15/2032 | | Aa3 | | | 2,000,000 | | | | 2,144,209 | |
| CT State GO | | 5.00% | | | 6/15/2034 | | Aa3 | | | 1,100,000 | | | | 1,166,425 | |
| CT State GO | | 5.00% | | | 6/15/2035 | | Aa3 | | | 1,125,000 | | | | 1,187,845 | |
| CT State GO | | 5.00% | | | 4/15/2036 | | Aa3 | | | 1,150,000 | | | | 1,221,152 | |
| Fresno USD (NPFGC)(FGIC) | | 5.25% | | | 2/1/2024 | | A+ | | | 3,285,000 | | | | 3,365,748 | |
| Geneva USD | | 5.00% | | | 1/1/2028 | | AA+ | | | 1,125,000 | | | | 1,191,496 | |
| Geneva USD | | 5.00% | | | 1/1/2029 | | AA+ | | | 2,200,000 | | | | 2,327,320 | |
| Geneva USD | | 5.00% | | | 1/1/2030 | | AA+ | | | 1,400,000 | | | | 1,479,834 | |
| HI Harbor System AMT | | 4.00% | | | 7/1/2035 | | Aa3 | | | 1,325,000 | | | | 1,245,635 | |
| Houston GO | | 5.00% | | | 3/1/2024 | | AA | | | 2,000,000 | | | | 2,048,103 | |
| Howard Co GO | | 3.00% | | | 8/15/2037 | | AAA | | | 2,255,000 | | | | 1,875,517 | |
| IL State GO | | 4.00% | | | 10/1/2033 | | BBB+ | | | 10,500,000 | | | | 9,595,451 | |
| IL State GO | | 4.00% | | | 10/1/2034 | | BBB+ | | | 5,000,000 | | | | 4,481,051 | |
| IL State GO | | 4.00% | | | 12/1/2034 | | BBB+ | | | 9,500,000 | | | | 8,483,950 | |
| IL State GO | | 4.00% | | | 10/1/2035 | | BBB+ | | | 5,000,000 | | | | 4,420,579 | |
| IL State GO | | 4.00% | | | 3/1/2038 | | BBB+ | | | 1,125,000 | | | | 969,051 | |
| IL State GO | | 4.00% | | | 3/1/2039 | | BBB+ | | | 2,100,000 | | | | 1,786,679 | |
| IL State GO | | 5.00% | | | 8/1/2023 | | BBB+ | | | 5,350,000 | | | | 5,403,831 | |
| IL State GO | | 5.00% | | | 11/1/2027 | | BBB+ | | | 5,000,000 | | | | 5,092,755 | |
| IL State GO | | 5.00% | | | 2/1/2028 | | BBB+ | | | 13,620,000 | | | | 13,884,944 | |
| IL State GO | | 5.00% | | | 3/1/2028 | | BBB+ | | | 6,500,000 | | | | 6,654,217 | |
| IL State GO(f) | | 5.00% | | | 10/1/2029 | | BBB+ | | | 10,000,000 | | | | 10,247,508 | |
| IL State GO | | 5.00% | | | 11/1/2029 | | BBB+ | | | 2,800,000 | | | | 2,842,644 | |
| IL State GO | | 5.00% | | | 3/1/2032 | | BBB+ | | | 3,450,000 | | | | 3,510,617 | |
| IL State GO | | 5.00% | | | 10/1/2032 | | BBB+ | | | 6,300,000 | | | | 6,372,715 | |
| IL State GO | | 5.00% | | | 11/1/2032 | | BBB+ | | | 9,200,000 | | | | 9,273,796 | |
| IL State GO | | 5.00% | | | 3/1/2033 | | BBB+ | | | 5,000,000 | | | | 5,047,623 | |
| IL State GO | | 5.00% | | | 10/1/2033 | | BBB+ | | | 5,000,000 | | | | 5,010,233 | |
| IL State GO | | 5.00% | | | 12/1/2033 | | BBB+ | | | 4,500,000 | | | | 4,506,255 | |
| IL State GO | | 5.00% | | | 3/1/2034 | | BBB+ | | | 4,000,000 | | | | 3,999,816 | |
| IL State GO | | 5.00% | | | 5/1/2036 | | BBB+ | | | 7,480,000 | | | | 7,397,565 | |
| IL State GO | | 5.25% | | | 5/1/2023 | | BBB+ | | | 5,000,000 | | | | 5,045,460 | |
| IL State GO | | 5.25% | | | 7/1/2030 | | BBB+ | | | 5,430,000 | | | | 5,459,828 | |
| IL State GO | | 5.25% | | | 2/1/2034 | | BBB+ | | | 3,295,000 | | | | 3,305,402 | |
| IL State GO(f) | | 5.25% | | | 10/1/2036 | | BBB+ | | | 12,500,000 | | | | 12,627,311 | |
| IL State GO | | 5.50% | | | 5/1/2030 | | BBB+ | | | 6,395,000 | | | | 6,754,827 | |
| | See Notes to Financial Statements. | 53 |
Schedule of Investments (continued)
INTERMEDIATE TAX FREE FUND September 30, 2022
| Investments | | Interest
Rate | | | Maturity
Date | | Credit
Rating:
S&P or
Moody’s(a) | | Principal
Amount | | | Fair
Value | |
| General Obligation (continued) | | | | | | | | | | | | | | | |
| IL State GO | | 5.50% | | | 7/1/2038 | | BBB+ | | $ | 5,000,000 | | | $ | 5,011,849 | |
| IL State GO | | 5.50% | | | 5/1/2039 | | BBB+ | | | 11,000,000 | | | | 11,203,961 | |
| LA State GO | | 5.00% | | | 5/1/2028 | | Aa2 | | | 11,180,000 | | | | 11,612,641 | |
| Lake Co GO | | 3.50% | | | 11/30/2031 | | AAA | | | 1,825,000 | | | | 1,809,696 | |
| Lubbock GO | | 5.00% | | | 2/15/2026 | | AA+ | | | 11,810,000 | | | | 12,289,115 | |
| Luzerne Co GO (AGM) | | 5.00% | | | 11/15/2022 | | AA | | | 2,250,000 | | | | 2,254,644 | |
| Luzerne Co GO (AGM) | | 5.00% | | | 11/15/2023 | | AA | | | 2,500,000 | | | | 2,545,261 | |
| Luzerne Co GO (AGM) | | 5.00% | | | 11/15/2024 | | AA | | | 4,000,000 | | | | 4,124,533 | |
| MI Strategic Fund–I-75 AMT (AGM) | | 4.25% | | | 12/31/2038 | | AA | | | 2,500,000 | | | | 2,214,672 | |
| Miami-Dade Co GO | | 5.00% | | | 7/1/2038 | | AA | | | 4,830,000 | | | | 5,113,653 | |
| Nassau Co GO (AGM) | | 4.00% | | | 4/1/2034 | | AA | | | 3,130,000 | | | | 3,032,677 | |
| Nassau Co GO (AGM) | | 4.00% | | | 4/1/2035 | | AA | | | 2,415,000 | | | | 2,310,827 | |
| Nassau Co GO (AGM) | | 4.00% | | | 4/1/2036 | | AA | | | 4,030,000 | | | | 3,826,207 | |
| Nassau Co GO (AGM) | | 4.00% | | | 4/1/2037 | | AA | | | 4,680,000 | | | | 4,406,835 | |
| Nassau Co GO CR (AGM) | | 5.00% | | | 1/1/2026 | | AA | | | 10,000,000 | | | | 10,521,884 | |
| New Orleans GO | | 4.00% | | | 10/1/2032 | | A+ | | | 2,580,000 | | | | 2,533,371 | |
| New Orleans GO | | 4.00% | | | 10/1/2033 | | A+ | | | 2,680,000 | | | | 2,577,863 | |
| New York State Dormitory Authority (BAM) | | 5.00% | | | 10/1/2032 | | AA | | | 3,500,000 | | | | 3,796,000 | |
| New York State Dormitory Authority (BAM) | | 5.00% | | | 10/1/2035 | | AA | | | 5,000,000 | | | | 5,327,065 | |
| Newark BANS | | 3.75% | | | 2/17/2023 | | NR | | | 10,223,000 | | | | 10,222,495 | |
| NJ EDA–Sch Facs | | 5.00% | | | 3/1/2027 | | NR | | | 6,545,000 | | | | 6,594,530 | |
| NJ State GO | | 2.00% | | | 6/1/2027 | | A2 | | | 12,635,000 | | | | 11,377,768 | |
| NJ State GO | | 5.00% | | | 6/1/2029 | | A2 | | | 5,000,000 | | | | 5,301,389 | |
| NY Dorm–Sch Dist (AGM) | | 5.00% | | | 10/1/2023 | | AA | | | 2,500,000 | | | | 2,544,471 | |
| NY Dorm–Sch Dist (AGM) | | 5.00% | | | 10/1/2031 | | AA | | | 5,370,000 | | | | 5,820,516 | |
| NYC GO | | 5.00% | | | 8/1/2025 | | AA | | | 12,000,000 | | | | 12,178,322 | |
| NYC GO | | 5.00% | | | 8/1/2032 | | AA | | | 1,750,000 | | | | 1,872,548 | |
| NYC GO | | 5.00% | | | 10/1/2032 | | AA | | | 3,500,000 | | | | 3,765,834 | |
| NYC GO | | 5.00% | | | 8/1/2033 | | AA | | | 7,030,000 | | | | 7,446,312 | |
| NYC GO | | 5.00% | | | 10/1/2033 | | AA | | | 4,500,000 | | | | 4,808,877 | |
| NYC GO | | 5.00% | | | 9/1/2035 | | AA | | | 10,000,000 | | | | 10,767,051 | |
| NYC GO | | 5.00% | | | 4/1/2037 | | AA | | | 10,000,000 | | | | 10,363,717 | |
| NYC GO | | 5.00% | | | 12/1/2037 | | AA | | | 7,500,000 | | | | 7,710,961 | |
| Oyster Bay GO (AGM) | | 2.00% | | | 3/1/2030 | | AA | | | 2,125,000 | | | | 1,792,272 | |
| Oyster Bay GO (AGM) | | 2.00% | | | 3/1/2031 | | AA | | | 2,040,000 | | | | 1,669,924 | |
| Oyster Bay GO (AGM) | | 2.00% | | | 3/1/2033 | | AA | | | 1,415,000 | | | | 1,098,520 | |
| PA State GO | | 4.00% | | | 3/1/2035 | | Aa3 | | | 12,500,000 | | | | 12,395,589 | |
| 54 | See Notes to Financial Statements. |
Schedule of Investments (continued)
INTERMEDIATE TAX FREE FUND September 30, 2022
| Investments | | Interest
Rate | | | Maturity
Date | | Credit
Rating:
S&P or
Moody’s(a) | | Principal
Amount | | | Fair
Value | |
| General Obligation (continued) | | | | | | | | | | | | | | | |
| PA State GO | | 4.00% | | | 3/1/2038 | | Aa3 | | $ | 8,020,000 | | | $ | 7,686,963 | |
| PA State GO | | 5.00% | | | 1/15/2028 | | Aa3 | | | 10,000,000 | | | | 10,587,783 | |
| Perris UHSD (AGM) | | 4.00% | | | 9/1/2037 | | AA | | | 2,000,000 | | | | 1,936,573 | |
| Perris UHSD (AGM) | | 4.00% | | | 9/1/2039 | | AA | | | 5,050,000 | | | | 4,709,790 | |
| Philadelphia GO | | 5.00% | | | 2/1/2030 | | A | | | 2,750,000 | | | | 2,956,321 | |
| Philadelphia GO | | 5.00% | | | 2/1/2031 | | A | | | 2,500,000 | | | | 2,675,427 | |
| Philadelphia GO | | 5.00% | | | 2/1/2032 | | A | | | 1,750,000 | | | | 1,861,341 | |
| Philadelphia GO | | 5.00% | | | 2/1/2033 | | A | | | 2,500,000 | | | | 2,642,315 | |
| Philadelphia Sch Dist | | 5.00% | | | 9/1/2026 | | A1 | | | 500,000 | | | | 521,777 | |
| Philadelphia Sch Dist | | 5.00% | | | 9/1/2027 | | A1 | | | 600,000 | | | | 627,740 | |
| Philadelphia Sch Dist | | 5.00% | | | 9/1/2028 | | A1 | | | 500,000 | | | | 525,674 | |
| Philadelphia Sch Dist (AGM) | | 5.00% | | | 6/1/2030 | | AA | | | 5,000,000 | | | | 5,175,327 | |
| Philadelphia Sch Dist (AGM) | | 5.00% | | | 6/1/2031 | | AA | | | 5,000,000 | | | | 5,163,734 | |
| PR Comwlth GO | | Zero Coupon | | | 7/1/2024 | | NR | | | 1,098,853 | | | | 1,010,502 | |
| PR Comwlth GO | | Zero Coupon | | | 7/1/2033 | | NR | | | 1,727,569 | | | | 955,215 | |
| PR Comwlth GO | | Zero Coupon | | | 11/1/2043 | | NR | | | 6,702,858 | | | | 3,359,808 | |
| PR Comwlth GO | | 4.00% | | | 7/1/2033 | | NR | | | 6,342,423 | | | | 5,591,698 | |
| PR Comwlth GO | | 4.00% | | | 7/1/2035 | | NR | | | 11,206,659 | | | | 9,607,404 | |
| PR Comwlth GO | | 4.00% | | | 7/1/2037 | | NR | | | 3,035,632 | | | | 2,498,875 | |
| PR Comwlth GO | | 4.00% | | | 7/1/2041 | | NR | | | 5,000,000 | | | | 3,916,597 | |
| PR Comwlth GO | | 4.00% | | | 7/1/2046 | | NR | | | 1,917,657 | | | | 1,441,293 | |
| PR Comwlth GO | | 5.25% | | | 7/1/2023 | | NR | | | 749,622 | | | | 753,141 | |
| PR Comwlth GO | | 5.375% | | | 7/1/2025 | | NR | | | 6,625,085 | | | | 6,694,216 | |
| PR Comwlth GO | | 5.625% | | | 7/1/2027 | | NR | | | 6,481,543 | | | | 6,624,343 | |
| PR Comwlth GO | | 5.625% | | | 7/1/2029 | | NR | | | 5,309,508 | | | | 5,439,619 | |
| PR Comwlth GO | | 5.75% | | | 7/1/2031 | | NR | | | 1,415,665 | | | | 1,446,234 | |
| Reedy Creek Impt Dist GO | | 4.00% | | | 6/1/2031 | | AA- | | | 2,240,000 | | | | 2,291,716 | |
| RI State GO | | 5.00% | | | 8/1/2029 | | AA | | | 7,500,000 | | | | 8,125,284 | |
| Romeoville GO | | 4.00% | | | 12/30/2036 | | Aa2 | | | 4,725,000 | | | | 4,489,577 | |
| Romeoville GO | | 4.00% | | | 12/30/2037 | | Aa2 | | | 3,800,000 | | | | 3,599,152 | |
| Schaumburg GO | | 3.00% | | | 12/1/2027 | | NR | | | 7,060,000 | | | | 6,736,144 | |
| Suffolk Co GO (BAM) | | 2.00% | | | 6/15/2033 | | AA | | | 7,555,000 | | | | 5,668,639 | |
| VT EDA–Casella Waste AMT† | | 4.625% | #(b) | | 4/1/2036 | | B | | | 750,000 | | | | 714,443 | |
| Wake Co Ltd Ob | | 4.00% | | | 12/1/2031 | | AA+ | | | 5,000,000 | | | | 5,084,548 | |
| WI PFA–American Dream† | | 7.00% | | | 12/1/2050 | | NR | | | 4,000,000 | | | | 3,368,598 | |
| Total | | | | | | | | | | | | | | 827,011,725 | |
| | See Notes to Financial Statements. | 55 |
Schedule of Investments (continued)
INTERMEDIATE TAX FREE FUND September 30, 2022
| Investments | | Interest
Rate | | | Maturity
Date | | Credit
Rating:
S&P or
Moody’s(a) | | Principal
Amount | | | Fair
Value | |
| Health Care 11.73% | | | | | | | | | | | | | | | |
| Allegheny Co Hosp Auth–UPMC | | 4.00% | | | 7/15/2038 | | A | | $ | 4,950,000 | | | $ | 4,516,738 | |
| Allegheny County Health Network | | 5.00% | | | 4/1/2031 | | A | | | 16,000,000 | | | | 16,532,224 | |
| Antelope Valley Hlth | | 5.00% | | | 3/1/2031 | | BBB | | | 7,000,000 | | | | 7,046,019 | |
| Atlantic Beach Hlth Facs–Fleet Landing | | 5.00% | | | 11/15/2028 | | BBB | (c) | | 2,020,000 | | | | 2,032,720 | |
| Berks Co IDA–Tower Hlth | | 5.00% | | | 11/1/2036 | | BB- | | | 1,835,000 | | | | 1,376,046 | |
| Berks Co IDA–Tower Hlth | | 5.00% | | | 11/1/2037 | | BB- | | | 5,075,000 | | | | 3,761,885 | |
| Berks Co IDA–Tower Hlth | | 5.00% | #(b) | | 2/1/2040 | | BB- | | | 6,000,000 | | | | 5,390,468 | |
| Blaine Sr Hsg & Hlthcare–Crest View | | 5.125% | | | 7/1/2025 | | NR | | | 770,000 | | | | 645,013 | (e) |
| Bucks Co IDA–Grand View Hosp | | 5.00% | | | 7/1/2030 | | BB | | | 2,075,000 | | | | 2,086,123 | |
| Bucks Co IDA–Grand View Hosp | | 5.00% | | | 7/1/2031 | | BB | | | 1,150,000 | | | | 1,151,454 | |
| Bucks Co IDA–Grand View Hosp | | 5.00% | | | 7/1/2032 | | BB | | | 1,000,000 | | | | 985,487 | |
| CA Hlth–Childrens Hsp Los Angeles | | 5.00% | | | 11/15/2022 | | BBB+ | | | 1,540,000 | | | | 1,543,294 | |
| CA Hlth–Childrens Hsp Los Angeles | | 5.00% | | | 11/15/2023 | | BBB+ | | | 1,000,000 | | | | 1,002,139 | |
| CA Hlth–Childrens Hsp Los Angeles | | 5.00% | | | 11/15/2024 | | BBB+ | | | 2,000,000 | | | | 2,004,278 | |
| CA Hlth–Childrens Hsp Los Angeles | | 5.00% | | | 11/15/2025 | | BBB+ | | | 4,880,000 | | | | 4,890,438 | |
| CA Hlth–Childrens Hsp Los Angeles | | 5.00% | | | 11/15/2026 | | BBB+ | | | 3,705,000 | | | | 3,712,925 | |
| CA Hlth–Childrens Hsp Los Angeles | | 5.00% | | | 11/15/2029 | | BBB+ | | | 1,300,000 | | | | 1,302,781 | |
| CA Hlth–CommonSpirit | | 4.00% | | | 4/1/2035 | | A- | | | 3,065,000 | | | | 2,852,969 | |
| CA Hlth–CommonSpirit | | 4.00% | | | 4/1/2036 | | A- | | | 5,000,000 | | | | 4,622,104 | |
| CA Hlth–Lucile Packard Childrens Hsp | | 5.00% | | | 8/15/2032 | | A+ | | | 1,250,000 | | | | 1,289,872 | |
| CA Hlth–Sutter Hlth | | 5.00% | | | 11/15/2032 | | A1 | | | 2,000,000 | | | | 2,080,993 | |
| CA Hlth–Sutter Hlth | | 5.00% | | | 11/15/2033 | | A1 | | | 2,450,000 | | | | 2,530,479 | |
| CA Hlth–Sutter Hlth | | 5.00% | | | 11/15/2034 | | A1 | | | 3,350,000 | | | | 3,444,150 | |
| CA Hlth Facs–Cedars-Sinai Med Ctr | | 5.00% | | | 11/15/2026 | | Aa3 | | | 5,000,000 | | | | 5,259,587 | |
| CA Muni Fin–Cmnty Med Ctrs | | 5.00% | | | 2/1/2030 | | A- | | | 3,305,000 | | | | 3,436,991 | |
| CA Stwde–Loma Linda Univ Med Ctr† | | 5.00% | | | 12/1/2033 | | BB- | | | 1,000,000 | | | | 975,776 | |
| CA Stwde–Loma Linda Univ Med Ctr† | | 5.00% | | | 12/1/2041 | | BB- | | | 1,000,000 | | | | 929,728 | |
| CA Stwde–Loma Linda Univ Med Ctr† | | 5.25% | | | 12/1/2038 | | BB- | | | 1,500,000 | | | | 1,474,788 | |
| Camden Co Impt Auth–Cooper Hlth | | 5.00% | | | 2/15/2023 | | BBB+ | | | 3,000,000 | | | | 3,014,180 | |
| Camden Co Impt Auth–Cooper Hlth | | 5.00% | | | 2/15/2024 | | BBB+ | | | 3,730,000 | | | | 3,789,486 | |
| Camden Co Impt Auth–Cooper Hlth | | 5.00% | | | 2/15/2025 | | BBB+ | | | 1,250,000 | | | | 1,259,879 | |
| Camden Co Impt Auth–Cooper Hlth | | 5.00% | | | 2/15/2027 | | BBB+ | | | 1,000,000 | | | | 1,002,601 | |
| City of Oroville- Oroville Hsp | | 5.25% | | | 4/1/2034 | | B+ | | | 2,300,000 | | | | 2,276,923 | |
| Clarke Co Hsp–Piedmont Hlth | | 5.00% | | | 7/1/2029 | | AA- | | | 7,090,000 | | | | 7,415,654 | |
| Clarke Co Hsp–Piedmont Hlth | | 5.00% | | | 7/1/2030 | | AA- | | | 4,500,000 | | | | 4,692,063 | |
| CO Hlth Fac Auth–CommonSpirit | | 4.00% | | | 8/1/2039 | | A- | | | 2,500,000 | | | | 2,198,188 | |
| CO Hlth Facs–IHC Hlth | | 5.00% | #(b) | | 5/15/2062 | | AA+ | | | 10,255,000 | | | | 10,927,063 | |
| 56 | See Notes to Financial Statements. |
Schedule of Investments (continued)
INTERMEDIATE TAX FREE FUND September 30, 2022
| Investments | | Interest
Rate | | | Maturity
Date | | Credit
Rating:
S&P or
Moody’s(a) | | Principal
Amount | | | Fair
Value | |
| Health Care (continued) | | | | | | | | | | | | | | | |
| CO Hlth Facs–Valley View Hosp | | 2.80% | #(b) | | 5/15/2042 | | A | | $ | 2,245,000 | | | $ | 2,244,031 | |
| CO Hlth Facs Auth–Commonspirit | | 5.00% | | | 8/1/2031 | | A- | | | 3,000,000 | | | | 3,080,592 | |
| Cobb Co Kennestone–Wellstar Hlth Sys | | 4.00% | | | 4/1/2041 | | A+ | | | 1,375,000 | | | | 1,222,881 | |
| Cobb Co Kennestone–Wellstar Hlth Sys | | 5.00% | | | 4/1/2042 | | A+ | | | 2,400,000 | | | | 2,388,353 | |
| CT Hlth & Ed–Griffin Hosp† | | 5.00% | | | 7/1/2032 | | BB+ | | | 370,000 | | | | 366,860 | |
| CT Hlth & Ed–Griffin Hosp† | | 5.00% | | | 7/1/2034 | | BB+ | | | 225,000 | | | | 220,444 | |
| CT Hlth & Ed–Griffin Hosp† | | 5.00% | | | 7/1/2039 | | BB+ | | | 1,000,000 | | | | 953,168 | |
| CT Hlth & Ed Fac Auth–Nuvance Hlt | | 4.00% | | | 7/1/2034 | | BBB+ | | | 1,750,000 | | | | 1,538,797 | |
| CT Hlth & Ed Fac Auth–Nuvance Hlt | | 4.00% | | | 7/1/2035 | | BBB+ | | | 2,500,000 | | | | 2,156,876 | |
| CT Hlth & Ed Fac Auth–Nuvance Hlt | | 5.00% | | | 7/1/2028 | | BBB+ | | | 5,000,000 | | | | 5,177,962 | |
| CT Hlth & Ed Fac Auth–Nuvance Hlt | | 5.00% | | | 7/1/2029 | | BBB+ | | | 5,250,000 | | | | 5,461,738 | |
| Cuyahoga Co Hsp–Metrohealth | | 5.00% | | | 2/15/2037 | | BBB | | | 5,000,000 | | | | 5,007,396 | |
| DC Hsp–Childrens Ntl Hsp | | 5.00% | | | 7/15/2026 | | A1 | | | 1,700,000 | | | | 1,767,197 | |
| District Columbia Hosp-Childrens Hosp | | 5.00% | | | 7/15/2034 | | A1 | | | 5,000,000 | | | | 5,095,839 | |
| Eisenhower Med Ctr | | 5.00% | | | 7/1/2029 | | Baa2 | | | 1,000,000 | | | | 1,036,476 | |
| Eisenhower Med Ctr | | 5.00% | | | 7/1/2031 | | Baa2 | | | 1,900,000 | | | | 1,952,203 | |
| Eisenhower Med Ctr | | 5.00% | | | 7/1/2033 | | Baa2 | | | 1,000,000 | | | | 1,018,772 | |
| Franklin Co IDA–Menno-Haven | | 5.00% | | | 12/1/2031 | | NR | | | 1,000,000 | | | | 921,618 | |
| Franklin Co IDA–Menno-Haven | | 5.00% | | | 12/1/2033 | | NR | | | 1,000,000 | | | | 902,053 | |
| Gainesville & Hall Co Hsp–NE GA Hlth | | 5.00% | | | 2/15/2033 | | A | | | 9,630,000 | | | | 9,971,571 | |
| Geisinger Health | | 5.00% | #(b) | | 4/1/2043 | | AA- | | | 17,300,000 | | | | 18,263,892 | |
| Glendale IDA–Beatitudes | | 5.00% | | | 11/15/2036 | | NR | | | 1,500,000 | | | | 1,347,869 | |
| Greeneville Hlth–Ballad Hlth | | 5.00% | | | 7/1/2035 | | A- | | | 3,300,000 | | | | 3,357,848 | |
| Greeneville Hlth–Ballad Hlth | | 5.00% | | | 7/1/2036 | | A- | | | 3,000,000 | | | | 3,048,894 | |
| Greeneville Hlth–Ballad Hlth | | 5.00% | | | 7/1/2037 | | A- | | | 10,000,000 | | | | 9,916,579 | |
| Guadalupe Co–Seguin City Hospital | | 5.25% | | | 12/1/2035 | | BB | | | 3,000,000 | | | | 3,004,262 | |
| Harris Co Cultural Ed–Brazos | | 4.00% | | | 1/1/2023 | | BB+ | (c) | | 255,000 | | | | 254,292 | |
| Harris Co Cultural Ed–Brazos | | 6.375% | | | 1/1/2033 | | BB+ | (c) | | 1,385,000 | | | | 1,389,241 | |
| Harris Co Edu Fac–Hermann Hlth | | 5.00% | #(b) | | 6/1/2050 | | A+ | | | 5,000,000 | | | | 5,287,877 | |
| HI Dept Budget–Kahala Nui | | 5.00% | | | 11/15/2027 | | A+ | (c) | | 1,500,000 | | | | 1,503,296 | |
| IL Fin Auth–Ascension Health | | 4.00% | | | 2/15/2033 | | AA+ | | | 5,000,000 | | | | 4,875,663 | |
| IL Fin Auth–Northshore Univ Hlth | | 5.00% | | | 8/15/2031 | | AA- | | | 2,000,000 | | | | 2,135,148 | |
| IL Fin Auth–Northshore Univ Hlth | | 5.00% | | | 8/15/2033 | | AA- | | | 1,250,000 | | | | 1,315,315 | |
| IL Fin Auth–Northwestern Mem Hlth | | 5.00% | | | 7/15/2029 | | AA+ | | | 1,000,000 | | | | 1,065,553 | |
| IL Fin Auth–Plymouth Place | | 5.00% | | | 5/15/2030 | | BB+ | (c) | | 1,690,000 | | | | 1,761,058 | |
| IL Fin Auth–Silver Cross Hsp | | 5.00% | | | 8/15/2035 | | A3 | | | 4,500,000 | | | | 4,515,113 | |
| Karnes Co Hsp Dist | | 5.00% | | | 2/1/2024 | | A | (c) | | 730,000 | | | | 737,706 | |
| | See Notes to Financial Statements. | 57 |
Schedule of Investments (continued)
INTERMEDIATE TAX FREE FUND September 30, 2022
| Investments | | Interest
Rate | | | Maturity
Date | | Credit
Rating:
S&P or
Moody’s(a) | | Principal
Amount | | | Fair
Value | |
| Health Care (continued) | | | | | | | | | | | | | | | |
| Karnes Co Hsp Dist | | 5.00% | | | 2/1/2034 | | A | (c) | $ | 1,000,000 | | | $ | 1,003,251 | |
| Kirkwood IDA–Aberdeen Heights | | 5.25% | | | 5/15/2037 | | BB- | (c) | | 2,000,000 | | | | 1,781,862 | |
| KY EDFA–Masonic Homes | | 5.375% | | | 11/15/2032 | | NR | | | 1,185,000 | | | | 1,083,923 | |
| KY EDFA–Owensboro Hlth | | 5.00% | | | 6/1/2029 | | Baa2 | | | 4,235,000 | | | | 4,354,669 | |
| KY EDFA–Owensboro Hlth | | 5.00% | | | 6/1/2032 | | Baa2 | | | 6,000,000 | | | | 6,090,201 | |
| Lakeland Regional Health | | 4.00% | | | 11/15/2034 | | A2 | | | 4,000,000 | | | | 3,731,879 | |
| Lakeland Regional Health | | 4.00% | | | 11/15/2035 | | A2 | | | 3,530,000 | | | | 3,270,673 | |
| Lakeland Regional Health | | 4.00% | | | 11/15/2036 | | A2 | | | 3,700,000 | | | | 3,405,725 | |
| Lakeland Regional Health | | 4.00% | | | 11/15/2037 | | A2 | | | 2,400,000 | | | | 2,193,286 | |
| Lakeland Regional Health | | 4.00% | | | 11/15/2038 | | A2 | | | 2,265,000 | | | | 2,052,817 | |
| Lakeland Regional Health | | 4.00% | | | 11/15/2039 | | A2 | | | 2,000,000 | | | | 1,799,484 | |
| Lee Memorial Hlth System | | 5.00% | | | 4/1/2036 | | A+ | | | 4,535,000 | | | | 4,636,852 | |
| Lehigh Co–Lehigh Valley Health Network | | 5.00% | | | 7/1/2029 | | A+ | | | 4,345,000 | | | | 4,566,952 | |
| MA DFA–Beth Israel Lahey Hlth | | 5.00% | | | 7/1/2034 | | A | | | 1,000,000 | | | | 1,036,847 | |
| MA DFA–Beth Israel Lahey Hlth | | 5.00% | | | 7/1/2036 | | A | | | 2,000,000 | | | | 2,054,924 | |
| MA DFA–Atrius Hlth | | 5.00% | | | 6/1/2039 | | NR | | | 1,250,000 | | | | 1,365,697 | |
| MA DFA–Partners Hlthcare Sys | | 5.00% | | | 7/1/2030 | | AA- | | | 9,660,000 | | | | 10,317,040 | |
| MA DFA–Wellforce Hlth | | 4.00% | | | 7/1/2035 | | BBB+ | | | 2,000,000 | | | | 1,796,253 | |
| MA DFA–Wellforce Hlth | | 4.00% | | | 7/1/2037 | | BBB+ | | | 3,930,000 | | | | 3,449,289 | |
| MA DFA–Wellforce Hlth | | 5.00% | | | 7/1/2038 | | BBB+ | | | 1,000,000 | | | | 990,618 | |
| MA DFA–Wellforce Hlth | | 5.00% | | | 7/1/2039 | | BBB+ | | | 2,250,000 | | | | 2,220,959 | |
| Maricopa Cnty AZ IDA–Banner Health | | 5.00% | | | 1/1/2028 | | AA- | | | 5,000,000 | | | | 5,354,233 | |
| Maricopa Co IDA–Honor Health | | 5.00% | | | 9/1/2033 | | A2 | | | 500,000 | | | | 513,749 | |
| Maricopa Co IDA–Honor Health | | 5.00% | | | 9/1/2034 | | A2 | | | 1,000,000 | | | | 1,024,530 | |
| Maricopa Co IDA–Honor Health | | 5.00% | | | 9/1/2035 | | A2 | | | 1,000,000 | | | | 1,022,944 | |
| Maricopa Co IDA–Honor Health | | 5.00% | | | 9/1/2036 | | A2 | | | 1,800,000 | | | | 1,837,223 | |
| Meadville Med Center | | 6.00% | | | 6/1/2036 | | NR | | | 3,830,000 | | | | 3,897,453 | |
| Met Nash/Davidson Hlth–Vanderbilt Med | | 5.00% | | | 7/1/2031 | | A3 | | | 1,300,000 | | | | 1,329,664 | |
| MI Fin Auth–Trinity Health | | 5.00% | | | 12/1/2034 | | AA- | | | 5,000,000 | | | | 5,152,925 | |
| MI Fin Auth–Trinity Health | | 5.00% | | | 12/1/2035 | | AA- | | | 5,000,000 | | | | 5,123,336 | |
| Miami Beach Hlth–Mt Sinai Med Ctr | | 5.00% | | | 11/15/2030 | | Baa1 | | | 1,500,000 | | | | 1,517,106 | |
| Miami Dade Co Hlth–Miami Childrens Hsp | | 5.125% | | | 8/1/2037 | | A | | | 12,150,000 | | | | 12,343,808 | |
| Monroeville Fin Auth–Univ Pitt Med Ctr | | 5.00% | | | 2/15/2028 | | A | | | 1,600,000 | | | | 1,675,789 | |
| Montgomery Co IDA–Einstein Hlthcare | | 5.00% | | | 1/15/2024 | | NR | | | 4,000,000 | | | | 4,088,347 | |
| Montgomery Co IDA–Einstein Hlthcare | | 5.25% | | | 1/15/2026 | | NR | | | 2,000,000 | | | | 2,087,123 | |
| Montgomery Co IDA–Einstein Hlthcare | | 5.25% | | | 1/15/2028 | | NR | | | 3,000,000 | | | | 3,130,684 | |
| Montgomery Co IDA–Jefferson Hlth | | 4.00% | | | 9/1/2036 | | A | | | 1,350,000 | | | | 1,237,990 | |
| 58 | See Notes to Financial Statements. |
Schedule of Investments (continued)
INTERMEDIATE TAX FREE FUND September 30, 2022
| Investments | | Interest
Rate | | | Maturity
Date | | Credit
Rating:
S&P or
Moody’s(a) | | Principal
Amount | | | Fair
Value | |
| Health Care (continued) | | | | | | | | | | | | | | | |
| Montgomery Co IDA–Jefferson Hlth | | 4.00% | | | 9/1/2038 | | A | | $ | 2,250,000 | | | $ | 2,017,250 | |
| Montgomery Co IDA–Whitemarsh | | 5.00% | | | 1/1/2030 | | NR | | | 2,000,000 | | | | 1,967,676 | |
| Moon IDC–Baptist Homes Soc | | 5.125% | | | 7/1/2025 | | NR | | | 2,895,000 | | | | 2,800,409 | |
| Muskingum Co Hsp–Genesis Hlthcare | | 5.00% | | | 2/15/2033 | | BB+ | | | 10,500,000 | | | | 10,026,540 | |
| NC Med–Southminster | | 5.00% | | | 10/1/2031 | | NR | | | 1,750,000 | | | | 1,693,388 | |
| New Hope Ed Facs–Childrens Hlth | | 5.00% | | | 8/15/2026 | | Aa3 | | | 2,000,000 | | | | 2,108,285 | |
| NJ Hlth–Hackensack Meridian Hlth | | 5.00% | | | 7/1/2028 | | AA- | | | 5,500,000 | | | | 5,854,152 | |
| NJ Hlth–St Josephs Hlth | | 5.00% | | | 7/1/2028 | | BBB- | | | 1,300,000 | | | | 1,319,709 | |
| NJ Hlth–St Josephs Hlth | | 5.00% | | | 7/1/2029 | | BBB- | | | 1,605,000 | | | | 1,625,994 | |
| NJ Hlth–St Josephs Hlth | | 5.00% | | | 7/1/2030 | | BBB- | | | 1,100,000 | | | | 1,110,946 | |
| NJ Hlth–St Josephs Hlth | | 5.00% | | | 7/1/2031 | | BBB- | | | 1,110,000 | | | | 1,116,650 | |
| NJ Hlth–St Peters Univ Hsp | | 5.75% | | | 7/1/2037 | | BBB- | | | 6,370,000 | | | | 6,387,507 | |
| NJ Hlth–St Peters Univ Hsp | | 6.00% | | | 7/1/2026 | | BBB- | | | 4,525,000 | | | | 4,532,651 | |
| NJ Hlth–St Peters Univ Hsp | | 6.25% | | | 7/1/2035 | | BBB- | | | 2,050,000 | | | | 2,053,071 | |
| NJ Hlth–Univ Hosp (AGM) | | 5.00% | | | 7/1/2028 | | AA | | | 2,000,000 | | | | 2,066,415 | |
| NJ Hlth Fin Auth–Valley Health | | 4.00% | | | 7/1/2036 | | A | | | 1,000,000 | | | | 923,979 | |
| NJ Hlth Fin Auth–Valley Health | | 4.00% | | | 7/1/2037 | | A | | | 1,000,000 | | | | 912,616 | |
| NJ Hlth Fin Auth–Valley Health | | 5.00% | | | 7/1/2029 | | A | | | 1,000,000 | | | | 1,051,082 | |
| Norfolk EDA–Sentara Hlth | | 5.00% | #(b) | | 11/1/2048 | | AA | | | 11,245,000 | | | | 11,966,693 | |
| NY Dorm–Catholic Hlth | | 4.00% | | | 7/1/2037 | | BB+ | | | 1,100,000 | | | | 861,440 | |
| NY Dorm–Catholic Hlth | | 4.00% | | | 7/1/2039 | | BB+ | | | 1,000,000 | | | | 763,567 | |
| NY Dorm–Catholic Hlth | | 4.00% | | | 7/1/2040 | | BB+ | | | 850,000 | | | | 641,225 | |
| NY Dorm–Catholic Hlth | | 5.00% | | | 7/1/2036 | | BB+ | | | 1,945,000 | | | | 1,750,713 | |
| NY Dorm–Montefiore | | 4.00% | | | 8/1/2036 | | BBB- | | | 1,780,000 | | | | 1,486,524 | |
| NY Dorm–Montefiore | | 4.00% | | | 9/1/2036 | | BBB- | | | 1,555,000 | | | | 1,297,385 | |
| NY Dorm–Montefiore | | 4.00% | | | 8/1/2037 | | BBB- | | | 650,000 | | | | 537,482 | |
| NY Dorm–Montefiore | | 4.00% | | | 8/1/2038 | | BBB- | | | 4,000,000 | | | | 3,276,349 | |
| NY Dorm–Montefiore | | 4.00% | | | 9/1/2038 | | BBB- | | | 2,940,000 | | | | 2,406,457 | |
| NY Dorm–Montefiore | | 4.00% | | | 9/1/2040 | | BBB- | | | 3,150,000 | | | | 2,530,329 | |
| NY Dorm–Montefiore | | 5.00% | | | 9/1/2031 | | BBB- | | | 800,000 | | | | 778,852 | |
| NY Dorm–Montefiore | | 5.00% | | | 9/1/2032 | | BBB- | | | 1,300,000 | | | | 1,256,215 | |
| NY Dorm–Montefiore | | 5.00% | | | 8/1/2033 | | BBB- | | | 1,045,000 | | | | 1,001,738 | |
| NY Dorm–Montefiore | | 5.00% | | | 9/1/2033 | | BBB- | | | 1,000,000 | | | | 957,909 | |
| NY Dorm–Montefiore | | 5.00% | | | 8/1/2034 | | BBB- | | | 500,000 | | | | 475,254 | |
| NY Dorm–Orange Reg Med Ctr† | | 5.00% | | | 12/1/2030 | | BBB- | | | 1,100,000 | | | | 1,099,234 | |
| NY Dorm–Orange Reg Med Ctr† | | 5.00% | | | 12/1/2031 | | BBB- | | | 1,600,000 | | | | 1,585,079 | |
| NY Dorm–Orange Regl Med Ctr† | | 5.00% | | | 12/1/2026 | | BBB- | | | 1,500,000 | | | | 1,530,727 | |
| | See Notes to Financial Statements. | 59 |
Schedule of Investments (continued)
INTERMEDIATE TAX FREE FUND September 30, 2022
| Investments | | Interest
Rate | | | Maturity
Date | | Credit
Rating:
S&P or
Moody’s(a) | | Principal
Amount | | | Fair
Value | |
| Health Care (continued) | | | | | | | | | | | | | | | |
| NY Dorm–Orange Regl Med Ctr† | | 5.00% | | | 12/1/2027 | | BBB- | | $ | 1,300,000 | | | $ | 1,315,169 | |
| NY Dorm–Orange Regl Med Ctr† | | 5.00% | | | 12/1/2028 | | BBB- | | | 2,000,000 | | | | 2,013,318 | |
| NY Dorm–Orange Regl Med Ctr† | | 5.00% | | | 12/1/2029 | | BBB- | | | 2,700,000 | | | | 2,710,429 | |
| NYC Hlth & Hsp Corp | | 5.00% | | | 2/15/2023 | | Aa3 | | | 4,000,000 | | | | 4,024,873 | |
| OH Hosp Fac–Premier Hlt | | 4.00% | | | 11/15/2039 | | Baa1 | | | 6,000,000 | | | | 5,181,062 | |
| OH State–Univ Hosp | | 4.00% | | | 1/15/2037 | | A | | | 1,900,000 | | | | 1,781,452 | |
| OH State–Univ Hosp | | 5.00% | | | 1/15/2036 | | A | | | 3,295,000 | | | | 3,365,782 | |
| OK DFA–OU Med | | 5.00% | | | 8/15/2033 | | Ba2 | | | 5,045,000 | | | | 4,514,916 | |
| OK DFA–OU Med | | 5.00% | | | 8/15/2038 | | Ba2 | | | 2,645,000 | | | | 2,257,812 | |
| OK DFA–OU Med | | 5.25% | | | 8/15/2043 | | Ba2 | | | 6,710,000 | | | | 5,712,083 | |
| Oneida Co–Mohawk Valley Hlth (AGM) | | 4.00% | | | 12/1/2035 | | AA | | | 1,000,000 | | | | 932,020 | |
| Oneida Co–Mohawk Valley Hlth (AGM) | | 4.00% | | | 12/1/2036 | | AA | | | 1,250,000 | | | | 1,157,628 | |
| Oneida Co–Mohawk Valley Hlth (AGM) | | 4.00% | | | 12/1/2037 | | AA | | | 2,210,000 | | | | 2,032,874 | |
| OR Hosp Fac–Salem Health | | 5.00% | | | 5/15/2029 | | A+ | | | 3,275,000 | | | | 3,439,850 | |
| OR Hosp Fac–Salem Health | | 5.00% | | | 5/15/2030 | | A+ | | | 4,660,000 | | | | 4,857,222 | |
| Oroville–Oroville Hsp | | 5.25% | | | 4/1/2039 | | B+ | | | 440,000 | | | | 423,788 | |
| Palomar Hlth | | 5.00% | | | 11/1/2036 | | BBB | | | 2,980,000 | | | | 2,973,852 | |
| Philadelphia Hsps–Temple Univ Hlth | | 5.00% | | | 7/1/2030 | | BBB | | | 4,775,000 | | | | 4,915,714 | |
| Philadelphia Hsps–Temple Univ Hlth | | 5.00% | | | 7/1/2032 | | BBB | | | 4,055,000 | | | | 4,142,055 | |
| Philadelphia Hsps–Temple Univ Hlth | | 5.00% | | | 7/1/2033 | | BBB | | | 4,870,000 | | | | 4,955,187 | |
| RI Hlth & Ed–Care New England | | 5.00% | | | 9/1/2031 | | B+ | | | 5,000,000 | | | | 4,572,540 | |
| SE Port Auth–Memorial Hlth | | 5.00% | | | 12/1/2035 | | B+ | (c) | | 3,850,000 | | | | 3,516,513 | |
| SE Port Auth–Memorial Hlth | | 5.50% | | | 12/1/2029 | | B+ | (c) | | 750,000 | | | | 753,044 | (e) |
| South Miami Hlth Fac–Baptist Hlth | | 5.00% | | | 8/15/2026 | | AA- | | | 3,000,000 | | | | 3,141,416 | |
| South Miami Hlth Fac–Baptist Hlth | | 5.00% | | | 8/15/2027 | | AA- | | | 3,620,000 | | | | 3,823,761 | |
| South Miami Hlth Fac–Baptist Hlth | | 5.00% | | | 8/15/2028 | | AA- | | | 2,625,000 | | | | 2,797,902 | |
| St Paul Hsg–HlthEast Care Sys | | 5.00% | | | 11/15/2023 | | NR | | | 3,735,000 | | | | 3,798,981 | |
| St Paul Hsg–HlthEast Care Sys | | 5.00% | | | 11/15/2024 | | NR | | | 4,500,000 | | | | 4,641,097 | |
| Tampa Hlth & Ed–Moffit Cancer | | 4.00% | | | 7/1/2038 | | A2 | | | 4,755,000 | | | | 4,314,910 | |
| Tarrant Co Cultural–CHRISTUS Health | | 5.00% | #(b) | | 7/1/2053 | | A1 | | | 7,750,000 | | | | 8,260,853 | |
| Tulsa Co Industrial Auth–Montereau | | 5.25% | | | 11/15/2037 | | BBB- | (c) | | 1,250,000 | | | | 1,257,158 | |
| Univ of CA | | 5.00% | | | 5/15/2034 | | AA- | | | 12,250,000 | | | | 13,028,864 | |
| WA HFC–Rockwood† | | 6.00% | | | 1/1/2024 | | NR | | | 470,000 | | | | 471,813 | |
| Washington Co–Memorial Hlth | | 5.50% | | | 12/1/2027 | | NR | | | 12,120,000 | | | | 11,501,665 | |
| Washington Co–Memorial Hlth | | 6.375% | | | 12/1/2037 | | NR | | | 10,000,000 | | | | 9,193,700 | |
| WI Hlth & Ed–American Baptist | | 5.00% | | | 8/1/2032 | | NR | | | 1,375,000 | | | | 1,227,743 | |
| WI Hlth & Ed–American Baptist | | 5.00% | | | 8/1/2037 | | NR | | | 1,500,000 | | | | 1,256,316 | |
| 60 | See Notes to Financial Statements. |
Schedule of Investments (continued)
INTERMEDIATE TAX FREE FUND September 30, 2022
| Investments | | Interest
Rate | | | Maturity
Date | | Credit
Rating:
S&P or
Moody’s(a) | | Principal
Amount | | | Fair
Value | |
| Health Care (continued) | | | | | | | | | | | | | | | |
| WI PFA–Alabama Proton† | | 6.85% | | | 10/1/2047 | | NR | | $ | 1,410,000 | | | $ | 1,127,387 | (e) |
| Wood Co Hsp Facs–Wood Co Hsp | | 5.00% | | | 12/1/2027 | | NR | | | 1,155,000 | | | | 1,158,629 | |
| Wood Co Hsp Facs–Wood Co Hsp | | 5.00% | | | 12/1/2032 | | NR | | | 760,000 | | | | 762,388 | |
| WV Hsp–WV United Health Sys | | 4.00% | | | 6/1/2030 | | A | | | 5,500,000 | | | | 5,445,949 | |
| WV Hsp–WV United Health Sys | | 4.00% | | | 6/1/2035 | | A | | | 1,570,000 | | | | 1,459,205 | |
| Total | | | | | | | | | | | | | | 592,248,456 | |
| | | | | | | | | | | | | | | | |
| Housing 1.50% | | | | | | | | | | | | | | | |
| CA HFA–MFH | | 3.25% | | | 8/20/2036 | | BBB | | | 7,406,184 | | | | 6,345,169 | |
| CA HFA–MFH | | 3.50% | | | 11/20/2035 | | BBB+ | | | 5,722,352 | | | | 4,947,343 | |
| CA HFA–MFH | | 4.00% | | | 3/20/2033 | | BBB+ | | | 4,540,712 | | | | 4,321,591 | |
| CA HFA–MFH | | 4.25% | | | 1/15/2035 | | BBB+ | | | 4,293,574 | | | | 4,117,529 | |
| CA Muni Fin–Park Wstrn Apts (FNMA) | | 2.65% | | | 8/1/2036 | | Aaa | | | 4,343,728 | | | | 3,593,323 | |
| CA State GO | | 5.00% | | | 11/1/2031 | | Aa2 | | | 10,000,000 | | | | 10,767,199 | |
| CA Stwde–CHF-Irvine LLC | | 5.00% | | | 5/15/2026 | | Baa1 | | | 1,000,000 | | | | 1,026,521 | |
| CA Stwde–CHF-Irvine LLC | | 5.00% | | | 5/15/2027 | | Baa1 | | | 750,000 | | | | 769,385 | |
| CA Stwde–Lancer Student Hsg† | | 5.00% | | | 6/1/2034 | | NR | | | 380,000 | | | | 365,676 | |
| CA Stwde–Lancer Student Hsg† | | 5.00% | | | 6/1/2039 | | NR | | | 650,000 | | | | 603,406 | |
| CSCDA–Westgate Pasadena† | | 3.00% | | | 6/1/2047 | | NR | | | 5,000,000 | | | | 3,422,036 | |
| FL State Hsg Fin Auth (GNMA) | | 3.00% | | | 1/1/2052 | | Aaa | | | 3,985,000 | | | | 3,796,694 | |
| FL State Hsg Fin Auth (GNMA) | | 3.00% | | | 7/1/2052 | | Aaa | | | 5,270,000 | | | | 4,985,656 | |
| MD State Hsg CDA | | 3.00% | | | 9/1/2039 | | Aa1 | | | 10,000,000 | | | | 8,211,127 | |
| MO State Hsg Dev Cmmn (GNMA) | | 3.25% | | | 11/1/2052 | | AA+ | | | 2,945,000 | | | | 2,802,209 | |
| MO State Hsg Dev Cmmn (GNMA) | | 4.25% | | | 5/1/2047 | | AA+ | | | 1,595,000 | | | | 1,584,076 | |
| ND State Hsg Fin Agy | | 3.00% | | | 7/1/2052 | | AA+ | | | 4,935,000 | | | | 4,614,577 | |
| NYC HDC (FHA) | | 2.10% | | | 11/1/2036 | | AA+ | | | 5,725,000 | | | | 4,165,914 | |
| Phoenix IDA–ASU Std Hsg | | 5.00% | | | 7/1/2032 | | Baa3 | | | 1,080,000 | | | | 1,070,071 | |
| WA St HFC | | 3.50% | | | 12/20/2035 | | BBB+ | | | 4,904,462 | | | | 4,165,430 | |
| Total | | | | | | | | | | | | | | 75,674,932 | |
| | | | | | | | | | | | | | | | |
| Lease Obligations 4.63% | | | | | | | | | | | | | | | |
| CA Pub Wks–Dept Hsps | | 5.00% | | | 6/1/2023 | | Aa3 | | | 3,000,000 | | | | 3,038,244 | |
| CA St Pub Wks Brd Lease | | 5.00% | | | 5/1/2034 | | Aa3 | | | 9,525,000 | | | | 10,440,810 | |
| Cuyahoga Co COPS–Conv Hotel Proj | | 5.00% | | | 12/1/2023 | | AA- | | | 5,640,000 | | | | 5,736,315 | |
| Hudson Yards | | 5.00% | | | 2/15/2029 | | Aa2 | | | 3,500,000 | | | | 3,707,805 | |
| IL Sports Facs Auth (AGM) | | 5.00% | | | 6/15/2027 | | AA | | | 3,000,000 | | | | 3,077,539 | |
| IN Fin Auth–Stadium | | 5.25% | | | 2/1/2029 | | AA+ | | | 2,500,000 | | | | 2,627,547 | |
| LA PFA–Hurricane Recovery | | 5.00% | | | 6/1/2023 | | Aa3 | | | 3,200,000 | | | | 3,235,556 | |
| | See Notes to Financial Statements. | 61 |
Schedule of Investments (continued)
INTERMEDIATE TAX FREE FUND September 30, 2022
| Investments | | Interest
Rate | | | Maturity
Date | | Credit
Rating:
S&P or
Moody’s(a) | | Principal
Amount | | | Fair
Value | |
| Lease Obligations (continued) | | | | | | | | | | | | | | | |
| MI St Bldg Auth | | 5.00% | | | 4/15/2036 | | Aa2 | | $ | 3,000,000 | | | $ | 3,207,492 | |
| Miami Dade Co Sch Dist GO | | 4.00% | | | 3/15/2034 | | AA- | | | 4,535,000 | | | | 4,545,307 | |
| Michigan St Bldg Auth | | 5.00% | | | 4/15/2034 | | Aa2 | | | 6,525,000 | | | | 6,760,231 | |
| Nassau Health Care Corp GTD | | 5.00% | | | 8/1/2029 | | AA- | | | 5,000,000 | | | | 5,396,714 | |
| NJ EDA–Bldgs | | 5.00% | | | 6/15/2036 | | A3 | | | 1,320,000 | | | | 1,330,071 | |
| NJ EDA–Sch Facs | | 4.00% | | | 6/15/2034 | | A3 | | | 500,000 | | | | 460,796 | |
| NJ EDA–Sch Facs | | 4.00% | | | 6/15/2035 | | A3 | | | 400,000 | | | | 365,451 | |
| NJ EDA–Sch Facs | | 4.06%
(MUNIPSA * 1 + 1.60% | )# | | 3/1/2028 | | A3 | | | 5,000,000 | | | | 5,003,253 | |
| NJ EDA–Sch Facs | | 5.00% | | | 6/15/2025 | | A3 | | | 5,085,000 | | | | 5,215,016 | |
| NJ EDA–Sch Facs | | 5.00% | | | 3/1/2027 | | BBB+ | | | 355,000 | | | | 356,333 | |
| NJ EDA–Sch Facs | | 5.00% | | | 3/1/2029 | | A3 | | | 7,500,000 | | | | 7,556,757 | |
| NJ EDA–Sch Facs | | 5.00% | | | 6/15/2034 | | A3 | | | 3,000,000 | | | | 3,028,552 | |
| NJ EDA–Sch Facs | | 5.00% | | | 6/15/2035 | | A3 | | | 4,925,000 | | | | 4,949,786 | |
| NJ EDA–Sch Facs | | 5.00% | | | 6/15/2035 | | A3 | | | 1,000,000 | | | | 1,008,417 | |
| NJ EDA–Sch Facs | | 5.00% | | | 6/15/2042 | | A3 | | | 1,400,000 | | | | 1,387,889 | |
| NJ EDA–Sch Facs† | | 5.25% | | | 9/1/2027 | | BBB+ | | | 24,555,000 | | | | 25,827,384 | |
| NJ EDA–Sch Facs | | 5.25% | | | 6/15/2032 | | A3 | | | 2,865,000 | | | | 3,011,106 | |
| NJ EDA–Sch Facs | | 5.50% | | | 6/15/2029 | | A3 | | | 3,500,000 | | | | 3,800,271 | |
| NJ EDA–State House Proj | | 5.00% | | | 6/15/2033 | | A3 | | | 7,215,000 | | | | 7,352,641 | |
| NJ EDA–State House Proj | | 5.00% | | | 6/15/2034 | | A3 | | | 13,645,000 | | | | 13,810,899 | |
| NJ EDA–Transit | | 4.00% | | | 11/1/2037 | | A3 | | | 3,000,000 | | | | 2,673,936 | |
| NJ EDA–Transit | | 4.00% | | | 11/1/2038 | | A3 | | | 3,000,000 | | | | 2,642,494 | |
| NJ EDA–Transit | | 5.00% | | | 11/1/2033 | | A3 | | | 3,845,000 | | | | 3,921,800 | |
| NJ Trans Trust Fund | | 3.25% | | | 6/15/2039 | | A3 | | | 2,000,000 | | | | 1,549,743 | |
| NJ Trans Trust Fund | | 4.00% | | | 6/15/2036 | | A3 | | | 2,770,000 | | | | 2,496,566 | |
| NJ Trans Trust Fund | | 5.00% | | | 6/15/2030 | | A+ | | | 3,000,000 | | | | 3,095,467 | |
| NJ Trans Trust Fund | | 5.00% | | | 6/15/2031 | | A+ | | | 2,400,000 | | | | 2,465,142 | |
| NJ Trans Trust Fund | | 5.00% | | | 6/15/2031 | | A3 | | | 8,000,000 | | | | 8,258,285 | |
| NJ Trans Trust Fund | | 5.00% | | | 6/15/2033 | | A3 | | | 1,425,000 | | | | 1,452,185 | |
| NJ Trans Trust Fund | | 5.00% | | | 12/15/2033 | | A3 | | | 35,410,000 | | | | 36,027,033 | |
| NJ Trans Trust Fund | | 5.00% | | | 12/15/2034 | | A3 | | | 8,995,000 | | | | 9,098,525 | |
| NYC Eductnl Const | | 4.00% | | | 4/1/2036 | | AA- | | | 2,335,000 | | | | 2,178,018 | |
| NYC Eductnl Const | | 4.00% | | | 4/1/2037 | | AA- | | | 6,070,000 | | | | 5,596,896 | |
| NYC TFA Sch Dist | | 5.00% | | | 7/15/2035 | | AA | | | 10,000,000 | | | | 10,301,321 | |
| Philadelphia Redev Auth | | 5.00% | | | 4/15/2028 | | A | | | 4,380,000 | | | | 4,547,915 | |
| San Jose Fing Auth–Civic Ctr | | 5.00% | | | 6/1/2023 | | Aa2 | | | 1,000,000 | | | | 1,012,420 | |
| Total | | | | | | | | | | | | | | 233,555,928 | |
| 62 | See Notes to Financial Statements. |
Schedule of Investments (continued)
INTERMEDIATE TAX FREE FUND September 30, 2022
| Investments | | Interest
Rate | | | Maturity
Date | | Credit
Rating:
S&P or
Moody’s(a) | | Principal
Amount | | | Fair
Value | |
| Other Revenue 3.82% | | | | | | | | | | | | | | | |
| Black Belt Energy Gas Dist–Morgan Stanley | | 4.00% | #(b) | | 12/1/2049 | | A1 | | $ | 12,675,000 | | | $ | 12,560,200 | |
| Brooklyn Arena LDC–Barclays Ctr | | 5.00% | | | 7/15/2042 | | Ba1 | | | 7,600,000 | | | | 7,268,224 | |
| Brooklyn Arena LDC–Barclays Ctr (AGM) | | 4.00% | | | 7/15/2029 | | AA | | | 1,500,000 | | | | 1,513,746 | |
| Chester Co IDA–Collegium Chtr Sch | | 5.25% | | | 10/15/2032 | | BB | | | 6,410,000 | | | | 6,414,166 | |
| Cleveland Co Port Auth–Playhouse Sq | | 5.00% | | | 12/1/2033 | | BB+ | | | 2,000,000 | | | | 1,993,101 | |
| Cleveland Co Port Auth–Playhouse Sq | | 5.25% | | | 12/1/2038 | | BB+ | | | 1,650,000 | | | | 1,648,097 | |
| Clifton Higher Ed–Intl Ldrshp Sch | | 6.00% | | | 8/15/2038 | | NR | | | 13,970,000 | | | | 14,247,905 | |
| CT State Revolving Fund | | 4.00% | | | 2/1/2038 | | AAA | | | 3,000,000 | | | | 2,858,835 | |
| Florence Twn IDA–Legacy Trad Sch† | | 5.75% | | | 7/1/2033 | | BB+ | | | 3,000,000 | | | | 3,054,821 | |
| HI Dept Budget–Hawaiian Electric AMT | | 3.25% | | | 1/1/2025 | | Baa1 | | | 5,000,000 | | | | 4,902,276 | |
| HI Harbor System AMT | | 4.00% | | | 7/1/2034 | | Aa3 | | | 1,625,000 | | | | 1,539,127 | |
| IL Fin Auth–Field Museum | | 3.272%
(SOFR * .70 + 1.20% | )# | | 11/1/2034 | | A | | | 10,500,000 | | | | 10,387,415 | |
| KS DFA–Revolving Fund | | 5.00% | | | 5/1/2031 | | AAA | | | 5,465,000 | | | | 5,986,605 | |
| KY Public Energy Auth–Peak Energy | | 4.00% | #(b) | | 2/1/2050 | | A1 | | | 28,995,000 | | | | 28,224,936 | |
| Lower AL Gas Dist–Goldman Sachs | | 4.00% | #(b) | | 12/1/2050 | | A2 | | | 30,995,000 | | | | 30,589,998 | |
| Lower AL Gas Dist–Goldman Sachs | | 5.00% | | | 9/1/2027 | | A2 | | | 5,000,000 | | | | 5,112,413 | |
| Maricopa Co–Legacy Schools† | | 5.00% | | | 7/1/2039 | | BB+ | | | 2,055,000 | | | | 1,956,288 | |
| Maricopa Co IDA–Paradise Schools† | | 5.00% | | | 7/1/2036 | | BB+ | | | 2,500,000 | | | | 2,373,410 | |
| MD EDC–Chesapeake Bay Hyatt(d) | | 5.00% | | | 12/1/2016 | | NR | | | 700,000 | | | | 420,000 | |
| MSR Energy Auth–Citi | | 6.125% | | | 11/1/2029 | | BBB+ | | | 3,595,000 | | | | 3,906,359 | |
| NYC Cultural–Lincoln Center | | 4.00% | | | 12/1/2033 | | A | | | 2,000,000 | | | | 1,914,735 | |
| NYC Cultural–Lincoln Center | | 5.00% | | | 12/1/2031 | | A | | | 1,250,000 | | | | 1,367,349 | |
| NYC Cultural–Lincoln Center | | 5.00% | | | 12/1/2032 | | A | | | 3,500,000 | | | | 3,800,891 | |
| Phoenix IDA–Basis Schs† | | 5.00% | | | 7/1/2035 | | BB | | | 2,350,000 | | | | 2,332,338 | |
| Pima Co IDA–Edkey Chtr Sch† | | 5.00% | | | 7/1/2035 | | NR | | | 5,000,000 | | | | 4,709,636 | |
| PR Comwlth GO | | Zero Coupon | | | 11/1/2051 | | NR | | | 15,086,280 | | | | 6,807,684 | |
| SA Energy Acquisition Pub Fac–Goldman Sachs | | 5.50% | | | 8/1/2023 | | A2 | | | 9,365,000 | | | | 9,473,848 | |
| St Louis Fin Corp–Convention Center (AGM) | | 5.00% | | | 10/1/2040 | | AA | | | 1,750,000 | | | | 1,826,439 | |
| Triborough Brdg & Tunl Auth–Payroll Mobility Tax | | 5.00% | | | 11/15/2028 | | AA+ | | | 4,285,000 | | | | 4,661,280 | |
| WA Convention Ctr | | 4.00% | | | 7/1/2031 | | NR | | | 10,180,000 | | | | 9,025,985 | |
| Total | | | | | | | | | | | | | | 192,878,107 | |
| | See Notes to Financial Statements. | 63 |
Schedule of Investments (continued)
INTERMEDIATE TAX FREE FUND September 30, 2022
| Investments | | Interest
Rate | | | Maturity
Date | | Credit
Rating:
S&P or
Moody’s(a) | | Principal
Amount | | | Fair
Value | |
| Pre-Refunded 0.08% | | | | | | | | | | | | | | | |
| NY Dorm–PIT | | 4.00% | | | 2/15/2034 | | NR | | $ | 15,000 | | | $ | 15,413 | |
| Wood Co Hsp Facs–Wood Co Hsp | | 5.00% | | | 12/1/2027 | | NR | | | 2,295,000 | | | | 2,302,211 | |
| Wood Co Hsp Facs–Wood Co Hsp | | 5.00% | | | 12/1/2032 | | NR | | | 1,515,000 | | | | 1,519,760 | |
| Total | | | | | | | | | | | | | | 3,837,384 | |
| | | | | | | | | | | | | | | | |
| Special Tax 2.15% | | | | | | | | | | | | | | | |
| Allentown Neighborhood Impt† | | 5.00% | | | 5/1/2032 | | Ba3 | | | 1,250,000 | | | | 1,223,289 | |
| Allentown Neighborhood Impt† | | 5.375% | | | 5/1/2042 | | NR | | | 5,500,000 | | | | 5,147,201 | |
| Allentown Neighborhood Impt–Wtrfrnt Proj† | | 6.00% | | | 5/1/2042 | | NR | | | 1,910,000 | | | | 1,878,950 | |
| Atlanta Urban Dev Agency–Atlanta Beltline† | | 2.375% | | | 7/1/2026 | | NR | | | 415,000 | | | | 387,510 | |
| Atlanta Urban Dev Agency–Atlanta Beltline† | | 2.875% | | | 7/1/2031 | | NR | | | 965,000 | | | | 829,841 | |
| Atlanta Urban Dev Agency–Atlanta Beltline† | | 3.625% | | | 7/1/2042 | | NR | | | 1,880,000 | | | | 1,513,148 | |
| Connecticut Special Transportation Fund: Debt Service | | 4.00% | | | 9/1/2034 | | AA- | | | 8,075,000 | | | | 7,890,659 | |
| CT Spl Tax–Trans Infra | | 5.00% | | | 10/1/2030 | | AA- | | | 9,000,000 | | | | 9,725,162 | |
| CT Spl Tax–Trans Infra | | 5.00% | | | 1/1/2032 | | AA- | | | 14,375,000 | | | | 15,340,069 | |
| Douglas Co–Sterling Ranch | | 3.375% | | | 12/1/2030 | | NR | | | 600,000 | | | | 517,056 | |
| Douglas Co–Sterling Ranch | | 3.75% | | | 12/1/2040 | | NR | | | 1,250,000 | | | | 967,741 | |
| Emeryville Redev Agy (AGM) | | 5.00% | | | 9/1/2024 | | AA | | | 1,950,000 | | | | 2,010,646 | |
| Emeryville Redev Agy (AGM) | | 5.00% | | | 9/1/2025 | | AA | | | 2,650,000 | | | | 2,736,450 | |
| Miami World Ctr CDD | | 4.75% | | | 11/1/2027 | | NR | | | 750,000 | | | | 756,096 | |
| MIDA Mount Village PID† | | 4.50% | | | 8/1/2040 | | NR | | | 1,250,000 | | | | 1,110,232 | |
| New York N Y City Indl Dev Agy Rev Pilot Ref Bds Queens Baseball Stad Proj 2021a (AGM) | 3.00% | | | 1/1/2033 | | AA | | | 1,750,000 | | | | 1,502,769 | |
| NYC IDA–Queens Stadium (AGM) | | 3.00% | | | 1/1/2034 | | AA | | | 1,000,000 | | | | 837,706 | |
| NYC IDA–Queens Stadium (AGM) | | 4.00% | | | 1/1/2032 | | AA | | | 1,000,000 | | | | 1,003,881 | |
| NYC IDA–Queens Stadium (AGM) | | 5.00% | | | 1/1/2030 | | AA | | | 2,500,000 | | | | 2,663,947 | |
| NYC IDA–Queens Stadium (AGM) | | 5.00% | | | 1/1/2031 | | AA | | | 1,250,000 | | | | 1,336,462 | |
| NYC IDA–Yankee Stadium (AGM) | | 2.50% | | | 3/1/2037 | | AA | | | 10,435,000 | | | | 7,386,500 | |
| NYC IDA–Yankee Stadium (AGM) | | 3.00% | | | 3/1/2036 | | AA | | | 5,500,000 | | | | 4,431,799 | |
| Orange Co CFD–Esencia | | 5.00% | | | 8/15/2033 | | NR | | | 1,370,000 | | | | 1,396,926 | |
| Orange Co CFD–Esencia | | 5.00% | | | 8/15/2035 | | NR | | | 975,000 | | | | 991,560 | |
| Peninsula Town Center† | | 4.50% | | | 9/1/2028 | | NR | | | 545,000 | | | | 505,830 | |
| Peninsula Town Center† | | 5.00% | | | 9/1/2037 | | NR | | | 875,000 | | | | 800,089 | |
| 64 | See Notes to Financial Statements. |
Schedule of Investments (continued)
INTERMEDIATE TAX FREE FUND September 30, 2022
| Investments | | Interest
Rate | | | Maturity
Date | | Credit
Rating:
S&P or
Moody’s(a) | | Principal
Amount | | | Fair
Value | |
| Special Tax (continued) | | | | | | | | | | | | | | | |
| Pittsburg Redev Agy–Los Medanos (AGM) | | 5.00% | | | 9/1/2025 | | AA | | $ | 3,500,000 | | | $ | 3,626,006 | |
| Plaza Met Dist #1† | | 4.50% | | | 12/1/2030 | | NR | | | 4,300,000 | | | | 4,063,388 | |
| River Islands PFA–CFD 2021 | | 4.00% | | | 9/1/2051 | | NR | | | 990,000 | | | | 780,470 | |
| River Islands Pub Fing Auth Calif Spl Tax Ref Bds Cfd 2003 1 Impt Area No 1 2022a-1 (AGM) | | 5.00% | | | 9/1/2042 | | AA | | | 4,000,000 | | | | 4,181,311 | |
| St Louis IDA–Ballpark Vlg | | 4.375% | | | 11/15/2035 | | NR | | | 3,955,000 | | | | 3,220,718 | |
| Village CDD #12 | | 3.25% | | | 5/1/2026 | | NR | | | 3,040,000 | | | | 2,928,364 | |
| Village CDD #12† | | 3.80% | | | 5/1/2028 | | NR | | | 2,085,000 | | | | 2,013,077 | |
| Village CDD #12† | | 4.00% | | | 5/1/2033 | | NR | | | 1,855,000 | | | | 1,757,126 | |
| Village CDD #13 | | 1.80% | | | 5/1/2026 | | NR | | | 600,000 | | | | 537,638 | (e) |
| Village CDD #13 | | 2.55% | | | 5/1/2031 | | NR | | | 750,000 | | | | 612,673 | |
| Village CDD #13 | | 2.85% | | | 5/1/2036 | | NR | | | 1,885,000 | | | | 1,422,009 | |
| Village CDD #13 | | 3.00% | | | 5/1/2029 | | NR | | | 485,000 | | | | 434,989 | |
| Village CDD #13† | | 3.00% | | | 5/1/2035 | | NR | | | 3,420,000 | | | | 2,743,414 | |
| Village CDD #13† | | 3.25% | | | 5/1/2040 | | NR | | | 4,285,000 | | | | 3,273,969 | |
| Village CDD #13 | | 3.375% | | | 5/1/2034 | | NR | | | 2,495,000 | | | | 2,120,111 | |
| Total | | | | | | | | | | | | | | 108,606,782 | |
| | | | | | | | | | | | | | | | |
| Tax Revenue 4.22% | | | | | | | | | | | | | | | |
| Chicago Brd Ed | | 5.00% | | | 12/1/2032 | | BB | | | 5,675,000 | | | | 5,643,378 | |
| Clear Creek ISD | | 0.28% | #(b) | | 2/15/2038 | | AAA | | | 4,930,000 | | | | 4,574,295 | |
| Cook Co–Sales Tax | | 5.25% | | | 11/15/2036 | | AA- | | | 10,000,000 | | | | 10,519,778 | |
| Cook Co Sales Tax | | 4.00% | | | 11/15/2034 | | AA- | | | 3,750,000 | | | | 3,724,816 | |
| CT Spl Tax–Trans Infra | | 5.00% | | | 5/1/2033 | | AA- | | | 3,000,000 | | | | 3,246,690 | |
| El Paso Dev Corp–Downtown Ballpark | | 6.25% | | | 8/15/2023 | | AA- | | | 5,000,000 | | | | 5,083,615 | |
| Guam–Business Privilege Tax | | 4.00% | | | 1/1/2036 | | Ba1 | | | 2,865,000 | | | | 2,481,451 | |
| Guam–Business Privilege Tax | | 5.00% | | | 1/1/2031 | | Ba1 | | | 750,000 | | | | 744,179 | |
| Islip Union Free SD(f) | | 4.50% | | | 6/23/2023 | | NR | | | 20,000,000 | | | | 20,163,446 | |
| Jefferson Co–Sch Warrant | | 5.00% | | | 9/15/2026 | | AA | | | 2,400,000 | | | | 2,541,562 | |
| MD Dept Trans | | 4.00% | | | 7/1/2037 | | Aa2 | | | 4,660,000 | | | | 4,455,186 | |
| MD St Trans Auth | | 3.00% | | | 10/1/2034 | | AAA | | | 5,510,000 | | | | 4,786,623 | |
| Met Atlanta Rapid Trans Auth | | 5.00% | | | 7/1/2032 | | AA+ | | | 5,000,000 | | | | 5,262,304 | |
| Met Pier & Expo Auth–McCormick Place | | 5.00% | | | 12/15/2022 | | A- | | | 5,020,000 | | | | 5,030,291 | |
| Miami Dade Co–Transit Rev | | 5.00% | | | 7/1/2032 | | AA | | | 7,500,000 | | | | 8,150,930 | |
| MTA NY–Dedicated Tax | | 5.00% | | | 11/15/2027 | | AA | | | 5,700,000 | | | | 5,711,340 | |
| MTA NY–Dedicated Tax | | 5.00% | | | 11/15/2036 | | AA | | | 7,900,000 | | | | 8,253,783 | |
| NJ Trans Trust Fund | | 5.00% | | | 6/15/2031 | | A3 | | | 3,200,000 | | | | 3,303,314 | |
| | See Notes to Financial Statements. | 65 |
Schedule of Investments (continued)
INTERMEDIATE TAX FREE FUND September 30, 2022
| Investments | | Interest
Rate | | | Maturity
Date | | Credit
Rating:
S&P or
Moody’s(a) | | Principal
Amount | | | Fair
Value | |
| Tax Revenue (continued) | | | | | | | | | | | | | | | |
| NY UDC–PIT(f) | | 5.00% | | | 3/15/2034 | | Aa1 | | $ | 12,140,000 | | | $ | 13,244,676 | |
| NY UDC–PIT(f) | | 5.00% | | | 3/15/2035 | | Aa1 | | | 5,000,000 | | | | 5,419,271 | |
| NYC TFA–Future Tax | | 4.00% | | | 8/1/2038 | | AAA | | | 5,530,000 | | | | 5,233,162 | |
| NYC TFA–Bldg Aid | | 5.25% | | | 7/15/2036 | | AA | | | 11,700,000 | | | | 12,402,433 | |
| NYC TFA–Future Tax | | 3.00% | | | 11/1/2037 | | AAA | | | 2,500,000 | | | | 2,015,093 | |
| NYC TFA–Future Tax | | 5.00% | | | 2/1/2043 | | AAA | | | 5,515,000 | | | | 5,617,111 | |
| NYS Twy Auth–PIT | | 5.00% | | | 3/15/2035 | | AA+ | | | 6,000,000 | | | | 6,504,216 | |
| PR Corp Sales Tax | | Zero Coupon | | | 7/1/2029 | | NR | | | 1,616,000 | | | | 1,163,945 | |
| PR Corp Sales Tax | | Zero Coupon | | | 7/1/2031 | | NR | | | 21,064,000 | | | | 13,420,454 | |
| PR Corp Sales Tax | | Zero Coupon | | | 7/1/2033 | | NR | | | 2,346,000 | | | | 1,321,391 | |
| PR Corp Sales Tax | | 4.329% | | | 7/1/2040 | | NR | | | 5,223,000 | | | | 4,524,549 | |
| PR Corp Sales Tax | | 4.329% | | | 7/1/2040 | | NR | | | 12,051,000 | | | | 10,439,467 | |
| PR Corp Sales Tax | | 4.50% | | | 7/1/2034 | | NR | | | 4,560,000 | | | | 4,274,145 | |
| PR Corp Sales Tax | | 4.536% | | | 7/1/2053 | | NR | | | 81,000 | | | | 66,895 | |
| PR Corp Sales Tax | | 4.55% | | | 7/1/2040 | | NR | | | 268,000 | | | | 238,808 | |
| PR Corp Sales Tax | | 4.75% | | | 7/1/2053 | | NR | | | 1,967,000 | | | | 1,684,857 | |
| PR Corp Sales Tax | | 4.784% | | | 7/1/2058 | | NR | | | 1,092,000 | | | | 921,199 | |
| PR Corp Sales Tax | | 5.00% | | | 7/1/2058 | | NR | | | 4,974,000 | | | | 4,403,494 | |
| Sparks–Legends at Sparks Marina† | | 2.50% | | | 6/15/2024 | | Ba2 | | | 210,000 | | | | 202,080 | |
| Sparks–Legends at Sparks Marina† | | 2.75% | | | 6/15/2028 | | Ba2 | | | 2,265,000 | | | | 1,988,160 | |
| Spencer Van Etten CSD | | 3.75% | | | 6/30/2023 | | NR | | | 14,313,597 | | | | 14,358,127 | |
| Total | | | | | | | | | | | | | | 213,120,514 | |
| | | | | | | | | | | | | | | | |
| Tobacco 1.86% | | | | | | | | | | | | | | | |
| Buckeye Tobacco | | 5.00% | | | 6/1/2055 | | NR | | | 21,180,000 | | | | 17,817,417 | |
| Golden St Tobacco | | 5.00% | | | 6/1/2027 | | NR | | | 4,000,000 | | | | 4,318,090 | |
| Los Angeles Co Tobacco | | 4.00% | | | 6/1/2034 | | A- | | | 980,000 | | | | 912,816 | |
| Los Angeles Co Tobacco | | 4.00% | | | 6/1/2035 | | A- | | | 1,300,000 | | | | 1,197,924 | |
| Los Angeles Co Tobacco | | 4.00% | | | 6/1/2036 | | A- | | | 1,195,000 | | | | 1,091,348 | |
| Los Angeles Co Tobacco | | 4.00% | | | 6/1/2037 | | A- | | | 895,000 | | | | 808,382 | |
| Los Angeles Co Tobacco | | 5.00% | | | 6/1/2049 | | BBB- | | | 195,000 | | | | 184,558 | |
| MI Tob Settlement | | 4.00% | | | 6/1/2034 | | A- | | | 1,000,000 | | | | 934,493 | |
| MI Tob Settlement | | 4.00% | | | 6/1/2035 | | A- | | | 2,000,000 | | | | 1,854,251 | |
| Nassau Co Tobacco | | Zero Coupon | | | 6/1/2060 | | NR | | | 35,000,000 | | | | 1,598,215 | |
| Northern Tobacco | | 4.00% | | | 6/1/2037 | | A- | | | 1,500,000 | | | | 1,367,262 | |
| Nthrn AK Tobacco | | 4.00% | | | 6/1/2050 | | BBB- | | | 1,750,000 | | | | 1,561,237 | |
| PA Tob Settlement | | 5.00% | | | 6/1/2032 | | A1 | | | 8,350,000 | | | | 8,710,218 | |
| 66 | See Notes to Financial Statements. |
Schedule of Investments (continued)
INTERMEDIATE TAX FREE FUND September 30, 2022
| Investments | | Interest
Rate | | | Maturity
Date | | Credit
Rating:
S&P or
Moody’s(a) | | Principal
Amount | | | Fair
Value | |
| Tobacco (continued) | | | | | | | | | | | | | | | |
| Railsplitter Tob Settlement Auth | | 5.00% | | | 6/1/2027 | | A | | $ | 3,325,000 | | | $ | 3,457,584 | |
| RI Tob Settlement | | 5.00% | | | 6/1/2027 | | BBB | | | 2,500,000 | | | | 2,547,792 | |
| RI Tob Settlement | | 5.00% | | | 6/1/2028 | | BBB | | | 2,000,000 | | | | 2,033,560 | |
| SD Edu Enhancement Fding Corp | | 5.00% | | | 6/1/2023 | | NR | | | 1,000,000 | | | | 1,011,831 | |
| SD Edu Enhancement Fding Corp | | 5.00% | | | 6/1/2024 | | NR | | | 1,000,000 | | | | 1,011,831 | |
| SD Edu Enhancement Fding Corp | | 5.00% | | | 6/1/2025 | | NR | | | 1,040,000 | | | | 1,052,304 | |
| Tobacco Settlement Auth IA | | 4.00% | | | 6/1/2049 | | BBB | | | 7,090,000 | | | | 6,280,632 | |
| Tobacco Settlement Auth WA | | 5.00% | | | 6/1/2023 | | A | | | 6,250,000 | | | | 6,331,453 | |
| Tobacco Settlement Fin Corp NJ | | 5.00% | | | 6/1/2029 | | A | | | 3,575,000 | | | | 3,708,689 | |
| Tobacco Settlement Fin Corp NJ | | 5.00% | | | 6/1/2046 | | BB+ | | | 10,300,000 | | | | 9,494,294 | |
| Tobacco Settlement Fin Corp NJ | | 5.25% | | | 6/1/2046 | | BBB+ | | | 5,100,000 | | | | 5,002,113 | |
| Tobacco Settlement Fin Corp VA | | 5.00% | | | 6/1/2047 | | B- | | | 3,690,000 | | | | 3,423,140 | |
| TSASC | | 5.00% | | | 6/1/2029 | | A | | | 5,775,000 | | | | 5,988,099 | |
| Total | | | | | | | | | | | | | | 93,699,533 | |
| | | | | | | | | | | | | | | | |
| Transportation 22.33% | | | | | | | | | | | | | | | |
| AK Intl Airports Sys | | 5.00% | | | 10/1/2024 | | A1 | | | 750,000 | | | | 774,293 | |
| AK Intl Airports Sys | | 5.00% | | | 10/1/2028 | | A1 | | | 2,000,000 | | | | 2,086,511 | |
| AL Port Auth AMT (AGM) | | 5.00% | | | 10/1/2026 | | AA | | | 1,250,000 | | | | 1,298,447 | |
| AL Port Auth AMT (AGM) | | 5.00% | | | 10/1/2027 | | AA | | | 2,000,000 | | | | 2,093,848 | |
| AL Port Auth AMT (AGM) | | 5.00% | | | 10/1/2028 | | AA | | | 4,710,000 | | | | 4,928,732 | |
| AL Port Auth AMT (AGM) | | 5.00% | | | 10/1/2029 | | AA | | | 3,500,000 | | | | 3,660,803 | |
| Alameda Corridor Trsp Auth CR (AGM) | | 5.00% | | | 10/1/2034 | | AA | | | 3,650,000 | | | | 3,751,406 | |
| Atlanta Arpt–PFC | | 5.00% | | | 1/1/2029 | | Aa3 | | | 2,500,000 | | | | 2,547,552 | |
| Atlanta Arpt–PFC AMT | | 4.00% | | | 7/1/2034 | | Aa3 | | | 20,615,000 | | | | 18,881,320 | |
| Atlanta GA Arpt Passenger Fac Charge AMT | | 4.00% | | | 7/1/2035 | | Aa3 | | | 5,860,000 | | | | 5,412,850 | |
| Atlanta GA Arpt Passenger Fac Charge AMT | | 4.00% | | | 7/1/2037 | | Aa3 | | | 4,150,000 | | | | 3,809,937 | |
| Broward Cnty Fla Arpt Sys Rev Bds 2019 a AMT | | 5.00% | | | 10/1/2035 | | A1 | | | 2,660,000 | | | | 2,707,988 | |
| Broward Co Arpt AMT | | 5.00% | | | 10/1/2029 | | A1 | | | 1,120,000 | | | | 1,175,453 | |
| Broward Co Arpt AMT | | 5.00% | | | 10/1/2033 | | A1 | | | 6,130,000 | | | | 6,185,848 | |
| Broward Co Arpt AMT | | 5.00% | | | 10/1/2036 | | A1 | | | 2,615,000 | | | | 2,652,335 | |
| Broward Co Arpt AMT | | 5.00% | | | 10/1/2037 | | A1 | | | 4,000,000 | | | | 4,049,316 | |
| CA Muni Fin–LINXS AMT | | 5.00% | | | 6/30/2031 | | BBB- | (c) | | 3,195,000 | | | | 3,258,451 | |
| CA Muni Fin Auth–LINXS APM Proj AMT | | 5.00% | | | 12/31/2036 | | BBB- | (c) | | 3,215,000 | | | | 3,212,898 | |
| CA Muni Fin Auth–LINXS APM Proj AMT | | 5.00% | | | 12/31/2037 | | BBB- | (c) | | 7,000,000 | | | | 6,991,821 | |
| CA Sacramento Arpt AMT | | 5.00% | | | 7/1/2036 | | A+ | | | 5,645,000 | | | | 5,731,321 | |
| Central FL Expressway Auth | | 4.00% | | | 7/1/2037 | | A+ | | | 7,380,000 | | | | 6,940,909 | |
| | See Notes to Financial Statements. | 67 |
Schedule of Investments (continued)
INTERMEDIATE TAX FREE FUND September 30, 2022
| Investments | | Interest
Rate | | | Maturity
Date | | Credit
Rating:
S&P or
Moody’s(a) | | Principal
Amount | | | Fair
Value | |
| Transportation (continued) | | | | | | | | | | | | | | | |
| Central Tex Regl Mobility Auth | | 5.00% | | | 1/1/2025 | | BBB+ | | $ | 7,500,000 | | | $ | 7,630,794 | |
| Central TX Mobility Auth | | 4.00% | | | 1/1/2034 | | A- | | | 4,750,000 | | | | 4,456,375 | |
| Central TX Mobility Auth | | 4.00% | | | 1/1/2035 | | A- | | | 4,000,000 | | | | 3,719,079 | |
| Central TX Mobility Auth | | 4.00% | | | 1/1/2036 | | A- | | | 4,510,000 | | | | 4,146,653 | |
| Central TX Mobility Auth | | 5.00% | | | 1/1/2030 | | A- | | | 800,000 | | | | 835,136 | |
| Central TX Mobility Auth | | 5.00% | | | 1/1/2031 | | A- | | | 1,675,000 | | | | 1,748,565 | |
| Central TX Mobility Auth | | 5.00% | | | 1/1/2032 | | A- | | | 2,000,000 | | | | 2,087,839 | |
| Central TX Mobility Auth | | 5.00% | | | 1/1/2033 | | BBB+ | | | 3,010,000 | | | | 3,023,245 | |
| Central TX Tpk | | 5.00% | | | 8/15/2025 | | A- | | | 2,250,000 | | | | 2,273,733 | |
| Central TX Tpk | | 5.00% | | | 8/15/2026 | | A- | | | 2,500,000 | | | | 2,525,589 | |
| Central TX Tpk | | 5.00% | | | 8/15/2027 | | A- | | | 3,300,000 | | | | 3,332,940 | |
| Central TX Tpk | | 5.00% | | | 8/15/2028 | | A- | | | 3,705,000 | | | | 3,741,263 | |
| Central TX Tpk | | 5.00% | | | 8/15/2033 | | A- | | | 7,650,000 | | | | 7,691,180 | |
| Chicago Midway Arpt | | 4.00% | | | 1/1/2034 | | A- | | | 2,175,000 | | | | 2,049,629 | |
| Chicago Midway Arpt | | 5.00% | | | 1/1/2026 | | A- | | | 6,075,000 | | | | 6,178,679 | |
| Chicago Midway Arpt AMT | | 5.00% | | | 1/1/2023 | | A- | | | 3,000,000 | | | | 3,008,377 | |
| Chicago Midway Arpt AMT | | 5.00% | | | 1/1/2026 | | A- | | | 4,605,000 | | | | 4,652,833 | |
| Chicago Midway Arpt AMT | | 5.00% | | | 1/1/2030 | | A- | | | 5,000,000 | | | | 5,042,216 | |
| Chicago Midway Arpt AMT | | 5.00% | | | 1/1/2031 | | A- | | | 2,000,000 | | | | 2,033,007 | |
| Chicago O’Hare Arpt | | 4.00% | | | 1/1/2035 | | A+ | | | 15,000,000 | | | | 14,065,962 | |
| Chicago O’Hare Arpt | | 5.00% | | | 1/1/2031 | | A+ | | | 6,500,000 | | | | 6,666,367 | |
| Chicago O’Hare Arpt | | 5.00% | | | 1/1/2035 | | A+ | | | 7,000,000 | | | | 7,376,008 | |
| Chicago O’Hare Arpt AMT | | 5.00% | | | 1/1/2031 | | A+ | | | 9,000,000 | | | | 9,104,767 | |
| Chicago Trans Auth | | 4.00% | | | 12/1/2050 | | A+ | | | 3,500,000 | | | | 2,887,955 | |
| Delaware River Port Auth | | 5.00% | | | 1/1/2027 | | A | | | 1,835,000 | | | | 1,842,048 | |
| Delaware River Port Auth | | 5.00% | | | 1/1/2028 | | A+ | | | 7,500,000 | | | | 7,671,763 | |
| Delaware River Toll Brdg Commn | | 5.00% | | | 7/1/2030 | | A1 | | | 1,920,000 | | | | 2,054,712 | |
| Delaware River Toll Brdg Commn | | 5.00% | | | 7/1/2032 | | A1 | | | 2,025,000 | | | | 2,147,400 | |
| Denver City & Co Arpt AMT | | 5.00% | | | 11/15/2031 | | Aa3 | | | 16,500,000 | | | | 17,355,441 | |
| Denver City & Co Arpt AMT | | 5.00% | | | 12/1/2031 | | A1 | | | 15,000,000 | | | | 15,498,066 | |
| Denver City & Co Arpt AMT | | 5.00% | | | 12/1/2035 | | A1 | | | 5,000,000 | | | | 5,063,591 | |
| Denver RTD–Eagle P3 | | 4.00% | | | 1/15/2033 | | Baa1 | | | 850,000 | | | | 795,695 | |
| Denver RTD–Eagle P3 | | 4.00% | | | 7/15/2034 | | Baa1 | | | 7,650,000 | | | | 7,048,940 | |
| Denver RTD–Eagle P3 | | 4.00% | | | 7/15/2036 | | Baa1 | | | 700,000 | | | | 633,276 | |
| Denver RTD–Eagle P3 | | 5.00% | | | 1/15/2032 | | Baa1 | | | 950,000 | | | | 972,250 | |
| E470 Pub Hwy Auth | | 2.333%
(SOFR * .67 + .35% | )# | | 9/1/2039 | | A | | | 1,690,000 | | | | 1,673,144 | |
| 68 | See Notes to Financial Statements. |
Schedule of Investments (continued)
INTERMEDIATE TAX FREE FUND September 30, 2022
| Investments | | Interest
Rate | | | Maturity
Date | | Credit
Rating:
S&P or
Moody’s(a) | | Principal
Amount | | | Fair
Value | |
| Transportation (continued) | | | | | | | | | | | | | | | |
| Foothill / Eastern Corridor Toll Rd | | 4.00% | | | 1/15/2043 | | A- | | $ | 10,000,000 | | | $ | 8,437,217 | |
| Greater Orlando Aviation AMT | | 5.00% | | | 10/1/2029 | | A+ | | | 3,000,000 | | | | 3,203,776 | |
| Greater Orlando Aviation Auth AMT | | 4.00% | | | 10/1/2035 | | AA- | | | 3,000,000 | | | | 2,793,582 | |
| Greater Orlando Aviation Auth AMT | | 4.00% | | | 10/1/2037 | | AA- | | | 4,000,000 | | | | 3,676,688 | |
| Greater Orlando Aviation Auth AMT | | 4.00% | | | 10/1/2039 | | AA- | | | 2,900,000 | | | | 2,615,325 | |
| Hampton Roads Trans Commn | | 5.00% | | | 7/1/2032 | | AA | | | 1,180,000 | | | | 1,280,659 | |
| Hampton Roads Trans Commn | | 5.00% | | | 7/1/2033 | | AA | | | 1,000,000 | | | | 1,085,304 | |
| Harris Co Toll Rd | | 5.00% | | | 8/15/2031 | | Aa1 | | | 3,000,000 | | | | 3,219,779 | |
| HI Airport Sys AMT | | 5.00% | | | 7/1/2031 | | A+ | | | 1,275,000 | | | | 1,316,565 | |
| HI Airport Sys AMT | | 5.00% | | | 7/1/2033 | | A+ | | | 3,300,000 | | | | 3,373,451 | |
| HI Airport Sys AMT | | 5.00% | | | 7/1/2034 | | A+ | | | 2,000,000 | | | | 2,038,604 | |
| Houston Arpt–Continental Airlines AMT | | 4.75% | | | 7/1/2024 | | Ba3 | | | 4,655,000 | | | | 4,623,655 | |
| Houston Arpt–United Airlines AMT | | 5.00% | | | 7/15/2027 | | B- | (c) | | 1,000,000 | | | | 1,005,411 | |
| Houston Arpt–United Airlines AMT | | 5.00% | | | 7/15/2035 | | B | | | 1,455,000 | | | | 1,365,827 | |
| Houston Arpt AMT | | 5.00% | | | 7/1/2034 | | A1 | | | 4,850,000 | | | | 4,943,615 | |
| IL State GO | | 5.00% | | | 11/1/2025 | | BBB+ | | | 2,000,000 | | | | 2,034,388 | |
| IL Toll Hwy Auth | | 5.00% | | | 1/1/2027 | | AA- | | | 1,000,000 | | | | 1,018,207 | |
| IL Toll Hwy Auth | | 5.00% | | | 1/1/2028 | | AA- | | | 2,535,000 | | | | 2,580,755 | |
| Kansas City Dev Auth Arpt–Terminal Modernization AMT | | 5.00% | | | 3/1/2036 | | A2 | | | 5,000,000 | | | | 5,001,421 | |
| Kansas City Dev Auth Arpt–Terminal Modernization AMT | | 5.00% | | | 3/1/2038 | | A2 | | | 6,205,000 | | | | 6,209,230 | |
| Lee Cnty Arpt AMT | | 5.00% | | | 10/1/2029 | | A2 | | | 11,000,000 | | | | 11,503,901 | |
| Los Angeles Dept Arpts–LAX | | 5.00% | | | 5/15/2032 | | AA- | | | 5,870,000 | | | | 6,082,908 | |
| Los Angeles Dept Arpts–LAX AMT | | 5.00% | | | 5/15/2033 | | AA | | | 6,675,000 | | | | 6,873,523 | |
| Los Angeles Dept Arpts–LAX AMT | | 5.00% | | | 5/15/2033 | | AA | | | 4,500,000 | | | | 4,702,285 | |
| Los Angeles Dept Arpts–LAX AMT | | 5.00% | | | 5/15/2034 | | AA- | | | 2,930,000 | | | | 3,021,901 | |
| Los Angeles Dept Arpts–LAX AMT | | 5.00% | | | 5/15/2034 | | AA | | | 6,000,000 | | | | 6,242,468 | |
| Los Angeles Dept Arpts–LAX AMT | | 5.00% | | | 5/15/2035 | | AA- | | | 11,410,000 | | | | 11,638,708 | |
| Los Angeles Dept Arpts–LAX AMT | | 5.00% | | | 5/15/2036 | | AA- | | | 10,640,000 | | | | 10,825,945 | |
| Louisville Regl Airport AMT | | 5.00% | | | 7/1/2023 | | A+ | | | 2,250,000 | | | | 2,273,737 | |
| MA Port Auth AMT | | 5.00% | | | 7/1/2031 | | AA | | | 7,500,000 | | | | 7,857,202 | |
| MD EDC–CNX Marine Terminals | | 5.75% | | | 9/1/2025 | | BB | | | 5,000,000 | | | | 5,011,782 | |
| MD EDC–Port Covington | | 3.25% | | | 9/1/2030 | | NR | | | 500,000 | | | | 441,599 | |
| MD EDC–Port Covington | | 4.00% | | | 9/1/2040 | | NR | | | 1,000,000 | | | | 843,400 | |
| MD EDC–Ports America Chesapeake AMT | | 5.00% | | | 6/1/2044 | | Baa2 | | | 125,000 | | | | 126,122 | |
| MD EDC–Purple Line AMT | | 5.00% | | | 11/12/2028 | | Baa3 | | | 7,500,000 | | | | 7,710,379 | |
| | See Notes to Financial Statements. | 69 |
Schedule of Investments (continued)
INTERMEDIATE TAX FREE FUND September 30, 2022
| Investments | | Interest
Rate | | | Maturity
Date | | Credit
Rating:
S&P or
Moody’s(a) | | Principal
Amount | | | Fair
Value | |
| Transportation (continued) | | | | | | | | | | | | | | | |
| Met Airpt Auth–Dulles Metrorail | | 4.00% | | | 10/1/2035 | | A- | | $ | 1,000,000 | | | $ | 920,206 | |
| Met Airpt Auth–Dulles Metrorail | | 4.00% | | | 10/1/2036 | | A- | | | 1,500,000 | | | | 1,370,493 | |
| Met Airpt Auth–Dulles Metrorail | | 4.00% | | | 10/1/2037 | | A- | | | 1,500,000 | | | | 1,359,260 | |
| Met DC Arpt AMT | | 5.00% | | | 10/1/2031 | | AA- | | | 5,000,000 | | | | 5,127,365 | |
| Met Nashville Arpt Auth AMT | | 5.00% | | | 7/1/2036 | | A2 | | | 7,500,000 | | | | 7,618,930 | |
| Met Nashville Arpt Auth AMT | | 5.00% | | | 7/1/2037 | | A2 | | | 8,750,000 | | | | 8,866,868 | |
| Met Nashville Arpt Auth AMT | | 5.00% | | | 7/1/2038 | | A2 | | | 5,000,000 | | | | 5,055,086 | |
| Met Nashville Arpt Auth AMT | | 5.00% | | | 7/1/2039 | | A2 | | | 5,000,000 | | | | 5,042,744 | |
| Metropolitan DC Arpts AMT | | 5.00% | | | 10/1/2031 | | AA- | | | 4,000,000 | | | | 4,188,055 | |
| Miami Dade Co Aviation–MIA | | 5.00% | | | 10/1/2025 | | A1 | | | 3,690,000 | | | | 3,804,662 | |
| Miami Dade Co Aviation–MIA AMT | | 5.00% | | | 10/1/2022 | | A1 | | | 1,550,000 | | | | 1,550,000 | |
| Miami Dade Co Aviation–MIA AMT | | 5.00% | | | 10/1/2027 | | A1 | | | 5,145,000 | | | | 5,227,284 | |
| Miami Dade Co Aviation–MIA AMT | | 5.00% | | | 10/1/2028 | | A1 | | | 3,500,000 | | | | 3,555,273 | |
| Miami Dade Co Aviation–MIA AMT | | 5.00% | | | 10/1/2033 | | A1 | | | 4,240,000 | | | | 4,266,299 | |
| Miami Dade Co Expwy Auth | | 5.00% | | | 7/1/2023 | | A | | | 2,500,000 | | | | 2,525,457 | |
| Miami Dade Co Expwy Auth | | 5.00% | | | 7/1/2023 | | A | | | 2,000,000 | | | | 2,002,992 | |
| Miami Dade Co Expwy Auth | | 5.00% | | | 7/1/2024 | | A | | | 3,500,000 | | | | 3,542,017 | |
| Minneapolis / St Paul Met Arpts | | 5.00% | | | 1/1/2028 | | A+ | | | 3,500,000 | | | | 3,564,883 | |
| MTA NY | | 4.00% | | | 11/15/2032 | | A3 | | | 8,500,000 | | | | 8,023,012 | |
| MTA NY | | 5.00% | | | 11/1/2023 | | A3 | | | 5,640,000 | | | | 5,647,591 | |
| MTA NY | | 5.00% | | | 11/15/2028 | | A3 | | | 9,090,000 | | | | 9,368,656 | |
| MTA NY | | 5.00% | | | 11/15/2029 | | A3 | | | 5,000,000 | | | | 5,148,984 | |
| MTA NY | | 5.00% | | | 11/15/2031 | | A3 | | | 12,180,000 | | | | 12,206,193 | |
| MTA NY | | 5.00% | | | 11/15/2033 | | A3 | | | 4,025,000 | | | | 4,024,976 | |
| MTA NY | | 5.00% | | | 11/15/2035 | | A3 | | | 5,000,000 | | | | 4,990,194 | |
| MTA NY | | 5.00% | | | 11/15/2038 | | A3 | | | 1,500,000 | | | | 1,477,621 | |
| MTA NY | | 5.25% | | | 11/15/2028 | | A3 | | | 6,760,000 | | | | 6,955,320 | |
| MTA NY | | 5.25% | | | 11/15/2035 | | A3 | | | 7,500,000 | | | | 7,547,662 | |
| NC Tpk Auth–Triangle Exprs | | 5.00% | | | 1/1/2032 | | BBB | | | 1,000,000 | | | | 1,013,546 | |
| NC Tpk Auth–Triangle Exprs (AGM) | | 4.00% | | | 1/1/2037 | | AA | | | 12,895,000 | | | | 12,159,382 | |
| NC Tpk Auth–Triangle Exprs (AGM) | | 4.00% | | | 1/1/2038 | | AA | | | 9,000,000 | | | | 8,490,808 | |
| NC Tpk Auth–Triangle Exprs (AGM) | | 5.00% | | | 1/1/2031 | | AA | | | 1,000,000 | | | | 1,044,734 | |
| New York St Twy Auth Gen Rev Bds | | 4.00% | | | 1/1/2037 | | A1 | | | 11,770,000 | | | | 11,200,744 | |
| Niagara Frontier Trsp–Buffalo Intl Arpt AMT | | 5.00% | | | 4/1/2023 | | A3 | | | 3,000,000 | | | | 3,021,177 | |
| Niagara Frontier Trsp–Buffalo Intl Arpt AMT | | 5.00% | | | 4/1/2027 | | A3 | | | 3,185,000 | | | | 3,223,852 | |
| Niagara Frontier Trsp–Buffalo Intl Arpt AMT | | 5.00% | | | 4/1/2030 | | A3 | | | 365,000 | | | | 378,253 | |
| Niagara Frontier Trsp–Buffalo Intl Arpt AMT | | 5.00% | | | 4/1/2031 | | A3 | | | 300,000 | | | | 308,989 | |
| 70 | See Notes to Financial Statements. |
Schedule of Investments (continued)
INTERMEDIATE TAX FREE FUND September 30, 2022
| Investments | | Interest
Rate | | | Maturity
Date | | Credit
Rating:
S&P or
Moody’s(a) | | Principal
Amount | | | Fair
Value | |
| Transportation (continued) | | | | | | | | | | | | | | | |
| Niagara Frontier Trsp–Buffalo Intl Arpt AMT | | 5.00% | | | 4/1/2032 | | A3 | | $ | 775,000 | | | $ | 795,434 | |
| Niagara Frontier Trsp–Buffalo Intl Arpt AMT | | 5.00% | | | 4/1/2034 | | A3 | | | 865,000 | | | | 881,888 | |
| NJ EDA–Goethals Brdg AMT | | 5.125% | | | 1/1/2034 | | BBB+ | | | 5,010,000 | | | | 5,023,667 | |
| NJ Tpk Auth | | 5.00% | | | 1/1/2029 | | AA- | | | 5,000,000 | | | | 5,134,096 | |
| NJ Tpk Auth | | 5.00% | | | 1/1/2031 | | AA- | | | 5,000,000 | | | | 5,149,685 | |
| NJ Tpk Auth | | 5.00% | | | 1/1/2031 | | AA- | | | 5,000,000 | | | | 5,205,041 | |
| NJ Tpk Auth | | 5.00% | | | 1/1/2033 | | AA- | | | 2,100,000 | | | | 2,197,658 | |
| NJ Tpk Auth | | 5.00% | | | 1/1/2034 | | AA- | | | 1,500,000 | | | | 1,580,066 | |
| NJ Trans Trust Fund | | 4.00% | | | 6/15/2038 | | A3 | | | 3,000,000 | | | | 2,646,749 | |
| NJ Trans Trust Fund | | 4.00% | | | 6/15/2039 | | A3 | | | 6,000,000 | | | | 5,250,314 | |
| NJ Trans Trust Fund | | 5.00% | | | 6/15/2028 | | A+ | | | 6,275,000 | | | | 6,516,249 | |
| NJ Trans Trust Fund | | 5.00% | | | 6/15/2032 | | A3 | | | 6,960,000 | | | | 7,220,438 | |
| NJ Trans Trust Fund | | 5.00% | | | 6/15/2034 | | A3 | | | 10,000,000 | | | | 10,145,358 | |
| NJ Trans Trust Fund | | 5.00% | | | 6/15/2034 | | A3 | | | 2,625,000 | | | | 2,669,392 | |
| NJ Trans Trust Fund | | 5.00% | | | 6/15/2035 | | A3 | | | 3,425,000 | | | | 3,476,222 | |
| NJ Trans Trust Fund | | 5.00% | | | 6/15/2036 | | A3 | | | 5,000,000 | | | | 5,061,915 | |
| North TX Twy Auth | | 4.00% | | | 1/1/2037 | | AA- | | | 8,740,000 | | | | 8,153,455 | |
| North TX Twy Auth | | 5.00% | | | 1/1/2023 | | NR | | | 1,985,000 | | | | 1,994,365 | |
| North TX Twy Auth | | 5.00% | | | 1/1/2023 | | AA- | | | 3,015,000 | | | | 3,028,635 | |
| North TX Twy Auth | | 5.00% | | | 1/1/2025 | | AA- | | | 5,000,000 | | | | 5,094,270 | |
| North TX Twy Auth | | 5.00% | | | 1/1/2031 | | A+ | | | 8,085,000 | | | | 8,221,257 | |
| North TX Twy Auth | | 5.00% | | | 1/1/2036 | | AA- | | | 5,000,000 | | | | 5,153,362 | |
| NV State Highway Rev | | 5.00% | | | 12/1/2030 | | AAA | | | 10,000,000 | | | | 10,678,959 | |
| NY Trans Dev Corp–Delta Airlines AMT | | 4.00% | | | 1/1/2036 | | Baa3 | | | 10,010,000 | | | | 8,852,305 | |
| NY Trans Dev Corp–Delta Airlines AMT | | 5.00% | | | 1/1/2036 | | Baa3 | | | 10,500,000 | | | | 10,075,701 | |
| NY Trans Dev Corp–Delta Airlines AMT | | 5.00% | | | 10/1/2040 | | Baa3 | | | 6,750,000 | | | | 6,341,512 | |
| NY Trans Dev Corp–Delta AMT | | 4.375% | | | 10/1/2045 | | Baa3 | | | 6,750,000 | | | | 5,672,767 | |
| NY Trans Dev Corp–Delta AMT | | 5.00% | | | 1/1/2031 | | Baa3 | | | 4,225,000 | | | | 4,174,495 | |
| NY Trans Dev Corp–Delta AMT | | 5.00% | | | 1/1/2033 | | Baa3 | | | 11,000,000 | | | | 10,735,618 | |
| NY Trans Dev Corp–Delta AMT | | 5.00% | | | 1/1/2034 | | Baa3 | | | 3,450,000 | | | | 3,345,887 | |
| NY Trans Dev Corp–JFK IAT | | 5.00% | | | 12/1/2030 | | Baa1 | | | 3,000,000 | | | | 3,130,560 | |
| NY Trans Dev Corp–JFK IAT | | 5.00% | | | 12/1/2031 | | Baa1 | | | 2,160,000 | | | | 2,225,806 | |
| NY Trans Dev Corp–JFK IAT | | 5.00% | | | 12/1/2032 | | Baa1 | | | 5,045,000 | | | | 5,164,962 | |
| NY Trans Dev Corp–JFK IAT | | 5.00% | | | 12/1/2035 | | Baa1 | | | 2,500,000 | | | | 2,523,497 | |
| NY Trans Dev Corp–JFK IAT AMT | | 5.00% | | | 12/1/2024 | | Baa1 | | | 750,000 | | | | 761,614 | |
| NY Trans Dev Corp–JFK IAT AMT | | 5.00% | | | 12/1/2027 | | Baa1 | | | 1,025,000 | | | | 1,047,515 | |
| NY Trans Dev Corp–JFK IAT AMT | | 5.00% | | | 12/1/2030 | | Baa1 | | | 10,000,000 | | | | 10,201,072 | |
| | See Notes to Financial Statements. | 71 |
Schedule of Investments (continued)
INTERMEDIATE TAX FREE FUND September 30, 2022
| Investments | | Interest
Rate | | | Maturity
Date | | Credit
Rating:
S&P or
Moody’s(a) | | Principal
Amount | | | Fair
Value | |
| Transportation (continued) | | | | | | | | | | | | | | | |
| NY Trans Dev Corp–JFK IAT AMT | | 5.00% | | | 12/1/2031 | | Baa1 | | $ | 2,150,000 | | | $ | 2,176,011 | |
| NY Trans Dev Corp–JFK IAT AMT | | 5.00% | | | 12/1/2033 | | Baa1 | | | 1,800,000 | | | | 1,792,371 | |
| NY Trans Dev Corp–LaGuardia Airport AMT | | 4.00% | | | 7/1/2031 | | Baa2 | | | 3,000,000 | | | | 2,775,208 | |
| NY Trans Dev Corp–LaGuardia Airport AMT | | 4.00% | | | 7/1/2032 | | Baa2 | | | 3,000,000 | | | | 2,740,138 | |
| NY Trans Dev Corp–LaGuardia Airport AMT | | 4.00% | | | 7/1/2033 | | Baa2 | | | 3,500,000 | | | | 3,177,965 | |
| NY Trans Dev Corp–LaGuardia Airport AMT | | 5.00% | | | 7/1/2034 | | Baa2 | | | 2,250,000 | | | | 2,262,416 | |
| NY Trans Dev Corp–LaGuardia Airport AMT | | 5.25% | | | 1/1/2050 | | Baa2 | | | 13,000,000 | | | | 12,620,575 | |
| NY Trans Dev Corp–TOGA AMT | | 5.00% | | | 1/1/2023 | | Baa3 | | | 750,000 | | | | 751,693 | |
| NY Twy Auth | | 5.00% | | | 1/1/2024 | | A1 | | | 1,960,000 | | | | 2,001,757 | |
| NY Twy Auth | | 5.00% | | | 1/1/2026 | | A1 | | | 5,115,000 | | | | 5,276,494 | |
| NY Twy Auth | | 5.00% | | | 1/1/2033 | | A1 | | | 3,405,000 | | | | 3,612,131 | |
| NYS Thruway–Service Area AMT | | 4.00% | | | 10/31/2041 | | BBB- | (c) | | 3,000,000 | | | | 2,480,222 | |
| NYS Thruway–Service Area Proj AMT | | 4.00% | | | 10/31/2034 | | BBB- | (c) | | 750,000 | | | | 665,777 | |
| Orlando & Orange Co Expwy Auth | | 5.00% | | | 7/1/2030 | | A+ | | | 10,000,000 | | | | 10,139,340 | |
| PA Tpk Commn | | 4.00% | | | 12/1/2036 | | A | | | 1,000,000 | | | | 944,301 | |
| PA Tpk Commn | | 4.00% | | | 12/1/2037 | | A | | | 2,500,000 | | | | 2,343,360 | |
| PA Tpk Commn | | 5.00% | | | 12/1/2022 | | A+ | | | 3,500,000 | | | | 3,510,322 | |
| PA Tpk Commn | | 5.00% | | | 12/1/2032 | | A1 | | | 1,500,000 | | | | 1,622,011 | |
| PA Tpk Commn | | 5.00% | | | 12/1/2033 | | A1 | | | 1,300,000 | | | | 1,396,117 | |
| PA Tpk Commn | | 5.00% | | | 12/1/2034 | | A1 | | | 1,200,000 | | | | 1,275,473 | |
| PA Tpk Commn | | 5.00% | | | 12/1/2035 | | A1 | | | 1,800,000 | | | | 1,902,026 | |
| Philadelphia Arpt AMT | | 5.00% | | | 7/1/2032 | | A2 | | | 3,660,000 | | | | 3,798,675 | |
| Phoenix Arpt | | 5.00% | | | 7/1/2036 | | Aa3 | | | 4,045,000 | | | | 4,187,548 | |
| Phoenix Arpt | | 5.00% | | | 7/1/2038 | | Aa3 | | | 5,000,000 | | | | 5,138,303 | |
| Phoenix Arpt AMT | | 5.00% | | | 7/1/2029 | | A1 | | | 1,500,000 | | | | 1,572,124 | |
| Phoenix Civic Impt Corp AR | | 5.00% | | | 7/1/2036 | | A1 | | | 5,000,000 | | | | 5,176,203 | |
| Pittsburgh Intl Airport AMT | | 4.00% | | | 1/1/2037 | | A2 | | | 5,000,000 | | | | 4,508,688 | |
| Port Auth NY & NJ | | 4.00% | | | 11/1/2037 | | AA- | | | 3,540,000 | | | | 3,377,663 | |
| Port Auth NY & NJ | | 5.00% | | | 12/1/2023 | | AA- | | | 5,300,000 | | | | 5,407,480 | |
| Port Auth NY & NJ | | 5.00% | | | 12/1/2025 | | AA- | | | 10,000,000 | | | | 10,206,231 | |
| Port Auth NY & NJ | | 5.00% | | | 10/15/2026 | | AA- | | | 5,605,000 | | | | 5,890,122 | |
| Port Auth NY & NJ AMT | | 3.00% | | | 10/1/2027 | | AA- | | | 6,405,000 | | | | 5,976,887 | |
| Port Auth NY & NJ AMT | | 4.00% | | | 7/15/2034 | | AA- | | | 2,250,000 | | | | 2,114,465 | |
| Port Auth NY & NJ AMT | | 4.00% | | | 7/15/2035 | | AA- | | | 2,250,000 | | | | 2,087,753 | |
| Port Auth NY & NJ AMT | | 4.00% | | | 7/15/2036 | | AA- | | | 1,500,000 | | | | 1,376,517 | |
| Port Auth NY & NJ AMT | | 4.00% | | | 7/15/2037 | | AA- | | | 2,000,000 | | | | 1,816,513 | |
| Port Auth NY & NJ AMT | | 4.00% | | | 7/15/2038 | | AA- | | | 3,000,000 | | | | 2,693,493 | |
| 72 | See Notes to Financial Statements. |
Schedule of Investments (continued)
INTERMEDIATE TAX FREE FUND September 30, 2022
| Investments | | Interest
Rate | | | Maturity
Date | | Credit
Rating:
S&P or
Moody’s(a) | | Principal
Amount | | | Fair
Value | |
| Transportation (continued) | | | | | | | | | | | | | | | |
| Port Auth NY & NJ AMT | | 5.00% | | | 9/15/2028 | | AA- | | $ | 4,000,000 | | | $ | 4,187,013 | |
| Port Auth NY & NJ AMT | | 5.00% | | | 11/1/2030 | | AA- | | | 4,100,000 | | | | 4,313,294 | |
| Port Auth NY & NJ AMT | | 5.00% | | | 10/15/2034 | | AA- | | | 9,170,000 | | | | 9,288,660 | |
| Port of Portland–Portland Intl Arpt AMT | | 5.00% | | | 7/1/2033 | | AA- | | | 6,920,000 | | | | 7,160,344 | |
| Port of Portland–Portland Intl Arpt AMT | | 5.00% | | | 7/1/2037 | | AA- | | | 2,420,000 | | | | 2,455,727 | |
| Port of Portland–Portland Intl Arpt AMT | | 5.00% | | | 7/1/2038 | | AA- | | | 3,250,000 | | | | 3,291,193 | |
| Port of Portland–Portland Intl Arpt AMT | | 5.00% | | | 7/1/2039 | | AA- | | | 3,330,000 | | | | 3,359,141 | |
| Port Seattle AMT | | 5.00% | | | 8/1/2033 | | AA- | | | 5,000,000 | | | | 5,208,901 | |
| Port Seattle AMT | | 5.00% | | | 8/1/2034 | | AA- | | | 4,500,000 | | | | 4,645,471 | |
| PR Hwy & Trans Auth(d) | | 5.00% | | | 7/1/2033 | | NR | | | 1,215,000 | | | | 246,038 | |
| PR Hwy & Trans Auth(d) | | 5.50% | | | 7/1/2023 | | NR | | | 4,305,000 | | | | 871,763 | |
| PR Hwy & Trans Auth(d) | | 5.50% | | | 7/1/2024 | | NR | | | 3,000,000 | | | | 607,500 | |
| PR Hwy & Trans Auth (AGC) | | 5.25% | | | 7/1/2036 | | AA | | | 1,560,000 | | | | 1,527,597 | |
| PR Hwy & Trans Auth (AGM) | | 5.25% | | | 7/1/2032 | | AA | | | 1,000,000 | | | | 990,156 | |
| Riverside Co Trsp Comm | | 4.00% | | | 6/1/2040 | | A | | | 2,000,000 | | | | 1,772,064 | |
| Sacramento Co Arpt AMT | | 5.00% | | | 7/1/2027 | | A+ | | | 5,950,000 | | | | 6,164,937 | |
| Sacramento Co Arpt AMT | | 5.00% | | | 7/1/2034 | | A+ | | | 4,000,000 | | | | 4,077,208 | |
| Salt Lake City Arpt AMT | | 5.00% | | | 7/1/2029 | | A | | | 3,000,000 | | | | 3,125,278 | |
| Salt Lake City Arpt AMT | | 5.00% | | | 7/1/2030 | | A | | | 2,275,000 | | | | 2,341,058 | |
| Salt Lake City Arpt AMT | | 5.00% | | | 7/1/2031 | | A | | | 3,000,000 | | | | 3,065,659 | |
| Salt Lake City Arpt AMT | | 5.00% | | | 7/1/2034 | | A | | | 14,645,000 | | | | 14,853,899 | |
| Salt Lake City Arpt AMT | | 5.00% | | | 7/1/2034 | | A | | | 4,455,000 | | | | 4,508,615 | |
| San Diego Arpt | | 4.00% | | | 7/1/2037 | | A | | | 2,000,000 | | | | 1,868,309 | |
| San Diego Arpt | | 4.00% | | | 7/1/2038 | | A | | | 2,000,000 | | | | 1,852,402 | |
| San Francisco Arpt AMT | | 5.00% | | | 5/1/2036 | | A+ | | | 4,245,000 | | | | 4,319,096 | |
| San Francisco Arpt AMT | | 5.00% | | | 5/1/2036 | | A+ | | | 3,195,000 | | | | 3,250,768 | |
| San Francisco Arpt AMT | | 5.00% | | | 5/1/2037 | | A+ | | | 15,565,000 | | | | 15,816,839 | |
| San Francisco Arpt AMT | | 5.00% | | | 5/1/2038 | | A+ | | | 6,015,000 | | | | 6,096,613 | |
| San Joaquin Hills Trsp | | 4.00% | | | 1/15/2034 | | A | | | 3,250,000 | | | | 3,037,135 | |
| San Joaquin Hills Trsp | | 4.00% | | | 1/15/2035 | | A | | | 1,730,000 | | | | 1,601,956 | |
| San Joaquin Hills Trsp | | 4.00% | | | 1/15/2036 | | A | | | 1,400,000 | | | | 1,286,853 | |
| San Jose Arpt | | 5.00% | | | 3/1/2026 | | A | | | 1,200,000 | | | | 1,227,299 | |
| San Jose Arpt | | 5.00% | | | 3/1/2027 | | A | | | 2,260,000 | | | | 2,310,913 | |
| San Jose Arpt | | 5.00% | | | 3/1/2028 | | A | | | 1,655,000 | | | | 1,691,999 | |
| San Jose Arpt AMT | | 5.00% | | | 3/1/2035 | | A | | | 1,500,000 | | | | 1,518,988 | |
| South Carolina Ports AMT | | 5.00% | | | 7/1/2032 | | A+ | | | 4,225,000 | | | | 4,346,224 | |
| | See Notes to Financial Statements. | 73 |
Schedule of Investments (continued)
INTERMEDIATE TAX FREE FUND September 30, 2022
| Investments | | Interest
Rate | | | Maturity
Date | | Credit
Rating:
S&P or
Moody’s(a) | | Principal
Amount | | | Fair
Value | |
| Transportation (continued) | | | | | | | | | | | | | | | |
| Triborough Brdg & Tunl Auth–Payroll Mobility Tax | | 5.00% | | | 8/15/2024 | | NR | | $ | 20,000,000 | | | $ | 20,674,268 | |
| TX Surface Trans Corp–I-635 | | 4.00% | | | 12/31/2033 | | Baa2 | | | 6,500,000 | | | | 5,938,406 | |
| TX Surface Trans Corp–I-635 | | 4.00% | | | 12/31/2034 | | Baa2 | | | 6,500,000 | | | | 5,874,809 | |
| TX Surface Trans Corp–I-635 | | 4.00% | | | 12/31/2035 | | Baa2 | | | 6,000,000 | | | | 5,369,776 | |
| TX Surface Trans Corp–I-635 | | 4.00% | | | 6/30/2036 | | Baa2 | | | 4,125,000 | | | | 3,676,061 | |
| TX Surface Trans Corp–I-635 | | 4.00% | | | 12/31/2036 | | Baa2 | | | 5,500,000 | | | | 4,879,230 | |
| VA Small Bus Fing–95 Express AMT | | 5.00% | | | 7/1/2032 | | BBB- | | | 7,050,000 | | | | 7,227,488 | |
| VA Small Bus Fing–95 Express AMT | | 5.00% | | | 1/1/2034 | | BBB- | | | 9,105,000 | | | | 9,263,445 | |
| VA Small Bus Fing–95 Express AMT | | 5.00% | | | 1/1/2038 | | BBB- | | | 7,465,000 | | | | 7,499,218 | |
| Wayne Co Arpt† | | 4.00% | | | 12/1/2027 | | A1 | | | 10,630,000 | | | | 10,572,481 | |
| Wayne Co Arpt AMT | | 5.00% | | | 12/1/2026 | | A1 | | | 1,590,000 | | | | 1,633,168 | |
| Wayne Co Arpt AMT | | 5.00% | | | 12/1/2027 | | A1 | | | 2,000,000 | | | | 2,049,339 | |
| Total | | | | | | | | | | | | | | 1,127,256,201 | |
| | | | | | | | | | | | | | | | |
| Utilities 12.75% | | | | | | | | | | | | | | | |
| Albuquerque Bernalillo Co Wtr Util | | 5.00% | | | 7/1/2024 | | AA | | | 2,645,000 | | | | 2,724,997 | |
| Amelia Co IDA–Waste Mgmt AMT | | 1.45% | | | 4/1/2027 | | A- | | | 2,500,000 | | | | 2,194,875 | |
| Appling Co Dev–Oglethorpe Power | | 1.50% | #(b) | | 1/1/2038 | | BBB+ | | | 1,250,000 | | | | 1,154,277 | |
| Bartow Co Dev–GA Power | | 2.875% | #(b) | | 8/1/2043 | | BBB+ | | | 6,500,000 | | | | 6,285,681 | |
| Black Belt Energy Gas Dist | | 4.00% | #(b) | | 12/1/2052 | | Baa1 | | | 11,100,000 | | | | 10,655,393 | |
| Black Belt Energy Gas Dist–RBC | | 4.00% | #(b) | | 7/1/2052 | | Aa1 | | | 6,000,000 | | | | 5,945,993 | |
| Burke Co Dev–Vogtle Proj | | 2.20% | | | 10/1/2032 | | BBB+ | | | 1,000,000 | | | | 895,280 | |
| CA Poll Ctl–Poseidon Res† | | 5.00% | | | 7/1/2039 | | Baa3 | | | 5,000,000 | | | | 4,738,776 | |
| CA Poll Ctl–Poseidon Res AMT† | | 5.00% | | | 7/1/2037 | | Baa3 | | | 5,570,000 | | | | 5,433,444 | |
| Central Plains–Goldman Sachs | | 5.00% | | | 9/1/2035 | | BBB+ | | | 3,435,000 | | | | 3,414,865 | |
| Central Plains–Goldman Sachs | | 5.00% | #(b) | | 5/1/2053 | | A2 | | | 25,000,000 | | | | 25,038,225 | |
| Chicago Wastewater | | 5.00% | | | 1/1/2029 | | A | | | 4,335,000 | | | | 4,554,465 | |
| Chicago Wastewater | | 5.00% | | | 1/1/2030 | | A | | | 6,500,000 | | | | 6,823,602 | |
| Chicago Water | | 5.00% | | | 11/1/2025 | | A | | | 2,625,000 | | | | 2,699,017 | |
| Chicago Water (AGM) | | 5.00% | | | 11/1/2034 | | AA | | | 6,275,000 | | | | 6,584,430 | |
| Chicago Water (AGM) | | 5.00% | | | 11/1/2035 | | AA | | | 5,000,000 | | | | 5,240,042 | |
| Chicago Water (AGM) | | 5.25% | | | 11/1/2030 | | AA | | | 5,510,000 | | | | 5,908,675 | |
| Cleveland Public Pwr (AGM) | | 4.00% | | | 11/15/2034 | | AA | | | 1,000,000 | | | | 1,001,843 | |
| Cleveland Public Pwr (AGM) | | 4.00% | | | 11/15/2036 | | AA | | | 1,000,000 | | | | 932,900 | |
| Cleveland Public Pwr (AGM) | | 5.00% | | | 11/15/2033 | | AA | | | 2,000,000 | | | | 2,164,229 | |
| DE EDA–NRG Energy | | 1.25% | #(b) | | 10/1/2040 | | BBB- | | | 7,500,000 | | | | 6,707,448 | |
| DE EDA–NRG Energy | | 1.25% | #(b) | | 10/1/2045 | | BBB- | | | 20,300,000 | | | | 18,154,826 | |
| 74 | See Notes to Financial Statements. |
Schedule of Investments (continued)
INTERMEDIATE TAX FREE FUND September 30, 2022
| Investments | | Interest
Rate | | | Maturity
Date | | Credit
Rating:
S&P or
Moody’s(a) | | Principal
Amount | | | Fair
Value | |
| Utilities (continued) | | | | | | | | | | | | | | | |
| Detroit Sewer | | 5.00% | | | 7/1/2034 | | A+ | | $ | 4,200,000 | | | $ | 4,293,632 | |
| Detroit Sewer | | 5.00% | | | 7/1/2035 | | A+ | | | 1,835,000 | | | | 1,873,998 | |
| Detroit Water (AGM) | | 5.00% | | | 7/1/2037 | | AA | | | 5,000,000 | | | | 5,081,503 | |
| FL DFC–Waste Pro AMT | | 3.00% | | | 6/1/2032 | | NR | | | 8,000,000 | | | | 6,219,498 | |
| Guam Waterworks | | 5.00% | | | 7/1/2036 | | A- | | | 1,000,000 | | | | 1,019,676 | |
| Guam Waterworks Auth | | 5.00% | | | 7/1/2029 | | A- | | | 1,000,000 | | | | 1,016,378 | |
| HI Dept Budget–Hawaiian Electric | | 3.20% | | | 7/1/2039 | | Baa1 | | | 11,120,000 | | | | 8,574,740 | |
| HI Dept Budget–Hawaiian Electric AMT | | 4.00% | | | 3/1/2037 | | Baa1 | | | 3,000,000 | | | | 2,717,308 | |
| Houston Util Sys | | 5.00% | | | 11/15/2023 | | AA | | | 4,000,000 | | | | 4,076,822 | |
| Houston Util Sys | | 5.00% | | | 11/15/2026 | | AA | | | 5,355,000 | | | | 5,536,100 | |
| Imperial Irrigation Dist | | 5.00% | | | 11/1/2032 | | AA- | | | 2,000,000 | | | | 2,105,429 | |
| IN Muni Pwr | | 5.00% | | | 1/1/2033 | | A+ | | | 5,210,000 | | | | 5,524,384 | |
| IN Muni Pwr | | 5.00% | | | 1/1/2034 | | A+ | | | 4,000,000 | | | | 4,231,018 | |
| KY Muni Pwr–Prarie State Proj | | 3.45% | #(b) | | 9/1/2042 | | Baa1 | | | 5,935,000 | | | | 5,677,262 | |
| KY Public Energy Auth–BP | | 4.00% | #(b) | | 1/1/2049 | | A2 | | | 6,375,000 | | | | 6,353,295 | |
| KY Public Energy Auth–Morgan Stanley | | 4.00% | #(b) | | 4/1/2048 | | A1 | | | 3,200,000 | | | | 3,193,595 | |
| KY Public Energy Auth–Morgan Stanley | | 4.00% | #(b) | | 8/1/2052 | | A1 | | | 8,800,000 | | | | 8,375,824 | |
| LA Env Facs–E Baton Rouge Swr | | 0.875% | #(b) | | 2/1/2046 | | A+ | | | 15,000,000 | | | | 13,761,123 | |
| Long Beach Nat Gas–ML | | 3.376%
(3 Mo. LIBOR * .67 + 1.43% | )# | | 11/15/2026 | | A2 | | | 4,000,000 | | | | 3,858,305 | |
| Long Island Power Auth | | 0.85% | #(b) | | 9/1/2050 | | A | | | 6,000,000 | | | | 5,349,863 | |
| Lower AL Gas Dist–Goldman Sachs | | 5.00% | | | 9/1/2031 | | A2 | | | 4,005,000 | | | | 4,090,667 | |
| Lower Colo Riv Auth–Transmn Contract | | 5.00% | | | 5/15/2034 | | A | | | 3,190,000 | | | | 3,378,395 | |
| Lower Colo Riv Auth–Transmn Contract | | 5.00% | | | 5/15/2035 | | A | | | 4,860,000 | | | | 5,121,401 | |
| Lower Colo Riv Auth–Transmn Contract | | 5.00% | | | 5/15/2036 | | A | | | 5,055,000 | | | | 5,310,409 | |
| Lower Colorado River Authority Transmission Services Corp | | 5.00% | | | 5/15/2036 | | A | | | 3,020,000 | | | | 3,172,589 | |
| Luzerne Co IDA–American Wtr AMT | | 2.45% | #(b) | | 12/1/2039 | | A+ | | | 4,000,000 | | | | 3,460,466 | |
| Main St Nat Gas–Citi | | 5.00% | #(b) | | 12/1/2052 | | A3 | | | 16,800,000 | | | | 16,795,340 | |
| Main St Nat Gas–Citibank | | 4.00% | #(b) | | 9/1/2052 | | A3 | | | 10,000,000 | | | | 9,390,255 | |
| Main St Nat Gas-Citadel† | | 4.00% | #(b) | | 8/1/2052 | | BBB- | | | 61,000,000 | | | | 57,421,960 | |
| Maricopa Co Poll Cntrl–El Paso Elec | | 3.60% | | | 2/1/2040 | | Baa2 | | | 5,085,000 | | | | 4,169,588 | |
| Maricopa Co Poll Cntrl–El Paso Elec | | 3.60% | | | 4/1/2040 | | Baa2 | | | 3,870,000 | | | | 3,169,359 | |
| Miami Dade Co Wtr & Swr | | 5.00% | | | 10/1/2043 | | AA- | | | 6,485,000 | | | | 6,773,967 | |
| Miami-Dade Co Wtr & Swr | | 4.00% | | | 10/1/2035 | | AA- | | | 5,000,000 | | | | 4,966,091 | |
| MO Joint Muni Elec Util Commn | | 5.00% | | | 1/1/2023 | | A2 | | | 2,000,000 | | | | 2,008,459 | |
| MO Joint Muni Elec Util Commn | | 5.00% | | | 1/1/2025 | | A2 | | | 1,500,000 | | | | 1,531,404 | |
| Modesto Irrigation Dist | | 5.00% | | | 7/1/2023 | | A+ | | | 1,780,000 | | | | 1,803,753 | |
| | See Notes to Financial Statements. | 75 |
Schedule of Investments (continued)
INTERMEDIATE TAX FREE FUND September 30, 2022
| Investments | | Interest
Rate | | | Maturity
Date | | Credit
Rating:
S&P or
Moody’s(a) | | Principal
Amount | | | Fair
Value | |
| Utilities (continued) | | | | | | | | | | | | | | | |
| Modesto Irrigation Dist | | 5.00% | | | 7/1/2024 | | A+ | | $ | 3,720,000 | | | $ | 3,774,056 | |
| Modesto Irrigation Dist | | 5.00% | | | 7/1/2025 | | A+ | | | 8,410,000 | | | | 8,523,464 | |
| Monroe Dev Auth–Oglethorpe Power | | 1.50% | #(b) | | 1/1/2039 | | BBB+ | | | 1,875,000 | | | | 1,731,415 | |
| Northern CA Gas–Goldman Sachs | | 4.00% | #(b) | | 7/1/2049 | | A2 | | | 7,500,000 | | | | 7,487,358 | |
| NYC Muni Water | | 4.00% | | | 6/15/2037 | | AA+ | | | 3,630,000 | | | | 3,485,160 | |
| Omaha Pub Pwr Dist | | 5.00% | | | 2/1/2029 | | AA | | | 5,000,000 | | | | 5,259,029 | |
| Orlando Util Commn | | 1.25% | #(b) | | 10/1/2046 | | AA | | | 10,000,000 | | | | 7,992,188 | |
| Pennsylvania Economic Development Financing Authority AMT | | 1.10% | #(b) | | 6/1/2031 | | A- | | | 5,000,000 | | | | 4,410,772 | |
| Philadelphia Gas Works | | 5.00% | | | 8/1/2026 | | A | | | 1,000,000 | | | | 1,039,950 | |
| Philadelphia Gas Works | | 5.00% | | | 8/1/2027 | | A | | | 1,000,000 | | | | 1,039,403 | |
| Philadelphia Gas Works | | 5.00% | | | 8/1/2028 | | A | | | 1,250,000 | | | | 1,323,207 | |
| Philadelphia Gas Works | | 5.00% | | | 8/1/2029 | | A | | | 1,700,000 | | | | 1,797,971 | |
| Philadelphia Gas Works | | 5.00% | | | 8/1/2030 | | A | | | 1,425,000 | | | | 1,503,586 | |
| Philadelphia Gas Works | | 5.00% | | | 10/1/2033 | | A | | | 2,390,000 | | | | 2,451,547 | |
| Philadelphia Water & Wastewater | | 5.00% | | | 11/1/2029 | | A | | | 3,185,000 | | | | 3,425,713 | |
| Piedmont Muni Pwr Agency | | 4.00% | | | 1/1/2033 | | A- | | | 7,300,000 | | | | 6,954,022 | |
| Piedmont Muni Pwr Agency | | 5.00% | | | 1/1/2034 | | A- | | | 13,660,000 | | | | 14,141,938 | |
| PR Aqueduct & Swr Auth† | | 4.00% | | | 7/1/2042 | | NR | | | 13,455,000 | | | | 10,628,954 | |
| PR Aqueduct & Swr Auth† | | 5.00% | | | 7/1/2025 | | NR | | | 3,500,000 | | | | 3,516,186 | |
| PR Aqueduct & Swr Auth† | | 5.00% | | | 7/1/2030 | | NR | | | 10,670,000 | | | | 10,478,849 | |
| PR Aqueduct & Swr Auth† | | 5.00% | | | 7/1/2033 | | NR | | | 850,000 | | | | 823,566 | |
| PR Aqueduct & Swr Auth† | | 5.00% | | | 7/1/2033 | | NR | | | 5,000,000 | | | | 4,844,509 | |
| PR Aqueduct & Swr Auth† | | 5.00% | | | 7/1/2037 | | NR | | | 6,000,000 | | | | 5,660,962 | |
| PR Elec Pwr Auth(d) | | 5.00% | | | 7/1/2037 | | D | (c) | | 1,035,000 | | | | 771,075 | |
| PR Elec Pwr Auth(d) | | 5.00% | | | 7/1/2042 | | D | (c) | | 2,390,000 | | | | 1,780,550 | |
| PR Elec Pwr Auth(d) | | 5.50% | | | 7/1/2038 | | D | (c) | | 2,350,000 | | | | 1,759,563 | |
| PR Elec Pwr Auth(d) | | 7.00% | | | 7/1/2033 | | D | (c) | | 4,000,000 | | | | 3,080,000 | |
| PR Elec Pwr Auth(d) | | 7.00% | | | 7/1/2040 | | D | (c) | | 725,000 | | | | 558,250 | |
| PR Elec Pwr Auth (AGM) | | 2.046%
(3 Mo. LIBOR * .67 + .52% | )# | | 7/1/2029 | | AA | | | 5,720,000 | | | | 5,359,150 | |
| Riverside Elec | | 5.00% | | | 10/1/2037 | | AA- | | | 4,000,000 | | | | 4,283,265 | |
| Riverside Elec | | 5.00% | | | 10/1/2038 | | AA- | | | 5,000,000 | | | | 5,328,501 | |
| Salt Verde Fin Corp–Citi | | 5.25% | | | 12/1/2026 | | A3 | | | 7,500,000 | | | | 7,718,339 | |
| Salt Verde Fin Corp–Citi | | 5.50% | | | 12/1/2029 | | A3 | | | 5,100,000 | | | | 5,356,410 | |
| San Antonio Elec & Gas | | 5.00% | | | 2/1/2029 | | Aa2 | | | 7,340,000 | | | | 7,787,639 | |
| SC Pub Service Auth–Santee Cooper | | 5.00% | | | 12/1/2032 | | A2 | | | 2,670,000 | | | | 2,775,771 | |
| SE AL Gas Dist | | 4.00% | #(b) | | 12/1/2051 | | A1 | | | 12,255,000 | | | | 11,375,796 | |
| 76 | See Notes to Financial Statements. |
Schedule of Investments (continued)
INTERMEDIATE TAX FREE FUND September 30, 2022
| Investments | | Interest
Rate | | | Maturity
Date | | Credit
Rating:
S&P or
Moody’s(a) | | Principal
Amount | | | Fair
Value | |
| Utilities (continued) | | | | | | | | | | | | | | | |
| SE AL Gas Dist-Goldman Sachs | | 4.00% | #(b) | | 11/1/2051 | | A2 | | $ | 16,890,000 | | | $ | 16,054,484 | |
| Seminole Co Wtr & Swr | | 5.00% | | | 10/1/2024 | | AA+ | | | 4,000,000 | | | | 4,141,296 | |
| Stockton PFA–Wastewater (BAM) | | 5.00% | | | 9/1/2024 | | AA | | | 1,000,000 | | | | 1,030,539 | |
| TEAC–Goldman Sachs | | 5.25% | | | 9/1/2024 | | A2 | | | 8,940,000 | | | | 9,060,384 | |
| TEAC–Goldman Sachs | | 5.625% | | | 9/1/2026 | | BBB | (c) | | 5,000,000 | | | | 5,226,722 | |
| Texas Municipal Power Agency (AGM) | | 3.00% | | | 9/1/2034 | | AA | | | 1,470,000 | | | | 1,251,894 | |
| Texas Municipal Power Agency (AGM) | | 3.00% | | | 9/1/2036 | | AA | | | 5,250,000 | | | | 4,316,246 | |
| Texas Water Dev Brd | | 3.00% | | | 10/15/2033 | | AAA | | | 4,000,000 | | | | 3,601,028 | |
| Transbay Pwr Auth | | 5.00% | | | 10/1/2030 | | A- | (c) | | 300,000 | | | | 327,824 | |
| Transbay Pwr Auth | | 5.00% | | | 10/1/2031 | | A- | (c) | | 300,000 | | | | 326,366 | |
| Transbay Pwr Auth | | 5.00% | | | 10/1/2032 | | A- | (c) | | 500,000 | | | | 540,332 | |
| Transbay Pwr Auth | | 5.00% | | | 10/1/2033 | | A- | (c) | | 900,000 | | | | 968,622 | |
| Transbay Pwr Auth | | 5.00% | | | 10/1/2034 | | A- | (c) | | 970,000 | | | | 1,037,045 | |
| Transbay Pwr Auth | | 5.00% | | | 10/1/2035 | | A- | (c) | | 900,000 | | | | 957,509 | |
| Transbay Pwr Auth | | 5.00% | | | 10/1/2037 | | A- | (c) | | 675,000 | | | | 706,734 | |
| Transbay Pwr Auth | | 5.00% | | | 10/1/2039 | | A- | (c) | | 1,400,000 | | | | 1,441,853 | |
| Transbay Pwr Auth | | 5.00% | | | 10/1/2040 | | A- | (c) | | 1,500,000 | | | | 1,536,977 | |
| TX Muni Gas Acq & Supply–Macquarie | | 5.00% | | | 12/15/2027 | | A3 | | | 4,375,000 | | | | 4,487,934 | |
| TX Muni Gas Acq & Supply–Macquarie | | 5.00% | | | 12/15/2029 | | A3 | | | 13,200,000 | | | | 13,603,751 | |
| TX Muni Gas Acq & Supply–Macquarie | | 5.00% | | | 12/15/2030 | | A3 | | | 6,500,000 | | | | 6,692,301 | |
| TX Muni Gas Acq & Supply–Macquarie | | 5.00% | | | 12/15/2031 | | A3 | | | 6,000,000 | | | | 6,159,724 | |
| TX Muni Gas Acq & Supply–Macquarie | | 5.00% | | | 12/15/2032 | | A3 | | | 12,400,000 | | | | 12,689,500 | |
| TX Muni Gas Acq & Supply–ML | | 5.25% | | | 12/15/2023 | | A2 | | | 2,925,000 | | | | 2,964,745 | |
| TX Muni Gas Acq & Supply–ML | | 6.25% | | | 12/15/2026 | | A2 | | | 11,780,000 | | | | 12,241,990 | |
| Western MN Muni Pwr Agy | | 5.00% | | | 1/1/2023 | | Aa2 | | | 1,500,000 | | | | 1,506,930 | |
| Total | | | | | | | | | | | | | | 643,757,983 | |
| Total Municipal Bonds (cost $5,317,312,821) | | | | | | | | 4,886,781,760 | |
| | See Notes to Financial Statements. | 77 |
Schedule of Investments (continued)
INTERMEDIATE TAX FREE FUND September 30, 2022
| Investments | | Interest
Rate# | | Interest
Rate
Reset
Date(g) | | Final
Maturity
Date | | Credit
Rating:
S&P or
Moody’s(a) | | Principal
Amount | | | Fair
Value | |
| SHORT-TERM INVESTMENTS 1.52% | | | | | | | | | | | | | | | | |
| | | | | | | | | | | | | | | | | |
| VARIABLE RATE DEMAND NOTES 1.52% |
| | | | | | | | | | | | | | | | | |
| Corporate-Backed 0.08% | | | | | | | | | | | | | | | | |
| Mobile IDB–AL Power | | 2.900% | | 10/3/2022 | | 12/1/2037 | | A1 | | $ | 4,000,000 | | | $ | 4,000,000 | |
| | | | | | | | | | | | | | | | | |
| Health Care 0.01% | | | | | | | | | | | | | | | | |
| OH State–Univ Hosp | | 2.800% | | 10/3/2022 | | 1/15/2049 | | A | | | 500,000 | | | | 500,000 | |
| | | | | | | | | | | | | | | | | |
| Tax Revenue 0.38% | | | | | | | | | | | | | | | | |
| NYC TFA–Future Tax | | 2.750% | | 10/3/2022 | | 11/1/2044 | | AAA | | | 19,055,000 | | | | 19,055,000 | |
| | | | | | | | | | | | | | | | | |
| Utilities 1.05% | | | | | | | | | | | | | | | | |
| Appling Co Dev–GA Power | | 2.960% | | 10/3/2022 | | 9/1/2041 | | BBB+ | | | 33,250,000 | | | | 33,250,000 | |
| Los Angeles Dept Wtr & Pwr Sys | | 2.450% | | 10/3/2022 | | 7/1/2051 | | Aa2 | | | 2,500,000 | | | | 2,500,000 | |
| NYC Muni Water | | 2.770% | | 10/3/2022 | | 6/15/2049 | | AA+ | | | 17,350,000 | | | | 17,350,000 | |
| Total | | | | | | | | | | | | | | | 53,100,000 | |
| Total Short-Term Investments (cost $76,655,000) | | | | | | | 76,655,000 | |
| Total Investments in Securities 98.32% (cost $5,393,967,821) | | | | | | | 4,963,436,760 | |
| Other Assets and Liabilities – Net(h) 1.68% | | | | | | | 84,578,371 | |
| Net Assets 100.00% | | | | | | | | | | | | | | $ | 5,048,015,131 | |
| AGC | | Insured by–Assured Guarantee Corp. |
| AGM | | Insured by–Assured Guaranty Municipal Corporation. |
| AMBAC | | Insured by–AMBAC Assurance Corporation. |
| AMT | | Income from the security may be subject to Alternative Minimum Tax. |
| BAM | | Insured by–Build America Mutual. |
| COPS | | Certificates of Participation. |
| CR | | Custodian Receipt. |
| FGIC | | Insured by–Financial Guaranty Insurance Company. |
| FHA | | Insured by–Federal Housing Administration. |
| FNMA | | Insured by–Federal National Mortgage Association. |
| GNMA | | Insured by–Government National Mortgage Association. |
| GTD | | Guaranteed. |
| LIBOR | | London Interbank Offered Rate. |
| MUNIPSA | | SIFMA Municipal Swap Index Yield. |
| NPFGC | | Insured by–National Public Finance Guarantee Corporation. |
| NR | | Not Rated. |
| SIFMA | | Insured by–Securities Industry and Financial Markets Association. |
| SOFR | | Secured Overnight Financing Rate. |
| TRIPS | | Tax Refund Intercept Programs. |
| | | |
| # | | Variable rate security. The interest rate represents the rate in effect at September 30, 2022. |
| † | | Security was purchased pursuant to Rule 144A under the Securities Act of 1933 and, unless registered under such Act or exempted from registration, may only be resold to qualified institutional buyers. At September 30, 2022, the total value of Rule 144A securities was $324,071,556, which represents 6.42% of net assets. |
| (a) | | Unaudited. |
| 78 | See Notes to Financial Statements. |
Schedule of Investments (concluded)
INTERMEDIATE TAX FREE FUND September 30, 2022
| (b) | | Variable Rate is Fixed to Float: Rate remains fixed or at Zero Coupon until designated future date. |
| (c) | | This investment has been rated by Fitch IBCA. |
| (d) | | Defaulted (non-income producing security). |
| (e) | | Level 3 Investment as described in Note 2(i) in the Notes to Financials. Security valued utilizing third party pricing information without adjustment. Such valuations are based on unobservable inputs. A significant change in third party information could result in a significantly lower or higher value of such Level 3 investments. |
| (f) | | Securities purchased on a when-issued basis (See Note 2(g)). |
| (g) | | The interest rate reset date shown represents the date in which the Fund has the right to sell a Variable Rate Demand Note (“VRDN”) back to the issuer for Principal Amount. The interest rate on the VRDN is generally reset daily based on the SIFMA Municipal Swap Index. |
| (h) | | Other Assets and Liabilities – Net include net unrealized appreciation/depreciation on futures contracts as follows: |
Futures Contracts at September 30, 2022:
| Type | | Expiration | | Contracts | | Position | | Notional
Amount | | | Notional
Value | | | Unrealized
Appreciation | |
| U.S. Long Bond | | December 2022 | | 512 | | Short | | $ | (70,111,392 | ) | | $ | (64,720,000 | ) | | $ | 5,391,392 | |
| | | | | | | | | | | | | | | | | | | |
The following is a summary of the inputs used as of September 30, 2022 in valuing the Fund’s investments carried at fair value(1):
| Investment Type(2) | | Level 1 | | | Level 2 | | | Level 3 | | | Total | |
| Long-Term Investments | | | | | | | | | | | | | | | | |
| Municipal Bonds | | | | | | | | | | | | | | | | |
| Corporate-Backed | | $ | – | | | $ | 469,022,301 | | | $ | 3,724,000 | | | $ | 472,746,301 | |
| Education | | | – | | | | 278,041,673 | | | | 15,628,613 | | | | 293,670,286 | |
| Health Care | | | – | | | | 589,723,012 | | | | 2,525,444 | | | | 592,248,456 | |
| Special Tax | | | – | | | | 108,069,144 | | | | 537,638 | | | | 108,606,782 | |
| Remaining Industries | | | – | | | | 3,419,509,935 | | | | – | | | | 3,419,509,935 | |
| Short-Term Investments | | | | | | | | | | | | | | | | |
| Variable Rate Demand Notes | | | – | | | | 76,655,000 | | | | – | | | | 76,655,000 | |
| Total | | $ | – | | | $ | 4,941,021,065 | | | $ | 22,415,695 | | | $ | 4,963,436,760 | |
| Other Financial Instruments | | | | | | | | | | | | | | | | |
| Futures Contracts | | | | | | | | | | | | | | | | |
| Assets | | $ | 5,391,392 | | | $ | – | | | $ | – | | | $ | 5,391,392 | |
| Liabilities | | | – | | | | – | | | | – | | | | – | |
| Total | | $ | 5,391,392 | | | $ | – | | | $ | – | | | $ | 5,391,392 | |
| (1) | | Refer to Note 2(i) for a description of fair value measurements and the three-tier hierarchy of inputs. |
| (2) | | See Schedule of Investments for fair values in each industry. The table above is presented by Investment Type. Industries are presented within an Investment Type should such Investment Type include securities classified as two or more levels within the three-tier fair value hierarchy. When applicable each Level 3 security is identified on the Schedule of Investments along with the valuation technique utilized. |
A reconciliation of Level 3 investments is presented when the Fund has a material amount of Level 3 investments at the beginning or end of the year in relation to the Fund’s net assets. Management has determined not to provide a reconciliation as the balance of Level 3 investments was not considered to be material to the Fund’s net assets at the beginning or end of the year.
| | See Notes to Financial Statements. | 79 |
Schedule of Investments
NATIONAL TAX FREE FUND September 30, 2022
| Investments | | Interest
Rate | | Maturity
Date | | Credit
Rating:
S&P or
Moody’s(a) | | Principal
Amount | | | Fair
Value | |
| LONG-TERM INVESTMENTS 99.67% | | | | | | | | | | | | | | |
| | | | | | | | | | | | | | | |
| MUNICIPAL BONDS 99.67% | | | | | | | | | | | | | | |
| | | | | | | | | | | | | | | |
| Corporate-Backed 9.19% | | | | | | | | | | | | | | |
| AR DFA–Big River Steel AMT† | | 4.75% | | 9/1/2049 | | Ba2 | | $ | 6,000,000 | | | $ | 5,074,817 | |
| AZ IDA | | 3.625% | | 5/20/2033 | | BBB | | | 8,492,489 | | | | 7,766,101 | |
| Black Belt Energy Gas Dist–Goldman Sachs | | 4.00% | #(b) | 10/1/2052 | | A2 | | | 2,725,000 | | | | 2,655,198 | |
| CA Poll Ctl–Poseidon Res AMT† | | 5.00% | | 11/21/2045 | | Baa3 | | | 15,775,000 | | | | 14,849,738 | |
| CA Poll Ctl–Waste Mgmt AMT | | 4.30% | | 7/1/2040 | | A- | | | 2,575,000 | | | | 2,497,048 | (c) |
| Fort Bend IDC–NRG Energy | | 4.75% | | 5/1/2038 | | Baa2 | | | 3,500,000 | | | | 3,270,478 | |
| Fort Bend IDC–NRG Energy | | 4.75% | | 11/1/2042 | | Baa2 | | | 1,370,000 | | | | 1,246,088 | |
| Gloucester Co Poll Ctl–Logan AMT | | 5.00% | | 12/1/2024 | | NR | | | 500,000 | | | | 505,631 | |
| Hoover IDA–US Steel AMT | | 5.75% | | 10/1/2049 | | BB- | | | 1,100,000 | | | | 1,121,527 | |
| IA Fin Auth–Alcoa | | 4.75% | | 8/1/2042 | | BB+ | | | 5,000,000 | | | | 4,478,057 | |
| IA Fin Auth–Iowa Fertilizer Co | | 4.00% | #(b) | 12/1/2050 | | BBB- | | | 4,600,000 | | | | 4,181,962 | |
| IA Fin Auth–Iowa Fertilizer Co | | 5.00% | #(b) | 12/1/2050 | | BBB- | | | 15,000,000 | | | | 13,583,314 | |
| IN Fin Auth–OVEC | | 2.50% | | 11/1/2030 | | Baa3 | | | 1,000,000 | | | | 847,294 | |
| IN Fin Auth–OVEC | | 3.00% | | 11/1/2030 | | Baa3 | | | 1,000,000 | | | | 876,745 | |
| IN Fin Auth–OVEC | | 3.00% | | 11/1/2030 | | Baa3 | | | 3,600,000 | | | | 3,182,886 | |
| IN Fin Auth–US Steel | | 4.125% | | 12/1/2026 | | BB- | | | 1,625,000 | | | | 1,573,894 | |
| LA Env Facs–Entergy | | 2.50% | | 4/1/2036 | | A | | | 11,390,000 | | | | 8,521,264 | |
| LA Env Facs–Westlake Chem | | 3.50% | | 11/1/2032 | | BBB | | | 26,455,000 | | | | 24,249,457 | |
| LA St John Parish–Marathon Oil | | 2.00% | #(b) | 6/1/2037 | | BBB- | | | 9,555,000 | | | | 9,486,155 | |
| LA St John Parish–Marathon Oil | | 2.10% | #(b) | 6/1/2037 | | BBB- | | | 8,000,000 | | | | 7,800,294 | |
| LA St John Parish–Marathon Oil | | 2.20% | #(b) | 6/1/2037 | | BBB- | | | 1,810,000 | | | | 1,679,530 | |
| LA St John Parish–Marathon Oil | | 2.375% | #(b) | 6/1/2037 | | BBB- | | | 3,125,000 | | | | 2,919,034 | |
| Love Field Arpt–Southwest Airlines | | 5.00% | | 11/1/2028 | | Baa1 | | | 2,845,000 | | | | 2,846,788 | |
| Maricopa Co IDA–Commercial Metals AMT† | | 4.00% | | 10/15/2047 | | BB+ | | | 2,000,000 | | | | 1,538,556 | |
| Matagorda Co Nav Dist–AEP TX Central | | 2.60% | | 11/1/2029 | | A- | | | 11,100,000 | | | | 9,552,414 | |
| MD EDC–AFCO AMT | | 4.00% | | 7/1/2039 | | BBB | | | 5,625,000 | | | | 4,884,731 | (c) |
| MD EDC–Chesapeake Bay Hyatt(d) | | 5.00% | | 12/1/2016 | | NR | | | 855,000 | | | | 513,000 | |
| Mission Econ Dev Corp–Natgasoline AMT† | | 4.625% | | 10/1/2031 | | BB- | | | 5,250,000 | | | | 5,179,751 | |
| National Fin Auth NH–Covanta† | | 4.625% | | 11/1/2042 | | B | | | 1,500,000 | | | | 1,289,303 | |
| NH National Fin Auth–Covanta† | | 3.625% | #(b) | 7/1/2043 | | B | | | 690,000 | | | | 526,294 | |
| NH National Fin Auth–Covanta AMT† | | 3.75% | #(b) | 7/1/2045 | | B | | | 1,315,000 | | | | 1,021,099 | |
| NH National Fin Auth–Covanta AMT† | | 4.875% | | 11/1/2042 | | B | | | 5,000,000 | | | | 4,444,551 | |
| NH National Fin Auth–Hsg Sec | | 4.125% | | 1/20/2034 | | BBB | | | 6,925,942 | | | | 6,422,062 | |
| NH National Fin Auth–NY Electric & Gas AMT | | 4.00% | | 12/1/2028 | | A- | | | 5,000,000 | | | | 4,925,461 | |
| 80 | See Notes to Financial Statements. |
Schedule of Investments (continued)
NATIONAL TAX FREE FUND September 30, 2022
| Investments | | Interest
Rate | | Maturity
Date | | Credit
Rating:
S&P or
Moody’s(a) | | Principal
Amount | | | Fair
Value | |
| Corporate-Backed (continued) | | | | | | | | | | | | | | |
| Niagara Area Dev Corp–Covanta† | | 3.50% | | 11/1/2024 | | B1 | | $ | 2,500,000 | | | $ | 2,438,390 | |
| Niagara Area Dev Corp–Covanta AMT† | | 4.75% | | 11/1/2042 | | B1 | | | 5,000,000 | | | | 4,371,114 | |
| NY Energy RDA–NYSEGC | | 3.50% | | 10/1/2029 | | A- | | | 1,200,000 | | | | 1,142,131 | |
| NY Env Facs–Casella Waste AMT | | 2.75% | #(b) | 9/1/2050 | | B | | | 1,300,000 | | | | 1,215,277 | |
| NY Env Facs–Casella Waste AMT† | | 3.125% | #(b) | 12/1/2044 | | B | | | 3,000,000 | | | | 2,781,668 | |
| NY Liberty Dev Corp–7 WTC | | 3.00% | | 9/15/2043 | | Aaa | | | 13,500,000 | | | | 9,913,882 | |
| NY Trans Dev Corp–American Airlines AMT | | 5.25% | | 8/1/2031 | | B- | | | 970,000 | | | | 970,595 | |
| NY Trans Dev Corp–American Airlines AMT | | 5.375% | | 8/1/2036 | | B- | | | 1,500,000 | | | | 1,471,931 | |
| NYC IDA–TRIPS | | 5.00% | | 7/1/2028 | | BBB+ | | | 11,005,000 | | | | 11,038,046 | |
| OH Air Dev Auth–AEP | | 2.40% | #(b) | 12/1/2038 | | BBB+ | | | 1,665,000 | | | | 1,452,107 | |
| OH Air Dev Auth–AEP AMT | | 2.10% | #(b) | 7/1/2028 | | BBB+ | | | 5,000,000 | | | | 4,765,952 | |
| OH Air Dev Auth–AEP AMT | | 2.50% | #(b) | 8/1/2040 | | BBB+ | | | 2,500,000 | | | | 2,177,356 | |
| OH Air Dev Auth–AEP AMT | | 2.60% | #(b) | 6/1/2041 | | BBB+ | | | 1,960,000 | | | | 1,718,618 | |
| OH Air Dev Auth–OVEC | | 3.25% | | 9/1/2029 | | Baa3 | | | 3,450,000 | | | | 3,164,403 | |
| OH Air Quality–AMG Vanadium AMT† | | 5.00% | | 7/1/2049 | | B- | | | 4,630,000 | | | | 4,100,960 | |
| PA EDA–Covanta AMT† | | 3.25% | | 8/1/2039 | | B | | | 5,535,000 | | | | 4,040,816 | |
| Parish of St James–Nustar Logistics† | | 6.10% | #(b) | 12/1/2040 | | BB- | | | 3,250,000 | | | | 3,464,258 | |
| Parish of St James–Nustar Logistics† | | 6.35% | | 7/1/2040 | | BB- | | | 3,250,000 | | | | 3,472,778 | |
| Parish of St James–Nustar Logistics† | | 6.35% | | 10/1/2040 | | BB- | | | 2,500,000 | | | | 2,671,368 | |
| Phenix City–Meadwestvaco AMT | | 4.125% | | 5/15/2035 | | BBB | | | 2,945,000 | | | | 2,850,487 | |
| Phenix City IDB–Meadwestvaco | | 3.625% | | 5/15/2030 | | BBB | | | 3,050,000 | | | | 2,930,845 | |
| Port Beaumont Nav Dis–Jefferson Rail AMT† | | 4.00% | | 1/1/2050 | | NR | | | 3,150,000 | | | | 2,307,034 | |
| Port Beaumont Nav Dis-Jefferson Rail AMT† | | 3.00% | | 1/1/2050 | | NR | | | 5,500,000 | | | | 3,269,922 | |
| Richland Co Env Impt–Intl Paper | | 3.875% | | 4/1/2023 | | BBB | | | 6,625,000 | | | | 6,608,286 | |
| Salem Co Poll Ctl–Chambers AMT | | 5.00% | | 12/1/2023 | | NR | | | 4,965,000 | | | | 5,020,550 | |
| Selma IDB–Intl Paper | | 2.00% | #(b) | 11/1/2033 | | BBB | | | 2,000,000 | | | | 1,926,369 | |
| Spring Valley Community Infrastructure District No. 1† | | 3.75% | | 9/1/2051 | | NR | | | 4,375,000 | | | | 3,086,762 | |
| St James Parish–Nustar Logistics† | | 5.85% | #(b) | 8/1/2041 | | BB- | | | 1,000,000 | | | | 1,026,593 | |
| Sumter Co IDA–Enviva Inc AMT | | 6.00% | #(b) | 7/15/2052 | | B+ | | | 10,000,000 | | | | 9,199,386 | |
| Tuscaloosa IDA–Hunt Refining† | | 4.50% | | 5/1/2032 | | NR | | | 3,503,450 | | | | 3,041,295 | |
| VA Small Bus Fing–Covanta AMT† | | 5.00% | #(b) | 1/1/2048 | | B | | | 910,000 | | | | 833,672 | |
| Valparaiso Facs–Pratt Paper AMT | | 7.00% | | 1/1/2044 | | NR | | | 2,000,000 | | | | 2,056,605 | |
| West Pace Coop Dist(d) | | 9.125% | | 5/1/2039 | | NR | | | 4,900,000 | | | | 3,724,000 | (c) |
| WI PFA–American Dream† | | 5.00% | | 12/1/2027 | | NR | | | 1,455,000 | | | | 1,274,394 | |
| WI PFA–American Dream† | | 6.50% | | 12/1/2037 | | NR | | | 3,000,000 | | | | 2,531,781 | |
| WI PFA–Celanese AMT | | 4.30% | | 11/1/2030 | | BBB | | | 1,035,000 | | | | 1,018,331 | |
| WI PFA–Fargo-Moorhead | | 4.00% | | 9/30/2051 | | Baa3 | | | 19,250,000 | | | | 14,275,303 | |
| | See Notes to Financial Statements. | 81 |
Schedule of Investments (continued)
NATIONAL TAX FREE FUND September 30, 2022
| Investments | | Interest
Rate | | Maturity
Date | | Credit
Rating:
S&P or
Moody’s(a) | | Principal
Amount | | | Fair
Value | |
| Corporate-Backed (continued) | | | | | | | | | | | | | | |
| WI PFA–Fargo-Moorhead | | 4.00% | | 3/31/2056 | | Baa3 | | $ | 8,480,000 | | | $ | 6,077,775 | |
| WI PFA–TRIPS AMT | | 5.00% | | 7/1/2042 | | BBB+ | | | 5,250,000 | | | | 5,210,976 | |
| WI Pub Fin Auth–Celanese | | 4.05% | | 11/1/2030 | | BBB | | | 500,000 | | | | 483,576 | |
| Total | | | | | | | | | | | | | 310,636,114 | |
| | | | | | | | | | | | | | | |
| Education 4.85% | | | | | | | | | | | | | | |
| Build NYC Res Corp–CUNY | | 5.00% | | 6/1/2034 | | Aa2 | | | 325,000 | | | | 330,801 | |
| CA Ed Facs–Chapman Univ | | 5.00% | | 4/1/2045 | | A2 | | | 5,000,000 | | | | 5,075,748 | |
| CA Sch Fin–Green Dot Charter† | | 5.00% | | 8/1/2045 | | BBB- | | | 1,500,000 | | | | 1,471,537 | |
| Cap Trust Ed–Advantage Charter Scho | | 5.00% | | 12/15/2049 | | Baa3 | | | 1,000,000 | | | | 934,036 | |
| Cap Trust Ed–Advantage Charter Scho | | 5.00% | | 12/15/2054 | | Baa3 | | | 1,030,000 | | | | 950,601 | |
| Carroll Co–KY Util Comp AMT | | 2.125% | | 10/1/2034 | | A1 | | | 7,500,000 | | | | 5,533,947 | |
| Chicago Brd Ed | | 5.00% | | 12/1/2044 | | BB | | | 1,750,000 | | | | 1,701,907 | |
| Chicago Brd Ed | | 5.00% | | 12/1/2046 | | BB | | | 3,500,000 | | | | 3,385,731 | |
| Dutchess Co LDC–Bard College† | | 5.00% | | 7/1/2045 | | BB+ | | | 1,000,000 | | | | 910,129 | |
| Dutchess Co LDC–Bard College† | | 5.00% | | 7/1/2051 | | BB+ | | | 1,500,000 | | | | 1,334,883 | |
| FL HI Ed–Nova Southeastern Univ | | 5.00% | | 4/1/2033 | | A- | | | 1,475,000 | | | | 1,511,150 | |
| FL HI Ed–Nova Southeastern Univ | | 5.00% | | 4/1/2036 | | A- | | | 2,000,000 | | | | 2,034,825 | |
| IA HI Ed–Des Moines Univ | | 5.00% | | 10/1/2038 | | BBB+ | | | 2,730,000 | | | | 2,730,593 | |
| IA Higher Ed–Des Moines Univ | | 5.00% | | 10/1/2039 | | BBB+ | | | 2,870,000 | | | | 2,861,858 | |
| IA Higher Ed–Des Moines Univ | | 5.00% | | 10/1/2040 | | BBB+ | | | 3,535,000 | | | | 3,503,085 | |
| IL Fin Auth–IL Inst of Tech | | 4.00% | | 9/1/2037 | | Baa3 | | | 3,135,000 | | | | 2,683,496 | |
| IL Fin Auth–IL Inst of Tech | | 4.00% | | 9/1/2039 | | Baa3 | | | 3,295,000 | | | | 2,760,109 | |
| IL Fin Auth–IL Inst of Tech | | 5.00% | | 9/1/2040 | | Baa3 | | | 2,020,000 | | | | 1,948,765 | |
| IN Fin Auth–OVEC | | 4.25% | | 11/1/2030 | | Baa3 | | | 5,695,000 | | | | 5,471,103 | |
| Iowa St Hi Ed–Des Moines Univ | | 5.00% | | 10/1/2047 | | BBB+ | | | 1,800,000 | | | | 1,721,543 | |
| LA PDA–Tulane Univ | | 5.00% | | 4/1/2045 | | A+ | | | 5,000,000 | | | | 5,049,229 | |
| LA PFA–Tulane Univ | | 4.00% | | 4/1/2050 | | A+ | | | 5,290,000 | | | | 4,414,115 | |
| MA Dfa–Olin Clg | | 5.00% | | 11/1/2038 | | A | | | 5,000,000 | | | | 5,027,516 | |
| MA DFA–Springfield Clg | | 4.00% | | 6/1/2035 | | BBB | | | 1,900,000 | | | | 1,729,132 | |
| MA DFA–Suffolk Univ | | 5.00% | | 7/1/2030 | | Baa2 | | | 1,500,000 | | | | 1,544,852 | |
| MA DFA–Suffolk Univ | | 5.00% | | 7/1/2032 | | Baa2 | | | 3,750,000 | | | | 3,825,692 | |
| MA DFA–Suffolk Univ | | 5.00% | | 7/1/2033 | | Baa2 | | | 1,250,000 | | | | 1,269,735 | |
| MA DFA–Suffolk Univ | | 5.00% | | 7/1/2034 | | Baa2 | | | 1,600,000 | | | | 1,616,547 | |
| Maricopa Co Poll Cntrl–So Cal Edison | | 2.40% | | 6/1/2035 | | A- | | | 8,255,000 | | | | 6,159,447 | |
| Miami Dade Cnty Ed Facs–Univ of Miami FL | | 5.00% | | 4/1/2053 | | A2 | | | 5,000,000 | | | | 4,973,809 | |
| Nashville Hlth & Ed–Lipscomb U | | 5.25% | | 10/1/2058 | | BBB- | | | 6,065,000 | | | | 5,889,645 | |
| NY Dorm–Mt Sinai Sch Med | | 5.00% | | 7/1/2040 | | A- | | | 5,000,000 | | | | 5,053,554 | |
| 82 | See Notes to Financial Statements. |
Schedule of Investments (continued)
NATIONAL TAX FREE FUND September 30, 2022
| Investments | | Interest
Rate | | Maturity
Date | | Credit
Rating:
S&P or
Moody’s(a) | | Principal
Amount | | | Fair
Value | |
| Education (continued) | | | | | | | | | | | | | | |
| NY Dorm–New School | | 4.00% | | 7/1/2052 | | A3 | | $ | 3,500,000 | | | $ | 2,729,956 | |
| NY Dorm–Pace Univ | | 5.00% | | 5/1/2029 | | BBB- | | | 245,000 | | | | 245,429 | |
| NY Dorm–The New School | | 4.00% | | 7/1/2047 | | A3 | | | 3,500,000 | | | | 2,789,556 | |
| NY Dorm–Touro Clg | | 5.00% | | 1/1/2047 | | NR | | | 6,600,000 | | | | 7,100,807 | |
| NY Dorm–Touro Clg | | 5.50% | | 1/1/2039 | | NR | | | 2,450,000 | | | | 2,538,772 | |
| NY Dorm–Yeshiva | | 5.00% | | 7/15/2042 | | BBB- | | | 3,720,000 | | | | 3,593,087 | |
| NY Dorm–Yeshiva | | 5.00% | | 7/15/2050 | | BBB- | | | 8,000,000 | | | | 7,512,764 | |
| OH Air Dev Auth–Duke Energy | | 4.00% | #(b) | 9/1/2030 | | BBB | | | 4,600,000 | | | | 4,515,407 | |
| Onondaga CO NY–Syracuse Univ | | 5.00% | | 12/1/2043 | | AA- | | | 8,000,000 | | | | 8,395,626 | |
| PA HI Ed–Drexel Univ (AGM) | | 4.00% | | 5/1/2041 | | AA | | | 3,425,000 | | | | 3,090,770 | |
| Univ of CT | | 5.25% | | 11/15/2047 | | A+ | | | 8,080,000 | | | | 8,538,624 | |
| Univ of Illinois (AGM) | | 4.00% | | 4/1/2038 | | AA | | | 4,965,000 | | | | 4,470,154 | |
| Univ of North Carolina–Wilmington | | 5.00% | | 6/1/2037 | | A1 | | | 7,055,000 | | | | 7,255,936 | |
| WI PFA–Wingate Univ | | 5.25% | | 10/1/2038 | | BBB- | | | 2,220,000 | | | | 2,159,936 | |
| WI PFA–Wingate Univ | | 5.25% | | 10/1/2043 | | BBB- | | | 1,000,000 | | | | 943,882 | |
| WV EDA–Wheeling Pwr AMT | | 3.00% | #(b) | 6/1/2037 | | A- | | | 2,800,000 | | | | 2,567,533 | |
| Total | | | | | | | | | | | | | 163,857,359 | |
| | | | | | | | | | | | | | | |
| Energy 0.42% | | | | | | | | | | | | | | |
| Main St Nat Gas–Macquarie | | 5.00% | | 5/15/2038 | | A3 | | | 3,745,000 | | | | 3,746,168 | |
| New Mexico Energy Acq Auth–RBC | | 5.00% | #(b) | 11/1/2039 | | Aa1 | | | 10,000,000 | | | | 10,282,779 | |
| Total | | | | | | | | | | | | | 14,028,947 | |
| | | | | | | | | | | | | | | |
| Financial Services 0.18% | | | | | | | | | | | | | | |
| MA Ed Fin Auth AMT | | 4.125% | | 7/1/2046 | | BBB | | | 5,755,000 | | | | 4,696,737 | |
| NJ Higher Ed Assistance Auth AMT | | 3.75% | | 12/1/2031 | | Aaa | | | 1,580,000 | | | | 1,539,961 | |
| Total | | | | | | | | | | | | | 6,236,698 | |
| | | | | | | | | | | | | | | |
| General Obligation 12.16% | | | | | | | | | | | | | | |
| Beaverton Sch Dist | | 5.00% | | 6/15/2036 | | AA+ | | | 8,000,000 | | | | 8,377,150 | |
| CA State GO | | 4.00% | | 9/1/2037 | | Aa2 | | | 5,000,000 | | | | 4,922,633 | |
| CA State GO | | 5.00% | | 4/1/2032 | | Aa2 | | | 2,450,000 | | | | 2,751,644 | |
| CA State GO | | 5.00% | | 8/1/2038 | | Aa2 | | | 3,700,000 | | | | 3,871,706 | |
| CA State GO | | 5.25% | | 8/1/2032 | | Aa2 | | | 7,500,000 | | | | 7,894,087 | |
| Chicago Brd Ed | | 5.00% | | 12/1/2029 | | BB | | | 2,000,000 | | | | 2,033,776 | |
| Chicago Brd Ed | | 5.00% | | 12/1/2030 | | BB | | | 2,070,000 | | | | 2,097,935 | |
| Chicago Brd Ed | | 5.00% | | 12/1/2031 | | BB | | | 1,000,000 | | | | 1,009,478 | |
| Chicago Brd Ed | | 5.00% | | 12/1/2032 | | BB | | | 1,250,000 | | | | 1,255,140 | |
| Chicago Brd Ed | | 5.00% | | 12/1/2033 | | BB | | | 1,750,000 | | | | 1,753,377 | |
| | See Notes to Financial Statements. | 83 |
Schedule of Investments (continued)
NATIONAL TAX FREE FUND September 30, 2022
| Investments | | Interest
Rate | | Maturity
Date | | Credit
Rating:
S&P or
Moody’s(a) | | Principal
Amount | | | Fair
Value | |
| General Obligation (continued) | | | | | | | | | | | | | | |
| Chicago Brd Ed | | 5.00% | | 12/1/2036 | | BB | | $ | 1,000,000 | | | $ | 986,059 | |
| Chicago Brd Ed | | 5.00% | | 12/1/2046 | | BB | | | 2,000,000 | | | | 1,937,175 | |
| Chicago Brd Ed | | 5.00% | | 12/1/2047 | | BB | | | 6,250,000 | | | | 5,883,190 | |
| Chicago Brd Ed | | 6.50% | | 12/1/2046 | | BB | | | 1,100,000 | | | | 1,166,246 | |
| Chicago Brd Ed† | | 7.00% | | 12/1/2046 | | BB | | | 1,200,000 | | | | 1,312,792 | |
| Chicago Brd Ed (AGM) | | 5.00% | | 12/1/2027 | | AA | | | 1,850,000 | | | | 1,917,330 | |
| Chicago Brd Ed (NPFGC)(FGIC) | | Zero Coupon | | 12/1/2030 | | Baa2 | | | 1,765,000 | | | | 1,180,675 | |
| Chicago GO | | 4.00% | | 1/1/2032 | | BBB+ | | | 9,500,000 | | | | 8,726,734 | |
| Chicago GO | | 4.00% | | 1/1/2035 | | BBB+ | | | 4,610,000 | | | | 4,090,188 | |
| Chicago GO | | 5.00% | | 1/1/2026 | | BBB+ | | | 6,145,000 | | | | 6,270,782 | |
| Chicago GO | | 5.00% | | 1/1/2029 | | BBB+ | | | 3,000,000 | | | | 3,044,740 | |
| Chicago GO | | 5.00% | | 1/1/2030 | | BBB+ | | | 2,400,000 | | | | 2,415,757 | |
| Chicago GO | | 5.50% | | 1/1/2033 | | BBB+ | | | 2,255,000 | | | | 2,264,213 | |
| Chicago GO | | 5.50% | | 1/1/2034 | | BBB+ | | | 2,400,000 | | | | 2,409,805 | |
| Chicago GO | | 5.50% | | 1/1/2037 | | BBB+ | | | 2,745,000 | | | | 2,753,342 | |
| Chicago GO | | 5.50% | | 1/1/2040 | | BBB+ | | | 2,500,000 | | | | 2,507,597 | |
| Chicago GO | | 5.50% | | 1/1/2042 | | BBB+ | | | 5,000,000 | | | | 5,013,102 | |
| Chicago GO | | 5.50% | | 1/1/2049 | | BBB+ | | | 13,265,000 | | | | 13,354,228 | |
| Chicago GO | | 5.625% | | 1/1/2030 | | BBB+ | | | 525,000 | | | | 535,552 | |
| Chicago GO | | 6.00% | | 1/1/2038 | | BBB+ | | | 19,430,000 | | | | 20,102,329 | |
| Chicago O’Hare Arpt AMT | | 5.00% | | 1/1/2052 | | A+ | | | 9,375,000 | | | | 9,255,396 | |
| Clark Co SD (AGM) | | 4.00% | | 6/15/2038 | | AA | | | 1,200,000 | | | | 1,134,351 | |
| Clark Co SD (AGM) | | 4.00% | | 6/15/2040 | | AA | | | 1,975,000 | | | | 1,802,264 | |
| Cook Co GO | | 5.00% | | 11/15/2030 | | A+ | | | 1,000,000 | | | | 1,048,263 | |
| Cook Co GO | | 5.00% | | 11/15/2031 | | A+ | | | 2,150,000 | | | | 2,239,601 | |
| Cook Co GO | | 5.00% | | 11/15/2034 | | A+ | | | 500,000 | | | | 515,656 | |
| Cook Co GO | | 5.00% | | 11/15/2035 | | A+ | | | 1,000,000 | | | | 1,026,366 | |
| CT State GO | | 3.00% | | 1/15/2034 | | Aa3 | | | 7,475,000 | | | | 6,474,300 | |
| CT State GO | | 3.00% | | 1/15/2038 | | Aa3 | | | 11,425,000 | | | | 9,206,026 | |
| CT State GO | | 3.00% | | 6/1/2038 | | Aa3 | | | 1,875,000 | | | | 1,497,111 | |
| CT State GO | | 3.00% | | 6/1/2039 | | Aa3 | | | 2,190,000 | | | | 1,702,625 | |
| CT State GO | | 3.00% | | 6/1/2040 | | Aa3 | | | 1,625,000 | | | | 1,238,353 | |
| CT State GO | | 4.00% | | 6/1/2037 | | Aa3 | | | 1,000,000 | | | | 933,768 | |
| CT State GO | | 4.00% | | 6/15/2037 | | Aa3 | | | 975,000 | | | | 911,426 | |
| CT State GO | | 4.00% | | 6/1/2039 | | Aa3 | | | 600,000 | | | | 554,712 | |
| CT State GO | | 5.00% | | 6/15/2032 | | Aa3 | | | 1,250,000 | | | | 1,340,131 | |
| CT State GO | | 5.00% | | 6/15/2033 | | Aa3 | | | 1,250,000 | | | | 1,332,655 | |
| 84 | See Notes to Financial Statements. |
Schedule of Investments (continued)
NATIONAL TAX FREE FUND September 30, 2022
| Investments | | Interest
Rate | | Maturity
Date | | Credit
Rating:
S&P or
Moody’s(a) | | Principal
Amount | | | Fair
Value | |
| General Obligation (continued) | | | | | | | | | | | | | | |
| CT State GO | | 5.00% | | 4/15/2036 | | Aa3 | | $ | 1,150,000 | | | $ | 1,221,152 | |
| CT State GO | | 5.00% | | 6/15/2038 | | Aa3 | | | 1,000,000 | | | | 1,050,617 | |
| CT State GO | | 5.00% | | 4/15/2039 | | Aa3 | | | 1,650,000 | | | | 1,728,049 | |
| Hamilton Co Sch Dist GO | | 4.00% | | 1/15/2055 | | Aa2 | | | 7,000,000 | | | | 6,082,347 | |
| Hillsborough Co | | 3.25% | | 8/1/2048 | | AAA | | | 7,690,000 | | | | 5,766,290 | |
| IL State GO | | 4.00% | | 10/1/2032 | | BBB+ | | | 2,000,000 | | | | 1,867,465 | |
| IL State GO | | 4.00% | | 10/1/2033 | | BBB+ | | | 2,500,000 | | | | 2,284,631 | |
| IL State GO | | 4.00% | | 10/1/2038 | | BBB+ | | | 2,500,000 | | | | 2,142,733 | |
| IL State GO | | 4.00% | | 10/1/2039 | | BBB+ | | | 7,500,000 | | | | 6,359,209 | |
| IL State GO | | 4.00% | | 11/1/2043 | | BBB+ | | | 1,470,000 | | | | 1,196,083 | |
| IL State GO | | 4.00% | | 11/1/2044 | | BBB+ | | | 2,745,000 | | | | 2,212,547 | |
| IL State GO | | 4.25% | | 10/1/2045 | | BBB+ | | | 6,000,000 | | | | 4,990,548 | |
| IL State GO | | 5.00% | | 3/1/2033 | | BBB+ | | | 5,000,000 | | | | 5,047,623 | |
| IL State GO | | 5.00% | | 1/1/2035 | | BBB+ | | | 6,200,000 | | | | 6,151,923 | |
| IL State GO | | 5.00% | | 5/1/2038 | | BBB+ | | | 4,515,000 | | | | 4,436,238 | |
| IL State GO | | 5.00% | | 1/1/2041 | | BBB+ | | | 3,580,000 | | | | 3,469,346 | |
| IL State GO | | 5.50% | | 5/1/2030 | | BBB+ | | | 5,345,000 | | | | 5,645,747 | |
| IL State GO | | 5.50% | | 7/1/2033 | | BBB+ | | | 9,470,000 | | | | 9,515,859 | |
| IL State GO | | 5.50% | | 7/1/2038 | | BBB+ | | | 5,345,000 | | | | 5,357,667 | |
| IL State GO | | 5.50% | | 5/1/2039 | | BBB+ | | | 8,250,000 | | | | 8,402,971 | |
| IL State GO(e) | | 5.50% | | 10/1/2039 | | NR | | | 6,000,000 | | | | 6,138,500 | |
| IL State GO | | 5.50% | | 3/1/2042 | | BBB+ | | | 5,250,000 | | | | 5,316,974 | |
| IL State GO | | 5.50% | | 3/1/2047 | | BBB+ | | | 10,950,000 | | | | 11,005,287 | |
| IL State GO | | 5.75% | | 5/1/2045 | | BBB+ | | | 2,600,000 | | | | 2,658,270 | |
| Irvine USD–Spl Tax (BAM) | | 5.00% | | 9/1/2056 | | AA | | | 500,000 | | | | 514,790 | |
| King Co Pub Hsp–Snoqualmie Vly Hsp | | 5.00% | | 12/1/2038 | | NR | | | 5,000,000 | | | | 4,615,026 | |
| Los Angeles USD | | 4.00% | | 7/1/2032 | | Aa3 | | | 3,750,000 | | | | 3,807,844 | |
| Luzerne Co GO (AGM) | | 5.00% | | 11/15/2029 | | AA | | | 4,215,000 | | | | 4,389,002 | |
| MA State GO | | 3.00% | | 2/1/2048 | | Aa1 | | | 12,500,000 | | | | 8,978,811 | |
| MI Strategic Fund–I-75 AMT (AGM) | | 4.25% | | 12/31/2038 | | AA | | | 2,500,000 | | | | 2,214,672 | |
| NJ State GO | | 4.00% | | 6/1/2031 | | A2 | | | 6,825,000 | | | | 6,883,019 | |
| NJ Trans Trust Fund | | Zero Coupon | | 12/15/2029 | | A3 | | | 15,365,000 | | | | 11,086,227 | |
| NYC GO | | 5.00% | | 8/1/2027 | | AA | | | 6,575,000 | | | | 6,672,167 | |
| NYC GO | | 5.25% | | 9/1/2043 | | AA | | | 6,500,000 | | | | 6,976,186 | |
| NYC GO | | 5.50% | | 5/1/2046 | | AA | | | 2,675,000 | | | | 2,910,633 | |
| NYC GO TCRS (BAM) | | 3.00% | | 3/1/2051 | | AA | | | 5,000,000 | | | | 3,487,773 | |
| PA State GO | | 4.00% | | 9/15/2030 | | Aa3 | | | 10,000,000 | | | | 10,087,418 | |
| | See Notes to Financial Statements. | 85 |
Schedule of Investments (continued)
NATIONAL TAX FREE FUND September 30, 2022
| Investments | | Interest
Rate | | Maturity
Date | | Credit
Rating:
S&P or
Moody’s(a) | | Principal
Amount | | | Fair
Value | |
| General Obligation (continued) | | | | | | | | | | | | | | |
| PA State GO | | 4.00% | | 3/1/2037 | | Aa3 | | $ | 4,255,000 | | | $ | 4,140,790 | |
| Philadelphia GO | | 5.00% | | 8/1/2036 | | A | | | 8,990,000 | | | | 9,350,987 | |
| Philadelphia GO | | 5.00% | | 8/1/2037 | | A | | | 3,250,000 | | | | 3,375,200 | |
| Philadelphia Sch Dist | | 4.00% | | 9/1/2038 | | A1 | | | 2,200,000 | | | | 2,008,213 | |
| Philadelphia Sch Dist | | 4.00% | | 9/1/2039 | | A1 | | | 5,600,000 | | | | 5,084,128 | |
| Philadelphia Sch Dist | | 5.00% | | 9/1/2037 | | A1 | | | 1,200,000 | | | | 1,225,998 | |
| PR Comwlth GO | | Zero Coupon | | 7/1/2024 | | NR | | | 123,388 | | | | 113,467 | |
| PR Comwlth GO | | Zero Coupon | | 7/1/2033 | | NR | | | 74,906 | | | | 41,417 | |
| PR Comwlth GO | | Zero Coupon | | 11/1/2043 | | NR | | | 1,840,169 | | | | 922,385 | |
| PR Comwlth GO | | 4.00% | | 7/1/2033 | | NR | | | 2,069,029 | | | | 1,824,127 | |
| PR Comwlth GO | | 4.00% | | 7/1/2035 | | NR | | | 1,031,707 | | | | 884,476 | |
| PR Comwlth GO | | 4.00% | | 7/1/2037 | | NR | | | 5,034,693 | | | | 4,144,464 | |
| PR Comwlth GO | | 4.00% | | 7/1/2046 | | NR | | | 5,000,000 | | | | 3,757,952 | |
| PR Comwlth GO | | 5.25% | | 7/1/2023 | | NR | | | 1,706,025 | | | | 1,714,034 | |
| PR Comwlth GO | | 5.375% | | 7/1/2025 | | NR | | | 5,160,996 | | | | 5,214,849 | |
| PR Comwlth GO | | 5.625% | | 7/1/2027 | | NR | | | 407,273 | | | | 416,246 | |
| PR Comwlth GO | | 5.625% | | 7/1/2029 | | NR | | | 400,666 | | | | 410,484 | |
| PR Comwlth GO | | 5.75% | | 7/1/2031 | | NR | | | 389,162 | | | | 397,565 | |
| San Francisco Arpt AMT | | 5.25% | | 5/1/2042 | | A+ | | | 4,000,000 | | | | 4,053,436 | |
| Stockton USD (AGM) | | 5.00% | | 7/1/2028 | | AA | | | 750,000 | | | | 750,670 | |
| Sweetwater UHSD (BAM) | | 5.00% | | 8/1/2027 | | AA | | | 500,000 | | | | 512,940 | |
| Tuscaloosa Co Brd of Ed | | 5.00% | | 8/1/2046 | | AA- | | | 5,000,000 | | | | 5,305,063 | |
| Union Co Util Auth–Covanta GTD AMT | | 4.75% | | 12/1/2031 | | AA+ | | | 3,970,000 | | | | 3,973,478 | |
| Wilkes Barre PA School District (BAM) | | 5.00% | | 4/15/2059 | | AA | | | 2,500,000 | | | | 2,608,266 | |
| Total | | | | | | | | | | | | | 410,954,045 | |
| | | | | | | | | | | | | | | |
| Health Care 13.89% | | | | | | | | | | | | | | |
| Allegheny County Health Network | | 4.00% | | 4/1/2037 | | A | | | 3,120,000 | | | | 2,844,927 | |
| Allen Co–Bon Secours Mercy Hlth | | 5.00% | | 12/1/2046 | | A+ | | | 8,000,000 | | | | 8,002,427 | |
| Antelope Valley Hlth | | 5.00% | | 3/1/2041 | | BBB | | | 3,000,000 | | | | 2,789,094 | |
| Antelope Valley Hlth | | 5.00% | | 3/1/2046 | | BBB | | | 2,615,000 | | | | 2,330,495 | |
| Appalachian Regl Hlth | | 4.00% | | 7/1/2046 | | BBB | | | 1,380,000 | | | | 1,103,578 | |
| Appalachian Regl Hlth | | 4.00% | | 7/1/2056 | | BBB | | | 1,125,000 | | | | 847,365 | |
| Baltimore Co–Riderwood Village | | 4.00% | | 1/1/2045 | | A | (f) | | 5,250,000 | | | | 4,738,185 | |
| Baltimore Co–Riderwood Village | | 4.00% | | 1/1/2050 | | A | (f) | | 1,500,000 | | | | 1,325,569 | |
| Berks Co IDA–Tower Hlth | | 4.00% | | 11/1/2038 | | BB- | | | 5,000,000 | | | | 3,215,060 | |
| Berks Co IDA–Tower Hlth | | 5.00% | | 11/1/2036 | | BB- | | | 5,000,000 | | | | 3,749,443 | |
| Berks Co IDA–Tower Hlth | | 5.00% | #(b) | 2/1/2040 | | BB- | | | 2,680,000 | | | | 2,515,378 | |
| 86 | See Notes to Financial Statements. |
Schedule of Investments (continued)
NATIONAL TAX FREE FUND September 30, 2022
| Investments | | Interest
Rate | | Maturity
Date | | Credit
Rating:
S&P or
Moody’s(a) | | Principal
Amount | | | Fair
Value | |
| Health Care (continued) | | | | | | | | | | | | | | |
| Berks Co IDA–Tower Hlth | | 5.00% | #(b) | 2/1/2040 | | BB- | | $ | 605,000 | | | $ | 510,163 | |
| Berks Co IDA–Tower Hlth | | 5.00% | | 11/1/2044 | | BB- | | | 10,000,000 | | | | 6,968,331 | |
| CA Hlth–Cedars-Sinai Med Ctr | | 3.00% | | 8/15/2051 | | AA- | | | 7,545,000 | | | | 5,227,138 | |
| CA Hlth–Sutter Hlth | | 4.00% | | 11/15/2042 | | A1 | | | 2,000,000 | | | | 1,790,394 | |
| CA Muni Fin–Cmnty Med Ctrs | | 5.00% | | 2/1/2047 | | A- | | | 6,940,000 | | | | 6,884,317 | |
| CA Stwde–Eskaton Pptys | | 5.25% | | 11/15/2034 | | BBB- | | | 1,875,000 | | | | 1,866,650 | |
| CA Stwde–Huntington Memorial Hosp | | 4.00% | | 7/1/2048 | | AA- | | | 4,500,000 | | | | 3,910,344 | |
| CA Stwde–John Muir Hlth | | 4.00% | | 12/1/2057 | | A+ | | | 2,500,000 | | | | 2,070,717 | |
| CA Stwde–Loma Linda Univ Med Ctr† | | 5.25% | | 12/1/2043 | | BB- | | | 4,510,000 | | | | 4,335,780 | |
| CA Stwde–Loma Linda Univ Med Ctr | | 5.50% | | 12/1/2054 | | BB- | | | 6,875,000 | | | | 6,914,158 | |
| CA Stwde–Loma Linda Univ Med Ctr† | | 5.50% | | 12/1/2058 | | BB- | | | 3,375,000 | | | | 3,249,969 | |
| City of Grand Forks-Altru Health | | 4.00% | | 12/1/2046 | | Baa2 | | | 1,125,000 | | | | 892,005 | |
| CO Hlth Fac Auth–CommonSpirit | | 4.00% | | 8/1/2038 | | A- | | | 1,875,000 | | | | 1,668,400 | |
| CO Hlth Facs-Adventhealth Obligated | | 4.00% | | 11/15/2043 | | AA | | | 20,000,000 | | | | 17,821,792 | |
| CO Hlth Facs–CommonSpirit | | 5.00% | | 8/1/2044 | | A- | | | 3,000,000 | | | | 2,910,757 | |
| Crawford Hsp Auth–Meadville Med | | 6.00% | | 6/1/2046 | | NR | | | 950,000 | | | | 957,209 | |
| Crawford Hsp Auth–Meadville Med | | 6.00% | | 6/1/2051 | | NR | | | 1,115,000 | | | | 1,121,623 | |
| CT Hlth–Nuvance | | 4.00% | | 7/1/2049 | | BBB+ | | | 9,325,000 | | | | 7,136,794 | |
| CT Hlth & Ed–Nuvance Hlth | | 4.00% | | 7/1/2041 | | BBB+ | | | 10,920,000 | | | | 8,847,882 | |
| CT Hlth & Ed–Yale New Haven Hsp | | 5.00% | | 7/1/2028 | | AA- | | | 500,000 | | | | 512,431 | |
| Cuyahoga Co Hsp–Metrohealth | | 5.00% | | 2/15/2057 | | BBB | | | 1,000,000 | | | | 937,175 | |
| Cuyahoga Co Hsp–Metrohealth | | 5.50% | | 2/15/2052 | | BBB | | | 8,925,000 | | | | 9,033,358 | |
| Cuyahoga Co Hsp–Metrohealth | | 5.50% | | 2/15/2057 | | BBB | | | 5,250,000 | | | | 5,303,540 | |
| Denver Hlth & Hsp Auth | | 5.25% | | 12/1/2045 | | BBB | | | 700,000 | | | | 700,714 | |
| Duluth Econ Dev Auth–Essentia Health | | 5.25% | | 2/15/2053 | | A- | | | 2,870,000 | | | | 2,873,292 | |
| Duluth Econ Dev Auth–Essentia Health | | 5.25% | | 2/15/2058 | | A- | | | 22,000,000 | | | | 22,025,236 | |
| Duluth EDA–Essentia Hlth | | 5.00% | | 2/15/2053 | | A- | | | 5,000,000 | | | | 4,912,470 | |
| Duluth EDA–St Lukes Hsp | | 5.25% | | 6/15/2052 | | BBB- | | | 5,000,000 | | | | 4,731,272 | |
| Fairview Health Services | | 5.00% | | 11/15/2049 | | A | | | 5,400,000 | | | | 5,330,049 | |
| FL DFC–UF Health Jacksonville (AGM) | | 4.00% | | 2/1/2046 | | AA | | | 2,360,000 | | | | 2,014,773 | |
| Gainesville & Hall Co Hsp–NE GA Hlth | | 5.00% | | 2/15/2030 | | A | | | 3,345,000 | | | | 3,502,995 | |
| Gainesville & Hall Co Hsp–NE GA Hlth | | 5.00% | | 2/15/2032 | | A | | | 5,545,000 | | | | 5,762,760 | |
| Genesee Co-Rochester Reg Hlth | | 5.25% | | 12/1/2052 | | BBB+ | | | 4,000,000 | | | | 3,851,135 | |
| Greenville Hlth Sys | | 5.00% | | 5/1/2034 | | A | | | 3,970,000 | | | | 3,994,753 | |
| Guadalupe Co–Seguin City Hsp | | 5.00% | | 12/1/2045 | | BB | | | 2,000,000 | | | | 1,796,306 | |
| Hillsborough Co IDA–Tampa General | | 4.00% | | 8/1/2045 | | Baa1 | | | 9,280,000 | | | | 7,479,720 | |
| Lee Memorial Hlth System | | 4.00% | | 4/1/2049 | | A+ | | | 5,500,000 | | | | 4,645,747 | |
| | See Notes to Financial Statements. | 87 |
Schedule of Investments (continued)
NATIONAL TAX FREE FUND September 30, 2022
| Investments | | Interest
Rate | | Maturity
Date | | Credit
Rating:
S&P or
Moody’s(a) | | Principal
Amount | | | Fair
Value | |
| Health Care (continued) | | | | | | | | | | | | | | |
| MA DFA–Boston Med Ctr | | 5.00% | | 7/1/2031 | | BBB | | $ | 1,980,000 | | | $ | 2,021,065 | |
| MA DFA–Boston Med Ctr | | 5.00% | | 7/1/2035 | | BBB | | | 5,115,000 | | | | 5,156,736 | |
| MA DFA–CareGroup | | 5.00% | | 7/1/2048 | | A | | | 4,000,000 | | | | 3,965,636 | |
| MA DFA–Partners Hlth | | 4.00% | | 7/1/2041 | | AA- | | | 4,000,000 | | | | 3,645,413 | |
| MA DFA–Wellforce Hlth | | 4.00% | | 7/1/2035 | | BBB+ | | | 2,000,000 | | | | 1,796,253 | |
| MA DFA–Wellforce Hlth | | 5.00% | | 7/1/2039 | | BBB+ | | | 2,685,000 | | | | 2,650,344 | |
| MA DFA–Wellforce Hlth (AGM) | | 4.00% | | 10/1/2045 | | AA | | | 1,685,000 | | | | 1,438,282 | |
| Martin Co Hlth–Cleveland Clinic | | 4.00% | | 1/1/2046 | | AA | | | 5,000,000 | | | | 4,388,242 | |
| MD Hlth & HI Ed–Adventist | | 5.50% | | 1/1/2046 | | Baa3 | | | 16,615,000 | | | | 16,754,501 | |
| MD Hlth & HI Ed–Doctors | | 5.00% | | 7/1/2038 | | A3 | | | 7,080,000 | | | | 7,074,410 | |
| MD Hlth & HI Ed–Mercy Med Ctr | | 5.00% | | 7/1/2036 | | BBB+ | | | 1,320,000 | | | | 1,327,874 | |
| MD Hlth & HI Ed–Mercy Med Ctr | | 5.00% | | 7/1/2038 | | BBB+ | | | 2,250,000 | | | | 2,248,224 | |
| MI Fin Auth–Trinity Health | | 4.00% | | 12/1/2049 | | AA- | | | 6,000,000 | | | | 5,190,708 | |
| MI Hosp Fin Auth–Ascension Hlth | | 5.00% | | 11/15/2047 | | AA+ | | | 4,000,000 | | | | 4,028,191 | |
| Montgomery Co–Dayton Childrens Hosp | | 4.00% | | 8/1/2051 | | A1 | | | 7,000,000 | | | | 5,966,853 | |
| Montgomery Co Hgr Ed–Thomas Jeff U | | 4.00% | | 9/1/2049 | | A | | | 3,960,000 | | | | 3,347,448 | |
| Montgomery Co Hosp–Premier | | 4.00% | | 11/15/2042 | | Baa1 | | | 8,440,000 | | | | 7,083,675 | |
| Montgomery Co IDA–Whitemarsh | | 5.375% | | 1/1/2050 | | NR | | | 1,070,000 | | | | 1,002,458 | |
| MT St Fac Fin Auth–Kalispell Med Ctr | | 5.00% | | 7/1/2043 | | BBB | | | 4,000,000 | | | | 3,942,689 | |
| MT St Fac Fin Auth–Kalispell Med Ctr | | 5.00% | | 7/1/2048 | | BBB | | | 5,760,000 | | | | 5,557,882 | |
| Muskingum Co Hsp–Genesis Hlthcare | | 5.00% | | 2/15/2044 | | BB+ | | | 2,650,000 | | | | 2,352,578 | |
| Nassau Co LEAC–Catholic Hlth LI | | 5.00% | | 7/1/2034 | | A- | | | 1,100,000 | | | | 1,110,653 | |
| Nassau Co LEAC–Catholic Hlth Svcs | | 5.00% | | 7/1/2029 | | A- | | | 1,000,000 | | | | 1,017,390 | |
| Nassau Co LEAC–Catholic Hlth Svcs | | 5.00% | | 7/1/2030 | | A- | | | 580,000 | | | | 589,681 | |
| Nassau Co LEAC–Catholic Hlth Svcs | | 5.00% | | 7/1/2031 | | A- | | | 1,620,000 | | | | 1,645,233 | |
| NE Ed Hlth–Immanuel | | 4.00% | | 1/1/2049 | | AA | (f) | | 10,000,000 | | | | 8,522,464 | |
| Niagara Area Dev Corp–Catholic Hlth | | 5.00% | | 7/1/2052 | | BB+ | | | 1,500,000 | | | | 1,198,743 | |
| NJ Hlth–St Peters Univ Hsp | | 5.75% | | 7/1/2037 | | BBB- | | | 4,900,000 | | | | 4,913,467 | |
| NJ Hlth–Univ Hosp (AGM) | | 5.00% | | 7/1/2029 | | AA | | | 135,000 | | | | 139,410 | |
| NY Dorm–Montefiore | | 4.00% | | 8/1/2036 | | BBB- | | | 1,450,000 | | | | 1,210,933 | |
| NY Dorm–Montefiore | | 4.00% | | 8/1/2038 | | BBB- | | | 4,725,000 | | | | 3,870,188 | |
| NY Dorm–Montefiore | | 5.00% | | 8/1/2033 | | BBB- | | | 1,140,000 | | | | 1,092,805 | |
| NY Dorm–Montefiore | | 5.00% | | 8/1/2034 | | BBB- | | | 1,010,000 | | | | 960,013 | |
| NY Dorm–Montefiore | | 5.00% | | 8/1/2035 | | BBB- | | | 1,000,000 | | | | 939,466 | |
| NY Dorm–Montefiore Ob Group | | 5.00% | | 8/1/2030 | | BBB- | | | 4,540,000 | | | | 4,476,454 | |
| NY Dorm–Orange Reg Med Ctr† | | 5.00% | | 12/1/2031 | | BBB- | | | 1,300,000 | | | | 1,287,876 | |
| NY Dorm–Orange Reg Med Ctr† | | 5.00% | | 12/1/2040 | | BBB- | | | 1,300,000 | | | | 1,188,157 | |
| 88 | See Notes to Financial Statements. |
Schedule of Investments (continued)
NATIONAL TAX FREE FUND September 30, 2022
| Investments | | Interest
Rate | | Maturity
Date | | Credit
Rating:
S&P or
Moody’s(a) | | Principal
Amount | | | Fair
Value | |
| Health Care (continued) | | | | | | | | | | | | | | |
| NY Dorm-Montefiore Medical Center | | 5.00% | | 8/1/2028 | | BBB- | | $ | 3,055,000 | | | $ | 3,064,960 | |
| NY Dorm Norwell Health(g) | | 5.00% | | 5/1/2052 | | A3 | | | 33,500,000 | | | | 33,172,993 | |
| OK DFA–OU Med | | 5.50% | | 8/15/2052 | | Ba2 | | | 8,590,000 | | | | 7,335,573 | |
| OK DFA–OU Med (AGM) | | 4.00% | | 8/15/2048 | | AA | | | 4,000,000 | | | | 3,380,931 | |
| Oneida Co–Mohawk Valley Hlth (AGM) | | 4.00% | | 12/1/2049 | | AA | | | 4,500,000 | | | | 3,827,082 | |
| Oroville–Oroville Hsp | | 5.25% | | 4/1/2039 | | B+ | | | 1,000,000 | | | | 963,154 | |
| Oroville–Oroville Hsp | | 5.25% | | 4/1/2054 | | B+ | | | 1,000,000 | | | | 890,536 | |
| PA Econ Dev–Univ Pitt Med Ctr | | 3.00% | | 10/15/2038 | | A | | | 4,725,000 | | | | 3,588,356 | |
| PA Hi Ed–U Penn Hlth | | 4.00% | | 8/15/2049 | | AA | | | 7,000,000 | | | | 6,028,525 | |
| PA HI Ed–UPenn Hlth Sys | | 4.00% | | 8/15/2044 | | AA | | | 3,055,000 | | | | 2,696,806 | |
| Palm Beach Co Hlth–Lifespace | | 5.00% | | 5/15/2053 | | BBB | (f) | | 2,375,000 | | | | 2,020,400 | |
| Palomar Hlth | | 5.00% | | 11/1/2036 | | BBB | | | 6,025,000 | | | | 6,012,569 | |
| Palomar Hlth | | 5.00% | | 11/1/2039 | | BBB | | | 5,500,000 | | | | 5,440,677 | |
| Philadelphia Hsps–Temple Univ Hlth | | 5.00% | | 7/1/2031 | | BBB | | | 1,000,000 | | | | 1,025,321 | |
| Philadelphia Hsps–Temple Univ Hlth | | 5.00% | | 7/1/2032 | | BBB | | | 1,000,000 | | | | 1,021,469 | |
| Philadelphia Hsps–Temple Univ Hlth | | 5.00% | | 7/1/2033 | | BBB | | | 2,950,000 | | | | 3,001,602 | |
| Roanoke EDA–Carilion Clinic | | 3.00% | | 7/1/2045 | | AA- | | | 6,956,000 | | | | 4,928,953 | |
| Savannah Hosp–St.Joseph’s/Candler | | 4.00% | | 7/1/2043 | | A2 | | | 5,000,000 | | | | 4,370,764 | |
| Savannah Hosp Auth–St.Joseph’s/Candler | | 4.00% | | 7/1/2039 | | A2 | | | 4,500,000 | | | | 4,059,437 | |
| Tampa Hlth & Ed–Moffit Cancer | | 4.00% | | 7/1/2045 | | A2 | | | 4,855,000 | | | | 4,180,782 | |
| Tarrant Cnty TX Cultural Edu Fac(g) | | 5.00% | | 7/1/2053 | | A1 | | | 9,550,000 | | | | 9,454,862 | |
| UCal Med Ctr | | 5.25% | | 5/15/2038 | | AA- | | | 660,000 | | | | 663,913 | |
| VT Ed & Hlth–Univ of VT Med Ctr | | 5.00% | | 12/1/2035 | | A | | | 4,500,000 | | | | 4,566,038 | |
| WA Hlth Care–Overlake Hsp | | 5.00% | | 7/1/2038 | | A | | | 4,000,000 | | | | 4,000,576 | |
| Westchester Co LDC–Westchester Med Ctr | | 6.00% | | 11/1/2030 | | Baa2 | | | 110,000 | | | | 110,128 | |
| Westchester Co LDC–Westchester Med Ctr | | 6.125% | | 11/1/2037 | | Baa2 | | | 30,000 | | | | 30,061 | |
| WI Hlth & Ed–Marshfield Hlth Sys | | 4.00% | | 2/15/2050 | | A- | | | 5,580,000 | | | | 4,618,278 | |
| WI Hlth & Ed–Sauk-Prarie Mem Hsp | | 5.375% | | 2/1/2048 | | Ba3 | | | 840,000 | | | | 841,370 | |
| WI PFA–ACTS | | 5.00% | | 11/15/2041 | | A- | (f) | | 1,125,000 | | | | 1,133,147 | |
| WI PFA–Alabama Proton† | | 6.85% | | 10/1/2047 | | NR | | | 1,410,000 | | | | 1,127,387 | (c) |
| WI PFA–Cone Health | | 5.00% | | 10/1/2052 | | AA- | | | 8,750,000 | | | | 8,761,037 | |
| Total | | | | | | | | | | | | | 469,373,752 | |
| | | | | | | | | | | | | | | |
| Housing 2.32% | | | | | | | | | | | | | | |
| CA HFA–MFH | | 3.25% | | 8/20/2036 | | BBB | | | 7,406,184 | | | | 6,345,169 | |
| CA HFA–MFH | | 3.50% | | 11/20/2035 | | BBB+ | | | 5,722,352 | | | | 4,947,343 | |
| CA HFA–MFH | | 4.00% | | 3/20/2033 | | BBB+ | | | 14,147,543 | | | | 13,464,825 | |
| CA HFA–MFH | | 4.25% | | 1/15/2035 | | BBB+ | | | 6,678,893 | | | | 6,405,045 | |
| | See Notes to Financial Statements. | 89 |
Schedule of Investments (continued)
NATIONAL TAX FREE FUND September 30, 2022
| Investments | | Interest
Rate | | Maturity
Date | | Credit
Rating:
S&P or
Moody’s(a) | | Principal
Amount | | | Fair
Value | |
| Housing (continued) | | | | | | | | | | | | | | |
| CA Muni Fin–Caritas Affordable Hsg | | 5.25% | | 8/15/2039 | | A- | | $ | 650,000 | | | $ | 656,675 | |
| CA Muni Fin–UC Berkeley Hsg | | 5.00% | | 6/1/2050 | | Baa3 | | | 1,410,000 | | | | 1,366,691 | |
| CSCDA–Jefferson-Anaheim† | | 3.125% | | 8/1/2056 | | NR | | | 4,500,000 | | | | 2,891,481 | |
| CSCDA–Pasadena† | | 4.00% | | 12/1/2056 | | NR | | | 3,250,000 | | | | 2,149,999 | |
| CSCDA-Waterscape† | | 4.00% | | 9/1/2046 | | NR | | | 1,000,000 | | | | 704,080 | |
| Fed Home Loan Mtg Corp | | 4.60% | | 12/15/2044 | | AA+ | | | 5,485,000 | | | | 5,502,545 | |
| LA Pub Facs Auth–Provident LSU | | 5.00% | | 7/1/2059 | | A3 | | | 2,500,000 | | | | 2,465,128 | |
| MI HDA | | 3.60% | | 10/1/2060 | | AA | | | 6,330,000 | | | | 4,714,488 | |
| NH National Fin Auth | | 4.00% | | 10/20/2036 | | NR | | | 11,000,000 | | | | 9,625,444 | |
| NH National Fin Auth–Hsg Sec | | 4.375% | | 9/20/2036 | | BBB | | | 5,483,121 | | | | 4,996,826 | |
| NY Dorm–SUNY | | 3.00% | | 7/1/2045 | | Aa3 | | | 5,037,000 | | | | 3,551,313 | |
| Phoenix IDA–ASU Std Hsg | | 5.00% | | 7/1/2037 | | Baa3 | | | 1,000,000 | | | | 956,674 | |
| Toledo/Lucas Port Auth–Univ Toledo | | 5.00% | | 7/1/2034 | | BBB- | | | 1,000,000 | | | | 979,870 | |
| Toledo/Lucas Port Auth–Univ Toledo | | 5.00% | | 7/1/2039 | | BBB- | | | 1,500,000 | | | | 1,414,946 | |
| Toledo/Lucas Port Auth–Univ Toledo | | 5.00% | | 7/1/2046 | | BBB- | | | 1,000,000 | | | | 908,335 | (c) |
| WA St HFC | | 3.50% | | 12/20/2035 | | BBB+ | | | 4,904,462 | | | | 4,165,431 | |
| Total | | | | | | | | | | | | | 78,212,308 | |
| | | | | | | | | | | | | | | |
| Lease Obligations 4.18% | | | | | | | | | | | | | | |
| Erie Co IDA–Buffalo Sch Dist | | 5.00% | | 5/1/2026 | | AA | | | 6,430,000 | | | | 6,495,120 | |
| IL Sports Facs Auth (AGM) | | 5.00% | | 6/15/2027 | | AA | | | 3,500,000 | | | | 3,590,462 | |
| IL Sports Facs Auth (AGM) | | 5.00% | | 6/15/2028 | | AA | | | 865,000 | | | | 885,200 | |
| IN Fin Auth–Stadium | | 5.25% | | 2/1/2032 | | AA+ | | | 5,000,000 | | | | 5,223,487 | |
| KY Bond Dev Corp–Lexington Conv | | 4.00% | | 9/1/2048 | | A+ | | | 6,645,000 | | | | 5,900,444 | |
| Los Angeles Co Pub Wks–LACMA Bldg | | 5.00% | | 12/1/2045 | | AA+ | | | 6,240,000 | | | | 6,701,107 | |
Met Pier & Expo Auth–McCormick Place
(NPFGC)(FGIC) |
|
Zero Coupon |
|
12/15/2032 |
|
A- |
|
|
3,575,000 |
|
|
|
2,163,109 |
|
| MI Fin Auth–Wayne Co Criminal Justice | | 4.00% | | 11/1/2048 | | Aa3 | | | 3,500,000 | | | | 3,036,021 | |
| MI St Bldg Auth | | 4.00% | | 4/15/2054 | | Aa2 | | | 6,500,000 | | | | 5,654,296 | |
| NJ Ed Facs–Higher Ed | | 4.00% | | 9/1/2029 | | A3 | | | 5,445,000 | | | | 5,312,058 | |
| NJ EDA–Bldgs | | 5.00% | | 6/15/2036 | | A3 | | | 1,285,000 | | | | 1,294,804 | |
| NJ EDA–Bldgs | | 5.00% | | 6/15/2047 | | A3 | | | 6,050,000 | | | | 5,992,639 | |
| NJ EDA–Goethals Brdg AMT | | 5.625% | | 1/1/2052 | | BBB+ | | | 7,500,000 | | | | 7,523,479 | |
| NJ EDA–Sch Facs | | 5.00% | | 6/15/2041 | | A3 | | | 5,050,000 | | | | 5,010,439 | |
| NJ EDA–Sch Facs | | 5.00% | | 6/15/2042 | | A3 | | | 4,930,000 | | | | 4,887,352 | |
| NJ EDA–Sch Facs (NPFGC)(FGIC) | | 5.50% | | 9/1/2029 | | A3 | | | 7,500,000 | | | | 8,227,422 | |
| NJ EDA–State House | | 5.00% | | 6/15/2043 | | A3 | | | 4,500,000 | | | | 4,458,302 | |
| NJ EDA–Transit | | 5.00% | | 11/1/2044 | | A3 | | | 5,500,000 | | | | 5,449,278 | |
| 90 | See Notes to Financial Statements. |
Schedule of Investments (continued)
NATIONAL TAX FREE FUND September 30, 2022
| Investments | | Interest
Rate | | Maturity
Date | | Credit
Rating:
S&P or
Moody’s(a) | | Principal
Amount | | | Fair
Value | |
| Lease Obligations (continued) | | | | | | | | | | | | | | |
| NJ Trans Trust Fund | | Zero Coupon | | 12/15/2028 | | A3 | | $ | 10,000,000 | | | $ | 7,595,524 | |
| NJ Trans Trust Fund | | Zero Coupon | | 12/15/2031 | | A3 | | | 1,935,000 | | | | 1,249,745 | |
| NJ Trans Trust Fund | | Zero Coupon | | 12/15/2037 | | A3 | | | 3,390,000 | | | | 1,517,304 | |
| NJ Trans Trust Fund | | Zero Coupon | | 12/15/2038 | | A3 | | | 6,760,000 | | | | 2,830,985 | |
| NJ Trans Trust Fund | | 4.00% | | 12/15/2031 | | A3 | | | 2,125,000 | | | | 2,037,643 | |
| NJ Trans Trust Fund | | 5.00% | | 6/15/2030 | | A+ | | | 3,000,000 | | | | 3,095,467 | |
| NJ Trans Trust Fund | | 5.00% | | 6/15/2031 | | A+ | | | 2,400,000 | | | | 2,465,142 | |
| NJ Trans Trust Fund | | 5.00% | | 6/15/2033 | | A3 | | | 4,565,000 | | | | 4,680,886 | |
| NJ Trans Trust Fund | | 5.00% | | 12/15/2035 | | A3 | | | 4,200,000 | | | | 4,244,487 | |
| NJ Trans Trust Fund | | 5.00% | | 12/15/2036 | | A3 | | | 3,500,000 | | | | 3,528,626 | |
| NJ Trans Trust Fund | | 5.00% | | 6/15/2046 | | A3 | | | 14,595,000 | | | | 14,465,601 | |
| NYC TFA–Bldg Aid | | 5.00% | | 7/15/2035 | | AA | | | 545,000 | | | | 577,755 | |
| St Louis Fin Corp–Convention Center (AGM) | | 5.00% | | 10/1/2045 | | AA | | | 2,500,000 | | | | 2,530,923 | |
| St Louis Fin Corp–Convention Center (AGM) | | 5.00% | | 10/1/2049 | | AA | | | 2,625,000 | | | | 2,651,126 | |
| Total | | | | | | | | | | | | | 141,276,233 | |
| | | | | | | | | | | | | | | |
| Other Revenue 2.80% | | | | | | | | | | | | | | |
| CA Infra & Econ Dev–Acad Motion Pict | | 5.00% | | 11/1/2041 | | Aa2 | | | 2,500,000 | | | | 2,527,387 | |
| CA Infra & Econ Dev–Museum of Nat Hist | | 4.00% | | 7/1/2050 | | A2 | | | 4,000,000 | | | | 3,534,894 | |
| CA Sch Fin–Aspire† | | 4.00% | | 8/1/2061 | | BBB | | | 3,275,000 | | | | 2,434,913 | |
| CA Sch Fin Auth–Green Dot Charter† | | 5.00% | | 8/1/2048 | | BBB- | | | 1,650,000 | | | | 1,567,435 | |
| City of Miami Beach–Parking Revs (BAM) | | 5.00% | | 9/1/2040 | | AA | | | 2,000,000 | | | | 2,065,866 | |
| Clifton Higher Ed–IDEA Pub Schs | | 5.00% | | 8/15/2042 | | A- | | | 275,000 | | | | 275,079 | |
| Clifton Higher Ed–IDEA Pub Schs | | 6.00% | | 8/15/2043 | | A- | | | 1,000,000 | | | | 1,014,015 | |
| Clifton Higher Ed–Intl Ldrshp Sch | | 6.125% | | 8/15/2048 | | NR | | | 7,825,000 | | | | 7,954,398 | |
| DC Rev–Friendship Pub Chtr Sch | | 5.00% | | 6/1/2041 | | BBB | | | 1,935,000 | | | | 1,878,949 | |
| FL DFC–Mater Admy | | 5.00% | | 6/15/2050 | | BBB | | | 2,135,000 | | | | 2,076,688 | |
| FL DFC–Mater Admy | | 5.00% | | 6/15/2055 | | BBB | | | 1,500,000 | | | | 1,429,488 | |
| Grand River Hosp Dist (AGM) | | 5.25% | | 12/1/2034 | | AA | | | 1,000,000 | | | | 1,027,395 | |
| Grand River Hosp Dist (AGM) | | 5.25% | | 12/1/2035 | | AA | | | 1,000,000 | | | | 1,020,576 | |
| Grand River Hosp Dist (AGM) | | 5.25% | | 12/1/2037 | | AA | | | 1,160,000 | | | | 1,180,643 | |
| IL Fin Auth–Noble Chrter Schs | | 6.125% | | 9/1/2039 | | BBB | | | 6,000,000 | | | | 6,082,056 | |
| Indianapolis Local Pub Impt Bd Bk | | 5.00% | | 2/1/2031 | | AA- | | | 7,120,000 | | | | 7,248,022 | |
| KY Public Energy Auth–Peak Energy | | 4.00% | #(b) | 2/1/2050 | | A1 | | | 11,660,000 | | | | 11,350,328 | |
| Long Beach Nat Gas–ML | | 3.396% | #(b) | 11/15/2027 | | A2 | | | 9,000,000 | | | | 8,553,909 | |
| Lower AL Gas Dist–Goldman Sachs | | 4.00% | #(b) | 12/1/2050 | | A2 | | | 2,000,000 | | | | 1,973,867 | |
| Main St Nat Gas–Macquarie | | 5.00% | | 5/15/2037 | | A3 | | | 2,990,000 | | | | 3,008,257 | |
| Main St Nat Gas–Macquarie | | 5.00% | | 5/15/2043 | | A3 | | | 3,250,000 | | | | 3,179,364 | |
| | See Notes to Financial Statements. | 91 |
Schedule of Investments (continued)
NATIONAL TAX FREE FUND September 30, 2022
| Investments | | Interest
Rate | | Maturity
Date | | Credit
Rating:
S&P or
Moody’s(a) | | Principal
Amount | | | Fair
Value | |
| Other Revenue (continued) | | | | | | | | | | | | | | |
| Main St Nat Gas–Macquarie | | 5.00% | | 5/15/2049 | | A3 | | $ | 6,900,000 | | | $ | 6,617,290 | |
| Maricopa Co IDA–Legacy Schools† | | 5.00% | | 7/1/2049 | | BB+ | | | 1,165,000 | | | | 1,056,617 | |
| Maricopa Co IDA–Legacy Schools† | | 5.00% | | 7/1/2054 | | BB+ | | | 1,000,000 | | | | 893,714 | |
| MI Fin Auth–Bradford Admy | | 4.30% | | 9/1/2030 | | NR | | | 300,000 | | | | 266,502 | |
| MI Fin Auth–Bradford Admy | | 4.80% | | 9/1/2040 | | NR | | | 565,000 | | | | 457,512 | |
| MI Fin Auth–Bradford Admy | | 5.00% | | 9/1/2050 | | NR | | | 925,000 | | | | 715,135 | |
| Middlesex Co Impt Auth–Heldrich Ctr | | 6.125% | | 1/1/2025 | | NR | | | 1,250,000 | | | | 25,000 | |
| Middlesex Co Impt Auth–Heldrich Ctr | | 6.25% | | 1/1/2037 | | NR | | | 1,700,000 | | | | 34,000 | |
| MSR Energy Auth–Citi | | 6.125% | | 11/1/2029 | | BBB+ | | | 2,090,000 | | | | 2,271,012 | |
| NJ EDA–Team Academy | | 6.00% | | 10/1/2043 | | BBB | | | 3,500,000 | | | | 3,549,931 | |
| NYC Cultural–Lincoln Center | | 4.00% | | 12/1/2033 | | A | | | 2,000,000 | | | | 1,914,735 | |
| NYC Cultural–Lincoln Center | | 4.00% | | 12/1/2035 | | A | | | 1,750,000 | | | | 1,619,833 | |
| NYC Cultural–Lincoln Center | | 5.00% | | 12/1/2031 | | A | | | 1,250,000 | | | | 1,367,349 | |
| PR Comwlth GO | | Zero Coupon | | 11/1/2051 | | NR | | | 5,142,778 | | | | 2,320,679 | |
| Total | | | | | | | | | | | | | 94,492,838 | |
| | | | | | | | | | | | | | | |
| Pre-Refunded 0.03% | | | | | | | | | | | | | | |
| Philadelphia Sch Dist | | 5.00% | | 9/1/2038 | | NR | | | 5,000 | | | | 5,321 | |
| Philadelphia Sch Dist | | 5.00% | | 9/1/2038 | | A1 | | | 995,000 | | | | 1,012,979 | |
| Total | | | | | | | | | | | | | 1,018,300 | |
| | | | | | | | | | | | | | | |
| Special Tax 1.83% | | | | | | | | | | | | | | |
| Allentown Neighborhood Impt† | | 5.00% | | 5/1/2032 | | Ba3 | | | 1,845,000 | | | | 1,805,574 | |
| Allentown Neighborhood Impt–City Center† | | 5.25% | | 5/1/2042 | | NR | | | 3,250,000 | | | | 2,994,824 | |
| Atlanta Urban Dev Agency-Atlanta Beltline† | | 3.625% | | 7/1/2042 | | NR | | | 1,850,000 | | | | 1,489,002 | |
| Atlanta Urban Dev Agency-Atlanta Beltline† | | 3.875% | | 7/1/2051 | | NR | | | 3,325,000 | | | | 2,572,757 | |
| CT Spl Tax–Trans Infra | | 5.00% | | 8/1/2034 | | AA- | | | 3,600,000 | | | | 3,730,448 | |
| CT Spl Tax–Trans Infra | | 5.00% | | 1/1/2037 | | AA- | | | 7,000,000 | | | | 7,385,098 | |
| CT Spl Tax–Trans Infra | | 5.00% | | 1/1/2038 | | AA- | | | 4,250,000 | | | | 4,476,324 | |
| Gramercy Farms CDD~ | | Zero Coupon | | 5/1/2039 | | NR | | | 2,965,000 | | | | 1,541,800 | |
| Gramercy Farms Cmnty Dev Dist(d) | | 5.25% | | 5/1/2039 | | NR | | | 1,340,000 | | | | 214 | (c) |
| Inland Valley Redev Agy | | 5.25% | | 9/1/2037 | | A | | | 4,875,000 | | | | 4,958,775 | |
| Irvine CFD–Great Park | | 5.00% | | 9/1/2044 | | NR | | | 500,000 | | | | 502,418 | |
| NJ EDA–Kapkowski Rd Landfill | | 6.50% | | 4/1/2028 | | Baa2 | | | 2,235,249 | | | | 2,209,937 | |
| NYC IDA–Queens Stadium (AGM) | | 3.00% | | 1/1/2034 | | AA | | | 1,000,000 | | | | 837,706 | |
| NYC IDA–Queens Stadium (AGM) | | 3.00% | | 1/1/2046 | | AA | | | 4,450,000 | | | | 3,058,139 | |
| PA COPS | | 4.00% | | 7/1/2046 | | A | | | 2,375,000 | | | | 2,066,944 | |
| Rancho Cucamonga Redev Agy (AGM) | | 5.00% | | 9/1/2030 | | AA | | | 1,500,000 | | | | 1,543,285 | |
| 92 | See Notes to Financial Statements. |
Schedule of Investments (continued)
NATIONAL TAX FREE FUND September 30, 2022
| Investments | | Interest
Rate | | Maturity
Date | | Credit
Rating:
S&P or
Moody’s(a) | | Principal
Amount | | | Fair
Value | |
| Special Tax (continued) | | | | | | | | | | | | | | |
| Rancho Cucamonga Redev Agy (AGM) | | 5.00% | | 9/1/2031 | | AA | | $ | 1,400,000 | | | $ | 1,439,892 | |
| River Islands PFA–CFD 2003 (AGM) | | 5.25% | | 9/1/2052 | | AA | | | 2,500,000 | | | | 2,629,310 | |
| Riverside RDA–Housing | | 8.50% | | 10/1/2041 | | A | | | 11,195,000 | | | | 13,308,859 | |
| Stone Canyon CID(d) | | 5.70% | | 4/1/2022 | | NR | | | 1,000,000 | | | | 260,000 | |
| Stone Canyon CID(d) | | 5.75% | | 4/1/2027 | | NR | | | 1,300,000 | | | | 338,000 | |
| Village CDD #13 | | 3.00% | | 5/1/2041 | | NR | | | 1,250,000 | | | | 869,131 | |
| Village CDD #13 | | 3.25% | | 5/1/2052 | | NR | | | 2,750,000 | | | | 1,794,169 | |
| Total | | | | | | | | | | | | | 61,812,606 | |
| | | | | | | | | | | | | | | |
| Tax Revenue 5.89% | | | | | | | | | | | | | | |
| Bay Area Rapid Transit Dist | | 3.00% | | 8/1/2042 | | Aaa | | | 5,180,000 | | | | 4,115,191 | |
| Casino Reinv Dev Auth | | 5.25% | | 11/1/2039 | | Baa2 | | | 3,300,000 | | | | 3,346,759 | |
| Casino Reinv Dev Auth | | 5.25% | | 11/1/2044 | | Baa2 | | | 1,950,000 | | | | 1,973,600 | |
| Chicago Brd Ed–CIT | | 5.00% | | 4/1/2042 | | A | (f) | | 1,800,000 | | | | 1,805,898 | |
| Chicago Trans Auth | | 5.00% | | 12/1/2046 | | A+ | | | 2,835,000 | | | | 2,839,646 | |
| Chicago Trans Auth | | 5.00% | | 12/1/2052 | | A+ | | | 6,500,000 | | | | 6,366,920 | |
| Chicago Trans Auth | | 5.25% | | 12/1/2049 | | AA | | | 10,000,000 | | | | 10,199,799 | |
| Compton Community Redevelopment Agency Successor Agency (AGM) | | 5.00% | | 8/1/2042 | | AA | | | 1,250,000 | | | | 1,262,549 | |
| Cook Co Sales Tax | | 4.00% | | 11/15/2034 | | AA- | | | 3,750,000 | | | | 3,724,816 | |
| CT Spl Tax–Trans Infra | | 4.00% | | 5/1/2039 | | AA- | | | 3,150,000 | | | | 2,959,589 | |
| Guam–Business Privilege Tax | | 4.00% | | 1/1/2042 | | Ba1 | | | 1,500,000 | | | | 1,214,925 | |
| Lower Colo Riv Auth–Transmn Contract(e) | | 6.00% | | 5/15/2052 | | NR | | | 1,700,000 | | | | 1,893,121 | |
| MA Sch Bldg Auth–Sales Tax | | 4.00% | | 2/15/2043 | | AA | | | 1,000,000 | | | | 912,442 | |
| Met Pier & Expo Auth–McCormick Place | | 5.50% | | 6/15/2053 | | A- | | | 4,415,000 | | | | 4,419,218 | |
| Met Pier & Expo Auth–McCormick Place (NPFGC)(FGIC) | | Zero Coupon | | 12/15/2030 | | A- | | | 10,535,000 | | | | 7,162,776 | |
| Met Pier & Expo Auth–McCormick Place (NPFGC)(FGIC) | | Zero Coupon | | 12/15/2036 | | A- | | | 10,000,000 | | | | 4,755,661 | |
| Met Pier & Expo Auth–McCormick Place (NPFGC)(FGIC) | | Zero Coupon | | 12/15/2037 | | A- | | | 15,000,000 | | | | 6,713,736 | |
| Met Pier & Expo Auth–McCormick Place TCRS (BAM) | | 5.00% | | 6/15/2053 | | AA | | | 915,000 | | | | 943,990 | |
| NY Dorm–PIT | | 3.00% | | 3/15/2041 | | AA+ | | | 4,400,000 | | | | 3,373,551 | |
| NY Dorm–PIT | | 3.00% | | 3/15/2050 | | AA+ | | | 5,000,000 | | | | 3,499,921 | |
| NY UDC–PIT | | 3.00% | | 3/15/2047 | | AA+ | | | 3,740,000 | | | | 2,673,786 | |
| NY UDC–PIT | | 3.00% | | 3/15/2048 | | AA+ | | | 9,590,000 | | | | 6,798,958 | |
| NY UDC–PIT | | 4.00% | | 3/15/2042 | | Aa1 | | | 5,000,000 | | | | 4,539,491 | |
| NY UDC–PIT | | 5.00% | | 3/15/2033 | | AA+ | | | 750,000 | | | | 755,163 | |
| | See Notes to Financial Statements. | 93 |
Schedule of Investments (continued)
NATIONAL TAX FREE FUND September 30, 2022
| Investments | | Interest
Rate | | Maturity
Date | | Credit
Rating:
S&P or
Moody’s(a) | | Principal
Amount | | | Fair
Value | |
| Tax Revenue (continued) | | | | | | | | | | | | | | |
| NY UDC Sales Tax | | 5.00% | | 3/15/2040 | | Aa1 | | $ | 10,935,000 | | | $ | 11,405,523 | |
| NYC TFA–Future Tax | | 3.00% | | 5/1/2045 | | AAA | | | 7,000,000 | | | | 5,115,020 | |
| NYC TFA–Future Tax | | 4.00% | | 5/1/2037 | | AAA | | | 3,000,000 | | | | 2,871,711 | |
| NYC TFA–Future Tax | | 4.00% | | 2/1/2041 | | AAA | | | 4,500,000 | | | | 4,186,536 | |
| NYC TFA–Future Tax | | 4.00% | | 8/1/2042 | | AAA | | | 1,000,000 | | | | 922,539 | |
| NYC TFA–Future Tax | | 4.00% | | 5/1/2044 | | AAA | | | 1,000,000 | | | | 910,815 | |
| NYC TFA–Future Tax | | 5.00% | | 2/1/2036 | | AAA | | | 1,000,000 | | | | 1,017,071 | |
| PR Corp Sales Tax | | Zero Coupon | | 7/1/2029 | | NR | | | 1,271,000 | | | | 915,455 | |
| PR Corp Sales Tax | | Zero Coupon | | 7/1/2031 | | NR | | | 2,122,000 | | | | 1,351,985 | |
| PR Corp Sales Tax | | Zero Coupon | | 7/1/2033 | | NR | | | 2,549,000 | | | | 1,435,731 | |
| PR Corp Sales Tax | | Zero Coupon | | 7/1/2051 | | NR | | | 2,523,000 | | | | 413,874 | |
| PR Corp Sales Tax | | 4.329% | | 7/1/2040 | | NR | | | 5,803,000 | | | | 5,026,987 | |
| PR Corp Sales Tax | | 4.329% | | 7/1/2040 | | NR | | | 5,253,000 | | | | 4,550,537 | |
| PR Corp Sales Tax | | 4.536% | | 7/1/2053 | | NR | | | 39,000 | | | | 32,209 | |
| PR Corp Sales Tax | | 4.55% | | 7/1/2040 | | NR | | | 129,000 | | | | 114,949 | |
| PR Corp Sales Tax | | 4.75% | | 7/1/2053 | | NR | | | 4,895,000 | | | | 4,192,869 | |
| PR Corp Sales Tax | | 5.00% | | 7/1/2058 | | NR | | | 6,033,000 | | | | 5,341,029 | |
| Reno Cap Impt (AGM) | | 4.00% | | 6/1/2043 | | AA | | | 4,725,000 | | | | 4,126,093 | |
| Reno Cap Impt (AGM) | | 4.00% | | 6/1/2046 | | AA | | | 6,800,000 | | | | 5,826,076 | |
| San Leandro USD(e) | | 5.25% | | 8/1/2048 | | A1 | | | 10,500,000 | | | | 11,213,800 | |
| Sparks–Legends at Sparks Marina† | | 2.50% | | 6/15/2024 | | Ba2 | | | 175,000 | | | | 168,400 | |
| Sparks–Legends at Sparks Marina† | | 2.75% | | 6/15/2028 | | Ba2 | | | 750,000 | | | | 658,331 | |
| Triborough Brdg & Tunl–Payroll Mobility Tax | | 5.00% | | 5/15/2051 | | AA+ | | | 6,555,000 | | | | 6,713,866 | |
| Triborough Brdg & Tunl–Payroll Mobility Tax | | 5.00% | | 5/15/2052 | | AA+ | | | 3,000,000 | | | | 3,126,362 | |
| Triborough Brdg & Tunl–Sales Tax | | 5.25% | | 5/15/2052 | | AA+ | | | 10,335,000 | | | | 10,946,885 | |
| Triborough Brdg & Tunl–Sales Tax | | 5.25% | | 5/15/2057 | | AA+ | | | 2,500,000 | | | | 2,637,619 | |
| Triborough Brdg & Tunl–Sales Tax | | 5.25% | | 5/15/2062 | | AA+ | | | 7,905,000 | | | | 8,307,440 | |
| USVI Matching Fund | | 5.00% | | 10/1/2032 | | NR | | | 1,500,000 | | | | 1,529,073 | |
| VA Small Bus Fin–NTL Senior Lvg | | 4.00% | | 1/1/2045 | | A | (f) | | 4,000,000 | | | | 3,365,923 | |
| VT Edu Loan | | 3.375% | | 6/15/2036 | | A | | | 2,620,000 | | | | 2,453,485 | |
| Total | | | | | | | | | | | | | 199,129,699 | |
| | | | | | | | | | | | | | | |
| Tobacco 3.35% | | | | | | | | | | | | | | |
| Buckeye Tobacco | | 5.00% | | 6/1/2055 | | NR | | | 33,915,000 | | | | 28,530,580 | |
| Los Angeles Co Tobacco | | 5.00% | | 6/1/2049 | | BBB- | | | 195,000 | | | | 184,558 | |
| MI Tob Settlement | | Zero Coupon | | 6/1/2058 | | NR | | | 25,000,000 | | | | 1,037,500 | |
| MI Tob Settlement | | 4.00% | | 6/1/2049 | | BBB+ | | | 4,000,000 | | | | 3,232,614 | |
| MI Tob Settlement | | 5.00% | | 6/1/2049 | | BBB- | | | 5,355,000 | | | | 5,039,387 | |
| 94 | See Notes to Financial Statements. |
Schedule of Investments (continued)
NATIONAL TAX FREE FUND September 30, 2022
| Investments | | Interest
Rate | | Maturity
Date | | Credit
Rating:
S&P or
Moody’s(a) | | | Principal
Amount | | | | Fair
Value | |
| Tobacco (continued) | | | | | | | | | | | | | | |
| Nassau Co Tobacco | | Zero Coupon | | 6/1/2060 | | NR | | $ | 20,000,000 | | | $ | 913,266 | |
| PA Tob Settlement (AGM) | | 4.00% | | 6/1/2039 | | AA | | | 15,000,000 | | | | 13,984,835 | |
| Railsplitter Tob Settlement Auth | | 5.00% | | 6/1/2027 | | A | | | 3,325,000 | | | | 3,457,584 | |
| Sacramento Co Tobacco | | 4.00% | | 6/1/2036 | | A- | | | 1,050,000 | | | | 971,041 | |
| Sacramento Co Tobacco | | 4.00% | | 6/1/2038 | | A- | | | 1,000,000 | | | | 907,637 | |
| Sacramento Co Tobacco | | 4.00% | | 6/1/2040 | | A- | | | 1,000,000 | | | | 891,893 | |
| Sacramento Co Tobacco | | 4.00% | | 6/1/2049 | | BBB+ | | | 2,250,000 | | | | 1,832,068 | |
| San Diego Co Tobacco | | 5.00% | | 6/1/2048 | | BBB+ | | | 3,500,000 | | | | 3,425,470 | |
| San Diego Co Tobacco | | 5.00% | | 6/1/2048 | | BBB- | | | 8,505,000 | | | | 8,012,433 | |
| Tobacco Settlement Auth IA | | 4.00% | | 6/1/2049 | | BBB+ | | | 2,000,000 | | | | 1,628,456 | |
| Tobacco Settlement Auth WA | | 5.25% | | 6/1/2032 | | A- | | | 460,000 | | | | 460,415 | |
| Tobacco Settlement Fin Corp LA | | 5.25% | | 5/15/2035 | | A- | | | 2,310,000 | | | | 2,353,612 | |
| Tobacco Settlement Fin Corp NJ | | 3.20% | | 6/1/2027 | | BBB+ | | | 5,000 | | | | 4,968 | |
| Tobacco Settlement Fin Corp NJ | | 5.00% | | 6/1/2031 | | A | | | 4,605,000 | | | | 4,734,089 | |
| Tobacco Settlement Fin Corp NJ | | 5.00% | | 6/1/2033 | | A- | | | 1,000,000 | | | | 1,019,873 | |
| Tobacco Settlement Fin Corp NJ | | 5.25% | | 6/1/2046 | | BBB+ | | | 14,300,000 | | | | 14,025,532 | |
| Tobacco Settlement Fin Corp VA | | 5.00% | | 6/1/2047 | | B- | | | 7,540,000 | | | | 6,994,709 | |
| TSASC | | 5.00% | | 6/1/2023 | | B- | | | 3,400,000 | | | | 3,379,775 | |
| TSASC | | 5.00% | | 6/1/2035 | | A- | | | 1,390,000 | | | | 1,413,522 | |
| TSASC | | 5.00% | | 6/1/2048 | | NR | | | 5,550,000 | | | | 4,769,309 | |
| Total | | | | | | | | | | | | | 113,205,126 | |
| | | | | | | | | | | | | | | |
| Transportation 22.40% | | | | | | | | | | | | | | |
| AL Port Auth (AGM) | | 5.00% | | 10/1/2036 | | AA | | | 750,000 | | | | 786,139 | |
| AL Port Auth AMT (AGM) | | 5.00% | | 10/1/2034 | | AA | | | 2,000,000 | | | | 2,064,458 | |
| AL Port Auth AMT (AGM) | | 5.00% | | 10/1/2035 | | AA | | | 2,000,000 | | | | 2,061,901 | |
| Alameda Corridor Trsp Auth CR (AGM) | | 5.00% | | 10/1/2034 | | AA | | | 3,650,000 | | | | 3,751,406 | |
| Atlanta Arpt–PFC AMT | | 5.00% | | 1/1/2028 | | Aa3 | | | 2,000,000 | | | | 2,038,299 | |
| Atlanta Arpt–PFC AMT | | 5.00% | | 1/1/2031 | | Aa3 | | | 4,000,000 | | | | 4,069,365 | |
| Atlanta Arpt PFC AMT | | 4.00% | | 7/1/2039 | | Aa3 | | | 2,250,000 | | | | 2,031,121 | |
| Bay Area Toll Auth | | 4.00% | | 4/1/2049 | | AA- | | | 4,860,000 | | | | 4,303,028 | |
| CA Muni Fin–LINXS AMT | | 4.00% | | 12/31/2047 | | BBB- | (f) | | 14,450,000 | | | | 11,734,987 | |
| CA Muni Fin–LINXS CR (AGM) AMT | | 4.00% | | 12/31/2047 | | AA | | | 3,630,000 | | | | 3,095,258 | |
| CA Muni Fin Auth–LINXS AMT | | 5.00% | | 12/31/2038 | | BBB- | (f) | | 5,000,000 | | | | 4,995,979 | |
| Canaveral FL Port Auth AMT | | 5.00% | | 6/1/2045 | | A3 | | | 4,630,000 | | | | 4,702,239 | |
| Canaveral Port Auth | | 5.00% | | 6/1/2048 | | A3 | | | 4,890,000 | | | | 4,940,177 | |
| Central TX Mobility Auth | | 5.00% | | 1/1/2045 | | A- | | | 4,500,000 | | | | 4,697,638 | |
| Central TX Mobility Auth | | 5.00% | | 1/1/2046 | | A- | | | 1,500,000 | | | | 1,502,483 | |
| | See Notes to Financial Statements. | 95 |
Schedule of Investments (continued)
NATIONAL TAX FREE FUND September 30, 2022
| Investments | | Interest
Rate | | Maturity
Date | | Credit
Rating:
S&P or
Moody’s(a) | | Principal
Amount | | | Fair
Value | |
| Transportation (continued) | | | | | | | | | | | | | | |
| Central TX Tpk | | 5.00% | | 8/15/2033 | | A- | | $ | 5,750,000 | | | $ | 5,780,952 | |
| Central TX Tpk | | 5.00% | | 8/15/2037 | | A- | | | 1,000,000 | | | | 1,002,754 | |
| Chicago Midway Arpt | | 4.00% | | 1/1/2034 | | A- | | | 1,000,000 | | | | 942,358 | |
| Chicago O’Hare Arpt | | 4.00% | | 1/1/2044 | | A+ | | | 13,500,000 | | | | 11,939,625 | |
| Chicago O’Hare Arpt | | 5.00% | | 1/1/2048 | | A+ | | | 1,020,000 | | | | 1,034,137 | |
| Chicago O’Hare Arpt–TRIPS AMT | | 5.00% | | 7/1/2048 | | BBB+ | | | 3,500,000 | | | | 3,265,022 | |
| Chicago O’Hare Arpt AMT | | 5.00% | | 1/1/2047 | | A+ | | | 5,735,000 | | | | 5,681,116 | |
| Chicago O’Hare Arpt AMT | | 5.00% | | 1/1/2048 | | A+ | | | 20,000,000 | | | | 19,829,826 | |
| Chicago Trans Auth | | 4.00% | | 12/1/2055 | | A+ | | | 4,000,000 | | | | 3,256,632 | |
| Chicago Trans Auth | | 5.00% | | 12/1/2055 | | A+ | | | 1,750,000 | | | | 1,712,776 | |
| Cleveland Arpt (AGM) | | 5.00% | | 1/1/2031 | | AA | | | 900,000 | | | | 923,036 | |
| CT Airport Auth–Bradley Arpt AMT | | 4.00% | | 7/1/2049 | | BBB+ | | | 3,600,000 | | | | 2,790,222 | |
| CT Airport Auth–Ground Trans Proj AMT | | 5.00% | | 7/1/2049 | | BBB+ | | | 3,425,000 | | | | 3,160,990 | |
| Denver City & Co Arpt | | 4.00% | | 12/1/2043 | | A1 | | | 5,000,000 | | | | 4,482,781 | |
| Denver City & Co Arpt AMT | | 4.00% | | 12/1/2048 | | A1 | | | 4,255,000 | | | | 3,588,522 | |
| Denver City & Co Arpt AMT | | 5.25% | | 11/15/2043 | | A1 | | | 8,000,000 | | | | 8,019,043 | |
| DFW Arpt | | 5.00% | | 11/1/2030 | | A+ | | | 850,000 | | | | 861,215 | |
| E470 Pub Hwy Auth (NPFGC)(FGIC) | | Zero Coupon | | 9/1/2032 | | A | | | 4,200,000 | | | | 2,691,982 | |
| E470 Pub Hwy Auth (NPFGC)(FGIC) | | Zero Coupon | | 9/1/2037 | | A | | | 7,720,000 | | | | 3,661,161 | |
| Eagle Co Arpt AMT | | 5.00% | | 5/1/2033 | | Baa2 | | | 2,430,000 | | | | 2,440,470 | |
| Eagle Co Arpt AMT | | 5.00% | | 5/1/2037 | | Baa2 | | | 1,000,000 | | | | 994,813 | |
| Eagle Co Arpt AMT | | 5.00% | | 5/1/2041 | | Baa2 | | | 3,000,000 | | | | 2,923,837 | |
| Foothill / Eastern Corridor Toll Rd | | Zero Coupon | | 1/15/2033 | | A | | | 5,000,000 | | | | 3,011,286 | |
| Foothill / Eastern Corridor Toll Rd | | 3.50% | #(b) | 1/15/2053 | | A | | | 7,190,000 | | | | 5,341,211 | |
| Foothill / Eastern Corridor Toll Rd | | 4.00% | | 1/15/2043 | | A- | | | 16,723,000 | | | | 14,109,558 | |
| Foothill / Eastern Corridor Toll Rd | | 4.00% | | 1/15/2046 | | A | | | 10,000,000 | | | | 8,566,234 | |
| Hampton Roads Trans Commn | | 5.50% | | 7/1/2057 | | AA | | | 7,500,000 | | | | 8,319,304 | |
| Hampton Roads VA Transportation(g) | | 5.25% | | 7/1/2060 | | AA | | | 20,000,000 | | | | 21,098,720 | |
| HI Airport Sys AMT | | 5.00% | | 7/1/2041 | | A+ | | | 5,000,000 | | | | 4,966,739 | |
| HI Airport Sys AMT | | 5.00% | | 7/1/2048 | | A+ | | | 11,905,000 | | | | 11,870,709 | |
| HI Arprt AMT | | 4.00% | | 7/1/2035 | | A+ | | | 4,425,000 | | | | 4,067,491 | |
| Houston Arpt–Continental Airlines AMT | | 6.625% | | 7/15/2038 | | Ba3 | | | 2,500,000 | | | | 2,504,558 | |
| Kansas City IDA–Kansas City Arpt AMT | | 4.00% | | 3/1/2036 | | A2 | | | 3,000,000 | | | | 2,730,193 | |
| Los Angeles Dept Arpts–LAX | | 4.00% | | 5/15/2041 | | AA- | | | 3,695,000 | | | | 3,277,418 | |
| Los Angeles Dept Arpts–LAX AMT | | 5.00% | | 5/15/2033 | | AA- | | | 5,115,000 | | | | 5,355,110 | |
| Los Angeles Dept Arpts–LAX AMT | | 5.00% | | 5/15/2039 | | AA | | | 9,000,000 | | | | 9,185,138 | |
| Los Angeles Dept Arpts–LAX AMT | | 5.00% | | 5/15/2041 | | AA | | | 4,000,000 | | | | 4,010,006 | |
| 96 | See Notes to Financial Statements. |
Schedule of Investments (continued)
NATIONAL TAX FREE FUND September 30, 2022
| Investments | | Interest
Rate | | Maturity
Date | | Credit
Rating:
S&P or
Moody’s(a) | | Principal
Amount | | | Fair
Value | |
| Transportation (continued) | | | | | | | | | | | | | | |
| MA Port Auth AMT | | 4.00% | | 7/1/2046 | | AA | | $ | 5,465,000 | | | $ | 4,622,642 | |
| MA Port Auth AMT | | 5.00% | | 7/1/2040 | | AA | | | 1,500,000 | | | | 1,520,697 | |
| MA Port Auth AMT | | 5.00% | | 7/1/2045 | | AA | | | 3,315,000 | | | | 3,321,334 | |
| Maryland State Transportation Authority Passenger Facility Charge Revenue | | 3.00% | | 6/1/2036 | | A+ | | | 7,310,000 | | | | 5,698,557 | |
| MD EDC–Port Covington | | 4.00% | | 9/1/2040 | | NR | | | 2,000,000 | | | | 1,686,800 | |
| MD EDC–Ports America Chesapeake AMT | | 5.00% | | 6/1/2044 | | Baa2 | | | 375,000 | | | | 378,365 | |
| MD EDC–Ports America Chesapeake AMT | | 5.00% | | 6/1/2049 | | Baa2 | | | 750,000 | | | | 753,821 | |
| MD EDC–Purple Line AMT | | 5.25% | | 6/30/2052 | | Baa3 | | | 2,500,000 | | | | 2,489,713 | |
| MD EDC–Purple Line AMT | | 5.25% | | 6/30/2055 | | Baa3 | | | 12,500,000 | | | | 12,363,934 | |
| Met Airpt Auth–Dulles Metrorail | | Zero Coupon | | 10/1/2037 | | A- | | | 5,000,000 | | | | 2,207,487 | |
| Met DC Arpt AMT | | 5.00% | | 10/1/2027 | | AA- | | | 3,250,000 | | | | 3,314,436 | |
| Met DC Arpt AMT | | 5.00% | | 10/1/2028 | | AA- | | | 2,000,000 | | | | 2,017,983 | |
| Met DC Arpt AMT | | 5.00% | | 10/1/2035 | | AA- | | | 4,525,000 | | | | 4,583,021 | |
| Met Nashville Arpt Auth AMT | | 5.00% | | 7/1/2049 | | A2 | | | 5,000,000 | | | | 4,978,988 | |
| Met Transportation Auth NY Revenue | | 5.25% | | 11/15/2055 | | A3 | | | 2,000,000 | | | | 1,972,265 | |
| Met Transportation Auth NY Revenue(g) | | 5.25% | | 11/15/2055 | | A3 | | | 20,500,000 | | | | 20,215,712 | |
| MI Strategic Fund–I-75 AMT | | 5.00% | | 6/30/2048 | | Baa2 | | | 2,500,000 | | | | 2,249,638 | |
| Miami Dade Co–Rickenbacker Cswy | | 5.00% | | 10/1/2029 | | A- | | | 500,000 | | | | 507,698 | |
| Miami Dade Co–Rickenbacker Cswy | | 5.00% | | 10/1/2030 | | A- | | | 550,000 | | | | 557,716 | |
| Miami Dade Co–Rickenbacker Cswy | | 5.00% | | 10/1/2032 | | A- | | | 1,160,000 | | | | 1,172,585 | |
| Miami Dade Co Aviation–MIA AMT | | 5.00% | | 10/1/2028 | | A1 | | | 4,435,000 | | | | 4,505,039 | |
| Miami Dade Co Aviation–MIA AMT | | 5.00% | | 10/1/2029 | | A1 | | | 2,500,000 | | | | 2,538,966 | |
| Miami Dade Co Aviation–MIA AMT | | 5.00% | | 10/1/2034 | | A1 | | | 10,000,000 | | | | 10,051,448 | |
| Miami Dade CO Aviation–Mia AMT | | 5.00% | | 10/1/2044 | | A | | | 6,000,000 | | | | 5,992,346 | |
| Miami Dade Co Expwy Auth | | 5.00% | | 7/1/2027 | | A | | | 160,000 | | | | 163,528 | |
| Miami Dade Co Expwy Auth | | 5.00% | | 7/1/2028 | | A | | | 515,000 | | | | 524,351 | |
| Miami-Dade Co Seaport (AGM) | | 4.00% | | 10/1/2049 | | AA | | | 9,325,000 | | | | 8,002,286 | |
| Minneapolis / St Paul Met Arpts | | 5.00% | | 1/1/2027 | | A+ | | | 575,000 | | | | 586,102 | |
| Minneapolis / St Paul Met Arpts | | 5.00% | | 1/1/2031 | | A+ | | | 2,000,000 | | | | 2,028,835 | |
| Minneapolis / St Paul Met Arpts | | 5.00% | | 1/1/2052 | | A+ | | | 9,800,000 | | | | 9,948,762 | |
| MTA NY | | 5.00% | | 11/15/2035 | | A3 | | | 4,265,000 | | | | 4,256,636 | |
| MTA NY | | 5.00% | #(b) | 11/15/2045 | | A3 | | | 2,700,000 | | | | 2,790,131 | |
| MTA NY | | 5.25% | | 11/15/2044 | | A3 | | | 9,680,000 | | | | 9,711,653 | |
| NC Tpk Auth–Triangle Exprs | | 5.00% | | 1/1/2032 | | BBB | | | 1,350,000 | | | | 1,368,287 | |
| NC Tpk Auth–Triangle Exprs | | 5.00% | | 1/1/2043 | | BBB | | | 1,150,000 | | | | 1,119,607 | |
| NC Tpk Auth–Triangle Exprs (AGM) | | 4.00% | | 1/1/2037 | | AA | | | 14,255,000 | | | | 13,441,798 | |
| NC Tpk Auth–Triangle Exprs (AGM) | | 4.00% | | 1/1/2038 | | AA | | | 1,000,000 | | | | 943,423 | |
| | See Notes to Financial Statements. | 97 |
Schedule of Investments (continued)
NATIONAL TAX FREE FUND September 30, 2022
| Investments | | Interest
Rate | | Maturity
Date | | Credit
Rating:
S&P or
Moody’s(a) | | Principal
Amount | | | Fair
Value | |
| Transportation (continued) | | | | | | | | | | | | | | |
| NC Tpk Auth–Triangle Exprs (AGM) | | 4.00% | | 1/1/2055 | | AA | | $ | 4,000,000 | | | $ | 3,444,812 | |
| Niagara Frontier Trsp–Buffalo Intl Arpt AMT | | 5.00% | | 4/1/2025 | | A3 | | | 2,750,000 | | | | 2,790,833 | |
| Niagara Frontier Trsp–Buffalo Intl Arpt AMT | | 5.00% | | 4/1/2026 | | A3 | | | 1,000,000 | | | | 1,012,424 | |
| NJ Tpk Auth | | 4.00% | | 1/1/2033 | | AA- | | | 1,630,000 | | | | 1,629,064 | |
| NJ Tpk Auth | | 4.00% | | 1/1/2043 | | AA- | | | 5,555,000 | | | | 5,100,673 | |
| NJ Trans Trust Fund | | 4.00% | | 6/15/2045 | | A3 | | | 15,680,000 | | | | 13,268,563 | |
| NJ Trans Trust Fund | | 5.00% | | 6/15/2034 | | A3 | | | 2,625,000 | | | | 2,669,392 | |
| NJ Trans Trust Fund | | 5.00% | | 6/15/2035 | | A3 | | | 3,425,000 | | | | 3,476,222 | |
| NJ Trans Trust Fund | | 5.00% | | 6/15/2045 | | A3 | | | 5,000,000 | | | | 4,951,649 | |
| North TX Twy Auth | | 5.00% | | 1/1/2031 | | A+ | | | 250,000 | | | | 254,213 | |
| North TX Twy Auth | | 5.00% | | 1/1/2040 | | AA- | | | 4,350,000 | | | | 4,369,141 | |
| North TX Twy Auth | | 5.00% | | 1/1/2048 | | A+ | | | 5,000,000 | | | | 5,031,786 | |
| NY Trans Dev Corp–Delta Airlines AMT | | 4.00% | | 10/1/2030 | | Baa3 | | | 8,500,000 | | | | 7,983,000 | |
| NY Trans Dev Corp–Delta Airlines AMT | | 4.00% | | 1/1/2036 | | Baa3 | | | 3,295,000 | | | | 2,913,921 | |
| NY Trans Dev Corp–Delta Airlines AMT | | 5.00% | | 1/1/2036 | | Baa3 | | | 2,250,000 | | | | 2,159,079 | |
| NY Trans Dev Corp–Delta Airlines AMT | | 5.00% | | 10/1/2040 | | Baa3 | | | 11,500,000 | | | | 10,804,057 | |
| NY Trans Dev Corp–Delta AMT | | 5.00% | | 1/1/2029 | | Baa3 | | | 2,455,000 | | | | 2,450,258 | |
| NY Trans Dev Corp–Delta AMT | | 5.00% | | 1/1/2030 | | Baa3 | | | 3,275,000 | | | | 3,256,831 | |
| NY Trans Dev Corp–Delta AMT | | 5.00% | | 1/1/2033 | | Baa3 | | | 12,450,000 | | | | 12,150,768 | |
| NY Trans Dev Corp–Delta AMT | | 5.00% | | 1/1/2034 | | Baa3 | | | 4,205,000 | | | | 4,078,103 | |
| NY Trans Dev Corp–JFK IAT | | 5.00% | | 12/1/2035 | | Baa1 | | | 1,000,000 | | | | 1,009,399 | |
| NY Trans Dev Corp–JFK IAT | | 5.00% | | 12/1/2037 | | Baa1 | | | 1,500,000 | | | | 1,507,853 | |
| NY Trans Dev Corp–JFK IAT AMT | | 5.00% | | 12/1/2035 | | Baa1 | | | 1,905,000 | | | | 1,874,566 | |
| NY Trans Dev Corp–JFK IAT AMT | | 5.00% | | 12/1/2037 | | Baa1 | | | 1,390,000 | | | | 1,351,011 | |
| NY Trans Dev Corp–JFK IAT AMT | | 5.00% | | 12/1/2039 | | Baa1 | | | 5,840,000 | | | | 5,627,830 | |
| NY Trans Dev Corp–JFK IAT AMT | | 5.00% | | 12/1/2042 | | Baa1 | | | 3,250,000 | | | | 3,103,037 | |
| NY Trans Dev Corp–LaGuardia Airport AMT | | 4.00% | | 7/1/2041 | | Baa2 | | | 7,365,000 | | | | 6,147,228 | |
| NY Trans Dev Corp–LaGuardia Airport AMT | | 4.00% | | 7/1/2046 | | Baa2 | | | 2,340,000 | | | | 1,845,185 | |
| NY Trans Dev Corp–LaGuardia Airport AMT | | 5.25% | | 1/1/2050 | | Baa2 | | | 20,605,000 | | | | 20,003,612 | |
| NY Twy Auth CR (AGM) | | 4.00% | | 1/1/2051 | | AA | | | 2,725,000 | | | | 2,655,231 | (c) |
| NYS Thruway–Service Area AMT | | 4.00% | | 10/31/2041 | | BBB- | (f) | | 5,885,000 | | | | 4,865,370 | |
| Ontario Intl Airport (AGM) | | 5.00% | | 5/15/2046 | | AA | | | 2,000,000 | | | | 2,045,680 | |
| Orlando & Orange Co Expwy Auth | | 4.00% | | 7/1/2035 | | A+ | | | 5,000,000 | | | | 4,879,631 | |
| Osceola Co Trans–Osceola Parkway | | 5.00% | | 10/1/2039 | | BBB+ | | | 1,000,000 | | | | 995,948 | |
| Osceola Parkway | | 4.00% | | 10/1/2054 | | BBB+ | | | 9,300,000 | | | | 7,222,196 | |
| PA Tpk Commn | | 4.00% | | 12/1/2038 | | A3 | | | 3,425,000 | | | | 3,186,604 | |
| PA Tpk Commn | | 4.00% | | 12/1/2043 | | A | | | 1,500,000 | | | | 1,347,024 | |
| 98 | See Notes to Financial Statements. |
Schedule of Investments (continued)
NATIONAL TAX FREE FUND September 30, 2022
| Investments | | Interest
Rate | | Maturity
Date | | Credit
Rating:
S&P or
Moody’s(a) | | Principal
Amount | | | Fair
Value | |
| Transportation (continued) | | | | | | | | | | | | | | |
| PA Tpk Commn | | 5.00% | | 6/1/2029 | | A3 | | $ | 9,000,000 | | | $ | 9,391,054 | |
| PA Tpk Commn | | 5.00% | | 12/1/2039 | | A+ | | | 750,000 | | | | 767,115 | |
| PA Tpk Commn | | 5.00% | | 12/1/2044 | | A3 | | | 3,500,000 | | | | 3,462,964 | |
| Philadelphia Airport AMT | | 5.00% | | 7/1/2042 | | A2 | | | 4,440,000 | | | | 4,417,969 | |
| Port Auth NY & NJ | | 5.25% | | 10/15/2055 | | AA- | | | 3,675,000 | | | | 3,771,662 | |
| Port Auth NY & NJ AMT | | 5.00% | | 11/15/2041 | | AA- | | | 6,950,000 | | | | 6,989,957 | |
| Port of Portland–Portland Intl Arpt AMT | | 5.00% | | 7/1/2039 | | AA- | | | 2,000,000 | | | | 2,004,970 | |
| PR Hwy & Trans Auth(d) | | 4.00% | | 7/1/2017 | | NR | | | 240,000 | | | | 48,000 | (c) |
| PR Hwy & Trans Auth (AGM) | | 5.25% | | 7/1/2032 | | AA | | | 2,000,000 | | | | 1,980,312 | |
| PR Hwy & Trans Auth CR (AGM) | | 5.50% | | 7/1/2025 | | AA | | | 2,000,000 | | | | 2,062,658 | |
| Riverside Co Trsp Comm | | 4.00% | | 6/1/2040 | | A | | | 2,115,000 | | | | 1,873,958 | |
| Sacramento Co Arpt | | 5.00% | | 7/1/2041 | | A | | | 8,000,000 | | | | 8,085,082 | |
| Salt Lake City Arpt AMT | | 5.00% | | 7/1/2036 | | A | | | 10,045,000 | | | | 10,221,032 | |
| Salt Lake City Arpt AMT | | 5.00% | | 7/1/2034 | | A | | | 5,000,000 | | | | 5,060,173 | |
| San Antonio Arpt AMT | | 5.00% | | 7/1/2045 | | A1 | | | 8,435,000 | | | | 8,432,465 | |
| San Diego Arpt | | 5.00% | | 7/1/2044 | | A | | | 4,500,000 | | | | 4,564,028 | |
| San Diego Arpt | | 5.00% | | 7/1/2051 | | A2 | | | 10,475,000 | | | | 10,589,154 | |
| San Diego Cnty CA Regl Arpt Authority(g) | | 5.00% | | 7/1/2056 | | A2 | | | 11,540,000 | | | | 11,658,227 | |
| San Francisco Arpt | | 5.00% | | 5/1/2052 | | A1 | | | 5,000,000 | | | | 5,179,279 | |
| San Francisco Arpt AMT | | 5.00% | | 5/1/2052 | | A1 | | | 3,000,000 | | | | 2,998,152 | |
| San Francisco Arpt AMT | | 5.25% | | 5/1/2033 | | A+ | | | 7,000,000 | | | | 7,048,910 | |
| San Jose Arpt | | 5.00% | | 3/1/2047 | | A | | | 750,000 | | | | 754,763 | |
| SC St Port Auth AMT | | 5.00% | | 7/1/2044 | | A+ | | | 5,000,000 | | | | 4,999,728 | |
| St Louis Arpt (AGM) | | 5.00% | | 7/1/2047 | | AA | | | 7,500,000 | | | | 7,598,177 | |
| Triborough Brdg & Tunl Auth | | 3.00% | | 11/15/2047 | | AA- | | | 7,280,000 | | | | 5,166,886 | |
| Triborough Brdg & Tunl Auth | | 5.00% | | 11/15/2042 | | AA- | | | 1,640,000 | | | | 1,698,265 | |
| TX Surface Trans Corp–I-635 | | 4.00% | | 6/30/2037 | | Baa2 | | | 2,950,000 | | | | 2,602,324 | |
| TX Surface Trans Corp–I-635 | | 4.00% | | 12/31/2037 | | Baa2 | | | 2,125,000 | | | | 1,868,893 | |
| TX Surface Trans Corp–I-635 | | 4.00% | | 6/30/2038 | | Baa2 | | | 1,050,000 | | | | 917,015 | |
| TX Surface Trans Corp–I-635 | | 4.00% | | 12/31/2038 | | Baa2 | | | 1,375,000 | | | | 1,197,282 | |
| TX Surface Trans Corp–I-635 | | 4.00% | | 6/30/2039 | | Baa2 | | | 1,340,000 | | | | 1,158,247 | |
| TX Surface Trans Corp–I-635 | | 4.00% | | 12/31/2039 | | Baa2 | | | 1,025,000 | | | | 883,378 | |
| TX Trans Comm–Hwy 249 | | 5.00% | | 8/1/2057 | | Baa3 | | | 2,625,000 | | | | 2,514,812 | |
| VA Small Bus Fing–95 Express AMT | | 5.00% | | 1/1/2032 | | BBB- | | | 6,225,000 | | | | 6,394,915 | |
| VA Small Bus Fing–95 Express AMT | | 5.00% | | 1/1/2033 | | BBB- | | | 2,685,000 | | | | 2,746,444 | |
| VA Small Bus Fing–95 Express AMT | | 5.00% | | 1/1/2035 | | BBB- | | | 6,715,000 | | | | 6,807,245 | |
| VA Small Bus Fing–95 Express AMT | | 5.00% | | 7/1/2036 | | BBB- | | | 6,685,000 | | | | 6,752,697 | |
| | See Notes to Financial Statements. | 99 |
Schedule of Investments (continued)
NATIONAL TAX FREE FUND September 30, 2022
| Investments | | Interest
Rate | | Maturity
Date | | Credit
Rating:
S&P or
Moody’s(a) | | Principal
Amount | | | Fair
Value | |
| Transportation (continued) | | | | | | | | | | | | | | |
| VA Small Bus Fing–Elizabeth River AMT | | 4.00% | | 1/1/2038 | | BBB | | $ | 4,500,000 | | | $ | 3,985,488 | |
| VA Small Bus Fing–Elizabeth River AMT | | 4.00% | | 1/1/2040 | | BBB | | | 4,000,000 | | | | 3,479,458 | |
| Wayne Co Arpt AMT | | 5.00% | | 12/1/2039 | | A1 | | | 1,700,000 | | | | 1,704,194 | |
| Wayne Co Arpt AMT | | 5.00% | | 12/1/2042 | | A1 | | | 1,200,000 | | | | 1,196,997 | |
| Wayne Co Arpt AMT | | 5.00% | | 12/1/2046 | | A1 | | | 2,825,000 | | | | 2,826,020 | |
| WV Parkways Auth | | 4.00% | | 6/1/2047 | | AA- | | | 5,235,000 | | | | 4,693,210 | |
| Total | | | | | | | | | | | | | 756,773,766 | |
| | | | | | | | | | | | | | | |
| Utilities 16.18% | | | | | | | | | | | | | | |
| Adelanto Util Sys (AGM) | | 5.00% | | 7/1/2039 | | AA | | | 1,500,000 | | | | 1,575,685 | |
| Baltimore MD Proj Revenue(g) | | 5.25% | | 7/1/2047 | | Aa2 | | | 7,190,000 | | | | 7,553,050 | |
| Baltimore MD Proj Revenue(g) | | 5.25% | | 7/1/2052 | | Aa2 | | | 12,190,000 | | | | 12,805,519 | |
| Baltimore Wastewater | | 5.00% | | 7/1/2039 | | Aa3 | | | 4,750,000 | | | | 4,858,272 | |
| Baltimore Water | | 4.00% | | 7/1/2049 | | Aa2 | | | 5,850,000 | | | | 5,197,676 | |
| Baltimore Water | | 5.00% | | 7/1/2032 | | Aa3 | | | 2,435,000 | | | | 2,513,458 | |
| Baltimore Water | | 5.00% | | 7/1/2046 | | Aa3 | | | 10,000,000 | | | | 10,317,382 | |
| Black Belt Energy Gas Dist | | 4.00% | #(b) | 6/1/2051 | | Aa1 | | | 13,945,000 | | | | 13,421,082 | |
| Black Belt Energy Gas Dist | | 4.00% | #(b) | 12/1/2052 | | Baa1 | | | 18,600,000 | | | | 17,854,983 | |
| Black Belt Energy Gas Dist–CIBC | | 5.00% | #(b) | 5/1/2053 | | Aa2 | | | 18,200,000 | | | | 18,737,226 | |
| Black Belt Energy Gas Dist–Goldman Sachs | | 4.00% | #(b) | 4/1/2053 | | A2 | | | 2,000,000 | | | | 1,926,815 | |
| Black Belt Energy Gas Dist–RBC | | 4.00% | #(b) | 7/1/2052 | | Aa1 | | | 6,000,000 | | | | 5,945,993 | |
| CA Choice Clean Energy–Morgan Stanley | | 4.00% | #(b) | 2/1/2052 | | A1 | | | 2,500,000 | | | | 2,391,414 | |
| CA Poll Ctl–Poseidon Res† | | 5.00% | | 7/1/2039 | | Baa3 | | | 2,200,000 | | | | 2,085,061 | |
| CA Poll Ctl–Poseidon Res† | | 5.00% | | 11/21/2045 | | Baa3 | | | 2,750,000 | | | | 2,507,356 | |
| Campbell Co Solid Wste–Basin Elec | | 3.625% | | 7/15/2039 | | A | | | 11,270,000 | | | | 9,267,718 | |
| Casitas Muni Water Dist (BAM) | | 5.25% | | 9/1/2047 | | AA | | | 500,000 | | | | 521,535 | |
| Central Plains–Goldman Sachs | | 5.00% | #(b) | 5/1/2053 | | A2 | | | 15,000,000 | | | | 15,022,935 | |
| Chicago Water | | 5.00% | | 11/1/2029 | | A | | | 4,560,000 | | | | 4,724,958 | |
| Chicago Water | | 5.00% | | 11/1/2036 | | A | | | 1,775,000 | | | | 1,840,864 | |
| Chicago Water | | 5.00% | | 11/1/2039 | | A | | | 3,455,000 | | | | 3,383,030 | |
| Chicago Water (AGM) | | 5.00% | | 11/1/2036 | | AA | | | 3,000,000 | | | | 3,140,647 | |
| Chicago Water (AGM) | | 5.00% | | 11/1/2037 | | AA | | | 2,500,000 | | | | 2,612,518 | |
| CO Public Auth–ML | | 6.50% | | 11/15/2038 | | A2 | | | 9,565,000 | | | | 10,913,785 | |
| Compton Water | | 6.00% | | 8/1/2039 | | NR | | | 5,500,000 | | | | 5,505,378 | |
| Detroit Sewer | | 5.00% | | 7/1/2034 | | A+ | | | 1,980,000 | | | | 2,024,141 | |
| GA Muni Elec Auth–MEAG | | 5.00% | | 1/1/2033 | | A2 | | | 1,910,000 | | | | 1,949,995 | |
| GA Muni Elec Auth–MEAG | | 5.00% | | 1/1/2048 | | BBB+ | | | 5,000,000 | | | | 4,759,086 | |
| GA Muni Elec Auth–MEAG | | 5.00% | | 1/1/2056 | | A | | | 3,810,000 | | | | 3,675,889 | |
| 100 | See Notes to Financial Statements. |
Schedule of Investments (continued)
NATIONAL TAX FREE FUND September 30, 2022
| Investments | | Interest
Rate | | Maturity
Date | | Credit
Rating:
S&P or
Moody’s(a) | | Principal
Amount | | | Fair
Value | |
| Utilities (continued) | | | | | | | | | | | | | | |
| GA Muni Elec Auth–MEAG | | 5.00% | | 1/1/2059 | | BBB+ | | $ | 2,000,000 | | | $ | 1,869,035 | |
| Great Lakes Wtr & Sewer | | 5.50% | | 7/1/2052 | | A+ | | | 12,000,000 | | | | 12,729,286 | |
| Guam Waterworks | | 5.00% | | 1/1/2050 | | A- | | | 2,250,000 | | | | 2,256,073 | |
| HI Dept Budget–Hawaiian Electric | | 3.20% | | 7/1/2039 | | Baa1 | | | 18,865,000 | | | | 14,546,984 | |
| HI Dept Budget–Hawaiian Electric AMT | | 3.10% | | 5/1/2026 | | Baa1 | | | 6,235,000 | | | | 6,004,625 | |
| HI Dept Budget–Hawaiian Electric AMT | | 4.00% | | 3/1/2037 | | Baa1 | | | 3,000,000 | | | | 2,717,308 | |
| Jefferson Co Sewer | | Zero Coupon | | 10/1/2039 | | BBB | | | 350,000 | | | | 353,570 | |
| Jefferson Co Sewer | | 6.00% | | 10/1/2042 | | BBB | | | 5,000,000 | | | | 5,341,275 | |
| Jefferson Co Sewer | | 6.50% | | 10/1/2053 | | BBB | | | 7,700,000 | | | | 8,260,722 | |
| Jefferson Co Sewer (AGM) | | Zero Coupon | | 10/1/2026 | | AA | | | 1,000,000 | | | | 846,092 | |
| Jefferson Co Sewer (AGM) | | Zero Coupon | | 10/1/2027 | | AA | | | 4,875,000 | | | | 3,873,725 | |
| Jefferson Co Sewer (AGM) | | 5.50% | | 10/1/2053 | | AA | | | 3,555,000 | | | | 3,673,147 | |
| KY Muni Pwr Auth (NPFGC)(FGIC) | | 5.00% | | 9/1/2035 | | Baa1 | | | 5,000,000 | | | | 5,256,730 | |
| KY Muni Pwr Auth (NPFGC)(FGIC) | | 5.00% | | 9/1/2036 | | Baa1 | | | 5,000,000 | | | | 5,249,282 | |
| KY Public Energy Auth–Morgan Stanley | | 4.00% | #(b) | 8/1/2052 | | A1 | | | 16,000,000 | | | | 15,228,771 | |
| Long Beach Nat Gas–ML | | 5.50% | | 11/15/2037 | | A2 | | | 8,950,000 | | | | 9,371,368 | |
| Lower AL Gas Dist–Goldman Sachs | | 5.00% | | 9/1/2031 | | A2 | | | 2,575,000 | | | | 2,630,079 | |
| Lower Colo Riv Auth–Transmn Contract | | 5.00% | | 5/15/2040 | | A | | | 2,970,000 | | | | 3,030,533 | |
| Lower Colo Riv Auth–Transmn Contract | | 5.00% | | 5/15/2051 | | A | | | 3,750,000 | | | | 3,753,817 | |
| Main St Nat Gas–Citi | | 5.00% | #(b) | 12/1/2052 | | A3 | | | 13,400,000 | | | | 13,396,283 | |
| Main St Nat Gas–Citibank | | 4.00% | #(b) | 5/1/2052 | | A3 | | | 8,750,000 | | | | 8,297,849 | |
| Main St Nat Gas–Citibank | | 4.00% | #(b) | 9/1/2052 | | A3 | | | 2,000,000 | | | | 1,878,051 | |
| Main St Nat Gas–Macquarie | | 5.00% | | 5/15/2035 | | A3 | | | 2,000,000 | | | | 2,031,045 | |
| Main St Nat Gas- Citadel† | | 4.00% | #(b) | 8/1/2052 | | BBB- | | | 25,000,000 | | | | 23,533,590 | |
| Maricopa Co Poll Cntrl–El Paso Elec | | 3.60% | | 2/1/2040 | | Baa2 | | | 5,085,000 | | | | 4,169,588 | |
| Maricopa Co Poll Cntrl–El Paso Elec | | 3.60% | | 4/1/2040 | | Baa2 | | | 4,315,000 | | | | 3,533,794 | |
| MN Muni Gas | | 4.00% | #(b) | 12/1/2052 | | Aa1 | | | 5,000,000 | | | | 4,978,180 | |
| Norfolk Water | | 5.25% | | 11/1/2028 | | AA+ | | | 1,000,000 | | | | 1,057,302 | |
| NYC Muni Water | | 3.50% | | 6/15/2048 | | AA+ | | | 9,435,000 | | | | 7,869,132 | |
| NYC Muni Water | | 5.00% | | 6/15/2036 | | AA+ | | | 500,000 | | | | 509,773 | |
| Omaha Pub Pwr Dist | | 5.25% | | 2/1/2042 | | A+ | | | 4,000,000 | | | | 4,084,591 | |
| Paducah Electric (AGM) | | 5.00% | | 10/1/2033 | | AA | | | 1,000,000 | | | | 1,059,594 | |
| Paducah Electric (AGM) | | 5.00% | | 10/1/2034 | | AA | | | 1,000,000 | | | | 1,058,444 | |
| Paducah Electric (AGM) | | 5.00% | | 10/1/2035 | | AA | | | 1,000,000 | | | | 1,057,679 | |
| Philadelphia Gas Works | | 5.00% | | 8/1/2029 | | A | | | 2,000,000 | | | | 2,061,953 | |
| Philadelphia Gas Works | | 5.00% | | 8/1/2030 | | A | | | 1,500,000 | | | | 1,542,010 | |
| Philadelphia Water & Wastewater | | 5.00% | | 7/1/2030 | | A+ | | | 3,355,000 | | | | 3,475,589 | |
| | See Notes to Financial Statements. | 101 |
Schedule of Investments (continued)
NATIONAL TAX FREE FUND September 30, 2022
| Investments | | Interest
Rate | | Maturity
Date | | Credit
Rating:
S&P or
Moody’s(a) | | Principal
Amount | | | Fair
Value | |
| Utilities (continued) | | | | | | | | | | | | | | |
| Philadelphia Water & Wastewater | | 5.00% | | 10/1/2046 | | A+ | | $ | 4,475,000 | | | $ | 4,644,274 | |
| Philadelphia Water & Wastewater | | 5.25% | | 10/1/2052 | | A+ | | | 6,610,000 | | | | 6,858,194 | |
| PR Aqueduct & Swr Auth† | | 4.00% | | 7/1/2042 | | NR | | | 5,000,000 | | | | 3,949,816 | |
| PR Aqueduct & Swr Auth† | | 5.00% | | 7/1/2030 | | NR | | | 4,000,000 | | | | 3,928,341 | |
| PR Elec Pwr Auth(d) | | 2.226%
(3 Mo. LIBOR *.67 + .70%) | # | 7/1/2031 | | D | (f) | | 4,000,000 | | | | 2,695,000 | |
| PR Elec Pwr Auth(d) | | 5.00% | | 7/1/2028 | | D | (f) | | 270,000 | | | | 201,150 | |
| PR Elec Pwr Auth(d) | | 5.25% | | 7/1/2028 | | D | (f) | | 880,000 | | | | 655,600 | |
| PR Elec Pwr Auth (AGC) | | 4.25% | | 7/1/2027 | | AA | | | 280,000 | | | | 275,885 | |
| Salt Verde Fin Corp–Citi | | 5.00% | | 12/1/2032 | | A3 | | | 6,205,000 | | | | 6,255,973 | |
| Salt Verde Fin Corp–Citi | | 5.00% | | 12/1/2037 | | A3 | | | 15,995,000 | | | | 15,759,565 | |
| Salt Verde Fin Corp–Citi | | 5.25% | | 12/1/2027 | | A3 | | | 3,750,000 | | | | 3,871,590 | |
| San Antonio Water Sys | | 5.00% | | 5/15/2050 | | AA+ | | | 3,000,000 | | | | 3,119,895 | |
| SE AL Gas Dist | | 4.00% | #(b) | 12/1/2051 | | A1 | | | 41,955,000 | | | | 38,945,043 | |
| SE AL Gas Dist–Goldman Sachs | | 4.00% | #(b) | 4/1/2049 | | A3 | | | 2,500,000 | | | | 2,492,184 | |
| SE AL Gas Dist-Goldman Sachs | | 4.00% | #(b) | 11/1/2051 | | A2 | | | 9,840,000 | | | | 9,353,234 | |
| Southern CA Pub Pwr Auth–Goldman Sachs | 3.334%
(3 Mo. LIBOR *.67 + 1.47%) | # | 11/1/2038 | | A2 | | | 3,090,000 | | | | 2,535,498 | (c) |
| Southern CA Pub Pwr Auth–Goldman Sachs | | 5.00% | | 11/1/2033 | | A2 | | | 4,665,000 | | | | 4,750,408 | |
| TEAC–Goldman Sachs | | 5.00% | #(b) | 5/1/2052 | | A2 | | | 10,000,000 | | | | 9,989,673 | |
| TEAC–Goldman Sachs | | 5.625% | | 9/1/2026 | | BBB | (f) | | 10,550,000 | | | | 11,028,382 | |
| Texas Water Dev Brd | | 4.00% | | 10/15/2037 | | AAA | | | 7,760,000 | | | | 7,478,866 | |
| Transbay Pwr Auth | | 5.00% | | 10/1/2049 | | A- | (f) | | 1,310,000 | | | | 1,310,948 | |
| Transbay Pwrs Auth–Senior Tax Alloc | | 5.00% | | 10/1/2045 | | A- | (f) | | 3,000,000 | | | | 3,027,661 | |
| Trimble Env Facs–Louisville Gas & Elec | | 3.75% | | 6/1/2033 | | A1 | | | 12,500,000 | | | | 11,472,149 | |
| TX Muni Gas Acq & Supply–Macquarie | | 5.00% | | 12/15/2029 | | A3 | | | 7,250,000 | | | | 7,471,757 | |
| TX Muni Gas Acq & Supply–Macquarie | | 5.00% | | 12/15/2030 | | A3 | | | 6,500,000 | | | | 6,692,301 | |
| TX Muni Gas Acq & Supply–Macquarie | | 5.00% | | 12/15/2031 | | A3 | | | 6,000,000 | | | | 6,159,724 | |
| Total | | | | | | | | | | | | | 546,543,431 | |
| Total Municipal Bonds (cost $3,727,860,107) | | | | | | | | | | | | | 3,367,551,222 | |
| 102 | See Notes to Financial Statements. |
Schedule of Investments (continued)
NATIONAL TAX FREE FUND September 30, 2022
| Investments | | Interest
Rate# | | Interest
Rate
Reset
Date(h) | | Final
Maturity
Date | | Credit
Rating:
S&P or
Moody’s(a) | | Principal
Amount | | Fair
Value | |
| SHORT-TERM INVESTMENTS 0.95% | | | | | | | | | | | | | | | |
| | | | | | | | | | | | | | | | |
| VARIABLE RATE DEMAND NOTES 0.95% | | | | | | | | | | | | | | | |
| | | | | | | | | | | | | | | | |
| Tax Revenue 0.27% | | | | | | | | | | | | | | | |
| NYC TFA–Future Tax | | 2.750% | | 10/3/2022 | | 5/1/2034 | | AAA | | $ | 7,840,000 | | $ | 7,840,000 | |
| NYC TFA–Future Tax | | 2.750% | | 10/3/2022 | | 11/1/2044 | | AAA | | | 1,175,000 | | | 1,175,000 | |
| Total | | | | | | | | | | | | | | 9,015,000 | |
| | | | | | | | | | | | | | | | |
| Utilities 0.68% | | | | | | | | | | | | | | | |
| Appling Co Dev–GA Power | | 2.960% | | 10/3/2022 | | 9/1/2041 | | BBB+ | | | 6,850,000 | | | 6,850,000 | |
| NYC Muni Water | | 2.770% | | 10/3/2022 | | 6/15/2049 | | AA+ | | | 7,500,000 | | | 7,500,000 | |
| NYC Muni Water | | 2.780% | | 10/3/2022 | | 6/15/2045 | | AA+ | | | 8,690,000 | | | 8,690,000 | |
| Total | | | | | | | | | | | | | | 23,040,000 | |
| Total Short-Term Investments (cost $32,055,000) | | | | | | | | | | | | | | 32,055,000 | |
| Total Investments in Securities 100.62% (cost $3,759,915,107) | | | | | | | 3,399,606,222 | |
| Other Assets and Liabilities – Net(i) (0.62)% | | | | | | | | | | | | | | (20,948,492 | ) |
| Net Assets 100.00% | | | | | | | | | | | | | $ | 3,378,657,730 | |
| | | |
| AGC | | Insured by–Assured Guarantee Corp. |
| AGM | | Insured by–Assured Guaranty Municipal Corporation. |
| AMT | | Income from the security may be subject to Alternative Minimum Tax. |
| BAM | | Insured by–Build America Mutual. |
| COPS | | Certificates of Participation. |
| CR | | Custodian Receipt. |
| FGIC | | Insured by–Financial Guaranty Insurance Company. |
| GTD | | Guaranteed. |
| LIBOR | | London Interbank Offered Rate. |
| NPFGC | | Insured by–National Public Finance Guarantee Corporation. |
| NR | | Not Rated. |
| SIFMA | | Insured by–Securities Industry and Financial Markets Association. |
| TCRS | | Transferable Custodial Receipts. |
| TRIPS | | Tax Refund Intercept Programs. |
| † | | Security was purchased pursuant to Rule 144A under the Securities Act of 1933 and, unless registered under such Act or exempted from registration, may only be resold to qualified institutional buyers. At September 30, 2022, the total value of Rule 144A securities was $152,246,715, which represents 4.51% of net assets. |
| # | | Variable rate security. The interest rate represents the rate in effect at September 30, 2022. |
| ~ | | Deferred interest debentures pay no interest for a stipulated number of years, after which they pay a predetermined interest rate. |
| (a) | | Unaudited. |
| (b) | | Variable Rate is Fixed to Float: Rate remains fixed or at Zero Coupon until designated future date. |
| (c) | | Level 3 Investment as described in Note 2(i) in the Notes to Financials. Security valued utilizing third party pricing information without adjustment. Such valuations are based on unobservable inputs. A significant change in third party information could result in a significantly lower or higher value of such Level 3 investments. |
| (d) | | Defaulted (non-income producing security). |
| (e) | | Securities purchased on a when-issued basis (See Note 2(g)). |
| (f) | | This investment has been rated by Fitch IBCA. |
| (g) | | Municipal Bonds Held in Trust–Securities represent underlying bonds transferred to a separate securitization trust established in a tender option bond transaction in which the Fund acquired the residual interest certificates. These securities serve as collateral in a financing transaction. See Note 2(h) to Financial Statements for details of Municipal Bonds Held in Trust. |
| | See Notes to Financial Statements. | 103 |
Schedule of Investments (concluded)
NATIONAL TAX FREE FUND September 30, 2022
| (h) | | The interest rate reset date shown represents the date in which the Fund has the right to sell a Variable Rate Demand Note (“VRDN”) back to the issuer for Principal Amount. The interest rate on the VRDN is generally reset daily based on the SIFMA Municipal Swap Index. |
| (i) | | Other Assets and Liabilities – Net include net unrealized appreciation/depreciation on futures contracts as follows: |
Futures Contracts at September 30, 2022:
| Type | | Expiration | | Contracts | | Position | | Notional
Amount | | Notional
Value | | Unrealized
Appreciation | |
| U.S. Long Bond | | December 2022 | | 407 | | Short | | $(55,809,094 | ) | $(51,447,344 | ) | $4,361,750 | |
The following is a summary of the inputs used as of September 30, 2022 in valuing the Fund’s investments carried at fair value(1):
| Investment Type(2) | | Level 1 | | | Level 2 | | | Level 3 | | | Total | |
| Long-Term Investments | | | | | | | | | | | | | | | | |
| Municipal Bonds(3) | | | | | | | | | | | | | | | | |
| Corporate-Backed | | $ | – | | | $ | 299,530,335 | | | $ | 11,105,779 | | | $ | 310,636,114 | |
| Health Care | | | – | | | | 468,246,365 | | | | 1,127,387 | | | | 469,373,752 | |
| Housing | | | – | | | | 77,303,973 | | | | 908,335 | | | | 78,212,308 | |
| Special Tax | | | – | | | | 61,812,392 | | | | 214 | | | | 61,812,606 | |
| Transportation | | | – | | | | 754,070,535 | | | | 2,703,231 | | | | 756,773,766 | |
| Utilities | | | – | | | | 544,007,933 | | | | 2,535,498 | | | | 546,543,431 | |
| Remaining Industries | | | – | | | | 1,144,199,245 | | | | – | | | | 1,144,199,245 | |
| Short-Term Investments | | | | | | | | | | | | | | | | |
| Variable Rate Demand Notes | | | – | | | | 32,055,000 | | | | – | | | | 32,055,000 | |
| Total | | $ | – | | | $ | 3,381,225,778 | | | $ | 18,380,444 | | | $ | 3,399,606,222 | |
| Other Financial Instruments | | | | | | | | | | | | | | | | |
| Futures Contracts | | | | | | | | | | | | | | | | |
| Assets | | $ | 4,361,750 | | | $ | – | | | $ | – | | | $ | 4,361,750 | |
| Liabilities | | | – | | | | – | | | | – | | | | – | |
| Total | | $ | 4,361,750 | | | $ | – | | | $ | – | | | $ | 4,361,750 | |
| (1) | | Refer to Note 2(i) for a description of fair value measurements and the three-tier hierarchy of inputs. |
| (2) | | See Schedule of Investments for fair values in each industry. The table above is presented by Investment Type. Industries are presented within an Investment Type should such Investment Type include securities classified as two or more levels within the three-tier fair value hierarchy. When applicable each Level 3 security is identified on the Schedule of Investments along with the valuation technique utilized. |
| (3) | | Includes Municipal Bonds held in the Trust (See Note 2(h)). |
A reconciliation of Level 3 investments is presented when the Fund has a material amount of Level 3 investments at the beginning or end of the year in relation to the Fund’s net assets. Management has determined not to provide a reconciliation as the balance of Level 3 investments was not considered to be material to the Fund’s net assets at the beginning or end of the year.
| 104 | See Notes to Financial Statements. |
Schedule of Investments
HIGH INCOME MUNICIPAL BOND FUND September 30, 2022
| Investments | | Interest
Rate | | Maturity
Date | | Credit
Rating:
S&P or
Moody’s(a) | | Principal
Amount | | | Fair
Value | |
| LONG-TERM INVESTMENTS 98.61% | | | | | | | | | | | | | | |
| | | | | | | | | | | | | | | |
| MUNICIPAL BONDS 98.61% | | | | | | | | | | | | | | |
| | | | | | | | | | | | | | | |
| Corporate-Backed 17.62% | | | | | | | | | | | | | | |
| Allegheny Co IDA–US Steel | | 5.125% | | 5/1/2030 | | BB- | | $ | 3,990,000 | | | $ | 4,007,656 | |
| AR DFA–Big River Steel AMT† | | 4.50% | | 9/1/2049 | | Ba2 | | | 19,000,000 | | | | 15,433,618 | |
| AR DFA–Big River Steel AMT† | | 4.75% | | 9/1/2049 | | Ba2 | | | 13,635,000 | | | | 11,532,523 | |
| AR DFA–US Steel AMT† | | 5.45% | | 9/1/2052 | | BB- | | | 17,000,000 | | | | 15,380,136 | |
| Beauregard Parish–Office Max | | 6.80% | | 2/1/2027 | | B1 | | | 5,000,000 | | | | 5,023,416 | |
| Black Belt Energy Gas Dist–Goldman Sachs | | 4.00% | #(b) | 10/1/2052 | | A2 | | | 5,715,000 | | | | 5,568,609 | |
| Build NYC Res Corp–Pratt Paper AMT† | | 5.00% | | 1/1/2035 | | NR | | | 1,450,000 | | | | 1,458,742 | |
| Calhoun Co IDA–Max Midstream AMT† | | 3.625% | | 7/1/2026 | | NR | | | 12,800,000 | | | | 11,409,907 | |
| Charlotte Co IDA–MSKP Town & Country AMT† | | 4.00% | | 10/1/2041 | | NR | | | 2,750,000 | | | | 2,079,019 | |
| Downtown Doral CDD† | | 4.75% | | 12/15/2038 | | NR | | | 625,000 | | | | 598,698 | |
| Downtown Doral CDD† | | 5.00% | | 12/15/2048 | | NR | | | 1,500,000 | | | | 1,407,040 | |
| FL DFC–Waste Pro AMT† | | 5.00% | | 5/1/2029 | | NR | | | 4,500,000 | | | | 4,279,343 | |
| Fort Bend IDC–NRG Energy | | 4.75% | | 11/1/2042 | | Baa2 | | | 3,590,000 | | | | 3,265,296 | |
| Greater Orlando Aviation–Jet Blue | | 5.00% | | 11/15/2036 | | NR | | | 2,000,000 | | | | 1,929,386 | |
| Henderson Facs–Pratt Paper† | | 4.45% | | 1/1/2042 | | NR | | | 2,750,000 | | | | 2,494,652 | |
| Henderson Facs–Pratt Paper AMT† | | 3.70% | | 1/1/2032 | | NR | | | 4,000,000 | | | | 3,725,512 | |
| Henderson Facs–Pratt Paper AMT† | | 4.45% | | 1/1/2042 | | NR | | | 1,500,000 | | | | 1,360,719 | |
| Hoover IDA–US Steel AMT | | 5.75% | | 10/1/2049 | | BB- | | | 17,200,000 | | | | 17,536,599 | |
| Hoover IDA–US Steel AMT | | 6.375% | #(b) | 11/1/2050 | | BB- | | | 1,965,000 | | | | 2,157,662 | |
| Houston Arpt–United Airlines AMT | | 4.00% | | 7/15/2041 | | B- | (c) | | 4,475,000 | | | | 3,517,121 | |
| Houston Arpt–United Airlines AMT | | 5.00% | | 7/1/2029 | | Ba3 | | | 18,325,000 | | | | 18,005,077 | |
| IA Fin Auth–Alcoa | | 4.75% | | 8/1/2042 | | BB+ | | | 10,385,000 | | | | 9,300,924 | |
| IA Fin Auth–Iowa Fertilizer Co | | 4.00% | #(b) | 12/1/2050 | | BBB- | | | 10,590,000 | | | | 9,627,603 | |
| IA Fin Auth–Iowa Fertilizer Co | | 5.00% | | 12/1/2050 | | BBB- | | | 15,000,000 | | | | 13,063,350 | |
| IN Fin Auth–US Steel | | 4.125% | | 12/1/2026 | | BB- | | | 11,500,000 | | | | 11,138,327 | |
| IN Fin Auth–US Steel AMT | | 6.75% | | 5/1/2039 | | BB- | | | 3,500,000 | | | | 3,892,847 | |
| Jefferson Co Port Auth–JSW Steel AMT† | | 3.50% | | 12/1/2051 | | Ba1 | | | 13,250,000 | | | | 8,917,348 | |
| LA Env Facs–Entergy | | 2.50% | | 4/1/2036 | | A | | | 7,110,000 | | | | 5,319,244 | |
| Maricopa Co IDA–Commercial Metals AMT† | | 4.00% | | 10/15/2047 | | BB+ | | | 17,335,000 | | | | 13,335,431 | |
| Maricopa Poll Ctl–So Cal Edison | | 2.40% | | 6/1/2035 | | A- | | | 4,470,000 | | | | 3,335,279 | |
| MD EDC–Chesapeake Bay Hyatt(d) | | 5.00% | | 12/1/2016 | | NR | | | 3,430,000 | | | | 2,058,000 | |
| Mission Econ Dev Corp–Natgasoline AMT† | | 4.625% | | 10/1/2031 | | BB- | | | 5,000,000 | | | | 4,933,096 | |
| | See Notes to Financial Statements. | 105 |
Schedule of Investments (continued)
HIGH INCOME MUNICIPAL BOND FUND September 30, 2022
| Investments | | Interest
Rate | | Maturity
Date | | Credit
Rating:
S&P or
Moody’s(a) | | Principal
Amount | | | Fair
Value | |
| Corporate-Backed (continued) | | | | | | | | | | | | | | |
| NH National Fin Auth–Covanta† | | 3.625% | #(b) | 7/1/2043 | | B | | $ | 1,785,000 | | | $ | 1,361,500 | |
| NH National Fin Auth–Covanta AMT† | | 3.75% | #(b) | 7/1/2045 | | B | | | 4,725,000 | | | | 3,668,966 | |
| NH National Fin Auth–Covanta AMT† | | 4.00% | | 11/1/2027 | | B | | | 1,250,000 | | | | 1,188,617 | |
| NH National Fin Auth–Covanta AMT† | | 4.875% | | 11/1/2042 | | B | | | 12,000,000 | | | | 10,666,921 | |
| Niagara Area Dev Corp–Covanta† | | 3.50% | | 11/1/2024 | | B1 | | | 2,500,000 | | | | 2,438,390 | |
| Niagara Area Dev Corp–Covanta AMT† | | 4.75% | | 11/1/2042 | | B1 | | | 10,000,000 | | | | 8,742,227 | |
| NJ EDA–Continental Airlines | | 5.25% | | 9/15/2029 | | Ba3 | | | 15,960,000 | | | | 15,813,219 | |
| NJ EDA–Continental Airlines | | 5.50% | | 6/1/2033 | | Ba3 | | | 6,760,000 | | | | 6,636,638 | |
| NY Env Facs–Casella Waste AMT† | | 3.125% | #(b) | 12/1/2044 | | B | | | 2,000,000 | | | | 1,854,445 | |
| NY Liberty Dev Corp–3 WTC† | | 5.00% | | 11/15/2044 | | NR | | | 10,000,000 | | | | 8,975,071 | |
| NY Liberty Dev Corp–3 WTC† | | 5.15% | | 11/15/2034 | | NR | | | 7,100,000 | | | | 6,924,771 | |
| NY Liberty Dev Corp–4 WTC | | 2.50% | | 11/15/2036 | | A+ | | | 7,500,000 | | | | 5,405,926 | |
| NY Liberty Dev Corp–7 WTC | | 3.00% | | 9/15/2043 | | Aaa | | | 3,500,000 | | | | 2,570,266 | |
| NY Trans Dev Corp–American Airlines AMT | | 2.25% | | 8/1/2026 | | B | (c) | | 5,135,000 | | | | 4,738,763 | |
| NY Trans Dev Corp–American Airlines AMT | | 5.00% | | 8/1/2026 | | B- | | | 2,540,000 | | | | 2,540,037 | |
| NY Trans Dev Corp–American Airlines AMT | | 5.00% | | 8/1/2031 | | B- | | | 21,480,000 | | | | 21,490,072 | |
| NY Trans Dev Corp–American Airlines AMT | | 5.25% | | 8/1/2031 | | B- | | | 6,740,000 | | | | 6,744,134 | |
| NY Trans Dev Corp–American Airlines AMT | | 5.375% | | 8/1/2036 | | B- | | | 6,500,000 | | | | 6,378,369 | |
| NYC IDA–TRIPS | | 5.00% | | 7/1/2028 | | BBB+ | | | 6,135,000 | | | | 6,153,422 | |
| OH Air Dev Auth–OVEC | | 3.25% | | 9/1/2029 | | Baa3 | | | 8,500,000 | | | | 7,796,356 | |
| OH Air Quality–AMG Vanadium AMT† | | 5.00% | | 7/1/2049 | | B- | | | 34,290,000 | | | | 30,371,908 | |
| PA EDA–Consol Energy AMT† | | 9.00% | #(b) | 4/1/2051 | | B- | | | 4,250,000 | | | | 4,846,266 | |
| PA EDA–Covanta AMT† | | 3.25% | | 8/1/2039 | | B | | | 6,980,000 | | | | 5,095,735 | |
| PA EDA–National Gypsum AMT | | 5.50% | | 11/1/2044 | | NR | | | 1,000,000 | | | | 952,118 | |
| Parish of St James–Nustar Logistics† | | 6.10% | #(b) | 6/1/2038 | | BB- | | | 5,375,000 | | | | 5,729,350 | |
| Parish of St James–Nustar Logistics† | | 6.10% | #(b) | 12/1/2040 | | BB- | | | 2,750,000 | | | | 2,931,295 | |
| Parish of St James–Nustar Logistics† | | 6.35% | | 7/1/2040 | | BB- | | | 5,000,000 | | | | 5,342,736 | |
| Parish of St James–Nustar Logistics† | | 6.35% | | 10/1/2040 | | BB- | | | 7,690,000 | | | | 8,217,128 | |
| Polk Co IDA–Mineral Development† | | 5.875% | | 1/1/2033 | | NR | | | 7,375,000 | | | | 7,309,972 | |
| Port Beaumont Nav Dis–Jefferson Rail AMT† | | 4.00% | | 1/1/2050 | | NR | | | 14,590,000 | | | | 10,685,596 | |
| Port Beaumont Nav Dis–Jefferson Rail AMT† | | 3.00% | | 1/1/2050 | | NR | | | 7,250,000 | | | | 4,310,351 | |
| Port Beaumont Nav Dis–Jefferson Rail AMT† | | 3.625% | | 1/1/2035 | | NR | | | 6,765,000 | | | | 5,461,796 | |
| Rumford Solid Waste–Office Max | | 6.875% | | 10/1/2026 | | B1 | | | 1,500,000 | | | | 1,507,025 | |
| 106 | See Notes to Financial Statements. |
Schedule of Investments (continued)
HIGH INCOME MUNICIPAL BOND FUND September 30, 2022
| Investments | | Interest
Rate | | Maturity
Date | | Credit
Rating:
S&P or
Moody’s(a) | | Principal
Amount | | | Fair
Value | |
| Corporate-Backed (continued) | | | | | | | | | | | | | | |
| Spring Valley Community Infrastructure District No. 1† | | 3.75% | | 9/1/2051 | | NR | | $ | 13,125,000 | | | $ | 9,260,285 | |
| St James Parish–Nustar Logistics† | | 5.85% | #(b) | 8/1/2041 | | BB- | | | 1,000,000 | | | | 1,026,592 | |
| Sumter Co IDA–Enviva Inc AMT | | 6.00% | #(b) | 7/15/2052 | | B+ | | | 30,000,000 | | | | 27,598,158 | |
| Tuscaloosa IDA–Hunt Refining† | | 4.50% | | 5/1/2032 | | NR | | | 4,913,375 | | | | 4,265,231 | |
| Tuscaloosa IDA–Hunt Refining† | | 5.25% | | 5/1/2044 | | NR | | | 26,665,000 | | | | 22,526,037 | |
| UIPA Crossroads Public Infrastructure District† | | 4.125% | | 6/1/2041 | | NR | | | 2,000,000 | | | | 1,664,764 | |
| UIPA Crossroads Public Infrastructure District† | | 4.375% | | 6/1/2052 | | NR | | | 7,500,000 | | | | 5,968,162 | |
| VA Small Bus Fing–Covanta AMT† | | 5.00% | #(b) | 1/1/2048 | | B | | | 3,150,000 | | | | 2,885,789 | |
| Valparaiso Facs–Pratt Paper AMT | | 5.875% | | 1/1/2024 | | NR | | | 325,000 | | | | 330,009 | |
| Valparaiso Facs–Pratt Paper AMT | | 7.00% | | 1/1/2044 | | NR | | | 4,000,000 | | | | 4,113,211 | |
| VT EDA–Casella Waste AMT† | | 5.00% | #(b) | 6/1/2052 | | B | | | 9,000,000 | | | | 8,766,216 | |
| West Pace Coop Dist(d) | | 9.125% | | 5/1/2039 | | NR | | | 13,770,000 | | | | 10,465,200 | (e) |
| WI PFA–American Dream† | | 6.75% | | 12/1/2042 | | NR | | | 1,000,000 | | | | 842,515 | |
| WI PFA–Celanese AMT | | 4.30% | | 11/1/2030 | | BBB | | | 4,215,000 | | | | 4,147,117 | |
| WI PFA–Celanese AMT | | 5.00% | | 1/1/2024 | | BBB | | | 6,750,000 | | | | 6,812,605 | |
| WI PFA–Celanese AMT | | 5.00% | | 12/1/2025 | | BBB | | | 1,950,000 | | | | 1,988,646 | |
| WI PFA–Fargo-Moorhead | | 4.00% | | 9/30/2051 | | Baa3 | | | 12,750,000 | | | | 9,455,071 | |
| WI PFA–Fargo-Moorhead | | 4.00% | | 3/31/2056 | | Baa3 | | | 8,500,000 | | | | 6,092,109 | |
| WI PFA–Sky Harbour AMT | | 4.00% | | 7/1/2041 | | NR | | | 2,500,000 | | | | 1,818,504 | |
| WI PFA–Sky Harbour AMT | | 4.25% | | 7/1/2054 | | NR | | | 25,500,000 | | | | 17,192,378 | |
| WI PFA–TRIPS AMT | | 5.00% | | 7/1/2042 | | BBB+ | | | 11,000,000 | | | | 10,918,236 | |
| Total | | | | | | | | | | | | | 600,078,401 | |
| | | | | | | | | | | | | | | |
| Education 6.29% | | | | | | | | | | | | | | |
| AZ IDA–Academy of Math & Science† | | 5.625% | | 7/1/2048 | | BB+ | | | 2,235,000 | | | | 2,236,033 | |
| AZ IDA–Academy of Math & Science† | | 5.75% | | 7/1/2053 | | BB+ | | | 3,000,000 | | | | 3,016,485 | |
| AZ IDA–Basis Schools† | | 5.00% | | 7/1/2051 | | BB | | | 3,080,000 | | | | 2,809,030 | |
| AZ IDA–Basis Schools † | | 5.00% | | 7/1/2047 | | BB | | | 1,325,000 | | | | 1,224,121 | |
| AZ IDA–Odyssey Prep† | | 5.00% | | 7/1/2049 | | BB- | | | 2,000,000 | | | | 1,764,046 | |
| AZ IDA–Odyssey Prep† | | 5.00% | | 7/1/2054 | | BB- | | | 5,000,000 | | | | 4,338,088 | |
| CA Muni Fin–Julian Chtr Sch† | | 5.625% | | 3/1/2045 | | B+ | | | 11,500,000 | | | | 10,446,085 | |
| CA Muni Fin–William Jessup U† | | 5.00% | | 8/1/2048 | | NR | | | 8,075,000 | | | | 7,001,882 | |
| Cap Trust Ed–Advantage Charter Scho | | 5.00% | | 12/15/2049 | | Baa3 | | | 1,360,000 | | | | 1,270,289 | |
| Cap Trust Ed–Advantage Charter Scho | | 5.00% | | 12/15/2054 | | Baa3 | | | 705,000 | | | | 650,654 | |
| Cap Trust Ed–Renaissance Charter† | | 5.00% | | 6/15/2039 | | NR | | | 1,950,000 | | | | 1,798,129 | |
| | See Notes to Financial Statements. | 107 |
Schedule of Investments (continued)
HIGH INCOME MUNICIPAL BOND FUND September 30, 2022
| Investments | | Interest
Rate | | Maturity
Date | | Credit
Rating:
S&P or
Moody’s(a) | | Principal
Amount | | | Fair
Value | |
| Education (continued) | | | | | | | | | | | | | | |
| Cap Trust Ed–Renaissance Charter† | | 5.00% | | 6/15/2049 | | NR | | $ | 9,815,000 | | | $ | 8,586,425 | |
| Chicago Brd Ed | | 5.00% | | 12/1/2044 | | BB | | | 4,860,000 | | | | 4,726,440 | |
| Clifton Higher Ed–Intl Ldrshp Sch | | 5.75% | | 8/15/2045 | | NR | | | 6,500,000 | | | | 6,535,190 | |
| Columbus-Franklin Co–Ohio Dominican U | | 6.50% | | 3/1/2048 | | NR | | | 5,055,000 | | | | 3,961,163 | |
| Columbus-Franklin Co–Ohio Dominican U | | 6.50% | | 3/1/2053 | | NR | | | 3,500,000 | | | | 2,692,947 | |
| Dutchess Co LDC–Bard College† | | 5.00% | | 7/1/2045 | | BB+ | | | 4,000,000 | | | | 3,640,514 | |
| Dutchess Co LDC–Bard College† | | 5.00% | | 7/1/2051 | | BB+ | | | 9,000,000 | | | | 8,009,301 | |
| Farmville IDA–Longwood Univ Hsg | | 5.00% | | 1/1/2059 | | BBB- | | | 6,000,000 | | | | 5,243,597 | |
| FL HI Ed–Jacksonville Univ† | | 5.00% | | 6/1/2048 | | NR | | | 6,400,000 | | | | 5,759,653 | |
| FL HI Ed–Jacksonville Univ† | | 5.00% | | 6/1/2053 | | NR | | | 6,500,000 | | | | 5,758,293 | |
| Frederick Co Ed–Mount St Mary’s Univ† | | 5.00% | | 9/1/2037 | | BB+ | | | 1,500,000 | | | | 1,425,743 | |
| Frederick Co Ed–Mount St Mary’s Univ† | | 5.00% | | 9/1/2045 | | BB+ | | | 12,645,000 | | | | 11,415,331 | |
| IL Fin Auth–IL Inst of Tech | | 4.00% | | 9/1/2041 | | Baa3 | | | 5,490,000 | | | | 4,504,093 | |
| IL Fin Auth–IL Inst of Tech | | 5.00% | | 9/1/2038 | | Baa3 | | | 4,885,000 | | | | 4,755,895 | |
| IL Fin Auth–IL Inst of Tech | | 5.00% | | 9/1/2040 | | Baa3 | | | 1,750,000 | | | | 1,688,287 | |
| Iowa St Hi Ed–Des Moines Univ | | 5.375% | | 10/1/2052 | | BBB+ | | | 2,000,000 | | | | 2,001,435 | |
| Maricopa Co IDA–Ottawa Univ† | | 5.25% | | 10/1/2040 | | NR | | | 3,000,000 | | | | 2,928,374 | |
| Maricopa Co IDA–Ottawa Univ† | | 5.50% | | 10/1/2051 | | NR | | | 7,915,000 | | | | 7,746,598 | |
| Marietta Dev Auth–Life Univ† | | 5.00% | | 11/1/2037 | | Ba3 | | | 9,000,000 | | | | 8,631,529 | |
| Marietta Dev Auth–Life Univ† | | 5.00% | | 11/1/2047 | | Ba3 | | | 8,000,000 | | | | 7,316,903 | |
| Nashville Hlth & Ed–Lipscomb U | | 5.25% | | 10/1/2058 | | BBB- | | | 12,150,000 | | | | 11,798,712 | |
| New Hope Ed Facs–Jubilee† | | 4.00% | | 8/15/2041 | | BB+ | | | 3,320,000 | | | | 2,659,461 | |
| New Hope Ed Facs–Jubilee† | | 4.00% | | 8/15/2046 | | BB+ | | | 3,035,000 | | | | 2,311,501 | |
| NV Dept of Bus & Ind–Somerset† | | 5.00% | | 12/15/2048 | | BB | | | 1,500,000 | | | | 1,367,400 | |
| NY Dorm–Touro Clg | | 5.25% | | 1/1/2034 | | NR | | | 2,955,000 | | | | 3,044,615 | |
| NY Dorm–Yeshiva | | 5.00% | | 7/15/2042 | | BBB- | | | 3,725,000 | | | | 3,597,917 | |
| NY Dorm–Yeshiva | | 5.00% | | 7/15/2050 | | BBB- | | | 8,000,000 | | | | 7,512,764 | |
| OH Air Dev Auth–Duke Energy AMT | | 4.25% | #(b) | 11/1/2039 | | BBB | | | 3,500,000 | | | | 3,443,187 | |
| OK DFA–Oklahoma City Univ | | 5.00% | | 8/1/2049 | | BBB- | | | 6,000,000 | | | | 5,329,472 | |
| Phoenix IDA–Basis Schs† | | 5.00% | | 7/1/2045 | | BB | | | 7,200,000 | | | | 6,753,169 | |
| Public Finance Authority† | | 4.00% | | 7/1/2061 | | Ba1 | | | 7,200,000 | | | | 4,850,710 | |
| Tuscarawas Co Eco Dev–Ashland Univ | | 6.00% | | 3/1/2045 | | NR | | | 5,000,000 | | | | 4,933,014 | |
| Univ of Illinois (AGM) | | 4.00% | | 4/1/2037 | | AA | | | 5,745,000 | | | | 5,263,961 | |
| WI PFA–MN Clg of Osteopatic Med†(d) | | 5.50% | | 12/1/2048 | | NR | | | 82,164 | | | | 25,471 | (e) |
| WI PFA–Wingate Univ | | 5.25% | | 10/1/2043 | | BBB- | | | 2,000,000 | | | | 1,887,764 | |
| WI PFA–Wingate Univ | | 5.25% | | 10/1/2048 | | BBB- | | | 6,000,000 | | | | 5,582,879 | |
| Total | | | | | | | | | | | | | 214,244,550 | |
| 108 | See Notes to Financial Statements. |
Schedule of Investments (continued)
HIGH INCOME MUNICIPAL BOND FUND September 30, 2022
| Investments | | Interest
Rate | | Maturity
Date | | Credit
Rating:
S&P or
Moody’s(a) | | Principal
Amount | | | Fair
Value | |
| Energy 0.15% | | | | | | | | | | | | | | |
| Lower AL Gas Dist–Goldman Sachs | | 5.00% | | 9/1/2034 | | A2 | | $ | 5,000,000 | | | $ | 5,039,339 | |
| | | | | | | | | | | | | | | |
| Financial Services 0.87% | | | | | | | | | | | | | | |
| Berks Co IDA–Tower Hlth | | 5.00% | | 11/1/2047 | | BB- | | | 12,925,000 | | | | 8,882,136 | |
| Berks Co IDA–Tower Hlth | | 5.00% | | 11/1/2050 | | BB- | | | 23,325,000 | | | | 15,375,768 | |
| MA Ed Fin Auth AMT | | 4.125% | | 7/1/2046 | | BBB | | | 6,670,000 | | | | 5,443,481 | |
| Total | | | | | | | | | | | | | 29,701,385 | |
| | | | | | | | | | | | | | | |
| General Obligation 12.31% | | | | | | | | | | | | | | |
| Academical Village CCD | | 3.625% | | 5/1/2040 | | NR | | | 2,320,000 | | | | 1,818,377 | |
| Academical Village CCD | | 4.00% | | 5/1/2051 | | NR | | | 6,000,000 | | | | 4,707,956 | |
| American Samoa GO† | | 5.00% | | 9/1/2038 | | Ba3 | | | 5,500,000 | | | | 5,560,211 | |
| American Samoa GO | | 6.625% | | 9/1/2035 | | Ba3 | | | 2,275,000 | | | | 2,398,563 | |
| American Samoa GO† | | 7.125% | | 9/1/2038 | | Ba3 | | | 7,020,000 | | | | 7,848,090 | |
| Arlington ISD–Brooks Academies | | 5.00% | | 6/15/2041 | | NR | | | 3,000,000 | | | | 2,601,491 | |
| Arlington ISD–Brooks Academies | | 5.00% | | 6/15/2051 | | NR | | | 4,230,000 | | | | 3,456,047 | (e) |
| Chicago Brd Ed | | 5.00% | | 12/1/2029 | | BB | | | 5,000,000 | | | | 5,084,440 | |
| Chicago Brd Ed | | 5.00% | | 12/1/2030 | | BB | | | 5,170,000 | | | | 5,239,770 | |
| Chicago Brd Ed | | 5.00% | | 12/1/2030 | | BB | | | 5,000,000 | | | | 5,022,718 | |
| Chicago Brd Ed | | 5.00% | | 12/1/2031 | | BB | | | 2,500,000 | | | | 2,523,694 | |
| Chicago Brd Ed | | 5.00% | | 12/1/2032 | | BB | | | 2,000,000 | | | | 2,012,501 | |
| Chicago Brd Ed | | 5.00% | | 12/1/2033 | | BB | | | 1,500,000 | | | | 1,506,486 | |
| Chicago Brd Ed | | 5.00% | | 12/1/2033 | | BB | | | 9,930,000 | | | | 9,879,001 | |
| Chicago Brd Ed | | 5.00% | | 12/1/2036 | | BB | | | 1,865,000 | | | | 1,839,000 | |
| Chicago Brd Ed | | 5.00% | | 12/1/2037 | | BB | | | 10,100,000 | | | | 9,930,409 | |
| Chicago Brd Ed | | 5.00% | | 12/1/2038 | | BB | | | 5,000,000 | | | | 4,892,509 | |
| Chicago Brd Ed | | 5.00% | | 12/1/2039 | | BB | | | 5,575,000 | | | | 5,445,326 | |
| Chicago Brd Ed | | 5.00% | | 12/1/2042 | | BB | | | 11,305,000 | | | | 10,542,463 | |
| Chicago Brd Ed | | 5.00% | | 12/1/2047 | | BB | | | 37,440,000 | | | | 35,242,661 | |
| Chicago Brd Ed | | 5.25% | | 12/1/2035 | | BB | | | 7,215,000 | | | | 7,217,115 | |
| Chicago Brd Ed | | 5.25% | | 12/1/2039 | | BB | | | 13,410,000 | | | | 13,499,992 | |
| Chicago Brd Ed | | 6.50% | | 12/1/2046 | | BB | | | 5,000,000 | | | | 5,301,119 | |
| Chicago Brd Ed† | | 6.75% | | 12/1/2030 | | BB | | | 2,000,000 | | | | 2,223,408 | |
| Chicago Brd Ed | | 7.00% | | 12/1/2044 | | BB | | | 2,180,000 | | | | 2,328,105 | |
| Chicago Brd Ed† | | 7.00% | | 12/1/2046 | | BB | | | 6,560,000 | | | | 7,176,598 | |
| Chicago GO | | 5.50% | | 1/1/2033 | | BBB+ | | | 3,305,000 | | | | 3,318,503 | |
| Chicago GO | | 5.50% | | 1/1/2037 | | BBB+ | | | 1,000,000 | | | | 1,003,039 | |
| Chicago GO | | 5.50% | | 1/1/2049 | | BBB+ | | | 9,090,000 | | | | 9,151,145 | |
| | See Notes to Financial Statements. | 109 |
Schedule of Investments (continued)
HIGH INCOME MUNICIPAL BOND FUND September 30, 2022
| Investments | | Interest
Rate | | Maturity
Date | | Credit
Rating:
S&P or
Moody’s(a) | | Principal
Amount | | | Fair
Value | |
| General Obligation (continued) | | | | | | | | | | | | | | |
| Chicago GO | | 6.00% | | 1/1/2038 | | BBB+ | | $ | 18,085,000 | | | $ | 18,710,788 | |
| Chicago O’Hare Arpt AMT | | 5.00% | | 1/1/2052 | | A+ | | | 5,000,000 | | | | 4,936,211 | |
| City of New Orleans LA | | 5.00% | | 12/1/2046 | | A+ | | | 10,000,000 | | | | 10,341,735 | |
| Coralville GO | | 4.00% | | 5/1/2041 | | A- | (c) | | 5,000,000 | | | | 4,492,045 | |
| Coralville GO | | 4.50% | | 6/1/2032 | | BB+ | | | 4,000,000 | | | | 4,019,722 | |
| Green Valley Ranch GO | | 5.875% | | 12/1/2050 | | NR | | | 5,750,000 | | | | 5,112,401 | |
| IL State GO | | 3.50% | | 6/1/2029 | | BBB+ | | | 4,520,000 | | | | 4,243,136 | |
| IL State GO | | 4.00% | | 10/1/2034 | | BBB+ | | | 10,070,000 | | | | 9,024,838 | |
| IL State GO | | 4.00% | | 6/1/2037 | | BBB+ | | | 7,040,000 | | | | 6,114,918 | |
| IL State GO | | 4.00% | | 3/1/2038 | | BBB+ | | | 1,125,000 | | | | 969,051 | |
| IL State GO | | 4.00% | | 3/1/2040 | | BBB+ | | | 2,200,000 | | | | 1,853,174 | |
| IL State GO | | 4.00% | | 11/1/2041 | | BBB+ | | | 2,730,000 | | | | 2,267,814 | |
| IL State GO | | 4.00% | | 11/1/2044 | | BBB+ | | | 2,990,000 | | | | 2,410,024 | |
| IL State GO | | 4.25% | | 10/1/2045 | | BBB+ | | | 10,500,000 | | | | 8,733,459 | |
| IL State GO | | 4.50% | | 11/1/2039 | | BBB+ | | | 1,230,000 | | | | 1,110,459 | |
| IL State GO | | 5.50% | | 5/1/2030 | | BBB+ | | | 9,545,000 | | | | 10,082,068 | |
| IL State GO | | 5.50% | | 5/1/2039 | | BBB+ | | | 8,280,000 | | | | 8,433,527 | |
| IL State GO(f) | | 5.50% | | 10/1/2039 | | NR | | | 4,000,000 | | | | 4,092,334 | |
| IL State GO | | 5.50% | | 3/1/2042 | | BBB+ | | | 5,250,000 | | | | 5,316,974 | |
| IL State GO | | 5.50% | | 3/1/2047 | | BBB+ | | | 15,270,000 | | | | 15,347,098 | |
| IL State GO | | 5.75% | | 5/1/2045 | | BBB+ | | | 1,000,000 | | | | 1,022,411 | |
| ME Fin Auth–Casella Waste AMT† | | 4.375% | #(b) | 8/1/2035 | | B | | | 1,250,000 | | | | 1,223,468 | |
| MI Strategic Fund–I-75 AMT (AGM) | | 4.25% | | 12/31/2038 | | AA | | | 2,000,000 | | | | 1,771,737 | |
| New Haven GO | | 5.50% | | 8/1/2033 | | BBB+ | | | 1,000,000 | | | | 1,071,341 | |
| New Haven GO | | 5.50% | | 8/1/2035 | | BBB+ | | | 660,000 | | | | 703,901 | |
| New Haven GO | | 5.50% | | 8/1/2037 | | BBB+ | | | 1,280,000 | | | | 1,357,624 | |
| NJ Trans Trust Fund | | Zero Coupon | | 12/15/2029 | | A3 | | | 18,840,000 | | | | 13,593,525 | |
| PR Comwlth GO | | Zero Coupon | | 7/1/2024 | | NR | | | 882,453 | | | | 811,501 | |
| PR Comwlth GO | | Zero Coupon | | 7/1/2033 | | NR | | | 96,439 | | | | 53,323 | |
| PR Comwlth GO | | Zero Coupon | | 11/1/2043 | | NR | | | 20,564,047 | | | | 10,307,729 | |
| PR Comwlth GO | | 4.00% | | 7/1/2033 | | NR | | | 239,233 | | | | 210,916 | |
| PR Comwlth GO | | 4.00% | | 7/1/2035 | | NR | | | 122,318 | | | | 104,862 | |
| PR Comwlth GO | | 4.00% | | 7/1/2037 | | NR | | | 86,075 | | | | 70,855 | |
| PR Comwlth GO | | 4.00% | | 7/1/2041 | | NR | | | 12,450,000 | | | | 9,752,328 | |
| PR Comwlth GO | | 4.00% | | 7/1/2046 | | NR | | | 27,638,156 | | | | 20,772,573 | |
| PR Comwlth GO | | 5.25% | | 7/1/2023 | | NR | | | 2,973,728 | | | | 2,987,689 | |
| PR Comwlth GO | | 5.375% | | 7/1/2025 | | NR | | | 6,049,896 | | | | 6,113,025 | |
| 110 | See Notes to Financial Statements. |
Schedule of Investments (continued)
HIGH INCOME MUNICIPAL BOND FUND September 30, 2022
| Investments | | Interest
Rate | | Maturity
Date | | Credit
Rating:
S&P or
Moody’s(a) | | Principal
Amount | | | Fair
Value | |
| General Obligation (continued) | | | | | | | | | | | | | | |
| PR Comwlth GO | | 5.625% | | 7/1/2027 | | NR | | $ | 6,482,130 | | | $ | 6,624,943 | |
| PR Comwlth GO | | 5.625% | | 7/1/2029 | | NR | | | 2,865,493 | | | | 2,935,713 | |
| PR Comwlth GO | | 5.75% | | 7/1/2031 | | NR | | | 2,783,229 | | | | 2,843,328 | |
| Scranton GO† | | 5.00% | | 9/1/2028 | | BB+ | | | 500,000 | | | | 503,992 | |
| Scranton GO† | | 5.00% | | 9/1/2029 | | BB+ | | | 1,000,000 | | | | 1,007,521 | |
| Scranton GO | | 5.00% | | 11/15/2032 | | BB+ | | | 6,930,000 | | | | 6,952,748 | |
| WI PFA–American Dream† | | 7.00% | | 12/1/2050 | | NR | | | 24,050,000 | | | | 20,253,698 | |
| Total | | | | | | | | | | | | | 419,433,264 | |
| | | | | | | | | | | | | | | |
| Health Care 14.81% | | | | | | | | | | | | | | |
| Antelope Valley Hlth | | 5.00% | | 3/1/2041 | | BBB | | | 4,000,000 | | | | 3,718,792 | |
| Antelope Valley Hlth | | 5.00% | | 3/1/2046 | | BBB | | | 3,300,000 | | | | 2,940,969 | |
| Antelope Valley Hlth | | 5.25% | | 3/1/2036 | | BBB | | | 1,000,000 | | | | 1,001,681 | |
| Appalachian Regl Hlth | | 4.00% | | 7/1/2051 | | BBB | | | 1,675,000 | | | | 1,299,198 | |
| Appalachian Regl Hlth | | 4.00% | | 7/1/2056 | | BBB | | | 1,125,000 | | | | 847,365 | |
| AR DFA–CARTI | | 3.125% | | 7/1/2036 | | NR | | | 915,000 | | | | 678,402 | |
| AR DFA–CARTI | | 3.50% | | 7/1/2046 | | NR | | | 2,460,000 | | | | 1,631,299 | |
| Atlanta Dev Auth–Georgia Proton | | 6.00% | | 1/1/2023 | | NR | | | 2,000,000 | | | | 1,060,000 | |
| Atlanta Dev Auth–Georgia Proton | | 6.75% | | 1/1/2035 | | NR | | | 1,500,000 | | | | 795,000 | |
| Atlanta Dev Auth–Georgia Proton | | 7.00% | | 1/1/2040 | | NR | | | 8,000,000 | | | | 4,240,000 | |
| Berks Co IDA–Tower Hlth | | 4.00% | | 11/1/2047 | | BB- | | | 15,315,000 | | | | 9,084,781 | |
| Berks Co IDA–Tower Hlth | | 4.00% | | 11/1/2050 | | BB- | | | 6,000,000 | | | | 3,507,190 | |
| Berks Co IDA–Tower Hlth | | 5.00% | #(b) | 2/1/2040 | | BB- | | | 3,235,000 | | | | 2,906,361 | |
| Berks Co IDA–Tower Hlth | | 5.00% | #(b) | 2/1/2040 | | BB- | | | 1,505,000 | | | | 1,269,084 | |
| Blaine Sr Hsg & Hlthcare–Crest View | | 6.125% | | 7/1/2050 | | NR | | | 5,000,000 | | | | 3,044,738 | |
| Bucks Co IDA–Grand View Hosp | | 4.00% | | 7/1/2046 | | BB | | | 20,840,000 | | | | 15,067,935 | |
| Bucks Co IDA–Grand View Hosp | | 4.00% | | 7/1/2051 | | BB | | | 1,050,000 | | | | 723,212 | (e) |
| Bucks Co IDA–Grand View Hosp | | 5.00% | | 7/1/2054 | | BB | | | 5,500,000 | | | | 4,612,234 | |
| Buffalo & Erie IDC–Catholic Hlth | | 5.00% | | 7/1/2040 | | BB+ | | | 11,020,000 | | | | 9,516,840 | |
| CA Muni Fin–Cmnty Hlth Ctr† | | 5.00% | | 12/1/2046 | | NR | | | 1,490,000 | | | | 1,403,452 | (e) |
| CA Stwde–Daughters of Charity | | 5.50% | | 7/1/2039 | | NR | | | 176,089 | | | | 165,523 | |
| CA Stwde–Daughters of Charity | | 5.75% | | 7/1/2024 | | NR | | | 43,117 | | | | 40,530 | |
| CA Stwde–Daughters of Charity | | 5.75% | | 7/1/2035 | | NR | | | 86,234 | | | | 81,060 | |
| CA Stwde–Eskaton Pptys | | 5.25% | | 11/15/2034 | | BBB- | | | 1,640,000 | | | | 1,632,697 | |
| CA Stwde–Loma Linda Univ Med Ctr† | | 5.00% | | 12/1/2041 | | BB- | | | 3,425,000 | | | | 3,184,319 | |
| CA Stwde–Loma Linda Univ Med Ctr | | 5.25% | | 12/1/2044 | | BB- | | | 8,805,000 | | | | 8,832,897 | |
| CA Stwde–Loma Linda Univ Med Ctr† | | 5.25% | | 12/1/2056 | | BB- | | | 23,545,000 | | | | 21,811,601 | |
| | See Notes to Financial Statements. | 111 |
Schedule of Investments (continued)
HIGH INCOME MUNICIPAL BOND FUND September 30, 2022
| Investments | | Interest
Rate | | Maturity
Date | | Credit
Rating:
S&P or
Moody’s(a) | | Principal
Amount | | | Fair
Value | |
| Health Care (continued) | | | | | | | | | | | | | | |
| CA Stwde–Loma Linda Univ Med Ctr | | 5.50% | | 12/1/2054 | | BB- | | $ | 13,205,000 | | | $ | 13,280,212 | |
| CA Stwde–Loma Linda Univ Med Ctr† | | 5.50% | | 12/1/2058 | | BB- | | | 17,750,000 | | | | 17,092,432 | |
| Chester Co Hlth & Ed–Immaculata Univ | | 5.00% | | 11/1/2037 | | BB- | (c) | | 4,000,000 | | | | 3,320,743 | |
| Chester Co Hlth & Ed–Immaculata Univ | | 5.00% | | 11/1/2046 | | BB- | (c) | | 4,100,000 | | | | 3,120,861 | |
| Clackamas Co Hosp–Rose Villa | | 5.375% | | 11/15/2055 | | NR | | | 1,500,000 | | | | 1,317,253 | |
| Crawford Hsp Auth–Meadville Med | | 6.00% | | 6/1/2046 | | NR | | | 2,225,000 | | | | 2,241,885 | |
| Crawford Hsp Auth–Meadville Med | | 6.00% | | 6/1/2051 | | NR | | | 2,600,000 | | | | 2,615,445 | |
| Cuyahoga Co Hsp–Metrohealth | | 5.00% | | 2/15/2057 | | BBB | | | 5,750,000 | | | | 5,388,755 | |
| Cuyahoga Co Hsp–Metrohealth | | 5.50% | | 2/15/2052 | | BBB | | | 8,175,000 | | | | 8,274,253 | |
| Cuyahoga Co Hsp–Metrohealth | | 5.50% | | 2/15/2057 | | BBB | | | 4,900,000 | | | | 4,949,970 | |
| Denver Hlth & Hsp Auth | | 5.25% | | 12/1/2045 | | BBB | | | 3,700,000 | | | | 3,703,774 | |
| Duluth Econ Dev Auth–Essentia Health | | 5.25% | | 2/15/2058 | | A- | | | 18,000,000 | | | | 18,020,648 | |
| Duluth EDA–Essentia Hlth | | 5.00% | | 2/15/2053 | | A- | | | 5,000,000 | | | | 4,912,470 | |
| Duluth EDA–St Lukes Hsp | | 5.25% | | 6/15/2052 | | BBB- | | | 5,000,000 | | | | 4,731,271 | |
| Franklin Hlth–Provision Proton†(d) | | 7.50% | | 6/1/2047 | | NR | | | 7,635,000 | | | | 2,061,450 | |
| Fruita CO Hlth–Canyons Hosp & Med Centr† | | 5.375% | | 1/1/2033 | | NR | | | 3,400,000 | | | | 3,259,002 | |
| Fruita CO Hlth–Canyons Hosp & Med Centr† | | 5.50% | | 1/1/2048 | | NR | | | 11,000,000 | | | | 9,761,261 | |
| Fulton Co Med Ctr | | 5.00% | | 7/1/2046 | | NR | | | 4,450,000 | | | | 4,074,481 | |
| Fulton Co Med Ctr | | 5.00% | | 7/1/2051 | | NR | | | 5,000,000 | | | | 4,516,215 | |
| Gainesville & Hall Co Hsp–NE GA Hlth GTD | | 5.50% | | 8/15/2054 | | AA | | | 3,600,000 | | | | 3,786,765 | |
| Glendale IDA–Beatitudes | | 5.00% | | 11/15/2036 | | NR | | | 1,500,000 | | | | 1,347,869 | |
| Glendale IDA–Beatitudes | | 5.00% | | 11/15/2040 | | NR | | | 3,000,000 | | | | 2,599,516 | |
| Glendale IDA–Beatitudes | | 5.00% | | 11/15/2045 | | NR | | | 1,400,000 | | | | 1,162,116 | |
| Glendale IDA–Beatitudes | | 5.00% | | 11/15/2053 | | NR | | | 6,000,000 | | | | 4,804,188 | |
| Guadalupe Co–Seguin City Hsp | | 5.00% | | 12/1/2040 | | BB | | | 4,880,000 | | | | 4,509,992 | |
| Guadalupe Co–Seguin City Hsp | | 5.00% | | 12/1/2045 | | BB | | | 910,000 | | | | 817,319 | |
| Harris Co Cultural Ed–Brazos | | 5.125% | | 1/1/2048 | | BB+ | (c) | | 1,655,000 | | | | 1,425,564 | |
| Holmes Co Hsp–Doctors Mem Hsp(d) | | 5.75% | | 11/1/2026 | | NR | | | 3,760,000 | | | | 3,523,060 | |
| Holmes Co Hsp–Doctors Mem Hsp | | 6.00% | | 11/1/2038 | | NR | | | 7,115,000 | | | | 6,435,266 | (e) |
| Howard Co Retmt Cmnty–Vantage House | | 5.00% | | 4/1/2044 | | NR | | | 2,955,000 | | | | 2,460,269 | |
| Howard Co Retmt Cmnty–Vantage House | | 5.00% | | 4/1/2046 | | NR | | | 7,000,000 | | | | 5,741,858 | |
| King Co Pub Hsp–Snoqualmie Vly Hsp | | 6.25% | | 12/1/2045 | | NR | | | 4,000,000 | | | | 4,039,226 | |
| Kirkwood IDA–Aberdeen Hts | | 5.25% | | 5/15/2042 | | BB- | (c) | | 1,750,000 | | | | 1,498,935 | |
| Kirkwood IDA–Aberdeen Hts | | 5.25% | | 5/15/2050 | | BB- | (c) | | 5,250,000 | | | | 4,280,670 | |
| KY EDFA–Masonic Homes | | 5.375% | | 11/15/2032 | | NR | | | 1,100,000 | | | | 1,006,174 | |
| 112 | See Notes to Financial Statements. |
Schedule of Investments (continued)
HIGH INCOME MUNICIPAL BOND FUND September 30, 2022
| Investments | | Interest
Rate | | Maturity
Date | | Credit
Rating:
S&P or
Moody’s(a) | | Principal
Amount | | | Fair
Value | |
| Health Care (continued) | | | | | | | | | | | | | | |
| LA Env Facs–St James Place | | 6.25% | | 11/15/2045 | | NR | | $ | 6,100,000 | | | $ | 5,711,235 | (e) |
| MA DFA–Ascentria Care† | | 5.00% | | 7/1/2041 | | NR | | | 3,500,000 | | | | 2,962,367 | |
| MA DFA–Ascentria Care† | | 5.00% | | 7/1/2051 | | NR | | | 5,625,000 | | | | 4,423,773 | |
| MA DFA–Ascentria Care† | | 5.00% | | 7/1/2056 | | NR | | | 2,310,000 | | | | 1,767,235 | |
| Magnolia West CDD | | 5.35% | | 5/1/2037 | | NR | | | 225,000 | | | | 226,331 | |
| MD Hlth & HI Ed–Doctors | | 5.00% | | 7/1/2038 | | A3 | | | 7,275,000 | | | | 7,269,256 | |
| Montgomery Co IDA–Whitemarsh | | 5.375% | | 1/1/2050 | | NR | | | 4,985,000 | | | | 4,670,329 | |
| Moon IDC–Baptist Homes | | 6.00% | | 7/1/2045 | | NR | | | 9,250,000 | | | | 7,887,849 | |
| Muskingum Co Hsp–Genesis Hlthcare | | 5.00% | | 2/15/2033 | | BB+ | | | 2,765,000 | | | | 2,640,322 | |
| Muskingum Co Hsp–Genesis Hlthcare | | 5.00% | | 2/15/2044 | | BB+ | | | 13,690,000 | | | | 12,153,506 | �� |
| Muskingum Co Hsp–Genesis Hlthcare | | 5.00% | | 2/15/2048 | | BB+ | | | 7,000,000 | | | | 6,050,983 | |
| NH Nat Fin Auth–Ascentria Care† | | 5.00% | | 7/1/2041 | | NR | | | 1,885,000 | | | | 1,606,411 | |
| NH Nat Fin Auth–Ascentria Care† | | 5.00% | | 7/1/2051 | | NR | | | 3,225,000 | | | | 2,556,878 | |
| NH Nat Fin Auth–Ascentria Care† | | 5.00% | | 7/1/2056 | | NR | | | 1,910,000 | | | | 1,473,492 | |
| Niagara Area Dev Corp–Catholic Hlth | | 5.00% | | 7/1/2052 | | BB+ | | | 8,545,000 | | | | 6,828,841 | |
| NJ EDA–Bancroft Neuro | | 5.00% | | 6/1/2036 | | NR | | | 1,500,000 | | | | 1,457,965 | |
| NM Hsp–Gerald Champion | | 5.50% | | 7/1/2042 | | A | | | 5,625,000 | | | | 5,628,707 | |
| NY Dorm–Catholic Hlth | | 4.00% | | 7/1/2045 | | BB+ | | | 2,000,000 | | | | 1,430,108 | |
| Oconee Co IDA–Presby Village | | 6.25% | | 12/1/2048 | | NR | | | 2,000,000 | | | | 1,598,368 | |
| Oconee Co IDA–Presby Village | | 6.375% | | 12/1/2053 | | NR | | | 3,000,000 | | | | 2,397,635 | |
| OK DFA–OU Med | | 5.25% | | 8/15/2048 | | Ba2 | | | 2,250,000 | | | | 1,867,128 | |
| OK DFA–OU Med | | 5.50% | | 8/15/2052 | | Ba2 | | | 12,580,000 | | | | 10,742,900 | |
| Oroville–Oroville Hsp | | 5.25% | | 4/1/2039 | | B+ | | | 2,060,000 | | | | 1,984,097 | |
| Oroville–Oroville Hsp | | 5.25% | | 4/1/2049 | | B+ | | | 1,000,000 | | | | 906,650 | |
| Oroville–Oroville Hsp | | 5.25% | | 4/1/2054 | | B+ | | | 14,940,000 | | | | 13,304,608 | |
| PA Hosp Auth–Doylestown | | 4.00% | | 7/1/2045 | | BB | | | 4,375,000 | | | | 3,079,692 | |
| PA Hosp Auth–Doylestown | | 5.00% | | 7/1/2049 | | BB | | | 2,375,000 | | | | 1,969,717 | |
| Palomar Hlth | | 5.00% | | 11/1/2039 | | BBB | | | 2,525,000 | | | | 2,497,765 | |
| Philadelphia IDA–Gtr Philadelphia Hlth | | 6.50% | | 6/1/2045 | | NR | | | 2,485,000 | | | | 2,421,552 | |
| Philadelphia IDA–Gtr Philadelphia Hlth | | 6.625% | | 6/1/2050 | | NR | | | 3,415,000 | | | | 3,353,048 | |
| RI Hlth & Ed–Care New England | | 5.00% | | 9/1/2036 | | B+ | | | 7,000,000 | | | | 6,070,323 | |
| Roanoke EDA–Carilion Clinic | | 3.00% | | 7/1/2045 | | AA- | | | 7,044,000 | | | | 4,991,309 | |
| SC Jobs EDA–Hampton Regl Med | | 5.00% | | 11/1/2042 | | NR | | | 3,815,000 | | | | 3,665,644 | (e) |
| SC Jobs EDA–Hampton Regl Med | | 5.00% | | 11/1/2046 | | NR | | | 6,070,000 | | | | 5,725,966 | (e) |
| SC Jobs EDA–Green Charter Schools† | | 4.00% | | 6/1/2036 | | NR | | | 1,000,000 | | | | 836,385 | |
| SC Jobs EDA–Green Charter Schools† | | 4.00% | | 6/1/2046 | | NR | | | 1,250,000 | | | | 923,241 | |
| SE Port Auth–Memorial Hlth | | 5.50% | | 12/1/2043 | | B+ | (c) | | 5,025,000 | | | | 4,758,923 | (e) |
| | See Notes to Financial Statements. | 113 |
Schedule of Investments (continued)
HIGH INCOME MUNICIPAL BOND FUND September 30, 2022
| Investments | | Interest
Rate | | Maturity
Date | | Credit
Rating:
S&P or
Moody’s(a) | | Principal
Amount | | | Fair
Value | |
| Health Care (continued) | | | | | | | | | | | | | | |
| SE Port Auth–Memorial Hlth | | 6.00% | | 12/1/2042 | | B+ | (c) | $ | 1,660,000 | | | $ | 1,667,484 | |
| Shelby Co–Farms at Bailey Station | | 5.75% | | 10/1/2059 | | NR | | | 10,000,000 | | | | 8,468,785 | |
| Tarrant Cnty TX Cultural Edu Fac(g) | | 5.00% | | 7/1/2053 | | A1 | | | 9,550,000 | | | | 9,454,862 | |
| Tulsa Co Industrial Auth–Montereau | | 5.25% | | 11/15/2045 | | BBB- | (c) | | 2,750,000 | | | | 2,710,014 | |
| Upper San Juan Hlth Dist | | 6.00% | | 6/1/2041 | | NR | | | 2,225,000 | | | | 2,052,611 | (e) |
| Upper San Juan Hlth Dist | | 6.125% | | 6/1/2046 | | NR | | | 3,015,000 | | | | 2,739,473 | (e) |
| WA HFC–Rockwood† | | 6.00% | | 1/1/2024 | | NR | | | 470,000 | | | | 471,813 | |
| Ward Co Hlth–Trinity Hlth | | 5.00% | | 6/1/2053 | | BB+ | | | 8,750,000 | | | | 7,273,766 | |
| Washington Co–Memorial Hlth | | 6.75% | | 12/1/2052 | | NR | | | 15,000,000 | | | | 13,621,656 | |
| WI Hlth & Ed–American Baptist | | 5.00% | | 8/1/2039 | | NR | | | 1,625,000 | | | | 1,332,923 | |
| WI Hlth & Ed–Sauk-Prarie Mem Hsp | | 5.375% | | 2/1/2048 | | Ba3 | | | 4,000,000 | | | | 4,006,524 | |
| WI Hlth & Ed–St. Camillus | | 5.00% | | 11/1/2039 | | NR | | | 1,000,000 | | | | 879,431 | |
| WI Hlth & Ed–St. Camillus | | 5.00% | | 11/1/2046 | | NR | | | 1,100,000 | | | | 910,953 | |
| WI PFA–Alabama Proton† | | 6.85% | | 10/1/2047 | | NR | | | 3,000,000 | | | | 2,398,696 | (e) |
| WI PFA–Bancroft Neuro† | | 4.625% | | 6/1/2036 | | NR | | | 4,330,000 | | | | 3,957,475 | |
| WI PFA–Bancroft Neuro† | | 5.125% | | 6/1/2048 | | NR | | | 6,900,000 | | | | 6,307,349 | |
| WI PFA–Cone Health | | 5.00% | | 10/1/2052 | | AA- | | | 8,750,000 | | | | 8,761,037 | |
| WI PFA–Delray Beach Radiation† | | 6.85% | | 11/1/2046 | | NR | | | 2,000,000 | | | | 1,488,850 | |
| WI PFA–Rose Villa† | | 5.75% | | 11/15/2044 | | NR | | | 2,035,000 | | | | 2,131,776 | |
| Wilson Co Hsp | | 5.60% | | 9/1/2036 | | NR | | | 3,530,000 | | | | 2,731,180 | (e) |
| Total | | | | | | | | | | | | | 504,385,525 | |
| | | | | | | | | | | | | | | |
| Housing 3.51% | | | | | | | | | | | | | | |
| AZ IDA–NCCU Prop Student Hsg (BAM) | | 5.00% | | 6/1/2058 | | AA | | | 2,500,000 | | | | 2,554,664 | |
| CA Cmty Hsg–Sausalito† | | 3.00% | | 2/1/2057 | | NR | | | 12,895,000 | | | | 8,040,988 | |
| CA Cmty Hsg–Sausalito† | | 4.00% | | 2/1/2050 | | NR | | | 11,500,000 | | | | 8,014,442 | |
| CA Cmty Hsg–The Arbors† | | 5.00% | | 8/1/2050 | | NR | | | 9,000,000 | | | | 7,681,200 | |
| CA HFA–MFH | | 3.25% | | 8/20/2036 | | BBB | | | 19,256,079 | | | | 16,497,440 | |
| CA HFA–MFH | | 4.25% | | 1/15/2035 | | BBB+ | | | 3,387,153 | | | | 3,248,273 | |
| CA Muni Fin–Caritas Affordable Hsg | | 5.25% | | 8/15/2039 | | A- | | | 550,000 | | | | 555,648 | |
| CEDA–Provident Student Hsg | | 5.00% | | 8/1/2057 | | Baa3 | | | 1,885,000 | | | | 1,705,989 | |
| CMFA–Latitude 33† | | 4.00% | | 12/1/2045 | | NR | | | 5,000,000 | | | | 3,560,575 | |
| CSCDA–Jefferson-Anaheim† | | 3.125% | | 8/1/2056 | | NR | | | 9,500,000 | | | | 6,104,238 | |
| CSCDA–Orange† | | 3.00% | | 3/1/2057 | | NR | | | 10,000,000 | | | | 6,265,780 | |
| CSCDA–Parallel-Anaheim† | | 4.00% | | 8/1/2056 | | NR | | | 4,450,000 | | | | 3,326,511 | |
| CSCDA–Pasadena† | | 4.00% | | 12/1/2056 | | NR | | | 15,000,000 | | | | 9,923,071 | |
| CSCDA–Westgate Pasadena† | | 3.00% | | 6/1/2047 | | NR | | | 15,640,000 | | | | 10,704,130 | |
| CSCDA–Westgate Pasadena† | | 4.00% | | 6/1/2057 | | NR | | | 5,000,000 | | | | 3,295,944 | |
| 114 | See Notes to Financial Statements. |
Schedule of Investments (continued)
HIGH INCOME MUNICIPAL BOND FUND September 30, 2022
| Investments | | Interest
Rate | | Maturity
Date | | Credit
Rating:
S&P or
Moody’s(a) | | Principal
Amount | | | Fair
Value | |
| Housing (continued) | | | | | | | | | | | | | | |
| CSCDA–Waterscape† | | 4.00% | | 9/1/2046 | | NR | | $ | 2,250,000 | | | $ | 1,584,180 | |
| LA Pub Facs Auth–Provident LSU | | 5.00% | | 7/1/2059 | | A3 | | | 2,915,000 | | | | 2,874,340 | |
| MI HDA | | 3.60% | | 10/1/2060 | | AA | | | 6,330,000 | | | | 4,714,488 | |
| NH National Fin Auth–Hsg Sec | | 4.375% | | 9/20/2036 | | BBB | | | 5,483,121 | | | | 4,996,826 | |
| Roanoke Co EDA–Richfield Living | | 5.25% | | 9/1/2049 | | NR | | | 15,000,000 | | | | 10,259,304 | |
| Roanoke Co EDA–Richfield Living | | 5.375% | | 9/1/2054 | | NR | | | 5,500,000 | | | | 3,741,602 | |
| Total | | | | | | | | | | | | | 119,649,633 | |
| | | | | | | | | | | | | | | |
| Lease Obligations 1.34% | | | | | | | | | | | | | | |
| Met Pier & Expo Auth–McCormick Place (NPFGC)(FGIC) | | 5.50% | | 6/15/2029 | | A- | | | 3,000,000 | | | | 3,163,068 | |
| NJ EDA–Bldgs | | 5.00% | | 6/15/2047 | | A3 | | | 5,450,000 | | | | 5,398,328 | |
| NJ EDA–Goethals Brdg AMT | | 5.375% | | 1/1/2043 | | BBB+ | | | 1,175,000 | | | | 1,176,539 | |
| NJ EDA–Goethals Brdg AMT | | 5.625% | | 1/1/2052 | | BBB+ | | | 5,000,000 | | | | 5,015,653 | |
| NJ EDA–Sch Facs | | 5.00% | | 6/15/2042 | | A3 | | | 2,000,000 | | | | 1,982,698 | |
| NJ EDA–Sch Facs | | 5.00% | | 6/15/2043 | | A3 | | | 5,000,000 | | | | 4,953,670 | |
| NJ EDA–Sch Facs | | 5.50% | | 6/15/2029 | | A3 | | | 3,575,000 | | | | 3,881,705 | |
| NJ EDA–State House | | 5.00% | | 6/15/2043 | | A3 | | | 3,800,000 | | | | 3,764,789 | |
| NJ Trans Trust Fund | | Zero Coupon | | 12/15/2034 | | A3 | | | 13,420,000 | | | | 7,233,296 | |
| NJ Trans Trust Fund | | 5.00% | | 12/15/2035 | | A3 | | | 3,250,000 | | | | 3,284,424 | |
| PR Pub Fin Corp(d) | | 5.50% | | 8/1/2031 | | NR | | | 12,250,000 | | | | 459,386 | |
| St Louis Fin Corp–Convention Center (AGM) | | 5.00% | | 10/1/2045 | | AA | | | 2,500,000 | | | | 2,530,923 | |
| St Louis Fin Corp–Convention Center (AGM) | | 5.00% | | 10/1/2049 | | AA | | | 2,625,000 | | | | 2,651,126 | |
| Total | | | | | | | | | | | | | 45,495,605 | |
| | | | | | | | | | | | | | | |
| Other Revenue 6.67% | | | | | | | | | | | | | | |
| Arlington HI Ed Fin Corp–Arlington Classics | | 5.00% | | 8/15/2045 | | BBB- | | | 2,250,000 | | | | 2,132,007 | |
| Arlington Hi Ed Fin Corp–Newman Intl Aca | | 5.00% | | 8/15/2051 | | NR | | | 1,500,000 | | | | 1,268,220 | |
| Arlington Hi Ed Fin Corp–Newman Intl Acad | | 5.00% | | 8/15/2041 | | NR | | | 900,000 | | | | 805,661 | |
| Arlington Hi Ed Fin Corp–Newman Intl Acad | | 5.50% | | 8/15/2046 | | NR | | | 5,000,000 | | | | 4,696,625 | |
| AZ IDA–American Charter Sch† | | 6.00% | | 7/1/2047 | | BB+ | | | 2,460,000 | | | | 2,479,829 | |
| AZ IDA–Odyssey Prep† | | 5.50% | | 7/1/2052 | | BB- | | | 750,000 | | | | 712,119 | |
| Build NYC Res Corp–Hellenic Charter† | | 5.00% | | 12/1/2041 | | NR | | | 1,200,000 | | | | 1,104,061 | |
| Build NYC Res Corp–Hellenic Charter† | | 5.00% | | 12/1/2051 | | NR | | | 1,650,000 | | | | 1,448,506 | |
| Build NYC Res Corp–Hellenic Charter† | | 5.00% | | 12/1/2055 | | NR | | | 1,000,000 | | | | 859,268 | |
| Build NYC Res Corp–Shefa School† | | 5.00% | | 6/15/2051 | | NR | | | 9,410,000 | | | | 8,533,095 | |
| CA Sch Fin Auth–Kipp LA† | | 5.125% | | 7/1/2044 | | BBB | | | 2,390,000 | | | | 2,385,270 | |
| Cap Trust Agy–Edu Growth Chtr Sch† | | 5.00% | | 7/1/2056 | | NR | | | 23,250,000 | | | | 19,698,142 | |
| | See Notes to Financial Statements. | 115 |
Schedule of Investments (continued)
HIGH INCOME MUNICIPAL BOND FUND September 30, 2022
| Investments | | Interest
Rate | | Maturity
Date | | Credit
Rating:
S&P or
Moody’s(a) | | Principal
Amount | | | Fair
Value | |
| Other Revenue (continued) | | | | | | | | | | | | | | |
| Cap Trust Agy–Franklin Academy† | | 5.00% | | 12/15/2040 | | NR | | $ | 3,640,000 | | | $ | 3,361,185 | |
| Cap Trust Agy–Franklin Academy† | | 5.00% | | 12/15/2050 | | NR | | | 6,250,000 | | | | 5,481,085 | |
| Cap Trust Agy–Franklin Academy† | | 5.00% | | 12/15/2055 | | NR | | | 8,535,000 | | | | 7,316,161 | |
| Chester Co IDA–Collegium Charter Sch | | 5.125% | | 10/15/2037 | | BB | | | 1,000,000 | | | | 948,246 | |
| Chester Co IDA–Collegium Charter Sch | | 5.25% | | 10/15/2047 | | BB | | | 2,500,000 | | | | 2,189,933 | |
| Chester Co IDA–Collegium Charter Sch | | 5.375% | | 10/15/2042 | | BB | | | 5,000,000 | | | | 5,003,438 | |
| Cleveland Co Port Auth–Playhouse Sq | | 5.25% | | 12/1/2038 | | BB+ | | | 1,400,000 | | | | 1,398,385 | |
| Cleveland Co Port Auth–Playhouse Sq | | 5.50% | | 12/1/2043 | | BB+ | | | 1,850,000 | | | | 1,857,515 | |
| Cleveland Co Port Auth–Playhouse Sq | | 5.50% | | 12/1/2053 | | BB+ | | | 11,485,000 | | | | 11,365,782 | |
| Clifton Higher Ed–IDEA Pub Schs | | 6.00% | | 8/15/2043 | | A- | | | 1,000,000 | | | | 1,014,015 | |
| Clifton Higher Ed–Intl Ldrshp Sch | | 6.125% | | 8/15/2048 | | NR | | | 22,025,000 | | | | 22,389,216 | |
| FL DFC–FL Charter Foundation† | | 5.00% | | 7/15/2046 | | NR | | | 4,000,000 | | | | 3,591,954 | (e) |
| FL DFC–Mater Admy | | 5.00% | | 6/15/2050 | | BBB | | | 2,140,000 | | | | 2,081,551 | |
| FL DFC–Mater Admy | | 5.00% | | 6/15/2055 | | BBB | | | 1,600,000 | | | | 1,524,788 | |
| FL DFC–Palm Bay Admy† | | Zero Coupon | | 5/15/2037 | | NR | | | 1,220,000 | | | | 244,000 | |
| FL DFC–Palm Bay Admy† | | Zero Coupon | | 5/15/2037 | | NR | | | 940,000 | | | | 9 | |
| FL DFC–Palm Bay Admy† | | 6.375% | | 5/15/2037 | | NR | | | 2,620,000 | | | | 2,177,853 | |
| FL DFC–Renaissance Chtr Sch 2015† | | 6.125% | | 6/15/2046 | | NR | | | 5,000,000 | | | | 5,090,632 | |
| FL DFC–Renaissance Chtr Sch 2020† | | 5.00% | | 9/15/2040 | | NR | | | 1,050,000 | | | | 964,726 | |
| FL DFC–Renaissance Chtr Sch 2020† | | 5.00% | | 9/15/2050 | | NR | | | 2,200,000 | | | | 1,919,588 | |
| Florence Twn IDA–Legacy Trad Sch† | | 6.00% | | 7/1/2043 | | BB+ | | | 3,250,000 | | | | 3,314,808 | |
| GA World Congress–Convention Ctr Hotel† | | 5.00% | | 1/1/2054 | | NR | | | 17,920,000 | | | | 13,849,006 | |
| IL Fin Auth–Acero Charter† | | 4.00% | | 10/1/2034 | | BB+ | | | 440,000 | | | | 377,723 | |
| IL Fin Auth–Acero Charter† | | 4.00% | | 10/1/2035 | | BB+ | | | 1,155,000 | | | | 979,343 | |
| Jefferson Parish Econ Dev Dist–Kenner† | | 5.50% | | 6/15/2038 | | NR | | | 3,200,000 | | | | 3,120,941 | |
| Jefferson Parish Econ Dev Dist–Kenner† | | 5.625% | | 6/15/2048 | | NR | | | 4,350,000 | | | | 4,137,205 | |
| Main St Nat Gas–Macquarie | | 5.00% | | 5/15/2043 | | A3 | | | 1,900,000 | | | | 1,858,705 | |
| Main St Nat Gas–Macquarie | | 5.00% | | 5/15/2049 | | A3 | | | 5,750,000 | | | | 5,514,408 | |
| Maricopa Co IDA–Legacy Schools† | | 5.00% | | 7/1/2049 | | BB+ | | | 2,335,000 | | | | 2,117,768 | |
| Maricopa Co IDA–Legacy Schools† | | 5.00% | | 7/1/2054 | | BB+ | | | 1,465,000 | | | | 1,309,291 | |
| Maricopa Co IDA–Paradise Schools† | | 5.00% | | 7/1/2047 | | BB+ | | | 4,000,000 | | | | 3,582,000 | |
| MD EDC–Chesapeake Bay Hyatt(d) | | 5.00% | | 12/1/2031 | | NR | | | 10,700,000 | | | | 6,420,000 | |
| MD EDC–Chesapeake Bay Hyatt(d) | | 5.25% | | 12/1/2031 | | NR | | | 3,000,000 | | | | 1,800,000 | |
| MI Fin Auth–Bradford Admy | | 4.30% | | 9/1/2030 | | NR | | | 970,000 | | | | 861,690 | |
| MI Fin Auth–Bradford Admy | | 4.80% | | 9/1/2040 | | NR | | | 1,845,000 | | | | 1,494,000 | |
| MI Fin Auth–Bradford Admy | | 5.00% | | 9/1/2050 | | NR | | | 3,010,000 | | | | 2,327,089 | |
| MI Pub Ed–Crescent Admy | | 7.00% | | 10/1/2036 | | NR | | | 610,000 | | | | 610,130 | |
| 116 | See Notes to Financial Statements. |
Schedule of Investments (continued)
HIGH INCOME MUNICIPAL BOND FUND September 30, 2022
| Investments | | Interest
Rate | | Maturity
Date | | Credit
Rating:
S&P or
Moody’s(a) | | Principal
Amount | | | Fair
Value | |
| Other Revenue (continued) | | | | | | | | | | | | | | |
| Middlesex Co Impt Auth–Heldrich Ctr | | 6.125% | | 1/1/2025 | | NR | | $ | 2,790,000 | | | $ | 55,800 | |
| Middlesex Co Impt Auth–Heldrich Ctr | | 6.25% | | 1/1/2037 | | NR | | | 5,755,000 | | | | 115,100 | |
| Phoenix IDA–Basis Schs† | | 5.00% | | 7/1/2046 | | BB | | | 2,000,000 | | | | 1,868,154 | |
| Pima Co IDA–Edkey Chtr Sch† | | 5.00% | | 7/1/2049 | | NR | | | 6,000,000 | | | | 5,166,029 | |
| Pima Co IDA–Edkey Chtr Sch† | | 5.00% | | 7/1/2055 | | NR | | | 4,000,000 | | | | 3,352,401 | |
| Plymouth Ed Ctr Charter Sch | | 5.375% | | 11/1/2030 | | D | | | 1,425,000 | | | | 869,250 | |
| PR Comwlth GO | | Zero Coupon | | 11/1/2051 | | NR | | | 23,653,680 | | | | 10,673,723 | |
| PR Comwlth GO | | Zero Coupon | | 11/1/2051 | | NR | | | 796,127 | | | | 104,492 | |
| UT Charter Sch–Freedom Academy† | | 5.00% | | 6/15/2041 | | NR | | | 1,020,000 | | | | 910,410 | |
| UT Charter Sch–Freedom Academy† | | 5.00% | | 6/15/2052 | | NR | | | 1,300,000 | | | | 1,092,385 | |
| UT Charter Sch–Freedom Academy† | | 5.375% | | 6/15/2048 | | NR | | | 5,150,000 | | | | 4,639,807 | |
| WA Convention Ctr | | 4.00% | | 7/1/2031 | | NR | | | 11,965,000 | | | | 10,608,636 | |
| WA Convention Ctr | | 4.00% | | 7/1/2058 | | Baa3 | | | 11,290,000 | | | | 8,116,510 | |
| Total | | | | | | | | | | | | | 227,289,669 | |
| | | | | | | | | | | | | | | |
| Special Tax 5.61% | | | | | | | | | | | | | | |
| Allentown Neighborhood Impt† | | 5.00% | | 5/1/2032 | | Ba3 | | | 2,425,000 | | | | 2,373,180 | |
| Allentown Neighborhood Impt† | | 5.375% | | 5/1/2042 | | NR | | | 5,500,000 | | | | 5,147,201 | |
| Allentown Neighborhood Impt–City Center† | | 5.25% | | 5/1/2042 | | NR | | | 3,250,000 | | | | 2,994,824 | |
| Allentown Neighborhood Impt–Wtrfrnt Proj† | | 6.00% | | 5/1/2042 | | NR | | | 11,680,000 | | | | 11,490,126 | |
| Anne Arundel Co Spl Tax–Vlgs Two Rivers | | 5.125% | | 7/1/2036 | | NR | | | 1,030,000 | | | | 1,025,396 | |
| Anne Arundel Co Spl Tax–Vlgs Two Rivers | | 5.25% | | 7/1/2044 | | NR | | | 2,150,000 | | | | 2,123,382 | |
| Arborwood CDD | | 6.90% | | 5/1/2036 | | NR | | | 635,000 | | | | 618,621 | |
| Arborwood CDD | | 6.90% | | 5/1/2036 | | NR | | | 50,000 | | | | 47,877 | (e) |
| Atlanta Urban Dev Agency–Atlanta Beltline† | | 3.625% | | 7/1/2042 | | NR | | | 1,875,000 | | | | 1,509,124 | |
| Atlanta Urban Dev Agency–Atlanta Beltline† | | 3.875% | | 7/1/2051 | | NR | | | 3,330,000 | | | | 2,576,625 | |
| Baltimore Spc Ob–Harbor Point | | 4.875% | | 6/1/2042 | | NR | | | 875,000 | | | | 819,210 | |
| Baltimore Spc Ob–Harbor Point | | 5.00% | | 6/1/2051 | | NR | | | 1,600,000 | | | | 1,485,518 | |
| Berkeley Co–Nexton Imp Dist | | 4.25% | | 11/1/2040 | | NR | | | 2,250,000 | | | | 2,007,309 | |
| Berkeley Co–Nexton Imp Dist | | 4.375% | | 11/1/2049 | | NR | | | 1,500,000 | | | | 1,305,549 | (e) |
| Brighton Crossing Met Dist #6 | | 5.00% | | 12/1/2050 | | NR | | | 2,340,000 | | | | 1,909,828 | |
| Celebration Pointe CDD | | 3.375% | | 5/1/2041 | | NR | | | 900,000 | | | | 665,856 | |
| Celebration Pointe CDD | | 4.00% | | 5/1/2053 | | NR | | | 900,000 | | | | 698,816 | |
| Celebration Pointe CDD† | | 5.00% | | 5/1/2048 | | NR | | | 6,555,000 | | | | 6,224,024 | |
| Charlotte Co IDA–Babcock Ranch | | 5.00% | | 5/1/2042 | | NR | | | 4,000,000 | | | | 3,826,322 | |
| Charlotte Co IDA–Babcock Ranch | | 5.00% | | 5/1/2053 | | NR | | | 4,000,000 | | | | 3,733,193 | |
| Cleveland Co Port Auth–Flats Bank East† | | 4.00% | | 12/1/2055 | | BB | | | 5,000,000 | | | | 3,775,845 | |
| Cleveland Co Port Auth–Flats Bank East† | | 4.50% | | 12/1/2055 | | NR | | | 3,950,000 | | | | 3,000,730 | |
| | See Notes to Financial Statements. | 117 |
Schedule of Investments (continued)
HIGH INCOME MUNICIPAL BOND FUND September 30, 2022
| Investments | | Interest
Rate | | Maturity
Date | | Credit
Rating:
S&P or
Moody’s(a) | | Principal
Amount | | | Fair
Value | |
| Special Tax (continued) | | | | | | | | | | | | | | |
| CO Rocky Mtn Rail Park Met Dist† | | 5.00% | | 12/1/2041 | | NR | | $ | 2,000,000 | | | $ | 1,657,237 | |
| CO Rocky Mtn Rail Park Met Dist† | | 5.00% | | 12/1/2051 | | NR | | | 6,520,000 | | | | 4,981,363 | |
| Denver Intl Business Ctr Met Dist #1 | | 6.00% | | 12/1/2048 | | NR | | | 2,300,000 | | | | 2,197,987 | |
| Frederick Co–Jefferson Technology Park† | | 4.625% | | 7/1/2043 | | NR | | | 2,155,000 | | | | 1,988,724 | |
| Frederick Co–Urbana CDA† | | 4.00% | | 7/1/2050 | | NR | | | 3,755,000 | | | | 3,082,465 | |
| Grandview IDA–Grandview Crossing(d) | | 5.75% | | 12/1/2028 | | NR | | | 1,000,000 | | | | 300,000 | |
| Inland Valley Redev Agy | | 5.25% | | 9/1/2037 | | A | | | 3,375,000 | | | | 3,432,998 | |
| Miami World Ctr CDD | | 5.25% | | 11/1/2049 | | NR | | | 4,500,000 | | | | 4,415,384 | |
| MIDA–Military Village | | 4.00% | | 6/1/2041 | | NR | | | 1,250,000 | | | | 964,492 | |
| MIDA Mount Village PID† | | 4.00% | | 8/1/2050 | | NR | | | 8,500,000 | | | | 6,270,707 | |
| MIDA Mount Village PID† | | 4.25% | | 8/1/2035 | | NR | | | 3,290,000 | | | | 2,996,688 | |
| MIDA Mount Village PID† | | 4.50% | | 8/1/2040 | | NR | | | 1,250,000 | | | | 1,110,232 | |
| MIDA Mount Village PID† | | 5.00% | | 8/1/2050 | | NR | | | 6,500,000 | | | | 5,701,749 | |
| Military Installation Development Authority | | 4.00% | | 6/1/2052 | | NR | | | 11,485,000 | | | | 7,980,792 | |
| North Las Vegas Improv Dist–Vall | | 4.50% | | 6/1/2039 | | NR | | | 480,000 | | | | 441,556 | |
| North Las Vegas Improv Dist–Vall | | 4.625% | | 6/1/2043 | | NR | | | 480,000 | | | | 435,818 | |
| North Las Vegas Improv Dist–Vall | | 4.625% | | 6/1/2049 | | NR | | | 730,000 | | | | 643,775 | |
| North Range Met Dist | | 5.00% | | 12/1/2040 | | NR | | | 2,000,000 | | | | 1,840,380 | |
| North Range Met Dist | | 5.25% | | 12/1/2050 | | NR | | | 5,000,000 | | | | 4,382,706 | |
| Nthrn Palm Bch Co Impt Dist | | 5.00% | | 8/1/2037 | | NR | | | 750,000 | | | | 751,540 | (e) |
| Nthrn Palm Bch Co Impt Dist | | 5.00% | | 8/1/2046 | | NR | | | 5,000,000 | | | | 4,837,352 | (e) |
| Nthrn Palm Bch Co Impt Dist | | 5.00% | | 8/1/2046 | | NR | | | 2,850,000 | | | | 2,734,714 | (e) |
| Orange Co CFD–Rienda | | 5.00% | | 8/15/2042 | | NR | | | 2,000,000 | | | | 1,980,170 | |
| Orange Co CFD–Rienda | | 5.00% | | 8/15/2047 | | NR | | | 2,000,000 | | | | 1,945,179 | |
| Orange Co CFD–Rienda | | 5.00% | | 8/15/2052 | | NR | | | 4,000,000 | | | | 3,853,436 | |
| Peninsula Town Center† | | 5.00% | | 9/1/2037 | | NR | | | 875,000 | | | | 800,089 | |
| Peninsula Town Center† | | 5.00% | | 9/1/2045 | | NR | | | 2,250,000 | | | | 1,979,807 | |
| Prairie Ctr Met Dist #3† | | 5.00% | | 12/15/2041 | | NR | | | 3,475,000 | | | | 3,146,365 | |
| Prince George Co Spl Ob† | | 5.00% | | 7/1/2046 | | NR | | | 5,000,000 | | | | 4,992,062 | (e) |
| Prince George Co Spl Ob–Westphalia† | | 5.125% | | 7/1/2039 | | NR | | | 1,100,000 | | | | 1,049,356 | |
| Prince George Co Spl Ob–Westphalia† | | 5.25% | | 7/1/2048 | | NR | | | 5,125,000 | | | | 4,823,694 | |
| River Islands PFA–CFD 2003 (AGM) | | 5.25% | | 9/1/2052 | | AA | | | 2,500,000 | | | | 2,629,310 | |
| Scranton RDA GTD | | 5.00% | | 11/15/2028 | | BB+ | | | 5,000,000 | | | | 4,742,002 | |
| SF Spl Tax–Mission Rock Dist† | | 4.00% | | 9/1/2046 | | NR | | | 2,475,000 | | | | 1,983,217 | |
| St Louis IDA–Ballpark Vlg | | 4.375% | | 11/15/2035 | | NR | | | 3,500,000 | | | | 2,850,192 | |
| St Louis IDA–Ballpark Vlg | | 4.75% | | 11/15/2047 | | NR | | | 4,875,000 | | | | 3,720,269 | |
| St. Charles–Noah’s Ark CID | | 3.00% | | 5/1/2030 | | NR | | | 725,000 | | | | 631,719 | |
| St. Charles–Noah’s Ark CID | | 3.125% | | 5/1/2035 | | NR | | | 500,000 | | | | 401,044 | |
| 118 | See Notes to Financial Statements. |
Schedule of Investments (continued)
HIGH INCOME MUNICIPAL BOND FUND September 30, 2022
| Investments | | Interest
Rate | | Maturity
Date | | Credit
Rating:
S&P or
Moody’s(a) | | Principal
Amount | | | Fair
Value | |
| Special Tax (continued) | | | | | | | | | | | | | | |
| Stone Canyon CID(d) | | 5.70% | | 4/1/2022 | | NR | | $ | 1,485,000 | | | $ | 386,100 | |
| Tahoe Douglas Visitors Auth | | 5.00% | | 7/1/2045 | | NR | | | 2,800,000 | | | | 2,625,660 | |
| Tahoe Douglas Visitors Auth | | 5.00% | | 7/1/2051 | | NR | | | 4,000,000 | | | | 3,672,287 | |
| Tern Bay CDD | | 5.375% | | 5/1/2037 | | NR | | | 370,000 | | | | 370,032 | |
| Village CDD #10 | | 6.00% | | 5/1/2044 | | NR | | | 820,000 | | | | 826,546 | |
| Village CDD #12† | | 4.25% | | 5/1/2043 | | NR | | | 6,960,000 | | | | 6,494,747 | (e) |
| Village CDD #12† | | 4.375% | | 5/1/2050 | | NR | | | 2,780,000 | | | | 2,568,591 | (e) |
| Village Met Dist–Avon | | 5.00% | | 12/1/2040 | | NR | | | 2,000,000 | | | | 1,892,447 | |
| Village Met Dist–Avon | | 5.00% | | 12/1/2049 | | NR | | | 4,085,000 | | | | 3,758,437 | |
| West Villages Impr Dist–#7 | | 4.75% | | 5/1/2039 | | NR | | | 1,750,000 | | | | 1,667,559 | (e) |
| West Villages Impr Dist–#7 | | 5.00% | | 5/1/2050 | | NR | | | 3,090,000 | | | | 2,889,900 | (e) |
| Total | | | | | | | | | | | | | 191,187,432 | |
| | | | | | | | | | | | | | | |
| Tax Revenue 3.34% | | | | | | | | | | | | | | |
| American Samoa GO† | | 6.50% | | 9/1/2028 | | Ba3 | | | 2,750,000 | | | | 2,971,462 | |
| Guam–Business Privilege Tax | | 4.00% | | 1/1/2036 | | Ba1 | | | 6,860,000 | | | | 5,941,624 | |
| Guam–Business Privilege Tax | | 4.00% | | 1/1/2042 | | Ba1 | | | 7,000,000 | | | | 5,669,651 | |
| Met Pier & Expo Auth–McCormick Place | | 5.50% | | 6/15/2053 | | A- | | | 9,150,000 | | | | 9,158,742 | |
| Met Pier & Expo Auth–McCormick Place (NPFGC)(FGIC) | | Zero Coupon | | 12/15/2036 | | A- | | | 10,000,000 | | | | 4,755,661 | |
| Met Pier & Expo Auth–McCormick Place (NPFGC)(FGIC) | | Zero Coupon | | 12/15/2037 | | A- | | | 10,000,000 | | | | 4,475,824 | |
| Monongalia Co–Econ Op Dev Dist† | | 4.125% | | 6/1/2043 | | NR | | | 2,250,000 | | | | 1,920,337 | |
| Monongalia Co–Econ Op Dev Dist† | | 4.875% | | 6/1/2043 | | NR | | | 3,430,000 | | | | 2,914,970 | |
| NY Dorm–PIT | | 3.00% | | 3/15/2050 | | AA+ | | | 2,500,000 | | | | 1,749,961 | |
| NY Liberty Dev Corp–1 WTC TCRS (BAM) | | 3.00% | | 2/15/2042 | | AA | | | 4,000,000 | | | | 3,028,162 | |
| NY UDC–PIT | | 3.00% | | 3/15/2047 | | AA+ | | | 3,740,000 | | | | 2,673,786 | |
| PR Corp Sales Tax | | Zero Coupon | | 7/1/2033 | | NR | | | 5,283,000 | | | | 2,975,665 | |
| PR Corp Sales Tax | | 4.55% | | 7/1/2040 | | NR | | | 8,719,000 | | | | 7,769,279 | |
| PR Corp Sales Tax | | 4.75% | | 7/1/2053 | | NR | | | 32,084,000 | | | | 27,481,922 | |
| PR Corp Sales Tax | | 5.00% | | 7/1/2058 | | NR | | | 19,422,000 | | | | 17,194,341 | |
| Reno–ReTRAC-Reno Trans† | | Zero Coupon | | 7/1/2058 | | NR | | | 18,500,000 | | | | 1,742,841 | |
| Sparks–Legends at Sparks Marina† | | 2.50% | | 6/15/2024 | | Ba2 | | | 170,000 | | | | 163,589 | |
| Sparks–Legends at Sparks Marina† | | 2.75% | | 6/15/2028 | | Ba2 | | | 750,000 | | | | 658,331 | |
| USVI Matching Fund | | 5.00% | | 10/1/2030 | | NR | | | 2,500,000 | | | | 2,557,169 | |
| USVI Matching Fund | | 5.00% | | 10/1/2039 | | NR | | | 4,000,000 | | | | 4,014,344 | (e) |
| WA Convention Ctr | | 3.00% | | 7/1/2048 | | Baa3 | | | 6,710,000 | | | | 4,068,848 | |
| Total | | | | | | | | | | | | | 113,886,509 | |
| | See Notes to Financial Statements. | 119 |
Schedule of Investments (continued)
HIGH INCOME MUNICIPAL BOND FUND September 30, 2022
| Investments | | Interest
Rate | | Maturity
Date | | Credit
Rating:
S&P or
Moody’s(a) | | Principal
Amount | | | Fair
Value | |
| Tobacco 6.99% | | | | | | | | | | | | | | |
| Buckeye Tobacco | | Zero Coupon | | 6/1/2057 | | NR | | $ | 63,000,000 | | | $ | 6,724,135 | |
| Buckeye Tobacco | | 5.00% | | 6/1/2055 | | NR | | | 57,165,000 | | | | 48,089,359 | |
| CA Stwde–Tobacco Settlement | | Zero Coupon | | 6/1/2046 | | NR | | | 26,325,000 | | | | 5,930,491 | |
| CA Stwde–Tobacco Settlement† | | Zero Coupon | | 6/1/2055 | | NR | | | 42,500,000 | | | | 1,777,329 | |
| Erie Co Tobacco† | | Zero Coupon | | 6/1/2060 | | NR | | | 30,000,000 | | | | 1,433,763 | |
| Golden St Tobacco | | Zero Coupon | | 6/1/2066 | | NR | | | 167,500,000 | | | | 14,709,398 | |
| Inland Empire Tobacco† | | Zero Coupon | | 6/1/2057 | | CCC | | | 47,000,000 | | | | 2,268,859 | |
| Los Angeles Co Tobacco | | 4.00% | | 6/1/2049 | | BBB+ | | | 2,015,000 | | | | 1,636,034 | |
| MI Tob Settlement | | Zero Coupon | | 6/1/2058 | | NR | | | 228,300,000 | | | | 9,474,450 | |
| MI Tob Settlement | | 4.00% | | 6/1/2049 | | BBB+ | | | 4,005,000 | | | | 3,236,655 | |
| MI Tob Settlement | | 5.00% | | 6/1/2049 | | BBB- | | | 3,335,000 | | | | 3,138,441 | |
| Monroe Co Tobacco† | | Zero Coupon | | 6/1/2061 | | NR | | | 22,900,000 | | | | 731,408 | |
| Nassau Co Tobacco | | Zero Coupon | | 6/1/2060 | | NR | | | 50,000,000 | | | | 2,283,165 | |
| Nassau Co Tobacco | | 5.00% | | 6/1/2035 | | CCC+ | | | 3,170,000 | | | | 2,861,394 | |
| Nassau Co Tobacco | | 5.25% | | 6/1/2026 | | CCC+ | | | 3,615,591 | | | | 3,499,657 | |
| RI Tob Settlement | | Zero Coupon | | 6/1/2052 | | CCC- | | | 25,885,000 | | | | 3,783,543 | |
| Rockland Tobacco† | | Zero Coupon | | 8/15/2060 | | NR | | | 41,035,000 | | | | 2,332,795 | |
| San Diego Co Tobacco | | Zero Coupon | | 6/1/2054 | | NR | | | 16,000,000 | | | | 2,750,469 | |
| San Diego Co Tobacco | | 5.00% | | 6/1/2048 | | BBB- | | | 2,235,000 | | | | 2,105,560 | |
| Silicon Valley Tobacco | | Zero Coupon | | 6/1/2036 | | NR | | | 10,000,000 | | | | 4,735,121 | |
| Silicon Valley Tobacco | | Zero Coupon | | 6/1/2056 | | NR | | | 20,000,000 | | | | 1,399,944 | |
| Sthrn CA Tobacco | | Zero Coupon | | 6/1/2046 | | CCC- | | | 15,000,000 | | | | 2,116,912 | |
| Tobacco Settlement Auth IA | | 4.00% | | 6/1/2049 | | BBB+ | | | 4,000,000 | | | | 3,256,912 | |
| Tobacco Settlement Fin Corp DC | | Zero Coupon | | 6/15/2046 | | NR | | | 4,780,000 | | | | 795,902 | (e) |
| Tobacco Settlement Fin Corp DC | | Zero Coupon | | 6/15/2055 | | NR | | | 21,000,000 | | | | 1,680,808 | |
| Tobacco Settlement Fin Corp DC | | Zero Coupon | | 6/15/2055 | | NR | | | 100,000,000 | | | | 6,700,390 | |
| Tobacco Settlement Fin Corp NJ | | 5.00% | | 6/1/2046 | | BB+ | | | 26,145,000 | | | | 24,099,836 | |
| Tobacco Settlement Fin Corp VA | | Zero Coupon | | 6/1/2047 | | CCC- | | | 9,500,000 | | | | 2,014,248 | |
| Tobacco Settlement Fin Corp VA | | Zero Coupon | | 6/1/2047 | | CCC- | | | 110,695,000 | | | | 24,269,336 | |
| Tobacco Settlement Fin Corp VA | | 5.00% | | 6/1/2047 | | B- | | | 17,575,000 | | | | 16,303,980 | |
| TSASC | | 5.00% | | 6/1/2045 | | CCC+ | | | 7,170,000 | | | | 6,287,486 | |
| TSASC | | 5.00% | | 6/1/2048 | | NR | | | 29,710,000 | | | | 25,530,843 | |
| Total | | | | | | | | | | | | | 237,958,623 | |
| | | | | | | | | | | | | | | |
| Transportation 8.89% | | | | | | | | | | | | | | |
| Allegheny County Airport Authority AMT | | 5.00% | | 1/1/2051 | | A2 | | | 3,290,000 | | | | 3,272,716 | |
| CA Muni Fin–LINXS AMT | | 4.00% | | 12/31/2047 | | BBB- | (c) | | 11,250,000 | | | | 9,136,235 | |
| Central TX Mobility Auth | | 5.00% | | 1/1/2046 | | A- | | | 1,500,000 | | | | 1,502,483 | |
| 120 | See Notes to Financial Statements. |
Schedule of Investments (continued)
HIGH INCOME MUNICIPAL BOND FUND September 30, 2022
| Investments | | Interest
Rate | | Maturity
Date | | Credit
Rating:
S&P or
Moody’s(a) | | Principal
Amount | | | Fair
Value | |
| Transportation (continued) | | | | | | | | | | | | | | |
| Chicago O’Hare Arpt AMT | | 5.00% | | 1/1/2048 | | A+ | | $ | 5,000,000 | | | $ | 4,957,457 | |
| Chicago Trans Auth | | 4.00% | | 12/1/2050 | | A+ | | | 3,500,000 | | | | 2,887,955 | |
| Chicago Trans Auth | | 4.00% | | 12/1/2055 | | A+ | | | 4,000,000 | | | | 3,256,632 | |
| Chicago Trans Auth | | 5.00% | | 12/1/2055 | | A+ | | | 1,750,000 | | | | 1,712,776 | |
| Denver City & Co Arpt AMT | | 5.50% | | 11/15/2025 | | A1 | | | 3,410,000 | | | | 3,477,139 | |
| Denver RTD–Eagle P3 | | 3.00% | | 7/15/2037 | | Baa1 | | | 3,825,000 | | | | 2,934,234 | |
| E470 Pub Hwy Auth (NPFGC)(FGIC) | | Zero Coupon | | 9/1/2031 | | A | | | 20,000,000 | | | | 13,533,436 | |
| Foothill / Eastern Corridor Toll Rd | | Zero Coupon | | 1/15/2033 | | A | | | 4,500,000 | | | | 2,710,157 | |
| Foothill / Eastern Corridor Toll Rd | | 4.00% | | 1/15/2043 | | A- | | | 4,099,000 | | | | 3,458,415 | |
| Houston Arpt–Continental Airlines AMT | | 4.75% | | 7/1/2024 | | Ba3 | | | 2,740,000 | | | | 2,721,550 | |
| Houston Arpt–United Airlines AMT | | 5.00% | | 7/15/2028 | | B | | | 3,500,000 | | | | 3,503,214 | |
| MD EDC–CNX Marine Terminals | | 5.75% | | 9/1/2025 | | BB | | | 9,000,000 | | | | 9,021,208 | |
| MD EDC–Port Covington | | 4.00% | | 9/1/2040 | | NR | | | 1,750,000 | | | | 1,475,950 | |
| MD EDC–Port Covington | | 4.00% | | 9/1/2050 | | NR | | | 14,750,000 | | | | 11,454,573 | |
| MD EDC–Ports America Chesapeake AMT | | 5.00% | | 6/1/2044 | | Baa2 | | | 250,000 | | | | 252,243 | |
| MD EDC–Ports America Chesapeake AMT | | 5.00% | | 6/1/2049 | | Baa2 | | | 750,000 | | | | 753,821 | |
| MD EDC–Purple Line AMT | | 5.25% | | 6/30/2055 | | Baa3 | | | 12,610,000 | | | | 12,472,736 | |
| Met Transportation Auth NY Revenue(g) | | 5.25% | | 11/15/2055 | | A3 | | | 21,710,000 | | | | 21,408,932 | |
| MI Strategic Fund–I-75 AMT (AGM) | | 4.50% | | 6/30/2048 | | AA | | | 3,000,000 | | | | 2,574,742 | |
| Miami Dade CO Aviation–Mia AMT | | 5.00% | | 10/1/2044 | | A | | | 5,000,000 | | | | 4,993,622 | |
| MTA NY | | 5.00% | | 11/15/2045 | | A3 | | | 1,900,000 | | | | 1,819,184 | |
| MTA NY | | 5.00% | | 11/15/2048 | | A3 | | | 7,420,000 | | | | 7,057,045 | |
| MTA NY | | 5.00% | | 11/15/2050 | | A3 | | | 7,630,000 | | | | 7,226,278 | |
| MTA NY | | 5.25% | | 11/15/2044 | | A3 | | | 10,000,000 | | | | 10,032,699 | |
| NJ Trans Trust Fund | | 5.00% | | 6/15/2045 | | A3 | | | 5,000,000 | | | | 4,951,649 | |
| North Parkway MMD† | | 4.75% | | 9/15/2041 | | NR | | | 2,930,000 | | | | 2,644,496 | (e) |
| North Parkway MMD† | | 5.00% | | 9/15/2051 | | NR | | | 6,875,000 | | | | 6,185,849 | (e) |
| NY Trans Dev Corp–Delta Airlines AMT | | 4.00% | | 1/1/2036 | | Baa3 | | | 9,305,000 | | | | 8,228,841 | |
| NY Trans Dev Corp–Delta Airlines AMT | | 5.00% | | 1/1/2036 | | Baa3 | | | 1,195,000 | | | | 1,146,711 | |
| NY Trans Dev Corp–Delta Airlines AMT | | 5.00% | | 10/1/2040 | | Baa3 | | | 17,600,000 | | | | 16,534,904 | |
| NY Trans Dev Corp–Delta AMT | | 4.375% | | 10/1/2045 | | Baa3 | | | 29,125,000 | | | | 24,476,938 | |
| NY Trans Dev Corp–Delta AMT | | 5.00% | | 1/1/2024 | | Baa3 | | | 6,300,000 | | | | 6,335,276 | |
| NY Trans Dev Corp–JFK IAT | | 5.00% | | 12/1/2035 | | Baa1 | | | 1,000,000 | | | | 1,009,399 | |
| NY Trans Dev Corp–JFK IAT | | 5.00% | | 12/1/2037 | | Baa1 | | | 1,000,000 | | | | 1,005,236 | |
| NY Trans Dev Corp–JFK IAT AMT | | 4.00% | | 12/1/2040 | | Baa1 | | | 1,000,000 | | | | 824,306 | |
| NY Trans Dev Corp–JFK IAT AMT | | 5.00% | | 12/1/2042 | | Baa1 | | | 2,500,000 | | | | 2,386,952 | |
| NY Trans Dev Corp–LaGuardia Airport AMT | | 5.25% | | 1/1/2050 | | Baa2 | | | 14,470,000 | | | | 14,047,671 | |
| | See Notes to Financial Statements. | 121 |
Schedule of Investments (continued)
HIGH INCOME MUNICIPAL BOND FUND September 30, 2022
| Investments | | Interest
Rate | | Maturity
Date | | Credit
Rating:
S&P or
Moody’s(a) | | Principal
Amount | | | Fair
Value | |
| Transportation (continued) | | | | | | | | | | | | | | |
| PA Tpk Commn | | 5.00% | | 12/1/2044 | | A3 | | $ | 4,500,000 | | | $ | 4,452,383 | |
| Port Auth NY & NJ AMT | | 5.00% | | 11/15/2041 | | AA- | | | 10,500,000 | | | | 10,560,367 | |
| PR Hwy & Trans Auth(d) | | 5.00% | | 7/1/2020 | | NR | | | 6,035,000 | | | | 1,207,000 | (e) |
| PR Hwy & Trans Auth(d) | | 5.00% | | 7/1/2022 | | NR | | | 1,545,000 | | | | 309,000 | (e) |
| PR Hwy & Trans Auth(d) | | 5.00% | | 7/1/2028 | | NR | | | 1,015,000 | | | | 10 | |
| Reno–ReTRAC-Reno Trans† | | Zero Coupon | | 7/1/2058 | | NR | | | 29,000,000 | | | | 3,046,320 | |
| San Diego Cnty CA Regl Arpt Authority(g) | | 5.00% | | 7/1/2056 | | A2 | | | 17,000,000 | | | | 17,174,165 | |
| Triborough Brdg & Tunl Auth | | 3.00% | | 11/15/2046 | | AA- | | | 5,000,000 | | | | 3,579,261 | |
| TX Trans Comm–Hwy 249 | | Zero Coupon | | 8/1/2036 | | Baa3 | | | 1,050,000 | | | | 497,697 | |
| TX Trans Comm–Hwy 249 | | Zero Coupon | | 8/1/2040 | | Baa3 | | | 1,100,000 | | | | 402,739 | |
| TX Trans Comm–Hwy 249 | | Zero Coupon | | 8/1/2048 | | Baa3 | | | 1,000,000 | | | | 218,916 | |
| TX Trans Comm–Hwy 249 | | 5.00% | | 8/1/2057 | | Baa3 | | | 2,375,000 | | | | 2,275,307 | |
| VA Small Bus Fing–95 Express AMT | | 4.00% | | 1/1/2048 | | BBB- | | | 7,205,000 | | | | 5,857,824 | |
| VA Small Bus Fing–95 Express AMT | | 5.00% | | 1/1/2033 | | BBB- | | | 1,500,000 | | | | 1,534,326 | |
| VA Small Bus Fing–95 Express AMT | | 5.00% | | 1/1/2035 | | BBB- | | | 3,000,000 | | | | 3,041,212 | |
| VA Small Bus Fing–95 Express AMT | | 5.00% | | 7/1/2036 | | BBB- | | | 3,200,000 | | | | 3,232,405 | |
| VA Small Bus Fing–95 Express AMT | | 5.00% | | 7/1/2037 | | BBB- | | | 2,000,000 | | | | 2,014,524 | |
| VA Small Bus Fing–Elizabeth River AMT | | 4.00% | | 1/1/2038 | | BBB | | | 4,500,000 | | | | 3,985,488 | |
| Total | | | | | | | | | | | | | 302,774,604 | |
| | | | | | | | | | | | | | | |
| Utilities 10.21% | | | | | | | | | | | | | | |
| Baltimore MD Proj Revenue(g) | | 5.25% | | 7/1/2047 | | Aa2 | | | 7,195,000 | | | | 7,556,353 | |
| Baltimore MD Proj Revenue(g) | | 5.25% | | 7/1/2052 | | Aa2 | | | 12,190,000 | | | | 12,802,216 | |
| Black Belt Energy Gas Dist | | 4.00% | #(b) | 6/1/2051 | | Aa1 | | | 11,445,000 | | | | 11,015,008 | |
| Black Belt Energy Gas Dist | | 4.00% | #(b) | 12/1/2052 | | Baa1 | | | 11,100,000 | | | | 10,655,393 | |
| Burke Co Dev–Oglethorpe Power | | 4.125% | | 11/1/2045 | | BBB+ | | | 14,025,000 | | | | 11,582,034 | |
| CA Poll Ctl–Poseidon Res† | | 5.00% | | 11/21/2045 | | Baa3 | | | 2,250,000 | | | | 2,051,473 | |
| Campbell Co Solid Wste–Basin Elec | | 3.625% | | 7/15/2039 | | A | | | 12,345,000 | | | | 10,151,728 | |
| Charlotte Co IDA–Babcock Ranch† | | 5.00% | | 10/1/2034 | | NR | | | 1,000,000 | | | | 932,693 | |
| Charlotte Co IDA–Babcock Ranch† | | 5.00% | | 10/1/2049 | | NR | | | 5,500,000 | | | | 4,750,666 | |
| CO Public Auth–ML | | 6.50% | | 11/15/2038 | | A2 | | | 5,000,000 | | | | 5,705,063 | |
| Compton Water | | 6.00% | | 8/1/2039 | | NR | | | 3,710,000 | | | | 3,713,628 | |
| FL DFC–Waste Pro AMT | | 3.00% | | 6/1/2032 | | NR | | | 20,250,000 | | | | 15,743,103 | |
| FL DFC–Waste Pro AMT† | | 5.25% | | 8/1/2029 | | NR | | | 7,000,000 | | | | 6,592,982 | |
| GA Muni Elec Auth–MEAG | | 5.00% | | 1/1/2048 | | BBB+ | | | 2,000,000 | | | | 1,903,634 | |
| GA Muni Elec Auth–MEAG | | 5.00% | | 1/1/2059 | | BBB+ | | | 7,300,000 | | | | 6,821,977 | |
| GA Muni Elec Auth–MEAG | | 5.00% | | 1/1/2063 | | A | | | 2,400,000 | | | | 2,282,892 | |
| Guam Waterworks | | 5.00% | | 1/1/2050 | | A- | | | 2,250,000 | | | | 2,256,073 | |
| 122 | See Notes to Financial Statements. |
Schedule of Investments (continued)
HIGH INCOME MUNICIPAL BOND FUND September 30, 2022
| Investments | | Interest
Rate | | Maturity
Date | | Credit
Rating:
S&P or
Moody’s(a) | | Principal
Amount | | | Fair
Value | |
| Utilities (continued) | | | | | | | | | | | | | | |
| HI Dept Budget–Hawaiian Electric | | 3.20% | | 7/1/2039 | | Baa1 | | $ | 15,765,000 | | | $ | 12,156,544 | |
| HI Dept Budget–Hawaiian Electric AMT | | 4.00% | | 3/1/2037 | | Baa1 | | | 4,475,000 | | | | 4,053,318 | |
| Jefferson Co Sewer | | Zero Coupon | | 10/1/2039 | | BBB | | | 5,000,000 | | | | 5,050,995 | |
| Jefferson Co Sewer | | Zero Coupon | | 10/1/2046 | | BBB | | | 5,445,000 | | | | 5,500,044 | |
| Jefferson Co Sewer | | 6.00% | | 10/1/2042 | | BBB | | | 7,175,000 | | | | 7,664,730 | |
| Jefferson Co Sewer | | 6.50% | | 10/1/2053 | | BBB | | | 26,800,000 | | | | 28,751,606 | |
| Jefferson Co Sewer (AGM) | | Zero Coupon | | 10/1/2028 | | AA | | | 4,035,000 | | | | 3,001,300 | |
| Jefferson Co Sewer (AGM) | | 5.00% | | 10/1/2044 | | AA | | | 5,070,000 | | | | 5,222,331 | |
| KY Public Energy Auth–Morgan Stanley | | 4.00% | #(b) | 8/1/2052 | | A1 | | | 16,000,000 | | | | 15,228,771 | |
| Lower Colo Riv Auth–Transmn Contract | | 5.00% | | 5/15/2051 | | A | | | 3,750,000 | | | | 3,753,817 | |
| Main St Nat Gas–Citibank | | 4.00% | #(b) | 5/1/2052 | | A3 | | | 8,750,000 | | | | 8,297,849 | |
| Main St Nat Gas–Citadel† | | 4.00% | #(b) | 8/1/2052 | | BBB- | | | 50,000,000 | | | | 47,067,180 | |
| Maricopa Co Poll Cntrl–El Paso Elec | | 3.60% | | 2/1/2040 | | Baa2 | | | 5,355,000 | | | | 4,390,982 | |
| Maricopa Co Poll Cntrl–El Paso Elec | | 3.60% | | 4/1/2040 | | Baa2 | | | 3,115,000 | | | | 2,551,047 | |
| PR Aqueduct & Swr Auth† | | 4.00% | | 7/1/2042 | | NR | | | 6,250,000 | | | | 4,937,269 | |
| PR Aqueduct & Swr Auth† | | 4.00% | | 7/1/2042 | | NR | | | 8,785,000 | | | | 6,939,826 | |
| PR Aqueduct & Swr Auth† | | 5.00% | | 7/1/2030 | | NR | | | 14,165,000 | | | | 13,911,237 | |
| PR Aqueduct & Swr Auth† | | 5.00% | | 7/1/2033 | | NR | | | 4,780,000 | | | | 4,631,350 | |
| PR Aqueduct & Swr Auth† | | 5.00% | | 7/1/2035 | | NR | | | 23,005,000 | | | | 21,860,987 | |
| PR Aqueduct & Swr Auth† | | 5.00% | | 7/1/2037 | | NR | | | 3,500,000 | | | | 3,302,228 | |
| PR Aqueduct & Swr Auth† | | 5.00% | | 7/1/2037 | | NR | | | 6,000,000 | | | | 5,660,962 | |
| PR Elec Pwr Auth(d) | | 5.00% | | 7/1/2042 | | D | (c) | | 4,975,000 | | | | 3,706,375 | |
| PR Elec Pwr Auth(d) | | 5.05% | | 7/1/2042 | | D | (c) | | 3,425,000 | | | | 2,543,063 | |
| PR Elec Pwr Auth(d) | | 5.25% | | 7/1/2024 | | D | (c) | | 7,000,000 | | | | 5,215,000 | |
| PR Elec Pwr Auth(d) | | 5.50% | | 7/1/2038 | | D | (c) | | 1,530,000 | | | | 1,145,588 | |
| SE AL Gas Dist–Goldman Sachs | | 4.00% | #(b) | 11/1/2051 | | A2 | | | 2,165,000 | | | | 2,057,902 | |
| TEAC–Goldman Sachs | | 5.00% | #(b) | 5/1/2052 | | A2 | | | 2,500,000 | | | | 2,497,418 | |
| Total | | | | | | | | | | | | | 347,616,635 | |
| Total Municipal Bonds (cost $3,884,187,768) | | | | | | | | | | | | | 3,358,741,174 | |
| | See Notes to Financial Statements. | 123 |
Schedule of Investments (continued)
HIGH INCOME MUNICIPAL BOND FUND September 30, 2022
| Investments | | Interest
Rate# | | Interest
Rate
Reset
Date(h) | | Final
Maturity
Date | | Credit
Rating:
S&P or
Moody’s(a) | | Principal
Amount | | | Fair
Value | |
| SHORT-TERM INVESTMENTS 0.90% | | | | | | | | | | | | | | | | |
| | | | | | | | | | | | | | | | | |
| VARIABLE RATE DEMAND NOTES 0.90% | | | | | | | | | | | | | | |
| | | | | | | | | | | | | | | | | |
| Tax Revenue 0.70% | | | | | | | | | | | | | | | | |
| NYC TFA–Future Tax | | 2.750% | | 10/3/2022 | | 11/1/2044 | | AAA | | $ | 6,000,000 | | | $ | 6,000,000 | |
| NYC TFA–Future Tax | | 2.950% | | 10/3/2022 | | 2/1/2045 | | AAA | | | 5,750,000 | | | | 5,750,000 | |
| NYC TFA–Future Tax | | 2.950% | | 10/3/2022 | | 2/1/2045 | | AAA | | | 12,000,000 | | | | 12,000,000 | |
| Total | | | | | | | | | | | | | | | 23,750,000 | |
| | | | | | | | | | | | | | | | | |
| Utilities 0.20% | | | | | | | | | | | | | | | | |
| Appling Co Dev–GA Power | | 2.960% | | 10/3/2022 | | 9/1/2041 | | BBB+ | | | 7,000,000 | | | | 7,000,000 | |
| Total Short-Term Investments (cost $30,750,000) | | | | | | | | | | | 30,750,000 | |
| Total Investments in Securities 99.51% (cost $3,914,937,768) | | | | | | | | | | | 3,389,491,174 | |
| Other Assets and Liabilities – Net(i) 0.49% | | | | | | | | | | | 16,793,701 | |
| Net Assets 100.00% | | | | | | | | | | | | | | $ | 3,406,284,875 | |
| AGM | | Insured by–Assured Guaranty Municipal Corporation. |
| AMT | | Income from the security may be subject to Alternative Minimum Tax. |
| BAM | | Insured by–Build America Mutual. |
| FGIC | | Insured by–Financial Guaranty Insurance Company. |
| GTD | | Guaranteed. |
| NPFGC | | Insured by–National Public Finance Guarantee Corporation. |
| NR | | Not Rated. |
| SIFMA | | Insured by–Securities Industry and Financial Markets Association. |
| TCRS | | Transferable Custodial Receipts. |
| TRIPS | | Tax Refund Intercept Programs. |
| † | | Security was purchased pursuant to Rule 144A under the Securities Act of 1933 and, unless registered under such Act or exempted from registration, may only be resold to qualified institutional buyers. At September 30, 2022, the total value of Rule 144A securities was $987,006,722, which represents 28.98% of net assets. |
| # | | Variable rate security. The interest rate represents the rate in effect at September 30, 2022. |
| (a) | | Unaudited. |
| (b) | | Variable Rate is Fixed to Float: Rate remains fixed or at Zero Coupon until designated future date. |
| (c) | | This investment has been rated by Fitch IBCA. |
| (d) | | Defaulted (non-income producing security). |
| (e) | | Level 3 Investment as described in Note 2(i) in the Notes to Financials. Security valued utilizing third party pricing information without adjustment. Such valuations are based on unobservable inputs. A significant change in third party information could result in a significantly lower or higher value of such Level 3 investments. |
| (f) | | Securities purchased on a when-issued basis (See Note 2(g)). |
| (g) | | Municipal Bonds Held in Trust–Securities represent underlying bonds transferred to a separate securitization trust established in a tender option bond transaction in which the Fund acquired the residual interest certificates. These securities serve as collateral in a financing transaction. See Note 2(h) to Financial Statements for details of Municipal Bonds Held in Trust |
| (h) | | The interest rate reset date shown represents the date in which the Fund has the right to sell a Variable Rate Demand Note (“VRDN”) back to the issuer for Principal Amount. The interest rate on the VRDN is generally reset daily based on the SIFMA Municipal Swap Index. |
| (i) | | Other Assets and Liabilities–Net include net unrealized appreciation/depreciation on futures contracts as follows: |
| 124 | See Notes to Financial Statements. |
Schedule of Investments (continued)
HIGH INCOME MUNICIPAL BOND FUND September 30, 2022
Futures Contracts at September 30, 2022:
| Type | | Expiration | | Contracts | | Position | | Notional
Amount | | | Notional
Value | | | Unrealized
Appreciation | |
| U.S. Long Bond | | December 2022 | | 552 | | Short | | | $(75,691,940 | ) | | | $(69,776,250 | ) | | | $5,915,690 | |
The following is a summary of the inputs used as of September 30, 2022 in valuing the Fund’s investments carried at fair value(1):
| Investment Type(2) | | Level 1 | | | Level 2 | | | Level 3 | | | Total | |
| Long-Term Investments | | | | | | | | | | | | | | | | |
| Municipal Bonds(3) | | | | | | | | | | | | | | | | |
| Corporate-Backed | | $ | – | | | $ | 589,613,201 | | | $ | 10,465,200 | | | $ | 600,078,401 | |
| Education | | | – | | | | 214,219,079 | | | | 25,471 | | | | 214,244,550 | |
| General Obligation | | | – | | | | 415,977,217 | | | | 3,456,047 | | | | 419,433,264 | |
| Health Care | | | – | | | | 466,039,867 | | | | 38,345,658 | | | | 504,385,525 | |
| Other Revenue | | | – | | | | 223,697,715 | | | | 3,591,954 | | | | 227,289,669 | |
| Special Tax | | | – | | | | 162,897,541 | | | | 28,289,891 | | | | 191,187,432 | |
| Tax Revenue | | | – | | | | 109,872,165 | | | | 4,014,344 | | | | 113,886,509 | |
| Tobacco | | | – | | | | 237,162,721 | | | | 795,902 | | | | 237,958,623 | |
| Transportation | | | – | | | | 292,428,259 | | | | 10,346,345 | | | | 302,774,604 | |
| Remaining Industries | | | – | | | | 547,502,597 | | | | – | | | | 547,502,597 | |
| Short-Term Investments | | | | | | | | | | | | | | | | |
| Variable Rate Demand Notes | | | – | | | | 30,750,000 | | | | – | | | | 30,750,000 | |
| Total | | $ | – | | | $ | 3,290,160,362 | | | $ | 99,330,812 | | | $ | 3,389,491,174 | |
| | | | | | | | | | | | | | | | | |
| Other Financial Instruments | | | | | | | | | | | | | | | | |
| Futures Contracts | | | | | | | | | | | | | | | | |
| Assets | | $ | 5,915,690 | | | $ | – | | | $ | – | | | $ | 5,915,690 | |
| Liabilities | | | – | | | | – | | | | – | | | | – | |
| Total | | $ | 5,915,690 | | | $ | – | | | $ | – | | | $ | 5,915,690 | |
| | (1) | Refer to Note 2(i) for a description of fair value measurements and the three-tier hierarchy of inputs. |
| | (2) | See Schedule of Investments for fair values in each industry. The table above is presented by Investment Type. Industries are presented within an Investment Type should such Investment Type include securities classified as two or more levels within the three-tier fair value hierarchy. When applicable each Level 3 security is identified on the Schedule of Investments along with the valuation technique utilized. |
| | (3) | Includes Municipal Bonds held in the Trust (See Note 2(h)). |
| | See Notes to Financial Statements. | 125 |
Schedule of Investments (concluded)
HIGH INCOME MUNICIPAL BOND FUND September 30, 2022
A reconciliation of Level 3 investments is presented when the Fund has a material amount of Level 3 investments at the beginning or end of the year in relation to the Fund’s net assets.
The following is a reconciliation of investments with unobservable inputs (Level 3) that were used in determining fair value:
| Investment Type | Municipal Bonds | |
| Balance as of October 1, 2021 | | $ | 10,542,427 | |
| Accrued Discounts (Premiums) | | | (137,961 | ) |
| Realized Gain (Loss) | | | (2,989,298 | ) |
| Change in Unrealized Appreciation (Depreciation) | | | (15,137,020 | ) |
| Purchases | | | 16,083,062 | |
| Sales | | | (10,260,617 | ) |
| Transfers into Level 3(a) | | | 101,230,219 | |
| Transfers out of Level 3 | | | – | |
| Balance as of September 30, 2022 | | $ | 99,330,812 | |
| Change in unrealized appreciation/ depreciation for the year ended September 30, 2022, related to Level 3 investments held at September 30, 2022 | | $ | (15,135,875 | ) |
| (a) | | The Fund recognizes transfers within the fair value hierarchy as of the beginning of the period. Transfers into and out of Level 3 were primarily related to the availability of market quotations in accordance with valuation methodology. |
| 126 | See Notes to Financial Statements. |
Schedule of Investments
SHORT DURATION HIGH INCOME MUNICIPAL BOND FUND September 30, 2022
| Investments | | Interest
Rate | | Maturity
Date | | Credit
Rating:
S&P or
Moody’s(a) | | Principal
Amount | | | Fair
Value | |
| LONG-TERM INVESTMENTS 97.10% | | | | | | | | | | | | | | |
| | | | | | | | | | | | | | | |
| MUNICIPAL BONDS 97.10% | | | | | | | | | | | | | | |
| | | | | | | | | | | | | | | |
| Corporate-Backed 27.04% | | | | | | | | | | | | | | |
| Allegheny Co IDA–US Steel | | 4.875% | | 11/1/2024 | | BB- | | $ | 4,000,000 | | | $ | 4,003,365 | |
| Allegheny Co IDA–US Steel | | 5.125% | | 5/1/2030 | | BB- | | | 12,485,000 | | | | 12,540,246 | |
| Black Belt Energy Gas Dist–Goldman Sachs | | 4.00% | #(b) | 10/1/2052 | | A2 | | | 14,670,000 | | | | 14,294,224 | |
| Bucks Cnty IDA–Waste Mgmt AMT | | 2.75% | | 12/1/2022 | | A- | | | 1,000,000 | | | | 998,599 | |
| CA Muni Fin–United Airlines AMT | | 4.00% | | 7/15/2029 | | B+ | | | 14,740,000 | | | | 13,564,489 | |
| Calhoun Co IDA–Max Midstream AMT† | | 3.625% | | 7/1/2026 | | NR | | | 2,500,000 | | | | 2,228,498 | |
| Downtown Doral CDD† | | 3.875% | | 12/15/2023 | | NR | | | 105,000 | | | | 103,752 | |
| Downtown Doral CDD† | | 4.25% | | 12/15/2028 | | NR | | | 250,000 | | | | 244,866 | |
| FL DFC–Waste Pro AMT† | | 5.00% | | 5/1/2029 | | NR | | | 8,410,000 | | | | 7,997,617 | |
| Greater Orlando Aviation–Jet Blue | | 5.00% | | 11/15/2026 | | NR | | | 100,000 | | | | 100,263 | |
| Henderson Facs–Pratt Paper AMT† | | 3.70% | | 1/1/2032 | | NR | | | 6,500,000 | | | | 6,053,957 | |
| Hoover IDA–US Steel AMT | | 6.375% | #(b) | 11/1/2050 | | BB- | | | 1,570,000 | | | | 1,723,933 | |
| IA Fin Auth–Iowa Fertilizer Co | | 4.00% | #(b) | 12/1/2050 | | BBB- | | | 5,600,000 | | | | 5,091,084 | |
| IN Fin Auth–OVEC | | 2.50% | | 11/1/2030 | | Baa3 | | | 3,350,000 | | | | 2,838,433 | |
| IN Fin Auth–OVEC | | 3.00% | | 11/1/2030 | | Baa3 | | | 500,000 | | | | 442,067 | |
| IN Fin Auth–OVEC | | 3.00% | | 11/1/2030 | | Baa3 | | | 1,000,000 | | | | 883,516 | |
| IN Fin Auth–US Steel | | 4.125% | | 12/1/2026 | | BB- | | | 8,480,000 | | | | 8,213,306 | |
| LA St John Parish–Marathon Oil | | 2.20% | #(b) | 6/1/2037 | | BBB- | | | 3,980,000 | | | | 3,693,111 | |
| Love Field Arpt–Southwest Airlines | | 5.00% | | 11/1/2022 | | Baa1 | | | 285,000 | | | | 285,299 | |
| Matagorda Co Nav Dist–AEP TX Central | | 2.60% | | 11/1/2029 | | A- | | | 2,580,000 | | | | 2,220,291 | |
| Mission Econ Dev Corp–Natgasoline AMT† | | 4.625% | | 10/1/2031 | | BB- | | | 9,775,000 | | | | 9,644,203 | |
| MSR Energy Auth–Citi | | 6.125% | | 11/1/2029 | | BBB+ | | | 2,440,000 | | | | 2,651,440 | |
| Nez Perce Co Poll Ctl–Potlatch | | 2.75% | | 10/1/2024 | | BBB- | | | 2,835,000 | | | | 2,776,815 | |
| NH Bus Fin Auth–United Illuminating | | 2.80% | #(b) | 10/1/2033 | | A- | | | 1,000,000 | | | | 991,448 | |
| NH Fin Auth–Casella Waste† | | 2.95% | | 4/1/2029 | | B | | | 2,300,000 | | | | 1,969,795 | |
| NH National Fin Auth–Covanta AMT† | | 4.00% | | 11/1/2027 | | B | | | 1,525,000 | | | | 1,450,113 | |
| NH National Fin Auth–NY Electric & Gas AMT | | 4.00% | | 12/1/2028 | | A- | | | 5,050,000 | | | | 4,974,715 | |
| NH National Fin Auth–Waste Mgmt AMT | | 2.15% | #(b) | 7/1/2027 | | A- | | | 3,160,000 | | | | 3,077,517 | |
| Niagara Area Dev Corp–Covanta† | | 3.50% | | 11/1/2024 | | B1 | | | 6,100,000 | | | | 5,949,672 | |
| NJ EDA–Continental Airlines | | 5.125% | | 9/15/2023 | | Ba3 | | | 2,115,000 | | | | 2,116,192 | |
| NY Env Facs–Casella Waste AMT | | 2.75% | #(b) | 9/1/2050 | | B | | | 3,500,000 | | | | 3,271,900 | |
| NY Env Facs–Casella Waste AMT† | | 2.875% | #(b) | 12/1/2044 | | B | | | 1,500,000 | | | | 1,259,841 | |
| NY Env Facs–Casella Waste AMT† | | 3.125% | #(b) | 12/1/2044 | | B | | | 3,000,000 | | | | 2,781,668 | |
| NY Trans Dev Corp–American Airlines AMT | | 2.25% | | 8/1/2026 | | B | (c) | | 1,505,000 | | | | 1,388,868 | |
| NY Trans Dev Corp–American Airlines AMT | | 3.00% | | 8/1/2031 | | B | (c) | | 4,545,000 | | | | 3,981,241 | |
| | See Notes to Financial Statements. | 127 |
Schedule of Investments (continued)
SHORT DURATION HIGH INCOME MUNICIPAL BOND FUND September 30, 2022
| Investments | | Interest
Rate | | Maturity
Date | | Credit
Rating:
S&P or
Moody’s(a) | | Principal
Amount | | | Fair
Value | |
| Corporate-Backed (continued) | | | | | | | | | | | | | | |
| NY Trans Dev Corp–American Airlines AMT | | 5.00% | | 8/1/2026 | | B- | | $ | 820,000 | | | $ | 820,012 | |
| NY Trans Dev Corp–American Airlines AMT | | 5.25% | | 8/1/2031 | | B- | | | 4,510,000 | | | | 4,512,766 | |
| NY Trans Dev Corp–Delta Airlines AMT | | 5.00% | | 1/1/2032 | | Baa3 | | | 3,000,000 | | | | 2,946,066 | |
| NYC IDA–TRIPS | | 5.00% | | 7/1/2028 | | BBB+ | | | 1,000,000 | | | | 1,003,003 | |
| OH Air Dev Auth–AEP AMT | | 2.60% | #(b) | 6/1/2041 | | BBB+ | | | 2,500,000 | | | | 2,192,115 | |
| OH Air Dev Auth–OVEC | | 2.875% | | 2/1/2026 | | Baa3 | | | 700,000 | | | | 658,615 | |
| OH Air Quality–Pratt Paper AMT† | | 3.75% | | 1/15/2028 | | NR | | | 320,000 | | | | 319,117 | |
| Ohio Air Quality Development Authority | | 2.875% | | 2/1/2026 | | Baa3 | | | 1,940,000 | | | | 1,825,305 | |
| PA EDA–Consol Energy AMT† | | 9.00% | #(b) | 4/1/2051 | | B- | | | 3,125,000 | | | | 3,563,431 | |
| PA EDA–Covanta AMT† | | 3.25% | | 8/1/2039 | | B | | | 7,700,000 | | | | 5,621,370 | |
| Parish of St James–Nustar Logistics† | | 6.10% | #(b) | 6/1/2038 | | BB- | | | 8,235,000 | | | | 8,777,896 | |
| Parish of St James–Nustar Logistics† | | 6.10% | #(b) | 12/1/2040 | | BB- | | | 2,250,000 | | | | 2,398,332 | |
| Polk Co IDA–Mineral Development† | | 5.875% | | 1/1/2033 | | NR | | | 1,375,000 | | | | 1,362,876 | |
| Port Beaumont Nav Dis–Jefferson Rail AMT† | | 1.875% | | 1/1/2026 | | NR | | | 2,710,000 | | | | 2,438,264 | |
| Port Beaumont Nav Dis–Jefferson Rail AMT† | | 2.00% | | 1/1/2027 | | NR | | | 1,250,000 | | | | 1,089,450 | |
| Port Beaumont Nav Dis–Jefferson Rail AMT† | | 2.125% | | 1/1/2028 | | NR | | | 775,000 | | | | 654,720 | |
| Port Beaumont Nav Dis–Jefferson Rail AMT† | | 2.25% | | 1/1/2029 | | NR | | | 1,300,000 | | | | 1,066,539 | |
| Port Beaumont Nav Dis–Jefferson Rail AMT† | | 2.50% | | 1/1/2030 | | NR | | | 1,150,000 | | | | 928,120 | |
| Port Beaumont Nav Dis–Jefferson Rail AMT† | | 2.625% | | 1/1/2031 | | NR | | | 1,600,000 | | | | 1,267,190 | |
| Port Beaumont Nav Dis–Jefferson Rail AMT† | | 3.625% | | 1/1/2035 | | NR | | | 1,230,000 | | | | 993,054 | |
| Sacramento Co Arpt AMT | | 5.00% | | 7/1/2028 | | A+ | | | 3,090,000 | | | | 3,220,738 | |
| Salem Co Poll Ctl–Chambers AMT | | 5.00% | | 12/1/2023 | | NR | | | 2,660,000 | | | | 2,689,761 | |
| St James Parish–Nustar Logistics† | | 5.85% | #(b) | 8/1/2041 | | BB- | | | 4,125,000 | | | | 4,234,694 | |
| Sumter Co IDA–Enviva Inc AMT | | 6.00% | #(b) | 7/15/2052 | | B+ | | | 15,000,000 | | | | 13,799,079 | |
| Tuscaloosa IDA–Hunt Refining† | | 4.50% | | 5/1/2032 | | NR | | | 9,446,498 | | | | 8,200,370 | |
| Valparaiso Facs–Pratt Paper AMT | | 5.875% | | 1/1/2024 | | NR | | | 110,000 | | | | 111,695 | |
| Valparaiso Facs–Pratt Paper AMT | | 7.00% | | 1/1/2044 | | NR | | | 115,000 | | | | 118,255 | |
| VT EDA–Casella Waste AMT† | | 5.00% | #(b) | 6/1/2052 | | B | | | 5,500,000 | | | | 5,357,132 | |
| Warren Co–Intl Paper | | 2.90% | #(b) | 9/1/2032 | | BBB | | | 750,000 | | | | 743,320 | |
| Whiting Env Facs–BP AMT | | 5.00% | #(b) | 11/1/2045 | | A2 | | | 1,170,000 | | | | 1,170,899 | |
| WI PFA–American Dream† | | 5.00% | | 12/1/2027 | | NR | | | 1,275,000 | | | | 1,116,737 | |
| WI PFA–American Dream† | | 6.50% | | 12/1/2037 | | NR | | | 2,000,000 | | | | 1,687,854 | |
| WI PFA–Celanese AMT | | 4.30% | | 11/1/2030 | | BBB | | | 3,095,000 | | | | 3,045,155 | |
| WI PFA–Celanese AMT | | 5.00% | | 1/1/2024 | | BBB | | | 1,500,000 | | | | 1,513,912 | |
| WI PFA–Celanese AMT | | 5.00% | | 12/1/2025 | | BBB | | | 2,490,000 | | | | 2,539,348 | |
| WI PFA–Sky Harbour AMT | | 4.00% | | 7/1/2036 | | NR | | | 9,585,000 | | | | 7,530,836 | |
| Total | | | | | | | | | | | | | 237,324,370 | |
| 128 | See Notes to Financial Statements. |
Schedule of Investments (continued)
SHORT DURATION HIGH INCOME MUNICIPAL BOND FUND September 30, 2022
| Investments | | Interest
Rate | | Maturity
Date | | Credit
Rating:
S&P or
Moody’s(a) | | Principal
Amount | | | Fair
Value | |
| Education 6.10% | | | | | | | | | | | | | | |
| AZ Edu Fac–Odyssey Prep† | | 4.00% | | 7/1/2029 | | BB- | | $ | 425,000 | | | $ | 398,191 | |
| AZ IDA–Academy of Math & Science Proj† | | 5.00% | | 7/1/2029 | | BB+ | | | 1,500,000 | | | | 1,493,104 | |
| CA Choice Clean Energy–Morgan Stanley | | 3.697%
(SOFR * .67 + 1.70% | )# | 5/1/2053 | | A1 | | | 10,000,000 | | | | 9,949,536 | (d) |
| CA Muni Fin–Julian Chtr Sch† | | 5.00% | | 3/1/2025 | | B+ | | | 565,000 | | | | 558,305 | |
| CA Muni Fin Auth–William Jessup U† | | 5.00% | | 8/1/2024 | | NR | | | 835,000 | | | | 837,750 | |
| CA Muni Fin Auth–William Jessup U† | | 5.00% | | 8/1/2027 | | NR | | | 100,000 | | | | 99,897 | |
| Cap Trust Agy–Renaissance Chtr Sch† | | 4.00% | | 6/15/2029 | | NR | | | 930,000 | | | | 859,552 | |
| Cap Trust Ed Facs–Advantage Charter Scho | | 4.00% | | 12/15/2024 | | Baa3 | | | 325,000 | | | | 320,354 | |
| Cap Trust Ed Facs–Advantage Charter Scho | | 5.00% | | 12/15/2029 | | Baa3 | | | 400,000 | | | | 402,831 | |
| Chester Co Hlth & Ed–Immaculata Univ | | 4.25% | | 11/1/2032 | | BB- | (c) | | 1,600,000 | | | | 1,308,877 | |
| Chester Co Hlth & Ed–Immaculata Univ | | 5.00% | | 11/1/2022 | | BB- | (c) | | 630,000 | | | | 629,647 | |
| Chicago Brd Ed | | 5.00% | | 12/1/2022 | | BB | | | 1,500,000 | | | | 1,503,565 | |
| City of Farmington NM | | 1.80% | | 4/1/2029 | | A- | | | 4,810,000 | | | | 4,063,794 | |
| Clifton Higher Ed–Intl Ldrshp Sch | | 4.625% | | 8/15/2025 | | NR | | | 1,965,000 | | | | 1,960,989 | |
| Clifton Higher Ed–Intl Ldrshp Sch | | 5.75% | | 8/15/2038 | | NR | | | 1,405,000 | | | | 1,420,007 | |
| Frederick Co Ed Fac–Mount St Mary’s Univ† | | 5.00% | | 9/1/2027 | | BB+ | | | 2,250,000 | | | | 2,256,212 | |
| IL Fin Auth–IL Inst of Tech | | 5.00% | | 9/1/2024 | | Baa3 | | | 500,000 | | | | 506,206 | |
| IL Fin Auth–IL Inst of Tech | | 5.00% | | 9/1/2025 | | Baa3 | | | 600,000 | | | | 610,325 | |
| IL Fin Auth–IL Inst of Tech | | 5.00% | | 9/1/2026 | | Baa3 | | | 750,000 | | | | 765,708 | |
| MA DFA–Emerson Clg | | 5.00% | | 1/1/2024 | | BBB+ | | | 500,000 | | | | 505,474 | |
| Maricopa Co IDA–Ottawa Univ† | | 5.00% | | 10/1/2026 | | NR | | | 240,000 | | | | 240,697 | |
| Maricopa Co IDA–Ottawa Univ† | | 5.125% | | 10/1/2030 | | NR | | | 425,000 | | | | 424,584 | |
| Marietta Dev Auth–Life Univ† | | 5.00% | | 11/1/2027 | | Ba3 | | | 3,000,000 | | | | 3,032,288 | |
| Multnomah Co Hsp–Mirabella | | 5.00% | | 10/1/2024 | | NR | | | 90,000 | | | | 90,230 | |
| New Hope Cultural Education Facilities Finance Cor† | | 4.00% | | 8/15/2023 | | BB+ | | | 700,000 | | | | 696,100 | |
| New Hope Cultural Education Facilities Finance Cor† | | 4.00% | | 8/15/2025 | | BB+ | | | 1,280,000 | | | | 1,246,174 | |
| New Hope Cultural Education Facilities Finance Cor† | | 4.00% | | 8/15/2027 | | BB+ | | | 1,040,000 | | | | 986,489 | |
| New Hope Cultural Education Facilities Finance Cor† | | 4.00% | | 8/15/2029 | | BB+ | | | 1,345,000 | | | | 1,246,143 | |
| NY Dorm–Touro Clg | | 5.25% | | 1/1/2034 | | NR | | | 100,000 | | | | 103,033 | |
| NY Dorm–Yeshiva | | 5.00% | | 7/15/2028 | | BBB- | | | 1,140,000 | | | | 1,171,977 | |
| NY Dorm–Yeshiva | | 5.00% | | 7/15/2029 | | BBB- | | | 1,545,000 | | | | 1,589,271 | |
| NY Dorm–Yeshiva | | 5.00% | | 7/15/2030 | | BBB- | | | 2,200,000 | | | | 2,255,875 | |
| | See Notes to Financial Statements. | 129 |
Schedule of Investments (continued)
SHORT DURATION HIGH INCOME MUNICIPAL BOND FUND September 30, 2022
| Investments | | Interest
Rate | | Maturity
Date | | Credit
Rating:
S&P or
Moody’s(a) | | Principal
Amount | | | Fair
Value | |
| Education (continued) | | | | | | | | | | | | | | |
| NY Dorm–Yeshiva | | 5.00% | | 7/15/2032 | | BBB- | | $ | 1,960,000 | | | $ | 1,982,096 | |
| NYC IDA–Yankee Stadium (FGIC) | | 9.415%
(CPI YoY | )# | 3/1/2027 | | Baa1 | | | 2,500,000 | | | | 2,520,642 | |
| OH Air Dev Auth–Duke Energy AMT | | 4.25% | #(b) | 11/1/2039 | | BBB | | | 2,000,000 | | | | 1,967,535 | |
| OH HI Ed–Dayton Univ (AMBAC) | | 6.49%
(CPI YoY | )# | 12/1/2022 | | A+ | | | 2,365,000 | | | | 2,366,690 | |
| VT Edu Loan Rev AMT | | 4.00% | | 6/15/2029 | | A | | | 1,250,000 | | | | 1,208,256 | |
| Total | | | | | | | | | | | | | 53,578,404 | |
| | | | | | | | | | | | | | | |
| Financial Services 0.23% | | | | | | | | | | | | | | |
| MA Ed Fin Auth AMT | | 5.00% | | 7/1/2025 | | AA | | | 2,000,000 | | | | 2,058,181 | |
| | | | | | | | | | | | | | | |
| General Obligation 10.66% | | | | | | | | | | | | | | |
| Academical Village CCD | | 3.25% | | 5/1/2031 | | NR | | | 765,000 | | | | 649,335 | |
| Academical Village CDD | | 2.875% | | 5/1/2025 | | NR | | | 910,000 | | | | 860,742 | |
| Arlington ISD–Brooks Academies | | 4.00% | | 6/15/2031 | | NR | | | 3,360,000 | | | | 2,963,853 | |
| Chicago Brd Ed | | Zero Coupon | | 12/1/2025 | | BB | | | 1,000,000 | | | | 865,228 | |
| Chicago Brd Ed | | 4.00% | | 12/1/2022 | | BB | | | 1,290,000 | | | | 1,290,387 | |
| Chicago Brd Ed | | 4.00% | | 12/1/2022 | | BB | | | 1,175,000 | | | | 1,175,352 | |
| Chicago Brd Ed | | 4.00% | | 12/1/2027 | | BB | | | 2,250,000 | | | | 2,176,067 | |
| Chicago Brd Ed | | 5.00% | | 12/1/2030 | | BB | | | 4,000,000 | | | | 4,046,847 | |
| Chicago Brd Ed | | 5.00% | | 12/1/2034 | | BB | | | 6,325,000 | | | | 6,334,517 | |
| Chicago Brd Ed† | | 6.75% | | 12/1/2030 | | BB | | | 2,000,000 | | | | 2,223,408 | |
| Chicago Brd Ed | | 7.00% | | 12/1/2026 | | BB | | | 100,000 | | | | 108,331 | |
| Chicago GO | | 5.00% | | 1/1/2024 | | BBB+ | | | 2,930,000 | | | | 2,961,803 | |
| Chicago GO | | 5.00% | | 1/1/2026 | | BBB+ | | | 2,125,000 | | | | 2,168,497 | |
| Chicago GO | | 5.00% | | 1/1/2027 | | BBB+ | | | 1,925,000 | | | | 1,942,274 | |
| Chicago GO | | 5.00% | | 1/1/2030 | | BBB+ | | | 4,780,000 | | | | 4,811,382 | |
| Coralville GO | | 4.50% | | 6/1/2032 | | BB+ | | | 1,215,000 | | | | 1,220,990 | |
| Coralville GO | | 5.00% | | 5/1/2030 | | A- | (c) | | 1,025,000 | | | | 1,046,192 | |
| IL State GO | | 5.00% | | 11/1/2025 | | BBB+ | | | 2,000,000 | | | | 2,034,388 | |
| IL State GO | | 5.00% | | 12/1/2026 | | BBB+ | | | 3,000,000 | | | | 3,058,050 | |
| IL State GO | | 5.00% | | 3/1/2028 | | BBB+ | | | 6,000,000 | | | | 6,142,354 | |
| IL State GO | | 5.00% | | 5/1/2028 | | BBB+ | | | 3,000,000 | | | | 3,027,165 | |
| IL State GO | | 5.375% | | 5/1/2023 | | BBB+ | | | 1,700,000 | | | | 1,716,654 | |
| IL State GO | | 5.50% | | 5/1/2030 | | BBB+ | | | 5,260,000 | | | | 5,555,964 | |
| New Haven GO | | 5.00% | | 8/1/2025 | | BBB+ | | | 580,000 | | | | 601,272 | |
| Philadelphia Sch Dist | | 5.00% | | 9/1/2025 | | A1 | | | 200,000 | | | | 207,312 | |
| PR Comwlth GO | | Zero Coupon | | 7/1/2024 | | NR | | | 5,978,252 | | | | 5,497,581 | |
| 130 | See Notes to Financial Statements. |
Schedule of Investments (continued)
SHORT DURATION HIGH INCOME MUNICIPAL BOND FUND September 30, 2022
| Investments | | Interest
Rate | | Maturity
Date | | Credit
Rating:
S&P or
Moody’s(a) | | Principal
Amount | | | Fair
Value | |
| General Obligation (continued) | | | | | | | | | | | | | | |
| PR Comwlth GO | | Zero Coupon | | 7/1/2033 | | NR | | $ | 980 | | | $ | 542 | |
| PR Comwlth GO | | Zero Coupon | #(b) | 11/1/2043 | | NR | | | 6,436,560 | | | | 3,226,326 | |
| PR Comwlth GO | | 4.00% | | 7/1/2033 | | NR | | | 1,136,793 | | | | 1,002,236 | |
| PR Comwlth GO | | 4.00% | | 7/1/2035 | | NR | | | 56,654 | | | | 48,569 | |
| PR Comwlth GO | | 4.00% | | 7/1/2037 | | NR | | | 92,716 | | | | 76,322 | |
| PR Comwlth GO | | 5.25% | | 7/1/2023 | | NR | | | 681,468 | | | | 684,667 | |
| PR Comwlth GO | | 5.375% | | 7/1/2025 | | NR | | | 11,433,128 | | | | 11,552,429 | |
| PR Comwlth GO | | 5.625% | | 7/1/2027 | | NR | | | 420,150 | | | | 429,407 | |
| PR Comwlth GO | | 5.625% | | 7/1/2029 | | NR | | | 2,852,109 | | | | 2,922,001 | |
| PR Comwlth GO | | 5.75% | | 7/1/2031 | | NR | | | 2,357,000 | | | | 2,407,895 | |
| PR Elec Pwr Auth (NPFGC)(FGIC) | | 5.25% | | 7/1/2023 | | Baa2 | | | 2,325,000 | | | | 2,328,993 | |
| San Gorgonio Memorial Health Care District | | 5.00% | | 8/1/2035 | | Ba2 | | | 1,355,000 | | | | 1,336,051 | |
| Scranton GO | | 5.00% | | 11/15/2032 | | BB+ | | | 1,000,000 | | | | 1,003,282 | |
| VT EDA–Casella Waste AMT† | | 4.625% | #(b) | 4/1/2036 | | B | | | 1,900,000 | | | | 1,809,921 | |
| Total | | | | | | | | | | | | | 93,514,586 | |
| | | | | | | | | | | | | | | |
| Health Care 11.68% | | | | | | | | | | | | | | |
| Atlanta Dev Auth–Georgia Proton | | 6.00% | | 1/1/2023 | | NR | | | 2,000,000 | | | | 1,060,000 | |
| Berks Co IDA–Tower Hlth | | 5.00% | | 11/1/2023 | | BB- | | | 2,945,000 | | | | 2,872,574 | |
| Berks Co IDA–Tower Hlth | | 5.00% | | 2/1/2029 | | BB- | | | 1,500,000 | | | | 1,294,341 | |
| Berks Co IDA–Tower Hlth | | 5.00% | | 2/1/2032 | | BB- | | | 850,000 | | | | 686,471 | |
| Berks Co IDA–Tower Hlth | | 5.00% | #(b) | 2/1/2040 | | BB- | | | 8,890,000 | | | | 7,986,877 | |
| Berks Co IDA–Tower Hlth | | 5.00% | #(b) | 2/1/2040 | | BB- | | | 8,710,000 | | | | 8,174,980 | |
| Blaine Sr Hsg & Hlthcare–Crest View | | 5.125% | | 7/1/2025 | | NR | | | 60,000 | | | | 50,261 | (d) |
| Bucks Co IDA–Grand View Hosp | | 5.00% | | 7/1/2025 | | BB | | | 1,450,000 | | | | 1,466,945 | |
| Bucks Co IDA–Grand View Hosp | | 5.00% | | 7/1/2038 | | BB | | | 1,000,000 | | | | 923,245 | |
| CA Stwde–Daughters of Charity | | 5.50% | | 7/1/2022 | | NR | | | 3,663 | | | | 3,444 | |
| CA Stwde–Daughters of Charity | | 5.75% | | 7/1/2024 | | NR | | | 21,558 | | | | 20,265 | |
| CA Stwde–Loma Linda Univ Med† | | 5.00% | | 12/1/2031 | | BB- | | | 1,000,000 | | | | 987,800 | |
| CA Stwde–Loma Linda Univ Med Ctr† | | 5.00% | | 12/1/2025 | | BB- | | | 1,200,000 | | | | 1,212,256 | |
| CA Stwde–Loma Linda Univ Med Ctr† | | 5.00% | | 12/1/2026 | | BB- | | | 1,070,000 | | | | 1,080,991 | |
| CA Stwde–Loma Linda Univ Med Ctr† | | 5.00% | | 12/1/2028 | | BB- | | | 885,000 | | | | 886,364 | |
| CA Stwde–Loma Linda Univ Med Ctr | | 5.25% | | 12/1/2029 | | BB- | | | 2,500,000 | | | | 2,539,304 | |
| City of Oroville–Oroville Hsp | | 5.00% | | 4/1/2026 | | B+ | | | 1,255,000 | | | | 1,257,291 | |
| City of Oroville–Oroville Hsp | | 5.00% | | 4/1/2029 | | B+ | | | 900,000 | | | | 898,485 | |
| CT Hlth & Ed–Griffin Hosp† | | 5.00% | | 7/1/2032 | | BB+ | | | 740,000 | | | | 733,720 | |
| Cuyahoga Co Hsp–Metrohealth | | 5.00% | | 2/15/2023 | | BBB | | | 1,500,000 | | | | 1,508,017 | |
| Cuyahoga Co Hsp–Metrohealth | | 5.00% | | 2/15/2028 | | BBB | | | 500,000 | | | | 513,190 | |
| | See Notes to Financial Statements. | 131 |
Schedule of Investments (continued)
SHORT DURATION HIGH INCOME MUNICIPAL BOND FUND September 30, 2022
| Investments | | Interest
Rate | | Maturity
Date | | Credit
Rating:
S&P or
Moody’s(a) | | Principal
Amount | | | Fair
Value | |
| Health Care (continued) | | | | | | | | | | | | | | |
| Cuyahoga Co Hsp–Metrohealth | | 5.00% | | 2/15/2030 | | BBB | | $ | 1,900,000 | | | $ | 1,945,811 | |
| Franklin Co IDA–Menno-Haven | | 5.00% | | 12/1/2026 | | NR | | | 500,000 | | | | 486,805 | |
| Fruita CO Hlth–Canyons Hosp & Med Centr† | | 5.375% | | 1/1/2033 | | NR | | | 2,000,000 | | | | 1,917,060 | |
| Fulton Co Med Ctr | | 4.00% | | 7/1/2028 | | NR | | | 3,275,000 | | | | 3,067,191 | |
| Glendale IDA–Beatitudes | | 4.00% | | 11/15/2027 | | NR | | | 385,000 | | | | 363,147 | |
| Glendale IDA–Beatitudes | | 5.00% | | 11/15/2023 | | NR | | | 1,715,000 | | | | 1,713,437 | |
| Guadalupe Co–Seguin City Hospital | | 4.00% | | 12/1/2026 | | BB | | | 1,255,000 | | | | 1,180,727 | |
| Guadalupe Co–Seguin City Hospital | | 5.00% | | 12/1/2022 | | BB | | | 250,000 | | | | 250,216 | |
| Guadalupe Co–Seguin City Hospital | | 5.00% | | 12/1/2023 | | BB | | | 1,280,000 | | | | 1,286,654 | |
| ID HFA–Madison Mem Hosp | | 5.00% | | 9/1/2023 | | BB+ | | | 1,795,000 | | | | 1,808,791 | |
| ID HFA–Madison Mem Hosp | | 5.00% | | 9/1/2029 | | BB+ | | | 710,000 | | | | 724,475 | |
| IL Fin Auth–Plymouth Place | | 5.00% | | 5/15/2025 | | BB+ | (c) | | 75,000 | | | | 77,092 | |
| Jefferson Co–Samaritan Med Ctr | | 5.00% | | 11/1/2025 | | BB | | | 1,305,000 | | | | 1,328,561 | |
| King Co Pub Hsp–Snoqualmie Vly Hsp | | 5.00% | | 12/1/2025 | | NR | | | 90,000 | | | | 88,816 | |
| Kirkwood IDA–Aberdeen Hts | | 5.25% | | 5/15/2028 | | BB- | (c) | | 1,135,000 | | | | 1,091,199 | |
| MA Hlth & Edu Facs–Trinity Hlth | | 2.766%
(3 Mo. LIBOR * .67 + .82% | )# | 11/15/2032 | | AA- | | | 1,520,000 | | | | 1,484,577 | |
| Montgomery Co IDA–Trinity Health | | 2.776%
(3 Mo. LIBOR * .67 + .83% | )# | 11/15/2034 | | AA- | | | 480,000 | | | | 471,695 | |
| Muskingum Co Hsp–Genesis Hlthcare | | 4.00% | | 2/15/2023 | | BB+ | | | 1,500,000 | | | | 1,498,925 | |
| Muskingum Co Hsp–Genesis Hlthcare | | 5.00% | | 2/15/2033 | | BB+ | | | 5,965,000 | | | | 5,696,030 | |
| Muskingum Co Hsp–Genesis Hlthcare | | 5.00% | | 2/15/2044 | | BB+ | | | 2,000,000 | | | | 1,775,530 | |
| New Hope Cultural–Wesleyan Homes | | 3.00% | | 1/1/2024 | | NR | | | 155,000 | | | | 149,471 | |
| NJ Hlth–St Peters Univ Hsp | | 5.75% | | 7/1/2037 | | BBB- | | | 795,000 | | | | 797,185 | |
| NY Dorm–Catholic Hlth | | 5.00% | | 7/1/2028 | | BB+ | | | 1,000,000 | | | | 938,268 | |
| NY Dorm–Catholic Hlth | | 5.00% | | 7/1/2030 | | BB+ | | | 1,750,000 | | | | 1,624,624 | |
| NY Dorm–Orange Reg Med Ctr† | | 5.00% | | 12/1/2022 | | BBB- | | | 500,000 | | | | 500,616 | |
| NY Dorm–Orange Reg Med Ctr† | | 5.00% | | 12/1/2022 | | BBB- | | | 200,000 | | | | 200,246 | |
| OK DFA–OU Med | | 5.00% | | 8/15/2029 | | Ba2 | | | 475,000 | | | | 453,322 | |
| OK DFA–OU Med | | 5.25% | | 8/15/2043 | | Ba2 | | | 1,500,000 | | | | 1,276,919 | |
| OU MedOK DFA OK DFA–OU Med | | 5.00% | | 8/15/2024 | | Ba2 | | | 1,400,000 | | | | 1,364,358 | |
| Palomar Health | | 5.00% | | 11/1/2031 | | BBB | | | 750,000 | | | | 764,542 | |
| Philadelphia Hsps–Temple Univ Hlth | | 5.00% | | 7/1/2023 | | BBB | | | 1,000,000 | | | | 1,007,038 | |
| RI Hlth & Ed–Care New England | | 5.00% | | 9/1/2031 | | B+ | | | 8,010,000 | | | | 7,325,209 | |
| Roanoke Co EDA–Richfield Living II | | 4.30% | | 9/1/2030 | | NR | | | 770,000 | | | | 601,408 | |
| SC Jobs EDA–Hampton Regl Med | | 5.00% | | 11/1/2022 | | NR | | | 700,000 | | | | 700,540 | |
| 132 | See Notes to Financial Statements. |
Schedule of Investments (continued)
SHORT DURATION HIGH INCOME MUNICIPAL BOND FUND September 30, 2022
| Investments | | Interest
Rate | | Maturity
Date | | Credit
Rating:
S&P or
Moody’s(a) | | Principal
Amount | | | Fair
Value | |
| Health Care (continued) | | | | | | | | | | | | | | |
| SC Jobs EDA–Hampton Regl Med | | 5.00% | | 11/1/2023 | | NR | | $ | 740,000 | | | $ | 746,165 | |
| SC Kiawah Life Plan Village† | | 8.75% | | 7/1/2025 | | NR | | | 4,500,000 | | | | 4,534,328 | (d) |
| SE Port Auth–Memorial Hlth | | 5.00% | | 12/1/2022 | | B+ | (c) | | 100,000 | | | | 100,298 | |
| SE Port Auth–Memorial Hlth | | 5.00% | | 12/1/2023 | | B+ | (c) | | 100,000 | | | | 100,587 | |
| SE Port Auth–Memorial Hlth | | 5.50% | | 12/1/2029 | | B+ | (c) | | 1,000,000 | | | | 1,004,059 | (d) |
| SE Port Auth–Memorial Hlth | | 5.75% | | 12/1/2032 | | B+ | (c) | | 1,945,000 | | | | 1,953,073 | |
| Tulsa Co Industrial Auth–Montereau | | 5.00% | | 11/15/2023 | | BBB- | (c) | | 230,000 | | | | 231,822 | |
| Washington Co–Memorial Hlth | | 5.50% | | 12/1/2027 | | NR | | | 10,000,000 | | | | 9,489,823 | |
| WI Hlth & Ed–American Baptist | | 4.375% | | 8/1/2027 | | NR | | | 225,000 | | | | 208,614 | |
| WI Hlth Fac Auth–St. Camillus | | 5.00% | | 11/1/2026 | | NR | | | 355,000 | | | | 350,107 | |
| WI PFA–Bancroft Neuro† | | 5.00% | | 6/1/2026 | | NR | | | 470,000 | | | | 464,719 | |
| WI PFA–Carson Valley Med Center | | 3.00% | | 12/1/2026 | | BB+ | | | 250,000 | | | | 230,550 | |
| WI PFA–Carson Valley Med Center | | 4.00% | | 12/1/2031 | | BB+ | | | 1,050,000 | | | | 966,630 | |
| Total | | | | | | | | | | | | | 102,498,081 | |
| | | | | | | | | | | | | | | |
| Housing 0.89% | | | | | | | | | | | | | | |
| Ca Stwde–Lancer Student Hsg† | | 3.00% | | 6/1/2029 | | NR | | | 710,000 | | | | 613,916 | (d) |
| Chicago GO | | 5.00% | | 1/1/2023 | | BBB+ | | | 2,000,000 | | | | 2,008,801 | |
| MN HFA | | 3.00% | | 1/1/2051 | | AA+ | | | 1,140,000 | | | | 1,084,543 | |
| Montgomery Co Hsg | | 4.00% | | 7/1/2048 | | Aa2 | | | 435,000 | | | | 431,231 | |
| NC State Hsg Fin Agy | | 4.00% | | 7/1/2047 | | AA+ | | | 400,000 | | | | 396,568 | |
| NJ Hsg and Mtg Fin Auth | | 4.50% | | 10/1/2048 | | AA | | | 770,000 | | | | 769,580 | |
| NYC HDC (FHA) | | 1.45% | | 11/1/2029 | | AA+ | | | 1,080,000 | | | | 903,954 | |
| NYS HFA L-1 (SONYMA) | | 1.45% | | 5/1/2029 | | Aa2 | | | 1,560,000 | | | | 1,290,064 | |
| PA Hsg Fin Auth AMT | | 4.00% | | 4/1/2039 | | AA+ | | | 300,000 | | | | 298,031 | |
| Total | | | | | | | | | | | | | 7,796,688 | |
| | | | | | | | | | | | | | | |
| Lease Obligations 2.83% | | | | | | | | | | | | | | |
| Coralville COPS | | 4.00% | | 6/1/2031 | | BB | | | 1,000,000 | | | | 938,070 | |
| KY Ppty & Bldgs Commn–Proj #112 | | 5.00% | | 11/1/2024 | | A1 | | | 1,000,000 | | | | 1,030,808 | |
| Met Pier & Expo Auth–McCormick Place (NPFGC)(FGIC) | | 5.50% | | 6/15/2029 | | A- | | | 2,015,000 | | | | 2,124,527 | |
| Met Pier & Expo Auth–Mccormick Place (NPFGC)(FGIC) | | Zero Coupon | | 6/15/2028 | | A- | | | 1,345,000 | | | | 1,040,760 | |
| NJ EDA–Sch Facs | | 3.71%
(MUNIPSA * 1 + 1.25% | )# | 9/1/2025 | | A3 | | | 2,280,000 | | | | 2,282,388 | |
| NJ EDA–Sch Facs | | 4.01%
(MUNIPSA * 1 + 1.55% | )# | 9/1/2027 | | A3 | | | 530,000 | | | | 530,316 | |
| NJ EDA–Sch Facs | | 5.00% | | 3/1/2023 | | A3 | | | 2,005,000 | | | | 2,018,048 | |
| | See Notes to Financial Statements. | 133 |
Schedule of Investments (continued)
SHORT DURATION HIGH INCOME MUNICIPAL BOND FUND September 30, 2022
| Investments | | Interest
Rate | | Maturity
Date | | Credit
Rating:
S&P or
Moody’s(a) | | Principal
Amount | | | Fair
Value | |
| Lease Obligations (continued) | | | | | | | | | | | | | | |
| NJ EDA–Sch Facs | | 5.00% | | 6/15/2023 | | A3 | | $ | 3,455,000 | | | $ | 3,491,857 | |
| NJ EDA–Sch Facs (NPFGC)(FGIC) | | 5.50% | | 9/1/2029 | | A3 | | | 1,555,000 | | | | 1,705,819 | |
| NJ Trans Trust Fund | | 4.00% | | 12/15/2031 | | A3 | | | 4,110,000 | | | | 3,941,041 | |
| NJ Trans Trust Fund | | 5.00% | | 12/15/2023 | | A3 | | | 1,000,000 | | | | 1,017,620 | |
| NJ Trans Trust Fund | | 5.00% | | 12/15/2026 | | A3 | | | 3,510,000 | | | | 3,642,274 | |
| NY Liberty Dev Corp–4 WTC CR (AGM) | | 1.90% | | 11/15/2031 | | AA | | | 1,000,000 | | | | 778,237 | |
| PA COPS | | 5.00% | | 7/1/2024 | | A | | | 300,000 | | | | 308,046 | |
| Total | | | | | | | | | | | | | 24,849,811 | |
| | | | | | | | | | | | | | | |
| Other Revenue 6.30% | | | | | | | | | | | | | | |
| Arlington Hi Ed Fin Corp–Newman Intl Acad | | 4.00% | | 8/15/2031 | | NR | | | 360,000 | | | | 326,268 | |
| Arlington Hi Ed Fin Corp–Newman Intl Acad | | 4.375% | | 8/15/2026 | | NR | | | 1,570,000 | | | | 1,532,059 | |
| AZ IDA–Academy of Math & Science† | | 4.00% | | 7/1/2029 | | BB+ | | | 400,000 | | | | 375,573 | |
| AZ IDA–Basis Schools† | | 5.00% | | 7/1/2026 | | BB | | | 415,000 | | | | 419,107 | |
| Build NYC Res Corp–Hellenic Charter† | | 4.00% | | 12/1/2031 | | NR | | | 700,000 | | | | 636,506 | |
| Build NYC Res Corp–Shefa School† | | 2.50% | | 6/15/2031 | | NR | | | 1,100,000 | | | | 900,382 | (d) |
| CA Sch Fin Auth–Green Dot Charter† | | 5.00% | | 8/1/2025 | | BBB- | | | 150,000 | | | | 152,235 | |
| CA Sch Fin Auth–Green Dot Charter† | | 5.00% | | 8/1/2026 | | BBB- | | | 150,000 | | | | 152,556 | |
| CA Sch Fin Auth–Green Dot Charter† | | 5.00% | | 8/1/2027 | | BBB- | | | 160,000 | | | | 163,130 | |
| Cap Trust Agy–Edu Growth Chtr Sch† | | 3.375% | | 7/1/2031 | | NR | | | 8,785,000 | | | | 7,420,607 | |
| Cap Trust Agy–Franklin Academy† | | 4.00% | | 12/15/2023 | | NR | | | 370,000 | | | | 368,103 | |
| Cap Trust Agy–Franklin Academy† | | 4.00% | | 12/15/2024 | | NR | | | 385,000 | | | | 380,520 | |
| Cap Trust Agy–Franklin Academy† | | 4.00% | | 12/15/2025 | | NR | | | 300,000 | | | | 294,339 | |
| Cap Trust Agy–Franklin Academy† | | 5.00% | | 12/15/2026 | | NR | | | 300,000 | | | | 302,753 | |
| Cap Trust Agy–Franklin Academy† | | 5.00% | | 12/15/2027 | | NR | | | 660,000 | | | | 663,334 | |
| Cap Trust Agy–Franklin Academy† | | 5.00% | | 12/15/2028 | | NR | | | 690,000 | | | | 691,124 | |
| Cap Trust Agy–Franklin Academy† | | 5.00% | | 12/15/2029 | | NR | | | 730,000 | | | | 728,201 | |
| Cap Trust Agy–Franklin Academy† | | 5.00% | | 12/15/2035 | | NR | | | 2,165,000 | | | | 2,064,187 | |
| Chester Co IDA–Collegium Charter Sch | | 3.70% | | 10/15/2022 | | BB | | | 345,000 | | | | 344,888 | |
| Cleveland Co Port Auth–Playhouse Sq | | 5.00% | | 12/1/2028 | | BB+ | | | 1,610,000 | | | | 1,634,241 | |
| Clifton Higher Ed–Intl Ldrshp Sch | | 5.25% | | 8/15/2026 | | NR | | | 1,600,000 | | | | 1,618,101 | |
| Clifton Higher Ed–Intl Ldrshp Sch | | 5.25% | | 8/15/2028 | | NR | | | 3,040,000 | | | | 3,061,464 | |
| FL DFC–FL Charter Foundation† | | 4.00% | | 7/15/2026 | | NR | | | 455,000 | | | | 435,441 | |
| FL DFC–Renaissance Chtr Sch† | | 5.00% | | 6/15/2025 | | NR | | | 190,000 | | | | 190,593 | |
| FL DFC–Renaissance Chtr Sch 2020† | | 4.00% | | 9/15/2030 | | NR | | | 470,000 | | | | 431,350 | |
| Florence Twn IDA–Legacy Trad Sch† | | 5.00% | | 7/1/2023 | | BB+ | | | 45,000 | | | | 45,528 | |
| GA World Congress–Convention Ctr Hotel† | | 3.625% | | 1/1/2031 | | NR | | | 1,850,000 | | | | 1,563,638 | |
| IL Fin Auth–Acero Charter† | | 4.00% | | 10/1/2028 | | BB+ | | | 580,000 | | | | 546,841 | |
| 134 | See Notes to Financial Statements. |
Schedule of Investments (continued)
SHORT DURATION HIGH INCOME MUNICIPAL BOND FUND September 30, 2022
| Investments | | Interest
Rate | | Maturity
Date | | Credit
Rating:
S&P or
Moody’s(a) | | Principal
Amount | | | Fair
Value | |
| Other Revenue (continued) | | | | | | | | | | | | | | |
| IL Fin Auth–Acero Charter† | | 4.00% | | 10/1/2030 | | BB+ | | $ | 625,000 | | | $ | 573,768 | |
| IL Fin Auth–Acero Charter† | | 4.00% | | 10/1/2031 | | BB+ | | | 985,000 | | | | 889,746 | |
| IL Fin Auth–Acero Charter† | | 4.00% | | 10/1/2032 | | BB+ | | | 680,000 | | | | 603,832 | |
| Illinois Sports Facilities Authority (The) (AGM) | | 5.25% | | 6/15/2032 | | AA | | | 750,000 | | | | 766,595 | |
| Jefferson Parish Econ Dev Dist–Kenner† | | 4.80% | | 6/15/2029 | | NR | | | 2,390,000 | | | | 2,356,233 | |
| Main St Nat Gas–Macquarie | | 5.00% | | 5/15/2026 | | A3 | | | 1,000,000 | | | | 1,019,650 | |
| MD EDC–Chesapeake Bay Hyatt(e) | | 5.00% | | 12/1/2031 | | NR | | | 1,500,000 | | | | 900,000 | |
| Phoenix IDA–GreatHearts Academy | | 2.95% | | 7/1/2026 | | BBB- | | | 1,315,000 | | | | 1,224,971 | |
| Pima Co IDA–Edkey Chtr Sch† | | 3.50% | | 7/1/2025 | | NR | | | 760,000 | | | | 736,007 | |
| PR Elec Pwr Auth(e) | | 5.00% | | 7/1/2018 | | NR | | | 50,000 | | | | 37,000 | |
| UT Charter Sch–Freedom Academy† | | 3.25% | | 6/15/2031 | | NR | | | 540,000 | | | | 456,201 | |
| UT Charter Sch–Freedom Academy† | | 4.50% | | 6/15/2027 | | NR | | | 2,410,000 | | | | 2,339,345 | |
| WA Convention Ctr | | 4.00% | | 7/1/2031 | | NR | | | 14,705,000 | | | | 13,038,026 | |
| WA State Convention Ctr Pub Facs | | 3.00% | | 7/1/2031 | | Baa3 | | | 2,395,000 | | | | 2,031,400 | |
| WA State Convention Ctr Pub Facs | | 4.00% | | 7/1/2030 | | Baa3 | | | 925,000 | | | | 871,003 | |
| Total | | | | | | | | | | | | | 55,286,846 | |
| | | | | | | | | | | | | | | |
| Special Tax 4.41% | | | | | | | | | | | | | | |
| Allentown Neighborhood Impt† | | 5.00% | | 5/1/2032 | | Ba3 | | | 2,000,000 | | | | 1,957,262 | |
| Allentown Neighborhood Impt–City Center† | | 5.00% | | 5/1/2023 | | Ba3 | | | 130,000 | | | | 130,549 | |
| Allentown Neighborhood Impt–City Center† | | 5.00% | | 5/1/2028 | | NR | | | 1,430,000 | | | | 1,416,543 | |
| Allentown Neighborhood Impt–Wtrfrnt Proj† | | 6.00% | | 5/1/2042 | | NR | | | 955,000 | | | | 939,475 | |
| Atlanta Urban Dev Agency–Atlanta Beltline† | | 2.375% | | 7/1/2026 | | NR | | | 690,000 | | | | 644,293 | |
| Atlanta Urban Dev Agency–Atlanta Beltline† | | 2.875% | | 7/1/2031 | | NR | | | 965,000 | | | | 829,841 | |
| Baltimore Spc Ob–Harbor Point | | 4.50% | | 6/1/2033 | | NR | | | 400,000 | | | | 382,331 | |
| Berkeley Co–Nexton Imp Dist | | 4.00% | | 11/1/2030 | | NR | | | 425,000 | | | | 400,983 | |
| Celebration Pointe Community Development District | | 2.375% | | 5/1/2026 | | NR | | | 430,000 | | | | 384,310 | |
| Celebration Pointe Community Development District | | 3.00% | | 5/1/2031 | | NR | | | 675,000 | | | | 555,643 | (d) |
| Charlotte Co IDA–Babcock Ranch | | 4.125% | | 5/1/2027 | | NR | | | 1,225,000 | | | | 1,200,385 | |
| Charlotte Co IDA–Babcock Ranch | | 4.25% | | 5/1/2032 | | NR | | | 2,000,000 | | | | 1,907,051 | |
| CO Rocky Mtn Rail Park Met Dist† | | 5.00% | | 12/1/2031 | | NR | | | 1,500,000 | | | | 1,373,938 | |
| MD Special Tax–Brunswick Crossing | | 3.00% | | 7/1/2024 | | NR | | | 475,000 | | | | 461,930 | |
| MIDA Mount Village PID† | | 4.00% | | 8/1/2025 | | NR | | | 1,000,000 | | | | 977,671 | |
| MIDA Mount Village PID† | | 4.00% | | 8/1/2027 | | NR | | | 1,385,000 | | | | 1,322,449 | |
| MIDA Mount Village PID† | | 4.00% | | 8/1/2029 | | NR | | | 1,000,000 | | | | 927,432 | |
| | See Notes to Financial Statements. | 135 |
Schedule of Investments (continued)
SHORT DURATION HIGH INCOME MUNICIPAL BOND FUND September 30, 2022
| Investments | | Interest
Rate | | Maturity
Date | | Credit
Rating:
S&P or
Moody’s(a) | | Principal
Amount | | | Fair
Value | |
| Special Tax (continued) | | | | | | | | | | | | | | |
| MIDA Mount Village PID† | | 4.00% | | 8/1/2031 | | NR | | $ | 1,000,000 | | | $ | 899,987 | |
| North Las Vegas Special Improv Dist–Vall | | 3.50% | | 6/1/2023 | | NR | | | 100,000 | | | | 99,377 | |
| North Las Vegas Special Improv Dist–Vall | | 3.50% | | 6/1/2024 | | NR | | | 115,000 | | | | 112,795 | |
| North Las Vegas Special Improv Dist–Vall | | 3.75% | | 6/1/2025 | | NR | | | 145,000 | | | | 141,344 | |
| Nthrn Palm Bch Co Impt Dist | | 5.00% | | 8/1/2037 | | NR | | | 750,000 | | | | 751,540 | (d) |
| NYC IDA–Yankee Stadium (FGIC) | | 9.395%
(CPI YoY | )# | 3/1/2025 | | Baa1 | | | 1,585,000 | | | | 1,594,371 | (d) |
| NYC IDA–Yankee Stadium (FGIC) | | 9.405%
(CPI YoY | )# | 3/1/2026 | | Baa1 | | | 1,350,000 | | | | 1,359,901 | |
| Peninsula Town Center† | | 4.00% | | 9/1/2023 | | NR | | | 75,000 | | | | 73,942 | |
| Peninsula Town Center† | | 4.50% | | 9/1/2028 | | NR | | | 680,000 | | | | 631,128 | |
| Scranton RDA GTD | | 5.00% | | 11/15/2028 | | BB+ | | | 255,000 | | | | 241,842 | |
| St Louis IDA–Ballpark Vlg | | 3.875% | | 11/15/2029 | | NR | | | 1,170,000 | | | | 1,017,808 | |
| St. Charles–Noah’s Ark CID | | 3.00% | | 5/1/2023 | | NR | | | 300,000 | | | | 297,150 | |
| St. Charles–Noah’s Ark CID | | 3.00% | | 5/1/2025 | | NR | | | 450,000 | | | | 429,468 | |
| St. Charles–Noah’s Ark CID | | 3.00% | | 5/1/2026 | | NR | | | 275,000 | �� | | | 257,619 | |
| St. Charles–Noah’s Ark CID | | 3.00% | | 5/1/2030 | | NR | | | 1,950,000 | | | | 1,699,107 | |
| Tahoe Douglas Visitors Auth | | 4.00% | | 7/1/2027 | | NR | | | 650,000 | | | | 634,832 | |
| Tahoe Douglas Visitors Auth | | 5.00% | | 7/1/2030 | | NR | | | 2,755,000 | | | | 2,796,356 | |
| Village CDD #12† | | 3.25% | | 5/1/2023 | | NR | | | 160,000 | | | | 159,441 | |
| Village CDD #12 | | 3.25% | | 5/1/2026 | | NR | | | 1,925,000 | | | | 1,854,309 | |
| Village CDD #13 | | 2.55% | | 5/1/2031 | | NR | | | 2,225,000 | | | | 1,817,596 | |
| Village CDD #13† | | 2.625% | | 5/1/2030 | | NR | | | 1,490,000 | | | | 1,267,087 | |
| Village Met Dist–Avon | | 4.15% | | 12/1/2030 | | NR | | | 3,695,000 | | | | 3,477,027 | |
| West Villages Unit #7 | | 4.00% | | 5/1/2024 | | NR | | | 370,000 | | | | 368,235 | |
| West Villages Unit #7 | | 4.25% | | 5/1/2029 | | NR | | | 940,000 | | | | 920,665 | |
| Total | | | | | | | | | | | | | 38,715,013 | |
| | | | | | | | | | | | | |
| Tax Revenue 1.32% | | | | | | | | | | | | | | |
| American Samoa GO† | | 6.50% | | 9/1/2028 | | Ba3 | | | 1,000,000 | | | | 1,080,532 | |
| Casino Reinv Dev Auth | | 5.00% | | 11/1/2022 | | Baa2 | | | 350,000 | | | | 350,291 | |
| Guam–Business Privilege Tax | | 5.00% | | 1/1/2030 | | Ba1 | | | 1,500,000 | | | | 1,498,176 | |
| Guam–Business Privilege Tax | | 5.00% | | 1/1/2031 | | Ba1 | | | 750,000 | | | | 744,179 | |
| Met Pier & Expo Auth–McCormick Place | | 5.00% | | 12/15/2022 | | A- | | | 1,275,000 | | | | 1,277,614 | |
| PR Corp Sales Tax | | Zero Coupon | | 7/1/2031 | | NR | | | 591,000 | | | | 376,542 | |
| PR Corp Sales Tax | | Zero Coupon | | 7/1/2033 | | NR | | | 48,000 | | | | 27,036 | |
| PR Corp Sales Tax | | 4.329% | | 7/1/2040 | | NR | | | 27,000 | | | | 23,389 | |
| PR Corp Sales Tax | | 4.536% | | 7/1/2053 | | NR | | | 1,000 | | | | 826 | |
| 136 | See Notes to Financial Statements. |
Schedule of Investments (continued)
SHORT DURATION HIGH INCOME MUNICIPAL BOND FUND September 30, 2022
| Investments | | Interest
Rate | | Maturity
Date | | Credit
Rating:
S&P or
Moody’s(a) | | Principal
Amount | | | Fair
Value | |
| Tax Revenue (continued) | | | | | | | | | | | | | | |
| PR Corp Sales Tax | | 4.55% | | 7/1/2040 | | NR | | $ | 3,000 | | | $ | 2,673 | |
| PR Corp Sales Tax | | 4.75% | | 7/1/2053 | | NR | | | 19,000 | | | | 16,275 | |
| PR Corp Sales Tax | | 5.00% | | 7/1/2058 | | NR | | | 49,000 | | | | 43,380 | |
| Sparks–Legends at Sparks Marina† | | 2.50% | | 6/15/2024 | | Ba2 | | | 390,000 | | | | 375,292 | |
| Sparks–Legends at Sparks Marina† | | 2.75% | | 6/15/2028 | | Ba2 | | | 3,110,000 | | | | 2,729,880 | |
| USVI Matching Fund | | 5.00% | | 10/1/2026 | | NR | | | 1,000,000 | | | | 1,027,119 | |
| USVI Matching Fund | | 5.00% | | 10/1/2027 | | NR | | | 1,000,000 | | | | 1,028,700 | |
| USVI Matching Fund | | 5.00% | | 10/1/2028 | | NR | | | 1,000,000 | | | | 1,028,433 | |
| Total | | | | | | | | | | | | | 11,630,337 | |
| | | | | | | | | | | | | | | |
| Tobacco 0.35% | | | | | | | | | | | | | | |
| Nassau Co Tobacco | | 5.25% | | 6/1/2026 | | CCC+ | | | 1,392,003 | | | | 1,347,368 | |
| PA Tob Settlement | | 5.00% | | 6/1/2023 | | A1 | | | 760,000 | | | | 766,363 | |
| San Diego Tobacco Settlement | | 4.00% | | 6/1/2032 | | BBB | | | 150,000 | | | | 140,362 | |
| SD Edu Enhancement Fding Corp | | 5.00% | | 6/1/2024 | | NR | | | 775,000 | | | | 784,169 | |
| Total | | | | | | | | | | | | | 3,038,262 | |
| | | | | | | | | | | | | | | |
| Transportation 8.92% | | | | | | | | | | | | | | |
| City of Los Angeles Department of Airports AMT | | 5.00% | | 5/15/2029 | | AA- | | | 2,700,000 | | | | 2,835,907 | |
| Denver Arpt–United Airlines AMT | | 5.00% | | 10/1/2032 | | B | | | 9,010,000 | | | | 8,594,734 | |
| E470 Pub Hwy Auth | | 2.333%
(SOFR * .67 + .35% | )# | 9/1/2039 | | A | | | 1,685,000 | | | | 1,668,194 | |
| Houston Arpt–United Airlines AMT | | 5.00% | | 7/15/2027 | | B- | (c) | | 3,000,000 | | | | 3,016,234 | |
| Houston Arpt–United Airlines AMT | | 5.00% | | 7/15/2035 | | B | | | 2,450,000 | | | | 2,299,847 | |
| MD EDC–CNX Marine Terminals | | 5.75% | | 9/1/2025 | | BB | | | 9,500,000 | | | | 9,522,387 | |
| MD EDC–Port Covington | | 3.25% | | 9/1/2030 | | NR | | | 2,650,000 | | | | 2,340,476 | |
| MD EDC–Purple Line AMT | | 5.00% | | 11/12/2028 | | Baa3 | | | 4,600,000 | | | | 4,729,032 | |
| MTA NY | | 5.00% | | 11/15/2029 | | A3 | | | 2,660,000 | | | | 2,723,152 | |
| MTA NY | | 5.00% | | 11/15/2029 | | A3 | | | 1,000,000 | | | | 1,038,079 | |
| MTA NY | | 5.00% | | 11/15/2031 | | A3 | | | 1,850,000 | | | | 1,878,981 | |
| MTA NY | | 5.00% | #(b) | 11/15/2034 | | A3 | | | 4,475,000 | | | | 4,556,294 | |
| MTA NY | | 5.00% | #(b) | 11/15/2045 | | A3 | | | 5,135,000 | | | | 5,306,415 | |
| North Parkway Municipal Management District No 1† | | 3.625% | | 9/15/2026 | | NR | | | 500,000 | | | | 472,196 | |
| North Parkway Municipal Management District No 1† | | 4.25% | | 9/15/2031 | | NR | | | 1,500,000 | | | | 1,400,058 | |
| NY Trans Dev Corp–Delta Airlines AMT | | 5.00% | | 1/1/2036 | | Baa3 | | | 5,000,000 | | | | 4,797,953 | |
| NY Trans Dev Corp–Delta AMT | | 5.00% | | 1/1/2024 | | Baa3 | | | 1,000,000 | | | | 1,005,599 | |
| | See Notes to Financial Statements. | 137 |
Schedule of Investments (continued)
SHORT DURATION HIGH INCOME MUNICIPAL BOND FUND September 30, 2022
| Investments | | Interest
Rate | | Maturity
Date | | Credit
Rating:
S&P or
Moody’s(a) | | Principal
Amount | | | Fair
Value | |
| Transportation (continued) | | | | | | | | | | | | | | |
| NY Trans Dev Corp–Delta AMT | | 5.00% | | 1/1/2030 | | Baa3 | | $ | 3,875,000 | | | $ | 3,853,502 | |
| NY Trans Dev Corp–JFK IAT AMT | | 5.00% | | 12/1/2030 | | Baa1 | | | 8,000,000 | | | | 8,160,858 | |
| NY Trans Dev Corp–LaGuardia Airport AMT | | 4.00% | | 7/1/2032 | | Baa2 | | | 830,000 | | | | 758,105 | |
| NY Trans Dev Corp–TOGA AMT | | 5.00% | | 1/1/2023 | | Baa3 | | | 1,055,000 | | | | 1,057,382 | |
| NYS Thruway–Service Area Proj AMT | | 2.50% | | 10/31/2031 | | BBB- | (c) | | 1,365,000 | | | | 1,090,441 | (d) |
| Osceola Co Trans–Osceola Parkway | | 5.00% | | 10/1/2031 | | BBB+ | | | 1,050,000 | | | | 1,074,217 | |
| Philadelphia Arpt AMT | | 5.00% | | 7/1/2031 | | A2 | | | 1,900,000 | | | | 1,988,759 | |
| PR Hwy & Trans Auth (AMBAC) | | 10.18%
(CPI YoY | )# | 7/1/2028 | | NR | | | 2,230,000 | | | | 2,072,436 | |
| Total | | | | | | | | | | | | | 78,241,238 | |
| | | | | | | | | | | | | | | |
| Utilities 16.37% | | | | | | | | | | | | | | |
| Black Belt Energy Gas Dist | | 4.00% | #(b) | 12/1/2052 | | Baa1 | | | 13,125,000 | | | | 12,599,282 | |
| Black Belt Energy Gas Dist–CIBC | | 5.00% | #(b) | 5/1/2053 | | Aa2 | | | 8,800,000 | | | | 9,059,757 | |
| Black Belt Energy Gas Dist–RBC | | 4.00% | #(b) | 7/1/2052 | | Aa1 | | | 3,000,000 | | | | 2,972,997 | |
| Burke Co Dev–Oglethorpe Power | | 3.00% | #(b) | 11/1/2045 | | A- | | | 1,535,000 | | | | 1,529,147 | |
| CA Poll Ctl–Poseidon Res† | | 5.00% | | 7/1/2029 | | Baa3 | | | 250,000 | | | | 254,440 | |
| Central Plains–Goldman Sachs | | 5.00% | #(b) | 5/1/2053 | | A2 | | | 10,000,000 | | | | 10,015,290 | |
| Charlotte County IDA–Babcock Ranch† | | 5.00% | | 10/1/2029 | | NR | | | 895,000 | | | | 870,519 | |
| CO Public Auth–ML | | 6.125% | | 11/15/2023 | | A2 | | | 1,035,000 | | | | 1,048,111 | |
| FL DFC–Waste Pro AMT | | 3.00% | | 6/1/2032 | | NR | | | 11,910,000 | | | | 9,259,277 | |
| Guam Pwr Auth | | 5.00% | | 10/1/2029 | | BBB | | | 3,500,000 | | | | 3,662,488 | |
| IN Fin Auth–Indy Power & Light | | 1.40% | | 8/1/2029 | | A2 | | | 2,000,000 | | | | 1,614,142 | |
| KY Muni Pwr–Prarie State Proj | | 3.45% | #(b) | 9/1/2042 | | Baa1 | | | 850,000 | | | | 813,087 | |
| Main St Nat Gas–Citi | | 5.00% | #(b) | 12/1/2052 | | A3 | | | 6,800,000 | | | | 6,798,114 | |
| Main St Nat Gas–Citibank | | 4.00% | #(b) | 9/1/2052 | | A3 | | | 1,190,000 | | | | 1,117,440 | |
| Main St Nat Gas–Citadel† | | 4.00% | #(b) | 8/1/2052 | | BBB- | | | 27,000,000 | | | | 25,416,277 | |
| Orlando Util Commn | | 1.25% | #(b) | 10/1/2046 | | AA | | | 7,000,000 | | | | 5,594,532 | |
| PR Aqueduct & Swr Auth† | | 5.00% | | 7/1/2025 | | NR | | | 2,550,000 | | | | 2,561,793 | |
| PR Aqueduct & Swr Auth† | | 5.00% | | 7/1/2028 | | NR | | | 9,915,000 | | | | 9,893,061 | |
| PR Aqueduct & Swr Auth† | | 5.00% | | 7/1/2028 | | NR | | | 4,750,000 | | | | 4,739,490 | |
| PR Elec Pwr Auth(e) | | 4.10% | | 7/1/2019 | | NR | | | 240,000 | | | | 174,900 | |
| PR Elec Pwr Auth(e) | | 4.25% | | 7/1/2020 | | NR | | | 970,000 | | | | 706,887 | |
| PR Elec Pwr Auth(e) | | 5.25% | | 7/1/2027 | | D | (c) | | 2,630,000 | | | | 1,959,350 | |
| PR Elec Pwr Auth (AGM) | | 5.00% | | 7/1/2024 | | AA | | | 145,000 | | | | 146,986 | |
| Rockport IN Poll Ctl–IN MI Pwr | | 3.05% | | 6/1/2025 | | A- | | | 1,610,000 | | | | 1,584,180 | |
| SE AL Gas Dist | | 4.00% | #(b) | 12/1/2051 | | A1 | | | 8,000,000 | | | | 7,426,060 | |
| SE AL Gas Dist–Goldman Sachs | | 4.00% | #(b) | 4/1/2049 | | A3 | | | 4,030,000 | | | | 4,017,401 | |
| 138 | See Notes to Financial Statements. |
Schedule of Investments (continued)
SHORT DURATION HIGH INCOME MUNICIPAL BOND FUND September 30, 2022
| Investments | | | | Interest
Rate | | Maturity
Date | | Credit
Rating:
S&P or
Moody’s(a) | | Principal
Amount | | | Fair
Value | |
| Utilities (continued) | | | | | | | | | | | | | | | | |
| TEAC–Goldman Sachs | | | | 5.00% | #(b) | 5/1/2052 | | A2 | | $ | 10,090,000 | | | $ | 10,079,580 | |
| TEAC–Goldman Sachs | | | | 5.625% | | 9/1/2026 | | BBB | (c) | | 5,405,000 | | | | 5,650,086 | |
| TX Muni Gas Acq & Supply–ML | | | | 6.25% | | 12/15/2026 | | A2 | | | 1,980,000 | | | | 2,057,652 | |
| Total | | | | | | | | | | | | | | | 143,622,326 | |
| Total Municipal Bonds (cost $916,248,768) | | | | | | | | | | | | | | | 852,154,143 | |
| | | | | | | | | | | | | | | | | |
| | | Interest
Rate# | | Interest
Rate
Reset
Date(f) | | Final
Maturity
Date | | | | | | | | | | |
| | | | | | | | | | | | | | | | | |
| SHORT-TERM INVESTMENTS 0.46% | | | | | | | | | | | | | | | | |
| | | | | | | | | | | | | | | | | |
| VARIABLE RATE DEMAND NOTES 0.46% | | | | | | | | | | | | | | | | |
| | | | | | | | | | | | | | | | | |
| Utilities | | | | | | | | | | | | | | | | |
Appling Co Dev - GA Power
(cost $4,000,000) | | 2.960% | | 10/3/2022 | | 9/1/2041 | | BBB+ | | | 4,000,000 | | | | 4,000,000 | |
| Total Investments in Securities 97.56% (cost $920,248,768) | | | | | | | | | | | | 856,154,143 | |
| Other Assets and Liabilities – Net(g) 2.44% | | | | | | | | | | | | | | | 21,413,587 | |
| Net Assets 100.00% | | | | | | | | | | | | | | $ | 877,567,730 | |
| AGM | | Insured by–Assured Guaranty Municipal Corporation. |
| AMBAC | | Insured by–AMBAC Assurance Corporation. |
| AMT | | Income from the security may be subject to Alternative Minimum Tax. |
| COPS | | Certificates of Participation. |
| CPI | | Consumer Price Index: Rate fluctuates based on CPI. |
| CR | | Custodian Receipt. |
| FGIC | | Insured by–Financial Guaranty Insurance Company. |
| FHA | | Insured by–Federal Housing Administration. |
| GTD | | Guaranteed. |
| LIBOR | | London Interbank Offered Rate. |
| MUNIPSA | | SIFMA Municipal Swap Index Yield. |
| NPFGC | | Insured by–National Public Finance Guarantee Corporation. |
| NR | | Not Rated. |
| SIFMA | | Insured by–Securities Industry and Financial Markets Association. |
| SOFR | | Secured Overnight Financing Rate. |
| SONYMA | | State of New York Mortgage Agency. |
| TRIPS | | Tax Refund Intercept Programs. |
| YoY | | Year on Year inflation rates. |
| | # | | Variable rate security. The interest rate represents the rate in effect at September 30, 2022. |
| | † | | Security was purchased pursuant to Rule 144A under the Securities Act of 1933 and, unless registered under such Act or exempted from registration, may only be resold to qualified institutional buyers. At September 30, 2022, the total value of Rule 144A securities was $212,527,715, which represents 24.22% of net assets. |
| | (a) | | Unaudited. |
| | (b) | | Variable Rate is Fixed to Float: Rate remains fixed or at Zero Coupon until designated future date. |
| | (c) | | This investment has been rated by Fitch IBCA. |
| | See Notes to Financial Statements. | 139 |
Schedule of Investments (continued)
SHORT DURATION HIGH INCOME MUNICIPAL BOND FUND September 30, 2022
| | (d) | | Level 3 Investment as described in Note 2(i) in the Notes to Financials. Security valued utilizing third party pricing information without adjustment. Such valuations are based on unobservable inputs. A significant change in third party information could result in a significantly lower or higher value of such Level 3 investments. |
| | (e) | | Defaulted (non-income producing security). |
| | (f) | | The interest rate reset date shown represents the date in which the Fund has the right to sell a Variable Rate Demand Note (“VRDN”) back to the issuer for Principal Amount. The interest rate on the VRDN is generally reset daily based on the SIFMA Municipal Swap Index. |
| | (g) | | Other Assets and Liabilities–Net include net unrealized appreciation/depreciation on futures contracts as follows: |
Futures Contracts at September 30, 2022:
| Type | | Expiration | | Contracts | | Position | | Notional
Amount | | | Notional
Value | | | Unrealized
Appreciation | |
| U.S. 10-Year Treasury Note | | December 2022 | | 562 | | Short | | $ | (65,123,483 | ) | | $ | (62,979,125 | ) | | | $ | 2,144,358 | |
| U.S. 5-Year Treasury Note | | December 2022 | | 376 | | Short | | | (40,999,411 | ) | | | (40,422,938 | ) | | | | 576,473 | |
| Total Unrealized Appreciation on Futures Contracts | | | | | | | | | | | | | $ | 2,720,831 | |
The following is a summary of the inputs used as of September 30, 2022 in valuing the Fund’s investments carried at fair value(1):
| Investment Type(2) | | Level 1 | | | Level 2 | | | Level 3 | | | Total | |
| Long-Term Investments | | | | | | | | | | | | | | | | |
| Municipal Bonds | | | | | | | | | | | | | | | | |
| Education | | $ | – | | | $ | 43,628,868 | | | $ | 9,949,536 | | | $ | 53,578,404 | |
| Health Care | | | – | | | | 96,909,433 | | | | 5,588,648 | | | | 102,498,081 | |
| Housing | | | – | | | | 7,182,772 | | | | 613,916 | | | | 7,796,688 | |
| Other Revenue | | | – | | | | 54,386,464 | | | | 900,382 | | | | 55,286,846 | |
| Special Tax | | | – | | | | 35,813,459 | | | | 2,901,554 | | | | 38,715,013 | |
| Transportation | | | – | | | | 77,150,797 | | | | 1,090,441 | | | | 78,241,238 | |
| Remaining Industries | | | – | | | | 516,037,873 | | | | – | | | | 516,037,873 | |
| Short-Term Investments | | | | | | | | | | | | | | | | |
| Variable Rate Demand Notes | | | – | | | | 4,000,000 | | | | – | | | | 4,000,000 | |
| Total | | $ | – | | | $ | 835,109,666 | | | $ | 21,044,477 | | | $ | 856,154,143 | |
| | | | | | | | | | | | | | | | | |
| Other Financial Instruments | | | | | | | | | | | | | | | | |
| Futures Contracts | | | | | | | | | | | | | | | | |
| Assets | | $ | 2,720,831 | | | $ | – | | | $ | – | | | $ | 2,720,831 | |
| Liabilities | | | – | | | | – | | | | – | | | | – | |
| Total | | $ | 2,720,831 | | | $ | – | | | $ | – | | | $ | 2,720,831 | |
| | (1) | Refer to Note 2(i) for a description of fair value measurements and the three-tier hierarchy of inputs. |
| | (2) | See Schedule of Investments for fair values in each industry. The table above is presented by Investment Type. Industries are presented within an Investment Type should such Investment Type include securities classified as two or more levels within the three-tier fair value hierarchy. When applicable each Level 3 security is identified on the Schedule of Investments along with the valuation technique utilized. |
| 140 | See Notes to Financial Statements. |
Schedule of Investments (concluded)
SHORT DURATION HIGH INCOME MUNICIPAL BOND FUND September 30, 2022
A reconciliation of Level 3 investments is presented when the Fund has a material amount of Level 3 investments at the beginning or end of the year in relation to the Fund’s net assets.
The following is a reconciliation of investments with unobservable inputs (Level 3) that were used in determining fair value:
| Investment Type | | Municipal Bonds | |
| Balance as of October 1, 2021 | | $ | – | |
| Accrued Discounts (Premiums) | | | (47,577 | ) |
| Realized Gain (Loss) | | | 75 | |
| Change in Unrealized Appreciation (Depreciation) | | | (1,100,938 | ) |
| Purchases | | | 13,198,001 | |
| Sales | | | (135,000 | ) |
| Transfers into Level 3(a) | | | 9,129,916 | |
| Transfers out of Level 3 | | | – | |
| Balance as of September 30, 2022 | | $ | 21,044,477 | |
| Change in unrealized appreciation/depreciation for the year ended September 30, 2022, related to Level 3 investments held at September 30, 2022 | | $ | (1,100,938 | ) |
| (a) | The Fund recognizes transfers within the fair value hierarchy as of the beginning of the period. Transfers into and out of Level 3 were primarily related to the availability of market quotations in accordance with valuation methodology. |
| | See Notes to Financial Statements. | 141 |
Schedule of Investments
SUSTAINABLE MUNICIPAL BOND FUND September 30, 2022
| Investments | | Interest
Rate | | Maturity
Date | | Credit
Rating:
S&P or
Moody’s(a) | | Principal
Amount | | | Fair
Value | |
| LONG-TERM INVESTMENTS 90.63% | | | | | | | | | | | | | | |
| | | | | | | | | | | | | | | |
| MUNICIPAL BONDS 90.63% | | | | | | | | | | | | | | |
| | | | | | | | | | | | | | | |
| Education 21.90% | | | | | | | | | | | | | | |
| CA Choice Clean Energy–Morgan Stanley | | 4.00% | #(b) | 5/1/2053 | | A1 | | $ | 150,000 | | | $ | 146,684 | |
| California Educational Facilities Authority | | 4.00% | | 10/1/2039 | | A2 | | | 150,000 | | | | 139,361 | |
| Cleveland State University | | 5.00% | | 6/1/2031 | | A+ | | | 100,000 | | | | 103,757 | |
| IA HI Ed–Des Moines Univ | | 5.00% | | 10/1/2027 | | BBB+ | | | 125,000 | | | | 129,206 | |
| MN St Ed Facs–Univ of St Thomas | | 4.00% | | 10/1/2036 | | A2 | | | 150,000 | | | | 139,452 | |
| NY Dorm–Pratt Institute | | 5.00% | | 7/1/2031 | | A2 | | | 150,000 | | | | 155,309 | |
| NY Dorm–Yeshiva | | 5.00% | | 7/15/2029 | | BBB- | | | 150,000 | | | | 154,298 | |
| Stephen F Austin State University | | 5.00% | | 10/15/2028 | | A1 | | | 25,000 | | | | 26,368 | |
| Total | | | | | | | | | | | | | 994,435 | |
| | | | | | | | | | | | | | | |
| General Obligation 4.51% | | | | | | | | | | | | | | |
| Chicago Brd Ed | | 4.00% | | 12/1/2039 | | BB | | | 125,000 | | | | 106,166 | |
| San Gorgonio Memorial Health Care District | | 5.00% | | 8/1/2035 | | Ba2 | | | 100,000 | | | | 98,602 | |
| Total | | | | | | | | | | | | | 204,768 | |
| | | | | | | | | | | | | | | |
| Health Care 32.44% | | | | | | | | | | | | | | |
| CT Hlth & Ed–Hartford Hlthcare | | 5.00% | | 7/1/2028 | | A | | | 165,000 | | | | 173,271 | |
| Dutchess Co LDC–Nuvance Hlth | | 5.00% | | 7/1/2027 | | BBB+ | | | 125,000 | | | | 129,298 | |
| Franklin Co IDA–Trinity Hlth | | 5.00% | | 12/1/2036 | | AA- | | | 150,000 | | | | 157,127 | |
| Guadalupe Co–Seguin City Hospital | | 4.00% | | 12/1/2026 | | BB | | | 200,000 | | | | 188,164 | |
| Lee Memorial Health System | | 5.00% | | 4/1/2029 | | A+ | | | 50,000 | | | | 52,482 | |
| New York St Dorm Auth Revs Non St Supported Debt Bds Catholic Health Sys, Inc. | | 5.00% | | 7/1/2026 | | BB+ | | | 100,000 | | | | 95,496 | |
| Norfolk EDA–Sentara Hlth | | 5.00% | #(b) | 11/1/2048 | | AA | | | 150,000 | | | | 159,627 | |
| OH State–Univ Hosp | | 5.00% | | 1/15/2032 | | A | | | 150,000 | | | | 155,878 | |
| Palomar Health | | 4.00% | | 8/1/2035 | | A1 | | | 100,000 | | | | 94,754 | |
| Tarrant Co Cultural–CHRISTUS Health | | 5.00% | #(b) | 7/1/2053 | | A1 | | | 250,000 | | | | 266,479 | |
| Total | | | | | | | | | | | | | 1,472,576 | |
| | | | | | | | | | | | | | | |
| Housing 2.68% | | | | | | | | | | | | | | |
| MD State Hsg CDA | | 3.50% | | 3/1/2050 | | Aa1 | | | 125,000 | | | | 121,463 | |
| | | | | | | | | | | | | | | |
| Lease Obligation 2.66% | | | | | | | | | | | | | | |
| NJ EDA–Sch Facs | | 5.00% | | 6/15/2035 | | A3 | | | 120,000 | | | | 120,912 | |
| | |
| 142 | See Notes to Financial Statements. |
Schedule of Investments (continued)
SUSTAINABLE MUNICIPAL BOND FUND September 30, 2022
| Investments | | Interest
Rate | | Maturity
Date | | Credit
Rating:
S&P or
Moody’s(a) | | Principal
Amount | | | Fair
Value | |
| Other Revenue 5.70% | | | | | | | | | | | | | | |
| Build NYC Res Corp–Shefa School† | | 2.50% | | 6/15/2031 | | NR | | $ | 100,000 | | | $ | 81,853 | (c) |
| DC Rev–Kipp Chtr Sch | | 5.00% | | 7/1/2037 | | BBB+ | | | 175,000 | | | | 177,075 | |
| Total | | | | | | | | | | | | | 258,928 | |
| | | | | | | | | | | | | | | |
| Transportation 14.73% | | | | | | | | | | | | | | |
| Foothill-Eastern Transportation Corridor Agency | | 5.00% | | 1/15/2028 | | A- | | | 125,000 | | | | 128,149 | |
| MD EDC–Purple Line AMT | | 5.00% | | 11/12/2028 | | Baa3 | | | 150,000 | | | | 154,208 | |
| MTA NY | | 5.00% | | 11/15/2032 | | A3 | | | 175,000 | | | | 177,305 | |
| Osceola Transportation Revenue County | | 5.00% | | 10/1/2028 | | BBB+ | | | 100,000 | | | | 102,696 | |
| Triborough Brdg & Tunl Auth | | 5.00% | | 11/15/2029 | | AA- | | | 100,000 | | | | 106,545 | |
| Total | | | | | | | | | | | | | 668,903 | |
| | | | | | | | | | | | | | | |
| Utilities 6.01% | | | | | | | | | | | | | | |
| CA Choice Clean Energy–Goldman | | 4.00% | #(b) | 10/1/2052 | | A2 | | | 130,000 | | | | 128,718 | |
| Chicago Water | | 5.00% | | 11/1/2029 | | A | | | 140,000 | | | | 144,148 | |
| Total | | | | | | | | | | | | | 272,866 | |
| Total Investments in Securities 90.63% (cost $4,433,394) | | | | | | | | 4,114,851 | |
| Other Assets and Liabilities – Net 9.37% | | | | | | | | | | | | | 425,332 | |
| Net Assets 100.00% | | | | | | | | | | | | $ | 4,540,183 | |
| | | | | | | | | | | | | | | |
| AMT | | Income from the security may be subject to Alternative Minimum Tax. |
| # | | Variable rate security. The interest rate represents the rate in effect at September 30, 2022. |
| † | | Security was purchased pursuant to Rule 144A under the Securities Act of 1933 and, unless registered under such Act or exempted from registration, may only be resold to qualified institutional buyers. At September 30, 2022, the total value of Rule 144A securities was $81,853, which represents 1.80% of net assets. |
| (a) | | Unaudited. |
| (b) | | Variable Rate is Fixed to Float: Rate remains fixed or at Zero Coupon until designated future date. |
| (c) | | Level 3 Investment as described in Note 2(i) in the Notes to Financials. Security valued utilizing third party pricing information without adjustment. Such valuations are based on unobservable inputs. A significant change in third party information could result in a significantly lower or higher value of such Level 3 investments. |
| | | |
| | See Notes to Financial Statements. | 143 |
Schedule of Investments (concluded)
SUSTAINABLE MUNICIPAL BOND FUND September 30, 2022
The following is a summary of the inputs used as of September 30, 2022 in valuing the Fund’s investments carried at fair value(1):
| Investment Type(2) | | Level 1 | | | Level 2 | | | Level 3 | | | Total | |
| Long-Term Investments | | | | | | | | | | | | | | | | |
| Municipal Bonds | | | | | | | | | | | | | | | | |
| Other Revenue | | $ | – | | | $ | 177,075 | | | $ | 81,853 | | | $ | 258,928 | |
| Remaining Industries | | | – | | | | 3,855,923 | | | | – | | | | 3,855,923 | |
| Total | | $ | – | | | $ | 4,032,998 | | | $ | 81,853 | | | $ | 4,114,851 | |
| | | |
| (1) | | Refer to Note 2(i) for a description of fair value measurements and the three-tier hierarchy of inputs. |
| (2) | | See Schedule of Investments for fair values in each industry. The table above is presented by Investment Type. Industries are presented within an Investment Type should such Investment Type include securities classified as two or more levels within the three-tier fair value hierarchy. When applicable each Level 3 security is identified on the Schedule of Investments along with the valuation technique utilized. |
A reconciliation of Level 3 investments is presented when the Fund has a material amount of Level 3 investments at the beginning or end of the year in relation to the Fund’s net assets.
The following is a reconciliation of investments with unobservable inputs (Level 3) that were used in determining fair value:
| Investment Type | | Municipal Bonds | |
Balance as of January 5, 2022
(Commencement of operations) | | $ | – | |
| Accrued Discounts (Premiums) | | | 34 | |
| Realized Gain (Loss) | | | – | |
| Change in Unrealized Appreciation (Depreciation) | | | (17,681 | ) |
| Purchases | | | 99,500 | |
| Sales | | | – | |
| Transfers into Level 3 | | | – | |
| Transfers out of Level 3 | | | – | |
| Balance as of September 30, 2022 | | $ | 81,853 | |
| Change in unrealized appreciation/depreciation for the period ended September 30, 2022, related to Level 3 investments held at September 30, 2022 | | $ | (17,681 | ) |
| | |
| 144 | See Notes to Financial Statements. |
Schedule of Investments
CALIFORNIA TAX FREE FUND September 30, 2022
| Investments | | Interest
Rate | | Maturity
Date | | Credit
Rating:
S&P or
Moody’s(a) | | Principal
Amount | | | Fair
Value | |
| LONG-TERM INVESTMENTS 96.86% | | | | | | | | | | | | | | |
| | | | | | | | | | | | | | | |
| MUNICIPAL BONDS 96.86% | | | | | | | | | | | | | | |
| | | | | | | | | | | | | | | |
| Corporate-Backed 3.08% | | | | | | | | | | | | | | |
| CA Muni Fin–United Airlines AMT | | 4.00% | | 7/15/2029 | | B+ | | $ | 2,430,000 | | | $ | 2,236,208 | |
| CA Muni Fin–Waste Mgmt AMT | | 2.40% | #(b) | 10/1/2044 | | A- | | | 4,930,000 | | | | 4,380,538 | |
| CA Poll Ctl–Poseidon Res AMT† | | 5.00% | | 11/21/2045 | | Baa3 | | | 4,410,000 | | | | 4,151,337 | |
| CA Poll Ctl–Waste Mgmt AMT | | 4.30% | | 7/1/2040 | | A- | | | 185,000 | | | | 179,400 | (c) |
| Long Beach Nat Gas–ML | | 5.00% | | 11/15/2029 | | A2 | | | 1,285,000 | | | | 1,319,548 | |
| San Francisco Arpt–SFO Fuel AMT | | 5.00% | | 1/1/2038 | | A1 | | | 1,715,000 | | | | 1,734,421 | |
| Total | | | | | | | | | | | | | 14,001,452 | |
| | | | | | | | | | ’ | | | | | |
| Education 9.87% | | | | | | | | | | | | | | |
| CA Choice Clean Energy–Morgan Stanley | | 4.00% | #(b) | 5/1/2053 | | A1 | | | 4,350,000 | | | | 4,253,850 | |
| CA Ed Facs–ArtCenter College of Design | | 5.00% | | 12/1/2030 | | Baa1 | | | 1,175,000 | | | | 1,204,986 | |
| CA Ed Facs–ArtCenter College of Design | | 5.00% | | 12/1/2044 | | Baa1 | | | 1,500,000 | | | | 1,464,634 | |
| CA Ed Facs–Chapman Univ | | 4.00% | | 4/1/2047 | | A2 | | | 1,910,000 | | | | 1,681,814 | |
| CA Ed Facs–Chapman Univ | | 5.00% | | 4/1/2040 | | A2 | | | 1,000,000 | | | | 1,019,753 | |
| CA Ed Facs–Loyola Marymount Univ | | 5.00% | | 10/1/2048 | | A2 | | | 1,000,000 | | | | 1,031,323 | |
| CA Ed Facs–Loyola Marymount Univ (NPFGC)(FGIC) | | Zero Coupon | | 10/1/2029 | | A2 | | | 650,000 | | | | 495,965 | |
| CA Ed Facs–Loyola Marymount Univ (NPFGC)(FGIC) | | Zero Coupon | | 10/1/2033 | | A2 | | | 1,720,000 | | | | 1,074,080 | |
| CA Ed Facs–Santa Clara Univ | | 5.00% | | 4/1/2039 | | Aa3 | | | 1,000,000 | | | | 1,022,179 | |
| CA Ed Facs–Univ of Pacific | | 4.00% | | 11/1/2042 | | A2 | | | 1,125,000 | | | | 1,026,889 | |
| CA Ed Facs–Univ of Pacific | | 4.00% | | 11/1/2044 | | A2 | | | 1,000,000 | | | | 896,692 | |
| CA Ed Facs–Univ of San Francisco | | 5.00% | | 10/1/2037 | | A2 | | | 1,000,000 | | | | 1,049,530 | |
| CA Ed Facs–Univ of San Francisco | | 5.00% | | 10/1/2053 | | A2 | | | 2,000,000 | | | | 2,059,012 | |
| CA Infra & Econ Dev–UCSF | | 5.00% | | 5/15/2047 | | AA | | | 3,325,000 | | | | 3,467,265 | |
| CA Muni Fin–Biola Univ | | 5.00% | | 10/1/2029 | | Baa1 | | | 330,000 | | | | 333,926 | |
| CA Muni Fin–Biola Univ | | 5.00% | | 10/1/2032 | | Baa1 | | | 400,000 | | | | 412,191 | |
| CA Muni Fin–Biola Univ | | 5.00% | | 10/1/2042 | | Baa1 | | | 1,500,000 | | | | 1,505,899 | |
| CA Muni Fin–Emerson Clg | | 5.00% | | 1/1/2042 | | BBB+ | | | 3,190,000 | | | | 3,143,499 | |
| CA Muni Fin–Julian Chtr Sch† | | 5.625% | | 3/1/2045 | | B+ | | | 500,000 | | | | 454,178 | |
| CA Muni Fin–Touro College | | 5.25% | | 1/1/2040 | | NR | | | 1,085,000 | | | | 1,121,626 | |
| CA Muni Fin–Univ of La Verne | | 5.00% | | 6/1/2043 | | A3 | | | 1,035,000 | | | | 1,054,194 | |
| CA Muni Fin–Univ of San Diego | | 5.00% | | 10/1/2049 | | A1 | | | 2,000,000 | | | | 2,076,638 | |
| CA Sch Fin–Aspire† | | 5.00% | | 8/1/2046 | | NR | | | 85,000 | | | | 89,073 | |
| CA Sch Fin–Aspire† | | 5.00% | | 8/1/2046 | | BBB | | | 915,000 | | | | 895,712 | |
| | | |
| | See Notes to Financial Statements. | 145 |
Schedule of Investments (continued)
CALIFORNIA TAX FREE FUND September 30, 2022
| Investments | | Interest
Rate | | Maturity
Date | | Credit
Rating:
S&P or
Moody’s(a) | | Principal
Amount | | | Fair
Value | |
| Education (continued) | | | | | | | | | | | | | | |
| CA Sch Fin–Green Dot Charter† | | 5.00% | | 8/1/2045 | | BBB- | | $ | 620,000 | | | $ | 608,235 | |
| CA Sch Fin Auth–KIPP LA† | | 5.00% | | 7/1/2045 | | BBB | | | 540,000 | | | | 521,345 | |
| CA Stwde–Culinary Institute | | 5.00% | | 7/1/2046 | | Baa2 | | | 1,010,000 | | | | 976,658 | |
| Ripon USD (BAM) | | 5.50% | | 8/1/2043 | | AA | | | 1,000,000 | | | | 1,064,096 | |
| Univ of CA | | 5.00% | | 5/15/2052 | | AA | | | 2,500,000 | | | | 2,623,693 | |
| Univ of CA | | 5.25% | | 5/15/2047 | | AA | | | 2,000,000 | | | | 2,081,440 | |
| Univ of CA | | 5.25% | | 5/15/2058 | | AA | | | 2,500,000 | | | | 2,609,145 | |
| University of CA | | 4.00% | | 5/15/2041 | | AA | | | 1,635,000 | | | | 1,513,954 | |
| Total | | | | | | | | | | | | | 44,833,474 | |
| | | | | | | | | | | | | | | |
| General Obligation 11.92% | | | | | | | | | | | | | | |
| Banning USD (AGM) | | 5.25% | | 8/1/2042 | | AA | | | 1,115,000 | | | | 1,168,595 | |
| CA St GO | | 4.00% | | 10/1/2044 | | Aa2 | | | 1,805,000 | | | | 1,663,553 | |
| CA State GO | | 3.00% | | 10/1/2033 | | Aa2 | | | 1,250,000 | | | | 1,131,160 | |
| CA State GO | | 4.00% | | 9/1/2035 | | Aa2 | | | 1,145,000 | | | | 1,146,419 | |
| CA State GO | | 5.00% | | 4/1/2032 | | Aa2 | | | 2,200,000 | | | | 2,470,864 | |
| CA State GO | | 5.00% | | 8/1/2038 | | Aa2 | | | 1,565,000 | | | | 1,637,627 | |
| CA State GO | | 5.25% | | 8/1/2032 | | Aa2 | | | 2,500,000 | | | | 2,631,362 | |
| CA State GO | | 5.25% | | 10/1/2039 | | Aa2 | | | 500,000 | | | | 524,748 | |
| California St GO | | 5.25% | | 9/1/2047 | | Aa2 | | | 3,000,000 | | | | 3,266,461 | |
| Centinela UHSD (BAM) | | 4.00% | | 8/1/2052 | | AA | | | 1,615,000 | | | | 1,416,443 | |
| Centinela UHSD (BAM) | | 5.00% | | 8/1/2052 | | AA | | | 2,000,000 | | | | 2,068,870 | |
| Cupertino USD | | 2.50% | | 8/1/2033 | | Aa1 | | | 740,000 | | | | 626,517 | |
| Grossmont UHSD (AGM) | | Zero Coupon | | 6/1/2040 | | AA | | | 2,000,000 | | | | 824,150 | |
| Hope Elem Sch Dist | | 4.00% | | 8/1/2047 | | AA | | | 2,000,000 | | | | 1,794,837 | |
| Imperial USD (BAM) | | 5.25% | | 8/1/2043 | | AA | | | 2,000,000 | | | | 2,181,638 | |
| Irvine USD | | 5.50% | | 9/1/2035 | | Aa1 | | | 1,060,000 | | | | 1,157,341 | |
| Irvine USD–Spl Tax (BAM) | | 5.00% | | 9/1/2038 | | AA | | | 1,000,000 | | | | 1,031,135 | |
| Irvine USD–Spl Tax (BAM) | | 5.00% | | 9/1/2056 | | AA | | | 1,000,000 | | | | 1,029,580 | |
| Long Beach USD | | 3.00% | | 8/1/2037 | | Aa2 | | | 2,420,000 | | | | 1,964,159 | |
| New Haven USD | | 4.00% | | 8/1/2044 | | Aa3 | | | 1,250,000 | | | | 1,122,140 | |
| Newport Mesa USD | | Zero Coupon | | 8/1/2041 | | Aaa | | | 1,325,000 | | | | 547,067 | |
| Newport-Mesa USD | | Zero Coupon | | 8/1/2045 | | Aaa | | | 2,000,000 | | | | 662,214 | |
| North Orange CCD | | 2.75% | | 8/1/2036 | | AA+ | | | 2,000,000 | | | | 1,636,157 | |
| Orange USD | | 4.00% | | 8/1/2047 | | AA | | | 1,000,000 | | | | 897,418 | |
| Panama-Buena Vista USD (BAM) | | 2.625% | | 8/1/2037 | | AA | | | 1,510,000 | | | | 1,185,077 | |
| Perris UHSD (AGM) | | 3.00% | | 9/1/2044 | | AA | | | 1,000,000 | | | | 739,287 | |
| PR Comwlth GO | | Zero Coupon | | 7/1/2024 | | NR | | | 52,336 | | | | 48,128 | |
| | |
| 146 | See Notes to Financial Statements. |
Schedule of Investments (continued)
CALIFORNIA TAX FREE FUND September 30, 2022
| Investments | | Interest
Rate | | Maturity
Date | | Credit
Rating:
S&P or
Moody’s(a) | | Principal
Amount | | | Fair
Value | |
| General Obligation (continued) | | | | | | | | | | | | | | |
| PR Comwlth GO | | Zero Coupon | | 7/1/2033 | | NR | | $ | 1,434 | | | $ | 793 | |
| PR Comwlth GO | | Zero Coupon | #(b) | 11/1/2043 | | NR | | | 779,478 | | | | 390,713 | |
| PR Comwlth GO | | 4.00% | | 7/1/2033 | | NR | | | 6,526 | | | | 5,754 | |
| PR Comwlth GO | | 4.00% | | 7/1/2035 | | NR | | | 40,696 | | | | 34,888 | |
| PR Comwlth GO | | 4.00% | | 7/1/2037 | | NR | | | 20,754 | | | | 17,084 | |
| PR Comwlth GO | | 4.00% | | 7/1/2046 | | NR | | | 2,000,000 | | | | 1,503,181 | |
| PR Comwlth GO | | 5.25% | | 7/1/2023 | | NR | | | 87,405 | | | | 87,815 | |
| PR Comwlth GO | | 5.375% | | 7/1/2025 | | NR | | | 174,326 | | | | 176,145 | |
| PR Comwlth GO | | 5.625% | | 7/1/2027 | | NR | | | 172,747 | | | | 176,553 | |
| PR Comwlth GO | | 5.625% | | 7/1/2029 | | NR | | | 169,945 | | | | 174,110 | |
| PR Comwlth GO | | 5.75% | | 7/1/2031 | | NR | | | 165,067 | | | | 168,631 | |
| San Benito HSD | | Zero Coupon | | 8/1/2041 | | Aa3 | | | 1,640,000 | | | | 714,239 | |
| San Benito HSD | | Zero Coupon | | 8/1/2042 | | Aa3 | | | 1,795,000 | | | | 744,409 | |
| San Benito HSD | | Zero Coupon | | 8/1/2043 | | Aa3 | | | 2,600,000 | | | | 1,026,630 | |
| San Francisco Arpt AMT | | 5.25% | | 5/1/2042 | | A+ | | | 1,000,000 | | | | 1,013,359 | |
| San Francisco CCD | | 5.00% | | 6/15/2028 | | A+ | | | 1,000,000 | | | | 1,046,847 | |
| San Gorgonio Mem Hlthcare Dist | | 5.00% | | 8/1/2032 | | Ba2 | | | 1,000,000 | | | | 1,000,011 | |
| San Leandro USD (BAM) | | 4.00% | | 8/1/2043 | | AA | | | 650,000 | | | | 588,770 | |
| San Leandro USD (BAM) | | 5.25% | | 8/1/2046 | | AA | | | 1,750,000 | | | | 1,827,520 | |
| San Rafael Elem Sch Dist | | 4.50% | | 8/1/2042 | | AA | | | 1,150,000 | | | | 1,132,147 | |
| Santa Ana USD | | 3.25% | | 8/1/2042 | | Aa3 | | | 500,000 | | | | 388,016 | |
| Santa Barbara USD | | 4.00% | | 8/1/2036 | | Aa1 | | | 750,000 | | | | 744,176 | |
| Santa Rita USD | | 2.50% | | 8/1/2031 | | AA- | | | 1,235,000 | | | | 1,087,651 | |
| Southwestern CCD | | Zero Coupon | | 8/1/2041 | | Aa2 | | | 1,100,000 | | | | 452,174 | |
| Sweetwater UHSD (BAM) | | 5.00% | | 8/1/2027 | | AA | | | 1,000,000 | | | | 1,025,880 | |
| West Contra Costa USD | | 4.00% | | 8/1/2043 | | AA- | | | 1,000,000 | | | | 902,959 | |
| West Contra Costa USD | | 6.00% | | 8/1/2027 | | AA- | | | 1,000,000 | | | | 1,116,987 | |
| Total | | | | | | | | | | | | | 54,120,389 | |
| | | | | | | | | | | | | | | |
| Health Care 12.69% | | | | | | | | | | | | | | |
| Abag Fin Auth–Eskaton Pptys | | 5.00% | | 11/15/2035 | | BBB- | | | 1,000,000 | | | | 967,257 | |
| Abag Fin Auth–Sharp Hlthcare | | 5.00% | | 8/1/2043 | | AA | | | 1,000,000 | | | | 1,004,703 | |
| Antelope Valley Hlth | | 5.25% | | 3/1/2036 | | BBB | | | 1,000,000 | | | | 1,001,681 | |
| CA Hlth–Kaiser Permanente | | 5.00% | | 11/1/2047 | | AA- | | | 1,000,000 | | | | 1,047,330 | |
| CA Hlth–Childrens Hsp Los Angeles | | 5.00% | | 11/15/2029 | | BBB+ | | | 1,000,000 | | | | 1,002,139 | |
| CA Hlth–Childrens Hsp Los Angeles | | 5.00% | | 8/15/2047 | | BBB+ | | | 3,000,000 | | | | 2,901,513 | |
| CA Hlth–Childrens Hsp Orange Co | | 4.00% | | 11/1/2035 | | AA- | | | 570,000 | | | | 539,503 | |
| CA Hlth–Childrens Hsp Orange Co | | 5.00% | | 11/1/2033 | | AA- | | | 1,300,000 | | | | 1,385,593 | |
| | | |
| | See Notes to Financial Statements. | 147 |
Schedule of Investments (continued)
CALIFORNIA TAX FREE FUND September 30, 2022
| Investments | | Interest
Rate | | Maturity
Date | | Credit
Rating:
S&P or
Moody’s(a) | | Principal
Amount | | | Fair
Value | |
| Health Care (continued) | | | | | | | | | | | | | | |
| CA Hlth–Childrens Hsp Orange Co | | 5.00% | | 11/1/2034 | | AA- | | $ | 1,200,000 | | | $ | 1,268,093 | |
| CA Hlth–CommonSpirit | | 4.00% | | 4/1/2044 | | A- | | | 1,250,000 | | | | 1,064,510 | |
| CA Hlth–CommonSpirit | | 4.00% | | 4/1/2045 | | A- | | | 1,250,000 | | | | 1,053,673 | |
| CA Hlth–Providence St. Joes Hlth | | 4.00% | | 10/1/2047 | | A+ | | | 2,115,000 | | | | 1,872,891 | |
| CA Hlth–Sutter Hlth | | 4.00% | | 11/15/2042 | | A1 | | | 1,715,000 | | | | 1,535,263 | |
| CA Hlth Facs–Lucile Packard Hosp | | 5.00% | | 11/15/2056 | | A+ | | | 1,500,000 | | | | 1,496,563 | |
| CA Muni Fin–Caritas Affordable Hsg | | 4.00% | | 8/15/2037 | | A- | | | 1,000,000 | | | | 917,601 | |
| CA Muni Fin–Channing House | | 5.00% | | 5/15/2047 | | AA- | | | 2,000,000 | | | | 2,071,719 | |
| CA Muni Fin–Cmnty Hlth Ctr† | | 5.00% | | 12/1/2054 | | NR | | | 750,000 | | | | 695,399 | (c) |
| CA Muni Fin–Cmnty Med Ctrs | | 4.00% | | 2/1/2042 | | A- | | | 1,165,000 | | | | 1,028,742 | |
| CA Muni Fin–Cmnty Med Ctrs | | 5.00% | | 2/1/2040 | | A- | | | 500,000 | | | | 519,968 | |
| CA Muni Fin–Cmnty Med Ctrs | | 5.00% | | 2/1/2047 | | A- | | | 2,000,000 | | | | 1,983,953 | |
| CA Muni Fin–Eisenhower Med Ctr | | 5.00% | | 7/1/2032 | | Baa2 | | | 1,055,000 | | | | 1,079,459 | |
| CA Stwde–Adventist Health West | | 3.00% | | 3/1/2039 | | A | | | 2,475,000 | | | | 1,854,634 | |
| CA Stwde–American Baptist | | 5.00% | | 10/1/2045 | | A- | (d) | | 1,000,000 | | | | 987,659 | |
| CA Stwde–Daughters of Charity | | 5.50% | | 7/1/2039 | | NR | | | 15,140 | | | | 14,232 | |
| Ca Stwde–Emanate Health | | 4.00% | | 4/1/2037 | | A | | | 1,400,000 | | | | 1,273,930 | |
| CA Stwde–Huntington Memorial Hosp | | 4.00% | | 7/1/2048 | | AA- | | | 1,000,000 | | | | 868,965 | |
| CA Stwde–John Muir Hlth | | 4.00% | | 12/1/2057 | | A+ | | | 1,000,000 | | | | 828,287 | |
| CA Stwde–Kaiser Permanente | | 5.00% | #(b) | 5/1/2033 | | AA- | | | 985,000 | | | | 1,072,974 | |
| CA Stwde–Loma Linda Univ Med Ctr | | 5.25% | | 12/1/2034 | | BB- | | | 2,150,000 | | | | 2,171,631 | |
| CA Stwde–Loma Linda Univ Med Ctr† | | 5.25% | | 12/1/2043 | | BB- | | | 1,000,000 | | | | 961,370 | |
| CA Stwde–Loma Linda Univ Med Ctr† | | 5.25% | | 12/1/2056 | | BB- | | | 1,015,000 | | | | 940,275 | |
| CA Stwde–Loma Linda Univ Med Ctr | | 5.50% | | 12/1/2054 | | BB- | | | 2,200,000 | | | | 2,212,531 | |
| CA Stwde–Loma Linda Univ Med Ctr† | | 5.50% | | 12/1/2058 | | BB- | | | 1,555,000 | | | | 1,497,393 | |
| California Health Facs Fing Auth Rev Bds Childrens Hosp of Orange Cnty 2021b | | 3.00% | | 11/1/2038 | | AA- | | | 3,000,000 | | | | 2,337,819 | |
| Oroville–Oroville Hsp | | 5.25% | | 4/1/2049 | | B+ | | | 1,695,000 | | | | 1,536,772 | |
| Palomar Hlth | | 5.00% | | 11/1/2036 | | BBB | | | 1,250,000 | | | | 1,247,421 | |
| Palomar Hlth | | 5.00% | | 11/1/2039 | | BBB | | | 3,750,000 | | | | 3,709,552 | |
| Regents UCal Med Ctr | | 5.00% | | 5/15/2047 | | AA- | | | 2,000,000 | | | | 2,079,282 | |
| Sierra Joint CCD | | 4.00% | | 8/1/2053 | | Aaa | | | 1,500,000 | | | | 1,315,839 | |
| UCal Med Ctr | | 5.00% | | 5/15/2035 | | AA- | | | 2,000,000 | | | | 2,144,434 | |
| Washingtown Twnshp Health Care Dist | | 3.00% | | 7/1/2037 | | Baa2 | | | 1,440,000 | | | | 1,031,959 | |
| Washingtown Twnshp Health Care Dist | | 5.00% | | 7/1/2032 | | Baa2 | | | 1,075,000 | | | | 1,090,231 | |
| Total | | | | | | | | | | | | | 57,614,743 | |
| | |
| 148 | See Notes to Financial Statements. |
Schedule of Investments (continued)
CALIFORNIA TAX FREE FUND September 30, 2022
| Investments | | Interest
Rate | | Maturity
Date | | Credit
Rating:
S&P or
Moody’s(a) | | Principal
Amount | | | Fair
Value | |
| Housing 7.26% | | | | | | | | | | | | | | |
| CA Cmty Hsg–Sausalito† | | 3.00% | | 2/1/2057 | | NR | | $ | 1,740,000 | | | $ | 1,085,019 | |
| CA Cmty Hsg–Sausalito† | | 4.00% | | 2/1/2050 | | NR | | | 1,000,000 | | | | 696,908 | |
| CA Cmty Hsg–The Arbors† | | 5.00% | | 8/1/2050 | | NR | | | 1,000,000 | | | | 853,467 | |
| CA HFA–MFH | | 3.25% | | 8/20/2036 | | BBB | | | 4,443,711 | | | | 3,807,101 | |
| CA HFA–MFH | | 3.50% | | 11/20/2035 | | BBB+ | | | 3,335,593 | | | | 2,883,836 | |
| CA HFA–MFH | | 4.00% | | 3/20/2033 | | BBB+ | | | 1,911,625 | | | | 1,819,376 | |
| CA HFA–MFH | | 4.25% | | 1/15/2035 | | BBB+ | | | 5,795,149 | | | | 5,557,535 | |
| CA Muni Fin–Biola Univ | | 5.00% | | 10/1/2034 | | Baa1 | | | 1,000,000 | | | | 1,024,551 | |
| CA Muni Fin–Caritas Affordable Hsg | | 5.00% | | 8/15/2030 | | A- | | | 1,050,000 | | | | 1,062,767 | |
| CA Muni Fin–UC Berkeley Hsg | | 5.00% | | 6/1/2050 | | Baa3 | | | 500,000 | | | | 484,642 | |
| CA Muni Fin–UC Davis Hsg (BAM) | | 4.00% | | 5/15/2046 | | AA | | | 4,625,000 | | | | 4,049,600 | |
| CA Stwde–CHF-Irvine LLC | | 5.00% | | 5/15/2035 | | Baa1 | | | 1,100,000 | | | | 1,106,438 | |
| California Statewide Communities Development Authority (BAM) | | 4.00% | | 5/15/2046 | | AA | | | 1,000,000 | | | | 901,525 | |
| CEDA–Provident Student Hsg | | 5.00% | | 8/1/2045 | | Baa3 | | | 1,745,000 | | | | 1,643,012 | |
| CSCDA–Parallel-Anaheim† | | 4.00% | | 8/1/2056 | | NR | | | 1,000,000 | | | | 747,530 | |
| CSCDA–Pasadena† | | 2.65% | | 12/1/2046 | | NR | | | 3,455,000 | | | | 2,478,433 | |
| CSCDA–Westgate Pasadena† | | 3.00% | | 6/1/2047 | | NR | | | 2,500,000 | | | | 1,711,018 | |
| ESRF / Natl Charter School Loans | | 5.00% | | 11/1/2044 | | A | | | 1,050,000 | | | | 1,070,353 | |
| Total | | | | | | | | | | | | | 32,983,111 | |
| | | | | | | | | | | | | | | |
| Lease Obligations 0.99% | | | | | | | | | | | | | | |
| San Bernardino USD (AGM) | | 5.00% | | 10/1/2031 | | AA | | | 860,000 | | | | 927,802 | |
| Santa Barbara COPS AMT | | 5.00% | | 12/1/2036 | | AA | | | 3,395,000 | | | | 3,549,666 | |
| Total | | | | | | | | | | | | | 4,477,468 | |
| | | | | | | | | | | | | | | |
| Other Revenue 2.38% | | | | | | | | | | | | | | |
| CA Infra & Econ Dev–Acad Motion Pict | | 5.00% | | 11/1/2041 | | Aa2 | | | 1,010,000 | | | | 1,021,065 | |
| CA Infra & Econ Dev–CA Science Center | | 4.00% | | 5/1/2046 | | A- | | | 3,000,000 | | | | 2,639,840 | |
| CA Infra & Econ Dev–Museum of Nat Hist | | 4.00% | | 7/1/2050 | | A2 | | | 1,000,000 | | | | 883,724 | |
| CA Muni Fin–Oceaa | | 6.75% | | 10/1/2028 | | NR | | | 800,000 | | | | 800,603 | |
| CA Sch Fin–Aspire† | | 4.00% | | 8/1/2051 | | BBB | | | 785,000 | | | | 615,241 | |
| CA Sch Fin Auth–Green Dot Charter† | | 5.00% | | 8/1/2038 | | BBB- | | | 1,000,000 | | | | 990,593 | |
| CA Sch Fin Auth–KIPP LA† | | 5.00% | | 7/1/2034 | | BBB | | | 600,000 | | | | 601,321 | |
| MSR Energy Auth–Citi | | 6.125% | | 11/1/2029 | | BBB+ | | | 1,950,000 | | | | 2,118,979 | |
| PR Comwlth GO | | Zero Coupon | #(b) | 11/1/2051 | | NR | | | 2,500,000 | | | | 1,128,125 | |
| Total | | | | | | | | | | | | | 10,799,491 | |
| | | |
| | See Notes to Financial Statements. | 149 |
Schedule of Investments (continued)
CALIFORNIA TAX FREE FUND September 30, 2022
| Investments | | Interest
Rate | | Maturity
Date | | Credit
Rating:
S&P or
Moody’s(a) | | Principal
Amount | | | Fair
Value | |
| Pre-Refunded 0.14% | | | | | | | | | | | | | | |
| MSR Energy Auth–Citi | | 6.50% | | 11/1/2039 | | BBB+ | | $ | 555,000 | | | $ | 641,811 | |
| | | | | | | | | | | | | | | |
| Special Tax 4.43% | | | | | | | | | | | | | | |
| Brentwood Infra Fin Auth | | 5.00% | | 9/2/2036 | | NR | | | 500,000 | | | | 506,651 | |
| Inland Valley Redev Agy | | 5.25% | | 9/1/2037 | | A | | | 1,325,000 | | | | 1,347,770 | |
| Invine Reassessment District No. 19 | | 5.00% | | 9/2/2028 | | NR | | | 1,000,000 | | | | 1,026,234 | |
| Irvine CFD–Great Park | | 5.00% | | 9/1/2044 | | NR | | | 500,000 | | | | 502,418 | |
| Irvine USD–Spl Tax | | 5.00% | | 3/1/2057 | | NR | | | 1,000,000 | | | | 956,700 | |
| Lake Elsinore PFA | | 5.00% | | 9/1/2035 | | NR | | | 920,000 | | | | 935,584 | |
| Los Angeles Co Spl Tax–Valencia Fac | | 5.00% | | 9/1/2052 | | NR | | | 1,500,000 | | | | 1,398,000 | |
| Orange Co CFD–Rienda | | 5.00% | | 8/15/2047 | | NR | | | 1,000,000 | | | | 972,590 | |
| Poway USD PFA (BAM) | | 5.00% | | 9/1/2035 | | AA+ | | | 1,770,000 | | | | 1,827,314 | |
| River Islands PFA–CFD 2003 (AGM) | | 5.25% | | 9/1/2052 | | AA | | | 1,000,000 | | | | 1,051,724 | |
| River Islands PFA–Lathrop (AGM) | | 4.00% | | 9/1/2040 | | AA | | | 1,000,000 | | | | 918,348 | |
| River Islands PFA–Lathrop (AGM) | | 4.00% | | 9/1/2045 | | AA | | | 2,000,000 | | | | 1,788,517 | |
| River Islands PFA–Lathrop (AGM) | | 4.00% | | 9/1/2050 | | AA | | | 1,400,000 | | | | 1,233,983 | |
| Roseville CFD–Westpark | | 5.00% | | 9/1/2031 | | NR | | | 1,000,000 | | | | 1,025,430 | |
| San Clemente Cmnty Facs | | 5.00% | | 9/1/2040 | | NR | | | 970,000 | | | | 979,434 | |
| SF Spl Tax–Mission Rock Dist† | | 4.00% | | 9/1/2041 | | NR | | | 2,500,000 | | | | 2,105,567 | |
| Temecula Vly USD (BAM) | | 5.00% | | 9/1/2035 | | AA | | | 1,505,000 | | | | 1,543,630 | |
| Total | | | | | | | | | | | | | 20,119,894 | |
| | | | | | | | | | | | | | | |
| Tax Revenue 6.80% | | | | | | | | | | | | | | |
| Anaheim PFA Lease Rev (BAM) | | 5.00% | | 9/1/2035 | | AA | | | 2,000,000 | | | | 2,098,083 | |
| City of Sacramento–TOT Revs | | 5.00% | | 6/1/2048 | | A1 | | | 1,000,000 | | | | 1,018,695 | |
| Compton Community Redevelopment Agency Successor Agency (AGM) | | 5.00% | | 8/1/2037 | | AA | | | 1,700,000 | | | | 1,744,997 | |
| Fresno USD | | 5.00% | | 8/1/2046 | | Aa3 | | | 1,000,000 | | | | 1,039,692 | |
| Guam–Business Privilege Tax | | 4.00% | | 1/1/2036 | | Ba1 | | | 3,750,000 | | | | 3,247,972 | |
| Invine Reassessment District No. 19 | | 4.00% | | 9/2/2039 | | A | | | 1,000,000 | | | | 938,387 | |
| Moreno Valley Calif USD (BAM) | | 3.00% | | 8/1/2050 | | AA | | | 2,890,000 | | | | 2,002,279 | |
| Oxnard UHSD | | 4.00% | | 8/1/2047 | | Aa2 | | | 2,500,000 | | | | 2,296,686 | |
| PR Corp Sales Tax | | Zero Coupon | | 7/1/2031 | | NR | | | 587,000 | | | | 373,994 | |
| PR Corp Sales Tax | | Zero Coupon | | 7/1/2033 | | NR | | | 134,000 | | | | 75,476 | |
| PR Corp Sales Tax | | Zero Coupon | | 7/1/2051 | | NR | | | 501,000 | | | | 82,184 | |
| PR Corp Sales Tax | | 4.329% | | 7/1/2040 | | NR | | | 350,000 | | | | 303,196 | |
| PR Corp Sales Tax | | 4.329% | | 7/1/2040 | | NR | | | 3,971,000 | | | | 3,439,974 | |
| PR Corp Sales Tax | | 4.536% | | 7/1/2053 | | NR | | | 7,000 | | | | 5,781 | |
| | |
| 150 | See Notes to Financial Statements. |
Schedule of Investments (continued)
CALIFORNIA TAX FREE FUND September 30, 2022
| Investments | | Interest
Rate | | Maturity
Date | | Credit
Rating:
S&P or
Moody’s(a) | | Principal
Amount | | | Fair
Value | |
| Tax Revenue (continued) | | | | | | | | | | | | | | |
| PR Corp Sales Tax | | 4.55% | | 7/1/2040 | | NR | | $ | 313,000 | | | $ | 278,906 | |
| PR Corp Sales Tax | | 4.75% | | 7/1/2053 | | NR | | | 296,000 | | | | 253,542 | |
| PR Corp Sales Tax | | 5.00% | | 7/1/2058 | | NR | | | 4,291,000 | | | | 3,798,832 | |
| San Diego USD | | 3.00% | | 7/1/2044 | | Aa2 | | | 4,400,000 | | | | 3,311,834 | |
| San Leandro USD(e) | | 5.25% | | 8/1/2048 | | A1 | | | 2,100,000 | | | | 2,242,760 | |
| San Rafael HSD | | 5.25% | | 8/1/2052 | | Aa2 | | | 1,215,000 | | | | 1,295,609 | |
| Tustin CFD 06–1 | | 5.00% | | 9/1/2037 | | A- | | | 1,000,000 | | | | 1,021,916 | |
| Total | | | | | | | | | | | | | 30,870,795 | |
| | | | | | | | | | | | | | | |
| Tobacco 5.14% | | | | | | | | | | | | | | |
| CA Stwde–Tobacco Settlement | | Zero Coupon | | 6/1/2046 | | NR | | | 8,675,000 | | | | 1,954,302 | |
| CA Stwde–Tobacco Settlement† | | Zero Coupon | | 6/1/2055 | | NR | | | 10,000,000 | | | | 418,195 | |
| Golden St Tobacco | | Zero Coupon | | 6/1/2066 | | NR | | | 19,500,000 | | | | 1,712,437 | |
| Golden St Tobacco | | 5.00% | | 6/1/2029 | | NR | | | 1,000,000 | | | | 1,079,522 | |
| Golden St Tobacco | | 5.00% | | 6/1/2034 | | NR | | | 1,050,000 | | | | 1,150,951 | |
| Inland Empire Tobacco† | | Zero Coupon | | 6/1/2057 | | CCC | | | 3,000,000 | | | | 144,821 | |
| Los Angeles Co Tobacco | | Zero Coupon | | 6/1/2055 | | NR | | | 3,000,000 | | | | 492,483 | |
| Los Angeles Co Tobacco | | 4.00% | | 6/1/2038 | | A- | | | 615,000 | | | | 549,694 | |
| Los Angeles Co Tobacco | | 4.00% | | 6/1/2039 | | A- | | | 785,000 | | | | 694,085 | |
| Los Angeles Co Tobacco | | 4.00% | | 6/1/2040 | | A- | | | 710,000 | | | | 621,973 | |
| Los Angeles Co Tobacco | | 4.00% | | 6/1/2049 | | BBB+ | | | 1,500,000 | | | | 1,217,891 | |
| Los Angeles Co Tobacco | | 5.00% | | 6/1/2049 | | BBB- | | | 1,020,000 | | | | 965,379 | |
| Merced Co Tobacco | | 5.00% | | 6/1/2050 | | NR | | | 935,000 | | | | 865,141 | |
| Sacramento Co Tobacco | | 4.00% | | 6/1/2049 | | BBB+ | | | 3,250,000 | | | | 2,646,321 | |
| San Diego Co Tobacco | | Zero Coupon | | 6/1/2054 | | NR | | | 4,800,000 | | | | 825,141 | |
| San Diego Co Tobacco | | 5.00% | | 6/1/2038 | | A- | | | 1,000,000 | | | | 1,014,352 | |
| San Diego Co Tobacco | | 5.00% | | 6/1/2039 | | A- | | | 1,000,000 | | | | 1,011,737 | |
| San Diego Co Tobacco | | 5.00% | | 6/1/2048 | | BBB+ | | | 1,675,000 | | | | 1,639,332 | |
| San Diego Co Tobacco | | 5.00% | | 6/1/2048 | | BBB- | | | 85,000 | | | | 80,077 | |
| San Diego Tobacco Settlement | | 4.00% | | 6/1/2032 | | BBB | | | 1,060,000 | | | | 991,893 | |
| Silicon Valley Tobacco | | Zero Coupon | | 6/1/2041 | | NR | | | 5,000,000 | | | | 1,603,196 | |
| Silicon Valley Tobacco | | Zero Coupon | | 6/1/2056 | | NR | | | 2,250,000 | | | | 157,494 | |
| Sonoma Co Tobacco | | 4.00% | | 6/1/2049 | | BBB+ | | | 1,450,000 | | | | 1,177,294 | |
| Sthrn CA Tobacco | | Zero Coupon | | 6/1/2046 | | CCC- | | | 2,500,000 | | | | 352,819 | |
| Total | | | | | | | | | | | | | 23,366,530 | |
| | | |
| | See Notes to Financial Statements. | 151 |
Schedule of Investments (continued)
CALIFORNIA TAX FREE FUND September 30, 2022
| Investments | | Interest
Rate | | Maturity
Date | | Credit
Rating:
S&P or
Moody’s(a) | | Principal
Amount | | | Fair
Value | |
| Transportation 19.28% | | | | | | | | | | | | | | |
| Alameda Corridor Trsp Auth (AGM) | | 5.00% | | 10/1/2052 | | AA | | $ | 9,000,000 | | | $ | 9,074,814 | |
| CA Muni Fin–LINXS AMT | | 4.00% | | 12/31/2047 | | BBB- | (d) | | 5,590,000 | | | | 4,539,694 | |
| CA Muni Fin–LINXS AMT | | 5.00% | | 12/31/2031 | | BBB- | (d) | | 1,240,000 | | | | 1,262,640 | |
| CA Muni Fin–LINXS AMT | | 5.00% | | 12/31/2035 | | BBB- | (d) | | 1,000,000 | | | | 1,001,898 | |
| CA Muni Fin–LINXS AMT | | 5.00% | | 12/31/2043 | | BBB- | (d) | | 4,700,000 | | | | 4,578,286 | |
| Foothill / Eastern Corridor Toll Rd | | Zero Coupon | | 1/15/2033 | | A | | | 1,500,000 | | | | 903,386 | |
| Foothill / Eastern Corridor Toll Rd | | Zero Coupon | | 1/15/2042 | | A | | | 1,150,000 | | | | 1,189,773 | |
| Foothill / Eastern Corridor Toll Rd | | 4.00% | | 1/15/2043 | | A- | | | 8,710,000 | | | | 7,348,816 | |
| Foothill / Eastern Corridor Toll Rd | | 4.00% | | 1/15/2046 | | A | | | 2,500,000 | | | | 2,141,559 | |
| Foothill / Eastern Corridor Toll Rd | | 4.00% | | 1/15/2046 | | A | | | 2,000,000 | | | | 1,713,247 | |
| Long Beach Arpt AMT (AGM) | | 5.25% | | 6/1/2047 | | AA | | | 1,250,000 | | | | 1,265,290 | |
| Long Beach Harbor AMT | | 5.00% | | 5/15/2028 | | AA | | | 1,000,000 | | | | 1,045,492 | |
| Los Angeles Dept Arpts–LAX AMT | | 5.00% | | 5/15/2032 | | AA- | | | 2,000,000 | | | | 2,107,089 | |
| Los Angeles Dept Arpts–LAX AMT | | 5.00% | | 5/15/2039 | | AA | | | 1,000,000 | | | | 1,020,571 | |
| Los Angeles Dept Arpts–LAX AMT | | 5.00% | | 5/15/2041 | | AA | | | 1,000,000 | | | | 1,002,501 | |
| Los Angeles Dept Arpts–LAX AMT | | 5.00% | | 5/15/2043 | | AA- | | | 1,000,000 | | | | 1,002,053 | |
| Los Angeles Dept Arpts–LAX AMT | | 5.00% | | 5/15/2044 | | AA- | | | 4,090,000 | | | | 4,099,000 | |
| Los Angeles Dept Arpts–LAX AMT | | 5.00% | | 5/15/2046 | | AA- | | | 1,000,000 | | | | 1,000,792 | |
| Los Angeles Dept Arpts–LAX AMT | | 5.25% | | 5/15/2047 | | AA | | | 3,000,000 | | | | 3,079,118 | |
| Los Angeles Dept Arpts–LAX AMT | | 5.25% | | 5/15/2048 | | AA- | | | 2,000,000 | | | | 2,025,122 | |
| Los Angeles Harbor AMT | | 5.00% | | 8/1/2036 | | AA | | | 1,000,000 | | | | 1,021,736 | |
| Ontario Intl Airport (AGM) | | 5.00% | | 5/15/2046 | | AA | | | 1,500,000 | | | | 1,534,260 | |
| Riverside Co Trsp Commn | | Zero Coupon | | 6/1/2028 | | NR | | | 465,000 | | | | 380,165 | |
| Riverside Co Trsp Commn | | Zero Coupon | | 6/1/2028 | | A | | | 535,000 | | | | 411,065 | |
| Riverside County Transportation Commission | | 4.00% | | 6/1/2047 | | A- | | | 1,625,000 | | | | 1,344,400 | |
| Sacramento Co Arpt | | 5.00% | | 7/1/2041 | | A | | | 1,130,000 | | | | 1,142,018 | |
| San Diego Arpt AMT | | 5.00% | | 7/1/2047 | | A | | | 2,000,000 | | | | 2,000,081 | |
| San Diego Co Regl Arpt Auth | | 4.00% | | 7/1/2046 | | A2 | | | 1,000,000 | | | | 871,400 | |
| San Francisco Arpt AMT | | 5.00% | | 5/1/2031 | | A1 | | | 6,500,000 | | | | 6,833,196 | |
| San Francisco Arpt AMT | | 5.00% | | 5/1/2032 | | A+ | | | 1,500,000 | | | | 1,570,066 | |
| San Francisco Arpt AMT | | 5.00% | | 5/1/2045 | | A+ | | | 1,515,000 | | | | 1,514,603 | |
| San Francisco Arpt AMT | | 5.00% | | 5/1/2050 | | A+ | | | 4,000,000 | | | | 3,996,040 | |
| San Francisco Arpt AMT | | 5.00% | | 5/1/2052 | | A1 | | | 5,500,000 | | | | 5,496,613 | |
| San Francisco Port AMT | | 5.00% | | 3/1/2030 | | Aa3 | | | 1,415,000 | | | | 1,449,022 | |
| San Joaquin Hills Trsp Corridor | | 5.25% | | 1/15/2044 | | A- | | | 2,100,000 | | | | 2,106,101 | |
| San Joaquin Hills Trsp Corridor | | 5.25% | | 1/15/2049 | | A- | | | 1,930,000 | | | | 1,931,963 | |
| San Joaquin Hills Trsp Corridor (NPFGC)(FGIC) | | Zero Coupon | | 1/15/2036 | | Baa2 | | | 1,450,000 | | | | 719,113 | |
| San Jose Arpt AMT | | 5.00% | | 3/1/2031 | | A | | | 1,750,000 | | | | 1,835,953 | |
| Total | | | | | | | | | | | | | 87,558,936 | |
| | |
| 152 | See Notes to Financial Statements. |
Schedule of Investments (continued)
CALIFORNIA TAX FREE FUND September 30, 2022
| Investments | | Interest
Rate | | Maturity
Date | | Credit
Rating:
S&P or
Moody’s(a) | | Principal
Amount | | | Fair
Value | |
| Utilities 12.88% | | | | | | | | | | | | | | |
| Adelanto Util Sys (AGM) | | 5.00% | | 7/1/2039 | | AA | | $ | 1,335,000 | | | $ | 1,402,360 | |
| CA Choice Clean Energy–Goldman | | 4.00% | #(b) | 10/1/2052 | | A2 | | | 2,350,000 | | | | 2,326,822 | |
| CA Choice Clean Energy–Morgan Stanley | | 4.00% | #(b) | 2/1/2052 | | A1 | | | 3,525,000 | | | | 3,371,893 | |
| CA Poll Ctl–Poseidon Res† | | 5.00% | | 7/1/2039 | | Baa3 | | | 750,000 | | | | 710,816 | |
| CA Poll Ctl–Poseidon Res† | | 5.00% | | 11/21/2045 | | Baa3 | | | 3,870,000 | | | | 3,528,534 | |
| Casitas Muni Water Dist (BAM) | | 5.25% | | 9/1/2047 | | AA | | | 1,525,000 | | | | 1,590,681 | |
| Guam Pwr Auth (AGM) | | 5.00% | | 10/1/2034 | | AA | | | 705,000 | | | | 722,630 | |
| Guam Waterworks | | 5.00% | | 1/1/2050 | | A- | | | 600,000 | | | | 601,620 | |
| Long Beach Nat Gas–ML | 3.376%
(3 Mo. LIBOR * 0.67 + 1.43% | )# | 11/15/2026 | | A2 | | | 1,000,000 | | | | 964,576 | |
| Long Beach Nat Gas–ML | | 5.50% | | 11/15/2037 | | A2 | | | 1,900,000 | | | | 1,989,452 | |
| Los Angeles Dept Wtr & Pwr Sys | | 5.00% | | 7/1/2043 | | Aa2 | | | 2,000,000 | | | | 2,122,600 | |
| Los Angeles Dept Wtr & Pwr Sys | | 5.00% | | 7/1/2051 | | Aa2 | | | 1,200,000 | | | | 1,255,734 | |
| Los Angeles DWAP–Pwr Sys | | 5.25% | | 7/1/2037 | | Aa2 | | | 1,500,000 | | | | 1,584,958 | |
| Los Angeles DWAP–Pwr Sys | | 5.25% | | 7/1/2049 | | Aa2 | | | 2,000,000 | | | | 2,112,072 | |
| Los Angeles Wastewater | | 5.00% | | 6/1/2044 | | AA+ | | | 1,000,000 | | | | 1,024,686 | |
| Mountain House Util Sys (BAM) | | 4.00% | | 12/1/2045 | | AA | | | 2,720,000 | | | | 2,421,390 | |
| MSR Energy Auth–Citi | | 6.50% | | 11/1/2039 | | BBB+ | | | 2,625,000 | | | | 3,035,595 | |
| MSR Energy Auth–Citi | | 7.00% | | 11/1/2034 | | BBB+ | | | 5,000,000 | | | | 5,918,873 | |
| PR Aqueduct & Swr Auth† | | 5.00% | | 7/1/2030 | | NR | | | 750,000 | | | | 736,564 | |
| PR Elec Pwr Auth(f) | | 5.25% | | 7/1/2024 | | D | (d) | | 255,000 | | | | 189,975 | |
| PR Elec Pwr Auth(f) | | 5.25% | | 7/1/2033 | | D | (d) | | 115,000 | | | | 85,675 | |
| PR Elec Pwr Auth(f) | | 7.00% | | 7/1/2040 | | D | (d) | | 450,000 | | | | 346,500 | |
| San Diego Water | | 5.00% | | 8/1/2043 | | Aa3 | | | 1,000,000 | | | | 1,051,331 | |
| San Francisco Calif City & Cnty Pub Utils Commnwastewater R Ev Bds 2018 a Green Bond | | 4.00% | | 10/1/2043 | | AA | | | 1,250,000 | | | | 1,150,823 | |
| San Francisco Pub Utils Commn | | 5.00% | | 10/1/2046 | | AA | | | 2,000,000 | | | | 2,110,490 | |
| Southern CA Pub Pwr Auth–Apex | | 5.00% | | 7/1/2038 | | AA- | | | 1,000,000 | | | | 1,024,433 | |
| Southern CA Pub Pwr Auth–Goldman Sachs | 3.334%
(3 Mo. LIBOR * 0.67 + 1.47% | )# | 11/1/2038 | | A2 | | | 770,000 | | | | 631,823 | (c) |
| Southern CA Pub Pwr Auth–Goldman Sachs | | 5.00% | | 11/1/2033 | | A2 | | | 5,575,000 | | | | 5,677,068 | |
| Stockton PFA–Wastewater (BAM) | | 5.00% | | 9/1/2029 | | AA | | | 1,000,000 | | | | 1,020,499 | |
| Transbay Pwr Auth | | 5.00% | | 10/1/2025 | | BBB+ | (d) | | 1,130,000 | | | | 1,167,242 | |
| Transbay Pwr Auth | | 5.00% | | 10/1/2029 | | BBB+ | (d) | | 1,370,000 | | | | 1,463,511 | |
| Transbay Pwr Auth | | 5.00% | | 10/1/2031 | | BBB+ | (d) | | 765,000 | | | | 804,057 | |
| | | |
| | See Notes to Financial Statements. | 153 |
Schedule of Investments (continued)
CALIFORNIA TAX FREE FUND September 30, 2022
| Investments | | | | | Interest
Rate | | Maturity
Date | | Credit
Rating:
S&P or
Moody’s(a) | | Principal
Amount | | | Fair
Value | |
| Utilities (continued) | | | | | | | | | | | | | | | | | |
| Transbay Pwr Auth | | | | | 5.00% | | 10/1/2032 | | BBB+ | (d) | $ | 1,090,000 | | | $ | 1,141,646 | |
| Transbay Pwr Auth | | | | | 5.00% | | 10/1/2034 | | BBB+ | (d) | | 300,000 | | | | 311,846 | |
| Transbay Pwr Auth | | | | | 5.00% | | 10/1/2035 | | BBB+ | (d) | | 200,000 | | | | 207,533 | |
| Transbay Pwr Auth | | | | | 5.00% | | 10/1/2038 | | BBB+ | (d) | | 650,000 | | | | 666,872 | |
| Transbay Pwrs Auth–Senior Tax Alloc | | | | | 5.00% | | 10/1/2045 | | A- | (d) | | 2,000,000 | | | | 2,018,441 | |
| Total | | | | | | | | | | | | | | | | 58,491,621 | |
| Total Municipal Bonds (cost $488,698,039) | | | | | | | | | 439,879,715 | |
| | | | | | | | | | | | | | | | | | |
| | | Interest
Rate | # | | Interest
Rate
Reset
Date(g) | | Final
Maturity
Date | | | | | | | | | | |
| | | | | | | | | | | | | | | | | | |
| SHORT-TERM INVESTMENTS 0.66% | | | | | | | | | | | | | | | | | |
| | | | | | | | | | | | | | | | | | |
| VARIABLE RATE DEMAND NOTES 0.66% | | | | | | | | | | | | |
| | | | | | | | | | | | | | | | | | |
| Utilities | | | | | | | | | | | | | | | | | |
Los Angeles Dept Wtr & Pwr Sys
(cost $3,000,000) | | 2.450% | | | 10/3/2022 | | 7/1/2051 | | Aa2 | | | 3,000,000 | | | | 3,000,000 | |
| Total Investments in Securities 97.52% (cost $491,698,039) | | | | | | | 442,879,715 | |
| Other Assets and Liabilities – Net(h) 2.48% | | | | | 11,249,910 | |
| Net Assets 100.00% | | | | | | | | | | | | | | | $ | 454,129,625 | |
| | | |
| AGM | | Insured by–Assured Guaranty Municipal Corporation. |
| AMT | | Income from the security may be subject to Alternative Minimum Tax. |
| BAM | | Insured by–Build America Mutual. |
| COPS | | Certificates of Participation. |
| FGIC | | Insured by–Financial Guaranty Insurance Company. |
| LIBOR | | London Interbank Offered Rate. |
| NPFGC | | Insured by–National Public Finance Guarantee Corporation. |
| NR | | Not Rated. |
| SIFMA | | Insured by–Securities Industry and Financial Markets Association. |
| # | | Variable rate security. The interest rate represents the rate in effect at September 30, 2022. |
| † | | Security was purchased pursuant to Rule 144A under the Securities Act of 1933 and, unless registered under such Act or exempted from registration, may only be resold to qualified institutional buyers. At September 30, 2022, the total value of Rule 144A securities was $28,238,344, which represents 6.22% of net assets. |
| (a) | | Unaudited. |
| (b) | | Variable Rate is Fixed to Float: Rate remains fixed or at Zero Coupon until designated future date. |
| (c) | | Level 3 Investment as described in Note 2(i) in the Notes to Financials. Security valued utilizing third party pricing information without adjustment. Such valuations are based on unobservable inputs. A significant change in third party information could result in a significantly lower or higher value of such Level 3 investments. |
| (d) | | This investment has been rated by Fitch IBCA. |
| (e) | | Securities purchased on a when-issued basis (See Note 2(g)). |
| (f) | | Defaulted (non-income producing security). |
| (g) | | The interest rate reset date shown represents the date in which the Fund has the right to sell a Variable Rate Demand Note (“VRDN”) back to the issuer for Principal Amount. The interest rate on the VRDN is generally reset daily based on the SIFMA Municipal Swap Index. |
| (h) | | Other Assets and Liabilities–Net include net unrealized appreciation/depreciation on futures contracts as follows: |
| | |
| 154 | See Notes to Financial Statements. |
Schedule of Investments (concluded)
CALIFORNIA TAX FREE FUND September 30, 2022
Futures Contracts at September 30, 2022:
| Type | | Expiration | | Contracts | | Position | | Notional
Amount | | | Notional
Value | | | Unrealized
Appreciation | |
| U.S. Long Bond | | December 2022 | | 109 | | Short | | $ | (14,362,134 | ) | | $ | (13,778,281 | ) | | | $583,853 | |
The following is a summary of the inputs used as of September 30, 2022 in valuing the Fund’s investments carried at fair value(1):
| Investment Type(2) | | Level 1 | | | Level 2 | | | Level 3 | | | Total | |
| Long-Term Investments | | | | | | | | | | | | | | | | |
| Municipal Bonds | | | | | | | | | | | | | | | | |
| Corporate-Backed | | $ | – | | | $ | 13,822,052 | | | $ | 179,400 | | | $ | 14,001,452 | |
| Health Care | | | – | | | | 56,919,344 | | | | 695,399 | | | | 57,614,743 | |
| Utilities | | | – | | | | 57,859,798 | | | | 631,823 | | | | 58,491,621 | |
| Remaining Industries | | | – | | | | 309,771,899 | | | | – | | | | 309,771,899 | |
| Short-Term Investments | | | | | | | | | | | | | | | | |
| Variable Rate Demand Notes | | | – | | | | 3,000,000 | | | | – | | | | 3,000,000 | |
| Total | | $ | – | | | $ | 441,373,093 | | | $ | 1,506,622 | | | $ | 442,879,715 | |
| Other Financial Instruments | | | | | | | | | | | | | | | | |
| Futures Contracts | | | | | | | | | | | | | | | | |
| Assets | | $ | 583,853 | | | $ | – | | | $ | – | | | $ | 583,853 | |
| Liabilities | | | – | | | | – | | | | – | | | | – | |
| Total | | $ | 583,853 | | | $ | – | | | $ | – | | | $ | 583,853 | |
| | | |
| (1) | | Refer to Note 2(i) for a description of fair value measurements and the three-tier hierarchy of inputs. |
| (2) | | See Schedule of Investments for fair values in each industry. The table above is presented by Investment Type. Industries are presented within an Investment Type should such Investment Type include securities classified as two or more levels within the three-tier fair value hierarchy. When applicable each Level 3 security is identified on the Schedule of Investments along with the valuation technique utilized. |
A reconciliation of Level 3 investments is presented when the Fund has a material amount of Level 3 investments at the beginning or end of the year in relation to the Fund’s net assets. Management has determined not to provide a reconciliation as the balance of Level 3 investments was not considered to be material to the Fund’s net assets at the beginning or end of the year.
| | | |
| | See Notes to Financial Statements. | 155 |
Schedule of Investments
NEW JERSEY TAX FREE FUND September 30, 2022
| Investments | | Interest
Rate | | Maturity
Date | | Credit
Rating:
S&P or
Moody’s(a) | | Principal
Amount | | | Fair
Value | |
| LONG-TERM INVESTMENTS 99.42% | | | | | | | | | | | | | | |
| | | | | | | | | | | | | | | |
| MUNICIPAL BONDS 99.42% | | | | | | | | | | | | | | |
| | | | | | | | | | | | | | | |
| Corporate-Backed 3.52% | | | | | | | | | | | | | | |
| Gloucester Co Poll Ctl–Logan AMT | | 5.00% | | 12/1/2024 | | NR | | $ | 130,000 | | | $ | 131,464 | |
| NJ EDA–Continental Airlines | | 5.25% | | 9/15/2029 | | Ba3 | | | 1,675,000 | | | | 1,659,596 | |
| NJ EDA–Continental Airlines | | 5.50% | | 6/1/2033 | | Ba3 | | | 650,000 | | | | 638,138 | |
| NJ EDA–Goethals Brdg AMT | | 5.00% | | 7/1/2023 | | BBB+ | | | 70,000 | | | | 70,509 | |
| NJ EDA–Goethals Brdg AMT | | 5.00% | | 1/1/2028 | | BBB+ | | | 100,000 | | | | 100,659 | |
| NJ EDA–Goethals Brdg AMT (AGM) | | 5.00% | | 1/1/2031 | | AA | | | 225,000 | | | | 226,193 | |
| NJ Infra Bank–Environmental Infra | | 2.125% | | 9/1/2046 | | AAA | | | 400,000 | | | | 238,227 | |
| Salem Co Poll Ctl–Chambers AMT | | 5.00% | | 12/1/2023 | | NR | | | 500,000 | | | | 505,594 | |
| Total | | | | | | | | | | | | | 3,570,380 | |
| | | | | | | | | | | | | | | |
| Education 6.96% | | | | | | | | | | | | | | |
| Gloucester Co Impt Auth–Rowan Univ (BAM) | | 4.00% | | 7/1/2051 | | AA | | | 650,000 | | | | 554,152 | |
| NJ Ed Facs–Ramapo College (AGM) | | 4.00% | | 7/1/2041 | | AA | | | 545,000 | | | | 491,507 | |
| NJ Ed Facs–Ramapo College (AGM) | | 4.00% | | 7/1/2052 | | AA | | | 500,000 | | | | 431,663 | |
| NJ Ed Facs–Seton Hall Univ | | 4.00% | | 7/1/2046 | | BBB+ | | | 545,000 | | | | 450,915 | |
| NJ Ed Facs–Seton Hall Univ (AGM) | | 3.25% | | 7/1/2049 | | AA | | | 400,000 | | | | 286,639 | |
| NJ Ed Facs–Stockton Univ | | 5.00% | | 7/1/2034 | | BBB+ | | | 325,000 | | | | 330,717 | |
| NJ Ed Facs–Stockton Univ | | 5.00% | | 7/1/2041 | | Baa1 | | | 800,000 | | | | 788,960 | |
| NJ Ed Facs–William Paterson Univ (AGM) | | 3.00% | | 7/1/2039 | | AA | | | 250,000 | | | | 186,234 | |
| NJ Ed Facs–William Paterson Univ (AGM) | | 3.00% | | 7/1/2040 | | AA | | | 250,000 | | | | 183,476 | |
| NJ EDA–Montclair St Univ (AGM) | | 5.00% | | 6/1/2042 | | AA | | | 500,000 | | | | 493,845 | |
| NJ EDA–NJ City Univ (AGM) | | 4.00% | | 7/1/2036 | | AA | | | 745,000 | | | | 698,233 | |
| NJ EDA–Stevens Inst Tech | | 3.00% | | 7/1/2050 | | BBB+ | | | 1,005,000 | | | | 654,132 | |
| NJ EDA–Stevens Inst Tech | | 4.00% | | 7/1/2050 | | BBB+ | | | 200,000 | | | | 161,028 | |
| NJ Higher Ed Assistance Auth AMT | | 2.50% | | 12/1/2040 | | AA | | | 500,000 | | | | 417,233 | |
| NJ Higher Ed Assistance Auth AMT | | 3.25% | | 12/1/2039 | | Aa1 | | | 650,000 | | | | 562,499 | |
| NJ Higher Ed Assistance Auth AMT | | 4.125% | | 12/1/2024 | | Aaa | | | 195,000 | | | | 195,122 | |
| NJ Inst of Tech | | 5.00% | | 7/1/2033 | | A1 | | | 170,000 | | | | 181,567 | |
| Total | | | | | | | | | | | | | 7,067,922 | |
| | | | | | | | | | | | | | | |
| Financial Services 0.21% | | | | | | | | | | | | | | |
| NJ Higher Ed Assistance Auth AMT | | 5.00% | | 12/1/2028 | | Aaa | | | 200,000 | | | | 208,363 | |
| | | | | | | | | | | | | | | |
| General Obligation 11.35% | | | | | | | | | | | | | | |
| Atlantic City GO (AGM) | | 5.00% | | 3/1/2037 | | AA | | | 540,000 | | | | 558,951 | |
| Atlantic City GO (BAM) | | 5.00% | | 3/1/2042 | | AA | | | 750,000 | | | | 771,476 | |
| | |
| 156 | See Notes to Financial Statements. |
Schedule of Investments (continued)
NEW JERSEY TAX FREE FUND September 30, 2022
| Investments | | Interest
Rate | | Maturity
Date | | Credit
Rating:
S&P or
Moody’s(a) | | Principal
Amount | | | Fair
Value | |
| General Obligation (continued) | | | | | | | | | | | | | | |
| Berkeley Heights Twp GO | | 4.00% | | 7/1/2041 | | Aa1 | | $ | 785,000 | | | $ | 722,972 | |
| Cumberland Co Impt Auth (BAM) | | 4.00% | | 10/1/2048 | | AA | | | 750,000 | | | | 660,845 | |
| Gloucester Co Impt Auth–Rowan Univ GTD | | 4.00% | | 7/1/2048 | | Aa1 | | | 510,000 | | | | 451,450 | |
| Hudson Cnty NJ GO | | 2.00% | | 11/15/2035 | | AA | | | 920,000 | | | | 643,677 | |
| Jersey City GO | | 4.00% | | 2/15/2036 | | Aa3 | | | 750,000 | | | | 731,656 | |
| Jersey City GO | | 5.00% | | 11/1/2033 | | AA- | | | 135,000 | | | | 143,404 | |
| Mercer Cnty GO | | 4.00% | | 4/1/2031 | | AA+ | | | 200,000 | | | | 207,254 | |
| Newark GO (AGM) | | 4.00% | | 10/1/2035 | | AA | | | 250,000 | | | | 236,059 | |
| Newark GO (AGM) | | 4.00% | | 10/1/2037 | | AA | | | 275,000 | | | | 256,591 | |
| Newark Housing Authority | | 4.00% | | 1/1/2037 | | AA- | | | 550,000 | | | | 521,890 | |
| NJ State GO | | 2.50% | | 6/1/2038 | | A2 | | | 1,020,000 | | | | 730,489 | |
| NJ State GO | | 4.00% | | 6/1/2031 | | A2 | | | 1,370,000 | | | | 1,381,646 | |
| NJ State GO | | 4.00% | | 6/1/2032 | | A2 | | | 820,000 | | | | 822,611 | |
| PR Comwlth GO | | Zero Coupon | | 7/1/2024 | | NR | | | 13,686 | | | | 12,586 | |
| PR Comwlth GO | | Zero Coupon | | 7/1/2033 | | NR | | | 52,676 | | | | 29,126 | |
| PR Comwlth GO | | Zero Coupon | #(b) | 11/1/2043 | | NR | | | 203,468 | | | | 101,988 | |
| PR Comwlth GO | | 4.00% | | 7/1/2033 | | NR | | | 40,933 | | | | 36,088 | |
| PR Comwlth GO | | 4.00% | | 7/1/2035 | | NR | | | 36,793 | | | | 31,542 | |
| PR Comwlth GO | | 4.00% | | 7/1/2037 | | NR | | | 31,578 | | | | 25,994 | |
| PR Comwlth GO | | 5.25% | | 7/1/2023 | | NR | | | 22,857 | | | | 22,964 | |
| PR Comwlth GO | | 5.375% | | 7/1/2025 | | NR | | | 45,588 | | | | 46,064 | |
| PR Comwlth GO | | 5.625% | | 7/1/2027 | | NR | | | 45,175 | | | | 46,170 | |
| PR Comwlth GO | | 5.625% | | 7/1/2029 | | NR | | | 44,442 | | | | 45,531 | |
| PR Comwlth GO | | 5.75% | | 7/1/2031 | | NR | | | 43,166 | | | | 44,098 | |
| Rutherford BOE | | 2.50% | | 12/15/2034 | | AA- | | | 1,000,000 | | | | 788,165 | |
| Summit GO | | 4.00% | | 7/15/2041 | | AAA | | | 500,000 | | | | 454,270 | |
| Union Co Util Auth–Covanta GTD AMT | | 4.75% | | 12/1/2031 | | AA+ | | | 990,000 | | | | 990,867 | |
| Total | | | | | | | | | | | | | 11,516,424 | |
| | | | | | | | | | | | | | | |
| Health Care 14.79% | | | | | | | | | | | | | | |
| Camden Co Impt Auth–Cooper Hlth | | 5.00% | | 2/15/2030 | | BBB+ | | | 530,000 | | | | 526,569 | |
| Camden Co Impt Auth–Cooper Hlth | | 5.00% | | 2/15/2032 | | BBB+ | | | 500,000 | | | | 491,913 | |
| Camden Co Impt Auth–Cooper Hlth | | 5.75% | | 2/15/2042 | | BBB+ | | | 425,000 | | | | 426,680 | |
| NJ EDA–Bancroft Neuro | | 5.00% | | 6/1/2036 | | NR | | | 220,000 | | | | 213,835 | |
| NJ Hlth–AHS Hsp Corp | | 5.00% | | 7/1/2030 | | AA- | | | 105,000 | | | | 110,878 | |
| NJ Hlth–Atlanticare | | 2.375% | | 7/1/2046 | | AA- | | | 695,000 | | | | 413,061 | |
| NJ Hlth–Hackensack Meridian Hlth | | 5.00% | | 7/1/2029 | | AA- | | | 675,000 | | | | 718,142 | |
| NJ Hlth–Hackensack Meridian Hlth | | 5.00% | | 7/1/2031 | | AA- | | | 640,000 | | | | 674,965 | |
| | | |
| | See Notes to Financial Statements. | 157 |
Schedule of Investments (continued)
NEW JERSEY TAX FREE FUND September 30, 2022
| Investments | | Interest
Rate | | Maturity
Date | | Credit
Rating:
S&P or
Moody’s(a) | | Principal
Amount | | | Fair
Value | |
| Health Care (continued) | | | | | | | | | | | | | | |
| NJ Hlth–Hackensack Meridian Hlth | | 5.00% | | 7/1/2033 | | AA- | | $ | 260,000 | | | $ | 271,071 | |
| NJ Hlth–Inspira Hlth | | 4.00% | | 7/1/2047 | | A2 | | | 830,000 | | | | 706,611 | |
| NJ Hlth–Inspira Hlth | | 5.00% | | 7/1/2035 | | A2 | | | 460,000 | | | | 468,763 | |
| NJ Hlth–Inspira Hlth | | 5.00% | | 7/1/2042 | | A2 | | | 635,000 | | | | 631,849 | |
| NJ Hlth–Princeton Hlth | | 5.00% | | 7/1/2039 | | AA | | | 1,000,000 | | | | 1,018,871 | |
| NJ Hlth–RWJ Barnabas | | 3.00% | | 7/1/2051 | | AA- | | | 1,000,000 | | | | 672,539 | |
| NJ Hlth–RWJ Barnabas | | 4.00% | | 7/1/2045 | | AA- | | | 500,000 | | | | 442,386 | |
| NJ Hlth–RWJ Barnabas | | 4.00% | | 7/1/2051 | | AA- | | | 485,000 | | | | 418,563 | |
| NJ Hlth–RWJ Barnabas | | 5.00% | | 7/1/2033 | | AA- | | | 580,000 | | | | 601,903 | |
| NJ Hlth–RWJ Barnabas | | 5.00% | | 7/1/2043 | | AA- | | | 865,000 | | | | 870,731 | |
| NJ Hlth–St Josephs Hlth | | 4.00% | | 7/1/2048 | | BBB- | | | 1,200,000 | | | | 936,224 | |
| NJ Hlth–St Josephs Hlth | | 5.00% | | 7/1/2027 | | BBB- | | | 100,000 | | | | 101,727 | |
| NJ Hlth–St Josephs Hlth | | 5.00% | | 7/1/2041 | | BBB- | | | 750,000 | | | | 698,715 | |
| NJ Hlth–St Peters Univ Hsp | | 5.75% | | 7/1/2037 | | BBB- | | | 590,000 | | | | 591,622 | |
| NJ Hlth–Univ Hosp (AGM) | | 5.00% | | 7/1/2046 | | AA | | | 1,000,000 | | | | 991,122 | |
| NJ Hlth Fin Auth–Valley Health | | 4.00% | | 7/1/2044 | | A | | | 1,055,000 | | | | 907,034 | |
| NJ Hlth Fin Auth–Valley Health | | 5.00% | | 7/1/2028 | | A | | | 740,000 | | | | 777,092 | |
| NJ Hlth Fin Auth–Valley Health | | 5.00% | | 7/1/2030 | | A | | | 315,000 | | | | 328,426 | |
| Total | | | | | | | | | | | | | 15,011,292 | |
| | | | | | | | | | | | | | | |
| Housing 0.94% | | | | | | | | | | | | | | |
| Essex Co Imp Auth–NJIT Stud Hsg (BAM) | | 4.00% | | 8/1/2051 | | AA | | | 1,020,000 | | | | 888,304 | |
| NJ Hsg and Mtg Fin Auth | | 3.15% | | 5/1/2053 | | AA- | | | 100,000 | | | | 69,559 | |
| Total | | | | | | | | | | | | | 957,863 | |
| | | | | | | | | | | | | | | |
| Lease Obligations 19.43% | | | | | | | | | | | | | | |
| Gloucester Co Impt Auth–Rowan Univ (AGM) | | 5.00% | | 11/1/2029 | | AA | | | 250,000 | | | | 261,583 | |
| Gloucester Co Impt Auth–Rowan Univ (AGM) | | 5.00% | | 11/1/2030 | | AA | | | 290,000 | | | | 302,879 | |
| NJ Ed Facs–Higher Ed Cap Impt | | 5.00% | | 9/1/2033 | | A3 | | | 1,060,000 | | | | 1,066,567 | |
| NJ Ed Facs–Higher Ed Cap Impt | | 5.00% | | 9/1/2036 | | A3 | | | 535,000 | | | | 538,076 | |
| NJ Ed Facs–Higher Ed Cap Impt | | 5.50% | | 9/1/2033 | | A3 | | | 410,000 | | | | 422,238 | |
| NJ EDA–Bldgs | | 5.00% | | 6/15/2047 | | A3 | | | 540,000 | | | | 534,880 | |
| NJ EDA–Goethals Brdg AMT | | 5.375% | | 1/1/2043 | | BBB+ | | | 1,560,000 | | | | 1,562,043 | |
| NJ EDA–Goethals Brdg AMT | | 5.625% | | 1/1/2052 | | BBB+ | | | 210,000 | | | | 210,657 | |
| NJ EDA–Sch Facs | | 4.00% | | 6/15/2049 | | A3 | | | 1,390,000 | | | | 1,153,969 | |
| NJ EDA–Sch Facs | | 5.00% | | 6/15/2029 | | A3 | | | 500,000 | | | | 517,446 | |
| NJ EDA–Sch Facs | | 5.00% | | 6/15/2034 | | A3 | | | 390,000 | | | | 391,420 | |
| NJ EDA–Sch Facs | | 5.00% | | 6/15/2035 | | A3 | | | 640,000 | | | | 644,865 | |
| | |
| 158 | See Notes to Financial Statements. |
Schedule of Investments (continued)
NEW JERSEY TAX FREE FUND September 30, 2022
| Investments | | Interest
Rate | | Maturity
Date | | Credit
Rating:
S&P or
Moody’s(a) | | Principal
Amount | | | Fair
Value | |
| Lease Obligations (continued) | | | | | | | | | | | | | | |
| NJ EDA–Sch Facs | | 5.00% | | 6/15/2042 | | A3 | | $ | 505,000 | | | $ | 500,631 | |
| NJ EDA–Sch Facs | | 5.00% | | 6/15/2048 | | A3 | | | 500,000 | | | | 495,000 | |
| NJ EDA–State House Proj | | 5.00% | | 6/15/2035 | | A3 | | | 750,000 | | | | 758,065 | |
| NJ Hlth–Hsp Asset Trans | | 5.00% | | 10/1/2038 | | A3 | | | 520,000 | | | | 520,329 | |
| NJ Trans Trust Fund | | Zero Coupon | | 12/15/2031 | | A3 | | | 1,980,000 | | | | 1,278,809 | |
| NJ Trans Trust Fund | | Zero Coupon | | 12/15/2038 | | A3 | | | 1,120,000 | | | | 469,039 | |
| NJ Trans Trust Fund | | 4.00% | | 12/15/2039 | | A3 | | | 1,145,000 | | | | 999,837 | |
| NJ Trans Trust Fund | | 4.00% | | 6/15/2050 | | A3 | | | 1,360,000 | | | | 1,124,644 | |
| NJ Trans Trust Fund | | 4.25% | | 12/15/2038 | | A3 | | | 470,000 | | | | 431,096 | |
| NJ Trans Trust Fund | | 4.75% | | 6/15/2038 | | A3 | | | 980,000 | | | | 963,270 | |
| NJ Trans Trust Fund | | 5.00% | | 6/15/2030 | | A+ | | | 545,000 | | | | 562,343 | |
| NJ Trans Trust Fund | | 5.00% | | 6/15/2031 | | A+ | | | 400,000 | | | | 410,857 | |
| NJ Trans Trust Fund | | 5.00% | | 12/15/2036 | | A3 | | | 530,000 | | | | 534,335 | |
| NJ Trans Trust Fund | | 5.00% | | 6/15/2038 | | A3 | | | 1,380,000 | | | | 1,380,196 | |
| NJ Trans Trust Fund | | 5.25% | | 6/15/2041 | | A3 | | | 205,000 | | | | 206,084 | |
| NJ Trans Trust Fund | | 5.25% | | 6/15/2043 | | A3 | | | 720,000 | | | | 728,203 | |
| Salem Co Impr Auth (AGM) | | 4.00% | | 8/15/2042 | | AA | | | 350,000 | | | | 305,310 | |
| Salem Co Impr Auth (AGM) | | 4.00% | | 8/15/2048 | | AA | | | 525,000 | | | | 443,146 | |
| Total | | | | | | | | | | | | | 19,717,817 | |
| | | | | | | | | | | | | | | |
| Other Revenue 0.35% | | | | | | | | | | | | | | |
| Middlesex Co Impt Auth–Heldrich Ctr | | 6.25% | | 1/1/2037 | | NR | | | 1,300,000 | | | | 26,000 | |
| NJ EDA–Bancroft Neuro | | 5.00% | | 6/1/2041 | | NR | | | 350,000 | | | | 330,107 | |
| Total | | | | | | | | | | | | | 356,107 | |
| | | | | | | | | | | | | | | |
| Special Tax 0.93% | | | | | | | | | | | | | | |
| NJ EDA–Kapkowski Rd Landfill | | 6.50% | | 4/1/2028 | | Baa2 | | | 648,943 | | | | 641,595 | |
| NJ Infra Bank–Environmental Infra | | 2.00% | | 9/1/2046 | | AAA | | | 520,000 | | | | 300,460 | |
| Total | | | | | | | | | | | | | 942,055 | |
| | | | | | | | | | | | | | | |
| Tax Revenue 5.22% | | | | | | | | | | | | | | |
| Casino Reinv Dev Auth | | 5.25% | | 11/1/2039 | | Baa2 | | | 525,000 | | | | 532,439 | |
| Casino Reinv Dev Auth (AGM) | | 5.00% | | 11/1/2032 | | AA | | | 500,000 | | | | 511,246 | |
| Garden St Preservation Trust (AGM) | | 5.75% | | 11/1/2028 | | AA | | | 1,205,000 | | | | 1,307,034 | |
| Guam–Business Privilege Tax | | 4.00% | | 1/1/2042 | | Ba1 | | | 250,000 | | | | 202,488 | |
| NJ Trans Trust Fund | | 3.00% | | 6/15/2050 | | A3 | | | 400,000 | | | | 265,108 | |
| PR Corp Sales Tax | | Zero Coupon | | 7/1/2029 | | NR | | | 18,000 | | | | 12,965 | |
| PR Corp Sales Tax | | Zero Coupon | | 7/1/2031 | | NR | | | 235,000 | | | | 149,725 | |
| | | |
| | See Notes to Financial Statements. | 159 |
Schedule of Investments (continued)
NEW JERSEY TAX FREE FUND September 30, 2022
| Investments | | Interest
Rate | | Maturity
Date | | Credit
Rating:
S&P or
Moody’s(a) | | Principal
Amount | | | Fair
Value | |
| Tax Revenue (continued) | | | | | | | | | | | | | | |
| PR Corp Sales Tax | | Zero Coupon | | 7/1/2033 | | NR | | $ | 646,000 | | | $ | 363,861 | |
| PR Corp Sales Tax | | Zero Coupon | | 7/1/2051 | | NR | | | 2,675,000 | | | | 438,808 | |
| PR Corp Sales Tax | | 4.329% | | 7/1/2040 | | NR | | | 96,000 | | | | 83,162 | |
| PR Corp Sales Tax | | 4.329% | | 7/1/2040 | | NR | | | 492,000 | | | | 426,207 | |
| PR Corp Sales Tax | | 4.536% | | 7/1/2053 | | NR | | | 18,000 | | | | 14,865 | |
| PR Corp Sales Tax | | 4.55% | | 7/1/2040 | | NR | | | 19,000 | | | | 16,930 | |
| PR Corp Sales Tax | | 4.55% | | 7/1/2040 | | NR | | | 380,000 | | | | 338,608 | |
| PR Corp Sales Tax | | 4.75% | | 7/1/2053 | | NR | | | 267,000 | | | | 228,702 | |
| PR Corp Sales Tax | | 4.784% | | 7/1/2058 | | NR | | | 40,000 | | | | 33,744 | |
| PR Corp Sales Tax | | 5.00% | | 7/1/2058 | | NR | | | 420,000 | | | | 371,827 | |
| Total | | | | | | | | | | | | | 5,297,719 | |
| | | | | | | | | | | | | | | |
| Tobacco 3.10% | | | | | | | | | | | | | | |
| Tobacco Settlement Fin Corp NJ | | 5.00% | | 6/1/2046 | | BB+ | | | 2,350,000 | | | | 2,166,174 | |
| Tobacco Settlement Fin Corp NJ | | 5.25% | | 6/1/2046 | | BBB+ | | | 1,000,000 | | | | 980,806 | |
| Total | | | | | | | | | | | | | 3,146,980 | |
| | | | | | | | | | | | | | | |
| Transportation 24.67% | | | | | | | | | | | | | | |
| Delaware River & Bay Auth | | 4.00% | | 1/1/2044 | | A1 | | | 850,000 | | | | 781,837 | |
| Delaware River Port Auth | | 5.00% | | 1/1/2040 | | A+ | | | 520,000 | | | | 529,807 | |
| Delaware River Toll Brdg Commn | | 3.00% | | 7/1/2049 | | A1 | | | 1,025,000 | | | | 701,784 | |
| Delaware River Toll Brdg Commn | | 4.00% | | 7/1/2047 | | A1 | | | 1,230,000 | | | | 1,104,222 | |
| Delaware River Toll Brdg Commn | | 5.00% | | 7/1/2030 | | A1 | | | 280,000 | | | | 299,645 | |
| NJ EDA–Goethals Brdg AMT (AGM) | | 5.125% | | 1/1/2039 | | AA | | | 925,000 | | | | 927,163 | |
| NJ EDA–Port Newark AMT | | 5.00% | | 10/1/2047 | | Baa2 | | | 930,000 | | | | 901,612 | |
| NJ EDA–Transit | | 4.00% | | 11/1/2044 | | A3 | | | 275,000 | | | | 233,624 | |
| NJ Tpk Auth | | 4.00% | | 1/1/2043 | | AA- | | | 1,015,000 | | | | 931,986 | |
| NJ Tpk Auth | | 4.00% | | 1/1/2048 | | AA- | | | 1,000,000 | | | | 892,875 | |
| NJ Tpk Auth | | 5.00% | | 1/1/2030 | | AA- | | | 510,000 | | | | 538,054 | |
| NJ Tpk Auth | | 5.00% | | 1/1/2030 | | AA- | | | 585,000 | | | | 624,091 | |
| NJ Tpk Auth | | 5.00% | | 1/1/2033 | | AA- | | | 675,000 | | | | 713,097 | |
| NJ Tpk Auth | | 5.00% | | 1/1/2034 | | AA- | | | 510,000 | | | | 523,179 | |
| NJ Tpk Auth | | 5.00% | | 1/1/2034 | | AA- | | | 615,000 | | | | 642,055 | |
| NJ Tpk Auth | | 5.00% | | 1/1/2035 | | AA- | | | 515,000 | | | | 531,698 | |
| NJ Tpk Auth | | 5.00% | | 1/1/2037 | | AA- | | | 340,000 | | | | 355,908 | |
| NJ Tpk Auth (AGM) | | 5.25% | | 1/1/2028 | | AA | | | 810,000 | | | | 874,989 | |
| NJ Trans Trust Fund | | 4.00% | | 6/15/2046 | | A3 | | | 125,000 | | | | 105,240 | |
| NJ Trans Trust Fund | | 4.00% | | 6/15/2050 | | A3 | | | 1,080,000 | | | | 893,100 | |
| | |
| 160 | See Notes to Financial Statements. |
Schedule of Investments (continued)
NEW JERSEY TAX FREE FUND September 30, 2022
| Investments | | Interest
Rate | | Maturity
Date | | Credit
Rating:
S&P or
Moody’s(a) | | Principal
Amount | | | Fair
Value | |
| Transportation (continued) | | | | | | | | | | | | | | |
| NJ Trans Trust Fund | | 5.00% | | 6/15/2028 | | A+ | | $ | 1,000,000 | | | $ | 1,038,446 | |
| Port Auth N Y & N J Consolidated Bds | | 5.00% | | 11/15/2047 | | AA- | | | 575,000 | | | | 589,898 | |
| Port Auth NY & NJ | | 4.00% | | 9/1/2043 | | AA- | | | 850,000 | | | | 780,334 | |
| Port Auth NY & NJ | | 5.00% | | 11/15/2033 | | AA- | | | 500,000 | | | | 532,964 | |
| Port Auth NY & NJ | | 5.00% | | 10/15/2035 | | AA- | | | 500,000 | | | | 526,129 | |
| Port Auth NY & NJ | | 5.00% | | 7/15/2038 | | AA- | | | 420,000 | | | | 442,200 | |
| Port Auth NY & NJ | | 5.25% | | 8/1/2052 | | Aa3 | | | 250,000 | | | | 264,257 | |
| Port Auth NY & NJ AMT | | 4.00% | | 9/1/2043 | | AA- | | | 950,000 | | | | 825,870 | |
| Port Auth NY & NJ AMT | | 5.00% | | 9/15/2029 | | AA- | | | 320,000 | | | | 334,472 | |
| Port Auth NY & NJ AMT | | 5.00% | | 9/15/2032 | | AA- | | | 505,000 | | | | 521,935 | |
| Port Auth NY & NJ AMT | | 5.00% | | 11/15/2032 | | AA- | | | 500,000 | | | | 509,406 | |
| Port Auth NY & NJ AMT | | 5.00% | | 9/15/2033 | | AA- | | | 560,000 | | | | 576,725 | |
| Port Auth NY & NJ AMT | | 5.00% | | 10/15/2036 | | AA- | | | 1,190,000 | | | | 1,204,014 | |
| Port Auth NY & NJ AMT | | 5.00% | | 11/15/2041 | | AA- | | | 500,000 | | | | 502,875 | |
| South Jersey Port Corp AMT | | 5.00% | | 1/1/2048 | | Baa1 | | | 500,000 | | | | 470,635 | |
| South Jersey Trans Auth | | 5.00% | | 11/1/2039 | | BBB+ | | | 530,000 | | | | 534,810 | |
| South Jersey Trans Auth | | 5.25% | | 11/1/2052 | | BBB+ | | | 850,000 | | | | 872,464 | |
| South Jersey Trans Auth (BAM) | | 4.00% | | 11/1/2050 | | AA | | | 1,080,000 | | | | 901,365 | |
| South Jersey Trans Auth (BAM) | | 5.00% | | 11/1/2045 | | AA | | | 500,000 | | | | 509,236 | |
| Total | | | | | | | | | | | | | 25,044,001 | |
| | | | | | | | | | | | | | | |
| Utilities 7.95% | | | | | | | | | | | | | | |
| Guam Pwr Auth (AGM) | | 5.00% | | 10/1/2034 | | AA | | | 400,000 | | | | 410,003 | |
| Guam Waterworks | | 5.00% | | 7/1/2036 | | A- | | | 100,000 | | | | 101,968 | |
| Guam Waterworks | | 5.00% | | 1/1/2050 | | A- | | | 300,000 | | | | 300,810 | |
| NJ EDA–Middlesex Water AMT | | 4.00% | | 8/1/2059 | | A+ | | | 500,000 | | | | 407,523 | |
| NJ EDA–Nat Gas | | 3.50% | | 4/1/2042 | | A1 | | | 1,655,000 | | | | 1,311,595 | |
| NJ EDA–Nat Gas AMT | | 3.00% | | 8/1/2041 | | A1 | | | 1,000,000 | | | | 713,632 | |
| NJ EDA–NJ American Wtr Co AMT | | 2.20% | #(b) | 10/1/2039 | | A+ | | | 500,000 | | | | 425,848 | |
| NJ EDA–UMM Energy AMT | | 4.75% | | 6/15/2032 | | Baa2 | | | 1,000,000 | | | | 978,026 | |
| NJ Infra Bank-NJ-Am Wtr Co AMT | | 4.00% | | 9/1/2036 | | AAA | | | 335,000 | | | | 330,573 | |
| NJ Infra Bank-NJ-Am Wtr Co AMT | | 4.00% | | 9/1/2047 | | AAA | | | 1,500,000 | | | | 1,308,587 | |
| NJ Tpk Auth | | 5.00% | | 1/1/2031 | | AA- | | | 510,000 | | | | 542,664 | |
| Passaic Valley Swr (AGM) | | 3.00% | | 12/1/2038 | | AA | | | 1,000,000 | | | | 778,983 | |
| PR Aqueduct & Swr Auth† | | 5.00% | | 7/1/2030 | | NR | | | 250,000 | | | | 245,521 | |
| PR Elec Pwr Auth(c) | | 5.00% | | 7/1/2037 | | D | (d) | | 110,000 | | | | 81,950 | |
| | | |
| | See Notes to Financial Statements. | 161 |
Schedule of Investments (concluded)
NEW JERSEY TAX FREE FUND September 30, 2022
| Investments | | Interest
Rate | | Maturity
Date | | Credit
Rating:
S&P or
Moody’s(a) | | Principal
Amount | | | Fair
Value | |
| Utilities (continued) | | | | | | | | | | | | | | |
| PR Elec Pwr Auth(c) | | 5.75% | | 7/1/2036 | | NR | (d) | $ | 75,000 | | | $ | 56,438 | |
| PR Elec Pwr Auth(c) | | 7.00% | | 7/1/2040 | | D | (d) | | 100,000 | | | | 77,000 | |
| Total | | | | | | | | | | | | | 8,071,121 | |
| Total Investments in Securities 99.42% (cost $114,498,688) | | | | | | | | | | | 100,908,044 | |
| Other Assets and Liabilities – Net(e) 0.58% | | | | | | | | | | | | | 587,671 | |
| Net Assets 100.00% | | | | | | | | | | | | $ | 101,495,715 | |
| | | |
| AGM | | Insured by–Assured Guaranty Municipal Corporation. |
| AMT | | Income from the security may be subject to Alternative Minimum Tax. |
| BAM | | Insured by–Build America Mutual. |
| GTD | | Guaranteed. |
| NR | | Not Rated. |
| # | | Variable rate security. The interest rate represents the rate in effect at September 30, 2022. |
| † | | Security was purchased pursuant to Rule 144A under the Securities Act of 1933 and, unless registered under such Act or exempted from registration, may only be resold to qualified institutional buyers. At September 30, 2022, the total value of Rule 144A securities was $245,521, which represents 0.24% of net assets. |
| (a) | | Unaudited. |
| (b) | | Variable Rate is Fixed to Float: Rate remains fixed or at Zero Coupon until designated future date. |
| (c) | | Defaulted (non-income producing security). |
| (d) | | This investment has been rated by Fitch IBCA. |
| (e) | | Other Assets and Liabilities–Net include net unrealized appreciation/depreciation on futures contracts as follows: |
Futures Contracts at September 30, 2022:
| Type | | Expiration | | Contracts | | Position | | Notional
Amount | | Notional
Value | | Unrealized
Appreciation |
| U.S. Long Bond | | December 2022 | | 10 | | Short | | $(1,371,231 | ) | $(1,264,063 | ) | $107,168 |
The following is a summary of the inputs used as of September 30, 2022 in valuing the Fund’s investments carried at fair value(1):
| Investment Type(2) | | Level 1 | | | Level 2 | | | Level 3 | | | Total | |
| Long-Term Investments | | | | | | | | | | | | |
| Municipal Bonds | | $ | – | | | $ | 100,908,044 | | | $ | – | | | $ | 100,908,044 | |
| Total | | $ | – | | | $ | 100,908,044 | | | $ | – | | | $ | 100,908,044 | |
| | | | | | | | | | | | | | | | | |
| Other Financial Instruments | | | | | | | | | | | | | | | | |
| Futures Contracts | | | | | | | | | | | | | | | | |
| Assets | | $ | 107,168 | | | $ | – | | | $ | – | | | $ | 107,168 | |
| Liabilities | | | – | | | | – | | | | – | | | | – | |
| Total | | $ | 107,168 | | | $ | – | | | $ | – | | | $ | 107,168 | |
| | | |
| (1) | | Refer to Note 2(i) for a description of fair value measurements and the three-tier hierarchy of inputs. |
| (2) | | See Schedule of Investments for fair values in each industry. The table above is presented by Investment Type. When applicable each Level 3 security is identified on the Schedule of Investments along with the valuation technique utilized. |
A reconciliation of Level 3 investments is presented when the Fund has a material amount of Level 3 investments at the beginning or end of the year in relation to the Fund’s net assets.
| 162 | See Notes to Financial Statements. |
Schedule of Investments
NEW YORK TAX FREE FUND September 30, 2022
| Investments | | Interest
Rate | | Maturity
Date | | Credit
Rating:
S&P or
Moody’s(a) | | Principal
Amount | | | Fair
Value | |
| LONG-TERM INVESTMENTS 98.51% | | | | | | | | | | | | | | |
| | | | | | | | | | | | | | | |
| MUNICIPAL BONDS 98.51% | | | | | | | | | | | | | | |
| | | | | | | | | | | | | | | |
| Corporate-Backed 9.73% | | | | | | | | | | | | | | |
| Brooklyn Arena LDC–Barclays Ctr | | Zero Coupon | | 7/15/2047 | | Ba1 | | $ | 250,000 | | | $ | 55,059 | |
| Build NYC Res Corp–Pratt Paper AMT† | | 4.50% | | 1/1/2025 | | NR | | | 130,000 | | | | 131,008 | |
| Build NYC Res Corp–Pratt Paper AMT† | | 5.00% | | 1/1/2035 | | NR | | | 250,000 | | | | 251,507 | |
| Liberty Dev Corp–Goldman Sachs | | 5.25% | | 10/1/2035 | | A2 | | | 7,215,000 | | | | 7,487,739 | |
| Liberty Dev Corp–Goldman Sachs | | 5.50% | | 10/1/2037 | | A2 | | | 3,380,000 | | | | 3,578,667 | |
| Niagara Area Dev Corp–Covanta AMT† | | 4.75% | | 11/1/2042 | | B1 | | | 1,750,000 | | | | 1,529,890 | |
| NY Env Facs–Casella Waste AMT | | 2.75% | #(b) | 9/1/2050 | | B | | | 500,000 | | | | 467,414 | |
| NY Env Facs–Casella Waste AMT† | | 2.875% | #(b) | 12/1/2044 | | B | | | 1,500,000 | | | | 1,259,841 | |
| NY Liberty Dev Corp–3 WTC† | | 5.00% | | 11/15/2044 | | NR | | | 8,655,000 | | | | 7,767,924 | |
| NY Liberty Dev Corp–3 WTC† | | 5.15% | | 11/15/2034 | | NR | | | 750,000 | | | | 731,490 | |
| NY Liberty Dev Corp–3 WTC† | | 7.25% | | 11/15/2044 | | NR | | | 1,000,000 | | | | 1,008,031 | |
| NY Liberty Dev Corp–4 WTC | | 2.10% | | 11/15/2032 | | A+ | | | 2,520,000 | | | | 1,922,527 | |
| NY Liberty Dev Corp–4 WTC | | 2.875% | | 11/15/2046 | | A+ | | | 7,270,000 | | | | 4,802,084 | |
| NY Liberty Dev Corp–BofA Tower | | 2.80% | | 9/15/2069 | | Baa1 | | | 4,630,000 | | | | 3,801,379 | |
| NY Trans Dev Corp–American Airlines AMT | | 2.25% | | 8/1/2026 | | B | (c) | | 205,000 | | | | 189,181 | |
| NY Trans Dev Corp–American Airlines AMT | | 3.00% | | 8/1/2031 | | B | (c) | | 1,000,000 | | | | 875,961 | |
| NY Trans Dev Corp–American Airlines AMT | | 5.25% | | 8/1/2031 | | B- | | | 1,430,000 | | | | 1,430,877 | |
| NY Trans Dev Corp–American Airlines AMT | | 5.375% | | 8/1/2036 | | B- | | | 1,025,000 | | | | 1,005,820 | |
| NY Trans Dev Corp–JFK IAT AMT | | 4.00% | | 12/1/2038 | | Baa1 | | | 2,370,000 | | | | 1,995,505 | |
| NYC IDA–TRIPS | | 5.00% | | 7/1/2028 | | BBB+ | | | 1,825,000 | | | | 1,830,480 | |
| Westchester Co LDC–Miriam Osborn Memorial | | 5.00% | | 7/1/2034 | | A | (c) | | 200,000 | | | | 206,200 | |
| Total | | | | | | | | | | | | | 42,328,584 | |
| | | | | | | | | | | | | | | |
| Education 10.33% | | | | | | | | | | | | | | |
| Build NYC Res Corp–Manhattan Clg | | 5.00% | | 8/1/2033 | | A- | | | 1,125,000 | | | | 1,159,951 | |
| Build NYC Res Corp–NY Law | | 5.00% | | 7/1/2041 | | BBB- | | | 1,175,000 | | | | 1,132,442 | |
| Build NYC Res Corp–Packer Collegiate | | 5.00% | | 6/1/2040 | | A2 | | | 1,000,000 | | | | 1,013,645 | |
| Dutchess Co LDC–Bard College† | | 5.00% | | 7/1/2045 | | BB+ | | | 1,000,000 | | | | 910,129 | |
| Dutchess Co LDC–Bard College† | | 5.00% | | 7/1/2051 | | BB+ | | | 1,000,000 | | | | 889,922 | |
| Dutchess Co LDC–Culinary Institute | | 4.00% | | 7/1/2035 | | Baa2 | | | 1,145,000 | | | | 1,024,274 | |
| Dutchess Co LDC–Culinary Institute | | 4.00% | | 7/1/2037 | | Baa2 | | | 965,000 | | | | 846,699 | |
| Dutchess Co LDC–Culinary Institute | | 4.00% | | 7/1/2040 | | Baa2 | | | 325,000 | | | | 276,873 | |
| Dutchess Co LDC–Culinary Institute | | 5.00% | | 7/1/2033 | | Baa2 | | | 390,000 | | | | 392,167 | |
| Dutchess Co LDC–Culinary Institute | | 5.00% | | 7/1/2041 | | Baa2 | | | 200,000 | | | | 197,477 | |
| | | |
| | See Notes to Financial Statements. | 163 |
Schedule of Investments (continued)
NEW YORK TAX FREE FUND September 30, 2022
| Investments | | Interest
Rate | | Maturity
Date | | Credit
Rating:
S&P or
Moody’s(a) | | Principal
Amount | | | Fair
Value | |
| Education (continued) | | | | | | | | | | | | | | |
| Dutchess Co LDC–Culinary Institute | | 5.00% | | 7/1/2046 | | Baa2 | | $ | 275,000 | | | $ | 265,922 | |
| Dutchess Co LDC–Vassar College | | 5.00% | | 7/1/2034 | | Aa3 | | | 275,000 | | | | 286,006 | |
| Dutchess Co LDC- Millbrook | | 4.00% | | 9/1/2051 | | A | | | 1,500,000 | | | | 1,262,061 | |
| Hempstead Town LDC–Adelphi Univ | | 4.00% | | 2/1/2039 | | A- | | | 2,165,000 | | | | 1,910,543 | |
| Hempstead Town LDC–Adelphi Univ | | 5.00% | | 6/1/2029 | | A- | | | 490,000 | | | | 520,064 | |
| Hempstead Town LDC–Adelphi Univ | | 5.00% | | 6/1/2030 | | A- | | | 200,000 | | | | 213,065 | |
| Hempstead Town LDC–Adelphi Univ | | 5.00% | | 6/1/2031 | | A- | | | 340,000 | | | | 362,990 | |
| Hempstead Town LDC–Adelphi Univ | | 5.00% | | 6/1/2032 | | A- | | | 330,000 | | | | 350,556 | |
| Hempstead Town LDC–Hofstra Univ | | 5.00% | | 7/1/2042 | | A | | | 545,000 | | | | 556,264 | |
| Hempstead Town LDC–Molloy Clg | | 5.00% | | 7/1/2034 | | BBB | | | 825,000 | | | | 828,665 | |
| Hempstead Town LDC–Molloy Clg | | 5.00% | | 7/1/2037 | | BBB | | | 630,000 | | | | 630,206 | |
| Hempstead Town LDC–Molloy Clg | | 5.00% | | 7/1/2039 | | BBB | | | 555,000 | | | | 550,918 | |
| Monroe Co IDA–Univ of Rochester | | 4.00% | | 7/1/2043 | | AA- | | | 1,000,000 | | | | 889,517 | |
| Monroe Co IDA–Univ of Rochester | | 5.00% | | 7/1/2031 | | AA- | | | 350,000 | | | | 373,985 | |
| New Rochelle LDC–Iona Clg | | 5.00% | | 7/1/2028 | | BBB | | | 205,000 | | | | 209,338 | |
| New Rochelle LDC–Iona Clg | | 5.00% | | 7/1/2029 | | BBB | | | 250,000 | | | | 255,091 | |
| New Rochelle LDC–Iona Clg | | 5.00% | | 7/1/2030 | | BBB | | | 220,000 | | | | 224,015 | |
| New Rochelle LDC–Iona Clg | | 5.00% | | 7/1/2031 | | BBB | | | 200,000 | | | | 202,998 | |
| NY Dorm–Barnard Clg | | 4.00% | | 7/1/2034 | | A3 | | | 460,000 | | | | 431,110 | |
| NY Dorm–Barnard Clg | | 4.00% | | 7/1/2036 | | A3 | | | 325,000 | | | | 295,778 | |
| NY Dorm–Barnard Clg | | 4.00% | | 7/1/2037 | | A3 | | | 710,000 | | | | 637,864 | |
| NY Dorm–Fordham Univ | | 5.00% | | 7/1/2035 | | A | | | 550,000 | | | | 567,414 | |
| NY Dorm–Iona Clg | | 5.00% | | 7/1/2046 | | BBB | | | 375,000 | | | | 366,103 | |
| NY Dorm–Mt Sinai Sch Med | | 5.00% | | 7/1/2040 | | A- | | | 2,000,000 | | | | 2,021,422 | |
| NY Dorm–NYU | | 4.00% | | 7/1/2045 | | Aa2 | | | 1,000,000 | | | | 885,078 | |
| NY Dorm–NYU | | 5.00% | | 7/1/2029 | | Aa2 | | | 1,000,000 | | | | 1,075,674 | |
| NY Dorm–NYU | | 5.00% | | 7/1/2042 | | Aa2 | | | 1,500,000 | | | | 1,565,309 | |
| NY Dorm–Pace Univ | | 5.00% | | 5/1/2023 | | NR | | | 20,000 | | | | 20,221 | |
| NY Dorm–Pace Univ | | 5.00% | | 5/1/2023 | | BBB- | | | 905,000 | | | | 909,021 | |
| NY Dorm–PIT | | 5.00% | | 2/15/2041 | | NR | | | 5,000 | | | | 5,381 | |
| NY Dorm–Pratt Institute | | 5.00% | | 7/1/2039 | | A2 | | | 1,010,000 | | | | 1,031,853 | |
| NY Dorm–St Johns Univ | | 5.00% | | 7/1/2027 | | A- | | | 250,000 | | | | 257,915 | |
| NY Dorm–SUNY Empire Commons | | 5.00% | | 5/1/2030 | | A | | | 350,000 | | | | 356,981 | |
| NY Dorm–SUNY Empire Commons | | 5.00% | | 5/1/2032 | | A | | | 250,000 | | | | 253,500 | |
| NY Dorm–The New School | | 4.00% | | 7/1/2047 | | A3 | | | 500,000 | | | | 398,508 | |
| NY Dorm–The New School | | 5.00% | | 7/1/2028 | | A3 | | | 780,000 | | | | 805,719 | |
| NY Dorm–Touro Clg | | 5.00% | | 1/1/2047 | | NR | | | 1,630,000 | | | | 1,753,684 | |
| | |
| 164 | See Notes to Financial Statements. |
Schedule of Investments (continued)
NEW YORK TAX FREE FUND September 30, 2022
| Investments | | Interest
Rate | | Maturity
Date | | Credit
Rating:
S&P or
Moody’s(a) | | Principal
Amount | | | Fair
Value | |
| Education (continued) | | | | | | | | | | | | | | |
| NY Dorm–Yeshiva | | 5.00% | | 7/15/2037 | | BBB- | | $ | 1,000,000 | | | $ | 987,554 | |
| NY Dorm–Yeshiva | | 5.00% | | 7/15/2042 | | BBB- | | | 1,000,000 | | | | 965,884 | |
| NYC IDA–Yankee Stadium (AGM) | | 3.00% | | 3/1/2049 | | AA | | | 2,000,000 | | | | 1,385,184 | |
| Onondaga CDC–Le Moyne College | | 4.00% | | 7/1/2038 | | Baa2 | | | 150,000 | | | | 130,122 | |
| Onondaga CDC–Le Moyne College | | 4.00% | | 7/1/2040 | | Baa2 | | | 300,000 | | | | 255,266 | |
| Onondaga CDC–Le Moyne College | | 4.00% | | 7/1/2041 | | Baa2 | | | 415,000 | | | | 349,415 | |
| Onondaga CDC–Le Moyne College | | 5.00% | | 7/1/2035 | | Baa2 | | | 365,000 | | | | 366,326 | |
| Onondaga CDC–Le Moyne College | | 5.00% | | 7/1/2036 | | Baa2 | | | 465,000 | | | | 465,890 | |
| Onondaga CDC–Le Moyne College | | 5.00% | | 7/1/2046 | | Baa2 | | | 600,000 | | | | 577,042 | |
| Schenectady Co–Union Clg | | 5.25% | | 7/1/2052 | | A1 | | | 520,000 | | | | 535,397 | |
| St Lawrence IDA–Clarkson Univ | | 5.00% | | 9/1/2037 | | Baa1 | | | 455,000 | | | | 460,844 | |
| St Lawrence IDA–Clarkson Univ | | 5.00% | | 9/1/2038 | | Baa1 | | | 475,000 | | | | 479,515 | |
| St Lawrence IDA–Clarkson Univ | | 5.00% | | 9/1/2041 | | Baa1 | | | 160,000 | | | | 160,510 | |
| Troy Cap Res Corp–RPI | | 4.00% | | 9/1/2034 | | A3 | | | 835,000 | | | | 763,375 | |
| Troy Cap Res Corp–RPI | | 4.00% | | 9/1/2035 | | A3 | | | 370,000 | | | | 331,447 | |
| Troy Cap Res Corp–RPI | | 4.00% | | 9/1/2036 | | A3 | | | 1,140,000 | | | | 1,005,523 | |
| Troy Cap Res Corp–RPI | | 4.00% | | 9/1/2040 | | A3 | | | 1,000,000 | | | | 843,770 | |
| Troy Cap Res Corp–RPI | | 5.00% | | 8/1/2032 | | A3 | | | 1,415,000 | | | | 1,456,555 | |
| Westchester Co LDC–Miriam Osborn Memorial | | 5.00% | | 7/1/2042 | | A | (c) | | 450,000 | | | | 458,748 | |
| Westchester Co LDC–Sarah Lawrence College | | 4.00% | | 6/1/2033 | | BBB- | | | 1,710,000 | | | | 1,598,412 | |
| Total | | | | | | | | | | | | | 44,951,097 | |
| | | | | | | | | | | | | | | |
| General Obligation 6.35% | | | | | | | | | | | | | | |
| Erie CO GO | | 5.00% | | 9/15/2028 | | AA | | | 275,000 | | | | 287,685 | |
| Jefferson Co–Samaritan Med Ctr | | 5.00% | | 11/1/2037 | | BB | | | 2,000,000 | | | | 2,012,355 | |
| Long Beach GO (BAM) | | 5.25% | | 7/15/2034 | | AA | | | 510,000 | | | | 533,669 | |
| Long Beach GO (BAM) | | 5.25% | | 7/15/2035 | | AA | | | 400,000 | | | | 416,859 | |
| Long Beach GO (BAM) | | 5.25% | | 7/15/2036 | | AA | | | 300,000 | | | | 311,566 | |
| Long Beach GO (BAM) | | 5.25% | | 7/15/2037 | | AA | | | 485,000 | | | | 501,850 | |
| Long Beach GO (BAM) | | 5.25% | | 7/15/2042 | | AA | | | 500,000 | | | | 511,841 | |
| NY Dorm–Sch Dist (AGM) | | 5.00% | | 10/1/2027 | | AA | | | 1,000,000 | | | | 1,032,391 | |
| NYC GO | | 5.00% | | 8/1/2027 | | AA | | | 1,700,000 | | | | 1,762,091 | |
| NYC GO | | 5.00% | | 8/1/2029 | | AA | | | 3,000,000 | | | | 3,143,420 | |
| NYC GO | | 5.00% | | 10/1/2037 | | AA | | | 2,500,000 | | | | 2,635,194 | |
| NYC GO | | 5.00% | | 10/1/2039 | | AA | | | 1,000,000 | | | | 1,050,613 | |
| NYC GO | | 5.00% | | 3/1/2044 | | AA | | | 3,000,000 | | | | 3,114,652 | |
| | | |
| | See Notes to Financial Statements. | 165 |
Schedule of Investments (continued)
NEW YORK TAX FREE FUND September 30, 2022
| Investments | | Interest
Rate | | Maturity
Date | | Credit
Rating:
S&P or
Moody’s(a) | | Principal
Amount | | | Fair
Value | |
| General Obligation (continued) | | | | | | | | | | | | | | |
| NYC GO | | 5.00% | | 12/1/2044 | | AA | | $ | 2,535,000 | | | $ | 2,601,049 | |
| NYC GO | | 5.00% | | 4/1/2045 | | AA | | | 1,380,000 | | | | 1,411,779 | |
| NYC GO | | 5.25% | | 9/1/2043 | | AA | | | 1,150,000 | | | | 1,234,248 | |
| NYC GO | | 5.50% | | 5/1/2044 | | AA | | | 2,085,000 | | | | 2,276,258 | |
| PR Comwlth GO | | Zero Coupon | | 7/1/2024 | | NR | | | 63,475 | | | | 58,371 | |
| PR Comwlth GO | | Zero Coupon | | 7/1/2033 | | NR | | | 244,309 | | | | 135,084 | |
| PR Comwlth GO | | Zero Coupon | #(b) | 11/1/2043 | | NR | | | 943,648 | | | | 473,004 | |
| PR Comwlth GO | | 4.00% | | 7/1/2033 | | NR | | | 189,842 | | | | 167,371 | |
| PR Comwlth GO | | 4.00% | | 7/1/2035 | | NR | | | 170,642 | | | | 146,290 | |
| PR Comwlth GO | | 4.00% | | 7/1/2037 | | NR | | | 146,457 | | | | 120,561 | |
| PR Comwlth GO | | 5.25% | | 7/1/2023 | | NR | | | 106,010 | | | | 106,508 | |
| PR Comwlth GO | | 5.375% | | 7/1/2025 | | NR | | | 211,432 | | | | 213,638 | |
| PR Comwlth GO | | 5.625% | | 7/1/2027 | | NR | | | 209,517 | | | | 214,133 | |
| PR Comwlth GO | | 5.625% | | 7/1/2029 | | NR | | | 206,118 | | | | 211,169 | |
| PR Comwlth GO | | 5.75% | | 7/1/2031 | | NR | | | 200,202 | | | | 204,525 | |
| Syracuse GO | | 4.00% | | 5/15/2034 | | A+ | | | 725,000 | | | | 725,393 | |
| Total | | | | | | | | | | | | | 27,613,567 | |
| | | | | | | | | | | | | | | |
| Health Care 11.48% | | | | | | | | | | | | | | |
| Brookhaven Co–Jefferson’s Ferry | | 4.00% | | 11/1/2045 | | BBB | (c) | | 1,000,000 | | | | 828,042 | |
| Brookhaven Co–Jefferson’s Ferry | | 4.00% | | 11/1/2055 | | BBB | (c) | | 1,000,000 | | | | 785,206 | |
| Brookhaven Co–Long Island Cmnty Hospital | | 3.375% | | 10/1/2040 | | A- | | | 365,000 | | | | 263,380 | |
| Brookhaven Co–Long Island Cmnty Hospital | | 4.00% | | 10/1/2045 | | A- | | | 1,865,000 | | | | 1,579,333 | |
| Brookhaven Co–Long Island Cmnty Hospital | | 5.00% | | 10/1/2050 | | A- | | | 1,000,000 | | | | 987,173 | |
| Broome Co–United Health Services (AGM) | | 3.00% | | 4/1/2036 | | AA | | | 1,030,000 | | | | 808,322 | |
| Broome Co–United Health Services (AGM) | | 3.00% | | 4/1/2037 | | AA | | | 1,500,000 | | | | 1,158,490 | |
| Buffalo & Erie IDC–Catholic Hlth | | 5.00% | | 7/1/2025 | | BB+ | | | 300,000 | | | | 290,678 | |
| Buffalo & Erie IDC–Orchard Park | | 5.00% | | 11/15/2037 | | BBB | (c) | | 1,000,000 | | | | 1,006,244 | |
| Dutchess Co LDC–Health Quest | | 5.00% | | 7/1/2035 | | BBB+ | | | 1,765,000 | | | | 1,768,013 | |
| Dutchess Co LDC–Nuvance Hlth | | 4.00% | | 7/1/2044 | | BBB+ | | | 1,250,000 | | | | 1,015,341 | |
| Dutchess Co LDC–Nuvance Hlth | | 4.00% | | 7/1/2049 | | BBB+ | | | 2,120,000 | | | | 1,672,596 | |
| Genesee Co-Rochester Reg Hlth | | 5.25% | | 12/1/2052 | | BBB+ | | | 1,000,000 | | | | 962,784 | |
| Monroe Co IDA–Rochester General Hospital | | 4.00% | | 12/1/2035 | | BBB+ | | | 500,000 | | | | 434,745 | |
| Monroe Co IDA–Rochester General Hospital | | 4.00% | | 12/1/2036 | | BBB+ | | | 425,000 | | | | 366,130 | |
| Monroe Co IDA–Rochester General Hospital | | 5.00% | | 12/1/2034 | | BBB+ | | | 250,000 | | | | 252,123 | |
| | |
| 166 | See Notes to Financial Statements. |
Schedule of Investments (continued)
NEW YORK TAX FREE FUND September 30, 2022
| Investments | | Interest
Rate | | Maturity
Date | | Credit
Rating:
S&P or
Moody’s(a) | | Principal
Amount | | | Fair
Value | |
| Health Care (continued) | | | | | | | | | | | | | | |
| Nassau Co LEAC–Catholic Hlth LI | | 5.00% | | 7/1/2027 | | A- | | $ | 625,000 | | | $ | 636,100 | |
| Nassau Co LEAC–Catholic Hlth LI | | 5.00% | | 7/1/2028 | | A- | | | 2,045,000 | | | | 2,080,928 | |
| Nassau Co LEAC–Catholic Hlth LI | | 5.00% | | 7/1/2033 | | A- | | | 600,000 | | | | 606,899 | |
| Niagara Area Dev Corp–Catholic Hlth | | 5.00% | | 7/1/2052 | | BB+ | | | 1,000,000 | | | | 799,162 | |
| NY Dorm–Catholic Hlth | | 4.00% | | 7/1/2045 | | BB+ | | | 2,895,000 | | | | 2,070,081 | |
| NY Dorm–Catholic Hlth | | 5.00% | | 7/1/2032 | | BB+ | | | 500,000 | | | | 500,097 | |
| NY Dorm–Maimondes Med Ctr (FHA) | | 3.00% | | 2/1/2050 | | AA+ | | | 1,000,000 | | | | 691,634 | |
| NY Dorm–Montefiore | | 4.00% | | 8/1/2036 | | BBB- | | | 475,000 | | | | 396,685 | |
| NY Dorm–Montefiore | | 4.00% | | 8/1/2037 | | BBB- | | | 1,820,000 | | | | 1,504,950 | |
| NY Dorm–Montefiore | | 4.00% | | 8/1/2038 | | BBB- | | | 1,520,000 | | | | 1,245,013 | |
| NY Dorm–Montefiore | | 4.00% | | 9/1/2050 | | BBB- | | | 5,000,000 | | | | 3,660,535 | |
| NY Dorm–Montefiore | | 5.00% | | 8/1/2033 | | BBB- | | | 1,080,000 | | | | 1,035,289 | |
| NY Dorm–Montefiore | | 5.00% | | 8/1/2034 | | BBB- | | | 390,000 | | | | 370,698 | |
| NY Dorm–Montefiore | | 5.00% | | 8/1/2035 | | BBB- | | | 525,000 | | | | 493,220 | |
| NY Dorm–Northwell Health | | 4.00% | | 5/1/2045 | | A- | | | 2,000,000 | | | | 1,730,716 | |
| NY Dorm–Northwell Health | | 5.00% | | 5/1/2028 | | A- | | | 1,000,000 | | | | 1,020,257 | |
| NY Dorm–Northwell Health | | 5.00% | | 5/1/2038 | | A- | | | 980,000 | | | | 998,895 | |
| NY Dorm–NYU Langone | | 5.00% | | 7/1/2032 | | A+ | | | 810,000 | | | | 826,806 | |
| NY Dorm–NYU Langone | | 5.00% | | 7/1/2033 | | A+ | | | 760,000 | | | | 774,113 | |
| NY Dorm–Orange Regl Med Ctr† | | 5.00% | | 12/1/2026 | | BBB- | | | 1,000,000 | | | | 1,011,004 | |
| NY Dorm–Orange Regl Med Ctr† | | 5.00% | | 12/1/2029 | | BBB- | | | 1,900,000 | | | | 1,907,339 | |
| NYC IDA–Yankee Stadium | | 3.00% | | 3/1/2049 | | Baa1 | | | 2,090,000 | | | | 1,355,394 | |
| Oneida Co–Mohawk Valley Hlth (AGM) | | 4.00% | | 12/1/2049 | | AA | | | 4,645,000 | | | | 3,950,399 | |
| Southhold LDC–Peconic Landing | | 5.00% | | 12/1/2045 | | BBB- | (c) | | 1,000,000 | | | | 975,813 | |
| Tompkins Co Dev Corp–Kendal Ithaca | | 5.00% | | 7/1/2044 | | BBB+ | | | 920,000 | | | | 920,233 | (d) |
| Westchester Co LDC–Westchester Med Ctr | | 5.00% | | 11/1/2033 | | Baa2 | | | 1,000,000 | | | | 990,355 | |
| Westchester Co LDC–Westchester Med Ctr | | 5.00% | | 11/1/2034 | | Baa2 | | | 985,000 | | | | 970,198 | |
| Westchester Co LDC–Westchester Med Ctr | | 5.00% | | 11/1/2046 | | Baa2 | | | 2,240,000 | | | | 2,071,509 | |
| Westchester Co LDC–Westchester Med Ctr | | 6.00% | | 11/1/2030 | | Baa2 | | | 105,000 | | | | 105,122 | |
| Westchester Co LDC–Westchester Med Ctr | | 6.125% | | 11/1/2037 | | Baa2 | | | 40,000 | | | | 40,082 | |
| Total | | | | | | | | | | | | | 49,918,126 | |
| | | | | | | | | | | | | | | |
| Housing 0.91% | | | | | | | | | | | | | | |
| NYC HDC | | 3.35% | | 11/1/2065 | | AA+ | | | 1,985,000 | | | | 1,323,143 | |
| NYC Hsg–8 Spruce St | | 4.50% | | 2/15/2048 | | NR | | | 1,000,000 | | | | 980,258 | (d) |
| NYS HFA | | 3.15% | | 11/1/2054 | | Aa2 | | | 1,000,000 | | | | 689,584 | |
| Westchester Co LDC–SUNY Purchase Hsg | | 5.00% | | 6/1/2047 | | BBB | | | 1,000,000 | | | | 962,903 | |
| Total | | | | | | | | | | | | | 3,955,888 | |
| | | |
| | See Notes to Financial Statements. | 167 |
Schedule of Investments (continued)
NEW YORK TAX FREE FUND September 30, 2022
| Investments | | Interest
Rate | | Maturity
Date | | Credit
Rating:
S&P or
Moody’s(a) | | Principal
Amount | | | Fair
Value | |
| Lease Obligations 1.99% | | | | | | | | | | | | | | |
| Erie Co IDA–Buffalo Sch Dist | | 5.00% | | 5/1/2028 | | AA | | $ | 1,050,000 | | | $ | 1,100,040 | |
| Hudson Yards | | 5.00% | | 2/15/2031 | | Aa2 | | | 2,065,000 | | | | 2,181,170 | |
| Hudson Yards | | 5.00% | | 2/15/2033 | | Aa2 | | | 1,075,000 | | | | 1,126,845 | |
| NY Dorm- Saint Lawerence-Lewis Boces (BAM) | | 4.00% | | 8/15/2050 | | AA | | | 2,500,000 | | | | 2,139,778 | |
| NYC TFA–Bldg Aid | | 5.00% | | 7/15/2035 | | AA | | | 2,005,000 | | | | 2,125,504 | |
| Total | | | | | | | | | | | | | 8,673,337 | |
| | | | | | | | | | | | | | | |
| Other 0.72% | | | | | | | | | | | | | | |
| Build NYC Res Corp–Childrens Aid Soc | | 4.00% | | 7/1/2044 | | A+ | | | 1,340,000 | | | | 1,147,716 | |
| Build NYC Res Corp–Childrens Aid Soc | | 4.00% | | 7/1/2049 | | A+ | | | 2,380,000 | | | | 1,991,256 | |
| Total | | | | | | | | | | | | | 3,138,972 | |
| | | | | | | | | | | | | | | |
| Other Revenue 3.66% | | | | | | | | | | | | | | |
| Brooklyn Arena LDC–Barclays Ctr | | 5.00% | | 7/15/2042 | | Ba1 | | | 3,000,000 | | | | 2,869,036 | |
| Build NYC Res Corp–Shefa School† | | 5.00% | | 6/15/2051 | | NR | | | 1,315,000 | | | | 1,192,457 | |
| New York St Twy Auth St–PIT | | 5.00% | | 3/15/2046 | | AA+ | | | 2,500,000 | | | | 2,602,522 | |
| NYC Cultural–Lincoln Center | | 4.00% | | 12/1/2033 | | A | | | 1,850,000 | | | | 1,771,130 | |
| NYS Twy Auth–PIT | | 5.00% | | 3/15/2048 | | AA+ | | | 2,000,000 | | | | 2,077,883 | |
| Triborough Brdg & Tunl Auth–Payroll Mobility Tax | 5.50% | | 5/15/2052 | | AA+ | | | 5,000,000 | | | | 5,417,750 | |
| Total | | | | | | | | | | | | | 15,930,778 | |
| | | | | | | | | | | | | | | |
| Special Tax 2.40% | | | | | | | | | | | | | | |
| NYC IDA–Queens Stadium (AGM) | | 3.00% | | 1/1/2040 | | AA | | | 1,975,000 | | | | 1,488,176 | |
| NYC IDA–Queens Stadium (AGM) | | 3.00% | | 1/1/2046 | | AA | | | 2,965,000 | | | | 2,037,614 | |
| NYC IDA–Yankee Stadium | | 4.00% | | 3/1/2045 | | Baa1 | | | 1,800,000 | | | | 1,522,515 | |
| NYC IDA–Yankee Stadium (AGC) | | Zero Coupon | | 3/1/2043 | | AA | | | 425,000 | | | | 143,766 | |
| NYC IDA–Yankee Stadium (AGC) | | Zero Coupon | | 3/1/2044 | | AA | | | 640,000 | | | | 204,128 | |
| NYC IDA–Yankee Stadium (AGC) | | Zero Coupon | | 3/1/2047 | | AA | | | 385,000 | | | | 103,204 | |
| NYC IDA–Yankee Stadium (FGIC) | 9.405%
(CPI Based * 1 + 0.88% | )# | 3/1/2026 | | Baa1 | | | 3,450,000 | | | | 3,475,301 | |
| NYC TFA–Future Tax | | 5.25% | | 11/1/2037 | | AAA | | | 1,370,000 | | | | 1,483,585 | |
| Total | | | | | | | | | | | | | 10,458,289 | |
| | | | | | | | | | | | | | | |
| Tax Revenue 15.51% | | | | | | | | | | | | | | |
| Guam–Business Privilege Tax | | 4.00% | | 1/1/2042 | | Ba1 | | | 750,000 | | | | 607,463 | |
| MTA NY–Dedicated Tax | | 4.00% | | 11/15/2035 | | AA | | | 335,000 | | | | 322,467 | |
| MTA NY–Dedicated Tax | | 5.00% | | 11/15/2034 | | AA | | | 1,085,000 | | | | 1,153,573 | |
| | |
| 168 | See Notes to Financial Statements. |
Schedule of Investments (continued)
NEW YORK TAX FREE FUND September 30, 2022
| Investments | | Interest
Rate | | Maturity
Date | | Credit
Rating:
S&P or
Moody’s(a) | | Principal
Amount | | | Fair
Value | |
| Tax Revenue (continued) | | | | | | | | | | | | | | |
| MTA NY–Dedicated Tax | | 5.00% | | 11/15/2047 | | AA | | $ | 2,000,000 | | | $ | 2,095,671 | |
| MTA NY–Dedicated Tax | | 5.25% | | 11/15/2031 | | AA | | | 1,215,000 | | | | 1,296,181 | |
| MTA NY–Dedicated Tax | | 5.25% | | 11/15/2032 | | AA | | | 670,000 | | | | 713,444 | |
| MTA NY–Dedicated Tax | | 5.25% | | 11/15/2034 | | AA | | | 455,000 | | | | 483,428 | |
| NY Dorm–PIT | | 4.00% | | 3/15/2043 | | AA+ | | | 5,000,000 | | | | 4,547,998 | |
| NY Dorm–PIT | | 4.00% | | 3/15/2048 | | Aa1 | | | 1,935,000 | | | | 1,711,633 | |
| NY Dorm–PIT | | 5.00% | | 3/15/2032 | | Aa1 | | | 3,000,000 | | | | 3,229,986 | |
| NY Dorm–PIT | | 5.00% | | 2/15/2042 | | AA+ | | | 2,055,000 | | | | 2,117,484 | |
| NY Dorm–PIT | | 5.00% | | 3/15/2045 | | Aa1 | | | 2,000,000 | | | | 2,055,649 | |
| NY Dorm–Sales Tax | | 5.00% | | 3/15/2043 | | AA+ | | | 2,025,000 | | | | 2,061,081 | |
| NY Dorm–Touro Clg | | 4.00% | | 1/1/2043 | | NR | | | 210,000 | | | | 215,619 | |
| NY Dorm- PIT | | 4.00% | | 3/15/2047 | | Aa1 | | | 2,000,000 | | | | 1,777,179 | |
| NY UDC–PIT | | 4.00% | | 3/15/2047 | | AA+ | | | 1,650,000 | | | | 1,468,357 | |
| NY UDC–PIT | | 5.00% | | 3/15/2033 | | AA+ | | | 2,010,000 | | | | 2,023,837 | |
| NY UDC–PIT | | 5.00% | | 3/15/2036 | | AA+ | | | 1,500,000 | | | | 1,530,637 | |
| NY UDC–PIT | | 5.00% | | 3/15/2040 | | AA+ | | | 1,000,000 | | | | 1,034,156 | |
| NYC TFA–Future Tax | | 4.00% | | 8/1/2039 | | AAA | | | 1,000,000 | | | | 940,829 | |
| NYC TFA–Future Tax | | 4.00% | | 11/1/2042 | | AAA | | | 1,675,000 | | | | 1,544,289 | |
| NYC TFA–Future Tax | | 4.00% | | 11/1/2042 | | AAA | | | 1,500,000 | | | | 1,382,946 | |
| NYC TFA–Future Tax | | 4.00% | | 5/1/2043 | | AAA | | | 2,000,000 | | | | 1,833,364 | |
| NYC TFA–Future Tax | | 5.00% | | 11/1/2030 | | AAA | | | 2,075,000 | | | | 2,190,774 | |
| NYC TFA–Future Tax | | 5.00% | | 11/1/2032 | | AAA | | | 1,555,000 | | | | 1,631,966 | |
| NYC TFA–Future Tax | | 5.00% | | 5/1/2035 | | AAA | | | 1,270,000 | | | | 1,319,214 | |
| NYC TFA–Future Tax | | 5.00% | | 8/1/2040 | | AAA | | | 2,530,000 | | | | 2,597,727 | |
| NYC TFA–Future Tax | | 5.00% | | 8/1/2041 | | AAA | | | 2,975,000 | | | | 3,048,449 | |
| NYC TFA–Future Tax | | 5.00% | | 8/1/2042 | | AAA | | | 2,700,000 | | | | 2,778,181 | |
| NYC TFA–Future Tax | | 5.00% | | 2/1/2043 | | AAA | | | 2,510,000 | | | | 2,556,473 | |
| NYC TFA–Future Tax | | 5.00% | | 5/1/2043 | | AAA | | | 1,400,000 | | | | 1,427,315 | |
| NYC TFA–Future Tax | | 5.00% | | 2/1/2047 | | AAA | | | 2,000,000 | | | | 2,057,354 | |
| PR Corp Sales Tax | | Zero Coupon | | 7/1/2029 | | NR | | | 163,000 | | | | 117,403 | |
| PR Corp Sales Tax | | Zero Coupon | | 7/1/2031 | | NR | | | 708,000 | | | | 451,086 | |
| PR Corp Sales Tax | | Zero Coupon | | 7/1/2033 | | NR | | | 710,000 | | | | 399,909 | |
| PR Corp Sales Tax | | Zero Coupon | | 7/1/2051 | | NR | | | 7,476,000 | | | | 1,226,365 | |
| PR Corp Sales Tax | | 4.329% | | 7/1/2040 | | NR | | | 489,000 | | | | 423,608 | |
| PR Corp Sales Tax | | 4.329% | | 7/1/2040 | | NR | | | 858,000 | | | | 743,263 | |
| PR Corp Sales Tax | | 4.536% | | 7/1/2053 | | NR | | | 64,000 | | | | 52,855 | |
| PR Corp Sales Tax | | 4.55% | | 7/1/2040 | | NR | | | 153,000 | | | | 136,334 | |
| | | |
| | See Notes to Financial Statements. | 169 |
Schedule of Investments (continued)
NEW YORK TAX FREE FUND September 30, 2022
| Investments | | Interest
Rate | | Maturity
Date | | Credit
Rating:
S&P or
Moody’s(a) | | Principal
Amount | | | Fair
Value | |
| Tax Revenue (continued) | | | | | | | | | | | | | | |
| PR Corp Sales Tax | | 4.55% | | 7/1/2040 | | NR | | $ | 380,000 | | | $ | 338,608 | |
| PR Corp Sales Tax | | 4.75% | | 7/1/2053 | | NR | | | 1,199,000 | | | | 1,027,017 | |
| PR Corp Sales Tax | | 4.784% | | 7/1/2058 | | NR | | | 180,000 | | | | 151,846 | |
| PR Corp Sales Tax | | 5.00% | | 7/1/2058 | | NR | | | 1,922,000 | | | | 1,701,551 | |
| Triborough Brdg & Tunl–Sales Tax | | 5.00% | | 5/15/2047 | | AA+ | | | 3,000,000 | | | | 3,109,009 | |
| Triborough Brdg & Tunl Auth- Payroll Mobility Tax | | 4.00% | | 5/15/2046 | | AA+ | | | 2,015,000 | | | | 1,811,253 | |
| Total | | | | | | | | | | | | | 67,444,831 | |
| | | | | | | | | | | | | | | |
| Tobacco 2.98% | | | | | | | | | | | | | | |
| Erie Co Tobacco | | Zero Coupon | | 6/1/2055 | | NR | | | 8,000,000 | | | | 380,125 | |
| Erie Co Tobacco† | | Zero Coupon | | 6/1/2060 | | NR | | | 20,000,000 | | | | 955,842 | |
| Monroe Co Tobacco† | | Zero Coupon | | 6/1/2061 | | NR | | | 10,000,000 | | | | 319,392 | |
| Nassau Co Tobacco | | Zero Coupon | | 6/1/2060 | | NR | | | 15,000,000 | | | | 684,950 | |
| Nassau Co Tobacco | | 5.125% | | 6/1/2046 | | CCC+ | | | 2,085,000 | | | | 1,843,210 | |
| NY Co Tobacco Trust | | Zero Coupon | | 6/1/2060 | | NR | | | 20,000,000 | | | | 867,928 | |
| Rockland Tobacco† | | Zero Coupon | | 8/15/2060 | | NR | | | 10,575,000 | | | | 601,177 | |
| Suffolk Tobacco Asset Sec Corp | | Zero Coupon | | 6/1/2066 | | NR | | | 7,700,000 | | | | 659,159 | |
| TSASC | | 5.00% | | 6/1/2034 | | A- | | | 1,000,000 | | | | 1,018,561 | |
| TSASC | | 5.00% | | 6/1/2035 | | A- | | | 300,000 | | | | 305,077 | |
| TSASC | | 5.00% | | 6/1/2036 | | A- | | | 100,000 | | | | 101,510 | |
| TSASC | | 5.00% | | 6/1/2041 | | A- | | | 545,000 | | | | 548,755 | |
| TSASC | | 5.00% | | 6/1/2048 | | NR | | | 3,300,000 | | | | 2,835,805 | |
| Westchester Tobacco Asset Sec Corp | | 5.125% | | 6/1/2051 | | BB- | | | 1,845,000 | | | | 1,835,261 | |
| Total | | | | | | | | | | | | | 12,956,752 | |
| | | | | | | | | | | | | | | |
| Transportation 25.28% | | | | | | | | | | | | | | |
| Buffalo & Erie PBA–Peace Bridge | | 5.00% | | 1/1/2034 | | A+ | | | 600,000 | | | | 635,304 | |
| MTA NY | | 4.00% | | 11/15/2051 | | A3 | | | 3,190,000 | | | | 2,569,806 | |
| MTA NY | | 4.75% | | 11/15/2045 | | A3 | | | 3,095,000 | | | | 2,920,869 | |
| MTA NY | | 5.00% | | 11/15/2028 | | A3 | | | 865,000 | | | | 897,841 | |
| MTA NY | | 5.00% | | 11/15/2029 | | A3 | | | 2,450,000 | | | | 2,523,002 | |
| MTA NY | | 5.00% | | 11/15/2029 | | A3 | | | 1,730,000 | | | | 1,764,464 | |
| MTA NY | | 5.00% | | 11/15/2030 | | A3 | | | 1,785,000 | | | | 1,819,927 | |
| MTA NY | | 5.00% | | 11/15/2030 | | A3 | | | 700,000 | | | | 718,150 | |
| MTA NY | | 5.00% | | 11/15/2033 | | A3 | | | 1,900,000 | | | | 1,900,125 | |
| MTA NY | | 5.00% | | 11/15/2041 | | A3 | | | 1,050,000 | | | | 1,020,398 | |
| MTA NY | | 5.00% | #(b) | 11/15/2045 | | A3 | | | 2,520,000 | | | | 2,604,122 | |
| | |
| 170 | See Notes to Financial Statements. |
Schedule of Investments (continued)
NEW YORK TAX FREE FUND September 30, 2022
| Investments | | Interest
Rate | | Maturity
Date | | Credit
Rating:
S&P or
Moody’s(a) | | Principal
Amount | | | Fair
Value | |
| Transportation (continued) | | | | | | | | | | | | | | |
| MTA NY | | 5.00% | | 11/15/2050 | | A3 | | $ | 2,005,000 | | | $ | 1,898,910 | |
| MTA NY | | 5.25% | | 11/15/2028 | | A3 | | | 3,740,000 | | | | 3,848,062 | |
| MTA NY | | 5.25% | | 11/15/2035 | | A3 | | | 1,170,000 | | | | 1,177,435 | |
| MTA NY–Dedicated Tax | | 5.00% | | 11/15/2033 | | AA | | | 1,540,000 | | | | 1,639,549 | |
| Niagara Frontier Trsp–Buffalo Intl Arpt AMT | | 5.00% | | 4/1/2027 | | A3 | | | 1,000,000 | | | | 1,012,199 | |
| Niagara Frontier Trsp–Buffalo Intl Arpt AMT | | 5.00% | | 4/1/2036 | | A3 | | | 850,000 | | | | 861,945 | |
| Niagara Frontier Trsp–Buffalo Intl Arpt AMT | | 5.00% | | 4/1/2038 | | A3 | | | 725,000 | | | | 731,128 | |
| Niagara Frontier Trsp–Buffalo Intl Arpt AMT | | 5.00% | | 4/1/2039 | | A3 | | | 350,000 | | | | 352,215 | |
| NY Trans Dev Corp–Delta Airlines AMT | | 4.00% | | 1/1/2036 | | Baa3 | | | 3,515,000 | | | | 3,108,477 | |
| NY Trans Dev Corp–Delta Airlines AMT | | 5.00% | | 1/1/2036 | | Baa3 | | | 2,295,000 | | | | 2,202,260 | |
| NY Trans Dev Corp–Delta Airlines AMT | | 5.00% | | 10/1/2040 | | Baa3 | | | 2,645,000 | | | | 2,484,933 | |
| NY Trans Dev Corp–JFK IAT | | 4.00% | | 12/1/2041 | | Baa1 | | | 1,000,000 | | | | 836,761 | |
| NY Trans Dev Corp–JFK IAT | | 4.00% | | 12/1/2042 | | Baa1 | | | 1,800,000 | | | | 1,481,196 | |
| NY Trans Dev Corp–JFK IAT AMT | | 4.00% | | 12/1/2039 | | Baa1 | | | 345,000 | | | | 287,471 | |
| NY Trans Dev Corp–JFK IAT AMT | | 4.00% | | 12/1/2040 | | Baa1 | | | 1,325,000 | | | | 1,092,206 | |
| NY Trans Dev Corp–JFK IAT AMT | | 4.00% | | 12/1/2041 | | Baa1 | | | 2,810,000 | | | | 2,287,172 | |
| NY Trans Dev Corp–JFK IAT AMT | | 5.00% | | 12/1/2034 | | Baa1 | | | 545,000 | | | | 539,061 | |
| NY Trans Dev Corp–JFK IAT AMT | | 5.00% | | 12/1/2039 | | Baa1 | | | 1,150,000 | | | | 1,108,220 | |
| NY Trans Dev Corp–JFK IAT AMT | | 5.00% | | 12/1/2042 | | Baa1 | | | 870,000 | | | | 830,659 | |
| NY Trans Dev Corp–LaGuardia Airport AMT | | 4.00% | | 7/1/2031 | | Baa2 | | | 2,000,000 | | | | 1,850,139 | |
| NY Trans Dev Corp–LaGuardia Airport AMT | | 4.00% | | 7/1/2046 | | Baa2 | | | 2,110,000 | | | | 1,663,820 | |
| NY Trans Dev Corp–LaGuardia Airport AMT | | 5.25% | | 1/1/2050 | | Baa2 | | | 12,280,000 | | | | 11,921,590 | |
| NY Trans Dev Corp–TOGA AMT | | 5.00% | | 1/1/2023 | | Baa3 | | | 1,500,000 | | | | 1,503,386 | |
| NY Twy Auth | | 5.00% | | 1/1/2032 | | A1 | | | 150,000 | | | | 159,849 | |
| NY Twy Auth | | 5.00% | | 1/1/2036 | | A1 | | | 1,760,000 | | | | 1,775,441 | |
| NYS Thruway–Service Area AMT | | 4.00% | | 10/31/2041 | | BBB- | (c) | | 860,000 | | | | 710,997 | |
| NYS Thruway–Service Area AMT | | 4.00% | | 10/31/2046 | | BBB- | (c) | | 1,525,000 | | | | 1,202,108 | |
| NYS Thruway–Service Area AMT | | 4.00% | | 4/30/2053 | | BBB- | (c) | | 3,335,000 | | | | 2,536,788 | |
| Port Auth NY & NJ | | 4.00% | | 7/15/2036 | | AA- | | | 2,070,000 | | | | 1,971,699 | |
| Port Auth NY & NJ AMT | | 4.00% | | 9/1/2043 | | AA- | | | 5,155,000 | | | | 4,481,430 | |
| Port Auth NY & NJ AMT | | 5.00% | | 10/15/2027 | | AA- | | | 1,485,000 | | | | 1,536,302 | |
| Port Auth NY & NJ AMT | | 5.00% | | 9/15/2028 | | AA- | | | 1,000,000 | | | | 1,046,753 | |
| Port Auth NY & NJ AMT | | 5.00% | | 9/15/2029 | | AA- | | | 250,000 | | | | 261,306 | |
| Port Auth NY & NJ AMT | | 5.00% | | 11/15/2031 | | AA- | | | 3,430,000 | | | | 3,530,194 | |
| Port Auth NY & NJ AMT | | 5.00% | | 9/1/2032 | | AA- | | | 805,000 | | | | 837,852 | |
| Port Auth NY & NJ AMT | | 5.00% | | 11/15/2032 | | AA- | | | 2,850,000 | | | | 2,903,613 | |
| Port Auth NY & NJ AMT | | 5.00% | | 9/15/2033 | | AA- | | | 2,820,000 | | | | 2,904,221 | |
| | | |
| | See Notes to Financial Statements. | 171 |
Schedule of Investments (continued)
NEW YORK TAX FREE FUND September 30, 2022
| Investments | | Interest
Rate | | Maturity
Date | | Credit
Rating:
S&P or
Moody’s(a) | | Principal
Amount | | | Fair
Value | |
| Transportation (continued) | | | | | | | | | | | | | | |
| Port Auth NY & NJ AMT | | 5.00% | | 10/15/2033 | | AA- | | $ | 1,000,000 | | | $ | 1,029,260 | |
| Port Auth NY & NJ AMT | | 5.00% | | 10/15/2033 | | AA- | | | 1,520,000 | | | | 1,580,185 | |
| Port Auth NY & NJ AMT | | 5.00% | | 9/15/2034 | | AA- | | | 1,030,000 | | | | 1,056,923 | |
| Port Auth NY & NJ AMT | | 5.00% | | 4/1/2036 | | AA- | | | 1,080,000 | | | | 1,088,496 | |
| Port Auth NY & NJ AMT | | 5.00% | | 11/15/2041 | | AA- | | | 2,000,000 | | | | 2,011,498 | |
| Port Auth NY & NJ AMT | | 5.00% | | 9/15/2048 | | AA- | | | 365,000 | | | | 360,312 | |
| Port Auth NY & NJ AMT | | 5.50% | | 8/1/2052 | | Aa3 | | | 4,000,000 | | | | 4,193,434 | |
| Triborough Brdg & Tunl Auth | | 4.00% | | 11/15/2048 | | AA- | | | 2,015,000 | | | | 1,753,485 | |
| Triborough Brdg & Tunl Auth | | 5.00% | | 11/15/2038 | | AA- | | | 1,000,000 | | | | 1,040,572 | |
| Triborough Brdg & Tunl Auth | | 5.00% | | 11/15/2047 | | AA- | | | 1,135,000 | | | | 1,165,145 | |
| Triborough Brdg & Tunl Auth | | 5.00% | | 11/15/2051 | | AA- | | | 2,500,000 | | | | 2,571,316 | |
| Triborough Brdg & Tunl Auth | | 5.50% | | 11/15/2057 | | AA- | | | 2,000,000 | | | | 2,145,207 | |
| Total | | | | | | | | | | | | | 109,947,188 | |
| | | | | | | | | | | | | | | |
| Utilities 7.17% | | | | | | | | | | | | | | |
| Buffalo Muni Wtr Fin Auth (AGM) | | 5.00% | | 7/1/2043 | | AA | | | 600,000 | | | | 624,929 | |
| Buffalo Muni Wtr Fin Auth (AGM) | | 5.00% | | 7/1/2048 | | AA | | | 1,750,000 | | | | 1,813,434 | |
| Guam Waterworks | | 5.00% | | 7/1/2036 | | A- | | | 400,000 | | | | 407,870 | |
| Guam Waterworks | | 5.00% | | 1/1/2050 | | A- | | | 600,000 | | | | 601,619 | |
| Long Island Power Auth | | 4.00% | | 9/1/2038 | | A | | | 1,500,000 | | | | 1,374,890 | |
| Long Island Power Auth | | 4.00% | | 9/1/2039 | | A | | | 1,050,000 | | | | 955,978 | |
| Long Island Power Auth | | 5.00% | | 9/1/2034 | | A | | | 2,000,000 | | | | 2,040,259 | |
| Long Island Power Auth | | 5.00% | | 9/1/2039 | | A | | | 1,000,000 | | | | 1,015,526 | |
| Long Island Power Auth | | 5.00% | | 9/1/2047 | | A | | | 1,115,000 | | | | 1,136,942 | |
| Long Island Power Auth (AGC) | | 5.25% | | 9/1/2029 | | AA | | | 2,000,000 | | | | 2,225,149 | |
| NYC Muni Water | | 4.00% | | 6/15/2049 | | AA+ | | | 2,985,000 | | | | 2,665,450 | |
| NYC Muni Water | | 5.00% | | 6/15/2035 | | AA+ | | | 1,550,000 | | | | 1,563,435 | |
| NYC Muni Water | | 5.00% | | 6/15/2035 | | AA+ | | | 1,675,000 | | | | 1,709,123 | |
| NYC Muni Water | | 5.00% | | 6/15/2036 | | AA+ | | | 1,750,000 | | | | 1,784,205 | |
| NYC Muni Water | | 5.00% | | 6/15/2036 | | AA+ | | | 2,250,000 | | | | 2,293,978 | |
| NYC Muni Water | | 5.00% | | 6/15/2046 | | AA+ | | | 3,140,000 | | | | 3,217,073 | |
| NYC Muni Water | | 5.00% | | 6/15/2048 | | AA+ | | | 1,675,000 | | | | 1,714,915 | |
| NYC Muni Water | | 5.25% | | 6/15/2037 | | AA+ | | | 1,500,000 | | | | 1,577,979 | |
| NYC Muni Water | | 5.25% | | 6/15/2047 | | AA+ | | | 1,000,000 | | | | 1,040,586 | |
| PR Aqueduct & Swr Auth† | | 5.00% | | 7/1/2030 | | NR | | | 500,000 | | | | 491,043 | |
| PR Elec Pwr Auth(e) | | 5.75% | | 7/1/2036 | | NR | | | 1,250,000 | | | | 940,625 | |
| Total | | | | | | | | | | | | | 31,195,008 | |
| Total Municipal Bonds (cost $482,933,655) | | | | | | | | | | | | | 428,512,417 | |
| | |
| 172 | See Notes to Financial Statements. |
Schedule of Investments (continued)
NEW YORK TAX FREE FUND September 30, 2022
| Investments | | Interest
Rate# | | Interest
Rate
Reset
Date(f) | | Final
Maturity
Date | | Credit
Rating:
S&P or
Moody’s(a) | | Principal
Amount | | | Fair
Value | |
| SHORT-TERM INVESTMENTS 0.46% | | | | | | | | | | | | | | |
| | | | | | | | | | | | | | | |
| VARIABLE RATE DEMAND NOTES 0.46% | | | | | | | | | | | | | | |
| | | | | | | | | | | | | | | |
| General Obligation 0.14% | | | | | | | | | | | | | | |
| NYC GO | | 2.750% | | 9/30/2022 | | 6/1/2044 | | AA | | $ | 600,000 | | | $ | 600,000 | |
| | | | | | | | | | | | | | | | | |
| Tax Revenue 0.32% | | | | | | | | | | | | | | | | |
| NYC TFA–Future Tax | | 2.750% | | 9/30/2022 | | 5/1/2034 | | AAA | | | 1,400,000 | | | | 1,400,000 | |
| Total Short-Term Investments (cost $2,000,000) | | | | | | | | | | | | 2,000,000 | |
| Total Investments in Securities 98.97% (cost $484,933,655) | | | | | | | | | | | | 430,512,417 | |
| Other Assets and Liabilities – Net(g) 1.03% | | | | | | | | | | | | 4,496,448 | |
| Net Assets 100.00% | | | | | | | | | | | | | | $ | 435,008,865 | |
| | | |
| AGC | | Insured by–Assured Guarantee Corp. |
| AGM | | Insured by–Assured Guaranty Municipal Corporation. |
| AMT | | Income from the security may be subject to Alternative Minimum Tax. |
| BAM | | Insured by–Build America Mutual. |
| CPI | | Consumer Price Index: Rate fluctuates based on CPI. |
| FGIC | | Insured by–Financial Guaranty Insurance Company. |
| FHA | | Insured by–Federal Housing Administration. |
| NR | | Not Rated. |
| TRIPS | | Tax Refund Intercept Programs. |
| † | | Security was purchased pursuant to Rule 144A under the Securities Act of 1933 and, unless registered under such Act or exempted from registration, may only be resold to qualified institutional buyers. At September 30, 2022, the total value of Rule 144A securities was $20,957,996, which represents 4.82% of net assets. |
| # | | Variable rate security. The interest rate represents the rate in effect at September 30, 2022. |
| (a) | | Unaudited. |
| (b) | | Variable Rate is Fixed to Float: Rate remains fixed or at Zero Coupon until designated future date. |
| (c) | | This investment has been rated by Fitch IBCA. |
| (d) | | Level 3 Investment as described in Note 2(i) in the Notes to Financials. Security valued utilizing third party pricing information without adjustment. Such valuations are based on unobservable inputs. A significant change in third party information could result in a significantly lower or higher value of such Level 3 investments. |
| (e) | | Defaulted (non-income producing security). |
| (f) | | The interest rate reset date shown represents the date in which the Fund has the right to sell a Variable Rate Demand Note (“VRDN”) back to the issuer for Principal Amount. The interest rate on the VRDN is generally reset daily based on the SIFMA Municipal Swap Index. |
| (g) | | Other Assets and Liabilities–Net include net unrealized appreciation/depreciation on futures contracts as follows: |
Futures Contracts at September 30, 2022:
| Type | | Expiration | | Contracts | | Position | | Notional
Amount | | Notional
Value | | Unrealized
Appreciation |
| U.S. Long Bond | | December 2022 | | 42 | | Short | | $(5,759,169 | ) | $(5,309,062 | ) | $450,107 |
| | | |
| | See Notes to Financial Statements. | 173 |
Schedule of Investments (concluded)
NEW YORK TAX FREE FUND September 30, 2022
The following is a summary of the inputs used as of September 30, 2022 in valuing the Fund’s investments carried at fair value(1):
| Investment Type(2) | | Level 1 | | | Level 2 | | | Level 3 | | | Total | |
| Long-Term Investments | | | | | | | | | | | | | | | | |
| Municipal Bonds | | | | | | | | | | | | | | | | |
| Health Care | | $ | – | | | $ | 48,997,893 | | | $ | 920,233 | | | $ | 49,918,126 | |
| Housing | | | – | | | | 2,975,630 | | | | 980,258 | | | | 3,955,888 | |
| Remaining Industries | | | – | | | | 374,638,403 | | | | – | | | | 374,638,403 | |
| Short-Term Investments | | | | | | | | | | | | | | | | |
| Variable Rate Demand Notes | | | – | | | | 2,000,000 | | | | – | | | | 2,000,000 | |
| Total | | $ | – | | | $ | 428,611,926 | | | $ | 1,900,491 | | | $ | 430,512,417 | |
| | | | | | | | | | | | | | | | | |
| Other Financial Instruments | | | | | | | | | | | | | | | | |
| Futures Contracts | | | | | | | | | | | | | | | | |
| Assets | | $ | 450,107 | | | $ | – | | | $ | – | | | $ | 450,107 | |
| Liabilities | | | – | | | | – | | | | – | | | | – | |
| Total | | $ | 450,107 | | | $ | – | | | $ | – | | | $ | 450,107 | |
| | | |
| (1) | | Refer to Note 2(i) for a description of fair value measurements and the three-tier hierarchy of inputs. |
| (2) | | See Schedule of Investments for fair values in each industry. The table above is presented by Investment Type. Industries are presented within an Investment Type should such Investment Type include securities classified as two or more levels within the three-tier fair value hierarchy. When applicable each Level 3 security is identified on the Schedule of Investments along with the valuation technique utilized. |
A reconciliation of Level 3 investments is presented when the Fund has a material amount of Level 3 investments at the beginning or end of the year in relation to the Fund’s net assets. Management has determined not to provide a reconciliation as the balance of Level 3 investments was not considered to be material to the Fund’s net assets at the beginning or end of the year.
| 174 | See Notes to Financial Statements. |
This page is intentionally left blank.
175
Statements of Assets and Liabilities
September 30, 2022
| | | Short Duration | | | Intermediate | | | National | |
| ASSETS: | | | | | | | | | | | | |
| Investments in securities, at cost | | $ | 2,113,943,302 | | | $ | 5,393,967,821 | | | $ | 3,759,915,107 | |
| Investments in securities, at fair value | | $ | 2,024,561,538 | | | $ | 4,963,436,760 | | | $ | 3,399,606,222 | |
| Cash | | | 27,869,751 | | | | 64,791,797 | | | | 2,153,991 | |
| Deposits with brokers for futures collateral | | | – | | | | 1,945,638 | | | | 1,546,600 | |
| Receivables: | | | | | | | | | | | | |
| Interest | | | 17,978,036 | | | | 62,755,491 | | | | 45,181,319 | |
| Investment securities sold | | | 6,084,553 | | | | 30,498,523 | | | | 27,958,846 | |
| Capital shares sold | | | 7,790,726 | | | | 17,837,450 | | | | 18,483,502 | |
| From advisor (See Note 3) | | | 33,450 | | | | – | | | | – | |
| Variation margin for futures contracts | | | – | | | | 336,631 | | | | 267,747 | |
| Prepaid expenses and other assets | | | 48,313 | | | | 109,426 | | | | 109,283 | |
| Total assets | | | 2,084,366,367 | | | | 5,141,711,716 | | | | 3,495,307,510 | |
| LIABILITIES: | | | | | | | | | | | | |
| Payables: | | | | | | | | | | | | |
| Capital shares reacquired | | | 8,862,827 | | | | 16,652,750 | | | | 11,849,644 | |
| Management fee | | | 591,554 | | | | 1,654,566 | | | | 1,130,775 | |
| Directors' fees | | | 285,972 | | | | 670,068 | | | | 517,251 | |
| 12b-1 distribution plan | | | 218,928 | | | | 766,240 | | | | 607,608 | |
| Fund administration | | | 69,835 | | | | 172,655 | | | | 115,141 | |
| Investment securities purchased | | | – | | | | 61,662,035 | | | | 35,101,438 | |
| Trust certificates (See Note 2) | | | – | | | | – | | | | 57,235,000 | |
| Interest expense and fees | | | – | | | | – | | | | 297,042 | |
| Distributions payable | | | 2,904,452 | | | | 11,117,843 | | | | 9,196,596 | |
| Accrued expenses | | | 260,924 | | | | 1,000,428 | | | | 599,285 | |
| Total liabilities | | | 13,194,492 | | | | 93,696,585 | | | | 116,649,780 | |
| Commitments and contingent liabilities | | | | | | | | | | | | |
| NET ASSETS | | $ | 2,071,171,875 | | | $ | 5,048,015,131 | | | $ | 3,378,657,730 | |
| COMPOSITION OF NET ASSETS: | | | | | | | | | | | | |
| Paid-in capital | | $ | 2,210,909,540 | | | $ | 5,684,033,084 | | | $ | 3,942,877,257 | |
| Total distributable earnings (loss) | | | (139,737,665 | ) | | | (636,017,953 | ) | | | (564,219,527 | ) |
| Net Assets | | $ | 2,071,171,875 | | | $ | 5,048,015,131 | | | $ | 3,378,657,730 | |
| | | |
| 176 | See Notes to Financial Statements. | |
| High Income | | | Short Duration
High Income | | | Sustainable | | | California | | | New Jersey | | | New York | |
| | | | | | | | | | | | | | | | | | | | | | | |
| $ | 3,914,937,768 | | | $ | 920,248,768 | | | $ | 4,433,394 | | | $ | 491,698,039 | | | $ | 114,498,688 | | | $ | 484,933,655 | |
| $ | 3,389,491,174 | | | $ | 856,154,143 | | | $ | 4,114,851 | | | $ | 442,879,715 | | | $ | 100,908,044 | | | $ | 430,512,417 | |
| | 22,122,112 | | | | 10,351,351 | | | | 383,802 | | | | 6,143,739 | | | | 1,336,949 | | | | 1,340,535 | |
| | 2,097,600 | | | | 1,688,000 | | | | – | | | | 414,200 | | | | 38,000 | | | | 159,600 | |
| | | | | | | | | | | | | | | | | | | | | | | |
| | 48,482,852 | | | | 11,366,719 | | | | 57,070 | | | | 5,634,991 | | | | 1,253,910 | | | | 5,456,880 | |
| | 20,291,072 | | | | 455,000 | | | | – | | | | 4,708,594 | | | | – | | | | 1,149,912 | |
| | 17,805,604 | | | | 5,547,677 | | | | 100 | | | | 2,753,866 | | | | 231,699 | | | | 1,836,958 | |
| | – | | | | 76,502 | | | | 6,887 | | | | – | | | | 4,681 | | | | – | |
| | 362,912 | | | | 169,476 | | | | – | | | | 71,700 | | | | 6,588 | | | | 27,771 | |
| | 83,116 | | | | 55,570 | | | | 7,668 | | | | 21,616 | | | | 15,370 | | | | 20,589 | |
| | 3,500,736,442 | | | | 885,864,438 | | | | 4,570,378 | | | | 462,628,421 | | | | 103,795,241 | | | | 440,504,662 | |
| | | | | | | | | | | | | | | | | | | | | | | |
| | 17,426,600 | | | | 3,589,820 | | | | 41 | | | | 1,732,121 | | | | 1,929,185 | | | | 1,804,267 | |
| | 1,310,446 | | | | 304,676 | | | | 1,197 | | | | 173,727 | | | | 39,554 | | | | 167,147 | |
| | 413,840 | | | | 47,602 | | | | 90 | | | | 88,094 | | | | 25,939 | | | | 88,467 | |
| | 430,965 | | | | 89,348 | | | | 604 | | | | 79,067 | | | | 21,339 | | | | 95,067 | |
| | 118,716 | | | | 30,468 | | | | 150 | | | | 15,442 | | | | 3,516 | | | | 14,858 | |
| | 28,586,033 | | | | 1,514,273 | | | | – | | | | 5,222,664 | | | | – | | | | 2,178,191 | |
| | 33,820,000 | | | | – | | | | – | | | | – | | | | – | | | | – | |
| | 138,735 | | | | – | | | | – | | | | – | | | | – | | | | – | |
| | 11,374,306 | | | | 2,396,690 | | | | 8,952 | | | | 1,106,025 | | | | 249,566 | | | | 1,062,977 | |
| | 831,926 | | | | 323,831 | | | | 19,161 | | | | 81,656 | | | | 30,427 | | | | 84,823 | |
| | 94,451,567 | | | | 8,296,708 | | | | 30,195 | | | | 8,498,796 | | | | 2,299,526 | | | | 5,495,797 | |
| | | | | | | | | | | | | | | | | | | | | | | |
| $ | 3,406,284,875 | | | $ | 877,567,730 | | | $ | 4,540,183 | | | $ | 454,129,625 | | | $ | 101,495,715 | | | $ | 435,008,865 | |
| | | | | | | | | | | | | | | | | | | | | | | |
| $ | 4,227,374,356 | | | $ | 1,015,776,313 | | | $ | 5,146,290 | | | $ | 522,249,248 | | | $ | 116,249,880 | | | $ | 500,912,166 | |
| | (821,089,481 | ) | | | (138,208,583 | ) | | | (606,107 | ) | | | (68,119,623 | ) | | | (14,754,165 | ) | | | (65,903,301 | ) |
| $ | 3,406,284,875 | | | $ | 877,567,730 | | | $ | 4,540,183 | | | $ | 454,129,625 | | | $ | 101,495,715 | | | $ | 435,008,865 | |
| | | |
| | See Notes to Financial Statements. | 177 |
Statements of Assets and Liabilities (concluded)
September 30, 2022
| | | Short Duration | | | Intermediate | | | National | |
| | | | | | | | | | | | | |
| Net Assets by class: | | | | | | | | | | | | |
| Class A Shares | | $ | 875,792,294 | | | $ | 2,075,394,450 | | | $ | 2,235,687,419 | |
| Class C Shares | | $ | 23,284,325 | | | $ | 123,237,773 | | | $ | 83,742,955 | |
| Class F Shares | | $ | 246,973,949 | | | $ | 522,922,268 | | | $ | 222,942,388 | |
| Class F3 Shares | | $ | 361,359,060 | | | $ | 194,787,457 | | | $ | 268,560,144 | |
| Class I Shares | | $ | 563,762,247 | | | $ | 2,131,673,183 | | | $ | 567,724,824 | |
| Outstanding shares by class*: | | | | | | | | | | | | |
| Class A Shares | | | 59,238,153 | | | | 213,634,492 | | | | 227,354,719 | |
| Class C Shares | | | 1,575,006 | | | | 12,701,201 | | | | 8,507,661 | |
| Class F Shares | | | 16,703,718 | | | | 53,854,342 | | | | 22,694,070 | |
| Class F3 Shares | | | 24,433,240 | | | | 20,040,822 | | | | 27,324,334 | |
| Class I Shares | | | 38,119,918 | | | | 219,440,392 | | | | 57,764,707 | |
Net Asset Value, offering and redemption price per share
(Net assets divided by outstanding shares): | | | | | | | | | | | | |
| Class A Shares-Net asset value | | | $14.78 | | | | $9.71 | | | | $ 9.83 | |
Class A Shares-Maximum offering price
(Net asset value plus sales charge of 2.25%) | | | $15.12 | | | | $9.93 | | | | $10.06 | |
| Class C Shares-Net asset value | | | $14.78 | | | | $9.70 | | | | $ 9.84 | |
| Class F Shares-Net asset value | | | $14.79 | | | | $9.71 | | | | $ 9.82 | |
| Class F3 Shares-Net asset value | | | $14.79 | | | | $9.72 | | | | $ 9.83 | |
| Class I Shares-Net asset value | | | $14.79 | | | | $9.71 | | | | $ 9.83 | |
| * | Lord Abbett Municipal Income Fund, Inc. has 11,757,501,500 authorized shares of capital stock (par value $.001), which are designated as follows: 1,950,001,500 to Short Duration, 2,445,000,000 to Intermediate, 1,250,000,000 to National, 1,987,500,000 to High Income, 1,950,000,000 to Short Duration High Income, 750,000,000 to Sustainable, 450,000,000 to California, 525,000,000 to New Jersey and 450,000,000 to New York (As of September 30, 2022). |
| | | |
| 178 | See Notes to Financial Statements. | |
| High Income | | | Short Duration
High Income | | | Sustainable | | | California | | | New Jersey | | | New York | |
| | | | | | | | | | | | | | | | | | | | | | | |
| $ | 1,787,225,346 | | | $ | 325,756,084 | | | $ | 2,681,989 | | | $ | 303,455,215 | | | $ | 80,854,286 | | | $ | 322,137,886 | |
| $ | 174,126,586 | | | $ | 21,391,899 | | | $ | 65,956 | | | $ | 21,220,645 | | | $ | – | | | $ | 20,926,824 | |
| $ | 369,471,325 | | | $ | 139,298,881 | | | $ | 65,954 | | | $ | 20,963,565 | | | $ | 5,884,596 | | | $ | 19,359,951 | |
| $ | 114,133,911 | | | $ | 28,250,726 | | | $ | 87,938 | | | $ | 29,694,422 | | | $ | 1,342,245 | | | $ | 2,364,071 | |
| $ | 961,327,707 | | | $ | 362,870,140 | | | $ | 1,638,346 | | | $ | 78,795,778 | | | $ | 13,414,588 | | | $ | 70,220,133 | |
| | | | | | | | | | | | | | | | | | | | | | | |
| | 174,866,922 | | | | 23,533,947 | | | | 304,984 | | | | 31,932,002 | | | | 18,306,790 | | | | 32,535,832 | |
| | 17,031,563 | | | | 1,545,203 | | | | 7,500 | | | | 2,232,038 | | | | – | | | | 2,116,269 | |
| | 36,124,106 | | | | 10,063,245 | | | | 7,500 | | | | 2,205,688 | | | | 1,332,469 | | | | 1,953,876 | |
| | 11,188,719 | | | | 2,040,725 | | | | 10,000 | | | | 3,125,905 | | | | 303,530 | | | | 238,669 | |
| | 94,221,343 | | | | 26,209,909 | | | | 186,311 | | | | 8,296,982 | | | | 3,034,223 | | | | 7,088,744 | |
| | | | | | | | | | | | | | | | | | | | | | | |
| | $10.22 | | | | $13.84 | | | | $8.79 | | | | $9.50 | | | | $4.42 | | | | $ 9.90 | |
| | | | | | | | | | | | | | | | | | | | | | | |
| | $10.46 | | | | $14.16 | | | | $8.99 | | | | $9.72 | | | | $4.52 | | | | $10.13 | |
| | $10.22 | | | | $13.84 | | | | $8.79 | | | | $9.51 | | | | $ – | | | | $ 9.89 | |
| | $10.23 | | | | $13.84 | | | | $8.79 | | | | $9.50 | | | | $4.42 | | | | $ 9.91 | |
| | $10.20 | | | | $13.84 | | | | $8.79 | | | | $9.50 | | | | $4.42 | | | | $ 9.91 | |
| $10.20 | | | | $13.84 | | | | $8.79 | | | | $9.50 | | | | $4.42 | | | | $ 9.91 | |
| | | |
| | See Notes to Financial Statements. | 179 |
Statements of Operations
For the Period Ended September 30, 2022
| | | Short Duration | | | Intermediate | | | National | |
| Investment income: | | | | | | | | | | | | |
| Interest and other | | $ | 36,786,347 | | | $ | 170,085,738 | | | $ | 138,408,895 | |
| Interest earned from Interfund Lending (See Note 11) | | | – | | | | – | | | | 1,958 | |
| Total investment income | | | 36,786,347 | | | | 170,085,738 | | | | 138,410,853 | |
| Expenses: | | | | | | | | | | | | |
| Management fee | | | 7,550,075 | | | | 22,890,553 | | | | 15,894,634 | |
| 12b-1 distribution plan–Class A | | | 1,957,134 | | | | 4,875,905 | | | | 5,345,589 | |
| 12b-1 distribution plan–Class C | | | 226,264 | | | | 1,339,050 | | | | 949,013 | |
| 12b-1 distribution plan–Class F | | | 485,193 | | | | 1,815,642 | | | | 660,472 | |
| Shareholder servicing | | | 1,001,823 | | | | 4,193,446 | | | | 2,104,511 | |
| Fund administration | | | 893,759 | | | | 2,416,063 | | | | 1,645,101 | |
| Registration | | | 257,704 | | | | 393,593 | | | | 342,668 | |
| Professional | | | 84,459 | | | | 146,901 | | | | 96,676 | |
| Reports to shareholders | | | 76,498 | | | | 321,310 | | | | 205,927 | |
| Directors’ fees | | | 54,225 | | | | 146,522 | | | | 100,381 | |
| Custody | | | 25,798 | | | | 69,196 | | | | 51,537 | |
| Interest expense and fees (See Note 2(h) | | | – | | | | – | | | | 336,106 | |
| Interest paid from Interfund Lending (See Note 11) | | | – | | | | – | | | | – | |
| Market Data | | | – | | | | – | | | | – | |
| Other | | | 82,051 | | | | 130,391 | | | | 109,689 | |
| Gross expenses | | | 12,694,983 | | | | 38,738,572 | | | | 27,842,304 | |
| Expense reductions (See Note 9) | | | (10,500 | ) | | | (30,563 | ) | | | (19,824 | ) |
| Fees waived and expenses reimbursed (See Note 3) | | | (99,772 | ) | | | (69,196 | ) | | | (51,537 | ) |
| Net expenses | | | 12,584,711 | | | | 38,638,813 | | | | 27,770,943 | |
| Net investment income | | | 24,201,636 | | | | 131,446,925 | | | | 110,639,910 | |
| Net realized and unrealized gain (loss): | | | | | | | | | | | | |
| Net realized gain (loss) on investments | | | (22,970,656 | ) | | | (150,033,751 | ) | | | (165,011,159 | ) |
| Net realized gain (loss) on futures contracts | | | – | | | | (2,392,155 | ) | | | 395,810 | |
| Net change in unrealized appreciation/depreciation on investments | | | (129,113,613 | ) | | | (776,627,878 | ) | | | (661,607,525 | ) |
| Net change in unrealized appreciation/depreciation on futures contracts | | | – | | | | 5,391,392 | | | | 3,924,740 | |
| Net realized and unrealized gain (loss) | | | (152,084,269 | ) | | | (923,662,392 | ) | | | (822,298,134 | ) |
| Net Decrease in Net Assets Resulting From Operations | | $ | (127,882,633 | ) | | $ | (792,215,467 | ) | | $ | (711,658,224 | ) |
| (a) | For the period January 5, 2022, commencement of operations, to September 30, 2022. |
| | | |
| 180 | See Notes to Financial Statements. | |
| High Income | | | Short Duration
High Income | | | Sustainable(a) | | | California | | | New Jersey | | | New York | |
| | | | | | | | | | | | | | | | | | | | | | | |
| $ | 172,116,508 | | | $ | 33,109,882 | | | $ | 73,395 | | | $ | 16,757,585 | | | $ | 3,956,662 | | | $ | 15,685,594 | |
| | 1,902 | | | | 860 | | | | – | | | | – | | | | – | | | | – | |
| | 172,118,410 | | | | 33,110,742 | | | | 73,395 | | | | 16,757,585 | | | | 3,956,662 | | | | 15,685,594 | |
| | | | | | | | | | | | | | | | | | | | | | | |
| | 18,555,563 | | | | 4,500,262 | | | | 11,125 | | | | 2,391,938 | | | | 555,178 | | | | 2,226,676 | |
| | 4,393,018 | | | | 786,104 | | | | 4,188 | | | | 681,622 | | | | 186,550 | | | | 712,583 | |
| | 1,940,475 | | | | 235,814 | | | | 518 | | | | 232,548 | | | | – | | | | 232,988 | |
| | 993,481 | | | | 342,386 | | | | 52 | | | | 80,276 | | | | 17,780 | | | | 48,453 | |
| | 2,604,341 | | | | 927,638 | | | | 1,972 | | | | 193,545 | | | | 59,758 | | | | 223,762 | |
| | 1,705,556 | | | | 450,026 | | | | 1,391 | | | | 212,617 | | | | 49,349 | | | | 197,927 | |
| | 443,850 | | | | 239,596 | | | | 11,723 | | | | 75,345 | | | | 56,526 | | | | 71,022 | |
| | 56,533 | | | | 77,606 | | | | 32,086 | | | | 52,374 | | | | 41,067 | | | | 52,738 | |
| | 196,889 | | | | 39,940 | | | | 2,027 | | | | 17,721 | | | | 6,385 | | | | 16,405 | |
| | 103,901 | | | | 26,951 | | | | 152 | | | | 13,095 | | | | 3,031 | | | | 12,046 | |
| | 47,341 | | | | 23,660 | | | | 2,250 | | | | 8,836 | | | | 1,161 | | | | 7,478 | |
| | 150,491 | | | | – | | | | – | | | | – | | | | – | | | | – | |
| | 286 | | | | – | | | | – | | | | – | | | | – | | | | – | |
| | – | | | | – | | | | 5,059 | | | | – | | | | – | | | | – | |
| | 222,719 | | | | 127,291 | | | | 205 | | | | 69,105 | | | | 19,691 | | | | 62,270 | |
| | 31,414,444 | | | | 7,777,274 | | | | 72,748 | | | | 4,029,022 | | | | 996,476 | | | | 3,864,348 | |
| | (21,444 | ) | | | (5,596 | ) | | | (26 | ) | | | (2,627 | ) | | | (648 | ) | | | (2,664 | ) |
| | (47,341 | ) | | | (802,314 | ) | | | (53,042 | ) | | | (8,836 | ) | | | (27,110 | ) | | | (7,478 | ) |
| | 31,345,659 | | | | 6,969,364 | | | | 19,680 | | | | 4,017,559 | | | | 968,718 | | | | 3,854,206 | |
| | 140,772,751 | | | | 26,141,378 | | | | 53,715 | | | | 12,740,026 | | | | 2,987,944 | | | | 11,831,388 | |
| | | | | | | | | | | | | | | | | | | | | | | |
| | (170,405,037 | ) | | | (67,289,895 | ) | | | (289,439 | ) | | | (18,582,182 | ) | | | (1,210,543 | ) | | | (7,281,313 | ) |
| | 2,159,294 | | | | 10,075,434 | | | | – | | | | 36,419 | | | | (21,888 | ) | | | (91,580 | ) |
| | | | | | | | | | | | | | | | | | | | | | | |
| | (808,338,862 | ) | | | (100,448,453 | ) | | | (318,543 | ) | | | (85,809,256 | ) | | | (21,595,747 | ) | | | (88,182,880 | ) |
| | | | | | | | | | | | | | | | | | | | | | | |
| | 5,055,472 | | | | 2,022,916 | | | | – | | | | 527,571 | | | | 107,168 | | | | 450,107 | |
| | (971,529,133 | ) | | | (155,639,998 | ) | | | (607,982 | ) | | | (103,827,448 | ) | | | (22,721,010 | ) | | | (95,105,666 | ) |
| | | | | | | | | | | | | | | | | | | | | | | |
| $ | (830,756,382 | ) | | $ | (129,498,620 | ) | | $ | (554,267 | ) | | $ | (91,087,422 | ) | | $ | (19,733,066 | ) | | $ | (83,274,278 | ) |
| | | |
| | See Notes to Financial Statements. | 181 |
Statements of Changes in Net Assets
| | | Short Duration | |
| INCREASE (DECREASE) IN NET ASSETS | | For the
Year Ended
September 30, 2022 | | | For the
Year Ended
September 30, 2021 | |
| Operations: | | | | | | | | |
| Net investment income | | $ | 24,201,636 | | | $ | 21,690,576 | |
| Net realized gain (loss) on investments and futures contracts | | | (22,970,656 | ) | | | 1,875,230 | |
| Net change in unrealized appreciation/depreciation on investments and futures contracts | | | (129,113,613 | ) | | | 2,102,805 | |
| Net increase (decrease) in net assets resulting from operations | | | (127,882,633 | ) | | | 25,668,611 | |
| Distributions to shareholders:(1) | | | | | | | | |
| Class A | | | (9,685,207 | ) | | | (9,353,549 | ) |
| Class C | | | (94,961 | ) | | | (108,638 | ) |
| Class F | | | (4,881,413 | ) | | | (6,642,848 | ) |
| Class F3 | | | (4,336,314 | ) | | | (3,255,626 | ) |
| Class I | | | (5,165,908 | ) | | | (2,247,704 | ) |
| Total distributions to shareholders | | | (24,163,803 | ) | | | (21,608,365 | ) |
| Capital share transactions (Net of share conversions) (See Note 15): | | | | | | | | |
| Net proceeds from sales of shares | | | 1,763,864,555 | | | | 1,234,520,763 | |
| Reinvestment of distributions | | �� | 16,863,725 | | | | 14,428,863 | |
| Cost of shares reacquired | | | (1,931,244,877 | ) | | | (825,977,848 | ) |
| Net increase (decrease) in net assets resulting from capital share transactions | | | (150,516,597 | ) | | | 422,971,778 | |
| Net increase (decrease) in net assets | | | (302,563,033 | ) | | | 427,032,024 | |
| NET ASSETS: | | | | | | | | |
| Beginning of year | | $ | 2,373,734,908 | | | $ | 1,946,702,884 | |
| End of year | | $ | 2,071,171,875 | | | $ | 2,373,734,908 | |
| (1) | Refer to Note 4 in the Notes to Financial Statements for the tax character of distributions. |
| | | |
| 182 | See Notes to Financial Statements. | |
| Intermediate | | | National | |
For the
Year Ended
September 30, 2022 | | | For the
Year Ended
September 30, 2021 | | | For the
Year Ended
September 30, 2022 | | | For the
Year Ended
September 30, 2021 | |
| | | | | | | | | | | | | | | |
| $ | 131,446,925 | | | $ | 133,822,931 | | | $ | 110,639,910 | | | $ | 109,417,557 | |
| | (152,425,906 | ) | | | 10,423,459 | | | | (164,615,349 | ) | | | 8,805,585 | |
| | | | | | | | | | | | | | | |
| | (771,236,486 | ) | | | 91,499,934 | | | | (657,682,785 | ) | | | 107,516,505 | |
| | (792,215,467 | ) | | | 235,746,324 | | | | (711,658,224 | ) | | | 225,739,647 | |
| | | | | | | | | | | | | | | |
| | (51,244,377 | ) | | | (52,904,456 | ) | | | (70,690,253 | ) | | | (70,612,678 | ) |
| | (2,324,854 | ) | | | (3,095,954 | ) | | | (2,256,462 | ) | | | (2,656,051 | ) |
| | (38,501,878 | ) | | | (54,041,532 | ) | | | (17,459,525 | ) | | | (24,745,249 | ) |
| | (4,596,185 | ) | | | (2,853,506 | ) | | | (8,742,056 | ) | | | (5,675,458 | ) |
| | (34,327,561 | ) | | | (20,432,894 | ) | | | (10,879,330 | ) | | | (5,166,364 | ) |
| | (130,994,855 | ) | | | (133,328,342 | ) | | | (110,027,626 | ) | | | (108,855,800 | ) |
| | | | | | | | | | | | | | | |
| | 3,855,743,096 | | | | 2,130,946,683 | | | | 1,818,078,604 | | | | 1,311,879,683 | |
| | 99,272,234 | | | | 102,179,642 | | | | 99,822,938 | | | | 96,592,669 | |
| | (4,596,451,995 | ) | | | (1,274,383,334 | ) | | | (2,261,223,177 | ) | | | (791,862,843 | ) |
| | | | | | | | | | | | | | | |
| | (641,436,665 | ) | | | 958,742,991 | | | | (343,321,635 | ) | | | 616,609,509 | |
| | (1,564,646,987 | ) | | | 1,061,160,973 | | | | (1,165,007,485 | ) | | | 733,493,356 | |
| | | | | | | | | | | | | | | |
| $ | 6,612,662,118 | | | $ | 5,551,501,145 | | | $ | 4,543,665,215 | | | $ | 3,810,171,859 | |
| $ | 5,048,015,131 | | | $ | 6,612,662,118 | | | $ | 3,378,657,730 | | | $ | 4,543,665,215 | |
| | | |
| | See Notes to Financial Statements. | 183 |
Statements of Changes in Net Assets (continued)
| | | High Income | |
| INCREASE (DECREASE) IN NET ASSETS | | For the
Year Ended
September 30, 2022 | | | For the
Year Ended
September 30, 2021 | |
| Operations: | | | | | | | | |
| Net investment income | | $ | 140,772,751 | | | $ | 130,737,590 | |
| Net realized gain (loss) on investments and futures contracts | | | (168,245,743 | ) | | | 17,380,187 | |
| Net change in unrealized appreciation/depreciation on investments and futures contracts | | | (803,283,390 | ) | | | 198,093,781 | |
| Net increase (decrease) in net assets resulting from operations | | | (830,756,382 | ) | | | 346,211,558 | |
| Distributions to shareholders:(1) | | | | | | | | |
| Class A | | | (71,083,164 | ) | | | (67,473,878 | ) |
| Class C | | | (5,926,875 | ) | | | (6,499,258 | ) |
| Class F | | | (32,027,041 | ) | | | (38,742,384 | ) |
| Class F3 | | | (4,432,261 | ) | | | (2,761,669 | ) |
| Class I | | | (25,551,036 | ) | | | (13,541,719 | ) |
| Total distributions to shareholders | | | (139,020,377 | ) | | | (129,018,908 | ) |
| Capital share transactions (Net of share conversions) (See Note 15): | | | | | | | | |
| Net proceeds from sales of shares | | | 2,559,922,817 | | | | 1,995,623,133 | |
| Reinvestment of distributions | | | 121,604,651 | | | | 112,416,715 | |
| Cost of shares reacquired | | | (3,018,619,337 | ) | | | (895,073,879 | ) |
| Net increase (decrease) in net assets resulting from capital share transactions | | | (337,091,869 | ) | | | 1,212,965,969 | |
| Net increase (decrease) in net assets | | | (1,306,868,628 | ) | | | 1,430,158,619 | |
| NET ASSETS: | | | | | | | | |
| Beginning of period | | $ | 4,713,153,503 | | | $ | 3,282,994,884 | |
| End of period | | $ | 3,406,284,875 | | | $ | 4,713,153,503 | |
| (1) | Refer to Note 4 in the Notes to Financial Statements for the tax character of distributions. |
| (2) | For the period January 5, 2022, commencement of operations, to September 30, 2022. |
| | | |
| 184 | See Notes to Financial Statements. | |
| Short Duration High Income | | | Sustainable | |
For the
Year Ended
September 30, 2022 | | | For the
Year Ended
September 30, 2021 | | | For the
Period Ended
September 30, 2022(2) | |
| | | | | | | | | | | |
| $ | 26,141,378 | | | $ | 17,939,072 | | | $ | 53,715 | |
| | (57,214,461 | ) | | | (807,535 | ) | | | (289,439 | ) |
| | | | | | | | | | | |
| | (98,425,537 | ) | | | 26,566,348 | | | | (318,543 | ) |
| | (129,498,620 | ) | | | 43,697,885 | | | | (554,267 | ) |
| | | | | | | | | | | |
| | (8,688,573 | ) | | | (5,978,204 | ) | | | (30,845 | ) |
| | (392,609 | ) | | | (268,418 | ) | | | (348 | ) |
| | (7,267,298 | ) | | | (7,228,491 | ) | | | (814 | ) |
| | (799,544 | ) | | | (428,019 | ) | | | (1,181 | ) |
| | (8,379,287 | ) | | | (3,663,856 | ) | | | (20,220 | ) |
| | (25,527,311 | ) | | | (17,566,988 | ) | | | (53,408 | ) |
| | | | | | | | | | | |
| | 960,334,431 | | | | 962,424,163 | | | | 5,147,500 | |
| | 24,955,977 | | | | 17,410,649 | | | | 399 | |
| | (1,159,684,331 | ) | | | (260,730,291 | ) | | | (41 | ) |
| | | | | | | | | | | |
| | (174,393,923 | ) | | | 719,104,521 | | | | 5,147,858 | |
| | (329,419,854 | ) | | | 745,235,418 | | | | 4,540,183 | |
| | | | | | | | | | | |
| $ | 1,206,987,584 | | | $ | 461,752,166 | | | $ | – | |
| $ | 877,567,730 | | | $ | 1,206,987,584 | | | $ | 4,540,183 | |
| | | |
| | See Notes to Financial Statements. | 185 |
Statements of Changes in Net Assets (concluded)
| | | California | |
| INCREASE (DECREASE) IN NET ASSETS | | For the
Year Ended
September 30, 2022 | | | For the
Year Ended
September 30, 2021 | |
| Operations: | | | | | | | | |
| Net investment income | | $ | 12,740,026 | | | $ | 13,089,857 | |
| Net realized gain (loss) on investments and futures contracts | | | (18,545,763 | ) | | | 1,617,011 | |
| Net change in unrealized appreciation/depreciation on investments and futures contracts | | | (85,281,685 | ) | | | 7,605,834 | |
| Net increase (decrease) in net assets resulting from operations | | | (91,087,422 | ) | | | 22,312,702 | |
| Distributions to shareholders:(1) | | | | | | | | |
| Class A | | | (8,047,205 | ) | | | (8,272,876 | ) |
| Class C | | | (479,633 | ) | | | (554,826 | ) |
| Class F | | | (1,872,942 | ) | | | (2,860,413 | ) |
| Class F3 | | | (635,428 | ) | | | (391,431 | ) |
| Class I | | | (1,550,729 | ) | | | (859,821 | ) |
| Total distributions to shareholders | | | (12,585,937 | ) | | | (12,939,367 | ) |
| Capital share transactions (Net of share conversions) (See Note 15): | | | | | | |
| Net proceeds from sales of shares | | | 276,101,921 | | | | 184,226,635 | |
| Reinvestment of distributions | | | 10,926,214 | | | | 11,266,767 | |
| Cost of shares reacquired | | | (333,545,364 | ) | | | (136,478,657 | ) |
| Net increase (decrease) in net assets resulting from capital share transactions | | | (46,517,229 | ) | | | 59,014,745 | |
| Net increase (decrease) in net assets | | | (150,190,588 | ) | | | 68,388,080 | |
| NET ASSETS: | | | | | | | | |
| Beginning of year | | $ | 604,320,213 | | | $ | 535,932,133 | |
| End of year | | $ | 454,129,625 | | | $ | 604,320,213 | |
| (1) | Refer to Note 4 in the Notes to Financial Statements for the tax character of distributions. |
| | | |
| 186 | See Notes to Financial Statements. | |
| New Jersey | | | New York | |
For the
Year Ended
September 30, 2022 | | | For the
Year Ended
September 30, 2021 | | | For the
Year Ended
September 30, 2022 | | | For the
Year Ended
September 30, 2021 | |
| | | | | | | | | | | | | | | |
| $ | 2,987,944 | | | $ | 2,969,340 | | | $ | 11,831,388 | | | $ | 11,411,214 | |
| | (1,232,431 | ) | | | 691,437 | | | | (7,372,893 | ) | | | 863,728 | |
| | | | | | | | | | | | | | | |
| | (21,488,579 | ) | | | 3,419,402 | | | | (87,732,773 | ) | | | 16,377,278 | |
| | (19,733,066 | ) | | | 7,080,179 | | | | (83,274,278 | ) | | | 28,652,220 | |
| | | | | | | | | | | | | | | |
| | (2,225,957 | ) | | | (2,211,761 | ) | | | (8,459,566 | ) | | | (8,330,052 | ) |
| | – | | | | – | | | | (479,877 | ) | | | (526,065 | ) |
| | (425,020 | ) | | | (599,276 | ) | | | (1,152,222 | ) | | | (1,577,541 | ) |
| | (37,239 | ) | | | (20,857 | ) | | | (61,174 | ) | | | (37,057 | ) |
| | (291,769 | ) | | | (132,198 | ) | | | (1,587,444 | ) | | | (867,441 | ) |
| | (2,979,985 | ) | | | (2,964,092 | ) | | | (11,740,283 | ) | | | (11,338,156 | ) |
| | | | | | | | | | | | | | | |
| | 36,024,111 | | | | 25,613,495 | | | | 169,981,763 | | | | 126,582,142 | |
| | 2,450,485 | | | | 2,481,365 | | | | 9,730,316 | | | | 9,345,025 | |
| | (49,773,261 | ) | | | (26,055,574 | ) | | | (189,584,632 | ) | | | (100,356,392 | ) |
| | | | | | | | | | | | | | | |
| | (11,298,665 | ) | | | 2,039,286 | | | | (9,872,553 | ) | | | 35,570,775 | |
| | (34,011,716 | ) | | | 6,155,373 | | | | (104,887,114 | ) | | | 52,884,839 | |
| | | | | | | | | | | | | | | |
| $ | 135,507,431 | | | $ | 129,352,058 | | | $ | 539,895,979 | | | $ | 487,011,140 | |
| $ | 101,495,715 | | | $ | 135,507,431 | | | $ | 435,008,865 | | | $ | 539,895,979 | |
| | | |
| | See Notes to Financial Statements. | 187 |
Financial Highlights
SHORT DURATION TAX FREE FUND
| | | | | Per Share Operating Performance: | | |
| | | | | Investment Operations: | | Distributions
to
shareholders
from: | | |
| | | Net asset
value,
beginning of
period | | Net
investment
income(a) | | Net
realized and
unrealized
gain (loss) | | Total from
investment
operations | | Net
investment
income | | Net asset
value,
end of
period |
| Class A | | | | | | | | | | | | | | | | | | | | | | | | |
| 9/30/2022 | | $ | 15.84 | | | $ | 0.15 | | | $ | (1.06 | ) | | | $(0.91 | ) | | | $(0.15 | ) | | $ | 14.78 | |
| 9/30/2021 | | | 15.80 | | | | 0.15 | | | | 0.04 | | | | 0.19 | | | | (0.15 | ) | | | 15.84 | |
| 9/30/2020 | | | 15.78 | | | | 0.24 | | | | 0.02 | | | | 0.26 | | | | (0.24 | ) | | | 15.80 | |
| 9/30/2019 | | | 15.43 | | | | 0.29 | | | | 0.34 | | | | 0.63 | | | | (0.28 | ) | | | 15.78 | |
| 9/30/2018 | | | 15.64 | | | | 0.21 | | | | (0.20 | ) | | | 0.01 | | | | (0.22 | ) | | | 15.43 | |
| Class C | | | | | | | | | | | | | | | | | | | | | | | | |
| 9/30/2022 | | | 15.84 | | | | 0.05 | | | | (1.05 | ) | | | (1.00 | ) | | | (0.06 | ) | | | 14.78 | |
| 9/30/2021 | | | 15.80 | | | | 0.05 | | | | 0.04 | | | | 0.09 | | | | (0.05 | ) | | | 15.84 | |
| 9/30/2020 | | | 15.78 | | | | 0.15 | | | | 0.01 | | | | 0.16 | | | | (0.14 | ) | | | 15.80 | |
| 9/30/2019 | | | 15.43 | | | | 0.19 | | | | 0.35 | | | | 0.54 | | | | (0.19 | ) | | | 15.78 | |
| 9/30/2018 | | | 15.64 | | | | 0.12 | | | | (0.21 | ) | | | (0.09 | ) | | | (0.12 | ) | | | 15.43 | |
| Class F | | | | | | | | | | | | | | | | | | | | | | | | |
| 9/30/2022 | | | 15.85 | | | | 0.16 | | | | (1.05 | ) | | | (0.89 | ) | | | (0.17 | ) | | | 14.79 | |
| 9/30/2021 | | | 15.80 | | | | 0.16 | | | | 0.05 | | | | 0.21 | | | | (0.16 | ) | | | 15.85 | |
| 9/30/2020 | | | 15.78 | | | | 0.26 | | | | 0.02 | | | | 0.28 | | | | (0.26 | ) | | | 15.80 | |
| 9/30/2019 | | | 15.43 | | | | 0.30 | | | | 0.35 | | | | 0.65 | | | | (0.30 | ) | | | 15.78 | |
| 9/30/2018 | | | 15.64 | | | | 0.23 | | | | (0.21 | ) | | | 0.02 | | | | (0.23 | ) | | | 15.43 | |
| Class F3 | | | | | | | | | | | | | | | | | | | | | | | | |
| 9/30/2022 | | | 15.85 | | | | 0.19 | | | | (1.06 | ) | | | (0.87 | ) | | | (0.19 | ) | | | 14.79 | |
| 9/30/2021 | | | 15.80 | | | | 0.18 | | | | 0.06 | | | | 0.24 | | | | (0.19 | ) | | | 15.85 | |
| 9/30/2020 | | | 15.79 | | | | 0.27 | | | | 0.02 | | | | 0.29 | | | | (0.28 | ) | | | 15.80 | |
| 9/30/2019 | | | 15.43 | | | | 0.32 | | | | 0.36 | | | | 0.68 | | | | (0.32 | ) | | | 15.79 | |
| 9/30/2018 | | | 15.65 | | | | 0.25 | | | | (0.22 | ) | | | 0.03 | | | | (0.25 | ) | | | 15.43 | |
| Class I | | | | | | | | | | | | | | | | | | | | | | | | |
| 9/30/2022 | | | 15.85 | | | | 0.20 | | | | (1.08 | ) | | | (0.88 | ) | | | (0.18 | ) | | | 14.79 | |
| 9/30/2021 | | | 15.80 | | | | 0.18 | | | | 0.05 | | | | 0.23 | | | | (0.18 | ) | | | 15.85 | |
| 9/30/2020 | | | 15.78 | | | | 0.27 | | | | 0.02 | | | | 0.29 | | | | (0.27 | ) | | | 15.80 | |
| 9/30/2019 | | | 15.43 | | | | 0.32 | | | | 0.35 | | | | 0.67 | | | | (0.32 | ) | | | 15.78 | |
| 9/30/2018 | | | 15.65 | | | | 0.25 | | | | (0.22 | ) | | | 0.03 | | | | (0.25 | ) | | | 15.43 | |
| (a) | Calculated based on average shares outstanding during the period. |
| (b) | Total return for Classes A and C does not consider the effects of sales loads and assumes the reinvestment of all distributions. Total return for all other classes assumes the reinvestment of all distributions. |
| 188 | See Notes to Financial Statements. |
| | | Ratios to Average Net Assets: | | Supplemental Data: |
| | | | | | | | | | | |
Total
return
(%)(b) | | Total
expenses
after
waivers
and/or reim-
bursements
(%) | | Total
expenses
(%) | | Net
investment
income
(%) | | Net
assets,
end of
period
(000) | | Portfolio
turnover
rate
(%) |
| | | | | | | | | | | | | | | | | |
| | (5.68 | ) | | | 0.65 | | | | 0.65 | | | | 0.99 | | | $ | 875,792 | | | | 43 | |
| | 1.20 | | | | 0.65 | | | | 0.65 | | | | 0.93 | | | | 1,067,651 | | | | 26 | |
| | 1.68 | | | | 0.65 | | | | 0.66 | | | | 1.52 | | | | 895,461 | | | | 28 | |
| | 4.15 | | | | 0.65 | | | | 0.66 | | | | 1.83 | | | | 632,983 | | | | 33 | |
| | 0.04 | | | | 0.65 | | | | 0.68 | | | | 1.38 | | | | 621,383 | | | | 55 | |
| | | | | | | | | | | | | | | | | | | | | | | |
| | (6.34 | ) | | | 1.29 | | | | 1.29 | | | | 0.35 | | | | 23,284 | | | | 43 | |
| | 0.54 | | | | 1.30 | | | | 1.31 | | | | 0.30 | | | | 31,450 | | | | 26 | |
| | 1.05 | | | | 1.27 | | | | 1.28 | | | | 0.96 | | | | 39,779 | | | | 28 | |
| | 3.52 | | | | 1.26 | | | | 1.28 | | | | 1.22 | | | | 86,435 | | | | 33 | |
| | (0.57 | ) | | | 1.26 | | | | 1.29 | | | | 0.77 | | | | 106,989 | | | | 55 | |
| | | | | | | | | | | | | | | | | | | | | | | |
| | (5.65 | ) | | | 0.55 | | | | 0.55 | | | | 1.01 | | | | 246,974 | | | | 43 | |
| | 1.36 | | | | 0.55 | | | | 0.55 | | | | 1.03 | | | | 736,826 | | | | 26 | |
| | 1.77 | | | | 0.55 | | | | 0.56 | | | | 1.62 | | | | 587,635 | | | | 28 | |
| | 4.25 | | | | 0.55 | | | | 0.56 | | | | 1.92 | | | | 577,258 | | | | 33 | |
| | 0.14 | | | | 0.55 | | | | 0.58 | | | | 1.48 | | | | 507,085 | | | | 55 | |
| | | | | | | | | | | | | | | | | | | | | | | |
| | (5.52 | ) | | | 0.41 | | | | 0.41 | | | | 1.25 | | | | 361,359 | | | | 43 | |
| | 1.50 | | | | 0.42 | | | | 0.42 | | | | 1.16 | | | | 331,257 | | | | 26 | |
| | 1.84 | | | | 0.42 | | | | 0.43 | | | | 1.74 | | | | 246,193 | | | | 28 | |
| | 4.44 | | | | 0.42 | | | | 0.43 | | | | 2.04 | | | | 46,899 | | | | 33 | |
| | 0.19 | | | | 0.43 | | | | 0.44 | | | | 1.63 | | | | 19,703 | | | | 55 | |
| | | | | | | | | | | | | | | | | | | | | | | |
| | (5.55 | ) | | | 0.45 | | | | 0.46 | | | | 1.30 | | | | 563,762 | | | | 43 | |
| | 1.46 | | | | 0.45 | | | | 0.45 | | | | 1.13 | | | | 206,551 | | | | 26 | |
| | 1.87 | | | | 0.45 | | | | 0.46 | | | | 1.70 | | | | 177,634 | | | | 28 | |
| | 4.35 | | | | 0.45 | | | | 0.46 | | | | 2.02 | | | | 108,949 | | | | 33 | |
| | 0.17 | | | | 0.45 | | | | 0.47 | | | | 1.60 | | | | 98,960 | | | | 55 | |
| | See Notes to Financial Statements. | 189 |
Financial Highlights (continued)
INTERMEDIATE TAX FREE FUND
| | | | | Per Share Operating Performance: | | |
| | | | | | | |
| | | | | Investment Operations: | | Distributions
to
shareholders
from: | | |
| | | Net asset
value,
beginning of
period | | Net
investment
income(a) | | Net
realized and
unrealized
gain (loss) | | Total from
investment
operations | | Net
investment
income | | Net asset
value,
end of
period |
| Class A | | | | | | | | | | | | | | | | | | | | | | | | |
| 9/30/2022 | | $ | 11.33 | | | $ | 0.23 | | | $ | (1.63 | ) | | | $(1.40 | ) | | | $(0.22 | ) | | $ | 9.71 | |
| 9/30/2021 | | | 11.11 | | | | 0.24 | | | | 0.22 | | | | 0.46 | | | | (0.24 | ) | | | 11.33 | |
| 9/30/2020 | | | 11.17 | | | | 0.27 | | | | (0.06 | ) | | | 0.21 | | | | (0.27 | ) | | | 11.11 | |
| 9/30/2019 | | | 10.60 | | | | 0.30 | | | | 0.57 | | | | 0.87 | | | | (0.30 | ) | | | 11.17 | |
| 9/30/2018 | | | 10.85 | | | | 0.27 | | | | (0.25 | ) | | | 0.02 | | | | (0.27 | ) | | | 10.60 | |
| Class C | | | | | | | | | | | | | | | | | | | | | | | | |
| 9/30/2022 | | | 11.32 | | | | 0.16 | | | | (1.62 | ) | | | (1.46 | ) | | | (0.16 | ) | | | 9.70 | |
| 9/30/2021 | | | 11.10 | | | | 0.17 | | | | 0.22 | | | | 0.39 | | | | (0.17 | ) | | | 11.32 | |
| 9/30/2020 | | | 11.16 | | | | 0.21 | | | | (0.07 | ) | | | 0.14 | | | | (0.20 | ) | | | 11.10 | |
| 9/30/2019 | | | 10.59 | | | | 0.23 | | | | 0.57 | | | | 0.80 | | | | (0.23 | ) | | | 11.16 | |
| 9/30/2018 | | | 10.84 | | | | 0.21 | | | | (0.26 | ) | | | (0.05 | ) | | | (0.20 | ) | | | 10.59 | |
| Class F | | | | | | | | | | | | | | | | | | | | | | | | |
| 9/30/2022 | | | 11.33 | | | | 0.23 | | | | (1.61 | ) | | | (1.38 | ) | | | (0.24 | ) | | | 9.71 | |
| 9/30/2021 | | | 11.11 | | | | 0.25 | | | | 0.22 | | | | 0.47 | | | | (0.25 | ) | | | 11.33 | |
| 9/30/2020 | | | 11.17 | | | | 0.28 | | | | (0.06 | ) | | | 0.22 | | | | (0.28 | ) | | | 11.11 | |
| 9/30/2019 | | | 10.60 | | | | 0.31 | | | | 0.57 | | | | 0.88 | | | | (0.31 | ) | | | 11.17 | |
| 9/30/2018 | | | 10.85 | | | | 0.28 | | | | (0.25 | ) | | | 0.03 | | | | (0.28 | ) | | | 10.60 | |
| Class F3 | | | | | | | | | | | | | | | | | | | | | | | | |
| 9/30/2022 | | | 11.34 | | | | 0.25 | | | | (1.62 | ) | | | (1.37 | ) | | | (0.25 | ) | | | 9.72 | |
| 9/30/2021 | | | 11.12 | | | | 0.27 | | | | 0.22 | | | | 0.49 | | | | (0.27 | ) | | | 11.34 | |
| 9/30/2020 | | | 11.18 | | | | 0.30 | | | | (0.06 | ) | | | 0.24 | | | | (0.30 | ) | | | 11.12 | |
| 9/30/2019 | | | 10.60 | | | | 0.32 | | | | 0.58 | | | | 0.90 | | | | (0.32 | ) | | | 11.18 | |
| 9/30/2018 | | | 10.86 | | | | 0.30 | | | | (0.26 | ) | | | 0.04 | | | | (0.30 | ) | | | 10.60 | |
| Class I | | | | | | | | | | | | | | | | | | | | | | | | |
| 9/30/2022 | | | 11.33 | | | | 0.25 | | | | (1.62 | ) | | | (1.37 | ) | | | (0.25 | ) | | | 9.71 | |
| 9/30/2021 | | | 11.12 | | | | 0.27 | | | | 0.21 | | | | 0.48 | | | | (0.27 | ) | | | 11.33 | |
| 9/30/2020 | | | 11.17 | | | | 0.29 | | | | (0.05 | ) | | | 0.24 | | | | (0.29 | ) | | | 11.12 | |
| 9/30/2019 | | | 10.60 | | | | 0.32 | | | | 0.57 | | | | 0.89 | | | | (0.32 | ) | | | 11.17 | |
| 9/30/2018 | | | 10.85 | | | | 0.30 | | | | (0.26 | ) | | | 0.04 | | | | (0.29 | ) | | | 10.60 | |
| (a) | Calculated using average shares outstanding during the period. |
| (b) | Total return for Classes A and C does not consider the effects of sales loads and assumes the reinvestment of all distributions. Total return for all other classes assumes the reinvestment of all distributions. |
| (c) | Interest expense, if applicable, relates to the liability for floating rate notes issued in conjunction with tender option bond trusts. |
| 190 | See Notes to Financial Statements. |
| | | Ratios to Average Net Assets: | | Supplemental Data: |
Total
return
(%)(b) | | Total
expenses
after
waivers
and/or reim-
bursements
(includes
interest
expense)
(%)(c) | | Total
expenses
after
waivers
and/or reim-
bursements
(excludes
interest
expense)
(%)(c) | | Total
expenses
(%) | | Net
investment
income
(%) | | Net
assets,
end of
period
(000) | | Portfolio
turnover
rate
(%) |
| | | | | | | | | | | | | | | | | | | | |
| | (12.36 | ) | | | 0.71 | | | | 0.71 | | | | 0.71 | | | | 2.11 | | | $ | 2,075,394 | | | | 33 | |
| | 4.19 | | | | 0.70 | | | | 0.70 | | | | 0.70 | | | | 2.15 | | | | 2,656,030 | | | | 13 | |
| | 1.93 | | | | 0.70 | | | | 0.70 | | | | 0.70 | | | | 2.45 | | | | 2,239,629 | | | | 14 | |
| | 8.27 | | | | 0.70 | | | | 0.70 | | | | 0.71 | | | | 2.73 | | | | 1,704,883 | | | | 19 | |
| | 0.20 | | | | 0.70 | | | | 0.70 | | | | 0.70 | | | | 2.57 | | | | 1,496,393 | | | | 23 | |
| | | | | | | | | | | | | | | | | | | | | | | | | | | |
| | (13.02 | ) | | | 1.35 | | | | 1.35 | | | | 1.35 | | | | 1.47 | | | | 123,238 | | | | 33 | |
| | 3.53 | | | | 1.33 | | | | 1.33 | | | | 1.33 | | | | 1.52 | | | | 190,855 | | | | 13 | |
| | 1.30 | | | | 1.32 | | | | 1.32 | | | | 1.32 | | | | 1.86 | | | | 215,475 | | | | 14 | |
| | 7.62 | | | | 1.31 | | | | 1.31 | | | | 1.32 | | | | 2.13 | | | | 390,735 | | | | 19 | |
| | (0.42 | ) | | | 1.32 | | | | 1.32 | | | | 1.32 | | | | 1.95 | | | | 432,891 | | | | 23 | |
| | | | | | | | | | | | | | | | | | | | | | | | | | | |
| | (12.37 | ) | | | 0.60 | | | | 0.60 | | | | 0.60 | | | | 2.13 | | | | 522,922 | | | | 33 | |
| | 4.30 | | | | 0.60 | | | | 0.60 | | | | 0.60 | | | | 2.24 | | | | 2,697,578 | | | | 13 | |
| | 2.03 | | | | 0.60 | | | | 0.60 | | | | 0.60 | | | | 2.56 | | | | 2,140,068 | | | | 14 | |
| | 8.38 | | | | 0.60 | | | | 0.60 | | | | 0.61 | | | | 2.83 | | | | 1,871,641 | | | | 19 | |
| | 0.30 | | | | 0.60 | | | | 0.60 | | | | 0.60 | | | | 2.66 | | | | 1,680,364 | | | | 23 | |
| | | | | | | | | | | | | | | | | | | | | | | | | | | |
| | (12.21 | ) | | | 0.45 | | | | 0.45 | | | | 0.45 | | | | 2.39 | | | | 194,787 | | | | 33 | |
| | 4.45 | | | | 0.45 | | | | 0.45 | | | | 0.45 | | | | 2.36 | | | | 171,655 | | | | 13 | |
| | 2.17 | | | | 0.46 | | | | 0.46 | | | | 0.46 | | | | 2.68 | | | | 85,559 | | | | 14 | |
| | 8.62 | | | | 0.46 | | | | 0.46 | | | | 0.47 | | | | 2.94 | | | | 43,659 | | | | 19 | |
| | 0.34 | | | | 0.46 | | | | 0.46 | | | | 0.46 | | | | 2.80 | | | | 24,227 | | | | 23 | |
| | | | | | | | | | | | | | | | | | | | | | | | | | | |
| | (12.28 | ) | | | 0.52 | | | | 0.52 | | | | 0.52 | | | | 2.39 | | | | 2,131,673 | | | | 33 | |
| | 4.31 | | | | 0.50 | | | | 0.50 | | | | 0.50 | | | | 2.35 | | | | 896,545 | | | | 13 | |
| | 2.22 | | | | 0.50 | | | | 0.50 | | | | 0.50 | | | | 2.65 | | | | 870,771 | | | | 14 | |
| | 8.48 | | | | 0.50 | | | | 0.50 | | | | 0.51 | | | | 2.92 | | | | 652,729 | | | | 19 | |
| | 0.40 | | | | 0.50 | | | | 0.50 | | | | 0.50 | | | | 2.77 | | | | 528,933 | | | | 23 | |
| | See Notes to Financial Statements. | 191 |
Financial Highlights (continued)
NATIONAL TAX FREE FUND
| | | | | Per Share Operating Performance: | | |
| | | | | | | |
| | | | | Investment Operations: | | Distributions
to
shareholders
from: | | |
| | | Net asset
value,
beginning of
period | | Net
investment
income(a) | | Net
realized and
unrealized
gain (loss) | | Total from
investment
operations | | Net
investment
income | | Net asset
value,
end of
period |
| Class A | | | | | | | | | | | | | | | | | | | | | | | | |
| 9/30/2022 | | $ | 12.06 | | | $ | 0.30 | | | $ | (2.23 | ) | | | $(1.93 | ) | | | $(0.30 | ) | | $ | 9.83 | |
| 9/30/2021 | | | 11.70 | | | | 0.31 | | | | 0.36 | | | | 0.67 | | | | (0.31 | ) | | | 12.06 | |
| 9/30/2020 | | | 11.80 | | | | 0.34 | | | | (0.10 | ) | | | 0.24 | | | | (0.34 | ) | | | 11.70 | |
| 9/30/2019 | | | 11.11 | | | | 0.37 | | | | 0.69 | | | | 1.06 | | | | (0.37 | ) | | | 11.80 | |
| 9/30/2018 | | | 11.36 | | | | 0.37 | | | | (0.25 | ) | | | 0.12 | | | | (0.37 | ) | | | 11.11 | |
| Class C | | | | | | | | | | | | | | | | | | | | | | | | |
| 9/30/2022 | | | 12.08 | | | | 0.23 | | | | (2.24 | ) | | | (2.01 | ) | | | (0.23 | ) | | | 9.84 | |
| 9/30/2021 | | | 11.71 | | | | 0.23 | | | | 0.37 | | | | 0.60 | | | | (0.23 | ) | | | 12.08 | |
| 9/30/2020 | | | 11.82 | | | | 0.26 | | | | (0.11 | ) | | | 0.15 | | | | (0.26 | ) | | | 11.71 | |
| 9/30/2019 | | | 11.13 | | | | 0.30 | | | | 0.69 | | | | 0.99 | | | | (0.30 | ) | | | 11.82 | |
| 9/30/2018 | | | 11.37 | | | | 0.30 | | | | (0.24 | ) | | | 0.06 | | | | (0.30 | ) | | | 11.13 | |
| Class F | | | | | | | | | | | | | | | | | | | | | | | | |
| 9/30/2022 | | | 12.05 | | | | 0.31 | | | | (2.23 | ) | | | (1.92 | ) | | | (0.31 | ) | | | 9.82 | |
| 9/30/2021 | | | 11.69 | | | | 0.32 | | | | 0.36 | | | | 0.68 | | | | (0.32 | ) | | | 12.05 | |
| 9/30/2020 | | | 11.79 | | | | 0.35 | | | | (0.10 | ) | | | 0.25 | | | | (0.35 | ) | | | 11.69 | |
| 9/30/2019 | | | 11.10 | | | | 0.38 | | | | 0.69 | | | | 1.07 | | | | (0.38 | ) | | | 11.79 | |
| 9/30/2018 | | | 11.35 | | | | 0.38 | | | | (0.25 | ) | | | 0.13 | | | | (0.38 | ) | | | 11.10 | |
| Class F3 | | | | | | | | | | | | | | | | | | | | | | | | |
| 9/30/2022 | | | 12.06 | | | | 0.32 | | | | (2.23 | ) | | | (1.91 | ) | | | (0.32 | ) | | | 9.83 | |
| 9/30/2021 | | | 11.69 | | | | 0.34 | | | | 0.37 | | | | 0.71 | | | | (0.34 | ) | | | 12.06 | |
| 9/30/2020 | | | 11.80 | | | | 0.36 | | | | (0.11 | ) | | | 0.25 | | | | (0.36 | ) | | | 11.69 | |
| 9/30/2019 | | | 11.11 | | | | 0.39 | | | | 0.70 | | | | 1.09 | | | | (0.40 | ) | | | 11.80 | |
| 9/30/2018 | | | 11.35 | | | | 0.39 | | | | (0.24 | ) | | | 0.15 | | | | (0.39 | ) | | | 11.11 | |
| Class I | | | | | | | | | | | | | | | | | | | | | | | | |
| 9/30/2022 | | | 12.06 | | | | 0.32 | | | | (2.23 | ) | | | (1.91 | ) | | | (0.32 | ) | | | 9.83 | |
| 9/30/2021 | | | 11.69 | | | | 0.34 | | | | 0.36 | | | | 0.70 | | | | (0.33 | ) | | | 12.06 | |
| 9/30/2020 | | | 11.80 | | | | 0.36 | | | | (0.11 | ) | | | 0.25 | | | | (0.36 | ) | | | 11.69 | |
| 9/30/2019 | | | 11.11 | | | | 0.39 | | | | 0.69 | | | | 1.08 | | | | (0.39 | ) | | | 11.80 | |
| 9/30/2018 | | | 11.35 | | | | 0.39 | | | | (0.24 | ) | | | 0.15 | | | | (0.39 | ) | | | 11.11 | |
| (a) | Calculated using average shares outstanding during the period. |
| (b) | Total return for Classes A and C does not consider the effects of sales loads and assumes the reinvestment of all distributions. Total return for all other classes assumes the reinvestment of all distributions. |
| (c) | Interest expense, if applicable, relates to the liability for floating rate notes issued in conjunction with tender option bond trusts. |
| 192 | See Notes to Financial Statements. |
| | | Ratios to Average Net Assets: | | Supplemental Data: |
Total
return
(%)(b) | | Total
expenses
after
waivers
and/or reim-
bursements
(includes
interest
expense)
(%)(c) | | Total
expenses
after
waivers
and/or reim-
bursements
(excludes
interest
expense)
(%)(c) | | Total
expenses
(%) | | Net
investment
income
(%) | | Net
assets,
end of
period
(000) | | Portfolio
turnover
rate
(%) |
| | | | | | | | | | | | | | | | | | | | |
| | (16.27 | ) | | | 0.71 | | | | 0.70 | | | | 0.71 | | | | 2.66 | | | $ | 2,235,687 | | | | 40 | |
| | 5.77 | | | | 0.70 | | | | 0.70 | | | | 0.70 | | | | 2.58 | | | | 2,925,529 | | | | 18 | |
| | 2.06 | | | | 0.71 | | | | 0.71 | | | | 0.71 | | | | 2.90 | | | | 2,504,023 | | | | 24 | |
| | 9.70 | | | | 0.77 | | | | 0.75 | | | | 0.77 | | | | 3.25 | | | | 2,011,535 | | | | 11 | |
| | 1.03 | | | | 0.77 | | | | 0.74 | | | | 0.77 | | | | 3.28 | | | | 1,484,381 | | | | 32 | |
| | | | | | | | | | | | | | | | | | | | | | | | | | | |
| | (16.86 | ) | | | 1.35 | | | | 1.34 | | | | 1.35 | | | | 2.01 | | | | 83,743 | | | | 40 | |
| | 5.16 | | | | 1.35 | | | | 1.35 | | | | 1.35 | | | | 1.94 | | | | 135,544 | | | | 18 | |
| | 1.32 | | | | 1.35 | | | | 1.35 | | | | 1.35 | | | | 2.27 | | | | 138,705 | | | | 24 | |
| | 9.01 | | | | 1.39 | | | | 1.37 | | | | 1.39 | | | | 2.63 | | | | 165,263 | | | | 11 | |
| | 0.49 | | | | 1.39 | | | | 1.36 | | | | 1.39 | | | | 2.66 | | | | 131,631 | | | | 32 | |
| | | | | | | | | | | | | | | | | | | | | | | | | | | |
| | (16.20 | ) | | | 0.61 | | | | 0.60 | | | | 0.61 | | | | 2.66 | | | | 222,942 | | | | 40 | |
| | 5.88 | | | | 0.60 | | | | 0.60 | | | | 0.60 | | | | 2.68 | | | | 984,235 | | | | 18 | |
| | 2.15 | | | | 0.61 | | | | 0.61 | | | | 0.61 | | | | 2.99 | | | | 871,094 | | | | 24 | |
| | 9.80 | | | | 0.67 | | | | 0.65 | | | | 0.67 | | | | 3.32 | | | | 594,320 | | | | 11 | |
| | 1.12 | | | | 0.67 | | | | 0.64 | | | | 0.67 | | | | 3.37 | | | | 299,777 | | | | 32 | |
| | | | | | | | | | | | | | | | | | | | | | | | | | | |
| | (16.07 | ) | | | 0.47 | | | | 0.46 | | | | 0.47 | | | | 2.91 | | | | 268,560 | | | | 40 | |
| | 6.10 | | | | 0.45 | | | | 0.45 | | | | 0.45 | | | | 2.78 | | | | 288,718 | | | | 18 | |
| | 2.19 | | | | 0.48 | | | | 0.48 | | | | 0.48 | | | | 3.10 | | | | 140,730 | | | | 24 | |
| | 9.95 | | | | 0.53 | | | | 0.50 | | | | 0.53 | | | | 3.42 | | | | 59,942 | | | | 11 | |
| | 1.34 | | | | 0.53 | | | | 0.50 | | | | 0.53 | | | | 3.50 | | | | 21,499 | | | | 32 | |
| | | | | | | | | | | | | | | | | | | | | | | | | | | |
| | (16.10 | ) | | | 0.52 | | | | 0.51 | | | | 0.52 | | | | 2.99 | | | | 567,725 | | | | 40 | |
| | 6.07 | | | | 0.50 | | | | 0.50 | | | | 0.50 | | | | 2.78 | | | | 209,640 | | | | 18 | |
| | 2.17 | | | | 0.51 | | | | 0.51 | | | | 0.51 | | | | 3.09 | | | | 155,620 | | | | 24 | |
| | 9.91 | | | | 0.57 | | | | 0.55 | | | | 0.57 | | | | 3.40 | | | | 111,141 | | | | 11 | |
| | 1.31 | | | | 0.57 | | | | 0.54 | | | | 0.57 | | | | 3.48 | | | | 46,873 | | | | 32 | |
| | See Notes to Financial Statements. | 193 |
Financial Highlights (continued)
HIGH INCOME MUNICIPAL BOND FUND
| | | | | Per Share Operating Performance: | | |
| | | | | | | |
| | | | | Investment Operations: | | Distributions
to
shareholders
from: | | |
| | | Net asset
value,
beginning of
period | | Net
investment
income(a) | | Net
realized and
unrealized
gain (loss) | | Total from
investment
operations | | Net
investment
income | | Net asset
value,
end of
period |
| Class A | | | | | | | | | | | | | | | | | | | | | | | | |
| 9/30/2022 | | $ | 12.91 | | | $ | 0.39 | | | $ | (2.69 | ) | | $ | (2.30 | ) | | | $(0.39 | ) | | $ | 10.22 | |
| 9/30/2021 | | | 12.14 | | | | 0.41 | | | | 0.77 | | | | 1.18 | | | | (0.41 | ) | | | 12.91 | |
| 9/30/2020 | | | 12.60 | | | | 0.45 | | | | (0.47 | ) | | | (0.02 | ) | | | (0.44 | ) | | | 12.14 | |
| 9/30/2019 | | | 11.93 | | | | 0.50 | | | | 0.66 | | | | 1.16 | | | | (0.49 | ) | | | 12.60 | |
| 9/30/2018 | | | 11.84 | | | | 0.48 | | | | 0.08 | | | | 0.56 | | | | (0.47 | ) | | | 11.93 | |
| Class C | | | | | | | | | | | | | | | | | | | | | | | | |
| 9/30/2022 | | | 12.92 | | | | 0.31 | | | | (2.70 | ) | | | (2.39 | ) | | | (0.31 | ) | | | 10.22 | |
| 9/30/2021 | | | 12.14 | | | | 0.33 | | | | 0.78 | | | | 1.11 | | | | (0.33 | ) | | | 12.92 | |
| 9/30/2020 | | | 12.61 | | | | 0.37 | | | | (0.48 | ) | | | (0.11 | ) | | | (0.36 | ) | | | 12.14 | |
| 9/30/2019 | | | 11.93 | | | | 0.42 | | | | 0.67 | | | | 1.09 | | | | (0.41 | ) | | | 12.61 | |
| 9/30/2018 | | | 11.84 | | | | 0.41 | | | | 0.08 | | | | 0.49 | | | | (0.40 | ) | | | 11.93 | |
| Class F | | | | | | | | | | | | | | | | | | | | | | | | |
| 9/30/2022 | | | 12.92 | | | | 0.40 | | | | (2.69 | ) | | | (2.29 | ) | | | (0.40 | ) | | | 10.23 | |
| 9/30/2021 | | | 12.15 | | | | 0.42 | | | | 0.77 | | | | 1.19 | | | | (0.42 | ) | | | 12.92 | |
| 9/30/2020 | | | 12.61 | | | | 0.46 | | | | (0.47 | ) | | | (0.01 | ) | | | (0.45 | ) | | | 12.15 | |
| 9/30/2019 | | | 11.93 | | | | 0.51 | | | | 0.67 | | | | 1.18 | | | | (0.50 | ) | | | 12.61 | |
| 9/30/2018 | | | 11.85 | | | | 0.49 | | | | 0.07 | | | | 0.56 | | | | (0.48 | ) | | | 11.93 | |
| Class F3 | | | | | | | | | | | | | | | | | | | | | | | | |
| 9/30/2022 | | | 12.89 | | | | 0.42 | | | | (2.70 | ) | | | (2.28 | ) | | | (0.41 | ) | | | 10.20 | |
| 9/30/2021 | | | 12.12 | | | | 0.44 | | | | 0.77 | | | | 1.21 | | | | (0.44 | ) | | | 12.89 | |
| 9/30/2020 | | | 12.58 | | | | 0.47 | | | | (0.46 | ) | | | 0.01 | | | | (0.47 | ) | | | 12.12 | |
| 9/30/2019 | | | 11.90 | | | | 0.52 | | | | 0.67 | | | | 1.19 | | | | (0.51 | ) | | | 12.58 | |
| 9/30/2018 | | | 11.82 | | | | 0.51 | | | | 0.06 | | | | 0.57 | | | | (0.49 | ) | | | 11.90 | |
| Class I | | | | | | | | | | | | | | | | | | | | | | | | |
| 9/30/2022 | | | 12.89 | | | | 0.42 | | | | (2.70 | ) | | | (2.28 | ) | | | (0.41 | ) | | | 10.20 | |
| 9/30/2021 | | | 12.12 | | | | 0.44 | | | | 0.76 | | | | 1.20 | | | | (0.43 | ) | | | 12.89 | |
| 9/30/2020 | | | 12.58 | | | | 0.47 | | | | (0.47 | ) | | | – | (d) | | | (0.46 | ) | | | 12.12 | |
| 9/30/2019 | | | 11.90 | | | | 0.51 | | | | 0.68 | | | | 1.19 | | | | (0.51 | ) | | | 12.58 | |
| 9/30/2018 | | | 11.82 | | | | 0.50 | | | | 0.07 | | | | 0.57 | | | | (0.49 | ) | | | 11.90 | |
| (a) | Calculated using average shares outstanding during the period. |
| (b) | Total return for Classes A and C does not consider the effects of sales loads and assumes the reinvestment of all distributions. Total return for all other classes assumes the reinvestment of all distributions. |
| (c) | Interest expense, if applicable, relates to the liability for floating rate notes issued in conjunction with tender option bond trusts. |
| (d) | Amount less than $0.01. |
| 194 | See Notes to Financial Statements. |
| | | Ratios to Average Net Assets: | | Supplemental Data: |
| | | | | | | |
Total
return
(%)(b) | | Total
expenses
after
waivers
and/or reim-
bursements
(includes
interest
expense)
(%)(c) | | Total
expenses
after
waivers
and/or reim-
bursements
(excludes
interest
expense)
(%)(c) | | Total
expenses
(%) | | Net
investment
income
(%) | | Net
assets,
end of
period
(000) | | Portfolio
turnover
rate
(%) |
| | | | | | | | | | | | | | | | | | | | | | | | | | | |
| | (18.19 | ) | | | 0.77 | | | | 0.77 | | | | 0.77 | | | | 3.28 | | | $ | 1,787,225 | | | | 40 | |
| | 9.81 | | | | 0.75 | | | | 0.75 | | | | 0.75 | | | | 3.23 | | | | 2,388,758 | | | | 15 | |
| | (0.09 | ) | | | 0.77 | | | | 0.77 | | | | 0.77 | | | | 3.69 | | | | 1,822,069 | | | | 43 | |
| | 9.94 | | | | 0.79 | | | | 0.79 | | | | 0.79 | | | | 4.09 | | | | 1,728,665 | | | | 11 | |
| | 4.83 | | | | 0.82 | | | | 0.81 | | | | 0.82 | | | | 4.09 | | | | 1,217,482 | | | | 30 | |
| | | | | | | | | | | | | | | | | | | | | | | | | | | |
| | (18.78 | ) | | | 1.41 | | | | 1.41 | | | | 1.41 | | | | 2.63 | | | | 174,127 | | | | 40 | |
| | 9.19 | | | | 1.40 | | | | 1.40 | | | | 1.40 | | | | 2.60 | | | | 267,871 | | | | 15 | |
| | (0.81 | ) | | | 1.42 | | | | 1.42 | | | | 1.42 | | | | 3.06 | | | | 242,392 | | | | 43 | |
| | 9.34 | | | | 1.42 | | | | 1.42 | | | | 1.42 | | | | 3.48 | | | | 346,925 | | | | 11 | |
| | 4.18 | | | | 1.44 | | | | 1.43 | | | | 1.44 | | | | 3.48 | | | | 309,743 | | | | 30 | |
| | | | | | | | | | | | | | | | | | | | | | | | | | | |
| | (18.09 | ) | | | 0.66 | | | | 0.66 | | | | 0.66 | | | | 3.27 | | | | 369,471 | | | | 40 | |
| | 9.90 | | | | 0.65 | | | | 0.65 | | | | 0.65 | | | | 3.30 | | | | 1,450,736 | | | | 15 | |
| | 0.00 | | | | 0.67 | | | | 0.67 | | | | 0.67 | | | | 3.78 | | | | 861,795 | | | | 43 | |
| | 10.13 | | | | 0.69 | | | | 0.69 | | | | 0.69 | | | | 4.16 | | | | 895,691 | | | | 11 | |
| | 4.84 | | | | 0.72 | | | | 0.71 | | | | 0.72 | | | | 4.18 | | | | 517,484 | | | | 30 | |
| | | | | | | | | | | | | | | | | | | | | | | | | | | |
| | (18.01 | ) | | | 0.51 | | | | 0.51 | | | | 0.51 | | | | 3.55 | | | | 114,134 | | | | 40 | |
| | 10.07 | | | | 0.52 | | | | 0.51 | | | | 0.51 | | | | 3.42 | | | | 118,100 | | | | 15 | |
| | 0.14 | | | | 0.53 | | | | 0.53 | | | | 0.53 | | | | 3.92 | | | | 55,503 | | | | 43 | |
| | 10.28 | | | | 0.55 | | | | 0.55 | | | | 0.55 | | | | 4.24 | | | | 32,101 | | | | 11 | |
| | 4.98 | | | | 0.58 | | | | 0.57 | | | | 0.58 | | | | 4.30 | | | | 13,249 | | | | 30 | |
| | | | | | | | | | | | | | | | | | | | | | | | | | | |
| | (18.06 | ) | | | 0.57 | | | | 0.57 | | | | 0.57 | | | | 3.59 | | | | 961,328 | | | | 40 | |
| | 10.03 | | | | 0.56 | | | | 0.55 | | | | 0.55 | | | | 3.41 | | | | 487,688 | | | | 15 | |
| | 0.09 | | | | 0.57 | | | | 0.57 | | | | 0.57 | | | | 3.88 | | | | 301,236 | | | | 43 | |
| | 10.25 | | | | 0.59 | | | | 0.59 | | | | 0.59 | | | | 4.22 | | | | 282,296 | | | | 11 | |
| | 4.94 | | | | 0.62 | | | | 0.61 | | | | 0.62 | | | | 4.27 | | | | 108,526 | | | | 30 | |
| | See Notes to Financial Statements. | 195 |
Financial Highlights (continued)
SHORT DURATION HIGH INCOME MUNICIPAL BOND FUND
| | | | | Per Share Operating Performance: |
| | | | | Investment Operations: | | Distributions to
shareholders from: |
| | | | | | | |
| | | Net asset
value, beginning
of period | | Net
invest-
ment
income(a) | | Net
realized
and
unrealized
gain (loss) | | Total
from
invest-
ment
opera-
tions | | Net
investment
income | | Net
realized
gain | | Total
distri-
butions |
| Class A | | | | | | | | | | | | | | | | | | | | | | | | | | | | |
| 9/30/2022 | | $ | 15.88 | | | $ | 0.34 | | | $ | (2.05 | ) | | $ | (1.71 | ) | | $ | (0.33 | ) | | | $– | | | $ | (0.33 | ) |
| 9/30/2021 | | | 15.20 | | | | 0.33 | | | | 0.69 | | | | 1.02 | | | | (0.34 | ) | | | – | | | | (0.34 | ) |
| 9/30/2020 | | | 15.64 | | | | 0.43 | | | | (0.45 | ) | | | (0.02 | ) | | | (0.42 | ) | | | – | | | | (0.42 | ) |
| 9/30/2019 | | | 15.10 | | | | 0.46 | | | | 0.52 | | | | 0.98 | | | | (0.44 | ) | | | – | | | | (0.44 | ) |
| 9/30/2018 | | | 15.26 | | | | 0.43 | | | | (0.18 | ) | | | 0.25 | | | | (0.41 | ) | | | – | (c) | | | (0.41 | ) |
| Class C | | | | | | | | | | | | | | | | | | | | | | | | | | | | |
| 9/30/2022 | | | 15.88 | | | | 0.23 | | | | (2.04 | ) | | | (1.81 | ) | | | (0.23 | ) | | | – | | | | (0.23 | ) |
| 9/30/2021 | | | 15.20 | | | | 0.23 | | | | 0.68 | | | | 0.91 | | | | (0.23 | ) | | | – | | | | (0.23 | ) |
| 9/30/2020 | | | 15.65 | | | | 0.33 | | | | (0.46 | ) | | | (0.13 | ) | | | (0.32 | ) | | | – | | | | (0.32 | ) |
| 9/30/2019 | | | 15.11 | | | | 0.36 | | | | 0.52 | | | | 0.88 | | | | (0.34 | ) | | | – | | | | (0.34 | ) |
| 9/30/2018 | | | 15.26 | | | | 0.33 | | | | (0.17 | ) | | | 0.16 | | | | (0.31 | ) | | | – | (c) | | | (0.31 | ) |
| Class F | | | | | | | | | | | | | | | | | | | | | | | | | | | | |
| 9/30/2022 | | | 15.88 | | | | 0.33 | | | | (2.02 | ) | | | (1.69 | ) | | | (0.35 | ) | | | – | | | | (0.35 | ) |
| 9/30/2021 | | | 15.20 | | | | 0.34 | | | | 0.69 | | | | 1.03 | | | | (0.35 | ) | | | – | | | | (0.35 | ) |
| 9/30/2020 | | | 15.64 | | | | 0.45 | | | | (0.46 | ) | | | (0.01 | ) | | | (0.43 | ) | | | – | | | | (0.43 | ) |
| 9/30/2019 | | | 15.10 | | | | 0.47 | | | | 0.53 | | | | 1.00 | | | | (0.46 | ) | | | – | | | | (0.46 | ) |
| 9/30/2018 | | | 15.26 | | | | 0.44 | | | | (0.18 | ) | | | 0.26 | | | | (0.42 | ) | | | – | (c) | | | (0.42 | ) |
| Class F3 | | | | | | | | | | | | | | | | | | | | | | | | | | | | |
| 9/30/2022 | | | 15.88 | | | | 0.38 | | | | (2.05 | ) | | | (1.67 | ) | | | (0.37 | ) | | | – | | | | (0.37 | ) |
| 9/30/2021 | | | 15.20 | | | | 0.37 | | | | 0.69 | | | | 1.06 | | | | (0.38 | ) | | | – | | | | (0.38 | ) |
| 9/30/2020 | | | 15.65 | | | | 0.47 | | | | (0.46 | ) | | | 0.01 | | | | (0.46 | ) | | | – | | | | (0.46 | ) |
| 9/30/2019 | | | 15.11 | | | | 0.50 | | | | 0.52 | | | | 1.02 | | | | (0.48 | ) | | | – | | | | (0.48 | ) |
| 9/30/2018 | | | 15.27 | | | | 0.46 | | | | (0.18 | ) | | | 0.28 | | | | (0.44 | ) | | | – | (c) | | | (0.44 | ) |
| Class I | | | | | | | | | | | | | | | | | | | | | | | | | | | | |
| 9/30/2022 | | | 15.88 | | | | 0.38 | | | | (2.06 | ) | | | (1.68 | ) | | | (0.36 | ) | | | – | | | | (0.36 | ) |
| 9/30/2021 | | | 15.20 | | | | 0.36 | | | | 0.69 | | | | 1.05 | | | | (0.37 | ) | | | – | | | | (0.37 | ) |
| 9/30/2020 | | | 15.65 | | | | 0.46 | | | | (0.46 | ) | | | – | | | | (0.45 | ) | | | – | | | | (0.45 | ) |
| 9/30/2019 | | | 15.11 | | | | 0.49 | | | | 0.52 | | | | 1.01 | | | | (0.47 | ) | | | – | | | | (0.47 | ) |
| 9/30/2018 | | | 15.26 | | | | 0.46 | | | | (0.17 | ) | | | 0.29 | | | | (0.44 | ) | | | – | (c) | | | (0.44 | ) |
| (a) | Calculated using average shares outstanding during the period. |
| (b) | Total return for Classes A and C does not consider the effects of sales loads and assumes the reinvestment of all distributions. Total return for all other classes assumes the reinvestment of all distributions. |
| (c) | Amount less than $0.01. |
| 196 | See Notes to Financial Statements. |
| | | | | Ratios to Average Net Assets: | | Supplemental Data: |
| | | | | | | |
Net
asset
value,
end of
period | | Total
return
(%)(b) | | Total
expenses
after
waivers
and/or reim-
bursements
(%) | | Total
expenses
(%) | | Net
investment income
(%) | | Net
assets,
end of
period
(000) | | | Portfolio
turnover
rate
(%) |
| | | | | | | | | | | | | | | | | | | | | | | | | | | |
| $ | 13.84 | | | | (10.85 | ) | | | 0.70 | | | | 0.77 | | | | 2.27 | | | $ | 325,756 | | | | 81 | |
| | 15.88 | | | | 6.74 | | | | 0.69 | | | | 0.75 | | | | 2.09 | | | | 409,286 | | | | 14 | |
| | 15.20 | | | | (0.12 | ) | | | 0.62 | | | | 0.78 | | | | 2.83 | | | | 176,351 | | | | 61 | |
| | 15.64 | | | | 6.59 | | | | 0.55 | | | | 0.78 | | | | 2.99 | | | | 176,214 | | | | 29 | |
| | 15.10 | | | | 1.59 | | | | 0.55 | | | | 0.78 | | | | 2.83 | | | | 121,804 | | | | 29 | |
| | | | | | | | | | | | | | | | | | | | | | | | | | | |
| | 13.84 | | | | (11.48 | ) | | | 1.40 | | | | 1.47 | | | | 1.56 | | | | 21,392 | | | | 81 | |
| | 15.88 | | | | 6.03 | | | | 1.36 | | | | 1.43 | | | | 1.43 | | | | 26,412 | | | | 14 | |
| | 15.20 | | | | (0.85 | ) | | | 1.28 | | | | 1.45 | | | | 2.18 | | | | 12,758 | | | | 61 | |
| | 15.65 | | | | 5.90 | | | | 1.21 | | | | 1.44 | | | | 2.34 | | | | 12,303 | | | | 29 | |
| | 15.11 | | | | 0.98 | | | | 1.22 | | | | 1.45 | | | | 2.17 | | | | 8,851 | | | | 29 | |
| | | | | | | | | | | | | | | | | | | | | | | | | | | |
| | 13.84 | | | | (10.77 | ) | | | 0.60 | | | | 0.66 | | | | 2.18 | | | | 139,299 | | | | 81 | |
| | 15.88 | | | | 6.84 | | | | 0.59 | | | | 0.65 | | | | 2.17 | | | | 495,439 | | | | 14 | |
| | 15.20 | | | | (0.03 | ) | | | 0.52 | | | | 0.68 | | | | 2.92 | | | | 171,092 | | | | 61 | |
| | 15.64 | | | | 6.70 | | | | 0.45 | | | | 0.68 | | | | 3.08 | | | | 156,308 | | | | 29 | |
| | 15.10 | | | | 1.69 | | | | 0.45 | | | | 0.68 | | | | 2.93 | | | | 109,580 | | | | 29 | |
| | | | | | | | | | | | | | | | | | | | | | | | | | | |
| | 13.84 | | | | (10.62 | ) | | | 0.44 | | | | 0.50 | | | | 2.56 | | | | 28,251 | | | | 81 | |
| | 15.88 | | | | 7.02 | | | | 0.43 | | | | 0.49 | | | | 2.31 | | | | 31,122 | | | | 14 | |
| | 15.20 | | | | 0.07 | | | | 0.36 | | | | 0.52 | | | | 3.10 | | | | 8,538 | | | | 61 | |
| | 15.65 | | | | 6.86 | | | | 0.30 | | | | 0.53 | | | | 3.24 | | | | 6,546 | | | | 29 | |
| | 15.11 | | | | 1.91 | | | | 0.29 | | | | 0.53 | | | | 3.06 | | | | 3,812 | | | | 29 | |
| | | | | | | | | | | | | | | | | | | | | | | | | | | |
| | 13.84 | | | | (10.61 | ) | | | 0.50 | | | | 0.58 | | | | 2.59 | | | | 362,870 | | | | 81 | |
| | 15.88 | | | | 6.95 | | | | 0.50 | | | | 0.55 | | | | 2.28 | | | | 244,728 | | | | 14 | |
| | 15.20 | | | | 0.01 | | | | 0.42 | | | | 0.59 | | | | 3.03 | | | | 93,013 | | | | 61 | |
| | 15.65 | | | | 6.80 | | | | 0.35 | | | | 0.59 | | | | 3.18 | | | | 65,005 | | | | 29 | |
| | 15.11 | | | | 1.86 | | | | 0.35 | | | | 0.58 | | | | 3.03 | | | | 30,068 | | | | 29 | |
| | See Notes to Financial Statements. | 197 |
Financial Highlights (continued)
SUSTAINABLE MUNICIPAL BOND FUND
| | | | | Per Share Operating Performance: | | | |
| | | | | Investment Operations: | | Distributions
to
shareholders
from: | | | |
| | | Net asset
value,
beginning of
period | | Net
investment
income(a) | | Net
realized and
unrealized
(loss) | | Total from
investment
operations | | Net
investment
income | | Net asset
value,
end of
period |
| Class A | | | | | | | | | | | | | | | | | | | | | | | | |
| 1/5/2022 to 9/30/2022(e) | | $ | 10.00 | | | $ | 0.10 | | | $ | (1.21 | ) | | $ | (1.11 | ) | | | $(0.10 | ) | | $ | 8.79 | |
| Class C | | | | | | | | | | | | | | | | | | | | | | | | |
| 1/5/2022 to 9/30/2022(e) | | | 10.00 | | | | 0.05 | | | | (1.21 | ) | | | (1.16 | ) | | | (0.05 | ) | | | 8.79 | |
| Class F | | | | | | | | | | | | | | | | | | | | | | | | |
| 1/5/2022 to 9/30/2022(e) | | | 10.00 | | | | 0.11 | | | | (1.21 | ) | | | (1.10 | ) | | | (0.11 | ) | | | 8.79 | |
| Class F3 | | | | | | | | | | | | | | | | | | | | | | | | |
| 1/5/2022 to 9/30/2022(e) | | | 10.00 | | | | 0.12 | | | | (1.21 | ) | | | (1.09 | ) | | | (0.12 | ) | | | 8.79 | |
| Class I | | | | | | | | | | | | | | | | | | | | | | | | |
| 1/5/2022 to 9/30/2022(e) | | | 10.00 | | | | 0.12 | | | | (1.21 | ) | | | (1.09 | ) | | | (0.12 | ) | | | 8.79 | |
| (a) | Calculated using average shares outstanding during the period. |
| (b) | Total return for Classes A and C does not consider the effects of sales loads and assumes the reinvestment of all distributions. Total return for all other classes assumes the reinvestment of all distributions. |
| (c) | Not annualized. |
| (d) | Annualized. |
| (e) | Commenced on January 5, 2022 |
| 198 | See Notes to Financial Statements. |
| | | Ratios to Average Net Assets: | | Supplemental Data: |
| | | | | |
Total
return
(%)(b)(c) | | Total
expenses
after
waivers
and/or reim-
bursements
(%)(d) | | Total
expenses
(%)(d) | | Net
investment
income
(%)(d) | | Net
assets,
end of
period
(000) | | Portfolio
turnover
rate
(%)(c) |
| | | | | | | | | | | | | | | | | |
| | (11.11 | ) | | | 0.63 | | | | 2.16 | | | | 1.48 | | | | $2,682 | | | | 90 | |
| | | | | | | | | | | | | | | | | | | | | | | |
| | (11.64 | ) | | | 1.43 | | | | 2.96 | | | | 0.68 | | | | 66 | | | | 90 | |
| | | | | | | | | | | | | | | | | | | | | | | |
| | (11.05 | ) | | | 0.53 | | | | 2.06 | | | | 1.58 | | | | 66 | | | | 90 | |
| | | | | | | | | | | | | | | | | | | | | | | |
| | (10.95 | ) | | | 0.39 | | | | 1.91 | | | | 1.72 | | | | 88 | | | | 90 | |
| | | | | | | | | | | | | | | | | | | | | | | |
| | (10.98 | ) | | | 0.43 | | | | 1.96 | | | | 1.68 | | | | 1,638 | | | | 90 | |
| | See Notes to Financial Statements. | 199 |
Financial Highlights (continued)
CALIFORNIA TAX FREE FUND
| | | | | Per Share Operating Performance: | | |
| | | | | Investment Operations: | | Distributions
to
shareholders
from: | | |
| | | Net asset
value,
beginning of
period | | Net
investment
income(a) | | Net
realized and
unrealized
gain (loss) | | Total from
investment
operations | | Net
investment
income | | Net asset
value,
end of
period |
| Class A | | | | | | | | | | | | | | | | | | | | | | | | |
| 9/30/2022 | | $ | 11.61 | | | $ | 0.26 | | | $ | (2.11 | ) | | $ | (1.85 | ) | | | $(0.26 | ) | | $ | 9.50 | |
| 9/30/2021 | | | 11.40 | | | | 0.26 | | | | 0.21 | | | | 0.47 | | | | (0.26 | ) | | | 11.61 | |
| 9/30/2020 | | | 11.42 | | | | 0.29 | | | | (0.03 | ) | | | 0.26 | | | | (0.28 | ) | | | 11.40 | |
| 9/30/2019 | | | 10.76 | | | | 0.33 | | | | 0.66 | | | | 0.99 | | | | (0.33 | ) | | | 11.42 | |
| 9/30/2018 | | | 10.96 | | | | 0.33 | | | | (0.20 | ) | | | 0.13 | | | | (0.33 | ) | | | 10.76 | |
| Class C | | | | | | | | | | | | | | | | | | | | | | | | |
| 9/30/2022 | | | 11.62 | | | | 0.19 | | | | (2.11 | ) | | | (1.92 | ) | | | (0.19 | ) | | | 9.51 | |
| 9/30/2021 | | | 11.41 | | | | 0.19 | | | | 0.21 | | | | 0.40 | | | | (0.19 | ) | | | 11.62 | |
| 9/30/2020 | | | 11.42 | | | | 0.21 | | | | (0.01 | ) | | | 0.20 | | | | (0.21 | ) | | | 11.41 | |
| 9/30/2019 | | | 10.76 | | | | 0.26 | | | | 0.66 | | | | 0.92 | | | | (0.26 | ) | | | 11.42 | |
| 9/30/2018 | | | 10.96 | | | | 0.27 | | | | (0.21 | ) | | | 0.06 | | | | (0.26 | ) | | | 10.76 | |
| Class F | | | | | | | | | | | | | | | | | | | | | | | | |
| 9/30/2022 | | | 11.61 | | | | 0.26 | | | | (2.10 | ) | | | (1.84 | ) | | | (0.27 | ) | | | 9.50 | |
| 9/30/2021 | | | 11.40 | | | | 0.28 | | | | 0.20 | | | | 0.48 | | | | (0.27 | ) | | | 11.61 | |
| 9/30/2020 | | | 11.42 | | | | 0.30 | | | | (0.02 | ) | | | 0.28 | | | | (0.30 | ) | | | 11.40 | |
| 9/30/2019 | | | 10.75 | | | | 0.34 | | | | 0.67 | | | | 1.01 | | | | (0.34 | ) | | | 11.42 | |
| 9/30/2018 | | | 10.96 | | | | 0.34 | | | | (0.21 | ) | | | 0.13 | | | | (0.34 | ) | | | 10.75 | |
| Class F3 | | | | | | | | | | | | | | | | | | | | | | | | |
| 9/30/2022 | | | 11.61 | | | | 0.28 | | | | (2.11 | ) | | | (1.83 | ) | | | (0.28 | ) | | | 9.50 | |
| 9/30/2021 | | | 11.40 | | | | 0.29 | | | | 0.21 | | | | 0.50 | | | | (0.29 | ) | | | 11.61 | |
| 9/30/2020 | | | 11.41 | | | | 0.31 | | | | (0.01 | ) | | | 0.30 | | | | (0.31 | ) | | | 11.40 | |
| 9/30/2019 | | | 10.75 | | | | 0.35 | | | | 0.66 | | | | 1.01 | | | | (0.35 | ) | | | 11.41 | |
| 9/30/2018 | | | 10.95 | | | | 0.36 | | | | (0.21 | ) | | | 0.15 | | | | (0.35 | ) | | | 10.75 | |
| Class I | | | | | | | | | | | | | | | | | | | | | | | | |
| 9/30/2022 | | | 11.61 | | | | 0.28 | | | | (2.11 | ) | | | (1.83 | ) | | | (0.28 | ) | | | 9.50 | |
| 9/30/2021 | | | 11.40 | | | | 0.29 | | | | 0.21 | | | | 0.50 | | | | (0.29 | ) | | | 11.61 | |
| 9/30/2020 | | | 11.41 | | | | 0.31 | | | | (0.01 | ) | | | 0.30 | | | | (0.31 | ) | | | 11.40 | |
| 9/30/2019 | | | 10.75 | | | | 0.35 | | | | 0.66 | | | | 1.01 | | | | (0.35 | ) | | | 11.41 | |
| 9/30/2018 | | | 10.95 | | | | 0.36 | | | | (0.21 | ) | | | 0.15 | | | | (0.35 | ) | | | 10.75 | |
| (a) | Calculated using average shares outstanding during the period. |
| (b) | Total return for Classes A and C does not consider the effects of sales loads and assumes the reinvestment of all distributions. Total return for all other classes assumes the reinvestment of all distributions. |
| 200 | See Notes to Financial Statements. |
| | | Ratios to Average Net Assets: | | Supplemental Data: |
| | | | | |
Total
return
(%)(b) | | Total
expenses
after
waivers
and/or reim-
bursements
(%) | | Total
expenses
(%) | | Net
investment
income
(%) | | Net
assets,
end of
period
(000) | | Portfolio
turnover
rate
(%) |
| | | | | | | | | | | | | | | | | | | | | | | |
| | (16.10 | ) | | | 0.77 | | | | 0.77 | | | | 2.39 | | | $ | 303,455 | | | | 44 | |
| | 4.16 | | | | 0.77 | | | | 0.77 | | | | 2.27 | | | | 381,200 | | | | 14 | |
| | 2.36 | | | | 0.78 | | | | 0.78 | | | | 2.53 | | | | 342,426 | | | | 18 | |
| | 9.34 | | | | 0.79 | | | | 0.79 | | | | 3.00 | | | | 289,148 | | | | 15 | |
| | 1.20 | | | | 0.79 | | | | 0.79 | | | | 3.07 | | | | 197,080 | | | | 28 | |
| | | | | | | | | | | | | | | | | | | | | | | |
| | (16.70 | ) | | | 1.40 | | | | 1.40 | | | | 1.75 | | | | 21,221 | | | | 44 | |
| | 3.49 | | | | 1.41 | | | | 1.41 | | | | 1.63 | | | | 33,274 | | | | 14 | |
| | 1.78 | | | | 1.44 | | | | 1.44 | | | | 1.88 | | | | 37,078 | | | | 18 | |
| | 8.68 | | | | 1.40 | | | | 1.40 | | | | 2.39 | | | | 42,957 | | | | 15 | |
| | 0.58 | | | | 1.41 | | | | 1.41 | | | | 2.45 | | | | 33,793 | | | | 28 | |
| | | | | | | | | | | | | | | | | | | | | | | |
| | (16.02 | ) | | | 0.67 | | | | 0.67 | | | | 2.37 | | | | 20,964 | | | | 44 | |
| | 4.26 | | | | 0.67 | | | | 0.67 | | | | 2.36 | | | | 130,104 | | | | 14 | |
| | 2.46 | | | | 0.68 | | | | 0.68 | | | | 2.61 | | | | 112,378 | | | | 18 | |
| | 9.55 | | | | 0.69 | | | | 0.69 | | | | 3.08 | | | | 73,687 | | | | 15 | |
| | 1.21 | | | | 0.69 | | | | 0.69 | | | | 3.17 | | | | 49,601 | | | | 28 | |
| | | | | | | | | | | | | | | | | | | | | | | |
| | (16.00 | ) | | | 0.54 | | | | 0.54 | | | | 2.64 | | | | 29,694 | | | | 44 | |
| | 4.39 | | | | 0.54 | | | | 0.54 | | | | 2.48 | | | | 20,625 | | | | 14 | |
| | 2.67 | | | | 0.56 | | | | 0.56 | | | | 2.73 | | | | 13,170 | | | | 18 | |
| | 9.59 | | | | 0.56 | | | | 0.56 | | | | 3.19 | | | | 8,373 | | | | 15 | |
| | 1.42 | | | | 0.56 | | | | 0.56 | | | | 3.28 | | | | 3,949 | | | | 28 | |
| | | | | | | | | | | | | | | | | | | | | | | |
| | (16.02 | ) | | | 0.58 | | | | 0.58 | | | | 2.69 | | | | 78,796 | | | | 44 | |
| | 4.37 | | | | 0.57 | | | | 0.57 | | | | 2.46 | | | | 39,117 | | | | 14 | |
| | 2.65 | | | | 0.58 | | | | 0.58 | | | | 2.73 | | | | 30,880 | | | | 18 | |
| | 9.56 | | | | 0.58 | | | | 0.58 | | | | 3.18 | | | | 29,782 | | | | 15 | |
| | 1.40 | | | | 0.59 | | | | 0.59 | | | | 3.27 | | | | 14,836 | | | | 28 | |
| | See Notes to Financial Statements. | 201 |
Financial Highlights (continued)
NEW JERSEY TAX FREE FUND
| | | | | Per Share Operating Performance: | | |
| | | | | Investment Operations: | | Distributions
to
shareholders
from: | | |
| | | Net asset
value,
beginning of
period | | Net
investment
income(a) | | Net
realized and
unrealized
gain (loss) | | Total from
investment
operations | | Net
investment
income | | Net asset
value,
end of
period |
| Class A | | | | | | | | | | | | | | | | | | | | | | | | |
| 9/30/2022 | | $ | 5.35 | | | $ | 0.12 | | | $ | (0.93 | ) | | | $(0.81 | ) | | | $(0.12 | ) | | $ | 4.42 | |
| 9/30/2021 | | | 5.18 | | | | 0.12 | | | | 0.17 | | | | 0.29 | | | | (0.12 | ) | | | 5.35 | |
| 9/30/2020 | | | 5.21 | | | | 0.13 | | | | (0.03 | ) | | | 0.10 | | | | (0.13 | ) | | | 5.18 | |
| 9/30/2019 | | | 4.91 | | | | 0.14 | | | | 0.30 | | | | 0.44 | | | | (0.14 | ) | | | 5.21 | |
| 9/30/2018 | | | 4.96 | | | | 0.14 | | | | (0.05 | ) | | | 0.09 | | | | (0.14 | ) | | | 4.91 | |
| Class F | | | | | | | | | | | | | | | | | | | | | | | | |
| 9/30/2022 | | | 5.35 | | | | 0.12 | | | | (0.93 | ) | | | (0.81 | ) | | | (0.12 | ) | | | 4.42 | |
| 9/30/2021 | | | 5.18 | | | | 0.12 | | | | 0.17 | | | | 0.29 | | | | (0.12 | ) | | | 5.35 | |
| 9/30/2020 | | | 5.21 | | | | 0.13 | | | | (0.03 | ) | | | 0.10 | | | | (0.13 | ) | | | 5.18 | |
| 9/30/2019 | | | 4.91 | | | | 0.14 | | | | 0.30 | | | | 0.44 | | | | (0.14 | ) | | | 5.21 | |
| 9/30/2018 | | | 4.96 | | | | 0.14 | | | | (0.05 | ) | | | 0.09 | | | | (0.14 | ) | | | 4.91 | |
| Class F3 | | | | | | | | | | | | | | | | | | | | | | | | |
| 9/30/2022 | | | 5.35 | | | | 0.13 | | | | (0.93 | ) | | | (0.80 | ) | | | (0.13 | ) | | | 4.42 | |
| 9/30/2021 | | | 5.18 | | | | 0.13 | | | | 0.17 | | | | 0.30 | | | | (0.13 | ) | | | 5.35 | |
| 9/30/2020 | | | 5.22 | | | | 0.14 | | | | (0.04 | ) | | | 0.10 | | | | (0.14 | ) | | | 5.18 | |
| 9/30/2019 | | | 4.92 | | | | 0.14 | | | | 0.31 | | | | 0.45 | | | | (0.15 | ) | | | 5.22 | |
| 9/30/2018 | | | 4.97 | | | | 0.15 | | | | (0.05 | ) | | | 0.10 | | | | (0.15 | ) | | | 4.92 | |
| Class I | | | | | | | | | | | | | | | | | | | | | | | | |
| 9/30/2022 | | | 5.35 | | | | 0.13 | | | | (0.93 | ) | | | (0.80 | ) | | | (0.13 | ) | | | 4.42 | |
| 9/30/2021 | | | 5.18 | | | | 0.13 | | | | 0.17 | | | | 0.30 | | | | (0.13 | ) | | | 5.35 | |
| 9/30/2020 | | | 5.22 | | | | 0.14 | | | | (0.04 | ) | | | 0.10 | | | | (0.14 | ) | | | 5.18 | |
| 9/30/2019 | | | 4.92 | | | | 0.14 | | | | 0.31 | | | | 0.45 | | | | (0.15 | ) | | | 5.22 | |
| 9/30/2018 | | | 4.97 | | | | 0.15 | | | | (0.05 | ) | | | 0.10 | | | | (0.15 | ) | | | 4.92 | |
| (a) | Calculated using average shares outstanding during the period. |
| (b) | Total return for Class A does not consider the effects of sales loads and assumes the reinvestment of all distributions. Total return for all other classes assumes the reinvestment of all distributions. |
| | |
| 202 | See Notes to Financial Statements. |
| | | Ratios to Average Net Assets: | | Supplemental Data: |
| | | | | |
Total
return
(%)(b) | | Total
expenses
after
waivers
and/or reim-
bursements
(%) | | Total
expenses
(%) | | Net
investment
income
(%) | | Net
assets,
end of
period
(000) | | Portfolio
turnover
rate
(%) |
| | |
| | (15.36 | ) | | | 0.82 | | | | 0.84 | | | | 2.39 | | | $ | 80,854 | | | | 11 | |
| | 5.58 | | | | 0.82 | | | | 0.84 | | | | 2.21 | | | | 99,356 | | | | 13 | |
| | 1.92 | | | | 0.82 | | | | 0.85 | | | | 2.48 | | | | 101,085 | | | | 15 | |
| | 9.00 | | | | 0.82 | | | | 0.86 | | | | 2.69 | | | | 99,027 | | | | 4 | |
| | 1.75 | | | | 0.82 | | | | 0.88 | | | | 2.77 | | | | 79,108 | | | | 20 | |
| | | | | | | | | | | | | | | | | | | | | | | |
| | (15.28 | ) | | | 0.72 | | | | 0.74 | | | | 2.40 | | | | 5,885 | | | | 11 | |
| | 5.68 | | | | 0.72 | | | | 0.74 | | | | 2.30 | | | | 28,097 | | | | 13 | |
| | 2.02 | | | | 0.72 | | | | 0.75 | | | | 2.58 | | | | 23,903 | | | | 15 | |
| | 9.10 | | | | 0.72 | | | | 0.76 | | | | 2.77 | | | | 20,893 | | | | 4 | |
| | 1.85 | | | | 0.72 | | | | 0.78 | | | | 2.86 | | | | 15,243 | | | | 20 | |
| | | | | | | | | | | | | | | | | | | | | | | |
| | (15.16 | ) | | | 0.58 | | | | 0.60 | | | | 2.65 | | | | 1,342 | | | | 11 | |
| | 5.82 | | | | 0.59 | | | | 0.60 | | | | 2.40 | | | | 1,148 | | | | 13 | |
| | 1.96 | | | | 0.59 | | | | 0.62 | | | | 2.71 | | | | 618 | | | | 15 | |
| | 9.22 | | | | 0.58 | | | | 0.63 | | | | 2.79 | | | | 531 | | | | 4 | |
| | 1.99 | | | | 0.58 | | | | 0.64 | | | | 2.99 | | | | 139 | | | | 20 | |
| | | | | | | | | | | | | | | | | | | | | | | |
| | (15.19 | ) | | | 0.62 | | | | 0.65 | | | | 2.68 | | | | 13,415 | | | | 11 | |
| | 5.79 | | | | 0.62 | | | | 0.64 | | | | 2.38 | | | | 6,905 | | | | 13 | |
| | 1.93 | | | | 0.62 | | | | 0.65 | | | | 2.68 | | | | 3,746 | | | | 15 | |
| | 9.20 | | | | 0.62 | | | | 0.66 | | | | 2.86 | | | | 2,593 | | | | 4 | |
| | 1.95 | | | | 0.62 | | | | 0.68 | | | | 2.97 | | | | 1,209 | | | | 20 | |
| | See Notes to Financial Statements. | 203 |
Financial Highlights (concluded)
NEW YORK TAX FREE FUND
| | | | | Per Share Operating Performance: |
| | | | | Investment Operations: | | Distributions to
shareholders from: |
| | | | | | | |
| | | Net asset
value, beginning
of period | | Net
invest-
ment
income(a) | | Net
realized
and
unrealized
gain (loss) | | Total
from
invest-
ment
opera-
tions | | Net
investment
income | | Net
realized
gain | | Total
distri-
butions |
| Class A | | | | | | | | | | | | | | | | | | | | | | | | | | | | |
| 9/30/2022 | | $ | 12.06 | | | $ | 0.27 | | | $ | (2.16 | ) | | $ | (1.89 | ) | | $ | (0.27 | ) | | | $– | | | $ | (0.27 | ) |
| 9/30/2021 | | | 11.64 | | | | 0.27 | | | | 0.41 | | | | 0.68 | | | | (0.26 | ) | | | – | | | | (0.26 | ) |
| 9/30/2020 | | | 11.77 | | | | 0.27 | | | | (0.13 | ) | | | 0.14 | | | | (0.27 | ) | | | – | | | | (0.27 | ) |
| 9/30/2019 | | | 11.08 | | | | 0.29 | | | | 0.69 | | | | 0.98 | | | | (0.29 | ) | | | – | (c) | | | (0.29 | ) |
| 9/30/2018 | | | 11.32 | | | | 0.28 | | | | (0.24 | ) | | | 0.04 | | | | (0.28 | ) | | | – | | | | (0.28 | ) |
| Class C | | | | | | | | | | | | | | | | | | | | | | | | | | | | |
| 9/30/2022 | | | 12.04 | | | | 0.20 | | | | (2.15 | ) | | | (1.95 | ) | | | (0.20 | ) | | | – | | | | (0.20 | ) |
| 9/30/2021 | | | 11.63 | | | | 0.19 | | | | 0.41 | | | | 0.60 | | | | (0.19 | ) | | | – | | | | (0.19 | ) |
| 9/30/2020 | | | 11.75 | | | | 0.20 | | | | (0.13 | ) | | | 0.07 | | | | (0.19 | ) | | | – | | | | (0.19 | ) |
| 9/30/2019 | | | 11.06 | | | | 0.22 | | | | 0.69 | | | | 0.91 | | | | (0.22 | ) | | | – | (c) | | | (0.22 | ) |
| 9/30/2018 | | | 11.31 | | | | 0.21 | | | | (0.25 | ) | | | (0.04 | ) | | | (0.21 | ) | | | – | | | | (0.21 | ) |
| Class F | | | | | | | | | | | | | | | | | | | | | | | | | | | | |
| 9/30/2022 | | | 12.07 | | | | 0.28 | | | | (2.16 | ) | | | (1.88 | ) | | | (0.28 | ) | | | – | | | | (0.28 | ) |
| 9/30/2021 | | | 11.66 | | | | 0.28 | | | | 0.41 | | | | 0.69 | | | | (0.28 | ) | | | – | | | | (0.28 | ) |
| 9/30/2020 | | | 11.78 | | | | 0.28 | | | | (0.12 | ) | | | 0.16 | | | | (0.28 | ) | | | – | | | | (0.28 | ) |
| 9/30/2019 | | | 11.09 | | | | 0.30 | | | | 0.69 | | | | 0.99 | | | | (0.30 | ) | | | – | (c) | | | (0.30 | ) |
| 9/30/2018 | | | 11.33 | | | | 0.29 | | | | (0.24 | ) | | | 0.05 | | | | (0.29 | ) | | | – | | | | (0.29 | ) |
| Class F3 | | | | | | | | | | | | | | | | | | | | | | | | | | | | |
| 9/30/2022 | | | 12.07 | | | | 0.30 | | | | (2.17 | ) | | | (1.87 | ) | | | (0.29 | ) | | | – | | | | (0.29 | ) |
| 9/30/2021 | | | 11.65 | | | | 0.29 | | | | 0.42 | | | | 0.71 | | | | (0.29 | ) | | | – | | | | (0.29 | ) |
| 9/30/2020 | | | 11.78 | | | | 0.30 | | | | (0.13 | ) | | | 0.17 | | | | (0.30 | ) | | | – | | | | (0.30 | ) |
| 9/30/2019 | | | 11.08 | | | | 0.31 | | | | 0.70 | | | | 1.01 | | | | (0.31 | ) | | | – | (c) | | | (0.31 | ) |
| 9/30/2018 | | | 11.33 | | | | 0.30 | | | | (0.25 | ) | | | 0.05 | | | | (0.30 | ) | | | – | | | | (0.30 | ) |
| Class I | | | | | | | | | | | | | | | | | | | | | | | | | | | | |
| 9/30/2022 | | | 12.07 | | | | 0.29 | | | | (2.16 | ) | | | (1.87 | ) | | | (0.29 | ) | | | – | | | | (0.29 | ) |
| 9/30/2021 | | | 11.65 | | | | 0.29 | | | | 0.42 | | | | 0.71 | | | | (0.29 | ) | | | – | | | | (0.29 | ) |
| 9/30/2020 | | | 11.78 | | | | 0.29 | | | | (0.13 | ) | | | 0.16 | | | | (0.29 | ) | | | – | | | | (0.29 | ) |
| 9/30/2019 | | | 11.08 | | | | 0.31 | | | | 0.70 | | | | 1.01 | | | | (0.31 | ) | | | – | (c) | | | (0.31 | ) |
| 9/30/2018 | | | 11.33 | | | | 0.30 | | | | (0.25 | ) | | | 0.05 | | | | (0.30 | ) | | | – | | | | (0.30 | ) |
| (a) | Calculated using average shares outstanding during the period. |
| (b) | Total return for Classes A and C does not consider the effects of sales loads and assumes the reinvestment of all distributions. Total return for all other classes assumes the reinvestment of all distributions. |
| (c) | Amount less than $0.01. |
| | |
| 204 | See Notes to Financial Statements. |
| | | | | Ratios to Average Net Assets: | | Supplemental Data: |
| | | | | | | | | | | | | | |
Net
asset
value,
end of
period | | Total
return
(%)(b) | | Total
expenses
after
waivers
and/or reim-
bursements
(%) | | Total
expenses
(%) | | Net
investment income
(%) | | Net
assets,
end of
period
(000) | | Portfolio
turnover
rate
(%) |
| | |
| $ | 9.90 | | | | (15.91 | ) | | | 0.78 | | | | 0.78 | | | | 2.39 | | | $ | 322,138 | | | | 23 | |
| | 12.06 | | | | 5.90 | | | | 0.77 | | | | 0.77 | | | | 2.20 | | | | 390,194 | | | | 13 | |
| | 11.64 | | | | 1.21 | | | | 0.78 | | | | 0.78 | | | | 2.33 | | | | 357,909 | | | | 22 | |
| | 11.77 | | | | 8.98 | | | | 0.79 | | | | 0.79 | | | | 2.52 | | | | 332,822 | | | | 7 | |
| | 11.08 | | | | 0.36 | | | | 0.79 | | | | 0.79 | | | | 2.51 | | | | 249,147 | | | | 19 | |
| | | | | | | | | | | | | | | | | | | | | | | | | | | |
| | 9.89 | | | | (16.39 | ) | | | 1.42 | | | | 1.42 | | | | 1.74 | | | | 20,927 | | | | 23 | |
| | 12.04 | | | | 5.13 | | | | 1.42 | | | | 1.42 | | | | 1.56 | | | | 32,845 | | | | 13 | |
| | 11.63 | | | | 0.64 | | | | 1.44 | | | | 1.44 | | | | 1.68 | | | | 34,749 | | | | 22 | |
| | 11.75 | | | | 8.33 | | | | 1.40 | | | | 1.40 | | | | 1.92 | | | | 45,213 | | | | 7 | |
| | 11.06 | | | | (0.36 | ) | | | 1.41 | | | | 1.41 | | | | 1.89 | | | | 39,551 | | | | 19 | |
| | | | | | | | | | | | | | | | | | | | | | | | | | | |
| | 9.91 | | | | (15.81 | ) | | | 0.68 | | | | 0.68 | | | | 2.40 | | | | 19,360 | | | | 23 | |
| | 12.07 | | | | 6.00 | | | | 0.67 | | | | 0.67 | | | | 2.30 | | | | 71,401 | | | | 13 | |
| | 11.66 | | | | 1.31 | | | | 0.68 | | | | 0.68 | | | | 2.43 | | | | 63,388 | | | | 22 | |
| | 11.78 | | | | 9.08 | | | | 0.69 | | | | 0.69 | | | | 2.62 | | | | 55,301 | | | | 7 | |
| | 11.09 | | | | 0.46 | | | | 0.69 | | | | 0.69 | | | | 2.60 | | | | 44,093 | | | | 19 | |
| | | | | | | | | | | | | | | | | | | | | | | | | | | |
| | 9.91 | | | | (15.70 | ) | | | 0.54 | | | | 0.54 | | | | 2.65 | | | | 2,364 | | | | 23 | |
| | 12.07 | | | | 6.14 | | | | 0.54 | | | | 0.54 | | | | 2.41 | | | | 2,071 | | | | 13 | |
| | 11.65 | | | | 1.44 | | | | 0.56 | | | | 0.56 | | | | 2.56 | | | | 1,366 | | | | 22 | |
| | 11.78 | | | | 9.32 | | | | 0.56 | | | | 0.56 | | | | 2.74 | | | | 1,234 | | | | 7 | |
| | 11.08 | | | | 0.49 | | | | 0.55 | | | | 0.55 | | | | 2.73 | | | | 896 | | | | 19 | |
| | | | | | | | | | | | | | | | | | | | | | | | | | | |
| | 9.91 | | | | (15.73 | ) | | | 0.58 | | | | 0.58 | | | | 2.66 | | | | 70,220 | | | | 23 | |
| | 12.07 | | | | 6.11 | | | | 0.57 | | | | 0.57 | | | | 2.38 | | | | 43,385 | | | | 13 | |
| | 11.65 | | | | 1.41 | | | | 0.59 | | | | 0.59 | | | | 2.51 | | | | 29,600 | | | | 22 | |
| | 11.78 | | | | 9.29 | | | | 0.59 | | | | 0.59 | | | | 2.72 | | | | 12,674 | | | | 7 | |
| | 11.08 | | | | 0.47 | | | | 0.59 | | | | 0.59 | | | | 2.71 | | | | 8,534 | | | | 19 | |
| | See Notes to Financial Statements. | 205 |
Notes to Financial Statements
Lord Abbett Municipal Income Fund, Inc. (the “Company”) is registered under the Investment Company Act of 1940, as amended (the “Act”), as an open-end management investment company. The Company was organized as a Maryland corporation on December 27, 1983.
The Company currently consists of the following nine funds (separately, a “Fund” and collectively, the “Funds”) and their respective active share classes:
| Funds | Classes |
| Lord Abbett Short Duration Tax Free Fund (“Short Duration”) | A,C,F,F3 and I |
| Lord Abbett Intermediate Tax Free Fund (“Intermediate”) | A,C,F,F3 and I |
| Lord Abbett National Tax-Free Income Fund (“National”) | A,C,F,F3 and I |
| Lord Abbett High Income Municipal Bond Fund (“High Income”) | A,C,F,F3 and I |
| Lord Abbett Short Duration High Income Municipal Bond Fund (“Short Duration High Income”) | A,C,F,F3 and I |
| Lord Abbett Sustainable Municipal Bond Fund (“Sustainable”) | A,C,F,F3 and I |
| Lord Abbett California Tax-Free Income Fund (“California”) | A,C,F,F3 and I |
| Lord Abbett New Jersey Tax-Free Income Fund (“New Jersey”) | A,F,F3 and I |
| Lord Abbett New York Tax-Free Income Fund (“New York”) | A,C,F,F3 and I |
Short Duration, Intermediate, National, High Income, Short Duration High Income, Sustainable and California are diversified as defined in the Act. New Jersey and New York are non-diversified as defined in the Act.
The investment objective of each Fund (except for High Income and Short Duration High Income) is to seek the maximum amount of interest income exempt from federal income tax as is consistent with reasonable risk. The investment objective of High Income and Short Duration High Income is to seek a high level of income exempt from federal income tax. Each of California, New Jersey and New York also seeks as high a level of interest income exempt from the personal income tax of its corresponding state as is consistent with reasonable risk. In addition, New York seeks as high a level of interest income exempt from New York City personal income tax as is consistent with reasonable risk.
Each class has different expenses and dividends. A front-end sales charge is normally added to the net asset value (“NAV”) for Class A shares. There is no front-end sales charge in the case of Class C, F, F3 and I shares, although there may be a contingent deferred sales charge (“CDSC”) in certain cases as follows: Class A shares purchased without a sales charge and redeemed before the first day of the month in which the eighteen-month anniversary of the purchase falls (subject to certain exceptions as set forth in each Fund’s prospectus); and Class C shares redeemed before the first anniversary of purchase. Class C shares will automatically convert to Class A shares on the 25th day of the month (or, if the 25th day is not a business day, the next business day thereafter) following the eighth anniversary of the month on which the purchase order was accepted, provided that the Funds or financial intermediary through which a shareholder purchased Class C shares has records verifying that the C shares have been held at least eight years.
On September 28, 2021, the Board of Directors (the “Board”) approved a change in the name of Lord Abbett High Yield Municipal Bond Fund to Lord Abbett High Income Municipal Bond Fund and Lord Abbett Short Duration High Yield Municipal Bond Fund to Lord Abbett Short Duration High Income Municipal Bond Fund, each effective November 1, 2021. Sustainable commenced operations on January 5, 2022.
206
Notes to Financial Statements (continued)
The preparation of the financial statements in conformity with accounting principles generally accepted in the United States of America (“U.S. GAAP”) requires management to make certain estimates and assumptions that affect the reported amounts of assets and liabilities and disclosure of contingent assets and liabilities at the date of the financial statements and the reported amounts of increases and decreases in net assets from operations during the reporting period. Actual results could differ from those estimates. Each Fund is considered an investment company under U.S. GAAP and follows the accounting and reporting guidance applicable to investment companies.
| 2. | SIGNIFICANT ACCOUNTING POLICIES |
| (a) | Investment Valuation–Under procedures approved by the Funds’ Board, the Board has designated the determination of fair value of the Funds’ portfolio investments to Lord, Abbett & Co. LLC (“Lord Abbett”), as valuation designee. Accordingly, Lord Abbett is responsible for, among other things, assessing and managing valuation risks, establishing, applying and testing fair value methodologies, and evaluating pricing services. Lord Abbett has formed a Pricing Committee that performs these responsibilities on behalf of Lord Abbett, administers the pricing and valuation of portfolio investments and ensures that prices utilized reasonably reflect fair value. Among other things, these procedures allow Lord Abbett, subject to Board oversight, to utilize independent pricing services, quotations from securities and financial instrument dealers and other market sources to determine fair value. |
| | |
| | Securities are valued based on evaluated prices supplied by independent pricing services, which reflect broker/dealer supplied valuations and the independent pricing services’ own electronic data processing techniques. Exchange traded options and futures contracts are valued at the last quoted sale price in the market where they are principally traded. If no sale has occurred, the mean between the most recently quoted bid and ask prices is used. |
| | |
| | Securities for which prices are not readily available are valued at fair value as determined by the Pricing Committee. The Pricing Committee considers a number of factors, including observable and unobservable inputs, when arriving at fair value. The Pricing Committee may use observable inputs such as yield curves, broker quotes, observable trading activity, option adjusted spread models and other relevant information to determine the fair value of portfolio investments. The Board or a designated committee thereof periodically reviews reports that may include fair value determinations made by the Pricing Committee, related market activity, inputs and assumptions, and retrospective comparison of prices of subsequent purchases and sales transactions to fair value determinations made by the Pricing Committee. |
| | |
| | Short-term securities with 60 days or less remaining to maturity are valued using the amortized cost method, which approximates fair value. |
| | |
| (b) | Security Transactions–Security transactions are recorded as of the date that the securities are purchased or sold (trade date). Realized gains and losses on sales of portfolio securities are calculated using the identified-cost method. Realized and unrealized gains (losses) are allocated to each class of shares based upon the relative proportion of net assets at the beginning of the day. |
| | |
| (c) | Investment Income–Dividend income is recorded on the ex-dividend date. Interest income is recorded on the accrual basis as earned. Discounts are accreted and premiums are amortized using the effective interest method and are included in Interest and other, if applicable, on the Statements of Operations. Investment income is allocated to each class of shares based upon the relative proportion of net assets at the beginning of the day. |
207
Notes to Financial Statements (continued)
| (d) | Income Taxes–It is the policy of each Fund to meet the requirements of Subchapter M of the Internal Revenue Code applicable to regulated investment companies and to distribute substantially all taxable income and capital gains to its shareholders. Therefore, no income tax provision is required. |
| | |
| | Each Fund files U.S. federal and various state and local tax returns. No income tax returns are currently under examination. The statute of limitations on each Fund’s, except Sustainable, filed U.S. federal tax returns remains open for the fiscal years ended September 30, 2019 through September 30, 2022. The statutes of limitation for Sustainable filed U.S. federal tax returns remain open for the period ended September 30, 2022. The statutes of limitations on the Company’s state and local tax returns may remain open for an additional year depending upon the Funds’ jurisdiction. |
| | |
| (e) | Expenses–Expenses incurred by the Company that do not specifically relate to an individual fund are generally allocated to the Funds within the Company on a pro rata basis by relative net assets. Expenses, excluding class-specific expenses, are allocated to each class of shares based upon the relative proportion of net assets at the beginning of the day. In addition, Class F3 bear their class-specific share of shareholder servicing expenses. Class A, C and F shares bear their class-specific share of all expenses and fees relating to the Funds’ 12b-1 Distribution Plan. |
| | |
| (f) | Futures Contracts–Each Fund may purchase and sell futures contracts to enhance returns, to attempt to economically hedge some of its investment risk, or as a substitute position in lieu of holding the underlying asset on which the instrument is based. At the time of entering into a futures transaction, an investor is required to deposit and maintain a specified amount of cash or eligible securities called “initial margin.” Subsequent payments made or received by the Funds called “variation margin” are made on a daily basis as the market price of the futures contract fluctuates. Each Fund will record an unrealized gain (loss) based on the amount of variation margin. When a contract is closed, a realized gain (loss) is recorded equal to the difference between the opening and closing value of the contract. |
| | |
| (g) | When-Issued Municipal Bonds–Each Fund may purchase new issues of municipal bonds, which are generally offered on a when-issued basis. Payment and delivery may take place after customary settlement period for that security. |
| | |
| (h) | Municipal Bonds Held in Trust–Each Fund may invest in leveraged residual certificates (“TOB Residuals”) issued by tender option bond trusts (“TOBs”). A TOB is established by a third party sponsor forming a special purpose entity into which a Fund, or an agent on behalf of the Fund, transfers municipal securities. A TOB typically issues two classes of beneficial interests: short-term floating rate certificates (trust certificates), which are sold to third party investors, and residual certificates, which are generally issued to the Fund which made the transfer or to affiliates of the Fund. Each Fund’s transfer of the municipal securities to a TOB is accounted for as a secured borrowing, therefore the municipal securities deposited into a TOB are presented as investments in a Fund’s Schedule of Investments and the proceeds from the transactions are reported as a Liability for Trust Certificates on the Statements of Assets and Liabilities. Similarly, proceeds from residual certificates issued to affiliates, if any, from the transaction are included in the Liability for Trust Certificates. Interest income from the underlying security is recorded by a Fund on an accrual basis. Interest expense incurred on the secured borrowing and other expenses related to remarketing, administration and trustee services to a TOB are reported as expenses of a Fund. The floating rate certificates have |
208
Notes to Financial Statements (continued)
interest rates that generally reset weekly and their holders have the option to tender certificates to the TOB for redemption at par at each reset date. The residual interests held by a Fund include the right of the Fund (1) to cause the holders of a proportional share of floating rate certificates to tender their certificates at par and (2) to transfer a corresponding share of the municipal securities from the TOB to the Fund. The TOB may also be terminated without the consent of the Fund upon the occurrence of certain events as defined in the TOB agreements. Such termination events may include the bankruptcy or default of the municipal bond, a substantial downgrade in credit quality of the municipal bond, the inability of the TOB to obtain quarterly or annual renewal of the liquidity support agreement, a substantial decline in market value of the municipal bond or the inability to remarket the short-term floating rate certificates to third party investors.
The following is a summary of TOBs as of and during the fiscal year ended September 30, 2022:
| Fund | | Liability for
Trust Certificates | | Interest Rate
or Range of
Interest Rates | | Underlying
Municipal Bonds
Transferred
to TOBs | | Average
Trust
Certificates
Outstanding |
| Short Duration | | $ | – | | | | – | | | $ | – | | | $ | – |
| Intermediate | | | – | | | | – | | | | – | | | | – |
| National | | | 57,235,000 | | | | 2.49% – 2.64% | | | | 115,959,083 | | | | 25,001,250 |
| High Income | | | 33,820,000 | | | | 2.49% – 2.64% | | | | 68,396,528 | | | | 13,293,750 |
| Short Duration High Income | | | – | | | | – | | | | – | | | | – |
| Sustainable | | | – | | | | – | | | | – | | | | – |
| California | | | – | | | | – | | | | – | | | | – |
| New Jersey | | | – | | | | – | | | | – | | | | – |
| New York | | | – | | | | – | | | | – | | | | – |
| | Financial transactions executed through TOBs generally will underperform the market for fixed rate municipal bonds in a rising interest rate environment, but tend to outperform the market for fixed rate municipal bonds when interest rates decline or remain relatively stable. Should short-term interest rates rise, a Fund’s investment in TOB Residuals likely will adversely affect a Fund’s net investment income and distributions to shareholders. Fluctuations in the market value of municipal securities deposited into the TOB may adversely affect a Fund’s NAV per share. The carrying value of each Fund’s Liability for Trust Certificates approximates its fair value. |
| | |
| | While the Funds’ investment policies and restrictions expressly permit investments in inverse floating rate securities such as TOB Residuals, they generally do not allow the Funds to borrow money for purposes of making investments. The Funds’ management believes that the Funds’ restrictions on borrowings do not apply to TOB transactions, accounted for as secured borrowings. |
| | |
| (i) | Fair Value Measurements–Fair value is defined as the price that each Fund would receive upon selling an investment or transferring a liability in an orderly transaction to an independent buyer in the principal or most advantageous market of the investment. A three-tier hierarchy is used to maximize the use of observable market data and minimize the use of unobservable inputs and to establish classification of fair value measurements for disclosure purposes. Inputs refer broadly to the assumptions that market participants would use in pricing the asset or liability, including assumptions about risk - for example, the risk inherent in a particular valuation technique used to measure fair value (such as a pricing model) and/or the risk inherent in the inputs to the |
209
Notes to Financial Statements (continued)
valuation technique. Inputs may be observable or unobservable. Observable inputs reflect the assumptions market participants would use in pricing the asset or liability. Observable inputs are based on market data obtained from sources independent of the reporting entity. Unobservable inputs reflect the reporting entity’s own assumptions about the assumptions market participants would use in pricing the asset or liability. Unobservable inputs are based on the best information available in the circumstances. The three-tier hierarchy classification is determined based on the lowest level of inputs that is significant to the fair value measurement, and is summarized in the three broad Levels listed below:
| | ● | Level 1 – | unadjusted quoted prices in active markets for identical investments; |
| | | | |
| | ● | Level 2 – | other significant observable inputs (including quoted prices for similar investments, interest rates, prepayment speeds, credit risk, etc.); and |
| | | | |
| | ● | Level 3 – | significant unobservable inputs (including each Fund’s own assumptions in determining the fair value of investments). |
A summary of inputs used in valuing each Fund’s investments and other financial instruments as of September 30, 2022 and, if applicable, Level 3 rollforwards for the fiscal year then ended is included in each Fund’s Schedule of Investments.
Changes in valuation techniques may result in transfers into or out of an assigned level within the three-tier hierarchy. The inputs or methodology used for valuing securities are not necessarily an indication of the risk associated with investing in those securities.
| 3. | MANAGEMENT FEE AND OTHER TRANSACTIONS WITH AFFILIATES |
Management Fee
The Company has a management agreement with Lord Abbett, pursuant to which Lord Abbett provides each Fund with investment management services and executive and other personnel, provides office space and pays for ordinary and necessary office and clerical expenses relating to research and statistical work and supervision of each Fund’s investment portfolio.
The management fee for Short Duration is based on the Fund’s average daily assets at the following annual rates:
| First $2 billion | .34% |
| Next $3 billion | .32% |
| Over $5 billion | .29% |
The management fee for Intermediate is based on the Fund’s average daily assets at the following annual rates:
| First $2 billion | .40% |
| Next $3 billion | .375% |
| Next $5 billion | .35% |
| Over $10 billion | .32% |
The management fee for each of National, California, New Jersey and New York is based on the Fund’s average daily net assets at the following annual rates:
| First $1 billion | .45% |
| Next $1 billion | .40% |
| Over $2 billion | .35% |
210
Notes to Financial Statements (continued)
The management fee for High Income is based on the Fund’s average daily assets at the following annual rates:
| First $1 billion | .50% |
| Next $1 billion | .45% |
| Over $2 billion | .40% |
The management fee for Short Duration High Income is based on the Fund’s average daily assets at the following annual rates:
| First $2 billion | .40% |
| Next $1 billion | .375% |
| Over $3 billion | .35% |
The management fee for Sustainable is based on the Fund’s average daily assets at the following annual rates:
| First $1 billion | .32% |
| Over $1 billion | .29% |
For the fiscal year ended September 30, 2022, the effective management fee, net of any applicable waivers, was at the following annualized rate of each Fund’s average daily net assets:
| | Net Effective
Management Fee |
| Short Duration | .34% |
| Intermediate | .38% |
| National | .39% |
| High Income | .44% |
| Short Duration High Income | .33% |
| Sustainable | .00% |
| California | .45% |
| New Jersey | .43% |
| New York | .45% |
In addition, Lord Abbett provides certain administrative services to each Fund pursuant to an Administrative Services Agreement in return for a fee at an annual rate of ..04% of each Fund’s average daily net assets. Lord Abbett voluntarily waived the following fund administration fees during the fiscal year ended September 30, 2022:
| Fund | Fund
Administration Fee |
| Short Duration | $25,798 |
| Intermediate | 69,196 |
| National | 51,537 |
| High Income | 47,341 |
| Short Duration High Income | 23,660 |
| Sustainable | 2,250 |
| California | 8,836 |
| New Jersey | 1,161 |
| New York | 7,478 |
211
Notes to Financial Statements (continued)
For the fiscal year ended September 30, 2022 and continuing through January 31, 2023 for all Funds except Sustainable, and for the period January 5, 2022 through January 31, 2023 for Sustainable, Lord Abbett has contractually agreed to waive its fees and reimburse expenses to limit the total net annual operating expenses for each class, excluding certain of the Funds’ expenses and interest related expenses, to the following annual rates:
| | | Effective February 1, 2022 | | Prior to February 1, 2022 |
| | | Classes | | Classes |
| Fund | | A,C,F and I | | F3 | | A,C,F and I | | F3 |
| Short Duration | | .45% | | .41% | | .45% | | .42% |
| Short Duration High Income | | .50% | | .44% | | .50% | | .43% |
| Sustainable | | .43% | | .39% | | .43% | | .39% |
| New Jersey | | .62% | | .58% | | .62% | | .59% |
All contractual fee waivers and expense reimbursement agreements between the Funds and Lord Abbett may be terminated only upon the approval of the Board.
12b-1 Distribution Plan
Each Fund has adopted a distribution plan with respect to Class A, C, and F shares pursuant to Rule 12b-1 under the Act, which provides for the payment of ongoing distribution and service fees to Lord Abbett Distributor LLC (“the Distributor”), an affiliate of Lord Abbett. The following annual rates have been authorized by the Board pursuant to the plan:
| Fees | Class A | Class C(1) | Class F(2) |
| Service | .15% | .75% | – |
| Distribution | .05% | .25% | .10% |
| (1) | The Rule 12b-1 fee each applicable Fund pays on Class C shares is a blended rate based on 1.00% of each Fund’s daily net assets attributable to Class C shares held less than 1 year and .80% (25% service and 55% distribution) of each Fund’s daily net assets attributable to Class C shares for 1 year or more. All Class C shareholders will bear Rule 12b-1 fees at the same rate. |
| (2) | The Class F share Rule 12b-1 fee may be designated as a service fee in limited circumstances as described in the Funds’ prospectus. |
Class F3 and Class I shares do not have a distribution plan.
Commissions
Distributor received the following commissions on sales of shares of the Funds, after concessions were paid to authorized dealers, for the fiscal year ended September 30, 2022:
| | | Distributor
Commissions | | | Dealers’
Concessions |
| Short Duration | | $ | 31,203 | | | | $200,962 |
| Intermediate | | | 97,806 | | | | 647,248 |
| National | | | 154,142 | | | | 972,875 |
| High Income | | | 114,922 | | | | 744,729 |
| Short Duration High Income | | | 10,727 | | | | 64,046 |
| Sustainable | | | – | | | | – |
| California | | | 9,441 | | | | 61,578 |
| New Jersey | | | 2,883 | | | | 15,719 |
| New York | | | 6,345 | | | | 43,635 |
212
Notes to Financial Statements (continued)
Distributor received the following amount of CDSCs for the fiscal year ended September 30, 2022:
| | | Class A | | | Class C |
| Short Duration | | | 129,097 | | | | 2,582 |
| Intermediate | | | 304,950 | | | | 27,945 |
| National | | | 254,028 | | | | 19,004 |
| High Income | | | 300,475 | | | | 45,557 |
| Short Duration High Income | | | 40,777 | | | | 934 |
| Sustainable | | | – | | | | – |
| California | | | 43,409 | | | | 4,910 |
| New Jersey | | | – | | | | – |
| New York | | | 31,697 | | | | 4,977 |
One Director and certain of the Funds’ officers have an interest in Lord Abbett.
| 4. | DISTRIBUTIONS AND CAPITAL LOSS CARRYFORWARDS |
Dividends from net investment income, if any, are declared daily and paid monthly. Taxable net realized gains from investment transactions, reduced by allowable capital loss carryforwards, if any, are declared and distributed to shareholders at least annually. The capital loss carryforward amount, if any, is available to offset future net capital gains. Dividends and distributions to shareholders are recorded on the ex-dividend date. The amounts of dividends and distributions from net investment income and net realized capital gains are determined in accordance with federal income tax regulations, which may differ from U.S. GAAP. These book/tax differences are either considered temporary or permanent in nature. To the extent these differences are permanent in nature, such amounts are reclassified within the components of net assets based on their federal tax basis treatment; temporary differences do not require reclassification. Dividends and distributions, which exceed earnings and profits for tax purposes, are reported as a tax return of capital.
The tax character of distributions paid during the fiscal year ended September 30, 2022 and fiscal year ended September 30, 2021 was as follows:
| | | Short Duration Tax Free Fund | | | Intermediate Tax Free Fund |
| | | Year Ended
9/30/2022 | | | Year Ended
9/30/2021 | | | Year Ended
9/30/2022 | | | Year Ended
9/30/2021 |
| Distributions paid from: | | | | | | | | | | | | | | | |
| Tax-exempt income | | $ | 24,078,685 | | | $ | 21,608,365 | | | $ | 130,537,335 | | | $ | 132,423,213 |
| Ordinary income | | | 85,118 | | | | – | | | | 457,520 | | | | 905,129 |
| Total distributions paid | | $ | 24,163,803 | | | $ | 21,608,365 | | | $ | 130,994,855 | | | $ | 133,328,342 |
| | | | | | | | | | | | | | | | |
| | | | | | National Tax Free Fund | | |
| | | High Income
Municipal Bond Fund |
| | | Year Ended
9/30/2022 | | | Year Ended
9/30/2021 | | | Year Ended
9/30/2022 | | | Year Ended
9/30/2021 |
| Distributions paid from: | | | | | | | | | | | | | | | |
| Tax-exempt income | | $ | 109,477,825 | | | $ | 108,855,800 | | | $ | 137,361,933 | | | $ | 127,275,750 |
| Ordinary income | | | 549,801 | | | | – | | | | 1,658,444 | | | | 1,743,158 |
| Total distributions paid | | $ | 110,027,626 | | | $ | 108,855,800 | | | $ | 139,020,377 | | | $ | 129,018,908 |
213
Notes to Financial Statements (continued)
| | | Short Duration High Income
Municipal Bond Fund | | | | | Sustainable Municipal
Bond Fund |
| | | Year Ended
9/30/2022 | | | Year Ended
9/30/2021 | | | | | | Period Ended
9/30/2022 |
| Distributions paid from: | | | | | | | | | | | | | | | |
| Tax-exempt income | | $ | 24,801,277 | | | $ | 17,393,028 | | | | | | | $ | 53,408 |
| Ordinary income | | | 726,034 | | | | 173,960 | | | | | | | | – |
| Total distributions paid | | $ | 25,527,311 | | | $ | 17,566,988 | | | | | | | $ | 53,408 |
| | | | | | | | | |
| | | | | California Tax Free Fund | | | | New Jersey Tax Free Fund |
| | | Year Ended
9/30/2022 | | | Year Ended
9/30/2021 | | | Year Ended
9/30/2022 | | | Year Ended
9/30/2021 |
| Distributions paid from: | | | | | | | | | | | | | | | |
| Tax-exempt income | | $ | 12,532,074 | | | $ | 12,664,981 | | | $ | 2,977,642 | | | $ | 2,964,092 |
| Ordinary income | | | 53,863 | | | | 274,386 | | | | 2,343 | | | | – |
| Total distributions paid | | $ | 12,585,937 | | | $ | 12,939,367 | | | $ | 2,979,985 | | | $ | 2,964,092 |
| | | | | | | | | | | | | |
| | | | | New York Tax Free Fund | | | | | | | | |
| | | Year Ended
9/30/2022 | | | Year Ended
9/30/2021 | | | | | | | | |
| Distributions paid from: | | | | | | | | | | | | | | | |
| Tax-exempt income | | $ | 11,731,906 | | | $ | 11,338,156 | | | | | | | | |
| Ordinary income | | | 8,377 | | | | – | | | | | | | | |
| Total distributions paid | | $ | 11,740,283 | | | $ | 11,338,156 | | | | | | | | |
As of September 30, 2022, the components of accumulated gains (losses) on a tax-basis were as follows:
| | | Short Duration | | | Intermediate | | | National | |
| Undistributed tax-exempt income – net | | $ | 4,030,968 | | | $ | 24,190,139 | | | $ | 17,054,051 | |
| Total undistributed earnings | | | 4,030,968 | | | | 24,190,139 | | | | 17,054,051 | |
| Capital loss carryforwards* | | | (51,287,627 | ) | | | (217,826,869 | ) | | | (213,961,316 | ) |
| Temporary differences | | | (3,190,424 | ) | | | (11,787,911 | ) | | | (9,713,847 | ) |
| Unrealized gains (losses) – net | | | (89,290,582 | ) | | | (430,593,312 | ) | | | (357,598,415 | ) |
| Total accumulated gains (losses) – net | | $ | (139,737,665 | ) | | $ | (636,017,953 | ) | | $ | (564,219,527 | ) |
| | | | | | | | | | |
| | | High Income | | | Short Duration
High Income | | | Sustainable | |
| Undistributed tax-exempt income – net | | $ | 35,893,966 | | | $ | 4,170,582 | | | $ | 10,696 | |
| Total undistributed earnings | | | 35,893,966 | | | | 4,170,582 | | | | 10,696 | |
| Capital loss carryforwards* | | | (324,875,155 | ) | | | (73,680,083 | ) | | | (282,224 | ) |
| Temporary differences | | | (11,788,146 | ) | | | (2,444,292 | ) | | | (9,042 | ) |
| Unrealized gains (losses) – net | | | (520,320,146 | ) | | | (66,254,790 | ) | | | (325,537 | ) |
| Total accumulated gains (losses) – net | | $ | (821,089,481 | ) | | $ | (138,208,583 | ) | | $ | (606,107 | ) |
| | | | | | | | | | |
| | | California | | | New Jersey | | | New York | |
| Undistributed tax-exempt income – net | | $ | 1,528,105 | | | $ | 244,449 | | | $ | 656,191 | |
| Total undistributed earnings | | | 1,528,105 | | | | 244,449 | | | | 656,191 | |
| Capital loss carryforwards* | | | (19,968,944 | ) | | | (1,146,346 | ) | | | (11,309,032 | ) |
| Temporary differences | | | (1,194,119 | ) | | | (275,505 | ) | | | (1,151,444 | ) |
| Unrealized gains (losses) – net | | | (48,484,665 | ) | | | (13,576,763 | ) | | | (54,099,016 | ) |
| Total accumulated gains (losses) – net | | $ | (68,119,623 | ) | | $ | (14,754,165 | ) | | $ | (65,903,301 | ) |
| * | The capital losses will carry forward indefinitely. |
214
Notes to Financial Statements (continued)
As of September 30, 2022, the aggregate unrealized security gains and losses on investments and other financial instruments based on cost for U.S. federal income tax purposes were as follows:
| | | Tax Cost | | | Gross
Unrealized
Gain | | | Gross
Unrealized
Loss | | | Net
Unrealized
Gain/(Loss) | |
| Short Duration | | $ | 2,113,852,120 | | | $ | 256,442 | | | $ | (89,547,024 | ) | | $ | (89,290,582 | ) |
| Intermediate | | | 5,399,421,464 | | | | 13,581,183 | | | | (444,174,495 | ) | | | (430,593,312 | ) |
| National | | | 3,704,331,387 | | | | 13,047,913 | | | | (370,646,328 | ) | | | (357,598,415 | ) |
| High Income | | | 3,881,907,005 | | | | 27,165,667 | | | | (547,485,808 | ) | | | (520,320,141 | ) |
| Short Duration High Income | | | 925,129,764 | | | | 704,814 | | | | (66,959,604 | ) | | | (66,254,790 | ) |
| Sustainable | | | 4,440,388 | | | | – | | | | (325,537 | ) | | | (325,537 | ) |
| California | | | 491,948,233 | | | | 524,968 | | | | (49,009,633 | ) | | | (48,484,665 | ) |
| New Jersey | | | 114,591,975 | | | | 300,484 | | | | (13,877,247 | ) | | | (13,576,763 | ) |
| New York | | | 485,061,540 | | | | 526,813 | | | | (54,625,829 | ) | | | (54,099,016 | ) |
The difference between book-basis and tax-basis unrealized gains (losses) is attributable to the tax treatment of accretion on market discount, tender option bond trusts, other financial instruments and wash sales.
| 5. | PORTFOLIO SECURITIES TRANSACTIONS |
Purchases and sales of investment securities (excluding short-term investments) for the fiscal year ended September 30, 2022 were as follows:
| | | Purchases | | | Sales | |
| Short Duration | | $ | 817,788,946 | | | $ | 890,942,399 | |
| Intermediate | | | 1,919,010,586 | | | | 2,549,983,389 | |
| National | | | 1,596,038,638 | | | | 1,870,316,743 | |
| High Income | | | 1,699,442,420 | | | | 2,030,737,393 | |
| Short Duration High Income | | | 888,197,515 | | | | 1,010,679,403 | |
| Sustainable | | | 8,743,655 | | | | 3,966,608 | |
| California | | | 232,539,397 | | | | 277,857,786 | |
| New Jersey | | | 13,819,906 | | | | 23,016,982 | |
| New York | | | 113,484,142 | | | | 118,379,050 | |
There were no purchases or sales of U.S. Government securities for the fiscal year ended September 30, 2022.
| 6. | DISCLOSURES ABOUT DERIVATIVE INSTRUMENTS AND HEDGING ACTIVITIES |
Each Fund, except Short Duration and Sustainable, entered into U.S. Treasury futures contracts during the fiscal year ended September 30, 2022 (as described in Note 2(f)) to economically hedge against changes in interest rates. The Funds bear the risk of interest rates moving unexpectedly, in which case the Funds may not achieve the anticipated benefits of the futures contracts and realize a loss. There is minimal counterparty credit risk to the Funds since futures are exchange traded and the exchange’s clearinghouse, as counterparty to all exchange traded futures, guarantees futures against default.
As of September 30, 2022, the Funds had interest rate futures contracts with cumulative net unrealized appreciation/depreciation which are included in the Schedules of Investments. Only the current day’s variation margin is included in the Statements of Assets and Liabilities. The net realized gain (loss) on futures contracts and change in unrealized appreciation/depreciation on futures contracts are included in the Statements of Operations under the captions Net realized gain (loss) on futures contracts and Net change in unrealized appreciation/depreciation on futures contracts, respectively.
215
Notes to Financial Statements (continued)
The following is a summary of U.S. Treasury futures contracts as of and during the fiscal year ended September 30, 2022:
| | | Net Unrealized
Appreciation
(Depreciation) as of
September 30, 2022 | | | Net
Realized
Gain (Loss | ) | | Net Change
in Unrealized
Appreciation
(Depreciation | ) | | Average
Number of
Contracts* |
| Intermediate | | $ | 5,391,392 | | | $ | (2,392,155 | ) | | $ | 5,391,392 | | | | 202 |
| National | | | 4,361,750 | | | | 395,810 | | | | 3,924,740 | | | | 156 |
| High Income | | | 5,915,690 | | | | 2,159,294 | | | | 5,055,472 | | | | 222 |
| Short Duration High Income | | | 2,720,831 | | | | 10,075,434 | | | | 2,022,916 | | | | 709 |
| California | | | 583,853 | | | | 36,419 | | | | 527,571 | | | | 29 |
| New Jersey | | | 107,168 | | | | (21,888 | ) | | | 107,168 | | | | 3 |
| New York | | | 450,107 | | | | (91,580 | ) | | | 450,107 | | | | 14 |
| * | Calculated based on the number of contracts for the fiscal year ended September 30, 2022. |
| 7. | DISCLOSURES ABOUT OFFSETTING ASSETS AND LIABILITIES |
The Financial Accounting Standards Board (“FASB”) requires disclosure to help better assess the effect or potential effect of offsetting arrangements on a fund’s financial position. These requirements include the disclosure of gross and net information about recognized assets and liabilities eligible for offset in the Statement of Assets and Liabilities; and to disclose such amounts subject to an enforceable master netting agreement or similar agreement, by a counterparty. A master netting agreement is an agreement between a fund and a counterparty which provides for the net settlement of amounts owed under all contracts traded under that agreement, as well as cash collateral, through a single payment by one party to the other in the event of default on or termination of any one contract. The Funds’ accounting policy with respect to balance sheet offsetting is that, absent an event of default by the counterparty or a termination of the agreement, the master netting agreement does not result in an offset of reported amounts of financial assets and liabilities in the Statement of Assets and Liabilities across transactions between a Fund and the applicable counterparty. As of September 30, 2022, the Funds did not have assets or liabilities subject to the FASB disclosure requirements.
| 8. | DIRECTORS’ REMUNERATION |
The Company’s officers and the one Director, who are associated with Lord Abbett, do not receive any compensation from the Company for serving in such capacities. Independent Directors’ fees are allocated among all Lord Abbett-sponsored funds based on the net assets of each fund. There is an equity-based plan available to all Independent Directors under which Independent Directors may elect to defer receipt of an additional portion of Directors’ fees. The deferred amounts are treated as though equivalent dollar amounts had been invested in the funds. Such amounts and earnings accrued thereon are included in Directors’ fees on the Statements of Operations and in Directors’ fees payable on the Statements of Assets and Liabilities and are not deductible for U.S. federal income tax purposes until such amounts are paid.
The Company has entered into an arrangement with its transfer agent and custodian, whereby credits realized as a result of uninvested cash balances are used to reduce a portion of each Fund’s expenses.
216
Notes to Financial Statements (continued)
For the period ended August 3, 2022, with the exception of Sustainable, the Funds and certain other funds managed by Lord Abbett (collectively, the “Participating Funds”) entered into a syndicated line of credit facility with various lenders for $1.275 billion (the “Syndicated Facility”) whereas State Street Bank and Trust Company (“SSB”) participated as a lender and as agent for the lenders. The Participating Funds were subject to graduated borrowing limits of one-third of fund net assets (if fund net assets are less than $750 million), $250 million, $300 million, $700 million, or $1 billion, based on past borrowings and likelihood of future borrowings, among other factors.
Effective August 4, 2022, the Participating Funds, including Sustainable, entered into a Syndicated Facility with various lenders for $1.625 billion whereas SSB participates as a lender and as agent for the lenders. The Participating Funds are subject to graduated borrowing limits of one-third of fund net assets (if fund net assets are less than $750 million), $250 million, $300 million, $700 million, or $1 billion, based on past borrowings and likelihood of future borrowings, among other factors.
For the period ended August 3, 2022, the Participating Funds, with the exception of Sustainable, were party to an additional line of credit facility with SSB for $330 million (the “Bilateral Facility”), $250 million committed and $80 million uncommitted. Under the Bilateral Facility, the Participating Funds were subject to graduated borrowing limits of one-third of fund net assets (if net assets are less than $750 million), $250 million, $300 million, or $330 million, based on past borrowings and likelihood of future borrowings, among other factors.
Effective August 4, 2022, the Participating Funds, including Sustainable, are party to an additional uncommitted line of credit facility with SSB for $330 million. Under the Bilateral Facility, the Participating Funds are subject to borrowing limits of one-third of fund net assets (if net assets are less than $750 million), or $250 million, based on past borrowings and likelihood of future borrowings, among other factors.
The Syndicated Facility and the Bilateral Facility are to be used for temporary or emergency purposes as additional sources of liquidity to satisfy redemptions.
For period ended September 30, 2022, the Funds did not utilize the Syndicated Facility or Bilateral Facility.
| 11. | INTERFUND LENDING PROGRAM |
Pursuant to an exemptive order issued by the U.S. Securities and Exchange Commission (“SEC exemptive order”) certain registered open-end management investment companies managed by Lord Abbett, including each Fund, participate in a joint lending and borrowing program (the “Interfund Lending Program”). The SEC exemptive order allows the funds that participate in the Interfund Lending Program to borrow money from and lend money to each other for temporary or emergency purposes subject to the limitations and conditions.
For the fiscal year ended September 30, 2022, the following Funds participated as lenders in the Interfund Lending Program. For the period in which the loan was outstanding, the average amount loaned, interest rate and interest income were as follows:
| | | Average | | | Average | | Interest |
| Fund | | Amount Loaned | | | Interest Rate | | Income |
| National | | | $25,574,802 | | | | 0.65 | % | | | $1,958 |
| High Income | | | 10,802,041 | | | | 1.58 | % | | | 1,902 |
| Short Duration High Income | | | 19,987,299 | | | | 1.57 | % | | | 860 |
217
Notes to Financial Statements (continued)
For the fiscal year ended September 30, 2022, the following Fund participated as a borrower in the Interfund Lending Program. For the period in which the loan was outstanding, average amount borrowed, interest rate and interest expense were as follows:
| | | Average | | | Average | | Interest |
| Fund | | Amount Borrowed | | | Interest Rate | | Expense |
| High Income Municipal Bond Fund | | | $10,228,858 | | | | 1.02 | % | | | $286 |
| 12. | CUSTODIAN AND ACCOUNTING AGENT |
SSB is the Company’s custodian and accounting agent. SSB performs custodial, accounting and recordkeeping functions relating to portfolio transactions and calculating each Fund’s NAV.
| 13. | SECURITIES LENDING AGREEMENT |
The Funds have established a securities lending agreement with Citibank, N.A. for the lending of securities to qualified brokers in exchange for securities or cash collateral equal to at least the market value of securities loaned, plus interest, if applicable. Cash collateral is invested in an approved money market fund. In accordance with the Funds’ securities lending agreement, the market value of securities on loan is determined each day at the close of business and any additional collateral required to cover the value of securities on loan is delivered to the Funds on the next business day. As with other extensions of credit, the Funds may experience a delay in the recovery of their securities or incur a loss should the borrower of the securities breach its agreement with the Funds or the borrower becomes insolvent at a time when the collateral is insufficient to cover the cost of repurchasing securities on loan. Any income earned from securities lending is included in securities lending net income on the Statements of Operations.
The initial collateral received by the funds is required to have a value equal to at least 100% of the market value of the securities loaned. The collateral must be marked-to-market daily to cover increases in the market value of the securities loaned (or potentially a decline in the value of the collateral). In general, the risk of borrower default will be borne by Citibank, N.A.; the Funds will bear the risk of loss with respect to the investment of the cash collateral. The advantage of such loans is that the Funds continue to receive income on loaned securities while receiving a portion of any securities lending fees and earning returns on the cash amounts which may be reinvested for the purchase of investments in securities.
As of September 30, 2022, the Funds did not loan any securities.
Each Fund’s performance and the fair value of its investments will vary in response to changes in interest rates and other market factors. As interest rates rise, a Fund’s investments typically will lose value. This risk is usually greater for long-term bonds and particularly for TOB Residuals. As a result, each Fund, to the extent it invests in long-term bonds and TOB Residuals, is subject to such greater market risk. During periods of falling interest rates, a Fund’s investments may gain value; however, because Short Duration and Short Duration High Income typically invest in shorter term bonds, those Funds are subject to the risk that they will underperform funds invested in longer-term bonds during such periods.
Additional risks that could reduce each Fund’s performance or increase volatility include call risk, credit risk, defaulted bonds risk (High Income and Short Duration High Income only), derivatives risk, distressed debt risk (High Income and Short Duration High Income only), extension risk, fixed income securities risk, governmental risk, industry risk, liquidity risk, market and portfolio management risks,
218
Notes to Financial Statements (continued)
market disruption and geopolitical risk, state and territory risks, taxability risk and zero coupon, deferred interest, pay-in-kind, and capital appreciation bonds risk (all Funds except Short Duration, Intermediate, and Short Duration High Income). Credit risk varies among states based upon the economic and fiscal conditions of each state and the municipalities within the state.
There is the risk that an issuer of a municipal bond may fail to make timely payments of principal or interest to a Fund, a risk that is greater with municipal bonds rated below investment grade (sometimes called “lower rated bonds” or “junk bonds”). High Income, Short Duration High Income, Sustainable and, to a lesser extent, other Funds invest a portion of its assets in such bonds. Some issuers, particularly of junk bonds, may default as to principal and/or interest payments after a Fund purchases their securities. A default, or concerns in the market about an increase in risk of default or the deterioration in the creditworthiness of an issuer, may result in losses to a Fund. Junk bonds are considered predominantly speculative by traditional investment standards. In addition, the market for lower rated municipal bonds generally is less liquid and more volatile than the market for higher rated bonds, subjecting them to greater price fluctuations which could result in losses.
New Jersey and New York are non-diversified, which means they may invest a greater portion of their assets in a single issuer than a diversified fund. Thus, they may be exposed to greater risk.
Because each of California, New Jersey, and New York focuses on a particular state or territory, the Fund’s performance may be more affected by local, state and regional factors than a Fund that invests in municipal bonds issued in many states. These factors may include, for example, economic or political developments, erosion of the tax base and the possibility of credit problems. In addition, downturns or developments in the U.S. economy or in foreign economies or significant world events may harm the performance of any of the Funds (including Short Duration, Intermediate, National, High Income, Short Duration High Income and Sustainable), and may do so disproportionately as a result of the corresponding disproportionate impact of such occurrences on particular state, territory, or local economies.
Because Sustainable considers sustainability factors when evaluating an investment, the Fund may underperform funds that do not take sustainability-related factors into account. There is no guarantee that Lord Abbett will successfully implement and make investments in issuers that create a positive environmental, social or governance impact while achieving the desired financial returns. In evaluating an issuer, Lord Abbett may be dependent on data or information that may be incomplete, inaccurate or unavailable. Sustainable is a newly organized fund and there can be no assurance that it will reach or maintain a sufficient asset size to effectively implement its investment strategy.
Each Fund may invest in private activity bonds (sometimes called “AMT paper”). The credit quality of AMT paper usually is directly related to the credit standing of the private user of the facilities.
National, High Income, Short Duration High Income and, to a lesser extent, other Funds may invest in TOB Residuals. A TOB Residual, sometimes referred to as an inverse floater or a residual interest bond (“RIB”), is a type of derivative debt instrument with a floating or variable interest rate that moves in the opposite direction of the interest rate on another specific fixed-rate security. Changes in the interest rate on the specific fixed-rate security inversely affect the residual interest paid on the TOB Residual, with the result that when interest rates rise, TOB Residuals’ interest payments are lowered and their value falls faster than securities similar to the specific fixed-rate security. When interest rates fall, not only do TOB Residuals generally provide interest payments that are higher than securities similar to the specific fixed-rate security, but their values generally also rise faster than such similar securities.
219
Notes to Financial Statements (continued)
In addition, loss may result from a Fund’s investments in certain derivative transactions such as futures contracts, swap transactions, interest rate caps, TOB Residuals and similar transactions. These instruments may be leveraged so that small changes may produce disproportionate and substantial losses to a Fund. They also may increase a Fund’s interest rate risk.
Each Fund may purchase securities on a forward commitment or when-issued basis. Delivery and payment for such securities can take place a month or more after the transaction date. During this period such securities are subject to market fluctuations.
Geopolitical and other events (e.g., wars, terrorism, natural disasters, epidemics or pandemics, such as the COVID-19 outbreak which began in late 2019) may disrupt securities markets and adversely affect global economies and markets, thereby decreasing the value of each Fund’s investments. Market disruptions can also prevent the Funds from implementing their investment strategies and achieving their investment objective.
The transmission of COVID-19 and efforts to contain its spread have resulted in, among other things, border closings and other significant travel restrictions and disruptions, significant disruptions to business operations, supply chains and customer activity, lower consumer demand for goods and services, event cancellations and restrictions, service cancellations, reductions and other changes, significant challenges in healthcare service preparation and delivery, and prolonged quarantines, as well as general concern and uncertainty. The impact of the COVID-19 outbreak has and could again negatively affect the global economy, the economies of individual countries, and the financial performance of individual issuers, sectors, industries, asset classes, and markets in significant and unforeseen ways. The COVID-19 pandemic and its effects may last for an extended period of time. Although the long-term economic fallout of COVID-19 is difficult to predict, it has contributed to, and is likely to continue to contribute to, market volatility, inflation and systemic economic weakness. The foregoing could disrupt the operations of each Fund and its service providers, adversely affect the value and liquidity of each Fund’s investments, and negatively impact each Fund’s performance and your investment in each Fund.
These factors, and others, can affect each Fund’s performance.
| 15. | SUMMARY OF CAPITAL TRANSACTIONS |
Transactions in shares of capital stock were as follows:
| Short Duration | | Year Ended
September 30, 2022 | | | Year Ended
September 30, 2021 | |
| Class A Shares | | Shares | | | Amount | | | Shares | | | Amount | |
| Shares sold | | | 27,675,024 | | | $ | 423,850,743 | | | | 24,936,226 | | | $ | 396,321,652 | |
| Converted from Class C* | | | 254,848 | | | | 3,916,204 | | | | 393,155 | | | | 6,243,397 | |
| Reinvestment of distributions | | | 505,852 | | | | 7,720,199 | | | | 452,550 | | | | 7,187,577 | |
| Shares reacquired | | | (36,579,371 | ) | | | (560,984,644 | ) | | | (15,083,163 | ) | | | (239,732,251 | ) |
| Increase (decrease) | | | (8,143,647 | ) | | $ | (125,497,498 | ) | | | 10,698,768 | | | $ | 170,020,375 | |
| | | | | | | | | | | | | | | | | |
| Class C Shares | | | | | | | | | | | | | | | | |
| Shares sold | | | 486,705 | | | $ | 7,451,767 | | | | 543,919 | | | $ | 8,630,562 | |
| Reinvestment of distributions | | | 5,212 | | | | 78,840 | | | | 5,721 | | | | 90,784 | |
| Shares reacquired | | | (646,953 | ) | | | (9,935,912 | ) | | | (689,639 | ) | | | (10,957,387 | ) |
| Converted to Class A* | | | (254,848 | ) | | | (3,916,204 | ) | | | (393,113 | ) | | | (6,243,397 | ) |
| Decrease | | | (409,884 | ) | | $ | (6,321,509 | ) | | | (533,112 | ) | | $ | (8,479,438 | ) |
220
Notes to Financial Statements (continued)
| Short Duration | | Year Ended
September 30, 2022 | | | Year Ended
September 30, 2021 | |
| Class F Shares | | Shares | | | Amount | | | Shares | | | Amount | |
| Shares sold | | | 23,585,488 | | | $ | 362,962,189 | | | | 33,885,440 | | | $ | 538,863,636 | |
| Reinvestment of distributions | | | 226,476 | | | | 3,474,114 | | | | 244,425 | | | | 3,882,830 | |
| Shares reacquired | | | (53,603,175 | ) | | | (822,067,362 | ) | | | (24,827,086 | ) | | | (394,430,924 | ) |
| Increase (decrease) | | | (29,791,211 | ) | | $ | (455,631,059 | ) | | | 9,302,779 | | | $ | 148,315,542 | |
| | | | | | | | | | | | | | | | | |
| Class F3 Shares | | | | | | | | | | | | | | | | |
| Shares sold | | | 16,986,800 | | | $ | 259,774,089 | | | | 9,536,653 | | | $ | 151,699,177 | |
| Reinvestment of distributions | | | 123,424 | | | | 1,879,203 | | | | 67,901 | | | | 1,078,915 | |
| Shares reacquired | | | (13,574,621 | ) | | | (207,668,141 | ) | | | (4,284,349 | ) | | | (68,104,919 | ) |
| Increase | | | 3,535,603 | | | $ | 53,985,151 | | | | 5,320,205 | | | $ | 84,673,173 | |
| | | | | | | | | | | | | | | | | |
| Class I Shares | | | | | | | | | | | | | | | | |
| Shares sold | | | 46,559,487 | | | $ | 709,825,767 | | | | 8,742,874 | | | $ | 139,005,736 | |
| Reinvestment of distributions | | | 244,174 | | | | 3,711,369 | | | | 137,768 | | | | 2,188,757 | |
| Shares reacquired | | | (21,715,386 | ) | | | (330,588,818 | ) | | | (7,089,780 | ) | | | (112,752,367 | ) |
| Increase | | | 25,088,275 | | | $ | 382,948,318 | | | | 1,790,862 | | | $ | 28,442,126 | |
| | | | | | | | | | | | | | | | | |
| Intermediate | | Year Ended
September 30, 2022 | | | Year Ended
September 30, 2021 | |
| Class A Shares | | Shares | | | Amount | | | Shares | | | Amount | |
| Shares sold | | | 53,052,292 | | | $ | 563,848,755 | | | | 60,779,236 | | | $ | 690,600,824 | |
| Converted from Class C* | | | 1,673,822 | | | | 17,730,672 | | | | 2,328,418 | | | | 26,340,870 | |
| Reinvestment of distributions | | | 4,160,439 | | | | 43,941,102 | | | | 3,942,307 | | | | 44,740,744 | |
| Shares reacquired | | | (79,626,277 | ) | | | (835,050,076 | ) | | | (34,176,959 | ) | | | (387,796,511 | ) |
| Increase (decrease) | | | (20,739,724 | ) | | $ | (209,529,547 | ) | | | 32,873,002 | | | $ | 373,885,927 | |
| | | | | | | | | | | | | | | | | |
| Class C Shares | | | | | | | | | | | | | | | | |
| Shares sold | | | 1,420,669 | | | $ | 15,106,194 | | | | 3,987,237 | | | $ | 45,191,537 | |
| Reinvestment of distributions | | | 175,963 | | | | 1,856,840 | | | | 212,881 | | | | 2,410,652 | |
| Shares reacquired | | | (4,081,702 | ) | | | (43,034,344 | ) | | | (4,416,705 | ) | | | (50,058,332 | ) |
| Converted to Class A* | | | (1,675,918 | ) | | | (17,730,672 | ) | | | (2,331,418 | ) | | | (26,340,870 | ) |
| Decrease | | | (4,160,988 | ) | | $ | (43,801,982 | ) | | | (2,548,005 | ) | | $ | (28,797,013 | ) |
| | | | | | | | | | | | | | | | | |
| Class F Shares | | | | | | | | | | | | | | | | |
| Shares sold | | | 62,145,003 | | | $ | 672,104,399 | | | | 87,173,952 | | | $ | 990,776,155 | |
| Reinvestment of distributions | | | 2,423,374 | | | | 25,919,024 | | | | 2,981,908 | | | | 33,826,459 | |
| Shares reacquired | | | (248,827,572 | ) | | | (2,593,667,356 | ) | | | (44,644,670 | ) | | | (506,436,702 | ) |
| Increase (decrease) | | | (184,259,195 | ) | | $ | (1,895,643,933 | ) | | | 45,511,190 | | | $ | 518,165,912 | |
| | | | | | | | | | | | | | | | | |
| Class F3 Shares | | | | | | | | | | | | | | | | |
| Shares sold | | | 15,426,863 | | | $ | 162,911,001 | | | | 9,069,642 | | | $ | 103,305,640 | |
| Reinvestment of distributions | | | 420,880 | | | | 4,427,409 | | | | 245,552 | | | | 2,790,387 | |
| Shares reacquired | | | (10,946,063 | ) | | | (113,845,957 | ) | | | (1,869,606 | ) | | | (21,221,871 | ) |
| Increase | | | 4,901,680 | | | $ | 53,492,453 | | | | 7,445,588 | | | $ | 84,874,156 | |
| | | | | | | | | | | | | | | | | |
| Class I Shares | | | | | | | | | | | | | | | | |
| Shares sold | | | 236,204,233 | | | $ | 2,441,772,747 | | | | 26,470,064 | | | $ | 301,072,527 | |
| Reinvestment of distributions | | | 2,214,271 | | | | 23,127,859 | | | | 1,622,943 | | | | 18,411,400 | |
| Shares reacquired | | | (98,080,911 | ) | | | (1,010,854,262 | ) | | | (27,321,608 | ) | | | (308,869,918 | ) |
| Increase | | | 140,337,593 | | | $ | 1,454,046,344 | | | | 771,399 | | | $ | 10,614,009 | |
221
Notes to Financial Statements (continued)
| National | | Year Ended
September 30, 2022 | | | Year Ended
September 30, 2021 | |
| Class A Shares | | Shares | | | Amount | | | Shares | | | Amount | |
| Shares sold | | | 49,295,927 | | | $ | 545,653,188 | | | | 55,083,394 | | | $ | 665,347,445 | |
| Converted from Class C* | | | 882,355 | | | | 9,763,279 | | | | 824,417 | | | | 9,899,842 | |
| Reinvestment of distributions | | | 5,916,818 | | | | 65,326,061 | | | | 5,352,614 | | | | 64,509,482 | |
| Shares reacquired | | | (71,253,096 | ) | | | (776,390,605 | ) | | | (32,854,240 | ) | | | (395,732,546 | ) |
| Increase (decrease) | | | (15,157,996 | ) | | $ | (155,648,077 | ) | | | 28,406,185 | | | $ | 344,024,223 | |
| | | | | | | | | | | | | | | | | |
| Class C Shares | | | | | | | | | | | | | | | | |
| Shares sold | | | 1,212,720 | | | $ | 13,592,731 | | | | 2,539,815 | | | $ | 30,688,120 | |
| Reinvestment of distributions | | | 180,935 | | | | 2,003,649 | | | | 193,926 | | | | 2,337,452 | |
| Shares reacquired | | | (3,229,287 | ) | | | (35,481,847 | ) | | | (2,533,535 | ) | | | (30,541,340 | ) |
| Converted to Class A* | | | (881,519 | ) | | | (9,763,279 | ) | | | (823,563 | ) | | | (9,899,842 | ) |
| Decrease | | | (2,717,151 | ) | | $ | (29,648,746 | ) | | | (623,357 | ) | | $ | (7,415,610 | ) |
| | | | | | | | | | | | | | | | | |
| Class F Shares | | | | | | | | | | | | | | | | |
| Shares sold | | | 22,343,150 | | | $ | 252,636,831 | | | | 29,749,984 | | | $ | 358,116,624 | |
| Reinvestment of distributions | | | 1,296,695 | | | | 14,601,779 | | | | 1,575,075 | | | | 18,967,282 | |
| Shares reacquired | | | (82,597,556 | ) | | | (904,741,426 | ) | | | (24,213,568 | ) | | | (290,297,356 | ) |
| Increase (decrease) | | | (58,957,711 | ) | | $ | (637,502,816 | ) | | | 7,111,491 | | | $ | 86,786,550 | |
| | | | | | | | | | | | | | | | | |
| Class F3 Shares | | | | | | | | | | | | | | | | |
| Shares sold | | | 19,250,148 | | | $ | 213,368,948 | | | | 13,889,524 | | | $ | 167,990,257 | |
| Reinvestment of distributions | | | 794,371 | | | | 8,742,056 | | | | 471,502 | | | | 5,689,701 | |
| Shares reacquired | | | (16,664,587 | ) | | | (180,063,515 | ) | | | (2,455,465 | ) | | | (29,556,448 | ) |
| Increase | | | 3,379,932 | | | $ | 42,047,489 | | | | 11,905,561 | | | $ | 144,123,510 | |
| | | | | | | | | | | | | | | | | |
| Class I Shares | | | | | | | | | | | | | | | | |
| Shares sold | | | 73,940,091 | | | $ | 792,826,906 | | | | 7,455,057 | | | $ | 89,737,237 | |
| Reinvestment of distributions | | | 849,840 | | | | 9,149,393 | | | | 422,322 | | | | 5,088,752 | |
| Shares reacquired | | | (34,412,635 | ) | | | (364,545,784 | ) | | | (3,803,447 | ) | | | (45,735,153 | ) |
| Increase | | | 40,377,296 | | | $ | 437,430,515 | | | | 4,073,932 | | | $ | 49,090,836 | |
| | | | | | | | | | | | | | | | | |
| High Income | | Year Ended
September 30, 2022 | | | Year Ended
September 30, 2021 | |
| Class A Shares | | Shares | | | Amount | | | Shares | | | Amount | |
| Shares sold | | | 54,115,499 | | | $ | 643,313,026 | | | | 58,498,493 | | | $ | 749,411,983 | |
| Converted from Class C* | | | 1,439,157 | | | | 16,559,420 | | | | 1,219,491 | | | | 15,426,346 | |
| Reinvestment of distributions | | | 5,438,271 | | | | 63,720,375 | | | | 4,789,020 | | | | 61,145,784 | |
| Shares reacquired | | | (71,107,986 | ) | | | (826,335,850 | ) | | | (29,610,755 | ) | | | (378,036,115 | ) |
| Increase (decrease) | | | (10,115,059 | ) | | $ | (102,743,029 | ) | | | 34,896,249 | | | $ | 447,947,998 | |
| | | | | | | | | | | | | | | | | |
| Class C Shares | | | | | | | | | | | | | | | | |
| Shares sold | | | 2,746,793 | | | $ | 32,964,823 | | | | 5,501,509 | | | $ | 70,600,626 | |
| Reinvestment of distributions | | | 461,133 | | | | 5,408,574 | | | | 466,639 | | | | 5,951,615 | |
| Shares reacquired | | | (5,474,558 | ) | | | (64,433,876 | ) | | | (3,971,931 | ) | | | (50,612,884 | ) |
| Converted to Class A* | | | (1,438,721 | ) | | | (16,559,420 | ) | | | (1,219,015 | ) | | | (15,426,346 | ) |
| Increase (decrease) | | | (3,705,353 | ) | | $ | (42,619,899 | ) | | | 777,202 | | | $ | 10,513,011 | |
222
Notes to Financial Statements (continued)
| High Income | | Year Ended
September 30, 2022 | | | Year Ended
September 30, 2021 | |
| Class F Shares | | Shares | | | Amount | | | Shares | | | Amount | |
| Shares sold | | | 40,725,267 | | | $ | 498,388,960 | | | | 66,062,171 | | | $ | 846,869,019 | |
| Reinvestment of distributions | | | 2,209,756 | | | | 26,435,132 | | | | 2,278,055 | | | | 29,172,269 | |
| Shares reacquired | | | (119,065,773 | ) | | | (1,395,866,809 | ) | | | (27,016,770 | ) | | | (346,290,731 | ) |
| Increase (decrease) | | | (76,130,750 | ) | | $ | (871,042,717 | ) | | | 41,323,456 | | | $ | 529,750,557 | |
| | | | | | | | | | | | | | | | | |
| Class F3 Shares | | | | | | | | | | | | | | | | |
| Shares sold | | | 8,209,512 | | | $ | 96,241,910 | | | | 5,473,977 | | | $ | 70,251,463 | |
| Reinvestment of distributions | | | 380,805 | | | | 4,431,135 | | | | 216,648 | | | | 2,769,201 | |
| Shares reacquired | | | (6,564,018 | ) | | | (74,887,060 | ) | | | (1,108,436 | ) | | | (14,088,025 | ) |
| Increase | | | 2,026,299 | | | $ | 25,785,985 | | | | 4,582,189 | | | $ | 58,932,639 | |
| | | | | | | | | | | | | | | | | |
| Class I Shares | | | | | | | | | | | | | | | | |
| Shares sold | | | 112,854,562 | | | $ | 1,289,014,098 | | | | 20,227,026 | | | $ | 258,490,042 | |
| Reinvestment of distributions | | | 1,883,209 | | | | 21,609,435 | | | | 1,047,926 | | | | 13,377,846 | |
| Shares reacquired | | | (58,348,142 | ) | | | (657,095,742 | ) | | | (8,299,148 | ) | | | (106,046,124 | ) |
| Increase | | | 56,389,629 | | | $ | 653,527,791 | | | | 12,975,804 | | | $ | 165,821,764 | |
| | | | | | | | | | | | | | | | | |
| Short Duration High Income | | Year Ended
September 30, 2022 | | | Year Ended
September 30, 2021 | |
| Class A Shares | | Shares | | | Amount | | | Shares | | | Amount | |
| Shares sold | | | 10,864,383 | | | $ | 164,967,047 | | | | 18,422,428 | | | $ | 290,542,287 | |
| Converted from Class C* | | | 42,741 | | | | 635,378 | | | | 12,374 | | | | 196,133 | |
| Reinvestment of distributions | | | 576,692 | | | | 8,541,073 | | | | 378,399 | | | | 5,968,717 | |
| Shares reacquired | | | (13,720,715 | ) | | | (203,780,390 | ) | | | (4,643,894 | ) | | | (73,041,143 | ) |
| Increase (decrease) | | | (2,236,899 | ) | | $ | (29,636,892 | ) | | | 14,169,307 | | | $ | 223,665,994 | |
| | | | | | | | | | | | | | | | | |
| Class C Shares | | | | | | | | | | | | | | | | |
| Shares sold | | | 554,590 | | | $ | 8,531,204 | | | | 1,063,889 | | | $ | 16,792,924 | |
| Reinvestment of distributions | | | 26,289 | | | | 387,852 | | | | 16,943 | | | | 266,755 | |
| Shares reacquired | | | (655,790 | ) | | | (9,695,946 | ) | | | (244,768 | ) | | | (3,841,225 | ) |
| Converted to Class A* | | | (42,737 | ) | | | (635,378 | ) | | | (12,374 | ) | | | (196,133 | ) |
| Increase (decrease) | | | (117,648 | ) | | $ | (1,412,268 | ) | | | 823,690 | | | $ | 13,022,321 | |
| | | | | | | | | | | | | | | | | |
| Class F Shares | | | | | | | | | | | | | | | | |
| Shares sold | | | 18,007,811 | | | $ | 275,931,312 | | | | 29,353,173 | | | $ | 462,469,733 | |
| Reinvestment of distributions | | | 478,068 | | | | 7,201,066 | | | | 459,018 | | | | 7,244,408 | |
| Shares reacquired | | | (39,621,077 | ) | | | (595,140,802 | ) | | | (9,869,844 | ) | | | (156,025,802 | ) |
| Increase (decrease) | | | (21,135,198 | ) | | $ | (312,008,424 | ) | | | 19,942,347 | | | $ | 313,688,339 | |
| | | | | | | | | | | | | | | | | |
| Class F3 Shares | | | | | | | | | | | | | | | | |
| Shares sold | | | 1,471,688 | | | $ | 21,965,315 | | | | 1,540,117 | | | $ | 24,317,144 | |
| Reinvestment of distributions | | | 53,900 | | | | 797,173 | | | | 27,054 | | | | 427,618 | |
| Shares reacquired | | | (1,444,184 | ) | | | (21,130,565 | ) | | | (169,474 | ) | | | (2,660,961 | ) |
| Increase | | | 81,404 | | | $ | 1,631,923 | | | | 1,397,697 | | | $ | 22,083,801 | |
| | | | | | | | | | | | | | | | | |
| Class I Shares | | | | | | | | | | | | | | | | |
| Shares sold | | | 32,825,243 | | | $ | 488,939,553 | | | | 10,660,807 | | | $ | 168,302,075 | |
| Reinvestment of distributions | | | 546,776 | | | | 8,028,813 | | | | 222,022 | | | | 3,503,151 | |
| Shares reacquired | | | (22,568,457 | ) | | | (329,936,628 | ) | | | (1,594,535 | ) | | | (25,161,160 | ) |
| Increase | | | 10,803,562 | | | $ | 167,031,738 | | | | 9,288,294 | | | $ | 146,644,066 | |
223
Notes to Financial Statements (continued)
| Sustainable | | For the period ended
September 30, 2022(a) | | | | | | | | | |
| Class A Shares | | Shares | | | Amount | | | | | | | | | |
| Shares sold | | | 304,943 | | | $ | 3,047,500 | | | | | | | | | |
| Reinvestment of distributions | | | 41 | | | | 372 | | | | | | | | | |
| Increase | | | 304,984 | | | $ | 3,047,872 | | | | | | | | | |
| | | | | | | | | | | | | | | | | |
| Class C Shares | | | | | | | | | | | | | | | | |
| Shares sold | | | 7,500 | | | $ | 75,000 | | | | | | | | | |
| Increase | | | 7,500 | | | $ | 75,000 | | | | | | | | | |
| | | | | | | | | | | | | | | | | |
| Class F Shares | | | | | | | | | | | | | | | | |
| Shares sold | | | 7,500 | | | $ | 75,000 | | | | | | | | | |
| Increase | | | 7,500 | | | $ | 75,000 | | | | | | | | | |
| | | | | | | | | | | | | | | | | |
| Class F3 Shares | | | | | | | | | | | | | | | | |
| Shares sold | | | 10,000 | | | $ | 100,000 | | | | | | | | | |
| Increase | | | 10,000 | | | $ | 100,000 | | | | | | | | | |
| | | | | | | | | | | | | | | | | |
| Class I Shares | | | | | | | | | | | | | | | | |
| Shares sold | | | 186,313 | | | $ | 1,850,000 | | | | | | | | | |
| Reinvestment of distributions | | | 3 | | | | 27 | | | | | | | | | |
| Shares reacquired | | | (5 | ) | | | (41 | ) | | | | | | | | |
| Increase | | | 186,311 | | | $ | 1,849,986 | | | | | | | | | |
| | | | | | | |
| California | | Year Ended
September 30, 2022 | | | Year Ended
September 30, 2021 | |
| Class A Shares | | Shares | | | Amount | | | Shares | | | Amount | |
| Shares sold | | | 9,714,370 | | | $ | 102,711,684 | | | | 7,977,591 | | | $ | 92,837,242 | |
| Converted from Class C* | | | 238,050 | | | | 2,558,408 | | | | 216,382 | | | | 2,523,019 | |
| Reinvestment of distributions | | | 686,472 | | | | 7,300,515 | | | | 643,967 | | | | 7,497,462 | |
| Shares reacquired | | | (11,528,626 | ) | | | (123,722,571 | ) | | | (6,043,201 | ) | | | (70,282,805 | ) |
| Increase (decrease) | | | (889,734 | ) | | $ | (11,151,964 | ) | | | 2,794,739 | | | $ | 32,574,918 | |
| | | | | | | | | | | | | | | | | |
| Class C Shares | | | | | | | | | | | | | | | | |
| Shares sold | | | 409,728 | | | $ | 4,413,910 | | | | 592,388 | | | $ | 6,920,254 | |
| Reinvestment of distributions | | | 40,742 | | | | 433,795 | | | | 43,056 | | | | 501,097 | |
| Shares reacquired | | | (844,314 | ) | | | (8,994,447 | ) | | | (805,367 | ) | | | (9,375,307 | ) |
| Converted to Class A* | | | (237,971 | ) | | | (2,558,408 | ) | | | (216,356 | ) | | | (2,523,019 | ) |
| Decrease | | | (631,815 | ) | | $ | (6,705,150 | ) | | | (386,279 | ) | | $ | (4,476,975 | ) |
| | | | | | | | | | | | | | | | | |
| Class F Shares | | | | | | | | | | | | | | | | |
| Shares sold | | | 3,531,708 | | | $ | 38,386,295 | | | | 5,320,245 | | | $ | 62,112,967 | |
| Reinvestment of distributions | | | 123,708 | | | | 1,353,557 | | | | 174,205 | | | | 2,028,426 | |
| Shares reacquired | | | (12,651,669 | ) | | | (134,354,919 | ) | | | (4,146,768 | ) | | | (48,213,918 | ) |
| Increase (decrease) | | | (8,996,253 | ) | | $ | (94,615,067 | ) | | | 1,347,682 | | | $ | 15,927,475 | |
| | | | | | | | | | | | | | | | | |
| Class F3 Shares | | | | | | | | | | | | | | | | |
| Shares sold | | | 2,732,124 | | | $ | 28,646,820 | | | | 747,976 | | | $ | 8,754,760 | |
| Reinvestment of distributions | | | 60,399 | | | | 635,428 | | | | 33,680 | | | | 392,231 | |
| Shares reacquired | | | (1,442,987 | ) | | | (15,152,394 | ) | | | (160,513 | ) | | | (1,863,187 | ) |
| Increase | | | 1,349,536 | | | $ | 14,129,854 | | | | 621,143 | | | $ | 7,283,804 | |
224
Notes to Financial Statements (continued)
| California | | Year Ended
September 30, 2022 | | | Year Ended
September 30, 2021 | |
| Class I Shares | | Shares | | | Amount | | | Shares | | | Amount | |
| Shares sold | | | 9,758,019 | | | $ | 101,943,212 | | | | 1,167,930 | | | $ | 13,601,412 | |
| Reinvestment of distributions | | | 114,578 | | | | 1,202,919 | | | | 72,839 | | | | 847,551 | |
| Shares reacquired | | | (4,946,127 | ) | | | (51,321,033 | ) | | | (580,098 | ) | | | (6,743,440 | ) |
| Increase | | | 4,926,470 | | | $ | 51,825,098 | | | | 660,671 | | | $ | 7,705,523 | |
| | | | | | | | | | | | | | | | | |
| New Jersey | | Year Ended
September 30, 2022 | | | Year Ended
September 30, 2021 | |
| Class A Shares | | Shares | | | Amount | | | Shares | | | Amount | |
| Shares sold | | | 2,767,063 | | | $ | 13,514,049 | | | | 2,482,862 | | | $ | 13,204,791 | |
| Reinvestment of distributions | | | 367,992 | | | | 1,817,051 | | | | 345,191 | | | | 1,837,040 | |
| Shares reacquired | | | (3,416,025 | ) | | | (16,598,593 | ) | | | (3,765,649 | ) | | | (19,979,057 | ) |
| Decrease | | | (280,970 | ) | | $ | (1,267,493 | ) | | | (937,596 | ) | | $ | (4,937,226 | ) |
| | | | | | | | | | | | | | | | | |
| Class F Shares | | | | | | | | | | | | | | | | |
| Shares sold | | | 931,336 | | | $ | 4,823,229 | | | | 1,496,816 | | | $ | 7,983,605 | |
| Reinvestment of distributions | | | 69,563 | | | | 351,154 | | | | 92,176 | | | | 490,872 | |
| Shares reacquired | | | (4,924,806 | ) | | | (24,332,270 | ) | | | (949,665 | ) | | | (5,040,884 | ) |
| Increase (decrease) | | | (3,923,907 | ) | | $ | (19,157,887 | ) | | | 639,327 | | | $ | 3,433,593 | |
| | | | | | | | | | | | | | | | | |
| Class F3 Shares | | | | | | | | | | | | | | | | |
| Shares sold | | | 211,945 | | | $ | 1,051,022 | | | | 105,663 | | | $ | 563,023 | |
| Reinvestment of distributions | | | 7,587 | | | | 37,239 | | | | 3,920 | | | | 20,914 | |
| Shares reacquired | | | (130,591 | ) | | | (620,915 | ) | | | (14,219 | ) | | | (75,044 | ) |
| Increase | | | 88,941 | | | $ | 467,346 | | | | 95,364 | | | $ | 508,893 | |
| | | | | | | | | | | | | | | | | |
| Class I Shares | | | | | | | | | | | | | | | | |
| Shares sold | | | 3,426,486 | | | $ | 16,635,811 | | | | 722,403 | | | $ | 3,862,076 | |
| Reinvestment of distributions | | | 50,354 | | | | 245,041 | | | | 24,829 | | | | 132,539 | |
| Shares reacquired | | | (1,733,364 | ) | | | (8,221,483 | ) | | | (179,385 | ) | | | (960,589 | ) |
| Increase | | | 1,743,476 | | | $ | 8,659,369 | | | | 567,847 | | | $ | 3,034,026 | |
| | | | | | | |
| New York | | Year Ended
September 30, 2022 | | | Year Ended
September 30, 2021 | |
| Class A Shares | | Shares | | | Amount | | | Shares | | | Amount | |
| Shares sold | | | 7,267,527 | | | $ | 79,181,790 | | | | 6,282,361 | | | $ | 75,621,431 | |
| Converted from Class C* | | | 247,334 | | | | 2,682,494 | | | | 184,935 | | | | 2,218,013 | |
| Reinvestment of distributions | | | 650,952 | | | | 7,216,866 | | | | 595,888 | | | | 7,169,771 | |
| Shares reacquired | | | (7,984,467 | ) | | | (88,420,625 | ) | | | (5,443,885 | ) | | | (65,606,016 | ) |
| Increase | | | 181,346 | | | $ | 660,525 | | | | 1,619,299 | | | $ | 19,403,199 | |
| | | | | | | | | | | | | | | | | |
| Class C Shares | | | | | | | | | | | | | | | | |
| Shares sold | | | 227,831 | | | $ | 2,615,587 | | | | 494,156 | | | $ | 5,948,405 | |
| Reinvestment of distributions | | | 39,269 | | | | 435,328 | | | | 39,361 | | | | 472,629 | |
| Shares reacquired | | | (630,112 | ) | | | (7,052,538 | ) | | | (609,199 | ) | | | (7,315,938 | ) |
| Converted to Class A* | | | (247,711 | ) | | | (2,682,494 | ) | | | (185,218 | ) | | | (2,218,013 | ) |
| Decrease | | | (610,723 | ) | | $ | (6,684,117 | ) | | | (260,900 | ) | | $ | (3,112,917 | ) |
225
Notes to Financial Statements (concluded)
| New York | | Year Ended
September 30, 2022 | | | Year Ended
September 30, 2021 | |
| Class F Shares | | Shares | | | Amount | | | Shares | | | Amount | |
| Shares sold | | | 1,352,775 | | | $ | 15,718,470 | | | | 2,322,105 | | | $ | 28,027,809 | |
| Reinvestment of distributions | | | 72,464 | | | | 816,787 | | | | 80,901 | | | | 975,139 | |
| Shares reacquired | | | (5,386,852 | ) | | | (59,765,477 | ) | | | (1,926,125 | ) | | | (23,196,959 | ) |
| Increase (decrease) | | | (3,961,613 | ) | | $ | (43,230,220 | ) | | | 476,881 | | | $ | 5,805,989 | |
| | | | | | | | | | | | | | | | | |
| Class F3 Shares | | | | | | | | | | | | | | | | |
| Shares sold | | | 172,387 | | | $ | 1,898,630 | | | | 71,651 | | | $ | 868,449 | |
| Reinvestment of distributions | | | 5,557 | | | | 61,174 | | | | 3,080 | | | | 37,115 | |
| Shares reacquired | | | (110,926 | ) | | | (1,192,434 | ) | | | (20,294 | ) | | | (242,014 | ) |
| Increase | | | 67,018 | | | $ | 767,370 | | | | 54,437 | | | $ | 663,550 | |
| | | | | | | | | | | | | | | | | |
| Class I Shares | | | | | | | | | | | | | | | | |
| Shares sold | | | 6,493,470 | | | $ | 70,567,286 | | | | 1,330,915 | | | $ | 16,116,048 | |
| Reinvestment of distributions | | | 109,516 | | | | 1,200,161 | | | | 57,246 | | | | 690,371 | |
| Shares reacquired | | | (3,109,286 | ) | | | (33,153,558 | ) | | | (333,199 | ) | | | (3,995,465 | ) |
| Increase | | | 3,493,700 | | | $ | 38,613,889 | | | | 1,054,962 | | | $ | 12,810,954 | |
| | |
| * | Automatic conversion of Class C shares occurs on the 25th day of the month (or, if the 25th day was not a business day, the next business day thereafter) following the eighth anniversary of the day on which the purchase order was accepted. |
| (a) | For the period January 5, 2022, commencement of operations, to September 30, 2022. |
226
Report of Independent Registered Public Accounting Firm
To the shareholders and the Board of Directors of Lord Abbett Municipal Income Fund, Inc.
Opinion on the Financial Statements and Financial Highlights
We have audited the accompanying statements of assets and liabilities of Lord Abbett Municipal Income Fund, Inc. (the “Company”) comprising the Lord Abbett Short Duration Tax Free Fund, Lord Abbett Intermediate Tax Free Fund, Lord Abbett National Tax-Free Income Fund, Lord Abbett High Income Municipal Bond Fund, Lord Abbett Short Duration High Income Municipal Bond Fund, Lord Abbett Sustainable Municipal Bond Fund, Lord Abbett California Tax-Free Income Fund, Lord Abbett New Jersey Tax-Free Income Fund, and Lord Abbett New York Tax-Free Income Fund, including the schedules of investments, as of September 30, 2022; the related statements of operations for the year then ended, the statements of changes in net assets for each of the two years in the period then ended, and the financial highlights for each of the five years in the period then ended for each of the funds constituting the Lord Abbett Municipal Income Fund, Inc., except Lord Abbett Sustainable Municipal Bond Fund; the related statement of operations, statement of changes in net assets, and financial highlights for the period from January 5, 2022 (commencement of operations) to September 30, 2022, for Lord Abbett Sustainable Municipal Bond Fund; and the related notes.
In our opinion, the financial statements and financial highlights present fairly, in all material respects, the financial position of each of the funds constituting the Lord Abbett Municipal Income Fund, Inc., except Lord Abbett Sustainable Municipal Bond Fund, as of September 30, 2022, and the results of their operations for the year then ended, the changes in their net assets for each of the two years in the period then ended, and the financial highlights for each of the five years in the period then ended in conformity with accounting principles generally accepted in the United States of America. Also, in our opinion, the financial statements and financial highlights present fairly, in all material respects, the financial position of Lord Abbett Sustainable Municipal Bond Fund as of September 30, 2022; the results of operations, changes in net assets, and financial highlights for Lord Abbett Sustainable Municipal Bond Fund for the period from January 5, 2022 (commencement of operations) to September 30, 2022, in conformity with accounting principles generally accepted in the United States of America.
Basis for Opinion
These financial statements and financial highlights are the responsibility of the Company’s management. Our responsibility is to express an opinion on the Company’s financial statements and financial highlights based on our audits. We are a public accounting firm registered with the Public Company Accounting Oversight Board (United States) (PCAOB) and are required to be independent with respect to the Company in accordance with the U.S. federal securities laws and the applicable rules and regulations of the Securities and Exchange Commission and the PCAOB. We conducted our audits in accordance with the standards of the PCAOB. Those standards require that we plan and perform the audit to obtain reasonable assurance about whether the financial statements and financial highlights are free of material misstatement, whether due to error or fraud. The Company is not required to have, nor were we engaged to perform, an audit of its internal control over financial reporting. As part of our audits we are required to obtain an understanding of internal control over financial reporting but not for the purpose of expressing an opinion on the effectiveness of the Company’s internal control over financial reporting. Accordingly, we express no such opinion.
Our audits included performing procedures to assess the risks of material misstatement of the financial statements and financial highlights, whether due to error or fraud, and performing procedures that respond to those risks. Such procedures included examining, on a test basis, evidence regarding the amounts and disclosures in the financial statements and financial highlights. Our audits also included evaluating the accounting principles used and significant estimates made by management, as well as evaluating the overall presentation of the financial statements and financial highlights. Our procedures included confirmation of securities owned as of September 30, 2022, by correspondence with the custodian and brokers; when replies were not received from brokers, we performed other auditing procedures. We believe that our audits provide a reasonable basis for our opinion.
DELOITTE & TOUCHE LLP
New York, New York
November 22, 2022
We have served as the auditor of one or more Lord Abbett Family of Funds’ investment companies since 1932.
227
Basic Information About Management
The Board is responsible for the management of the business and affairs of the Fund in accordance with the laws of the state of organization. The Board elects officers who are responsible for the day-to-day operations of the Fund and who execute policies authorized by the Board. The Board also approves an investment adviser to the Fund and continues to monitor the cost and quality of the services the investment adviser provides, and annually considers whether to renew the contract with the investment adviser. Generally, each Board member holds office until his/her successor is elected and qualified or until his/her earlier resignation or removal, as provided in the Fund’s organizational documents.
Lord, Abbett & Co. LLC (“Lord Abbett”), a Delaware limited liability company, is the Fund’s investment adviser. Designated Lord Abbett personnel are responsible for the day-to-day management of the Fund.
Independent Board Members
The following Independent Board Members also are board members of each of the 14 investment companies in the Lord Abbett Family of Funds, which consist of 62 investment portfolios.
Name, Address and
Year of Birth | | Current Position and
Length of Service
with the Fund | | Principal Occupation and Other Directorships
During the Past Five Years |
| | | | | |
Evelyn E. Guernsey
Lord, Abbett & Co. LLC
c/o Legal Dept.
90 Hudson Street
Jersey City, NJ 07302
(1955) | | Board member since 2011 | | Principal Occupation: None. Other Directorships: None. |
| | | | | |
Julie A. Hill
Lord, Abbett & Co. LLC
c/o Legal Dept.
90 Hudson Street
Jersey City, NJ 07302
(1946) | | Board member since 2004 | | Principal Occupation: Owner and CEO of The Hill Company, a business consulting firm (since 1998). Other Directorships: Previously served as director of Anthem, Inc., a health benefits company (1994–2021). |
| | | | | |
Kathleen M. Lutito
Lord, Abbett & Co. LLC
c/o Legal Dept.
90 Hudson Street
Jersey City, NJ 07302
(1963) | | Board member since 2017 | | Principal Occupation: President and Chief Investment Officer of CenturyLink Investment Management Company (since 2006). Other Directorships: None. |
| | | | | |
James M. McTaggart
Lord, Abbett & Co. LLC
c/o Legal Dept.
90 Hudson Street
Jersey City, NJ 07302
(1947) | | Board member since 2012 | | Principal Occupation: Owner of McTaggart LLC (since 2011). Other Directorships: None. |
| | | | | |
Charles O. Prince
Lord, Abbett & Co. LLC
c/o Legal Dept.
90 Hudson Street
Jersey City, NJ 07302
(1950) | | Board member since 2019 | | Principal Occupation: None. Formerly Chairman and Chief Executive Officer, Citigroup, Inc. (Retired 2007). Other Directorships: Previously served as director of Johnson & Johnson (2005–2022). Previously served as director of Xerox Corporation (2007–2018). |
228
Basic Information About Management (continued)
Name, Address and
Year of Birth | | Current Position and
Length of Service
with the Fund | | Principal Occupation and Other Directorships
During the Past Five Years |
| | | | | |
Karla M. Rabusch
Lord, Abbett & Co. LLC
c/o Legal Dept.
90 Hudson Street
Jersey City, NJ 07302
(1959) | | Board member since 2017 | | Principal Occupation: President and Director of Wells Fargo Funds Management, LLC (2003–2017); President of Wells Fargo Funds (2003–2016). Other Directorships: None. |
| | | | | |
| Lorin Patrick | | | | |
Taylor Radtke
Lord, Abbett & Co. LLC
c/o Legal Dept.
90 Hudson Street
Jersey City, NJ 07302
(1968) | | Board member since 2021 | | Principal Occupation: Partner and Co-Founder of M Seven 8 Partners LLC, a venture capital firm (since 2016). Formerly Partner, Goldman Sachs (1992–2016). Other Directorships: Currently serves as director of Assured Guaranty (2021–Present), Virtual Combine (2018–Present), and Mariposa Family Learning Center (2021–Present). Previously served as director of SummerMoon Coffee (2022). |
| | | | | |
Leah Song Richardson
Lord, Abbett & Co. LLC
c/o Legal Dept.
90 Hudson Street
Jersey City, NJ 07302
(1966) | | Board member since 2021 | | Principal Occupation: President of Colorado College (since 2021) and was formerly Dean at University of California, Irvine – School of Law (2017–2021) and formerly Professor of Law at University of California, Irvine (2014–2017). Other Directorships: None. |
| | | | | |
Mark A. Schmid
Lord, Abbett & Co. LLC
c/o Legal Dept.
90 Hudson Street
Jersey City, NJ 07302
(1959) | | Board member since 2016 | | Principal Occupation: Vice President and Chief Investment Officer of the University of Chicago (2009–2021). Other Directorships: None. |
| | | | | |
James L.L. Tullis
Lord, Abbett & Co. LLC
c/o Legal Dept.
90 Hudson Street
Jersey City, NJ 07302
(1947) | | Board member since 2006; Chairman since 2017 | | Principal Occupation: Chairman of Tullis Health Investors - FL LLC (since 2018); CEO of Tullis-Dickerson and Co. Inc., a venture capital management firm (1990–2016). Other Directorships: Currently serves as Chairman of Crane Co. (since 2020, director since 1998), Director of Alphatec Spine (since 2018), and Director of Exagen Inc. (since 2019). Previously served as director of electroCore, Inc. (2018–2020). |
229
Basic Information About Management (continued)
Interested Board Members
Mr. Sieg is affiliated with Lord Abbett and is an “interested person” of the Fund as defined in the Act. Mr. Sieg is a board member of each of the 14 investment companies in the Lord Abbett Family of Funds, which consist of 62 investment portfolios. Mr. Sieg is an officer of the Lord Abbett Family of Funds.
Name, Address and
Year of Birth | | Current Position and
Length of Service
with the Fund | | Principal Occupation and Other Directorships
During the Past Five Years |
| | | | | |
Douglas B. Sieg
Lord, Abbett & Co. LLC
90 Hudson Street
Jersey City, NJ 07302
(1969) | | Board member since 2016 | | Principal Occupation: Managing Partner of Lord Abbett (since 2018) and was formerly Head of Client Services, joined Lord Abbett in 1994. Other Directorships: None. |
Officers
None of the officers listed below have received compensation from the Fund. All of the officers of the Fund also may be officers of the other Lord Abbett Funds and maintain offices at 90 Hudson Street, Jersey City, NJ 07302. Unless otherwise indicated, the position(s) and title(s) listed under the “Principal Occupation During the Past Five Years” column indicate each officer’s position(s) and title(s) with Lord Abbett. Each officer serves for an indefinite term (i.e., until his or her death, resignation, retirement, or removal).
Name and
Year of Birth | | Current Position
with the Fund | | Length of Service
of Current
Position | | Principal Occupation
During the Past Five
Years |
| | | | | | | |
Douglas B. Sieg
(1969) | | President and Chief Executive Officer | | Elected as President and Chief Executive Officer in 2018 | | Managing Partner of Lord Abbett (since 2018) and was formerly Head of Client Services, joined Lord Abbett in 1994. |
| | | | | | | |
Jackson C. Chan
(1964) | | AML Compliance Officer | | Elected in 2018 | | Deputy Chief Compliance Officer and Director of Regulatory Affairs, joined Lord Abbett in 2014. |
| | | | | | | |
Nicholas
D. Emguschowa
(1986) | | Data Protection Officer | | Elected in 2022 | | Assistant General Counsel, joined Lord Abbett in 2018 and was formerly Associate at Shearman & Sterling (2014-2018). |
230
Basic Information About Management (concluded)
Name and
Year of Birth | | Current Position
with the Fund | | Length of Service
of Current
Position | | Principal Occupation
During the Past Five Years |
| | | | | | | |
Michael J. Hebert
(1976) | | Chief Financial Officer and Treasurer | | Elected as Chief Financial Officer and Treasurer in 2021 | | Head of Global Fund Finance, joined Lord Abbett in 2021 and was formerly Vice President at Eaton Vance Management (EVM) (2014-2021) and Calvert Research & Management (CRM) (2016-2021), and Assistant Treasurer of registered investment companies managed, advised or administered by EVM and CRM during such years. |
| | | | | | | |
Jennifer C. Karam
(1970) | | Vice President and Assistant Secretary | | Elected in 2022 | | Partner and Senior Deputy General Counsel, joined Lord Abbett in 2012. |
| | | | | | | |
Linda Y. Kim
(1980) | | Vice President and Assistant Secretary | | Elected in 2016 | | Counsel, joined Lord Abbett in 2015. |
| | | | | | | |
Joseph M. McGill
(1962) | | Chief Compliance Officer | | Elected in 2014 | | Partner and Chief Compliance Officer, joined Lord Abbett in 2014. |
| | | | | | | |
Amanda S. Ryan
(1978) | | Vice President and Assistant Secretary | | Elected in 2018 | | Counsel, joined Lord Abbett in 2016. |
| | | | | | | |
Lawrence B. Stoller
(1963) | | Vice President, Secretary and Chief Legal Officer | | Elected as Vice President and Secretary in 2007 and Chief Legal Officer in 2019 | | Partner and General Counsel, joined Lord Abbett in 2007. |
| | | | | | | |
Victoria Zozulya
(1983) | | Vice President and Assistant Secretary | | Elected in 2022 | | Counsel, joined Lord Abbett in 2022 and was formerly Senior Director and Counsel at Equitable (2018-2022) and Assistant General Counsel at Neuberger Berman (2014-2018). |
Please call 888-522-2388 for a copy of the statement of additional information, which contains further information about the Fund’s Board members. It is available free upon request.
231
Liquidity Risk Management Program
Pursuant to Rule 22e-4 under the 1940 Act, the Funds adopted a Liquidity Risk Management Program and Policy (“Program”). The Program is designed to assess, manage and periodically review the Funds’ liquidity risk. Liquidity risk is defined under Rule 22e-4 as the risk that the Funds could not meet redemption requests without significant dilution of remaining investors’ interests in the Fund. The Board has appointed Lord Abbett as the administrator for the Fund’s Program. At the May 17-18, 2022 meeting, Lord Abbett provided the Board with a report addressing the operation of the Program and assessing its adequacy and effectiveness of implementation for the period April 1, 2021 through March 31, 2022. Lord Abbett reported that the Programoperated effectively during the period. In particular, Lord Abbett reported that: no Fund breached its 15% limit on illiquid investments at any point during the period and all regulatory reporting related to Rule 22e-4 was completed on time and without issue during the period. There can be no assurance that the Program will achieve its objectives in the future. Please refer to the Funds’ prospectus for more information regarding the Funds’ exposure to liquidity risk and other principal risks to which an investment in the Funds may be subject.
Householding
The Company has adopted a policy that allows it to send only one copy of each Fund’s prospectus, proxy material, annual report and semiannual report (or related notice of internet availability of annual report and semiannual report) to certain shareholders residing at the same “household.” This reduces Fund expenses, which benefits you and other shareholders. If you need additional copies or do not want your mailings to be “householded,” please call Lord Abbett at 888-522-2388 or send a written request with your name, the name of your fund or funds and your account number or numbers to Lord Abbett Family of Funds, P.O. Box 219336, Kansas City, MO64121.
Proxy Voting Policies, Procedures and Records
A description of the policies and procedures that Lord Abbett uses to vote proxies related to each Fund’s portfolio securities, and information on how Lord Abbett voted each Fund’s proxies during the 12-month period ended June 30 are available without charge, upon request, (i) by calling 888-522-2388; (ii) on Lord Abbett’s website at www.lordabbett.com; and (iii) on the Securities and Exchange Commission’s (“SEC”) website at www.sec.gov.
Shareholder Reports and Quarterly Portfolio Disclosure
The Funds are required to file their complete schedule of portfolio holdings with the SEC for their first and third fiscal quarters as an attachment to Form N-PORT. Copies of the filings are available without charge, upon request on the SEC’s website at www.sec.gov and may be available by calling Lord Abbett at 888-522-2388.
232
| |
| Tax Information (unaudited) |
| |
| The percentages below reflect the portion of ordinary income distributions paid during the fiscal year ended September 30, 2022 that is tax-exempt dividend income. |
| | |
| | Short Duration | 100% | |
| | Intermediate | 100% | |
| | National | 100% | |
| | High Income | 99% | |
| | Short Duration High Income | 98% | |
| | Sustainable | 100% | |
| | California | 100% | |
| | New Jersey | 100% | |
| | New York | 100% | |
| | |
233


This report, when not used for the general information of shareholders of the Fund, is to be distributed only if preceded or accompanied by a current fund prospectus. Lord Abbett mutual fund shares are distributed by LORD ABBETT DISTRIBUTOR LLC.
| | Lord Abbett Municipal Income Fund, Inc. Lord Abbett Short Duration Tax Free Fund Lord Abbett Intermediate Tax Free Fund Lord Abbett National Tax-Free Income Fund Lord Abbett High Income Municipal Bond Fund Lord Abbett Short Duration High Income Municipal Bond Fund Lord Abbett Sustainable Municipal Bond Fund Lord Abbett California Tax-Free Income Fund Lord Abbett New Jersey Tax-Free Income Fund Lord Abbett New York Tax-Free Income Fund | LATFI-2
(11/22) |
| (a) | In accordance with applicable requirements, the Registrant adopted a Sarbanes-Oxley Code of Ethics on June 19, 2003 that applies to the principal executive officer and senior financial officers of the Registrant (“Code of Ethics”). The Code of Ethics was in effect during the fiscal year ended September 30, 2022 (the “Period”). |
| (c) | The Registrant has not amended the Code of Ethics as described in Form N-CSR during the Period. |
| (d) | The Registrant has not granted any waiver, including an implicit waiver, from a provision of the Code of Ethics as described in Form N-CSR during the Period. |
| (f) | See Item 13(a)(1) concerning the filing of the Code of Ethics. |
| Item 3: | Audit Committee Financial Expert. |
The Registrant’s board of directors has determined that each of the following independent directors who are members of the audit committee is an audit committee financial expert: Evelyn E. Guernsey, Karla M. Rabusch and Mark A. Schmid. Each of these persons is independent within the meaning of the Form N-CSR.
| Item 4: | Principal Accountant Fees and Services. |
In response to sections (a), (b), (c) and (d) of Item 4, the aggregate fees billed to the Registrant for the fiscal years ended September 30, 2022 and 2021 by the Registrant’s principal accounting firm, Deloitte & Touche LLP, the member firms of Deloitte Touche Tohmatsu and their respective affiliates (collectively, “Deloitte”) were as follows:
| | Fiscal year ended: |
| | 2022 | | 2021 |
| Audit Fees {a} | $366,000 | | $320,000 |
| Audit-Related Fees | - 0 - | | - 0 - |
| Total audit and audit-related fees | $366,000 | | $320,000 |
| | | | |
| Tax Fees {b} | - 0 - | | $33,844 |
| All Other Fees | - 0 - | | - 0 - |
| | | | |
| Total Fees | $366,000 | | $353,844 |
{a} Consists of fees for audits of the Registrant’s annual financial statements.
{b} Fees for the fiscal year ended September 30, 2022 and 2021 consist of fees for preparing the U.S. Income Tax Return for Regulated Investment Companies, New Jersey Corporation Business Tax Return, New Jersey Annual Report Form, U.S. Return of Excise Tax on Undistributed Income of Investment Companies, IRS Forms 1099-MISC and 1096 Annual Summary and Transmittal of U.S. Information Returns.
(e) (1) Pursuant to Rule 2-01(c) (7) of Regulation S-X, the Registrant’s Audit Committee has adopted pre-approval policies and procedures. Such policies and procedures generally provide that the Audit Committee must pre-approve:
| · | any audit, audit-related, tax, and other services to be provided to the Lord Abbett Funds, including the Registrant, and |
| · | any audit-related, tax, and other services to be provided to the Registrant’s investment adviser and any entity controlling, controlled by or under common control with the investment adviser that provides ongoing services to one or more Funds comprising the Registrant if the engagement relates directly to operations and financial reporting of a Fund, by the independent auditor to assure that the provision of such services does not impair the auditor’s independence. |
The Audit Committee has delegated pre-approval authority to its Chairman, subject to a fee limit of $10,000 per event, and not to exceed $25,000 annually. The Chairman will report any pre-approval decisions to the Audit Committee at its next scheduled meeting. Unless a type of service to be provided by the independent auditor has received general pre-approval, it must be pre-approved by the Audit Committee. Any proposed services exceeding pre-approved cost levels will require specific pre-approval by the Audit Committee.
(e) (2) The Registrant’s Audit Committee has approved 100% of the services described in this Item 4 (b) through (d).
(f) Not applicable.
(g) The aggregate non-audit fees billed by Deloitte for services rendered to the Registrant are shown above in the response to Item 4 (a), (b), (c) and (d) as “All Other Fees”.
The aggregate non-audit fees billed by Deloitte for services rendered to the Registrant’s investment adviser, Lord, Abbett & Co. LLC (“Lord Abbett”), for the fiscal years ended September 30, 2022 and 2021 were:
| | Fiscal year ended: |
| | 2022 | | 2021 |
| All Other Fees {a} | $270,000 | | $220,000 |
{a} Consist of fees for Independent Services Auditors’ Report on Controls Placed in Operation and Tests of Operating Effectiveness related to Lord Abbett’s Asset Management Services (“SOC-1 Report”).
The aggregate non-audit fees billed by Deloitte for services rendered to entities under the common control of Lord Abbett for the fiscal years ended September 30, 2022 and 2021 were:
| | Fiscal year ended: |
| | 2022 | | 2021 |
| All Other Fees | $ - 0 - | | $ - 0- |
(h) The Registrant’s Audit Committee has considered the provision of non-audit services that were rendered to the Registrant’s investment adviser, and any entity controlling, controlled by or under common control with the investment adviser that provides ongoing services to the Registrant, that were not pre-approved pursuant to Rule 2-01 (c)(7)(ii) of Regulation S-X and has determined that the provision of such services is compatible with maintaining Deloitte’s independence.
| Item 5: | Audit Committee of Listed Registrants. |
Not applicable.
| Item 6: | Schedule of Investments. |
Not applicable.
| Item 7: | Disclosure of Proxy Voting Policies and Procedures for Closed-End Management Investment Companies. |
Not applicable.
| Item 8: | Portfolio Managers of Closed-End Management Investment Companies. |
Not applicable.
| Item 9: | Purchases of Equity Securities by Closed-End Management Investment Company and Affiliated Purchasers. |
Not applicable.
| Item 10: | Submission of Matters to a Vote of Security Holders. |
Not applicable.
| Item 11: | Controls and Procedures. |
| (a) | The principal executive officer and principal financial & accounting officer have concluded as of a date within 90 days of the filing date of this report, based on their evaluation of the Registrant’s disclosure controls and procedures (as defined in Rule 30a-3(c) under the Investment Company Act of 1940), that the design of such procedures is effective to provide reasonable assurance that material information required to be disclosed by the Registrant on Form N-CSR is recorded, processed, summarized and reported within the time periods specified in the Commission’s rules and forms. |
| (b) | There were no changes in the Registrant’s internal control over financial reporting (as defined in Rule 30a-3(d) under the Investment Company Act of 1940) that occurred during the period covered by this report that have materially affected, or are reasonably likely to materially affect, the Registrant’s internal control over financial reporting. |
| Item 12: | Disclosure of Securities Lending Activities for Closed-End Management Investment Companies. |
Not applicable.
SIGNATURES
Pursuant to the requirements of the Securities Exchange Act of 1934 and the Investment Company Act of 1940, the Registrant has duly caused this report to be signed on its behalf by the undersigned, thereunto duly authorized.
| | LORD ABBETT MUNICIPAL INCOME FUND, INC. |
| | | | |
| | | By: | /s/ Douglas B. Sieg |
| | | | Douglas B. Sieg |
| | | | President and Chief Executive Officer |
Date: November 22, 2022
Pursuant to the requirements of the Securities Exchange Act of 1934 and the Investment Company Act of 1940, this report has been signed below by the following persons on behalf of the Registrant and in the capacities and on the dates indicated.
| | | By: | /s/ Douglas B. Sieg |
| | | | Douglas B. Sieg |
| | | | President and Chief Executive Officer |
Date: November 22, 2022
| | | By: | /s/ Michael J. Hebert |
| | | | Michael J. Hebert |
| | | | Chief Financial Officer and Treasurer |
Date: November 22, 2022