UNITED STATES
SECURITIES AND EXCHANGE COMMISSION
Washington, D.C. 20549
FORM N-CSR
CERTIFIED SHAREHOLDER REPORT OF REGISTERED
MANAGEMENT INVESTMENT COMPANIES
Investment Company Act File Number: 811-03942
LORD ABBETT MUNICIPAL INCOME FUND, INC.
(Exact name of Registrant as specified in charter)
30 Hudson Street, Jersey City, New Jersey 07302-4804
(Address of principal executive offices) (Zip code)
Randolph A. Stuzin, Esq.
Vice President and Assistant Secretary
30 Hudson Street, Jersey City, New Jersey 07302-4804
(Name and address of agent for service)
Registrant’s telephone number, including area code: (888) 522-2388
Date of fiscal year end: 9/30
Date of reporting period: 9/30/2024
| Item 1: | Report(s) to Shareholders. |
Lord Abbett High Income Municipal Bond Fund
Annual Shareholder Report
September 30, 2024
lordabbett.com/FundDocuments
This annual shareholder report contains important information about the Lord Abbett High Income Municipal Bond Fund for the period of October 1, 2023 to September 30, 2024, as well as certain changes to the Fund. You can find additional information about the Fund at lordabbett.com/FundDocuments. You can also request this information by contacting us at 888-522-2388.
What were the Fund costs for the last year?
(based on a hypothetical $10,000 investment)
| Class Name | Costs of a $10,000 investment | Costs paid as a percentage of a $10,000 investment |
|---|
| Class A | $88 | 0.82% |
How did the Fund perform last year and what affected its performance?
For the fiscal year ended September 30, 2024, the Fund returned 15.38%, reflecting performance at the net asset value (NAV) of Class A shares, compared to the 17.38% of a securities market index with investment characteristics similar to those of the Fund, the Bloomberg High Yield Municipal Bond Index. The Fund's broad-based market index, the Bloomberg Aggregate Bond Index, returned 11.57% over the same period.
Positive factors for the municipal market included decreasing Treasury yields, easing inflationary pressures and the start of interest rate cuts by the U.S. Federal Reserve. Also supporting the market was increased demand for municipal bond funds and a strong fundamental backdrop as evidenced by growing tax revenue and positive ratings actions by public ratings agencies. Negative factors included a significant increase in municipal bond supply, which pressured the market in second half of the fiscal year, and periods of interest rate volatility driven by sticky inflation readings at points throughout the fiscal year. Against this backdrop, municipal bonds delivered strong returns.
Top contributors to the Fund’s performance: Security selection within the Education, Health Care and Tobacco sectors contributed to relative performance. An overweight allocation to the Health Care sector and underweight allocation to the Education sector contributed to relative performance.
Top detractors from the Fund’s performance: The Fund’s allocation to investment grade bonds was the primary detractor from relative performance. The Fund’s yield curve positioning led to a modest negative impact on relative performance. In particular, an overweight allocation to intermediate maturity bonds detracted as yields fell less at this part of the curve.
Total Return Based on $10,000 Investment

| Class A with load | Bloomberg High Yield Municipal Bond Index | Bloomberg 65% High Yield Municipal Bond Index/ 35% Bloomberg Municipal Bond Index | Lipper High Yield Municipal Debt Funds Average | Bloomberg Aggregate Bond Index |
|---|
| 9/30/2014 | $9,774 | $10,000 | $10,000 | $10,000 | $10,000 |
| 10/31/2014 | $9,827 | $9,964 | $10,000 | $10,077 | $10,098 |
| 11/30/2014 | $9,880 | $10,067 | $10,074 | $10,117 | $10,170 |
| 12/31/2014 | $9,945 | $10,121 | $10,127 | $10,206 | $10,179 |
| 1/31/2015 | $10,125 | $10,302 | $10,307 | $10,402 | $10,393 |
| 2/28/2015 | $10,061 | $10,261 | $10,243 | $10,324 | $10,295 |
| 3/31/2015 | $10,100 | $10,234 | $10,236 | $10,364 | $10,343 |
| 4/30/2015 | $10,095 | $10,192 | $10,190 | $10,330 | $10,306 |
| 5/31/2015 | $10,107 | $10,307 | $10,255 | $10,315 | $10,281 |
| 6/30/2015 | $9,984 | $9,927 | $10,006 | $10,188 | $10,169 |
| 7/31/2015 | $9,964 | $9,873 | $9,996 | $10,240 | $10,240 |
| 8/31/2015 | $9,994 | $9,914 | $10,030 | $10,261 | $10,225 |
| 9/30/2015 | $10,103 | $10,124 | $10,194 | $10,348 | $10,294 |
| 10/31/2015 | $10,212 | $10,248 | $10,288 | $10,424 | $10,296 |
| 11/30/2015 | $10,252 | $10,289 | $10,330 | $10,481 | $10,269 |
| 12/31/2015 | $10,309 | $10,304 | $10,365 | $10,577 | $10,235 |
| 1/31/2016 | $10,395 | $10,363 | $10,447 | $10,672 | $10,376 |
| 2/29/2016 | $10,461 | $10,477 | $10,527 | $10,693 | $10,450 |
| 3/31/2016 | $10,554 | $10,587 | $10,611 | $10,796 | $10,546 |
| 4/30/2016 | $10,657 | $10,652 | $10,680 | $10,900 | $10,586 |
| 5/31/2016 | $10,769 | $10,792 | $10,782 | $10,987 | $10,589 |
| 6/30/2016 | $11,008 | $11,127 | $11,059 | $11,204 | $10,779 |
| 7/31/2016 | $11,076 | $11,200 | $11,109 | $11,219 | $10,847 |
| 8/31/2016 | $11,122 | $11,240 | $11,140 | $11,265 | $10,835 |
| 9/30/2016 | $11,142 | $11,270 | $11,140 | $11,241 | $10,829 |
| 10/31/2016 | $11,024 | $11,130 | $11,009 | $11,107 | $10,746 |
| 11/30/2016 | $10,538 | $10,468 | $10,440 | $10,589 | $10,492 |
| 12/31/2016 | $10,585 | $10,613 | $10,576 | $10,659 | $10,506 |
| 1/31/2017 | $10,709 | $10,761 | $10,697 | $10,737 | $10,527 |
| 2/28/2017 | $10,841 | $11,018 | $10,889 | $10,856 | $10,598 |
| 3/31/2017 | $10,870 | $11,043 | $10,913 | $10,913 | $10,592 |
| 4/30/2017 | $10,956 | $11,118 | $10,989 | $11,101 | $10,674 |
| 5/31/2017 | $11,071 | $11,288 | $11,159 | $11,271 | $10,756 |
| 6/30/2017 | $11,081 | $11,263 | $11,129 | $11,263 | $10,745 |
| 7/31/2017 | $11,185 | $11,337 | $11,208 | $11,336 | $10,792 |
| 8/31/2017 | $11,350 | $11,493 | $11,339 | $11,457 | $10,888 |
| 9/30/2017 | $11,299 | $11,432 | $11,279 | $11,445 | $10,836 |
| 10/31/2017 | $11,232 | $11,463 | $11,309 | $11,445 | $10,843 |
| 11/30/2017 | $11,241 | $11,492 | $11,306 | $11,462 | $10,829 |
| 12/31/2017 | $11,366 | $11,641 | $11,443 | $11,587 | $10,879 |
| 1/31/2018 | $11,345 | $11,532 | $11,326 | $11,513 | $10,753 |
| 2/28/2018 | $11,335 | $11,540 | $11,319 | $11,480 | $10,651 |
| 3/31/2018 | $11,451 | $11,709 | $11,442 | $11,557 | $10,720 |
| 4/30/2018 | $11,508 | $11,762 | $11,461 | $11,562 | $10,640 |
| 5/31/2018 | $11,663 | $12,008 | $11,663 | $11,710 | $10,716 |
| 6/30/2018 | $11,770 | $12,068 | $11,704 | $11,746 | $10,703 |
| 7/31/2018 | $11,808 | $12,110 | $11,740 | $11,786 | $10,705 |
| 8/31/2018 | $11,905 | $12,207 | $11,812 | $11,832 | $10,774 |
| 9/30/2018 | $11,845 | $12,159 | $11,755 | $11,772 | $10,705 |
| 10/31/2018 | $11,676 | $12,007 | $11,634 | $11,646 | $10,620 |
| 11/30/2018 | $11,706 | $12,091 | $11,732 | $11,694 | $10,683 |
| 12/31/2018 | $11,797 | $12,195 | $11,847 | $11,794 | $10,880 |
| 1/31/2019 | $11,847 | $12,277 | $11,930 | $11,859 | $10,995 |
| 2/28/2019 | $11,995 | $12,343 | $11,994 | $11,954 | $10,989 |
| 3/31/2019 | $12,289 | $12,662 | $12,262 | $12,189 | $11,200 |
| 4/30/2019 | $12,381 | $12,733 | $12,323 | $12,257 | $11,203 |
| 5/31/2019 | $12,595 | $12,940 | $12,512 | $12,444 | $11,402 |
| 6/30/2019 | $12,677 | $13,007 | $12,571 | $12,501 | $11,545 |
| 7/31/2019 | $12,769 | $13,089 | $12,658 | $12,583 | $11,570 |
| 8/31/2019 | $13,075 | $13,404 | $12,926 | $12,818 | $11,870 |
| 9/30/2019 | $13,022 | $13,377 | $12,872 | $12,760 | $11,807 |
| 10/31/2019 | $13,020 | $13,405 | $12,898 | $12,768 | $11,842 |
| 11/30/2019 | $13,070 | $13,457 | $12,942 | $12,819 | $11,836 |
| 12/31/2019 | $13,151 | $13,497 | $12,981 | $12,862 | $11,828 |
| 1/31/2020 | $13,440 | $13,830 | $13,270 | $13,112 | $12,056 |
| 2/29/2020 | $13,782 | $14,121 | $13,512 | $13,348 | $12,273 |
| 3/31/2020 | $12,174 | $12,568 | $12,375 | $12,136 | $12,201 |
| 4/30/2020 | $11,729 | $12,144 | $12,049 | $11,785 | $12,417 |
| 5/31/2020 | $12,169 | $12,640 | $12,503 | $12,164 | $12,475 |
| 6/30/2020 | $12,705 | $13,141 | $12,861 | $12,564 | $12,554 |
| 7/31/2020 | $13,019 | $13,497 | $13,163 | $12,833 | $12,741 |
| 8/31/2020 | $13,046 | $13,533 | $13,164 | $12,838 | $12,638 |
| 9/30/2020 | $13,010 | $13,546 | $13,174 | $12,834 | $12,632 |
| 10/31/2020 | $12,994 | $13,571 | $13,175 | $12,822 | $12,575 |
| 11/30/2020 | $13,345 | $13,897 | $13,451 | $13,116 | $12,699 |
| 12/31/2020 | $13,610 | $14,157 | $13,643 | $13,338 | $12,716 |
| 1/31/2021 | $13,917 | $14,452 | $13,859 | $13,564 | $12,625 |
| 2/28/2021 | $13,705 | $14,301 | $13,687 | $13,399 | $12,443 |
| 3/31/2021 | $13,818 | $14,456 | $13,813 | $13,503 | $12,287 |
| 4/30/2021 | $14,018 | $14,667 | $13,985 | $13,682 | $12,384 |
| 5/31/2021 | $14,192 | $14,836 | $14,104 | $13,836 | $12,425 |
| 6/30/2021 | $14,359 | $15,024 | $14,234 | $13,982 | $12,512 |
| 7/31/2021 | $14,515 | $15,204 | $14,386 | $14,114 | $12,652 |
| 8/31/2021 | $14,450 | $15,181 | $14,353 | $14,064 | $12,628 |
| 9/30/2021 | $14,285 | $15,081 | $14,256 | $13,937 | $12,518 |
| 10/31/2021 | $14,220 | $15,020 | $14,204 | $13,902 | $12,515 |
| 11/30/2021 | $14,443 | $15,217 | $14,367 | $14,069 | $12,552 |
| 12/31/2021 | $14,479 | $15,257 | $14,399 | $14,103 | $12,520 |
| 1/31/2022 | $13,978 | $14,830 | $14,000 | $13,730 | $12,250 |
| 2/28/2022 | $13,823 | $14,795 | $13,961 | $13,616 | $12,114 |
| 3/31/2022 | $13,231 | $14,261 | $13,474 | $13,149 | $11,777 |
| 4/30/2022 | $12,695 | $13,754 | $13,033 | $12,680 | $11,330 |
| 5/31/2022 | $12,844 | $13,905 | $13,194 | $12,837 | $11,403 |
| 6/30/2022 | $12,352 | $13,461 | $12,844 | $12,385 | $11,224 |
| 7/31/2022 | $12,797 | $13,964 | $13,275 | $12,826 | $11,498 |
| 8/31/2022 | $12,482 | $13,653 | $12,981 | $12,527 | $11,174 |
| 9/30/2022 | $11,687 | $12,812 | $12,287 | $11,851 | $10,691 |
| 10/31/2022 | $11,417 | $12,549 | $12,087 | $11,639 | $10,552 |
| 11/30/2022 | $12,125 | $13,280 | $12,742 | $12,261 | $10,940 |
| 12/31/2022 | $12,086 | $13,258 | $12,742 | $12,211 | $10,891 |
| 1/31/2023 | $12,576 | $13,847 | $13,237 | $12,675 | $11,226 |
| 2/28/2023 | $12,235 | $13,412 | $12,862 | $12,333 | $10,936 |
| 3/31/2023 | $12,358 | $13,620 | $13,092 | $12,507 | $11,214 |
| 4/30/2023 | $12,458 | $13,699 | $13,131 | $12,548 | $11,282 |
| 5/31/2023 | $12,371 | $13,604 | $13,032 | $12,477 | $11,159 |
| 6/30/2023 | $12,600 | $13,846 | $13,228 | $12,600 | $11,119 |
| 7/31/2023 | $12,642 | $13,936 | $13,302 | $12,634 | $11,111 |
| 8/31/2023 | $12,484 | $13,724 | $13,104 | $12,456 | $11,040 |
| 9/30/2023 | $12,065 | $13,258 | $12,680 | $12,064 | $10,760 |
| 10/31/2023 | $11,778 | $13,045 | $12,511 | $11,821 | $10,590 |
| 11/30/2023 | $12,565 | $14,057 | $13,419 | $12,642 | $11,069 |
| 12/31/2023 | $12,961 | $14,479 | $13,790 | $13,023 | $11,493 |
| 1/31/2024 | $13,036 | $14,411 | $13,724 | $13,072 | $11,462 |
| 2/29/2024 | $13,135 | $14,525 | $13,800 | $13,151 | $11,300 |
| 3/31/2024 | $13,228 | $14,697 | $13,906 | $13,230 | $11,404 |
| 4/30/2024 | $13,084 | $14,607 | $13,791 | $13,073 | $11,116 |
| 5/31/2024 | $13,168 | $14,718 | $13,844 | $13,152 | $11,304 |
| 6/30/2024 | $13,426 | $15,078 | $14,139 | $13,458 | $11,412 |
| 7/31/2024 | $13,562 | $15,243 | $14,285 | $13,595 | $11,678 |
| 8/31/2024 | $13,697 | $15,423 | $14,434 | $13,706 | $11,846 |
| 9/30/2024 | $13,920 | $15,562 | $14,568 | $13,876 | $12,004 |
The Fund’s benchmarks are unmanaged indices used as a general measure of market performance. Calculations assume the reinvestment of dividends and capital gains.
Average Annual Total Returns (%)
| 1 Year | 5 Years | 10 Years |
|---|
| Class A at NAV | 15.38% | 1.34% | 3.60% |
| Class A with sales charge | 12.81% | 0.88% | 3.36% |
| Bloomberg High Yield Municipal Bond Index | 17.38% | 3.07% | 4.52% |
| Bloomberg 65% High Yield Municipal Bond Index/ 35% Bloomberg Municipal Bond Index | 14.89% | 2.51% | 3.83% |
| Lipper High Yield Municipal Debt Funds Average | 15.02% | 1.69% | 3.33% |
Bloomberg Aggregate Bond IndexFootnote Reference* | 11.57% | 0.33% | 1.84% |
| Footnote | Description |
Footnote* | The Fund has adopted the Bloomberg Aggregate Bond Index as its broad-based securities market index. |
The Fund's past performance is no guarantee of future results. The returns do not reflect the deduction of taxes that a shareholder would pay on Fund distributions or redemption of Fund shares.
(as of September 30, 2024)
| Total Net Assets | $4,098,713,523 |
| # of Portfolio Holdings | 611 |
| Portfolio Turnover Rate | 27% |
| Total Advisory Fees Paid | $16,137,454 |
What did the Fund invest in?
(as of September 30, 2024)
Credit Rating S&P or Moody'sFootnote Reference(a) | %Footnote Reference** |
|---|
| |
- A3.12%
- A-3.62%
- A+4.07%
- AA4.24%
- AA-2.36%
- AA+0.32%
- AAA1.03%
- B0.75%
- B-2.26%
- B+2.14%
- BB6.67%
- BB-5.00%
- BB+6.47%
- BBB3.00%
- BBB-8.39%
- BBB+4.73%
- CCC0.30%
- CCC-1.01%
- CCC+0.36%
- NR40.16%
- Total 100.00%
| Footnote | Description |
Footnote** | Represents percent of total investments, which excludes derivatives. |
Footnote(a) | Investments in investment grade municipal bonds, which as bonds that are rated, at the time of purchase, within the four highest grades assigned by an independent rating agency such as Moody’s, S&P, or Fitch, or an equivalent short-term rating, as applicable, or are unrated by rating agencies but deemed by Lord Abbett to be of comparable quality. Lower rated municipal bonds are rated, at the time of purchase, or an equivalent short-term rating, as applicable, by an independent rating agency or are unrated by rating agencies but deemed by Lord Abbett to be of comparable quality. |
There were no material fund changes during the period.
Where can I find additional information about the Fund?
For additional information about the Fund, including its Prospectus, Statement of Additional Information, financial statements, holdings and proxy information, please visit lordabbett.com/FundDocuments.
The Fund has adopted a policy that allows it to send only one copy of the Fund's prospectus, proxy material, annual report and semiannual report (or related notice of internet availability of annual report and semiannual report) to certain shareholders residing at the same "household." This reduces Fund expenses, which benefits you and other shareholders.If you need additional copies or do not want your mailings to be "householded," please call Lord Abbett at 888-522-2388.
Lord Abbett High Income Municipal Bond Fund
Annual Shareholder Report
September 30, 2024
lordabbett.com/FundDocuments
TSR-A-1430-A
11/24
Lord Abbett High Income Municipal Bond Fund
Annual Shareholder Report
September 30, 2024
lordabbett.com/FundDocuments
This annual shareholder report contains important information about the Lord Abbett High Income Municipal Bond Fund for the period of October 1, 2023 to September 30, 2024, as well as certain changes to the Fund. You can find additional information about the Fund at lordabbett.com/FundDocuments. You can also request this information by contacting us at 888-522-2388.
What were the Fund costs for the last year?
(based on a hypothetical $10,000 investment)
| Class Name | Costs of a $10,000 investment | Costs paid as a percentage of a $10,000 investment |
|---|
| Class C | $153 | 1.43% |
How did the Fund perform last year and what affected its performance?
For the fiscal year ended September 30, 2024, the Fund returned 14.68%, reflecting performance at the net asset value (NAV) of Class C shares, compared to the 17.38% of a securities market index with investment characteristics similar to those of the Fund, the Bloomberg High Yield Municipal Bond Index. The Fund's broad-based market index, the Bloomberg Aggregate Bond Index, returned 11.57% over the same period.
Positive factors for the municipal market included decreasing Treasury yields, easing inflationary pressures and the start of interest rate cuts by the U.S. Federal Reserve. Also supporting the market was increased demand for municipal bond funds and a strong fundamental backdrop as evidenced by growing tax revenue and positive ratings actions by public ratings agencies. Negative factors included a significant increase in municipal bond supply, which pressured the market in second half of the fiscal year, and periods of interest rate volatility driven by sticky inflation readings at points throughout the fiscal year. Against this backdrop, municipal bonds delivered strong returns.
Top contributors to the Fund’s performance: Security selection within the Education, Health Care and Tobacco sectors contributed to relative performance. An overweight allocation to the Health Care sector and underweight allocation to the Education sector contributed to relative performance.
Top detractors from the Fund’s performance: The Fund’s allocation to investment grade bonds was the primary detractor from relative performance. The Fund’s yield curve positioning led to a modest negative impact on relative performance. In particular, an overweight allocation to intermediate maturity bonds detracted as yields fell less at this part of the curve.
Total Return Based on $10,000 Investment
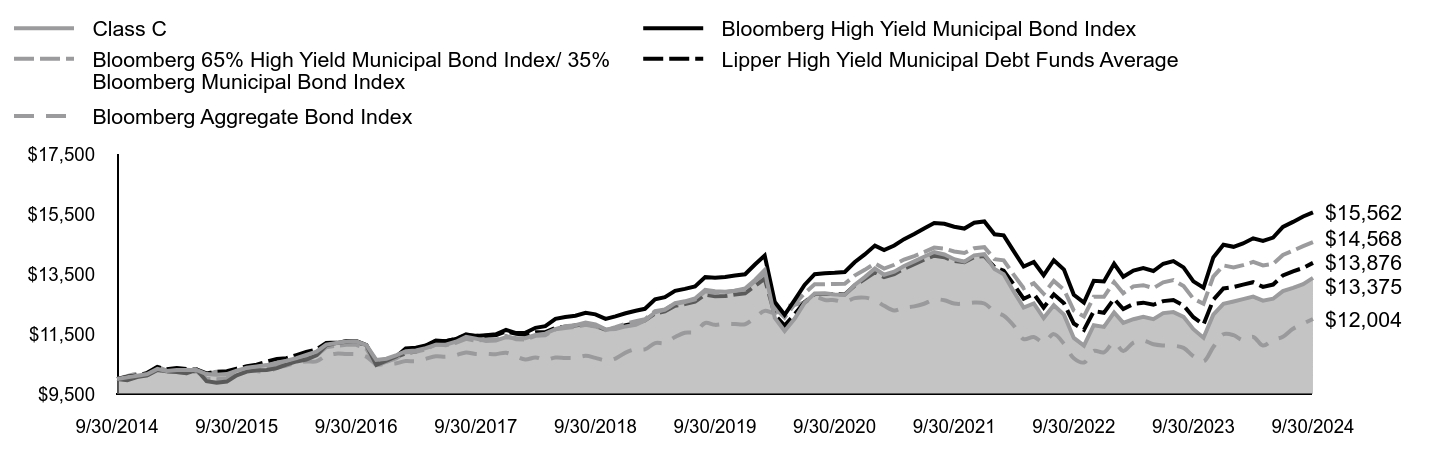
| Class C | Bloomberg High Yield Municipal Bond Index | Bloomberg 65% High Yield Municipal Bond Index/ 35% Bloomberg Municipal Bond Index | Lipper High Yield Municipal Debt Funds Average | Bloomberg Aggregate Bond Index |
|---|
| 9/30/2014 | $10,000 | $10,000 | $10,000 | $10,000 | $10,000 |
| 10/31/2014 | $10,058 | $9,964 | $10,000 | $10,077 | $10,098 |
| 11/30/2014 | $10,106 | $10,067 | $10,074 | $10,117 | $10,170 |
| 12/31/2014 | $10,167 | $10,121 | $10,127 | $10,206 | $10,179 |
| 1/31/2015 | $10,338 | $10,302 | $10,307 | $10,402 | $10,393 |
| 2/28/2015 | $10,267 | $10,261 | $10,243 | $10,324 | $10,295 |
| 3/31/2015 | $10,301 | $10,234 | $10,236 | $10,364 | $10,343 |
| 4/30/2015 | $10,299 | $10,192 | $10,190 | $10,330 | $10,306 |
| 5/31/2015 | $10,297 | $10,307 | $10,255 | $10,315 | $10,281 |
| 6/30/2015 | $10,167 | $9,927 | $10,006 | $10,188 | $10,169 |
| 7/31/2015 | $10,141 | $9,873 | $9,996 | $10,240 | $10,240 |
| 8/31/2015 | $10,166 | $9,914 | $10,030 | $10,261 | $10,225 |
| 9/30/2015 | $10,281 | $10,124 | $10,194 | $10,348 | $10,294 |
| 10/31/2015 | $10,377 | $10,248 | $10,288 | $10,424 | $10,296 |
| 11/30/2015 | $10,421 | $10,289 | $10,330 | $10,481 | $10,269 |
| 12/31/2015 | $10,465 | $10,304 | $10,365 | $10,577 | $10,235 |
| 1/31/2016 | $10,547 | $10,363 | $10,447 | $10,672 | $10,376 |
| 2/29/2016 | $10,609 | $10,477 | $10,527 | $10,693 | $10,450 |
| 3/31/2016 | $10,698 | $10,587 | $10,611 | $10,796 | $10,546 |
| 4/30/2016 | $10,805 | $10,652 | $10,680 | $10,900 | $10,586 |
| 5/31/2016 | $10,913 | $10,792 | $10,782 | $10,987 | $10,589 |
| 6/30/2016 | $11,149 | $11,127 | $11,059 | $11,204 | $10,779 |
| 7/31/2016 | $11,203 | $11,200 | $11,109 | $11,219 | $10,847 |
| 8/31/2016 | $11,254 | $11,240 | $11,140 | $11,265 | $10,835 |
| 9/30/2016 | $11,258 | $11,270 | $11,140 | $11,241 | $10,829 |
| 10/31/2016 | $11,133 | $11,130 | $11,009 | $11,107 | $10,746 |
| 11/30/2016 | $10,637 | $10,468 | $10,440 | $10,589 | $10,492 |
| 12/31/2016 | $10,679 | $10,613 | $10,576 | $10,659 | $10,506 |
| 1/31/2017 | $10,799 | $10,761 | $10,697 | $10,737 | $10,527 |
| 2/28/2017 | $10,926 | $11,018 | $10,889 | $10,856 | $10,598 |
| 3/31/2017 | $10,950 | $11,043 | $10,913 | $10,913 | $10,592 |
| 4/30/2017 | $11,031 | $11,118 | $10,989 | $11,101 | $10,674 |
| 5/31/2017 | $11,140 | $11,288 | $11,159 | $11,271 | $10,756 |
| 6/30/2017 | $11,145 | $11,263 | $11,129 | $11,263 | $10,745 |
| 7/31/2017 | $11,244 | $11,337 | $11,208 | $11,336 | $10,792 |
| 8/31/2017 | $11,404 | $11,493 | $11,339 | $11,457 | $10,888 |
| 9/30/2017 | $11,347 | $11,432 | $11,279 | $11,445 | $10,836 |
| 10/31/2017 | $11,273 | $11,463 | $11,309 | $11,445 | $10,843 |
| 11/30/2017 | $11,286 | $11,492 | $11,306 | $11,462 | $10,829 |
| 12/31/2017 | $11,396 | $11,641 | $11,443 | $11,587 | $10,879 |
| 1/31/2018 | $11,369 | $11,532 | $11,326 | $11,513 | $10,753 |
| 2/28/2018 | $11,363 | $11,540 | $11,319 | $11,480 | $10,651 |
| 3/31/2018 | $11,473 | $11,709 | $11,442 | $11,557 | $10,720 |
| 4/30/2018 | $11,515 | $11,762 | $11,461 | $11,562 | $10,640 |
| 5/31/2018 | $11,664 | $12,008 | $11,663 | $11,710 | $10,716 |
| 6/30/2018 | $11,765 | $12,068 | $11,704 | $11,746 | $10,703 |
| 7/31/2018 | $11,797 | $12,110 | $11,740 | $11,786 | $10,705 |
| 8/31/2018 | $11,888 | $12,207 | $11,812 | $11,832 | $10,774 |
| 9/30/2018 | $11,821 | $12,159 | $11,755 | $11,772 | $10,705 |
| 10/31/2018 | $11,656 | $12,007 | $11,634 | $11,646 | $10,620 |
| 11/30/2018 | $11,671 | $12,091 | $11,732 | $11,694 | $10,683 |
| 12/31/2018 | $11,755 | $12,195 | $11,847 | $11,794 | $10,880 |
| 1/31/2019 | $11,808 | $12,277 | $11,930 | $11,859 | $10,995 |
| 2/28/2019 | $11,950 | $12,343 | $11,994 | $11,954 | $10,989 |
| 3/31/2019 | $12,226 | $12,662 | $12,262 | $12,189 | $11,200 |
| 4/30/2019 | $12,311 | $12,733 | $12,323 | $12,257 | $11,203 |
| 5/31/2019 | $12,528 | $12,940 | $12,512 | $12,444 | $11,402 |
| 6/30/2019 | $12,593 | $13,007 | $12,571 | $12,501 | $11,545 |
| 7/31/2019 | $12,688 | $13,089 | $12,658 | $12,583 | $11,570 |
| 8/31/2019 | $12,975 | $13,404 | $12,926 | $12,818 | $11,870 |
| 9/30/2019 | $12,926 | $13,377 | $12,872 | $12,760 | $11,807 |
| 10/31/2019 | $12,916 | $13,405 | $12,898 | $12,768 | $11,842 |
| 11/30/2019 | $12,949 | $13,457 | $12,942 | $12,819 | $11,836 |
| 12/31/2019 | $13,022 | $13,497 | $12,981 | $12,862 | $11,828 |
| 1/31/2020 | $13,312 | $13,830 | $13,270 | $13,112 | $12,056 |
| 2/29/2020 | $13,633 | $14,121 | $13,512 | $13,348 | $12,273 |
| 3/31/2020 | $12,036 | $12,568 | $12,375 | $12,136 | $12,201 |
| 4/30/2020 | $11,600 | $12,144 | $12,049 | $11,785 | $12,417 |
| 5/31/2020 | $12,018 | $12,640 | $12,503 | $12,164 | $12,475 |
| 6/30/2020 | $12,540 | $13,141 | $12,861 | $12,564 | $12,554 |
| 7/31/2020 | $12,854 | $13,497 | $13,163 | $12,833 | $12,741 |
| 8/31/2020 | $12,863 | $13,533 | $13,164 | $12,838 | $12,638 |
| 9/30/2020 | $12,820 | $13,546 | $13,174 | $12,834 | $12,632 |
| 10/31/2020 | $12,809 | $13,571 | $13,175 | $12,822 | $12,575 |
| 11/30/2020 | $13,137 | $13,897 | $13,451 | $13,116 | $12,699 |
| 12/31/2020 | $13,400 | $14,157 | $13,643 | $13,338 | $12,716 |
| 1/31/2021 | $13,685 | $14,452 | $13,859 | $13,564 | $12,625 |
| 2/28/2021 | $13,481 | $14,301 | $13,687 | $13,399 | $12,443 |
| 3/31/2021 | $13,584 | $14,456 | $13,813 | $13,503 | $12,287 |
| 4/30/2021 | $13,773 | $14,667 | $13,985 | $13,682 | $12,384 |
| 5/31/2021 | $13,926 | $14,836 | $14,104 | $13,836 | $12,425 |
| 6/30/2021 | $14,082 | $15,024 | $14,234 | $13,982 | $12,512 |
| 7/31/2021 | $14,238 | $15,204 | $14,386 | $14,114 | $12,652 |
| 8/31/2021 | $14,156 | $15,181 | $14,353 | $14,064 | $12,628 |
| 9/30/2021 | $13,998 | $15,081 | $14,256 | $13,937 | $12,518 |
| 10/31/2021 | $13,916 | $15,020 | $14,204 | $13,902 | $12,515 |
| 11/30/2021 | $14,127 | $15,217 | $14,367 | $14,069 | $12,552 |
| 12/31/2021 | $14,165 | $15,257 | $14,399 | $14,103 | $12,520 |
| 1/31/2022 | $13,668 | $14,830 | $14,000 | $13,730 | $12,250 |
| 2/28/2022 | $13,499 | $14,795 | $13,961 | $13,616 | $12,114 |
| 3/31/2022 | $12,913 | $14,261 | $13,474 | $13,149 | $11,777 |
| 4/30/2022 | $12,383 | $13,754 | $13,033 | $12,680 | $11,330 |
| 5/31/2022 | $12,522 | $13,905 | $13,194 | $12,837 | $11,403 |
| 6/30/2022 | $12,036 | $13,461 | $12,844 | $12,385 | $11,224 |
| 7/31/2022 | $12,463 | $13,964 | $13,275 | $12,826 | $11,498 |
| 8/31/2022 | $12,149 | $13,653 | $12,981 | $12,527 | $11,174 |
| 9/30/2022 | $11,370 | $12,812 | $12,287 | $11,851 | $10,691 |
| 10/31/2022 | $11,112 | $12,549 | $12,087 | $11,639 | $10,552 |
| 11/30/2022 | $11,794 | $13,280 | $12,742 | $12,261 | $10,940 |
| 12/31/2022 | $11,738 | $13,258 | $12,742 | $12,211 | $10,891 |
| 1/31/2023 | $12,220 | $13,847 | $13,237 | $12,675 | $11,226 |
| 2/28/2023 | $11,872 | $13,412 | $12,862 | $12,333 | $10,936 |
| 3/31/2023 | $11,996 | $13,620 | $13,092 | $12,507 | $11,214 |
| 4/30/2023 | $12,075 | $13,699 | $13,131 | $12,548 | $11,282 |
| 5/31/2023 | $11,995 | $13,604 | $13,032 | $12,477 | $11,159 |
| 6/30/2023 | $12,200 | $13,846 | $13,228 | $12,600 | $11,119 |
| 7/31/2023 | $12,234 | $13,936 | $13,302 | $12,634 | $11,111 |
| 8/31/2023 | $12,075 | $13,724 | $13,104 | $12,456 | $11,040 |
| 9/30/2023 | $11,663 | $13,258 | $12,680 | $12,064 | $10,760 |
| 10/31/2023 | $11,380 | $13,045 | $12,511 | $11,821 | $10,590 |
| 11/30/2023 | $12,147 | $14,057 | $13,419 | $12,642 | $11,069 |
| 12/31/2023 | $12,511 | $14,479 | $13,790 | $13,023 | $11,493 |
| 1/31/2024 | $12,588 | $14,411 | $13,724 | $13,072 | $11,462 |
| 2/29/2024 | $12,666 | $14,525 | $13,800 | $13,151 | $11,300 |
| 3/31/2024 | $12,749 | $14,697 | $13,906 | $13,230 | $11,404 |
| 4/30/2024 | $12,616 | $14,607 | $13,791 | $13,073 | $11,116 |
| 5/31/2024 | $12,679 | $14,718 | $13,844 | $13,152 | $11,304 |
| 6/30/2024 | $12,932 | $15,078 | $14,139 | $13,458 | $11,412 |
| 7/31/2024 | $13,044 | $15,243 | $14,285 | $13,595 | $11,678 |
| 8/31/2024 | $13,168 | $15,423 | $14,434 | $13,706 | $11,846 |
| 9/30/2024 | $13,375 | $15,562 | $14,568 | $13,876 | $12,004 |
The Fund’s benchmarks are unmanaged indices used as a general measure of market performance. Calculations assume the reinvestment of dividends and capital gains.
Average Annual Total Returns (%)
| 1 Year | 5 Years | 10 Years |
|---|
| Class C at NAV | 14.68% | 0.69% | 2.95% |
| Class C with sales charge | 13.68% | 0.69% | 2.95% |
| Bloomberg High Yield Municipal Bond Index | 17.38% | 3.07% | 4.52% |
| Bloomberg 65% High Yield Municipal Bond Index/ 35% Bloomberg Municipal Bond Index | 14.89% | 2.51% | 3.83% |
| Lipper High Yield Municipal Debt Funds Average | 15.02% | 1.69% | 3.33% |
Bloomberg Aggregate Bond IndexFootnote Reference* | 11.57% | 0.33% | 1.84% |
| Footnote | Description |
Footnote* | The Fund has adopted the Bloomberg Aggregate Bond Index as its broad-based securities market index. |
The Fund's past performance is no guarantee of future results. The returns do not reflect the deduction of taxes that a shareholder would pay on Fund distributions or redemption of Fund shares.
(as of September 30, 2024)
| Total Net Assets | $4,098,713,523 |
| # of Portfolio Holdings | 611 |
| Portfolio Turnover Rate | 27% |
| Total Advisory Fees Paid | $16,137,454 |
What did the Fund invest in?
(as of September 30, 2024)
Credit Rating S&P or Moody'sFootnote Reference(a) | %Footnote Reference** |
|---|
| |
- A3.12%
- A-3.62%
- A+4.07%
- AA4.24%
- AA-2.36%
- AA+0.32%
- AAA1.03%
- B0.75%
- B-2.26%
- B+2.14%
- BB6.67%
- BB-5.00%
- BB+6.47%
- BBB3.00%
- BBB-8.39%
- BBB+4.73%
- CCC0.30%
- CCC-1.01%
- CCC+0.36%
- NR40.16%
- Total 100.00%
| Footnote | Description |
Footnote** | Represents percent of total investments, which excludes derivatives. |
Footnote(a) | Investments in investment grade municipal bonds, which as bonds that are rated, at the time of purchase, within the four highest grades assigned by an independent rating agency such as Moody’s, S&P, or Fitch, or an equivalent short-term rating, as applicable, or are unrated by rating agencies but deemed by Lord Abbett to be of comparable quality. Lower rated municipal bonds are rated, at the time of purchase, or an equivalent short-term rating, as applicable, by an independent rating agency or are unrated by rating agencies but deemed by Lord Abbett to be of comparable quality. |
There were no material fund changes during the period.
Where can I find additional information about the Fund?
For additional information about the Fund, including its Prospectus, Statement of Additional Information, financial statements, holdings and proxy information, please visit lordabbett.com/FundDocuments.
The Fund has adopted a policy that allows it to send only one copy of the Fund's prospectus, proxy material, annual report and semiannual report (or related notice of internet availability of annual report and semiannual report) to certain shareholders residing at the same "household." This reduces Fund expenses, which benefits you and other shareholders.If you need additional copies or do not want your mailings to be "householded," please call Lord Abbett at 888-522-2388.
Lord Abbett High Income Municipal Bond Fund
Annual Shareholder Report
September 30, 2024
lordabbett.com/FundDocuments
TSR-A-1432-C
11/24
Lord Abbett High Income Municipal Bond Fund
Annual Shareholder Report
September 30, 2024
lordabbett.com/FundDocuments
This annual shareholder report contains important information about the Lord Abbett High Income Municipal Bond Fund for the period of October 1, 2023 to September 30, 2024, as well as certain changes to the Fund. You can find additional information about the Fund at lordabbett.com/FundDocuments. You can also request this information by contacting us at 888-522-2388.
What were the Fund costs for the last year?
(based on a hypothetical $10,000 investment)
| Class Name | Costs of a $10,000 investment | Costs paid as a percentage of a $10,000 investment |
|---|
| Class F | $78 | 0.72% |
How did the Fund perform last year and what affected its performance?
For the fiscal year ended September 30, 2024, the Fund returned 15.48%, reflecting performance at the net asset value (NAV) of Class F shares, compared to the 17.38% of a securities market index with investment characteristics similar to those of the Fund, the Bloomberg High Yield Municipal Bond Index. The Fund's broad-based market index, the Bloomberg Aggregate Bond Index, returned 11.57% over the same period.
Positive factors for the municipal market included decreasing Treasury yields, easing inflationary pressures and the start of interest rate cuts by the U.S. Federal Reserve. Also supporting the market was increased demand for municipal bond funds and a strong fundamental backdrop as evidenced by growing tax revenue and positive ratings actions by public ratings agencies. Negative factors included a significant increase in municipal bond supply, which pressured the market in second half of the fiscal year, and periods of interest rate volatility driven by sticky inflation readings at points throughout the fiscal year. Against this backdrop, municipal bonds delivered strong returns.
Top contributors to the Fund’s performance: Security selection within the Education, Health Care and Tobacco sectors contributed to relative performance. An overweight allocation to the Health Care sector and underweight allocation to the Education sector contributed to relative performance.
Top detractors from the Fund’s performance: The Fund’s allocation to investment grade bonds was the primary detractor from relative performance. The Fund’s yield curve positioning led to a modest negative impact on relative performance. In particular, an overweight allocation to intermediate maturity bonds detracted as yields fell less at this part of the curve.
Total Return Based on $10,000 Investment

| Class F | Bloomberg High Yield Municipal Bond Index | Bloomberg 65% High Yield Municipal Bond Index/ 35% Bloomberg Municipal Bond Index | Lipper High Yield Municipal Debt Funds Average | Bloomberg Aggregate Bond Index |
|---|
| 9/30/2014 | $10,000 | $10,000 | $10,000 | $10,000 | $10,000 |
| 10/31/2014 | $10,064 | $9,964 | $10,000 | $10,077 | $10,098 |
| 11/30/2014 | $10,118 | $10,067 | $10,074 | $10,117 | $10,170 |
| 12/31/2014 | $10,186 | $10,121 | $10,127 | $10,206 | $10,179 |
| 1/31/2015 | $10,363 | $10,302 | $10,307 | $10,402 | $10,393 |
| 2/28/2015 | $10,306 | $10,261 | $10,243 | $10,324 | $10,295 |
| 3/31/2015 | $10,347 | $10,234 | $10,236 | $10,364 | $10,343 |
| 4/30/2015 | $10,343 | $10,192 | $10,190 | $10,330 | $10,306 |
| 5/31/2015 | $10,356 | $10,307 | $10,255 | $10,315 | $10,281 |
| 6/30/2015 | $10,231 | $9,927 | $10,006 | $10,188 | $10,169 |
| 7/31/2015 | $10,211 | $9,873 | $9,996 | $10,240 | $10,240 |
| 8/31/2015 | $10,243 | $9,914 | $10,030 | $10,261 | $10,225 |
| 9/30/2015 | $10,355 | $10,124 | $10,194 | $10,348 | $10,294 |
| 10/31/2015 | $10,468 | $10,248 | $10,288 | $10,424 | $10,296 |
| 11/30/2015 | $10,510 | $10,289 | $10,330 | $10,481 | $10,269 |
| 12/31/2015 | $10,569 | $10,304 | $10,365 | $10,577 | $10,235 |
| 1/31/2016 | $10,658 | $10,363 | $10,447 | $10,672 | $10,376 |
| 2/29/2016 | $10,727 | $10,477 | $10,527 | $10,693 | $10,450 |
| 3/31/2016 | $10,823 | $10,587 | $10,611 | $10,796 | $10,546 |
| 4/30/2016 | $10,929 | $10,652 | $10,680 | $10,900 | $10,586 |
| 5/31/2016 | $11,045 | $10,792 | $10,782 | $10,987 | $10,589 |
| 6/30/2016 | $11,290 | $11,127 | $11,059 | $11,204 | $10,779 |
| 7/31/2016 | $11,361 | $11,200 | $11,109 | $11,219 | $10,847 |
| 8/31/2016 | $11,410 | $11,240 | $11,140 | $11,265 | $10,835 |
| 9/30/2016 | $11,431 | $11,270 | $11,140 | $11,241 | $10,829 |
| 10/31/2016 | $11,311 | $11,130 | $11,009 | $11,107 | $10,746 |
| 11/30/2016 | $10,814 | $10,468 | $10,440 | $10,589 | $10,492 |
| 12/31/2016 | $10,863 | $10,613 | $10,576 | $10,659 | $10,506 |
| 1/31/2017 | $10,991 | $10,761 | $10,697 | $10,737 | $10,527 |
| 2/28/2017 | $11,127 | $11,018 | $10,889 | $10,856 | $10,598 |
| 3/31/2017 | $11,158 | $11,043 | $10,913 | $10,913 | $10,592 |
| 4/30/2017 | $11,247 | $11,118 | $10,989 | $11,101 | $10,674 |
| 5/31/2017 | $11,356 | $11,288 | $11,159 | $11,271 | $10,756 |
| 6/30/2017 | $11,377 | $11,263 | $11,129 | $11,263 | $10,745 |
| 7/31/2017 | $11,485 | $11,337 | $11,208 | $11,336 | $10,792 |
| 8/31/2017 | $11,655 | $11,493 | $11,339 | $11,457 | $10,888 |
| 9/30/2017 | $11,604 | $11,432 | $11,279 | $11,445 | $10,836 |
| 10/31/2017 | $11,536 | $11,463 | $11,309 | $11,445 | $10,843 |
| 11/30/2017 | $11,546 | $11,492 | $11,306 | $11,462 | $10,829 |
| 12/31/2017 | $11,675 | $11,641 | $11,443 | $11,587 | $10,879 |
| 1/31/2018 | $11,655 | $11,532 | $11,326 | $11,513 | $10,753 |
| 2/28/2018 | $11,645 | $11,540 | $11,319 | $11,480 | $10,651 |
| 3/31/2018 | $11,765 | $11,709 | $11,442 | $11,557 | $10,720 |
| 4/30/2018 | $11,825 | $11,762 | $11,461 | $11,562 | $10,640 |
| 5/31/2018 | $11,985 | $12,008 | $11,663 | $11,710 | $10,716 |
| 6/30/2018 | $12,096 | $12,068 | $11,704 | $11,746 | $10,703 |
| 7/31/2018 | $12,136 | $12,110 | $11,740 | $11,786 | $10,705 |
| 8/31/2018 | $12,237 | $12,207 | $11,812 | $11,832 | $10,774 |
| 9/30/2018 | $12,166 | $12,159 | $11,755 | $11,772 | $10,705 |
| 10/31/2018 | $12,003 | $12,007 | $11,634 | $11,646 | $10,620 |
| 11/30/2018 | $12,035 | $12,091 | $11,732 | $11,694 | $10,683 |
| 12/31/2018 | $12,129 | $12,195 | $11,847 | $11,794 | $10,880 |
| 1/31/2019 | $12,182 | $12,277 | $11,930 | $11,859 | $10,995 |
| 2/28/2019 | $12,335 | $12,343 | $11,994 | $11,954 | $10,989 |
| 3/31/2019 | $12,638 | $12,662 | $12,262 | $12,189 | $11,200 |
| 4/30/2019 | $12,734 | $12,733 | $12,323 | $12,257 | $11,203 |
| 5/31/2019 | $12,954 | $12,940 | $12,512 | $12,444 | $11,402 |
| 6/30/2019 | $13,040 | $13,007 | $12,571 | $12,501 | $11,545 |
| 7/31/2019 | $13,135 | $13,089 | $12,658 | $12,583 | $11,570 |
| 8/31/2019 | $13,451 | $13,404 | $12,926 | $12,818 | $11,870 |
| 9/30/2019 | $13,398 | $13,377 | $12,872 | $12,760 | $11,807 |
| 10/31/2019 | $13,396 | $13,405 | $12,898 | $12,768 | $11,842 |
| 11/30/2019 | $13,449 | $13,457 | $12,942 | $12,819 | $11,836 |
| 12/31/2019 | $13,533 | $13,497 | $12,981 | $12,862 | $11,828 |
| 1/31/2020 | $13,832 | $13,830 | $13,270 | $13,112 | $12,056 |
| 2/29/2020 | $14,185 | $14,121 | $13,512 | $13,348 | $12,273 |
| 3/31/2020 | $12,532 | $12,568 | $12,375 | $12,136 | $12,201 |
| 4/30/2020 | $12,076 | $12,144 | $12,049 | $11,785 | $12,417 |
| 5/31/2020 | $12,529 | $12,640 | $12,503 | $12,164 | $12,475 |
| 6/30/2020 | $13,081 | $13,141 | $12,861 | $12,564 | $12,554 |
| 7/31/2020 | $13,406 | $13,497 | $13,163 | $12,833 | $12,741 |
| 8/31/2020 | $13,434 | $13,533 | $13,164 | $12,838 | $12,638 |
| 9/30/2020 | $13,398 | $13,546 | $13,174 | $12,834 | $12,632 |
| 10/31/2020 | $13,383 | $13,571 | $13,175 | $12,822 | $12,575 |
| 11/30/2020 | $13,745 | $13,897 | $13,451 | $13,116 | $12,699 |
| 12/31/2020 | $14,019 | $14,157 | $13,643 | $13,338 | $12,716 |
| 1/31/2021 | $14,336 | $14,452 | $13,859 | $13,564 | $12,625 |
| 2/28/2021 | $14,120 | $14,301 | $13,687 | $13,399 | $12,443 |
| 3/31/2021 | $14,237 | $14,456 | $13,813 | $13,503 | $12,287 |
| 4/30/2021 | $14,444 | $14,667 | $13,985 | $13,682 | $12,384 |
| 5/31/2021 | $14,624 | $14,836 | $14,104 | $13,836 | $12,425 |
| 6/30/2021 | $14,798 | $15,024 | $14,234 | $13,982 | $12,512 |
| 7/31/2021 | $14,959 | $15,204 | $14,386 | $14,114 | $12,652 |
| 8/31/2021 | $14,893 | $15,181 | $14,353 | $14,064 | $12,628 |
| 9/30/2021 | $14,725 | $15,081 | $14,256 | $13,937 | $12,518 |
| 10/31/2021 | $14,659 | $15,020 | $14,204 | $13,902 | $12,515 |
| 11/30/2021 | $14,890 | $15,217 | $14,367 | $14,069 | $12,552 |
| 12/31/2021 | $14,928 | $15,257 | $14,399 | $14,103 | $12,520 |
| 1/31/2022 | $14,413 | $14,830 | $14,000 | $13,730 | $12,250 |
| 2/28/2022 | $14,255 | $14,795 | $13,961 | $13,616 | $12,114 |
| 3/31/2022 | $13,646 | $14,261 | $13,474 | $13,149 | $11,777 |
| 4/30/2022 | $13,095 | $13,754 | $13,033 | $12,680 | $11,330 |
| 5/31/2022 | $13,250 | $13,905 | $13,194 | $12,837 | $11,403 |
| 6/30/2022 | $12,732 | $13,461 | $12,844 | $12,385 | $11,224 |
| 7/31/2022 | $13,203 | $13,964 | $13,275 | $12,826 | $11,498 |
| 8/31/2022 | $12,879 | $13,653 | $12,981 | $12,527 | $11,174 |
| 9/30/2022 | $12,061 | $12,812 | $12,287 | $11,851 | $10,691 |
| 10/31/2022 | $11,784 | $12,549 | $12,087 | $11,639 | $10,552 |
| 11/30/2022 | $12,515 | $13,280 | $12,742 | $12,261 | $10,940 |
| 12/31/2022 | $12,475 | $13,258 | $12,742 | $12,211 | $10,891 |
| 1/31/2023 | $12,982 | $13,847 | $13,237 | $12,675 | $11,226 |
| 2/28/2023 | $12,632 | $13,412 | $12,862 | $12,333 | $10,936 |
| 3/31/2023 | $12,760 | $13,620 | $13,092 | $12,507 | $11,214 |
| 4/30/2023 | $12,852 | $13,699 | $13,131 | $12,548 | $11,282 |
| 5/31/2023 | $12,775 | $13,604 | $13,032 | $12,477 | $11,159 |
| 6/30/2023 | $13,000 | $13,846 | $13,228 | $12,600 | $11,119 |
| 7/31/2023 | $13,045 | $13,936 | $13,302 | $12,634 | $11,111 |
| 8/31/2023 | $12,883 | $13,724 | $13,104 | $12,456 | $11,040 |
| 9/30/2023 | $12,463 | $13,258 | $12,680 | $12,064 | $10,760 |
| 10/31/2023 | $12,168 | $13,045 | $12,511 | $11,821 | $10,590 |
| 11/30/2023 | $12,982 | $14,057 | $13,419 | $12,642 | $11,069 |
| 12/31/2023 | $13,392 | $14,479 | $13,790 | $13,023 | $11,493 |
| 1/31/2024 | $13,470 | $14,411 | $13,724 | $13,072 | $11,462 |
| 2/29/2024 | $13,574 | $14,525 | $13,800 | $13,151 | $11,300 |
| 3/31/2024 | $13,671 | $14,697 | $13,906 | $13,230 | $11,404 |
| 4/30/2024 | $13,524 | $14,607 | $13,791 | $13,073 | $11,116 |
| 5/31/2024 | $13,612 | $14,718 | $13,844 | $13,152 | $11,304 |
| 6/30/2024 | $13,878 | $15,078 | $14,139 | $13,458 | $11,412 |
| 7/31/2024 | $14,020 | $15,243 | $14,285 | $13,595 | $11,678 |
| 8/31/2024 | $14,161 | $15,423 | $14,434 | $13,706 | $11,846 |
| 9/30/2024 | $14,393 | $15,562 | $14,568 | $13,876 | $12,004 |
The Fund’s benchmarks are unmanaged indices used as a general measure of market performance. Calculations assume the reinvestment of dividends and capital gains.
Average Annual Total Returns (%)
| 1 Year | 5 Years | 10 Years |
|---|
| Class F at NAV | 15.48% | 1.44% | 3.71% |
| Bloomberg High Yield Municipal Bond Index | 17.38% | 3.07% | 4.52% |
| Bloomberg 65% High Yield Municipal Bond Index/ 35% Bloomberg Municipal Bond Index | 14.89% | 2.51% | 3.83% |
| Lipper High Yield Municipal Debt Funds Average | 15.02% | 1.69% | 3.33% |
Bloomberg Aggregate Bond IndexFootnote Reference* | 11.57% | 0.33% | 1.84% |
| Footnote | Description |
Footnote* | The Fund has adopted the Bloomberg Aggregate Bond Index as its broad-based securities market index. |
The Fund's past performance is no guarantee of future results. The returns do not reflect the deduction of taxes that a shareholder would pay on Fund distributions or redemption of Fund shares.
(as of September 30, 2024)
| Total Net Assets | $4,098,713,523 |
| # of Portfolio Holdings | 611 |
| Portfolio Turnover Rate | 27% |
| Total Advisory Fees Paid | $16,137,454 |
What did the Fund invest in?
(as of September 30, 2024)
Credit Rating S&P or Moody'sFootnote Reference(a) | %Footnote Reference** |
|---|
| |
- A3.12%
- A-3.62%
- A+4.07%
- AA4.24%
- AA-2.36%
- AA+0.32%
- AAA1.03%
- B0.75%
- B-2.26%
- B+2.14%
- BB6.67%
- BB-5.00%
- BB+6.47%
- BBB3.00%
- BBB-8.39%
- BBB+4.73%
- CCC0.30%
- CCC-1.01%
- CCC+0.36%
- NR40.16%
- Total 100.00%
| Footnote | Description |
Footnote** | Represents percent of total investments, which excludes derivatives. |
Footnote(a) | Investments in investment grade municipal bonds, which as bonds that are rated, at the time of purchase, within the four highest grades assigned by an independent rating agency such as Moody’s, S&P, or Fitch, or an equivalent short-term rating, as applicable, or are unrated by rating agencies but deemed by Lord Abbett to be of comparable quality. Lower rated municipal bonds are rated, at the time of purchase, or an equivalent short-term rating, as applicable, by an independent rating agency or are unrated by rating agencies but deemed by Lord Abbett to be of comparable quality. |
There were no material fund changes during the period.
Where can I find additional information about the Fund?
For additional information about the Fund, including its Prospectus, Statement of Additional Information, financial statements, holdings and proxy information, please visit lordabbett.com/FundDocuments.
The Fund has adopted a policy that allows it to send only one copy of the Fund's prospectus, proxy material, annual report and semiannual report (or related notice of internet availability of annual report and semiannual report) to certain shareholders residing at the same "household." This reduces Fund expenses, which benefits you and other shareholders.If you need additional copies or do not want your mailings to be "householded," please call Lord Abbett at 888-522-2388.
Lord Abbett High Income Municipal Bond Fund
Annual Shareholder Report
September 30, 2024
lordabbett.com/FundDocuments
TSR-A-1038-F
11/24
Lord Abbett High Income Municipal Bond Fund
Annual Shareholder Report
September 30, 2024
lordabbett.com/FundDocuments
This annual shareholder report contains important information about the Lord Abbett High Income Municipal Bond Fund for the period of October 1, 2023 to September 30, 2024, as well as certain changes to the Fund. You can find additional information about the Fund at lordabbett.com/FundDocuments. You can also request this information by contacting us at 888-522-2388.
What were the Fund costs for the last year?
(based on a hypothetical $10,000 investment)
| Class Name | Costs of a $10,000 investment | Costs paid as a percentage of a $10,000 investment |
|---|
| Class F3 | $60 | 0.56% |
How did the Fund perform last year and what affected its performance?
For the fiscal year ended September 30, 2024, the Fund returned 15.69%, reflecting performance at the net asset value (NAV) of Class F3 shares, compared to the 17.38% of a securities market index with investment characteristics similar to those of the Fund, the Bloomberg High Yield Municipal Bond Index. The Fund's broad-based market index, the Bloomberg Aggregate Bond Index, returned 11.57% over the same period.
Positive factors for the municipal market included decreasing Treasury yields, easing inflationary pressures and the start of interest rate cuts by the U.S. Federal Reserve. Also supporting the market was increased demand for municipal bond funds and a strong fundamental backdrop as evidenced by growing tax revenue and positive ratings actions by public ratings agencies. Negative factors included a significant increase in municipal bond supply, which pressured the market in second half of the fiscal year, and periods of interest rate volatility driven by sticky inflation readings at points throughout the fiscal year. Against this backdrop, municipal bonds delivered strong returns.
Top contributors to the Fund’s performance: Security selection within the Education, Health Care and Tobacco sectors contributed to relative performance. An overweight allocation to the Health Care sector and underweight allocation to the Education sector contributed to relative performance.
Top detractors from the Fund’s performance: The Fund’s allocation to investment grade bonds was the primary detractor from relative performance. The Fund’s yield curve positioning led to a modest negative impact on relative performance. In particular, an overweight allocation to intermediate maturity bonds detracted as yields fell less at this part of the curve.
Total Return Based on $10,000 Investment
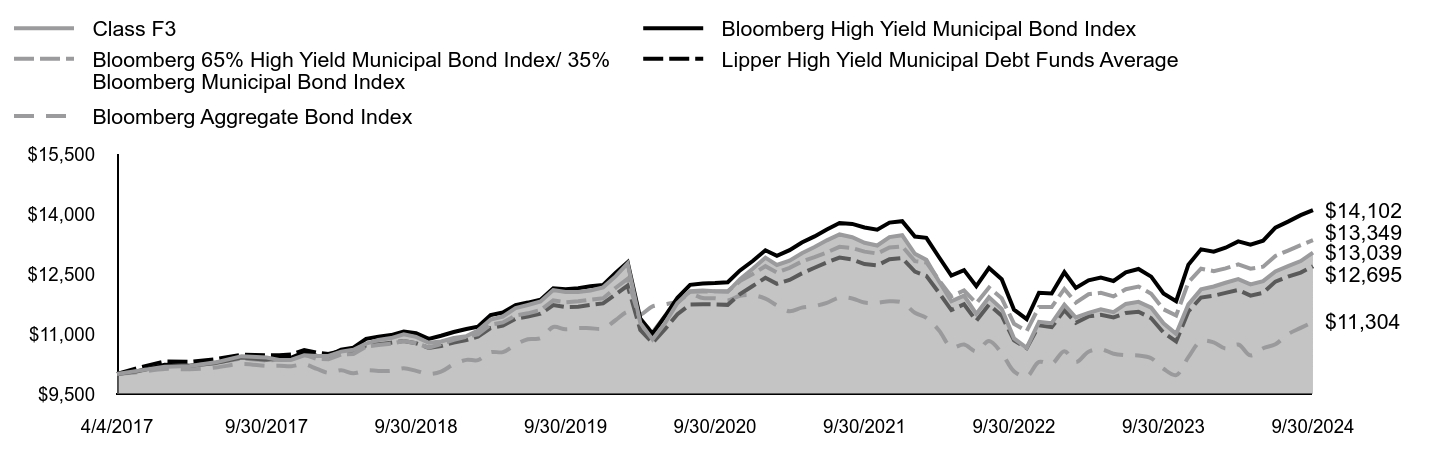
| Class F3 | Bloomberg High Yield Municipal Bond Index | Bloomberg 65% High Yield Municipal Bond Index/ 35% Bloomberg Municipal Bond Index | Lipper High Yield Municipal Debt Funds Average | Bloomberg Aggregate Bond Index |
|---|
| 4/4/2017 | $10,000 | $10,000 | $10,000 | $10,000 | $10,000 |
| 4/30/2017 | $10,085 | $10,075 | $10,070 | $10,156 | $10,051 |
| 5/31/2017 | $10,183 | $10,229 | $10,226 | $10,312 | $10,128 |
| 6/30/2017 | $10,203 | $10,207 | $10,198 | $10,305 | $10,118 |
| 7/31/2017 | $10,292 | $10,274 | $10,271 | $10,371 | $10,162 |
| 8/31/2017 | $10,447 | $10,415 | $10,390 | $10,482 | $10,253 |
| 9/30/2017 | $10,411 | $10,360 | $10,335 | $10,471 | $10,204 |
| 10/31/2017 | $10,350 | $10,388 | $10,363 | $10,471 | $10,210 |
| 11/30/2017 | $10,360 | $10,414 | $10,360 | $10,487 | $10,197 |
| 12/31/2017 | $10,468 | $10,549 | $10,486 | $10,601 | $10,244 |
| 1/31/2018 | $10,451 | $10,451 | $10,379 | $10,533 | $10,126 |
| 2/28/2018 | $10,452 | $10,458 | $10,372 | $10,503 | $10,030 |
| 3/31/2018 | $10,561 | $10,611 | $10,485 | $10,574 | $10,094 |
| 4/30/2018 | $10,607 | $10,659 | $10,502 | $10,578 | $10,019 |
| 5/31/2018 | $10,761 | $10,882 | $10,687 | $10,714 | $10,091 |
| 6/30/2018 | $10,854 | $10,936 | $10,725 | $10,747 | $10,078 |
| 7/31/2018 | $10,900 | $10,974 | $10,758 | $10,783 | $10,080 |
| 8/31/2018 | $10,992 | $11,062 | $10,824 | $10,825 | $10,145 |
| 9/30/2018 | $10,929 | $11,019 | $10,772 | $10,770 | $10,080 |
| 10/31/2018 | $10,784 | $10,881 | $10,661 | $10,655 | $10,000 |
| 11/30/2018 | $10,813 | $10,957 | $10,751 | $10,699 | $10,060 |
| 12/31/2018 | $10,900 | $11,051 | $10,856 | $10,790 | $10,245 |
| 1/31/2019 | $10,948 | $11,125 | $10,932 | $10,850 | $10,354 |
| 2/28/2019 | $11,087 | $11,185 | $10,991 | $10,937 | $10,348 |
| 3/31/2019 | $11,361 | $11,474 | $11,236 | $11,152 | $10,546 |
| 4/30/2019 | $11,439 | $11,539 | $11,292 | $11,214 | $10,549 |
| 5/31/2019 | $11,649 | $11,726 | $11,466 | $11,385 | $10,736 |
| 6/30/2019 | $11,727 | $11,788 | $11,519 | $11,437 | $10,871 |
| 7/31/2019 | $11,814 | $11,862 | $11,599 | $11,512 | $10,895 |
| 8/31/2019 | $12,100 | $12,147 | $11,844 | $11,727 | $11,177 |
| 9/30/2019 | $12,053 | $12,122 | $11,796 | $11,674 | $11,118 |
| 10/31/2019 | $12,053 | $12,148 | $11,819 | $11,682 | $11,151 |
| 11/30/2019 | $12,092 | $12,195 | $11,859 | $11,728 | $11,146 |
| 12/31/2019 | $12,169 | $12,231 | $11,895 | $11,768 | $11,138 |
| 1/31/2020 | $12,449 | $12,533 | $12,160 | $11,996 | $11,352 |
| 2/29/2020 | $12,769 | $12,797 | $12,382 | $12,212 | $11,557 |
| 3/31/2020 | $11,279 | $11,390 | $11,339 | $11,103 | $11,489 |
| 4/30/2020 | $10,868 | $11,005 | $11,041 | $10,782 | $11,693 |
| 5/31/2020 | $11,279 | $11,454 | $11,457 | $11,129 | $11,747 |
| 6/30/2020 | $11,779 | $11,908 | $11,785 | $11,495 | $11,821 |
| 7/31/2020 | $12,073 | $12,231 | $12,062 | $11,741 | $11,998 |
| 8/31/2020 | $12,091 | $12,264 | $12,063 | $11,746 | $11,901 |
| 9/30/2020 | $12,069 | $12,276 | $12,072 | $11,742 | $11,894 |
| 10/31/2020 | $12,057 | $12,298 | $12,073 | $11,731 | $11,841 |
| 11/30/2020 | $12,375 | $12,593 | $12,325 | $12,000 | $11,958 |
| 12/31/2020 | $12,634 | $12,829 | $12,502 | $12,203 | $11,974 |
| 1/31/2021 | $12,912 | $13,097 | $12,699 | $12,410 | $11,888 |
| 2/28/2021 | $12,728 | $12,960 | $12,542 | $12,259 | $11,716 |
| 3/31/2021 | $12,835 | $13,100 | $12,657 | $12,354 | $11,570 |
| 4/30/2021 | $13,023 | $13,292 | $12,815 | $12,518 | $11,662 |
| 5/31/2021 | $13,177 | $13,444 | $12,924 | $12,659 | $11,700 |
| 6/30/2021 | $13,346 | $13,615 | $13,043 | $12,792 | $11,782 |
| 7/31/2021 | $13,493 | $13,778 | $13,183 | $12,913 | $11,914 |
| 8/31/2021 | $13,425 | $13,757 | $13,152 | $12,867 | $11,891 |
| 9/30/2021 | $13,285 | $13,667 | $13,063 | $12,751 | $11,788 |
| 10/31/2021 | $13,216 | $13,611 | $13,015 | $12,719 | $11,785 |
| 11/30/2021 | $13,427 | $13,790 | $13,165 | $12,872 | $11,820 |
| 12/31/2021 | $13,473 | $13,826 | $13,195 | $12,903 | $11,789 |
| 1/31/2022 | $13,009 | $13,439 | $12,828 | $12,562 | $11,535 |
| 2/28/2022 | $12,857 | $13,408 | $12,793 | $12,457 | $11,407 |
| 3/31/2022 | $12,318 | $12,923 | $12,347 | $12,030 | $11,090 |
| 4/30/2022 | $11,820 | $12,464 | $11,943 | $11,601 | $10,669 |
| 5/31/2022 | $11,962 | $12,601 | $12,090 | $11,745 | $10,738 |
| 6/30/2022 | $11,505 | $12,199 | $11,770 | $11,331 | $10,569 |
| 7/31/2022 | $11,923 | $12,654 | $12,164 | $11,735 | $10,828 |
| 8/31/2022 | $11,631 | $12,372 | $11,895 | $11,461 | $10,522 |
| 9/30/2022 | $10,892 | $11,610 | $11,259 | $10,843 | $10,067 |
| 10/31/2022 | $10,653 | $11,372 | $11,076 | $10,649 | $9,937 |
| 11/30/2022 | $11,305 | $12,034 | $11,676 | $11,218 | $10,302 |
| 12/31/2022 | $11,271 | $12,014 | $11,676 | $11,172 | $10,256 |
| 1/31/2023 | $11,732 | $12,548 | $12,130 | $11,597 | $10,571 |
| 2/28/2023 | $11,415 | $12,154 | $11,786 | $11,284 | $10,298 |
| 3/31/2023 | $11,532 | $12,343 | $11,997 | $11,443 | $10,559 |
| 4/30/2023 | $11,617 | $12,414 | $12,032 | $11,480 | $10,623 |
| 5/31/2023 | $11,548 | $12,328 | $11,942 | $11,415 | $10,508 |
| 6/30/2023 | $11,754 | $12,547 | $12,122 | $11,528 | $10,470 |
| 7/31/2023 | $11,807 | $12,629 | $12,190 | $11,559 | $10,463 |
| 8/31/2023 | $11,661 | $12,437 | $12,008 | $11,396 | $10,396 |
| 9/30/2023 | $11,271 | $12,014 | $11,620 | $11,038 | $10,132 |
| 10/31/2023 | $11,005 | $11,822 | $11,464 | $10,815 | $9,972 |
| 11/30/2023 | $11,744 | $12,738 | $12,296 | $11,566 | $10,424 |
| 12/31/2023 | $12,118 | $13,121 | $12,636 | $11,915 | $10,823 |
| 1/31/2024 | $12,190 | $13,060 | $12,576 | $11,960 | $10,793 |
| 2/29/2024 | $12,285 | $13,162 | $12,645 | $12,032 | $10,640 |
| 3/31/2024 | $12,376 | $13,319 | $12,743 | $12,104 | $10,739 |
| 4/30/2024 | $12,243 | $13,237 | $12,637 | $11,961 | $10,467 |
| 5/31/2024 | $12,324 | $13,337 | $12,686 | $12,033 | $10,645 |
| 6/30/2024 | $12,568 | $13,664 | $12,956 | $12,313 | $10,746 |
| 7/31/2024 | $12,698 | $13,814 | $13,090 | $12,438 | $10,997 |
| 8/31/2024 | $12,828 | $13,976 | $13,226 | $12,540 | $11,155 |
| 9/30/2024 | $13,039 | $14,102 | $13,349 | $12,695 | $11,304 |
The Fund’s benchmarks are unmanaged indices used as a general measure of market performance. Calculations assume the reinvestment of dividends and capital gains.
Average Annual Total Returns (%)
| 1 Year | 5 Years | Since Inception 4/4/17 |
|---|
| Class F3 at NAV | 15.69% | 1.59% | 3.61% |
| Bloomberg High Yield Municipal Bond Index | 17.38% | 3.07% | 4.70% |
| Bloomberg 65% High Yield Municipal Bond Index/ 35% Bloomberg Municipal Bond Index | 14.89% | 2.51% | 3.93% |
| Lipper High Yield Municipal Debt Funds Average | 15.02% | 1.69% | 3.24% |
Bloomberg Aggregate Bond IndexFootnote Reference* | 11.57% | 0.33% | 1.65% |
| Footnote | Description |
Footnote* | The Fund has adopted the Bloomberg Aggregate Bond Index as its broad-based securities market index. |
The Fund's past performance is no guarantee of future results. The returns do not reflect the deduction of taxes that a shareholder would pay on Fund distributions or redemption of Fund shares.
(as of September 30, 2024)
| Total Net Assets | $4,098,713,523 |
| # of Portfolio Holdings | 611 |
| Portfolio Turnover Rate | 27% |
| Total Advisory Fees Paid | $16,137,454 |
What did the Fund invest in?
(as of September 30, 2024)
Credit Rating S&P or Moody'sFootnote Reference(a) | %Footnote Reference** |
|---|
| |
- A3.12%
- A-3.62%
- A+4.07%
- AA4.24%
- AA-2.36%
- AA+0.32%
- AAA1.03%
- B0.75%
- B-2.26%
- B+2.14%
- BB6.67%
- BB-5.00%
- BB+6.47%
- BBB3.00%
- BBB-8.39%
- BBB+4.73%
- CCC0.30%
- CCC-1.01%
- CCC+0.36%
- NR40.16%
- Total 100.00%
| Footnote | Description |
Footnote** | Represents percent of total investments, which excludes derivatives. |
Footnote(a) | Investments in investment grade municipal bonds, which as bonds that are rated, at the time of purchase, within the four highest grades assigned by an independent rating agency such as Moody’s, S&P, or Fitch, or an equivalent short-term rating, as applicable, or are unrated by rating agencies but deemed by Lord Abbett to be of comparable quality. Lower rated municipal bonds are rated, at the time of purchase, or an equivalent short-term rating, as applicable, by an independent rating agency or are unrated by rating agencies but deemed by Lord Abbett to be of comparable quality. |
There were no material fund changes during the period.
Where can I find additional information about the Fund?
For additional information about the Fund, including its Prospectus, Statement of Additional Information, financial statements, holdings and proxy information, please visit lordabbett.com/FundDocuments.
The Fund has adopted a policy that allows it to send only one copy of the Fund's prospectus, proxy material, annual report and semiannual report (or related notice of internet availability of annual report and semiannual report) to certain shareholders residing at the same "household." This reduces Fund expenses, which benefits you and other shareholders.If you need additional copies or do not want your mailings to be "householded," please call Lord Abbett at 888-522-2388.
Lord Abbett High Income Municipal Bond Fund
Annual Shareholder Report
September 30, 2024
lordabbett.com/FundDocuments
TSR-A-8986-F3
11/24
Lord Abbett High Income Municipal Bond Fund
Annual Shareholder Report
September 30, 2024
lordabbett.com/FundDocuments
This annual shareholder report contains important information about the Lord Abbett High Income Municipal Bond Fund for the period of October 1, 2023 to September 30, 2024, as well as certain changes to the Fund. You can find additional information about the Fund at lordabbett.com/FundDocuments. You can also request this information by contacting us at 888-522-2388.
What were the Fund costs for the last year?
(based on a hypothetical $10,000 investment)
| Class Name | Costs of a $10,000 investment | Costs paid as a percentage of a $10,000 investment |
|---|
| Class I | $67 | 0.62% |
How did the Fund perform last year and what affected its performance?
For the fiscal year ended September 30, 2024, the Fund returned 15.63%, reflecting performance at the net asset value (NAV) of Class I shares, compared to the 17.38% of a securities market index with investment characteristics similar to those of the Fund, the Bloomberg High Yield Municipal Bond Index. The Fund's broad-based market index, the Bloomberg Aggregate Bond Index, returned 11.57% over the same period.
Positive factors for the municipal market included decreasing Treasury yields, easing inflationary pressures and the start of interest rate cuts by the U.S. Federal Reserve. Also supporting the market was increased demand for municipal bond funds and a strong fundamental backdrop as evidenced by growing tax revenue and positive ratings actions by public ratings agencies. Negative factors included a significant increase in municipal bond supply, which pressured the market in second half of the fiscal year, and periods of interest rate volatility driven by sticky inflation readings at points throughout the fiscal year. Against this backdrop, municipal bonds delivered strong returns.
Top contributors to the Fund’s performance: Security selection within the Education, Health Care and Tobacco sectors contributed to relative performance. An overweight allocation to the Health Care sector and underweight allocation to the Education sector contributed to relative performance.
Top detractors from the Fund’s performance: The Fund’s allocation to investment grade bonds was the primary detractor from relative performance. The Fund’s yield curve positioning led to a modest negative impact on relative performance. In particular, an overweight allocation to intermediate maturity bonds detracted as yields fell less at this part of the curve.
Total Return Based on $10,000 Investment
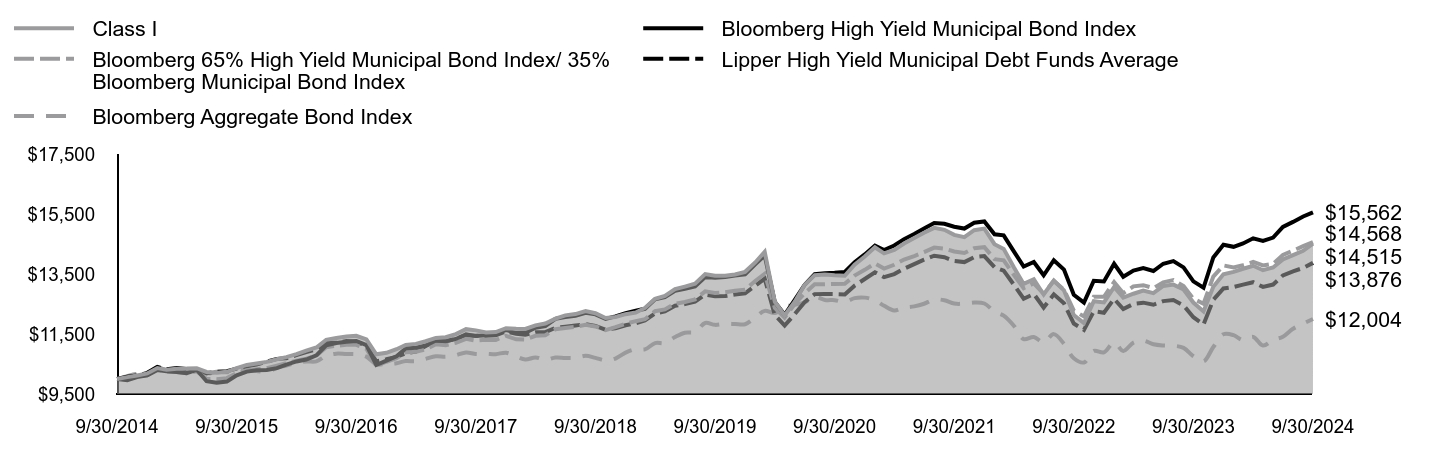
| Class I | Bloomberg High Yield Municipal Bond Index | Bloomberg 65% High Yield Municipal Bond Index/ 35% Bloomberg Municipal Bond Index | Lipper High Yield Municipal Debt Funds Average | Bloomberg Aggregate Bond Index |
|---|
| 9/30/2014 | $10,000 | $10,000 | $10,000 | $10,000 | $10,000 |
| 10/31/2014 | $10,064 | $9,964 | $10,000 | $10,077 | $10,098 |
| 11/30/2014 | $10,119 | $10,067 | $10,074 | $10,117 | $10,170 |
| 12/31/2014 | $10,187 | $10,121 | $10,127 | $10,206 | $10,179 |
| 1/31/2015 | $10,366 | $10,302 | $10,307 | $10,402 | $10,393 |
| 2/28/2015 | $10,310 | $10,261 | $10,243 | $10,324 | $10,295 |
| 3/31/2015 | $10,343 | $10,234 | $10,236 | $10,364 | $10,343 |
| 4/30/2015 | $10,348 | $10,192 | $10,190 | $10,330 | $10,306 |
| 5/31/2015 | $10,362 | $10,307 | $10,255 | $10,315 | $10,281 |
| 6/30/2015 | $10,237 | $9,927 | $10,006 | $10,188 | $10,169 |
| 7/31/2015 | $10,209 | $9,873 | $9,996 | $10,240 | $10,240 |
| 8/31/2015 | $10,242 | $9,914 | $10,030 | $10,261 | $10,225 |
| 9/30/2015 | $10,364 | $10,124 | $10,194 | $10,348 | $10,294 |
| 10/31/2015 | $10,469 | $10,248 | $10,288 | $10,424 | $10,296 |
| 11/30/2015 | $10,520 | $10,289 | $10,330 | $10,481 | $10,269 |
| 12/31/2015 | $10,572 | $10,304 | $10,365 | $10,577 | $10,235 |
| 1/31/2016 | $10,661 | $10,363 | $10,447 | $10,672 | $10,376 |
| 2/29/2016 | $10,731 | $10,477 | $10,527 | $10,693 | $10,450 |
| 3/31/2016 | $10,828 | $10,587 | $10,611 | $10,796 | $10,546 |
| 4/30/2016 | $10,945 | $10,652 | $10,680 | $10,900 | $10,586 |
| 5/31/2016 | $11,052 | $10,792 | $10,782 | $10,987 | $10,589 |
| 6/30/2016 | $11,309 | $11,127 | $11,059 | $11,204 | $10,779 |
| 7/31/2016 | $11,371 | $11,200 | $11,109 | $11,219 | $10,847 |
| 8/31/2016 | $11,421 | $11,240 | $11,140 | $11,265 | $10,835 |
| 9/30/2016 | $11,442 | $11,270 | $11,140 | $11,241 | $10,829 |
| 10/31/2016 | $11,322 | $11,130 | $11,009 | $11,107 | $10,746 |
| 11/30/2016 | $10,824 | $10,468 | $10,440 | $10,589 | $10,492 |
| 12/31/2016 | $10,874 | $10,613 | $10,576 | $10,659 | $10,506 |
| 1/31/2017 | $10,994 | $10,761 | $10,697 | $10,737 | $10,527 |
| 2/28/2017 | $11,140 | $11,018 | $10,889 | $10,856 | $10,598 |
| 3/31/2017 | $11,172 | $11,043 | $10,913 | $10,913 | $10,592 |
| 4/30/2017 | $11,261 | $11,118 | $10,989 | $11,101 | $10,674 |
| 5/31/2017 | $11,371 | $11,288 | $11,159 | $11,271 | $10,756 |
| 6/30/2017 | $11,393 | $11,263 | $11,129 | $11,263 | $10,745 |
| 7/31/2017 | $11,501 | $11,337 | $11,208 | $11,336 | $10,792 |
| 8/31/2017 | $11,664 | $11,493 | $11,339 | $11,457 | $10,888 |
| 9/30/2017 | $11,623 | $11,432 | $11,279 | $11,445 | $10,836 |
| 10/31/2017 | $11,555 | $11,463 | $11,309 | $11,445 | $10,843 |
| 11/30/2017 | $11,566 | $11,492 | $11,306 | $11,462 | $10,829 |
| 12/31/2017 | $11,697 | $11,641 | $11,443 | $11,587 | $10,879 |
| 1/31/2018 | $11,677 | $11,532 | $11,326 | $11,513 | $10,753 |
| 2/28/2018 | $11,669 | $11,540 | $11,319 | $11,480 | $10,651 |
| 3/31/2018 | $11,790 | $11,709 | $11,442 | $11,557 | $10,720 |
| 4/30/2018 | $11,851 | $11,762 | $11,461 | $11,562 | $10,640 |
| 5/31/2018 | $12,012 | $12,008 | $11,663 | $11,710 | $10,716 |
| 6/30/2018 | $12,125 | $12,068 | $11,704 | $11,746 | $10,703 |
| 7/31/2018 | $12,166 | $12,110 | $11,740 | $11,786 | $10,705 |
| 8/31/2018 | $12,268 | $12,207 | $11,812 | $11,832 | $10,774 |
| 9/30/2018 | $12,197 | $12,159 | $11,755 | $11,772 | $10,705 |
| 10/31/2018 | $12,035 | $12,007 | $11,634 | $11,646 | $10,620 |
| 11/30/2018 | $12,068 | $12,091 | $11,732 | $11,694 | $10,683 |
| 12/31/2018 | $12,164 | $12,195 | $11,847 | $11,794 | $10,880 |
| 1/31/2019 | $12,218 | $12,277 | $11,930 | $11,859 | $10,995 |
| 2/28/2019 | $12,372 | $12,343 | $11,994 | $11,954 | $10,989 |
| 3/31/2019 | $12,678 | $12,662 | $12,262 | $12,189 | $11,200 |
| 4/30/2019 | $12,775 | $12,733 | $12,323 | $12,257 | $11,203 |
| 5/31/2019 | $12,998 | $12,940 | $12,512 | $12,444 | $11,402 |
| 6/30/2019 | $13,085 | $13,007 | $12,571 | $12,501 | $11,545 |
| 7/31/2019 | $13,182 | $13,089 | $12,658 | $12,583 | $11,570 |
| 8/31/2019 | $13,501 | $13,404 | $12,926 | $12,818 | $11,870 |
| 9/30/2019 | $13,448 | $13,377 | $12,872 | $12,760 | $11,807 |
| 10/31/2019 | $13,447 | $13,405 | $12,898 | $12,768 | $11,842 |
| 11/30/2019 | $13,490 | $13,457 | $12,942 | $12,819 | $11,836 |
| 12/31/2019 | $13,577 | $13,497 | $12,981 | $12,862 | $11,828 |
| 1/31/2020 | $13,889 | $13,830 | $13,270 | $13,112 | $12,056 |
| 2/29/2020 | $14,245 | $14,121 | $13,512 | $13,348 | $12,273 |
| 3/31/2020 | $12,582 | $12,568 | $12,375 | $12,136 | $12,201 |
| 4/30/2020 | $12,123 | $12,144 | $12,049 | $11,785 | $12,417 |
| 5/31/2020 | $12,581 | $12,640 | $12,503 | $12,164 | $12,475 |
| 6/30/2020 | $13,138 | $13,141 | $12,861 | $12,564 | $12,554 |
| 7/31/2020 | $13,466 | $13,497 | $13,163 | $12,833 | $12,741 |
| 8/31/2020 | $13,484 | $13,533 | $13,164 | $12,838 | $12,638 |
| 9/30/2020 | $13,460 | $13,546 | $13,174 | $12,834 | $12,632 |
| 10/31/2020 | $13,446 | $13,571 | $13,175 | $12,822 | $12,575 |
| 11/30/2020 | $13,812 | $13,897 | $13,451 | $13,116 | $12,699 |
| 12/31/2020 | $14,088 | $14,157 | $13,643 | $13,338 | $12,716 |
| 1/31/2021 | $14,398 | $14,452 | $13,859 | $13,564 | $12,625 |
| 2/28/2021 | $14,192 | $14,301 | $13,687 | $13,399 | $12,443 |
| 3/31/2021 | $14,311 | $14,456 | $13,813 | $13,503 | $12,287 |
| 4/30/2021 | $14,521 | $14,667 | $13,985 | $13,682 | $12,384 |
| 5/31/2021 | $14,704 | $14,836 | $14,104 | $13,836 | $12,425 |
| 6/30/2021 | $14,880 | $15,024 | $14,234 | $13,982 | $12,512 |
| 7/31/2021 | $15,043 | $15,204 | $14,386 | $14,114 | $12,652 |
| 8/31/2021 | $14,978 | $15,181 | $14,353 | $14,064 | $12,628 |
| 9/30/2021 | $14,810 | $15,081 | $14,256 | $13,937 | $12,518 |
| 10/31/2021 | $14,733 | $15,020 | $14,204 | $13,902 | $12,515 |
| 11/30/2021 | $14,967 | $15,217 | $14,367 | $14,069 | $12,552 |
| 12/31/2021 | $15,018 | $15,257 | $14,399 | $14,103 | $12,520 |
| 1/31/2022 | $14,500 | $14,830 | $14,000 | $13,730 | $12,250 |
| 2/28/2022 | $14,342 | $14,795 | $13,961 | $13,616 | $12,114 |
| 3/31/2022 | $13,729 | $14,261 | $13,474 | $13,149 | $11,777 |
| 4/30/2022 | $13,174 | $13,754 | $13,033 | $12,680 | $11,330 |
| 5/31/2022 | $13,331 | $13,905 | $13,194 | $12,837 | $11,403 |
| 6/30/2022 | $12,821 | $13,461 | $12,844 | $12,385 | $11,224 |
| 7/31/2022 | $13,286 | $13,964 | $13,275 | $12,826 | $11,498 |
| 8/31/2022 | $12,960 | $13,653 | $12,981 | $12,527 | $11,174 |
| 9/30/2022 | $12,136 | $12,812 | $12,287 | $11,851 | $10,691 |
| 10/31/2022 | $11,869 | $12,549 | $12,087 | $11,639 | $10,552 |
| 11/30/2022 | $12,595 | $13,280 | $12,742 | $12,261 | $10,940 |
| 12/31/2022 | $12,556 | $13,258 | $12,742 | $12,211 | $10,891 |
| 1/31/2023 | $13,069 | $13,847 | $13,237 | $12,675 | $11,226 |
| 2/28/2023 | $12,716 | $13,412 | $12,862 | $12,333 | $10,936 |
| 3/31/2023 | $12,846 | $13,620 | $13,092 | $12,507 | $11,214 |
| 4/30/2023 | $12,952 | $13,699 | $13,131 | $12,548 | $11,282 |
| 5/31/2023 | $12,864 | $13,604 | $13,032 | $12,477 | $11,159 |
| 6/30/2023 | $13,104 | $13,846 | $13,228 | $12,600 | $11,119 |
| 7/31/2023 | $13,151 | $13,936 | $13,302 | $12,634 | $11,111 |
| 8/31/2023 | $12,988 | $13,724 | $13,104 | $12,456 | $11,040 |
| 9/30/2023 | $12,553 | $13,258 | $12,680 | $12,064 | $10,760 |
| 10/31/2023 | $12,255 | $13,045 | $12,511 | $11,821 | $10,590 |
| 11/30/2023 | $13,079 | $14,057 | $13,419 | $12,642 | $11,069 |
| 12/31/2023 | $13,494 | $14,479 | $13,790 | $13,023 | $11,493 |
| 1/31/2024 | $13,574 | $14,411 | $13,724 | $13,072 | $11,462 |
| 2/29/2024 | $13,679 | $14,525 | $13,800 | $13,151 | $11,300 |
| 3/31/2024 | $13,779 | $14,697 | $13,906 | $13,230 | $11,404 |
| 4/30/2024 | $13,631 | $14,607 | $13,791 | $13,073 | $11,116 |
| 5/31/2024 | $13,721 | $14,718 | $13,844 | $13,152 | $11,304 |
| 6/30/2024 | $13,991 | $15,078 | $14,139 | $13,458 | $11,412 |
| 7/31/2024 | $14,136 | $15,243 | $14,285 | $13,595 | $11,678 |
| 8/31/2024 | $14,280 | $15,423 | $14,434 | $13,706 | $11,846 |
| 9/30/2024 | $14,515 | $15,562 | $14,568 | $13,876 | $12,004 |
The Fund’s benchmarks are unmanaged indices used as a general measure of market performance. Calculations assume the reinvestment of dividends and capital gains.
Average Annual Total Returns (%)
| 1 Year | 5 Years | 10 Years |
|---|
| Class I at NAV | 15.63% | 1.54% | 3.80% |
| Bloomberg High Yield Municipal Bond Index | 17.38% | 3.07% | 4.52% |
| Bloomberg 65% High Yield Municipal Bond Index/ 35% Bloomberg Municipal Bond Index | 14.89% | 2.51% | 3.83% |
| Lipper High Yield Municipal Debt Funds Average | 15.02% | 1.69% | 3.33% |
Bloomberg Aggregate Bond IndexFootnote Reference* | 11.57% | 0.33% | 1.84% |
| Footnote | Description |
Footnote* | The Fund has adopted the Bloomberg Aggregate Bond Index as its broad-based securities market index. |
The Fund's past performance is no guarantee of future results. The returns do not reflect the deduction of taxes that a shareholder would pay on Fund distributions or redemption of Fund shares.
(as of September 30, 2024)
| Total Net Assets | $4,098,713,523 |
| # of Portfolio Holdings | 611 |
| Portfolio Turnover Rate | 27% |
| Total Advisory Fees Paid | $16,137,454 |
What did the Fund invest in?
(as of September 30, 2024)
Credit Rating S&P or Moody'sFootnote Reference(a) | %Footnote Reference** |
|---|
| |
- A3.12%
- A-3.62%
- A+4.07%
- AA4.24%
- AA-2.36%
- AA+0.32%
- AAA1.03%
- B0.75%
- B-2.26%
- B+2.14%
- BB6.67%
- BB-5.00%
- BB+6.47%
- BBB3.00%
- BBB-8.39%
- BBB+4.73%
- CCC0.30%
- CCC-1.01%
- CCC+0.36%
- NR40.16%
- Total 100.00%
| Footnote | Description |
Footnote** | Represents percent of total investments, which excludes derivatives. |
Footnote(a) | Investments in investment grade municipal bonds, which as bonds that are rated, at the time of purchase, within the four highest grades assigned by an independent rating agency such as Moody’s, S&P, or Fitch, or an equivalent short-term rating, as applicable, or are unrated by rating agencies but deemed by Lord Abbett to be of comparable quality. Lower rated municipal bonds are rated, at the time of purchase, or an equivalent short-term rating, as applicable, by an independent rating agency or are unrated by rating agencies but deemed by Lord Abbett to be of comparable quality. |
There were no material fund changes during the period.
Where can I find additional information about the Fund?
For additional information about the Fund, including its Prospectus, Statement of Additional Information, financial statements, holdings and proxy information, please visit lordabbett.com/FundDocuments.
The Fund has adopted a policy that allows it to send only one copy of the Fund's prospectus, proxy material, annual report and semiannual report (or related notice of internet availability of annual report and semiannual report) to certain shareholders residing at the same "household." This reduces Fund expenses, which benefits you and other shareholders.If you need additional copies or do not want your mailings to be "householded," please call Lord Abbett at 888-522-2388.
Lord Abbett High Income Municipal Bond Fund
Annual Shareholder Report
September 30, 2024
lordabbett.com/FundDocuments
TSR-A-1451-I
11/24
Lord Abbett California Tax Free Fund
Annual Shareholder Report
September 30, 2024
lordabbett.com/FundDocuments
This annual shareholder report contains important information about the Lord Abbett California Tax Free Fund for the period of October 1, 2023 to September 30, 2024, as well as certain changes to the Fund. You can find additional information about the Fund at lordabbett.com/FundDocuments. You can also request this information by contacting us at 888-522-2388.
What were the Fund costs for the last year?
(based on a hypothetical $10,000 investment)
| Class Name | Costs of a $10,000 investment | Costs paid as a percentage of a $10,000 investment |
|---|
| Class A | $82 | 0.77% |
How did the Fund perform last year and what affected its performance?
For the fiscal year ended September 30, 2024, the Fund returned 11.78%, reflecting performance at the net asset value (NAV) of Class A shares, compared to the 10.37% of a securities market index with investment characteristics similar to those of the Fund, the Bloomberg Municipal Bond Index. The Fund's broad-based market index, the Bloomberg Aggregate Bond Index, returned 11.57% over the same period.
Positive factors for the municipal market included decreasing Treasury yields, easing inflationary pressures and the start of interest rate cuts by the U.S. Federal Reserve. Also supporting the market was increased demand for municipal bond funds and a strong fundamental backdrop as evidenced by growing tax revenue and positive ratings actions by public ratings agencies. Negative factors included a significant increase in municipal bond supply, which pressured the market in second half of the fiscal year, and periods of interest rate volatility driven by sticky inflation readings at points throughout the fiscal year. Against this backdrop, municipal bonds delivered strong returns.
Top contributors to the Fund’s performance: The Fund’s longer duration positioning contributed to relative performance with the fall in rates over the period. An overweight allocation to BBB-rated and non-investment grade bonds contributed to relative performance. An overweight allocation to the Tobacco and Industrial Development sectors contributed to relative performance.
Top detractors from the Fund’s performance: Security selection within the Transportation, Local General Obligation and Education sectors detracted from relative performance.
Total Return Based on $10,000 Investment

| Class A with load | Bloomberg Municipal Bond Index | Lipper California Municipal Debt Funds Average | Bloomberg Aggregate Bond Index |
|---|
| 9/30/2014 | $9,775 | $10,000 | $10,000 | $10,000 |
| 10/31/2014 | $9,875 | $10,069 | $10,080 | $10,098 |
| 11/30/2014 | $9,885 | $10,086 | $10,093 | $10,170 |
| 12/31/2014 | $9,967 | $10,137 | $10,163 | $10,179 |
| 1/31/2015 | $10,168 | $10,316 | $10,356 | $10,393 |
| 2/28/2015 | $10,050 | $10,210 | $10,248 | $10,295 |
| 3/31/2015 | $10,078 | $10,240 | $10,282 | $10,343 |
| 4/30/2015 | $10,014 | $10,186 | $10,215 | $10,306 |
| 5/31/2015 | $9,996 | $10,158 | $10,191 | $10,281 |
| 6/30/2015 | $9,951 | $10,148 | $10,126 | $10,169 |
| 7/31/2015 | $10,008 | $10,222 | $10,199 | $10,240 |
| 8/31/2015 | $10,037 | $10,242 | $10,230 | $10,225 |
| 9/30/2015 | $10,121 | $10,316 | $10,303 | $10,294 |
| 10/31/2015 | $10,177 | $10,357 | $10,350 | $10,296 |
| 11/30/2015 | $10,235 | $10,398 | $10,409 | $10,269 |
| 12/31/2015 | $10,330 | $10,472 | $10,506 | $10,235 |
| 1/31/2016 | $10,463 | $10,596 | $10,612 | $10,376 |
| 2/29/2016 | $10,484 | $10,613 | $10,624 | $10,450 |
| 3/31/2016 | $10,532 | $10,647 | $10,694 | $10,546 |
| 4/30/2016 | $10,627 | $10,725 | $10,784 | $10,586 |
| 5/31/2016 | $10,694 | $10,754 | $10,839 | $10,589 |
| 6/30/2016 | $10,914 | $10,925 | $11,036 | $10,779 |
| 7/31/2016 | $10,923 | $10,932 | $11,021 | $10,847 |
| 8/31/2016 | $10,950 | $10,947 | $11,049 | $10,835 |
| 9/30/2016 | $10,910 | $10,892 | $10,995 | $10,829 |
| 10/31/2016 | $10,783 | $10,778 | $10,870 | $10,746 |
| 11/30/2016 | $10,269 | $10,376 | $10,394 | $10,492 |
| 12/31/2016 | $10,345 | $10,497 | $10,502 | $10,506 |
| 1/31/2017 | $10,442 | $10,567 | $10,558 | $10,527 |
| 2/28/2017 | $10,519 | $10,640 | $10,634 | $10,598 |
| 3/31/2017 | $10,537 | $10,663 | $10,671 | $10,592 |
| 4/30/2017 | $10,624 | $10,740 | $10,830 | $10,674 |
| 5/31/2017 | $10,790 | $10,911 | $11,004 | $10,756 |
| 6/30/2017 | $10,788 | $10,872 | $10,990 | $10,745 |
| 7/31/2017 | $10,865 | $10,960 | $11,056 | $10,792 |
| 8/31/2017 | $10,960 | $11,043 | $11,147 | $10,888 |
| 9/30/2017 | $10,897 | $10,987 | $11,096 | $10,836 |
| 10/31/2017 | $10,925 | $11,014 | $11,114 | $10,843 |
| 11/30/2017 | $10,902 | $10,955 | $11,094 | $10,829 |
| 12/31/2017 | $11,040 | $11,069 | $11,212 | $10,879 |
| 1/31/2018 | $10,906 | $10,939 | $11,088 | $10,753 |
| 2/28/2018 | $10,854 | $10,906 | $11,037 | $10,651 |
| 3/31/2018 | $10,932 | $10,947 | $11,091 | $10,720 |
| 4/30/2018 | $10,889 | $10,908 | $11,056 | $10,640 |
| 5/31/2018 | $11,039 | $11,033 | $11,198 | $10,716 |
| 6/30/2018 | $11,056 | $11,042 | $11,209 | $10,703 |
| 7/31/2018 | $11,074 | $11,069 | $11,226 | $10,705 |
| 8/31/2018 | $11,112 | $11,097 | $11,257 | $10,774 |
| 9/30/2018 | $11,028 | $11,025 | $11,177 | $10,705 |
| 10/31/2018 | $10,903 | $10,957 | $11,073 | $10,620 |
| 11/30/2018 | $10,994 | $11,079 | $11,160 | $10,683 |
| 12/31/2018 | $11,095 | $11,211 | $11,272 | $10,880 |
| 1/31/2019 | $11,155 | $11,296 | $11,333 | $10,995 |
| 2/28/2019 | $11,227 | $11,357 | $11,395 | $10,989 |
| 3/31/2019 | $11,464 | $11,536 | $11,595 | $11,200 |
| 4/30/2019 | $11,545 | $11,579 | $11,651 | $11,203 |
| 5/31/2019 | $11,740 | $11,739 | $11,836 | $11,402 |
| 6/30/2019 | $11,789 | $11,782 | $11,881 | $11,545 |
| 7/31/2019 | $11,869 | $11,877 | $11,967 | $11,570 |
| 8/31/2019 | $12,148 | $12,065 | $12,189 | $11,870 |
| 9/30/2019 | $12,059 | $11,968 | $12,108 | $11,807 |
| 10/31/2019 | $12,053 | $11,989 | $12,111 | $11,842 |
| 11/30/2019 | $12,080 | $12,019 | $12,139 | $11,836 |
| 12/31/2019 | $12,127 | $12,056 | $12,168 | $11,828 |
| 1/31/2020 | $12,397 | $12,273 | $12,401 | $12,056 |
| 2/29/2020 | $12,635 | $12,431 | $12,596 | $12,273 |
| 3/31/2020 | $11,775 | $11,980 | $11,886 | $12,201 |
| 4/30/2020 | $11,501 | $11,830 | $11,650 | $12,417 |
| 5/31/2020 | $11,955 | $12,206 | $12,059 | $12,475 |
| 6/30/2020 | $12,163 | $12,307 | $12,230 | $12,554 |
| 7/31/2020 | $12,425 | $12,514 | $12,451 | $12,741 |
| 8/31/2020 | $12,363 | $12,455 | $12,398 | $12,638 |
| 9/30/2020 | $12,344 | $12,458 | $12,398 | $12,632 |
| 10/31/2020 | $12,325 | $12,420 | $12,377 | $12,575 |
| 11/30/2020 | $12,588 | $12,608 | $12,611 | $12,699 |
| 12/31/2020 | $12,689 | $12,685 | $12,704 | $12,716 |
| 1/31/2021 | $12,811 | $12,765 | $12,806 | $12,625 |
| 2/28/2021 | $12,552 | $12,563 | $12,591 | $12,443 |
| 3/31/2021 | $12,652 | $12,640 | $12,680 | $12,287 |
| 4/30/2021 | $12,808 | $12,746 | $12,818 | $12,384 |
| 5/31/2021 | $12,897 | $12,784 | $12,901 | $12,425 |
| 6/30/2021 | $12,953 | $12,819 | $12,958 | $12,512 |
| 7/31/2021 | $13,076 | $12,925 | $13,068 | $12,652 |
| 8/31/2021 | $12,999 | $12,878 | $13,011 | $12,628 |
| 9/30/2021 | $12,857 | $12,785 | $12,891 | $12,518 |
| 10/31/2021 | $12,846 | $12,748 | $12,877 | $12,515 |
| 11/30/2021 | $12,992 | $12,856 | $13,001 | $12,552 |
| 12/31/2021 | $13,025 | $12,877 | $13,019 | $12,520 |
| 1/31/2022 | $12,579 | $12,525 | $12,652 | $12,250 |
| 2/28/2022 | $12,468 | $12,480 | $12,571 | $12,114 |
| 3/31/2022 | $11,966 | $12,075 | $12,143 | $11,777 |
| 4/30/2022 | $11,442 | $11,741 | $11,711 | $11,330 |
| 5/31/2022 | $11,623 | $11,916 | $11,880 | $11,403 |
| 6/30/2022 | $11,232 | $11,720 | $11,554 | $11,224 |
| 7/31/2022 | $11,652 | $12,030 | $11,931 | $11,498 |
| 8/31/2022 | $11,338 | $11,766 | $11,648 | $11,174 |
| 9/30/2022 | $10,787 | $11,315 | $11,118 | $10,691 |
| 10/31/2022 | $10,632 | $11,221 | $10,977 | $10,552 |
| 11/30/2022 | $11,284 | $11,746 | $11,585 | $10,940 |
| 12/31/2022 | $11,288 | $11,779 | $11,586 | $10,891 |
| 1/31/2023 | $11,703 | $12,117 | $11,962 | $11,226 |
| 2/28/2023 | $11,389 | $11,843 | $11,662 | $10,936 |
| 3/31/2023 | $11,613 | $12,106 | $11,865 | $11,214 |
| 4/30/2023 | $11,618 | $12,079 | $11,867 | $11,282 |
| 5/31/2023 | $11,532 | $11,974 | $11,784 | $11,159 |
| 6/30/2023 | $11,678 | $12,094 | $11,872 | $11,119 |
| 7/31/2023 | $11,708 | $12,142 | $11,904 | $11,111 |
| 8/31/2023 | $11,530 | $11,967 | $11,750 | $11,040 |
| 9/30/2023 | $11,165 | $11,616 | $11,403 | $10,760 |
| 10/31/2023 | $10,963 | $11,517 | $11,202 | $10,590 |
| 11/30/2023 | $11,734 | $12,249 | $11,982 | $11,069 |
| 12/31/2023 | $12,071 | $12,533 | $12,306 | $11,493 |
| 1/31/2024 | $12,068 | $12,469 | $12,304 | $11,462 |
| 2/29/2024 | $12,089 | $12,485 | $12,325 | $11,300 |
| 3/31/2024 | $12,098 | $12,485 | $12,346 | $11,404 |
| 4/30/2024 | $11,952 | $12,330 | $12,197 | $11,116 |
| 5/31/2024 | $11,973 | $12,294 | $12,217 | $11,304 |
| 6/30/2024 | $12,162 | $12,482 | $12,433 | $11,412 |
| 7/31/2024 | $12,268 | $12,596 | $12,536 | $11,678 |
| 8/31/2024 | $12,325 | $12,696 | $12,620 | $11,846 |
| 9/30/2024 | $12,479 | $12,821 | $12,761 | $12,004 |
The Fund’s benchmarks are unmanaged indices used as a general measure of market performance. Calculations assume the reinvestment of dividends and capital gains.
Average Annual Total Returns (%)
| 1 Year | 5 Years | 10 Years |
|---|
| Class A at NAV | 11.78% | 0.69% | 2.47% |
| Class A with sales charge | 9.26% | 0.24% | 2.24% |
| Bloomberg Municipal Bond Index | 10.37% | 1.39% | 2.52% |
| Lipper California Municipal Debt Funds Average | 11.91% | 1.06% | 2.47% |
Bloomberg Aggregate Bond IndexFootnote Reference* | 11.57% | 0.33% | 1.84% |
| Footnote | Description |
Footnote* | The Fund has adopted the Bloomberg Aggregate Bond Index as its broad-based securities market index. |
The Fund's past performance is no guarantee of future results. The returns do not reflect the deduction of taxes that a shareholder would pay on Fund distributions or redemption of Fund shares.
(as of September 30, 2024)
| Total Net Assets | $667,621,225 |
| # of Portfolio Holdings | 274 |
| Portfolio Turnover Rate | 26% |
| Total Advisory Fees Paid | $2,699,455 |
What did the Fund invest in?
(as of September 30, 2024)
Credit Rating S&P or Moody'sFootnote Reference(a) | %Footnote Reference** |
|---|
| |
- A12.21%
- A-7.22%
- A+12.73%
- AA25.04%
- AA-10.22%
- AA+2.93%
- AAA0.17%
- B+0.07%
- BB2.47%
- BB-0.31%
- BB+3.20%
- BBB4.70%
- BBB-3.58%
- BBB+6.68%
- CCC0.10%
- CCC-0.08%
- NR8.29%
- Total 100.00%
| Footnote | Description |
Footnote** | Represents percent of total investments, which excludes derivatives. |
Footnote(a) | Investments in investment grade municipal bonds, which as bonds that are rated, at the time of purchase, within the four highest grades assigned by an independent rating agency such as Moody’s, S&P, or Fitch, or an equivalent short-term rating, as applicable, or are unrated by rating agencies but deemed by Lord Abbett to be of comparable quality. Lower rated municipal bonds are rated, at the time of purchase, or an equivalent short-term rating, as applicable, by an independent rating agency or are unrated by rating agencies but deemed by Lord Abbett to be of comparable quality. |
There were no material fund changes during the period.
Where can I find additional information about the Fund?
For additional information about the Fund, including its Prospectus, Statement of Additional Information, financial statements, holdings and proxy information, please visit lordabbett.com/FundDocuments.
The Fund has adopted a policy that allows it to send only one copy of the Fund's prospectus, proxy material, annual report and semiannual report (or related notice of internet availability of annual report and semiannual report) to certain shareholders residing at the same "household." This reduces Fund expenses, which benefits you and other shareholders.If you need additional copies or do not want your mailings to be "householded," please call Lord Abbett at 888-522-2388.
Lord Abbett California Tax Free Fund
Annual Shareholder Report
September 30, 2024
lordabbett.com/FundDocuments
TSR-A-2-A
11/24
Lord Abbett California Tax Free Fund
Annual Shareholder Report
September 30, 2024
lordabbett.com/FundDocuments
This annual shareholder report contains important information about the Lord Abbett California Tax Free Fund for the period of October 1, 2023 to September 30, 2024, as well as certain changes to the Fund. You can find additional information about the Fund at lordabbett.com/FundDocuments. You can also request this information by contacting us at 888-522-2388.
What were the Fund costs for the last year?
(based on a hypothetical $10,000 investment)
| Class Name | Costs of a $10,000 investment | Costs paid as a percentage of a $10,000 investment |
|---|
| Class C | $145 | 1.37% |
How did the Fund perform last year and what affected its performance?
For the fiscal year ended September 30, 2024, the Fund returned 11.10%, reflecting performance at the net asset value (NAV) of Class C shares, compared to the 10.37% of a securities market index with investment characteristics similar to those of the Fund, the Bloomberg Municipal Bond Index. The Fund's broad-based market index, the Bloomberg Aggregate Bond Index, returned 11.57% over the same period.
Positive factors for the municipal market included decreasing Treasury yields, easing inflationary pressures and the start of interest rate cuts by the U.S. Federal Reserve. Also supporting the market was increased demand for municipal bond funds and a strong fundamental backdrop as evidenced by growing tax revenue and positive ratings actions by public ratings agencies. Negative factors included a significant increase in municipal bond supply, which pressured the market in second half of the fiscal year, and periods of interest rate volatility driven by sticky inflation readings at points throughout the fiscal year. Against this backdrop, municipal bonds delivered strong returns.
Top contributors to the Fund’s performance: The Fund’s longer duration positioning contributed to relative performance with the fall in rates over the period. An overweight allocation to BBB-rated and non-investment grade bonds contributed to relative performance. An overweight allocation to the Tobacco and Industrial Development sectors contributed to relative performance.
Top detractors from the Fund’s performance: Security selection within the Transportation, Local General Obligation and Education sectors detracted from relative performance.
Total Return Based on $10,000 Investment

| Class C | Bloomberg Municipal Bond Index | Lipper California Municipal Debt Funds Average | Bloomberg Aggregate Bond Index |
|---|
| 9/30/2014 | $10,000 | $10,000 | $10,000 | $10,000 |
| 10/31/2014 | $10,097 | $10,069 | $10,080 | $10,098 |
| 11/30/2014 | $10,102 | $10,086 | $10,093 | $10,170 |
| 12/31/2014 | $10,181 | $10,137 | $10,163 | $10,179 |
| 1/31/2015 | $10,390 | $10,316 | $10,356 | $10,393 |
| 2/28/2015 | $10,265 | $10,210 | $10,248 | $10,295 |
| 3/31/2015 | $10,288 | $10,240 | $10,282 | $10,343 |
| 4/30/2015 | $10,217 | $10,186 | $10,215 | $10,306 |
| 5/31/2015 | $10,194 | $10,158 | $10,191 | $10,281 |
| 6/30/2015 | $10,133 | $10,148 | $10,126 | $10,169 |
| 7/31/2015 | $10,185 | $10,222 | $10,199 | $10,240 |
| 8/31/2015 | $10,209 | $10,242 | $10,230 | $10,225 |
| 9/30/2015 | $10,289 | $10,316 | $10,303 | $10,294 |
| 10/31/2015 | $10,341 | $10,357 | $10,350 | $10,296 |
| 11/30/2015 | $10,395 | $10,398 | $10,409 | $10,269 |
| 12/31/2015 | $10,485 | $10,472 | $10,506 | $10,235 |
| 1/31/2016 | $10,615 | $10,596 | $10,612 | $10,376 |
| 2/29/2016 | $10,630 | $10,613 | $10,624 | $10,450 |
| 3/31/2016 | $10,683 | $10,647 | $10,694 | $10,546 |
| 4/30/2016 | $10,774 | $10,725 | $10,784 | $10,586 |
| 5/31/2016 | $10,836 | $10,754 | $10,839 | $10,589 |
| 6/30/2016 | $11,053 | $10,925 | $11,036 | $10,779 |
| 7/31/2016 | $11,056 | $10,932 | $11,021 | $10,847 |
| 8/31/2016 | $11,068 | $10,947 | $11,049 | $10,835 |
| 9/30/2016 | $11,031 | $10,892 | $10,995 | $10,829 |
| 10/31/2016 | $10,887 | $10,778 | $10,870 | $10,746 |
| 11/30/2016 | $10,363 | $10,376 | $10,394 | $10,492 |
| 12/31/2016 | $10,434 | $10,497 | $10,502 | $10,506 |
| 1/31/2017 | $10,526 | $10,567 | $10,558 | $10,527 |
| 2/28/2017 | $10,608 | $10,640 | $10,634 | $10,598 |
| 3/31/2017 | $10,621 | $10,663 | $10,671 | $10,592 |
| 4/30/2017 | $10,703 | $10,740 | $10,830 | $10,674 |
| 5/31/2017 | $10,863 | $10,911 | $11,004 | $10,756 |
| 6/30/2017 | $10,846 | $10,872 | $10,990 | $10,745 |
| 7/31/2017 | $10,917 | $10,960 | $11,056 | $10,792 |
| 8/31/2017 | $11,007 | $11,043 | $11,147 | $10,888 |
| 9/30/2017 | $10,938 | $10,987 | $11,096 | $10,836 |
| 10/31/2017 | $10,959 | $11,014 | $11,114 | $10,843 |
| 11/30/2017 | $10,941 | $10,955 | $11,094 | $10,829 |
| 12/31/2017 | $11,063 | $11,069 | $11,212 | $10,879 |
| 1/31/2018 | $10,924 | $10,939 | $11,088 | $10,753 |
| 2/28/2018 | $10,867 | $10,906 | $11,037 | $10,651 |
| 3/31/2018 | $10,949 | $10,947 | $11,091 | $10,720 |
| 4/30/2018 | $10,890 | $10,908 | $11,056 | $10,640 |
| 5/31/2018 | $11,034 | $11,033 | $11,198 | $10,716 |
| 6/30/2018 | $11,056 | $11,042 | $11,209 | $10,703 |
| 7/31/2018 | $11,058 | $11,069 | $11,226 | $10,705 |
| 8/31/2018 | $11,101 | $11,097 | $11,257 | $10,774 |
| 9/30/2018 | $11,001 | $11,025 | $11,177 | $10,705 |
| 10/31/2018 | $10,881 | $10,957 | $11,073 | $10,620 |
| 11/30/2018 | $10,956 | $11,079 | $11,160 | $10,683 |
| 12/31/2018 | $11,051 | $11,211 | $11,272 | $10,880 |
| 1/31/2019 | $11,115 | $11,296 | $11,333 | $10,995 |
| 2/28/2019 | $11,182 | $11,357 | $11,395 | $10,989 |
| 3/31/2019 | $11,401 | $11,536 | $11,595 | $11,200 |
| 4/30/2019 | $11,476 | $11,579 | $11,651 | $11,203 |
| 5/31/2019 | $11,664 | $11,739 | $11,836 | $11,402 |
| 6/30/2019 | $11,707 | $11,782 | $11,881 | $11,545 |
| 7/31/2019 | $11,791 | $11,877 | $11,967 | $11,570 |
| 8/31/2019 | $12,051 | $12,065 | $12,189 | $11,870 |
| 9/30/2019 | $11,956 | $11,968 | $12,108 | $11,807 |
| 10/31/2019 | $11,955 | $11,989 | $12,111 | $11,842 |
| 11/30/2019 | $11,964 | $12,019 | $12,139 | $11,836 |
| 12/31/2019 | $12,015 | $12,056 | $12,168 | $11,828 |
| 1/31/2020 | $12,275 | $12,273 | $12,401 | $12,056 |
| 2/29/2020 | $12,495 | $12,431 | $12,596 | $12,273 |
| 3/31/2020 | $11,637 | $11,980 | $11,886 | $12,201 |
| 4/30/2020 | $11,360 | $11,830 | $11,650 | $12,417 |
| 5/31/2020 | $11,802 | $12,206 | $12,059 | $12,475 |
| 6/30/2020 | $12,012 | $12,307 | $12,230 | $12,554 |
| 7/31/2020 | $12,253 | $12,514 | $12,451 | $12,741 |
| 8/31/2020 | $12,195 | $12,455 | $12,398 | $12,638 |
| 9/30/2020 | $12,169 | $12,458 | $12,398 | $12,632 |
| 10/31/2020 | $12,144 | $12,420 | $12,377 | $12,575 |
| 11/30/2020 | $12,397 | $12,608 | $12,611 | $12,699 |
| 12/31/2020 | $12,478 | $12,685 | $12,704 | $12,716 |
| 1/31/2021 | $12,591 | $12,765 | $12,806 | $12,625 |
| 2/28/2021 | $12,341 | $12,563 | $12,591 | $12,443 |
| 3/31/2021 | $12,422 | $12,640 | $12,680 | $12,287 |
| 4/30/2021 | $12,568 | $12,746 | $12,818 | $12,384 |
| 5/31/2021 | $12,649 | $12,784 | $12,901 | $12,425 |
| 6/30/2021 | $12,698 | $12,819 | $12,958 | $12,512 |
| 7/31/2021 | $12,811 | $12,925 | $13,068 | $12,652 |
| 8/31/2021 | $12,740 | $12,878 | $13,011 | $12,628 |
| 9/30/2021 | $12,594 | $12,785 | $12,891 | $12,518 |
| 10/31/2021 | $12,566 | $12,748 | $12,877 | $12,515 |
| 11/30/2021 | $12,701 | $12,856 | $13,001 | $12,552 |
| 12/31/2021 | $12,727 | $12,877 | $13,019 | $12,520 |
| 1/31/2022 | $12,285 | $12,525 | $12,652 | $12,250 |
| 2/28/2022 | $12,181 | $12,480 | $12,571 | $12,114 |
| 3/31/2022 | $11,685 | $12,075 | $12,143 | $11,777 |
| 4/30/2022 | $11,157 | $11,741 | $11,711 | $11,330 |
| 5/31/2022 | $11,328 | $11,916 | $11,880 | $11,403 |
| 6/30/2022 | $10,952 | $11,720 | $11,554 | $11,224 |
| 7/31/2022 | $11,343 | $12,030 | $11,931 | $11,498 |
| 8/31/2022 | $11,032 | $11,766 | $11,648 | $11,174 |
| 9/30/2022 | $10,490 | $11,315 | $11,118 | $10,691 |
| 10/31/2022 | $10,334 | $11,221 | $10,977 | $10,552 |
| 11/30/2022 | $10,963 | $11,746 | $11,585 | $10,940 |
| 12/31/2022 | $10,971 | $11,779 | $11,586 | $10,891 |
| 1/31/2023 | $11,358 | $12,117 | $11,962 | $11,226 |
| 2/28/2023 | $11,047 | $11,843 | $11,662 | $10,936 |
| 3/31/2023 | $11,258 | $12,106 | $11,865 | $11,214 |
| 4/30/2023 | $11,269 | $12,079 | $11,867 | $11,282 |
| 5/31/2023 | $11,180 | $11,974 | $11,784 | $11,159 |
| 6/30/2023 | $11,304 | $12,094 | $11,872 | $11,119 |
| 7/31/2023 | $11,327 | $12,142 | $11,904 | $11,111 |
| 8/31/2023 | $11,149 | $11,967 | $11,750 | $11,040 |
| 9/30/2023 | $10,801 | $11,616 | $11,403 | $10,760 |
| 10/31/2023 | $10,600 | $11,517 | $11,202 | $10,590 |
| 11/30/2023 | $11,340 | $12,249 | $11,982 | $11,069 |
| 12/31/2023 | $11,660 | $12,533 | $12,306 | $11,493 |
| 1/31/2024 | $11,639 | $12,469 | $12,304 | $11,462 |
| 2/29/2024 | $11,654 | $12,485 | $12,325 | $11,300 |
| 3/31/2024 | $11,657 | $12,485 | $12,346 | $11,404 |
| 4/30/2024 | $11,511 | $12,330 | $12,197 | $11,116 |
| 5/31/2024 | $11,526 | $12,294 | $12,217 | $11,304 |
| 6/30/2024 | $11,713 | $12,482 | $12,433 | $11,412 |
| 7/31/2024 | $11,797 | $12,596 | $12,536 | $11,678 |
| 8/31/2024 | $11,858 | $12,696 | $12,620 | $11,846 |
| 9/30/2024 | $12,000 | $12,821 | $12,761 | $12,004 |
The Fund’s benchmarks are unmanaged indices used as a general measure of market performance. Calculations assume the reinvestment of dividends and capital gains.
Average Annual Total Returns (%)
| 1 Year | 5 Years | 10 Years |
|---|
| Class C at NAV | 11.10% | 0.07% | 1.84% |
| Class C with sales charge | 10.10% | 0.07% | 1.84% |
| Bloomberg Municipal Bond Index | 10.37% | 1.39% | 2.52% |
| Lipper California Municipal Debt Funds Average | 11.91% | 1.06% | 2.47% |
Bloomberg Aggregate Bond IndexFootnote Reference* | 11.57% | 0.33% | 1.84% |
| Footnote | Description |
Footnote* | The Fund has adopted the Bloomberg Aggregate Bond Index as its broad-based securities market index. |
The Fund's past performance is no guarantee of future results. The returns do not reflect the deduction of taxes that a shareholder would pay on Fund distributions or redemption of Fund shares.
(as of September 30, 2024)
| Total Net Assets | $667,621,225 |
| # of Portfolio Holdings | 274 |
| Portfolio Turnover Rate | 26% |
| Total Advisory Fees Paid | $2,699,455 |
What did the Fund invest in?
(as of September 30, 2024)
Credit Rating S&P or Moody'sFootnote Reference(a) | %Footnote Reference** |
|---|
| |
- A12.21%
- A-7.22%
- A+12.73%
- AA25.04%
- AA-10.22%
- AA+2.93%
- AAA0.17%
- B+0.07%
- BB2.47%
- BB-0.31%
- BB+3.20%
- BBB4.70%
- BBB-3.58%
- BBB+6.68%
- CCC0.10%
- CCC-0.08%
- NR8.29%
- Total 100.00%
| Footnote | Description |
Footnote** | Represents percent of total investments, which excludes derivatives. |
Footnote(a) | Investments in investment grade municipal bonds, which as bonds that are rated, at the time of purchase, within the four highest grades assigned by an independent rating agency such as Moody’s, S&P, or Fitch, or an equivalent short-term rating, as applicable, or are unrated by rating agencies but deemed by Lord Abbett to be of comparable quality. Lower rated municipal bonds are rated, at the time of purchase, or an equivalent short-term rating, as applicable, by an independent rating agency or are unrated by rating agencies but deemed by Lord Abbett to be of comparable quality. |
There were no material fund changes during the period.
Where can I find additional information about the Fund?
For additional information about the Fund, including its Prospectus, Statement of Additional Information, financial statements, holdings and proxy information, please visit lordabbett.com/FundDocuments.
The Fund has adopted a policy that allows it to send only one copy of the Fund's prospectus, proxy material, annual report and semiannual report (or related notice of internet availability of annual report and semiannual report) to certain shareholders residing at the same "household." This reduces Fund expenses, which benefits you and other shareholders.If you need additional copies or do not want your mailings to be "householded," please call Lord Abbett at 888-522-2388.
Lord Abbett California Tax Free Fund
Annual Shareholder Report
September 30, 2024
lordabbett.com/FundDocuments
TSR-A-670-C
11/24
Lord Abbett California Tax Free Fund
Annual Shareholder Report
September 30, 2024
lordabbett.com/FundDocuments
This annual shareholder report contains important information about the Lord Abbett California Tax Free Fund for the period of October 1, 2023 to September 30, 2024, as well as certain changes to the Fund. You can find additional information about the Fund at lordabbett.com/FundDocuments. You can also request this information by contacting us at 888-522-2388.
What were the Fund costs for the last year?
(based on a hypothetical $10,000 investment)
| Class Name | Costs of a $10,000 investment | Costs paid as a percentage of a $10,000 investment |
|---|
| Class F | $71 | 0.67% |
How did the Fund perform last year and what affected its performance?
For the fiscal year ended September 30, 2024, the Fund returned 11.89%, reflecting performance at the net asset value (NAV) of Class F shares, compared to the 10.37% of a securities market index with investment characteristics similar to those of the Fund, the Bloomberg Municipal Bond Index. The Fund's broad-based market index, the Bloomberg Aggregate Bond Index, returned 11.57% over the same period.
Positive factors for the municipal market included decreasing Treasury yields, easing inflationary pressures and the start of interest rate cuts by the U.S. Federal Reserve. Also supporting the market was increased demand for municipal bond funds and a strong fundamental backdrop as evidenced by growing tax revenue and positive ratings actions by public ratings agencies. Negative factors included a significant increase in municipal bond supply, which pressured the market in second half of the fiscal year, and periods of interest rate volatility driven by sticky inflation readings at points throughout the fiscal year. Against this backdrop, municipal bonds delivered strong returns.
Top contributors to the Fund’s performance: The Fund’s longer duration positioning contributed to relative performance with the fall in rates over the period. An overweight allocation to BBB-rated and non-investment grade bonds contributed to relative performance. An overweight allocation to the Tobacco and Industrial Development sectors contributed to relative performance.
Top detractors from the Fund’s performance: Security selection within the Transportation, Local General Obligation and Education sectors detracted from relative performance.
Total Return Based on $10,000 Investment
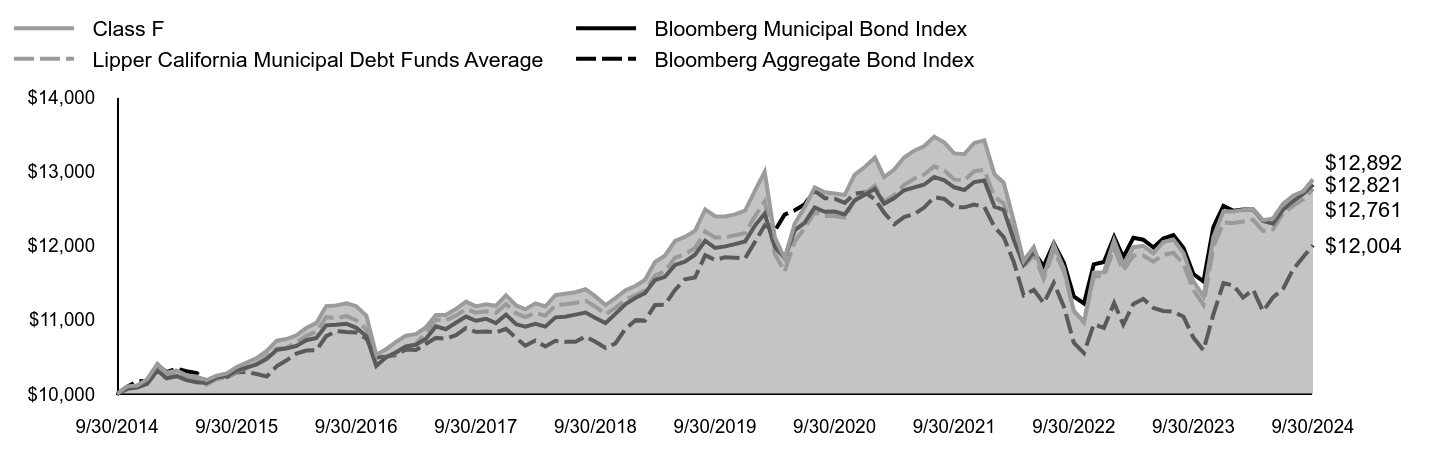
| Class F | Bloomberg Municipal Bond Index | Lipper California Municipal Debt Funds Average | Bloomberg Aggregate Bond Index |
|---|
| 9/30/2014 | $10,000 | $10,000 | $10,000 | $10,000 |
| 10/31/2014 | $10,103 | $10,069 | $10,080 | $10,098 |
| 11/30/2014 | $10,114 | $10,086 | $10,093 | $10,170 |
| 12/31/2014 | $10,200 | $10,137 | $10,163 | $10,179 |
| 1/31/2015 | $10,406 | $10,316 | $10,356 | $10,393 |
| 2/28/2015 | $10,286 | $10,210 | $10,248 | $10,295 |
| 3/31/2015 | $10,315 | $10,240 | $10,282 | $10,343 |
| 4/30/2015 | $10,251 | $10,186 | $10,215 | $10,306 |
| 5/31/2015 | $10,233 | $10,158 | $10,191 | $10,281 |
| 6/30/2015 | $10,188 | $10,148 | $10,126 | $10,169 |
| 7/31/2015 | $10,247 | $10,222 | $10,199 | $10,240 |
| 8/31/2015 | $10,277 | $10,242 | $10,230 | $10,225 |
| 9/30/2015 | $10,364 | $10,316 | $10,303 | $10,294 |
| 10/31/2015 | $10,423 | $10,357 | $10,350 | $10,296 |
| 11/30/2015 | $10,483 | $10,398 | $10,409 | $10,269 |
| 12/31/2015 | $10,581 | $10,472 | $10,506 | $10,235 |
| 1/31/2016 | $10,718 | $10,596 | $10,612 | $10,376 |
| 2/29/2016 | $10,740 | $10,613 | $10,624 | $10,450 |
| 3/31/2016 | $10,790 | $10,647 | $10,694 | $10,546 |
| 4/30/2016 | $10,889 | $10,725 | $10,784 | $10,586 |
| 5/31/2016 | $10,958 | $10,754 | $10,839 | $10,589 |
| 6/30/2016 | $11,184 | $10,925 | $11,036 | $10,779 |
| 7/31/2016 | $11,194 | $10,932 | $11,021 | $10,847 |
| 8/31/2016 | $11,223 | $10,947 | $11,049 | $10,835 |
| 9/30/2016 | $11,183 | $10,892 | $10,995 | $10,829 |
| 10/31/2016 | $11,053 | $10,778 | $10,870 | $10,746 |
| 11/30/2016 | $10,528 | $10,376 | $10,394 | $10,492 |
| 12/31/2016 | $10,607 | $10,497 | $10,502 | $10,506 |
| 1/31/2017 | $10,706 | $10,567 | $10,558 | $10,527 |
| 2/28/2017 | $10,786 | $10,640 | $10,634 | $10,598 |
| 3/31/2017 | $10,806 | $10,663 | $10,671 | $10,592 |
| 4/30/2017 | $10,896 | $10,740 | $10,830 | $10,674 |
| 5/31/2017 | $11,066 | $10,911 | $11,004 | $10,756 |
| 6/30/2017 | $11,065 | $10,872 | $10,990 | $10,745 |
| 7/31/2017 | $11,145 | $10,960 | $11,056 | $10,792 |
| 8/31/2017 | $11,244 | $11,043 | $11,147 | $10,888 |
| 9/30/2017 | $11,180 | $10,987 | $11,096 | $10,836 |
| 10/31/2017 | $11,209 | $11,014 | $11,114 | $10,843 |
| 11/30/2017 | $11,188 | $10,955 | $11,094 | $10,829 |
| 12/31/2017 | $11,329 | $11,069 | $11,212 | $10,879 |
| 1/31/2018 | $11,193 | $10,939 | $11,088 | $10,753 |
| 2/28/2018 | $11,141 | $10,906 | $11,037 | $10,651 |
| 3/31/2018 | $11,221 | $10,947 | $11,091 | $10,720 |
| 4/30/2018 | $11,179 | $10,908 | $11,056 | $10,640 |
| 5/31/2018 | $11,333 | $11,033 | $11,198 | $10,716 |
| 6/30/2018 | $11,352 | $11,042 | $11,209 | $10,703 |
| 7/31/2018 | $11,371 | $11,069 | $11,226 | $10,705 |
| 8/31/2018 | $11,411 | $11,097 | $11,257 | $10,774 |
| 9/30/2018 | $11,315 | $11,025 | $11,177 | $10,705 |
| 10/31/2018 | $11,198 | $10,957 | $11,073 | $10,620 |
| 11/30/2018 | $11,292 | $11,079 | $11,160 | $10,683 |
| 12/31/2018 | $11,397 | $11,211 | $11,272 | $10,880 |
| 1/31/2019 | $11,459 | $11,296 | $11,333 | $10,995 |
| 2/28/2019 | $11,535 | $11,357 | $11,395 | $10,989 |
| 3/31/2019 | $11,779 | $11,536 | $11,595 | $11,200 |
| 4/30/2019 | $11,863 | $11,579 | $11,651 | $11,203 |
| 5/31/2019 | $12,064 | $11,739 | $11,836 | $11,402 |
| 6/30/2019 | $12,116 | $11,782 | $11,881 | $11,545 |
| 7/31/2019 | $12,199 | $11,877 | $11,967 | $11,570 |
| 8/31/2019 | $12,487 | $12,065 | $12,189 | $11,870 |
| 9/30/2019 | $12,396 | $11,968 | $12,108 | $11,807 |
| 10/31/2019 | $12,392 | $11,989 | $12,111 | $11,842 |
| 11/30/2019 | $12,420 | $12,019 | $12,139 | $11,836 |
| 12/31/2019 | $12,469 | $12,056 | $12,168 | $11,828 |
| 1/31/2020 | $12,748 | $12,273 | $12,401 | $12,056 |
| 2/29/2020 | $12,994 | $12,431 | $12,596 | $12,273 |
| 3/31/2020 | $12,110 | $11,980 | $11,886 | $12,201 |
| 4/30/2020 | $11,829 | $11,830 | $11,650 | $12,417 |
| 5/31/2020 | $12,297 | $12,206 | $12,059 | $12,475 |
| 6/30/2020 | $12,512 | $12,307 | $12,230 | $12,554 |
| 7/31/2020 | $12,783 | $12,514 | $12,451 | $12,741 |
| 8/31/2020 | $12,719 | $12,455 | $12,398 | $12,638 |
| 9/30/2020 | $12,701 | $12,458 | $12,398 | $12,632 |
| 10/31/2020 | $12,683 | $12,420 | $12,377 | $12,575 |
| 11/30/2020 | $12,955 | $12,608 | $12,611 | $12,699 |
| 12/31/2020 | $13,059 | $12,685 | $12,704 | $12,716 |
| 1/31/2021 | $13,186 | $12,765 | $12,806 | $12,625 |
| 2/28/2021 | $12,921 | $12,563 | $12,591 | $12,443 |
| 3/31/2021 | $13,025 | $12,640 | $12,680 | $12,287 |
| 4/30/2021 | $13,186 | $12,746 | $12,818 | $12,384 |
| 5/31/2021 | $13,279 | $12,784 | $12,901 | $12,425 |
| 6/30/2021 | $13,338 | $12,819 | $12,958 | $12,512 |
| 7/31/2021 | $13,465 | $12,925 | $13,068 | $12,652 |
| 8/31/2021 | $13,387 | $12,878 | $13,011 | $12,628 |
| 9/30/2021 | $13,242 | $12,785 | $12,891 | $12,518 |
| 10/31/2021 | $13,232 | $12,748 | $12,877 | $12,515 |
| 11/30/2021 | $13,383 | $12,856 | $13,001 | $12,552 |
| 12/31/2021 | $13,418 | $12,877 | $13,019 | $12,520 |
| 1/31/2022 | $12,960 | $12,525 | $12,652 | $12,250 |
| 2/28/2022 | $12,847 | $12,480 | $12,571 | $12,114 |
| 3/31/2022 | $12,331 | $12,075 | $12,143 | $11,777 |
| 4/30/2022 | $11,792 | $11,741 | $11,711 | $11,330 |
| 5/31/2022 | $11,979 | $11,916 | $11,880 | $11,403 |
| 6/30/2022 | $11,589 | $11,720 | $11,554 | $11,224 |
| 7/31/2022 | $12,011 | $12,030 | $11,931 | $11,498 |
| 8/31/2022 | $11,688 | $11,766 | $11,648 | $11,174 |
| 9/30/2022 | $11,121 | $11,315 | $11,118 | $10,691 |
| 10/31/2022 | $10,962 | $11,221 | $10,977 | $10,552 |
| 11/30/2022 | $11,636 | $11,746 | $11,585 | $10,940 |
| 12/31/2022 | $11,641 | $11,779 | $11,586 | $10,891 |
| 1/31/2023 | $12,070 | $12,117 | $11,962 | $11,226 |
| 2/28/2023 | $11,746 | $11,843 | $11,662 | $10,936 |
| 3/31/2023 | $11,978 | $12,106 | $11,865 | $11,214 |
| 4/30/2023 | $11,997 | $12,079 | $11,867 | $11,282 |
| 5/31/2023 | $11,897 | $11,974 | $11,784 | $11,159 |
| 6/30/2023 | $12,049 | $12,094 | $11,872 | $11,119 |
| 7/31/2023 | $12,081 | $12,142 | $11,904 | $11,111 |
| 8/31/2023 | $11,898 | $11,967 | $11,750 | $11,040 |
| 9/30/2023 | $11,522 | $11,616 | $11,403 | $10,760 |
| 10/31/2023 | $11,314 | $11,517 | $11,202 | $10,590 |
| 11/30/2023 | $12,111 | $12,249 | $11,982 | $11,069 |
| 12/31/2023 | $12,461 | $12,533 | $12,306 | $11,493 |
| 1/31/2024 | $12,458 | $12,469 | $12,304 | $11,462 |
| 2/29/2024 | $12,481 | $12,485 | $12,325 | $11,300 |
| 3/31/2024 | $12,491 | $12,485 | $12,346 | $11,404 |
| 4/30/2024 | $12,342 | $12,330 | $12,197 | $11,116 |
| 5/31/2024 | $12,365 | $12,294 | $12,217 | $11,304 |
| 6/30/2024 | $12,561 | $12,482 | $12,433 | $11,412 |
| 7/31/2024 | $12,671 | $12,596 | $12,536 | $11,678 |
| 8/31/2024 | $12,731 | $12,696 | $12,620 | $11,846 |
| 9/30/2024 | $12,892 | $12,821 | $12,761 | $12,004 |
The Fund’s benchmarks are unmanaged indices used as a general measure of market performance. Calculations assume the reinvestment of dividends and capital gains.
Average Annual Total Returns (%)
| 1 Year | 5 Years | 10 Years |
|---|
| Class F at NAV | 11.89% | 0.79% | 2.57% |
| Bloomberg Municipal Bond Index | 10.37% | 1.39% | 2.52% |
| Lipper California Municipal Debt Funds Average | 11.91% | 1.06% | 2.47% |
Bloomberg Aggregate Bond IndexFootnote Reference* | 11.57% | 0.33% | 1.84% |
| Footnote | Description |
Footnote* | The Fund has adopted the Bloomberg Aggregate Bond Index as its broad-based securities market index. |
The Fund's past performance is no guarantee of future results. The returns do not reflect the deduction of taxes that a shareholder would pay on Fund distributions or redemption of Fund shares.
(as of September 30, 2024)
| Total Net Assets | $667,621,225 |
| # of Portfolio Holdings | 274 |
| Portfolio Turnover Rate | 26% |
| Total Advisory Fees Paid | $2,699,455 |
What did the Fund invest in?
(as of September 30, 2024)
Credit Rating S&P or Moody'sFootnote Reference(a) | %Footnote Reference** |
|---|
| |
- A12.21%
- A-7.22%
- A+12.73%
- AA25.04%
- AA-10.22%
- AA+2.93%
- AAA0.17%
- B+0.07%
- BB2.47%
- BB-0.31%
- BB+3.20%
- BBB4.70%
- BBB-3.58%
- BBB+6.68%
- CCC0.10%
- CCC-0.08%
- NR8.29%
- Total 100.00%
| Footnote | Description |
Footnote** | Represents percent of total investments, which excludes derivatives. |
Footnote(a) | Investments in investment grade municipal bonds, which as bonds that are rated, at the time of purchase, within the four highest grades assigned by an independent rating agency such as Moody’s, S&P, or Fitch, or an equivalent short-term rating, as applicable, or are unrated by rating agencies but deemed by Lord Abbett to be of comparable quality. Lower rated municipal bonds are rated, at the time of purchase, or an equivalent short-term rating, as applicable, by an independent rating agency or are unrated by rating agencies but deemed by Lord Abbett to be of comparable quality. |
There were no material fund changes during the period.
Where can I find additional information about the Fund?
For additional information about the Fund, including its Prospectus, Statement of Additional Information, financial statements, holdings and proxy information, please visit lordabbett.com/FundDocuments.
The Fund has adopted a policy that allows it to send only one copy of the Fund's prospectus, proxy material, annual report and semiannual report (or related notice of internet availability of annual report and semiannual report) to certain shareholders residing at the same "household." This reduces Fund expenses, which benefits you and other shareholders.If you need additional copies or do not want your mailings to be "householded," please call Lord Abbett at 888-522-2388.
Lord Abbett California Tax Free Fund
Annual Shareholder Report
September 30, 2024
lordabbett.com/FundDocuments
TSR-A-1030-F
11/24
Lord Abbett California Tax Free Fund
Annual Shareholder Report
September 30, 2024
lordabbett.com/FundDocuments
This annual shareholder report contains important information about the Lord Abbett California Tax Free Fund for the period of October 1, 2023 to September 30, 2024, as well as certain changes to the Fund. You can find additional information about the Fund at lordabbett.com/FundDocuments. You can also request this information by contacting us at 888-522-2388.
What were the Fund costs for the last year?
(based on a hypothetical $10,000 investment)
| Class Name | Costs of a $10,000 investment | Costs paid as a percentage of a $10,000 investment |
|---|
| Class F3 | $57 | 0.54% |
How did the Fund perform last year and what affected its performance?
For the fiscal year ended September 30, 2024, the Fund returned 12.04%, reflecting performance at the net asset value (NAV) of Class F3 shares, compared to the 10.37% of a securities market index with investment characteristics similar to those of the Fund, the Bloomberg Municipal Bond Index. The Fund's broad-based market index, the Bloomberg Aggregate Bond Index, returned 11.57% over the same period.
Positive factors for the municipal market included decreasing Treasury yields, easing inflationary pressures and the start of interest rate cuts by the U.S. Federal Reserve. Also supporting the market was increased demand for municipal bond funds and a strong fundamental backdrop as evidenced by growing tax revenue and positive ratings actions by public ratings agencies. Negative factors included a significant increase in municipal bond supply, which pressured the market in second half of the fiscal year, and periods of interest rate volatility driven by sticky inflation readings at points throughout the fiscal year. Against this backdrop, municipal bonds delivered strong returns.
Top contributors to the Fund’s performance: The Fund’s longer duration positioning contributed to relative performance with the fall in rates over the period. An overweight allocation to BBB-rated and non-investment grade bonds contributed to relative performance. An overweight allocation to the Tobacco and Industrial Development sectors contributed to relative performance.
Top detractors from the Fund’s performance: Security selection within the Transportation, Local General Obligation and Education sectors detracted from relative performance.
Total Return Based on $10,000 Investment

| Class F3 | Bloomberg Municipal Bond Index | Lipper California Municipal Debt Funds Average | Bloomberg Aggregate Bond Index |
|---|
| 4/4/2017 | $10,000 | $10,000 | $10,000 | $10,000 |
| 4/30/2017 | $10,071 | $10,060 | $10,130 | $10,051 |
| 5/31/2017 | $10,230 | $10,219 | $10,293 | $10,128 |
| 6/30/2017 | $10,230 | $10,183 | $10,280 | $10,118 |
| 7/31/2017 | $10,295 | $10,265 | $10,341 | $10,162 |
| 8/31/2017 | $10,388 | $10,343 | $10,427 | $10,253 |
| 9/30/2017 | $10,330 | $10,291 | $10,379 | $10,204 |
| 10/31/2017 | $10,358 | $10,316 | $10,396 | $10,210 |
| 11/30/2017 | $10,348 | $10,260 | $10,377 | $10,197 |
| 12/31/2017 | $10,470 | $10,368 | $10,487 | $10,244 |
| 1/31/2018 | $10,346 | $10,246 | $10,371 | $10,126 |
| 2/28/2018 | $10,308 | $10,215 | $10,324 | $10,030 |
| 3/31/2018 | $10,384 | $10,253 | $10,374 | $10,094 |
| 4/30/2018 | $10,345 | $10,216 | $10,341 | $10,019 |
| 5/31/2018 | $10,488 | $10,333 | $10,474 | $10,091 |
| 6/30/2018 | $10,507 | $10,342 | $10,485 | $10,078 |
| 7/31/2018 | $10,517 | $10,367 | $10,500 | $10,080 |
| 8/31/2018 | $10,565 | $10,394 | $10,529 | $10,145 |
| 9/30/2018 | $10,477 | $10,326 | $10,455 | $10,080 |
| 10/31/2018 | $10,370 | $10,263 | $10,357 | $10,000 |
| 11/30/2018 | $10,448 | $10,376 | $10,439 | $10,060 |
| 12/31/2018 | $10,546 | $10,501 | $10,543 | $10,245 |
| 1/31/2019 | $10,614 | $10,580 | $10,601 | $10,354 |
| 2/28/2019 | $10,685 | $10,637 | $10,658 | $10,348 |
| 3/31/2019 | $10,903 | $10,805 | $10,846 | $10,546 |
| 4/30/2019 | $10,991 | $10,845 | $10,898 | $10,549 |
| 5/31/2019 | $11,169 | $10,995 | $11,071 | $10,736 |
| 6/30/2019 | $11,218 | $11,035 | $11,113 | $10,871 |
| 7/31/2019 | $11,306 | $11,124 | $11,194 | $10,895 |
| 8/31/2019 | $11,564 | $11,300 | $11,401 | $11,177 |
| 9/30/2019 | $11,481 | $11,209 | $11,325 | $11,118 |
| 10/31/2019 | $11,488 | $11,229 | $11,328 | $11,151 |
| 11/30/2019 | $11,515 | $11,257 | $11,354 | $11,146 |
| 12/31/2019 | $11,562 | $11,292 | $11,382 | $11,138 |
| 1/31/2020 | $11,822 | $11,495 | $11,599 | $11,352 |
| 2/29/2020 | $12,041 | $11,643 | $11,782 | $11,557 |
| 3/31/2020 | $11,233 | $11,221 | $11,118 | $11,489 |
| 4/30/2020 | $10,973 | $11,080 | $10,897 | $11,693 |
| 5/31/2020 | $11,409 | $11,432 | $11,280 | $11,747 |
| 6/30/2020 | $11,610 | $11,526 | $11,440 | $11,821 |
| 7/31/2020 | $11,851 | $11,720 | $11,646 | $11,998 |
| 8/31/2020 | $11,804 | $11,665 | $11,597 | $11,901 |
| 9/30/2020 | $11,788 | $11,668 | $11,597 | $11,894 |
| 10/31/2020 | $11,772 | $11,633 | $11,577 | $11,841 |
| 11/30/2020 | $12,027 | $11,808 | $11,796 | $11,958 |
| 12/31/2020 | $12,125 | $11,880 | $11,883 | $11,974 |
| 1/31/2021 | $12,233 | $11,956 | $11,978 | $11,888 |
| 2/28/2021 | $11,998 | $11,766 | $11,777 | $11,716 |
| 3/31/2021 | $12,086 | $11,839 | $11,860 | $11,570 |
| 4/30/2021 | $12,247 | $11,938 | $11,990 | $11,662 |
| 5/31/2021 | $12,324 | $11,974 | $12,067 | $11,700 |
| 6/30/2021 | $12,391 | $12,007 | $12,120 | $11,782 |
| 7/31/2021 | $12,500 | $12,106 | $12,223 | $11,914 |
| 8/31/2021 | $12,440 | $12,062 | $12,170 | $11,891 |
| 9/30/2021 | $12,306 | $11,975 | $12,058 | $11,788 |
| 10/31/2021 | $12,287 | $11,940 | $12,045 | $11,785 |
| 11/30/2021 | $12,439 | $12,041 | $12,161 | $11,820 |
| 12/31/2021 | $12,463 | $12,061 | $12,178 | $11,789 |
| 1/31/2022 | $12,038 | $11,731 | $11,834 | $11,535 |
| 2/28/2022 | $11,945 | $11,688 | $11,758 | $11,407 |
| 3/31/2022 | $11,466 | $11,310 | $11,358 | $11,090 |
| 4/30/2022 | $10,955 | $10,997 | $10,954 | $10,669 |
| 5/31/2022 | $11,131 | $11,160 | $11,112 | $10,738 |
| 6/30/2022 | $10,769 | $10,977 | $10,807 | $10,569 |
| 7/31/2022 | $11,173 | $11,267 | $11,160 | $10,828 |
| 8/31/2022 | $10,875 | $11,020 | $10,895 | $10,522 |
| 9/30/2022 | $10,337 | $10,597 | $10,399 | $10,067 |
| 10/31/2022 | $10,190 | $10,509 | $10,268 | $9,937 |
| 11/30/2022 | $10,829 | $11,001 | $10,836 | $10,302 |
| 12/31/2022 | $10,835 | $11,032 | $10,837 | $10,256 |
| 1/31/2023 | $11,225 | $11,349 | $11,189 | $10,571 |
| 2/28/2023 | $10,935 | $11,093 | $10,908 | $10,298 |
| 3/31/2023 | $11,141 | $11,339 | $11,098 | $10,559 |
| 4/30/2023 | $11,160 | $11,313 | $11,100 | $10,623 |
| 5/31/2023 | $11,079 | $11,215 | $11,022 | $10,508 |
| 6/30/2023 | $11,211 | $11,327 | $11,105 | $10,470 |
| 7/31/2023 | $11,253 | $11,372 | $11,135 | $10,463 |
| 8/31/2023 | $11,072 | $11,208 | $10,991 | $10,396 |
| 9/30/2023 | $10,734 | $10,880 | $10,666 | $10,132 |
| 10/31/2023 | $10,542 | $10,787 | $10,478 | $9,972 |
| 11/30/2023 | $11,286 | $11,472 | $11,208 | $10,424 |
| 12/31/2023 | $11,613 | $11,739 | $11,511 | $10,823 |
| 1/31/2024 | $11,600 | $11,679 | $11,509 | $10,793 |
| 2/29/2024 | $11,623 | $11,694 | $11,528 | $10,640 |
| 3/31/2024 | $11,633 | $11,693 | $11,548 | $10,739 |
| 4/30/2024 | $11,496 | $11,548 | $11,409 | $10,467 |
| 5/31/2024 | $11,518 | $11,515 | $11,427 | $10,645 |
| 6/30/2024 | $11,714 | $11,691 | $11,629 | $10,746 |
| 7/31/2024 | $11,817 | $11,798 | $11,726 | $10,997 |
| 8/31/2024 | $11,875 | $11,891 | $11,804 | $11,155 |
| 9/30/2024 | $12,026 | $12,008 | $11,936 | $11,304 |
The Fund’s benchmarks are unmanaged indices used as a general measure of market performance. Calculations assume the reinvestment of dividends and capital gains.
Average Annual Total Returns (%)
| 1 Year | 5 Years | Since Inception 4/4/17 |
|---|
| Class F3 at NAV | 12.04% | 0.93% | 2.49% |
| Bloomberg Municipal Bond Index | 10.37% | 1.39% | 2.47% |
| Lipper California Municipal Debt Funds Average | 11.91% | 1.06% | 2.39% |
Bloomberg Aggregate Bond IndexFootnote Reference* | 11.57% | 0.33% | 1.65% |
| Footnote | Description |
Footnote* | The Fund has adopted the Bloomberg Aggregate Bond Index as its broad-based securities market index. |
The Fund's past performance is no guarantee of future results. The returns do not reflect the deduction of taxes that a shareholder would pay on Fund distributions or redemption of Fund shares.
(as of September 30, 2024)
| Total Net Assets | $667,621,225 |
| # of Portfolio Holdings | 274 |
| Portfolio Turnover Rate | 26% |
| Total Advisory Fees Paid | $2,699,455 |
What did the Fund invest in?
(as of September 30, 2024)
Credit Rating S&P or Moody'sFootnote Reference(a) | %Footnote Reference** |
|---|
| |
- A12.21%
- A-7.22%
- A+12.73%
- AA25.04%
- AA-10.22%
- AA+2.93%
- AAA0.17%
- B+0.07%
- BB2.47%
- BB-0.31%
- BB+3.20%
- BBB4.70%
- BBB-3.58%
- BBB+6.68%
- CCC0.10%
- CCC-0.08%
- NR8.29%
- Total 100.00%
| Footnote | Description |
Footnote** | Represents percent of total investments, which excludes derivatives. |
Footnote(a) | Investments in investment grade municipal bonds, which as bonds that are rated, at the time of purchase, within the four highest grades assigned by an independent rating agency such as Moody’s, S&P, or Fitch, or an equivalent short-term rating, as applicable, or are unrated by rating agencies but deemed by Lord Abbett to be of comparable quality. Lower rated municipal bonds are rated, at the time of purchase, or an equivalent short-term rating, as applicable, by an independent rating agency or are unrated by rating agencies but deemed by Lord Abbett to be of comparable quality. |
There were no material fund changes during the period.
Where can I find additional information about the Fund?
For additional information about the Fund, including its Prospectus, Statement of Additional Information, financial statements, holdings and proxy information, please visit lordabbett.com/FundDocuments.
The Fund has adopted a policy that allows it to send only one copy of the Fund's prospectus, proxy material, annual report and semiannual report (or related notice of internet availability of annual report and semiannual report) to certain shareholders residing at the same "household." This reduces Fund expenses, which benefits you and other shareholders.If you need additional copies or do not want your mailings to be "householded," please call Lord Abbett at 888-522-2388.
Lord Abbett California Tax Free Fund
Annual Shareholder Report
September 30, 2024
lordabbett.com/FundDocuments
TSR-A-8985-F3
11/24
Lord Abbett California Tax Free Fund
Annual Shareholder Report
September 30, 2024
lordabbett.com/FundDocuments
This annual shareholder report contains important information about the Lord Abbett California Tax Free Fund for the period of October 1, 2023 to September 30, 2024, as well as certain changes to the Fund. You can find additional information about the Fund at lordabbett.com/FundDocuments. You can also request this information by contacting us at 888-522-2388.
What were the Fund costs for the last year?
(based on a hypothetical $10,000 investment)
| Class Name | Costs of a $10,000 investment | Costs paid as a percentage of a $10,000 investment |
|---|
| Class I | $60 | 0.57% |
How did the Fund perform last year and what affected its performance?
For the fiscal year ended September 30, 2024, the Fund returned 12.01%, reflecting performance at the net asset value (NAV) of Class I shares, compared to the 10.37% of a securities market index with investment characteristics similar to those of the Fund, the Bloomberg Municipal Bond Index. The Fund's broad-based market index, the Bloomberg Aggregate Bond Index, returned 11.57% over the same period.
Positive factors for the municipal market included decreasing Treasury yields, easing inflationary pressures and the start of interest rate cuts by the U.S. Federal Reserve. Also supporting the market was increased demand for municipal bond funds and a strong fundamental backdrop as evidenced by growing tax revenue and positive ratings actions by public ratings agencies. Negative factors included a significant increase in municipal bond supply, which pressured the market in second half of the fiscal year, and periods of interest rate volatility driven by sticky inflation readings at points throughout the fiscal year. Against this backdrop, municipal bonds delivered strong returns.
Top contributors to the Fund’s performance: The Fund’s longer duration positioning contributed to relative performance with the fall in rates over the period. An overweight allocation to BBB-rated and non-investment grade bonds contributed to relative performance. An overweight allocation to the Tobacco and Industrial Development sectors contributed to relative performance.
Top detractors from the Fund’s performance: Security selection within the Transportation, Local General Obligation and Education sectors detracted from relative performance.
Total Return Based on $10,000 Investment
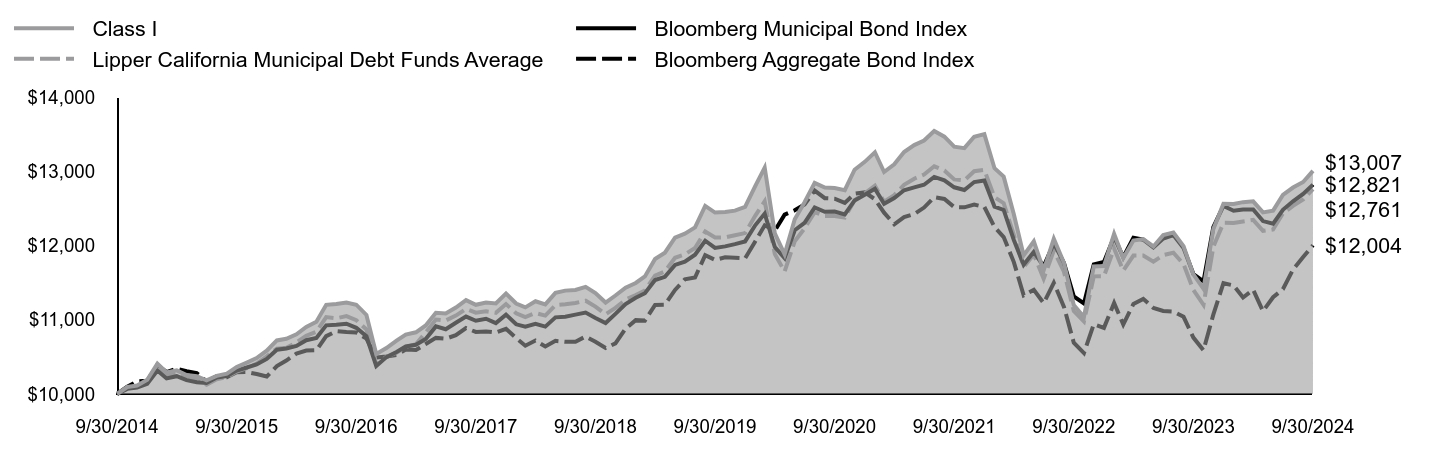
| Class I | Bloomberg Municipal Bond Index | Lipper California Municipal Debt Funds Average | Bloomberg Aggregate Bond Index |
|---|
| 9/30/2014 | $10,000 | $10,000 | $10,000 | $10,000 |
| 10/31/2014 | $10,094 | $10,069 | $10,080 | $10,098 |
| 11/30/2014 | $10,115 | $10,086 | $10,093 | $10,170 |
| 12/31/2014 | $10,192 | $10,137 | $10,163 | $10,179 |
| 1/31/2015 | $10,408 | $10,316 | $10,356 | $10,393 |
| 2/28/2015 | $10,289 | $10,210 | $10,248 | $10,295 |
| 3/31/2015 | $10,319 | $10,240 | $10,282 | $10,343 |
| 4/30/2015 | $10,256 | $10,186 | $10,215 | $10,306 |
| 5/31/2015 | $10,239 | $10,158 | $10,191 | $10,281 |
| 6/30/2015 | $10,185 | $10,148 | $10,126 | $10,169 |
| 7/31/2015 | $10,244 | $10,222 | $10,199 | $10,240 |
| 8/31/2015 | $10,275 | $10,242 | $10,230 | $10,225 |
| 9/30/2015 | $10,363 | $10,316 | $10,303 | $10,294 |
| 10/31/2015 | $10,423 | $10,357 | $10,350 | $10,296 |
| 11/30/2015 | $10,484 | $10,398 | $10,409 | $10,269 |
| 12/31/2015 | $10,583 | $10,472 | $10,506 | $10,235 |
| 1/31/2016 | $10,722 | $10,596 | $10,612 | $10,376 |
| 2/29/2016 | $10,744 | $10,613 | $10,624 | $10,450 |
| 3/31/2016 | $10,805 | $10,647 | $10,694 | $10,546 |
| 4/30/2016 | $10,904 | $10,725 | $10,784 | $10,586 |
| 5/31/2016 | $10,974 | $10,754 | $10,839 | $10,589 |
| 6/30/2016 | $11,201 | $10,925 | $11,036 | $10,779 |
| 7/31/2016 | $11,213 | $10,932 | $11,021 | $10,847 |
| 8/31/2016 | $11,233 | $10,947 | $11,049 | $10,835 |
| 9/30/2016 | $11,203 | $10,892 | $10,995 | $10,829 |
| 10/31/2016 | $11,065 | $10,778 | $10,870 | $10,746 |
| 11/30/2016 | $10,539 | $10,376 | $10,394 | $10,492 |
| 12/31/2016 | $10,619 | $10,497 | $10,502 | $10,506 |
| 1/31/2017 | $10,720 | $10,567 | $10,558 | $10,527 |
| 2/28/2017 | $10,801 | $10,640 | $10,634 | $10,598 |
| 3/31/2017 | $10,831 | $10,663 | $10,671 | $10,592 |
| 4/30/2017 | $10,923 | $10,740 | $10,830 | $10,674 |
| 5/31/2017 | $11,094 | $10,911 | $11,004 | $10,756 |
| 6/30/2017 | $11,084 | $10,872 | $10,990 | $10,745 |
| 7/31/2017 | $11,165 | $10,960 | $11,056 | $10,792 |
| 8/31/2017 | $11,265 | $11,043 | $11,147 | $10,888 |
| 9/30/2017 | $11,202 | $10,987 | $11,096 | $10,836 |
| 10/31/2017 | $11,232 | $11,014 | $11,114 | $10,843 |
| 11/30/2017 | $11,221 | $10,955 | $11,094 | $10,829 |
| 12/31/2017 | $11,354 | $11,069 | $11,212 | $10,879 |
| 1/31/2018 | $11,219 | $10,939 | $11,088 | $10,753 |
| 2/28/2018 | $11,167 | $10,906 | $11,037 | $10,651 |
| 3/31/2018 | $11,249 | $10,947 | $11,091 | $10,720 |
| 4/30/2018 | $11,207 | $10,908 | $11,056 | $10,640 |
| 5/31/2018 | $11,362 | $11,033 | $11,198 | $10,716 |
| 6/30/2018 | $11,393 | $11,042 | $11,209 | $10,703 |
| 7/31/2018 | $11,402 | $11,069 | $11,226 | $10,705 |
| 8/31/2018 | $11,444 | $11,097 | $11,257 | $10,774 |
| 9/30/2018 | $11,359 | $11,025 | $11,177 | $10,705 |
| 10/31/2018 | $11,232 | $10,957 | $11,073 | $10,620 |
| 11/30/2018 | $11,327 | $11,079 | $11,160 | $10,683 |
| 12/31/2018 | $11,433 | $11,211 | $11,272 | $10,880 |
| 1/31/2019 | $11,496 | $11,296 | $11,333 | $10,995 |
| 2/28/2019 | $11,584 | $11,357 | $11,395 | $10,989 |
| 3/31/2019 | $11,819 | $11,536 | $11,595 | $11,200 |
| 4/30/2019 | $11,904 | $11,579 | $11,651 | $11,203 |
| 5/31/2019 | $12,108 | $11,739 | $11,836 | $11,402 |
| 6/30/2019 | $12,161 | $11,782 | $11,881 | $11,545 |
| 7/31/2019 | $12,245 | $11,877 | $11,967 | $11,570 |
| 8/31/2019 | $12,535 | $12,065 | $12,189 | $11,870 |
| 9/30/2019 | $12,445 | $11,968 | $12,108 | $11,807 |
| 10/31/2019 | $12,452 | $11,989 | $12,111 | $11,842 |
| 11/30/2019 | $12,471 | $12,019 | $12,139 | $11,836 |
| 12/31/2019 | $12,521 | $12,056 | $12,168 | $11,828 |
| 1/31/2020 | $12,802 | $12,273 | $12,401 | $12,056 |
| 2/29/2020 | $13,051 | $12,431 | $12,596 | $12,273 |
| 3/31/2020 | $12,164 | $11,980 | $11,886 | $12,201 |
| 4/30/2020 | $11,883 | $11,830 | $11,650 | $12,417 |
| 5/31/2020 | $12,354 | $12,206 | $12,059 | $12,475 |
| 6/30/2020 | $12,583 | $12,307 | $12,230 | $12,554 |
| 7/31/2020 | $12,844 | $12,514 | $12,451 | $12,741 |
| 8/31/2020 | $12,782 | $12,455 | $12,398 | $12,638 |
| 9/30/2020 | $12,775 | $12,458 | $12,398 | $12,632 |
| 10/31/2020 | $12,747 | $12,420 | $12,377 | $12,575 |
| 11/30/2020 | $13,022 | $12,608 | $12,611 | $12,699 |
| 12/31/2020 | $13,128 | $12,685 | $12,704 | $12,716 |
| 1/31/2021 | $13,257 | $12,765 | $12,806 | $12,625 |
| 2/28/2021 | $12,991 | $12,563 | $12,591 | $12,443 |
| 3/31/2021 | $13,096 | $12,640 | $12,680 | $12,287 |
| 4/30/2021 | $13,260 | $12,746 | $12,818 | $12,384 |
| 5/31/2021 | $13,354 | $12,784 | $12,901 | $12,425 |
| 6/30/2021 | $13,415 | $12,819 | $12,958 | $12,512 |
| 7/31/2021 | $13,544 | $12,925 | $13,068 | $12,652 |
| 8/31/2021 | $13,467 | $12,878 | $13,011 | $12,628 |
| 9/30/2021 | $13,333 | $12,785 | $12,891 | $12,518 |
| 10/31/2021 | $13,313 | $12,748 | $12,877 | $12,515 |
| 11/30/2021 | $13,466 | $12,856 | $13,001 | $12,552 |
| 12/31/2021 | $13,502 | $12,877 | $13,019 | $12,520 |
| 1/31/2022 | $13,042 | $12,525 | $12,652 | $12,250 |
| 2/28/2022 | $12,929 | $12,480 | $12,571 | $12,114 |
| 3/31/2022 | $12,422 | $12,075 | $12,143 | $11,777 |
| 4/30/2022 | $11,868 | $11,741 | $11,711 | $11,330 |
| 5/31/2022 | $12,058 | $11,916 | $11,880 | $11,403 |
| 6/30/2022 | $11,666 | $11,720 | $11,554 | $11,224 |
| 7/31/2022 | $12,092 | $12,030 | $11,931 | $11,498 |
| 8/31/2022 | $11,768 | $11,766 | $11,648 | $11,174 |
| 9/30/2022 | $11,197 | $11,315 | $11,118 | $10,691 |
| 10/31/2022 | $11,038 | $11,221 | $10,977 | $10,552 |
| 11/30/2022 | $11,718 | $11,746 | $11,585 | $10,940 |
| 12/31/2022 | $11,724 | $11,779 | $11,586 | $10,891 |
| 1/31/2023 | $12,158 | $12,117 | $11,962 | $11,226 |
| 2/28/2023 | $11,832 | $11,843 | $11,662 | $10,936 |
| 3/31/2023 | $12,067 | $12,106 | $11,865 | $11,214 |
| 4/30/2023 | $12,087 | $12,079 | $11,867 | $11,282 |
| 5/31/2023 | $11,988 | $11,974 | $11,784 | $11,159 |
| 6/30/2023 | $12,141 | $12,094 | $11,872 | $11,119 |
| 7/31/2023 | $12,175 | $12,142 | $11,904 | $11,111 |
| 8/31/2023 | $11,991 | $11,967 | $11,750 | $11,040 |
| 9/30/2023 | $11,613 | $11,616 | $11,403 | $10,760 |
| 10/31/2023 | $11,416 | $11,517 | $11,202 | $10,590 |
| 11/30/2023 | $12,221 | $12,249 | $11,982 | $11,069 |
| 12/31/2023 | $12,563 | $12,533 | $12,306 | $11,493 |
| 1/31/2024 | $12,561 | $12,469 | $12,304 | $11,462 |
| 2/29/2024 | $12,585 | $12,485 | $12,325 | $11,300 |
| 3/31/2024 | $12,596 | $12,485 | $12,346 | $11,404 |
| 4/30/2024 | $12,447 | $12,330 | $12,197 | $11,116 |
| 5/31/2024 | $12,471 | $12,294 | $12,217 | $11,304 |
| 6/30/2024 | $12,682 | $12,482 | $12,433 | $11,412 |
| 7/31/2024 | $12,782 | $12,596 | $12,536 | $11,678 |
| 8/31/2024 | $12,856 | $12,696 | $12,620 | $11,846 |
| 9/30/2024 | $13,007 | $12,821 | $12,761 | $12,004 |
The Fund’s benchmarks are unmanaged indices used as a general measure of market performance. Calculations assume the reinvestment of dividends and capital gains.
Average Annual Total Returns (%)
| 1 Year | 5 Years | 10 Years |
|---|
| Class I at NAV | 12.01% | 0.89% | 2.66% |
| Bloomberg Municipal Bond Index | 10.37% | 1.39% | 2.52% |
| Lipper California Municipal Debt Funds Average | 11.91% | 1.06% | 2.47% |
Bloomberg Aggregate Bond IndexFootnote Reference* | 11.57% | 0.33% | 1.84% |
| Footnote | Description |
Footnote* | The Fund has adopted the Bloomberg Aggregate Bond Index as its broad-based securities market index. |
The Fund's past performance is no guarantee of future results. The returns do not reflect the deduction of taxes that a shareholder would pay on Fund distributions or redemption of Fund shares.
(as of September 30, 2024)
| Total Net Assets | $667,621,225 |
| # of Portfolio Holdings | 274 |
| Portfolio Turnover Rate | 26% |
| Total Advisory Fees Paid | $2,699,455 |
What did the Fund invest in?
(as of September 30, 2024)
Credit Rating S&P or Moody'sFootnote Reference(a) | %Footnote Reference** |
|---|
| |
- A12.21%
- A-7.22%
- A+12.73%
- AA25.04%
- AA-10.22%
- AA+2.93%
- AAA0.17%
- B+0.07%
- BB2.47%
- BB-0.31%
- BB+3.20%
- BBB4.70%
- BBB-3.58%
- BBB+6.68%
- CCC0.10%
- CCC-0.08%
- NR8.29%
- Total 100.00%
| Footnote | Description |
Footnote** | Represents percent of total investments, which excludes derivatives. |
Footnote(a) | Investments in investment grade municipal bonds, which as bonds that are rated, at the time of purchase, within the four highest grades assigned by an independent rating agency such as Moody’s, S&P, or Fitch, or an equivalent short-term rating, as applicable, or are unrated by rating agencies but deemed by Lord Abbett to be of comparable quality. Lower rated municipal bonds are rated, at the time of purchase, or an equivalent short-term rating, as applicable, by an independent rating agency or are unrated by rating agencies but deemed by Lord Abbett to be of comparable quality. |
There were no material fund changes during the period.
Where can I find additional information about the Fund?
For additional information about the Fund, including its Prospectus, Statement of Additional Information, financial statements, holdings and proxy information, please visit lordabbett.com/FundDocuments.
The Fund has adopted a policy that allows it to send only one copy of the Fund's prospectus, proxy material, annual report and semiannual report (or related notice of internet availability of annual report and semiannual report) to certain shareholders residing at the same "household." This reduces Fund expenses, which benefits you and other shareholders.If you need additional copies or do not want your mailings to be "householded," please call Lord Abbett at 888-522-2388.
Lord Abbett California Tax Free Fund
Annual Shareholder Report
September 30, 2024
lordabbett.com/FundDocuments
TSR-A-3325-I
11/24
Lord Abbett Intermediate Tax Free Fund
Annual Shareholder Report
September 30, 2024
lordabbett.com/FundDocuments
This annual shareholder report contains important information about the Lord Abbett Intermediate Tax Free Fund for the period of October 1, 2023 to September 30, 2024, as well as certain changes to the Fund. You can find additional information about the Fund at lordabbett.com/FundDocuments. You can also request this information by contacting us at 888-522-2388.
What were the Fund costs for the last year?
(based on a hypothetical $10,000 investment)
| Class Name | Costs of a $10,000 investment | Costs paid as a percentage of a $10,000 investment |
|---|
| Class A | $74 | 0.71% |
How did the Fund perform last year and what affected its performance?
For the fiscal year ended September 30, 2024, the Fund returned 9.80%, reflecting performance at the net asset value (NAV) of Class A shares, compared to the 8.47% of a securities market index with investment characteristics similar to those of the Fund, the Bloomberg 1-15 Year Municipal Bond Index. The Fund's broad-based market index, the Bloomberg Aggregate Bond Index, returned 11.57% over the same period.
Positive factors for the municipal market included decreasing Treasury yields, easing inflationary pressures and the start of interest rate cuts by the U.S. Federal Reserve. Also supporting the market was increased demand for municipal bond funds and a strong fundamental backdrop as evidenced by growing tax revenue and positive ratings actions by public ratings agencies. Negative factors included a significant increase in municipal bond supply, which pressured the market in second half of the fiscal year, and periods of interest rate volatility driven by sticky inflation readings at points throughout the fiscal year. Against this backdrop, municipal bonds delivered strong returns.
Top contributors to the Fund’s performance: An overweight allocation to BBB-rated and non-investment grade bonds contributed to relative performance. The Fund’s longer duration positioning relative to the prospectus benchmark led to a positive impact as yields fell over the period. An overweight allocation to the Health Care, Industrial Development and Transportation sectors contributed to relative performance. Security selection within the Transportation, Health Care and State General Obligation sectors contributed to relative performance.
Top detractors from the Fund’s performance: There were no significant detractors over the period.
Total Return Based on $10,000 Investment
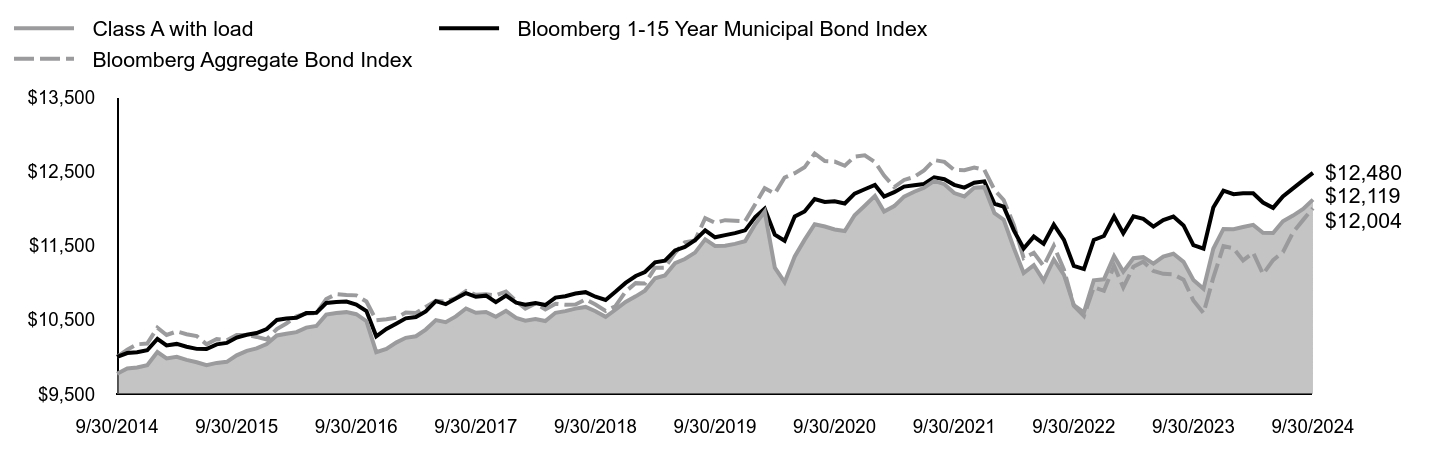
| Class A with load | Bloomberg 1-15 Year Municipal Bond Index | Bloomberg Aggregate Bond Index |
|---|
| 9/30/2014 | $9,774 | $10,000 | $10,000 |
| 10/31/2014 | $9,843 | $10,052 | $10,098 |
| 11/30/2014 | $9,857 | $10,063 | $10,170 |
| 12/31/2014 | $9,889 | $10,090 | $10,179 |
| 1/31/2015 | $10,066 | $10,243 | $10,393 |
| 2/28/2015 | $9,980 | $10,154 | $10,295 |
| 3/31/2015 | $10,002 | $10,175 | $10,343 |
| 4/30/2015 | $9,960 | $10,137 | $10,306 |
| 5/31/2015 | $9,928 | $10,108 | $10,281 |
| 6/30/2015 | $9,887 | $10,107 | $10,169 |
| 7/31/2015 | $9,919 | $10,169 | $10,240 |
| 8/31/2015 | $9,933 | $10,188 | $10,225 |
| 9/30/2015 | $10,021 | $10,261 | $10,294 |
| 10/31/2015 | $10,081 | $10,299 | $10,296 |
| 11/30/2015 | $10,114 | $10,321 | $10,269 |
| 12/31/2015 | $10,172 | $10,375 | $10,235 |
| 1/31/2016 | $10,289 | $10,498 | $10,376 |
| 2/29/2016 | $10,312 | $10,517 | $10,450 |
| 3/31/2016 | $10,334 | $10,527 | $10,546 |
| 4/30/2016 | $10,394 | $10,590 | $10,586 |
| 5/31/2016 | $10,416 | $10,595 | $10,589 |
| 6/30/2016 | $10,570 | $10,726 | $10,779 |
| 7/31/2016 | $10,592 | $10,741 | $10,847 |
| 8/31/2016 | $10,603 | $10,745 | $10,835 |
| 9/30/2016 | $10,575 | $10,706 | $10,829 |
| 10/31/2016 | $10,481 | $10,618 | $10,746 |
| 11/30/2016 | $10,063 | $10,277 | $10,492 |
| 12/31/2016 | $10,106 | $10,376 | $10,506 |
| 1/31/2017 | $10,196 | $10,450 | $10,527 |
| 2/28/2017 | $10,257 | $10,519 | $10,598 |
| 3/31/2017 | $10,278 | $10,537 | $10,592 |
| 4/30/2017 | $10,368 | $10,612 | $10,674 |
| 5/31/2017 | $10,495 | $10,751 | $10,756 |
| 6/30/2017 | $10,467 | $10,710 | $10,745 |
| 7/31/2017 | $10,545 | $10,788 | $10,792 |
| 8/31/2017 | $10,652 | $10,860 | $10,888 |
| 9/30/2017 | $10,595 | $10,810 | $10,836 |
| 10/31/2017 | $10,606 | $10,825 | $10,843 |
| 11/30/2017 | $10,540 | $10,737 | $10,829 |
| 12/31/2017 | $10,620 | $10,826 | $10,879 |
| 1/31/2018 | $10,524 | $10,731 | $10,753 |
| 2/28/2018 | $10,488 | $10,704 | $10,651 |
| 3/31/2018 | $10,510 | $10,727 | $10,720 |
| 4/30/2018 | $10,483 | $10,699 | $10,640 |
| 5/31/2018 | $10,594 | $10,799 | $10,716 |
| 6/30/2018 | $10,617 | $10,818 | $10,703 |
| 7/31/2018 | $10,650 | $10,853 | $10,705 |
| 8/31/2018 | $10,673 | $10,872 | $10,774 |
| 9/30/2018 | $10,616 | $10,811 | $10,705 |
| 10/31/2018 | $10,540 | $10,767 | $10,620 |
| 11/30/2018 | $10,635 | $10,877 | $10,683 |
| 12/31/2018 | $10,740 | $10,997 | $10,880 |
| 1/31/2019 | $10,816 | $11,090 | $10,995 |
| 2/28/2019 | $10,893 | $11,144 | $10,989 |
| 3/31/2019 | $11,060 | $11,274 | $11,200 |
| 4/30/2019 | $11,096 | $11,296 | $11,203 |
| 5/31/2019 | $11,263 | $11,434 | $11,402 |
| 6/30/2019 | $11,319 | $11,481 | $11,545 |
| 7/31/2019 | $11,405 | $11,571 | $11,570 |
| 8/31/2019 | $11,583 | $11,706 | $11,870 |
| 9/30/2019 | $11,495 | $11,611 | $11,807 |
| 10/31/2019 | $11,498 | $11,641 | $11,842 |
| 11/30/2019 | $11,523 | $11,668 | $11,836 |
| 12/31/2019 | $11,558 | $11,705 | $11,828 |
| 1/31/2020 | $11,788 | $11,884 | $12,056 |
| 2/29/2020 | $11,958 | $11,996 | $12,273 |
| 3/31/2020 | $11,202 | $11,646 | $12,201 |
| 4/30/2020 | $11,007 | $11,564 | $12,417 |
| 5/31/2020 | $11,354 | $11,891 | $12,475 |
| 6/30/2020 | $11,576 | $11,960 | $12,554 |
| 7/31/2020 | $11,787 | $12,128 | $12,741 |
| 8/31/2020 | $11,757 | $12,088 | $12,638 |
| 9/30/2020 | $11,716 | $12,098 | $12,632 |
| 10/31/2020 | $11,696 | $12,067 | $12,575 |
| 11/30/2020 | $11,909 | $12,200 | $12,699 |
| 12/31/2020 | $12,037 | $12,259 | $12,716 |
| 1/31/2021 | $12,169 | $12,317 | $12,625 |
| 2/28/2021 | $11,958 | $12,161 | $12,443 |
| 3/31/2021 | $12,032 | $12,219 | $12,287 |
| 4/30/2021 | $12,160 | $12,295 | $12,384 |
| 5/31/2021 | $12,225 | $12,313 | $12,425 |
| 6/30/2021 | $12,278 | $12,329 | $12,512 |
| 7/31/2021 | $12,372 | $12,419 | $12,652 |
| 8/31/2021 | $12,327 | $12,394 | $12,628 |
| 9/30/2021 | $12,207 | $12,318 | $12,518 |
| 10/31/2021 | $12,162 | $12,281 | $12,515 |
| 11/30/2021 | $12,278 | $12,347 | $12,552 |
| 12/31/2021 | $12,287 | $12,365 | $12,520 |
| 1/31/2022 | $11,937 | $12,063 | $12,250 |
| 2/28/2022 | $11,849 | $12,025 | $12,114 |
| 3/31/2022 | $11,467 | $11,705 | $11,777 |
| 4/30/2022 | $11,129 | $11,460 | $11,330 |
| 5/31/2022 | $11,237 | $11,621 | $11,403 |
| 6/30/2022 | $11,029 | $11,524 | $11,224 |
| 7/31/2022 | $11,313 | $11,781 | $11,498 |
| 8/31/2022 | $11,104 | $11,577 | $11,174 |
| 9/30/2022 | $10,698 | $11,226 | $10,691 |
| 10/31/2022 | $10,600 | $11,183 | $10,552 |
| 11/30/2022 | $11,032 | $11,575 | $10,940 |
| 12/31/2022 | $11,045 | $11,629 | $10,891 |
| 1/31/2023 | $11,357 | $11,891 | $11,226 |
| 2/28/2023 | $11,149 | $11,667 | $10,936 |
| 3/31/2023 | $11,330 | $11,893 | $11,214 |
| 4/30/2023 | $11,344 | $11,860 | $11,282 |
| 5/31/2023 | $11,257 | $11,755 | $11,159 |
| 6/30/2023 | $11,352 | $11,844 | $11,119 |
| 7/31/2023 | $11,389 | $11,891 | $11,111 |
| 8/31/2023 | $11,281 | $11,771 | $11,040 |
| 9/30/2023 | $11,037 | $11,506 | $10,760 |
| 10/31/2023 | $10,918 | $11,459 | $10,590 |
| 11/30/2023 | $11,457 | $12,013 | $11,069 |
| 12/31/2023 | $11,724 | $12,240 | $11,493 |
| 1/31/2024 | $11,719 | $12,193 | $11,462 |
| 2/29/2024 | $11,750 | $12,205 | $11,300 |
| 3/31/2024 | $11,779 | $12,205 | $11,404 |
| 4/30/2024 | $11,673 | $12,080 | $11,116 |
| 5/31/2024 | $11,669 | $12,008 | $11,304 |
| 6/30/2024 | $11,827 | $12,163 | $11,412 |
| 7/31/2024 | $11,904 | $12,271 | $11,678 |
| 8/31/2024 | $11,993 | $12,379 | $11,846 |
| 9/30/2024 | $12,119 | $12,480 | $12,004 |
The Fund’s benchmarks are unmanaged indices used as a general measure of market performance. Calculations assume the reinvestment of dividends and capital gains.
Average Annual Total Returns (%)
| 1 Year | 5 Years | 10 Years |
|---|
| Class A at NAV | 9.80% | 1.06% | 2.17% |
| Class A with sales charge | 7.38% | 0.60% | 1.94% |
| Bloomberg 1-15 Year Municipal Bond Index | 8.47% | 1.45% | 2.24% |
Bloomberg Aggregate Bond IndexFootnote Reference* | 11.57% | 0.33% | 1.84% |
| Footnote | Description |
Footnote* | The Fund has adopted the Bloomberg Aggregate Bond Index as its broad-based securities market index. |
The Fund's past performance is no guarantee of future results. The returns do not reflect the deduction of taxes that a shareholder would pay on Fund distributions or redemption of Fund shares.
(as of September 30, 2024)
| Total Net Assets | $4,957,534,804 |
| # of Portfolio Holdings | 886 |
| Portfolio Turnover Rate | 49% |
| Total Advisory Fees Paid | $18,635,236 |
What did the Fund invest in?
(as of September 30, 2024)
Credit Rating S&P or Moody'sFootnote Reference(a) | %Footnote Reference** |
|---|
| |
- A11.96%
- A-8.12%
- A+12.71%
- AA11.41%
- AA-8.70%
- AA+6.09%
- AAA4.90%
- B0.39%
- B-0.16%
- B+0.51%
- BB1.36%
- BB-1.25%
- BB+2.47%
- BBB5.69%
- BBB-7.74%
- BBB+7.91%
- NR8.63%
- Total 100.00%
| Footnote | Description |
Footnote** | Represents percent of total investments, which excludes derivatives. |
Footnote(a) | Investments in investment grade municipal bonds, which as bonds that are rated, at the time of purchase, within the four highest grades assigned by an independent rating agency such as Moody’s, S&P, or Fitch, or an equivalent short-term rating, as applicable, or are unrated by rating agencies but deemed by Lord Abbett to be of comparable quality. Lower rated municipal bonds are rated, at the time of purchase, or an equivalent short-term rating, as applicable, by an independent rating agency or are unrated by rating agencies but deemed by Lord Abbett to be of comparable quality. |
There were no material fund changes during the period.
Where can I find additional information about the Fund?
For additional information about the Fund, including its Prospectus, Statement of Additional Information, financial statements, holdings and proxy information, please visit lordabbett.com/FundDocuments.
The Fund has adopted a policy that allows it to send only one copy of the Fund's prospectus, proxy material, annual report and semiannual report (or related notice of internet availability of annual report and semiannual report) to certain shareholders residing at the same "household." This reduces Fund expenses, which benefits you and other shareholders.If you need additional copies or do not want your mailings to be "householded," please call Lord Abbett at 888-522-2388.
Lord Abbett Intermediate Tax Free Fund
Annual Shareholder Report
September 30, 2024
lordabbett.com/FundDocuments
TSR-A-1409-A
11/24
Lord Abbett Intermediate Tax Free Fund
Annual Shareholder Report
September 30, 2024
lordabbett.com/FundDocuments
This annual shareholder report contains important information about the Lord Abbett Intermediate Tax Free Fund for the period of October 1, 2023 to September 30, 2024, as well as certain changes to the Fund. You can find additional information about the Fund at lordabbett.com/FundDocuments. You can also request this information by contacting us at 888-522-2388.
What were the Fund costs for the last year?
(based on a hypothetical $10,000 investment)
| Class Name | Costs of a $10,000 investment | Costs paid as a percentage of a $10,000 investment |
|---|
| Class C | $138 | 1.32% |
How did the Fund perform last year and what affected its performance?
For the fiscal year ended September 30, 2024, the Fund returned 9.03%, reflecting performance at the net asset value (NAV) of Class C shares, compared to the 8.47% of a securities market index with investment characteristics similar to those of the Fund, the Bloomberg 1-15 Year Municipal Bond Index. The Fund's broad-based market index, the Bloomberg Aggregate Bond Index, returned 11.57% over the same period.
Positive factors for the municipal market included decreasing Treasury yields, easing inflationary pressures and the start of interest rate cuts by the U.S. Federal Reserve. Also supporting the market was increased demand for municipal bond funds and a strong fundamental backdrop as evidenced by growing tax revenue and positive ratings actions by public ratings agencies. Negative factors included a significant increase in municipal bond supply, which pressured the market in second half of the fiscal year, and periods of interest rate volatility driven by sticky inflation readings at points throughout the fiscal year. Against this backdrop, municipal bonds delivered strong returns.
Top contributors to the Fund’s performance: An overweight allocation to BBB-rated and non-investment grade bonds contributed to relative performance. The Fund’s longer duration positioning relative to the prospectus benchmark led to a positive impact as yields fell over the period. An overweight allocation to the Health Care, Industrial Development and Transportation sectors contributed to relative performance. Security selection within the Transportation, Health Care and State General Obligation sectors contributed to relative performance.
Top detractors from the Fund’s performance: There were no significant detractors over the period.
Total Return Based on $10,000 Investment
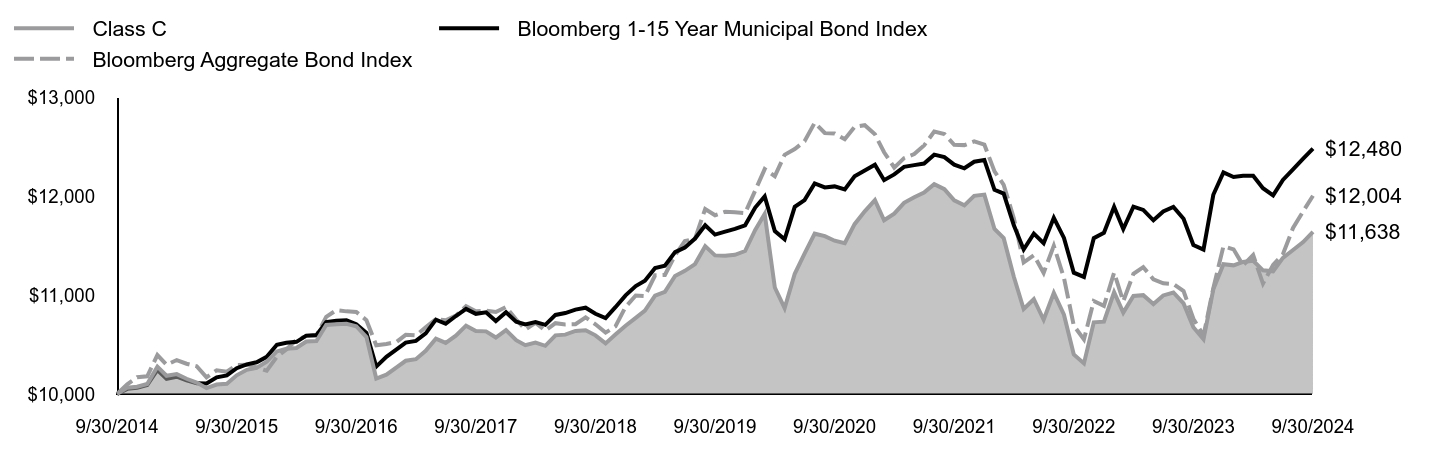
| Class C | Bloomberg 1-15 Year Municipal Bond Index | Bloomberg Aggregate Bond Index |
|---|
| 9/30/2014 | $10,000 | $10,000 | $10,000 |
| 10/31/2014 | $10,064 | $10,052 | $10,098 |
| 11/30/2014 | $10,074 | $10,063 | $10,170 |
| 12/31/2014 | $10,101 | $10,090 | $10,179 |
| 1/31/2015 | $10,276 | $10,243 | $10,393 |
| 2/28/2015 | $10,184 | $10,154 | $10,295 |
| 3/31/2015 | $10,201 | $10,175 | $10,343 |
| 4/30/2015 | $10,154 | $10,137 | $10,306 |
| 5/31/2015 | $10,115 | $10,108 | $10,281 |
| 6/30/2015 | $10,059 | $10,107 | $10,169 |
| 7/31/2015 | $10,096 | $10,169 | $10,240 |
| 8/31/2015 | $10,104 | $10,188 | $10,225 |
| 9/30/2015 | $10,189 | $10,261 | $10,294 |
| 10/31/2015 | $10,244 | $10,299 | $10,296 |
| 11/30/2015 | $10,263 | $10,321 | $10,269 |
| 12/31/2015 | $10,326 | $10,375 | $10,235 |
| 1/31/2016 | $10,430 | $10,498 | $10,376 |
| 2/29/2016 | $10,457 | $10,517 | $10,450 |
| 3/31/2016 | $10,465 | $10,527 | $10,546 |
| 4/30/2016 | $10,530 | $10,590 | $10,586 |
| 5/31/2016 | $10,536 | $10,595 | $10,589 |
| 6/30/2016 | $10,697 | $10,726 | $10,779 |
| 7/31/2016 | $10,704 | $10,741 | $10,847 |
| 8/31/2016 | $10,709 | $10,745 | $10,835 |
| 9/30/2016 | $10,685 | $10,706 | $10,829 |
| 10/31/2016 | $10,575 | $10,618 | $10,746 |
| 11/30/2016 | $10,156 | $10,277 | $10,492 |
| 12/31/2016 | $10,195 | $10,376 | $10,506 |
| 1/31/2017 | $10,270 | $10,450 | $10,527 |
| 2/28/2017 | $10,336 | $10,519 | $10,598 |
| 3/31/2017 | $10,352 | $10,537 | $10,592 |
| 4/30/2017 | $10,436 | $10,612 | $10,674 |
| 5/31/2017 | $10,559 | $10,751 | $10,756 |
| 6/30/2017 | $10,516 | $10,710 | $10,745 |
| 7/31/2017 | $10,589 | $10,788 | $10,792 |
| 8/31/2017 | $10,691 | $10,860 | $10,888 |
| 9/30/2017 | $10,637 | $10,810 | $10,836 |
| 10/31/2017 | $10,633 | $10,825 | $10,843 |
| 11/30/2017 | $10,571 | $10,737 | $10,829 |
| 12/31/2017 | $10,646 | $10,826 | $10,879 |
| 1/31/2018 | $10,544 | $10,731 | $10,753 |
| 2/28/2018 | $10,493 | $10,704 | $10,651 |
| 3/31/2018 | $10,519 | $10,727 | $10,720 |
| 4/30/2018 | $10,487 | $10,699 | $10,640 |
| 5/31/2018 | $10,593 | $10,799 | $10,716 |
| 6/30/2018 | $10,600 | $10,818 | $10,703 |
| 7/31/2018 | $10,637 | $10,853 | $10,705 |
| 8/31/2018 | $10,645 | $10,872 | $10,774 |
| 9/30/2018 | $10,593 | $10,811 | $10,705 |
| 10/31/2018 | $10,511 | $10,767 | $10,620 |
| 11/30/2018 | $10,601 | $10,877 | $10,683 |
| 12/31/2018 | $10,690 | $10,997 | $10,880 |
| 1/31/2019 | $10,770 | $11,090 | $10,995 |
| 2/28/2019 | $10,842 | $11,144 | $10,989 |
| 3/31/2019 | $10,993 | $11,274 | $11,200 |
| 4/30/2019 | $11,033 | $11,296 | $11,203 |
| 5/31/2019 | $11,193 | $11,434 | $11,402 |
| 6/30/2019 | $11,244 | $11,481 | $11,545 |
| 7/31/2019 | $11,313 | $11,571 | $11,570 |
| 8/31/2019 | $11,494 | $11,706 | $11,870 |
| 9/30/2019 | $11,401 | $11,611 | $11,807 |
| 10/31/2019 | $11,398 | $11,641 | $11,842 |
| 11/30/2019 | $11,407 | $11,668 | $11,836 |
| 12/31/2019 | $11,445 | $11,705 | $11,828 |
| 1/31/2020 | $11,658 | $11,884 | $12,056 |
| 2/29/2020 | $11,820 | $11,996 | $12,273 |
| 3/31/2020 | $11,076 | $11,646 | $12,201 |
| 4/30/2020 | $10,867 | $11,564 | $12,417 |
| 5/31/2020 | $11,215 | $11,891 | $12,475 |
| 6/30/2020 | $11,418 | $11,960 | $12,554 |
| 7/31/2020 | $11,620 | $12,128 | $12,741 |
| 8/31/2020 | $11,595 | $12,088 | $12,638 |
| 9/30/2020 | $11,549 | $12,098 | $12,632 |
| 10/31/2020 | $11,523 | $12,067 | $12,575 |
| 11/30/2020 | $11,716 | $12,200 | $12,699 |
| 12/31/2020 | $11,846 | $12,259 | $12,716 |
| 1/31/2021 | $11,959 | $12,317 | $12,625 |
| 2/28/2021 | $11,756 | $12,161 | $12,443 |
| 3/31/2021 | $11,823 | $12,219 | $12,287 |
| 4/30/2021 | $11,932 | $12,295 | $12,384 |
| 5/31/2021 | $11,989 | $12,313 | $12,425 |
| 6/30/2021 | $12,035 | $12,329 | $12,512 |
| 7/31/2021 | $12,121 | $12,419 | $12,652 |
| 8/31/2021 | $12,070 | $12,394 | $12,628 |
| 9/30/2021 | $11,957 | $12,318 | $12,518 |
| 10/31/2021 | $11,906 | $12,281 | $12,515 |
| 11/30/2021 | $12,003 | $12,347 | $12,552 |
| 12/31/2021 | $12,015 | $12,365 | $12,520 |
| 1/31/2022 | $11,667 | $12,063 | $12,250 |
| 2/28/2022 | $11,575 | $12,025 | $12,114 |
| 3/31/2022 | $11,185 | $11,705 | $11,777 |
| 4/30/2022 | $10,859 | $11,460 | $11,330 |
| 5/31/2022 | $10,958 | $11,621 | $11,403 |
| 6/30/2022 | $10,750 | $11,524 | $11,224 |
| 7/31/2022 | $11,021 | $11,781 | $11,498 |
| 8/31/2022 | $10,801 | $11,577 | $11,174 |
| 9/30/2022 | $10,399 | $11,226 | $10,691 |
| 10/31/2022 | $10,309 | $11,183 | $10,552 |
| 11/30/2022 | $10,724 | $11,575 | $10,940 |
| 12/31/2022 | $10,731 | $11,629 | $10,891 |
| 1/31/2023 | $11,028 | $11,891 | $11,226 |
| 2/28/2023 | $10,822 | $11,667 | $10,936 |
| 3/31/2023 | $10,991 | $11,893 | $11,214 |
| 4/30/2023 | $10,999 | $11,860 | $11,282 |
| 5/31/2023 | $10,909 | $11,755 | $11,159 |
| 6/30/2023 | $10,996 | $11,844 | $11,119 |
| 7/31/2023 | $11,026 | $11,891 | $11,111 |
| 8/31/2023 | $10,915 | $11,771 | $11,040 |
| 9/30/2023 | $10,674 | $11,506 | $10,760 |
| 10/31/2023 | $10,553 | $11,459 | $10,590 |
| 11/30/2023 | $11,058 | $12,013 | $11,069 |
| 12/31/2023 | $11,311 | $12,240 | $11,493 |
| 1/31/2024 | $11,300 | $12,193 | $11,462 |
| 2/29/2024 | $11,335 | $12,205 | $11,300 |
| 3/31/2024 | $11,347 | $12,205 | $11,404 |
| 4/30/2024 | $11,250 | $12,080 | $11,116 |
| 5/31/2024 | $11,240 | $12,008 | $11,304 |
| 6/30/2024 | $11,375 | $12,163 | $11,412 |
| 7/31/2024 | $11,455 | $12,271 | $11,678 |
| 8/31/2024 | $11,535 | $12,379 | $11,846 |
| 9/30/2024 | $11,638 | $12,480 | $12,004 |
The Fund’s benchmarks are unmanaged indices used as a general measure of market performance. Calculations assume the reinvestment of dividends and capital gains.
Average Annual Total Returns (%)
| 1 Year | 5 Years | 10 Years |
|---|
| Class C at NAV | 9.03% | 0.41% | 1.53% |
| Class C with sales charge | 8.03% | 0.41% | 1.53% |
| Bloomberg 1-15 Year Municipal Bond Index | 8.47% | 1.45% | 2.24% |
Bloomberg Aggregate Bond IndexFootnote Reference* | 11.57% | 0.33% | 1.84% |
| Footnote | Description |
Footnote* | The Fund has adopted the Bloomberg Aggregate Bond Index as its broad-based securities market index. |
The Fund's past performance is no guarantee of future results. The returns do not reflect the deduction of taxes that a shareholder would pay on Fund distributions or redemption of Fund shares.
(as of September 30, 2024)
| Total Net Assets | $4,957,534,804 |
| # of Portfolio Holdings | 886 |
| Portfolio Turnover Rate | 49% |
| Total Advisory Fees Paid | $18,635,236 |
What did the Fund invest in?
(as of September 30, 2024)
Credit Rating S&P or Moody'sFootnote Reference(a) | %Footnote Reference** |
|---|
| |
- A11.96%
- A-8.12%
- A+12.71%
- AA11.41%
- AA-8.70%
- AA+6.09%
- AAA4.90%
- B0.39%
- B-0.16%
- B+0.51%
- BB1.36%
- BB-1.25%
- BB+2.47%
- BBB5.69%
- BBB-7.74%
- BBB+7.91%
- NR8.63%
- Total 100.00%
| Footnote | Description |
Footnote** | Represents percent of total investments, which excludes derivatives. |
Footnote(a) | Investments in investment grade municipal bonds, which as bonds that are rated, at the time of purchase, within the four highest grades assigned by an independent rating agency such as Moody’s, S&P, or Fitch, or an equivalent short-term rating, as applicable, or are unrated by rating agencies but deemed by Lord Abbett to be of comparable quality. Lower rated municipal bonds are rated, at the time of purchase, or an equivalent short-term rating, as applicable, by an independent rating agency or are unrated by rating agencies but deemed by Lord Abbett to be of comparable quality. |
There were no material fund changes during the period.
Where can I find additional information about the Fund?
For additional information about the Fund, including its Prospectus, Statement of Additional Information, financial statements, holdings and proxy information, please visit lordabbett.com/FundDocuments.
The Fund has adopted a policy that allows it to send only one copy of the Fund's prospectus, proxy material, annual report and semiannual report (or related notice of internet availability of annual report and semiannual report) to certain shareholders residing at the same "household." This reduces Fund expenses, which benefits you and other shareholders.If you need additional copies or do not want your mailings to be "householded," please call Lord Abbett at 888-522-2388.
Lord Abbett Intermediate Tax Free Fund
Annual Shareholder Report
September 30, 2024
lordabbett.com/FundDocuments
TSR-A-1411-C
11/24
Lord Abbett Intermediate Tax Free Fund
Annual Shareholder Report
September 30, 2024
lordabbett.com/FundDocuments
This annual shareholder report contains important information about the Lord Abbett Intermediate Tax Free Fund for the period of October 1, 2023 to September 30, 2024, as well as certain changes to the Fund. You can find additional information about the Fund at lordabbett.com/FundDocuments. You can also request this information by contacting us at 888-522-2388.
What were the Fund costs for the last year?
(based on a hypothetical $10,000 investment)
| Class Name | Costs of a $10,000 investment | Costs paid as a percentage of a $10,000 investment |
|---|
| Class F | $64 | 0.61% |
How did the Fund perform last year and what affected its performance?
For the fiscal year ended September 30, 2024, the Fund returned 9.80%, reflecting performance at the net asset value (NAV) of Class F shares, compared to the 8.47% of a securities market index with investment characteristics similar to those of the Fund, the Bloomberg 1-15 Year Municipal Bond Index. The Fund's broad-based market index, the Bloomberg Aggregate Bond Index, returned 11.57% over the same period.
Positive factors for the municipal market included decreasing Treasury yields, easing inflationary pressures and the start of interest rate cuts by the U.S. Federal Reserve. Also supporting the market was increased demand for municipal bond funds and a strong fundamental backdrop as evidenced by growing tax revenue and positive ratings actions by public ratings agencies. Negative factors included a significant increase in municipal bond supply, which pressured the market in second half of the fiscal year, and periods of interest rate volatility driven by sticky inflation readings at points throughout the fiscal year. Against this backdrop, municipal bonds delivered strong returns.
Top contributors to the Fund’s performance: An overweight allocation to BBB-rated and non-investment grade bonds contributed to relative performance. The Fund’s longer duration positioning relative to the prospectus benchmark led to a positive impact as yields fell over the period. An overweight allocation to the Health Care, Industrial Development and Transportation sectors contributed to relative performance. Security selection within the Transportation, Health Care and State General Obligation sectors contributed to relative performance.
Top detractors from the Fund’s performance: There were no significant detractors over the period.
Total Return Based on $10,000 Investment
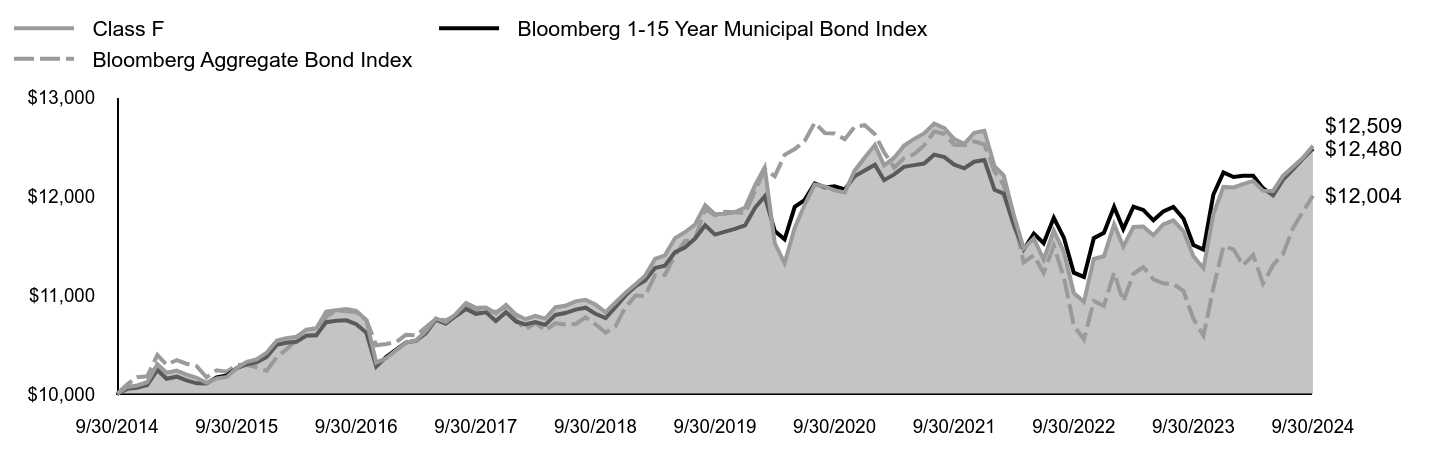
| Class F | Bloomberg 1-15 Year Municipal Bond Index | Bloomberg Aggregate Bond Index |
|---|
| 9/30/2014 | $10,000 | $10,000 | $10,000 |
| 10/31/2014 | $10,071 | $10,052 | $10,098 |
| 11/30/2014 | $10,086 | $10,063 | $10,170 |
| 12/31/2014 | $10,119 | $10,090 | $10,179 |
| 1/31/2015 | $10,301 | $10,243 | $10,393 |
| 2/28/2015 | $10,214 | $10,154 | $10,295 |
| 3/31/2015 | $10,237 | $10,175 | $10,343 |
| 4/30/2015 | $10,196 | $10,137 | $10,306 |
| 5/31/2015 | $10,164 | $10,108 | $10,281 |
| 6/30/2015 | $10,113 | $10,107 | $10,169 |
| 7/31/2015 | $10,157 | $10,169 | $10,240 |
| 8/31/2015 | $10,172 | $10,188 | $10,225 |
| 9/30/2015 | $10,262 | $10,261 | $10,294 |
| 10/31/2015 | $10,325 | $10,299 | $10,296 |
| 11/30/2015 | $10,349 | $10,321 | $10,269 |
| 12/31/2015 | $10,419 | $10,375 | $10,235 |
| 1/31/2016 | $10,540 | $10,498 | $10,376 |
| 2/29/2016 | $10,564 | $10,517 | $10,450 |
| 3/31/2016 | $10,578 | $10,527 | $10,546 |
| 4/30/2016 | $10,650 | $10,590 | $10,586 |
| 5/31/2016 | $10,664 | $10,595 | $10,589 |
| 6/30/2016 | $10,832 | $10,726 | $10,779 |
| 7/31/2016 | $10,846 | $10,741 | $10,847 |
| 8/31/2016 | $10,858 | $10,745 | $10,835 |
| 9/30/2016 | $10,841 | $10,706 | $10,829 |
| 10/31/2016 | $10,745 | $10,618 | $10,746 |
| 11/30/2016 | $10,317 | $10,277 | $10,492 |
| 12/31/2016 | $10,363 | $10,376 | $10,506 |
| 1/31/2017 | $10,445 | $10,450 | $10,527 |
| 2/28/2017 | $10,519 | $10,519 | $10,598 |
| 3/31/2017 | $10,541 | $10,537 | $10,592 |
| 4/30/2017 | $10,634 | $10,612 | $10,674 |
| 5/31/2017 | $10,765 | $10,751 | $10,756 |
| 6/30/2017 | $10,727 | $10,710 | $10,745 |
| 7/31/2017 | $10,809 | $10,788 | $10,792 |
| 8/31/2017 | $10,919 | $10,860 | $10,888 |
| 9/30/2017 | $10,871 | $10,810 | $10,836 |
| 10/31/2017 | $10,874 | $10,825 | $10,843 |
| 11/30/2017 | $10,816 | $10,737 | $10,829 |
| 12/31/2017 | $10,900 | $10,826 | $10,879 |
| 1/31/2018 | $10,802 | $10,731 | $10,753 |
| 2/28/2018 | $10,756 | $10,704 | $10,651 |
| 3/31/2018 | $10,789 | $10,727 | $10,720 |
| 4/30/2018 | $10,762 | $10,699 | $10,640 |
| 5/31/2018 | $10,877 | $10,799 | $10,716 |
| 6/30/2018 | $10,892 | $10,818 | $10,703 |
| 7/31/2018 | $10,936 | $10,853 | $10,705 |
| 8/31/2018 | $10,951 | $10,872 | $10,774 |
| 9/30/2018 | $10,904 | $10,811 | $10,705 |
| 10/31/2018 | $10,826 | $10,767 | $10,620 |
| 11/30/2018 | $10,925 | $10,877 | $10,683 |
| 12/31/2018 | $11,024 | $10,997 | $10,880 |
| 1/31/2019 | $11,112 | $11,090 | $10,995 |
| 2/28/2019 | $11,193 | $11,144 | $10,989 |
| 3/31/2019 | $11,365 | $11,274 | $11,200 |
| 4/30/2019 | $11,402 | $11,296 | $11,203 |
| 5/31/2019 | $11,575 | $11,434 | $11,402 |
| 6/30/2019 | $11,634 | $11,481 | $11,545 |
| 7/31/2019 | $11,713 | $11,571 | $11,570 |
| 8/31/2019 | $11,907 | $11,706 | $11,870 |
| 9/30/2019 | $11,817 | $11,611 | $11,807 |
| 10/31/2019 | $11,822 | $11,641 | $11,842 |
| 11/30/2019 | $11,838 | $11,668 | $11,836 |
| 12/31/2019 | $11,885 | $11,705 | $11,828 |
| 1/31/2020 | $12,113 | $11,884 | $12,056 |
| 2/29/2020 | $12,288 | $11,996 | $12,273 |
| 3/31/2020 | $11,522 | $11,646 | $12,201 |
| 4/30/2020 | $11,323 | $11,564 | $12,417 |
| 5/31/2020 | $11,680 | $11,891 | $12,475 |
| 6/30/2020 | $11,910 | $11,960 | $12,554 |
| 7/31/2020 | $12,117 | $12,128 | $12,741 |
| 8/31/2020 | $12,098 | $12,088 | $12,638 |
| 9/30/2020 | $12,057 | $12,098 | $12,632 |
| 10/31/2020 | $12,037 | $12,067 | $12,575 |
| 11/30/2020 | $12,257 | $12,200 | $12,699 |
| 12/31/2020 | $12,390 | $12,259 | $12,716 |
| 1/31/2021 | $12,516 | $12,317 | $12,625 |
| 2/28/2021 | $12,311 | $12,161 | $12,443 |
| 3/31/2021 | $12,388 | $12,219 | $12,287 |
| 4/30/2021 | $12,510 | $12,295 | $12,384 |
| 5/31/2021 | $12,578 | $12,313 | $12,425 |
| 6/30/2021 | $12,633 | $12,329 | $12,512 |
| 7/31/2021 | $12,732 | $12,419 | $12,652 |
| 8/31/2021 | $12,686 | $12,394 | $12,628 |
| 9/30/2021 | $12,575 | $12,318 | $12,518 |
| 10/31/2021 | $12,529 | $12,281 | $12,515 |
| 11/30/2021 | $12,639 | $12,347 | $12,552 |
| 12/31/2021 | $12,660 | $12,365 | $12,520 |
| 1/31/2022 | $12,301 | $12,063 | $12,250 |
| 2/28/2022 | $12,211 | $12,025 | $12,114 |
| 3/31/2022 | $11,807 | $11,705 | $11,777 |
| 4/30/2022 | $11,471 | $11,460 | $11,330 |
| 5/31/2022 | $11,572 | $11,621 | $11,403 |
| 6/30/2022 | $11,358 | $11,524 | $11,224 |
| 7/31/2022 | $11,652 | $11,781 | $11,498 |
| 8/31/2022 | $11,437 | $11,577 | $11,174 |
| 9/30/2022 | $11,020 | $11,226 | $10,691 |
| 10/31/2022 | $10,931 | $11,183 | $10,552 |
| 11/30/2022 | $11,366 | $11,575 | $10,940 |
| 12/31/2022 | $11,392 | $11,629 | $10,891 |
| 1/31/2023 | $11,714 | $11,891 | $11,226 |
| 2/28/2023 | $11,490 | $11,667 | $10,936 |
| 3/31/2023 | $11,688 | $11,893 | $11,214 |
| 4/30/2023 | $11,692 | $11,860 | $11,282 |
| 5/31/2023 | $11,604 | $11,755 | $11,159 |
| 6/30/2023 | $11,714 | $11,844 | $11,119 |
| 7/31/2023 | $11,754 | $11,891 | $11,111 |
| 8/31/2023 | $11,643 | $11,771 | $11,040 |
| 9/30/2023 | $11,392 | $11,506 | $10,760 |
| 10/31/2023 | $11,270 | $11,459 | $10,590 |
| 11/30/2023 | $11,815 | $12,013 | $11,069 |
| 12/31/2023 | $12,093 | $12,240 | $11,493 |
| 1/31/2024 | $12,088 | $12,193 | $11,462 |
| 2/29/2024 | $12,121 | $12,205 | $11,300 |
| 3/31/2024 | $12,153 | $12,205 | $11,404 |
| 4/30/2024 | $12,055 | $12,080 | $11,116 |
| 5/31/2024 | $12,052 | $12,008 | $11,304 |
| 6/30/2024 | $12,204 | $12,163 | $11,412 |
| 7/31/2024 | $12,297 | $12,271 | $11,678 |
| 8/31/2024 | $12,390 | $12,379 | $11,846 |
| 9/30/2024 | $12,509 | $12,480 | $12,004 |
The Fund’s benchmarks are unmanaged indices used as a general measure of market performance. Calculations assume the reinvestment of dividends and capital gains.
Average Annual Total Returns (%)
| 1 Year | 5 Years | 10 Years |
|---|
| Class F at NAV | 9.80% | 1.14% | 2.26% |
| Bloomberg 1-15 Year Municipal Bond Index | 8.47% | 1.45% | 2.24% |
Bloomberg Aggregate Bond IndexFootnote Reference* | 11.57% | 0.33% | 1.84% |
| Footnote | Description |
Footnote* | The Fund has adopted the Bloomberg Aggregate Bond Index as its broad-based securities market index. |
The Fund's past performance is no guarantee of future results. The returns do not reflect the deduction of taxes that a shareholder would pay on Fund distributions or redemption of Fund shares.
(as of September 30, 2024)
| Total Net Assets | $4,957,534,804 |
| # of Portfolio Holdings | 886 |
| Portfolio Turnover Rate | 49% |
| Total Advisory Fees Paid | $18,635,236 |
What did the Fund invest in?
(as of September 30, 2024)
Credit Rating S&P or Moody'sFootnote Reference(a) | %Footnote Reference** |
|---|
| |
- A11.96%
- A-8.12%
- A+12.71%
- AA11.41%
- AA-8.70%
- AA+6.09%
- AAA4.90%
- B0.39%
- B-0.16%
- B+0.51%
- BB1.36%
- BB-1.25%
- BB+2.47%
- BBB5.69%
- BBB-7.74%
- BBB+7.91%
- NR8.63%
- Total 100.00%
| Footnote | Description |
Footnote** | Represents percent of total investments, which excludes derivatives. |
Footnote(a) | Investments in investment grade municipal bonds, which as bonds that are rated, at the time of purchase, within the four highest grades assigned by an independent rating agency such as Moody’s, S&P, or Fitch, or an equivalent short-term rating, as applicable, or are unrated by rating agencies but deemed by Lord Abbett to be of comparable quality. Lower rated municipal bonds are rated, at the time of purchase, or an equivalent short-term rating, as applicable, by an independent rating agency or are unrated by rating agencies but deemed by Lord Abbett to be of comparable quality. |
There were no material fund changes during the period.
Where can I find additional information about the Fund?
For additional information about the Fund, including its Prospectus, Statement of Additional Information, financial statements, holdings and proxy information, please visit lordabbett.com/FundDocuments.
The Fund has adopted a policy that allows it to send only one copy of the Fund's prospectus, proxy material, annual report and semiannual report (or related notice of internet availability of annual report and semiannual report) to certain shareholders residing at the same "household." This reduces Fund expenses, which benefits you and other shareholders.If you need additional copies or do not want your mailings to be "householded," please call Lord Abbett at 888-522-2388.
Lord Abbett Intermediate Tax Free Fund
Annual Shareholder Report
September 30, 2024
lordabbett.com/FundDocuments
TSR-A-1039-F
11/24
Lord Abbett Intermediate Tax Free Fund
Annual Shareholder Report
September 30, 2024
lordabbett.com/FundDocuments
This annual shareholder report contains important information about the Lord Abbett Intermediate Tax Free Fund for the period of October 1, 2023 to September 30, 2024, as well as certain changes to the Fund. You can find additional information about the Fund at lordabbett.com/FundDocuments. You can also request this information by contacting us at 888-522-2388.
What were the Fund costs for the last year?
(based on a hypothetical $10,000 investment)
| Class Name | Costs of a $10,000 investment | Costs paid as a percentage of a $10,000 investment |
|---|
| Class F3 | $46 | 0.44% |
How did the Fund perform last year and what affected its performance?
For the fiscal year ended September 30, 2024, the Fund returned 9.97%, reflecting performance at the net asset value (NAV) of Class F3 shares, compared to the 8.47% of a securities market index with investment characteristics similar to those of the Fund, the Bloomberg 1-15 Year Municipal Bond Index. The Fund's broad-based market index, the Bloomberg Aggregate Bond Index, returned 11.57% over the same period.
Positive factors for the municipal market included decreasing Treasury yields, easing inflationary pressures and the start of interest rate cuts by the U.S. Federal Reserve. Also supporting the market was increased demand for municipal bond funds and a strong fundamental backdrop as evidenced by growing tax revenue and positive ratings actions by public ratings agencies. Negative factors included a significant increase in municipal bond supply, which pressured the market in second half of the fiscal year, and periods of interest rate volatility driven by sticky inflation readings at points throughout the fiscal year. Against this backdrop, municipal bonds delivered strong returns.
Top contributors to the Fund’s performance: An overweight allocation to BBB-rated and non-investment grade bonds contributed to relative performance. The Fund’s longer duration positioning relative to the prospectus benchmark led to a positive impact as yields fell over the period. An overweight allocation to the Health Care, Industrial Development and Transportation sectors contributed to relative performance. Security selection within the Transportation, Health Care and State General Obligation sectors contributed to relative performance.
Top detractors from the Fund’s performance: There were no significant detractors over the period.
Total Return Based on $10,000 Investment
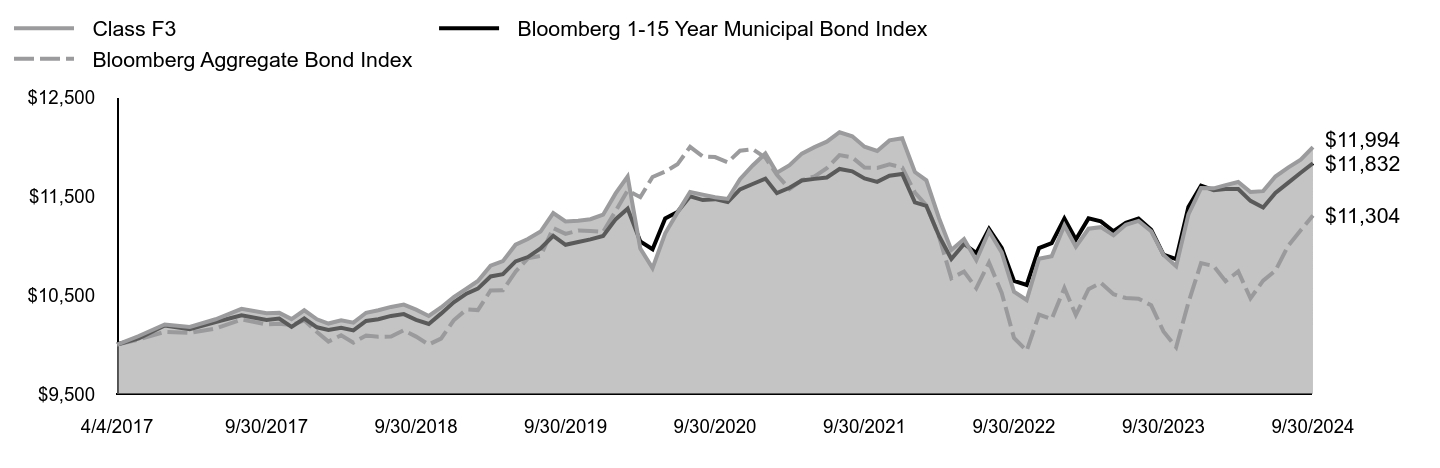
| Class F3 | Bloomberg 1-15 Year Municipal Bond Index | Bloomberg Aggregate Bond Index |
|---|
| 4/4/2017 | $10,000 | $10,000 | $10,000 |
| 4/30/2017 | $10,086 | $10,061 | $10,051 |
| 5/31/2017 | $10,202 | $10,193 | $10,128 |
| 6/30/2017 | $10,177 | $10,154 | $10,118 |
| 7/31/2017 | $10,255 | $10,228 | $10,162 |
| 8/31/2017 | $10,361 | $10,296 | $10,253 |
| 9/30/2017 | $10,316 | $10,248 | $10,204 |
| 10/31/2017 | $10,320 | $10,262 | $10,210 |
| 11/30/2017 | $10,257 | $10,179 | $10,197 |
| 12/31/2017 | $10,346 | $10,263 | $10,244 |
| 1/31/2018 | $10,255 | $10,174 | $10,126 |
| 2/28/2018 | $10,212 | $10,148 | $10,030 |
| 3/31/2018 | $10,245 | $10,170 | $10,094 |
| 4/30/2018 | $10,221 | $10,143 | $10,019 |
| 5/31/2018 | $10,321 | $10,238 | $10,091 |
| 6/30/2018 | $10,346 | $10,256 | $10,078 |
| 7/31/2018 | $10,380 | $10,289 | $10,080 |
| 8/31/2018 | $10,404 | $10,307 | $10,145 |
| 9/30/2018 | $10,352 | $10,250 | $10,080 |
| 10/31/2018 | $10,289 | $10,208 | $10,000 |
| 11/30/2018 | $10,374 | $10,312 | $10,060 |
| 12/31/2018 | $10,479 | $10,426 | $10,245 |
| 1/31/2019 | $10,564 | $10,514 | $10,354 |
| 2/28/2019 | $10,642 | $10,565 | $10,348 |
| 3/31/2019 | $10,797 | $10,688 | $10,546 |
| 4/30/2019 | $10,843 | $10,710 | $10,549 |
| 5/31/2019 | $11,009 | $10,840 | $10,736 |
| 6/30/2019 | $11,066 | $10,884 | $10,871 |
| 7/31/2019 | $11,142 | $10,970 | $10,895 |
| 8/31/2019 | $11,328 | $11,098 | $11,177 |
| 9/30/2019 | $11,244 | $11,008 | $11,118 |
| 10/31/2019 | $11,250 | $11,036 | $11,151 |
| 11/30/2019 | $11,266 | $11,062 | $11,146 |
| 12/31/2019 | $11,312 | $11,097 | $11,138 |
| 1/31/2020 | $11,530 | $11,267 | $11,352 |
| 2/29/2020 | $11,698 | $11,373 | $11,557 |
| 3/31/2020 | $10,971 | $11,041 | $11,489 |
| 4/30/2020 | $10,772 | $10,963 | $11,693 |
| 5/31/2020 | $11,124 | $11,274 | $11,747 |
| 6/30/2020 | $11,333 | $11,339 | $11,821 |
| 7/31/2020 | $11,542 | $11,498 | $11,998 |
| 8/31/2020 | $11,515 | $11,460 | $11,901 |
| 9/30/2020 | $11,488 | $11,469 | $11,894 |
| 10/31/2020 | $11,471 | $11,440 | $11,841 |
| 11/30/2020 | $11,671 | $11,567 | $11,958 |
| 12/31/2020 | $11,809 | $11,622 | $11,974 |
| 1/31/2021 | $11,931 | $11,677 | $11,888 |
| 2/28/2021 | $11,736 | $11,530 | $11,716 |
| 3/31/2021 | $11,812 | $11,584 | $11,570 |
| 4/30/2021 | $11,929 | $11,657 | $11,662 |
| 5/31/2021 | $11,995 | $11,674 | $11,700 |
| 6/30/2021 | $12,050 | $11,688 | $11,782 |
| 7/31/2021 | $12,145 | $11,774 | $11,914 |
| 8/31/2021 | $12,104 | $11,750 | $11,891 |
| 9/30/2021 | $11,999 | $11,678 | $11,788 |
| 10/31/2021 | $11,956 | $11,644 | $11,785 |
| 11/30/2021 | $12,063 | $11,706 | $11,820 |
| 12/31/2021 | $12,084 | $11,723 | $11,789 |
| 1/31/2022 | $11,743 | $11,436 | $11,535 |
| 2/28/2022 | $11,659 | $11,401 | $11,407 |
| 3/31/2022 | $11,276 | $11,097 | $11,090 |
| 4/30/2022 | $10,956 | $10,864 | $10,669 |
| 5/31/2022 | $11,065 | $11,017 | $10,738 |
| 6/30/2022 | $10,852 | $10,925 | $10,569 |
| 7/31/2022 | $11,144 | $11,169 | $10,828 |
| 8/31/2022 | $10,931 | $10,976 | $10,522 |
| 9/30/2022 | $10,534 | $10,643 | $10,067 |
| 10/31/2022 | $10,450 | $10,602 | $9,937 |
| 11/30/2022 | $10,867 | $10,974 | $10,302 |
| 12/31/2022 | $10,893 | $11,025 | $10,256 |
| 1/31/2023 | $11,203 | $11,273 | $10,571 |
| 2/28/2023 | $10,989 | $11,061 | $10,298 |
| 3/31/2023 | $11,170 | $11,275 | $10,559 |
| 4/30/2023 | $11,186 | $11,244 | $10,623 |
| 5/31/2023 | $11,103 | $11,145 | $10,508 |
| 6/30/2023 | $11,210 | $11,229 | $10,470 |
| 7/31/2023 | $11,249 | $11,273 | $10,463 |
| 8/31/2023 | $11,144 | $11,159 | $10,396 |
| 9/30/2023 | $10,906 | $10,909 | $10,132 |
| 10/31/2023 | $10,791 | $10,864 | $9,972 |
| 11/30/2023 | $11,314 | $11,389 | $10,424 |
| 12/31/2023 | $11,581 | $11,605 | $10,823 |
| 1/31/2024 | $11,578 | $11,560 | $10,793 |
| 2/29/2024 | $11,611 | $11,571 | $10,640 |
| 3/31/2024 | $11,643 | $11,571 | $10,739 |
| 4/30/2024 | $11,541 | $11,452 | $10,467 |
| 5/31/2024 | $11,550 | $11,384 | $10,645 |
| 6/30/2024 | $11,698 | $11,531 | $10,746 |
| 7/31/2024 | $11,788 | $11,634 | $10,997 |
| 8/31/2024 | $11,868 | $11,736 | $11,155 |
| 9/30/2024 | $11,994 | $11,832 | $11,304 |
The Fund’s benchmarks are unmanaged indices used as a general measure of market performance. Calculations assume the reinvestment of dividends and capital gains.
Average Annual Total Returns (%)
| 1 Year | 5 Years | Since Inception 4/4/17 |
|---|
| Class F3 at NAV | 9.97% | 1.30% | 2.46% |
| Bloomberg 1-15 Year Municipal Bond Index | 8.47% | 1.45% | 2.27% |
Bloomberg Aggregate Bond IndexFootnote Reference* | 11.57% | 0.33% | 1.65% |
| Footnote | Description |
Footnote* | The Fund has adopted the Bloomberg Aggregate Bond Index as its broad-based securities market index. |
The Fund's past performance is no guarantee of future results. The returns do not reflect the deduction of taxes that a shareholder would pay on Fund distributions or redemption of Fund shares.
(as of September 30, 2024)
| Total Net Assets | $4,957,534,804 |
| # of Portfolio Holdings | 886 |
| Portfolio Turnover Rate | 49% |
| Total Advisory Fees Paid | $18,635,236 |
What did the Fund invest in?
(as of September 30, 2024)
Credit Rating S&P or Moody'sFootnote Reference(a) | %Footnote Reference** |
|---|
| |
- A11.96%
- A-8.12%
- A+12.71%
- AA11.41%
- AA-8.70%
- AA+6.09%
- AAA4.90%
- B0.39%
- B-0.16%
- B+0.51%
- BB1.36%
- BB-1.25%
- BB+2.47%
- BBB5.69%
- BBB-7.74%
- BBB+7.91%
- NR8.63%
- Total 100.00%
| Footnote | Description |
Footnote** | Represents percent of total investments, which excludes derivatives. |
Footnote(a) | Investments in investment grade municipal bonds, which as bonds that are rated, at the time of purchase, within the four highest grades assigned by an independent rating agency such as Moody’s, S&P, or Fitch, or an equivalent short-term rating, as applicable, or are unrated by rating agencies but deemed by Lord Abbett to be of comparable quality. Lower rated municipal bonds are rated, at the time of purchase, or an equivalent short-term rating, as applicable, by an independent rating agency or are unrated by rating agencies but deemed by Lord Abbett to be of comparable quality. |
There were no material fund changes during the period.
Where can I find additional information about the Fund?
For additional information about the Fund, including its Prospectus, Statement of Additional Information, financial statements, holdings and proxy information, please visit lordabbett.com/FundDocuments.
The Fund has adopted a policy that allows it to send only one copy of the Fund's prospectus, proxy material, annual report and semiannual report (or related notice of internet availability of annual report and semiannual report) to certain shareholders residing at the same "household." This reduces Fund expenses, which benefits you and other shareholders.If you need additional copies or do not want your mailings to be "householded," please call Lord Abbett at 888-522-2388.
Lord Abbett Intermediate Tax Free Fund
Annual Shareholder Report
September 30, 2024
lordabbett.com/FundDocuments
TSR-A-8987-F3
11/24
Lord Abbett Intermediate Tax Free Fund
Annual Shareholder Report
September 30, 2024
lordabbett.com/FundDocuments
This annual shareholder report contains important information about the Lord Abbett Intermediate Tax Free Fund for the period of October 1, 2023 to September 30, 2024, as well as certain changes to the Fund. You can find additional information about the Fund at lordabbett.com/FundDocuments. You can also request this information by contacting us at 888-522-2388.
What were the Fund costs for the last year?
(based on a hypothetical $10,000 investment)
| Class Name | Costs of a $10,000 investment | Costs paid as a percentage of a $10,000 investment |
|---|
| Class I | $54 | 0.51% |
How did the Fund perform last year and what affected its performance?
For the fiscal year ended September 30, 2024, the Fund returned 10.02%, reflecting performance at the net asset value (NAV) of Class I shares, compared to the 8.47% of a securities market index with investment characteristics similar to those of the Fund, the Bloomberg 1-15 Year Municipal Bond Index. The Fund's broad-based market index, the Bloomberg Aggregate Bond Index, returned 11.57% over the same period.
Positive factors for the municipal market included decreasing Treasury yields, easing inflationary pressures and the start of interest rate cuts by the U.S. Federal Reserve. Also supporting the market was increased demand for municipal bond funds and a strong fundamental backdrop as evidenced by growing tax revenue and positive ratings actions by public ratings agencies. Negative factors included a significant increase in municipal bond supply, which pressured the market in second half of the fiscal year, and periods of interest rate volatility driven by sticky inflation readings at points throughout the fiscal year. Against this backdrop, municipal bonds delivered strong returns.
Top contributors to the Fund’s performance: An overweight allocation to BBB-rated and non-investment grade bonds contributed to relative performance. The Fund’s longer duration positioning relative to the prospectus benchmark led to a positive impact as yields fell over the period. An overweight allocation to the Health Care, Industrial Development and Transportation sectors contributed to relative performance. Security selection within the Transportation, Health Care and State General Obligation sectors contributed to relative performance.
Top detractors from the Fund’s performance: There were no significant detractors over the period.
Total Return Based on $10,000 Investment
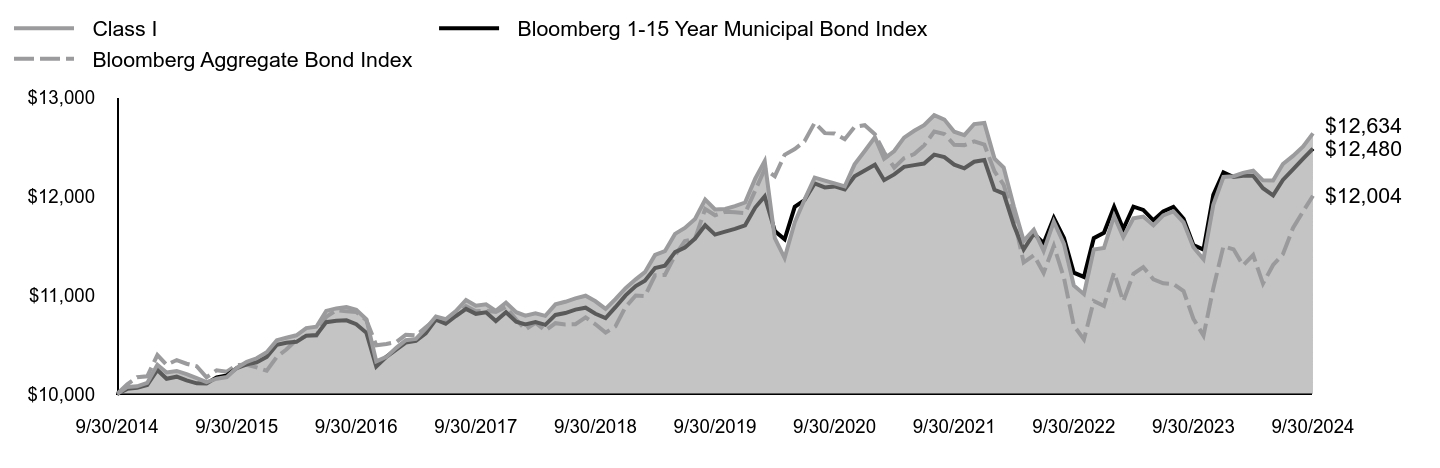
| Class I | Bloomberg 1-15 Year Municipal Bond Index | Bloomberg Aggregate Bond Index |
|---|
| 9/30/2014 | $10,000 | $10,000 | $10,000 |
| 10/31/2014 | $10,071 | $10,052 | $10,098 |
| 11/30/2014 | $10,078 | $10,063 | $10,170 |
| 12/31/2014 | $10,112 | $10,090 | $10,179 |
| 1/31/2015 | $10,295 | $10,243 | $10,393 |
| 2/28/2015 | $10,218 | $10,154 | $10,295 |
| 3/31/2015 | $10,233 | $10,175 | $10,343 |
| 4/30/2015 | $10,201 | $10,137 | $10,306 |
| 5/31/2015 | $10,160 | $10,108 | $10,281 |
| 6/30/2015 | $10,120 | $10,107 | $10,169 |
| 7/31/2015 | $10,155 | $10,169 | $10,240 |
| 8/31/2015 | $10,171 | $10,188 | $10,225 |
| 9/30/2015 | $10,263 | $10,261 | $10,294 |
| 10/31/2015 | $10,326 | $10,299 | $10,296 |
| 11/30/2015 | $10,361 | $10,321 | $10,269 |
| 12/31/2015 | $10,422 | $10,375 | $10,235 |
| 1/31/2016 | $10,544 | $10,498 | $10,376 |
| 2/29/2016 | $10,569 | $10,517 | $10,450 |
| 3/31/2016 | $10,593 | $10,527 | $10,546 |
| 4/30/2016 | $10,666 | $10,590 | $10,586 |
| 5/31/2016 | $10,680 | $10,595 | $10,589 |
| 6/30/2016 | $10,840 | $10,726 | $10,779 |
| 7/31/2016 | $10,865 | $10,741 | $10,847 |
| 8/31/2016 | $10,878 | $10,745 | $10,835 |
| 9/30/2016 | $10,851 | $10,706 | $10,829 |
| 10/31/2016 | $10,756 | $10,618 | $10,746 |
| 11/30/2016 | $10,329 | $10,277 | $10,492 |
| 12/31/2016 | $10,375 | $10,376 | $10,506 |
| 1/31/2017 | $10,469 | $10,450 | $10,527 |
| 2/28/2017 | $10,543 | $10,519 | $10,598 |
| 3/31/2017 | $10,557 | $10,537 | $10,592 |
| 4/30/2017 | $10,660 | $10,612 | $10,674 |
| 5/31/2017 | $10,783 | $10,751 | $10,756 |
| 6/30/2017 | $10,756 | $10,710 | $10,745 |
| 7/31/2017 | $10,838 | $10,788 | $10,792 |
| 8/31/2017 | $10,950 | $10,860 | $10,888 |
| 9/30/2017 | $10,893 | $10,810 | $10,836 |
| 10/31/2017 | $10,906 | $10,825 | $10,843 |
| 11/30/2017 | $10,840 | $10,737 | $10,829 |
| 12/31/2017 | $10,924 | $10,826 | $10,879 |
| 1/31/2018 | $10,827 | $10,731 | $10,753 |
| 2/28/2018 | $10,792 | $10,704 | $10,651 |
| 3/31/2018 | $10,816 | $10,727 | $10,720 |
| 4/30/2018 | $10,790 | $10,699 | $10,640 |
| 5/31/2018 | $10,906 | $10,799 | $10,716 |
| 6/30/2018 | $10,932 | $10,818 | $10,703 |
| 7/31/2018 | $10,967 | $10,853 | $10,705 |
| 8/31/2018 | $10,993 | $10,872 | $10,774 |
| 9/30/2018 | $10,937 | $10,811 | $10,705 |
| 10/31/2018 | $10,860 | $10,767 | $10,620 |
| 11/30/2018 | $10,959 | $10,877 | $10,683 |
| 12/31/2018 | $11,070 | $10,997 | $10,880 |
| 1/31/2019 | $11,159 | $11,090 | $10,995 |
| 2/28/2019 | $11,231 | $11,144 | $10,989 |
| 3/31/2019 | $11,405 | $11,274 | $11,200 |
| 4/30/2019 | $11,443 | $11,296 | $11,203 |
| 5/31/2019 | $11,618 | $11,434 | $11,402 |
| 6/30/2019 | $11,678 | $11,481 | $11,545 |
| 7/31/2019 | $11,768 | $11,571 | $11,570 |
| 8/31/2019 | $11,964 | $11,706 | $11,870 |
| 9/30/2019 | $11,865 | $11,611 | $11,807 |
| 10/31/2019 | $11,870 | $11,641 | $11,842 |
| 11/30/2019 | $11,898 | $11,668 | $11,836 |
| 12/31/2019 | $11,935 | $11,705 | $11,828 |
| 1/31/2020 | $12,176 | $11,884 | $12,056 |
| 2/29/2020 | $12,353 | $11,996 | $12,273 |
| 3/31/2020 | $11,574 | $11,646 | $12,201 |
| 4/30/2020 | $11,374 | $11,564 | $12,417 |
| 5/31/2020 | $11,735 | $11,891 | $12,475 |
| 6/30/2020 | $11,966 | $11,960 | $12,554 |
| 7/31/2020 | $12,186 | $12,128 | $12,741 |
| 8/31/2020 | $12,157 | $12,088 | $12,638 |
| 9/30/2020 | $12,128 | $12,098 | $12,632 |
| 10/31/2020 | $12,098 | $12,067 | $12,575 |
| 11/30/2020 | $12,321 | $12,200 | $12,699 |
| 12/31/2020 | $12,455 | $12,259 | $12,716 |
| 1/31/2021 | $12,594 | $12,317 | $12,625 |
| 2/28/2021 | $12,377 | $12,161 | $12,443 |
| 3/31/2021 | $12,456 | $12,219 | $12,287 |
| 4/30/2021 | $12,591 | $12,295 | $12,384 |
| 5/31/2021 | $12,660 | $12,313 | $12,425 |
| 6/30/2021 | $12,717 | $12,329 | $12,512 |
| 7/31/2021 | $12,817 | $12,419 | $12,652 |
| 8/31/2021 | $12,773 | $12,394 | $12,628 |
| 9/30/2021 | $12,650 | $12,318 | $12,518 |
| 10/31/2021 | $12,616 | $12,281 | $12,515 |
| 11/30/2021 | $12,728 | $12,347 | $12,552 |
| 12/31/2021 | $12,739 | $12,365 | $12,520 |
| 1/31/2022 | $12,379 | $12,063 | $12,250 |
| 2/28/2022 | $12,289 | $12,025 | $12,114 |
| 3/31/2022 | $11,895 | $11,705 | $11,777 |
| 4/30/2022 | $11,547 | $11,460 | $11,330 |
| 5/31/2022 | $11,660 | $11,621 | $11,403 |
| 6/30/2022 | $11,447 | $11,524 | $11,224 |
| 7/31/2022 | $11,743 | $11,781 | $11,498 |
| 8/31/2022 | $11,517 | $11,577 | $11,174 |
| 9/30/2022 | $11,097 | $11,226 | $10,691 |
| 10/31/2022 | $11,009 | $11,183 | $10,552 |
| 11/30/2022 | $11,459 | $11,575 | $10,940 |
| 12/31/2022 | $11,475 | $11,629 | $10,891 |
| 1/31/2023 | $11,800 | $11,891 | $11,226 |
| 2/28/2023 | $11,587 | $11,667 | $10,936 |
| 3/31/2023 | $11,776 | $11,893 | $11,214 |
| 4/30/2023 | $11,793 | $11,860 | $11,282 |
| 5/31/2023 | $11,705 | $11,755 | $11,159 |
| 6/30/2023 | $11,805 | $11,844 | $11,119 |
| 7/31/2023 | $11,846 | $11,891 | $11,111 |
| 8/31/2023 | $11,735 | $11,771 | $11,040 |
| 9/30/2023 | $11,484 | $11,506 | $10,760 |
| 10/31/2023 | $11,362 | $11,459 | $10,590 |
| 11/30/2023 | $11,912 | $12,013 | $11,069 |
| 12/31/2023 | $12,193 | $12,240 | $11,493 |
| 1/31/2024 | $12,201 | $12,193 | $11,462 |
| 2/29/2024 | $12,235 | $12,205 | $11,300 |
| 3/31/2024 | $12,256 | $12,205 | $11,404 |
| 4/30/2024 | $12,159 | $12,080 | $11,116 |
| 5/31/2024 | $12,157 | $12,008 | $11,304 |
| 6/30/2024 | $12,324 | $12,163 | $11,412 |
| 7/31/2024 | $12,406 | $12,271 | $11,678 |
| 8/31/2024 | $12,502 | $12,379 | $11,846 |
| 9/30/2024 | $12,634 | $12,480 | $12,004 |
The Fund’s benchmarks are unmanaged indices used as a general measure of market performance. Calculations assume the reinvestment of dividends and capital gains.
Average Annual Total Returns (%)
| 1 Year | 5 Years | 10 Years |
|---|
| Class I at NAV | 10.02% | 1.26% | 2.37% |
| Bloomberg 1-15 Year Municipal Bond Index | 8.47% | 1.45% | 2.24% |
Bloomberg Aggregate Bond IndexFootnote Reference* | 11.57% | 0.33% | 1.84% |
| Footnote | Description |
Footnote* | The Fund has adopted the Bloomberg Aggregate Bond Index as its broad-based securities market index. |
The Fund's past performance is no guarantee of future results. The returns do not reflect the deduction of taxes that a shareholder would pay on Fund distributions or redemption of Fund shares.
(as of September 30, 2024)
| Total Net Assets | $4,957,534,804 |
| # of Portfolio Holdings | 886 |
| Portfolio Turnover Rate | 49% |
| Total Advisory Fees Paid | $18,635,236 |
What did the Fund invest in?
(as of September 30, 2024)
Credit Rating S&P or Moody'sFootnote Reference(a) | %Footnote Reference** |
|---|
| |
- A11.96%
- A-8.12%
- A+12.71%
- AA11.41%
- AA-8.70%
- AA+6.09%
- AAA4.90%
- B0.39%
- B-0.16%
- B+0.51%
- BB1.36%
- BB-1.25%
- BB+2.47%
- BBB5.69%
- BBB-7.74%
- BBB+7.91%
- NR8.63%
- Total 100.00%
| Footnote | Description |
Footnote** | Represents percent of total investments, which excludes derivatives. |
Footnote(a) | Investments in investment grade municipal bonds, which as bonds that are rated, at the time of purchase, within the four highest grades assigned by an independent rating agency such as Moody’s, S&P, or Fitch, or an equivalent short-term rating, as applicable, or are unrated by rating agencies but deemed by Lord Abbett to be of comparable quality. Lower rated municipal bonds are rated, at the time of purchase, or an equivalent short-term rating, as applicable, by an independent rating agency or are unrated by rating agencies but deemed by Lord Abbett to be of comparable quality. |
There were no material fund changes during the period.
Where can I find additional information about the Fund?
For additional information about the Fund, including its Prospectus, Statement of Additional Information, financial statements, holdings and proxy information, please visit lordabbett.com/FundDocuments.
The Fund has adopted a policy that allows it to send only one copy of the Fund's prospectus, proxy material, annual report and semiannual report (or related notice of internet availability of annual report and semiannual report) to certain shareholders residing at the same "household." This reduces Fund expenses, which benefits you and other shareholders.If you need additional copies or do not want your mailings to be "householded," please call Lord Abbett at 888-522-2388.
Lord Abbett Intermediate Tax Free Fund
Annual Shareholder Report
September 30, 2024
lordabbett.com/FundDocuments
TSR-A-3326-I
11/24
Lord Abbett National Tax Free Fund
Annual Shareholder Report
September 30, 2024
lordabbett.com/FundDocuments
This annual shareholder report contains important information about the Lord Abbett National Tax Free Fund for the period of October 1, 2023 to September 30, 2024, as well as certain changes to the Fund. You can find additional information about the Fund at lordabbett.com/FundDocuments. You can also request this information by contacting us at 888-522-2388.
What were the Fund costs for the last year?
(based on a hypothetical $10,000 investment)
| Class Name | Costs of a $10,000 investment | Costs paid as a percentage of a $10,000 investment |
|---|
| Class A | $83 | 0.78% |
How did the Fund perform last year and what affected its performance?
For the fiscal year ended September 30, 2024, the Fund returned 12.58%, reflecting performance at the net asset value (NAV) of Class A shares, compared to the 10.37% of a securities market index with investment characteristics similar to those of the Fund, the Bloomberg Municipal Bond Index. The Fund's broad-based market index, the Bloomberg Aggregate Bond Index, returned 11.57% over the same period.
Positive factors for the municipal market included decreasing Treasury yields, easing inflationary pressures and the start of interest rate cuts by the U.S. Federal Reserve. Also supporting the market was increased demand for municipal bond funds and a strong fundamental backdrop as evidenced by growing tax revenue and positive ratings actions by public ratings agencies. Negative factors included a significant increase in municipal bond supply, which pressured the market in second half of the fiscal year, and periods of interest rate volatility driven by sticky inflation readings at points throughout the fiscal year. Against this backdrop, municipal bonds delivered strong returns.
Top contributors to the Fund’s performance: An overweight allocation to BBB-rated and non-investment grade bonds contributed to relative performance. The Fund’s longer duration positioning relative to the prospectus benchmark led to a positive impact as yields fell over the period. An overweight allocation to the Health Care and Special Tax sectors contributed to relative performance. An underweight allocation to the State General Obligation bonds contributed to relative performance.
Top detractors from the Fund’s performance: Security selection within the Health Care, Education and Leasing sectors detracted from relative performance.
Total Return Based on $10,000 Investment
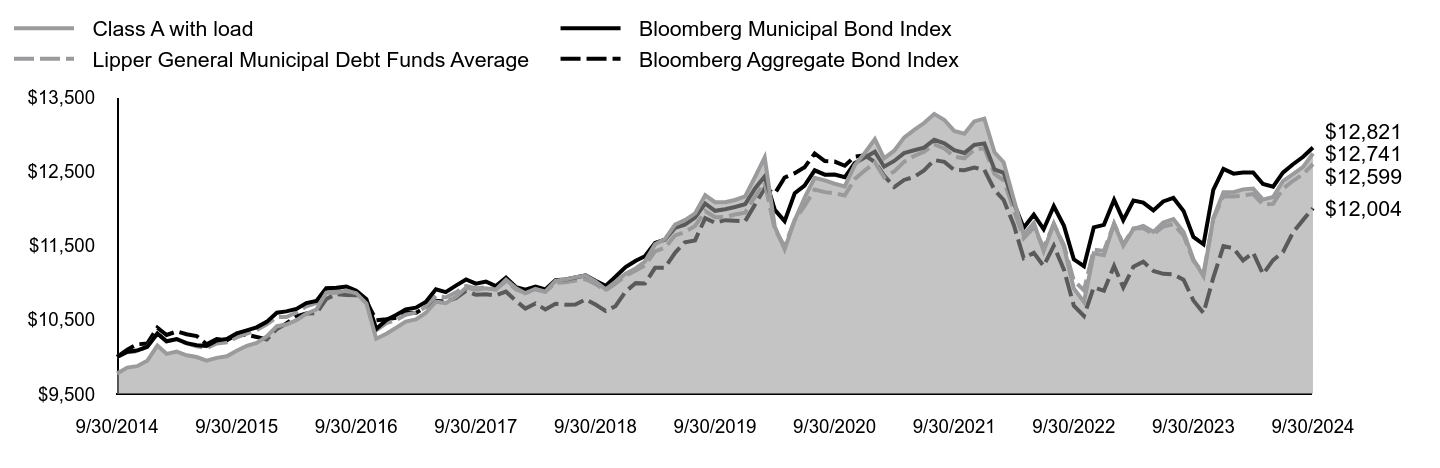
| Class A with load | Bloomberg Municipal Bond Index | Lipper General Municipal Debt Funds Average | Bloomberg Aggregate Bond Index |
|---|
| 9/30/2014 | $9,775 | $10,000 | $10,000 | $10,000 |
| 10/31/2014 | $9,856 | $10,069 | $10,064 | $10,098 |
| 11/30/2014 | $9,875 | $10,086 | $10,074 | $10,170 |
| 12/31/2014 | $9,948 | $10,137 | $10,139 | $10,179 |
| 1/31/2015 | $10,152 | $10,316 | $10,312 | $10,393 |
| 2/28/2015 | $10,041 | $10,210 | $10,208 | $10,295 |
| 3/31/2015 | $10,071 | $10,240 | $10,236 | $10,343 |
| 4/30/2015 | $10,022 | $10,186 | $10,181 | $10,306 |
| 5/31/2015 | $9,998 | $10,158 | $10,144 | $10,281 |
| 6/30/2015 | $9,949 | $10,148 | $10,118 | $10,169 |
| 7/31/2015 | $9,987 | $10,222 | $10,181 | $10,240 |
| 8/31/2015 | $10,008 | $10,242 | $10,197 | $10,225 |
| 9/30/2015 | $10,083 | $10,316 | $10,263 | $10,294 |
| 10/31/2015 | $10,150 | $10,357 | $10,312 | $10,296 |
| 11/30/2015 | $10,189 | $10,398 | $10,361 | $10,269 |
| 12/31/2015 | $10,275 | $10,472 | $10,440 | $10,235 |
| 1/31/2016 | $10,414 | $10,596 | $10,536 | $10,376 |
| 2/29/2016 | $10,436 | $10,613 | $10,538 | $10,450 |
| 3/31/2016 | $10,495 | $10,647 | $10,598 | $10,546 |
| 4/30/2016 | $10,581 | $10,725 | $10,681 | $10,586 |
| 5/31/2016 | $10,639 | $10,754 | $10,725 | $10,589 |
| 6/30/2016 | $10,863 | $10,925 | $10,897 | $10,779 |
| 7/31/2016 | $10,864 | $10,932 | $10,889 | $10,847 |
| 8/31/2016 | $10,893 | $10,947 | $10,914 | $10,835 |
| 9/30/2016 | $10,858 | $10,892 | $10,865 | $10,829 |
| 10/31/2016 | $10,719 | $10,778 | $10,758 | $10,746 |
| 11/30/2016 | $10,245 | $10,376 | $10,359 | $10,492 |
| 12/31/2016 | $10,312 | $10,497 | $10,455 | $10,506 |
| 1/31/2017 | $10,397 | $10,567 | $10,501 | $10,527 |
| 2/28/2017 | $10,475 | $10,640 | $10,568 | $10,598 |
| 3/31/2017 | $10,504 | $10,663 | $10,597 | $10,592 |
| 4/30/2017 | $10,591 | $10,740 | $10,672 | $10,674 |
| 5/31/2017 | $10,744 | $10,911 | $10,823 | $10,756 |
| 6/30/2017 | $10,725 | $10,872 | $10,800 | $10,745 |
| 7/31/2017 | $10,810 | $10,960 | $10,869 | $10,792 |
| 8/31/2017 | $10,934 | $11,043 | $10,956 | $10,888 |
| 9/30/2017 | $10,905 | $10,987 | $10,924 | $10,836 |
| 10/31/2017 | $10,924 | $11,014 | $10,938 | $10,843 |
| 11/30/2017 | $10,905 | $10,955 | $10,909 | $10,829 |
| 12/31/2017 | $11,041 | $11,069 | $11,019 | $10,879 |
| 1/31/2018 | $10,925 | $10,939 | $10,907 | $10,753 |
| 2/28/2018 | $10,858 | $10,906 | $10,863 | $10,651 |
| 3/31/2018 | $10,916 | $10,947 | $10,907 | $10,720 |
| 4/30/2018 | $10,878 | $10,908 | $10,876 | $10,640 |
| 5/31/2018 | $11,025 | $11,033 | $10,998 | $10,716 |
| 6/30/2018 | $11,045 | $11,042 | $11,007 | $10,703 |
| 7/31/2018 | $11,075 | $11,069 | $11,029 | $10,705 |
| 8/31/2018 | $11,095 | $11,097 | $11,046 | $10,774 |
| 9/30/2018 | $11,017 | $11,025 | $10,982 | $10,705 |
| 10/31/2018 | $10,909 | $10,957 | $10,895 | $10,620 |
| 11/30/2018 | $11,010 | $11,079 | $10,986 | $10,683 |
| 12/31/2018 | $11,121 | $11,211 | $11,095 | $10,880 |
| 1/31/2019 | $11,192 | $11,296 | $11,165 | $10,995 |
| 2/28/2019 | $11,285 | $11,357 | $11,233 | $10,989 |
| 3/31/2019 | $11,517 | $11,536 | $11,422 | $11,200 |
| 4/30/2019 | $11,588 | $11,579 | $11,472 | $11,203 |
| 5/31/2019 | $11,781 | $11,739 | $11,637 | $11,402 |
| 6/30/2019 | $11,843 | $11,782 | $11,682 | $11,545 |
| 7/31/2019 | $11,934 | $11,877 | $11,763 | $11,570 |
| 8/31/2019 | $12,178 | $12,065 | $11,965 | $11,870 |
| 9/30/2019 | $12,085 | $11,968 | $11,883 | $11,807 |
| 10/31/2019 | $12,084 | $11,989 | $11,885 | $11,842 |
| 11/30/2019 | $12,114 | $12,019 | $11,918 | $11,836 |
| 12/31/2019 | $12,163 | $12,056 | $11,943 | $11,828 |
| 1/31/2020 | $12,430 | $12,273 | $12,164 | $12,056 |
| 2/29/2020 | $12,687 | $12,431 | $12,348 | $12,273 |
| 3/31/2020 | $11,752 | $11,980 | $11,717 | $12,201 |
| 4/30/2020 | $11,449 | $11,830 | $11,490 | $12,417 |
| 5/31/2020 | $11,843 | $12,206 | $11,848 | $12,475 |
| 6/30/2020 | $12,144 | $12,307 | $12,035 | $12,554 |
| 7/31/2020 | $12,413 | $12,514 | $12,256 | $12,741 |
| 8/31/2020 | $12,378 | $12,455 | $12,220 | $12,638 |
| 9/30/2020 | $12,333 | $12,458 | $12,205 | $12,632 |
| 10/31/2020 | $12,298 | $12,420 | $12,174 | $12,575 |
| 11/30/2020 | $12,581 | $12,608 | $12,395 | $12,699 |
| 12/31/2020 | $12,747 | $12,685 | $12,511 | $12,716 |
| 1/31/2021 | $12,935 | $12,765 | $12,619 | $12,625 |
| 2/28/2021 | $12,676 | $12,563 | $12,419 | $12,443 |
| 3/31/2021 | $12,778 | $12,640 | $12,500 | $12,287 |
| 4/30/2021 | $12,955 | $12,746 | $12,627 | $12,384 |
| 5/31/2021 | $13,059 | $12,784 | $12,709 | $12,425 |
| 6/30/2021 | $13,151 | $12,819 | $12,764 | $12,512 |
| 7/31/2021 | $13,274 | $12,925 | $12,862 | $12,652 |
| 8/31/2021 | $13,192 | $12,878 | $12,809 | $12,628 |
| 9/30/2021 | $13,045 | $12,785 | $12,698 | $12,518 |
| 10/31/2021 | $13,006 | $12,748 | $12,676 | $12,515 |
| 11/30/2021 | $13,173 | $12,856 | $12,792 | $12,552 |
| 12/31/2021 | $13,210 | $12,877 | $12,811 | $12,520 |
| 1/31/2022 | $12,757 | $12,525 | $12,465 | $12,250 |
| 2/28/2022 | $12,620 | $12,480 | $12,380 | $12,114 |
| 3/31/2022 | $12,121 | $12,075 | $11,977 | $11,777 |
| 4/30/2022 | $11,645 | $11,741 | $11,599 | $11,330 |
| 5/31/2022 | $11,804 | $11,916 | $11,745 | $11,403 |
| 6/30/2022 | $11,425 | $11,720 | $11,471 | $11,224 |
| 7/31/2022 | $11,795 | $12,030 | $11,789 | $11,498 |
| 8/31/2022 | $11,481 | $11,766 | $11,504 | $11,174 |
| 9/30/2022 | $10,922 | $11,315 | $11,028 | $10,691 |
| 10/31/2022 | $10,741 | $11,221 | $10,896 | $10,552 |
| 11/30/2022 | $11,395 | $11,746 | $11,444 | $10,940 |
| 12/31/2022 | $11,370 | $11,779 | $11,428 | $10,891 |
| 1/31/2023 | $11,793 | $12,117 | $11,794 | $11,226 |
| 2/28/2023 | $11,499 | $11,843 | $11,514 | $10,936 |
| 3/31/2023 | $11,723 | $12,106 | $11,731 | $11,214 |
| 4/30/2023 | $11,766 | $12,079 | $11,736 | $11,282 |
| 5/31/2023 | $11,685 | $11,974 | $11,653 | $11,159 |
| 6/30/2023 | $11,811 | $12,094 | $11,756 | $11,119 |
| 7/31/2023 | $11,856 | $12,142 | $11,789 | $11,111 |
| 8/31/2023 | $11,684 | $11,967 | $11,637 | $11,040 |
| 9/30/2023 | $11,317 | $11,616 | $11,297 | $10,760 |
| 10/31/2023 | $11,087 | $11,517 | $11,125 | $10,590 |
| 11/30/2023 | $11,872 | $12,249 | $11,860 | $11,069 |
| 12/31/2023 | $12,219 | $12,533 | $12,169 | $11,493 |
| 1/31/2024 | $12,220 | $12,469 | $12,161 | $11,462 |
| 2/29/2024 | $12,257 | $12,485 | $12,178 | $11,300 |
| 3/31/2024 | $12,269 | $12,485 | $12,194 | $11,404 |
| 4/30/2024 | $12,119 | $12,330 | $12,052 | $11,116 |
| 5/31/2024 | $12,155 | $12,294 | $12,061 | $11,304 |
| 6/30/2024 | $12,368 | $12,482 | $12,265 | $11,412 |
| 7/31/2024 | $12,464 | $12,596 | $12,373 | $11,678 |
| 8/31/2024 | $12,560 | $12,696 | $12,462 | $11,846 |
| 9/30/2024 | $12,741 | $12,821 | $12,599 | $12,004 |
The Fund’s benchmarks are unmanaged indices used as a general measure of market performance. Calculations assume the reinvestment of dividends and capital gains.
Average Annual Total Returns (%)
| 1 Year | 5 Years | 10 Years |
|---|
| Class A at NAV | 12.58% | 1.06% | 2.69% |
| Class A with sales charge | 10.01% | 0.61% | 2.45% |
| Bloomberg Municipal Bond Index | 10.37% | 1.39% | 2.52% |
| Lipper General Municipal Debt Funds Average | 11.53% | 1.18% | 2.34% |
Bloomberg Aggregate Bond IndexFootnote Reference* | 11.57% | 0.33% | 1.84% |
| Footnote | Description |
Footnote* | The Fund has adopted the Bloomberg Aggregate Bond Index as its broad-based securities market index. |
The Fund's past performance is no guarantee of future results. The returns do not reflect the deduction of taxes that a shareholder would pay on Fund distributions or redemption of Fund shares.
(as of September 30, 2024)
| Total Net Assets | $4,759,225,524 |
| # of Portfolio Holdings | 744 |
| Portfolio Turnover Rate | 27% |
| Total Advisory Fees Paid | $16,281,601 |
What did the Fund invest in?
(as of September 30, 2024)
Credit Rating S&P or Moody'sFootnote Reference(a) | %Footnote Reference** |
|---|
| |
- A12.57%
- A-9.95%
- A+12.51%
- AA13.25%
- AA-7.93%
- AA+6.40%
- AAA3.72%
- B0.27%
- B-0.35%
- B+0.17%
- BB1.37%
- BB-0.62%
- BB+2.12%
- BBB5.29%
- BBB-9.72%
- BBB+7.92%
- CCC+0.14%
- NR5.70%
- Total 100.00%
| Footnote | Description |
Footnote** | Represents percent of total investments, which excludes derivatives. |
Footnote(a) | Investments in investment grade municipal bonds, which as bonds that are rated, at the time of purchase, within the four highest grades assigned by an independent rating agency such as Moody’s, S&P, or Fitch, or an equivalent short-term rating, as applicable, or are unrated by rating agencies but deemed by Lord Abbett to be of comparable quality. Lower rated municipal bonds are rated, at the time of purchase, or an equivalent short-term rating, as applicable, by an independent rating agency or are unrated by rating agencies but deemed by Lord Abbett to be of comparable quality. |
There were no material fund changes during the period.
Where can I find additional information about the Fund?
For additional information about the Fund, including its Prospectus, Statement of Additional Information, financial statements, holdings and proxy information, please visit lordabbett.com/FundDocuments.
The Fund has adopted a policy that allows it to send only one copy of the Fund's prospectus, proxy material, annual report and semiannual report (or related notice of internet availability of annual report and semiannual report) to certain shareholders residing at the same "household." This reduces Fund expenses, which benefits you and other shareholders.If you need additional copies or do not want your mailings to be "householded," please call Lord Abbett at 888-522-2388.
Lord Abbett National Tax Free Fund
Annual Shareholder Report
September 30, 2024
lordabbett.com/FundDocuments
TSR-A-6-A
11/24
Lord Abbett National Tax Free Fund
Annual Shareholder Report
September 30, 2024
lordabbett.com/FundDocuments
This annual shareholder report contains important information about the Lord Abbett National Tax Free Fund for the period of October 1, 2023 to September 30, 2024, as well as certain changes to the Fund. You can find additional information about the Fund at lordabbett.com/FundDocuments. You can also request this information by contacting us at 888-522-2388.
What were the Fund costs for the last year?
(based on a hypothetical $10,000 investment)
| Class Name | Costs of a $10,000 investment | Costs paid as a percentage of a $10,000 investment |
|---|
| Class C | $148 | 1.40% |
How did the Fund perform last year and what affected its performance?
For the fiscal year ended September 30, 2024, the Fund returned 11.89%, reflecting performance at the net asset value (NAV) of Class C shares, compared to the 10.37% of a securities market index with investment characteristics similar to those of the Fund, the Bloomberg Municipal Bond Index. The Fund's broad-based market index, the Bloomberg Aggregate Bond Index, returned 11.57% over the same period.
Positive factors for the municipal market included decreasing Treasury yields, easing inflationary pressures and the start of interest rate cuts by the U.S. Federal Reserve. Also supporting the market was increased demand for municipal bond funds and a strong fundamental backdrop as evidenced by growing tax revenue and positive ratings actions by public ratings agencies. Negative factors included a significant increase in municipal bond supply, which pressured the market in second half of the fiscal year, and periods of interest rate volatility driven by sticky inflation readings at points throughout the fiscal year. Against this backdrop, municipal bonds delivered strong returns.
Top contributors to the Fund’s performance: An overweight allocation to BBB-rated and non-investment grade bonds contributed to relative performance. The Fund’s longer duration positioning relative to the prospectus benchmark led to a positive impact as yields fell over the period. An overweight allocation to the Health Care and Special Tax sectors contributed to relative performance. An underweight allocation to the State General Obligation bonds contributed to relative performance.
Top detractors from the Fund’s performance: Security selection within the Health Care, Education and Leasing sectors detracted from relative performance.
Total Return Based on $10,000 Investment
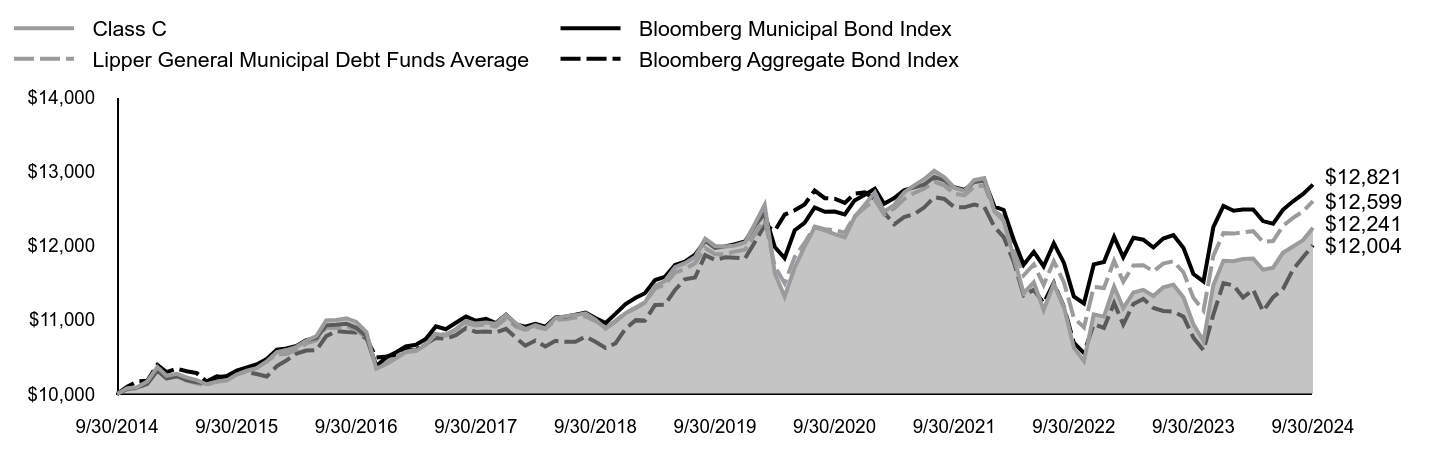
| Class C | Bloomberg Municipal Bond Index | Lipper General Municipal Debt Funds Average | Bloomberg Aggregate Bond Index |
|---|
| 9/30/2014 | $10,000 | $10,000 | $10,000 | $10,000 |
| 10/31/2014 | $10,078 | $10,069 | $10,064 | $10,098 |
| 11/30/2014 | $10,092 | $10,086 | $10,074 | $10,170 |
| 12/31/2014 | $10,170 | $10,137 | $10,139 | $10,179 |
| 1/31/2015 | $10,364 | $10,316 | $10,312 | $10,393 |
| 2/28/2015 | $10,246 | $10,210 | $10,208 | $10,295 |
| 3/31/2015 | $10,271 | $10,240 | $10,236 | $10,343 |
| 4/30/2015 | $10,224 | $10,186 | $10,181 | $10,306 |
| 5/31/2015 | $10,186 | $10,158 | $10,144 | $10,281 |
| 6/30/2015 | $10,131 | $10,148 | $10,118 | $10,169 |
| 7/31/2015 | $10,164 | $10,222 | $10,181 | $10,240 |
| 8/31/2015 | $10,181 | $10,242 | $10,197 | $10,225 |
| 9/30/2015 | $10,261 | $10,316 | $10,263 | $10,294 |
| 10/31/2015 | $10,313 | $10,357 | $10,312 | $10,296 |
| 11/30/2015 | $10,348 | $10,398 | $10,361 | $10,269 |
| 12/31/2015 | $10,439 | $10,472 | $10,440 | $10,235 |
| 1/31/2016 | $10,565 | $10,596 | $10,536 | $10,376 |
| 2/29/2016 | $10,592 | $10,613 | $10,538 | $10,450 |
| 3/31/2016 | $10,636 | $10,647 | $10,598 | $10,546 |
| 4/30/2016 | $10,718 | $10,725 | $10,681 | $10,586 |
| 5/31/2016 | $10,781 | $10,754 | $10,725 | $10,589 |
| 6/30/2016 | $10,992 | $10,925 | $10,897 | $10,779 |
| 7/31/2016 | $10,998 | $10,932 | $10,889 | $10,847 |
| 8/31/2016 | $11,021 | $10,947 | $10,914 | $10,835 |
| 9/30/2016 | $10,970 | $10,892 | $10,865 | $10,829 |
| 10/31/2016 | $10,834 | $10,778 | $10,758 | $10,746 |
| 11/30/2016 | $10,341 | $10,376 | $10,359 | $10,492 |
| 12/31/2016 | $10,403 | $10,497 | $10,455 | $10,506 |
| 1/31/2017 | $10,483 | $10,567 | $10,501 | $10,527 |
| 2/28/2017 | $10,565 | $10,640 | $10,568 | $10,598 |
| 3/31/2017 | $10,580 | $10,663 | $10,597 | $10,592 |
| 4/30/2017 | $10,662 | $10,740 | $10,672 | $10,674 |
| 5/31/2017 | $10,810 | $10,911 | $10,823 | $10,756 |
| 6/30/2017 | $10,785 | $10,872 | $10,800 | $10,745 |
| 7/31/2017 | $10,875 | $10,960 | $10,869 | $10,792 |
| 8/31/2017 | $10,984 | $11,043 | $10,956 | $10,888 |
| 9/30/2017 | $10,949 | $10,987 | $10,924 | $10,836 |
| 10/31/2017 | $10,963 | $11,014 | $10,938 | $10,843 |
| 11/30/2017 | $10,948 | $10,955 | $10,909 | $10,829 |
| 12/31/2017 | $11,068 | $11,069 | $11,019 | $10,879 |
| 1/31/2018 | $10,947 | $10,939 | $10,907 | $10,753 |
| 2/28/2018 | $10,875 | $10,906 | $10,863 | $10,651 |
| 3/31/2018 | $10,927 | $10,947 | $10,907 | $10,720 |
| 4/30/2018 | $10,883 | $10,908 | $10,876 | $10,640 |
| 5/31/2018 | $11,024 | $11,033 | $10,998 | $10,716 |
| 6/30/2018 | $11,048 | $11,042 | $11,007 | $10,703 |
| 7/31/2018 | $11,063 | $11,069 | $11,029 | $10,705 |
| 8/31/2018 | $11,087 | $11,097 | $11,046 | $10,774 |
| 9/30/2018 | $11,003 | $11,025 | $10,982 | $10,705 |
| 10/31/2018 | $10,880 | $10,957 | $10,895 | $10,620 |
| 11/30/2018 | $10,975 | $11,079 | $10,986 | $10,683 |
| 12/31/2018 | $11,090 | $11,211 | $11,095 | $10,880 |
| 1/31/2019 | $11,155 | $11,296 | $11,165 | $10,995 |
| 2/28/2019 | $11,232 | $11,357 | $11,233 | $10,989 |
| 3/31/2019 | $11,457 | $11,536 | $11,422 | $11,200 |
| 4/30/2019 | $11,522 | $11,579 | $11,472 | $11,203 |
| 5/31/2019 | $11,708 | $11,739 | $11,637 | $11,402 |
| 6/30/2019 | $11,763 | $11,782 | $11,682 | $11,545 |
| 7/31/2019 | $11,847 | $11,877 | $11,763 | $11,570 |
| 8/31/2019 | $12,093 | $12,065 | $11,965 | $11,870 |
| 9/30/2019 | $11,995 | $11,968 | $11,883 | $11,807 |
| 10/31/2019 | $11,988 | $11,989 | $11,885 | $11,842 |
| 11/30/2019 | $12,001 | $12,019 | $11,918 | $11,836 |
| 12/31/2019 | $12,044 | $12,056 | $11,943 | $11,828 |
| 1/31/2020 | $12,301 | $12,273 | $12,164 | $12,056 |
| 2/29/2020 | $12,548 | $12,431 | $12,348 | $12,273 |
| 3/31/2020 | $11,628 | $11,980 | $11,717 | $12,201 |
| 4/30/2020 | $11,313 | $11,830 | $11,490 | $12,417 |
| 5/31/2020 | $11,705 | $12,206 | $11,848 | $12,475 |
| 6/30/2020 | $11,986 | $12,307 | $12,035 | $12,554 |
| 7/31/2020 | $12,245 | $12,514 | $12,256 | $12,741 |
| 8/31/2020 | $12,204 | $12,455 | $12,220 | $12,638 |
| 9/30/2020 | $12,153 | $12,458 | $12,205 | $12,632 |
| 10/31/2020 | $12,112 | $12,420 | $12,174 | $12,575 |
| 11/30/2020 | $12,383 | $12,608 | $12,395 | $12,699 |
| 12/31/2020 | $12,549 | $12,685 | $12,511 | $12,716 |
| 1/31/2021 | $12,717 | $12,765 | $12,619 | $12,625 |
| 2/28/2021 | $12,456 | $12,563 | $12,419 | $12,443 |
| 3/31/2021 | $12,549 | $12,640 | $12,500 | $12,287 |
| 4/30/2021 | $12,716 | $12,746 | $12,627 | $12,384 |
| 5/31/2021 | $12,811 | $12,784 | $12,709 | $12,425 |
| 6/30/2021 | $12,894 | $12,819 | $12,764 | $12,512 |
| 7/31/2021 | $13,007 | $12,925 | $12,862 | $12,652 |
| 8/31/2021 | $12,920 | $12,878 | $12,809 | $12,628 |
| 9/30/2021 | $12,780 | $12,785 | $12,698 | $12,518 |
| 10/31/2021 | $12,735 | $12,748 | $12,676 | $12,515 |
| 11/30/2021 | $12,881 | $12,856 | $12,792 | $12,552 |
| 12/31/2021 | $12,910 | $12,877 | $12,811 | $12,520 |
| 1/31/2022 | $12,461 | $12,525 | $12,465 | $12,250 |
| 2/28/2022 | $12,332 | $12,480 | $12,380 | $12,114 |
| 3/31/2022 | $11,839 | $12,075 | $11,977 | $11,777 |
| 4/30/2022 | $11,358 | $11,741 | $11,599 | $11,330 |
| 5/31/2022 | $11,506 | $11,916 | $11,745 | $11,403 |
| 6/30/2022 | $11,132 | $11,720 | $11,471 | $11,224 |
| 7/31/2022 | $11,486 | $12,030 | $11,789 | $11,498 |
| 8/31/2022 | $11,174 | $11,766 | $11,504 | $11,174 |
| 9/30/2022 | $10,626 | $11,315 | $11,028 | $10,691 |
| 10/31/2022 | $10,443 | $11,221 | $10,896 | $10,552 |
| 11/30/2022 | $11,074 | $11,746 | $11,444 | $10,940 |
| 12/31/2022 | $11,043 | $11,779 | $11,428 | $10,891 |
| 1/31/2023 | $11,447 | $12,117 | $11,794 | $11,226 |
| 2/28/2023 | $11,157 | $11,843 | $11,514 | $10,936 |
| 3/31/2023 | $11,368 | $12,106 | $11,731 | $11,214 |
| 4/30/2023 | $11,404 | $12,079 | $11,736 | $11,282 |
| 5/31/2023 | $11,320 | $11,974 | $11,653 | $11,159 |
| 6/30/2023 | $11,436 | $12,094 | $11,756 | $11,119 |
| 7/31/2023 | $11,473 | $12,142 | $11,789 | $11,111 |
| 8/31/2023 | $11,301 | $11,967 | $11,637 | $11,040 |
| 9/30/2023 | $10,941 | $11,616 | $11,297 | $10,760 |
| 10/31/2023 | $10,713 | $11,517 | $11,125 | $10,590 |
| 11/30/2023 | $11,465 | $12,249 | $11,860 | $11,069 |
| 12/31/2023 | $11,794 | $12,533 | $12,169 | $11,493 |
| 1/31/2024 | $11,789 | $12,469 | $12,161 | $11,462 |
| 2/29/2024 | $11,819 | $12,485 | $12,178 | $11,300 |
| 3/31/2024 | $11,825 | $12,485 | $12,194 | $11,404 |
| 4/30/2024 | $11,674 | $12,330 | $12,052 | $11,116 |
| 5/31/2024 | $11,703 | $12,294 | $12,061 | $11,304 |
| 6/30/2024 | $11,902 | $12,482 | $12,265 | $11,412 |
| 7/31/2024 | $11,987 | $12,596 | $12,373 | $11,678 |
| 8/31/2024 | $12,074 | $12,696 | $12,462 | $11,846 |
| 9/30/2024 | $12,241 | $12,821 | $12,599 | $12,004 |
The Fund’s benchmarks are unmanaged indices used as a general measure of market performance. Calculations assume the reinvestment of dividends and capital gains.
Average Annual Total Returns (%)
| 1 Year | 5 Years | 10 Years |
|---|
| Class C at NAV | 11.89% | 0.41% | 2.04% |
| Class C with sales charge | 10.89% | 0.41% | 2.04% |
| Bloomberg Municipal Bond Index | 10.37% | 1.39% | 2.52% |
| Lipper General Municipal Debt Funds Average | 11.53% | 1.18% | 2.34% |
Bloomberg Aggregate Bond IndexFootnote Reference* | 11.57% | 0.33% | 1.84% |
| Footnote | Description |
Footnote* | The Fund has adopted the Bloomberg Aggregate Bond Index as its broad-based securities market index. |
The Fund's past performance is no guarantee of future results. The returns do not reflect the deduction of taxes that a shareholder would pay on Fund distributions or redemption of Fund shares.
(as of September 30, 2024)
| Total Net Assets | $4,759,225,524 |
| # of Portfolio Holdings | 744 |
| Portfolio Turnover Rate | 27% |
| Total Advisory Fees Paid | $16,281,601 |
What did the Fund invest in?
(as of September 30, 2024)
Credit Rating S&P or Moody'sFootnote Reference(a) | %Footnote Reference** |
|---|
| |
- A12.57%
- A-9.95%
- A+12.51%
- AA13.25%
- AA-7.93%
- AA+6.40%
- AAA3.72%
- B0.27%
- B-0.35%
- B+0.17%
- BB1.37%
- BB-0.62%
- BB+2.12%
- BBB5.29%
- BBB-9.72%
- BBB+7.92%
- CCC+0.14%
- NR5.70%
- Total 100.00%
| Footnote | Description |
Footnote** | Represents percent of total investments, which excludes derivatives. |
Footnote(a) | Investments in investment grade municipal bonds, which as bonds that are rated, at the time of purchase, within the four highest grades assigned by an independent rating agency such as Moody’s, S&P, or Fitch, or an equivalent short-term rating, as applicable, or are unrated by rating agencies but deemed by Lord Abbett to be of comparable quality. Lower rated municipal bonds are rated, at the time of purchase, or an equivalent short-term rating, as applicable, by an independent rating agency or are unrated by rating agencies but deemed by Lord Abbett to be of comparable quality. |
There were no material fund changes during the period.
Where can I find additional information about the Fund?
For additional information about the Fund, including its Prospectus, Statement of Additional Information, financial statements, holdings and proxy information, please visit lordabbett.com/FundDocuments.
The Fund has adopted a policy that allows it to send only one copy of the Fund's prospectus, proxy material, annual report and semiannual report (or related notice of internet availability of annual report and semiannual report) to certain shareholders residing at the same "household." This reduces Fund expenses, which benefits you and other shareholders.If you need additional copies or do not want your mailings to be "householded," please call Lord Abbett at 888-522-2388.
Lord Abbett National Tax Free Fund
Annual Shareholder Report
September 30, 2024
lordabbett.com/FundDocuments
TSR-A-669-C
11/24
Lord Abbett National Tax Free Fund
Annual Shareholder Report
September 30, 2024
lordabbett.com/FundDocuments
This annual shareholder report contains important information about the Lord Abbett National Tax Free Fund for the period of October 1, 2023 to September 30, 2024, as well as certain changes to the Fund. You can find additional information about the Fund at lordabbett.com/FundDocuments. You can also request this information by contacting us at 888-522-2388.
What were the Fund costs for the last year?
(based on a hypothetical $10,000 investment)
| Class Name | Costs of a $10,000 investment | Costs paid as a percentage of a $10,000 investment |
|---|
| Class F | $72 | 0.68% |
How did the Fund perform last year and what affected its performance?
For the fiscal year ended September 30, 2024, the Fund returned 12.60%, reflecting performance at the net asset value (NAV) of Class F shares, compared to the 10.37% of a securities market index with investment characteristics similar to those of the Fund, the Bloomberg Municipal Bond Index. The Fund's broad-based market index, the Bloomberg Aggregate Bond Index, returned 11.57% over the same period.
Positive factors for the municipal market included decreasing Treasury yields, easing inflationary pressures and the start of interest rate cuts by the U.S. Federal Reserve. Also supporting the market was increased demand for municipal bond funds and a strong fundamental backdrop as evidenced by growing tax revenue and positive ratings actions by public ratings agencies. Negative factors included a significant increase in municipal bond supply, which pressured the market in second half of the fiscal year, and periods of interest rate volatility driven by sticky inflation readings at points throughout the fiscal year. Against this backdrop, municipal bonds delivered strong returns.
Top contributors to the Fund’s performance: An overweight allocation to BBB-rated and non-investment grade bonds contributed to relative performance. The Fund’s longer duration positioning relative to the prospectus benchmark led to a positive impact as yields fell over the period. An overweight allocation to the Health Care and Special Tax sectors contributed to relative performance. An underweight allocation to the State General Obligation bonds contributed to relative performance.
Top detractors from the Fund’s performance: Security selection within the Health Care, Education and Leasing sectors detracted from relative performance.
Total Return Based on $10,000 Investment
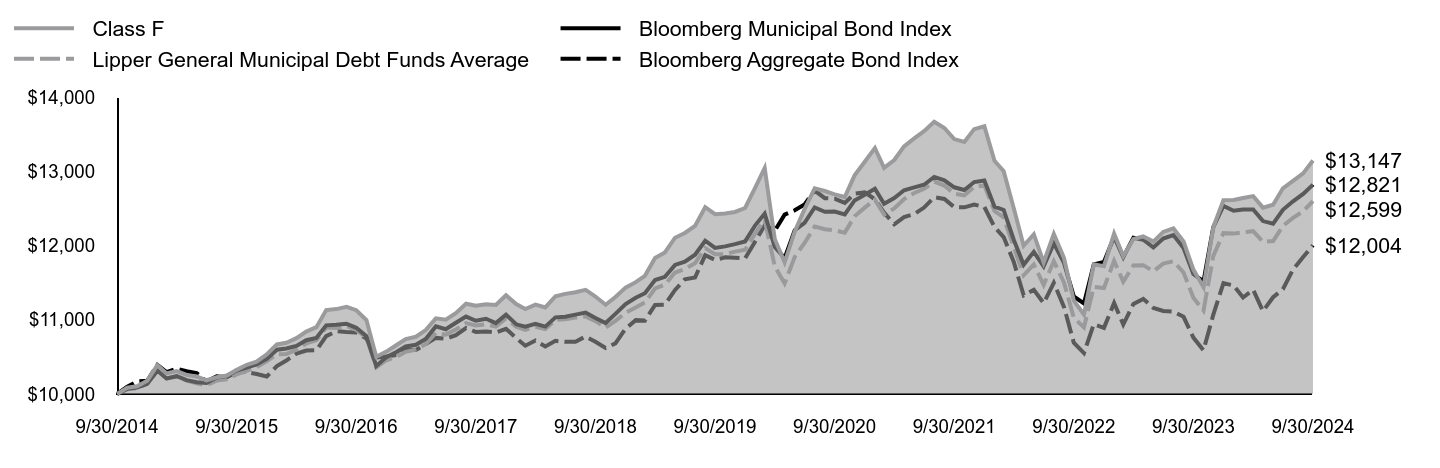
| Class F | Bloomberg Municipal Bond Index | Lipper General Municipal Debt Funds Average | Bloomberg Aggregate Bond Index |
|---|
| 9/30/2014 | $10,000 | $10,000 | $10,000 | $10,000 |
| 10/31/2014 | $10,084 | $10,069 | $10,064 | $10,098 |
| 11/30/2014 | $10,104 | $10,086 | $10,074 | $10,170 |
| 12/31/2014 | $10,180 | $10,137 | $10,139 | $10,179 |
| 1/31/2015 | $10,389 | $10,316 | $10,312 | $10,393 |
| 2/28/2015 | $10,277 | $10,210 | $10,208 | $10,295 |
| 3/31/2015 | $10,308 | $10,240 | $10,236 | $10,343 |
| 4/30/2015 | $10,258 | $10,186 | $10,181 | $10,306 |
| 5/31/2015 | $10,235 | $10,158 | $10,144 | $10,281 |
| 6/30/2015 | $10,185 | $10,148 | $10,118 | $10,169 |
| 7/31/2015 | $10,225 | $10,222 | $10,181 | $10,240 |
| 8/31/2015 | $10,248 | $10,242 | $10,197 | $10,225 |
| 9/30/2015 | $10,325 | $10,316 | $10,263 | $10,294 |
| 10/31/2015 | $10,394 | $10,357 | $10,312 | $10,296 |
| 11/30/2015 | $10,436 | $10,398 | $10,361 | $10,269 |
| 12/31/2015 | $10,533 | $10,472 | $10,440 | $10,235 |
| 1/31/2016 | $10,668 | $10,596 | $10,536 | $10,376 |
| 2/29/2016 | $10,691 | $10,613 | $10,538 | $10,450 |
| 3/31/2016 | $10,752 | $10,647 | $10,598 | $10,546 |
| 4/30/2016 | $10,841 | $10,725 | $10,681 | $10,586 |
| 5/31/2016 | $10,901 | $10,754 | $10,725 | $10,589 |
| 6/30/2016 | $11,131 | $10,925 | $10,897 | $10,779 |
| 7/31/2016 | $11,144 | $10,932 | $10,889 | $10,847 |
| 8/31/2016 | $11,174 | $10,947 | $10,914 | $10,835 |
| 9/30/2016 | $11,129 | $10,892 | $10,865 | $10,829 |
| 10/31/2016 | $10,997 | $10,778 | $10,758 | $10,746 |
| 11/30/2016 | $10,502 | $10,376 | $10,359 | $10,492 |
| 12/31/2016 | $10,571 | $10,497 | $10,455 | $10,506 |
| 1/31/2017 | $10,660 | $10,567 | $10,501 | $10,527 |
| 2/28/2017 | $10,740 | $10,640 | $10,568 | $10,598 |
| 3/31/2017 | $10,771 | $10,663 | $10,597 | $10,592 |
| 4/30/2017 | $10,861 | $10,740 | $10,672 | $10,674 |
| 5/31/2017 | $11,019 | $10,911 | $10,823 | $10,756 |
| 6/30/2017 | $11,000 | $10,872 | $10,800 | $10,745 |
| 7/31/2017 | $11,089 | $10,960 | $10,869 | $10,792 |
| 8/31/2017 | $11,216 | $11,043 | $10,956 | $10,888 |
| 9/30/2017 | $11,188 | $10,987 | $10,924 | $10,836 |
| 10/31/2017 | $11,208 | $11,014 | $10,938 | $10,843 |
| 11/30/2017 | $11,200 | $10,955 | $10,909 | $10,829 |
| 12/31/2017 | $11,330 | $11,069 | $11,019 | $10,879 |
| 1/31/2018 | $11,212 | $10,939 | $10,907 | $10,753 |
| 2/28/2018 | $11,144 | $10,906 | $10,863 | $10,651 |
| 3/31/2018 | $11,205 | $10,947 | $10,907 | $10,720 |
| 4/30/2018 | $11,166 | $10,908 | $10,876 | $10,640 |
| 5/31/2018 | $11,318 | $11,033 | $10,998 | $10,716 |
| 6/30/2018 | $11,349 | $11,042 | $11,007 | $10,703 |
| 7/31/2018 | $11,371 | $11,069 | $11,029 | $10,705 |
| 8/31/2018 | $11,403 | $11,097 | $11,046 | $10,774 |
| 9/30/2018 | $11,313 | $11,025 | $10,982 | $10,705 |
| 10/31/2018 | $11,203 | $10,957 | $10,895 | $10,620 |
| 11/30/2018 | $11,307 | $11,079 | $10,986 | $10,683 |
| 12/31/2018 | $11,433 | $11,211 | $11,095 | $10,880 |
| 1/31/2019 | $11,507 | $11,296 | $11,165 | $10,995 |
| 2/28/2019 | $11,593 | $11,357 | $11,233 | $10,989 |
| 3/31/2019 | $11,832 | $11,536 | $11,422 | $11,200 |
| 4/30/2019 | $11,907 | $11,579 | $11,472 | $11,203 |
| 5/31/2019 | $12,106 | $11,739 | $11,637 | $11,402 |
| 6/30/2019 | $12,170 | $11,782 | $11,682 | $11,545 |
| 7/31/2019 | $12,265 | $11,877 | $11,763 | $11,570 |
| 8/31/2019 | $12,517 | $12,065 | $11,965 | $11,870 |
| 9/30/2019 | $12,422 | $11,968 | $11,883 | $11,807 |
| 10/31/2019 | $12,433 | $11,989 | $11,885 | $11,842 |
| 11/30/2019 | $12,453 | $12,019 | $11,918 | $11,836 |
| 12/31/2019 | $12,506 | $12,056 | $11,943 | $11,828 |
| 1/31/2020 | $12,781 | $12,273 | $12,164 | $12,056 |
| 2/29/2020 | $13,046 | $12,431 | $12,348 | $12,273 |
| 3/31/2020 | $12,085 | $11,980 | $11,717 | $12,201 |
| 4/30/2020 | $11,774 | $11,830 | $11,490 | $12,417 |
| 5/31/2020 | $12,191 | $12,206 | $11,848 | $12,475 |
| 6/30/2020 | $12,491 | $12,307 | $12,035 | $12,554 |
| 7/31/2020 | $12,770 | $12,514 | $12,256 | $12,741 |
| 8/31/2020 | $12,735 | $12,455 | $12,220 | $12,638 |
| 9/30/2020 | $12,689 | $12,458 | $12,205 | $12,632 |
| 10/31/2020 | $12,654 | $12,420 | $12,174 | $12,575 |
| 11/30/2020 | $12,946 | $12,608 | $12,395 | $12,699 |
| 12/31/2020 | $13,129 | $12,685 | $12,511 | $12,716 |
| 1/31/2021 | $13,313 | $12,765 | $12,619 | $12,625 |
| 2/28/2021 | $13,047 | $12,563 | $12,419 | $12,443 |
| 3/31/2021 | $13,153 | $12,640 | $12,500 | $12,287 |
| 4/30/2021 | $13,337 | $12,746 | $12,627 | $12,384 |
| 5/31/2021 | $13,445 | $12,784 | $12,709 | $12,425 |
| 6/30/2021 | $13,541 | $12,819 | $12,764 | $12,512 |
| 7/31/2021 | $13,668 | $12,925 | $12,862 | $12,652 |
| 8/31/2021 | $13,585 | $12,878 | $12,809 | $12,628 |
| 9/30/2021 | $13,435 | $12,785 | $12,698 | $12,518 |
| 10/31/2021 | $13,395 | $12,748 | $12,676 | $12,515 |
| 11/30/2021 | $13,569 | $12,856 | $12,792 | $12,552 |
| 12/31/2021 | $13,608 | $12,877 | $12,811 | $12,520 |
| 1/31/2022 | $13,142 | $12,525 | $12,465 | $12,250 |
| 2/28/2022 | $13,002 | $12,480 | $12,380 | $12,114 |
| 3/31/2022 | $12,500 | $12,075 | $11,977 | $11,777 |
| 4/30/2022 | $11,998 | $11,741 | $11,599 | $11,330 |
| 5/31/2022 | $12,152 | $11,916 | $11,745 | $11,403 |
| 6/30/2022 | $11,773 | $11,720 | $11,471 | $11,224 |
| 7/31/2022 | $12,156 | $12,030 | $11,789 | $11,498 |
| 8/31/2022 | $11,833 | $11,766 | $11,504 | $11,174 |
| 9/30/2022 | $11,258 | $11,315 | $11,028 | $10,691 |
| 10/31/2022 | $11,071 | $11,221 | $10,896 | $10,552 |
| 11/30/2022 | $11,748 | $11,746 | $11,444 | $10,940 |
| 12/31/2022 | $11,723 | $11,779 | $11,428 | $10,891 |
| 1/31/2023 | $12,160 | $12,117 | $11,794 | $11,226 |
| 2/28/2023 | $11,858 | $11,843 | $11,514 | $10,936 |
| 3/31/2023 | $12,089 | $12,106 | $11,731 | $11,214 |
| 4/30/2023 | $12,124 | $12,079 | $11,736 | $11,282 |
| 5/31/2023 | $12,053 | $11,974 | $11,653 | $11,159 |
| 6/30/2023 | $12,184 | $12,094 | $11,756 | $11,119 |
| 7/31/2023 | $12,231 | $12,142 | $11,789 | $11,111 |
| 8/31/2023 | $12,054 | $11,967 | $11,637 | $11,040 |
| 9/30/2023 | $11,676 | $11,616 | $11,297 | $10,760 |
| 10/31/2023 | $11,440 | $11,517 | $11,125 | $10,590 |
| 11/30/2023 | $12,251 | $12,249 | $11,860 | $11,069 |
| 12/31/2023 | $12,611 | $12,533 | $12,169 | $11,493 |
| 1/31/2024 | $12,613 | $12,469 | $12,161 | $11,462 |
| 2/29/2024 | $12,640 | $12,485 | $12,178 | $11,300 |
| 3/31/2024 | $12,666 | $12,485 | $12,194 | $11,404 |
| 4/30/2024 | $12,511 | $12,330 | $12,052 | $11,116 |
| 5/31/2024 | $12,550 | $12,294 | $12,061 | $11,304 |
| 6/30/2024 | $12,771 | $12,482 | $12,265 | $11,412 |
| 7/31/2024 | $12,871 | $12,596 | $12,373 | $11,678 |
| 8/31/2024 | $12,972 | $12,696 | $12,462 | $11,846 |
| 9/30/2024 | $13,147 | $12,821 | $12,599 | $12,004 |
The Fund’s benchmarks are unmanaged indices used as a general measure of market performance. Calculations assume the reinvestment of dividends and capital gains.
Average Annual Total Returns (%)
| 1 Year | 5 Years | 10 Years |
|---|
| Class F at NAV | 12.60% | 1.14% | 2.77% |
| Bloomberg Municipal Bond Index | 10.37% | 1.39% | 2.52% |
| Lipper General Municipal Debt Funds Average | 11.53% | 1.18% | 2.34% |
Bloomberg Aggregate Bond IndexFootnote Reference* | 11.57% | 0.33% | 1.84% |
| Footnote | Description |
Footnote* | The Fund has adopted the Bloomberg Aggregate Bond Index as its broad-based securities market index. |
The Fund's past performance is no guarantee of future results. The returns do not reflect the deduction of taxes that a shareholder would pay on Fund distributions or redemption of Fund shares.
(as of September 30, 2024)
| Total Net Assets | $4,759,225,524 |
| # of Portfolio Holdings | 744 |
| Portfolio Turnover Rate | 27% |
| Total Advisory Fees Paid | $16,281,601 |
What did the Fund invest in?
(as of September 30, 2024)
Credit Rating S&P or Moody'sFootnote Reference(a) | %Footnote Reference** |
|---|
| |
- A12.57%
- A-9.95%
- A+12.51%
- AA13.25%
- AA-7.93%
- AA+6.40%
- AAA3.72%
- B0.27%
- B-0.35%
- B+0.17%
- BB1.37%
- BB-0.62%
- BB+2.12%
- BBB5.29%
- BBB-9.72%
- BBB+7.92%
- CCC+0.14%
- NR5.70%
- Total 100.00%
| Footnote | Description |
Footnote** | Represents percent of total investments, which excludes derivatives. |
Footnote(a) | Investments in investment grade municipal bonds, which as bonds that are rated, at the time of purchase, within the four highest grades assigned by an independent rating agency such as Moody’s, S&P, or Fitch, or an equivalent short-term rating, as applicable, or are unrated by rating agencies but deemed by Lord Abbett to be of comparable quality. Lower rated municipal bonds are rated, at the time of purchase, or an equivalent short-term rating, as applicable, by an independent rating agency or are unrated by rating agencies but deemed by Lord Abbett to be of comparable quality. |
There were no material fund changes during the period.
Where can I find additional information about the Fund?
For additional information about the Fund, including its Prospectus, Statement of Additional Information, financial statements, holdings and proxy information, please visit lordabbett.com/FundDocuments.
The Fund has adopted a policy that allows it to send only one copy of the Fund's prospectus, proxy material, annual report and semiannual report (or related notice of internet availability of annual report and semiannual report) to certain shareholders residing at the same "household." This reduces Fund expenses, which benefits you and other shareholders.If you need additional copies or do not want your mailings to be "householded," please call Lord Abbett at 888-522-2388.
Lord Abbett National Tax Free Fund
Annual Shareholder Report
September 30, 2024
lordabbett.com/FundDocuments
TSR-A-1034-F
11/24
Lord Abbett National Tax Free Fund
Annual Shareholder Report
September 30, 2024
lordabbett.com/FundDocuments
This annual shareholder report contains important information about the Lord Abbett National Tax Free Fund for the period of October 1, 2023 to September 30, 2024, as well as certain changes to the Fund. You can find additional information about the Fund at lordabbett.com/FundDocuments. You can also request this information by contacting us at 888-522-2388.
What were the Fund costs for the last year?
(based on a hypothetical $10,000 investment)
| Class Name | Costs of a $10,000 investment | Costs paid as a percentage of a $10,000 investment |
|---|
| Class F3 | $57 | 0.54% |
How did the Fund perform last year and what affected its performance?
For the fiscal year ended September 30, 2024, the Fund returned 12.86%, reflecting performance at the net asset value (NAV) of Class F3 shares, compared to the 10.37% of a securities market index with investment characteristics similar to those of the Fund, the Bloomberg Municipal Bond Index. The Fund's broad-based market index, the Bloomberg Aggregate Bond Index, returned 11.57% over the same period.
Positive factors for the municipal market included decreasing Treasury yields, easing inflationary pressures and the start of interest rate cuts by the U.S. Federal Reserve. Also supporting the market was increased demand for municipal bond funds and a strong fundamental backdrop as evidenced by growing tax revenue and positive ratings actions by public ratings agencies. Negative factors included a significant increase in municipal bond supply, which pressured the market in second half of the fiscal year, and periods of interest rate volatility driven by sticky inflation readings at points throughout the fiscal year. Against this backdrop, municipal bonds delivered strong returns.
Top contributors to the Fund’s performance: An overweight allocation to BBB-rated and non-investment grade bonds contributed to relative performance. The Fund’s longer duration positioning relative to the prospectus benchmark led to a positive impact as yields fell over the period. An overweight allocation to the Health Care and Special Tax sectors contributed to relative performance. An underweight allocation to the State General Obligation bonds contributed to relative performance.
Top detractors from the Fund’s performance: Security selection within the Health Care, Education and Leasing sectors detracted from relative performance.
Total Return Based on $10,000 Investment
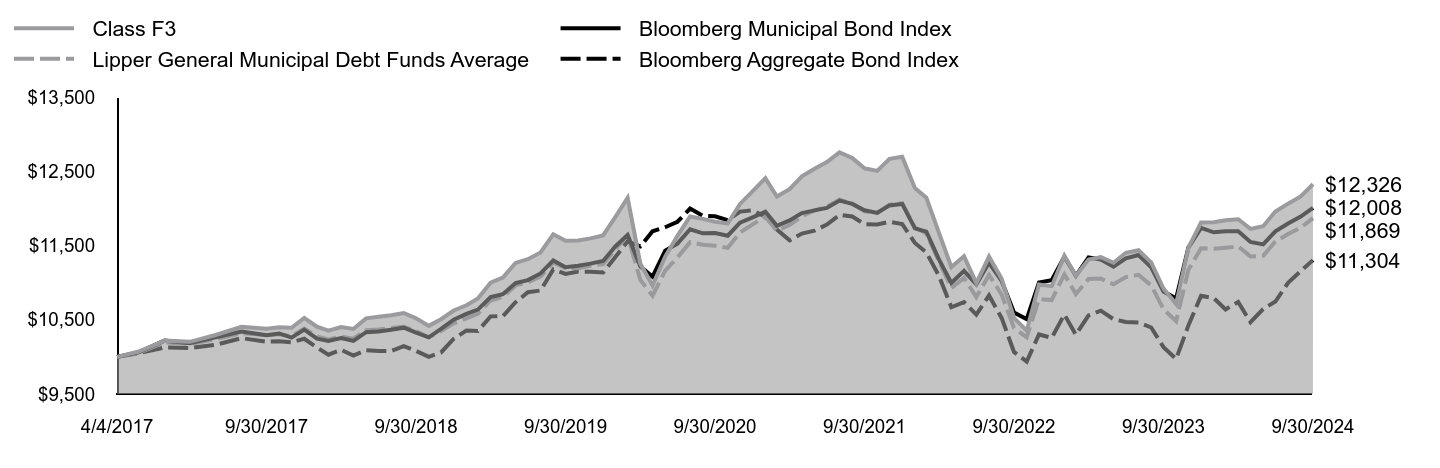
| Class F3 | Bloomberg Municipal Bond Index | Lipper General Municipal Debt Funds Average | Bloomberg Aggregate Bond Index |
|---|
| 4/4/2017 | $10,000 | $10,000 | $10,000 | $10,000 |
| 4/30/2017 | $10,072 | $10,060 | $10,054 | $10,051 |
| 5/31/2017 | $10,219 | $10,219 | $10,196 | $10,128 |
| 6/30/2017 | $10,203 | $10,183 | $10,174 | $10,118 |
| 7/31/2017 | $10,295 | $10,265 | $10,239 | $10,162 |
| 8/31/2017 | $10,406 | $10,343 | $10,321 | $10,253 |
| 9/30/2017 | $10,380 | $10,291 | $10,291 | $10,204 |
| 10/31/2017 | $10,400 | $10,316 | $10,304 | $10,210 |
| 11/30/2017 | $10,393 | $10,260 | $10,277 | $10,197 |
| 12/31/2017 | $10,524 | $10,368 | $10,381 | $10,244 |
| 1/31/2018 | $10,406 | $10,246 | $10,275 | $10,126 |
| 2/28/2018 | $10,354 | $10,215 | $10,234 | $10,030 |
| 3/31/2018 | $10,402 | $10,253 | $10,275 | $10,094 |
| 4/30/2018 | $10,376 | $10,216 | $10,246 | $10,019 |
| 5/31/2018 | $10,519 | $10,333 | $10,361 | $10,091 |
| 6/30/2018 | $10,540 | $10,342 | $10,369 | $10,078 |
| 7/31/2018 | $10,561 | $10,367 | $10,390 | $10,080 |
| 8/31/2018 | $10,592 | $10,394 | $10,406 | $10,145 |
| 9/30/2018 | $10,519 | $10,326 | $10,346 | $10,080 |
| 10/31/2018 | $10,418 | $10,263 | $10,264 | $10,000 |
| 11/30/2018 | $10,507 | $10,376 | $10,350 | $10,060 |
| 12/31/2018 | $10,625 | $10,501 | $10,452 | $10,245 |
| 1/31/2019 | $10,695 | $10,580 | $10,518 | $10,354 |
| 2/28/2019 | $10,786 | $10,637 | $10,582 | $10,348 |
| 3/31/2019 | $11,000 | $10,805 | $10,760 | $10,546 |
| 4/30/2019 | $11,070 | $10,845 | $10,807 | $10,549 |
| 5/31/2019 | $11,266 | $10,995 | $10,963 | $10,736 |
| 6/30/2019 | $11,317 | $11,035 | $11,005 | $10,871 |
| 7/31/2019 | $11,407 | $11,124 | $11,081 | $10,895 |
| 8/31/2019 | $11,652 | $11,300 | $11,272 | $11,177 |
| 9/30/2019 | $11,566 | $11,209 | $11,195 | $11,118 |
| 10/31/2019 | $11,567 | $11,229 | $11,196 | $11,151 |
| 11/30/2019 | $11,597 | $11,257 | $11,228 | $11,146 |
| 12/31/2019 | $11,637 | $11,292 | $11,251 | $11,138 |
| 1/31/2020 | $11,894 | $11,495 | $11,459 | $11,352 |
| 2/29/2020 | $12,143 | $11,643 | $11,633 | $11,557 |
| 3/31/2020 | $11,259 | $11,221 | $11,038 | $11,489 |
| 4/30/2020 | $10,961 | $11,080 | $10,824 | $11,693 |
| 5/31/2020 | $11,350 | $11,432 | $11,162 | $11,747 |
| 6/30/2020 | $11,631 | $11,526 | $11,338 | $11,821 |
| 7/31/2020 | $11,892 | $11,720 | $11,546 | $11,998 |
| 8/31/2020 | $11,860 | $11,665 | $11,512 | $11,901 |
| 9/30/2020 | $11,820 | $11,668 | $11,498 | $11,894 |
| 10/31/2020 | $11,798 | $11,633 | $11,469 | $11,841 |
| 11/30/2020 | $12,061 | $11,808 | $11,677 | $11,958 |
| 12/31/2020 | $12,233 | $11,880 | $11,786 | $11,974 |
| 1/31/2021 | $12,406 | $11,956 | $11,888 | $11,888 |
| 2/28/2021 | $12,160 | $11,766 | $11,699 | $11,716 |
| 3/31/2021 | $12,260 | $11,839 | $11,776 | $11,570 |
| 4/30/2021 | $12,432 | $11,938 | $11,895 | $11,662 |
| 5/31/2021 | $12,535 | $11,974 | $11,973 | $11,700 |
| 6/30/2021 | $12,625 | $12,007 | $12,024 | $11,782 |
| 7/31/2021 | $12,756 | $12,106 | $12,117 | $11,914 |
| 8/31/2021 | $12,680 | $12,062 | $12,067 | $11,891 |
| 9/30/2021 | $12,541 | $11,975 | $11,962 | $11,788 |
| 10/31/2021 | $12,506 | $11,940 | $11,942 | $11,785 |
| 11/30/2021 | $12,669 | $12,041 | $12,051 | $11,820 |
| 12/31/2021 | $12,696 | $12,061 | $12,069 | $11,789 |
| 1/31/2022 | $12,274 | $11,731 | $11,743 | $11,535 |
| 2/28/2022 | $12,144 | $11,688 | $11,663 | $11,407 |
| 3/31/2022 | $11,667 | $11,310 | $11,283 | $11,090 |
| 4/30/2022 | $11,211 | $10,997 | $10,927 | $10,669 |
| 5/31/2022 | $11,355 | $11,160 | $11,065 | $10,738 |
| 6/30/2022 | $10,993 | $10,977 | $10,806 | $10,569 |
| 7/31/2022 | $11,352 | $11,267 | $11,106 | $10,828 |
| 8/31/2022 | $11,051 | $11,020 | $10,837 | $10,522 |
| 9/30/2022 | $10,526 | $10,597 | $10,389 | $10,067 |
| 10/31/2022 | $10,353 | $10,509 | $10,265 | $9,937 |
| 11/30/2022 | $10,976 | $11,001 | $10,781 | $10,302 |
| 12/31/2022 | $10,953 | $11,032 | $10,766 | $10,256 |
| 1/31/2023 | $11,363 | $11,349 | $11,111 | $10,571 |
| 2/28/2023 | $11,093 | $11,093 | $10,847 | $10,298 |
| 3/31/2023 | $11,311 | $11,339 | $11,051 | $10,559 |
| 4/30/2023 | $11,344 | $11,313 | $11,056 | $10,623 |
| 5/31/2023 | $11,268 | $11,215 | $10,978 | $10,508 |
| 6/30/2023 | $11,403 | $11,327 | $11,075 | $10,470 |
| 7/31/2023 | $11,437 | $11,372 | $11,106 | $10,463 |
| 8/31/2023 | $11,274 | $11,208 | $10,963 | $10,396 |
| 9/30/2023 | $10,921 | $10,880 | $10,642 | $10,132 |
| 10/31/2023 | $10,713 | $10,787 | $10,480 | $9,972 |
| 11/30/2023 | $11,473 | $11,472 | $11,173 | $10,424 |
| 12/31/2023 | $11,811 | $11,739 | $11,464 | $10,823 |
| 1/31/2024 | $11,814 | $11,679 | $11,456 | $10,793 |
| 2/29/2024 | $11,841 | $11,694 | $11,472 | $10,640 |
| 3/31/2024 | $11,855 | $11,693 | $11,488 | $10,739 |
| 4/30/2024 | $11,724 | $11,548 | $11,354 | $10,467 |
| 5/31/2024 | $11,761 | $11,515 | $11,362 | $10,645 |
| 6/30/2024 | $11,958 | $11,691 | $11,554 | $10,746 |
| 7/31/2024 | $12,065 | $11,798 | $11,656 | $10,997 |
| 8/31/2024 | $12,161 | $11,891 | $11,740 | $11,155 |
| 9/30/2024 | $12,326 | $12,008 | $11,869 | $11,304 |
The Fund’s benchmarks are unmanaged indices used as a general measure of market performance. Calculations assume the reinvestment of dividends and capital gains.
Average Annual Total Returns (%)
| 1 Year | 5 Years | Since Inception 4/4/17 |
|---|
| Class F3 at NAV | 12.86% | 1.28% | 2.83% |
| Bloomberg Municipal Bond Index | 10.37% | 1.39% | 2.47% |
| Lipper General Municipal Debt Funds Average | 11.53% | 1.18% | 2.31% |
Bloomberg Aggregate Bond IndexFootnote Reference* | 11.57% | 0.33% | 1.65% |
| Footnote | Description |
Footnote* | The Fund has adopted the Bloomberg Aggregate Bond Index as its broad-based securities market index. |
The Fund's past performance is no guarantee of future results. The returns do not reflect the deduction of taxes that a shareholder would pay on Fund distributions or redemption of Fund shares.
(as of September 30, 2024)
| Total Net Assets | $4,759,225,524 |
| # of Portfolio Holdings | 744 |
| Portfolio Turnover Rate | 27% |
| Total Advisory Fees Paid | $16,281,601 |
What did the Fund invest in?
(as of September 30, 2024)
Credit Rating S&P or Moody'sFootnote Reference(a) | %Footnote Reference** |
|---|
| |
- A12.57%
- A-9.95%
- A+12.51%
- AA13.25%
- AA-7.93%
- AA+6.40%
- AAA3.72%
- B0.27%
- B-0.35%
- B+0.17%
- BB1.37%
- BB-0.62%
- BB+2.12%
- BBB5.29%
- BBB-9.72%
- BBB+7.92%
- CCC+0.14%
- NR5.70%
- Total 100.00%
| Footnote | Description |
Footnote** | Represents percent of total investments, which excludes derivatives. |
Footnote(a) | Investments in investment grade municipal bonds, which as bonds that are rated, at the time of purchase, within the four highest grades assigned by an independent rating agency such as Moody’s, S&P, or Fitch, or an equivalent short-term rating, as applicable, or are unrated by rating agencies but deemed by Lord Abbett to be of comparable quality. Lower rated municipal bonds are rated, at the time of purchase, or an equivalent short-term rating, as applicable, by an independent rating agency or are unrated by rating agencies but deemed by Lord Abbett to be of comparable quality. |
There were no material fund changes during the period.
Where can I find additional information about the Fund?
For additional information about the Fund, including its Prospectus, Statement of Additional Information, financial statements, holdings and proxy information, please visit lordabbett.com/FundDocuments.
The Fund has adopted a policy that allows it to send only one copy of the Fund's prospectus, proxy material, annual report and semiannual report (or related notice of internet availability of annual report and semiannual report) to certain shareholders residing at the same "household." This reduces Fund expenses, which benefits you and other shareholders.If you need additional copies or do not want your mailings to be "householded," please call Lord Abbett at 888-522-2388.
Lord Abbett National Tax Free Fund
Annual Shareholder Report
September 30, 2024
lordabbett.com/FundDocuments
TSR-A-8988-F3
11/24
Lord Abbett National Tax Free Fund
Annual Shareholder Report
September 30, 2024
lordabbett.com/FundDocuments
This annual shareholder report contains important information about the Lord Abbett National Tax Free Fund for the period of October 1, 2023 to September 30, 2024, as well as certain changes to the Fund. You can find additional information about the Fund at lordabbett.com/FundDocuments. You can also request this information by contacting us at 888-522-2388.
What were the Fund costs for the last year?
(based on a hypothetical $10,000 investment)
| Class Name | Costs of a $10,000 investment | Costs paid as a percentage of a $10,000 investment |
|---|
| Class I | $62 | 0.58% |
How did the Fund perform last year and what affected its performance?
For the fiscal year ended September 30, 2024, the Fund returned 12.81%, reflecting performance at the net asset value (NAV) of Class I shares, compared to the 10.37% of a securities market index with investment characteristics similar to those of the Fund, the Bloomberg Municipal Bond Index. The Fund's broad-based market index, the Bloomberg Aggregate Bond Index, returned 11.57% over the same period.
Positive factors for the municipal market included decreasing Treasury yields, easing inflationary pressures and the start of interest rate cuts by the U.S. Federal Reserve. Also supporting the market was increased demand for municipal bond funds and a strong fundamental backdrop as evidenced by growing tax revenue and positive ratings actions by public ratings agencies. Negative factors included a significant increase in municipal bond supply, which pressured the market in second half of the fiscal year, and periods of interest rate volatility driven by sticky inflation readings at points throughout the fiscal year. Against this backdrop, municipal bonds delivered strong returns.
Top contributors to the Fund’s performance: An overweight allocation to BBB-rated and non-investment grade bonds contributed to relative performance. The Fund’s longer duration positioning relative to the prospectus benchmark led to a positive impact as yields fell over the period. An overweight allocation to the Health Care and Special Tax sectors contributed to relative performance. An underweight allocation to the State General Obligation bonds contributed to relative performance.
Top detractors from the Fund’s performance: Security selection within the Health Care, Education and Leasing sectors detracted from relative performance.
Total Return Based on $10,000 Investment
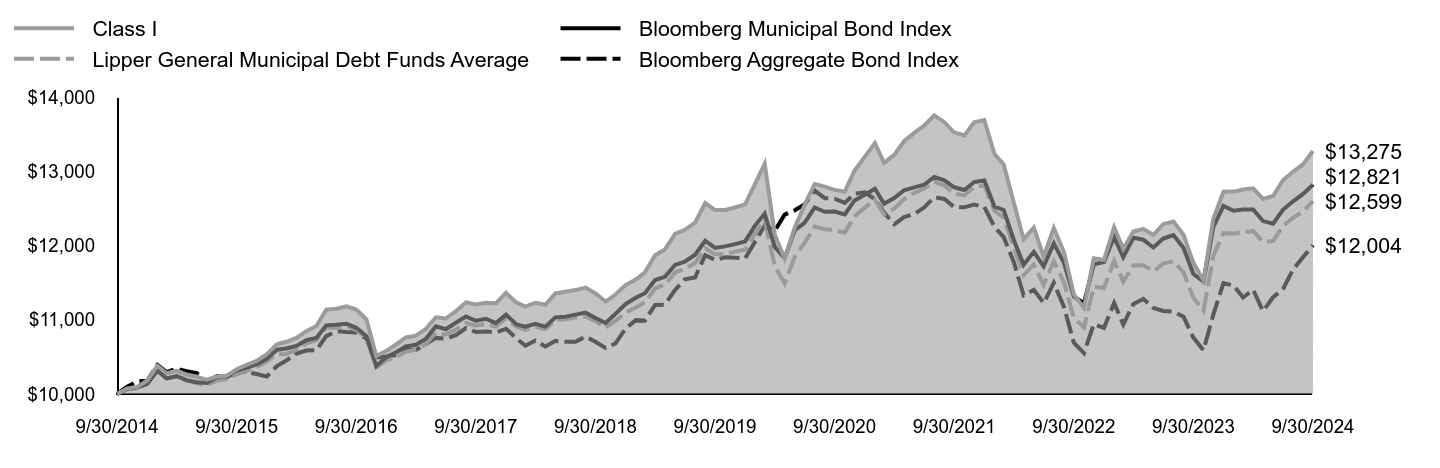
| Class I | Bloomberg Municipal Bond Index | Lipper General Municipal Debt Funds Average | Bloomberg Aggregate Bond Index |
|---|
| 9/30/2014 | $10,000 | $10,000 | $10,000 | $10,000 |
| 10/31/2014 | $10,075 | $10,069 | $10,064 | $10,098 |
| 11/30/2014 | $10,096 | $10,086 | $10,074 | $10,170 |
| 12/31/2014 | $10,181 | $10,137 | $10,139 | $10,179 |
| 1/31/2015 | $10,382 | $10,316 | $10,312 | $10,393 |
| 2/28/2015 | $10,280 | $10,210 | $10,208 | $10,295 |
| 3/31/2015 | $10,312 | $10,240 | $10,236 | $10,343 |
| 4/30/2015 | $10,263 | $10,186 | $10,181 | $10,306 |
| 5/31/2015 | $10,232 | $10,158 | $10,144 | $10,281 |
| 6/30/2015 | $10,192 | $10,148 | $10,118 | $10,169 |
| 7/31/2015 | $10,232 | $10,222 | $10,181 | $10,240 |
| 8/31/2015 | $10,247 | $10,242 | $10,197 | $10,225 |
| 9/30/2015 | $10,334 | $10,316 | $10,263 | $10,294 |
| 10/31/2015 | $10,394 | $10,357 | $10,312 | $10,296 |
| 11/30/2015 | $10,446 | $10,398 | $10,361 | $10,269 |
| 12/31/2015 | $10,535 | $10,472 | $10,440 | $10,235 |
| 1/31/2016 | $10,671 | $10,596 | $10,536 | $10,376 |
| 2/29/2016 | $10,704 | $10,613 | $10,538 | $10,450 |
| 3/31/2016 | $10,756 | $10,647 | $10,598 | $10,546 |
| 4/30/2016 | $10,846 | $10,725 | $10,681 | $10,586 |
| 5/31/2016 | $10,916 | $10,754 | $10,725 | $10,589 |
| 6/30/2016 | $11,137 | $10,925 | $10,897 | $10,779 |
| 7/31/2016 | $11,150 | $10,932 | $10,889 | $10,847 |
| 8/31/2016 | $11,182 | $10,947 | $10,914 | $10,835 |
| 9/30/2016 | $11,137 | $10,892 | $10,865 | $10,829 |
| 10/31/2016 | $11,006 | $10,778 | $10,758 | $10,746 |
| 11/30/2016 | $10,512 | $10,376 | $10,359 | $10,492 |
| 12/31/2016 | $10,582 | $10,497 | $10,455 | $10,506 |
| 1/31/2017 | $10,671 | $10,567 | $10,501 | $10,527 |
| 2/28/2017 | $10,762 | $10,640 | $10,568 | $10,598 |
| 3/31/2017 | $10,785 | $10,663 | $10,597 | $10,592 |
| 4/30/2017 | $10,875 | $10,740 | $10,672 | $10,674 |
| 5/31/2017 | $11,034 | $10,911 | $10,823 | $10,756 |
| 6/30/2017 | $11,017 | $10,872 | $10,800 | $10,745 |
| 7/31/2017 | $11,116 | $10,960 | $10,869 | $10,792 |
| 8/31/2017 | $11,235 | $11,043 | $10,956 | $10,888 |
| 9/30/2017 | $11,207 | $10,987 | $10,924 | $10,836 |
| 10/31/2017 | $11,229 | $11,014 | $10,938 | $10,843 |
| 11/30/2017 | $11,221 | $10,955 | $10,909 | $10,829 |
| 12/31/2017 | $11,362 | $11,069 | $11,019 | $10,879 |
| 1/31/2018 | $11,235 | $10,939 | $10,907 | $10,753 |
| 2/28/2018 | $11,178 | $10,906 | $10,863 | $10,651 |
| 3/31/2018 | $11,230 | $10,947 | $10,907 | $10,720 |
| 4/30/2018 | $11,202 | $10,908 | $10,876 | $10,640 |
| 5/31/2018 | $11,355 | $11,033 | $10,998 | $10,716 |
| 6/30/2018 | $11,378 | $11,042 | $11,007 | $10,703 |
| 7/31/2018 | $11,400 | $11,069 | $11,029 | $10,705 |
| 8/31/2018 | $11,433 | $11,097 | $11,046 | $10,774 |
| 9/30/2018 | $11,354 | $11,025 | $10,982 | $10,705 |
| 10/31/2018 | $11,245 | $10,957 | $10,895 | $10,620 |
| 11/30/2018 | $11,340 | $11,079 | $10,986 | $10,683 |
| 12/31/2018 | $11,467 | $11,211 | $11,095 | $10,880 |
| 1/31/2019 | $11,543 | $11,296 | $11,165 | $10,995 |
| 2/28/2019 | $11,640 | $11,357 | $11,233 | $10,989 |
| 3/31/2019 | $11,871 | $11,536 | $11,422 | $11,200 |
| 4/30/2019 | $11,946 | $11,579 | $11,472 | $11,203 |
| 5/31/2019 | $12,157 | $11,739 | $11,637 | $11,402 |
| 6/30/2019 | $12,212 | $11,782 | $11,682 | $11,545 |
| 7/31/2019 | $12,309 | $11,877 | $11,763 | $11,570 |
| 8/31/2019 | $12,573 | $12,065 | $11,965 | $11,870 |
| 9/30/2019 | $12,479 | $11,968 | $11,883 | $11,807 |
| 10/31/2019 | $12,480 | $11,989 | $11,885 | $11,842 |
| 11/30/2019 | $12,513 | $12,019 | $11,918 | $11,836 |
| 12/31/2019 | $12,556 | $12,056 | $11,943 | $11,828 |
| 1/31/2020 | $12,833 | $12,273 | $12,164 | $12,056 |
| 2/29/2020 | $13,101 | $12,431 | $12,348 | $12,273 |
| 3/31/2020 | $12,147 | $11,980 | $11,717 | $12,201 |
| 4/30/2020 | $11,825 | $11,830 | $11,490 | $12,417 |
| 5/31/2020 | $12,245 | $12,206 | $11,848 | $12,475 |
| 6/30/2020 | $12,547 | $12,307 | $12,035 | $12,554 |
| 7/31/2020 | $12,828 | $12,514 | $12,256 | $12,741 |
| 8/31/2020 | $12,794 | $12,455 | $12,220 | $12,638 |
| 9/30/2020 | $12,750 | $12,458 | $12,205 | $12,632 |
| 10/31/2020 | $12,726 | $12,420 | $12,174 | $12,575 |
| 11/30/2020 | $13,010 | $12,608 | $12,395 | $12,699 |
| 12/31/2020 | $13,195 | $12,685 | $12,511 | $12,716 |
| 1/31/2021 | $13,381 | $12,765 | $12,619 | $12,625 |
| 2/28/2021 | $13,115 | $12,563 | $12,419 | $12,443 |
| 3/31/2021 | $13,222 | $12,640 | $12,500 | $12,287 |
| 4/30/2021 | $13,408 | $12,746 | $12,627 | $12,384 |
| 5/31/2021 | $13,518 | $12,784 | $12,709 | $12,425 |
| 6/30/2021 | $13,615 | $12,819 | $12,764 | $12,512 |
| 7/31/2021 | $13,756 | $12,925 | $12,862 | $12,652 |
| 8/31/2021 | $13,662 | $12,878 | $12,809 | $12,628 |
| 9/30/2021 | $13,523 | $12,785 | $12,698 | $12,518 |
| 10/31/2021 | $13,485 | $12,748 | $12,676 | $12,515 |
| 11/30/2021 | $13,661 | $12,856 | $12,792 | $12,552 |
| 12/31/2021 | $13,690 | $12,877 | $12,811 | $12,520 |
| 1/31/2022 | $13,233 | $12,525 | $12,465 | $12,250 |
| 2/28/2022 | $13,094 | $12,480 | $12,380 | $12,114 |
| 3/31/2022 | $12,578 | $12,075 | $11,977 | $11,777 |
| 4/30/2022 | $12,086 | $11,741 | $11,599 | $11,330 |
| 5/31/2022 | $12,241 | $11,916 | $11,745 | $11,403 |
| 6/30/2022 | $11,850 | $11,720 | $11,471 | $11,224 |
| 7/31/2022 | $12,236 | $12,030 | $11,789 | $11,498 |
| 8/31/2022 | $11,912 | $11,766 | $11,504 | $11,174 |
| 9/30/2022 | $11,346 | $11,315 | $11,028 | $10,691 |
| 10/31/2022 | $11,159 | $11,221 | $10,896 | $10,552 |
| 11/30/2022 | $11,829 | $11,746 | $11,444 | $10,940 |
| 12/31/2022 | $11,805 | $11,779 | $11,428 | $10,891 |
| 1/31/2023 | $12,246 | $12,117 | $11,794 | $11,226 |
| 2/28/2023 | $11,955 | $11,843 | $11,514 | $10,936 |
| 3/31/2023 | $12,189 | $12,106 | $11,731 | $11,214 |
| 4/30/2023 | $12,225 | $12,079 | $11,736 | $11,282 |
| 5/31/2023 | $12,142 | $11,974 | $11,653 | $11,159 |
| 6/30/2023 | $12,288 | $12,094 | $11,756 | $11,119 |
| 7/31/2023 | $12,324 | $12,142 | $11,789 | $11,111 |
| 8/31/2023 | $12,147 | $11,967 | $11,637 | $11,040 |
| 9/30/2023 | $11,767 | $11,616 | $11,297 | $10,760 |
| 10/31/2023 | $11,530 | $11,517 | $11,125 | $10,590 |
| 11/30/2023 | $12,361 | $12,249 | $11,860 | $11,069 |
| 12/31/2023 | $12,724 | $12,533 | $12,169 | $11,493 |
| 1/31/2024 | $12,727 | $12,469 | $12,161 | $11,462 |
| 2/29/2024 | $12,756 | $12,485 | $12,178 | $11,300 |
| 3/31/2024 | $12,771 | $12,485 | $12,194 | $11,404 |
| 4/30/2024 | $12,628 | $12,330 | $12,052 | $11,116 |
| 5/31/2024 | $12,668 | $12,294 | $12,061 | $11,304 |
| 6/30/2024 | $12,880 | $12,482 | $12,265 | $11,412 |
| 7/31/2024 | $12,994 | $12,596 | $12,373 | $11,678 |
| 8/31/2024 | $13,097 | $12,696 | $12,462 | $11,846 |
| 9/30/2024 | $13,275 | $12,821 | $12,599 | $12,004 |
The Fund’s benchmarks are unmanaged indices used as a general measure of market performance. Calculations assume the reinvestment of dividends and capital gains.
Average Annual Total Returns (%)
| 1 Year | 5 Years | 10 Years |
|---|
| Class I at NAV | 12.81% | 1.24% | 2.87% |
| Bloomberg Municipal Bond Index | 10.37% | 1.39% | 2.52% |
| Lipper General Municipal Debt Funds Average | 11.53% | 1.18% | 2.34% |
Bloomberg Aggregate Bond IndexFootnote Reference* | 11.57% | 0.33% | 1.84% |
| Footnote | Description |
Footnote* | The Fund has adopted the Bloomberg Aggregate Bond Index as its broad-based securities market index. |
The Fund's past performance is no guarantee of future results. The returns do not reflect the deduction of taxes that a shareholder would pay on Fund distributions or redemption of Fund shares.
(as of September 30, 2024)
| Total Net Assets | $4,759,225,524 |
| # of Portfolio Holdings | 744 |
| Portfolio Turnover Rate | 27% |
| Total Advisory Fees Paid | $16,281,601 |
What did the Fund invest in?
(as of September 30, 2024)
Credit Rating S&P or Moody'sFootnote Reference(a) | %Footnote Reference** |
|---|
| |
- A12.57%
- A-9.95%
- A+12.51%
- AA13.25%
- AA-7.93%
- AA+6.40%
- AAA3.72%
- B0.27%
- B-0.35%
- B+0.17%
- BB1.37%
- BB-0.62%
- BB+2.12%
- BBB5.29%
- BBB-9.72%
- BBB+7.92%
- CCC+0.14%
- NR5.70%
- Total 100.00%
| Footnote | Description |
Footnote** | Represents percent of total investments, which excludes derivatives. |
Footnote(a) | Investments in investment grade municipal bonds, which as bonds that are rated, at the time of purchase, within the four highest grades assigned by an independent rating agency such as Moody’s, S&P, or Fitch, or an equivalent short-term rating, as applicable, or are unrated by rating agencies but deemed by Lord Abbett to be of comparable quality. Lower rated municipal bonds are rated, at the time of purchase, or an equivalent short-term rating, as applicable, by an independent rating agency or are unrated by rating agencies but deemed by Lord Abbett to be of comparable quality. |
There were no material fund changes during the period.
Where can I find additional information about the Fund?
For additional information about the Fund, including its Prospectus, Statement of Additional Information, financial statements, holdings and proxy information, please visit lordabbett.com/FundDocuments.
The Fund has adopted a policy that allows it to send only one copy of the Fund's prospectus, proxy material, annual report and semiannual report (or related notice of internet availability of annual report and semiannual report) to certain shareholders residing at the same "household." This reduces Fund expenses, which benefits you and other shareholders.If you need additional copies or do not want your mailings to be "householded," please call Lord Abbett at 888-522-2388.
Lord Abbett National Tax Free Fund
Annual Shareholder Report
September 30, 2024
lordabbett.com/FundDocuments
TSR-A-1452-I
11/24
Lord Abbett New Jersey Tax Free Fund
Annual Shareholder Report
September 30, 2024
lordabbett.com/FundDocuments
This annual shareholder report contains important information about the Lord Abbett New Jersey Tax Free Fund for the period of October 1, 2023 to September 30, 2024, as well as certain changes to the Fund. You can find additional information about the Fund at lordabbett.com/FundDocuments. You can also request this information by contacting us at 888-522-2388.
What were the Fund costs for the last year?
(based on a hypothetical $10,000 investment)
| Class Name | Costs of a $10,000 investment | Costs paid as a percentage of a $10,000 investment |
|---|
| Class A | $87 | 0.82% |
How did the Fund perform last year and what affected its performance?
For the fiscal year ended September 30, 2024, the Fund returned 11.14%, reflecting performance at the net asset value (NAV) of Class A shares, compared to the 10.37% of a securities market index with investment characteristics similar to those of the Fund, the Bloomberg Municipal Bond Index. The Fund's broad-based market index, the Bloomberg Aggregate Bond Index, returned 11.57% over the same period.
Positive factors for the municipal market included decreasing Treasury yields, easing inflationary pressures and the start of interest rate cuts by the U.S. Federal Reserve. Also supporting the market was increased demand for municipal bond funds and a strong fundamental backdrop as evidenced by growing tax revenue and positive ratings actions by public ratings agencies. Negative factors included a significant increase in municipal bond supply, which pressured the market in second half of the fiscal year, and periods of interest rate volatility driven by sticky inflation readings at points throughout the fiscal year. Against this backdrop, municipal bonds delivered strong returns.
Top contributors to the Fund’s performance: The Fund’s longer duration positioning contributed to relative performance with the fall in rates over the period. An overweight allocation to A-rated, BBB-rated and non-investment grade bonds contributed to relative performance.
Top detractors from the Fund’s performance: An overweight allocation to the Leasing, Industrial Development and Tobacco sectors detracted from relative performance. Security selection within the Leasing sector detracted from relative performance.
Total Return Based on $10,000 Investment
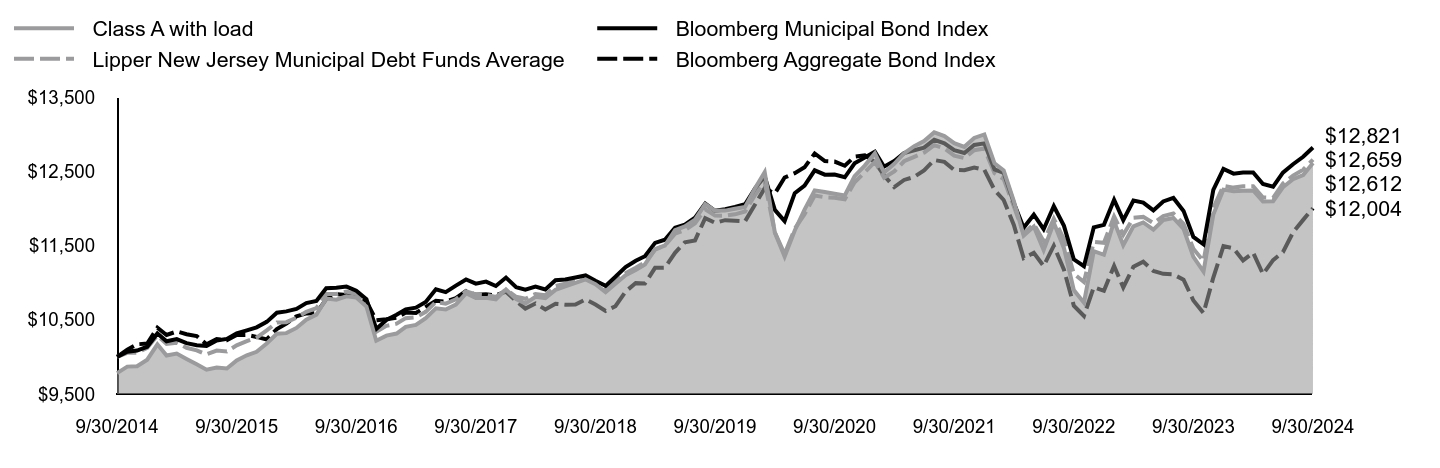
| Class A with load | Bloomberg Municipal Bond Index | Lipper New Jersey Municipal Debt Funds Average | Bloomberg Aggregate Bond Index |
|---|
| 9/30/2014 | $9,782 | $10,000 | $10,000 | $10,000 |
| 10/31/2014 | $9,869 | $10,069 | $10,055 | $10,098 |
| 11/30/2014 | $9,874 | $10,086 | $10,057 | $10,170 |
| 12/31/2014 | $9,962 | $10,137 | $10,121 | $10,179 |
| 1/31/2015 | $10,169 | $10,316 | $10,288 | $10,393 |
| 2/28/2015 | $10,018 | $10,210 | $10,175 | $10,295 |
| 3/31/2015 | $10,045 | $10,240 | $10,192 | $10,343 |
| 4/30/2015 | $9,973 | $10,186 | $10,123 | $10,306 |
| 5/31/2015 | $9,900 | $10,158 | $10,088 | $10,281 |
| 6/30/2015 | $9,827 | $10,148 | $10,034 | $10,169 |
| 7/31/2015 | $9,856 | $10,222 | $10,085 | $10,240 |
| 8/31/2015 | $9,843 | $10,242 | $10,073 | $10,225 |
| 9/30/2015 | $9,952 | $10,316 | $10,155 | $10,294 |
| 10/31/2015 | $10,021 | $10,357 | $10,211 | $10,296 |
| 11/30/2015 | $10,069 | $10,398 | $10,260 | $10,269 |
| 12/31/2015 | $10,180 | $10,472 | $10,357 | $10,235 |
| 1/31/2016 | $10,312 | $10,596 | $10,463 | $10,376 |
| 2/29/2016 | $10,320 | $10,613 | $10,468 | $10,450 |
| 3/31/2016 | $10,390 | $10,647 | $10,528 | $10,546 |
| 4/30/2016 | $10,501 | $10,725 | $10,607 | $10,586 |
| 5/31/2016 | $10,569 | $10,754 | $10,658 | $10,589 |
| 6/30/2016 | $10,785 | $10,925 | $10,848 | $10,779 |
| 7/31/2016 | $10,770 | $10,932 | $10,847 | $10,847 |
| 8/31/2016 | $10,817 | $10,947 | $10,881 | $10,835 |
| 9/30/2016 | $10,801 | $10,892 | $10,847 | $10,829 |
| 10/31/2016 | $10,679 | $10,778 | $10,750 | $10,746 |
| 11/30/2016 | $10,218 | $10,376 | $10,339 | $10,492 |
| 12/31/2016 | $10,287 | $10,497 | $10,419 | $10,506 |
| 1/31/2017 | $10,314 | $10,567 | $10,447 | $10,527 |
| 2/28/2017 | $10,405 | $10,640 | $10,522 | $10,598 |
| 3/31/2017 | $10,431 | $10,663 | $10,534 | $10,592 |
| 4/30/2017 | $10,522 | $10,740 | $10,607 | $10,674 |
| 5/31/2017 | $10,655 | $10,911 | $10,740 | $10,756 |
| 6/30/2017 | $10,638 | $10,872 | $10,717 | $10,745 |
| 7/31/2017 | $10,705 | $10,960 | $10,775 | $10,792 |
| 8/31/2017 | $10,857 | $11,043 | $10,884 | $10,888 |
| 9/30/2017 | $10,792 | $10,987 | $10,843 | $10,836 |
| 10/31/2017 | $10,795 | $11,014 | $10,837 | $10,843 |
| 11/30/2017 | $10,775 | $10,955 | $10,806 | $10,829 |
| 12/31/2017 | $10,909 | $11,069 | $10,909 | $10,879 |
| 1/31/2018 | $10,780 | $10,939 | $10,810 | $10,753 |
| 2/28/2018 | $10,719 | $10,906 | $10,783 | $10,651 |
| 3/31/2018 | $10,809 | $10,947 | $10,848 | $10,720 |
| 4/30/2018 | $10,790 | $10,908 | $10,831 | $10,640 |
| 5/31/2018 | $10,903 | $11,033 | $10,954 | $10,716 |
| 6/30/2018 | $10,950 | $11,042 | $10,987 | $10,703 |
| 7/31/2018 | $10,998 | $11,069 | $11,029 | $10,705 |
| 8/31/2018 | $11,045 | $11,097 | $11,066 | $10,774 |
| 9/30/2018 | $10,981 | $11,025 | $11,008 | $10,705 |
| 10/31/2018 | $10,872 | $10,957 | $10,926 | $10,620 |
| 11/30/2018 | $10,987 | $11,079 | $11,018 | $10,683 |
| 12/31/2018 | $11,102 | $11,211 | $11,127 | $10,880 |
| 1/31/2019 | $11,172 | $11,296 | $11,200 | $10,995 |
| 2/28/2019 | $11,246 | $11,357 | $11,275 | $10,989 |
| 3/31/2019 | $11,452 | $11,536 | $11,445 | $11,200 |
| 4/30/2019 | $11,501 | $11,579 | $11,500 | $11,203 |
| 5/31/2019 | $11,708 | $11,739 | $11,661 | $11,402 |
| 6/30/2019 | $11,757 | $11,782 | $11,707 | $11,545 |
| 7/31/2019 | $11,850 | $11,877 | $11,800 | $11,570 |
| 8/31/2019 | $12,058 | $12,065 | $11,990 | $11,870 |
| 9/30/2019 | $11,969 | $11,968 | $11,904 | $11,807 |
| 10/31/2019 | $11,971 | $11,989 | $11,903 | $11,842 |
| 11/30/2019 | $11,996 | $12,019 | $11,921 | $11,836 |
| 12/31/2019 | $12,021 | $12,056 | $11,959 | $11,828 |
| 1/31/2020 | $12,277 | $12,273 | $12,184 | $12,056 |
| 2/29/2020 | $12,488 | $12,431 | $12,356 | $12,273 |
| 3/31/2020 | $11,677 | $11,980 | $11,677 | $12,201 |
| 4/30/2020 | $11,352 | $11,830 | $11,386 | $12,417 |
| 5/31/2020 | $11,704 | $12,206 | $11,726 | $12,475 |
| 6/30/2020 | $11,985 | $12,307 | $11,924 | $12,554 |
| 7/31/2020 | $12,244 | $12,514 | $12,174 | $12,741 |
| 8/31/2020 | $12,221 | $12,455 | $12,151 | $12,638 |
| 9/30/2020 | $12,199 | $12,458 | $12,144 | $12,632 |
| 10/31/2020 | $12,175 | $12,420 | $12,124 | $12,575 |
| 11/30/2020 | $12,436 | $12,608 | $12,352 | $12,699 |
| 12/31/2020 | $12,577 | $12,685 | $12,488 | $12,716 |
| 1/31/2021 | $12,743 | $12,765 | $12,627 | $12,625 |
| 2/28/2021 | $12,483 | $12,563 | $12,414 | $12,443 |
| 3/31/2021 | $12,601 | $12,640 | $12,498 | $12,287 |
| 4/30/2021 | $12,744 | $12,746 | $12,636 | $12,384 |
| 5/31/2021 | $12,839 | $12,784 | $12,696 | $12,425 |
| 6/30/2021 | $12,908 | $12,819 | $12,752 | $12,512 |
| 7/31/2021 | $13,025 | $12,925 | $12,853 | $12,652 |
| 8/31/2021 | $12,976 | $12,878 | $12,808 | $12,628 |
| 9/30/2021 | $12,879 | $12,785 | $12,712 | $12,518 |
| 10/31/2021 | $12,830 | $12,748 | $12,678 | $12,515 |
| 11/30/2021 | $12,950 | $12,856 | $12,785 | $12,552 |
| 12/31/2021 | $12,997 | $12,877 | $12,807 | $12,520 |
| 1/31/2022 | $12,608 | $12,525 | $12,476 | $12,250 |
| 2/28/2022 | $12,512 | $12,480 | $12,395 | $12,114 |
| 3/31/2022 | $12,098 | $12,075 | $12,030 | $11,777 |
| 4/30/2022 | $11,635 | $11,741 | $11,663 | $11,330 |
| 5/31/2022 | $11,757 | $11,916 | $11,791 | $11,403 |
| 6/30/2022 | $11,440 | $11,720 | $11,559 | $11,224 |
| 7/31/2022 | $11,808 | $12,030 | $11,862 | $11,498 |
| 8/31/2022 | $11,465 | $11,766 | $11,584 | $11,174 |
| 9/30/2022 | $10,901 | $11,315 | $11,122 | $10,691 |
| 10/31/2022 | $10,730 | $11,221 | $11,009 | $10,552 |
| 11/30/2022 | $11,424 | $11,746 | $11,548 | $10,940 |
| 12/31/2022 | $11,376 | $11,779 | $11,537 | $10,891 |
| 1/31/2023 | $11,826 | $12,117 | $11,893 | $11,226 |
| 2/28/2023 | $11,506 | $11,843 | $11,644 | $10,936 |
| 3/31/2023 | $11,758 | $12,106 | $11,876 | $11,214 |
| 4/30/2023 | $11,811 | $12,079 | $11,886 | $11,282 |
| 5/31/2023 | $11,714 | $11,974 | $11,802 | $11,159 |
| 6/30/2023 | $11,843 | $12,094 | $11,897 | $11,119 |
| 7/31/2023 | $11,872 | $12,142 | $11,931 | $11,111 |
| 8/31/2023 | $11,724 | $11,967 | $11,794 | $11,040 |
| 9/30/2023 | $11,348 | $11,616 | $11,456 | $10,760 |
| 10/31/2023 | $11,150 | $11,517 | $11,290 | $10,590 |
| 11/30/2023 | $11,918 | $12,249 | $12,009 | $11,069 |
| 12/31/2023 | $12,254 | $12,533 | $12,305 | $11,493 |
| 1/31/2024 | $12,233 | $12,469 | $12,281 | $11,462 |
| 2/29/2024 | $12,238 | $12,485 | $12,299 | $11,300 |
| 3/31/2024 | $12,243 | $12,485 | $12,300 | $11,404 |
| 4/30/2024 | $12,093 | $12,330 | $12,148 | $11,116 |
| 5/31/2024 | $12,098 | $12,294 | $12,144 | $11,304 |
| 6/30/2024 | $12,285 | $12,482 | $12,336 | $11,412 |
| 7/31/2024 | $12,394 | $12,596 | $12,443 | $11,678 |
| 8/31/2024 | $12,450 | $12,696 | $12,522 | $11,846 |
| 9/30/2024 | $12,612 | $12,821 | $12,659 | $12,004 |
The Fund’s benchmarks are unmanaged indices used as a general measure of market performance. Calculations assume the reinvestment of dividends and capital gains.
Average Annual Total Returns (%)
| 1 Year | 5 Years | 10 Years |
|---|
| Class A at NAV | 11.14% | 1.05% | 2.57% |
| Class A with sales charge | 8.71% | 0.59% | 2.35% |
| Bloomberg Municipal Bond Index | 10.37% | 1.39% | 2.52% |
| Lipper New Jersey Municipal Debt Funds Average | 10.50% | 1.24% | 2.39% |
Bloomberg Aggregate Bond IndexFootnote Reference* | 11.57% | 0.33% | 1.84% |
| Footnote | Description |
Footnote* | The Fund has adopted the Bloomberg Aggregate Bond Index as its broad-based securities market index. |
The Fund's past performance is no guarantee of future results. The returns do not reflect the deduction of taxes that a shareholder would pay on Fund distributions or redemption of Fund shares.
(as of September 30, 2024)
| Total Net Assets | $140,370,809 |
| # of Portfolio Holdings | 187 |
| Portfolio Turnover Rate | 8% |
| Total Advisory Fees Paid | $513,640 |
What did the Fund invest in?
(as of September 30, 2024)
Credit Rating S&P or Moody'sFootnote Reference(a) | %Footnote Reference** |
|---|
| |
- A22.30%
- A-3.86%
- A+9.20%
- AA16.65%
- AA-23.07%
- AA+1.48%
- AAA6.67%
- BB-1.51%
- BBB2.16%
- BBB-3.20%
- BBB+6.82%
- NR3.08%
- Total 100.00%
| Footnote | Description |
Footnote** | Represents percent of total investments, which excludes derivatives. |
Footnote(a) | Investments in investment grade municipal bonds, which as bonds that are rated, at the time of purchase, within the four highest grades assigned by an independent rating agency such as Moody’s, S&P, or Fitch, or an equivalent short-term rating, as applicable, or are unrated by rating agencies but deemed by Lord Abbett to be of comparable quality. Lower rated municipal bonds are rated, at the time of purchase, or an equivalent short-term rating, as applicable, by an independent rating agency or are unrated by rating agencies but deemed by Lord Abbett to be of comparable quality. |
There were no material fund changes during the period.
Where can I find additional information about the Fund?
For additional information about the Fund, including its Prospectus, Statement of Additional Information, financial statements, holdings and proxy information, please visit lordabbett.com/FundDocuments.
The Fund has adopted a policy that allows it to send only one copy of the Fund's prospectus, proxy material, annual report and semiannual report (or related notice of internet availability of annual report and semiannual report) to certain shareholders residing at the same "household." This reduces Fund expenses, which benefits you and other shareholders.If you need additional copies or do not want your mailings to be "householded," please call Lord Abbett at 888-522-2388.
Lord Abbett New Jersey Tax Free Fund
Annual Shareholder Report
September 30, 2024
lordabbett.com/FundDocuments
TSR-A-20-A
11/24
Lord Abbett New Jersey Tax Free Fund
Annual Shareholder Report
September 30, 2024
lordabbett.com/FundDocuments
This annual shareholder report contains important information about the Lord Abbett New Jersey Tax Free Fund for the period of October 1, 2023 to September 30, 2024, as well as certain changes to the Fund. You can find additional information about the Fund at lordabbett.com/FundDocuments. You can also request this information by contacting us at 888-522-2388.
What were the Fund costs for the last year?
(based on a hypothetical $10,000 investment)
| Class Name | Costs of a $10,000 investment | Costs paid as a percentage of a $10,000 investment |
|---|
| Class F | $76 | 0.72% |
How did the Fund perform last year and what affected its performance?
For the fiscal year ended September 30, 2024, the Fund returned 11.25%, reflecting performance at the net asset value (NAV) of Class F shares, compared to the 10.37% of a securities market index with investment characteristics similar to those of the Fund, the Bloomberg Municipal Bond Index. The Fund's broad-based market index, the Bloomberg Aggregate Bond Index, returned 11.57% over the same period.
Positive factors for the municipal market included decreasing Treasury yields, easing inflationary pressures and the start of interest rate cuts by the U.S. Federal Reserve. Also supporting the market was increased demand for municipal bond funds and a strong fundamental backdrop as evidenced by growing tax revenue and positive ratings actions by public ratings agencies. Negative factors included a significant increase in municipal bond supply, which pressured the market in second half of the fiscal year, and periods of interest rate volatility driven by sticky inflation readings at points throughout the fiscal year. Against this backdrop, municipal bonds delivered strong returns.
Top contributors to the Fund’s performance: The Fund’s longer duration positioning contributed to relative performance with the fall in rates over the period. An overweight allocation to A-rated, BBB-rated and non-investment grade bonds contributed to relative performance.
Top detractors from the Fund’s performance: An overweight allocation to the Leasing, Industrial Development and Tobacco sectors detracted from relative performance. Security selection within the Leasing sector detracted from relative performance.
Total Return Based on $10,000 Investment

| Class F | Bloomberg Municipal Bond Index | Lipper New Jersey Municipal Debt Funds Average | Bloomberg Aggregate Bond Index |
|---|
| 9/30/2014 | $10,000 | $10,000 | $10,000 | $10,000 |
| 10/31/2014 | $10,090 | $10,069 | $10,055 | $10,098 |
| 11/30/2014 | $10,096 | $10,086 | $10,057 | $10,170 |
| 12/31/2014 | $10,186 | $10,137 | $10,121 | $10,179 |
| 1/31/2015 | $10,399 | $10,316 | $10,288 | $10,393 |
| 2/28/2015 | $10,245 | $10,210 | $10,175 | $10,295 |
| 3/31/2015 | $10,274 | $10,240 | $10,192 | $10,343 |
| 4/30/2015 | $10,200 | $10,186 | $10,123 | $10,306 |
| 5/31/2015 | $10,127 | $10,158 | $10,088 | $10,281 |
| 6/30/2015 | $10,074 | $10,148 | $10,034 | $10,169 |
| 7/31/2015 | $10,104 | $10,222 | $10,085 | $10,240 |
| 8/31/2015 | $10,071 | $10,242 | $10,073 | $10,225 |
| 9/30/2015 | $10,184 | $10,316 | $10,155 | $10,294 |
| 10/31/2015 | $10,255 | $10,357 | $10,211 | $10,296 |
| 11/30/2015 | $10,305 | $10,398 | $10,260 | $10,269 |
| 12/31/2015 | $10,440 | $10,472 | $10,357 | $10,235 |
| 1/31/2016 | $10,576 | $10,596 | $10,463 | $10,376 |
| 2/29/2016 | $10,564 | $10,613 | $10,468 | $10,450 |
| 3/31/2016 | $10,658 | $10,647 | $10,528 | $10,546 |
| 4/30/2016 | $10,751 | $10,725 | $10,607 | $10,586 |
| 5/31/2016 | $10,822 | $10,754 | $10,658 | $10,589 |
| 6/30/2016 | $11,044 | $10,925 | $10,848 | $10,779 |
| 7/31/2016 | $11,030 | $10,932 | $10,847 | $10,847 |
| 8/31/2016 | $11,078 | $10,947 | $10,881 | $10,835 |
| 9/30/2016 | $11,063 | $10,892 | $10,847 | $10,829 |
| 10/31/2016 | $10,939 | $10,778 | $10,750 | $10,746 |
| 11/30/2016 | $10,467 | $10,376 | $10,339 | $10,492 |
| 12/31/2016 | $10,539 | $10,497 | $10,419 | $10,506 |
| 1/31/2017 | $10,589 | $10,567 | $10,447 | $10,527 |
| 2/28/2017 | $10,684 | $10,640 | $10,522 | $10,598 |
| 3/31/2017 | $10,689 | $10,663 | $10,534 | $10,592 |
| 4/30/2017 | $10,783 | $10,740 | $10,607 | $10,674 |
| 5/31/2017 | $10,942 | $10,911 | $10,740 | $10,756 |
| 6/30/2017 | $10,903 | $10,872 | $10,717 | $10,745 |
| 7/31/2017 | $10,973 | $10,960 | $10,775 | $10,792 |
| 8/31/2017 | $11,129 | $11,043 | $10,884 | $10,888 |
| 9/30/2017 | $11,064 | $10,987 | $10,843 | $10,836 |
| 10/31/2017 | $11,090 | $11,014 | $10,837 | $10,843 |
| 11/30/2017 | $11,049 | $10,955 | $10,806 | $10,829 |
| 12/31/2017 | $11,187 | $11,069 | $10,909 | $10,879 |
| 1/31/2018 | $11,056 | $10,939 | $10,810 | $10,753 |
| 2/28/2018 | $11,016 | $10,906 | $10,783 | $10,651 |
| 3/31/2018 | $11,087 | $10,947 | $10,848 | $10,720 |
| 4/30/2018 | $11,069 | $10,908 | $10,831 | $10,640 |
| 5/31/2018 | $11,208 | $11,033 | $10,954 | $10,716 |
| 6/30/2018 | $11,235 | $11,042 | $10,987 | $10,703 |
| 7/31/2018 | $11,284 | $11,069 | $11,029 | $10,705 |
| 8/31/2018 | $11,333 | $11,097 | $11,066 | $10,774 |
| 9/30/2018 | $11,269 | $11,025 | $11,008 | $10,705 |
| 10/31/2018 | $11,158 | $10,957 | $10,926 | $10,620 |
| 11/30/2018 | $11,277 | $11,079 | $11,018 | $10,683 |
| 12/31/2018 | $11,396 | $11,211 | $11,127 | $10,880 |
| 1/31/2019 | $11,469 | $11,296 | $11,200 | $10,995 |
| 2/28/2019 | $11,545 | $11,357 | $11,275 | $10,989 |
| 3/31/2019 | $11,758 | $11,536 | $11,445 | $11,200 |
| 4/30/2019 | $11,809 | $11,579 | $11,500 | $11,203 |
| 5/31/2019 | $12,023 | $11,739 | $11,661 | $11,402 |
| 6/30/2019 | $12,073 | $11,782 | $11,707 | $11,545 |
| 7/31/2019 | $12,171 | $11,877 | $11,800 | $11,570 |
| 8/31/2019 | $12,385 | $12,065 | $11,990 | $11,870 |
| 9/30/2019 | $12,294 | $11,968 | $11,904 | $11,807 |
| 10/31/2019 | $12,298 | $11,989 | $11,903 | $11,842 |
| 11/30/2019 | $12,301 | $12,019 | $11,921 | $11,836 |
| 12/31/2019 | $12,351 | $12,056 | $11,959 | $11,828 |
| 1/31/2020 | $12,615 | $12,273 | $12,184 | $12,056 |
| 2/29/2020 | $12,833 | $12,431 | $12,356 | $12,273 |
| 3/31/2020 | $12,000 | $11,980 | $11,677 | $12,201 |
| 4/30/2020 | $11,668 | $11,830 | $11,386 | $12,417 |
| 5/31/2020 | $12,030 | $12,206 | $11,726 | $12,475 |
| 6/30/2020 | $12,321 | $12,307 | $11,924 | $12,554 |
| 7/31/2020 | $12,588 | $12,514 | $12,174 | $12,741 |
| 8/31/2020 | $12,565 | $12,455 | $12,151 | $12,638 |
| 9/30/2020 | $12,543 | $12,458 | $12,144 | $12,632 |
| 10/31/2020 | $12,520 | $12,420 | $12,124 | $12,575 |
| 11/30/2020 | $12,789 | $12,608 | $12,352 | $12,699 |
| 12/31/2020 | $12,936 | $12,685 | $12,488 | $12,716 |
| 1/31/2021 | $13,107 | $12,765 | $12,627 | $12,625 |
| 2/28/2021 | $12,840 | $12,563 | $12,414 | $12,443 |
| 3/31/2021 | $12,963 | $12,640 | $12,498 | $12,287 |
| 4/30/2021 | $13,111 | $12,746 | $12,636 | $12,384 |
| 5/31/2021 | $13,210 | $12,784 | $12,696 | $12,425 |
| 6/30/2021 | $13,282 | $12,819 | $12,752 | $12,512 |
| 7/31/2021 | $13,404 | $12,925 | $12,853 | $12,652 |
| 8/31/2021 | $13,355 | $12,878 | $12,808 | $12,628 |
| 9/30/2021 | $13,256 | $12,785 | $12,712 | $12,518 |
| 10/31/2021 | $13,206 | $12,748 | $12,678 | $12,515 |
| 11/30/2021 | $13,330 | $12,856 | $12,785 | $12,552 |
| 12/31/2021 | $13,380 | $12,877 | $12,807 | $12,520 |
| 1/31/2022 | $12,981 | $12,525 | $12,476 | $12,250 |
| 2/28/2022 | $12,908 | $12,480 | $12,395 | $12,114 |
| 3/31/2022 | $12,457 | $12,075 | $12,030 | $11,777 |
| 4/30/2022 | $11,982 | $11,741 | $11,663 | $11,330 |
| 5/31/2022 | $12,109 | $11,916 | $11,791 | $11,403 |
| 6/30/2022 | $11,783 | $11,720 | $11,559 | $11,224 |
| 7/31/2022 | $12,163 | $12,030 | $11,862 | $11,498 |
| 8/31/2022 | $11,811 | $11,766 | $11,584 | $11,174 |
| 9/30/2022 | $11,230 | $11,315 | $11,122 | $10,691 |
| 10/31/2022 | $11,055 | $11,221 | $11,009 | $10,552 |
| 11/30/2022 | $11,771 | $11,746 | $11,548 | $10,940 |
| 12/31/2022 | $11,723 | $11,779 | $11,537 | $10,891 |
| 1/31/2023 | $12,187 | $12,117 | $11,893 | $11,226 |
| 2/28/2023 | $11,858 | $11,843 | $11,644 | $10,936 |
| 3/31/2023 | $12,119 | $12,106 | $11,876 | $11,214 |
| 4/30/2023 | $12,175 | $12,079 | $11,886 | $11,282 |
| 5/31/2023 | $12,076 | $11,974 | $11,802 | $11,159 |
| 6/30/2023 | $12,210 | $12,094 | $11,897 | $11,119 |
| 7/31/2023 | $12,266 | $12,142 | $11,931 | $11,111 |
| 8/31/2023 | $12,089 | $11,967 | $11,794 | $11,040 |
| 9/30/2023 | $11,703 | $11,616 | $11,456 | $10,760 |
| 10/31/2023 | $11,525 | $11,517 | $11,290 | $10,590 |
| 11/30/2023 | $12,319 | $12,249 | $12,009 | $11,069 |
| 12/31/2023 | $12,640 | $12,533 | $12,305 | $11,493 |
| 1/31/2024 | $12,619 | $12,469 | $12,281 | $11,462 |
| 2/29/2024 | $12,625 | $12,485 | $12,299 | $11,300 |
| 3/31/2024 | $12,631 | $12,485 | $12,300 | $11,404 |
| 4/30/2024 | $12,478 | $12,330 | $12,148 | $11,116 |
| 5/31/2024 | $12,484 | $12,294 | $12,144 | $11,304 |
| 6/30/2024 | $12,678 | $12,482 | $12,336 | $11,412 |
| 7/31/2024 | $12,791 | $12,596 | $12,443 | $11,678 |
| 8/31/2024 | $12,878 | $12,696 | $12,522 | $11,846 |
| 9/30/2024 | $13,019 | $12,821 | $12,659 | $12,004 |
The Fund’s benchmarks are unmanaged indices used as a general measure of market performance. Calculations assume the reinvestment of dividends and capital gains.
Average Annual Total Returns (%)
| 1 Year | 5 Years | 10 Years |
|---|
| Class F at NAV | 11.25% | 1.15% | 2.67% |
| Bloomberg Municipal Bond Index | 10.37% | 1.39% | 2.52% |
| Lipper New Jersey Municipal Debt Funds Average | 10.50% | 1.24% | 2.39% |
Bloomberg Aggregate Bond IndexFootnote Reference* | 11.57% | 0.33% | 1.84% |
| Footnote | Description |
Footnote* | The Fund has adopted the Bloomberg Aggregate Bond Index as its broad-based securities market index. |
The Fund's past performance is no guarantee of future results. The returns do not reflect the deduction of taxes that a shareholder would pay on Fund distributions or redemption of Fund shares.
(as of September 30, 2024)
| Total Net Assets | $140,370,809 |
| # of Portfolio Holdings | 187 |
| Portfolio Turnover Rate | 8% |
| Total Advisory Fees Paid | $513,640 |
What did the Fund invest in?
(as of September 30, 2024)
Credit Rating S&P or Moody'sFootnote Reference(a) | %Footnote Reference** |
|---|
| |
- A22.30%
- A-3.86%
- A+9.20%
- AA16.65%
- AA-23.07%
- AA+1.48%
- AAA6.67%
- BB-1.51%
- BBB2.16%
- BBB-3.20%
- BBB+6.82%
- NR3.08%
- Total 100.00%
| Footnote | Description |
Footnote** | Represents percent of total investments, which excludes derivatives. |
Footnote(a) | Investments in investment grade municipal bonds, which as bonds that are rated, at the time of purchase, within the four highest grades assigned by an independent rating agency such as Moody’s, S&P, or Fitch, or an equivalent short-term rating, as applicable, or are unrated by rating agencies but deemed by Lord Abbett to be of comparable quality. Lower rated municipal bonds are rated, at the time of purchase, or an equivalent short-term rating, as applicable, by an independent rating agency or are unrated by rating agencies but deemed by Lord Abbett to be of comparable quality. |
There were no material fund changes during the period.
Where can I find additional information about the Fund?
For additional information about the Fund, including its Prospectus, Statement of Additional Information, financial statements, holdings and proxy information, please visit lordabbett.com/FundDocuments.
The Fund has adopted a policy that allows it to send only one copy of the Fund's prospectus, proxy material, annual report and semiannual report (or related notice of internet availability of annual report and semiannual report) to certain shareholders residing at the same "household." This reduces Fund expenses, which benefits you and other shareholders.If you need additional copies or do not want your mailings to be "householded," please call Lord Abbett at 888-522-2388.
Lord Abbett New Jersey Tax Free Fund
Annual Shareholder Report
September 30, 2024
lordabbett.com/FundDocuments
TSR-A-1035-F
11/24
Lord Abbett New Jersey Tax Free Fund
Annual Shareholder Report
September 30, 2024
lordabbett.com/FundDocuments
This annual shareholder report contains important information about the Lord Abbett New Jersey Tax Free Fund for the period of October 1, 2023 to September 30, 2024, as well as certain changes to the Fund. You can find additional information about the Fund at lordabbett.com/FundDocuments. You can also request this information by contacting us at 888-522-2388.
What were the Fund costs for the last year?
(based on a hypothetical $10,000 investment)
| Class Name | Costs of a $10,000 investment | Costs paid as a percentage of a $10,000 investment |
|---|
| Class F3 | $62 | 0.59% |
How did the Fund perform last year and what affected its performance?
For the fiscal year ended September 30, 2024, the Fund returned 11.15%, reflecting performance at the net asset value (NAV) of Class F3 shares, compared to the 10.37% of a securities market index with investment characteristics similar to those of the Fund, the Bloomberg Municipal Bond Index. The Fund's broad-based market index, the Bloomberg Aggregate Bond Index, returned 11.57% over the same period.
Positive factors for the municipal market included decreasing Treasury yields, easing inflationary pressures and the start of interest rate cuts by the U.S. Federal Reserve. Also supporting the market was increased demand for municipal bond funds and a strong fundamental backdrop as evidenced by growing tax revenue and positive ratings actions by public ratings agencies. Negative factors included a significant increase in municipal bond supply, which pressured the market in second half of the fiscal year, and periods of interest rate volatility driven by sticky inflation readings at points throughout the fiscal year. Against this backdrop, municipal bonds delivered strong returns.
Top contributors to the Fund’s performance: The Fund’s longer duration positioning contributed to relative performance with the fall in rates over the period. An overweight allocation to A-rated, BBB-rated and non-investment grade bonds contributed to relative performance.
Top detractors from the Fund’s performance: An overweight allocation to the Leasing, Industrial Development and Tobacco sectors detracted from relative performance. Security selection within the Leasing sector detracted from relative performance.
Total Return Based on $10,000 Investment
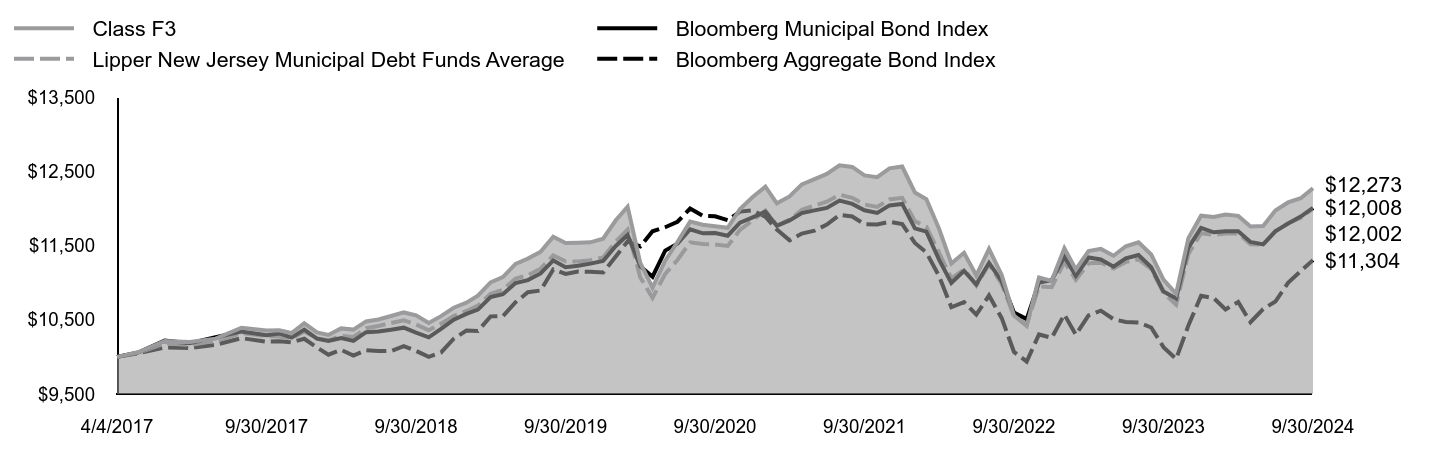
| Class F3 | Bloomberg Municipal Bond Index | Lipper New Jersey Municipal Debt Funds Average | Bloomberg Aggregate Bond Index |
|---|
| 4/4/2017 | $10,000 | $10,000 | $10,000 | $10,000 |
| 4/30/2017 | $10,065 | $10,060 | $10,057 | $10,051 |
| 5/31/2017 | $10,214 | $10,219 | $10,183 | $10,128 |
| 6/30/2017 | $10,200 | $10,183 | $10,161 | $10,118 |
| 7/31/2017 | $10,246 | $10,265 | $10,216 | $10,162 |
| 8/31/2017 | $10,393 | $10,343 | $10,320 | $10,253 |
| 9/30/2017 | $10,355 | $10,291 | $10,281 | $10,204 |
| 10/31/2017 | $10,359 | $10,316 | $10,275 | $10,210 |
| 11/30/2017 | $10,322 | $10,260 | $10,246 | $10,197 |
| 12/31/2017 | $10,452 | $10,368 | $10,343 | $10,244 |
| 1/31/2018 | $10,331 | $10,246 | $10,249 | $10,126 |
| 2/28/2018 | $10,295 | $10,215 | $10,224 | $10,030 |
| 3/31/2018 | $10,384 | $10,253 | $10,285 | $10,094 |
| 4/30/2018 | $10,368 | $10,216 | $10,269 | $10,019 |
| 5/31/2018 | $10,478 | $10,333 | $10,386 | $10,091 |
| 6/30/2018 | $10,504 | $10,342 | $10,417 | $10,078 |
| 7/31/2018 | $10,551 | $10,367 | $10,457 | $10,080 |
| 8/31/2018 | $10,599 | $10,394 | $10,492 | $10,145 |
| 9/30/2018 | $10,561 | $10,326 | $10,437 | $10,080 |
| 10/31/2018 | $10,458 | $10,263 | $10,359 | $10,000 |
| 11/30/2018 | $10,549 | $10,376 | $10,447 | $10,060 |
| 12/31/2018 | $10,662 | $10,501 | $10,550 | $10,245 |
| 1/31/2019 | $10,731 | $10,580 | $10,619 | $10,354 |
| 2/28/2019 | $10,825 | $10,637 | $10,690 | $10,348 |
| 3/31/2019 | $11,004 | $10,805 | $10,851 | $10,546 |
| 4/30/2019 | $11,075 | $10,845 | $10,904 | $10,549 |
| 5/31/2019 | $11,254 | $10,995 | $11,056 | $10,736 |
| 6/30/2019 | $11,324 | $11,035 | $11,100 | $10,871 |
| 7/31/2019 | $11,416 | $11,124 | $11,188 | $10,895 |
| 8/31/2019 | $11,618 | $11,300 | $11,368 | $11,177 |
| 9/30/2019 | $11,535 | $11,209 | $11,287 | $11,118 |
| 10/31/2019 | $11,539 | $11,229 | $11,286 | $11,151 |
| 11/30/2019 | $11,543 | $11,257 | $11,303 | $11,146 |
| 12/31/2019 | $11,592 | $11,292 | $11,339 | $11,138 |
| 1/31/2020 | $11,841 | $11,495 | $11,552 | $11,352 |
| 2/29/2020 | $12,023 | $11,643 | $11,715 | $11,557 |
| 3/31/2020 | $11,267 | $11,221 | $11,071 | $11,489 |
| 4/30/2020 | $10,934 | $11,080 | $10,795 | $11,693 |
| 5/31/2020 | $11,297 | $11,432 | $11,118 | $11,747 |
| 6/30/2020 | $11,548 | $11,526 | $11,306 | $11,821 |
| 7/31/2020 | $11,823 | $11,720 | $11,543 | $11,998 |
| 8/31/2020 | $11,780 | $11,665 | $11,521 | $11,901 |
| 9/30/2020 | $11,760 | $11,668 | $11,514 | $11,894 |
| 10/31/2020 | $11,740 | $11,633 | $11,495 | $11,841 |
| 11/30/2020 | $11,993 | $11,808 | $11,711 | $11,958 |
| 12/31/2020 | $12,155 | $11,880 | $11,840 | $11,974 |
| 1/31/2021 | $12,294 | $11,956 | $11,972 | $11,888 |
| 2/28/2021 | $12,069 | $11,766 | $11,770 | $11,716 |
| 3/31/2021 | $12,162 | $11,839 | $11,850 | $11,570 |
| 4/30/2021 | $12,325 | $11,938 | $11,981 | $11,662 |
| 5/31/2021 | $12,396 | $11,974 | $12,038 | $11,700 |
| 6/30/2021 | $12,466 | $12,007 | $12,091 | $11,782 |
| 7/31/2021 | $12,581 | $12,106 | $12,186 | $11,914 |
| 8/31/2021 | $12,559 | $12,062 | $12,144 | $11,891 |
| 9/30/2021 | $12,445 | $11,975 | $12,053 | $11,788 |
| 10/31/2021 | $12,422 | $11,940 | $12,020 | $11,785 |
| 11/30/2021 | $12,540 | $12,041 | $12,122 | $11,820 |
| 12/31/2021 | $12,565 | $12,061 | $12,143 | $11,789 |
| 1/31/2022 | $12,215 | $11,731 | $11,829 | $11,535 |
| 2/28/2022 | $12,124 | $11,688 | $11,752 | $11,407 |
| 3/31/2022 | $11,726 | $11,310 | $11,406 | $11,090 |
| 4/30/2022 | $11,258 | $10,997 | $11,058 | $10,669 |
| 5/31/2022 | $11,402 | $11,160 | $11,179 | $10,738 |
| 6/30/2022 | $11,097 | $10,977 | $10,960 | $10,569 |
| 7/31/2022 | $11,455 | $11,267 | $11,247 | $10,828 |
| 8/31/2022 | $11,102 | $11,020 | $10,983 | $10,522 |
| 9/30/2022 | $10,557 | $10,597 | $10,545 | $10,067 |
| 10/31/2022 | $10,418 | $10,509 | $10,438 | $9,937 |
| 11/30/2022 | $11,069 | $11,001 | $10,949 | $10,302 |
| 12/31/2022 | $11,025 | $11,032 | $10,939 | $10,256 |
| 1/31/2023 | $11,463 | $11,349 | $11,276 | $10,571 |
| 2/28/2023 | $11,179 | $11,093 | $11,040 | $10,298 |
| 3/31/2023 | $11,426 | $11,339 | $11,260 | $10,559 |
| 4/30/2023 | $11,455 | $11,313 | $11,270 | $10,623 |
| 5/31/2023 | $11,363 | $11,215 | $11,190 | $10,508 |
| 6/30/2023 | $11,491 | $11,327 | $11,280 | $10,470 |
| 7/31/2023 | $11,545 | $11,372 | $11,312 | $10,463 |
| 8/31/2023 | $11,380 | $11,208 | $11,182 | $10,396 |
| 9/30/2023 | $11,042 | $10,880 | $10,862 | $10,132 |
| 10/31/2023 | $10,851 | $10,787 | $10,704 | $9,972 |
| 11/30/2023 | $11,600 | $11,472 | $11,386 | $10,424 |
| 12/31/2023 | $11,903 | $11,739 | $11,667 | $10,823 |
| 1/31/2024 | $11,885 | $11,679 | $11,644 | $10,793 |
| 2/29/2024 | $11,918 | $11,694 | $11,661 | $10,640 |
| 3/31/2024 | $11,900 | $11,693 | $11,662 | $10,739 |
| 4/30/2024 | $11,757 | $11,548 | $11,518 | $10,467 |
| 5/31/2024 | $11,764 | $11,515 | $11,514 | $10,645 |
| 6/30/2024 | $11,973 | $11,691 | $11,696 | $10,746 |
| 7/31/2024 | $12,081 | $11,798 | $11,798 | $10,997 |
| 8/31/2024 | $12,138 | $11,891 | $11,873 | $11,155 |
| 9/30/2024 | $12,273 | $12,008 | $12,002 | $11,304 |
The Fund’s benchmarks are unmanaged indices used as a general measure of market performance. Calculations assume the reinvestment of dividends and capital gains.
Average Annual Total Returns (%)
| 1 Year | 5 Years | Since Inception 4/4/17 |
|---|
| Class F3 at NAV | 11.15% | 1.25% | 2.77% |
| Bloomberg Municipal Bond Index | 10.37% | 1.39% | 2.47% |
| Lipper New Jersey Municipal Debt Funds Average | 10.50% | 1.24% | 2.47% |
Bloomberg Aggregate Bond IndexFootnote Reference* | 11.57% | 0.33% | 1.65% |
| Footnote | Description |
Footnote* | The Fund has adopted the Bloomberg Aggregate Bond Index as its broad-based securities market index. |
The Fund's past performance is no guarantee of future results. The returns do not reflect the deduction of taxes that a shareholder would pay on Fund distributions or redemption of Fund shares.
(as of September 30, 2024)
| Total Net Assets | $140,370,809 |
| # of Portfolio Holdings | 187 |
| Portfolio Turnover Rate | 8% |
| Total Advisory Fees Paid | $513,640 |
What did the Fund invest in?
(as of September 30, 2024)
Credit Rating S&P or Moody'sFootnote Reference(a) | %Footnote Reference** |
|---|
| |
- A22.30%
- A-3.86%
- A+9.20%
- AA16.65%
- AA-23.07%
- AA+1.48%
- AAA6.67%
- BB-1.51%
- BBB2.16%
- BBB-3.20%
- BBB+6.82%
- NR3.08%
- Total 100.00%
| Footnote | Description |
Footnote** | Represents percent of total investments, which excludes derivatives. |
Footnote(a) | Investments in investment grade municipal bonds, which as bonds that are rated, at the time of purchase, within the four highest grades assigned by an independent rating agency such as Moody’s, S&P, or Fitch, or an equivalent short-term rating, as applicable, or are unrated by rating agencies but deemed by Lord Abbett to be of comparable quality. Lower rated municipal bonds are rated, at the time of purchase, or an equivalent short-term rating, as applicable, by an independent rating agency or are unrated by rating agencies but deemed by Lord Abbett to be of comparable quality. |
There were no material fund changes during the period.
Where can I find additional information about the Fund?
For additional information about the Fund, including its Prospectus, Statement of Additional Information, financial statements, holdings and proxy information, please visit lordabbett.com/FundDocuments.
The Fund has adopted a policy that allows it to send only one copy of the Fund's prospectus, proxy material, annual report and semiannual report (or related notice of internet availability of annual report and semiannual report) to certain shareholders residing at the same "household." This reduces Fund expenses, which benefits you and other shareholders.If you need additional copies or do not want your mailings to be "householded," please call Lord Abbett at 888-522-2388.
Lord Abbett New Jersey Tax Free Fund
Annual Shareholder Report
September 30, 2024
lordabbett.com/FundDocuments
TSR-A-8989-F3
11/24
Lord Abbett New Jersey Tax Free Fund
Annual Shareholder Report
September 30, 2024
lordabbett.com/FundDocuments
This annual shareholder report contains important information about the Lord Abbett New Jersey Tax Free Fund for the period of October 1, 2023 to September 30, 2024, as well as certain changes to the Fund. You can find additional information about the Fund at lordabbett.com/FundDocuments. You can also request this information by contacting us at 888-522-2388.
What were the Fund costs for the last year?
(based on a hypothetical $10,000 investment)
| Class Name | Costs of a $10,000 investment | Costs paid as a percentage of a $10,000 investment |
|---|
| Class I | $66 | 0.62% |
How did the Fund perform last year and what affected its performance?
For the fiscal year ended September 30, 2024, the Fund returned 11.36%, reflecting performance at the net asset value (NAV) of Class I shares, compared to the 10.37% of a securities market index with investment characteristics similar to those of the Fund, the Bloomberg Municipal Bond Index. The Fund's broad-based market index, the Bloomberg Aggregate Bond Index, returned 11.57% over the same period.
Positive factors for the municipal market included decreasing Treasury yields, easing inflationary pressures and the start of interest rate cuts by the U.S. Federal Reserve. Also supporting the market was increased demand for municipal bond funds and a strong fundamental backdrop as evidenced by growing tax revenue and positive ratings actions by public ratings agencies. Negative factors included a significant increase in municipal bond supply, which pressured the market in second half of the fiscal year, and periods of interest rate volatility driven by sticky inflation readings at points throughout the fiscal year. Against this backdrop, municipal bonds delivered strong returns.
Top contributors to the Fund’s performance: The Fund’s longer duration positioning contributed to relative performance with the fall in rates over the period. An overweight allocation to A-rated, BBB-rated and non-investment grade bonds contributed to relative performance.
Top detractors from the Fund’s performance: An overweight allocation to the Leasing, Industrial Development and Tobacco sectors detracted from relative performance. Security selection within the Leasing sector detracted from relative performance.
Total Return Based on $10,000 Investment

| Class I | Bloomberg Municipal Bond Index | Lipper New Jersey Municipal Debt Funds Average | Bloomberg Aggregate Bond Index |
|---|
| 9/30/2014 | $10,000 | $10,000 | $10,000 | $10,000 |
| 10/31/2014 | $10,091 | $10,069 | $10,055 | $10,098 |
| 11/30/2014 | $10,119 | $10,086 | $10,057 | $10,170 |
| 12/31/2014 | $10,190 | $10,137 | $10,121 | $10,179 |
| 1/31/2015 | $10,404 | $10,316 | $10,288 | $10,393 |
| 2/28/2015 | $10,272 | $10,210 | $10,175 | $10,295 |
| 3/31/2015 | $10,282 | $10,240 | $10,192 | $10,343 |
| 4/30/2015 | $10,210 | $10,186 | $10,123 | $10,306 |
| 5/31/2015 | $10,158 | $10,158 | $10,088 | $10,281 |
| 6/30/2015 | $10,085 | $10,148 | $10,034 | $10,169 |
| 7/31/2015 | $10,117 | $10,222 | $10,085 | $10,240 |
| 8/31/2015 | $10,085 | $10,242 | $10,073 | $10,225 |
| 9/30/2015 | $10,200 | $10,316 | $10,155 | $10,294 |
| 10/31/2015 | $10,272 | $10,357 | $10,211 | $10,296 |
| 11/30/2015 | $10,324 | $10,398 | $10,260 | $10,269 |
| 12/31/2015 | $10,461 | $10,472 | $10,357 | $10,235 |
| 1/31/2016 | $10,598 | $10,596 | $10,463 | $10,376 |
| 2/29/2016 | $10,609 | $10,613 | $10,468 | $10,450 |
| 3/31/2016 | $10,682 | $10,647 | $10,528 | $10,546 |
| 4/30/2016 | $10,776 | $10,725 | $10,607 | $10,586 |
| 5/31/2016 | $10,849 | $10,754 | $10,658 | $10,589 |
| 6/30/2016 | $11,073 | $10,925 | $10,848 | $10,779 |
| 7/31/2016 | $11,080 | $10,932 | $10,847 | $10,847 |
| 8/31/2016 | $11,108 | $10,947 | $10,881 | $10,835 |
| 9/30/2016 | $11,093 | $10,892 | $10,847 | $10,829 |
| 10/31/2016 | $10,970 | $10,778 | $10,750 | $10,746 |
| 11/30/2016 | $10,498 | $10,376 | $10,339 | $10,492 |
| 12/31/2016 | $10,591 | $10,497 | $10,419 | $10,506 |
| 1/31/2017 | $10,621 | $10,567 | $10,447 | $10,527 |
| 2/28/2017 | $10,716 | $10,640 | $10,522 | $10,598 |
| 3/31/2017 | $10,745 | $10,663 | $10,534 | $10,592 |
| 4/30/2017 | $10,817 | $10,740 | $10,607 | $10,674 |
| 5/31/2017 | $10,978 | $10,911 | $10,740 | $10,756 |
| 6/30/2017 | $10,962 | $10,872 | $10,717 | $10,745 |
| 7/31/2017 | $11,034 | $10,960 | $10,775 | $10,792 |
| 8/31/2017 | $11,169 | $11,043 | $10,884 | $10,888 |
| 9/30/2017 | $11,127 | $10,987 | $10,843 | $10,836 |
| 10/31/2017 | $11,131 | $11,014 | $10,837 | $10,843 |
| 11/30/2017 | $11,113 | $10,955 | $10,806 | $10,829 |
| 12/31/2017 | $11,230 | $11,069 | $10,909 | $10,879 |
| 1/31/2018 | $11,099 | $10,939 | $10,810 | $10,753 |
| 2/28/2018 | $11,060 | $10,906 | $10,783 | $10,651 |
| 3/31/2018 | $11,155 | $10,947 | $10,848 | $10,720 |
| 4/30/2018 | $11,138 | $10,908 | $10,831 | $10,640 |
| 5/31/2018 | $11,256 | $11,033 | $10,954 | $10,716 |
| 6/30/2018 | $11,284 | $11,042 | $10,987 | $10,703 |
| 7/31/2018 | $11,334 | $11,069 | $11,029 | $10,705 |
| 8/31/2018 | $11,385 | $11,097 | $11,066 | $10,774 |
| 9/30/2018 | $11,344 | $11,025 | $11,008 | $10,705 |
| 10/31/2018 | $11,233 | $10,957 | $10,926 | $10,620 |
| 11/30/2018 | $11,331 | $11,079 | $11,018 | $10,683 |
| 12/31/2018 | $11,451 | $11,211 | $11,127 | $10,880 |
| 1/31/2019 | $11,525 | $11,296 | $11,200 | $10,995 |
| 2/28/2019 | $11,626 | $11,357 | $11,275 | $10,989 |
| 3/31/2019 | $11,818 | $11,536 | $11,445 | $11,200 |
| 4/30/2019 | $11,893 | $11,579 | $11,500 | $11,203 |
| 5/31/2019 | $12,086 | $11,739 | $11,661 | $11,402 |
| 6/30/2019 | $12,138 | $11,782 | $11,707 | $11,545 |
| 7/31/2019 | $12,260 | $11,877 | $11,800 | $11,570 |
| 8/31/2019 | $12,477 | $12,065 | $11,990 | $11,870 |
| 9/30/2019 | $12,387 | $11,968 | $11,904 | $11,807 |
| 10/31/2019 | $12,367 | $11,989 | $11,903 | $11,842 |
| 11/30/2019 | $12,396 | $12,019 | $11,921 | $11,836 |
| 12/31/2019 | $12,447 | $12,056 | $11,959 | $11,828 |
| 1/31/2020 | $12,714 | $12,273 | $12,184 | $12,056 |
| 2/29/2020 | $12,909 | $12,431 | $12,356 | $12,273 |
| 3/31/2020 | $12,097 | $11,980 | $11,677 | $12,201 |
| 4/30/2020 | $11,740 | $11,830 | $11,386 | $12,417 |
| 5/31/2020 | $12,105 | $12,206 | $11,726 | $12,475 |
| 6/30/2020 | $12,399 | $12,307 | $11,924 | $12,554 |
| 7/31/2020 | $12,668 | $12,514 | $12,174 | $12,741 |
| 8/31/2020 | $12,647 | $12,455 | $12,151 | $12,638 |
| 9/30/2020 | $12,626 | $12,458 | $12,144 | $12,632 |
| 10/31/2020 | $12,604 | $12,420 | $12,124 | $12,575 |
| 11/30/2020 | $12,875 | $12,608 | $12,352 | $12,699 |
| 12/31/2020 | $13,049 | $12,685 | $12,488 | $12,716 |
| 1/31/2021 | $13,198 | $12,765 | $12,627 | $12,625 |
| 2/28/2021 | $12,955 | $12,563 | $12,414 | $12,443 |
| 3/31/2021 | $13,055 | $12,640 | $12,498 | $12,287 |
| 4/30/2021 | $13,230 | $12,746 | $12,636 | $12,384 |
| 5/31/2021 | $13,305 | $12,784 | $12,696 | $12,425 |
| 6/30/2021 | $13,379 | $12,819 | $12,752 | $12,512 |
| 7/31/2021 | $13,503 | $12,925 | $12,853 | $12,652 |
| 8/31/2021 | $13,479 | $12,878 | $12,808 | $12,628 |
| 9/30/2021 | $13,356 | $12,785 | $12,712 | $12,518 |
| 10/31/2021 | $13,332 | $12,748 | $12,678 | $12,515 |
| 11/30/2021 | $13,458 | $12,856 | $12,785 | $12,552 |
| 12/31/2021 | $13,484 | $12,877 | $12,807 | $12,520 |
| 1/31/2022 | $13,084 | $12,525 | $12,476 | $12,250 |
| 2/28/2022 | $13,011 | $12,480 | $12,395 | $12,114 |
| 3/31/2022 | $12,558 | $12,075 | $12,030 | $11,777 |
| 4/30/2022 | $12,080 | $11,741 | $11,663 | $11,330 |
| 5/31/2022 | $12,234 | $11,916 | $11,791 | $11,403 |
| 6/30/2022 | $11,882 | $11,720 | $11,559 | $11,224 |
| 7/31/2022 | $12,291 | $12,030 | $11,862 | $11,498 |
| 8/31/2022 | $11,912 | $11,766 | $11,584 | $11,174 |
| 9/30/2022 | $11,327 | $11,315 | $11,122 | $10,691 |
| 10/31/2022 | $11,177 | $11,221 | $11,009 | $10,552 |
| 11/30/2022 | $11,874 | $11,746 | $11,548 | $10,940 |
| 12/31/2022 | $11,827 | $11,779 | $11,537 | $10,891 |
| 1/31/2023 | $12,296 | $12,117 | $11,893 | $11,226 |
| 2/28/2023 | $11,992 | $11,843 | $11,644 | $10,936 |
| 3/31/2023 | $12,256 | $12,106 | $11,876 | $11,214 |
| 4/30/2023 | $12,287 | $12,079 | $11,886 | $11,282 |
| 5/31/2023 | $12,188 | $11,974 | $11,802 | $11,159 |
| 6/30/2023 | $12,325 | $12,094 | $11,897 | $11,119 |
| 7/31/2023 | $12,383 | $12,142 | $11,931 | $11,111 |
| 8/31/2023 | $12,205 | $11,967 | $11,794 | $11,040 |
| 9/30/2023 | $11,816 | $11,616 | $11,456 | $10,760 |
| 10/31/2023 | $11,637 | $11,517 | $11,290 | $10,590 |
| 11/30/2023 | $12,439 | $12,249 | $12,009 | $11,069 |
| 12/31/2023 | $12,765 | $12,533 | $12,305 | $11,493 |
| 1/31/2024 | $12,745 | $12,469 | $12,281 | $11,462 |
| 2/29/2024 | $12,779 | $12,485 | $12,299 | $11,300 |
| 3/31/2024 | $12,759 | $12,485 | $12,300 | $11,404 |
| 4/30/2024 | $12,606 | $12,330 | $12,148 | $11,116 |
| 5/31/2024 | $12,613 | $12,294 | $12,144 | $11,304 |
| 6/30/2024 | $12,810 | $12,482 | $12,336 | $11,412 |
| 7/31/2024 | $12,926 | $12,596 | $12,443 | $11,678 |
| 8/31/2024 | $13,014 | $12,696 | $12,522 | $11,846 |
| 9/30/2024 | $13,158 | $12,821 | $12,659 | $12,004 |
The Fund’s benchmarks are unmanaged indices used as a general measure of market performance. Calculations assume the reinvestment of dividends and capital gains.
Average Annual Total Returns (%)
| 1 Year | 5 Years | 10 Years |
|---|
| Class I at NAV | 11.36% | 1.22% | 2.78% |
| Bloomberg Municipal Bond Index | 10.37% | 1.39% | 2.52% |
| Lipper New Jersey Municipal Debt Funds Average | 10.50% | 1.24% | 2.39% |
Bloomberg Aggregate Bond IndexFootnote Reference* | 11.57% | 0.33% | 1.84% |
| Footnote | Description |
Footnote* | The Fund has adopted the Bloomberg Aggregate Bond Index as its broad-based securities market index. |
The Fund's past performance is no guarantee of future results. The returns do not reflect the deduction of taxes that a shareholder would pay on Fund distributions or redemption of Fund shares.
(as of September 30, 2024)
| Total Net Assets | $140,370,809 |
| # of Portfolio Holdings | 187 |
| Portfolio Turnover Rate | 8% |
| Total Advisory Fees Paid | $513,640 |
What did the Fund invest in?
(as of September 30, 2024)
Credit Rating S&P or Moody'sFootnote Reference(a) | %Footnote Reference** |
|---|
| |
- A22.30%
- A-3.86%
- A+9.20%
- AA16.65%
- AA-23.07%
- AA+1.48%
- AAA6.67%
- BB-1.51%
- BBB2.16%
- BBB-3.20%
- BBB+6.82%
- NR3.08%
- Total 100.00%
| Footnote | Description |
Footnote** | Represents percent of total investments, which excludes derivatives. |
Footnote(a) | Investments in investment grade municipal bonds, which as bonds that are rated, at the time of purchase, within the four highest grades assigned by an independent rating agency such as Moody’s, S&P, or Fitch, or an equivalent short-term rating, as applicable, or are unrated by rating agencies but deemed by Lord Abbett to be of comparable quality. Lower rated municipal bonds are rated, at the time of purchase, or an equivalent short-term rating, as applicable, by an independent rating agency or are unrated by rating agencies but deemed by Lord Abbett to be of comparable quality. |
There were no material fund changes during the period.
Where can I find additional information about the Fund?
For additional information about the Fund, including its Prospectus, Statement of Additional Information, financial statements, holdings and proxy information, please visit lordabbett.com/FundDocuments.
The Fund has adopted a policy that allows it to send only one copy of the Fund's prospectus, proxy material, annual report and semiannual report (or related notice of internet availability of annual report and semiannual report) to certain shareholders residing at the same "household." This reduces Fund expenses, which benefits you and other shareholders.If you need additional copies or do not want your mailings to be "householded," please call Lord Abbett at 888-522-2388.
Lord Abbett New Jersey Tax Free Fund
Annual Shareholder Report
September 30, 2024
lordabbett.com/FundDocuments
TSR-A-3327-I
11/24
Lord Abbett Short Duration Tax Free Income Fund
Annual Shareholder Report
September 30, 2024
lordabbett.com/FundDocuments
This annual shareholder report contains important information about the Lord Abbett Short Duration Tax Free Income Fund for the period of October 1, 2023 to September 30, 2024, as well as certain changes to the Fund. You can find additional information about the Fund at lordabbett.com/FundDocuments. You can also request this information by contacting us at 888-522-2388.
What were the Fund costs for the last year?
(based on a hypothetical $10,000 investment)
| Class Name | Costs of a $10,000 investment | Costs paid as a percentage of a $10,000 investment |
|---|
| Class A | $67 | 0.65% |
How did the Fund perform last year and what affected its performance?
For the fiscal year ended September 30, 2024, the Fund returned 5.67%, reflecting performance at the net asset value (NAV) of Class A shares, compared to the 6.09% of a securities market index with investment characteristics similar to those of the Fund, the Bloomberg Municipal Bond Short 1-5 Year Index. The Fund's broad-based market index, the Bloomberg Aggregate Bond Index, returned 11.57% over the same period.
Positive factors for the municipal market included decreasing Treasury yields, easing inflationary pressures and the start of interest rate cuts by the U.S. Federal Reserve. Also supporting the market was increased demand for municipal bond funds and a strong fundamental backdrop as evidenced by growing tax revenue and positive ratings actions by public ratings agencies. Negative factors included a significant increase in municipal bond supply, which pressured the market in second half of the fiscal year, and periods of interest rate volatility driven by sticky inflation readings at points throughout the fiscal year. Against this backdrop, municipal bonds delivered strong returns.
Top contributors to the Fund’s performance: An overweight allocation to A- and BBB-rated bonds contributed to relative performance.
Top detractors from the Fund’s performance: The Fund’s shorter duration positioning relative to the prospectus benchmark detracted from relative performance with the fall in rates over the period. An overweight allocation to the Power sector and Variable Rate Demand Notes detracted from relative performance. Security selection within the Housing and Health Care sectors detracted from relative performance.
Total Return Based on $10,000 Investment
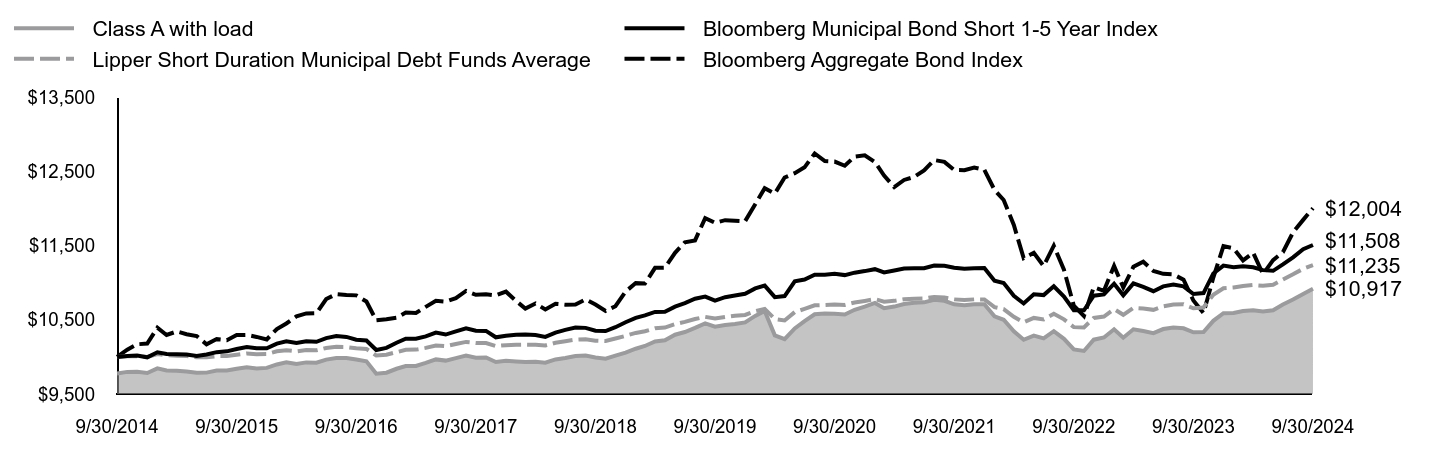
| Class A with load | Bloomberg Municipal Bond Short 1-5 Year Index | Lipper Short Duration Municipal Debt Funds Average | Bloomberg Aggregate Bond Index |
|---|
| 9/30/2014 | $9,777 | $10,000 | $10,000 | $10,000 |
| 10/31/2014 | $9,798 | $10,012 | $10,008 | $10,098 |
| 11/30/2014 | $9,800 | $10,019 | $10,010 | $10,170 |
| 12/31/2014 | $9,783 | $9,994 | $9,999 | $10,179 |
| 1/31/2015 | $9,846 | $10,062 | $10,038 | $10,393 |
| 2/28/2015 | $9,818 | $10,039 | $10,022 | $10,295 |
| 3/31/2015 | $9,813 | $10,034 | $10,017 | $10,343 |
| 4/30/2015 | $9,803 | $10,031 | $10,011 | $10,306 |
| 5/31/2015 | $9,786 | $10,013 | $9,994 | $10,281 |
| 6/30/2015 | $9,788 | $10,033 | $9,995 | $10,169 |
| 7/31/2015 | $9,815 | $10,064 | $10,010 | $10,240 |
| 8/31/2015 | $9,817 | $10,075 | $10,013 | $10,225 |
| 9/30/2015 | $9,839 | $10,107 | $10,029 | $10,294 |
| 10/31/2015 | $9,860 | $10,134 | $10,047 | $10,296 |
| 11/30/2015 | $9,844 | $10,116 | $10,037 | $10,269 |
| 12/31/2015 | $9,852 | $10,115 | $10,039 | $10,235 |
| 1/31/2016 | $9,898 | $10,178 | $10,075 | $10,376 |
| 2/29/2016 | $9,927 | $10,211 | $10,089 | $10,450 |
| 3/31/2016 | $9,904 | $10,186 | $10,075 | $10,546 |
| 4/30/2016 | $9,926 | $10,211 | $10,093 | $10,586 |
| 5/31/2016 | $9,922 | $10,204 | $10,088 | $10,589 |
| 6/30/2016 | $9,963 | $10,253 | $10,120 | $10,779 |
| 7/31/2016 | $9,984 | $10,281 | $10,135 | $10,847 |
| 8/31/2016 | $9,986 | $10,269 | $10,133 | $10,835 |
| 9/30/2016 | $9,964 | $10,232 | $10,115 | $10,829 |
| 10/31/2016 | $9,941 | $10,221 | $10,107 | $10,746 |
| 11/30/2016 | $9,773 | $10,093 | $10,019 | $10,492 |
| 12/31/2016 | $9,787 | $10,122 | $10,029 | $10,506 |
| 1/31/2017 | $9,840 | $10,190 | $10,064 | $10,527 |
| 2/28/2017 | $9,876 | $10,246 | $10,096 | $10,598 |
| 3/31/2017 | $9,878 | $10,244 | $10,098 | $10,592 |
| 4/30/2017 | $9,919 | $10,276 | $10,121 | $10,674 |
| 5/31/2017 | $9,966 | $10,327 | $10,154 | $10,756 |
| 6/30/2017 | $9,950 | $10,301 | $10,144 | $10,745 |
| 7/31/2017 | $9,984 | $10,345 | $10,173 | $10,792 |
| 8/31/2017 | $10,018 | $10,386 | $10,202 | $10,888 |
| 9/30/2017 | $9,989 | $10,352 | $10,188 | $10,836 |
| 10/31/2017 | $9,992 | $10,350 | $10,187 | $10,843 |
| 11/30/2017 | $9,931 | $10,264 | $10,146 | $10,829 |
| 12/31/2017 | $9,948 | $10,285 | $10,158 | $10,879 |
| 1/31/2018 | $9,938 | $10,299 | $10,164 | $10,753 |
| 2/28/2018 | $9,930 | $10,302 | $10,165 | $10,651 |
| 3/31/2018 | $9,935 | $10,295 | $10,163 | $10,720 |
| 4/30/2018 | $9,922 | $10,270 | $10,154 | $10,640 |
| 5/31/2018 | $9,966 | $10,326 | $10,190 | $10,716 |
| 6/30/2018 | $9,985 | $10,364 | $10,212 | $10,703 |
| 7/31/2018 | $10,011 | $10,395 | $10,232 | $10,705 |
| 8/31/2018 | $10,018 | $10,391 | $10,238 | $10,774 |
| 9/30/2018 | $9,993 | $10,353 | $10,219 | $10,705 |
| 10/31/2018 | $9,975 | $10,348 | $10,214 | $10,620 |
| 11/30/2018 | $10,016 | $10,400 | $10,247 | $10,683 |
| 12/31/2018 | $10,057 | $10,467 | $10,284 | $10,880 |
| 1/31/2019 | $10,110 | $10,525 | $10,323 | $10,995 |
| 2/28/2019 | $10,147 | $10,559 | $10,346 | $10,989 |
| 3/31/2019 | $10,208 | $10,606 | $10,385 | $11,200 |
| 4/30/2019 | $10,225 | $10,608 | $10,395 | $11,203 |
| 5/31/2019 | $10,299 | $10,677 | $10,441 | $11,402 |
| 6/30/2019 | $10,335 | $10,724 | $10,471 | $11,545 |
| 7/31/2019 | $10,390 | $10,783 | $10,510 | $11,570 |
| 8/31/2019 | $10,451 | $10,813 | $10,539 | $11,870 |
| 9/30/2019 | $10,408 | $10,759 | $10,516 | $11,807 |
| 10/31/2019 | $10,429 | $10,804 | $10,537 | $11,842 |
| 11/30/2019 | $10,444 | $10,827 | $10,554 | $11,836 |
| 12/31/2019 | $10,465 | $10,850 | $10,565 | $11,828 |
| 1/31/2020 | $10,552 | $10,923 | $10,615 | $12,056 |
| 2/29/2020 | $10,619 | $10,961 | $10,646 | $12,273 |
| 3/31/2020 | $10,290 | $10,805 | $10,510 | $12,201 |
| 4/30/2020 | $10,238 | $10,819 | $10,491 | $12,417 |
| 5/31/2020 | $10,384 | $11,019 | $10,603 | $12,475 |
| 6/30/2020 | $10,482 | $11,042 | $10,647 | $12,554 |
| 7/31/2020 | $10,574 | $11,108 | $10,695 | $12,741 |
| 8/31/2020 | $10,585 | $11,106 | $10,700 | $12,638 |
| 9/30/2020 | $10,582 | $11,119 | $10,706 | $12,632 |
| 10/31/2020 | $10,572 | $11,102 | $10,700 | $12,575 |
| 11/30/2020 | $10,635 | $11,135 | $10,733 | $12,699 |
| 12/31/2020 | $10,678 | $11,156 | $10,754 | $12,716 |
| 1/31/2021 | $10,727 | $11,182 | $10,778 | $12,625 |
| 2/28/2021 | $10,657 | $11,138 | $10,744 | $12,443 |
| 3/31/2021 | $10,678 | $11,165 | $10,755 | $12,287 |
| 4/30/2021 | $10,713 | $11,190 | $10,776 | $12,384 |
| 5/31/2021 | $10,728 | $11,193 | $10,785 | $12,425 |
| 6/30/2021 | $10,735 | $11,194 | $10,787 | $12,512 |
| 7/31/2021 | $10,770 | $11,231 | $10,807 | $12,652 |
| 8/31/2021 | $10,756 | $11,227 | $10,800 | $12,628 |
| 9/30/2021 | $10,709 | $11,202 | $10,775 | $12,518 |
| 10/31/2021 | $10,695 | $11,187 | $10,765 | $12,515 |
| 11/30/2021 | $10,709 | $11,193 | $10,775 | $12,552 |
| 12/31/2021 | $10,709 | $11,197 | $10,773 | $12,520 |
| 1/31/2022 | $10,546 | $11,025 | $10,670 | $12,250 |
| 2/28/2022 | $10,500 | $10,996 | $10,644 | $12,114 |
| 3/31/2022 | $10,344 | $10,824 | $10,540 | $11,777 |
| 4/30/2022 | $10,231 | $10,720 | $10,466 | $11,330 |
| 5/31/2022 | $10,287 | $10,844 | $10,525 | $11,403 |
| 6/30/2022 | $10,249 | $10,833 | $10,504 | $11,224 |
| 7/31/2022 | $10,347 | $10,951 | $10,582 | $11,498 |
| 8/31/2022 | $10,244 | $10,814 | $10,506 | $11,174 |
| 9/30/2022 | $10,100 | $10,629 | $10,402 | $10,691 |
| 10/31/2022 | $10,080 | $10,628 | $10,397 | $10,552 |
| 11/30/2022 | $10,232 | $10,825 | $10,525 | $10,940 |
| 12/31/2022 | $10,262 | $10,842 | $10,544 | $10,891 |
| 1/31/2023 | $10,372 | $10,986 | $10,643 | $11,226 |
| 2/28/2023 | $10,259 | $10,830 | $10,567 | $10,936 |
| 3/31/2023 | $10,372 | $10,990 | $10,661 | $11,214 |
| 4/30/2023 | $10,349 | $10,943 | $10,652 | $11,282 |
| 5/31/2023 | $10,320 | $10,885 | $10,634 | $11,159 |
| 6/30/2023 | $10,375 | $10,950 | $10,682 | $11,119 |
| 7/31/2023 | $10,397 | $10,976 | $10,707 | $11,111 |
| 8/31/2023 | $10,385 | $10,951 | $10,708 | $11,040 |
| 9/30/2023 | $10,332 | $10,847 | $10,655 | $10,760 |
| 10/31/2023 | $10,335 | $10,860 | $10,665 | $10,590 |
| 11/30/2023 | $10,486 | $11,124 | $10,838 | $11,069 |
| 12/31/2023 | $10,589 | $11,230 | $10,925 | $11,493 |
| 1/31/2024 | $10,592 | $11,209 | $10,935 | $11,462 |
| 2/29/2024 | $10,617 | $11,222 | $10,956 | $11,300 |
| 3/31/2024 | $10,628 | $11,208 | $10,968 | $11,404 |
| 4/30/2024 | $10,611 | $11,169 | $10,958 | $11,116 |
| 5/31/2024 | $10,629 | $11,160 | $10,972 | $11,304 |
| 6/30/2024 | $10,705 | $11,247 | $11,043 | $11,412 |
| 7/31/2024 | $10,772 | $11,342 | $11,113 | $11,678 |
| 8/31/2024 | $10,848 | $11,450 | $11,187 | $11,846 |
| 9/30/2024 | $10,917 | $11,508 | $11,235 | $12,004 |
The Fund’s benchmarks are unmanaged indices used as a general measure of market performance. Calculations assume the reinvestment of dividends and capital gains.
Average Annual Total Returns (%)
| 1 Year | 5 Years | 10 Years |
|---|
| Class A at NAV | 5.67% | 0.96% | 1.11% |
| Class A with sales charge | 3.30% | 0.51% | 0.88% |
| Bloomberg Municipal Bond Short 1-5 Year Index | 6.09% | 1.35% | 1.41% |
| Lipper Short Duration Municipal Debt Funds Average | 5.44% | 1.33% | 1.17% |
Bloomberg Aggregate Bond IndexFootnote Reference* | 11.57% | 0.33% | 1.84% |
| Footnote | Description |
Footnote* | The Fund has adopted the Bloomberg Aggregate Bond Index as its broad-based securities market index. |
The Fund's past performance is no guarantee of future results. The returns do not reflect the deduction of taxes that a shareholder would pay on Fund distributions or redemption of Fund shares.
(as of September 30, 2024)
| Total Net Assets | $1,561,231,464 |
| # of Portfolio Holdings | 277 |
| Portfolio Turnover Rate | 66% |
| Total Advisory Fees Paid | $5,141,439 |
What did the Fund invest in?
(as of September 30, 2024)
Credit Rating S&P or Moody'sFootnote Reference(a) | %Footnote Reference** |
|---|
| |
- A23.84%
- A-9.35%
- A+13.90%
- AA10.21%
- AA-5.98%
- AA+5.72%
- AAA4.03%
- B0.05%
- BB0.48%
- BB-0.49%
- BB+0.89%
- BBB4.31%
- BBB-7.01%
- BBB+7.46%
- NR6.28%
- Total 100.00%
| Footnote | Description |
Footnote** | Represents percent of total investments, which excludes derivatives. |
Footnote(a) | Investments in investment grade municipal bonds, which as bonds that are rated, at the time of purchase, within the four highest grades assigned by an independent rating agency such as Moody’s, S&P, or Fitch, or an equivalent short-term rating, as applicable, or are unrated by rating agencies but deemed by Lord Abbett to be of comparable quality. Lower rated municipal bonds are rated, at the time of purchase, or an equivalent short-term rating, as applicable, by an independent rating agency or are unrated by rating agencies but deemed by Lord Abbett to be of comparable quality. |
There were no material fund changes during the period.
Where can I find additional information about the Fund?
For additional information about the Fund, including its Prospectus, Statement of Additional Information, financial statements, holdings and proxy information, please visit lordabbett.com/FundDocuments.
The Fund has adopted a policy that allows it to send only one copy of the Fund's prospectus, proxy material, annual report and semiannual report (or related notice of internet availability of annual report and semiannual report) to certain shareholders residing at the same "household." This reduces Fund expenses, which benefits you and other shareholders.If you need additional copies or do not want your mailings to be "householded," please call Lord Abbett at 888-522-2388.
Lord Abbett Short Duration Tax Free Income Fund
Annual Shareholder Report
September 30, 2024
lordabbett.com/FundDocuments
TSR-A-2074-A
11/24
Lord Abbett Short Duration Tax Free Income Fund
Annual Shareholder Report
September 30, 2024
lordabbett.com/FundDocuments
This annual shareholder report contains important information about the Lord Abbett Short Duration Tax Free Income Fund for the period of October 1, 2023 to September 30, 2024, as well as certain changes to the Fund. You can find additional information about the Fund at lordabbett.com/FundDocuments. You can also request this information by contacting us at 888-522-2388.
What were the Fund costs for the last year?
(based on a hypothetical $10,000 investment)
| Class Name | Costs of a $10,000 investment | Costs paid as a percentage of a $10,000 investment |
|---|
| Class C | $129 | 1.26% |
How did the Fund perform last year and what affected its performance?
For the fiscal year ended September 30, 2024, the Fund returned 4.96%, reflecting performance at the net asset value (NAV) of Class C shares, compared to the 6.09% of a securities market index with investment characteristics similar to those of the Fund, the Bloomberg Municipal Bond Short 1-5 Year Index. The Fund's broad-based market index, the Bloomberg Aggregate Bond Index, returned 11.57% over the same period.
Positive factors for the municipal market included decreasing Treasury yields, easing inflationary pressures and the start of interest rate cuts by the U.S. Federal Reserve. Also supporting the market was increased demand for municipal bond funds and a strong fundamental backdrop as evidenced by growing tax revenue and positive ratings actions by public ratings agencies. Negative factors included a significant increase in municipal bond supply, which pressured the market in second half of the fiscal year, and periods of interest rate volatility driven by sticky inflation readings at points throughout the fiscal year. Against this backdrop, municipal bonds delivered strong returns.
Top contributors to the Fund’s performance: An overweight allocation to A- and BBB-rated bonds contributed to relative performance.
Top detractors from the Fund’s performance: The Fund’s shorter duration positioning relative to the prospectus benchmark detracted from relative performance with the fall in rates over the period. An overweight allocation to the Power sector and Variable Rate Demand Notes detracted from relative performance. Security selection within the Housing and Health Care sectors detracted from relative performance.
Total Return Based on $10,000 Investment
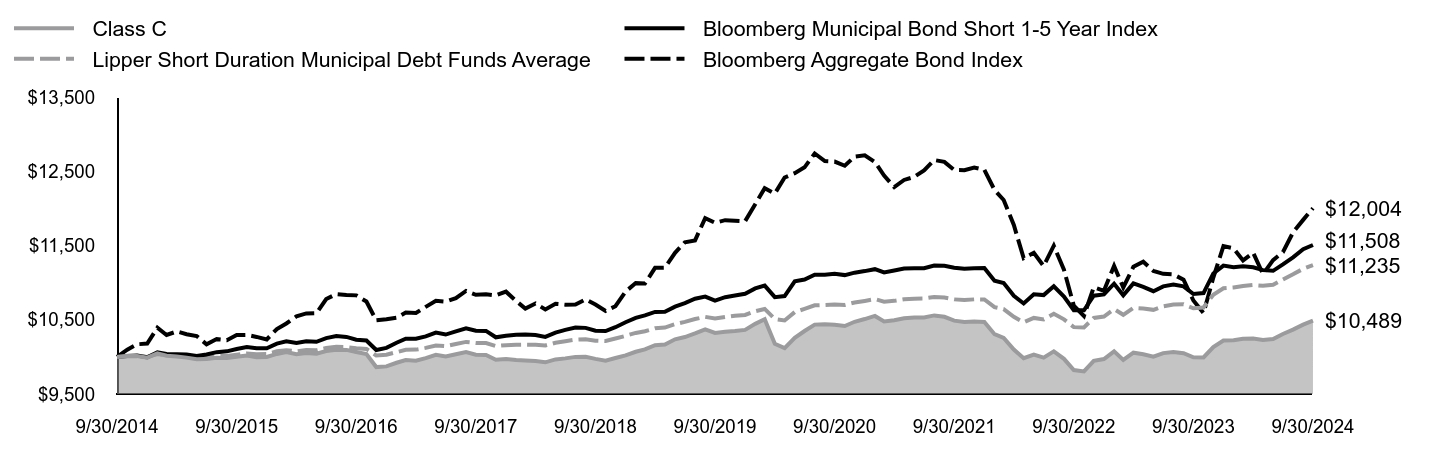
| Class C | Bloomberg Municipal Bond Short 1-5 Year Index | Lipper Short Duration Municipal Debt Funds Average | Bloomberg Aggregate Bond Index |
|---|
| 9/30/2014 | $10,000 | $10,000 | $10,000 | $10,000 |
| 10/31/2014 | $10,016 | $10,012 | $10,008 | $10,098 |
| 11/30/2014 | $10,013 | $10,019 | $10,010 | $10,170 |
| 12/31/2014 | $9,990 | $9,994 | $9,999 | $10,179 |
| 1/31/2015 | $10,049 | $10,062 | $10,038 | $10,393 |
| 2/28/2015 | $10,016 | $10,039 | $10,022 | $10,295 |
| 3/31/2015 | $10,006 | $10,034 | $10,017 | $10,343 |
| 4/30/2015 | $9,990 | $10,031 | $10,011 | $10,306 |
| 5/31/2015 | $9,967 | $10,013 | $9,994 | $10,281 |
| 6/30/2015 | $9,971 | $10,033 | $9,995 | $10,169 |
| 7/31/2015 | $9,987 | $10,064 | $10,010 | $10,240 |
| 8/31/2015 | $9,984 | $10,075 | $10,013 | $10,225 |
| 9/30/2015 | $10,001 | $10,107 | $10,029 | $10,294 |
| 10/31/2015 | $10,017 | $10,134 | $10,047 | $10,296 |
| 11/30/2015 | $9,996 | $10,116 | $10,037 | $10,269 |
| 12/31/2015 | $9,999 | $10,115 | $10,039 | $10,235 |
| 1/31/2016 | $10,040 | $10,178 | $10,075 | $10,376 |
| 2/29/2016 | $10,064 | $10,211 | $10,089 | $10,450 |
| 3/31/2016 | $10,036 | $10,186 | $10,075 | $10,546 |
| 4/30/2016 | $10,053 | $10,211 | $10,093 | $10,586 |
| 5/31/2016 | $10,044 | $10,204 | $10,088 | $10,589 |
| 6/30/2016 | $10,080 | $10,253 | $10,120 | $10,779 |
| 7/31/2016 | $10,097 | $10,281 | $10,135 | $10,847 |
| 8/31/2016 | $10,094 | $10,269 | $10,133 | $10,835 |
| 9/30/2016 | $10,066 | $10,232 | $10,115 | $10,829 |
| 10/31/2016 | $10,038 | $10,221 | $10,107 | $10,746 |
| 11/30/2016 | $9,863 | $10,093 | $10,019 | $10,492 |
| 12/31/2016 | $9,872 | $10,122 | $10,029 | $10,506 |
| 1/31/2017 | $9,921 | $10,190 | $10,064 | $10,527 |
| 2/28/2017 | $9,958 | $10,246 | $10,096 | $10,598 |
| 3/31/2017 | $9,948 | $10,244 | $10,098 | $10,592 |
| 4/30/2017 | $9,984 | $10,276 | $10,121 | $10,674 |
| 5/31/2017 | $10,027 | $10,327 | $10,154 | $10,756 |
| 6/30/2017 | $10,005 | $10,301 | $10,144 | $10,745 |
| 7/31/2017 | $10,035 | $10,345 | $10,173 | $10,792 |
| 8/31/2017 | $10,064 | $10,386 | $10,202 | $10,888 |
| 9/30/2017 | $10,030 | $10,352 | $10,188 | $10,836 |
| 10/31/2017 | $10,027 | $10,350 | $10,187 | $10,843 |
| 11/30/2017 | $9,961 | $10,264 | $10,146 | $10,829 |
| 12/31/2017 | $9,972 | $10,285 | $10,158 | $10,879 |
| 1/31/2018 | $9,958 | $10,299 | $10,164 | $10,753 |
| 2/28/2018 | $9,952 | $10,302 | $10,165 | $10,651 |
| 3/31/2018 | $9,944 | $10,295 | $10,163 | $10,720 |
| 4/30/2018 | $9,927 | $10,270 | $10,154 | $10,640 |
| 5/31/2018 | $9,966 | $10,326 | $10,190 | $10,716 |
| 6/30/2018 | $9,980 | $10,364 | $10,212 | $10,703 |
| 7/31/2018 | $10,000 | $10,395 | $10,232 | $10,705 |
| 8/31/2018 | $10,002 | $10,391 | $10,238 | $10,774 |
| 9/30/2018 | $9,973 | $10,353 | $10,219 | $10,705 |
| 10/31/2018 | $9,950 | $10,348 | $10,214 | $10,620 |
| 11/30/2018 | $9,985 | $10,400 | $10,247 | $10,683 |
| 12/31/2018 | $10,021 | $10,467 | $10,284 | $10,880 |
| 1/31/2019 | $10,069 | $10,525 | $10,323 | $10,995 |
| 2/28/2019 | $10,101 | $10,559 | $10,346 | $10,989 |
| 3/31/2019 | $10,157 | $10,606 | $10,385 | $11,200 |
| 4/30/2019 | $10,168 | $10,608 | $10,395 | $11,203 |
| 5/31/2019 | $10,237 | $10,677 | $10,441 | $11,402 |
| 6/30/2019 | $10,267 | $10,724 | $10,471 | $11,545 |
| 7/31/2019 | $10,316 | $10,783 | $10,510 | $11,570 |
| 8/31/2019 | $10,372 | $10,813 | $10,539 | $11,870 |
| 9/30/2019 | $10,323 | $10,759 | $10,516 | $11,807 |
| 10/31/2019 | $10,340 | $10,804 | $10,537 | $11,842 |
| 11/30/2019 | $10,349 | $10,827 | $10,554 | $11,836 |
| 12/31/2019 | $10,364 | $10,850 | $10,565 | $11,828 |
| 1/31/2020 | $10,445 | $10,923 | $10,615 | $12,056 |
| 2/29/2020 | $10,507 | $10,961 | $10,646 | $12,273 |
| 3/31/2020 | $10,176 | $10,805 | $10,510 | $12,201 |
| 4/30/2020 | $10,119 | $10,819 | $10,491 | $12,417 |
| 5/31/2020 | $10,258 | $11,019 | $10,603 | $12,475 |
| 6/30/2020 | $10,349 | $11,042 | $10,647 | $12,554 |
| 7/31/2020 | $10,435 | $11,108 | $10,695 | $12,741 |
| 8/31/2020 | $10,440 | $11,106 | $10,700 | $12,638 |
| 9/30/2020 | $10,432 | $11,119 | $10,706 | $12,632 |
| 10/31/2020 | $10,416 | $11,102 | $10,700 | $12,575 |
| 11/30/2020 | $10,473 | $11,135 | $10,733 | $12,699 |
| 12/31/2020 | $10,510 | $11,156 | $10,754 | $12,716 |
| 1/31/2021 | $10,552 | $11,182 | $10,778 | $12,625 |
| 2/28/2021 | $10,477 | $11,138 | $10,744 | $12,443 |
| 3/31/2021 | $10,493 | $11,165 | $10,755 | $12,287 |
| 4/30/2021 | $10,521 | $11,190 | $10,776 | $12,384 |
| 5/31/2021 | $10,530 | $11,193 | $10,785 | $12,425 |
| 6/30/2021 | $10,532 | $11,194 | $10,787 | $12,512 |
| 7/31/2021 | $10,559 | $11,231 | $10,807 | $12,652 |
| 8/31/2021 | $10,540 | $11,227 | $10,800 | $12,628 |
| 9/30/2021 | $10,488 | $11,202 | $10,775 | $12,518 |
| 10/31/2021 | $10,469 | $11,187 | $10,765 | $12,515 |
| 11/30/2021 | $10,477 | $11,193 | $10,775 | $12,552 |
| 12/31/2021 | $10,471 | $11,197 | $10,773 | $12,520 |
| 1/31/2022 | $10,306 | $11,025 | $10,670 | $12,250 |
| 2/28/2022 | $10,256 | $10,996 | $10,644 | $12,114 |
| 3/31/2022 | $10,099 | $10,824 | $10,540 | $11,777 |
| 4/30/2022 | $9,982 | $10,720 | $10,466 | $11,330 |
| 5/31/2022 | $10,032 | $10,844 | $10,525 | $11,403 |
| 6/30/2022 | $9,990 | $10,833 | $10,504 | $11,224 |
| 7/31/2022 | $10,074 | $10,951 | $10,582 | $11,498 |
| 8/31/2022 | $9,974 | $10,814 | $10,506 | $11,174 |
| 9/30/2022 | $9,823 | $10,629 | $10,402 | $10,691 |
| 10/31/2022 | $9,805 | $10,628 | $10,397 | $10,552 |
| 11/30/2022 | $9,947 | $10,825 | $10,525 | $10,940 |
| 12/31/2022 | $9,971 | $10,842 | $10,544 | $10,891 |
| 1/31/2023 | $10,074 | $10,986 | $10,643 | $11,226 |
| 2/28/2023 | $9,959 | $10,830 | $10,567 | $10,936 |
| 3/31/2023 | $10,057 | $10,990 | $10,661 | $11,214 |
| 4/30/2023 | $10,036 | $10,943 | $10,652 | $11,282 |
| 5/31/2023 | $10,002 | $10,885 | $10,634 | $11,159 |
| 6/30/2023 | $10,051 | $10,950 | $10,682 | $11,119 |
| 7/31/2023 | $10,067 | $10,976 | $10,707 | $11,111 |
| 8/31/2023 | $10,050 | $10,951 | $10,708 | $11,040 |
| 9/30/2023 | $9,994 | $10,847 | $10,655 | $10,760 |
| 10/31/2023 | $9,992 | $10,860 | $10,665 | $10,590 |
| 11/30/2023 | $10,133 | $11,124 | $10,838 | $11,069 |
| 12/31/2023 | $10,220 | $11,230 | $10,925 | $11,493 |
| 1/31/2024 | $10,224 | $11,209 | $10,935 | $11,462 |
| 2/29/2024 | $10,243 | $11,222 | $10,956 | $11,300 |
| 3/31/2024 | $10,248 | $11,208 | $10,968 | $11,404 |
| 4/30/2024 | $10,227 | $11,169 | $10,958 | $11,116 |
| 5/31/2024 | $10,240 | $11,160 | $10,972 | $11,304 |
| 6/30/2024 | $10,308 | $11,247 | $11,043 | $11,412 |
| 7/31/2024 | $10,367 | $11,342 | $11,113 | $11,678 |
| 8/31/2024 | $10,435 | $11,450 | $11,187 | $11,846 |
| 9/30/2024 | $10,489 | $11,508 | $11,235 | $12,004 |
The Fund’s benchmarks are unmanaged indices used as a general measure of market performance. Calculations assume the reinvestment of dividends and capital gains.
Average Annual Total Returns (%)
| 1 Year | 5 Years | 10 Years |
|---|
| Class C at NAV | 4.96% | 0.32% | 0.48% |
| Class C with sales charge | 3.96% | 0.32% | 0.48% |
| Bloomberg Municipal Bond Short 1-5 Year Index | 6.09% | 1.35% | 1.41% |
| Lipper Short Duration Municipal Debt Funds Average | 5.44% | 1.33% | 1.17% |
Bloomberg Aggregate Bond IndexFootnote Reference* | 11.57% | 0.33% | 1.84% |
| Footnote | Description |
Footnote* | The Fund has adopted the Bloomberg Aggregate Bond Index as its broad-based securities market index. |
The Fund's past performance is no guarantee of future results. The returns do not reflect the deduction of taxes that a shareholder would pay on Fund distributions or redemption of Fund shares.
(as of September 30, 2024)
| Total Net Assets | $1,561,231,464 |
| # of Portfolio Holdings | 277 |
| Portfolio Turnover Rate | 66% |
| Total Advisory Fees Paid | $5,141,439 |
What did the Fund invest in?
(as of September 30, 2024)
Credit Rating S&P or Moody'sFootnote Reference(a) | %Footnote Reference** |
|---|
| |
- A23.84%
- A-9.35%
- A+13.90%
- AA10.21%
- AA-5.98%
- AA+5.72%
- AAA4.03%
- B0.05%
- BB0.48%
- BB-0.49%
- BB+0.89%
- BBB4.31%
- BBB-7.01%
- BBB+7.46%
- NR6.28%
- Total 100.00%
| Footnote | Description |
Footnote** | Represents percent of total investments, which excludes derivatives. |
Footnote(a) | Investments in investment grade municipal bonds, which as bonds that are rated, at the time of purchase, within the four highest grades assigned by an independent rating agency such as Moody’s, S&P, or Fitch, or an equivalent short-term rating, as applicable, or are unrated by rating agencies but deemed by Lord Abbett to be of comparable quality. Lower rated municipal bonds are rated, at the time of purchase, or an equivalent short-term rating, as applicable, by an independent rating agency or are unrated by rating agencies but deemed by Lord Abbett to be of comparable quality. |
There were no material fund changes during the period.
Where can I find additional information about the Fund?
For additional information about the Fund, including its Prospectus, Statement of Additional Information, financial statements, holdings and proxy information, please visit lordabbett.com/FundDocuments.
The Fund has adopted a policy that allows it to send only one copy of the Fund's prospectus, proxy material, annual report and semiannual report (or related notice of internet availability of annual report and semiannual report) to certain shareholders residing at the same "household." This reduces Fund expenses, which benefits you and other shareholders.If you need additional copies or do not want your mailings to be "householded," please call Lord Abbett at 888-522-2388.
Lord Abbett Short Duration Tax Free Income Fund
Annual Shareholder Report
September 30, 2024
lordabbett.com/FundDocuments
TSR-A-2076-C
11/24
Lord Abbett Short Duration Tax Free Income Fund
Annual Shareholder Report
September 30, 2024
lordabbett.com/FundDocuments
This annual shareholder report contains important information about the Lord Abbett Short Duration Tax Free Income Fund for the period of October 1, 2023 to September 30, 2024, as well as certain changes to the Fund. You can find additional information about the Fund at lordabbett.com/FundDocuments. You can also request this information by contacting us at 888-522-2388.
What were the Fund costs for the last year?
(based on a hypothetical $10,000 investment)
| Class Name | Costs of a $10,000 investment | Costs paid as a percentage of a $10,000 investment |
|---|
| Class F | $57 | 0.55% |
How did the Fund perform last year and what affected its performance?
For the fiscal year ended September 30, 2024, the Fund returned 5.77%, reflecting performance at the net asset value (NAV) of Class F shares, compared to the 6.09% of a securities market index with investment characteristics similar to those of the Fund, the Bloomberg Municipal Bond Short 1-5 Year Index. The Fund's broad-based market index, the Bloomberg Aggregate Bond Index, returned 11.57% over the same period.
Positive factors for the municipal market included decreasing Treasury yields, easing inflationary pressures and the start of interest rate cuts by the U.S. Federal Reserve. Also supporting the market was increased demand for municipal bond funds and a strong fundamental backdrop as evidenced by growing tax revenue and positive ratings actions by public ratings agencies. Negative factors included a significant increase in municipal bond supply, which pressured the market in second half of the fiscal year, and periods of interest rate volatility driven by sticky inflation readings at points throughout the fiscal year. Against this backdrop, municipal bonds delivered strong returns.
Top contributors to the Fund’s performance: An overweight allocation to A- and BBB-rated bonds contributed to relative performance.
Top detractors from the Fund’s performance: The Fund’s shorter duration positioning relative to the prospectus benchmark detracted from relative performance with the fall in rates over the period. An overweight allocation to the Power sector and Variable Rate Demand Notes detracted from relative performance. Security selection within the Housing and Health Care sectors detracted from relative performance.
Total Return Based on $10,000 Investment
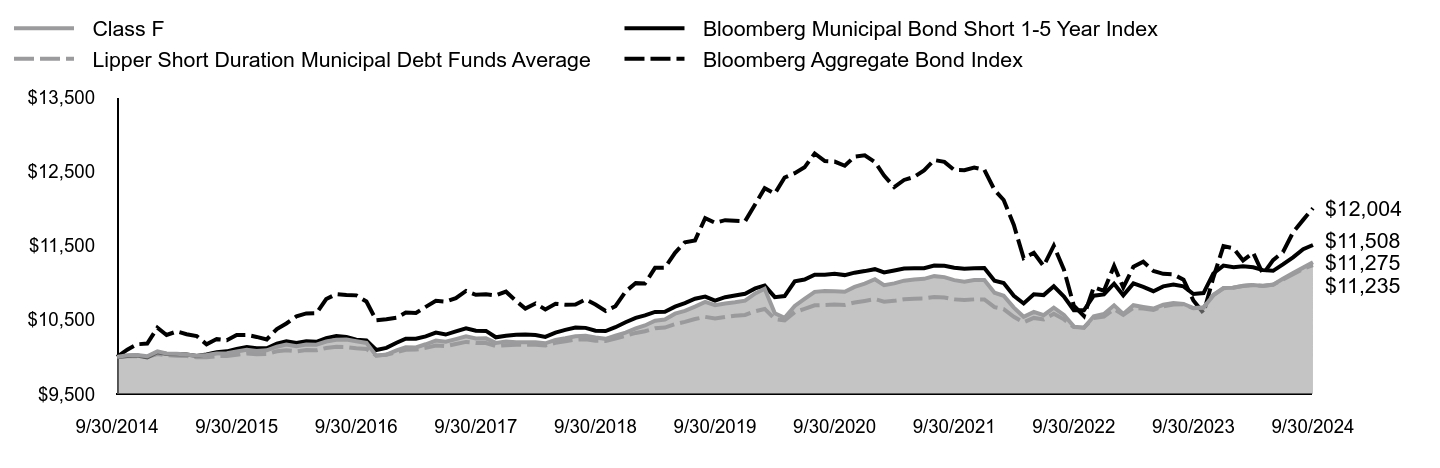
| Class F | Bloomberg Municipal Bond Short 1-5 Year Index | Lipper Short Duration Municipal Debt Funds Average | Bloomberg Aggregate Bond Index |
|---|
| 9/30/2014 | $10,000 | $10,000 | $10,000 | $10,000 |
| 10/31/2014 | $10,022 | $10,012 | $10,008 | $10,098 |
| 11/30/2014 | $10,025 | $10,019 | $10,010 | $10,170 |
| 12/31/2014 | $10,008 | $9,994 | $9,999 | $10,179 |
| 1/31/2015 | $10,074 | $10,062 | $10,038 | $10,393 |
| 2/28/2015 | $10,046 | $10,039 | $10,022 | $10,295 |
| 3/31/2015 | $10,042 | $10,034 | $10,017 | $10,343 |
| 4/30/2015 | $10,032 | $10,031 | $10,011 | $10,306 |
| 5/31/2015 | $10,015 | $10,013 | $9,994 | $10,281 |
| 6/30/2015 | $10,025 | $10,033 | $9,995 | $10,169 |
| 7/31/2015 | $10,047 | $10,064 | $10,010 | $10,240 |
| 8/31/2015 | $10,050 | $10,075 | $10,013 | $10,225 |
| 9/30/2015 | $10,073 | $10,107 | $10,029 | $10,294 |
| 10/31/2015 | $10,095 | $10,134 | $10,047 | $10,296 |
| 11/30/2015 | $10,080 | $10,116 | $10,037 | $10,269 |
| 12/31/2015 | $10,089 | $10,115 | $10,039 | $10,235 |
| 1/31/2016 | $10,137 | $10,178 | $10,075 | $10,376 |
| 2/29/2016 | $10,167 | $10,211 | $10,089 | $10,450 |
| 3/31/2016 | $10,144 | $10,186 | $10,075 | $10,546 |
| 4/30/2016 | $10,168 | $10,211 | $10,093 | $10,586 |
| 5/31/2016 | $10,165 | $10,204 | $10,088 | $10,589 |
| 6/30/2016 | $10,207 | $10,253 | $10,120 | $10,779 |
| 7/31/2016 | $10,230 | $10,281 | $10,135 | $10,847 |
| 8/31/2016 | $10,233 | $10,269 | $10,133 | $10,835 |
| 9/30/2016 | $10,211 | $10,232 | $10,115 | $10,829 |
| 10/31/2016 | $10,188 | $10,221 | $10,107 | $10,746 |
| 11/30/2016 | $10,016 | $10,093 | $10,019 | $10,492 |
| 12/31/2016 | $10,032 | $10,122 | $10,029 | $10,506 |
| 1/31/2017 | $10,088 | $10,190 | $10,064 | $10,527 |
| 2/28/2017 | $10,131 | $10,246 | $10,096 | $10,598 |
| 3/31/2017 | $10,127 | $10,244 | $10,098 | $10,592 |
| 4/30/2017 | $10,170 | $10,276 | $10,121 | $10,674 |
| 5/31/2017 | $10,219 | $10,327 | $10,154 | $10,756 |
| 6/30/2017 | $10,204 | $10,301 | $10,144 | $10,745 |
| 7/31/2017 | $10,240 | $10,345 | $10,173 | $10,792 |
| 8/31/2017 | $10,276 | $10,386 | $10,202 | $10,888 |
| 9/30/2017 | $10,247 | $10,352 | $10,188 | $10,836 |
| 10/31/2017 | $10,250 | $10,350 | $10,187 | $10,843 |
| 11/30/2017 | $10,189 | $10,264 | $10,146 | $10,829 |
| 12/31/2017 | $10,206 | $10,285 | $10,158 | $10,879 |
| 1/31/2018 | $10,198 | $10,299 | $10,164 | $10,753 |
| 2/28/2018 | $10,197 | $10,302 | $10,165 | $10,651 |
| 3/31/2018 | $10,196 | $10,295 | $10,163 | $10,720 |
| 4/30/2018 | $10,183 | $10,270 | $10,154 | $10,640 |
| 5/31/2018 | $10,229 | $10,326 | $10,190 | $10,716 |
| 6/30/2018 | $10,250 | $10,364 | $10,212 | $10,703 |
| 7/31/2018 | $10,277 | $10,395 | $10,232 | $10,705 |
| 8/31/2018 | $10,285 | $10,391 | $10,238 | $10,774 |
| 9/30/2018 | $10,261 | $10,353 | $10,219 | $10,705 |
| 10/31/2018 | $10,243 | $10,348 | $10,214 | $10,620 |
| 11/30/2018 | $10,286 | $10,400 | $10,247 | $10,683 |
| 12/31/2018 | $10,328 | $10,467 | $10,284 | $10,880 |
| 1/31/2019 | $10,384 | $10,525 | $10,323 | $10,995 |
| 2/28/2019 | $10,423 | $10,559 | $10,346 | $10,989 |
| 3/31/2019 | $10,487 | $10,606 | $10,385 | $11,200 |
| 4/30/2019 | $10,504 | $10,608 | $10,395 | $11,203 |
| 5/31/2019 | $10,582 | $10,677 | $10,441 | $11,402 |
| 6/30/2019 | $10,619 | $10,724 | $10,471 | $11,545 |
| 7/31/2019 | $10,677 | $10,783 | $10,510 | $11,570 |
| 8/31/2019 | $10,741 | $10,813 | $10,539 | $11,870 |
| 9/30/2019 | $10,697 | $10,759 | $10,516 | $11,807 |
| 10/31/2019 | $10,720 | $10,804 | $10,537 | $11,842 |
| 11/30/2019 | $10,736 | $10,827 | $10,554 | $11,836 |
| 12/31/2019 | $10,758 | $10,850 | $10,565 | $11,828 |
| 1/31/2020 | $10,855 | $10,923 | $10,615 | $12,056 |
| 2/29/2020 | $10,919 | $10,961 | $10,646 | $12,273 |
| 3/31/2020 | $10,588 | $10,805 | $10,510 | $12,201 |
| 4/30/2020 | $10,528 | $10,819 | $10,491 | $12,417 |
| 5/31/2020 | $10,686 | $11,019 | $10,603 | $12,475 |
| 6/30/2020 | $10,781 | $11,042 | $10,647 | $12,554 |
| 7/31/2020 | $10,876 | $11,108 | $10,695 | $12,741 |
| 8/31/2020 | $10,888 | $11,106 | $10,700 | $12,638 |
| 9/30/2020 | $10,886 | $11,119 | $10,706 | $12,632 |
| 10/31/2020 | $10,877 | $11,102 | $10,700 | $12,575 |
| 11/30/2020 | $10,943 | $11,135 | $10,733 | $12,699 |
| 12/31/2020 | $10,988 | $11,156 | $10,754 | $12,716 |
| 1/31/2021 | $11,046 | $11,182 | $10,778 | $12,625 |
| 2/28/2021 | $10,967 | $11,138 | $10,744 | $12,443 |
| 3/31/2021 | $10,990 | $11,165 | $10,755 | $12,287 |
| 4/30/2021 | $11,027 | $11,190 | $10,776 | $12,384 |
| 5/31/2021 | $11,043 | $11,193 | $10,785 | $12,425 |
| 6/30/2021 | $11,052 | $11,194 | $10,787 | $12,512 |
| 7/31/2021 | $11,088 | $11,231 | $10,807 | $12,652 |
| 8/31/2021 | $11,075 | $11,227 | $10,800 | $12,628 |
| 9/30/2021 | $11,034 | $11,202 | $10,775 | $12,518 |
| 10/31/2021 | $11,014 | $11,187 | $10,765 | $12,515 |
| 11/30/2021 | $11,036 | $11,193 | $10,775 | $12,552 |
| 12/31/2021 | $11,037 | $11,197 | $10,773 | $12,520 |
| 1/31/2022 | $10,864 | $11,025 | $10,670 | $12,250 |
| 2/28/2022 | $10,824 | $10,996 | $10,644 | $12,114 |
| 3/31/2022 | $10,664 | $10,824 | $10,540 | $11,777 |
| 4/30/2022 | $10,541 | $10,720 | $10,466 | $11,330 |
| 5/31/2022 | $10,607 | $10,844 | $10,525 | $11,403 |
| 6/30/2022 | $10,562 | $10,833 | $10,504 | $11,224 |
| 7/31/2022 | $10,664 | $10,951 | $10,582 | $11,498 |
| 8/31/2022 | $10,565 | $10,814 | $10,506 | $11,174 |
| 9/30/2022 | $10,411 | $10,629 | $10,402 | $10,691 |
| 10/31/2022 | $10,391 | $10,628 | $10,397 | $10,552 |
| 11/30/2022 | $10,548 | $10,825 | $10,525 | $10,940 |
| 12/31/2022 | $10,579 | $10,842 | $10,544 | $10,891 |
| 1/31/2023 | $10,695 | $10,986 | $10,643 | $11,226 |
| 2/28/2023 | $10,579 | $10,830 | $10,567 | $10,936 |
| 3/31/2023 | $10,696 | $10,990 | $10,661 | $11,214 |
| 4/30/2023 | $10,673 | $10,943 | $10,652 | $11,282 |
| 5/31/2023 | $10,651 | $10,885 | $10,634 | $11,159 |
| 6/30/2023 | $10,702 | $10,950 | $10,682 | $11,119 |
| 7/31/2023 | $10,725 | $10,976 | $10,707 | $11,111 |
| 8/31/2023 | $10,713 | $10,951 | $10,708 | $11,040 |
| 9/30/2023 | $10,659 | $10,847 | $10,655 | $10,760 |
| 10/31/2023 | $10,664 | $10,860 | $10,665 | $10,590 |
| 11/30/2023 | $10,828 | $11,124 | $10,838 | $11,069 |
| 12/31/2023 | $10,927 | $11,230 | $10,925 | $11,493 |
| 1/31/2024 | $10,931 | $11,209 | $10,935 | $11,462 |
| 2/29/2024 | $10,958 | $11,222 | $10,956 | $11,300 |
| 3/31/2024 | $10,970 | $11,208 | $10,968 | $11,404 |
| 4/30/2024 | $10,954 | $11,169 | $10,958 | $11,116 |
| 5/31/2024 | $10,974 | $11,160 | $10,972 | $11,304 |
| 6/30/2024 | $11,053 | $11,247 | $11,043 | $11,412 |
| 7/31/2024 | $11,131 | $11,342 | $11,113 | $11,678 |
| 8/31/2024 | $11,203 | $11,450 | $11,187 | $11,846 |
| 9/30/2024 | $11,275 | $11,508 | $11,235 | $12,004 |
The Fund’s benchmarks are unmanaged indices used as a general measure of market performance. Calculations assume the reinvestment of dividends and capital gains.
Average Annual Total Returns (%)
| 1 Year | 5 Years | 10 Years |
|---|
| Class F at NAV | 5.77% | 1.06% | 1.21% |
| Bloomberg Municipal Bond Short 1-5 Year Index | 6.09% | 1.35% | 1.41% |
| Lipper Short Duration Municipal Debt Funds Average | 5.44% | 1.33% | 1.17% |
Bloomberg Aggregate Bond IndexFootnote Reference* | 11.57% | 0.33% | 1.84% |
| Footnote | Description |
Footnote* | The Fund has adopted the Bloomberg Aggregate Bond Index as its broad-based securities market index. |
The Fund's past performance is no guarantee of future results. The returns do not reflect the deduction of taxes that a shareholder would pay on Fund distributions or redemption of Fund shares.
(as of September 30, 2024)
| Total Net Assets | $1,561,231,464 |
| # of Portfolio Holdings | 277 |
| Portfolio Turnover Rate | 66% |
| Total Advisory Fees Paid | $5,141,439 |
What did the Fund invest in?
(as of September 30, 2024)
Credit Rating S&P or Moody'sFootnote Reference(a) | %Footnote Reference** |
|---|
| |
- A23.84%
- A-9.35%
- A+13.90%
- AA10.21%
- AA-5.98%
- AA+5.72%
- AAA4.03%
- B0.05%
- BB0.48%
- BB-0.49%
- BB+0.89%
- BBB4.31%
- BBB-7.01%
- BBB+7.46%
- NR6.28%
- Total 100.00%
| Footnote | Description |
Footnote** | Represents percent of total investments, which excludes derivatives. |
Footnote(a) | Investments in investment grade municipal bonds, which as bonds that are rated, at the time of purchase, within the four highest grades assigned by an independent rating agency such as Moody’s, S&P, or Fitch, or an equivalent short-term rating, as applicable, or are unrated by rating agencies but deemed by Lord Abbett to be of comparable quality. Lower rated municipal bonds are rated, at the time of purchase, or an equivalent short-term rating, as applicable, by an independent rating agency or are unrated by rating agencies but deemed by Lord Abbett to be of comparable quality. |
There were no material fund changes during the period.
Where can I find additional information about the Fund?
For additional information about the Fund, including its Prospectus, Statement of Additional Information, financial statements, holdings and proxy information, please visit lordabbett.com/FundDocuments.
The Fund has adopted a policy that allows it to send only one copy of the Fund's prospectus, proxy material, annual report and semiannual report (or related notice of internet availability of annual report and semiannual report) to certain shareholders residing at the same "household." This reduces Fund expenses, which benefits you and other shareholders.If you need additional copies or do not want your mailings to be "householded," please call Lord Abbett at 888-522-2388.
Lord Abbett Short Duration Tax Free Income Fund
Annual Shareholder Report
September 30, 2024
lordabbett.com/FundDocuments
TSR-A-2078-F
11/24
Lord Abbett Short Duration Tax Free Income Fund
Annual Shareholder Report
September 30, 2024
lordabbett.com/FundDocuments
This annual shareholder report contains important information about the Lord Abbett Short Duration Tax Free Income Fund for the period of October 1, 2023 to September 30, 2024, as well as certain changes to the Fund. You can find additional information about the Fund at lordabbett.com/FundDocuments. You can also request this information by contacting us at 888-522-2388.
What were the Fund costs for the last year?
(based on a hypothetical $10,000 investment)
| Class Name | Costs of a $10,000 investment | Costs paid as a percentage of a $10,000 investment |
|---|
| Class F3 | $42 | 0.41% |
How did the Fund perform last year and what affected its performance?
For the fiscal year ended September 30, 2024, the Fund returned 5.92%, reflecting performance at the net asset value (NAV) of Class F3 shares, compared to the 6.09% of a securities market index with investment characteristics similar to those of the Fund, the Bloomberg Municipal Bond Short 1-5 Year Index. The Fund's broad-based market index, the Bloomberg Aggregate Bond Index, returned 11.57% over the same period.
Positive factors for the municipal market included decreasing Treasury yields, easing inflationary pressures and the start of interest rate cuts by the U.S. Federal Reserve. Also supporting the market was increased demand for municipal bond funds and a strong fundamental backdrop as evidenced by growing tax revenue and positive ratings actions by public ratings agencies. Negative factors included a significant increase in municipal bond supply, which pressured the market in second half of the fiscal year, and periods of interest rate volatility driven by sticky inflation readings at points throughout the fiscal year. Against this backdrop, municipal bonds delivered strong returns.
Top contributors to the Fund’s performance: An overweight allocation to A- and BBB-rated bonds contributed to relative performance.
Top detractors from the Fund’s performance: The Fund’s shorter duration positioning relative to the prospectus benchmark detracted from relative performance with the fall in rates over the period. An overweight allocation to the Power sector and Variable Rate Demand Notes detracted from relative performance. Security selection within the Housing and Health Care sectors detracted from relative performance.
Total Return Based on $10,000 Investment
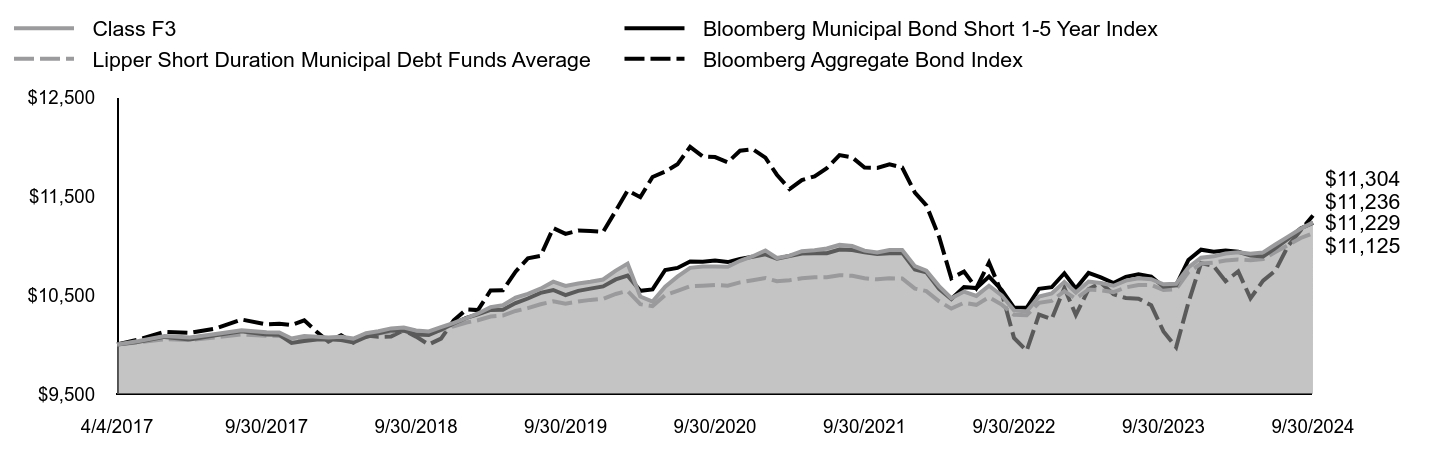
| Class F3 | Bloomberg Municipal Bond Short 1-5 Year Index | Lipper Short Duration Municipal Debt Funds Average | Bloomberg Aggregate Bond Index |
|---|
| 4/4/2017 | $10,000 | $10,000 | $10,000 | $10,000 |
| 4/30/2017 | $10,036 | $10,028 | $10,022 | $10,051 |
| 5/31/2017 | $10,085 | $10,077 | $10,054 | $10,128 |
| 6/30/2017 | $10,071 | $10,052 | $10,045 | $10,118 |
| 7/31/2017 | $10,107 | $10,094 | $10,073 | $10,162 |
| 8/31/2017 | $10,144 | $10,134 | $10,102 | $10,253 |
| 9/30/2017 | $10,123 | $10,101 | $10,088 | $10,204 |
| 10/31/2017 | $10,121 | $10,099 | $10,087 | $10,210 |
| 11/30/2017 | $10,061 | $10,016 | $10,047 | $10,197 |
| 12/31/2017 | $10,086 | $10,036 | $10,058 | $10,244 |
| 1/31/2018 | $10,078 | $10,050 | $10,064 | $10,126 |
| 2/28/2018 | $10,072 | $10,053 | $10,065 | $10,030 |
| 3/31/2018 | $10,078 | $10,046 | $10,063 | $10,094 |
| 4/30/2018 | $10,060 | $10,021 | $10,054 | $10,019 |
| 5/31/2018 | $10,114 | $10,076 | $10,090 | $10,091 |
| 6/30/2018 | $10,135 | $10,113 | $10,112 | $10,078 |
| 7/31/2018 | $10,163 | $10,143 | $10,132 | $10,080 |
| 8/31/2018 | $10,172 | $10,140 | $10,138 | $10,145 |
| 9/30/2018 | $10,142 | $10,102 | $10,119 | $10,080 |
| 10/31/2018 | $10,132 | $10,097 | $10,114 | $10,000 |
| 11/30/2018 | $10,175 | $10,149 | $10,147 | $10,060 |
| 12/31/2018 | $10,218 | $10,213 | $10,183 | $10,245 |
| 1/31/2019 | $10,268 | $10,270 | $10,222 | $10,354 |
| 2/28/2019 | $10,314 | $10,304 | $10,245 | $10,348 |
| 3/31/2019 | $10,378 | $10,349 | $10,283 | $10,546 |
| 4/30/2019 | $10,397 | $10,351 | $10,293 | $10,549 |
| 5/31/2019 | $10,475 | $10,419 | $10,339 | $10,736 |
| 6/30/2019 | $10,512 | $10,465 | $10,368 | $10,871 |
| 7/31/2019 | $10,564 | $10,522 | $10,407 | $10,895 |
| 8/31/2019 | $10,635 | $10,551 | $10,436 | $11,177 |
| 9/30/2019 | $10,592 | $10,499 | $10,413 | $11,118 |
| 10/31/2019 | $10,616 | $10,542 | $10,434 | $11,151 |
| 11/30/2019 | $10,634 | $10,565 | $10,451 | $11,146 |
| 12/31/2019 | $10,657 | $10,587 | $10,461 | $11,138 |
| 1/31/2020 | $10,747 | $10,658 | $10,511 | $11,352 |
| 2/29/2020 | $10,818 | $10,696 | $10,542 | $11,557 |
| 3/31/2020 | $10,485 | $10,543 | $10,407 | $11,489 |
| 4/30/2020 | $10,434 | $10,557 | $10,388 | $11,693 |
| 5/31/2020 | $10,584 | $10,753 | $10,499 | $11,747 |
| 6/30/2020 | $10,686 | $10,774 | $10,543 | $11,821 |
| 7/31/2020 | $10,775 | $10,839 | $10,590 | $11,998 |
| 8/31/2020 | $10,788 | $10,837 | $10,595 | $11,901 |
| 9/30/2020 | $10,788 | $10,850 | $10,601 | $11,894 |
| 10/31/2020 | $10,786 | $10,833 | $10,595 | $11,841 |
| 11/30/2020 | $10,846 | $10,865 | $10,628 | $11,958 |
| 12/31/2020 | $10,892 | $10,886 | $10,649 | $11,974 |
| 1/31/2021 | $10,951 | $10,911 | $10,672 | $11,888 |
| 2/28/2021 | $10,874 | $10,868 | $10,639 | $11,716 |
| 3/31/2021 | $10,898 | $10,895 | $10,650 | $11,570 |
| 4/30/2021 | $10,943 | $10,919 | $10,670 | $11,662 |
| 5/31/2021 | $10,953 | $10,922 | $10,679 | $11,700 |
| 6/30/2021 | $10,970 | $10,923 | $10,681 | $11,782 |
| 7/31/2021 | $11,007 | $10,959 | $10,701 | $11,914 |
| 8/31/2021 | $10,995 | $10,955 | $10,694 | $11,891 |
| 9/30/2021 | $10,949 | $10,931 | $10,669 | $11,788 |
| 10/31/2021 | $10,931 | $10,916 | $10,659 | $11,785 |
| 11/30/2021 | $10,954 | $10,922 | $10,669 | $11,820 |
| 12/31/2021 | $10,956 | $10,926 | $10,667 | $11,789 |
| 1/31/2022 | $10,792 | $10,758 | $10,565 | $11,535 |
| 2/28/2022 | $10,746 | $10,729 | $10,540 | $11,407 |
| 3/31/2022 | $10,590 | $10,562 | $10,437 | $11,090 |
| 4/30/2022 | $10,468 | $10,460 | $10,363 | $10,669 |
| 5/31/2022 | $10,535 | $10,581 | $10,422 | $10,738 |
| 6/30/2022 | $10,491 | $10,570 | $10,401 | $10,569 |
| 7/31/2022 | $10,594 | $10,686 | $10,478 | $10,828 |
| 8/31/2022 | $10,497 | $10,552 | $10,403 | $10,522 |
| 9/30/2022 | $10,345 | $10,372 | $10,300 | $10,067 |
| 10/31/2022 | $10,334 | $10,371 | $10,295 | $9,937 |
| 11/30/2022 | $10,484 | $10,563 | $10,422 | $10,302 |
| 12/31/2022 | $10,517 | $10,579 | $10,441 | $10,256 |
| 1/31/2023 | $10,633 | $10,720 | $10,539 | $10,571 |
| 2/28/2023 | $10,526 | $10,567 | $10,463 | $10,298 |
| 3/31/2023 | $10,637 | $10,724 | $10,556 | $10,559 |
| 4/30/2023 | $10,622 | $10,678 | $10,548 | $10,623 |
| 5/31/2023 | $10,594 | $10,621 | $10,530 | $10,508 |
| 6/30/2023 | $10,646 | $10,684 | $10,577 | $10,470 |
| 7/31/2023 | $10,670 | $10,710 | $10,602 | $10,463 |
| 8/31/2023 | $10,660 | $10,686 | $10,603 | $10,396 |
| 9/30/2023 | $10,608 | $10,584 | $10,551 | $10,132 |
| 10/31/2023 | $10,614 | $10,597 | $10,560 | $9,972 |
| 11/30/2023 | $10,778 | $10,855 | $10,732 | $10,424 |
| 12/31/2023 | $10,878 | $10,958 | $10,818 | $10,823 |
| 1/31/2024 | $10,891 | $10,938 | $10,828 | $10,793 |
| 2/29/2024 | $10,919 | $10,950 | $10,849 | $10,640 |
| 3/31/2024 | $10,932 | $10,937 | $10,860 | $10,739 |
| 4/30/2024 | $10,917 | $10,899 | $10,851 | $10,467 |
| 5/31/2024 | $10,931 | $10,890 | $10,864 | $10,645 |
| 6/30/2024 | $11,011 | $10,975 | $10,935 | $10,746 |
| 7/31/2024 | $11,090 | $11,067 | $11,004 | $10,997 |
| 8/31/2024 | $11,170 | $11,173 | $11,077 | $11,155 |
| 9/30/2024 | $11,236 | $11,229 | $11,125 | $11,304 |
The Fund’s benchmarks are unmanaged indices used as a general measure of market performance. Calculations assume the reinvestment of dividends and capital gains.
Average Annual Total Returns (%)
| 1 Year | 5 Years | Since Inception 4/4/17 |
|---|
| Class F3 at NAV | 5.92% | 1.19% | 1.57% |
| Bloomberg Municipal Bond Short 1-5 Year Index | 6.09% | 1.35% | 1.56% |
| Lipper Short Duration Municipal Debt Funds Average | 5.44% | 1.33% | 1.43% |
Bloomberg Aggregate Bond IndexFootnote Reference* | 11.57% | 0.33% | 1.65% |
| Footnote | Description |
Footnote* | The Fund has adopted the Bloomberg Aggregate Bond Index as its broad-based securities market index. |
The Fund's past performance is no guarantee of future results. The returns do not reflect the deduction of taxes that a shareholder would pay on Fund distributions or redemption of Fund shares.
(as of September 30, 2024)
| Total Net Assets | $1,561,231,464 |
| # of Portfolio Holdings | 277 |
| Portfolio Turnover Rate | 66% |
| Total Advisory Fees Paid | $5,141,439 |
What did the Fund invest in?
(as of September 30, 2024)
Credit Rating S&P or Moody'sFootnote Reference(a) | %Footnote Reference** |
|---|
| |
- A23.84%
- A-9.35%
- A+13.90%
- AA10.21%
- AA-5.98%
- AA+5.72%
- AAA4.03%
- B0.05%
- BB0.48%
- BB-0.49%
- BB+0.89%
- BBB4.31%
- BBB-7.01%
- BBB+7.46%
- NR6.28%
- Total 100.00%
| Footnote | Description |
Footnote** | Represents percent of total investments, which excludes derivatives. |
Footnote(a) | Investments in investment grade municipal bonds, which as bonds that are rated, at the time of purchase, within the four highest grades assigned by an independent rating agency such as Moody’s, S&P, or Fitch, or an equivalent short-term rating, as applicable, or are unrated by rating agencies but deemed by Lord Abbett to be of comparable quality. Lower rated municipal bonds are rated, at the time of purchase, or an equivalent short-term rating, as applicable, by an independent rating agency or are unrated by rating agencies but deemed by Lord Abbett to be of comparable quality. |
There were no material fund changes during the period.
Where can I find additional information about the Fund?
For additional information about the Fund, including its Prospectus, Statement of Additional Information, financial statements, holdings and proxy information, please visit lordabbett.com/FundDocuments.
The Fund has adopted a policy that allows it to send only one copy of the Fund's prospectus, proxy material, annual report and semiannual report (or related notice of internet availability of annual report and semiannual report) to certain shareholders residing at the same "household." This reduces Fund expenses, which benefits you and other shareholders.If you need additional copies or do not want your mailings to be "householded," please call Lord Abbett at 888-522-2388.
Lord Abbett Short Duration Tax Free Income Fund
Annual Shareholder Report
September 30, 2024
lordabbett.com/FundDocuments
TSR-A-8992-F3
11/24
Lord Abbett Short Duration Tax Free Income Fund
Annual Shareholder Report
September 30, 2024
lordabbett.com/FundDocuments
This annual shareholder report contains important information about the Lord Abbett Short Duration Tax Free Income Fund for the period of October 1, 2023 to September 30, 2024, as well as certain changes to the Fund. You can find additional information about the Fund at lordabbett.com/FundDocuments. You can also request this information by contacting us at 888-522-2388.
What were the Fund costs for the last year?
(based on a hypothetical $10,000 investment)
| Class Name | Costs of a $10,000 investment | Costs paid as a percentage of a $10,000 investment |
|---|
| Class I | $46 | 0.45% |
How did the Fund perform last year and what affected its performance?
For the fiscal year ended September 30, 2024, the Fund returned 5.88%, reflecting performance at the net asset value (NAV) of Class I shares, compared to the 6.09% of a securities market index with investment characteristics similar to those of the Fund, the Bloomberg Municipal Bond Short 1-5 Year Index. The Fund's broad-based market index, the Bloomberg Aggregate Bond Index, returned 11.57% over the same period.
Positive factors for the municipal market included decreasing Treasury yields, easing inflationary pressures and the start of interest rate cuts by the U.S. Federal Reserve. Also supporting the market was increased demand for municipal bond funds and a strong fundamental backdrop as evidenced by growing tax revenue and positive ratings actions by public ratings agencies. Negative factors included a significant increase in municipal bond supply, which pressured the market in second half of the fiscal year, and periods of interest rate volatility driven by sticky inflation readings at points throughout the fiscal year. Against this backdrop, municipal bonds delivered strong returns.
Top contributors to the Fund’s performance: An overweight allocation to A- and BBB-rated bonds contributed to relative performance.
Top detractors from the Fund’s performance: The Fund’s shorter duration positioning relative to the prospectus benchmark detracted from relative performance with the fall in rates over the period. An overweight allocation to the Power sector and Variable Rate Demand Notes detracted from relative performance. Security selection within the Housing and Health Care sectors detracted from relative performance.
Total Return Based on $10,000 Investment

| Class I | Bloomberg Municipal Bond Short 1-5 Year Index | Lipper Short Duration Municipal Debt Funds Average | Bloomberg Aggregate Bond Index |
|---|
| 9/30/2014 | $10,000 | $10,000 | $10,000 | $10,000 |
| 10/31/2014 | $10,022 | $10,012 | $10,008 | $10,098 |
| 11/30/2014 | $10,027 | $10,019 | $10,010 | $10,170 |
| 12/31/2014 | $10,011 | $9,994 | $9,999 | $10,179 |
| 1/31/2015 | $10,077 | $10,062 | $10,038 | $10,393 |
| 2/28/2015 | $10,050 | $10,039 | $10,022 | $10,295 |
| 3/31/2015 | $10,047 | $10,034 | $10,017 | $10,343 |
| 4/30/2015 | $10,038 | $10,031 | $10,011 | $10,306 |
| 5/31/2015 | $10,022 | $10,013 | $9,994 | $10,281 |
| 6/30/2015 | $10,032 | $10,033 | $9,995 | $10,169 |
| 7/31/2015 | $10,055 | $10,064 | $10,010 | $10,240 |
| 8/31/2015 | $10,059 | $10,075 | $10,013 | $10,225 |
| 9/30/2015 | $10,083 | $10,107 | $10,029 | $10,294 |
| 10/31/2015 | $10,106 | $10,134 | $10,047 | $10,296 |
| 11/30/2015 | $10,098 | $10,116 | $10,037 | $10,269 |
| 12/31/2015 | $10,102 | $10,115 | $10,039 | $10,235 |
| 1/31/2016 | $10,157 | $10,178 | $10,075 | $10,376 |
| 2/29/2016 | $10,181 | $10,211 | $10,089 | $10,450 |
| 3/31/2016 | $10,159 | $10,186 | $10,075 | $10,546 |
| 4/30/2016 | $10,190 | $10,211 | $10,093 | $10,586 |
| 5/31/2016 | $10,182 | $10,204 | $10,088 | $10,589 |
| 6/30/2016 | $10,225 | $10,253 | $10,120 | $10,779 |
| 7/31/2016 | $10,255 | $10,281 | $10,135 | $10,847 |
| 8/31/2016 | $10,252 | $10,269 | $10,133 | $10,835 |
| 9/30/2016 | $10,231 | $10,232 | $10,115 | $10,829 |
| 10/31/2016 | $10,209 | $10,221 | $10,107 | $10,746 |
| 11/30/2016 | $10,038 | $10,093 | $10,019 | $10,492 |
| 12/31/2016 | $10,055 | $10,122 | $10,029 | $10,506 |
| 1/31/2017 | $10,118 | $10,190 | $10,064 | $10,527 |
| 2/28/2017 | $10,155 | $10,246 | $10,096 | $10,598 |
| 3/31/2017 | $10,159 | $10,244 | $10,098 | $10,592 |
| 4/30/2017 | $10,196 | $10,276 | $10,121 | $10,674 |
| 5/31/2017 | $10,247 | $10,327 | $10,154 | $10,756 |
| 6/30/2017 | $10,232 | $10,301 | $10,144 | $10,745 |
| 7/31/2017 | $10,269 | $10,345 | $10,173 | $10,792 |
| 8/31/2017 | $10,306 | $10,386 | $10,202 | $10,888 |
| 9/30/2017 | $10,284 | $10,352 | $10,188 | $10,836 |
| 10/31/2017 | $10,282 | $10,350 | $10,187 | $10,843 |
| 11/30/2017 | $10,221 | $10,264 | $10,146 | $10,829 |
| 12/31/2017 | $10,246 | $10,285 | $10,158 | $10,879 |
| 1/31/2018 | $10,232 | $10,299 | $10,164 | $10,753 |
| 2/28/2018 | $10,231 | $10,302 | $10,165 | $10,651 |
| 3/31/2018 | $10,231 | $10,295 | $10,163 | $10,720 |
| 4/30/2018 | $10,220 | $10,270 | $10,154 | $10,640 |
| 5/31/2018 | $10,274 | $10,326 | $10,190 | $10,716 |
| 6/30/2018 | $10,295 | $10,364 | $10,212 | $10,703 |
| 7/31/2018 | $10,316 | $10,395 | $10,232 | $10,705 |
| 8/31/2018 | $10,326 | $10,391 | $10,238 | $10,774 |
| 9/30/2018 | $10,302 | $10,353 | $10,219 | $10,705 |
| 10/31/2018 | $10,285 | $10,348 | $10,214 | $10,620 |
| 11/30/2018 | $10,329 | $10,400 | $10,247 | $10,683 |
| 12/31/2018 | $10,379 | $10,467 | $10,284 | $10,880 |
| 1/31/2019 | $10,429 | $10,525 | $10,323 | $10,995 |
| 2/28/2019 | $10,469 | $10,559 | $10,346 | $10,989 |
| 3/31/2019 | $10,534 | $10,606 | $10,385 | $11,200 |
| 4/30/2019 | $10,559 | $10,608 | $10,395 | $11,203 |
| 5/31/2019 | $10,631 | $10,677 | $10,441 | $11,402 |
| 6/30/2019 | $10,676 | $10,724 | $10,471 | $11,545 |
| 7/31/2019 | $10,728 | $10,783 | $10,510 | $11,570 |
| 8/31/2019 | $10,800 | $10,813 | $10,539 | $11,870 |
| 9/30/2019 | $10,750 | $10,759 | $10,516 | $11,807 |
| 10/31/2019 | $10,774 | $10,804 | $10,537 | $11,842 |
| 11/30/2019 | $10,798 | $10,827 | $10,554 | $11,836 |
| 12/31/2019 | $10,822 | $10,850 | $10,565 | $11,828 |
| 1/31/2020 | $10,913 | $10,923 | $10,615 | $12,056 |
| 2/29/2020 | $10,978 | $10,961 | $10,646 | $12,273 |
| 3/31/2020 | $10,646 | $10,805 | $10,510 | $12,201 |
| 4/30/2020 | $10,587 | $10,819 | $10,491 | $12,417 |
| 5/31/2020 | $10,746 | $11,019 | $10,603 | $12,475 |
| 6/30/2020 | $10,842 | $11,042 | $10,647 | $12,554 |
| 7/31/2020 | $10,940 | $11,108 | $10,695 | $12,741 |
| 8/31/2020 | $10,953 | $11,106 | $10,700 | $12,638 |
| 9/30/2020 | $10,952 | $11,119 | $10,706 | $12,632 |
| 10/31/2020 | $10,950 | $11,102 | $10,700 | $12,575 |
| 11/30/2020 | $11,010 | $11,135 | $10,733 | $12,699 |
| 12/31/2020 | $11,056 | $11,156 | $10,754 | $12,716 |
| 1/31/2021 | $11,116 | $11,182 | $10,778 | $12,625 |
| 2/28/2021 | $11,038 | $11,138 | $10,744 | $12,443 |
| 3/31/2021 | $11,062 | $11,165 | $10,755 | $12,287 |
| 4/30/2021 | $11,107 | $11,190 | $10,776 | $12,384 |
| 5/31/2021 | $11,117 | $11,193 | $10,785 | $12,425 |
| 6/30/2021 | $11,134 | $11,194 | $10,787 | $12,512 |
| 7/31/2021 | $11,171 | $11,231 | $10,807 | $12,652 |
| 8/31/2021 | $11,152 | $11,227 | $10,800 | $12,628 |
| 9/30/2021 | $11,112 | $11,202 | $10,775 | $12,518 |
| 10/31/2021 | $11,092 | $11,187 | $10,765 | $12,515 |
| 11/30/2021 | $11,116 | $11,193 | $10,775 | $12,552 |
| 12/31/2021 | $11,117 | $11,197 | $10,773 | $12,520 |
| 1/31/2022 | $10,951 | $11,025 | $10,670 | $12,250 |
| 2/28/2022 | $10,904 | $10,996 | $10,644 | $12,114 |
| 3/31/2022 | $10,745 | $10,824 | $10,540 | $11,777 |
| 4/30/2022 | $10,621 | $10,720 | $10,466 | $11,330 |
| 5/31/2022 | $10,688 | $10,844 | $10,525 | $11,403 |
| 6/30/2022 | $10,644 | $10,833 | $10,504 | $11,224 |
| 7/31/2022 | $10,748 | $10,951 | $10,582 | $11,498 |
| 8/31/2022 | $10,649 | $10,814 | $10,506 | $11,174 |
| 9/30/2022 | $10,495 | $10,629 | $10,402 | $10,691 |
| 10/31/2022 | $10,483 | $10,628 | $10,397 | $10,552 |
| 11/30/2022 | $10,635 | $10,825 | $10,525 | $10,940 |
| 12/31/2022 | $10,668 | $10,842 | $10,544 | $10,891 |
| 1/31/2023 | $10,785 | $10,986 | $10,643 | $11,226 |
| 2/28/2023 | $10,676 | $10,830 | $10,567 | $10,936 |
| 3/31/2023 | $10,788 | $10,990 | $10,661 | $11,214 |
| 4/30/2023 | $10,772 | $10,943 | $10,652 | $11,282 |
| 5/31/2023 | $10,744 | $10,885 | $10,634 | $11,159 |
| 6/30/2023 | $10,797 | $10,950 | $10,682 | $11,119 |
| 7/31/2023 | $10,821 | $10,976 | $10,707 | $11,111 |
| 8/31/2023 | $10,810 | $10,951 | $10,708 | $11,040 |
| 9/30/2023 | $10,757 | $10,847 | $10,655 | $10,760 |
| 10/31/2023 | $10,762 | $10,860 | $10,665 | $10,590 |
| 11/30/2023 | $10,928 | $11,124 | $10,838 | $11,069 |
| 12/31/2023 | $11,030 | $11,230 | $10,925 | $11,493 |
| 1/31/2024 | $11,035 | $11,209 | $10,935 | $11,462 |
| 2/29/2024 | $11,070 | $11,222 | $10,956 | $11,300 |
| 3/31/2024 | $11,083 | $11,208 | $10,968 | $11,404 |
| 4/30/2024 | $11,068 | $11,169 | $10,958 | $11,116 |
| 5/31/2024 | $11,081 | $11,160 | $10,972 | $11,304 |
| 6/30/2024 | $11,162 | $11,247 | $11,043 | $11,412 |
| 7/31/2024 | $11,241 | $11,342 | $11,113 | $11,678 |
| 8/31/2024 | $11,315 | $11,450 | $11,187 | $11,846 |
| 9/30/2024 | $11,389 | $11,508 | $11,235 | $12,004 |
The Fund’s benchmarks are unmanaged indices used as a general measure of market performance. Calculations assume the reinvestment of dividends and capital gains.
Average Annual Total Returns (%)
| 1 Year | 5 Years | 10 Years |
|---|
| Class I at NAV | 5.88% | 1.16% | 1.31% |
| Bloomberg Municipal Bond Short 1-5 Year Index | 6.09% | 1.35% | 1.41% |
| Lipper Short Duration Municipal Debt Funds Average | 5.44% | 1.33% | 1.17% |
Bloomberg Aggregate Bond IndexFootnote Reference* | 11.57% | 0.33% | 1.84% |
| Footnote | Description |
Footnote* | The Fund has adopted the Bloomberg Aggregate Bond Index as its broad-based securities market index. |
The Fund's past performance is no guarantee of future results. The returns do not reflect the deduction of taxes that a shareholder would pay on Fund distributions or redemption of Fund shares.
(as of September 30, 2024)
| Total Net Assets | $1,561,231,464 |
| # of Portfolio Holdings | 277 |
| Portfolio Turnover Rate | 66% |
| Total Advisory Fees Paid | $5,141,439 |
What did the Fund invest in?
(as of September 30, 2024)
Credit Rating S&P or Moody'sFootnote Reference(a) | %Footnote Reference** |
|---|
| |
- A23.84%
- A-9.35%
- A+13.90%
- AA10.21%
- AA-5.98%
- AA+5.72%
- AAA4.03%
- B0.05%
- BB0.48%
- BB-0.49%
- BB+0.89%
- BBB4.31%
- BBB-7.01%
- BBB+7.46%
- NR6.28%
- Total 100.00%
| Footnote | Description |
Footnote** | Represents percent of total investments, which excludes derivatives. |
Footnote(a) | Investments in investment grade municipal bonds, which as bonds that are rated, at the time of purchase, within the four highest grades assigned by an independent rating agency such as Moody’s, S&P, or Fitch, or an equivalent short-term rating, as applicable, or are unrated by rating agencies but deemed by Lord Abbett to be of comparable quality. Lower rated municipal bonds are rated, at the time of purchase, or an equivalent short-term rating, as applicable, by an independent rating agency or are unrated by rating agencies but deemed by Lord Abbett to be of comparable quality. |
There were no material fund changes during the period.
Where can I find additional information about the Fund?
For additional information about the Fund, including its Prospectus, Statement of Additional Information, financial statements, holdings and proxy information, please visit lordabbett.com/FundDocuments.
The Fund has adopted a policy that allows it to send only one copy of the Fund's prospectus, proxy material, annual report and semiannual report (or related notice of internet availability of annual report and semiannual report) to certain shareholders residing at the same "household." This reduces Fund expenses, which benefits you and other shareholders.If you need additional copies or do not want your mailings to be "householded," please call Lord Abbett at 888-522-2388.
Lord Abbett Short Duration Tax Free Income Fund
Annual Shareholder Report
September 30, 2024
lordabbett.com/FundDocuments
TSR-A-2077-I
11/24
Lord Abbett Sustainable Municipal Bond Fund
Annual Shareholder Report
September 30, 2024
lordabbett.com/FundDocuments
This annual shareholder report contains important information about the Lord Abbett Sustainable Municipal Bond Fund for the period of October 1, 2023 to September 30, 2024, as well as certain changes to the Fund. You can find additional information about the Fund at lordabbett.com/FundDocuments. You can also request this information by contacting us at 888-522-2388.
What were the Fund costs for the last year?
(based on a hypothetical $10,000 investment)
| Class Name | Costs of a $10,000 investment | Costs paid as a percentage of a $10,000 investment |
|---|
| Class A | $66 | 0.63% |
How did the Fund perform last year and what affected its performance?
For the fiscal year ended September 30, 2024, the Fund returned 9.30%, reflecting performance at the net asset value (NAV) of Class A shares, compared to the 8.47% of a securities market index with investment characteristics similar to those of the Fund, the Bloomberg 1-15 Year Municipal Bond Index. The Fund's broad-based market index, the Bloomberg Aggregate Bond Index, returned 11.57% over the same period.
Positive factors for the municipal market included decreasing Treasury yields, easing inflationary pressures and the start of interest rate cuts by the U.S. Federal Reserve. Also supporting the market was increased demand for municipal bond funds and a strong fundamental backdrop as evidenced by growing tax revenue and positive ratings actions by public ratings agencies. Negative factors included a significant increase in municipal bond supply, which pressured the market in second half of the fiscal year, and periods of interest rate volatility driven by sticky inflation readings at points throughout the fiscal year. Against this backdrop, municipal bonds delivered strong returns.
Top contributors to the Fund’s performance: An overweight allocation to BBB-rated and non-investment grade bonds contributed to relative performance. The Fund’s longer duration positioning relative to the prospectus benchmark led to a positive impact as yields fell over the period. An overweight allocation to the Education and Local General Obligation sectors contributed to relative performance.
Top detractors from the Fund’s performance: Security selection within the Housing sector detracted from relative performance.
Total Return Based on $10,000 Investment
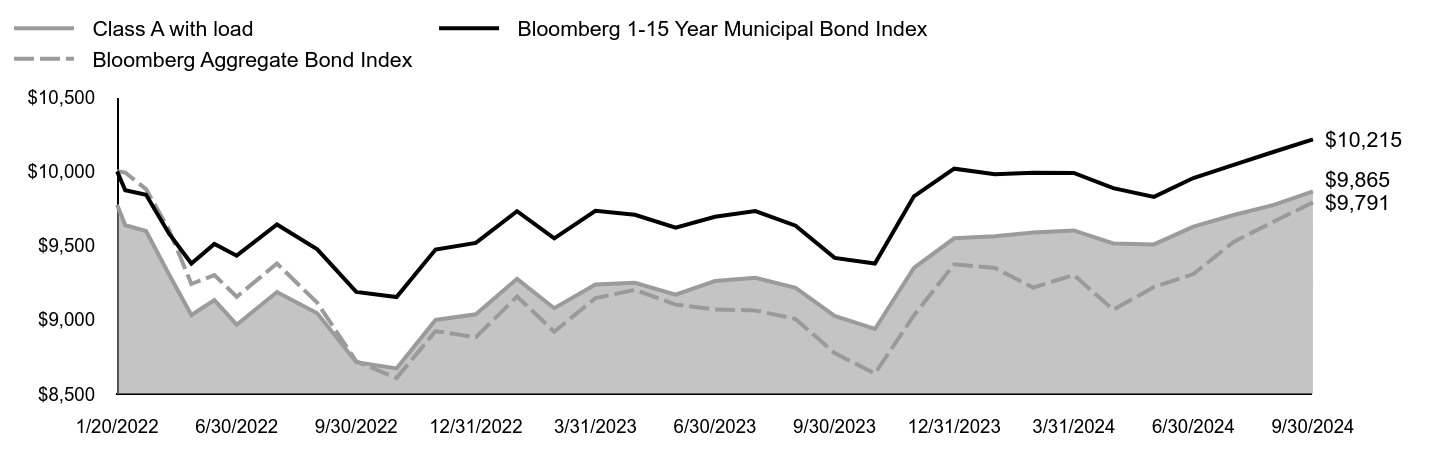
| Class A with load | Bloomberg 1-15 Year Municipal Bond Index | Bloomberg Aggregate Bond Index |
|---|
| 1/20/2022 | $9,775 | $10,000 | $10,000 |
| 1/31/2022 | $9,637 | $9,873 | $9,992 |
| 2/28/2022 | $9,598 | $9,842 | $9,880 |
| 3/31/2022 | $9,305 | $9,580 | $9,606 |
| 4/30/2022 | $9,032 | $9,379 | $9,241 |
| 5/31/2022 | $9,132 | $9,511 | $9,301 |
| 6/30/2022 | $8,967 | $9,432 | $9,155 |
| 7/31/2022 | $9,187 | $9,642 | $9,379 |
| 8/31/2022 | $9,044 | $9,475 | $9,114 |
| 9/30/2022 | $8,714 | $9,188 | $8,720 |
| 10/31/2022 | $8,672 | $9,153 | $8,607 |
| 11/30/2022 | $8,999 | $9,473 | $8,924 |
| 12/31/2022 | $9,037 | $9,518 | $8,883 |
| 1/31/2023 | $9,276 | $9,732 | $9,157 |
| 2/28/2023 | $9,078 | $9,549 | $8,920 |
| 3/31/2023 | $9,238 | $9,734 | $9,146 |
| 4/30/2023 | $9,249 | $9,707 | $9,202 |
| 5/31/2023 | $9,169 | $9,621 | $9,102 |
| 6/30/2023 | $9,261 | $9,694 | $9,069 |
| 7/31/2023 | $9,283 | $9,732 | $9,063 |
| 8/31/2023 | $9,215 | $9,634 | $9,005 |
| 9/30/2023 | $9,026 | $9,417 | $8,776 |
| 10/31/2023 | $8,938 | $9,379 | $8,638 |
| 11/30/2023 | $9,350 | $9,832 | $9,029 |
| 12/31/2023 | $9,549 | $10,018 | $9,374 |
| 1/31/2024 | $9,563 | $9,980 | $9,349 |
| 2/29/2024 | $9,588 | $9,990 | $9,217 |
| 3/31/2024 | $9,602 | $9,989 | $9,302 |
| 4/30/2024 | $9,514 | $9,887 | $9,067 |
| 5/31/2024 | $9,508 | $9,828 | $9,220 |
| 6/30/2024 | $9,628 | $9,955 | $9,308 |
| 7/31/2024 | $9,706 | $10,043 | $9,525 |
| 8/31/2024 | $9,774 | $10,132 | $9,662 |
| 9/30/2024 | $9,865 | $10,215 | $9,791 |
The Fund’s benchmarks are unmanaged indices used as a general measure of market performance. Calculations assume the reinvestment of dividends and capital gains.
Average Annual Total Returns (%)
| 1 Year | Since Inception 1/20/22 |
|---|
| Class A at NAV | 9.30% | 0.34% |
| Class A with sales charge | 6.89% | (0.50%) |
| Bloomberg 1-15 Year Municipal Bond Index | 8.47% | 0.79% |
Bloomberg Aggregate Bond IndexFootnote Reference* | 11.57% | (0.78%) |
| Footnote | Description |
Footnote* | The Fund has adopted the Bloomberg Aggregate Bond Index as its broad-based securities market index. |
The Fund's past performance is no guarantee of future results. The returns do not reflect the deduction of taxes that a shareholder would pay on Fund distributions or redemption of Fund shares.
(as of September 30, 2024)
| Total Net Assets | $5,689,525 |
| # of Portfolio Holdings | 40 |
| Portfolio Turnover Rate | 48% |
| Total Advisory Fees Paid | $0 |
What did the Fund invest in?
(as of September 30, 2024)
Credit Rating S&P or Moody'sFootnote Reference(a) | %Footnote Reference** |
|---|
| |
- A21.51%
- A+13.18%
- AA7.32%
- AA-2.86%
- AA+2.53%
- AAA6.98%
- BB7.63%
- BB+2.14%
- BBB4.81%
- BBB-21.95%
- BBB+3.34%
- NR5.75%
- Total 100.00%
| Footnote | Description |
Footnote** | Represents percent of total investments, which excludes derivatives. |
Footnote(a) | Investments in investment grade municipal bonds, which as bonds that are rated, at the time of purchase, within the four highest grades assigned by an independent rating agency such as Moody’s, S&P, or Fitch, or an equivalent short-term rating, as applicable, or are unrated by rating agencies but deemed by Lord Abbett to be of comparable quality. Lower rated municipal bonds are rated, at the time of purchase, or an equivalent short-term rating, as applicable, by an independent rating agency or are unrated by rating agencies but deemed by Lord Abbett to be of comparable quality. |
There were no material fund changes during the period.
Where can I find additional information about the Fund?
For additional information about the Fund, including its Prospectus, Statement of Additional Information, financial statements, holdings and proxy information, please visit lordabbett.com/FundDocuments.
The Fund has adopted a policy that allows it to send only one copy of the Fund's prospectus, proxy material, annual report and semiannual report (or related notice of internet availability of annual report and semiannual report) to certain shareholders residing at the same "household." This reduces Fund expenses, which benefits you and other shareholders.If you need additional copies or do not want your mailings to be "householded," please call Lord Abbett at 888-522-2388.
Lord Abbett Sustainable Municipal Bond Fund
Annual Shareholder Report
September 30, 2024
lordabbett.com/FundDocuments
TSR-A-9264-A
11/24
Lord Abbett Sustainable Municipal Bond Fund
Annual Shareholder Report
September 30, 2024
lordabbett.com/FundDocuments
This annual shareholder report contains important information about the Lord Abbett Sustainable Municipal Bond Fund for the period of October 1, 2023 to September 30, 2024, as well as certain changes to the Fund. You can find additional information about the Fund at lordabbett.com/FundDocuments. You can also request this information by contacting us at 888-522-2388.
What were the Fund costs for the last year?
(based on a hypothetical $10,000 investment)
| Class Name | Costs of a $10,000 investment | Costs paid as a percentage of a $10,000 investment |
|---|
| Class C | $132 | 1.27% |
How did the Fund perform last year and what affected its performance?
For the fiscal year ended September 30, 2024, the Fund returned 8.60%, reflecting performance at the net asset value (NAV) of Class C shares, compared to the 8.47% of a securities market index with investment characteristics similar to those of the Fund, the Bloomberg 1-15 Year Municipal Bond Index. The Fund's broad-based market index, the Bloomberg Aggregate Bond Index, returned 11.57% over the same period.
Positive factors for the municipal market included decreasing Treasury yields, easing inflationary pressures and the start of interest rate cuts by the U.S. Federal Reserve. Also supporting the market was increased demand for municipal bond funds and a strong fundamental backdrop as evidenced by growing tax revenue and positive ratings actions by public ratings agencies. Negative factors included a significant increase in municipal bond supply, which pressured the market in second half of the fiscal year, and periods of interest rate volatility driven by sticky inflation readings at points throughout the fiscal year. Against this backdrop, municipal bonds delivered strong returns.
Top contributors to the Fund’s performance: An overweight allocation to BBB-rated and non-investment grade bonds contributed to relative performance. The Fund’s longer duration positioning relative to the prospectus benchmark led to a positive impact as yields fell over the period. An overweight allocation to the Education and Local General Obligation sectors contributed to relative performance.
Top detractors from the Fund’s performance: Security selection within the Housing sector detracted from relative performance.
Total Return Based on $10,000 Investment
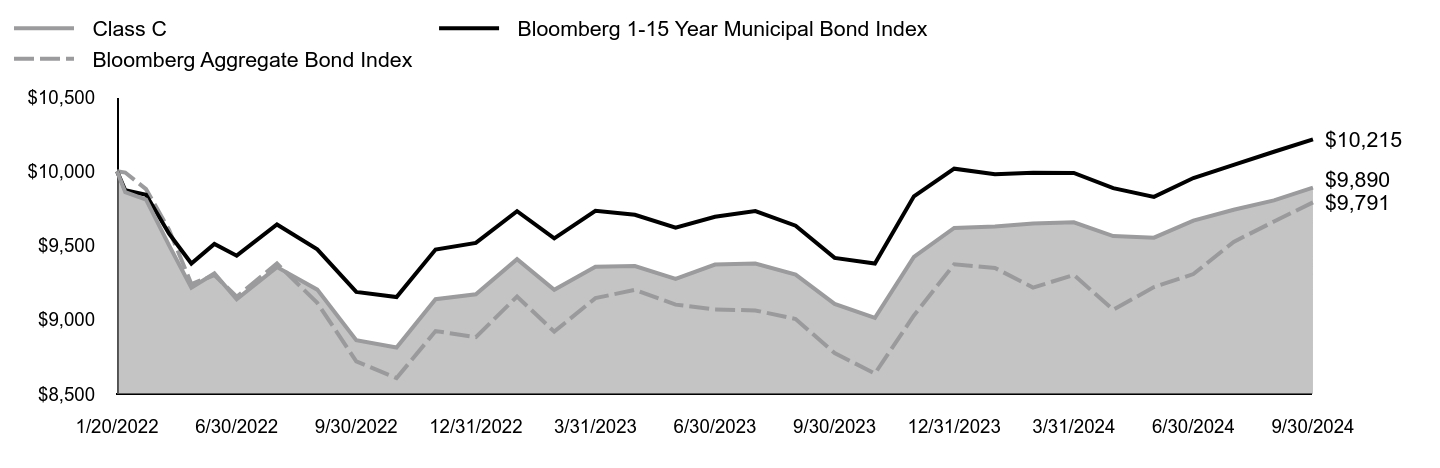
| Class C | Bloomberg 1-15 Year Municipal Bond Index | Bloomberg Aggregate Bond Index |
|---|
| 1/20/2022 | $10,000 | $10,000 | $10,000 |
| 1/31/2022 | $9,860 | $9,873 | $9,992 |
| 2/28/2022 | $9,809 | $9,842 | $9,880 |
| 3/31/2022 | $9,501 | $9,580 | $9,606 |
| 4/30/2022 | $9,216 | $9,379 | $9,241 |
| 5/31/2022 | $9,312 | $9,511 | $9,301 |
| 6/30/2022 | $9,138 | $9,432 | $9,155 |
| 7/31/2022 | $9,355 | $9,642 | $9,379 |
| 8/31/2022 | $9,203 | $9,475 | $9,114 |
| 9/30/2022 | $8,862 | $9,188 | $8,720 |
| 10/31/2022 | $8,813 | $9,153 | $8,607 |
| 11/30/2022 | $9,139 | $9,473 | $8,924 |
| 12/31/2022 | $9,172 | $9,518 | $8,883 |
| 1/31/2023 | $9,408 | $9,732 | $9,157 |
| 2/28/2023 | $9,202 | $9,549 | $8,920 |
| 3/31/2023 | $9,358 | $9,734 | $9,146 |
| 4/30/2023 | $9,362 | $9,707 | $9,202 |
| 5/31/2023 | $9,275 | $9,621 | $9,102 |
| 6/30/2023 | $9,372 | $9,694 | $9,069 |
| 7/31/2023 | $9,379 | $9,732 | $9,063 |
| 8/31/2023 | $9,304 | $9,634 | $9,005 |
| 9/30/2023 | $9,107 | $9,417 | $8,776 |
| 10/31/2023 | $9,013 | $9,379 | $8,638 |
| 11/30/2023 | $9,424 | $9,832 | $9,029 |
| 12/31/2023 | $9,619 | $10,018 | $9,374 |
| 1/31/2024 | $9,628 | $9,980 | $9,349 |
| 2/29/2024 | $9,648 | $9,990 | $9,217 |
| 3/31/2024 | $9,657 | $9,989 | $9,302 |
| 4/30/2024 | $9,564 | $9,887 | $9,067 |
| 5/31/2024 | $9,553 | $9,828 | $9,220 |
| 6/30/2024 | $9,668 | $9,955 | $9,308 |
| 7/31/2024 | $9,741 | $10,043 | $9,525 |
| 8/31/2024 | $9,804 | $10,132 | $9,662 |
| 9/30/2024 | $9,890 | $10,215 | $9,791 |
The Fund’s benchmarks are unmanaged indices used as a general measure of market performance. Calculations assume the reinvestment of dividends and capital gains.
Average Annual Total Returns (%)
| 1 Year | Since Inception 1/20/22 |
|---|
| Class C at NAV | 8.60% | (0.41%) |
| Class C with sales charge | 7.60% | (0.41%) |
| Bloomberg 1-15 Year Municipal Bond Index | 8.47% | 0.79% |
Bloomberg Aggregate Bond IndexFootnote Reference* | 11.57% | (0.78%) |
| Footnote | Description |
Footnote* | The Fund has adopted the Bloomberg Aggregate Bond Index as its broad-based securities market index. |
The Fund's past performance is no guarantee of future results. The returns do not reflect the deduction of taxes that a shareholder would pay on Fund distributions or redemption of Fund shares.
(as of September 30, 2024)
| Total Net Assets | $5,689,525 |
| # of Portfolio Holdings | 40 |
| Portfolio Turnover Rate | 48% |
| Total Advisory Fees Paid | $0 |
What did the Fund invest in?
(as of September 30, 2024)
Credit Rating S&P or Moody'sFootnote Reference(a) | %Footnote Reference** |
|---|
| |
- A21.51%
- A+13.18%
- AA7.32%
- AA-2.86%
- AA+2.53%
- AAA6.98%
- BB7.63%
- BB+2.14%
- BBB4.81%
- BBB-21.95%
- BBB+3.34%
- NR5.75%
- Total 100.00%
| Footnote | Description |
Footnote** | Represents percent of total investments, which excludes derivatives. |
Footnote(a) | Investments in investment grade municipal bonds, which as bonds that are rated, at the time of purchase, within the four highest grades assigned by an independent rating agency such as Moody’s, S&P, or Fitch, or an equivalent short-term rating, as applicable, or are unrated by rating agencies but deemed by Lord Abbett to be of comparable quality. Lower rated municipal bonds are rated, at the time of purchase, or an equivalent short-term rating, as applicable, by an independent rating agency or are unrated by rating agencies but deemed by Lord Abbett to be of comparable quality. |
There were no material fund changes during the period.
Where can I find additional information about the Fund?
For additional information about the Fund, including its Prospectus, Statement of Additional Information, financial statements, holdings and proxy information, please visit lordabbett.com/FundDocuments.
The Fund has adopted a policy that allows it to send only one copy of the Fund's prospectus, proxy material, annual report and semiannual report (or related notice of internet availability of annual report and semiannual report) to certain shareholders residing at the same "household." This reduces Fund expenses, which benefits you and other shareholders.If you need additional copies or do not want your mailings to be "householded," please call Lord Abbett at 888-522-2388.
Lord Abbett Sustainable Municipal Bond Fund
Annual Shareholder Report
September 30, 2024
lordabbett.com/FundDocuments
TSR-A-9265-C
11/24
Lord Abbett Sustainable Municipal Bond Fund
Annual Shareholder Report
September 30, 2024
lordabbett.com/FundDocuments
This annual shareholder report contains important information about the Lord Abbett Sustainable Municipal Bond Fund for the period of October 1, 2023 to September 30, 2024, as well as certain changes to the Fund. You can find additional information about the Fund at lordabbett.com/FundDocuments. You can also request this information by contacting us at 888-522-2388.
What were the Fund costs for the last year?
(based on a hypothetical $10,000 investment)
| Class Name | Costs of a $10,000 investment | Costs paid as a percentage of a $10,000 investment |
|---|
| Class F | $55 | 0.53% |
How did the Fund perform last year and what affected its performance?
For the fiscal year ended September 30, 2024, the Fund returned 9.41%, reflecting performance at the net asset value (NAV) of Class F shares, compared to the 8.47% of a securities market index with investment characteristics similar to those of the Fund, the Bloomberg 1-15 Year Municipal Bond Index. The Fund's broad-based market index, the Bloomberg Aggregate Bond Index, returned 11.57% over the same period.
Positive factors for the municipal market included decreasing Treasury yields, easing inflationary pressures and the start of interest rate cuts by the U.S. Federal Reserve. Also supporting the market was increased demand for municipal bond funds and a strong fundamental backdrop as evidenced by growing tax revenue and positive ratings actions by public ratings agencies. Negative factors included a significant increase in municipal bond supply, which pressured the market in second half of the fiscal year, and periods of interest rate volatility driven by sticky inflation readings at points throughout the fiscal year. Against this backdrop, municipal bonds delivered strong returns.
Top contributors to the Fund’s performance: An overweight allocation to BBB-rated and non-investment grade bonds contributed to relative performance. The Fund’s longer duration positioning relative to the prospectus benchmark led to a positive impact as yields fell over the period. An overweight allocation to the Education and Local General Obligation sectors contributed to relative performance.
Top detractors from the Fund’s performance: Security selection within the Housing sector detracted from relative performance.
Total Return Based on $10,000 Investment
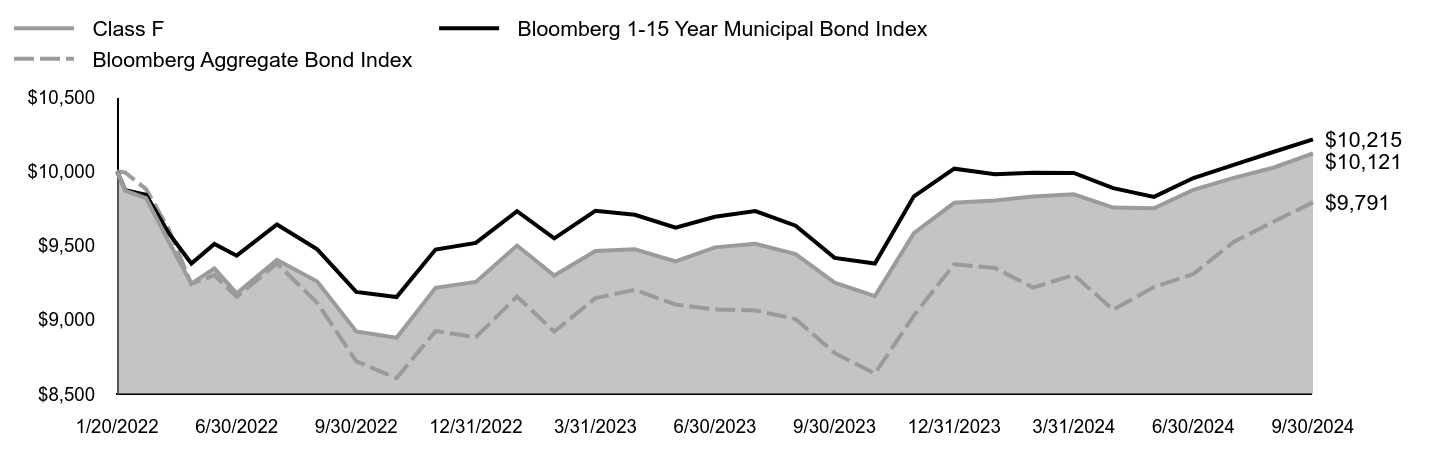
| Class F | Bloomberg 1-15 Year Municipal Bond Index | Bloomberg Aggregate Bond Index |
|---|
| 1/20/2022 | $10,000 | $10,000 | $10,000 |
| 1/31/2022 | $9,870 | $9,873 | $9,992 |
| 2/28/2022 | $9,819 | $9,842 | $9,880 |
| 3/31/2022 | $9,522 | $9,580 | $9,606 |
| 4/30/2022 | $9,243 | $9,379 | $9,241 |
| 5/31/2022 | $9,346 | $9,511 | $9,301 |
| 6/30/2022 | $9,178 | $9,432 | $9,155 |
| 7/31/2022 | $9,404 | $9,642 | $9,379 |
| 8/31/2022 | $9,258 | $9,475 | $9,114 |
| 9/30/2022 | $8,922 | $9,188 | $8,720 |
| 10/31/2022 | $8,879 | $9,153 | $8,607 |
| 11/30/2022 | $9,215 | $9,473 | $8,924 |
| 12/31/2022 | $9,255 | $9,518 | $8,883 |
| 1/31/2023 | $9,500 | $9,732 | $9,157 |
| 2/28/2023 | $9,298 | $9,549 | $8,920 |
| 3/31/2023 | $9,463 | $9,734 | $9,146 |
| 4/30/2023 | $9,475 | $9,707 | $9,202 |
| 5/31/2023 | $9,393 | $9,621 | $9,102 |
| 6/30/2023 | $9,488 | $9,694 | $9,069 |
| 7/31/2023 | $9,512 | $9,732 | $9,063 |
| 8/31/2023 | $9,443 | $9,634 | $9,005 |
| 9/30/2023 | $9,250 | $9,417 | $8,776 |
| 10/31/2023 | $9,160 | $9,379 | $8,638 |
| 11/30/2023 | $9,584 | $9,832 | $9,029 |
| 12/31/2023 | $9,788 | $10,018 | $9,374 |
| 1/31/2024 | $9,804 | $9,980 | $9,349 |
| 2/29/2024 | $9,830 | $9,990 | $9,217 |
| 3/31/2024 | $9,845 | $9,989 | $9,302 |
| 4/30/2024 | $9,756 | $9,887 | $9,067 |
| 5/31/2024 | $9,751 | $9,828 | $9,220 |
| 6/30/2024 | $9,875 | $9,955 | $9,308 |
| 7/31/2024 | $9,956 | $10,043 | $9,525 |
| 8/31/2024 | $10,026 | $10,132 | $9,662 |
| 9/30/2024 | $10,121 | $10,215 | $9,791 |
The Fund’s benchmarks are unmanaged indices used as a general measure of market performance. Calculations assume the reinvestment of dividends and capital gains.
Average Annual Total Returns (%)
| 1 Year | Since Inception 1/20/22 |
|---|
| Class F at NAV | 9.41% | 0.45% |
| Bloomberg 1-15 Year Municipal Bond Index | 8.47% | 0.79% |
Bloomberg Aggregate Bond IndexFootnote Reference* | 11.57% | (0.78%) |
| Footnote | Description |
Footnote* | The Fund has adopted the Bloomberg Aggregate Bond Index as its broad-based securities market index. |
The Fund's past performance is no guarantee of future results. The returns do not reflect the deduction of taxes that a shareholder would pay on Fund distributions or redemption of Fund shares.
(as of September 30, 2024)
| Total Net Assets | $5,689,525 |
| # of Portfolio Holdings | 40 |
| Portfolio Turnover Rate | 48% |
| Total Advisory Fees Paid | $0 |
What did the Fund invest in?
(as of September 30, 2024)
Credit Rating S&P or Moody'sFootnote Reference(a) | %Footnote Reference** |
|---|
| |
- A21.51%
- A+13.18%
- AA7.32%
- AA-2.86%
- AA+2.53%
- AAA6.98%
- BB7.63%
- BB+2.14%
- BBB4.81%
- BBB-21.95%
- BBB+3.34%
- NR5.75%
- Total 100.00%
| Footnote | Description |
Footnote** | Represents percent of total investments, which excludes derivatives. |
Footnote(a) | Investments in investment grade municipal bonds, which as bonds that are rated, at the time of purchase, within the four highest grades assigned by an independent rating agency such as Moody’s, S&P, or Fitch, or an equivalent short-term rating, as applicable, or are unrated by rating agencies but deemed by Lord Abbett to be of comparable quality. Lower rated municipal bonds are rated, at the time of purchase, or an equivalent short-term rating, as applicable, by an independent rating agency or are unrated by rating agencies but deemed by Lord Abbett to be of comparable quality. |
There were no material fund changes during the period.
Where can I find additional information about the Fund?
For additional information about the Fund, including its Prospectus, Statement of Additional Information, financial statements, holdings and proxy information, please visit lordabbett.com/FundDocuments.
The Fund has adopted a policy that allows it to send only one copy of the Fund's prospectus, proxy material, annual report and semiannual report (or related notice of internet availability of annual report and semiannual report) to certain shareholders residing at the same "household." This reduces Fund expenses, which benefits you and other shareholders.If you need additional copies or do not want your mailings to be "householded," please call Lord Abbett at 888-522-2388.
Lord Abbett Sustainable Municipal Bond Fund
Annual Shareholder Report
September 30, 2024
lordabbett.com/FundDocuments
TSR-A-9266-F
11/24
Lord Abbett Sustainable Municipal Bond Fund
Annual Shareholder Report
September 30, 2024
lordabbett.com/FundDocuments
This annual shareholder report contains important information about the Lord Abbett Sustainable Municipal Bond Fund for the period of October 1, 2023 to September 30, 2024, as well as certain changes to the Fund. You can find additional information about the Fund at lordabbett.com/FundDocuments. You can also request this information by contacting us at 888-522-2388.
What were the Fund costs for the last year?
(based on a hypothetical $10,000 investment)
| Class Name | Costs of a $10,000 investment | Costs paid as a percentage of a $10,000 investment |
|---|
| Class F3 | $42 | 0.40% |
How did the Fund perform last year and what affected its performance?
For the fiscal year ended September 30, 2024, the Fund returned 9.56%, reflecting performance at the net asset value (NAV) of Class F3 shares, compared to the 8.47% of a securities market index with investment characteristics similar to those of the Fund, the Bloomberg 1-15 Year Municipal Bond Index. The Fund's broad-based market index, the Bloomberg Aggregate Bond Index, returned 11.57% over the same period.
Positive factors for the municipal market included decreasing Treasury yields, easing inflationary pressures and the start of interest rate cuts by the U.S. Federal Reserve. Also supporting the market was increased demand for municipal bond funds and a strong fundamental backdrop as evidenced by growing tax revenue and positive ratings actions by public ratings agencies. Negative factors included a significant increase in municipal bond supply, which pressured the market in second half of the fiscal year, and periods of interest rate volatility driven by sticky inflation readings at points throughout the fiscal year. Against this backdrop, municipal bonds delivered strong returns.
Top contributors to the Fund’s performance: An overweight allocation to BBB-rated and non-investment grade bonds contributed to relative performance. The Fund’s longer duration positioning relative to the prospectus benchmark led to a positive impact as yields fell over the period. An overweight allocation to the Education and Local General Obligation sectors contributed to relative performance.
Top detractors from the Fund’s performance: Security selection within the Housing sector detracted from relative performance.
Total Return Based on $10,000 Investment
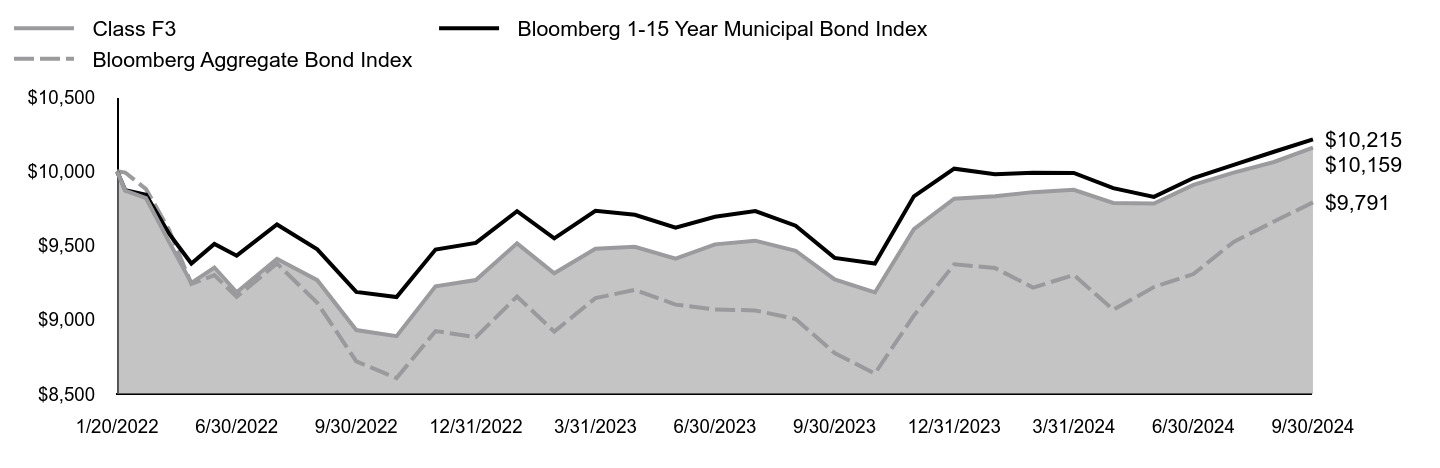
| Class F3 | Bloomberg 1-15 Year Municipal Bond Index | Bloomberg Aggregate Bond Index |
|---|
| 1/20/2022 | $10,000 | $10,000 | $10,000 |
| 1/31/2022 | $9,870 | $9,873 | $9,992 |
| 2/28/2022 | $9,819 | $9,842 | $9,880 |
| 3/31/2022 | $9,525 | $9,580 | $9,606 |
| 4/30/2022 | $9,248 | $9,379 | $9,241 |
| 5/31/2022 | $9,352 | $9,511 | $9,301 |
| 6/30/2022 | $9,185 | $9,432 | $9,155 |
| 7/31/2022 | $9,411 | $9,642 | $9,379 |
| 8/31/2022 | $9,267 | $9,475 | $9,114 |
| 9/30/2022 | $8,931 | $9,188 | $8,720 |
| 10/31/2022 | $8,890 | $9,153 | $8,607 |
| 11/30/2022 | $9,226 | $9,473 | $8,924 |
| 12/31/2022 | $9,268 | $9,518 | $8,883 |
| 1/31/2023 | $9,515 | $9,732 | $9,157 |
| 2/28/2023 | $9,313 | $9,549 | $8,920 |
| 3/31/2023 | $9,479 | $9,734 | $9,146 |
| 4/30/2023 | $9,492 | $9,707 | $9,202 |
| 5/31/2023 | $9,412 | $9,621 | $9,102 |
| 6/30/2023 | $9,508 | $9,694 | $9,069 |
| 7/31/2023 | $9,533 | $9,732 | $9,063 |
| 8/31/2023 | $9,465 | $9,634 | $9,005 |
| 9/30/2023 | $9,272 | $9,417 | $8,776 |
| 10/31/2023 | $9,184 | $9,379 | $8,638 |
| 11/30/2023 | $9,610 | $9,832 | $9,029 |
| 12/31/2023 | $9,816 | $10,018 | $9,374 |
| 1/31/2024 | $9,832 | $9,980 | $9,349 |
| 2/29/2024 | $9,860 | $9,990 | $9,217 |
| 3/31/2024 | $9,876 | $9,989 | $9,302 |
| 4/30/2024 | $9,787 | $9,887 | $9,067 |
| 5/31/2024 | $9,783 | $9,828 | $9,220 |
| 6/30/2024 | $9,909 | $9,955 | $9,308 |
| 7/31/2024 | $9,991 | $10,043 | $9,525 |
| 8/31/2024 | $10,063 | $10,132 | $9,662 |
| 9/30/2024 | $10,159 | $10,215 | $9,791 |
The Fund’s benchmarks are unmanaged indices used as a general measure of market performance. Calculations assume the reinvestment of dividends and capital gains.
Average Annual Total Returns (%)
| 1 Year | Since Inception 1/20/22 |
|---|
| Class F3 at NAV | 9.56% | 0.59% |
| Bloomberg 1-15 Year Municipal Bond Index | 8.47% | 0.79% |
Bloomberg Aggregate Bond IndexFootnote Reference* | 11.57% | (0.78%) |
| Footnote | Description |
Footnote* | The Fund has adopted the Bloomberg Aggregate Bond Index as its broad-based securities market index. |
The Fund's past performance is no guarantee of future results. The returns do not reflect the deduction of taxes that a shareholder would pay on Fund distributions or redemption of Fund shares.
(as of September 30, 2024)
| Total Net Assets | $5,689,525 |
| # of Portfolio Holdings | 40 |
| Portfolio Turnover Rate | 48% |
| Total Advisory Fees Paid | $0 |
What did the Fund invest in?
(as of September 30, 2024)
Credit Rating S&P or Moody'sFootnote Reference(a) | %Footnote Reference** |
|---|
| |
- A21.51%
- A+13.18%
- AA7.32%
- AA-2.86%
- AA+2.53%
- AAA6.98%
- BB7.63%
- BB+2.14%
- BBB4.81%
- BBB-21.95%
- BBB+3.34%
- NR5.75%
- Total 100.00%
| Footnote | Description |
Footnote** | Represents percent of total investments, which excludes derivatives. |
Footnote(a) | Investments in investment grade municipal bonds, which as bonds that are rated, at the time of purchase, within the four highest grades assigned by an independent rating agency such as Moody’s, S&P, or Fitch, or an equivalent short-term rating, as applicable, or are unrated by rating agencies but deemed by Lord Abbett to be of comparable quality. Lower rated municipal bonds are rated, at the time of purchase, or an equivalent short-term rating, as applicable, by an independent rating agency or are unrated by rating agencies but deemed by Lord Abbett to be of comparable quality. |
There were no material fund changes during the period.
Where can I find additional information about the Fund?
For additional information about the Fund, including its Prospectus, Statement of Additional Information, financial statements, holdings and proxy information, please visit lordabbett.com/FundDocuments.
The Fund has adopted a policy that allows it to send only one copy of the Fund's prospectus, proxy material, annual report and semiannual report (or related notice of internet availability of annual report and semiannual report) to certain shareholders residing at the same "household." This reduces Fund expenses, which benefits you and other shareholders.If you need additional copies or do not want your mailings to be "householded," please call Lord Abbett at 888-522-2388.
Lord Abbett Sustainable Municipal Bond Fund
Annual Shareholder Report
September 30, 2024
lordabbett.com/FundDocuments
TSR-A-9267-F3
11/24
Lord Abbett Sustainable Municipal Bond Fund
Annual Shareholder Report
September 30, 2024
lordabbett.com/FundDocuments
This annual shareholder report contains important information about the Lord Abbett Sustainable Municipal Bond Fund for the period of October 1, 2023 to September 30, 2024, as well as certain changes to the Fund. You can find additional information about the Fund at lordabbett.com/FundDocuments. You can also request this information by contacting us at 888-522-2388.
What were the Fund costs for the last year?
(based on a hypothetical $10,000 investment)
| Class Name | Costs of a $10,000 investment | Costs paid as a percentage of a $10,000 investment |
|---|
| Class I | $45 | 0.43% |
How did the Fund perform last year and what affected its performance?
For the fiscal year ended September 30, 2024, the Fund returned 9.52%, reflecting performance at the net asset value (NAV) of Class I shares, compared to the 8.47% of a securities market index with investment characteristics similar to those of the Fund, the Bloomberg 1-15 Year Municipal Bond Index. The Fund's broad-based market index, the Bloomberg Aggregate Bond Index, returned 11.57% over the same period.
Positive factors for the municipal market included decreasing Treasury yields, easing inflationary pressures and the start of interest rate cuts by the U.S. Federal Reserve. Also supporting the market was increased demand for municipal bond funds and a strong fundamental backdrop as evidenced by growing tax revenue and positive ratings actions by public ratings agencies. Negative factors included a significant increase in municipal bond supply, which pressured the market in second half of the fiscal year, and periods of interest rate volatility driven by sticky inflation readings at points throughout the fiscal year. Against this backdrop, municipal bonds delivered strong returns.
Top contributors to the Fund’s performance: An overweight allocation to BBB-rated and non-investment grade bonds contributed to relative performance. The Fund’s longer duration positioning relative to the prospectus benchmark led to a positive impact as yields fell over the period. An overweight allocation to the Education and Local General Obligation sectors contributed to relative performance.
Top detractors from the Fund’s performance: Security selection within the Housing sector detracted from relative performance.
Total Return Based on $10,000 Investment

| Class I | Bloomberg 1-15 Year Municipal Bond Index | Bloomberg Aggregate Bond Index |
|---|
| 1/20/2022 | $10,000 | $10,000 | $10,000 |
| 1/31/2022 | $9,870 | $9,873 | $9,992 |
| 2/28/2022 | $9,819 | $9,842 | $9,880 |
| 3/31/2022 | $9,524 | $9,580 | $9,606 |
| 4/30/2022 | $9,246 | $9,379 | $9,241 |
| 5/31/2022 | $9,350 | $9,511 | $9,301 |
| 6/30/2022 | $9,183 | $9,432 | $9,155 |
| 7/31/2022 | $9,409 | $9,642 | $9,379 |
| 8/31/2022 | $9,264 | $9,475 | $9,114 |
| 9/30/2022 | $8,929 | $9,188 | $8,720 |
| 10/31/2022 | $8,887 | $9,153 | $8,607 |
| 11/30/2022 | $9,223 | $9,473 | $8,924 |
| 12/31/2022 | $9,264 | $9,518 | $8,883 |
| 1/31/2023 | $9,510 | $9,732 | $9,157 |
| 2/28/2023 | $9,309 | $9,549 | $8,920 |
| 3/31/2023 | $9,475 | $9,734 | $9,146 |
| 4/30/2023 | $9,487 | $9,707 | $9,202 |
| 5/31/2023 | $9,407 | $9,621 | $9,102 |
| 6/30/2023 | $9,502 | $9,694 | $9,069 |
| 7/31/2023 | $9,527 | $9,732 | $9,063 |
| 8/31/2023 | $9,459 | $9,634 | $9,005 |
| 9/30/2023 | $9,266 | $9,417 | $8,776 |
| 10/31/2023 | $9,177 | $9,379 | $8,638 |
| 11/30/2023 | $9,603 | $9,832 | $9,029 |
| 12/31/2023 | $9,808 | $10,018 | $9,374 |
| 1/31/2024 | $9,824 | $9,980 | $9,349 |
| 2/29/2024 | $9,851 | $9,990 | $9,217 |
| 3/31/2024 | $9,867 | $9,989 | $9,302 |
| 4/30/2024 | $9,779 | $9,887 | $9,067 |
| 5/31/2024 | $9,774 | $9,828 | $9,220 |
| 6/30/2024 | $9,900 | $9,955 | $9,308 |
| 7/31/2024 | $9,981 | $10,043 | $9,525 |
| 8/31/2024 | $10,053 | $10,132 | $9,662 |
| 9/30/2024 | $10,148 | $10,215 | $9,791 |
The Fund’s benchmarks are unmanaged indices used as a general measure of market performance. Calculations assume the reinvestment of dividends and capital gains.
Average Annual Total Returns (%)
| 1 Year | Since Inception 1/20/22 |
|---|
| Class I at NAV | 9.52% | 0.55% |
| Bloomberg 1-15 Year Municipal Bond Index | 8.47% | 0.79% |
Bloomberg Aggregate Bond IndexFootnote Reference* | 11.57% | (0.78%) |
| Footnote | Description |
Footnote* | The Fund has adopted the Bloomberg Aggregate Bond Index as its broad-based securities market index. |
The Fund's past performance is no guarantee of future results. The returns do not reflect the deduction of taxes that a shareholder would pay on Fund distributions or redemption of Fund shares.
(as of September 30, 2024)
| Total Net Assets | $5,689,525 |
| # of Portfolio Holdings | 40 |
| Portfolio Turnover Rate | 48% |
| Total Advisory Fees Paid | $0 |
What did the Fund invest in?
(as of September 30, 2024)
Credit Rating S&P or Moody'sFootnote Reference(a) | %Footnote Reference** |
|---|
| |
- A21.51%
- A+13.18%
- AA7.32%
- AA-2.86%
- AA+2.53%
- AAA6.98%
- BB7.63%
- BB+2.14%
- BBB4.81%
- BBB-21.95%
- BBB+3.34%
- NR5.75%
- Total 100.00%
| Footnote | Description |
Footnote** | Represents percent of total investments, which excludes derivatives. |
Footnote(a) | Investments in investment grade municipal bonds, which as bonds that are rated, at the time of purchase, within the four highest grades assigned by an independent rating agency such as Moody’s, S&P, or Fitch, or an equivalent short-term rating, as applicable, or are unrated by rating agencies but deemed by Lord Abbett to be of comparable quality. Lower rated municipal bonds are rated, at the time of purchase, or an equivalent short-term rating, as applicable, by an independent rating agency or are unrated by rating agencies but deemed by Lord Abbett to be of comparable quality. |
There were no material fund changes during the period.
Where can I find additional information about the Fund?
For additional information about the Fund, including its Prospectus, Statement of Additional Information, financial statements, holdings and proxy information, please visit lordabbett.com/FundDocuments.
The Fund has adopted a policy that allows it to send only one copy of the Fund's prospectus, proxy material, annual report and semiannual report (or related notice of internet availability of annual report and semiannual report) to certain shareholders residing at the same "household." This reduces Fund expenses, which benefits you and other shareholders.If you need additional copies or do not want your mailings to be "householded," please call Lord Abbett at 888-522-2388.
Lord Abbett Sustainable Municipal Bond Fund
Annual Shareholder Report
September 30, 2024
lordabbett.com/FundDocuments
TSR-A-9268-I
11/24
Lord Abbett New York Tax Free Fund
Annual Shareholder Report
September 30, 2024
lordabbett.com/FundDocuments
This annual shareholder report contains important information about the Lord Abbett New York Tax Free Fund for the period of October 1, 2023 to September 30, 2024, as well as certain changes to the Fund. You can find additional information about the Fund at lordabbett.com/FundDocuments. You can also request this information by contacting us at 888-522-2388.
What were the Fund costs for the last year?
(based on a hypothetical $10,000 investment)
| Class Name | Costs of a $10,000 investment | Costs paid as a percentage of a $10,000 investment |
|---|
| Class A | $83 | 0.78% |
How did the Fund perform last year and what affected its performance?
For the fiscal year ended September 30, 2024, the Fund returned 11.96%, reflecting performance at the net asset value (NAV) of Class A shares, compared to the 10.37% of a securities market index with investment characteristics similar to those of the Fund, the Bloomberg Municipal Bond Index. The Fund's broad-based market index, the Bloomberg Aggregate Bond Index, returned 11.57% over the same period.
Positive factors for the municipal market included decreasing Treasury yields, easing inflationary pressures and the start of interest rate cuts by the U.S. Federal Reserve. Also supporting the market was increased demand for municipal bond funds and a strong fundamental backdrop as evidenced by growing tax revenue and positive ratings actions by public ratings agencies. Negative factors included a significant increase in municipal bond supply, which pressured the market in second half of the fiscal year, and periods of interest rate volatility driven by sticky inflation readings at points throughout the fiscal year. Against this backdrop, municipal bonds delivered strong returns.
Top contributors to the Fund’s performance: The Fund’s longer duration positioning contributed to relative performance with the fall in rates over the period. An overweight allocation to BBB-rated and non-investment grade bonds contributed to relative performance. An overweight allocation to the Education and Special Tax sectors contributed to relative performance.
Top detractors from the Fund’s performance: Security selection within the Special Tax, Leasing and Education sectors detracted from relative performance.
Total Return Based on $10,000 Investment
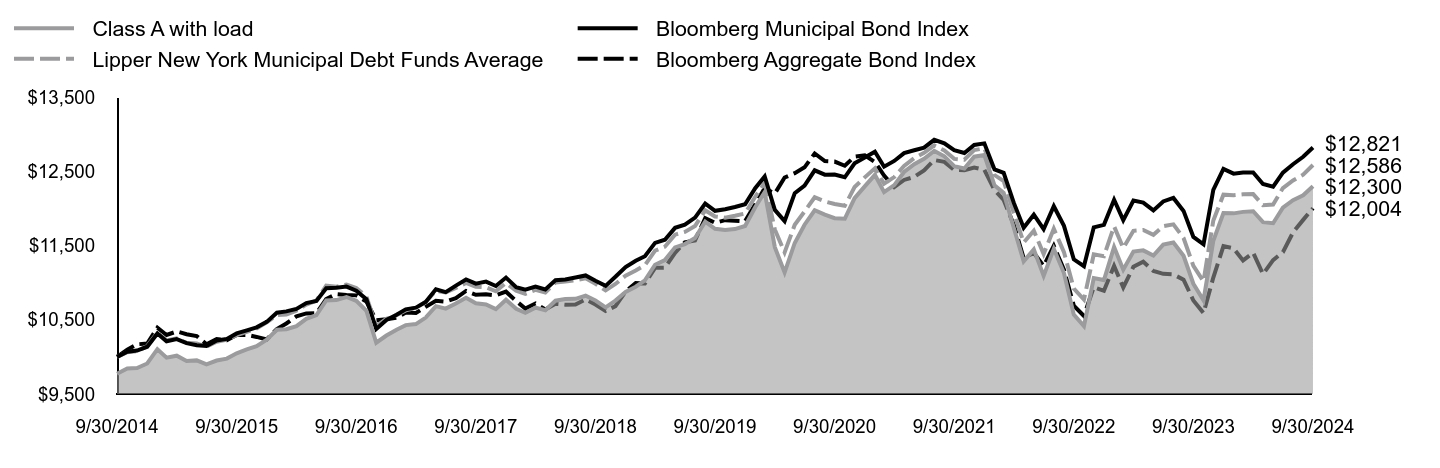
| Class A with load | Bloomberg Municipal Bond Index | Lipper New York Municipal Debt Funds Average | Bloomberg Aggregate Bond Index |
|---|
| 9/30/2014 | $9,774 | $10,000 | $10,000 | $10,000 |
| 10/31/2014 | $9,843 | $10,069 | $10,063 | $10,098 |
| 11/30/2014 | $9,850 | $10,086 | $10,078 | $10,170 |
| 12/31/2014 | $9,911 | $10,137 | $10,146 | $10,179 |
| 1/31/2015 | $10,104 | $10,316 | $10,328 | $10,393 |
| 2/28/2015 | $9,990 | $10,210 | $10,222 | $10,295 |
| 3/31/2015 | $10,016 | $10,240 | $10,250 | $10,343 |
| 4/30/2015 | $9,945 | $10,186 | $10,189 | $10,306 |
| 5/31/2015 | $9,953 | $10,158 | $10,181 | $10,281 |
| 6/30/2015 | $9,899 | $10,148 | $10,139 | $10,169 |
| 7/31/2015 | $9,951 | $10,222 | $10,204 | $10,240 |
| 8/31/2015 | $9,977 | $10,242 | $10,234 | $10,225 |
| 9/30/2015 | $10,048 | $10,316 | $10,294 | $10,294 |
| 10/31/2015 | $10,100 | $10,357 | $10,336 | $10,296 |
| 11/30/2015 | $10,144 | $10,398 | $10,385 | $10,269 |
| 12/31/2015 | $10,232 | $10,472 | $10,465 | $10,235 |
| 1/31/2016 | $10,366 | $10,596 | $10,565 | $10,376 |
| 2/29/2016 | $10,373 | $10,613 | $10,572 | $10,450 |
| 3/31/2016 | $10,415 | $10,647 | $10,624 | $10,546 |
| 4/30/2016 | $10,512 | $10,725 | $10,705 | $10,586 |
| 5/31/2016 | $10,563 | $10,754 | $10,758 | $10,589 |
| 6/30/2016 | $10,761 | $10,925 | $10,960 | $10,779 |
| 7/31/2016 | $10,766 | $10,932 | $10,946 | $10,847 |
| 8/31/2016 | $10,807 | $10,947 | $10,975 | $10,835 |
| 9/30/2016 | $10,756 | $10,892 | $10,929 | $10,829 |
| 10/31/2016 | $10,621 | $10,778 | $10,813 | $10,746 |
| 11/30/2016 | $10,191 | $10,376 | $10,416 | $10,492 |
| 12/31/2016 | $10,288 | $10,497 | $10,512 | $10,506 |
| 1/31/2017 | $10,367 | $10,567 | $10,561 | $10,527 |
| 2/28/2017 | $10,428 | $10,640 | $10,626 | $10,598 |
| 3/31/2017 | $10,442 | $10,663 | $10,661 | $10,592 |
| 4/30/2017 | $10,530 | $10,740 | $10,742 | $10,674 |
| 5/31/2017 | $10,684 | $10,911 | $10,891 | $10,756 |
| 6/30/2017 | $10,651 | $10,872 | $10,870 | $10,745 |
| 7/31/2017 | $10,720 | $10,960 | $10,929 | $10,792 |
| 8/31/2017 | $10,796 | $11,043 | $10,996 | $10,888 |
| 9/30/2017 | $10,722 | $10,987 | $10,944 | $10,836 |
| 10/31/2017 | $10,706 | $11,014 | $10,938 | $10,843 |
| 11/30/2017 | $10,643 | $10,955 | $10,884 | $10,829 |
| 12/31/2017 | $10,769 | $11,069 | $10,996 | $10,879 |
| 1/31/2018 | $10,648 | $10,939 | $10,891 | $10,753 |
| 2/28/2018 | $10,595 | $10,906 | $10,849 | $10,651 |
| 3/31/2018 | $10,664 | $10,947 | $10,903 | $10,720 |
| 4/30/2018 | $10,629 | $10,908 | $10,868 | $10,640 |
| 5/31/2018 | $10,757 | $11,033 | $11,002 | $10,716 |
| 6/30/2018 | $10,779 | $11,042 | $11,017 | $10,703 |
| 7/31/2018 | $10,782 | $11,069 | $11,033 | $10,705 |
| 8/31/2018 | $10,824 | $11,097 | $11,059 | $10,774 |
| 9/30/2018 | $10,760 | $11,025 | $10,986 | $10,705 |
| 10/31/2018 | $10,667 | $10,957 | $10,895 | $10,620 |
| 11/30/2018 | $10,759 | $11,079 | $10,982 | $10,683 |
| 12/31/2018 | $10,874 | $11,211 | $11,095 | $10,880 |
| 1/31/2019 | $10,946 | $11,296 | $11,163 | $10,995 |
| 2/28/2019 | $11,031 | $11,357 | $11,235 | $10,989 |
| 3/31/2019 | $11,242 | $11,536 | $11,432 | $11,200 |
| 4/30/2019 | $11,305 | $11,579 | $11,485 | $11,203 |
| 5/31/2019 | $11,476 | $11,739 | $11,647 | $11,402 |
| 6/30/2019 | $11,520 | $11,782 | $11,684 | $11,545 |
| 7/31/2019 | $11,602 | $11,877 | $11,763 | $11,570 |
| 8/31/2019 | $11,823 | $12,065 | $11,976 | $11,870 |
| 9/30/2019 | $11,726 | $11,968 | $11,891 | $11,807 |
| 10/31/2019 | $11,709 | $11,989 | $11,876 | $11,842 |
| 11/30/2019 | $11,722 | $12,019 | $11,901 | $11,836 |
| 12/31/2019 | $11,764 | $12,056 | $11,933 | $11,828 |
| 1/31/2020 | $12,017 | $12,273 | $12,158 | $12,056 |
| 2/29/2020 | $12,221 | $12,431 | $12,347 | $12,273 |
| 3/31/2020 | $11,479 | $11,980 | $11,716 | $12,201 |
| 4/30/2020 | $11,139 | $11,830 | $11,408 | $12,417 |
| 5/31/2020 | $11,535 | $12,206 | $11,781 | $12,475 |
| 6/30/2020 | $11,781 | $12,307 | $11,959 | $12,554 |
| 7/31/2020 | $11,976 | $12,514 | $12,151 | $12,741 |
| 8/31/2020 | $11,917 | $12,455 | $12,095 | $12,638 |
| 9/30/2020 | $11,869 | $12,458 | $12,060 | $12,632 |
| 10/31/2020 | $11,861 | $12,420 | $12,036 | $12,575 |
| 11/30/2020 | $12,139 | $12,608 | $12,288 | $12,699 |
| 12/31/2020 | $12,298 | $12,685 | $12,419 | $12,716 |
| 1/31/2021 | $12,453 | $12,765 | $12,541 | $12,625 |
| 2/28/2021 | $12,220 | $12,563 | $12,333 | $12,443 |
| 3/31/2021 | $12,314 | $12,640 | $12,423 | $12,287 |
| 4/30/2021 | $12,491 | $12,746 | $12,572 | $12,384 |
| 5/31/2021 | $12,596 | $12,784 | $12,679 | $12,425 |
| 6/30/2021 | $12,670 | $12,819 | $12,750 | $12,512 |
| 7/31/2021 | $12,775 | $12,925 | $12,849 | $12,652 |
| 8/31/2021 | $12,703 | $12,878 | $12,781 | $12,628 |
| 9/30/2021 | $12,569 | $12,785 | $12,668 | $12,518 |
| 10/31/2021 | $12,539 | $12,748 | $12,656 | $12,515 |
| 11/30/2021 | $12,697 | $12,856 | $12,787 | $12,552 |
| 12/31/2021 | $12,719 | $12,877 | $12,810 | $12,520 |
| 1/31/2022 | $12,311 | $12,525 | $12,450 | $12,250 |
| 2/28/2022 | $12,208 | $12,480 | $12,368 | $12,114 |
| 3/31/2022 | $11,737 | $12,075 | $11,938 | $11,777 |
| 4/30/2022 | $11,287 | $11,741 | $11,540 | $11,330 |
| 5/31/2022 | $11,448 | $11,916 | $11,700 | $11,403 |
| 6/30/2022 | $11,092 | $11,720 | $11,386 | $11,224 |
| 7/31/2022 | $11,456 | $12,030 | $11,726 | $11,498 |
| 8/31/2022 | $11,130 | $11,766 | $11,412 | $11,174 |
| 9/30/2022 | $10,570 | $11,315 | $10,921 | $10,691 |
| 10/31/2022 | $10,414 | $11,221 | $10,773 | $10,552 |
| 11/30/2022 | $11,062 | $11,746 | $11,381 | $10,940 |
| 12/31/2022 | $11,035 | $11,779 | $11,357 | $10,891 |
| 1/31/2023 | $11,481 | $12,117 | $11,759 | $11,226 |
| 2/28/2023 | $11,175 | $11,843 | $11,466 | $10,936 |
| 3/31/2023 | $11,419 | $12,106 | $11,699 | $11,214 |
| 4/30/2023 | $11,435 | $12,079 | $11,710 | $11,282 |
| 5/31/2023 | $11,365 | $11,974 | $11,644 | $11,159 |
| 6/30/2023 | $11,513 | $12,094 | $11,760 | $11,119 |
| 7/31/2023 | $11,541 | $12,142 | $11,786 | $11,111 |
| 8/31/2023 | $11,362 | $11,967 | $11,602 | $11,040 |
| 9/30/2023 | $10,985 | $11,616 | $11,226 | $10,760 |
| 10/31/2023 | $10,762 | $11,517 | $11,018 | $10,590 |
| 11/30/2023 | $11,564 | $12,249 | $11,838 | $11,069 |
| 12/31/2023 | $11,937 | $12,533 | $12,186 | $11,493 |
| 1/31/2024 | $11,934 | $12,469 | $12,178 | $11,462 |
| 2/29/2024 | $11,954 | $12,485 | $12,190 | $11,300 |
| 3/31/2024 | $11,962 | $12,485 | $12,194 | $11,404 |
| 4/30/2024 | $11,815 | $12,330 | $12,044 | $11,116 |
| 5/31/2024 | $11,801 | $12,294 | $12,053 | $11,304 |
| 6/30/2024 | $12,012 | $12,482 | $12,275 | $11,412 |
| 7/31/2024 | $12,111 | $12,596 | $12,378 | $11,678 |
| 8/31/2024 | $12,177 | $12,696 | $12,455 | $11,846 |
| 9/30/2024 | $12,300 | $12,821 | $12,586 | $12,004 |
The Fund’s benchmarks are unmanaged indices used as a general measure of market performance. Calculations assume the reinvestment of dividends and capital gains.
Average Annual Total Returns (%)
| 1 Year | 5 Years | 10 Years |
|---|
| Class A at NAV | 11.96% | 0.96% | 2.33% |
| Class A with sales charge | 9.44% | 0.50% | 2.09% |
| Bloomberg Municipal Bond Index | 10.37% | 1.39% | 2.52% |
| Lipper New York Municipal Debt Funds Average | 12.11% | 1.14% | 2.33% |
Bloomberg Aggregate Bond IndexFootnote Reference* | 11.57% | 0.33% | 1.84% |
| Footnote | Description |
Footnote* | The Fund has adopted the Bloomberg Aggregate Bond Index as its broad-based securities market index. |
The Fund's past performance is no guarantee of future results. The returns do not reflect the deduction of taxes that a shareholder would pay on Fund distributions or redemption of Fund shares.
(as of September 30, 2024)
| Total Net Assets | $570,555,933 |
| # of Portfolio Holdings | 306 |
| Portfolio Turnover Rate | 18% |
| Total Advisory Fees Paid | $2,228,010 |
What did the Fund invest in?
(as of September 30, 2024)
Credit Rating S&P or Moody'sFootnote Reference(a) | %Footnote Reference** |
|---|
| |
- A6.04%
- A-8.36%
- A+2.63%
- AA13.76%
- AA-5.81%
- AA+15.61%
- AAA8.80%
- B0.30%
- B-0.74%
- B+0.92%
- BB1.53%
- BB-0.32%
- BB+0.55%
- BBB7.38%
- BBB-13.62%
- BBB+7.48%
- CCC+0.33%
- NR5.82%
- Total 100.00%
| Footnote | Description |
Footnote** | Represents percent of total investments, which excludes derivatives. |
Footnote(a) | Investments in investment grade municipal bonds, which as bonds that are rated, at the time of purchase, within the four highest grades assigned by an independent rating agency such as Moody’s, S&P, or Fitch, or an equivalent short-term rating, as applicable, or are unrated by rating agencies but deemed by Lord Abbett to be of comparable quality. Lower rated municipal bonds are rated, at the time of purchase, or an equivalent short-term rating, as applicable, by an independent rating agency or are unrated by rating agencies but deemed by Lord Abbett to be of comparable quality. |
There were no material fund changes during the period.
Where can I find additional information about the Fund?
For additional information about the Fund, including its Prospectus, Statement of Additional Information, financial statements, holdings and proxy information, please visit lordabbett.com/FundDocuments.
The Fund has adopted a policy that allows it to send only one copy of the Fund's prospectus, proxy material, annual report and semiannual report (or related notice of internet availability of annual report and semiannual report) to certain shareholders residing at the same "household." This reduces Fund expenses, which benefits you and other shareholders.If you need additional copies or do not want your mailings to be "householded," please call Lord Abbett at 888-522-2388.
Lord Abbett New York Tax Free Fund
Annual Shareholder Report
September 30, 2024
lordabbett.com/FundDocuments
TSR-A-7-A
11/24
Lord Abbett New York Tax Free Fund
Annual Shareholder Report
September 30, 2024
lordabbett.com/FundDocuments
This annual shareholder report contains important information about the Lord Abbett New York Tax Free Fund for the period of October 1, 2023 to September 30, 2024, as well as certain changes to the Fund. You can find additional information about the Fund at lordabbett.com/FundDocuments. You can also request this information by contacting us at 888-522-2388.
What were the Fund costs for the last year?
(based on a hypothetical $10,000 investment)
| Class Name | Costs of a $10,000 investment | Costs paid as a percentage of a $10,000 investment |
|---|
| Class C | $147 | 1.39% |
How did the Fund perform last year and what affected its performance?
For the fiscal year ended September 30, 2024, the Fund returned 11.29%, reflecting performance at the net asset value (NAV) of Class C shares, compared to the 10.37% of a securities market index with investment characteristics similar to those of the Fund, the Bloomberg Municipal Bond Index. The Fund's broad-based market index, the Bloomberg Aggregate Bond Index, returned 11.57% over the same period.
Positive factors for the municipal market included decreasing Treasury yields, easing inflationary pressures and the start of interest rate cuts by the U.S. Federal Reserve. Also supporting the market was increased demand for municipal bond funds and a strong fundamental backdrop as evidenced by growing tax revenue and positive ratings actions by public ratings agencies. Negative factors included a significant increase in municipal bond supply, which pressured the market in second half of the fiscal year, and periods of interest rate volatility driven by sticky inflation readings at points throughout the fiscal year. Against this backdrop, municipal bonds delivered strong returns.
Top contributors to the Fund’s performance: The Fund’s longer duration positioning contributed to relative performance with the fall in rates over the period. An overweight allocation to BBB-rated and non-investment grade bonds contributed to relative performance. An overweight allocation to the Education and Special Tax sectors contributed to relative performance.
Top detractors from the Fund’s performance: Security selection within the Special Tax, Leasing and Education sectors detracted from relative performance.
Total Return Based on $10,000 Investment
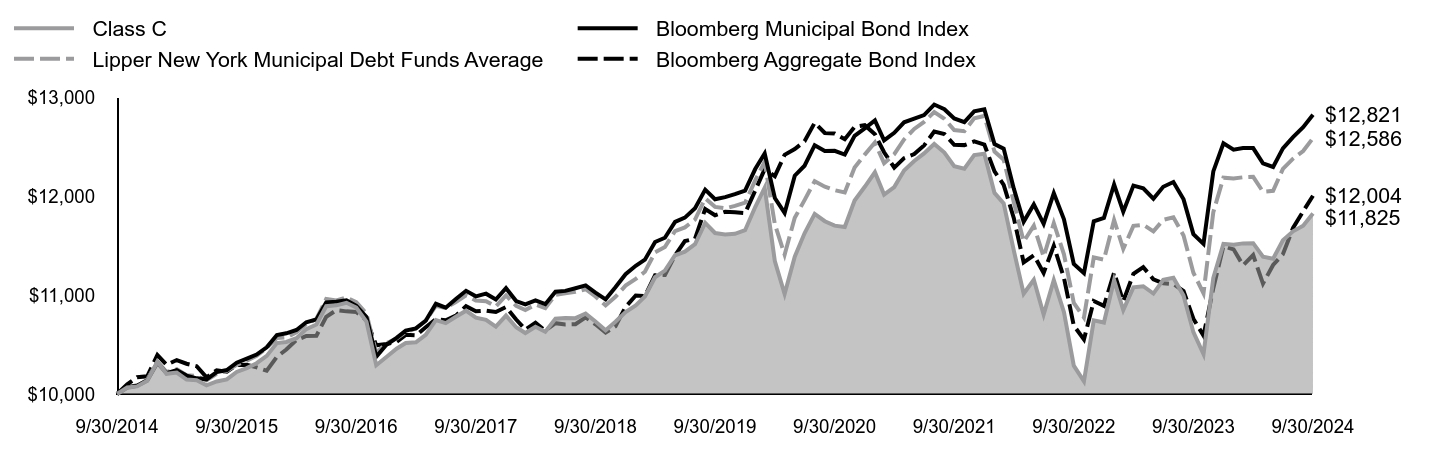
| Class C | Bloomberg Municipal Bond Index | Lipper New York Municipal Debt Funds Average | Bloomberg Aggregate Bond Index |
|---|
| 9/30/2014 | $10,000 | $10,000 | $10,000 | $10,000 |
| 10/31/2014 | $10,066 | $10,069 | $10,063 | $10,098 |
| 11/30/2014 | $10,077 | $10,086 | $10,078 | $10,170 |
| 12/31/2014 | $10,134 | $10,137 | $10,146 | $10,179 |
| 1/31/2015 | $10,326 | $10,316 | $10,328 | $10,393 |
| 2/28/2015 | $10,204 | $10,210 | $10,222 | $10,295 |
| 3/31/2015 | $10,216 | $10,240 | $10,250 | $10,343 |
| 4/30/2015 | $10,146 | $10,186 | $10,189 | $10,306 |
| 5/31/2015 | $10,140 | $10,158 | $10,181 | $10,281 |
| 6/30/2015 | $10,088 | $10,148 | $10,139 | $10,169 |
| 7/31/2015 | $10,127 | $10,222 | $10,204 | $10,240 |
| 8/31/2015 | $10,148 | $10,242 | $10,234 | $10,225 |
| 9/30/2015 | $10,223 | $10,316 | $10,294 | $10,294 |
| 10/31/2015 | $10,262 | $10,357 | $10,336 | $10,296 |
| 11/30/2015 | $10,311 | $10,398 | $10,385 | $10,269 |
| 12/31/2015 | $10,385 | $10,472 | $10,465 | $10,235 |
| 1/31/2016 | $10,515 | $10,596 | $10,565 | $10,376 |
| 2/29/2016 | $10,526 | $10,613 | $10,572 | $10,450 |
| 3/31/2016 | $10,564 | $10,647 | $10,624 | $10,546 |
| 4/30/2016 | $10,656 | $10,725 | $10,705 | $10,586 |
| 5/31/2016 | $10,702 | $10,754 | $10,758 | $10,589 |
| 6/30/2016 | $10,887 | $10,925 | $10,960 | $10,779 |
| 7/31/2016 | $10,896 | $10,932 | $10,946 | $10,847 |
| 8/31/2016 | $10,922 | $10,947 | $10,975 | $10,835 |
| 9/30/2016 | $10,874 | $10,892 | $10,929 | $10,829 |
| 10/31/2016 | $10,732 | $10,778 | $10,813 | $10,746 |
| 11/30/2016 | $10,291 | $10,376 | $10,416 | $10,492 |
| 12/31/2016 | $10,374 | $10,497 | $10,512 | $10,506 |
| 1/31/2017 | $10,458 | $10,567 | $10,561 | $10,527 |
| 2/28/2017 | $10,515 | $10,640 | $10,626 | $10,598 |
| 3/31/2017 | $10,523 | $10,663 | $10,661 | $10,592 |
| 4/30/2017 | $10,597 | $10,740 | $10,742 | $10,674 |
| 5/31/2017 | $10,746 | $10,911 | $10,891 | $10,756 |
| 6/30/2017 | $10,716 | $10,872 | $10,870 | $10,745 |
| 7/31/2017 | $10,780 | $10,960 | $10,929 | $10,792 |
| 8/31/2017 | $10,842 | $11,043 | $10,996 | $10,888 |
| 9/30/2017 | $10,771 | $10,987 | $10,944 | $10,836 |
| 10/31/2017 | $10,749 | $11,014 | $10,938 | $10,843 |
| 11/30/2017 | $10,680 | $10,955 | $10,884 | $10,829 |
| 12/31/2017 | $10,792 | $11,069 | $10,996 | $10,879 |
| 1/31/2018 | $10,674 | $10,939 | $10,891 | $10,753 |
| 2/28/2018 | $10,616 | $10,906 | $10,849 | $10,651 |
| 3/31/2018 | $10,680 | $10,947 | $10,903 | $10,720 |
| 4/30/2018 | $10,629 | $10,908 | $10,868 | $10,640 |
| 5/31/2018 | $10,761 | $11,033 | $11,002 | $10,716 |
| 6/30/2018 | $10,769 | $11,042 | $11,017 | $10,703 |
| 7/31/2018 | $10,766 | $11,069 | $11,033 | $10,705 |
| 8/31/2018 | $10,812 | $11,097 | $11,059 | $10,774 |
| 9/30/2018 | $10,733 | $11,025 | $10,986 | $10,705 |
| 10/31/2018 | $10,644 | $10,957 | $10,895 | $10,620 |
| 11/30/2018 | $10,730 | $11,079 | $10,982 | $10,683 |
| 12/31/2018 | $10,829 | $11,211 | $11,095 | $10,880 |
| 1/31/2019 | $10,896 | $11,296 | $11,163 | $10,995 |
| 2/28/2019 | $10,985 | $11,357 | $11,235 | $10,989 |
| 3/31/2019 | $11,180 | $11,536 | $11,432 | $11,200 |
| 4/30/2019 | $11,247 | $11,579 | $11,485 | $11,203 |
| 5/31/2019 | $11,402 | $11,739 | $11,647 | $11,402 |
| 6/30/2019 | $11,439 | $11,782 | $11,684 | $11,545 |
| 7/31/2019 | $11,515 | $11,877 | $11,763 | $11,570 |
| 8/31/2019 | $11,729 | $12,065 | $11,976 | $11,870 |
| 9/30/2019 | $11,627 | $11,968 | $11,891 | $11,807 |
| 10/31/2019 | $11,613 | $11,989 | $11,876 | $11,842 |
| 11/30/2019 | $11,619 | $12,019 | $11,901 | $11,836 |
| 12/31/2019 | $11,655 | $12,056 | $11,933 | $11,828 |
| 1/31/2020 | $11,889 | $12,273 | $12,158 | $12,056 |
| 2/29/2020 | $12,085 | $12,431 | $12,347 | $12,273 |
| 3/31/2020 | $11,344 | $11,980 | $11,716 | $12,201 |
| 4/30/2020 | $11,011 | $11,830 | $11,408 | $12,417 |
| 5/31/2020 | $11,387 | $12,206 | $11,781 | $12,475 |
| 6/30/2020 | $11,624 | $12,307 | $11,959 | $12,554 |
| 7/31/2020 | $11,820 | $12,514 | $12,151 | $12,741 |
| 8/31/2020 | $11,746 | $12,455 | $12,095 | $12,638 |
| 9/30/2020 | $11,701 | $12,458 | $12,060 | $12,632 |
| 10/31/2020 | $11,687 | $12,420 | $12,036 | $12,575 |
| 11/30/2020 | $11,955 | $12,608 | $12,288 | $12,699 |
| 12/31/2020 | $12,094 | $12,685 | $12,419 | $12,716 |
| 1/31/2021 | $12,241 | $12,765 | $12,541 | $12,625 |
| 2/28/2021 | $12,015 | $12,563 | $12,333 | $12,443 |
| 3/31/2021 | $12,091 | $12,640 | $12,423 | $12,287 |
| 4/30/2021 | $12,259 | $12,746 | $12,572 | $12,384 |
| 5/31/2021 | $12,355 | $12,784 | $12,679 | $12,425 |
| 6/30/2021 | $12,431 | $12,819 | $12,750 | $12,512 |
| 7/31/2021 | $12,527 | $12,925 | $12,849 | $12,652 |
| 8/31/2021 | $12,440 | $12,878 | $12,781 | $12,628 |
| 9/30/2021 | $12,302 | $12,785 | $12,668 | $12,518 |
| 10/31/2021 | $12,276 | $12,748 | $12,656 | $12,515 |
| 11/30/2021 | $12,414 | $12,856 | $12,787 | $12,552 |
| 12/31/2021 | $12,428 | $12,877 | $12,810 | $12,520 |
| 1/31/2022 | $12,032 | $12,525 | $12,450 | $12,250 |
| 2/28/2022 | $11,926 | $12,480 | $12,368 | $12,114 |
| 3/31/2022 | $11,449 | $12,075 | $11,938 | $11,777 |
| 4/30/2022 | $11,014 | $11,741 | $11,540 | $11,330 |
| 5/31/2022 | $11,155 | $11,916 | $11,700 | $11,403 |
| 6/30/2022 | $10,802 | $11,720 | $11,386 | $11,224 |
| 7/31/2022 | $11,151 | $12,030 | $11,726 | $11,498 |
| 8/31/2022 | $10,827 | $11,766 | $11,412 | $11,174 |
| 9/30/2022 | $10,286 | $11,315 | $10,921 | $10,691 |
| 10/31/2022 | $10,129 | $11,221 | $10,773 | $10,552 |
| 11/30/2022 | $10,744 | $11,746 | $11,381 | $10,940 |
| 12/31/2022 | $10,722 | $11,779 | $11,357 | $10,891 |
| 1/31/2023 | $11,150 | $12,117 | $11,759 | $11,226 |
| 2/28/2023 | $10,848 | $11,843 | $11,466 | $10,936 |
| 3/31/2023 | $11,078 | $12,106 | $11,699 | $11,214 |
| 4/30/2023 | $11,089 | $12,079 | $11,710 | $11,282 |
| 5/31/2023 | $11,015 | $11,974 | $11,644 | $11,159 |
| 6/30/2023 | $11,153 | $12,094 | $11,760 | $11,119 |
| 7/31/2023 | $11,174 | $12,142 | $11,786 | $11,111 |
| 8/31/2023 | $10,994 | $11,967 | $11,602 | $11,040 |
| 9/30/2023 | $10,625 | $11,616 | $11,226 | $10,760 |
| 10/31/2023 | $10,403 | $11,517 | $11,018 | $10,590 |
| 11/30/2023 | $11,173 | $12,249 | $11,838 | $11,069 |
| 12/31/2023 | $11,517 | $12,533 | $12,186 | $11,493 |
| 1/31/2024 | $11,509 | $12,469 | $12,178 | $11,462 |
| 2/29/2024 | $11,522 | $12,485 | $12,190 | $11,300 |
| 3/31/2024 | $11,524 | $12,485 | $12,194 | $11,404 |
| 4/30/2024 | $11,387 | $12,330 | $12,044 | $11,116 |
| 5/31/2024 | $11,367 | $12,294 | $12,053 | $11,304 |
| 6/30/2024 | $11,554 | $12,482 | $12,275 | $11,412 |
| 7/31/2024 | $11,644 | $12,596 | $12,378 | $11,678 |
| 8/31/2024 | $11,701 | $12,696 | $12,455 | $11,846 |
| 9/30/2024 | $11,825 | $12,821 | $12,586 | $12,004 |
The Fund’s benchmarks are unmanaged indices used as a general measure of market performance. Calculations assume the reinvestment of dividends and capital gains.
Average Annual Total Returns (%)
| 1 Year | 5 Years | 10 Years |
|---|
| Class C at NAV | 11.29% | 0.34% | 1.69% |
| Class C with sales charge | 10.29% | 0.34% | 1.69% |
| Bloomberg Municipal Bond Index | 10.37% | 1.39% | 2.52% |
| Lipper New York Municipal Debt Funds Average | 12.11% | 1.14% | 2.33% |
Bloomberg Aggregate Bond IndexFootnote Reference* | 11.57% | 0.33% | 1.84% |
| Footnote | Description |
Footnote* | The Fund has adopted the Bloomberg Aggregate Bond Index as its broad-based securities market index. |
The Fund's past performance is no guarantee of future results. The returns do not reflect the deduction of taxes that a shareholder would pay on Fund distributions or redemption of Fund shares.
(as of September 30, 2024)
| Total Net Assets | $570,555,933 |
| # of Portfolio Holdings | 306 |
| Portfolio Turnover Rate | 18% |
| Total Advisory Fees Paid | $2,228,010 |
What did the Fund invest in?
(as of September 30, 2024)
Credit Rating S&P or Moody'sFootnote Reference(a) | %Footnote Reference** |
|---|
| |
- A6.04%
- A-8.36%
- A+2.63%
- AA13.76%
- AA-5.81%
- AA+15.61%
- AAA8.80%
- B0.30%
- B-0.74%
- B+0.92%
- BB1.53%
- BB-0.32%
- BB+0.55%
- BBB7.38%
- BBB-13.62%
- BBB+7.48%
- CCC+0.33%
- NR5.82%
- Total 100.00%
| Footnote | Description |
Footnote** | Represents percent of total investments, which excludes derivatives. |
Footnote(a) | Investments in investment grade municipal bonds, which as bonds that are rated, at the time of purchase, within the four highest grades assigned by an independent rating agency such as Moody’s, S&P, or Fitch, or an equivalent short-term rating, as applicable, or are unrated by rating agencies but deemed by Lord Abbett to be of comparable quality. Lower rated municipal bonds are rated, at the time of purchase, or an equivalent short-term rating, as applicable, by an independent rating agency or are unrated by rating agencies but deemed by Lord Abbett to be of comparable quality. |
There were no material fund changes during the period.
Where can I find additional information about the Fund?
For additional information about the Fund, including its Prospectus, Statement of Additional Information, financial statements, holdings and proxy information, please visit lordabbett.com/FundDocuments.
The Fund has adopted a policy that allows it to send only one copy of the Fund's prospectus, proxy material, annual report and semiannual report (or related notice of internet availability of annual report and semiannual report) to certain shareholders residing at the same "household." This reduces Fund expenses, which benefits you and other shareholders.If you need additional copies or do not want your mailings to be "householded," please call Lord Abbett at 888-522-2388.
Lord Abbett New York Tax Free Fund
Annual Shareholder Report
September 30, 2024
lordabbett.com/FundDocuments
TSR-A-671-C
11/24
Lord Abbett New York Tax Free Fund
Annual Shareholder Report
September 30, 2024
lordabbett.com/FundDocuments
This annual shareholder report contains important information about the Lord Abbett New York Tax Free Fund for the period of October 1, 2023 to September 30, 2024, as well as certain changes to the Fund. You can find additional information about the Fund at lordabbett.com/FundDocuments. You can also request this information by contacting us at 888-522-2388.
What were the Fund costs for the last year?
(based on a hypothetical $10,000 investment)
| Class Name | Costs of a $10,000 investment | Costs paid as a percentage of a $10,000 investment |
|---|
| Class F | $72 | 0.68% |
How did the Fund perform last year and what affected its performance?
For the fiscal year ended September 30, 2024, the Fund returned 12.07%, reflecting performance at the net asset value (NAV) of Class F shares, compared to the 10.37% of a securities market index with investment characteristics similar to those of the Fund, the Bloomberg Municipal Bond Index. The Fund's broad-based market index, the Bloomberg Aggregate Bond Index, returned 11.57% over the same period.
Positive factors for the municipal market included decreasing Treasury yields, easing inflationary pressures and the start of interest rate cuts by the U.S. Federal Reserve. Also supporting the market was increased demand for municipal bond funds and a strong fundamental backdrop as evidenced by growing tax revenue and positive ratings actions by public ratings agencies. Negative factors included a significant increase in municipal bond supply, which pressured the market in second half of the fiscal year, and periods of interest rate volatility driven by sticky inflation readings at points throughout the fiscal year. Against this backdrop, municipal bonds delivered strong returns.
Top contributors to the Fund’s performance: The Fund’s longer duration positioning contributed to relative performance with the fall in rates over the period. An overweight allocation to BBB-rated and non-investment grade bonds contributed to relative performance. An overweight allocation to the Education and Special Tax sectors contributed to relative performance.
Top detractors from the Fund’s performance: Security selection within the Special Tax, Leasing and Education sectors detracted from relative performance.
Total Return Based on $10,000 Investment
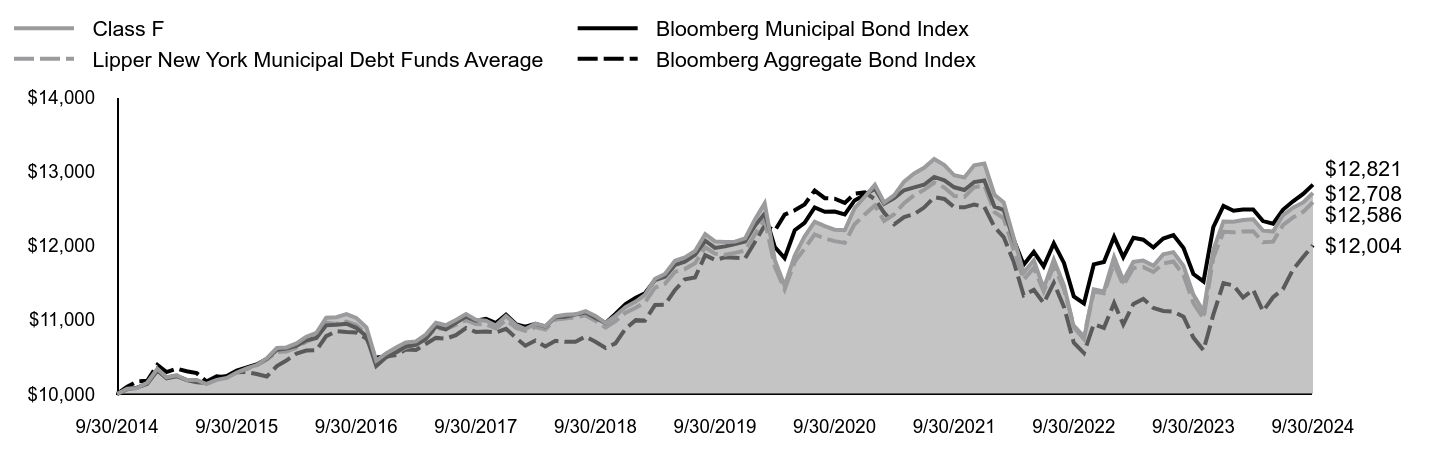
| Class F | Bloomberg Municipal Bond Index | Lipper New York Municipal Debt Funds Average | Bloomberg Aggregate Bond Index |
|---|
| 9/30/2014 | $10,000 | $10,000 | $10,000 | $10,000 |
| 10/31/2014 | $10,072 | $10,069 | $10,063 | $10,098 |
| 11/30/2014 | $10,080 | $10,086 | $10,078 | $10,170 |
| 12/31/2014 | $10,152 | $10,137 | $10,146 | $10,179 |
| 1/31/2015 | $10,341 | $10,316 | $10,328 | $10,393 |
| 2/28/2015 | $10,226 | $10,210 | $10,222 | $10,295 |
| 3/31/2015 | $10,253 | $10,240 | $10,250 | $10,343 |
| 4/30/2015 | $10,189 | $10,186 | $10,189 | $10,306 |
| 5/31/2015 | $10,190 | $10,158 | $10,181 | $10,281 |
| 6/30/2015 | $10,135 | $10,148 | $10,139 | $10,169 |
| 7/31/2015 | $10,190 | $10,222 | $10,204 | $10,240 |
| 8/31/2015 | $10,217 | $10,242 | $10,234 | $10,225 |
| 9/30/2015 | $10,290 | $10,316 | $10,294 | $10,294 |
| 10/31/2015 | $10,345 | $10,357 | $10,336 | $10,296 |
| 11/30/2015 | $10,390 | $10,398 | $10,385 | $10,269 |
| 12/31/2015 | $10,481 | $10,472 | $10,465 | $10,235 |
| 1/31/2016 | $10,619 | $10,596 | $10,565 | $10,376 |
| 2/29/2016 | $10,627 | $10,613 | $10,572 | $10,450 |
| 3/31/2016 | $10,681 | $10,647 | $10,624 | $10,546 |
| 4/30/2016 | $10,771 | $10,725 | $10,705 | $10,586 |
| 5/31/2016 | $10,824 | $10,754 | $10,758 | $10,589 |
| 6/30/2016 | $11,028 | $10,925 | $10,960 | $10,779 |
| 7/31/2016 | $11,034 | $10,932 | $10,946 | $10,847 |
| 8/31/2016 | $11,077 | $10,947 | $10,975 | $10,835 |
| 9/30/2016 | $11,025 | $10,892 | $10,929 | $10,829 |
| 10/31/2016 | $10,898 | $10,778 | $10,813 | $10,746 |
| 11/30/2016 | $10,449 | $10,376 | $10,416 | $10,492 |
| 12/31/2016 | $10,549 | $10,497 | $10,512 | $10,506 |
| 1/31/2017 | $10,631 | $10,567 | $10,561 | $10,527 |
| 2/28/2017 | $10,694 | $10,640 | $10,626 | $10,598 |
| 3/31/2017 | $10,709 | $10,663 | $10,661 | $10,592 |
| 4/30/2017 | $10,801 | $10,740 | $10,742 | $10,674 |
| 5/31/2017 | $10,959 | $10,911 | $10,891 | $10,756 |
| 6/30/2017 | $10,926 | $10,872 | $10,870 | $10,745 |
| 7/31/2017 | $10,998 | $10,960 | $10,929 | $10,792 |
| 8/31/2017 | $11,077 | $11,043 | $10,996 | $10,888 |
| 9/30/2017 | $11,002 | $10,987 | $10,944 | $10,836 |
| 10/31/2017 | $10,986 | $11,014 | $10,938 | $10,843 |
| 11/30/2017 | $10,922 | $10,955 | $10,884 | $10,829 |
| 12/31/2017 | $11,052 | $11,069 | $10,996 | $10,879 |
| 1/31/2018 | $10,929 | $10,939 | $10,891 | $10,753 |
| 2/28/2018 | $10,876 | $10,906 | $10,849 | $10,651 |
| 3/31/2018 | $10,948 | $10,947 | $10,903 | $10,720 |
| 4/30/2018 | $10,913 | $10,908 | $10,868 | $10,640 |
| 5/31/2018 | $11,045 | $11,033 | $11,002 | $10,716 |
| 6/30/2018 | $11,069 | $11,042 | $11,017 | $10,703 |
| 7/31/2018 | $11,073 | $11,069 | $11,033 | $10,705 |
| 8/31/2018 | $11,117 | $11,097 | $11,059 | $10,774 |
| 9/30/2018 | $11,052 | $11,025 | $10,986 | $10,705 |
| 10/31/2018 | $10,957 | $10,957 | $10,895 | $10,620 |
| 11/30/2018 | $11,053 | $11,079 | $10,982 | $10,683 |
| 12/31/2018 | $11,171 | $11,211 | $11,095 | $10,880 |
| 1/31/2019 | $11,246 | $11,296 | $11,163 | $10,995 |
| 2/28/2019 | $11,335 | $11,357 | $11,235 | $10,989 |
| 3/31/2019 | $11,552 | $11,536 | $11,432 | $11,200 |
| 4/30/2019 | $11,618 | $11,579 | $11,485 | $11,203 |
| 5/31/2019 | $11,795 | $11,739 | $11,647 | $11,402 |
| 6/30/2019 | $11,840 | $11,782 | $11,684 | $11,545 |
| 7/31/2019 | $11,926 | $11,877 | $11,763 | $11,570 |
| 8/31/2019 | $12,154 | $12,065 | $11,976 | $11,870 |
| 9/30/2019 | $12,056 | $11,968 | $11,891 | $11,807 |
| 10/31/2019 | $12,049 | $11,989 | $11,876 | $11,842 |
| 11/30/2019 | $12,053 | $12,019 | $11,901 | $11,836 |
| 12/31/2019 | $12,097 | $12,056 | $11,933 | $11,828 |
| 1/31/2020 | $12,358 | $12,273 | $12,158 | $12,056 |
| 2/29/2020 | $12,568 | $12,431 | $12,347 | $12,273 |
| 3/31/2020 | $11,807 | $11,980 | $11,716 | $12,201 |
| 4/30/2020 | $11,459 | $11,830 | $11,408 | $12,417 |
| 5/31/2020 | $11,867 | $12,206 | $11,781 | $12,475 |
| 6/30/2020 | $12,121 | $12,307 | $11,959 | $12,554 |
| 7/31/2020 | $12,322 | $12,514 | $12,151 | $12,741 |
| 8/31/2020 | $12,263 | $12,455 | $12,095 | $12,638 |
| 9/30/2020 | $12,214 | $12,458 | $12,060 | $12,632 |
| 10/31/2020 | $12,207 | $12,420 | $12,036 | $12,575 |
| 11/30/2020 | $12,505 | $12,608 | $12,288 | $12,699 |
| 12/31/2020 | $12,658 | $12,685 | $12,419 | $12,716 |
| 1/31/2021 | $12,819 | $12,765 | $12,541 | $12,625 |
| 2/28/2021 | $12,580 | $12,563 | $12,333 | $12,443 |
| 3/31/2021 | $12,678 | $12,640 | $12,423 | $12,287 |
| 4/30/2021 | $12,862 | $12,746 | $12,572 | $12,384 |
| 5/31/2021 | $12,971 | $12,784 | $12,679 | $12,425 |
| 6/30/2021 | $13,047 | $12,819 | $12,750 | $12,512 |
| 7/31/2021 | $13,167 | $12,925 | $12,849 | $12,652 |
| 8/31/2021 | $13,084 | $12,878 | $12,781 | $12,628 |
| 9/30/2021 | $12,947 | $12,785 | $12,668 | $12,518 |
| 10/31/2021 | $12,917 | $12,748 | $12,656 | $12,515 |
| 11/30/2021 | $13,081 | $12,856 | $12,787 | $12,552 |
| 12/31/2021 | $13,104 | $12,877 | $12,810 | $12,520 |
| 1/31/2022 | $12,685 | $12,525 | $12,450 | $12,250 |
| 2/28/2022 | $12,581 | $12,480 | $12,368 | $12,114 |
| 3/31/2022 | $12,097 | $12,075 | $11,938 | $11,777 |
| 4/30/2022 | $11,634 | $11,741 | $11,540 | $11,330 |
| 5/31/2022 | $11,801 | $11,916 | $11,700 | $11,403 |
| 6/30/2022 | $11,424 | $11,720 | $11,386 | $11,224 |
| 7/31/2022 | $11,811 | $12,030 | $11,726 | $11,498 |
| 8/31/2022 | $11,465 | $11,766 | $11,412 | $11,174 |
| 9/30/2022 | $10,900 | $11,315 | $10,921 | $10,691 |
| 10/31/2022 | $10,741 | $11,221 | $10,773 | $10,552 |
| 11/30/2022 | $11,409 | $11,746 | $11,381 | $10,940 |
| 12/31/2022 | $11,383 | $11,779 | $11,357 | $10,891 |
| 1/31/2023 | $11,843 | $12,117 | $11,759 | $11,226 |
| 2/28/2023 | $11,529 | $11,843 | $11,466 | $10,936 |
| 3/31/2023 | $11,781 | $12,106 | $11,699 | $11,214 |
| 4/30/2023 | $11,799 | $12,079 | $11,710 | $11,282 |
| 5/31/2023 | $11,728 | $11,974 | $11,644 | $11,159 |
| 6/30/2023 | $11,881 | $12,094 | $11,760 | $11,119 |
| 7/31/2023 | $11,911 | $12,142 | $11,786 | $11,111 |
| 8/31/2023 | $11,727 | $11,967 | $11,602 | $11,040 |
| 9/30/2023 | $11,340 | $11,616 | $11,226 | $10,760 |
| 10/31/2023 | $11,111 | $11,517 | $11,018 | $10,590 |
| 11/30/2023 | $11,939 | $12,249 | $11,838 | $11,069 |
| 12/31/2023 | $12,325 | $12,533 | $12,186 | $11,493 |
| 1/31/2024 | $12,322 | $12,469 | $12,178 | $11,462 |
| 2/29/2024 | $12,344 | $12,485 | $12,190 | $11,300 |
| 3/31/2024 | $12,354 | $12,485 | $12,194 | $11,404 |
| 4/30/2024 | $12,203 | $12,330 | $12,044 | $11,116 |
| 5/31/2024 | $12,189 | $12,294 | $12,053 | $11,304 |
| 6/30/2024 | $12,408 | $12,482 | $12,275 | $11,412 |
| 7/31/2024 | $12,511 | $12,596 | $12,378 | $11,678 |
| 8/31/2024 | $12,581 | $12,696 | $12,455 | $11,846 |
| 9/30/2024 | $12,708 | $12,821 | $12,586 | $12,004 |
The Fund’s benchmarks are unmanaged indices used as a general measure of market performance. Calculations assume the reinvestment of dividends and capital gains.
Average Annual Total Returns (%)
| 1 Year | 5 Years | 10 Years |
|---|
| Class F at NAV | 12.07% | 1.06% | 2.43% |
| Bloomberg Municipal Bond Index | 10.37% | 1.39% | 2.52% |
| Lipper New York Municipal Debt Funds Average | 12.11% | 1.14% | 2.33% |
Bloomberg Aggregate Bond IndexFootnote Reference* | 11.57% | 0.33% | 1.84% |
| Footnote | Description |
Footnote* | The Fund has adopted the Bloomberg Aggregate Bond Index as its broad-based securities market index. |
The Fund's past performance is no guarantee of future results. The returns do not reflect the deduction of taxes that a shareholder would pay on Fund distributions or redemption of Fund shares.
(as of September 30, 2024)
| Total Net Assets | $570,555,933 |
| # of Portfolio Holdings | 306 |
| Portfolio Turnover Rate | 18% |
| Total Advisory Fees Paid | $2,228,010 |
What did the Fund invest in?
(as of September 30, 2024)
Credit Rating S&P or Moody'sFootnote Reference(a) | %Footnote Reference** |
|---|
| |
- A6.04%
- A-8.36%
- A+2.63%
- AA13.76%
- AA-5.81%
- AA+15.61%
- AAA8.80%
- B0.30%
- B-0.74%
- B+0.92%
- BB1.53%
- BB-0.32%
- BB+0.55%
- BBB7.38%
- BBB-13.62%
- BBB+7.48%
- CCC+0.33%
- NR5.82%
- Total 100.00%
| Footnote | Description |
Footnote** | Represents percent of total investments, which excludes derivatives. |
Footnote(a) | Investments in investment grade municipal bonds, which as bonds that are rated, at the time of purchase, within the four highest grades assigned by an independent rating agency such as Moody’s, S&P, or Fitch, or an equivalent short-term rating, as applicable, or are unrated by rating agencies but deemed by Lord Abbett to be of comparable quality. Lower rated municipal bonds are rated, at the time of purchase, or an equivalent short-term rating, as applicable, by an independent rating agency or are unrated by rating agencies but deemed by Lord Abbett to be of comparable quality. |
There were no material fund changes during the period.
Where can I find additional information about the Fund?
For additional information about the Fund, including its Prospectus, Statement of Additional Information, financial statements, holdings and proxy information, please visit lordabbett.com/FundDocuments.
The Fund has adopted a policy that allows it to send only one copy of the Fund's prospectus, proxy material, annual report and semiannual report (or related notice of internet availability of annual report and semiannual report) to certain shareholders residing at the same "household." This reduces Fund expenses, which benefits you and other shareholders.If you need additional copies or do not want your mailings to be "householded," please call Lord Abbett at 888-522-2388.
Lord Abbett New York Tax Free Fund
Annual Shareholder Report
September 30, 2024
lordabbett.com/FundDocuments
TSR-A-1036-F
11/24
Lord Abbett New York Tax Free Fund
Annual Shareholder Report
September 30, 2024
lordabbett.com/FundDocuments
This annual shareholder report contains important information about the Lord Abbett New York Tax Free Fund for the period of October 1, 2023 to September 30, 2024, as well as certain changes to the Fund. You can find additional information about the Fund at lordabbett.com/FundDocuments. You can also request this information by contacting us at 888-522-2388.
What were the Fund costs for the last year?
(based on a hypothetical $10,000 investment)
| Class Name | Costs of a $10,000 investment | Costs paid as a percentage of a $10,000 investment |
|---|
| Class F3 | $57 | 0.54% |
How did the Fund perform last year and what affected its performance?
For the fiscal year ended September 30, 2024, the Fund returned 12.33%, reflecting performance at the net asset value (NAV) of Class F3 shares, compared to the 10.37% of a securities market index with investment characteristics similar to those of the Fund, the Bloomberg Municipal Bond Index. The Fund's broad-based market index, the Bloomberg Aggregate Bond Index, returned 11.57% over the same period.
Positive factors for the municipal market included decreasing Treasury yields, easing inflationary pressures and the start of interest rate cuts by the U.S. Federal Reserve. Also supporting the market was increased demand for municipal bond funds and a strong fundamental backdrop as evidenced by growing tax revenue and positive ratings actions by public ratings agencies. Negative factors included a significant increase in municipal bond supply, which pressured the market in second half of the fiscal year, and periods of interest rate volatility driven by sticky inflation readings at points throughout the fiscal year. Against this backdrop, municipal bonds delivered strong returns.
Top contributors to the Fund’s performance: The Fund’s longer duration positioning contributed to relative performance with the fall in rates over the period. An overweight allocation to BBB-rated and non-investment grade bonds contributed to relative performance. An overweight allocation to the Education and Special Tax sectors contributed to relative performance.
Top detractors from the Fund’s performance: Security selection within the Special Tax, Leasing and Education sectors detracted from relative performance.
Total Return Based on $10,000 Investment
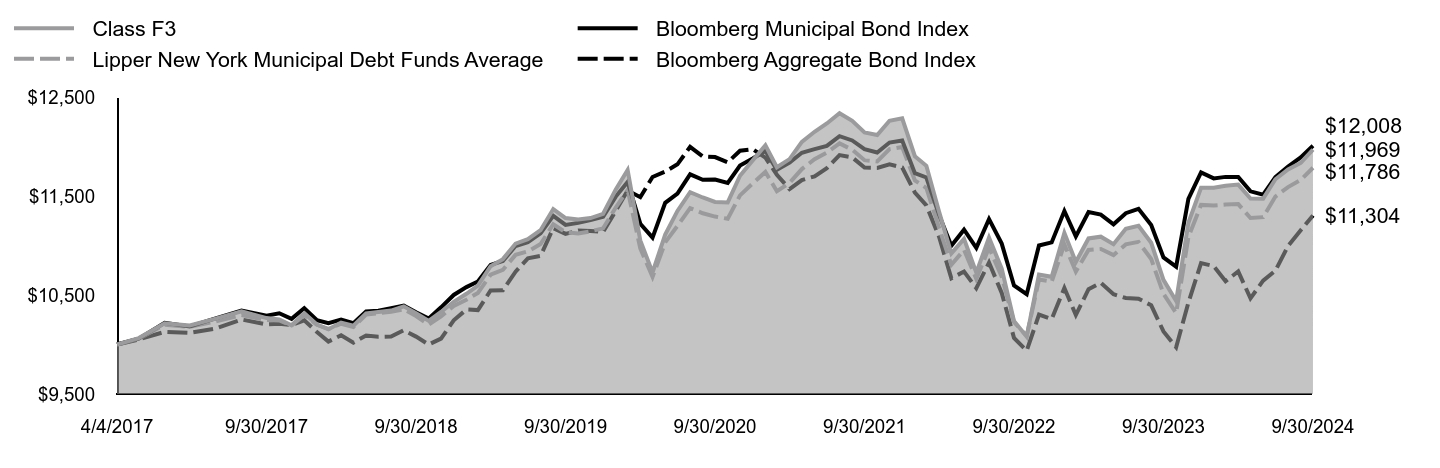
| Class F3 | Bloomberg Municipal Bond Index | Lipper New York Municipal Debt Funds Average | Bloomberg Aggregate Bond Index |
|---|
| 4/4/2017 | $10,000 | $10,000 | $10,000 | $10,000 |
| 4/30/2017 | $10,065 | $10,060 | $10,059 | $10,051 |
| 5/31/2017 | $10,214 | $10,219 | $10,199 | $10,128 |
| 6/30/2017 | $10,193 | $10,183 | $10,179 | $10,118 |
| 7/31/2017 | $10,261 | $10,265 | $10,234 | $10,162 |
| 8/31/2017 | $10,336 | $10,343 | $10,297 | $10,253 |
| 9/30/2017 | $10,267 | $10,291 | $10,248 | $10,204 |
| 10/31/2017 | $10,253 | $10,316 | $10,243 | $10,210 |
| 11/30/2017 | $10,194 | $10,260 | $10,192 | $10,197 |
| 12/31/2017 | $10,316 | $10,368 | $10,297 | $10,244 |
| 1/31/2018 | $10,202 | $10,246 | $10,199 | $10,126 |
| 2/28/2018 | $10,153 | $10,215 | $10,159 | $10,030 |
| 3/31/2018 | $10,222 | $10,253 | $10,210 | $10,094 |
| 4/30/2018 | $10,190 | $10,216 | $10,177 | $10,019 |
| 5/31/2018 | $10,315 | $10,333 | $10,302 | $10,091 |
| 6/30/2018 | $10,329 | $10,342 | $10,317 | $10,078 |
| 7/31/2018 | $10,343 | $10,367 | $10,331 | $10,080 |
| 8/31/2018 | $10,386 | $10,394 | $10,356 | $10,145 |
| 9/30/2018 | $10,317 | $10,326 | $10,287 | $10,080 |
| 10/31/2018 | $10,239 | $10,263 | $10,202 | $10,000 |
| 11/30/2018 | $10,329 | $10,376 | $10,284 | $10,060 |
| 12/31/2018 | $10,432 | $10,501 | $10,390 | $10,245 |
| 1/31/2019 | $10,513 | $10,580 | $10,453 | $10,354 |
| 2/28/2019 | $10,596 | $10,637 | $10,521 | $10,348 |
| 3/31/2019 | $10,791 | $10,805 | $10,705 | $10,546 |
| 4/30/2019 | $10,863 | $10,845 | $10,755 | $10,549 |
| 5/31/2019 | $11,020 | $10,995 | $10,906 | $10,736 |
| 6/30/2019 | $11,064 | $11,035 | $10,941 | $10,871 |
| 7/31/2019 | $11,155 | $11,124 | $11,015 | $10,895 |
| 8/31/2019 | $11,369 | $11,300 | $11,215 | $11,177 |
| 9/30/2019 | $11,278 | $11,209 | $11,135 | $11,118 |
| 10/31/2019 | $11,263 | $11,229 | $11,121 | $11,151 |
| 11/30/2019 | $11,278 | $11,257 | $11,144 | $11,146 |
| 12/31/2019 | $11,321 | $11,292 | $11,174 | $11,138 |
| 1/31/2020 | $11,566 | $11,495 | $11,385 | $11,352 |
| 2/29/2020 | $11,764 | $11,643 | $11,562 | $11,557 |
| 3/31/2020 | $11,052 | $11,221 | $10,971 | $11,489 |
| 4/30/2020 | $10,728 | $11,080 | $10,683 | $11,693 |
| 5/31/2020 | $11,111 | $11,432 | $11,032 | $11,747 |
| 6/30/2020 | $11,350 | $11,526 | $11,199 | $11,821 |
| 7/31/2020 | $11,540 | $11,720 | $11,378 | $11,998 |
| 8/31/2020 | $11,486 | $11,665 | $11,326 | $11,901 |
| 9/30/2020 | $11,441 | $11,668 | $11,293 | $11,894 |
| 10/31/2020 | $11,436 | $11,633 | $11,271 | $11,841 |
| 11/30/2020 | $11,706 | $11,808 | $11,507 | $11,958 |
| 12/31/2020 | $11,861 | $11,880 | $11,629 | $11,974 |
| 1/31/2021 | $12,013 | $11,956 | $11,744 | $11,888 |
| 2/28/2021 | $11,791 | $11,766 | $11,549 | $11,716 |
| 3/31/2021 | $11,874 | $11,839 | $11,633 | $11,570 |
| 4/30/2021 | $12,047 | $11,938 | $11,773 | $11,662 |
| 5/31/2021 | $12,150 | $11,974 | $11,873 | $11,700 |
| 6/30/2021 | $12,234 | $12,007 | $11,939 | $11,782 |
| 7/31/2021 | $12,337 | $12,106 | $12,032 | $11,914 |
| 8/31/2021 | $12,260 | $12,062 | $11,968 | $11,891 |
| 9/30/2021 | $12,144 | $11,975 | $11,863 | $11,788 |
| 10/31/2021 | $12,117 | $11,940 | $11,851 | $11,785 |
| 11/30/2021 | $12,261 | $12,041 | $11,974 | $11,820 |
| 12/31/2021 | $12,285 | $12,061 | $11,996 | $11,789 |
| 1/31/2022 | $11,903 | $11,731 | $11,658 | $11,535 |
| 2/28/2022 | $11,806 | $11,688 | $11,582 | $11,407 |
| 3/31/2022 | $11,343 | $11,310 | $11,179 | $11,090 |
| 4/30/2022 | $10,921 | $10,997 | $10,806 | $10,669 |
| 5/31/2022 | $11,068 | $11,160 | $10,956 | $10,738 |
| 6/30/2022 | $10,726 | $10,977 | $10,662 | $10,569 |
| 7/31/2022 | $11,080 | $11,267 | $10,980 | $10,828 |
| 8/31/2022 | $10,767 | $11,020 | $10,686 | $10,522 |
| 9/30/2022 | $10,238 | $10,597 | $10,227 | $10,067 |
| 10/31/2022 | $10,079 | $10,509 | $10,088 | $9,937 |
| 11/30/2022 | $10,708 | $11,001 | $10,657 | $10,302 |
| 12/31/2022 | $10,684 | $11,032 | $10,635 | $10,256 |
| 1/31/2023 | $11,128 | $11,349 | $11,011 | $10,571 |
| 2/28/2023 | $10,834 | $11,093 | $10,737 | $10,298 |
| 3/31/2023 | $11,072 | $11,339 | $10,955 | $10,559 |
| 4/30/2023 | $11,090 | $11,313 | $10,965 | $10,623 |
| 5/31/2023 | $11,014 | $11,215 | $10,904 | $10,508 |
| 6/30/2023 | $11,170 | $11,327 | $11,012 | $10,470 |
| 7/31/2023 | $11,200 | $11,372 | $11,037 | $10,463 |
| 8/31/2023 | $11,028 | $11,208 | $10,864 | $10,396 |
| 9/30/2023 | $10,654 | $10,880 | $10,512 | $10,132 |
| 10/31/2023 | $10,440 | $10,787 | $10,317 | $9,972 |
| 11/30/2023 | $11,231 | $11,472 | $11,085 | $10,424 |
| 12/31/2023 | $11,584 | $11,739 | $11,411 | $10,823 |
| 1/31/2024 | $11,584 | $11,679 | $11,404 | $10,793 |
| 2/29/2024 | $11,605 | $11,694 | $11,415 | $10,640 |
| 3/31/2024 | $11,616 | $11,693 | $11,419 | $10,739 |
| 4/30/2024 | $11,475 | $11,548 | $11,278 | $10,467 |
| 5/31/2024 | $11,474 | $11,515 | $11,287 | $10,645 |
| 6/30/2024 | $11,670 | $11,691 | $11,495 | $10,746 |
| 7/31/2024 | $11,769 | $11,798 | $11,591 | $10,997 |
| 8/31/2024 | $11,836 | $11,891 | $11,663 | $11,155 |
| 9/30/2024 | $11,969 | $12,008 | $11,786 | $11,304 |
The Fund’s benchmarks are unmanaged indices used as a general measure of market performance. Calculations assume the reinvestment of dividends and capital gains.
Average Annual Total Returns (%)
| 1 Year | 5 Years | Since Inception 4/4/17 |
|---|
| Class F3 at NAV | 12.33% | 1.20% | 2.43% |
| Bloomberg Municipal Bond Index | 10.37% | 1.39% | 2.47% |
| Lipper New York Municipal Debt Funds Average | 12.11% | 1.14% | 2.22% |
Bloomberg Aggregate Bond IndexFootnote Reference* | 11.57% | 0.33% | 1.65% |
| Footnote | Description |
Footnote* | The Fund has adopted the Bloomberg Aggregate Bond Index as its broad-based securities market index. |
The Fund's past performance is no guarantee of future results. The returns do not reflect the deduction of taxes that a shareholder would pay on Fund distributions or redemption of Fund shares.
(as of September 30, 2024)
| Total Net Assets | $570,555,933 |
| # of Portfolio Holdings | 306 |
| Portfolio Turnover Rate | 18% |
| Total Advisory Fees Paid | $2,228,010 |
What did the Fund invest in?
(as of September 30, 2024)
Credit Rating S&P or Moody'sFootnote Reference(a) | %Footnote Reference** |
|---|
| |
- A6.04%
- A-8.36%
- A+2.63%
- AA13.76%
- AA-5.81%
- AA+15.61%
- AAA8.80%
- B0.30%
- B-0.74%
- B+0.92%
- BB1.53%
- BB-0.32%
- BB+0.55%
- BBB7.38%
- BBB-13.62%
- BBB+7.48%
- CCC+0.33%
- NR5.82%
- Total 100.00%
| Footnote | Description |
Footnote** | Represents percent of total investments, which excludes derivatives. |
Footnote(a) | Investments in investment grade municipal bonds, which as bonds that are rated, at the time of purchase, within the four highest grades assigned by an independent rating agency such as Moody’s, S&P, or Fitch, or an equivalent short-term rating, as applicable, or are unrated by rating agencies but deemed by Lord Abbett to be of comparable quality. Lower rated municipal bonds are rated, at the time of purchase, or an equivalent short-term rating, as applicable, by an independent rating agency or are unrated by rating agencies but deemed by Lord Abbett to be of comparable quality. |
There were no material fund changes during the period.
Where can I find additional information about the Fund?
For additional information about the Fund, including its Prospectus, Statement of Additional Information, financial statements, holdings and proxy information, please visit lordabbett.com/FundDocuments.
The Fund has adopted a policy that allows it to send only one copy of the Fund's prospectus, proxy material, annual report and semiannual report (or related notice of internet availability of annual report and semiannual report) to certain shareholders residing at the same "household." This reduces Fund expenses, which benefits you and other shareholders.If you need additional copies or do not want your mailings to be "householded," please call Lord Abbett at 888-522-2388.
Lord Abbett New York Tax Free Fund
Annual Shareholder Report
September 30, 2024
lordabbett.com/FundDocuments
TSR-A-8990-F3
11/24
Lord Abbett New York Tax Free Fund
Annual Shareholder Report
September 30, 2024
lordabbett.com/FundDocuments
This annual shareholder report contains important information about the Lord Abbett New York Tax Free Fund for the period of October 1, 2023 to September 30, 2024, as well as certain changes to the Fund. You can find additional information about the Fund at lordabbett.com/FundDocuments. You can also request this information by contacting us at 888-522-2388.
What were the Fund costs for the last year?
(based on a hypothetical $10,000 investment)
| Class Name | Costs of a $10,000 investment | Costs paid as a percentage of a $10,000 investment |
|---|
| Class I | $62 | 0.58% |
How did the Fund perform last year and what affected its performance?
For the fiscal year ended September 30, 2024, the Fund returned 12.29%, reflecting performance at the net asset value (NAV) of Class I shares, compared to the 10.37% of a securities market index with investment characteristics similar to those of the Fund, the Bloomberg Municipal Bond Index. The Fund's broad-based market index, the Bloomberg Aggregate Bond Index, returned 11.57% over the same period.
Positive factors for the municipal market included decreasing Treasury yields, easing inflationary pressures and the start of interest rate cuts by the U.S. Federal Reserve. Also supporting the market was increased demand for municipal bond funds and a strong fundamental backdrop as evidenced by growing tax revenue and positive ratings actions by public ratings agencies. Negative factors included a significant increase in municipal bond supply, which pressured the market in second half of the fiscal year, and periods of interest rate volatility driven by sticky inflation readings at points throughout the fiscal year. Against this backdrop, municipal bonds delivered strong returns.
Top contributors to the Fund’s performance: The Fund’s longer duration positioning contributed to relative performance with the fall in rates over the period. An overweight allocation to BBB-rated and non-investment grade bonds contributed to relative performance. An overweight allocation to the Education and Special Tax sectors contributed to relative performance.
Top detractors from the Fund’s performance: Security selection within the Special Tax, Leasing and Education sectors detracted from relative performance.
Total Return Based on $10,000 Investment
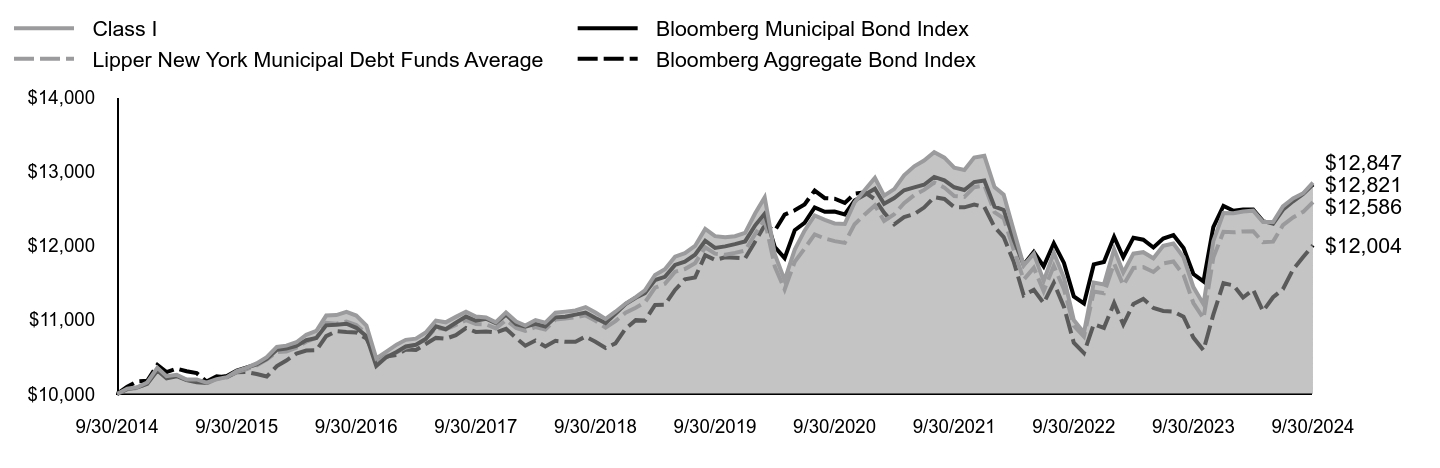
| Class I | Bloomberg Municipal Bond Index | Lipper New York Municipal Debt Funds Average | Bloomberg Aggregate Bond Index |
|---|
| 9/30/2014 | $10,000 | $10,000 | $10,000 | $10,000 |
| 10/31/2014 | $10,073 | $10,069 | $10,063 | $10,098 |
| 11/30/2014 | $10,091 | $10,086 | $10,078 | $10,170 |
| 12/31/2014 | $10,155 | $10,137 | $10,146 | $10,179 |
| 1/31/2015 | $10,354 | $10,316 | $10,328 | $10,393 |
| 2/28/2015 | $10,239 | $10,210 | $10,222 | $10,295 |
| 3/31/2015 | $10,258 | $10,240 | $10,250 | $10,343 |
| 4/30/2015 | $10,196 | $10,186 | $10,189 | $10,306 |
| 5/31/2015 | $10,197 | $10,158 | $10,181 | $10,281 |
| 6/30/2015 | $10,152 | $10,148 | $10,139 | $10,169 |
| 7/31/2015 | $10,199 | $10,222 | $10,204 | $10,240 |
| 8/31/2015 | $10,227 | $10,242 | $10,234 | $10,225 |
| 9/30/2015 | $10,310 | $10,316 | $10,294 | $10,294 |
| 10/31/2015 | $10,356 | $10,357 | $10,336 | $10,296 |
| 11/30/2015 | $10,412 | $10,398 | $10,385 | $10,269 |
| 12/31/2015 | $10,495 | $10,472 | $10,465 | $10,235 |
| 1/31/2016 | $10,634 | $10,596 | $10,565 | $10,376 |
| 2/29/2016 | $10,652 | $10,613 | $10,572 | $10,450 |
| 3/31/2016 | $10,697 | $10,647 | $10,624 | $10,546 |
| 4/30/2016 | $10,798 | $10,725 | $10,705 | $10,586 |
| 5/31/2016 | $10,852 | $10,754 | $10,758 | $10,589 |
| 6/30/2016 | $11,057 | $10,925 | $10,960 | $10,779 |
| 7/31/2016 | $11,064 | $10,932 | $10,946 | $10,847 |
| 8/31/2016 | $11,108 | $10,947 | $10,975 | $10,835 |
| 9/30/2016 | $11,057 | $10,892 | $10,929 | $10,829 |
| 10/31/2016 | $10,921 | $10,778 | $10,813 | $10,746 |
| 11/30/2016 | $10,481 | $10,376 | $10,416 | $10,492 |
| 12/31/2016 | $10,572 | $10,497 | $10,512 | $10,506 |
| 1/31/2017 | $10,665 | $10,567 | $10,561 | $10,527 |
| 2/28/2017 | $10,730 | $10,640 | $10,626 | $10,598 |
| 3/31/2017 | $10,746 | $10,663 | $10,661 | $10,592 |
| 4/30/2017 | $10,829 | $10,740 | $10,742 | $10,674 |
| 5/31/2017 | $10,989 | $10,911 | $10,891 | $10,756 |
| 6/30/2017 | $10,966 | $10,872 | $10,870 | $10,745 |
| 7/31/2017 | $11,039 | $10,960 | $10,929 | $10,792 |
| 8/31/2017 | $11,110 | $11,043 | $10,996 | $10,888 |
| 9/30/2017 | $11,045 | $10,987 | $10,944 | $10,836 |
| 10/31/2017 | $11,030 | $11,014 | $10,938 | $10,843 |
| 11/30/2017 | $10,967 | $10,955 | $10,884 | $10,829 |
| 12/31/2017 | $11,099 | $11,069 | $10,996 | $10,879 |
| 1/31/2018 | $10,976 | $10,939 | $10,891 | $10,753 |
| 2/28/2018 | $10,923 | $10,906 | $10,849 | $10,651 |
| 3/31/2018 | $10,996 | $10,947 | $10,903 | $10,720 |
| 4/30/2018 | $10,962 | $10,908 | $10,868 | $10,640 |
| 5/31/2018 | $11,095 | $11,033 | $11,002 | $10,716 |
| 6/30/2018 | $11,110 | $11,042 | $11,017 | $10,703 |
| 7/31/2018 | $11,125 | $11,069 | $11,033 | $10,705 |
| 8/31/2018 | $11,171 | $11,097 | $11,059 | $10,774 |
| 9/30/2018 | $11,097 | $11,025 | $10,986 | $10,705 |
| 10/31/2018 | $11,012 | $10,957 | $10,895 | $10,620 |
| 11/30/2018 | $11,109 | $11,079 | $10,982 | $10,683 |
| 12/31/2018 | $11,219 | $11,211 | $11,095 | $10,880 |
| 1/31/2019 | $11,305 | $11,296 | $11,163 | $10,995 |
| 2/28/2019 | $11,395 | $11,357 | $11,235 | $10,989 |
| 3/31/2019 | $11,604 | $11,536 | $11,432 | $11,200 |
| 4/30/2019 | $11,681 | $11,579 | $11,485 | $11,203 |
| 5/31/2019 | $11,850 | $11,739 | $11,647 | $11,402 |
| 6/30/2019 | $11,897 | $11,782 | $11,684 | $11,545 |
| 7/31/2019 | $11,995 | $11,877 | $11,763 | $11,570 |
| 8/31/2019 | $12,225 | $12,065 | $11,976 | $11,870 |
| 9/30/2019 | $12,127 | $11,968 | $11,891 | $11,807 |
| 10/31/2019 | $12,111 | $11,989 | $11,876 | $11,842 |
| 11/30/2019 | $12,126 | $12,019 | $11,901 | $11,836 |
| 12/31/2019 | $12,172 | $12,056 | $11,933 | $11,828 |
| 1/31/2020 | $12,435 | $12,273 | $12,158 | $12,056 |
| 2/29/2020 | $12,648 | $12,431 | $12,347 | $12,273 |
| 3/31/2020 | $11,883 | $11,980 | $11,716 | $12,201 |
| 4/30/2020 | $11,533 | $11,830 | $11,408 | $12,417 |
| 5/31/2020 | $11,945 | $12,206 | $11,781 | $12,475 |
| 6/30/2020 | $12,201 | $12,307 | $11,959 | $12,554 |
| 7/31/2020 | $12,405 | $12,514 | $12,151 | $12,741 |
| 8/31/2020 | $12,346 | $12,455 | $12,095 | $12,638 |
| 9/30/2020 | $12,298 | $12,458 | $12,060 | $12,632 |
| 10/31/2020 | $12,292 | $12,420 | $12,036 | $12,575 |
| 11/30/2020 | $12,582 | $12,608 | $12,288 | $12,699 |
| 12/31/2020 | $12,748 | $12,685 | $12,419 | $12,716 |
| 1/31/2021 | $12,911 | $12,765 | $12,541 | $12,625 |
| 2/28/2021 | $12,672 | $12,563 | $12,333 | $12,443 |
| 3/31/2021 | $12,761 | $12,640 | $12,423 | $12,287 |
| 4/30/2021 | $12,946 | $12,746 | $12,572 | $12,384 |
| 5/31/2021 | $13,068 | $12,784 | $12,679 | $12,425 |
| 6/30/2021 | $13,146 | $12,819 | $12,750 | $12,512 |
| 7/31/2021 | $13,258 | $12,925 | $12,849 | $12,652 |
| 8/31/2021 | $13,185 | $12,878 | $12,781 | $12,628 |
| 9/30/2021 | $13,049 | $12,785 | $12,668 | $12,518 |
| 10/31/2021 | $13,019 | $12,748 | $12,656 | $12,515 |
| 11/30/2021 | $13,185 | $12,856 | $12,787 | $12,552 |
| 12/31/2021 | $13,210 | $12,877 | $12,810 | $12,520 |
| 1/31/2022 | $12,789 | $12,525 | $12,450 | $12,250 |
| 2/28/2022 | $12,685 | $12,480 | $12,368 | $12,114 |
| 3/31/2022 | $12,198 | $12,075 | $11,938 | $11,777 |
| 4/30/2022 | $11,733 | $11,741 | $11,540 | $11,330 |
| 5/31/2022 | $11,891 | $11,916 | $11,700 | $11,403 |
| 6/30/2022 | $11,523 | $11,720 | $11,386 | $11,224 |
| 7/31/2022 | $11,903 | $12,030 | $11,726 | $11,498 |
| 8/31/2022 | $11,566 | $11,766 | $11,412 | $11,174 |
| 9/30/2022 | $10,997 | $11,315 | $10,921 | $10,691 |
| 10/31/2022 | $10,826 | $11,221 | $10,773 | $10,552 |
| 11/30/2022 | $11,501 | $11,746 | $11,381 | $10,940 |
| 12/31/2022 | $11,475 | $11,779 | $11,357 | $10,891 |
| 1/31/2023 | $11,952 | $12,117 | $11,759 | $11,226 |
| 2/28/2023 | $11,636 | $11,843 | $11,466 | $10,936 |
| 3/31/2023 | $11,891 | $12,106 | $11,699 | $11,214 |
| 4/30/2023 | $11,911 | $12,079 | $11,710 | $11,282 |
| 5/31/2023 | $11,828 | $11,974 | $11,644 | $11,159 |
| 6/30/2023 | $11,996 | $12,094 | $11,760 | $11,119 |
| 7/31/2023 | $12,027 | $12,142 | $11,786 | $11,111 |
| 8/31/2023 | $11,842 | $11,967 | $11,602 | $11,040 |
| 9/30/2023 | $11,441 | $11,616 | $11,226 | $10,760 |
| 10/31/2023 | $11,210 | $11,517 | $11,018 | $10,590 |
| 11/30/2023 | $12,059 | $12,249 | $11,838 | $11,069 |
| 12/31/2023 | $12,438 | $12,533 | $12,186 | $11,493 |
| 1/31/2024 | $12,437 | $12,469 | $12,178 | $11,462 |
| 2/29/2024 | $12,460 | $12,485 | $12,190 | $11,300 |
| 3/31/2024 | $12,470 | $12,485 | $12,194 | $11,404 |
| 4/30/2024 | $12,319 | $12,330 | $12,044 | $11,116 |
| 5/31/2024 | $12,318 | $12,294 | $12,053 | $11,304 |
| 6/30/2024 | $12,528 | $12,482 | $12,275 | $11,412 |
| 7/31/2024 | $12,634 | $12,596 | $12,378 | $11,678 |
| 8/31/2024 | $12,705 | $12,696 | $12,455 | $11,846 |
| 9/30/2024 | $12,847 | $12,821 | $12,586 | $12,004 |
The Fund’s benchmarks are unmanaged indices used as a general measure of market performance. Calculations assume the reinvestment of dividends and capital gains.
Average Annual Total Returns (%)
| 1 Year | 5 Years | 10 Years |
|---|
| Class I at NAV | 12.29% | 1.16% | 2.54% |
| Bloomberg Municipal Bond Index | 10.37% | 1.39% | 2.52% |
| Lipper New York Municipal Debt Funds Average | 12.11% | 1.14% | 2.33% |
Bloomberg Aggregate Bond IndexFootnote Reference* | 11.57% | 0.33% | 1.84% |
| Footnote | Description |
Footnote* | The Fund has adopted the Bloomberg Aggregate Bond Index as its broad-based securities market index. |
The Fund's past performance is no guarantee of future results. The returns do not reflect the deduction of taxes that a shareholder would pay on Fund distributions or redemption of Fund shares.
(as of September 30, 2024)
| Total Net Assets | $570,555,933 |
| # of Portfolio Holdings | 306 |
| Portfolio Turnover Rate | 18% |
| Total Advisory Fees Paid | $2,228,010 |
What did the Fund invest in?
(as of September 30, 2024)
Credit Rating S&P or Moody'sFootnote Reference(a) | %Footnote Reference** |
|---|
| |
- A6.04%
- A-8.36%
- A+2.63%
- AA13.76%
- AA-5.81%
- AA+15.61%
- AAA8.80%
- B0.30%
- B-0.74%
- B+0.92%
- BB1.53%
- BB-0.32%
- BB+0.55%
- BBB7.38%
- BBB-13.62%
- BBB+7.48%
- CCC+0.33%
- NR5.82%
- Total 100.00%
| Footnote | Description |
Footnote** | Represents percent of total investments, which excludes derivatives. |
Footnote(a) | Investments in investment grade municipal bonds, which as bonds that are rated, at the time of purchase, within the four highest grades assigned by an independent rating agency such as Moody’s, S&P, or Fitch, or an equivalent short-term rating, as applicable, or are unrated by rating agencies but deemed by Lord Abbett to be of comparable quality. Lower rated municipal bonds are rated, at the time of purchase, or an equivalent short-term rating, as applicable, by an independent rating agency or are unrated by rating agencies but deemed by Lord Abbett to be of comparable quality. |
There were no material fund changes during the period.
Where can I find additional information about the Fund?
For additional information about the Fund, including its Prospectus, Statement of Additional Information, financial statements, holdings and proxy information, please visit lordabbett.com/FundDocuments.
The Fund has adopted a policy that allows it to send only one copy of the Fund's prospectus, proxy material, annual report and semiannual report (or related notice of internet availability of annual report and semiannual report) to certain shareholders residing at the same "household." This reduces Fund expenses, which benefits you and other shareholders.If you need additional copies or do not want your mailings to be "householded," please call Lord Abbett at 888-522-2388.
Lord Abbett New York Tax Free Fund
Annual Shareholder Report
September 30, 2024
lordabbett.com/FundDocuments
TSR-A-3328-I
11/24
Lord Abbett Short Duration High Income Municipal Bond Fund
Annual Shareholder Report
September 30, 2024
lordabbett.com/FundDocuments
This annual shareholder report contains important information about the Lord Abbett Short Duration High Income Municipal Bond Fund for the period of October 1, 2023 to September 30, 2024, as well as certain changes to the Fund. You can find additional information about the Fund at lordabbett.com/FundDocuments. You can also request this information by contacting us at 888-522-2388.
What were the Fund costs for the last year?
(based on a hypothetical $10,000 investment)
| Class Name | Costs of a $10,000 investment | Costs paid as a percentage of a $10,000 investment |
|---|
| Class A | $68 | 0.65% |
How did the Fund perform last year and what affected its performance?
For the fiscal year ended September 30, 2024, the Fund returned 8.74%, reflecting performance at the net asset value (NAV) of Class A shares, compared to the 6.93% of a securities market index with investment characteristics similar to those of the Fund, the Bloomberg Municipal Bond 1-8 Year Index. The Fund's broad-based market index, the Bloomberg Aggregate Bond Index, returned 11.57% over the same period.
Positive factors for the municipal market included decreasing Treasury yields, easing inflationary pressures and the start of interest rate cuts by the U.S. Federal Reserve. Also supporting the market was increased demand for municipal bond funds and a strong fundamental backdrop as evidenced by growing tax revenue and positive ratings actions by public ratings agencies. Negative factors included a significant increase in municipal bond supply, which pressured the market in second half of the fiscal year, and periods of interest rate volatility driven by sticky inflation readings at points throughout the fiscal year. Against this backdrop, municipal bonds delivered strong returns.
Top contributors to the Fund’s performance: An overweight allocation to BBB-rated and non-investment grade bonds contributed to relative performance. The Fund’s longer duration positioning relative to the prospectus benchmark led to a positive impact as yields fell over the period. An overweight allocation to the Health Care sector contributed to relative performance. Security selection within the Local General Obligation and Health Care sectors contributed to relative performance.
Top detractors from the Fund’s performance: While the Fund’s overall sector allocation led to a positive impact, an overweight allocation to the Industrial Development sector detracted from relative performance.
Total Return Based on $10,000 Investment
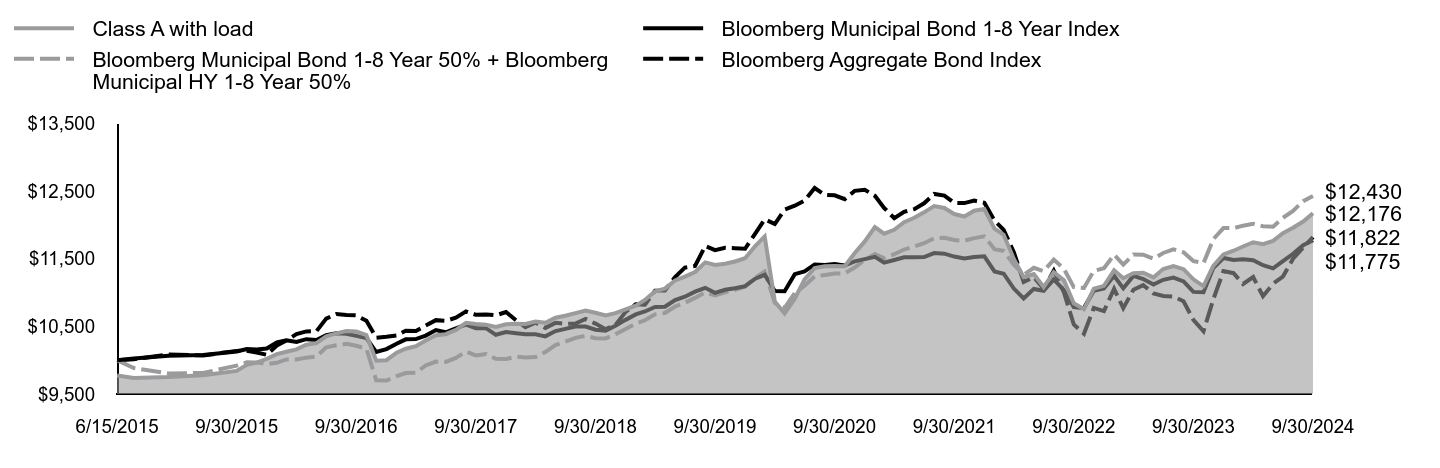
| Class A with load | Bloomberg Municipal Bond 1-8 Year Index | Bloomberg Municipal Bond 1-8 Year 50% + Bloomberg Municipal HY 1-8 Year 50% | Bloomberg Aggregate Bond Index |
|---|
| 6/15/2015 | $9,773 | $10,000 | $10,000 | $10,000 |
| 6/30/2015 | $9,737 | $10,025 | $9,884 | $10,015 |
| 7/31/2015 | $9,751 | $10,067 | $9,804 | $10,084 |
| 8/31/2015 | $9,779 | $10,078 | $9,812 | $10,070 |
| 9/30/2015 | $9,842 | $10,128 | $9,920 | $10,138 |
| 10/31/2015 | $9,931 | $10,166 | $9,969 | $10,140 |
| 11/30/2015 | $9,965 | $10,159 | $9,968 | $10,113 |
| 12/31/2015 | $10,020 | $10,174 | $9,941 | $10,080 |
| 1/31/2016 | $10,090 | $10,265 | $9,962 | $10,219 |
| 2/29/2016 | $10,126 | $10,295 | $10,011 | $10,291 |
| 3/31/2016 | $10,161 | $10,271 | $10,012 | $10,386 |
| 4/30/2016 | $10,230 | $10,311 | $10,038 | $10,426 |
| 5/31/2016 | $10,252 | $10,300 | $10,054 | $10,428 |
| 6/30/2016 | $10,354 | $10,371 | $10,192 | $10,616 |
| 7/31/2016 | $10,397 | $10,400 | $10,220 | $10,683 |
| 8/31/2016 | $10,431 | $10,391 | $10,242 | $10,670 |
| 9/30/2016 | $10,425 | $10,360 | $10,214 | $10,664 |
| 10/31/2016 | $10,373 | $10,328 | $10,169 | $10,583 |
| 11/30/2016 | $9,992 | $10,121 | $9,702 | $10,332 |
| 12/31/2016 | $10,000 | $10,165 | $9,700 | $10,347 |
| 1/31/2017 | $10,112 | $10,243 | $9,764 | $10,367 |
| 2/28/2017 | $10,170 | $10,309 | $9,810 | $10,437 |
| 3/31/2017 | $10,207 | $10,312 | $9,815 | $10,431 |
| 4/30/2017 | $10,291 | $10,365 | $9,922 | $10,512 |
| 5/31/2017 | $10,369 | $10,446 | $9,980 | $10,593 |
| 6/30/2017 | $10,385 | $10,413 | $9,975 | $10,582 |
| 7/31/2017 | $10,449 | $10,472 | $10,034 | $10,628 |
| 8/31/2017 | $10,554 | $10,525 | $10,128 | $10,723 |
| 9/30/2017 | $10,536 | $10,473 | $10,070 | $10,672 |
| 10/31/2017 | $10,524 | $10,474 | $10,092 | $10,678 |
| 11/30/2017 | $10,492 | $10,376 | $10,021 | $10,664 |
| 12/31/2017 | $10,531 | $10,416 | $10,019 | $10,713 |
| 1/31/2018 | $10,540 | $10,400 | $10,052 | $10,590 |
| 2/28/2018 | $10,537 | $10,386 | $10,041 | $10,490 |
| 3/31/2018 | $10,573 | $10,384 | $10,046 | $10,557 |
| 4/30/2018 | $10,555 | $10,353 | $10,120 | $10,478 |
| 5/31/2018 | $10,628 | $10,431 | $10,225 | $10,553 |
| 6/30/2018 | $10,659 | $10,464 | $10,276 | $10,540 |
| 7/31/2018 | $10,697 | $10,499 | $10,330 | $10,543 |
| 8/31/2018 | $10,735 | $10,498 | $10,361 | $10,610 |
| 9/30/2018 | $10,703 | $10,451 | $10,325 | $10,542 |
| 10/31/2018 | $10,664 | $10,438 | $10,323 | $10,459 |
| 11/30/2018 | $10,697 | $10,510 | $10,384 | $10,521 |
| 12/31/2018 | $10,752 | $10,597 | $10,461 | $10,715 |
| 1/31/2019 | $10,807 | $10,677 | $10,542 | $10,828 |
| 2/28/2019 | $10,892 | $10,721 | $10,591 | $10,822 |
| 3/31/2019 | $11,019 | $10,787 | $10,679 | $11,030 |
| 4/30/2019 | $11,060 | $10,792 | $10,698 | $11,033 |
| 5/31/2019 | $11,180 | $10,889 | $10,795 | $11,229 |
| 6/30/2019 | $11,236 | $10,939 | $10,850 | $11,370 |
| 7/31/2019 | $11,306 | $11,014 | $10,922 | $11,395 |
| 8/31/2019 | $11,448 | $11,071 | $11,004 | $11,690 |
| 9/30/2019 | $11,409 | $10,997 | $10,959 | $11,628 |
| 10/31/2019 | $11,428 | $11,042 | $11,004 | $11,663 |
| 11/30/2019 | $11,461 | $11,066 | $11,040 | $11,657 |
| 12/31/2019 | $11,510 | $11,095 | $11,087 | $11,649 |
| 1/31/2020 | $11,689 | $11,206 | $11,220 | $11,873 |
| 2/29/2020 | $11,832 | $11,264 | $11,312 | $12,086 |
| 3/31/2020 | $10,867 | $11,025 | $10,849 | $12,015 |
| 4/30/2020 | $10,692 | $11,020 | $10,775 | $12,229 |
| 5/31/2020 | $10,910 | $11,274 | $10,993 | $12,286 |
| 6/30/2020 | $11,197 | $11,313 | $11,103 | $12,363 |
| 7/31/2020 | $11,364 | $11,417 | $11,240 | $12,548 |
| 8/31/2020 | $11,390 | $11,410 | $11,260 | $12,447 |
| 9/30/2020 | $11,395 | $11,424 | $11,283 | $12,440 |
| 10/31/2020 | $11,391 | $11,403 | $11,285 | $12,384 |
| 11/30/2020 | $11,583 | $11,463 | $11,372 | $12,506 |
| 12/31/2020 | $11,758 | $11,496 | $11,483 | $12,523 |
| 1/31/2021 | $11,970 | $11,530 | $11,573 | $12,433 |
| 2/28/2021 | $11,872 | $11,444 | $11,509 | $12,254 |
| 3/31/2021 | $11,930 | $11,482 | $11,569 | $12,101 |
| 4/30/2021 | $12,042 | $11,522 | $11,638 | $12,196 |
| 5/31/2021 | $12,107 | $11,525 | $11,681 | $12,236 |
| 6/30/2021 | $12,188 | $11,527 | $11,732 | $12,322 |
| 7/31/2021 | $12,282 | $11,585 | $11,806 | $12,460 |
| 8/31/2021 | $12,253 | $11,577 | $11,812 | $12,436 |
| 9/30/2021 | $12,163 | $11,534 | $11,779 | $12,328 |
| 10/31/2021 | $12,126 | $11,507 | $11,767 | $12,325 |
| 11/30/2021 | $12,213 | $11,526 | $11,807 | $12,361 |
| 12/31/2021 | $12,238 | $11,537 | $11,833 | $12,330 |
| 1/31/2022 | $11,946 | $11,314 | $11,643 | $12,064 |
| 2/28/2022 | $11,857 | $11,280 | $11,617 | $11,930 |
| 3/31/2022 | $11,499 | $11,060 | $11,415 | $11,598 |
| 4/30/2022 | $11,229 | $10,913 | $11,265 | $11,158 |
| 5/31/2022 | $11,276 | $11,055 | $11,368 | $11,230 |
| 6/30/2022 | $11,083 | $11,028 | $11,318 | $11,054 |
| 7/31/2022 | $11,304 | $11,195 | $11,489 | $11,324 |
| 8/31/2022 | $11,182 | $11,035 | $11,351 | $11,004 |
| 9/30/2022 | $10,843 | $10,787 | $11,081 | $10,529 |
| 10/31/2022 | $10,754 | $10,772 | $11,069 | $10,392 |
| 11/30/2022 | $11,060 | $11,027 | $11,322 | $10,774 |
| 12/31/2022 | $11,100 | $11,062 | $11,360 | $10,726 |
| 1/31/2023 | $11,330 | $11,249 | $11,561 | $11,056 |
| 2/28/2023 | $11,213 | $11,064 | $11,415 | $10,770 |
| 3/31/2023 | $11,286 | $11,248 | $11,565 | $11,043 |
| 4/30/2023 | $11,295 | $11,202 | $11,561 | $11,110 |
| 5/31/2023 | $11,225 | $11,119 | $11,501 | $10,989 |
| 6/30/2023 | $11,349 | $11,190 | $11,587 | $10,950 |
| 7/31/2023 | $11,392 | $11,223 | $11,641 | $10,943 |
| 8/31/2023 | $11,347 | $11,166 | $11,597 | $10,873 |
| 9/30/2023 | $11,197 | $11,011 | $11,467 | $10,596 |
| 10/31/2023 | $11,097 | $11,005 | $11,437 | $10,429 |
| 11/30/2023 | $11,396 | $11,363 | $11,791 | $10,901 |
| 12/31/2023 | $11,565 | $11,513 | $11,956 | $11,319 |
| 1/31/2024 | $11,620 | $11,483 | $11,954 | $11,288 |
| 2/29/2024 | $11,683 | $11,493 | $11,991 | $11,128 |
| 3/31/2024 | $11,746 | $11,480 | $12,020 | $11,231 |
| 4/30/2024 | $11,718 | $11,406 | $11,982 | $10,947 |
| 5/31/2024 | $11,766 | $11,360 | $11,976 | $11,133 |
| 6/30/2024 | $11,880 | $11,467 | $12,107 | $11,238 |
| 7/31/2024 | $11,961 | $11,574 | $12,210 | $11,501 |
| 8/31/2024 | $12,052 | $11,702 | $12,354 | $11,666 |
| 9/30/2024 | $12,176 | $11,775 | $12,430 | $11,822 |
The Fund’s benchmarks are unmanaged indices used as a general measure of market performance. Calculations assume the reinvestment of dividends and capital gains.
Average Annual Total Returns (%)
| 1 Year | 5 Years | Since Inception 6/15/15 |
|---|
| Class A at NAV | 8.74% | 1.31% | 2.39% |
| Class A with sales charge | 6.28% | 0.85% | 2.14% |
| Bloomberg Municipal Bond 1-8 Year Index | 6.93% | 1.38% | 1.77% |
| Bloomberg Municipal Bond 1-8 Year 50% + Bloomberg Municipal HY 1-8 Year 50% | 8.40% | 2.55% | 2.37% |
Bloomberg Aggregate Bond IndexFootnote Reference* | 11.57% | 0.33% | 1.82% |
| Footnote | Description |
Footnote* | The Fund has adopted the Bloomberg Aggregate Bond Index as its broad-based securities market index. |
The Fund's past performance is no guarantee of future results. The returns do not reflect the deduction of taxes that a shareholder would pay on Fund distributions or redemption of Fund shares.
(as of September 30, 2024)
| Total Net Assets | $1,521,124,171 |
| # of Portfolio Holdings | 399 |
| Portfolio Turnover Rate | 38% |
| Total Advisory Fees Paid | $3,808,830 |
What did the Fund invest in?
(as of September 30, 2024)
Credit Rating S&P or Moody'sFootnote Reference(a) | %Footnote Reference** |
|---|
| |
- A3.98%
- A-3.14%
- A+6.31%
- AA1.50%
- AA-1.83%
- AA+0.95%
- AAA1.04%
- B1.10%
- B-0.68%
- B+4.20%
- BB5.39%
- BB-7.06%
- BB+7.99%
- BBB5.96%
- BBB-9.91%
- BBB+6.72%
- CCC+0.63%
- NR31.61%
- Total 100.00%
| Footnote | Description |
Footnote** | Represents percent of total investments, which excludes derivatives. |
Footnote(a) | Investments in investment grade municipal bonds, which as bonds that are rated, at the time of purchase, within the four highest grades assigned by an independent rating agency such as Moody’s, S&P, or Fitch, or an equivalent short-term rating, as applicable, or are unrated by rating agencies but deemed by Lord Abbett to be of comparable quality. Lower rated municipal bonds are rated, at the time of purchase, or an equivalent short-term rating, as applicable, by an independent rating agency or are unrated by rating agencies but deemed by Lord Abbett to be of comparable quality. |
There were no material fund changes during the period.
Where can I find additional information about the Fund?
For additional information about the Fund, including its Prospectus, Statement of Additional Information, financial statements, holdings and proxy information, please visit lordabbett.com/FundDocuments.
The Fund has adopted a policy that allows it to send only one copy of the Fund's prospectus, proxy material, annual report and semiannual report (or related notice of internet availability of annual report and semiannual report) to certain shareholders residing at the same "household." This reduces Fund expenses, which benefits you and other shareholders.If you need additional copies or do not want your mailings to be "householded," please call Lord Abbett at 888-522-2388.
Lord Abbett Short Duration High Income Municipal Bond Fund
Annual Shareholder Report
September 30, 2024
lordabbett.com/FundDocuments
TSR-A-3385-A
11/24
Lord Abbett Short Duration High Income Municipal Bond Fund
Annual Shareholder Report
September 30, 2024
lordabbett.com/FundDocuments
This annual shareholder report contains important information about the Lord Abbett Short Duration High Income Municipal Bond Fund for the period of October 1, 2023 to September 30, 2024, as well as certain changes to the Fund. You can find additional information about the Fund at lordabbett.com/FundDocuments. You can also request this information by contacting us at 888-522-2388.
What were the Fund costs for the last year?
(based on a hypothetical $10,000 investment)
| Class Name | Costs of a $10,000 investment | Costs paid as a percentage of a $10,000 investment |
|---|
| Class C | $131 | 1.26% |
How did the Fund perform last year and what affected its performance?
For the fiscal year ended September 30, 2024, the Fund returned 8.08%, reflecting performance at the net asset value (NAV) of Class C shares, compared to the 6.93% of a securities market index with investment characteristics similar to those of the Fund, the Bloomberg Municipal Bond 1-8 Year Index. The Fund's broad-based market index, the Bloomberg Aggregate Bond Index, returned 11.57% over the same period.
Positive factors for the municipal market included decreasing Treasury yields, easing inflationary pressures and the start of interest rate cuts by the U.S. Federal Reserve. Also supporting the market was increased demand for municipal bond funds and a strong fundamental backdrop as evidenced by growing tax revenue and positive ratings actions by public ratings agencies. Negative factors included a significant increase in municipal bond supply, which pressured the market in second half of the fiscal year, and periods of interest rate volatility driven by sticky inflation readings at points throughout the fiscal year. Against this backdrop, municipal bonds delivered strong returns.
Top contributors to the Fund’s performance: An overweight allocation to BBB-rated and non-investment grade bonds contributed to relative performance. The Fund’s longer duration positioning relative to the prospectus benchmark led to a positive impact as yields fell over the period. An overweight allocation to the Health Care sector contributed to relative performance. Security selection within the Local General Obligation and Health Care sectors contributed to relative performance.
Top detractors from the Fund’s performance: While the Fund’s overall sector allocation led to a positive impact, an overweight allocation to the Industrial Development sector detracted from relative performance.
Total Return Based on $10,000 Investment
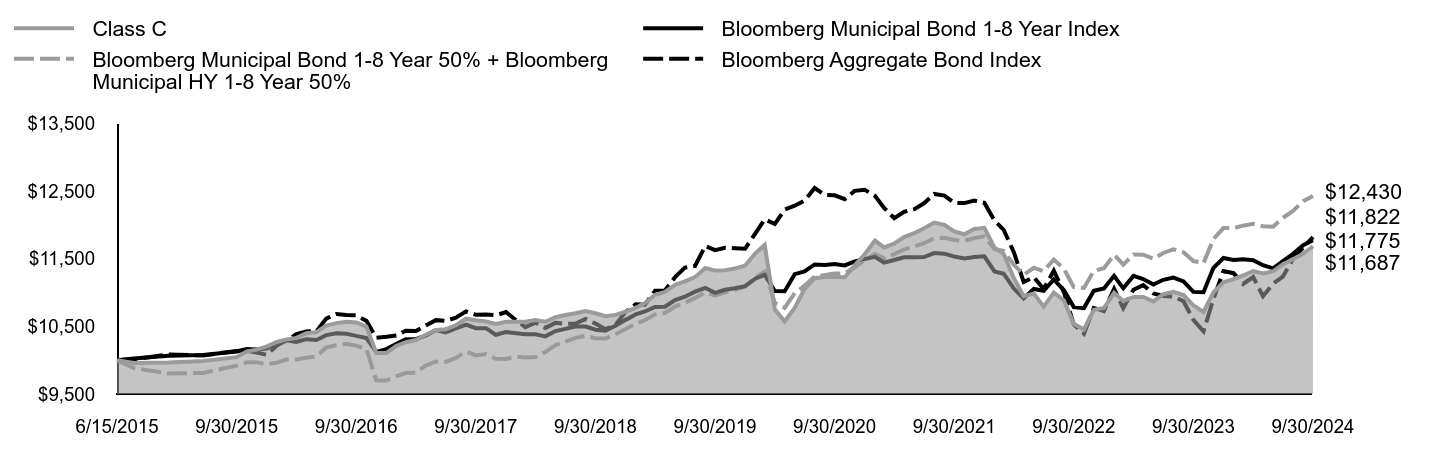
| Class C | Bloomberg Municipal Bond 1-8 Year Index | Bloomberg Municipal Bond 1-8 Year 50% + Bloomberg Municipal HY 1-8 Year 50% | Bloomberg Aggregate Bond Index |
|---|
| 6/15/2015 | $10,000 | $10,000 | $10,000 | $10,000 |
| 6/30/2015 | $9,959 | $10,025 | $9,884 | $10,015 |
| 7/31/2015 | $9,966 | $10,067 | $9,804 | $10,084 |
| 8/31/2015 | $9,987 | $10,078 | $9,812 | $10,070 |
| 9/30/2015 | $10,045 | $10,128 | $9,920 | $10,138 |
| 10/31/2015 | $10,129 | $10,166 | $9,969 | $10,140 |
| 11/30/2015 | $10,157 | $10,159 | $9,968 | $10,113 |
| 12/31/2015 | $10,206 | $10,174 | $9,941 | $10,080 |
| 1/31/2016 | $10,270 | $10,265 | $9,962 | $10,219 |
| 2/29/2016 | $10,307 | $10,295 | $10,011 | $10,291 |
| 3/31/2016 | $10,330 | $10,271 | $10,012 | $10,386 |
| 4/30/2016 | $10,400 | $10,311 | $10,038 | $10,426 |
| 5/31/2016 | $10,415 | $10,300 | $10,054 | $10,428 |
| 6/30/2016 | $10,512 | $10,371 | $10,192 | $10,616 |
| 7/31/2016 | $10,549 | $10,400 | $10,220 | $10,683 |
| 8/31/2016 | $10,570 | $10,391 | $10,242 | $10,670 |
| 9/30/2016 | $10,558 | $10,360 | $10,214 | $10,664 |
| 10/31/2016 | $10,498 | $10,328 | $10,169 | $10,583 |
| 11/30/2016 | $10,106 | $10,121 | $9,702 | $10,332 |
| 12/31/2016 | $10,108 | $10,165 | $9,700 | $10,347 |
| 1/31/2017 | $10,214 | $10,243 | $9,764 | $10,367 |
| 2/28/2017 | $10,267 | $10,309 | $9,810 | $10,437 |
| 3/31/2017 | $10,298 | $10,312 | $9,815 | $10,431 |
| 4/30/2017 | $10,377 | $10,365 | $9,922 | $10,512 |
| 5/31/2017 | $10,448 | $10,446 | $9,980 | $10,593 |
| 6/30/2017 | $10,459 | $10,413 | $9,975 | $10,582 |
| 7/31/2017 | $10,517 | $10,472 | $10,034 | $10,628 |
| 8/31/2017 | $10,616 | $10,525 | $10,128 | $10,723 |
| 9/30/2017 | $10,592 | $10,473 | $10,070 | $10,672 |
| 10/31/2017 | $10,573 | $10,474 | $10,092 | $10,678 |
| 11/30/2017 | $10,535 | $10,376 | $10,021 | $10,664 |
| 12/31/2017 | $10,568 | $10,416 | $10,019 | $10,713 |
| 1/31/2018 | $10,571 | $10,400 | $10,052 | $10,590 |
| 2/28/2018 | $10,569 | $10,386 | $10,041 | $10,490 |
| 3/31/2018 | $10,593 | $10,384 | $10,046 | $10,557 |
| 4/30/2018 | $10,569 | $10,353 | $10,120 | $10,478 |
| 5/31/2018 | $10,636 | $10,431 | $10,225 | $10,553 |
| 6/30/2018 | $10,668 | $10,464 | $10,276 | $10,540 |
| 7/31/2018 | $10,694 | $10,499 | $10,330 | $10,543 |
| 8/31/2018 | $10,726 | $10,498 | $10,361 | $10,610 |
| 9/30/2018 | $10,695 | $10,451 | $10,325 | $10,542 |
| 10/31/2018 | $10,651 | $10,438 | $10,323 | $10,459 |
| 11/30/2018 | $10,671 | $10,510 | $10,384 | $10,521 |
| 12/31/2018 | $10,719 | $10,597 | $10,461 | $10,715 |
| 1/31/2019 | $10,775 | $10,677 | $10,542 | $10,828 |
| 2/28/2019 | $10,847 | $10,721 | $10,591 | $10,822 |
| 3/31/2019 | $10,968 | $10,787 | $10,679 | $11,030 |
| 4/30/2019 | $11,010 | $10,792 | $10,698 | $11,033 |
| 5/31/2019 | $11,116 | $10,889 | $10,795 | $11,229 |
| 6/30/2019 | $11,166 | $10,939 | $10,850 | $11,370 |
| 7/31/2019 | $11,229 | $11,014 | $10,922 | $11,395 |
| 8/31/2019 | $11,364 | $11,071 | $11,004 | $11,690 |
| 9/30/2019 | $11,326 | $10,997 | $10,959 | $11,628 |
| 10/31/2019 | $11,331 | $11,042 | $11,004 | $11,663 |
| 11/30/2019 | $11,358 | $11,066 | $11,040 | $11,657 |
| 12/31/2019 | $11,400 | $11,095 | $11,087 | $11,649 |
| 1/31/2020 | $11,579 | $11,206 | $11,220 | $11,873 |
| 2/29/2020 | $11,706 | $11,264 | $11,312 | $12,086 |
| 3/31/2020 | $10,753 | $11,025 | $10,849 | $12,015 |
| 4/30/2020 | $10,574 | $11,020 | $10,775 | $12,229 |
| 5/31/2020 | $10,776 | $11,274 | $10,993 | $12,286 |
| 6/30/2020 | $11,054 | $11,313 | $11,103 | $12,363 |
| 7/31/2020 | $11,213 | $11,417 | $11,240 | $12,548 |
| 8/31/2020 | $11,232 | $11,410 | $11,260 | $12,447 |
| 9/30/2020 | $11,230 | $11,424 | $11,283 | $12,440 |
| 10/31/2020 | $11,228 | $11,403 | $11,285 | $12,384 |
| 11/30/2020 | $11,403 | $11,463 | $11,372 | $12,506 |
| 12/31/2020 | $11,568 | $11,496 | $11,483 | $12,523 |
| 1/31/2021 | $11,771 | $11,530 | $11,573 | $12,433 |
| 2/28/2021 | $11,669 | $11,444 | $11,509 | $12,254 |
| 3/31/2021 | $11,727 | $11,482 | $11,569 | $12,101 |
| 4/30/2021 | $11,823 | $11,522 | $11,638 | $12,196 |
| 5/31/2021 | $11,880 | $11,525 | $11,681 | $12,236 |
| 6/30/2021 | $11,952 | $11,527 | $11,732 | $12,322 |
| 7/31/2021 | $12,037 | $11,585 | $11,806 | $12,460 |
| 8/31/2021 | $12,002 | $11,577 | $11,812 | $12,436 |
| 9/30/2021 | $11,907 | $11,534 | $11,779 | $12,328 |
| 10/31/2021 | $11,864 | $11,507 | $11,767 | $12,325 |
| 11/30/2021 | $11,942 | $11,526 | $11,807 | $12,361 |
| 12/31/2021 | $11,959 | $11,537 | $11,833 | $12,330 |
| 1/31/2022 | $11,667 | $11,314 | $11,643 | $12,064 |
| 2/28/2022 | $11,573 | $11,280 | $11,617 | $11,930 |
| 3/31/2022 | $11,217 | $11,060 | $11,415 | $11,598 |
| 4/30/2022 | $10,947 | $10,913 | $11,265 | $11,158 |
| 5/31/2022 | $10,986 | $11,055 | $11,368 | $11,230 |
| 6/30/2022 | $10,793 | $11,028 | $11,318 | $11,054 |
| 7/31/2022 | $11,001 | $11,195 | $11,489 | $11,324 |
| 8/31/2022 | $10,884 | $11,035 | $11,351 | $11,004 |
| 9/30/2022 | $10,540 | $10,787 | $11,081 | $10,529 |
| 10/31/2022 | $10,456 | $10,772 | $11,069 | $10,392 |
| 11/30/2022 | $10,747 | $11,027 | $11,322 | $10,774 |
| 12/31/2022 | $10,772 | $11,062 | $11,360 | $10,726 |
| 1/31/2023 | $10,997 | $11,249 | $11,561 | $11,056 |
| 2/28/2023 | $10,877 | $11,064 | $11,415 | $10,770 |
| 3/31/2023 | $10,934 | $11,248 | $11,565 | $11,043 |
| 4/30/2023 | $10,937 | $11,202 | $11,561 | $11,110 |
| 5/31/2023 | $10,871 | $11,119 | $11,501 | $10,989 |
| 6/30/2023 | $10,977 | $11,190 | $11,587 | $10,950 |
| 7/31/2023 | $11,013 | $11,223 | $11,641 | $10,943 |
| 8/31/2023 | $10,964 | $11,166 | $11,597 | $10,873 |
| 9/30/2023 | $10,813 | $11,011 | $11,467 | $10,596 |
| 10/31/2023 | $10,711 | $11,005 | $11,437 | $10,429 |
| 11/30/2023 | $11,002 | $11,363 | $11,791 | $10,901 |
| 12/31/2023 | $11,152 | $11,513 | $11,956 | $11,319 |
| 1/31/2024 | $11,199 | $11,483 | $11,954 | $11,288 |
| 2/29/2024 | $11,254 | $11,493 | $11,991 | $11,128 |
| 3/31/2024 | $11,317 | $11,480 | $12,020 | $11,231 |
| 4/30/2024 | $11,285 | $11,406 | $11,982 | $10,947 |
| 5/31/2024 | $11,316 | $11,360 | $11,976 | $11,133 |
| 6/30/2024 | $11,421 | $11,467 | $12,107 | $11,238 |
| 7/31/2024 | $11,493 | $11,574 | $12,210 | $11,501 |
| 8/31/2024 | $11,574 | $11,702 | $12,354 | $11,666 |
| 9/30/2024 | $11,687 | $11,775 | $12,430 | $11,822 |
The Fund’s benchmarks are unmanaged indices used as a general measure of market performance. Calculations assume the reinvestment of dividends and capital gains.
Average Annual Total Returns (%)
| 1 Year | 5 Years | Since Inception 6/15/15 |
|---|
| Class C at NAV | 8.08% | 0.63% | 1.69% |
| Class C with sales charge | 7.08% | 0.63% | 1.69% |
| Bloomberg Municipal Bond 1-8 Year Index | 6.93% | 1.38% | 1.77% |
| Bloomberg Municipal Bond 1-8 Year 50% + Bloomberg Municipal HY 1-8 Year 50% | 8.40% | 2.55% | 2.37% |
Bloomberg Aggregate Bond IndexFootnote Reference* | 11.57% | 0.33% | 1.82% |
| Footnote | Description |
Footnote* | The Fund has adopted the Bloomberg Aggregate Bond Index as its broad-based securities market index. |
The Fund's past performance is no guarantee of future results. The returns do not reflect the deduction of taxes that a shareholder would pay on Fund distributions or redemption of Fund shares.
(as of September 30, 2024)
| Total Net Assets | $1,521,124,171 |
| # of Portfolio Holdings | 399 |
| Portfolio Turnover Rate | 38% |
| Total Advisory Fees Paid | $3,808,830 |
What did the Fund invest in?
(as of September 30, 2024)
Credit Rating S&P or Moody'sFootnote Reference(a) | %Footnote Reference** |
|---|
| |
- A3.98%
- A-3.14%
- A+6.31%
- AA1.50%
- AA-1.83%
- AA+0.95%
- AAA1.04%
- B1.10%
- B-0.68%
- B+4.20%
- BB5.39%
- BB-7.06%
- BB+7.99%
- BBB5.96%
- BBB-9.91%
- BBB+6.72%
- CCC+0.63%
- NR31.61%
- Total 100.00%
| Footnote | Description |
Footnote** | Represents percent of total investments, which excludes derivatives. |
Footnote(a) | Investments in investment grade municipal bonds, which as bonds that are rated, at the time of purchase, within the four highest grades assigned by an independent rating agency such as Moody’s, S&P, or Fitch, or an equivalent short-term rating, as applicable, or are unrated by rating agencies but deemed by Lord Abbett to be of comparable quality. Lower rated municipal bonds are rated, at the time of purchase, or an equivalent short-term rating, as applicable, by an independent rating agency or are unrated by rating agencies but deemed by Lord Abbett to be of comparable quality. |
There were no material fund changes during the period.
Where can I find additional information about the Fund?
For additional information about the Fund, including its Prospectus, Statement of Additional Information, financial statements, holdings and proxy information, please visit lordabbett.com/FundDocuments.
The Fund has adopted a policy that allows it to send only one copy of the Fund's prospectus, proxy material, annual report and semiannual report (or related notice of internet availability of annual report and semiannual report) to certain shareholders residing at the same "household." This reduces Fund expenses, which benefits you and other shareholders.If you need additional copies or do not want your mailings to be "householded," please call Lord Abbett at 888-522-2388.
Lord Abbett Short Duration High Income Municipal Bond Fund
Annual Shareholder Report
September 30, 2024
lordabbett.com/FundDocuments
TSR-A-3386-C
11/24
Lord Abbett Short Duration High Income Municipal Bond Fund
Annual Shareholder Report
September 30, 2024
lordabbett.com/FundDocuments
This annual shareholder report contains important information about the Lord Abbett Short Duration High Income Municipal Bond Fund for the period of October 1, 2023 to September 30, 2024, as well as certain changes to the Fund. You can find additional information about the Fund at lordabbett.com/FundDocuments. You can also request this information by contacting us at 888-522-2388.
What were the Fund costs for the last year?
(based on a hypothetical $10,000 investment)
| Class Name | Costs of a $10,000 investment | Costs paid as a percentage of a $10,000 investment |
|---|
| Class F | $57 | 0.55% |
How did the Fund perform last year and what affected its performance?
For the fiscal year ended September 30, 2024, the Fund returned 8.85%, reflecting performance at the net asset value (NAV) of Class F shares, compared to the 6.93% of a securities market index with investment characteristics similar to those of the Fund, the Bloomberg Municipal Bond 1-8 Year Index. The Fund's broad-based market index, the Bloomberg Aggregate Bond Index, returned 11.57% over the same period.
Positive factors for the municipal market included decreasing Treasury yields, easing inflationary pressures and the start of interest rate cuts by the U.S. Federal Reserve. Also supporting the market was increased demand for municipal bond funds and a strong fundamental backdrop as evidenced by growing tax revenue and positive ratings actions by public ratings agencies. Negative factors included a significant increase in municipal bond supply, which pressured the market in second half of the fiscal year, and periods of interest rate volatility driven by sticky inflation readings at points throughout the fiscal year. Against this backdrop, municipal bonds delivered strong returns.
Top contributors to the Fund’s performance: An overweight allocation to BBB-rated and non-investment grade bonds contributed to relative performance. The Fund’s longer duration positioning relative to the prospectus benchmark led to a positive impact as yields fell over the period. An overweight allocation to the Health Care sector contributed to relative performance. Security selection within the Local General Obligation and Health Care sectors contributed to relative performance.
Top detractors from the Fund’s performance: While the Fund’s overall sector allocation led to a positive impact, an overweight allocation to the Industrial Development sector detracted from relative performance.
Total Return Based on $10,000 Investment

| Class F | Bloomberg Municipal Bond 1-8 Year Index | Bloomberg Municipal Bond 1-8 Year 50% + Bloomberg Municipal HY 1-8 Year 50% | Bloomberg Aggregate Bond Index |
|---|
| 6/15/2015 | $10,000 | $10,000 | $10,000 | $10,000 |
| 6/30/2015 | $9,964 | $10,025 | $9,884 | $10,015 |
| 7/31/2015 | $9,979 | $10,067 | $9,804 | $10,084 |
| 8/31/2015 | $10,008 | $10,078 | $9,812 | $10,070 |
| 9/30/2015 | $10,074 | $10,128 | $9,920 | $10,138 |
| 10/31/2015 | $10,166 | $10,166 | $9,969 | $10,140 |
| 11/30/2015 | $10,202 | $10,159 | $9,968 | $10,113 |
| 12/31/2015 | $10,259 | $10,174 | $9,941 | $10,080 |
| 1/31/2016 | $10,331 | $10,265 | $9,962 | $10,219 |
| 2/29/2016 | $10,369 | $10,295 | $10,011 | $10,291 |
| 3/31/2016 | $10,405 | $10,271 | $10,012 | $10,386 |
| 4/30/2016 | $10,477 | $10,311 | $10,038 | $10,426 |
| 5/31/2016 | $10,500 | $10,300 | $10,054 | $10,428 |
| 6/30/2016 | $10,605 | $10,371 | $10,192 | $10,616 |
| 7/31/2016 | $10,650 | $10,400 | $10,220 | $10,683 |
| 8/31/2016 | $10,686 | $10,391 | $10,242 | $10,670 |
| 9/30/2016 | $10,681 | $10,360 | $10,214 | $10,664 |
| 10/31/2016 | $10,628 | $10,328 | $10,169 | $10,583 |
| 11/30/2016 | $10,239 | $10,121 | $9,702 | $10,332 |
| 12/31/2016 | $10,248 | $10,165 | $9,700 | $10,347 |
| 1/31/2017 | $10,363 | $10,243 | $9,764 | $10,367 |
| 2/28/2017 | $10,423 | $10,309 | $9,810 | $10,437 |
| 3/31/2017 | $10,462 | $10,312 | $9,815 | $10,431 |
| 4/30/2017 | $10,549 | $10,365 | $9,922 | $10,512 |
| 5/31/2017 | $10,630 | $10,446 | $9,980 | $10,593 |
| 6/30/2017 | $10,647 | $10,413 | $9,975 | $10,582 |
| 7/31/2017 | $10,714 | $10,472 | $10,034 | $10,628 |
| 8/31/2017 | $10,822 | $10,525 | $10,128 | $10,723 |
| 9/30/2017 | $10,805 | $10,473 | $10,070 | $10,672 |
| 10/31/2017 | $10,794 | $10,474 | $10,092 | $10,678 |
| 11/30/2017 | $10,762 | $10,376 | $10,021 | $10,664 |
| 12/31/2017 | $10,802 | $10,416 | $10,019 | $10,713 |
| 1/31/2018 | $10,812 | $10,400 | $10,052 | $10,590 |
| 2/28/2018 | $10,810 | $10,386 | $10,041 | $10,490 |
| 3/31/2018 | $10,848 | $10,384 | $10,046 | $10,557 |
| 4/30/2018 | $10,831 | $10,353 | $10,120 | $10,478 |
| 5/31/2018 | $10,906 | $10,431 | $10,225 | $10,553 |
| 6/30/2018 | $10,939 | $10,464 | $10,276 | $10,540 |
| 7/31/2018 | $10,979 | $10,499 | $10,330 | $10,543 |
| 8/31/2018 | $11,019 | $10,498 | $10,361 | $10,610 |
| 9/30/2018 | $10,987 | $10,451 | $10,325 | $10,542 |
| 10/31/2018 | $10,948 | $10,438 | $10,323 | $10,459 |
| 11/30/2018 | $10,983 | $10,510 | $10,384 | $10,521 |
| 12/31/2018 | $11,040 | $10,597 | $10,461 | $10,715 |
| 1/31/2019 | $11,097 | $10,677 | $10,542 | $10,828 |
| 2/28/2019 | $11,185 | $10,721 | $10,591 | $10,822 |
| 3/31/2019 | $11,316 | $10,787 | $10,679 | $11,030 |
| 4/30/2019 | $11,359 | $10,792 | $10,698 | $11,033 |
| 5/31/2019 | $11,484 | $10,889 | $10,795 | $11,229 |
| 6/30/2019 | $11,543 | $10,939 | $10,850 | $11,370 |
| 7/31/2019 | $11,615 | $11,014 | $10,922 | $11,395 |
| 8/31/2019 | $11,762 | $11,071 | $11,004 | $11,690 |
| 9/30/2019 | $11,723 | $10,997 | $10,959 | $11,628 |
| 10/31/2019 | $11,743 | $11,042 | $11,004 | $11,663 |
| 11/30/2019 | $11,778 | $11,066 | $11,040 | $11,657 |
| 12/31/2019 | $11,829 | $11,095 | $11,087 | $11,649 |
| 1/31/2020 | $12,015 | $11,206 | $11,220 | $11,873 |
| 2/29/2020 | $12,162 | $11,264 | $11,312 | $12,086 |
| 3/31/2020 | $11,171 | $11,025 | $10,849 | $12,015 |
| 4/30/2020 | $10,992 | $11,020 | $10,775 | $12,229 |
| 5/31/2020 | $11,217 | $11,274 | $10,993 | $12,286 |
| 6/30/2020 | $11,513 | $11,313 | $11,103 | $12,363 |
| 7/31/2020 | $11,686 | $11,417 | $11,240 | $12,548 |
| 8/31/2020 | $11,706 | $11,410 | $11,260 | $12,447 |
| 9/30/2020 | $11,719 | $11,424 | $11,283 | $12,440 |
| 10/31/2020 | $11,717 | $11,403 | $11,285 | $12,384 |
| 11/30/2020 | $11,907 | $11,463 | $11,372 | $12,506 |
| 12/31/2020 | $12,095 | $11,496 | $11,483 | $12,523 |
| 1/31/2021 | $12,307 | $11,530 | $11,573 | $12,433 |
| 2/28/2021 | $12,215 | $11,444 | $11,509 | $12,254 |
| 3/31/2021 | $12,276 | $11,482 | $11,569 | $12,101 |
| 4/30/2021 | $12,384 | $11,522 | $11,638 | $12,196 |
| 5/31/2021 | $12,460 | $11,525 | $11,681 | $12,236 |
| 6/30/2021 | $12,544 | $11,527 | $11,732 | $12,322 |
| 7/31/2021 | $12,633 | $11,585 | $11,806 | $12,460 |
| 8/31/2021 | $12,612 | $11,577 | $11,812 | $12,436 |
| 9/30/2021 | $12,521 | $11,534 | $11,779 | $12,328 |
| 10/31/2021 | $12,484 | $11,507 | $11,767 | $12,325 |
| 11/30/2021 | $12,574 | $11,526 | $11,807 | $12,361 |
| 12/31/2021 | $12,593 | $11,537 | $11,833 | $12,330 |
| 1/31/2022 | $12,302 | $11,314 | $11,643 | $12,064 |
| 2/28/2022 | $12,210 | $11,280 | $11,617 | $11,930 |
| 3/31/2022 | $11,843 | $11,060 | $11,415 | $11,598 |
| 4/30/2022 | $11,566 | $10,913 | $11,265 | $11,158 |
| 5/31/2022 | $11,615 | $11,055 | $11,368 | $11,230 |
| 6/30/2022 | $11,418 | $11,028 | $11,318 | $11,054 |
| 7/31/2022 | $11,646 | $11,195 | $11,489 | $11,324 |
| 8/31/2022 | $11,530 | $11,035 | $11,351 | $11,004 |
| 9/30/2022 | $11,173 | $10,787 | $11,081 | $10,529 |
| 10/31/2022 | $11,082 | $10,772 | $11,069 | $10,392 |
| 11/30/2022 | $11,398 | $11,027 | $11,322 | $10,774 |
| 12/31/2022 | $11,441 | $11,062 | $11,360 | $10,726 |
| 1/31/2023 | $11,678 | $11,249 | $11,561 | $11,056 |
| 2/28/2023 | $11,558 | $11,064 | $11,415 | $10,770 |
| 3/31/2023 | $11,635 | $11,248 | $11,565 | $11,043 |
| 4/30/2023 | $11,645 | $11,202 | $11,561 | $11,110 |
| 5/31/2023 | $11,574 | $11,119 | $11,501 | $10,989 |
| 6/30/2023 | $11,703 | $11,190 | $11,587 | $10,950 |
| 7/31/2023 | $11,748 | $11,223 | $11,641 | $10,943 |
| 8/31/2023 | $11,702 | $11,166 | $11,597 | $10,873 |
| 9/30/2023 | $11,549 | $11,011 | $11,467 | $10,596 |
| 10/31/2023 | $11,446 | $11,005 | $11,437 | $10,429 |
| 11/30/2023 | $11,755 | $11,363 | $11,791 | $10,901 |
| 12/31/2023 | $11,931 | $11,513 | $11,956 | $11,319 |
| 1/31/2024 | $11,989 | $11,483 | $11,954 | $11,288 |
| 2/29/2024 | $12,055 | $11,493 | $11,991 | $11,128 |
| 3/31/2024 | $12,121 | $11,480 | $12,020 | $11,231 |
| 4/30/2024 | $12,093 | $11,406 | $11,982 | $10,947 |
| 5/31/2024 | $12,143 | $11,360 | $11,976 | $11,133 |
| 6/30/2024 | $12,262 | $11,467 | $12,107 | $11,238 |
| 7/31/2024 | $12,347 | $11,574 | $12,210 | $11,501 |
| 8/31/2024 | $12,441 | $11,702 | $12,354 | $11,666 |
| 9/30/2024 | $12,571 | $11,775 | $12,430 | $11,822 |
The Fund’s benchmarks are unmanaged indices used as a general measure of market performance. Calculations assume the reinvestment of dividends and capital gains.
Average Annual Total Returns (%)
| 1 Year | 5 Years | Since Inception 6/15/15 |
|---|
| Class F at NAV | 8.85% | 1.41% | 2.49% |
| Bloomberg Municipal Bond 1-8 Year Index | 6.93% | 1.38% | 1.77% |
| Bloomberg Municipal Bond 1-8 Year 50% + Bloomberg Municipal HY 1-8 Year 50% | 8.40% | 2.55% | 2.37% |
Bloomberg Aggregate Bond IndexFootnote Reference* | 11.57% | 0.33% | 1.82% |
| Footnote | Description |
Footnote* | The Fund has adopted the Bloomberg Aggregate Bond Index as its broad-based securities market index. |
The Fund's past performance is no guarantee of future results. The returns do not reflect the deduction of taxes that a shareholder would pay on Fund distributions or redemption of Fund shares.
(as of September 30, 2024)
| Total Net Assets | $1,521,124,171 |
| # of Portfolio Holdings | 399 |
| Portfolio Turnover Rate | 38% |
| Total Advisory Fees Paid | $3,808,830 |
What did the Fund invest in?
(as of September 30, 2024)
Credit Rating S&P or Moody'sFootnote Reference(a) | %Footnote Reference** |
|---|
| |
- A3.98%
- A-3.14%
- A+6.31%
- AA1.50%
- AA-1.83%
- AA+0.95%
- AAA1.04%
- B1.10%
- B-0.68%
- B+4.20%
- BB5.39%
- BB-7.06%
- BB+7.99%
- BBB5.96%
- BBB-9.91%
- BBB+6.72%
- CCC+0.63%
- NR31.61%
- Total 100.00%
| Footnote | Description |
Footnote** | Represents percent of total investments, which excludes derivatives. |
Footnote(a) | Investments in investment grade municipal bonds, which as bonds that are rated, at the time of purchase, within the four highest grades assigned by an independent rating agency such as Moody’s, S&P, or Fitch, or an equivalent short-term rating, as applicable, or are unrated by rating agencies but deemed by Lord Abbett to be of comparable quality. Lower rated municipal bonds are rated, at the time of purchase, or an equivalent short-term rating, as applicable, by an independent rating agency or are unrated by rating agencies but deemed by Lord Abbett to be of comparable quality. |
There were no material fund changes during the period.
Where can I find additional information about the Fund?
For additional information about the Fund, including its Prospectus, Statement of Additional Information, financial statements, holdings and proxy information, please visit lordabbett.com/FundDocuments.
The Fund has adopted a policy that allows it to send only one copy of the Fund's prospectus, proxy material, annual report and semiannual report (or related notice of internet availability of annual report and semiannual report) to certain shareholders residing at the same "household." This reduces Fund expenses, which benefits you and other shareholders.If you need additional copies or do not want your mailings to be "householded," please call Lord Abbett at 888-522-2388.
Lord Abbett Short Duration High Income Municipal Bond Fund
Annual Shareholder Report
September 30, 2024
lordabbett.com/FundDocuments
TSR-A-3387-F
11/24
Lord Abbett Short Duration High Income Municipal Bond Fund
Annual Shareholder Report
September 30, 2024
lordabbett.com/FundDocuments
This annual shareholder report contains important information about the Lord Abbett Short Duration High Income Municipal Bond Fund for the period of October 1, 2023 to September 30, 2024, as well as certain changes to the Fund. You can find additional information about the Fund at lordabbett.com/FundDocuments. You can also request this information by contacting us at 888-522-2388.
What were the Fund costs for the last year?
(based on a hypothetical $10,000 investment)
| Class Name | Costs of a $10,000 investment | Costs paid as a percentage of a $10,000 investment |
|---|
| Class F3 | $41 | 0.39% |
How did the Fund perform last year and what affected its performance?
For the fiscal year ended September 30, 2024, the Fund returned 9.03%, reflecting performance at the net asset value (NAV) of Class F3 shares, compared to the 6.93% of a securities market index with investment characteristics similar to those of the Fund, the Bloomberg Municipal Bond 1-8 Year Index. The Fund's broad-based market index, the Bloomberg Aggregate Bond Index, returned 11.57% over the same period.
Positive factors for the municipal market included decreasing Treasury yields, easing inflationary pressures and the start of interest rate cuts by the U.S. Federal Reserve. Also supporting the market was increased demand for municipal bond funds and a strong fundamental backdrop as evidenced by growing tax revenue and positive ratings actions by public ratings agencies. Negative factors included a significant increase in municipal bond supply, which pressured the market in second half of the fiscal year, and periods of interest rate volatility driven by sticky inflation readings at points throughout the fiscal year. Against this backdrop, municipal bonds delivered strong returns.
Top contributors to the Fund’s performance: An overweight allocation to BBB-rated and non-investment grade bonds contributed to relative performance. The Fund’s longer duration positioning relative to the prospectus benchmark led to a positive impact as yields fell over the period. An overweight allocation to the Health Care sector contributed to relative performance. Security selection within the Local General Obligation and Health Care sectors contributed to relative performance.
Top detractors from the Fund’s performance: While the Fund’s overall sector allocation led to a positive impact, an overweight allocation to the Industrial Development sector detracted from relative performance.
Total Return Based on $10,000 Investment
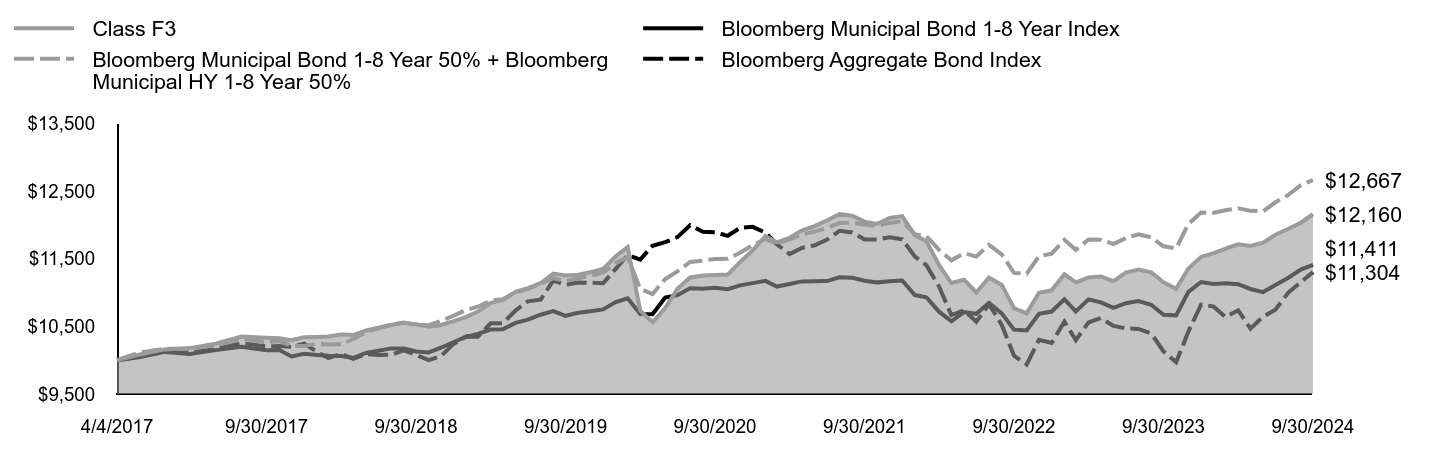
| Class F3 | Bloomberg Municipal Bond 1-8 Year Index | Bloomberg Municipal Bond 1-8 Year 50% + Bloomberg Municipal HY 1-8 Year 50% | Bloomberg Aggregate Bond Index |
|---|
| 4/4/2017 | $10,000 | $10,000 | $10,000 | $10,000 |
| 4/30/2017 | $10,082 | $10,044 | $10,111 | $10,051 |
| 5/31/2017 | $10,160 | $10,123 | $10,170 | $10,128 |
| 6/30/2017 | $10,179 | $10,091 | $10,165 | $10,118 |
| 7/31/2017 | $10,244 | $10,149 | $10,225 | $10,162 |
| 8/31/2017 | $10,349 | $10,199 | $10,321 | $10,253 |
| 9/30/2017 | $10,333 | $10,149 | $10,262 | $10,204 |
| 10/31/2017 | $10,324 | $10,150 | $10,284 | $10,210 |
| 11/30/2017 | $10,295 | $10,055 | $10,212 | $10,197 |
| 12/31/2017 | $10,341 | $10,094 | $10,210 | $10,244 |
| 1/31/2018 | $10,345 | $10,078 | $10,243 | $10,126 |
| 2/28/2018 | $10,351 | $10,065 | $10,232 | $10,030 |
| 3/31/2018 | $10,382 | $10,063 | $10,237 | $10,094 |
| 4/30/2018 | $10,374 | $10,033 | $10,313 | $10,019 |
| 5/31/2018 | $10,440 | $10,108 | $10,420 | $10,091 |
| 6/30/2018 | $10,480 | $10,140 | $10,472 | $10,078 |
| 7/31/2018 | $10,520 | $10,175 | $10,527 | $10,080 |
| 8/31/2018 | $10,553 | $10,173 | $10,558 | $10,145 |
| 9/30/2018 | $10,531 | $10,128 | $10,522 | $10,080 |
| 10/31/2018 | $10,495 | $10,115 | $10,519 | $10,000 |
| 11/30/2018 | $10,522 | $10,185 | $10,582 | $10,060 |
| 12/31/2018 | $10,578 | $10,270 | $10,660 | $10,245 |
| 1/31/2019 | $10,641 | $10,347 | $10,743 | $10,354 |
| 2/28/2019 | $10,720 | $10,389 | $10,792 | $10,348 |
| 3/31/2019 | $10,847 | $10,453 | $10,882 | $10,546 |
| 4/30/2019 | $10,897 | $10,459 | $10,902 | $10,549 |
| 5/31/2019 | $11,011 | $10,553 | $11,001 | $10,736 |
| 6/30/2019 | $11,068 | $10,601 | $11,057 | $10,871 |
| 7/31/2019 | $11,139 | $10,673 | $11,130 | $10,895 |
| 8/31/2019 | $11,282 | $10,728 | $11,214 | $11,177 |
| 9/30/2019 | $11,253 | $10,657 | $11,168 | $11,118 |
| 10/31/2019 | $11,266 | $10,701 | $11,214 | $11,151 |
| 11/30/2019 | $11,302 | $10,724 | $11,250 | $11,146 |
| 12/31/2019 | $11,352 | $10,752 | $11,298 | $11,138 |
| 1/31/2020 | $11,539 | $10,860 | $11,434 | $11,352 |
| 2/29/2020 | $11,674 | $10,916 | $11,527 | $11,557 |
| 3/31/2020 | $10,732 | $10,684 | $11,056 | $11,489 |
| 4/30/2020 | $10,562 | $10,679 | $10,980 | $11,693 |
| 5/31/2020 | $10,772 | $10,926 | $11,202 | $11,747 |
| 6/30/2020 | $11,057 | $10,963 | $11,315 | $11,821 |
| 7/31/2020 | $11,225 | $11,064 | $11,454 | $11,998 |
| 8/31/2020 | $11,253 | $11,057 | $11,474 | $11,901 |
| 9/30/2020 | $11,260 | $11,071 | $11,498 | $11,894 |
| 10/31/2020 | $11,267 | $11,051 | $11,500 | $11,841 |
| 11/30/2020 | $11,451 | $11,108 | $11,589 | $11,958 |
| 12/31/2020 | $11,626 | $11,141 | $11,702 | $11,974 |
| 1/31/2021 | $11,839 | $11,174 | $11,794 | $11,888 |
| 2/28/2021 | $11,744 | $11,090 | $11,728 | $11,716 |
| 3/31/2021 | $11,812 | $11,127 | $11,789 | $11,570 |
| 4/30/2021 | $11,918 | $11,166 | $11,860 | $11,662 |
| 5/31/2021 | $11,985 | $11,169 | $11,903 | $11,700 |
| 6/30/2021 | $12,067 | $11,171 | $11,955 | $11,782 |
| 7/31/2021 | $12,163 | $11,227 | $12,031 | $11,914 |
| 8/31/2021 | $12,137 | $11,219 | $12,037 | $11,891 |
| 9/30/2021 | $12,051 | $11,177 | $12,004 | $11,788 |
| 10/31/2021 | $12,017 | $11,152 | $11,991 | $11,785 |
| 11/30/2021 | $12,105 | $11,169 | $12,032 | $11,820 |
| 12/31/2021 | $12,133 | $11,180 | $12,058 | $11,789 |
| 1/31/2022 | $11,847 | $10,964 | $11,864 | $11,535 |
| 2/28/2022 | $11,760 | $10,931 | $11,838 | $11,407 |
| 3/31/2022 | $11,408 | $10,718 | $11,632 | $11,090 |
| 4/30/2022 | $11,142 | $10,575 | $11,479 | $10,669 |
| 5/31/2022 | $11,191 | $10,713 | $11,585 | $10,738 |
| 6/30/2022 | $11,003 | $10,687 | $11,533 | $10,569 |
| 7/31/2022 | $11,224 | $10,849 | $11,708 | $10,828 |
| 8/31/2022 | $11,114 | $10,693 | $11,567 | $10,522 |
| 9/30/2022 | $10,771 | $10,453 | $11,292 | $10,067 |
| 10/31/2022 | $10,693 | $10,439 | $11,280 | $9,937 |
| 11/30/2022 | $10,999 | $10,686 | $11,538 | $10,302 |
| 12/31/2022 | $11,034 | $10,720 | $11,576 | $10,256 |
| 1/31/2023 | $11,273 | $10,902 | $11,782 | $10,571 |
| 2/28/2023 | $11,151 | $10,722 | $11,633 | $10,298 |
| 3/31/2023 | $11,226 | $10,900 | $11,786 | $10,559 |
| 4/30/2023 | $11,238 | $10,856 | $11,781 | $10,623 |
| 5/31/2023 | $11,171 | $10,775 | $11,720 | $10,508 |
| 6/30/2023 | $11,297 | $10,844 | $11,808 | $10,470 |
| 7/31/2023 | $11,342 | $10,876 | $11,863 | $10,463 |
| 8/31/2023 | $11,301 | $10,821 | $11,818 | $10,396 |
| 9/30/2023 | $11,154 | $10,671 | $11,685 | $10,132 |
| 10/31/2023 | $11,056 | $10,664 | $11,655 | $9,972 |
| 11/30/2023 | $11,357 | $11,012 | $12,016 | $10,424 |
| 12/31/2023 | $11,528 | $11,157 | $12,184 | $10,823 |
| 1/31/2024 | $11,586 | $11,128 | $12,181 | $10,793 |
| 2/29/2024 | $11,651 | $11,138 | $12,219 | $10,640 |
| 3/31/2024 | $11,716 | $11,125 | $12,249 | $10,739 |
| 4/30/2024 | $11,691 | $11,054 | $12,210 | $10,467 |
| 5/31/2024 | $11,741 | $11,008 | $12,204 | $10,645 |
| 6/30/2024 | $11,857 | $11,113 | $12,337 | $10,746 |
| 7/31/2024 | $11,941 | $11,216 | $12,442 | $10,997 |
| 8/31/2024 | $12,034 | $11,340 | $12,590 | $11,155 |
| 9/30/2024 | $12,160 | $11,411 | $12,667 | $11,304 |
The Fund’s benchmarks are unmanaged indices used as a general measure of market performance. Calculations assume the reinvestment of dividends and capital gains.
Average Annual Total Returns (%)
| 1 Year | 5 Years | Since Inception 4/4/17 |
|---|
| Class F3 at NAV | 9.03% | 1.56% | 2.65% |
| Bloomberg Municipal Bond 1-8 Year Index | 6.93% | 1.38% | 1.78% |
| Bloomberg Municipal Bond 1-8 Year 50% + Bloomberg Municipal HY 1-8 Year 50% | 8.40% | 2.55% | 3.21% |
Bloomberg Aggregate Bond IndexFootnote Reference* | 11.57% | 0.33% | 1.65% |
| Footnote | Description |
Footnote* | The Fund has adopted the Bloomberg Aggregate Bond Index as its broad-based securities market index. |
The Fund's past performance is no guarantee of future results. The returns do not reflect the deduction of taxes that a shareholder would pay on Fund distributions or redemption of Fund shares.
(as of September 30, 2024)
| Total Net Assets | $1,521,124,171 |
| # of Portfolio Holdings | 399 |
| Portfolio Turnover Rate | 38% |
| Total Advisory Fees Paid | $3,808,830 |
What did the Fund invest in?
(as of September 30, 2024)
Credit Rating S&P or Moody'sFootnote Reference(a) | %Footnote Reference** |
|---|
| |
- A3.98%
- A-3.14%
- A+6.31%
- AA1.50%
- AA-1.83%
- AA+0.95%
- AAA1.04%
- B1.10%
- B-0.68%
- B+4.20%
- BB5.39%
- BB-7.06%
- BB+7.99%
- BBB5.96%
- BBB-9.91%
- BBB+6.72%
- CCC+0.63%
- NR31.61%
- Total 100.00%
| Footnote | Description |
Footnote** | Represents percent of total investments, which excludes derivatives. |
Footnote(a) | Investments in investment grade municipal bonds, which as bonds that are rated, at the time of purchase, within the four highest grades assigned by an independent rating agency such as Moody’s, S&P, or Fitch, or an equivalent short-term rating, as applicable, or are unrated by rating agencies but deemed by Lord Abbett to be of comparable quality. Lower rated municipal bonds are rated, at the time of purchase, or an equivalent short-term rating, as applicable, by an independent rating agency or are unrated by rating agencies but deemed by Lord Abbett to be of comparable quality. |
There were no material fund changes during the period.
Where can I find additional information about the Fund?
For additional information about the Fund, including its Prospectus, Statement of Additional Information, financial statements, holdings and proxy information, please visit lordabbett.com/FundDocuments.
The Fund has adopted a policy that allows it to send only one copy of the Fund's prospectus, proxy material, annual report and semiannual report (or related notice of internet availability of annual report and semiannual report) to certain shareholders residing at the same "household." This reduces Fund expenses, which benefits you and other shareholders.If you need additional copies or do not want your mailings to be "householded," please call Lord Abbett at 888-522-2388.
Lord Abbett Short Duration High Income Municipal Bond Fund
Annual Shareholder Report
September 30, 2024
lordabbett.com/FundDocuments
TSR-A-8991-F3
11/24
Lord Abbett Short Duration High Income Municipal Bond Fund
Annual Shareholder Report
September 30, 2024
lordabbett.com/FundDocuments
This annual shareholder report contains important information about the Lord Abbett Short Duration High Income Municipal Bond Fund for the period of October 1, 2023 to September 30, 2024, as well as certain changes to the Fund. You can find additional information about the Fund at lordabbett.com/FundDocuments. You can also request this information by contacting us at 888-522-2388.
What were the Fund costs for the last year?
(based on a hypothetical $10,000 investment)
| Class Name | Costs of a $10,000 investment | Costs paid as a percentage of a $10,000 investment |
|---|
| Class I | $47 | 0.45% |
How did the Fund perform last year and what affected its performance?
For the fiscal year ended September 30, 2024, the Fund returned 8.96%, reflecting performance at the net asset value (NAV) of Class I shares, compared to the 6.93% of a securities market index with investment characteristics similar to those of the Fund, the Bloomberg Municipal Bond 1-8 Year Index. The Fund's broad-based market index, the Bloomberg Aggregate Bond Index, returned 11.57% over the same period.
Positive factors for the municipal market included decreasing Treasury yields, easing inflationary pressures and the start of interest rate cuts by the U.S. Federal Reserve. Also supporting the market was increased demand for municipal bond funds and a strong fundamental backdrop as evidenced by growing tax revenue and positive ratings actions by public ratings agencies. Negative factors included a significant increase in municipal bond supply, which pressured the market in second half of the fiscal year, and periods of interest rate volatility driven by sticky inflation readings at points throughout the fiscal year. Against this backdrop, municipal bonds delivered strong returns.
Top contributors to the Fund’s performance: An overweight allocation to BBB-rated and non-investment grade bonds contributed to relative performance. The Fund’s longer duration positioning relative to the prospectus benchmark led to a positive impact as yields fell over the period. An overweight allocation to the Health Care sector contributed to relative performance. Security selection within the Local General Obligation and Health Care sectors contributed to relative performance.
Top detractors from the Fund’s performance: While the Fund’s overall sector allocation led to a positive impact, an overweight allocation to the Industrial Development sector detracted from relative performance.
Total Return Based on $10,000 Investment
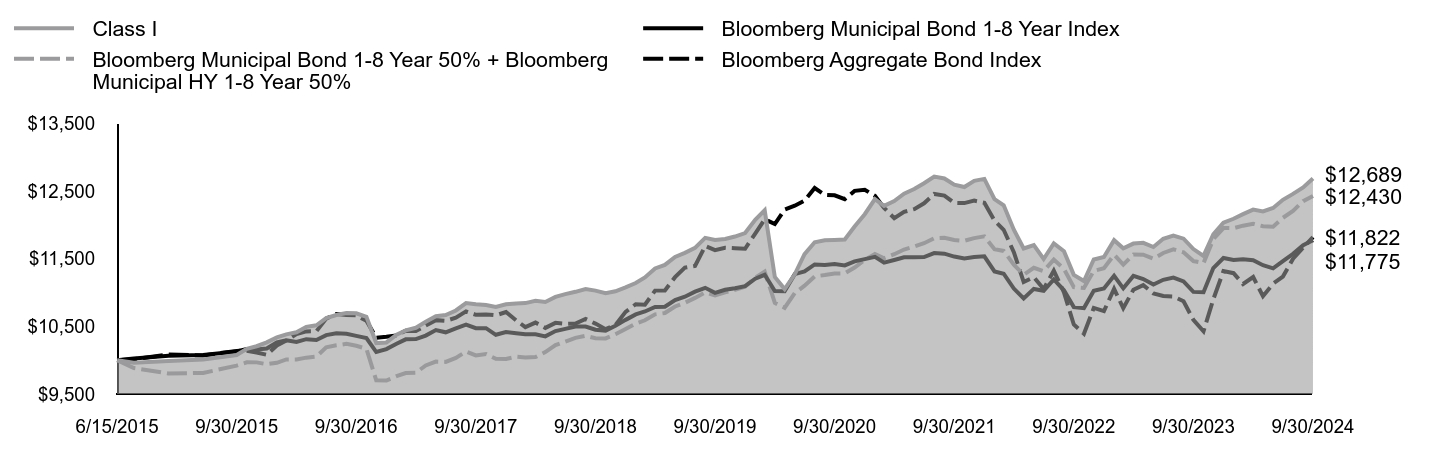
| Class I | Bloomberg Municipal Bond 1-8 Year Index | Bloomberg Municipal Bond 1-8 Year 50% + Bloomberg Municipal HY 1-8 Year 50% | Bloomberg Aggregate Bond Index |
|---|
| 6/15/2015 | $10,000 | $10,000 | $10,000 | $10,000 |
| 6/30/2015 | $9,964 | $10,025 | $9,884 | $10,015 |
| 7/31/2015 | $9,987 | $10,067 | $9,804 | $10,084 |
| 8/31/2015 | $10,010 | $10,078 | $9,812 | $10,070 |
| 9/30/2015 | $10,077 | $10,128 | $9,920 | $10,138 |
| 10/31/2015 | $10,169 | $10,166 | $9,969 | $10,140 |
| 11/30/2015 | $10,207 | $10,159 | $9,968 | $10,113 |
| 12/31/2015 | $10,264 | $10,174 | $9,941 | $10,080 |
| 1/31/2016 | $10,337 | $10,265 | $9,962 | $10,219 |
| 2/29/2016 | $10,383 | $10,295 | $10,011 | $10,291 |
| 3/31/2016 | $10,414 | $10,271 | $10,012 | $10,386 |
| 4/30/2016 | $10,493 | $10,311 | $10,038 | $10,426 |
| 5/31/2016 | $10,517 | $10,300 | $10,054 | $10,428 |
| 6/30/2016 | $10,623 | $10,371 | $10,192 | $10,616 |
| 7/31/2016 | $10,669 | $10,400 | $10,220 | $10,683 |
| 8/31/2016 | $10,699 | $10,391 | $10,242 | $10,670 |
| 9/30/2016 | $10,694 | $10,360 | $10,214 | $10,664 |
| 10/31/2016 | $10,643 | $10,328 | $10,169 | $10,583 |
| 11/30/2016 | $10,254 | $10,121 | $9,702 | $10,332 |
| 12/31/2016 | $10,263 | $10,165 | $9,700 | $10,347 |
| 1/31/2017 | $10,379 | $10,243 | $9,764 | $10,367 |
| 2/28/2017 | $10,441 | $10,309 | $9,810 | $10,437 |
| 3/31/2017 | $10,480 | $10,312 | $9,815 | $10,431 |
| 4/30/2017 | $10,568 | $10,365 | $9,922 | $10,512 |
| 5/31/2017 | $10,650 | $10,446 | $9,980 | $10,593 |
| 6/30/2017 | $10,668 | $10,413 | $9,975 | $10,582 |
| 7/31/2017 | $10,736 | $10,472 | $10,034 | $10,628 |
| 8/31/2017 | $10,846 | $10,525 | $10,128 | $10,723 |
| 9/30/2017 | $10,829 | $10,473 | $10,070 | $10,672 |
| 10/31/2017 | $10,818 | $10,474 | $10,092 | $10,678 |
| 11/30/2017 | $10,787 | $10,376 | $10,021 | $10,664 |
| 12/31/2017 | $10,828 | $10,416 | $10,019 | $10,713 |
| 1/31/2018 | $10,840 | $10,400 | $10,052 | $10,590 |
| 2/28/2018 | $10,845 | $10,386 | $10,041 | $10,490 |
| 3/31/2018 | $10,878 | $10,384 | $10,046 | $10,557 |
| 4/30/2018 | $10,861 | $10,353 | $10,120 | $10,478 |
| 5/31/2018 | $10,937 | $10,431 | $10,225 | $10,553 |
| 6/30/2018 | $10,978 | $10,464 | $10,276 | $10,540 |
| 7/31/2018 | $11,012 | $10,499 | $10,330 | $10,543 |
| 8/31/2018 | $11,054 | $10,498 | $10,361 | $10,610 |
| 9/30/2018 | $11,030 | $10,451 | $10,325 | $10,542 |
| 10/31/2018 | $10,991 | $10,438 | $10,323 | $10,459 |
| 11/30/2018 | $11,020 | $10,510 | $10,384 | $10,521 |
| 12/31/2018 | $11,078 | $10,597 | $10,461 | $10,715 |
| 1/31/2019 | $11,143 | $10,677 | $10,542 | $10,828 |
| 2/28/2019 | $11,225 | $10,721 | $10,591 | $10,822 |
| 3/31/2019 | $11,358 | $10,787 | $10,679 | $11,030 |
| 4/30/2019 | $11,410 | $10,792 | $10,698 | $11,033 |
| 5/31/2019 | $11,529 | $10,889 | $10,795 | $11,229 |
| 6/30/2019 | $11,588 | $10,939 | $10,850 | $11,370 |
| 7/31/2019 | $11,662 | $11,014 | $10,922 | $11,395 |
| 8/31/2019 | $11,811 | $11,071 | $11,004 | $11,690 |
| 9/30/2019 | $11,780 | $10,997 | $10,959 | $11,628 |
| 10/31/2019 | $11,793 | $11,042 | $11,004 | $11,663 |
| 11/30/2019 | $11,830 | $11,066 | $11,040 | $11,657 |
| 12/31/2019 | $11,882 | $11,095 | $11,087 | $11,649 |
| 1/31/2020 | $12,077 | $11,206 | $11,220 | $11,873 |
| 2/29/2020 | $12,218 | $11,264 | $11,312 | $12,086 |
| 3/31/2020 | $11,231 | $11,025 | $10,849 | $12,015 |
| 4/30/2020 | $11,052 | $11,020 | $10,775 | $12,229 |
| 5/31/2020 | $11,272 | $11,274 | $10,993 | $12,286 |
| 6/30/2020 | $11,570 | $11,313 | $11,103 | $12,363 |
| 7/31/2020 | $11,745 | $11,417 | $11,240 | $12,548 |
| 8/31/2020 | $11,774 | $11,410 | $11,260 | $12,447 |
| 9/30/2020 | $11,780 | $11,424 | $11,283 | $12,440 |
| 10/31/2020 | $11,787 | $11,403 | $11,285 | $12,384 |
| 11/30/2020 | $11,979 | $11,463 | $11,372 | $12,506 |
| 12/31/2020 | $12,161 | $11,496 | $11,483 | $12,523 |
| 1/31/2021 | $12,383 | $11,530 | $11,573 | $12,433 |
| 2/28/2021 | $12,284 | $11,444 | $11,509 | $12,254 |
| 3/31/2021 | $12,354 | $11,482 | $11,569 | $12,101 |
| 4/30/2021 | $12,464 | $11,522 | $11,638 | $12,196 |
| 5/31/2021 | $12,533 | $11,525 | $11,681 | $12,236 |
| 6/30/2021 | $12,619 | $11,527 | $11,732 | $12,322 |
| 7/31/2021 | $12,718 | $11,585 | $11,806 | $12,460 |
| 8/31/2021 | $12,690 | $11,577 | $11,812 | $12,436 |
| 9/30/2021 | $12,599 | $11,534 | $11,779 | $12,328 |
| 10/31/2021 | $12,563 | $11,507 | $11,767 | $12,325 |
| 11/30/2021 | $12,655 | $11,526 | $11,807 | $12,361 |
| 12/31/2021 | $12,683 | $11,537 | $11,833 | $12,330 |
| 1/31/2022 | $12,383 | $11,314 | $11,643 | $12,064 |
| 2/28/2022 | $12,292 | $11,280 | $11,617 | $11,930 |
| 3/31/2022 | $11,931 | $11,060 | $11,415 | $11,598 |
| 4/30/2022 | $11,653 | $10,913 | $11,265 | $11,158 |
| 5/31/2022 | $11,704 | $11,055 | $11,368 | $11,230 |
| 6/30/2022 | $11,498 | $11,028 | $11,318 | $11,054 |
| 7/31/2022 | $11,729 | $11,195 | $11,489 | $11,324 |
| 8/31/2022 | $11,613 | $11,035 | $11,351 | $11,004 |
| 9/30/2022 | $11,263 | $10,787 | $11,081 | $10,529 |
| 10/31/2022 | $11,172 | $10,772 | $11,069 | $10,392 |
| 11/30/2022 | $11,491 | $11,027 | $11,322 | $10,774 |
| 12/31/2022 | $11,527 | $11,062 | $11,360 | $10,726 |
| 1/31/2023 | $11,776 | $11,249 | $11,561 | $11,056 |
| 2/28/2023 | $11,656 | $11,064 | $11,415 | $10,770 |
| 3/31/2023 | $11,726 | $11,248 | $11,565 | $11,043 |
| 4/30/2023 | $11,737 | $11,202 | $11,561 | $11,110 |
| 5/31/2023 | $11,675 | $11,119 | $11,501 | $10,989 |
| 6/30/2023 | $11,797 | $11,190 | $11,587 | $10,950 |
| 7/31/2023 | $11,844 | $11,223 | $11,641 | $10,943 |
| 8/31/2023 | $11,799 | $11,166 | $11,597 | $10,873 |
| 9/30/2023 | $11,645 | $11,011 | $11,467 | $10,596 |
| 10/31/2023 | $11,543 | $11,005 | $11,437 | $10,429 |
| 11/30/2023 | $11,864 | $11,363 | $11,791 | $10,901 |
| 12/31/2023 | $12,034 | $11,513 | $11,956 | $11,319 |
| 1/31/2024 | $12,093 | $11,483 | $11,954 | $11,288 |
| 2/29/2024 | $12,161 | $11,493 | $11,991 | $11,128 |
| 3/31/2024 | $12,228 | $11,480 | $12,020 | $11,231 |
| 4/30/2024 | $12,201 | $11,406 | $11,982 | $10,947 |
| 5/31/2024 | $12,253 | $11,360 | $11,976 | $11,133 |
| 6/30/2024 | $12,374 | $11,467 | $12,107 | $11,238 |
| 7/31/2024 | $12,461 | $11,574 | $12,210 | $11,501 |
| 8/31/2024 | $12,557 | $11,702 | $12,354 | $11,666 |
| 9/30/2024 | $12,689 | $11,775 | $12,430 | $11,822 |
The Fund’s benchmarks are unmanaged indices used as a general measure of market performance. Calculations assume the reinvestment of dividends and capital gains.
Average Annual Total Returns (%)
| 1 Year | 5 Years | Since Inception 6/15/15 |
|---|
| Class I at NAV | 8.96% | 1.50% | 2.60% |
| Bloomberg Municipal Bond 1-8 Year Index | 6.93% | 1.38% | 1.77% |
| Bloomberg Municipal Bond 1-8 Year 50% + Bloomberg Municipal HY 1-8 Year 50% | 8.40% | 2.55% | 2.37% |
Bloomberg Aggregate Bond IndexFootnote Reference* | 11.57% | 0.33% | 1.82% |
| Footnote | Description |
Footnote* | The Fund has adopted the Bloomberg Aggregate Bond Index as its broad-based securities market index. |
The Fund's past performance is no guarantee of future results. The returns do not reflect the deduction of taxes that a shareholder would pay on Fund distributions or redemption of Fund shares.
(as of September 30, 2024)
| Total Net Assets | $1,521,124,171 |
| # of Portfolio Holdings | 399 |
| Portfolio Turnover Rate | 38% |
| Total Advisory Fees Paid | $3,808,830 |
What did the Fund invest in?
(as of September 30, 2024)
Credit Rating S&P or Moody'sFootnote Reference(a) | %Footnote Reference** |
|---|
| |
- A3.98%
- A-3.14%
- A+6.31%
- AA1.50%
- AA-1.83%
- AA+0.95%
- AAA1.04%
- B1.10%
- B-0.68%
- B+4.20%
- BB5.39%
- BB-7.06%
- BB+7.99%
- BBB5.96%
- BBB-9.91%
- BBB+6.72%
- CCC+0.63%
- NR31.61%
- Total 100.00%
| Footnote | Description |
Footnote** | Represents percent of total investments, which excludes derivatives. |
Footnote(a) | Investments in investment grade municipal bonds, which as bonds that are rated, at the time of purchase, within the four highest grades assigned by an independent rating agency such as Moody’s, S&P, or Fitch, or an equivalent short-term rating, as applicable, or are unrated by rating agencies but deemed by Lord Abbett to be of comparable quality. Lower rated municipal bonds are rated, at the time of purchase, or an equivalent short-term rating, as applicable, by an independent rating agency or are unrated by rating agencies but deemed by Lord Abbett to be of comparable quality. |
There were no material fund changes during the period.
Where can I find additional information about the Fund?
For additional information about the Fund, including its Prospectus, Statement of Additional Information, financial statements, holdings and proxy information, please visit lordabbett.com/FundDocuments.
The Fund has adopted a policy that allows it to send only one copy of the Fund's prospectus, proxy material, annual report and semiannual report (or related notice of internet availability of annual report and semiannual report) to certain shareholders residing at the same "household." This reduces Fund expenses, which benefits you and other shareholders.If you need additional copies or do not want your mailings to be "householded," please call Lord Abbett at 888-522-2388.
Lord Abbett Short Duration High Income Municipal Bond Fund
Annual Shareholder Report
September 30, 2024
lordabbett.com/FundDocuments
TSR-A-3388-I
11/24
| Item 1(b): | Not applicable. |
| | (a) | In accordance with applicable requirements, the Registrant adopted a Sarbanes-Oxley Code of Ethics on June 19, 2003 that applies to the principal executive officer and senior financial officers of the Registrant (“Code of Ethics”). The Code of Ethics was in effect during the fiscal year ended September 30, 2024 (the “Period”). |
| | | |
| | (b) | Not applicable. |
| | | |
| | (c) | The Registrant has not amended the Code of Ethics as described in Form N-CSR during the Period. |
| | | |
| | (d) | The Registrant has not granted any waiver, including an implicit waiver, from a provision of the Code of Ethics as described in Form N-CSR during the Period. |
| | | |
| | (e) | Not applicable. |
| | | |
| | (f) | See Item 19(a)(1) concerning the filing of the Code of Ethics. |
| | | |
| Item 3: | Audit Committee Financial Expert. |
| The Registrant’s board of directors has determined that each of the following independent directors who are members of the audit committee is an audit committee financial expert: Evelyn E. Guernsey and Karla M. Rabusch. Each of these persons is independent within the meaning of the Form N-CSR. |
| | |
| Item 4: | Principal Accountant Fees and Services. |
| In response to sections (a), (b), (c) and (d) of Item 4, the aggregate fees billed to the Registrant for the fiscal years ended September 30, 2024 and 2023 by the Registrant’s principal accounting firm, Deloitte & Touche LLP, the member firms of Deloitte Touche Tohmatsu and their respective affiliates (collectively, “Deloitte”) were as follows: |
| | |
| | Fiscal year ended: |
| | | | |
| | 2024 | | 2023 |
| | | | |
| Audit Fees {a} | $394,000 | | $385,000 |
| | | | |
| Audit-Related Fees | - 0 - | | - 0 - |
| | | | |
| Total audit and audit-related fees | $394,000 | | $385,000 |
| | | | |
| Tax Fees | - 0 - | | - 0 - |
| | | | |
| All Other Fees {b} | - 0 - | | - 0 - |
| Total Fees | $394,000 | | $385,000 |
| {a} | Consists of fees for audits of the Registrant’s annual financial statements. |
| | |
| {b} | Fees for the fiscal year ended September 30, 2024 and 2023 consist of fees for services related to the recovery of excess dividend withholding taxes in certain jurisdictions. |
| | |
| (e) | (1) | Pursuant to Rule 2-01(c) (7) of Regulation S-X, the Registrant’s Audit Committee has adopted pre-approval policies and procedures. Such policies and procedures generally provide that the Audit Committee must pre-approve: |
| | | |
| · | any audit, audit-related, tax, and other services to be provided to the Lord Abbett Funds, including the Registrant, and |
| | | |
| · | any audit-related, tax, and other services to be provided to the Registrant’s investment adviser and any entity controlling, controlled by or under common control with the investment adviser that provides ongoing services to one or more Funds comprising the Registrant if the engagement relates directly to operations and financial reporting of a Fund, by the independent auditor to assure that the provision of such services does not impair the auditor’s independence. |
The Audit Committee has delegated pre-approval authority to its Chair, subject to a fee limit of $10,000 per event, and not to exceed $25,000 annually. The Chair will report any pre-approval decisions to the Audit Committee at its next scheduled meeting. Unless a type of service to be provided by the independent auditor has received general pre-approval, it must be pre-approved by the Audit Committee. Any proposed services exceeding pre-approved cost levels will require specific pre-approval by the Audit Committee.
| (e) | (2) | The Registrant’s Audit Committee has approved 100% of the services described in paragraphs (b) through (d) of this Item 4, no amount was approved by the Audit Committee pursuant to paragraph (c)(7)(i)(C) of Rule 2-01 of Regulation S-X. |
| (f) | Not applicable. |
| | |
| (g) | The aggregate non-audit fees billed by Deloitte for services rendered to the Registrant are shown above in the response to Item 4 (a), (b), (c) and (d) as “All Other Fees”. |
The aggregate non-audit fees billed by Deloitte for services rendered to the Registrant’s investment adviser, Lord, Abbett & Co. LLC (“Lord Abbett”), for the fiscal years ended September 30, 2024 and 2023 were:
| | Fiscal year ended: |
| | |
| | 2024 | | 2023 |
| | | | |
| All Other Fees {a} | $250,000 | | $230,000 |
| {a} | Consist of fees for Independent Services Auditors’ Report on Controls Placed in Operation and Tests of Operating Effectiveness related to Lord Abbett’s Asset Management Services (“SOC-1 Report”). |
The aggregate non-audit fees billed by Deloitte for services rendered to entities under the common control of Lord Abbett for the fiscal years ended September 30, 2024 and 2023 were:
| | Fiscal year ended: |
| | |
| | 2024 | | 2023 |
| | | | |
| All Other Fees | $ - 0 - | | $ - 0- |
| (h) | The Registrant’s Audit Committee has considered the provision of non-audit services that were rendered to the Registrant’s investment adviser, and any entity controlling, controlled by or under common control with the investment adviser that provides ongoing services to the Registrant, that were not pre-approved pursuant to Rule 2-01 (c)(7)(ii) of Regulation S-X and has determined that the provision of such services is compatible with maintaining Deloitte’s independence. |
| (i) | Not Applicable. |
| | |
| (j) | Not Applicable. |
| | |
| Item 5: | Audit Committee of Listed Registrants. |
| Not applicable. |
| | |
| Item 6: | Investments. |
| The Registrant’s “Schedule I – Investments in securities of unaffiliated issuers” as of the close of the reporting period is included under Item 7 of this Form N-CSR. |
| | |
| Item 7: | Financial Statements and Financial Highlights for Open-End Management Investment Companies. |
| | |
| Item 8: | Changes in and Disagreements with Accountants for Open-End Management Investment Companies. |
| | |
| Item 9: | Proxy Disclosures for Open-End Management Investment Companies. |
| | |
| Item 10: | Remuneration Paid to Directors, Officers, and Others for Open-End Management Investment Companies. |
| | |
| Item 11: | Statement Regarding Basis for Approval of Investment Advisory Contract. |

LORD ABBETT
FINANCIAL STATEMENTS
AND OTHER IMPORTANT
INFORMATION
Lord Abbett Municipal Income Fund
Short Duration Tax Free Fund
Intermediate Tax Free Fund
National Tax Free Fund
High Income Municipal Bond Fund
Short Duration High Income Municipal Bond Fund
Sustainable Municipal Bond Fund
California Tax Free Fund
New Jersey Tax Free Fund
New York Tax Free Fund
For the fiscal year ended September 30, 2024
Table of Contents
Schedule of Investments
SHORT DURATION TAX FREE FUND September 30, 2024
| Investments | | Interest
Rate | | Maturity
Date | | Credit
Rating:
S&P or
Moody’s(a) | | Principal
Amount | | | Fair
Value | |
| LONG-TERM INVESTMENTS 81.56% | | | | | | | | | | | | | | |
| | | | | | | | | | | | | | | |
| MUNICIPAL BONDS 81.56% | | | | | | | | | | | | | | |
| | | | | | | | | | | | | | | |
| Corporate-Backed 5.15% | | | | | | | | | | | | | | |
| Allegheny County Industrial Development Authority–United States Steel Corp PA | | 4.875% | | 11/1/2024 | | BB- | | $ | 6,375,000 | | | $ | 6,381,528 | |
| Black Belt Energy Gas District AL | | 4.00% | #(b) | 10/1/2052 | | A2 | | | 15,000,000 | | | | 15,144,670 | |
| City of Farmington–Public Service Co of New Mexico | | 3.90% | #(b) | 6/1/2040 | | BBB | | | 2,500,000 | | | | 2,575,765 | |
| County of Nez Perce–PotlatchDeltic Corp ID | | 2.75% | | 10/1/2024 | | BBB- | | | 11,310,000 | | | | 11,310,000 | |
| Development Authority of Burke County–Oglethorpe Power Corp GA | | 1.50% | #(b) | 1/1/2040 | | BBB+ | | | 3,750,000 | | | | 3,701,954 | |
| Industrial Development Board of the City of Mobile Alabama–Alabama Power Co AL | | 1.00% | #(b) | 6/1/2034 | | A1 | | | 3,100,000 | | | | 3,041,619 | |
| Industrial Development Board of the City of Mobile Alabama–Alabama Power Co AL | | 3.65% | #(b) | 7/15/2034 | | A1 | | | 5,000,000 | | | | 4,996,845 | |
| Iowa Finance Authority–Howmet Aerospace Inc | | 4.75% | | 8/1/2042 | | Baa1 | | | 2,500,000 | | | | 2,502,792 | |
| Niagara Area Development Corp.–Covanta Holding Corp NY† | | 3.50% | | 11/1/2024 | | B | | | 750,000 | | | | 749,937 | |
| Ohio Air Quality Development Authority–American Electric Power Co Inc | | 2.40% | #(b) | 12/1/2038 | | BBB | | | 10,700,000 | | | | 10,122,006 | |
| Ohio Air Quality Development Authority–Ohio valley Electric Corp | | 1.50% | #(b) | 2/1/2026 | | Baa3 | | | 1,000,000 | | | | 964,518 | |
| Parish of St. James–NuStar Logistics LP LA† | | 5.85% | #(b) | 8/1/2041 | | BB+ | | | 3,500,000 | | | | 3,547,507 | |
| Parish of St. John the Baptist–Marathon Oil Corp LA | | 2.375% | #(b) | 6/1/2037 | | BBB- | | | 4,575,000 | | | | 4,496,628 | |
| Parish of St. John the Baptist–Marathon Oil Corp LA | | 4.05% | #(b) | 6/1/2037 | | BBB- | | | 4,650,000 | | | | 4,701,523 | |
| Virginia Resources Authority | | 5.00% | | 11/1/2036 | | Aa1 | | | 2,365,000 | | | | 2,789,191 | |
| Virginia Resources Authority | | 5.00% | | 11/1/2038 | | Aa1 | | | 2,845,000 | | | | 3,318,676 | |
| Total | | | | | | | | | | | | | 80,345,159 | |
| | See Notes to Financial Statements. | 1 |
Schedule of Investments (continued)
SHORT DURATION TAX FREE FUND September 30, 2024
| | | | | | | Credit | | | | | | |
| | | | | | | Rating: | | | | | | |
| | | Interest | | Maturity | | S&P or | | Principal | | | Fair | |
| Investments | | Rate | | Date | | Moody’s(a) | | Amount | | | Value | |
| Education 4.97% | | | | | | | | | | | | |
| California Community Choice Financing Authority | | 4.943%
(SOFR * .67 + 1.70% | )# | 5/1/2053 | | A1 | | $ | 15,000,000 | | | $ | 15,057,822 | |
| California State University | | 0.55% | #(b) | 11/1/2049 | | Aa2 | | | 5,000,000 | | | | 4,648,145 | |
| Capital Trust Agency, Inc.–Renaissance Charter School Inc Series 2019 Obligated Group FL† | | 4.00% | | 6/15/2029 | | NR | | | 1,050,000 | | | | 1,028,773 | |
| Clifton Higher Education Finance Corp.–International Leadership of Texas Inc (PSF-GTD) | | 5.00% | | 8/15/2026 | | Aaa | | | 1,000,000 | | | | 1,043,516 | |
| Clifton Higher Education Finance Corp.–International Leadership of Texas Inc (PSF-GTD) | | 5.00% | | 8/15/2027 | | Aaa | | | 1,400,000 | | | | 1,493,668 | |
| Clifton Higher Education Finance Corp.–International Leadership of Texas Inc (PSF-GTD) | | 5.00% | | 8/15/2028 | | Aaa | | | 800,000 | | | | 869,918 | |
| Florida Higher Educational Facilities Financial Authority–St Leo University Inc Obligated Group | | 5.00% | | 3/1/2025 | | BB | | | 675,000 | | | | 670,109 | |
| Hospital Facilities Authority of Multnomah County Oregon–Mirabella South Waterfront | | 5.00% | | 10/1/2024 | | NR | | | 335,000 | | | | 335,000 | |
| Illinois Finance Authority–Illinois Institute of Technology | | 5.00% | | 9/1/2028 | | Ba2 | | | 1,135,000 | | | | 1,148,220 | |
| Illinois Finance Authority–Illinois Institute of Technology | | 5.00% | | 9/1/2029 | | Ba2 | | | 630,000 | | | | 639,291 | |
| Louisiana Public Facilities Authority–Tulane University | | 5.00% | | 4/15/2037 | | A+ | | | 1,250,000 | | | | 1,453,273 | |
| Louisiana State Citizens Property Insurance Corp. | | 5.00% | | 6/1/2025 | | A1 | | | 7,490,000 | | | | 7,582,401 | |
| Louisiana State Citizens Property Insurance Corp. | | 5.00% | | 6/1/2026 | | A1 | | | 6,740,000 | | | | 6,990,360 | |
| New Jersey Educational Facilities Authority–Montclair State University Inc (AGM) | | 5.00% | | 7/1/2027 | | AA | | | 1,445,000 | | | | 1,541,927 | |
| New York State Dormitory Authority–Pace University | | 5.00% | | 5/1/2025 | | BBB- | | | 625,000 | | | | 630,262 | |
| New York State Dormitory Authority–Pace University | | 5.00% | | 5/1/2026 | | BBB- | | | 1,375,000 | | | | 1,414,724 | |
| New York State Dormitory Authority–Pace University | | 5.00% | | 5/1/2027 | | BBB- | | | 1,500,000 | | | | 1,575,322 | |
| | |
| 2 | See Notes to Financial Statements. |
Schedule of Investments (continued)
SHORT DURATION TAX FREE FUND September 30, 2024
| Investments | | Interest
Rate | | Maturity
Date | | Credit
Rating:
S&P or
Moody’s(a) | | Principal
Amount | | | Fair
Value | |
| Education (continued) | | | | | | | | | | | | | | |
| New York State Dormitory Authority–Pace University | | 5.00% | | 5/1/2028 | | BBB- | | $ | 1,480,000 | | | $ | 1,578,830 | |
| New York State Dormitory Authority–Pace University | | 5.00% | | 5/1/2036 | | BBB- | | | 2,500,000 | | | | 2,816,274 | |
| New York State Dormitory Authority–Pace University | | 5.00% | | 5/1/2037 | | BBB- | | | 3,000,000 | | | | 3,360,855 | |
| Northside Independent School District TX (PSF-GTD) | | 3.45% | #(b) | 8/1/2054 | | Aaa | | | 4,000,000 | | | | 4,064,918 | |
| Ohio Air Quality Development Authority–Duke Energy Corp | | 4.00% | #(b) | 9/1/2030 | | BBB | | | 1,300,000 | | | | 1,323,561 | |
| School District of Broward County FL COPS | | 5.00% | | 7/1/2035 | | Aa3 | | | 5,000,000 | | | | 5,701,225 | |
| Sierra Vista Industrial Development Authority–American Leadership Academy Inc AZ†(c) | | 5.00% | | 6/15/2034 | | NR | | | 625,000 | | | | 654,940 | |
| University of Colorado | | 2.00% | #(b) | 6/1/2054 | | Aa1 | | | 10,000,000 | | | | 9,989,710 | |
| Total | | | | | | | | | | | | | 77,613,044 | |
| |
| Energy 0.54% | | | | | | | | | | | | | | |
| New Mexico Municipal Energy Acquisition Authority | | 5.00% | #(b) | 11/1/2039 | | Aa1 | | | 8,300,000 | | | | 8,379,460 | |
| |
| General Obligation 14.32% | | | | | | | | | | | | | | |
| California State Public Works Board | | 5.00% | | 10/1/2026 | | NR | | | 90,000 | | | | 94,884 | |
| California State Public Works Board | | 5.00% | | 10/1/2026 | | Aa3 | | | 1,410,000 | | | | 1,486,239 | |
| California State Public Works Board | | 5.00% | | 10/1/2027 | | NR | | | 205,000 | | | | 221,673 | |
| California State Public Works Board | | 5.00% | | 10/1/2027 | | Aa3 | | | 3,095,000 | | | | 3,330,839 | |
| City of Chicago IL GO | | 5.00% | | 1/1/2026 | | BBB+ | | | 6,890,000 | | | | 7,045,558 | |
| City of Chicago IL GO | | 5.00% | | 1/1/2027 | | BBB+ | | | 6,400,000 | | | | 6,665,065 | |
| City of Chicago IL GO | | 5.25% | | 1/1/2027 | | BBB+ | | | 1,665,000 | | | | 1,671,481 | |
| City of Hutto TX GO (BAM) | | 5.00% | | 8/1/2037 | | AA | | | 3,715,000 | | | | 4,258,329 | |
| City of Jersey City NJ GO | | 4.50% | | 7/10/2025 | | NR | | | 10,000,000 | | | | 10,105,929 | |
| City of Lees Summit MO GO | | 5.00% | | 4/1/2027 | | Aaa | | | 3,960,000 | | | | 4,206,638 | |
| Commonwealth Financing Authority–Commonwealth of Pennsylvania Department of Community & Economic Development PA | | 5.00% | | 6/1/2025 | | A1 | | | 2,895,000 | | | | 2,934,944 | |
| County of Cook IL GO | | 4.00% | | 11/15/2026 | | A+ | | | 4,945,000 | | | | 5,086,133 | |
| County of Lake IL GO | | 4.00% | | 11/30/2027 | | AAA | | | 2,620,000 | | | | 2,731,805 | |
| | | |
| | See Notes to Financial Statements. | 3 |
Schedule of Investments (continued)
SHORT DURATION TAX FREE FUND September 30, 2024
| Investments | | Interest
Rate | | Maturity
Date | | Credit
Rating:
S&P or
Moody’s(a) | | Principal
Amount | | | Fair
Value | |
| General Obligation (continued) | | | | | | | | | | | | | | |
| Danville Community School Corp IN (ST INTERCEPT) | | 4.50% | | 12/15/2024 | | NR | | $ | 11,935,000 | | | $ | 11,956,837 | |
| Delaware Valley Regional Finance Authority PA | 3.55%
(MUNIPSA * 1 + .40% | )# | 3/1/2057 | | A+ | | | 6,070,000 | | | | 6,013,873 | |
| Eagle Mountain & Saginaw Independent School District TX (PSF-GTD) | | 4.00% | #(b) | 8/1/2050 | | AAA | | | 5,250,000 | | | | 5,423,384 | |
| Florida Insurance Assistance Interlocal Agency, Inc. | | 5.00% | | 9/1/2025 | | A | | | 25,540,000 | | | | 25,736,773 | |
| Louisiana Stadium & Exposition District | | 5.00% | | 7/1/2035 | | A2 | | | 2,690,000 | | | | 3,062,161 | |
| Louisiana Stadium & Exposition District | | 5.00% | | 7/1/2036 | | A2 | | | 4,325,000 | | | | 4,897,727 | |
| New Caney Independent School District TX (PSF-GTD) | | 4.00% | #(b) | 2/15/2050 | | Aaa | | | 6,500,000 | | | | 6,715,907 | |
| Portland Community College District OR GO | | 5.00% | | 6/15/2038 | | AA+ | | | 3,500,000 | | | | 4,041,522 | |
| Schenectady City School District NY (ST AID WITHHLDG) | | 4.00% | | 7/25/2025 | | NR | | | 15,000,000 | | | | 15,109,932 | |
| State of California GO | | 5.00% | | 8/1/2037 | | Aa2 | | | 17,725,000 | | | | 20,955,833 | |
| State of Illinois GO | | 5.00% | | 3/1/2025 | | A- | | | 4,000,000 | | | | 4,030,466 | |
| State of Illinois GO | | 5.00% | | 3/1/2025 | | A- | | | 5,500,000 | | | | 5,541,891 | |
| State of Illinois GO | | 5.00% | | 12/1/2025 | | A- | | | 10,000,000 | | | | 10,241,114 | |
| State of Illinois GO | | 5.00% | | 3/1/2026 | | A- | | | 4,050,000 | | | | 4,171,764 | |
| State of Illinois GO | | 5.00% | | 11/1/2027 | | A- | | | 5,000,000 | | | | 5,331,016 | |
| State of Illinois GO | | 5.00% | | 2/1/2028 | | A- | | | 5,990,000 | | | | 6,286,455 | |
| State of Illinois GO | | 5.00% | | 10/1/2029 | | A- | | | 2,115,000 | | | | 2,284,681 | |
| State of Illinois GO | | 5.00% | | 11/1/2030 | | A- | | | 7,200,000 | | | | 7,460,425 | |
| State of Illinois GO | | 5.00% | | 5/1/2037 | | A- | | | 4,500,000 | | | | 5,067,728 | |
| State of Maryland GO | | 4.00% | | 8/1/2028 | | AAA | | | 5,000,000 | | | | 5,296,637 | |
| State of New Jersey GO | | 5.00% | | 6/1/2027 | | A1 | | | 5,000,000 | | | | 5,334,618 | |
| Washington Metropolitan Area Transit Authority Dedicated Revenue DC | | 5.00% | | 7/15/2035 | | AA | | | 1,000,000 | | | | 1,166,456 | |
| Washington Metropolitan Area Transit Authority Dedicated Revenue DC | | 5.00% | | 7/15/2036 | | AA | | | 5,000,000 | | | | 5,533,237 | |
| Washington Metropolitan Area Transit Authority Dedicated Revenue DC | | 5.00% | | 7/15/2036 | | AA | | | 1,800,000 | | | | 2,089,227 | |
| Total | | | | | | | | | | | | | 223,589,181 | |
| | |
| 4 | See Notes to Financial Statements. |
Schedule of Investments (continued)
SHORT DURATION TAX FREE FUND September 30, 2024
| Investments | | Interest
Rate | | Maturity
Date | | Credit
Rating:
S&P or
Moody’s(a) | | Principal
Amount | | | Fair
Value | |
| Health Care 14.36% | | | | | | | | | | | | | | |
| Allegheny County Hospital Development Authority–Allegheny Health Network Obligated Group PA | | 5.00% | | 4/1/2026 | | A | | $ | 2,500,000 | | | $ | 2,574,111 | |
| Berks County Municipal Authority–Tower Health Obligated Group PA | | Zero Coupon | | 6/30/2044 | | NR | | | 1,399,000 | | | | 891,945 | |
| Berks County Municipal Authority–Tower Health Obligated Group PA | | 5.00% | | 6/30/2039 | | NR | | | 2,801,000 | | | | 2,776,716 | |
| Berks County Municipal Authority–Tower Health Obligated Group PA | | 6.00% | | 6/30/2034 | | NR | | | 198,834 | | | | 216,197 | |
| Berks County Municipal Authority–Tower Health Obligated Group PA | | 6.00% | | 6/30/2034 | | NR | | | 10,063 | | | | 10,942 | |
| Berks County Municipal Authority–Tower Health Obligated Group PA | | 8.00% | | 6/30/2034 | | NR | | | 396,773 | | | | 406,117 | |
| Berks County Municipal Authority–Tower Health Obligated Group PA | | 8.00% | | 6/30/2034 | | NR | | | 20,126 | | | | 20,126 | |
| Brevard County Health Facilities Authority–Health First Inc Obligated Group FL | | 5.00% | | 4/1/2027 | | A | | | 3,590,000 | | | | 3,775,190 | |
| Brevard County Health Facilities Authority–Health First Inc Obligated Group FL | | 5.00% | | 4/1/2028 | | A | | | 3,720,000 | | | | 3,982,278 | |
| California Health Facilities Financing Authority–Adventist Health System/West Obligated Group CA | | 5.00% | | 12/1/2037 | | BBB+ | | | 8,000,000 | | | | 8,970,512 | |
| California Municipal Finance Authority–Eisenhower Medical Center | | 5.00% | | 7/1/2026 | | Baa2 | | | 1,345,000 | | | | 1,382,286 | |
| California Municipal Finance Authority–Palomar Health Obligated Group COPS† | | 5.00% | | 11/1/2027 | | BB+ | | | 10,000,000 | | | | 10,218,739 | |
| California Statewide Communities Development Authority–John Muir Health Obligated Group | | 5.00% | | 12/1/2038 | | A+ | | | 4,500,000 | | | | 5,251,830 | |
| Charlotte-Mecklenburg Hospital Authority–Atrium Health Obligated Group NC | | 5.00% | #(b) | 1/15/2050 | | AA | | | 4,275,000 | | | | 4,648,386 | |
| Chattanooga Health Educational & Housing Facility Board–Erlanger Health Obligated Group TN | | 5.00% | | 12/1/2035 | | A | | | 3,085,000 | | | | 3,511,747 | |
| Citizens Memorial Hospital District MO | | 5.00% | | 12/1/2026 | | NR | | | 8,825,000 | | | | 8,911,839 | |
| City of Colby KS–Citizens Medical Center Inc | | 5.50% | | 7/1/2026 | | NR | | | 5,600,000 | | | | 5,647,056 | |
| City of Lenexa–Lakeview Village Inc KS | | 5.00% | | 5/15/2025 | | BB+ | (d) | | 990,000 | | | | 993,195 | |
| | | |
| | See Notes to Financial Statements. | 5 |
Schedule of Investments (continued)
SHORT DURATION TAX FREE FUND September 30, 2024
| Investments | | Interest
Rate | | Maturity
Date | | Credit
Rating:
S&P or
Moody’s(a) | | Principal
Amount | | | Fair
Value | |
| Health Care (continued) | | | | | | | | | | | | | | |
| City of Seneca–Nemaha Valley Community Hospital KS | | 5.00% | | 9/1/2025 | | NR | | $ | 2,000,000 | | | $ | 2,010,113 | |
| Colorado Health Facilities Authority–AdventHealth Obligated Group | | 5.00% | #(b) | 11/15/2049 | | NR | | | 185,000 | | | | 194,510 | |
| Colorado Health Facilities Authority–AdventHealth Obligated Group | | 5.00% | #(b) | 11/15/2049 | | AA | | | 1,825,000 | | | | 1,908,011 | |
| County of Cuyahoga–MetroHealth System OH | | 5.00% | | 2/15/2025 | | BBB | | | 1,500,000 | | | | 1,504,547 | |
| County of Lehigh–St Luke’s Hospital Obligated Group PA | 4.25%
(MUNIPSA * 1 + 1.10% | )# | 8/15/2038 | | A- | | | 14,630,000 | | | | 14,531,997 | |
| Crawford County Memorial Hospital Inc LA | | 5.00% | | 6/15/2027 | | NR | | | 1,260,000 | | | | 1,280,093 | |
| Gainesville & Hall County Hospital Authority–Northeast Georgia Health System Obligated Group GA | | 5.00% | | 10/15/2034 | | A | | | 4,250,000 | | | | 4,903,922 | |
| Harris County Cultural Education Facilities Finance Corp.–Memorial Hermann Health System Obligated Group TX | | 4.00%
(MUNIPSA * 1 + .85% | )# | 7/1/2049 | | AA- | | | 11,000,000 | | | | 10,997,376 | |
| Harris County Cultural Education Facilities Finance Corp.–Memorial Hermann Health System Obligated Group TX | | 5.00% | | 7/1/2037 | | AA- | | | 6,000,000 | | | | 6,921,623 | |
| Harris County Cultural Education Facilities Finance Corp.–Memorial Hermann Health System Obligated Group TX | | 5.00% | #(b) | 7/1/2049 | | AA- | | | 5,420,000 | | | | 5,686,687 | |
| Health & Educational Facilities Authority of the State of Missouri–SSM Health Care Obligated Group WA | | 5.00% | #(b) | 6/1/2039 | | A+ | | | 10,000,000 | | | | 10,725,960 | |
| Hospitals & Higher Education Facilities Authority of Philadelphia–Temple University Health Obligated Group PA | | 5.00% | | 7/1/2027 | | BBB | | | 5,000,000 | | | | 5,185,309 | |
| Illinois Finance Authority–Plymouth Place Obligated Group | | 5.00% | | 5/15/2025 | | NR | | | 270,000 | | | | 272,921 | |
| Illinois Finance Authority–University of Chicago Medical Center Obligated Group | | 5.00% | #(b) | 8/15/2052 | | AA- | | | 8,825,000 | | | | 9,322,774 | |
| Industrial Development Authority of the County of Pima–La Posada at Park Centre Inc Obligated Group AZ† | | 5.125% | | 11/15/2029 | | NR | | | 1,500,000 | | | | 1,514,813 | |
| Kentucky Economic Development Finance Authority–Owensboro Health Inc Obligated Group | | 5.00% | | 6/1/2025 | | Baa2 | | | 1,400,000 | | | | 1,404,923 | |
| | |
| 6 | See Notes to Financial Statements. |
Schedule of Investments (continued)
SHORT DURATION TAX FREE FUND September 30, 2024
| Investments | | Interest
Rate | | Maturity
Date | | Credit
Rating:
S&P or
Moody’s(a) | | Principal
Amount | | | Fair
Value | |
| Health Care (continued) | | | | | | | | | | | | | | |
| Maricopa County Industrial Development Authority–Banner Health Obligated Group AZ | | 3.72%
(MUNIPSA * 1 + .57% | )# | 1/1/2035 | | AA- | | $ | 4,240,000 | | | $ | 4,239,699 | |
| Massachusetts Development Finance Agency–Tufts Medicine Obligated Group | | 5.00% | | 7/1/2025 | | BBB- | | | 800,000 | | | | 808,425 | |
| Metropolitan Government Nashville & Davidson County Health & Educational Facilities Board–Vanderbilt University Medical Center Obligated Group TN | | 5.00% | | 7/1/2028 | | A | | | 1,500,000 | | | | 1,619,392 | |
| New Jersey Health Care Facilities Financing Authority–RWJ Barnabas Health Obligated Group | | 5.00% | | 7/1/2037 | | AA- | | | 3,055,000 | | | | 3,554,916 | |
| New Jersey Health Care Facilities Financing Authority–RWJ Barnabas Health Obligated Group | | 5.00% | | 7/1/2038 | | AA- | | | 2,500,000 | | | | 2,889,513 | |
| New Jersey Health Care Facilities Financing Authority–RWJ Barnabas Health Obligated Group | | 5.00% | | 7/1/2039 | | AA- | | | 5,000,000 | | | | 5,772,839 | |
| New Jersey Health Care Facilities Financing Authority–St Joseph’s Healthcare System Obligated Group | | 5.00% | | 7/1/2025 | | BBB- | | | 1,600,000 | | | | 1,611,406 | |
| New York State Dormitory Authority–Montefiore Obligated Group | | 5.00% | | 9/1/2027 | | BBB- | | | 1,400,000 | | | | 1,451,547 | |
| New York State Dormitory Authority–Montefiore Obligated Group | | 5.00% | | 9/1/2028 | | BBB- | | | 1,500,000 | | | | 1,572,582 | |
| New York State Dormitory Authority–Montefiore Obligated Group | | 5.00% | | 9/1/2029 | | BBB- | | | 1,750,000 | | | | 1,840,257 | |
| New York State Dormitory Authority–Montefiore Obligated Group | | 5.00% | | 9/1/2030 | | BBB- | | | 1,000,000 | | | | 1,057,242 | |
| Northampton County General Purpose Authority–St Luke’s Hospital Obligated Group PA | | 5.00% | | 8/15/2027 | | A- | | | 3,250,000 | | | | 3,446,121 | |
| Oklahoma Development Finance Authority–OU Medicine Obligated Group | | 5.00% | | 8/15/2025 | | BB | | | 550,000 | | | | 550,809 | |
| Oklahoma Development Finance Authority–OU Medicine Obligated Group | | 5.00% | | 8/15/2026 | | BB | | | 800,000 | | | | 820,627 | |
| Shelby County Health Educational & Housing Facilities Board–Baptist Memorial Health Care Obligated Group TN | | 5.00% | #(b) | 9/1/2049 | | BBB+ | | | 8,750,000 | | | | 9,453,412 | |
| | | |
| | See Notes to Financial Statements. | 7 |
Schedule of Investments (continued)
SHORT DURATION TAX FREE FUND September 30, 2024
| Investments | | Interest
Rate | | Maturity
Date | | Credit
Rating:
S&P or
Moody’s(a) | | Principal
Amount | | | Fair
Value | |
| Health Care (continued) | | | | | | | | | | | | | | |
| South Carolina Jobs-Economic Development Authority–Kiawah Life Plan Village Inc | | 5.25% | | 11/15/2028 | | NR | | $ | 2,850,000 | | | $ | 2,866,128 | |
| South Carolina Jobs-Economic Development Authority–Novant Health Obligated Group | | 5.00% | | 11/1/2037 | | A+ | | | 4,000,000 | | | | 4,592,784 | |
| State of Ohio–University Hospitals Health System Inc Obligated Group | | 5.00% | | 1/15/2027 | | A | | | 250,000 | | | | 260,951 | |
| Tarrant County Cultural Education Facilities Finance Corp.–Baylor Scott & White Health Obligated Group TX | | 5.00% | #(b) | 11/15/2052 | | AA- | | | 2,180,000 | | | | 2,241,914 | |
| Tulsa County Industrial Authority–Montereau Obligated Group OK | | 5.00% | | 11/15/2026 | | BBB- | (d) | | 500,000 | | | | 508,017 | |
| Washington Health Care Facilities Authority–CommonSpirit Health Obligated Group | 4.55%
(MUNIPSA * 1 + 1.40% | )# | 1/1/2035 | | A- | | | 2,000,000 | | | | 2,000,982 | |
| Washington Health Care Facilities Authority–CommonSpirit Health Obligated Group | | 5.00% | | 8/1/2029 | | A- | | | 3,425,000 | | | | 3,762,187 | |
| Washington Health Care Facilities Authority–CommonSpirit Health Obligated Group | | 5.00% | | 8/1/2029 | | A- | | | 3,500,000 | | | | 3,844,571 | |
| Washington Health Care Facilities Authority–CommonSpirit Health Obligated Group | | 5.00% | #(b) | 8/1/2049 | | A- | | | 7,515,000 | | | | 7,681,977 | |
| Winchester Economic Development Authority–Valley Health Obligated Group VA | | 5.00% | | 1/1/2039 | | A+ | | | 1,350,000 | | | | 1,527,040 | |
| Wisconsin Health & Educational Facilities Authority–Marshfield Clinic Health System Obligated Group | | 5.00% | | 2/15/2029 | | BBB | | | 6,200,000 | | | | 6,665,136 | |
| Wisconsin Health & Educational Facilities Authority–Wisconsin Masonic Home Obligated Group | | 4.20% | | 8/15/2028 | | BBB- | (d) | | 5,000,000 | | | | 5,042,494 | |
| Total | | | | | | | | | | | | | 224,237,759 | |
| |
| Housing 5.89% | | | | | | | | | | | | | | |
| California Housing Finance Agency–Del Sur Family Housing LP | | 5.00% | #(b) | 5/1/2054 | | Aaa | | | 1,750,000 | | | | 1,820,693 | |
| Connecticut Housing Finance Authority | | 4.00% | | 5/15/2049 | | AAA | | | 2,965,000 | | | | 3,004,519 | |
| Connecticut Housing Finance Authority | | 6.25% | | 5/15/2054 | | AAA | | | 2,435,000 | | | | 2,695,160 | |
| | |
| 8 | See Notes to Financial Statements. |
Schedule of Investments (continued)
SHORT DURATION TAX FREE FUND September 30, 2024
| Investments | | Interest
Rate | | Maturity
Date | | Credit
Rating:
S&P or
Moody’s(a) | | Principal
Amount | | | Fair
Value | |
| Housing (continued) | | | | | | | | | | | | | | |
| Michigan State Housing Development Authority | | 4.25% | | 12/1/2049 | | AA+ | | $ | 2,550,000 | | | $ | 2,588,359 | |
| Minnesota Housing Finance Agency (FHLMC), (FNMA), (GNMA) | | 4.25% | | 7/1/2049 | | AA+ | | | 2,065,000 | | | | 2,102,936 | |
| Minnesota Housing Finance Agency (FHLMC), (FNMA), (GNMA) | | 5.00% | | 7/1/2053 | | AA+ | | | 6,640,000 | | | | 6,964,929 | |
| Minnesota Housing Finance Agency (FHLMC), (FNMA), (GNMA) | | 6.25% | | 7/1/2054 | | AA+ | | | 5,680,000 | | | | 6,292,355 | |
| Minnesota Housing Finance Agency (FHLMC), (FNMA), (GNMA) | | 6.25% | | 1/1/2055 | | AA+ | | | 2,500,000 | | | | 2,860,007 | |
| Minnesota Housing Finance Agency (FHLMC), (FNMA), (GNMA) | | 6.50% | | 1/1/2055 | | AA+ | | | 3,550,000 | | | | 4,097,840 | |
| Missouri Housing Development Commission (FHLMC), (FNMA), (GNMA) | | 3.25% | | 11/1/2052 | | AA+ | | | 1,650,000 | | | | 1,641,006 | |
| New Jersey Housing & Mortgage Finance Agency | | 6.00% | | 10/1/2055 | | AA | | | 3,560,000 | | | | 3,947,506 | |
| New York State Housing Finance Agency (FHA), (SONYMA) | | 0.75% | | 11/1/2025 | | Aa2 | | | 3,955,000 | | | | 3,819,009 | |
| New York State Housing Finance Agency (SONYMA) | | 0.75% | | 11/1/2025 | | Aa2 | | | 8,055,000 | | | | 7,778,032 | |
| North Carolina Housing Finance Agency (FHLMC), (FNMA), (GNMA) | | 4.00% | | 1/1/2050 | | AA+ | | | 2,035,000 | | | | 2,051,136 | |
| North Carolina Housing Finance Agency (FHLMC), (FNMA), (GNMA) | | 6.25% | | 1/1/2055 | | AA+ | | | 5,495,000 | | | | 6,084,575 | |
| North Dakota Housing Finance Agency | | 4.00% | | 1/1/2050 | | Aa1 | | | 2,800,000 | | | | 2,836,788 | |
| Ohio Housing Finance Agency (FHLMC), (FNMA), (GNMA) | | 6.25% | | 3/1/2055 | | Aaa | | | 4,000,000 | | | | 4,500,659 | |
| Seattle Housing Authority–Yesler Block 6.6 LLLP WA (HUD) | | 5.00% | | 6/1/2027 | | AA | | | 7,000,000 | | | | 7,256,946 | |
| South Dakota Housing Development Authority (FHLMC), (FNMA), (GNMA) | | 6.25% | | 5/1/2055 | | AAA | | | 6,755,000 | | | | 7,555,613 | |
| State of New York Mortgage Agency Homeowner Mortgage Revenue | | 3.50% | | 4/1/2049 | | Aa1 | | | 545,000 | | | | 543,756 | |
| Texas State Affordable Housing Corp.–AHFC-FC Norman Housing LP | | 3.625% | #(b) | 1/1/2045 | | Aaa | | | 3,400,000 | | | | 3,447,691 | |
| Virginia Beach Development Authority–Westminster-Canterbury on Chesapeake Bay Obligated Group | | 5.375% | | 9/1/2029 | | BB+ | (d) | | 3,800,000 | | | | 3,961,005 | |
| | See Notes to Financial Statements. | 9 |
Schedule of Investments (continued)
SHORT DURATION TAX FREE FUND September 30, 2024
| Investments | | Interest
Rate | | Maturity
Date | | Credit
Rating:
S&P or
Moody’s(a) | | Principal
Amount | | | Fair
Value | |
| Housing (continued) | | | | | | | | | | | | | | |
| Wisconsin Housing & Economic Development Authority–East National LLC | | 5.00% | #(b) | 8/1/2058 | | Aaa | | $ | 2,000,000 | | | $ | 2,075,406 | |
| Wisconsin Housing & Economic Development Authority Housing Revenue (HUD) | | 0.81% | #(b) | 11/1/2052 | | AA+ | | | 2,035,000 | | | | 1,991,290 | |
| Total | | | | | | | | | | | | | 91,917,216 | |
| | | | | | | | | | | | | | | |
| Lease Obligations 1.75% | | | | | | | | | | | | | | |
| Commonwealth of Pennsylvania COPS | | 5.00% | | 7/1/2025 | | A | | | 500,000 | | | | 507,461 | |
| New Jersey Economic Development Authority–New Jersey Transit Corp | | 5.00% | | 11/1/2028 | | A2 | | | 1,315,000 | | | | 1,436,737 | |
| New Jersey Economic Development Authority–State Capitol Joint Management Commission | | 5.00% | | 6/15/2026 | | A2 | | | 4,000,000 | | | | 4,161,114 | |
| New Jersey Economic Development Authority–State of New Jersey Department of the Treasury | | 5.00% | | 6/15/2025 | | A2 | | | 1,250,000 | | | | 1,268,186 | |
| New Jersey Transportation Trust Fund Authority | | 5.00% | | 12/15/2024 | | A2 | | | 7,000,000 | | | | 7,022,355 | |
| New Jersey Transportation Trust Fund Authority | | 5.00% | | 12/15/2025 | | A2 | | | 12,500,000 | | | | 12,841,365 | |
| Total | | | | | | | | | | | | | 27,237,218 | |
| | | | | | | | | | | | | | | |
| Multi-Family Housing 0.17% | | | | | | | | | | | | | | |
| Illinois Housing Development Authority–South Shore IL Preservation LP (FHA), (HUD) | | 4.00% | #(b) | 6/1/2026 | | Aaa | | | 2,700,000 | | | | 2,710,145 | |
| | | | | | | | | | | | | | | |
| Other Revenue 3.87% | | | | | | | | | | | | | | |
| Black Belt Energy Gas District AL | | 4.00% | #(b) | 12/1/2049 | | A1 | | | 12,325,000 | | | | 12,397,220 | |
| California Infrastructure & Economic Development Bank–Museum Associates | | 3.85%
(MUNIPSA * 1 + .70% | )# | 12/1/2050 | | A3 | | | 6,500,000 | | | | 6,499,438 | |
| Clifton Higher Education Finance Corp.–International Leadership of Texas Inc | | 5.25% | | 8/15/2026 | | Baa3 | | | 1,605,000 | | | | 1,630,907 | |
| Clifton Higher Education Finance Corp.–International Leadership of Texas Inc | | 5.25% | | 8/15/2028 | | Baa3 | | | 1,920,000 | | | | 1,953,659 | |
| Illinois Finance Authority–Field Museum Natural of History | | 4.588%
(SOFR * .67 + 1.20% | )# | 11/1/2034 | | A | | | 4,365,000 | | | | 4,360,576 | |
| 10 | See Notes to Financial Statements. |
Schedule of Investments (continued)
SHORT DURATION TAX FREE FUND September 30, 2024
| Investments | | Interest
Rate | | Maturity
Date | | Credit
Rating:
S&P or
Moody’s(a) | | Principal
Amount | | | Fair
Value | |
| Other Revenue (continued) | | | | | | | | | | | | | | |
| Industrial Development Authority of the County of Pima–Edkey Inc Obligated Group† | | 3.50% | | 7/1/2025 | | NR | | $ | 425,000 | | | $ | 421,934 | |
| Lower Alabama Gas District | | 4.00% | #(b) | 12/1/2050 | | A2 | | | 19,085,000 | | | | 19,197,205 | |
| Main Street Natural Gas, Inc. GA | | 5.00% | | 5/15/2025 | | A1 | | | 4,850,000 | | | | 4,883,532 | |
| Triborough Bridge & Tunnel Authority–Metropolitan Transportation Authority Payroll Mobility Tax Revenue NY | | 5.00% | #(b) | 5/15/2051 | | AA+ | | | 5,700,000 | | | | 5,882,292 | |
| Washington Convention & Sports Authority DC | | 5.00% | | 10/1/2030 | | Aa3 | | | 3,000,000 | | | | 3,194,132 | |
| Total | | | | | | | | | | | | | 60,420,895 | |
| | | | | | | | | | | | | | | |
| Pollution Control 0.35% | | | | | | | | | | | | | | |
| North Carolina Capital Facilities Finance Agency–Republic Services Inc | | 3.50% | #(b) | 7/1/2034 | | BBB+ | | | 5,500,000 | | | | 5,500,000 | |
| | | | | | | | | | | | | | | |
| Special Tax 0.42% | | | | | | | | | | | | | | |
| Allentown Neighborhood Improvement Zone Development Authority PA† | | 5.00% | | 5/1/2028 | | NR | | | 2,495,000 | | | | 2,573,231 | |
| New York City Industrial Development Agency–Yankee Stadium LLC NY (FGIC) | | 3.775%
(CPI YoY * 1 + 0.88% | ) | 3/1/2026 | | Baa1 | | | 2,000,000 | | | | 2,006,188 | |
| Village Community Development District No. 13 FL† | | 1.875% | | 5/1/2025 | | NR | | | 590,000 | | | | 585,365 | |
| Village Community Development District No. 13 FL† | | 2.625% | | 5/1/2030 | | NR | | | 1,460,000 | | | | 1,383,410 | |
| Total | | | | | | | | | | | | | 6,548,194 | |
| | | | | | | | | | | | | | | |
| Tax Revenue 1.76% | | | | | | | | | | | | | | |
| City of Sparks NV† | | 2.75% | | 6/15/2028 | | Baa2 | | | 180,000 | | | | 176,200 | |
| Massachusetts Bay Transportation Authority Sales Tax Revenue | | 5.00% | | 7/1/2038 | | AA+ | | | 7,000,000 | | | | 8,264,753 | |
| Matching Fund Special Purpose Securitization Corp.–United States Virgin Islands Federal Excise Tax | | 5.00% | | 10/1/2026 | | NR | | | 2,000,000 | | | | 2,064,852 | |
| New Jersey Transportation Trust Fund Authority | | 5.00% | | 6/15/2028 | | A2 | | | 3,995,000 | | | | 4,336,170 | |
| New York State Dormitory Authority (AGM) | | 5.00% | | 10/1/2024 | | AA | | | 5,000 | | | | 5,000 | |
| | See Notes to Financial Statements. | 11 |
Schedule of Investments (continued)
SHORT DURATION TAX FREE FUND September 30, 2024
| Investments | | Interest
Rate | | Maturity
Date | | Credit
Rating:
S&P or
Moody’s(a) | | Principal
Amount | | | Fair
Value | |
| Tax Revenue (continued) | | | | | | | | | | | | | | |
| New York State Dormitory Authority (AGM) | | 5.00% | | 10/1/2024 | | AA | | $ | 2,245,000 | | | $ | 2,245,000 | |
| New York State Urban Development Corp.–State of New York Personal Income Tax Revenue | | 5.00% | | 3/15/2038 | | Aa1 | | | 4,650,000 | | | | 5,371,393 | |
| Sales Tax Securitization Corp. IL | | 5.00% | | 1/1/2025 | | AA- | | | 5,000,000 | | | | 5,021,683 | |
| Total | | | | | | | | | | | | | 27,485,051 | |
| | | | | | | | | | | | | | | |
| Taxable Revenue–Water & Sewer 2.80% | | | | | | | | | | | | | | |
| Augusta Water & Sewer Revenue GA(c) | | 5.00% | | 10/1/2037 | | A+ | | | 10,000,000 | | | | 11,672,991 | |
| City of Houston Combined Utility System Revenue TX | | 5.00% | | 11/15/2037 | | Aa2 | | | 2,000,000 | | | | 2,322,018 | |
| City of Houston Combined Utility System Revenue TX | | 5.00% | | 11/15/2038 | | Aa2 | | | 3,250,000 | | | | 3,742,568 | |
| Jersey City Municipal Utilities Authority Sewer Fund NJ | | 5.00% | | 5/1/2025 | | NR | | | 4,875,000 | | | | 4,915,174 | |
| Pittsburgh Water & Sewer Authority PA (AGM) | | 5.00% | | 9/1/2036 | | AA | | | 6,750,000 | | | | 7,826,043 | |
| Pittsburgh Water & Sewer Authority PA (AGM) | | 5.00% | | 9/1/2037 | | AA | | | 4,750,000 | | | | 5,491,123 | |
| Water Works Board of the City of Birmingham/The AL† | | 3.75% | | 9/1/2026 | | NR | | | 7,750,000 | | | | 7,759,437 | |
| Total | | | | | | | | | | | | | 43,729,354 | |
| | | | | | | | | | | | | | | |
| Transportation 4.26% | | | | | | | | | | | | | | |
| Central Texas Regional Mobility Authority | | 5.00% | | 1/1/2025 | | A | | | 2,500,000 | | | | 2,504,746 | |
| Central Texas Turnpike System | | 5.00% | | 8/15/2031 | | A- | | | 4,500,000 | | | | 4,506,432 | |
| Central Texas Turnpike System | | 5.00% | | 8/15/2039 | | A- | | | 4,570,000 | | | | 5,152,403 | |
| Chicago O’Hare International Airport IL | | 5.00% | | 1/1/2031 | | A+ | | | 4,750,000 | | | | 4,752,304 | |
| Chicago Transit Authority Capital Grant Receipts Revenue IL | | 5.00% | | 6/1/2025 | | A+ | | | 2,000,000 | | | | 2,020,172 | |
| County of Clark–Regional Transportation Commission of Southern Nevada Motor Fuel Tax Revenue NV | | 5.00% | | 7/1/2037 | | Aa2 | | | 8,200,000 | | | | 9,534,322 | |
| Maryland Economic Development Corp.–CONSOL Marine Terminals LLC | | 5.75% | | 9/1/2025 | | BB | | | 3,505,000 | | | | 3,532,980 | |
| Metropolitan Transportation Authority NY | | 5.00% | | 11/15/2026 | | A- | | | 2,250,000 | | | | 2,360,276 | |
| Metropolitan Transportation Authority NY | | 5.00% | | 11/15/2026 | | A- | | | 1,675,000 | | | | 1,757,095 | |
| Metropolitan Transportation Authority NY | | 5.00% | | 11/15/2026 | | A- | | | 2,315,000 | | | | 2,428,462 | |
| New Jersey Transportation Trust Fund Authority | | 5.00% | | 6/15/2036 | | A2 | | | 5,500,000 | | | | 6,327,309 | |
| 12 | See Notes to Financial Statements. |
Schedule of Investments (continued)
SHORT DURATION TAX FREE FUND September 30, 2024
| Investments | | Interest
Rate | | Maturity
Date | | Credit
Rating:
S&P or
Moody’s(a) | | Principal
Amount | | | Fair
Value | |
| Transportation (continued) | | | | | | | | | | | | | | |
| New Jersey Turnpike Authority (AGM) | | 5.25% | | 1/1/2026 | | AA | | $ | 8,600,000 | | | $ | 8,781,016 | |
| North Carolina Turnpike Authority (AGM) | | 5.00% | | 1/1/2028 | | AA | | | 1,500,000 | | | | 1,576,901 | |
| North Texas Tollway Authority | | 5.00% | | 1/1/2026 | | AA- | | | 5,500,000 | | | | 5,666,112 | |
| Port Authority of New York & New Jersey | | 3.00% | | 12/1/2027 | | AA- | | | 2,500,000 | | | | 2,500,120 | |
| State of Illinois GO | | 5.00% | | 11/1/2025 | | A- | | | 3,000,000 | | | | 3,065,670 | |
| Total | | | | | | | | | | | | | 66,466,320 | |
| | | | | | | | | | | | | | | |
| Utilities 20.95% | | | | | | | | | | | | | | |
| Black Belt Energy Gas District AL | | 5.25% | #(b) | 5/1/2055 | | A1 | | | 3,750,000 | | | | 4,134,620 | |
| California Community Choice Financing Authority | | 5.25% | | 11/1/2054 | | A2 | | | 8,800,000 | | | | 9,584,002 | |
| Central Plains Energy Project NE | | 5.00% | | 9/1/2027 | | BBB+ | | | 1,305,000 | | | | 1,362,976 | |
| Central Plains Energy Project NE | | 5.423%
(SOFR * .67 + 2.18% | )# | 5/1/2053 | | A2 | | | 20,000,000 | | | | 20,839,086 | |
| City of Rockport–Indiana Michigan Power Co IN | | 3.05% | | 6/1/2025 | | A3 | | | 3,500,000 | | | | 3,485,743 | |
| City of San Antonio Electric & Gas Systems Revenue TX | | 5.00% | | 2/1/2037 | | Aa2 | | | 7,500,000 | | | | 8,684,839 | |
| City of Seattle Municipal Light & Power Revenue WA | 3.40%
(MUNIPSA * 1 + .25% | )# | 5/1/2045 | | AA | | | 5,000,000 | | | | 4,910,040 | |
| County of Jefferson Sewer Revenue AL | | 5.00% | | 10/1/2037 | | BBB+ | | | 12,035,000 | | | | 13,530,953 | |
| Delaware State Economic Development Authority–Delmarva Power & Light Co | | 1.05% | #(b) | 1/1/2031 | | A | | | 6,315,000 | | | | 6,190,110 | |
| Delaware State Economic Development Authority–NRG Energy Inc | | 1.25% | #(b) | 10/1/2040 | | BBB- | | | 10,000,000 | | | | 9,735,963 | |
| Delaware State Economic Development Authority–NRG Energy Inc | | 1.25% | #(b) | 10/1/2045 | | BBB- | | | 16,000,000 | | | | 15,577,541 | |
| Development Authority of Appling County–Oglethorpe Power Corp GA | | 1.50% | #(b) | 1/1/2038 | | BBB+ | | | 1,250,000 | | | | 1,233,985 | |
| Development Authority of Burke County–Georgia Power Co | | 2.875% | #(b) | 12/1/2049 | | A | | | 5,650,000 | | | | 5,607,652 | |
| Development Authority of Burke County–Georgia Power Co | | 3.375% | #(b) | 11/1/2048 | | BBB+ | | | 7,750,000 | | | | 7,838,288 | |
| Development Authority of Monroe County–Georgia Power Co | | 3.875% | #(b) | 6/1/2042 | | A | | | 6,000,000 | | | | 6,085,385 | |
| Development Authority of Monroe County–Oglethorpe Power Corp GA | | 1.50% | #(b) | 1/1/2039 | | BBB+ | | | 1,875,000 | | | | 1,850,977 | |
| Energy Southeast A Cooperative District AL | | 5.25% | #(b) | 7/1/2054 | | A1 | | | 6,000,000 | | | | 6,646,454 | |
| | See Notes to Financial Statements. | 13 |
Schedule of Investments (continued)
SHORT DURATION TAX FREE FUND September 30, 2024
| Investments | | Interest
Rate | | Maturity
Date | | Credit
Rating:
S&P or
Moody’s(a) | | Principal
Amount | | | Fair
Value | |
| Utilities (continued) | | | | | | | | | | | | | | |
| Energy Southeast A Cooperative District AL | | 5.443%
(SOFR * .67 + 2.20% | )# | 4/1/2054 | | A1 | | $ | 5,000,000 | | | $ | 5,126,375 | |
| Illinois Finance Authority–Peoples Gas Light & Coke Co/The | | 3.90% | | 3/1/2030 | | Aa3 | | | 5,000,000 | | | | 4,999,842 | |
| Indiana Finance Authority–Indianapolis Power & Light Co | | 0.65% | | 8/1/2025 | | A2 | | | 4,500,000 | | | | 4,385,759 | |
| Intermountain Power Agency UT | | 5.00% | | 7/1/2036 | | Aa3 | | | 4,000,000 | | | | 4,576,577 | |
| Intermountain Power Agency UT | | 5.00% | | 7/1/2037 | | Aa3 | | | 3,500,000 | | | | 3,992,552 | |
| Kentucky Municipal Power Agency | | 3.45% | #(b) | 9/1/2042 | | Baa1 | | | 1,700,000 | | | | 1,696,576 | |
| Kentucky Public Energy Authority | | 4.00% | #(b) | 12/1/2049 | | A1 | | | 10,000,000 | | | | 10,036,892 | |
| Kentucky Public Energy Authority | | 5.25% | #(b) | 4/1/2054 | | A1 | | | 10,000,000 | | | | 11,120,672 | |
| Long Island Power Authority NY | | 0.85% | #(b) | 9/1/2050 | | A | | | 12,000,000 | | | | 11,690,893 | |
| Louisiana Local Government Environmental Facilities & Community Development Authority–East Baton Rouge Sewerage Commission | | 0.875% | #(b) | 2/1/2046 | | A+ | | | 26,500,000 | | | | 26,348,131 | |
| Lower Colorado River Authority TX | | 5.00% | #(b) | 5/15/2039 | | A | | | 20,000,000 | | | | 21,076,240 | |
| Main Street Natural Gas, Inc. GA† | | 4.00% | #(b) | 8/1/2052 | | BBB- | | | 18,000,000 | | | | 17,977,885 | |
| Montgomery County Industrial Development Authority–Constellation Energy Generation LLC PA | | 4.10% | #(b) | 4/1/2053 | | BBB+ | | | 7,760,000 | | | | 7,979,461 | |
| Municipal Electric Authority of Georgia(c) | | 5.00% | | 1/1/2035 | | A2 | | | 3,895,000 | | | | 4,466,313 | |
| Municipal Electric Authority of Georgia(c) | | 5.00% | | 1/1/2036 | | A2 | | | 2,800,000 | | | | 3,196,806 | |
| New Jersey Economic Development Authority–New Jersey Transit Corp | | 5.00% | | 3/1/2028 | | A2 | | | 2,840,000 | | | | 3,075,105 | |
| Pennsylvania Economic Development Financing Authority–Talen Energy Supply LLC | | 5.25% | #(b) | 12/1/2038 | | BB- | | | 1,100,000 | | | | 1,121,118 | |
| Philadelphia Gas Works Co.–Philadelphia Gas Works Co | | 5.00% | | 8/1/2030 | | A | | | 2,000,000 | | | | 2,246,616 | |
| Philadelphia Gas Works Co.–Philadelphia Gas Works Co | | 5.00% | | 8/1/2031 | | A | | | 1,375,000 | | | | 1,559,499 | |
| Philadelphia Gas Works Co.–Philadelphia Gas Works Co | | 5.00% | | 8/1/2032 | | A | | | 3,000,000 | | | | 3,429,966 | |
| Public Power Generation Agency NE(c) | | 5.00% | | 1/1/2031 | | A2 | | | 1,500,000 | | | | 1,692,372 | |
| Public Power Generation Agency NE(c) | | 5.00% | | 1/1/2032 | | A2 | | | 1,200,000 | | | | 1,364,956 | |
| Southeast Energy Authority A Cooperative District AL | | 5.033%
(SOFR * .67 + 1.79% | )# | 5/1/2053 | | A2 | | | 18,000,000 | | | | 18,388,960 | |
| 14 | See Notes to Financial Statements. |
Schedule of Investments (continued)
SHORT DURATION TAX FREE FUND September 30, 2024
| Investments | | | | Interest
Rate | | Maturity
Date | | Credit
Rating:
S&P or
Moody’s(a) | | Principal
Amount | | | Fair
Value | |
| Utilities (continued) | | | | | | | | | | | | | | | | |
| Southern California Public Power Authority–City of Anaheim Electric System Revenue CA | | | | 5.00% | #(b) | 4/1/2055 | | A2 | | $ | 5,250,000 | | | $ | 5,686,180 | |
| Tennessee Energy Acquisition Corp. | | | | 5.625% | | 9/1/2026 | | BBB | | | 9,040,000 | | | | 9,419,951 | |
| Texas Municipal Gas Acquisition & Supply Corp. IV | | | | 5.25% | | 1/1/2030 | | A1 | | | 4,660,000 | | | | 5,065,423 | |
| West Virginia Economic Development Authority–Appalachian Power Co | | | | 0.625% | #(b) | 12/1/2038 | | BBB+ | | | 8,500,000 | | | | 8,106,364 | |
| Total | | | | | | | | | | | | | | | 327,126,098 | |
| Total Municipal Bonds (cost $1,263,327,466) | | | | | | | | | | 1,273,305,094 | |
| | | | | | | | | | | | | | | | | |
| | | Interest
Rate# | | Interest
Rate
Reset
Date(e) | | Final
Maturity
Date | | | | | | | | |
| | | | | | | | | | | | | | | | | |
| SHORT-TERM INVESTMENTS 17.15% | | | | | | | | | | | | | | | | |
| | | | | | | | | | | | | | | | | |
| VARIABLE RATE DEMAND NOTES 17.15% | | | | | | | | | | | | | | | | |
| | | | | | | | | | | | | | | | | |
| Education 3.36% | | | | | | | | | | | | | | | | |
| Connecticut State Health & Educational Facilities Authority–Yale University | | 3.600% | | 10/1/2024 | | 7/1/2042 | | AAA | | | 2,500,000 | | | | 2,500,000 | |
| New York State Dormitory Authority–Pace University | | 4.050% | | 10/1/2024 | | 5/1/2044 | | BBB- | | | 20,000,000 | | | | 20,000,000 | |
| Pennsylvania Higher Educational Facilities Authority–Thomas Jefferson University Obligated Group | | 3.950% | | 10/1/2024 | | 9/1/2045 | | A | | | 16,825,000 | | | | 16,825,000 | |
| Philadelphia Authority for Industrial Development–Thomas Jefferson University Obligated PA | | 3.950% | | 10/1/2024 | | 9/1/2050 | | A | | | 13,125,000 | | | | 13,125,000 | |
| Total | | | | | | | | | | | | | | | 52,450,000 | |
| | | | | | | | | | | | | | | | | |
| General Obligation 2.73% | | | | | | | | | | | | | | | | |
| City of New York NY GO | | 4.050% | | 10/1/2024 | | 10/1/2046 | | AA | | | 1,000,000 | | | | 1,000,000 | |
| City of New York NY GO | | 4.150% | | 10/1/2024 | | 4/1/2042 | | AA | | | 31,675,000 | | | | 31,675,000 | |
| Florida Insurance Assistance Interlocal Agency, Inc. | | 3.920% | | 10/1/2024 | | 9/1/2032 | | A2 | | | 10,000,000 | | | | 10,000,000 | |
| Total | | | | | | | | | | | | | | | 42,675,000 | |
| | | | | | | | | | | | | | | | | |
| Health Care 8.66% | | | | | | | | | | | | | | | | |
| Harris County Cultural Education Facilities Finance Corp.–Baylor College of Medicine TX | | 3.680% | | 10/1/2024 | | 11/15/2046 | | A | | | 39,975,000 | | | | 39,975,000 | |
| | See Notes to Financial Statements. | 15 |
Schedule of Investments (continued)
SHORT DURATION TAX FREE FUND September 30, 2024
| Investments | | Interest
Rate# | | Interest
Rate
Reset
Date(e) | | Final
Maturity
Date | | Credit
Rating:
S&P or
Moody’s(a) | | Principal
Amount | | | Fair
Value | |
| Health Care (continued) | | | | | | | | | | | | | | | | |
| Health Care Authority for Baptist Health–Brazos Presbyterian Homes Obligated Group AL | | 4.570% | | 10/1/2024 | | 11/1/2042 | | A3 | | $ | 29,133,000 | | | $ | 29,133,000 | |
| Rib Floater Trust Various States FL† | | 3.500% | | 10/1/2024 | | 10/1/2054 | | A1 | | | 19,380,000 | | | | 19,380,000 | |
| State of Ohio–University Hospitals Health System Inc Obligated Group | | 3.680% | | 10/1/2024 | | 1/15/2033 | | A | | | 10,000,000 | | | | 10,000,000 | |
| State of Ohio–University Hospitals Health System Inc Obligated Group | | 3.680% | | 10/1/2024 | | 1/15/2045 | | A | | | 10,035,000 | | | | 10,035,000 | |
| Wisconsin Health & Educational Facilities Authority–Marshfield Clinic Health System Obligated Group | | 5.000% | | 10/1/2024 | | 2/15/2053 | | BBB | | | 26,675,000 | | | | 26,675,000 | |
| Total | | | | | | | | | | | | | | | 135,198,000 | |
| | | | | | | | | | | | | | | | | |
| Home Furnishings 0.64% | | | | | | | | | | | | | | | | |
| Rib Floater Trust Various States MD† | | 3.500% | | 10/1/2024 | | 11/15/2049 | | A1 | | | 10,000,000 | | | | 10,000,000 | |
| | | | | | | | | | | | | | | | | |
| Pollution Control 1.53% | | | | | | | | | | | | | | | | |
| Port of Port Arthur Navigation District–Motiva Enterprises LLC TX | | 4.350% | | 10/1/2024 | | 4/1/2040 | | BBB+ | | | 23,900,000 | | | | 23,900,000 | |
| | | | | | | | | | | | | | | | | |
| Utilities 0.23% | | | | | | | | | | | | | | | | |
| Development Authority of Appling County–Georgia Power Co | | 4.400% | | 10/1/2024 | | 9/1/2041 | | A | | | 3,500,000 | | | | 3,500,000 | |
| Total Short-Term Investments (cost $267,723,000) | | | | | | | | | | 267,723,000 | |
| Total Investments in Securities 98.71% (cost $1,531,050,466) | | | | | | | | | | 1,541,028,094 | |
| Other Assets and Liabilities – Net 1.29% | | | | | | | | | | | | | | | 20,203,370 | |
| Net Assets 100.00% | | | | | | | | | | | | | | $ | 1,561,231,464 | |
| AGM | | Insured by–Assured Guaranty Municipal Corporation. |
| BAM | | Insured by–Build America Mutual. |
| COPS | | Certificates of Participation. |
| CPI | | Consumer Price Index: Rate fluctuates based on CPI. |
| FGIC | | Insured by–Financial Guaranty Insurance Company. |
| FHA | | Insured by–Federal Housing Administration. |
| FHLMC | | Insured by–Federal Home Loan Mortgage Corporation. |
| FNMA | | Federal National Mortgage Association. |
| GNMA | | Government National Mortgage Association. |
| GTD | | Guaranteed. |
| HUD | | Insured by–Department of Housing and Urban Development. |
| MUNIPSA | | SIFMA Municipal Swap Index Yield. |
| NR | | Not Rated. |
| 16 | See Notes to Financial Statements. |
Schedule of Investments (concluded)
SHORT DURATION TAX FREE FUND September 30, 2024
| PSF | | Permanent School Fund. |
| SIFMA | | Insured by–Securities Industry and Financial Markets Association. |
| SOFR | | Secured Overnight Financing Rate. |
| SONYMA | | State of New York Mortgage Agency. |
| ST INTERCEPT | | State Intercept. |
| YoY | | Year on Year Inflation Rates. |
| # | | Variable rate security. The interest rate represents the rate in effect at September 30, 2024. |
| † | | Security was purchased pursuant to Rule 144A under the Securities Act of 1933 and, unless registered under such Act or exempted from registration, may only be resold to qualified institutional buyers. At September 30, 2024, the total value of Rule 144A securities was $77,972,171, which represents 4.99% of net assets. |
| (a) | | Unaudited. |
| (b) | | Variable Rate is Fixed to Float: Rate remains fixed or at Zero Coupon until designated future date. |
| (c) | | Securities purchased on a when-issued basis (See Note 2g)). |
| (d) | | This investment has been rated by Fitch IBCA. |
| (e) | | The interest rate reset date shown represents the date in which the Fund has the right to sell a Variable Rate Demand Note (“VRDN”) back to the issuer for Principal Amount. The interest rate on the VRDN is generally reset daily based on the SIFMA Municipal Swap Index. |
The following is a summary of the inputs used as of September 30, 2024 in valuing the Fund’s investments carried at fair value(1):
| Investment Type(2) | | Level 1 | | | Level 2 | | | Level 3 | | | Total | |
| Long-Term Investments | | | | | | | | | | | | | | | | |
| Municipal Bonds | | $ | – | | | $ | 1,273,305,094 | | | $ | – | | | $ | 1,273,305,094 | |
| Short-Term Investments | | | | | | | | | | | | | | | | |
| Variable Rate Demand Notes | | | – | | | | 267,723,000 | | | | – | | | | 267,723,000 | |
| Total | | $ | – | | | $ | 1,541,028,094 | | | $ | – | | | $ | 1,541,028,094 | |
| (1) | | Refer to Note 2(i) for a description of fair value measurements and the three-tier hierarchy of inputs. |
| (2) | | See Schedule of Investments for fair values in each industry. The table above is presented by Investment Type. Industries are presented within an Investment Type should such Investment Type include securities classified as two or more levels within the three-tier fair value hierarchy. When applicable, each Level 3 security is identified on the Schedule of Investments along with the valuation technique utilized. |
A reconciliation of Level 3 investments is presented when the Fund has a material amount of Level 3 investments at the beginning or end of the year in relation to the Fund’s net assets.
| | See Notes to Financial Statements. | 17 |
Schedule of Investments
INTERMEDIATE TAX FREE FUND September 30, 2024
| Investments | | Interest
Rate | | Maturity
Date | | Credit
Rating:
S&P or
Moody’s(a) | | Principal
Amount | | | Fair
Value | |
| LONG-TERM INVESTMENTS 98.76% | | | | | | | | | | | | | | |
| | | | | | | | | | | | | | | |
| MUNICIPAL BONDS 98.76% | | | | | | | | | | | | | | |
| | | | | | | | | | | | | | | |
| Corporate-Backed 9.79% | | | | | | | | | | | | | | |
| Allegheny County Industrial Development Authority–United States Steel Corp PA | | 4.875% | | 11/1/2024 | | BB- | | $ | 6,745,000 | | | $ | 6,751,907 | |
| Arizona Industrial Development Authority | | 3.625% | | 5/20/2033 | | BBB | | | 9,097,225 | | | | 8,923,980 | |
| Black Belt Energy Gas District AL | | 4.00% | #(b) | 10/1/2052 | | A2 | | | 31,580,000 | | | | 31,884,580 | |
| Build NYC Resource Corp.–Pratt Paper Inc NY AMT† | | 4.50% | | 1/1/2025 | | NR | | | 420,000 | | | | 420,578 | |
| Build NYC Resource Corp.–Pratt Paper Inc NY AMT† | | 5.00% | | 1/1/2035 | | NR | | | 550,000 | | | | 551,597 | |
| Cabot Citrus Farms Community Development District FL | | 5.25% | | 3/1/2029 | | NR | | | 3,900,000 | | | | 3,952,384 | |
| California Infrastructure & Economic Development Bank–DesertXpress Enterprises LLC AMT† | | 8.00% | #(b) | 1/1/2050 | | NR | | | 6,000,000 | | | | 6,179,527 | |
| California Municipal Finance Authority–Waste Management Inc AMT | | 4.125% | #(b) | 10/1/2041 | | A- | | | 7,250,000 | | | | 7,292,037 | |
| City of Farmington–Public Service Co of New Mexico | | 3.90% | #(b) | 6/1/2040 | | BBB | | | 7,000,000 | | | | 7,212,141 | |
| City of Granite City–Waste Management of Illinois Inc IL AMT | | 1.25% | | 5/1/2027 | | A- | | | 5,485,000 | | | | 5,035,885 | |
| City of Henderson–Pratt Paper LLC KY AMT† | | 3.70% | | 1/1/2032 | | NR | | | 7,470,000 | | | | 7,399,371 | |
| City of Houston Airport System Revenue–United Airlines Inc TX AMT | | 5.00% | | 7/1/2029 | | BB- | | | 2,295,000 | | | | 2,296,047 | |
| Development Authority of Burke County–Oglethorpe Power Corp GA | | 1.50% | #(b) | 1/1/2040 | | BBB+ | | | 3,750,000 | | | | 3,701,954 | |
| Downtown Doral South Community Development District FL† | | 4.75% | | 12/15/2038 | | NR | | | 625,000 | | | | 635,424 | |
| Florida Development Finance Corp.–Waste pro USA Inc AMT† | | 6.125% | #(b) | 7/1/2032 | | NR | | | 7,430,000 | | | | 7,638,376 | |
| Greater Orlando Aviation Authority–JetBlue Airways Corp FL | | 5.00% | | 11/15/2026 | | NR | | | 2,980,000 | | | | 2,982,478 | |
| Hobe-St Lucie Conservancy District Unit of Development No 1A | | 5.60% | | 5/1/2044 | | NR | | | 1,845,000 | | | | 1,932,252 | |
| Hoover Industrial Development Board–United States Steel Corp AL AMT | | 6.375% | #(b) | 11/1/2050 | | BB- | | | 8,525,000 | | | | 9,831,963 | |
| Indiana Finance Authority–Ohio Valley Electric Corp | | 2.50% | | 11/1/2030 | | Baa3 | | | 1,000,000 | | | | 932,337 | |
| Indiana Finance Authority–Ohio Valley Electric Corp | | 3.00% | | 11/1/2030 | | Baa3 | | | 5,600,000 | | | | 5,449,419 | |
| 18 | See Notes to Financial Statements. |
Schedule of Investments (continued)
INTERMEDIATE TAX FREE FUND September 30, 2024
| Investments | | Interest
Rate | | Maturity
Date | | Credit
Rating:
S&P or
Moody’s(a) | | Principal
Amount | | | Fair
Value | |
| Corporate-Backed (continued) | | | | | | | | | | | | | | |
| Indiana Finance Authority–Ohio Valley Electric Corp | | 3.00% | | 11/1/2030 | | Baa3 | | $ | 9,850,000 | | | $ | 9,579,867 | |
| Indiana Finance Authority–United States Steel Corp | | 4.125% | | 12/1/2026 | | BB- | | | 1,625,000 | | | | 1,651,388 | |
| Indiana Finance Authority–United States Steel Corp AMT | | 6.75% | | 5/1/2039 | | BB- | | | 1,500,000 | | | | 1,742,685 | |
| Industrial Development Authority of the County of Yavapai–Waste Management Inc AZ AMT | | 1.30% | | 6/1/2027 | | A- | | | 4,650,000 | | | | 4,263,449 | |
| Industrial Development Board of the City of Mobile Alabama–Alabama Power Co AL | | 3.65% | #(b) | 7/15/2034 | | A1 | | | 7,500,000 | | | | 7,495,267 | |
| Iowa Finance Authority–Howmet Aerospace Inc | | 4.75% | | 8/1/2042 | | Baa1 | | | 13,710,000 | | | | 13,725,311 | |
| Iowa Finance Authority–Iowa Fertilizer Co LLC | | 4.00% | #(b) | 12/1/2050 | | AA+ | | | 11,050,000 | | | | 12,146,538 | |
| Kansas City Industrial Development Authority MO AMT | | 5.00% | | 3/1/2035 | | A | | | 3,020,000 | | | | 3,175,284 | |
| Louisiana Local Government Environmental Facilities & Community Development Authority–Westlake Corp | | 3.50% | | 11/1/2032 | | BBB+ | | | 7,655,000 | | | | 7,543,443 | |
| Louisiana Public Facilities Authority–Waste Pro USA Inc AMT† | | 6.75% | #(b) | 10/1/2053 | | NR | | | 12,000,000 | | | | 13,060,622 | |
| Maryland Economic Development Corp.(c) | | 5.00% | | 12/1/2016 | | NR | | | 2,570,000 | | | | 1,667,288 | |
| Massachusetts Development Finance Agency–Waste Management of Massachusetts Inc AMT† | | 1.25% | | 5/1/2027 | | A- | | | 3,250,000 | | | | 2,983,888 | |
| Matagorda County Navigation District No. 1–AEP Texas Inc | | 2.60% | | 11/1/2029 | | BBB+ | | | 6,800,000 | | | | 6,538,991 | |
| Matagorda County Navigation District No. 1–AEP Texas Inc | | 4.00% | | 6/1/2030 | | BBB+ | | | 8,000,000 | | | | 8,004,070 | |
| Michigan Strategic Fund–Graphic Packaging International LLC AMT | | 4.00% | #(b) | 10/1/2061 | | BB | | | 5,640,000 | | | | 5,672,331 | |
| Mission Economic Development Corp.–Natgasoline LLC TX AMT† | | 4.625% | | 10/1/2031 | | BB- | | | 10,000,000 | | | | 10,046,430 | |
| New Hampshire Business Finance Authority | | 4.125% | | 1/20/2034 | | BBB | | | 4,642,269 | | | | 4,717,093 | |
| New Hampshire Business Finance Authority–Covanta Holding Corp AMT† | | 3.75% | #(b) | 7/1/2045 | | B | | | 1,970,000 | | | | 1,705,560 | |
| New Hampshire Business Finance Authority–Covanta Holding Corp AMT† | | 4.00% | | 11/1/2027 | | B | | | 6,225,000 | | | | 6,225,023 | |
| | See Notes to Financial Statements. | 19 |
Schedule of Investments (continued)
INTERMEDIATE TAX FREE FUND September 30, 2024
| Investments | | Interest
Rate | | Maturity
Date | | Credit
Rating:
S&P or
Moody’s(a) | | Principal
Amount | | | Fair
Value | |
| Corporate-Backed (continued) | | | | | | | | | | | | | | |
| New Hampshire Business Finance Authority–New York State Electric & Gas Corp AMT | | 4.00% | | 12/1/2028 | | A- | | $ | 9,235,000 | | | $ | 9,399,558 | |
| New Jersey Economic Development Authority–United Airlines Inc | | 5.25% | | 9/15/2029 | | BB- | | | 15,990,000 | | | | 16,008,686 | |
| New Jersey Economic Development Authority–United Airlines Inc | | 5.50% | | 6/1/2033 | | BB- | | | 1,500,000 | | | | 1,510,199 | |
| New York City Industrial Development Agency–TRIPS Obligated Group NY | | 5.00% | | 7/1/2028 | | BBB+ | | | 2,450,000 | | | | 2,451,096 | |
| New York Liberty Development Corp. | | 2.50% | | 11/15/2036 | | A+ | | | 2,500,000 | | | | 2,157,583 | |
| New York Liberty Development Corp.–3 World Trade Center LLC† | | 5.15% | | 11/15/2034 | | NR | | | 1,875,000 | | | | 1,877,492 | |
| New York Liberty Development Corp.–3 World Trade Center LLC† | | 7.25% | | 11/15/2044 | | NR | | | 1,920,000 | | | | 1,923,848 | |
| New York Liberty Development Corp.–Goldman Sachs Headquarters LLC | | 5.25% | | 10/1/2035 | | A2 | | | 16,385,000 | | | | 19,351,322 | |
| New York State Environmental Facilities Corp.–Casella Waste Systems Inc AMT | | 2.75% | #(b) | 9/1/2050 | | B+ | | | 2,900,000 | | | | 2,863,430 | |
| New York State Environmental Facilities Corp.–Casella Waste Systems Inc AMT† | | 2.875% | #(b) | 12/1/2044 | | B+ | | | 2,000,000 | | | | 1,893,949 | |
| New York State Environmental Facilities Corp.–Casella Waste Systems Inc AMT† | | 5.125% | #(b) | 9/1/2050 | | B+ | | | 1,000,000 | | | | 1,052,901 | |
| New York Transportation Development Corp.–American Airlines Inc AMT | | 5.00% | | 8/1/2026 | | B+ | | | 1,285,000 | | | | 1,287,392 | |
| New York Transportation Development Corp.–American Airlines Inc AMT | | 5.25% | | 8/1/2031 | | B+ | | | 1,620,000 | | | | 1,735,632 | |
| New York Transportation Development Corp.–American Airlines Inc AMT | | 5.375% | | 8/1/2036 | | B+ | | | 1,850,000 | | | | 1,985,419 | |
| New York Transportation Development Corp.–Delta Air Lines Inc AMT | | 5.00% | | 1/1/2026 | | Baa3 | | | 3,110,000 | | | | 3,162,167 | |
| Niagara Area Development Corp.–Covanta Holding Corp NY† | | 3.50% | | 11/1/2024 | | B | | | 4,650,000 | | | | 4,649,607 | |
| Niagara Area Development Corp.–Covanta Holding Corp NY AMT† | | 4.75% | | 11/1/2042 | | B | | | 5,500,000 | | | | 5,350,123 | |
| Ohio Air Quality Development Authority–American Electric Power Co Inc | | 2.40% | #(b) | 12/1/2038 | | BBB | | | 5,685,000 | | | | 5,377,907 | |
| Ohio Air Quality Development Authority–American Electric Power Co Inc AMT | | 2.50% | #(b) | 11/1/2042 | | BBB | | | 8,800,000 | | | | 8,306,613 | |
| Ohio Air Quality Development Authority–American Electric Power Co Inc AMT | | 2.60% | #(b) | 6/1/2041 | | BBB | | | 18,210,000 | | | | 17,271,373 | |
| 20 | See Notes to Financial Statements. |
Schedule of Investments (continued)
INTERMEDIATE TAX FREE FUND September 30, 2024
| Investments | | Interest
Rate | | Maturity
Date | | Credit
Rating:
S&P or
Moody’s(a) | | Principal
Amount | | | Fair
Value | |
| Corporate-Backed (continued) | | | | | | | | | | | | | | |
| Parish of St. James–NuStar Logistics LP LA† | | 5.85% | #(b) | 8/1/2041 | | BB+ | | $ | 7,685,000 | | | $ | 7,789,312 | |
| Parish of St. James–NuStar Logistics LP LA† | | 6.10% | #(b) | 6/1/2038 | | BB+ | | | 1,500,000 | | | | 1,679,174 | |
| Parish of St. James–NuStar Logistics LP LA† | | 6.10% | #(b) | 12/1/2040 | | BB+ | | | 9,825,000 | | | | 11,025,234 | |
| Parish of St. John the Baptist–Marathon Oil Corp LA | | 2.20% | #(b) | 6/1/2037 | | BBB- | | | 6,000,000 | | | | 5,879,533 | |
| Parish of St. John the Baptist–Marathon Oil Corp LA | | 2.375% | #(b) | 6/1/2037 | | BBB- | | | 12,480,000 | | | | 12,266,211 | |
| Parish of St. John the Baptist–Marathon Oil Corp LA | | 4.05% | #(b) | 6/1/2037 | | BBB- | | | 7,750,000 | | | | 7,835,872 | |
| Pennsylvania Economic Development Financing Authority–CONSOL Energy Inc AMT† | | 9.00% | #(b) | 4/1/2051 | | BB | | | 2,375,000 | | | | 2,736,818 | |
| Pennsylvania Economic Development Financing Authority–Covanta Holding Corp AMT† | | 3.25% | | 8/1/2039 | | B | | | 1,035,000 | | | | 862,212 | |
| Pennsylvania Economic Development Financing Authority–Procter & Gamble Co | | 5.375% | | 3/1/2031 | | AA- | | | 1,365,000 | | | | 1,539,550 | |
| Phenix City Industrial Development Board–WestRock Coated Board LLC AL AMT | | 4.125% | | 5/15/2035 | | BBB | | | 1,500,000 | | | | 1,499,956 | |
| Port of Beaumont Industrial Development Authority–Jefferson 2020 Bond Lessee & Borrower LLC Obligated Group TX† | | 4.10% | | 1/1/2028 | | NR | | | 8,000,000 | | | | 7,190,431 | |
| Port of Beaumont Navigation District–Jefferson 2020 Bond Lessee & Borrower LLC Obligated Group TX† | | 10.00% | | 7/1/2026 | | NR | | | 5,000,000 | | | | 5,159,467 | |
| Public Finance Authority–Sky Harbour Capital LLC Obligated Group WI AMT | | 4.00% | | 7/1/2036 | | NR | | | 5,000,000 | | | | 4,707,617 | |
| Public Finance Authority–Sky Harbour Capital LLC Obligated Group WI AMT | | 4.00% | | 7/1/2041 | | NR | | | 7,220,000 | | | | 6,444,937 | |
| Public Finance Authority–TRIPS Obligated Group WI AMT | | 5.00% | | 7/1/2042 | | BBB+ | | | 7,650,000 | | | | 7,652,019 | |
| Public Finance Authority–TRIPS Obligated Group WI AMT | | 5.25% | | 7/1/2028 | | BBB+ | | | 2,150,000 | | | | 2,152,185 | |
| Public Finance Authority–Waste Management Inc WI AMT | | 1.10% | #(b) | 7/1/2029 | | A- | | | 8,000,000 | | | | 7,645,540 | |
| Public Finance Authority WI† | | 5.375% | | 12/15/2032 | | NR | | | 3,000,000 | | | | 3,009,552 | |
| Tuscaloosa County Industrial Development Authority–Hunt Refining Co AL† | | 5.25% | | 5/1/2044 | | NR | | | 6,740,000 | | | | 6,916,117 | |
| Vermont Economic Development Authority–Casella Waste Systems Inc AMT† | | 5.00% | #(b) | 6/1/2052 | | B+ | | | 5,500,000 | | | | 5,626,876 | |
| Village Community Development District No 15 Series 2024 Special Assessment FL†(d) | | 4.55% | | 5/1/2044 | | NR | | | 5,500,000 | | | | 5,586,459 | |
| | See Notes to Financial Statements. | 21 |
Schedule of Investments (continued)
INTERMEDIATE TAX FREE FUND September 30, 2024
| Investments | | Interest
Rate | | Maturity
Date | | Credit
Rating:
S&P or
Moody’s(a) | | Principal
Amount | | | Fair
Value | |
| Corporate-Backed (continued) | | | | | | | | | | | | | | |
| Village Community Development District No. 15 FL† | | 4.85% | | 5/1/2038 | | NR | | $ | 2,200,000 | | | $ | 2,310,174 | |
| Village Community Development District No. 15 FL† | | 5.00% | | 5/1/2043 | | NR | | | 5,180,000 | | | | 5,403,552 | |
| Virginia Small Business Financing Authority–Covanta Holding Corp AMT† | | 5.00% | #(b) | 1/1/2048 | | B | | | 440,000 | | | | 440,078 | |
| West Pace Cooperative District AL(c) | | 9.125% | | 5/1/2039 | | NR | | | 4,900,000 | | | | 3,724,000 | |
| West Virginia Economic Development Authority–Kentucky Power Co AMT | | 4.70% | #(b) | 4/1/2036 | | BBB | | | 5,800,000 | | | | 5,883,456 | |
| Total | | | | | | | | | | | | | 485,531,394 | |
| | | | | | | | | | | | | | | |
| Education 5.23% | | | | | | | | | | | | | | |
| Ann Arbor School District MI GO | | 4.00% | | 5/1/2037 | | A1 | | | 4,175,000 | | | | 4,462,704 | |
| California Community Choice Financing Authority | | 4.00% | #(b) | 5/1/2053 | | A1 | | | 10,000,000 | | | | 10,243,234 | |
| California Community Choice Financing Authority | | 4.943%
(SOFR * .67 + 1.70% | )# | 5/1/2053 | | A1 | | | 10,000,000 | | | | 10,038,548 | |
| California Educational Facilities Authority–St Mary’s College of California | | 5.25% | | 10/1/2044 | | BBB- | | | 800,000 | | | | 865,127 | |
| California School Finance Authority–Aspire Public Schools Obligated Group† | | 5.00% | | 8/1/2036 | | NR | | | 125,000 | | | | 127,336 | |
| California School Finance Authority–Aspire Public Schools Obligated Group† | | 5.00% | | 8/1/2036 | | BBB | | | 1,475,000 | | | | 1,488,981 | |
| California State University | | 0.55% | #(b) | 11/1/2049 | | Aa2 | | | 6,750,000 | | | | 6,274,996 | |
| Capital Trust Agency, Inc.–Renaissance Charter School Inc Series 2019 Obligated Group FL† | | 5.00% | | 6/15/2039 | | NR | | | 2,160,000 | | | | 2,163,685 | |
| Chicago Board of Education Dedicated Capital Improvement Tax IL | | 5.00% | | 4/1/2038 | | A(e) | | | 3,230,000 | | | | 3,553,570 | |
| Chicago Board of Education Dedicated Capital Improvement Tax IL | | 5.25% | | 4/1/2034 | | A(e) | | | 1,625,000 | | | | 1,846,393 | |
| Chicago Board of Education Dedicated Capital Improvement Tax IL | | 5.25% | | 4/1/2035 | | A(e) | | | 1,125,000 | | | | 1,274,287 | |
| Chicago Board of Education Dedicated Capital Improvement Tax IL | | 5.25% | | 4/1/2036 | | A(e) | | | 2,175,000 | | | | 2,452,030 | |
| Chicago Board of Education Dedicated Capital Improvement Tax IL | | 5.25% | | 4/1/2039 | | A(e) | | | 6,220,000 | | | | 6,905,401 | |
| Chicago Board of Education IL GO (AGM) | | 5.00% | | 12/1/2031 | | AA | | | 5,000,000 | | | | 5,293,025 | |
| Clark County School District NV GO | | 5.00% | | 6/15/2037 | | AA- | | | 5,770,000 | | | | 6,598,092 | |
| 22 | See Notes to Financial Statements. |
Schedule of Investments (continued)
INTERMEDIATE TAX FREE FUND September 30, 2024
| Investments | | Interest
Rate | | Maturity
Date | | Credit
Rating:
S&P or
Moody’s(a) | | Principal
Amount | | | Fair
Value | |
| Education (continued) | | | | | | | | | | | | | | |
| Clark County School District NV GO | | 5.00% | | 6/15/2038 | | AA- | | $ | 4,240,000 | | | $ | 4,826,251 | |
| Clifton Higher Education Finance Corp.–International Leadership of Texas Inc | | 5.125% | | 8/15/2030 | | NR | | | 3,500,000 | | | | 3,546,484 | |
| Clifton Higher Education Finance Corp.–International Leadership of Texas Inc | | 5.75% | | 8/15/2038 | | NR | | | 1,405,000 | | | | 1,430,886 | |
| Clifton Higher Education Finance Corp.–International Leadership of Texas Inc | | 6.00% | | 8/15/2038 | | Baa3 | | | 19,860,000 | | | | 20,259,198 | |
| Connecticut State Health & Educational Facilities Authority–Quinnipiac University | | 5.00% | | 7/1/2033 | | A- | | | 8,230,000 | | | | 8,318,434 | |
| County of Frederick–Mount St Mary’s University Inc MD† | | 5.00% | | 9/1/2027 | | BB+ | | | 1,255,000 | | | | 1,276,042 | |
| County of Frederick–Mount St Mary’s University Inc MD† | | 5.00% | | 9/1/2032 | | BB+ | | | 2,400,000 | | | | 2,432,367 | |
| County of Lincoln–Augustana College Association SD | | 4.00% | | 8/1/2041 | | BBB- | | | 500,000 | | | | 467,329 | |
| Development Authority Of The City Of Marietta–Life University Inc GA† | | 5.00% | | 11/1/2027 | | Ba3 | | | 2,000,000 | | | | 2,031,306 | |
| Development Authority Of The City Of Marietta–Life University Inc GA† | | 5.00% | | 11/1/2037 | | Ba3 | | | 1,500,000 | | | | 1,525,198 | |
| Dutchess County Local Development Corp.–Bard College NY | | 5.00% | | 7/1/2040 | | BBB- | | | 1,150,000 | | | | 1,208,959 | |
| Dutchess County Local Development Corp.–Bard College NY | | 5.00% | | 7/1/2045 | | BBB- | | | 2,000,000 | | | | 2,074,951 | |
| Duval County Public Schools FL | | 5.00% | | 7/1/2032 | | A+ | | | 7,040,000 | | | | 7,123,399 | |
| Duval County Public Schools FL COPS (AGM) | | 5.00% | | 7/1/2035 | | AA | | | 3,750,000 | | | | 4,153,497 | |
| Fort Bend Independent School District TX GO (PSF-GTD) | | 0.875% | #(b) | 8/1/2050 | | AAA | | | 5,325,000 | | | | 5,217,424 | |
| Illinois Finance Authority–Illinois Institute of Technology | | 4.00% | | 9/1/2035 | | Ba2 | | | 2,600,000 | | | | 2,374,996 | |
| Illinois Finance Authority–Illinois Institute of Technology | | 5.00% | | 9/1/2030 | | Ba2 | | | 625,000 | | | | 632,574 | |
| Illinois Finance Authority–Illinois Institute of Technology | | 5.00% | | 9/1/2031 | | Ba2 | | | 1,100,000 | | | | 1,111,888 | |
| Illinois Finance Authority–Illinois Institute of Technology | | 5.00% | | 9/1/2032 | | Ba2 | | | 1,100,000 | | | | 1,110,928 | |
| Illinois Finance Authority–Illinois Institute of Technology | | 5.00% | | 9/1/2033 | | Ba2 | | | 1,000,000 | | | | 1,007,755 | |
| Illinois Finance Authority–Illinois Institute of Technology | | 5.00% | | 9/1/2034 | | Ba2 | | | 3,720,000 | | | | 3,739,150 | |
| | See Notes to Financial Statements. | 23 |
Schedule of Investments (continued)
INTERMEDIATE TAX FREE FUND September 30, 2024
| Investments | | Interest
Rate | | Maturity
Date | | Credit
Rating:
S&P or
Moody’s(a) | | Principal
Amount | | | Fair
Value | |
| Education (continued) | | | | | | | | | | | | | | |
| Illinois Finance Authority–Illinois Institute of Technology | | 5.00% | | 9/1/2036 | | Ba2 | | $ | 3,225,000 | | | $ | 3,199,164 | |
| Illinois Finance Authority–Noble Network of Charter Schools | | 5.00% | | 9/1/2025 | | BBB | | | 325,000 | | | | 325,059 | |
| Indiana Finance Authority–Ohio Valley Electric Corp | | 4.25% | | 11/1/2030 | | Baa3 | | | 14,550,000 | | | | 15,277,893 | |
| Industrial Development Authority of the City of Phoenix Arizona–BASIS Schools Inc Obligated Group AZ† | | 5.00% | | 7/1/2035 | | BB | | | 2,350,000 | | | | 2,364,994 | |
| IPS Multi-School Building Corp.–Indianapolis Board of School Commissioners IN(d) | | 5.00% | | 7/15/2041 | | Aa2 | | | 2,125,000 | | | | 2,364,230 | |
| Massachusetts Development Finance Agency–Emerson College | | 5.00% | | 1/1/2026 | | BBB+ | | | 5,135,000 | | | | 5,154,218 | |
| Massachusetts Development Finance Agency–Emerson College | | 5.00% | | 1/1/2027 | | BBB+ | | | 2,700,000 | | | | 2,710,327 | |
| Massachusetts Development Finance Agency–Emerson College | | 5.00% | | 1/1/2028 | | BBB+ | | | 1,810,000 | | | | 1,816,823 | |
| Miami-Dade County Educational Facilities Authority–University of Miami FL (AMBAC) | | 5.25% | | 4/1/2028 | | A2 | | | 5,000,000 | | | | 5,407,732 | |
| New Hampshire Health & Education Facilities Authority Act–University System of New Hampshire | | 5.00% | | 7/1/2036 | | Aa3 | | | 5,000,000 | | | | 5,055,147 | |
| New York State Dormitory Authority–Icahn School of Medicine Mount Sinai | | 5.00% | | 7/1/2026 | | BBB+ | | | 5,000,000 | | | | 5,064,143 | |
| New York State Dormitory Authority–Icahn School of Medicine Mount Sinai | | 5.00% | | 7/1/2027 | | BBB+ | | | 10,000,000 | | | | 10,112,447 | |
| New York State Dormitory Authority–New School | | 5.00% | | 7/1/2035 | | A3 | | | 5,345,000 | | | | 5,544,536 | |
| New York State Dormitory Authority–Pace University | | 5.00% | | 5/1/2026 | | BBB- | | | 980,000 | | | | 982,242 | |
| New York State Dormitory Authority–Yeshiva University | | 5.00% | | 7/15/2031 | | BBB- | | | 2,705,000 | | | | 2,942,488 | |
| New York State Dormitory Authority–Yeshiva University | | 5.00% | | 7/15/2037 | | BBB- | | | 11,000,000 | | | | 11,776,182 | |
| New York State Dormitory Authority (AGM) | | 5.00% | | 10/1/2031 | | AA | | | 10,000 | | | | 10,973 | |
| New York State Dormitory Authority (AGM), (ST AID WITHHLDG) | | 5.00% | | 10/1/2037 | | AA | | | 9,200,000 | | | | 10,374,918 | |
| Ohio Air Quality Development Authority–Duke Energy Corp | | 4.00% | #(b) | 9/1/2030 | | BBB | | | 4,175,000 | | | | 4,250,668 | |
| Sierra Vista Industrial Development Authority–American Leadership Academy Inc AZ†(d) | | 5.00% | | 6/15/2044 | | NR | | | 2,000,000 | | | | 2,036,223 | |
| 24 | See Notes to Financial Statements. |
Schedule of Investments (continued)
INTERMEDIATE TAX FREE FUND September 30, 2024
| Investments | | Interest
Rate | | Maturity
Date | | Credit
Rating:
S&P or
Moody’s(a) | | Principal
Amount | | | Fair
Value | |
| Education (continued) | | | | | | | | | | | | | | |
| State of Nevada Department of Business & Industry–Somerset Academy NLV Building 1/Sky Pointe/Stephanie/Losee Campuses† | | 4.50% | | 12/15/2029 | | BB | | $ | 465,000 | | | $ | 468,176 | |
| State of Nevada Department of Business & Industry–Somerset Academy NLV Building 1/Sky Pointe/Stephanie/Losee Campuses† | | 5.00% | | 12/15/2038 | | BB | | | 1,000,000 | | | | 1,006,087 | |
| Troy Capital Resource Corp.–Rensselaer Polytechnic Institute NY | | 5.00% | | 8/1/2026 | | A3 | | | 1,000,000 | | | | 1,025,968 | |
| University of Houston TX | | 2.00% | | 2/15/2032 | | AA | | | 6,095,000 | | | | 5,417,405 | |
| University of Illinois | | 5.00% | | 10/1/2035 | | A2 | | | 885,000 | | | | 985,536 | |
| University of Illinois | | 5.00% | | 10/1/2036 | | A2 | | | 920,000 | | | | 1,019,085 | |
| University of Illinois | | 5.00% | | 10/1/2037 | | A2 | | | 800,000 | | | | 886,346 | |
| University of Illinois | | 5.00% | | 10/1/2038 | | A2 | | | 800,000 | | | | 880,837 | |
| University of Illinois | | 5.50% | | 10/1/2039 | | A2 | | | 1,360,000 | | | | 1,555,518 | |
| University of Illinois | | 5.50% | | 10/1/2042 | | A2 | | | 1,650,000 | | | | 1,873,333 | |
| University of Illinois (AGM) | | 4.00% | | 4/1/2033 | | AA | | | 4,905,000 | | | | 4,983,367 | |
| University of Kentucky (ST INTERCEPT) | | 4.75% | | 4/1/2034 | | AA+ | | | 3,000,000 | | | | 3,019,171 | |
| Total | | | | | | | | | | | | | 259,347,661 | |
| | | | | | | | | | | | | | | |
| Financial Services 0.05% | | | | | | | | | | | | | | |
| Massachusetts Educational Financing Authority AMT | | 3.625% | | 7/1/2034 | | AA | | | 415,000 | | | | 410,506 | |
| New Jersey Higher Education Student Assistance Authority AMT | | 3.75% | | 12/1/2030 | | Aaa | | | 855,000 | | | | 857,941 | |
| New Jersey Higher Education Student Assistance Authority AMT | | 4.00% | | 12/1/2032 | | Aaa | | | 710,000 | | | | 710,389 | |
| New Jersey Higher Education Student Assistance Authority AMT | | 4.00% | | 12/1/2034 | | Aaa | | | 640,000 | | | | 638,849 | |
| Total | | | | | | | | | | | | | 2,617,685 | |
| | | | | | | | | | | | | | | |
| General Obligation 18.02% | | | | | | | | | | | | | | |
| California Community Choice Financing Authority | | 5.00% | #(b) | 12/1/2053 | | A2 | | | 11,335,000 | | | | 12,135,166 | |
| California Community Choice Financing Authority | | 5.50% | #(b) | 5/1/2054 | | A2 | | | 10,000,000 | | | | 10,797,969 | |
| California State Public Works Board–State of California Department of General Services | | 5.00% | | 4/1/2038 | | Aa3 | | | 4,250,000 | | | | 4,992,731 | |
| | See Notes to Financial Statements. | 25 |
Schedule of Investments (continued)
INTERMEDIATE TAX FREE FUND September 30, 2024
| Investments | | Interest
Rate | | Maturity
Date | | Credit
Rating:
S&P or
Moody’s(a) | | Principal
Amount | | | Fair
Value | |
| General Obligation (continued) | | | | | | | | | | | | | | |
| California State Public Works Board–State of California Department of General Services | | 5.00% | | 4/1/2040 | | Aa3 | | $ | 4,200,000 | | | $ | 4,866,537 | |
| California State Public Works Board–State of California Department of General Services | | 5.00% | | 4/1/2041 | | Aa3 | | | 3,550,000 | | | | 4,091,969 | |
| California State Public Works Board–State of California Department of General Services | | 5.00% | | 4/1/2042 | | Aa3 | | | 6,035,000 | | | | 6,936,663 | |
| Chabot-Las Positas Community College District CA GO | | 3.00% | | 8/1/2038 | | AA | | | 2,500,000 | | | | 2,344,717 | |
| Chicago Board of Education IL GO | | 5.00% | | 12/1/2029 | | BB+ | | | 8,000,000 | | | | 8,497,052 | |
| Chicago Board of Education IL GO | | 5.00% | | 12/1/2029 | | BB+ | | | 3,000,000 | | | | 3,136,192 | |
| Chicago Board of Education IL GO | | 5.00% | | 12/1/2031 | | BB+ | | | 1,500,000 | | | | 1,559,300 | |
| Chicago Board of Education IL GO | | 5.00% | | 12/1/2032 | | BB+ | | | 4,845,000 | | | | 5,026,585 | |
| Chicago Board of Education IL GO | | 5.00% | | 12/1/2033 | | BB+ | | | 900,000 | | | | 932,636 | |
| Chicago Board of Education IL GO | | 5.00% | | 12/1/2034 | | BB+ | | | 475,000 | | | | 491,688 | |
| Chicago Board of Education IL GO | | 5.00% | | 12/1/2035 | | BB+ | | | 450,000 | | | | 464,231 | |
| Chicago Board of Education IL GO | | 5.00% | | 12/1/2036 | | BB+ | | | 7,300,000 | | | | 7,646,522 | |
| Chicago Board of Education IL GO | | 5.00% | | 12/1/2039 | | BB+ | | | 2,340,000 | | | | 2,427,619 | |
| Chicago Board of Education IL GO | | 5.50% | | 12/1/2037 | | BB+ | | | 2,000,000 | | | | 2,213,050 | |
| Chicago Board of Education IL GO | | 5.50% | | 12/1/2038 | | BB+ | | | 2,250,000 | | | | 2,476,100 | |
| Chicago Board of Education IL GO† | | 6.75% | | 12/1/2030 | | BB+ | | | 5,000,000 | | | | 5,484,901 | |
| Chicago Board of Education IL GO (AGM) | | 5.00% | | 12/1/2027 | | AA | | | 2,860,000 | | | | 3,011,475 | |
| City of Bellevue WA GO | | 4.00% | | 12/1/2030 | | AAA | | | 5,590,000 | | | | 5,620,232 | |
| City of Chicago IL GO | | 5.00% | | 1/1/2025 | | BBB+ | | | 7,555,000 | | | | 7,586,522 | |
| City of Chicago IL GO | | 5.00% | | 1/1/2031 | | BBB+ | | | 2,210,000 | | | | 2,235,347 | |
| City of Chicago IL GO | | 5.00% | | 1/1/2042 | | BBB+ | | | 34,540,000 | | | | 36,651,966 | |
| City of Chicago IL GO | | 5.00% | | 1/1/2043 | | BBB+ | | | 43,745,000 | | | | 46,254,673 | |
| City of Chicago IL GO | | 5.125% | | 1/1/2027 | | NR | | | 1,130,000 | | | | 1,135,048 | |
| City of Chicago IL GO | | 5.125% | | 1/1/2027 | | BBB+ | | | 1,970,000 | | | | 1,976,091 | |
| City of Chicago IL GO | | 5.25% | | 1/1/2028 | | NR | | | 1,630,000 | | | | 1,637,783 | |
| City of Chicago IL GO | | 5.25% | | 1/1/2028 | | BBB+ | | | 2,215,000 | | | | 2,222,256 | |
| City of Chicago IL GO | | 5.25% | | 1/1/2029 | | BBB+ | | | 2,025,000 | | | | 2,031,186 | |
| City of Chicago IL GO | | 5.50% | | 1/1/2037 | | BBB+ | | | 1,945,000 | | | | 1,950,489 | |
| City of Chicago IL GO | | 5.50% | | 1/1/2039 | | BBB+ | | | 6,000,000 | | | | 6,630,119 | |
| City of Chicago IL GO | | 5.50% | | 1/1/2049 | | BBB+ | | | 3,750,000 | | | | 3,915,914 | |
| City of Chicago IL GO | | 5.625% | | 1/1/2030 | | BBB+ | | | 1,835,000 | | | | 1,919,712 | |
| 26 | See Notes to Financial Statements. |
Schedule of Investments (continued)
INTERMEDIATE TAX FREE FUND September 30, 2024
| Investments | | Interest
Rate | | Maturity
Date | | Credit
Rating:
S&P or
Moody’s(a) | | Principal
Amount | | | Fair
Value | |
| General Obligation (continued) | | | | | | | | | | | | | | |
| City of Chicago IL GO | | 5.75% | | 1/1/2033 | | BBB+ | | $ | 7,000,000 | | | $ | 7,316,070 | |
| City of Chicago IL GO | | 6.00% | | 1/1/2038 | | BBB+ | | | 15,890,000 | | | | 16,614,017 | |
| City of Frisco TX GO | | 5.00% | | 2/15/2041 | | AAA | | | 4,445,000 | | | | 5,023,037 | |
| City of Houston TX GO | | 5.00% | | 3/1/2036 | | Aa3 | | | 1,800,000 | | | | 2,062,955 | |
| City of Houston TX GO | | 5.00% | | 3/1/2038 | | Aa3 | | | 1,000,000 | | | | 1,133,641 | |
| City of Houston TX GO | | 5.00% | | 3/1/2041 | | AA | | | 3,750,000 | | | | 4,201,097 | |
| City of Houston TX GO | | 5.25% | | 3/1/2039 | | Aa3 | | | 4,610,000 | | | | 5,274,542 | |
| City of Houston TX GO | | 5.25% | | 3/1/2040 | | Aa3 | | | 5,800,000 | | | | 6,587,353 | |
| City of Hutto TX GO (BAM) | | 5.00% | | 8/1/2040 | | AA | | | 2,145,000 | | | | 2,414,048 | |
| City of Hutto TX GO (BAM) | | 5.00% | | 8/1/2041 | | AA | | | 3,500,000 | | | | 3,908,806 | |
| City of Hutto TX GO (BAM) | | 5.00% | | 8/1/2042 | | AA | | | 4,790,000 | | | | 5,321,447 | |
| City of Lubbock TX GO | | 4.00% | | 2/15/2032 | | AA+ | | | 5,120,000 | | | | 5,128,221 | |
| City of New Orleans LA GO | | 4.00% | | 10/1/2036 | | A+ | | | 2,290,000 | | | | 2,369,303 | |
| City of New York NY GO | | 5.00% | | 6/1/2035 | | AA | | | 7,685,000 | | | | 7,777,231 | |
| City of New York NY GO | | 5.00% | | 10/1/2036 | | AA | | | 1,250,000 | | | | 1,425,781 | |
| City of New York NY GO | | 5.00% | | 4/1/2040 | | AA | | | 2,000,000 | | | | 2,280,230 | |
| City of New York NY GO | | 5.00% | | 9/1/2042 | | AA | | | 8,055,000 | | | | 9,119,964 | |
| City of New York NY GO | | 5.00% | | 9/1/2043 | | AA | | | 5,000,000 | | | | 5,636,659 | |
| Clark County School District NV GO | | 5.00% | | 6/15/2041 | | AA- | | | 10,645,000 | | | | 11,867,822 | |
| Commonwealth of Massachusetts GO | | 5.00% | | 3/1/2039 | | AA+ | | | 8,000,000 | | | | 9,307,990 | |
| Commonwealth of Puerto Rico GO | | Zero Coupon | | 7/1/2033 | | NR | | | 1,727,569 | | | | 1,174,893 | |
| Commonwealth of Puerto Rico GO | | Zero Coupon | #(b) | 11/1/2043 | | NR | | | 5,950,386 | | | | 3,837,999 | |
| Commonwealth of Puerto Rico GO | | 4.00% | | 7/1/2035 | | NR | | | 11,385,659 | | | | 11,374,383 | |
| Commonwealth of Puerto Rico GO | | 4.00% | | 7/1/2037 | | NR | | | 3,035,632 | | | | 3,016,193 | |
| Commonwealth of Puerto Rico GO | | 4.00% | | 7/1/2041 | | NR | | | 5,000,000 | | | | 4,837,597 | |
| Commonwealth of Puerto Rico GO | | 4.00% | | 7/1/2046 | | NR | | | 1,917,657 | | | | 1,812,025 | |
| Commonwealth of Puerto Rico GO | | 5.375% | | 7/1/2025 | | NR | | | 17,088,974 | | | | 17,190,814 | |
| Commonwealth of Puerto Rico GO | | 5.625% | | 7/1/2027 | | NR | | | 11,481,543 | | | | 11,992,165 | |
| Commonwealth of Puerto Rico GO | | 5.625% | | 7/1/2029 | | NR | | | 5,336,508 | | | | 5,765,901 | |
| Commonwealth of Puerto Rico GO | | 5.75% | | 7/1/2031 | | NR | | | 1,415,665 | | | | 1,575,410 | |
| County of Howard MD GO | | 3.00% | | 8/15/2037 | | AAA | | | 2,255,000 | | | | 2,145,384 | |
| County of Luzerne PA GO (AGM) | | 5.00% | | 11/15/2024 | | AA | | | 4,000,000 | | | | 4,007,067 | |
| Delaware Valley Regional Finance Authority PA | 3.55%
(MUNIPSA * 1 + .40% | )# | 3/1/2057 | | A+ | | | 5,000,000 | | | | 4,953,767 | |
| Denton Independent School District TX GO (PSF-GTD) | | 5.00% | | 8/15/2038 | | AAA | | | 2,750,000 | | | | 3,161,251 | |
| | See Notes to Financial Statements. | 27 |
Schedule of Investments (continued)
INTERMEDIATE TAX FREE FUND September 30, 2024
| Investments | | Interest
Rate | | Maturity
Date | | Credit
Rating:
S&P or
Moody’s(a) | | Principal
Amount | | | Fair
Value | |
| General Obligation (continued) | | | | | | | | | | | | | | |
| Denton Independent School District TX GO (PSF-GTD) | | 5.00% | | 8/15/2039 | | AAA | | $ | 5,500,000 | | | $ | 6,275,523 | |
| Gregory-Portland Independent School District TX GO (PSF-GTD) | | 5.00% | | 2/15/2038 | | AAA | | | 6,790,000 | | | | 7,648,092 | |
| Houston Independent School District TX GO (PSF-GTD) | | 3.50% | #(b) | 6/1/2039 | | AAA | | | 10,000,000 | | | | 10,014,116 | |
| Lamar Consolidated Independent School District TX GO | | 5.00% | | 2/15/2038 | | AA- | | | 1,750,000 | | | | 1,994,217 | |
| Louisiana Stadium & Exposition District | | 5.00% | | 7/1/2038 | | A2 | | | 7,345,000 | | | | 8,279,420 | |
| Louisiana Stadium & Exposition District | | 5.00% | | 7/1/2039 | | A2 | | | 6,550,000 | | | | 7,344,366 | |
| New Jersey Transportation Trust Fund Authority | | 5.00% | | 6/15/2037 | | A2 | | | 4,000,000 | | | | 4,551,292 | |
| New Jersey Transportation Trust Fund Authority | | 5.25% | | 6/15/2036 | | A2 | | | 2,000,000 | | | | 2,323,758 | |
| New Jersey Transportation Trust Fund Authority–State of New Jersey | | 5.00% | | 6/15/2037 | | A2 | | | 4,000,000 | | | | 4,561,088 | |
| New York City Transitional Finance Authority Future Tax Secured Revenue NY | | 4.00% | | 8/1/2038 | | AAA | | | 5,000,000 | | | | 5,213,752 | |
| New York City Transitional Finance Authority Future Tax Secured Revenue NY | | 4.00% | | 2/1/2039 | | AAA | | | 11,820,000 | | | | 12,274,537 | |
| New York City Transitional Finance Authority Future Tax Secured Revenue NY | | 5.00% | | 11/1/2037 | | AAA | | | 8,265,000 | | | | 9,478,906 | |
| New York State Dormitory Authority–State of New York Personal Income Tax Revenue | | 4.00% | | 3/15/2037 | | Aa1 | | | 7,500,000 | | | | 7,798,235 | |
| New York State Dormitory Authority–State of New York Personal Income Tax Revenue | | 4.00% | | 3/15/2037 | | AA+ | | | 5,195,000 | | | | 5,449,261 | |
| New York State Dormitory Authority–State of New York Personal Income Tax Revenue | | 4.00% | | 2/15/2038 | | Aa1 | | | 8,305,000 | | | | 8,583,742 | |
| New York State Dormitory Authority–State of New York Personal Income Tax Revenue | | 4.00% | | 3/15/2038 | | AA+ | | | 5,000,000 | | | | 5,194,520 | |
| New York State Dormitory Authority (BAM) | | 5.00% | | 10/1/2035 | | AA | | | 5,000,000 | | | | 5,587,120 | |
| Palm Beach County School District FL COPS | | 5.00% | | 8/1/2037 | | Aa3 | | | 1,000,000 | | | | 1,155,835 | |
| Palm Beach County School District FL COPS | | 5.00% | | 8/1/2038 | | Aa3 | | | 2,375,000 | | | | 2,727,419 | |
| Palm Beach County School District FL COPS | | 5.00% | | 8/1/2039 | | Aa3 | | | 2,250,000 | | | | 2,569,764 | |
| Pennsylvania Economic Development Financing Authority–Commonwealth of Pennsylvania Department of Transportation AMT | | 5.25% | | 6/30/2035 | | Baa2 | | | 5,250,000 | | | | 5,847,469 | |
| 28 | See Notes to Financial Statements. |
Schedule of Investments (continued)
INTERMEDIATE TAX FREE FUND September 30, 2024
| Investments | | Interest
Rate | | Maturity
Date | | Credit
Rating:
S&P or
Moody’s(a) | | Principal
Amount | | | Fair
Value | |
| General Obligation (continued) | | | | | | | | | | | | | | |
| Pennsylvania Economic Development Financing Authority–Commonwealth of Pennsylvania Department of Transportation AMT | | 5.25% | | 6/30/2036 | | Baa2 | | $ | 8,550,000 | | | $ | 9,485,880 | |
| Pennsylvania Economic Development Financing Authority–Commonwealth of Pennsylvania Department of Transportation AMT | | 5.50% | | 6/30/2037 | | Baa2 | | | 5,575,000 | | | | 6,303,409 | |
| Pennsylvania Economic Development Financing Authority–Commonwealth of Pennsylvania Department of Transportation AMT | | 5.50% | | 6/30/2038 | | Baa2 | | | 6,200,000 | | | | 6,973,183 | |
| Pflugerville Independent School District TX GO | | 5.00% | | 2/15/2037 | | AA+ | | | 6,955,000 | | | | 7,840,776 | |
| Pflugerville Independent School District TX GO | | 5.00% | | 2/15/2038 | | AA+ | | | 4,405,000 | | | | 4,945,064 | |
| Pflugerville Independent School District TX GO | | 5.00% | | 2/15/2039 | | AA+ | | | 5,115,000 | | | | 5,689,342 | |
| School District of Philadelphia PA GO (ST AID WITHHLDG) | | 5.00% | | 9/1/2026 | | A1 | | | 500,000 | | | | 520,176 | |
| School District of Philadelphia PA GO (ST AID WITHHLDG) | | 5.00% | | 9/1/2027 | | A1 | | | 600,000 | | | | 636,078 | |
| School District of Philadelphia PA GO (ST AID WITHHLDG) | | 5.00% | | 9/1/2028 | | A1 | | | 500,000 | | | | 538,758 | |
| State of California GO | | 3.00% | | 11/1/2034 | | Aa2 | | | 5,900,000 | | | | 5,819,787 | |
| State of California GO | | 4.00% | | 8/1/2035 | | Aa2 | | | 20,000,000 | | | | 20,350,764 | |
| State of California GO | | 4.00% | | 3/1/2036 | | Aa2 | | | 10,000,000 | | | | 10,503,078 | |
| State of California GO | | 4.00% | | 9/1/2037 | | Aa2 | | | 4,500,000 | | | | 4,850,213 | |
| State of California GO | | 5.00% | | 9/1/2035 | | Aa2 | | | 9,000,000 | | | | 10,416,303 | |
| State of California GO | | 5.00% | | 9/1/2037 | | Aa2 | | | 14,540,000 | | | | 17,088,497 | |
| State of California GO | | 5.00% | | 8/1/2039 | | Aa2 | | | 6,500,000 | | | | 7,627,344 | |
| State of California GO | | 5.00% | | 10/1/2039 | | Aa2 | | | 4,000,000 | | | | 4,611,131 | |
| State of California GO | | 5.25% | | 8/1/2044 | | Aa2 | | | 5,000,000 | | | | 5,856,096 | |
| State of Connecticut GO | | 4.00% | | 4/15/2037 | | AA- | | | 1,825,000 | | | | 1,861,012 | |
| State of Connecticut GO | | 4.00% | | 6/15/2037 | | AA- | | | 775,000 | | | | 785,453 | |
| State of Connecticut GO | | 5.00% | | 6/15/2035 | | AA- | | | 1,125,000 | | | | 1,205,416 | |
| State of Illinois GO | | 4.00% | | 10/1/2034 | | A- | | | 5,000,000 | | | | 5,112,974 | |
| State of Illinois GO | | 4.00% | | 10/1/2035 | | A- | | | 5,000,000 | | | | 5,096,521 | |
| State of Illinois GO | | 5.00% | | 2/1/2028 | | A- | | | 13,620,000 | | | | 14,294,077 | |
| State of Illinois GO | | 5.00% | | 11/1/2029 | | A- | | | 2,800,000 | | | | 2,907,581 | |
| | See Notes to Financial Statements. | 29 |
Schedule of Investments (continued)
INTERMEDIATE TAX FREE FUND September 30, 2024
| Investments | | Interest
Rate | | Maturity
Date | | Credit
Rating:
S&P or
Moody’s(a) | | Principal
Amount | | | Fair
Value | |
| General Obligation (continued) | | | | | | | | | | | | | | |
| State of Illinois GO | | 5.00% | | 11/1/2032 | | A- | | $ | 9,200,000 | | | $ | 9,496,547 | |
| State of Illinois GO | | 5.00% | | 10/1/2033 | | A- | | | 5,000,000 | | | | 5,302,104 | |
| State of Illinois GO | | 5.00% | | 5/1/2038 | | A- | | | 2,000,000 | | | | 2,241,583 | |
| State of Illinois GO | | 5.00% | | 5/1/2039 | | A- | | | 3,000,000 | | | | 3,349,408 | |
| State of Illinois GO | | 5.00% | | 12/1/2039 | | A- | | | 15,000,000 | | | | 16,626,541 | |
| State of Illinois GO | | 5.00% | | 5/1/2040 | | A- | | | 6,000,000 | | | | 6,662,679 | |
| State of Illinois GO | | 5.00% | | 5/1/2041 | | A- | | | 6,000,000 | | | | 6,631,969 | |
| State of Illinois GO | | 5.00% | | 12/1/2042 | | A- | | | 11,320,000 | | | | 12,380,951 | |
| State of Illinois GO | | 5.25% | | 2/1/2034 | | A- | | | 3,295,000 | | | | 3,312,568 | |
| State of Illinois GO | | 5.25% | | 10/1/2036 | | A- | | | 17,540,000 | | | | 19,789,419 | |
| State of Illinois GO | | 5.25% | | 5/1/2038 | | A- | | | 9,750,000 | | | | 10,874,239 | |
| State of Illinois GO | | 5.25% | | 5/1/2042 | | A- | | | 15,000,000 | | | | 16,803,283 | |
| State of Illinois GO | | 5.25% | | 5/1/2043 | | A- | | | 7,830,000 | | | | 8,731,319 | |
| State of Illinois GO | | 5.50% | | 5/1/2039 | | A- | | | 11,000,000 | | | | 12,097,947 | |
| State of New Jersey GO | | 2.00% | | 6/1/2029 | | A1 | | | 5,000,000 | | | | 4,658,486 | |
| State of Texas GO | | 4.00% | | 10/1/2032 | | AAA | | | 14,570,000 | | | | 14,593,054 | |
| State of Washington GO | | 5.00% | | 2/1/2038 | | Aaa | | | 15,000,000 | | | | 17,211,321 | |
| Town of Oyster Bay NY GO (AGM) | | 2.00% | | 3/1/2030 | | AA | | | 2,125,000 | | | | 1,933,330 | |
| Town of Oyster Bay NY GO (AGM) | | 2.00% | | 3/1/2031 | | AA | | | 2,040,000 | | | | 1,814,422 | |
| Village of Romeoville IL GO | | 4.00% | | 12/30/2036 | | Aa2 | | | 4,725,000 | | | | 4,816,221 | |
| Village of Romeoville IL GO | | 4.00% | | 12/30/2037 | | Aa2 | | | 3,800,000 | | | | 3,868,235 | |
| Village of Schaumburg IL GO | | 3.00% | | 12/1/2027 | | AAA | | | 7,060,000 | | | | 7,098,998 | |
| Village of Skokie IL GO | | 3.00% | | 12/1/2029 | | Aa2 | | | 1,080,000 | | | | 1,088,493 | |
| Washington Metropolitan Area Transit Authority Dedicated Revenue DC | | 5.00% | | 7/15/2039 | | AA | | | 4,400,000 | | | | 5,022,563 | |
| Washington Metropolitan Area Transit Authority Dedicated Revenue DC | | 5.00% | | 7/15/2041 | | AA | | | 7,000,000 | | | | 7,912,645 | |
| Total | | | | | | | | | | | | | 893,425,174 | |
| | | | | | | | | | | | | | | |
| Health Care 14.82% | | | | | | | | | | | | | | |
| Allegheny County Hospital Development Authority–Allegheny Health Network Obligated Group PA | | 5.00% | | 4/1/2031 | | A | | | 16,000,000 | | | | 16,887,754 | |
| Antelope Valley Healthcare District Obligated Group CA | | 5.00% | | 3/1/2031 | | BBB | | | 7,000,000 | | | | 7,043,687 | |
| Arizona Health Facilities Authority–HonorHealth Obligated Group AZ | | 5.00% | | 12/1/2032 | | A2 | | | 5,000,000 | | | | 5,012,805 | |
| 30 | See Notes to Financial Statements. |
Schedule of Investments (continued)
INTERMEDIATE TAX FREE FUND September 30, 2024
| Investments | | Interest
Rate | | Maturity
Date | | Credit
Rating:
S&P or
Moody’s(a) | | Principal
Amount | | | Fair
Value | |
| Health Care (continued) | | | | | | | | | | | | | | |
| Astoria Hospital Facilities Authority–Columbia Lutheran Charities Obligated Group OR | | 5.00% | | 8/1/2034 | | BBB | | $ | 12,250,000 | | | $ | 13,839,684 | |
| Berks County Municipal Authority–Tower Health Obligated Group PA | | Zero Coupon | | 6/30/2044 | | NR | | | 5,774,000 | | | | 3,681,267 | |
| Berks County Municipal Authority–Tower Health Obligated Group PA | | 5.00% | | 6/30/2039 | | NR | | | 11,556,000 | | | | 11,455,814 | |
| Berks County Municipal Authority–Tower Health Obligated Group PA | | 6.00% | | 6/30/2034 | | NR | | | 820,439 | | | | 892,083 | |
| Berks County Municipal Authority–Tower Health Obligated Group PA | | 6.00% | | 6/30/2034 | | NR | | | 41,523 | | | | 45,149 | |
| Berks County Municipal Authority–Tower Health Obligated Group PA | | 8.00% | | 6/30/2034 | | NR | | | 1,637,186 | | | | 1,675,742 | |
| Berks County Municipal Authority–Tower Health Obligated Group PA | | 8.00% | | 6/30/2034 | | NR | | | 83,046 | | | | 83,046 | |
| Board of Managers Joint Guadalupe County-City of Seguin Hospital TX | | 5.25% | | 12/1/2035 | | BB | | | 3,000,000 | | | | 3,006,880 | |
| Brevard County Health Facilities Authority–Health First Inc Obligated Group FL | | 5.00% | | 4/1/2038 | | A | | | 7,000,000 | | | | 7,864,210 | |
| Brevard County Health Facilities Authority–Health First Inc Obligated Group FL | | 5.00% | | 4/1/2039 | | A | | | 5,500,000 | | | | 6,148,731 | |
| Bucks County Industrial Development Authority–Grand View Hospital/Sellersville Obligated Group PA | | 5.00% | | 7/1/2030 | | BB- | | | 2,075,000 | | | | 2,165,207 | |
| Bucks County Industrial Development Authority–Grand View Hospital/Sellersville Obligated Group PA | | 5.00% | | 7/1/2031 | | BB- | | | 1,150,000 | | | | 1,202,107 | |
| Bucks County Industrial Development Authority–Grand View Hospital/Sellersville Obligated Group PA | | 5.00% | | 7/1/2032 | | BB- | | | 1,000,000 | | | | 1,042,127 | |
| California Health Facilities Financing Authority–Adventist Health System/West Obligated Group | | 5.25% | | 12/1/2040 | | BBB+ | | | 3,000,000 | | | | 3,410,905 | |
| | See Notes to Financial Statements. | 31 |
Schedule of Investments (continued)
INTERMEDIATE TAX FREE FUND September 30, 2024
| Investments | | Interest
Rate | | Maturity
Date | | Credit
Rating:
S&P or
Moody’s(a) | | Principal
Amount | | | Fair
Value | |
| Health Care (continued) | | | | | | | | | | | | | | |
| California Health Facilities Financing Authority–Adventist Health System/West Obligated Group | | 5.25% | | 12/1/2041 | | BBB+ | | $ | 3,000,000 | | | $ | 3,390,538 | |
| California Health Facilities Financing Authority–Adventist Health System/West Obligated Group | | 5.25% | | 12/1/2042 | | BBB+ | | | 5,500,000 | | | | 6,179,356 | |
| California Health Facilities Financing Authority–Adventist Health System/West Obligated Group CA | | 5.00% | | 12/1/2037 | | BBB+ | | | 5,000,000 | | | | 5,606,570 | |
| California Health Facilities Financing Authority–Providence St Joseph Health Obligated Group | | 2.00% | #(b) | 10/1/2036 | | A | | | 8,190,000 | | | | 8,036,533 | |
| California Municipal Finance Authority–Eisenhower Medical Center | | 5.00% | | 7/1/2029 | | Baa2 | | | 1,000,000 | | | | 1,043,346 | |
| California Municipal Finance Authority–Eisenhower Medical Center | | 5.00% | | 7/1/2031 | | Baa2 | | | 1,900,000 | | | | 1,973,980 | |
| California Municipal Finance Authority–Eisenhower Medical Center | | 5.00% | | 7/1/2033 | | Baa2 | | | 4,015,000 | | | | 4,161,960 | |
| California Municipal Finance Authority–Palomar Health Obligated Group COPS† | | 5.00% | | 11/1/2027 | | BB+ | | | 5,000,000 | | | | 5,109,369 | |
| California Statewide Communities Development Authority–John Muir Health Obligated Group | | 5.00% | | 12/1/2041 | | A+ | | | 3,760,000 | | | | 4,304,813 | |
| California Statewide Communities Development Authority–John Muir Health Obligated Group | | 5.00% | | 12/1/2043 | | A+ | | | 4,510,000 | | | | 5,110,393 | |
| California Statewide Communities Development Authority–John Muir Health Obligated Group | | 5.25% | | 12/1/2042 | | A+ | | | 3,510,000 | | | | 4,095,006 | |
| California Statewide Communities Development Authority–Loma Linda University Medical Obligated Group† | | 5.00% | | 12/1/2033 | | BB | | | 1,000,000 | | | | 1,049,672 | |
| California Statewide Communities Development Authority–Loma Linda University Medical Obligated Group | | 5.25% | | 12/1/2034 | | BB | | | 5,000,000 | | | | 5,011,434 | |
| California Statewide Communities Development Authority–Loma Linda University Medical Obligated Group† | | 5.25% | | 12/1/2038 | | BB | | | 1,500,000 | | | | 1,576,145 | |
| Chattanooga Health Educational & Housing Facility Board–Erlanger Health Obligated Group TN | | 5.25% | | 12/1/2041 | | A | | | 1,000,000 | | | | 1,135,793 | |
| 32 | See Notes to Financial Statements. |
Schedule of Investments (continued)
INTERMEDIATE TAX FREE FUND September 30, 2024
| Investments | | Interest
Rate | | Maturity
Date | | Credit
Rating:
S&P or
Moody’s(a) | | Principal
Amount | | | Fair
Value | |
| Health Care (continued) | | | | | | | | | | | | | | |
| Chattanooga Health Educational & Housing Facility Board–Erlanger Health Obligated Group TN | | 5.25% | | 12/1/2042 | | A | | $ | 3,025,000 | | | $ | 3,417,545 | |
| Chattanooga Health Educational & Housing Facility Board–Erlanger Health Obligated Group TN | | 5.25% | | 12/1/2043 | | A | | | 2,550,000 | | | | 2,869,157 | |
| Citizens Memorial Hospital District MO | | 5.00% | | 12/1/2026 | | NR | | | 8,825,000 | | | | 8,911,839 | |
| City of Atlantic Beach–Naval Continuing Care Retirement Foundation Obligated Group FL | | 5.00% | | 11/15/2028 | | BBB | (e) | | 1,655,000 | | | | 1,657,103 | |
| City of Blaine–Crest View Obligated Group MN(c) | | 5.125% | | 7/1/2025 | | NR | | | 770,000 | | | | 423,500 | |
| City of Colby KS–Citizens Medical Center Inc | | 5.50% | | 7/1/2026 | | NR | | | 11,100,000 | | | | 11,193,272 | |
| City of Seneca–Nemaha Valley Community Hospital KS | | 5.00% | | 9/1/2025 | | NR | | | 5,500,000 | | | | 5,527,810 | |
| City of St. Cloud–CentraCare Health System Obligated Group MN(d) | | 5.00% | | 5/1/2041 | | A2 | | | 3,000,000 | | | | 3,372,757 | |
| Colorado Health Facilities Authority–CommonSpirit Health Obligated Group | | 5.00% | #(b) | 8/1/2049 | | A- | | | 2,345,000 | | | | 2,356,787 | |
| Colorado Health Facilities Authority–CommonSpirit Health Obligated Group | | 5.25% | | 11/1/2038 | | A- | | | 2,095,000 | | | | 2,376,761 | |
| Connecticut State Health & Educational Facilities Authority–Griffin Health Obligated Group† | | 5.00% | | 7/1/2034 | | BB+ | | | 225,000 | | | | 228,360 | |
| Connecticut State Health & Educational Facilities Authority–Griffin Health Obligated Group† | | 5.00% | | 7/1/2039 | | BB+ | | | 1,000,000 | | | | 1,001,419 | |
| County of Cuyahoga–MetroHealth System OH | | 5.00% | | 2/15/2037 | | BBB | | | 5,000,000 | | | | 5,141,182 | |
| County of Miami-Dade–Public Health Trust of Miami-Dade County FL | | 5.00% | | 6/1/2030 | | Aa2 | | | 11,910,000 | | | | 12,059,853 | |
| County of Miami-Dade–Public Health Trust of Miami-Dade County FL | | 5.00% | | 6/1/2031 | | Aa2 | | | 5,000,000 | | | | 5,057,528 | |
| County of Montgomery–Premier Health Partners Obligated Group OH | | 4.00% | | 11/15/2039 | | Baa1 | | | 6,000,000 | | | | 5,857,073 | |
| County of Muskingum–Genesis Healthcare Obligated Group OH | | 5.00% | | 2/15/2033 | | BB+ | | | 12,355,000 | | | | 12,357,522 | |
| | See Notes to Financial Statements. | 33 |
Schedule of Investments (continued)
INTERMEDIATE TAX FREE FUND September 30, 2024
| Investments | | Interest
Rate | | Maturity
Date | | Credit
Rating:
S&P or
Moody’s(a) | | Principal
Amount | | | Fair
Value | |
| Health Care (continued) | | | | | | | | | | | | | | |
| County of Washington–Marietta Area Health Care Inc Obligated Group OH | | 5.50% | | 12/1/2027 | | NR | | $ | 8,675,000 | | | $ | 8,815,396 | |
| County of Washington–Marietta Area Health Care Inc Obligated Group OH | | 6.375% | | 12/1/2037 | | NR | | | 10,000,000 | | | | 11,004,223 | |
| Crawford County Hospital Authority–Meadville Medical Center Obligated Group PA | | 6.00% | | 6/1/2036 | | NR | | | 3,830,000 | | | | 3,916,965 | |
| District of Columbia–Children’s National Medical Center Obligated Group | | 5.00% | | 7/15/2026 | | A1 | | | 1,700,000 | | | | 1,748,859 | |
| District of Columbia–Children’s National Medical Center Obligated Group | | 5.00% | | 7/15/2034 | | A1 | | | 5,000,000 | | | | 5,114,186 | |
| Doylestown Hospital Authority–Doylestown Hospital Obligated Group PA† | | 5.00% | | 7/1/2031 | | NR | | | 1,000,000 | | | | 1,067,987 | |
| Doylestown Hospital Authority–Doylestown Hospital Obligated Group PA† | | 5.375% | | 7/1/2039 | | NR | | | 2,000,000 | | | | 2,193,275 | |
| Franklin County Industrial Development Authority–Menno-Haven Inc Obligated Group PA | | 5.00% | | 12/1/2031 | | NR | | | 1,000,000 | | | | 1,028,306 | |
| Franklin County Industrial Development Authority–Menno-Haven Inc Obligated Group PA | | 5.00% | | 12/1/2033 | | NR | | | 1,000,000 | | | | 1,025,235 | |
| Glendale Industrial Development Authority–Beatitudes Campus Obligated Group AZ | | 5.00% | | 11/15/2036 | | NR | | | 1,500,000 | | | | 1,434,183 | |
| Greater Texas Cultural Education Facilities Finance Corp.–Texas Biomedical Research Institute TX | | 5.00% | | 6/1/2039 | | Baa2 | | | 3,900,000 | | | | 4,244,420 | |
| Greater Texas Cultural Education Facilities Finance Corp.–Texas Biomedical Research Institute TX | | 5.00% | | 6/1/2040 | | Baa2 | | | 4,040,000 | | | | 4,370,449 | |
| Greater Texas Cultural Education Facilities Finance Corp.–Texas Biomedical Research Institute TX | | 5.00% | | 6/1/2042 | | Baa2 | | | 3,990,000 | | | | 4,265,263 | |
| Greeneville Health & Educational Facilities Board–Ballad Health Obligated Group TN | | 5.00% | | 7/1/2035 | | A- | | | 3,300,000 | | | | 3,471,976 | |
| Greeneville Health & Educational Facilities Board–Ballad Health Obligated Group TN | | 5.00% | | 7/1/2036 | | A- | | | 3,000,000 | | | | 3,151,211 | |
| Greeneville Health & Educational Facilities Board–Ballad Health Obligated Group TN | | 5.00% | | 7/1/2037 | | A- | | | 10,000,000 | | | | 10,477,754 | |
| 34 | See Notes to Financial Statements. |
Schedule of Investments (continued)
INTERMEDIATE TAX FREE FUND September 30, 2024
| Investments | | Interest
Rate | | Maturity
Date | | Credit
Rating:
S&P or
Moody’s(a) | | Principal
Amount | | | Fair
Value | |
| Health Care (continued) | | | | | | | | | | | | | | |
| Harris County Cultural Education Facilities Finance Corp.–Brazos Presbyterian Homes Obligated Group TX | | 6.375% | | 1/1/2033 | | BB+ | (e) | $ | 120,000 | | | $ | 120,261 | |
| Harris County Cultural Education Facilities Finance Corp.–Memorial Hermann Health System Obligated Group TX | | 5.00% | | 7/1/2039 | | AA- | | | 2,500,000 | | | | 2,848,548 | |
| Harris County Cultural Education Facilities Finance Corp.–Memorial Hermann Health System Obligated Group TX | | 5.00% | | 7/1/2040 | | AA- | | | 1,500,000 | | | | 1,696,069 | |
| Harris County Cultural Education Facilities Finance Corp.–Memorial Hermann Health System Obligated Group TX | | 5.00% | #(b) | 6/1/2050 | | AA- | | | 5,000,000 | | | | 5,415,778 | |
| Health & Educational Facilities Authority of the State of Missouri–SSM Health Care Obligated Group WA | | 5.00% | #(b) | 6/1/2039 | | A+ | | | 13,150,000 | | | | 14,104,637 | |
| Hillsborough County Industrial Development Authority–BayCare Obligated Group FL | | 5.00% | | 11/15/2035 | | Aa2 | | | 4,000,000 | | | | 4,646,164 | |
| Hillsborough County Industrial Development Authority–BayCare Obligated Group FL | | 5.00% | | 11/15/2036 | | Aa2 | | | 2,500,000 | | | | 2,892,557 | |
| Hillsborough County Industrial Development Authority–BayCare Obligated Group FL | | 5.00% | | 11/15/2037 | | Aa2 | | | 2,500,000 | | | | 2,885,078 | |
| Hillsborough County Industrial Development Authority–BayCare Obligated Group FL | | 5.00% | | 11/15/2042 | | Aa2 | | | 5,000,000 | | | | 5,604,279 | |
| Hospitals & Higher Education Facilities Authority of Philadelphia–Temple University Health Obligated Group PA | | 5.00% | | 7/1/2030 | | BBB | | | 4,775,000 | | | | 4,905,243 | |
| Hospitals & Higher Education Facilities Authority of Philadelphia–Temple University Health Obligated Group PA | | 5.00% | | 7/1/2032 | | BBB | | | 4,055,000 | | | | 4,146,222 | |
| Hospitals & Higher Education Facilities Authority of Philadelphia–Temple University Health Obligated Group PA | | 5.00% | | 7/1/2033 | | BBB | | | 4,870,000 | | | | 4,975,186 | |
| Housing & Redevelopment Authority of The City of St. Paul Minnesota–Fairview Health Services Obligated Group | | 5.00% | | 11/15/2024 | | NR | | | 4,500,000 | | | | 4,507,478 | |
| | See Notes to Financial Statements. | 35 |
Schedule of Investments (continued)
INTERMEDIATE TAX FREE FUND September 30, 2024
| Investments | | Interest
Rate | | Maturity
Date | | Credit
Rating:
S&P or
Moody’s(a) | | Principal
Amount | | | Fair
Value | |
| Health Care (continued) | | | | | | | | | | | | | | |
| Illinois Finance Authority–Ascension Health Credit Group | | 4.00% | | 2/15/2033 | | AA+ | | $ | 5,000,000 | | | $ | 5,099,446 | |
| Illinois Finance Authority–Plymouth Place Obligated Group | | 5.00% | | 5/15/2030 | | NR | | | 1,690,000 | | | | 1,708,282 | |
| Illinois Finance Authority–Rush Obligated Group | | 5.00% | | 11/15/2031 | | A+ | | | 6,025,000 | | | | 6,087,576 | |
| Illinois Finance Authority–Rush Obligated Group | | 5.00% | | 11/15/2033 | | A+ | | | 2,500,000 | | | | 2,524,916 | |
| Illinois Finance Authority–Rush Obligated Group | | 5.00% | | 11/15/2034 | | A+ | | | 3,000,000 | | | | 3,029,551 | |
| Illinois Finance Authority–Silver Cross Hospital Obligated | | 5.00% | | 8/15/2035 | | A3 | | | 6,565,000 | | | | 6,642,396 | |
| Industrial Development Authority of the County of Pima–La Posada at Park Centre Inc Obligated Group AZ† | | 5.125% | | 11/15/2029 | | NR | | | 4,000,000 | | | | 4,039,500 | |
| Kentucky Economic Development Finance Authority–Masonic Homes of Kentucky Inc Obligated Group | | 5.375% | | 11/15/2032 | | NR | | | 1,185,000 | | | | 1,136,375 | |
| Kentucky Economic Development Finance Authority–Owensboro Health Inc Obligated Group | | 5.00% | | 6/1/2029 | | Baa2 | | | 4,235,000 | | | | 4,392,582 | |
| Kentucky Economic Development Finance Authority–Owensboro Health Inc Obligated Group | | 5.00% | | 6/1/2032 | | Baa2 | | | 6,000,000 | | | | 6,189,907 | |
| Louisville/Jefferson County Metropolitan Government–Norton Healthcare Obligated Group KY | | 5.00% | | 10/1/2040 | | A | | | 3,500,000 | | | | 3,876,041 | |
| Maricopa County Industrial Development Authority–HonorHealth Obligated Group AZ | | 5.00% | | 9/1/2033 | | A2 | | | 500,000 | | | | 534,711 | |
| Maricopa County Industrial Development Authority–HonorHealth Obligated Group AZ | | 5.00% | | 9/1/2034 | | A2 | | | 1,000,000 | | | | 1,068,025 | |
| Maricopa County Industrial Development Authority–HonorHealth Obligated Group AZ | | 5.00% | | 9/1/2035 | | A2 | | | 1,000,000 | | | | 1,065,662 | |
| Maricopa County Industrial Development Authority–HonorHealth Obligated Group AZ | | 5.00% | | 9/1/2036 | | A2 | | | 1,800,000 | | | | 1,913,350 | |
| Massachusetts Development Finance Agency–Tufts Medicine Obligated Group | | 4.00% | | 7/1/2035 | | BBB- | | | 2,000,000 | | | | 1,916,494 | |
| 36 | See Notes to Financial Statements. |
Schedule of Investments (continued)
INTERMEDIATE TAX FREE FUND September 30, 2024
| Investments | | Interest
Rate | | Maturity
Date | | Credit
Rating:
S&P or
Moody’s(a) | | Principal
Amount | | | Fair
Value | |
| Health Care (continued) | | | | | | | | | | | | | | |
| Massachusetts Development Finance Agency–Tufts Medicine Obligated Group | | 4.00% | | 7/1/2037 | | BBB- | | $ | 3,930,000 | | | $ | 3,763,985 | |
| Massachusetts Development Finance Agency–Tufts Medicine Obligated Group | | 5.00% | | 7/1/2038 | | BBB- | | | 3,100,000 | | | | 3,145,652 | |
| Massachusetts Development Finance Agency–Tufts Medicine Obligated Group | | 5.00% | | 7/1/2039 | | BBB- | | | 2,750,000 | | | | 2,780,800 | |
| Massachusetts Development Finance Agency–Tufts Medicine Obligated Group | | 8.50% | | 10/1/2026 | | BBB- | | | 8,910,000 | | | | 9,105,208 | |
| Metropolitan Government Nashville & Davidson County Health & Educational Facilities Board–Vanderbilt University Medical Center Obligated Group TN | | 5.00% | | 7/1/2031 | | A | | | 1,300,000 | | | | 1,339,499 | |
| Miami Beach Health Facilities Authority–Mount Sinai Medical Center of Florida Obligated Group FL | | 5.00% | | 11/15/2030 | | A3 | | | 2,500,000 | | | | 2,502,944 | |
| Michigan Finance Authority–McLaren Health Care Corp Obligated Group | | 5.00% | | 5/15/2033 | | A1 | | | 4,030,000 | | | | 4,069,351 | |
| Michigan Finance Authority–McLaren Health Care Corp Obligated Group | | 5.00% | | 5/15/2035 | | A1 | | | 4,945,000 | | | | 4,991,691 | |
| Michigan Finance Authority–McLaren Health Care Obligated Group | | 5.00% | | 5/15/2032 | | A1 | | | 10,390,000 | | | | 10,491,881 | |
| Michigan Finance Authority Provident Group–HFH Energy LLC | | 5.00% | | 2/28/2038 | | A3 | | | 2,060,000 | | | | 2,322,101 | |
| Michigan Finance Authority Provident Group–HFH Energy LLC | | 5.25% | | 2/29/2040 | | A3 | | | 1,400,000 | | | | 1,570,228 | |
| Michigan Finance Authority Provident Group–HFH Energy LLC | | 5.25% | | 2/28/2042 | | A3 | | | 1,860,000 | | | | 2,061,725 | |
| Minnesota Agricultural & Economic Development Board–HealthPartners Obligated Group | | 5.00% | | 1/1/2040 | | A | | | 3,600,000 | | | | 4,064,684 | |
| Minnesota Agricultural & Economic Development Board–HealthPartners Obligated Group | | 5.00% | | 1/1/2041 | | A | | | 4,000,000 | | | | 4,497,610 | |
| Minnesota Agricultural & Economic Development Board–HealthPartners Obligated Group | | 5.00% | | 1/1/2042 | | A | | | 4,985,000 | | | | 5,573,710 | |
| Monroe County Hospital Authority–Centurion Foundation Lehigh Valley LLC PA† | | 5.10% | | 6/15/2039 | | NR | | | 10,000,000 | | | | 10,192,111 | |
| Montgomery County Higher Education & Health Authority–Thomas Jefferson University Obligated Group PA | | 4.00% | | 9/1/2036 | | A | | | 1,350,000 | | | | 1,365,001 | |
| | See Notes to Financial Statements. | 37 |
Schedule of Investments (continued)
INTERMEDIATE TAX FREE FUND September 30, 2024
| Investments | | Interest
Rate | | Maturity
Date | | Credit
Rating:
S&P or
Moody’s(a) | | Principal
Amount | | | Fair
Value | |
| Health Care (continued) | | | | | | | | | | | | | | |
| Montgomery County Higher Education & Health Authority–Thomas Jefferson University Obligated Group PA | | 4.00% | | 9/1/2038 | | A | | $ | 2,250,000 | | | $ | 2,263,653 | |
| Montgomery County Industrial Development Authority–Albert Einstein Healthcare Network Obligated Group PA | | 5.25% | | 1/15/2026 | | NR | | | 2,000,000 | | | | 2,010,187 | |
| Montgomery County Industrial Development Authority–Albert Einstein Healthcare Network Obligated Group PA | | 5.25% | | 1/15/2028 | | NR | | | 3,000,000 | | | | 3,015,281 | |
| Montgomery County Industrial Development Authority–Whitemarsh Continuing Care Retirement Community Obligated PA | | 5.00% | | 1/1/2030 | | NR | | | 2,000,000 | | | | 2,001,543 | |
| Moon Industrial Development Authority–Baptist Homes Society Obligated Group PA | | 5.125% | | 7/1/2025 | | NR | | | 1,015,000 | | | | 991,823 | |
| New Hampshire Business Finance Authority–NFA UH SPV LLC† | | 5.625% | | 12/15/2033 | | NR | | | 5,500,000 | | | | 5,676,698 | |
| New Jersey Health Care Facilities Financing Authority–RWJ Barnabas Health Obligated Group | | 5.00% | | 7/1/2041 | | AA- | | | 12,000,000 | | | | 13,517,922 | |
| New Jersey Health Care Facilities Financing Authority–RWJ Barnabas Health Obligated Group | | 5.00% | | 7/1/2042 | | AA- | | | 5,000,000 | | | | 5,607,483 | |
| New Jersey Health Care Facilities Financing Authority–St Joseph’s Healthcare System Obligated Group | | 5.00% | | 7/1/2035 | | BBB- | | | 3,185,000 | | | | 3,241,181 | |
| New Jersey Health Care Facilities Financing Authority–University Hospital (AGM) | | 5.00% | | 7/1/2028 | | AA | | | 2,000,000 | | | | 2,031,753 | |
| New York State Dormitory Authority–Catholic Health System Obligated Group | | 4.00% | | 7/1/2037 | | B- | | | 1,100,000 | | | | 990,392 | |
| New York State Dormitory Authority–Catholic Health System Obligated Group | | 4.00% | | 7/1/2039 | | B- | | | 1,000,000 | | | | 882,114 | |
| New York State Dormitory Authority–Catholic Health System Obligated Group | | 4.00% | | 7/1/2040 | | B- | | | 850,000 | | | | 749,554 | |
| New York State Dormitory Authority–Catholic Health System Obligated Group | | 5.00% | | 7/1/2036 | | B- | | | 1,945,000 | | | | 1,934,606 | |
| 38 | See Notes to Financial Statements. |
Schedule of Investments (continued)
INTERMEDIATE TAX FREE FUND September 30, 2024
| Investments | | Interest
Rate | | Maturity
Date | | Credit
Rating:
S&P or
Moody’s(a) | | Principal
Amount | | | Fair
Value | |
| Health Care (continued) | | | | | | | | | | | | | | |
| New York State Dormitory Authority–Garnet Health Medical Center Obligated Group† | | 5.00% | | 12/1/2026 | | Ba2 | | $ | 1,500,000 | | | $ | 1,509,791 | |
| New York State Dormitory Authority–Garnet Health Medical Center Obligated Group† | | 5.00% | | 12/1/2029 | | Ba2 | | | 2,700,000 | | | | 2,712,654 | |
| New York State Dormitory Authority–Garnet Health Medical Center Obligated Group† | | 5.00% | | 12/1/2030 | | Ba2 | | | 1,100,000 | | | | 1,102,646 | |
| New York State Dormitory Authority–Garnet Health Medical Center Obligated Group† | | 5.00% | | 12/1/2031 | | Ba2 | | | 1,600,000 | | | | 1,601,639 | |
| New York State Dormitory Authority–Northwell Health Obligated Group | | 5.00% | | 5/1/2032 | | A- | | | 9,230,000 | | | | 9,322,023 | |
| Oklahoma Development Finance Authority–OU Medicine Obligated Group | | 5.00% | | 8/15/2033 | | BB | | | 3,920,000 | | | | 4,087,458 | |
| Oklahoma Development Finance Authority–OU Medicine Obligated Group | | 5.00% | | 8/15/2038 | | BB | | | 10,050,000 | | | | 10,380,565 | |
| Oklahoma Development Finance Authority–OU Medicine Obligated Group | | 5.25% | | 8/15/2043 | | BB | | | 6,710,000 | | | | 6,939,407 | |
| Oklahoma Development Finance Authority–OU Medicine Obligated Group | | 5.50% | | 8/15/2037 | | NR | | | 2,770,000 | | | | 2,959,066 | |
| Oneida County Local Development Corp.–Mohawk Valley Health System Obligated Group NY (AGM) | | 4.00% | | 12/1/2035 | | AA | | | 1,000,000 | | | | 1,008,857 | |
| Oneida County Local Development Corp.–Mohawk Valley Health System Obligated Group NY (AGM) | | 4.00% | | 12/1/2036 | | AA | | | 1,250,000 | | | | 1,257,188 | |
| Orange County Health Facilities Authority–Orlando Health Obligated Group FL | | 5.00% | | 10/1/2037 | | A+ | | | 2,495,000 | | | | 2,833,638 | |
| Orange County Health Facilities Authority–Orlando Health Obligated Group FL | | 5.00% | | 10/1/2038 | | A+ | | | 1,530,000 | | | | 1,727,300 | |
| Orange County Health Facilities Authority–Orlando Health Obligated Group FL | | 5.00% | | 10/1/2039 | | A+ | | | 1,500,000 | | | | 1,681,234 | |
| Orange County Health Facilities Authority–Orlando Health Obligated Group FL | | 5.00% | | 10/1/2039 | | A+ | | | 7,565,000 | | | | 7,783,168 | |
| Palomar Health Obligated Group CA | | 5.00% | | 11/1/2036 | | BB+ | | | 5,280,000 | | | | 5,307,536 | |
| | See Notes to Financial Statements. | 39 |
Schedule of Investments (continued)
INTERMEDIATE TAX FREE FUND September 30, 2024
| Investments | | Interest
Rate | | Maturity
Date | | Credit
Rating:
S&P or
Moody’s(a) | | Principal
Amount | | | Fair
Value | |
| Health Care (continued) | | | | | | | | | | | | | | |
| Pennsylvania Economic Development Financing Authority–UPMC Obligated Group | | 4.00% | | 2/15/2040 | | A | | $ | 2,820,000 | | | $ | 2,840,487 | |
| Public Finance Authority–Proton International Alabama LLC WI†(c) | | 6.85% | | 10/1/2047 | | NR | | | 1,410,000 | | | | 141,000 | |
| Public Finance Authority–RBS Evolution LLC WI† | | 10.00% | | 11/1/2038 | | NR | | | 3,500,000 | | | | 3,987,976 | |
| Rhode Island Health & Educational Building Corp.–Care New England Health System Obligated Group | | 5.00% | | 9/1/2031 | | B+ | | | 5,000,000 | | | | 5,053,279 | |
| Shelby County Health Educational & Housing Facilities Board–Baptist Memorial Health Care Obligated Group TN | | 5.00% | #(b) | 9/1/2049 | | BBB+ | | | 8,750,000 | | | | 9,453,412 | |
| South Carolina Jobs-Economic Development Authority–Kiawah Life Plan Village Inc | | 5.25% | | 11/15/2028 | | NR | | | 5,700,000 | | | | 5,732,256 | |
| South Carolina Jobs-Economic Development Authority–Novant Health Obligated Group | | 5.25% | | 11/1/2040 | | A+ | | | 6,500,000 | | | | 7,492,326 | |
| South Carolina Jobs-Economic Development Authority–Novant Health Obligated Group | | 5.25% | | 11/1/2041 | | A+ | | | 7,500,000 | | | | 8,600,179 | |
| Southeastern Ohio Port Authority–Marietta Area Healthcare Inc Obligated Group | | 5.00% | | 12/1/2035 | | B+ | (e) | | 3,850,000 | | | | 3,756,911 | |
| Southeastern Ohio Port Authority–Marietta Area Healthcare Inc Obligated Group | | 5.50% | | 12/1/2029 | | B+ | (e) | | 2,085,000 | | | | 2,086,836 | |
| Tarrant County Cultural Education Facilities Finance Corp.–Baylor Scott & White Health Obligated Group TX | | 5.00% | #(b) | 11/15/2052 | | AA- | | | 4,000,000 | | | | 4,432,165 | |
| Tulsa County Industrial Authority–Montereau Obligated Group OK | | 5.25% | | 11/15/2037 | | BBB- | (e) | | 1,250,000 | | | | 1,280,616 | |
| University of Kansas Hospital Authority–University of Kansas Health System Obligated Group KS | | 5.00% | | 9/1/2034 | | AA- | | | 5,000,000 | | | | 5,086,444 | |
| Washington Health Care Facilities Authority–Multicare Health System Obligated Group | | 5.00% | | 8/15/2030 | | A | | | 5,000,000 | | | | 5,060,614 | |
| Washington Health Care Facilities Authority–Multicare Health System Obligated Group | | 5.00% | | 8/15/2031 | | A | | | 5,000,000 | | | | 5,059,033 | |
| 40 | See Notes to Financial Statements. |
Schedule of Investments (continued)
INTERMEDIATE TAX FREE FUND September 30, 2024
| Investments | | Interest
Rate | | Maturity
Date | | Credit
Rating:
S&P or
Moody’s(a) | | Principal
Amount | | | Fair
Value | |
| Health Care (continued) | | | | | | | | | | | | | | |
| Washington Health Care Facilities Authority–Providence St Joseph Health Obligated Group | | 4.00% | #(b) | 10/1/2042 | | A | | $ | 28,220,000 | | | $ | 29,041,806 | |
| West Virginia Hospital Finance Authority–West Virginia United Health System Obligated Group | | 4.00% | | 6/1/2030 | | A | | | 5,500,000 | | | | 5,565,982 | |
| Westchester County Local Development Corp.–New York Blood Center Inc NY | | 5.00% | | 7/1/2035 | | Baa1 | | | 3,000,000 | | | | 3,371,777 | |
| Westchester County Local Development Corp.–New York Blood Center Inc NY | | 5.00% | | 7/1/2038 | | Baa1 | | | 3,075,000 | | | | 3,409,490 | |
| Winchester Economic Development Authority–Valley Health Obligated Group VA | | 5.00% | | 1/1/2041 | | A+ | | | 4,150,000 | | | | 4,655,775 | |
| Winchester Economic Development Authority–Valley Health Obligated Group VA | | 5.00% | | 1/1/2042 | | A+ | | | 2,500,000 | | | | 2,793,146 | |
| Wisconsin Health & Educational Facilities Authority–Marshfield Clinic Health System Obligated Group | | 5.00% | | 2/15/2029 | | BBB | | | 6,170,000 | | | | 6,632,886 | |
| Wisconsin Health & Educational Facilities Authority–Marshfield Clinic Health System Obligated Group | | 5.00% | | 2/15/2032 | | BBB | | | 12,500,000 | | | | 13,806,154 | |
| Yuma Industrial Development Authority–Yuma Regional Medical Center Obligated Group AZ(d) | | 5.00% | | 8/1/2041 | | A | | | 1,500,000 | | | | 1,671,110 | |
| Yuma Industrial Development Authority–Yuma Regional Medical Center Obligated Group AZ (AGC)(d) | | 5.25% | | 8/1/2042 | | AA | | | 2,125,000 | | | | 2,426,345 | |
| Yuma Industrial Development Authority–Yuma Regional Medical Center Obligated Group AZ (AGC)(d) | | 5.25% | | 8/1/2043 | | AA | | | 2,250,000 | | | | 2,558,108 | |
| Yuma Industrial Development Authority–Yuma Regional Medical Center Obligated Group AZ (AGC)(d) | | 5.25% | | 8/1/2044 | | AA | | | 3,000,000 | | | | 3,395,454 | |
| Total | | | | | | | | | | | | | 734,711,684 | |
| | | | | | | | | | | | | | | |
| Housing 2.41% | | | | | | | | | | | | | | |
| California Housing Finance Agency | | 3.25% | | 8/20/2036 | | BBB | | | 7,167,861 | | | | 6,857,092 | |
| California Housing Finance Agency | | 3.50% | | 11/20/2035 | | BBB+ | | | 5,538,665 | | | | 5,422,875 | |
| California Municipal Finance Authority–Park Western Housing LP (FNMA) | | 2.65% | | 8/1/2036 | | Aaa | | | 4,232,495 | | | | 3,740,339 | |
| | See Notes to Financial Statements. | 41 |
Schedule of Investments (continued)
INTERMEDIATE TAX FREE FUND September 30, 2024
| Investments | | Interest
Rate | | Maturity
Date | | Credit
Rating:
S&P or
Moody’s(a) | | Principal
Amount | | | Fair
Value | |
| Housing (continued) | | | | | | | | | | | | | | |
| Colorado Housing & Finance Authority (GNMA) | | 6.00% | | 5/1/2053 | | AA | | $ | 5,000,000 | | | $ | 5,550,619 | |
| CSCDA Community Improvement Authority Westgate Apartments CA† | | 3.00% | | 6/1/2047 | | NR | | | 5,000,000 | | | | 3,658,237 | |
| Indiana Finance Authority–CHF-Tippecanoe LLC | | 5.00% | | 6/1/2038 | | BBB- | | | 1,550,000 | | | | 1,669,992 | |
| Indiana Finance Authority–CHF-Tippecanoe LLC | | 5.00% | | 6/1/2043 | | BBB- | | | 2,525,000 | | | | 2,672,031 | |
| Industrial Development Authority of the City of Phoenix Arizona–Downtown Phoenix Student Housing LLC AZ | | 5.00% | | 7/1/2032 | | Baa3 | | | 1,080,000 | | | | 1,127,378 | |
| Maryland Community Development Administration | | 3.00% | | 9/1/2039 | | Aa1 | | | 10,000,000 | | | | 8,809,481 | |
| Minnesota Housing Finance Agency (FHLMC), (FNMA), (GNMA) | | 6.25% | | 7/1/2054 | | AA+ | | | 3,785,000 | | | | 4,193,057 | |
| Minnesota Housing Finance Agency (FHLMC), (FNMA), (GNMA) | | 6.25% | | 1/1/2055 | | AA+ | | | 10,000,000 | | | | 11,440,027 | |
| Minnesota Housing Finance Agency (FHLMC), (FNMA), (GNMA) | | 6.50% | | 1/1/2055 | | AA+ | | | 3,550,000 | | | | 4,097,840 | |
| Missouri Housing Development Commission (FHLMC), (FNMA), (GNMA) | | 3.25% | | 11/1/2052 | | AA+ | | | 2,485,000 | | | | 2,471,455 | |
| New Jersey Housing & Mortgage Finance Agency | | 6.00% | | 10/1/2055 | | AA | | | 3,560,000 | | | | 3,947,506 | |
| North Carolina Housing Finance Agency (FHLMC), (FNMA), (GNMA) | | 6.25% | | 1/1/2055 | | AA+ | | | 5,490,000 | | | | 6,079,038 | |
| North Dakota Housing Finance Agency | | 4.00% | | 1/1/2051 | | Aa1 | | | 7,145,000 | | | | 7,226,644 | |
| Ohio Housing Finance Agency (FHLMC), (FNMA), (GNMA) | | 7.00% | | 3/1/2049 | | Aaa | | | 3,500,000 | | | | 4,275,028 | |
| Pennsylvania Housing Finance Agency | | 3.50% | | 4/1/2051 | | AA+ | | | 1,740,000 | | | | 1,735,976 | |
| Pennsylvania Housing Finance Agency | | 4.00% | | 10/1/2049 | | AA+ | | | 1,685,000 | | | | 1,686,161 | |
| Texas Department of Housing & Community Affairs (GNMA) | | 5.75% | | 3/1/2054 | | Aaa | | | 7,295,000 | | | | 8,059,722 | |
| Virginia Beach Development Authority–Westminster-Canterbury on Chesapeake Bay Obligated Group | | 5.375% | | 9/1/2029 | | BB+ | (e) | | 5,000,000 | | | | 5,211,849 | |
| Washington State Housing Finance Commission | | 3.50% | | 12/20/2035 | | BBB+ | | | 4,750,098 | | | | 4,541,774 | |
| Washington State Housing Finance Commission–Provident Group-SH I Properties LLC | | 5.50% | | 7/1/2044 | | BBB- | | | 4,950,000 | | | | 5,508,513 | |
| 42 | See Notes to Financial Statements. |
Schedule of Investments (continued)
INTERMEDIATE TAX FREE FUND September 30, 2024
| Investments | | Interest
Rate | | Maturity
Date | | Credit
Rating:
S&P or
Moody’s(a) | | Principal
Amount | | | Fair
Value | |
| Housing (continued) | | | | | | | | | | | | | | |
| Washington State Housing Finance Commission–Provident Group-SH I Properties LLC | | 5.50% | | 7/1/2049 | | BBB- | | $ | 8,805,000 | | | $ | 9,665,540 | |
| Total | | | | | | | | | | | | | 119,648,174 | |
| | | | | | | | | | | | | | | |
| Lease Obligations 1.74% | | | | | | | | | | | | | | |
| Illinois Sports Facilities Authority (AGM) | | 5.00% | | 6/15/2027 | | AA | | | 3,000,000 | | | | 3,016,563 | |
| Indiana Finance Authority–Marion County Capital Improvement Board | | 5.25% | | 2/1/2029 | | AA+ | | | 2,500,000 | | | | 2,547,094 | |
| Michigan State Building Authority | | 5.00% | | 4/15/2034 | | Aa2 | | | 6,525,000 | | | | 6,645,203 | |
| New Jersey Economic Development Authority–New Jersey Economic Development Authority† | | 5.25% | | 9/1/2027 | | A- | | | 24,555,000 | | | | 26,401,131 | |
| New Jersey Economic Development Authority–State Capitol Joint Management Commission | | 5.00% | | 6/15/2033 | | A2 | | | 7,215,000 | | | | 7,763,876 | |
| New Jersey Economic Development Authority–State Capitol Joint Management Commission | | 5.00% | | 6/15/2034 | | A2 | | | 13,645,000 | | | | 14,640,551 | |
| New Jersey Economic Development Authority–State of New Jersey Department of the Treasury | | 5.00% | | 6/15/2025 | | A2 | | | 5,085,000 | | | | 5,158,982 | |
| New Jersey Economic Development Authority–State of New Jersey Department of the Treasury | | 5.00% | | 6/15/2036 | | A2 | | | 1,320,000 | | | | 1,383,224 | |
| New Jersey Transportation Trust Fund Authority | | 3.25% | | 6/15/2039 | | A2 | | | 2,000,000 | | | | 1,873,605 | |
| New Jersey Transportation Trust Fund Authority | | 4.00% | | 6/15/2035 | | A2 | | | 3,750,000 | | | | 3,906,362 | |
| New Jersey Transportation Trust Fund Authority | | 4.00% | | 6/15/2036 | | A2 | | | 2,770,000 | | | | 2,860,863 | |
| New Jersey Transportation Trust Fund Authority | | 5.00% | | 6/15/2030 | | A+ | | | 3,000,000 | | | | 3,097,650 | |
| New Jersey Transportation Trust Fund Authority | | 5.00% | | 6/15/2031 | | A+ | | | 2,400,000 | | | | 2,475,540 | |
| Redevelopment Authority of the City of Philadelphia PA | | 5.00% | | 4/15/2028 | | A1 | | | 4,380,000 | | | | 4,427,836 | |
| Total | | | | | | | | | | | | | 86,198,480 | |
| | See Notes to Financial Statements. | 43 |
Schedule of Investments (continued)
INTERMEDIATE TAX FREE FUND September 30, 2024
| Investments | | Interest
Rate | | Maturity
Date | | Credit
Rating:
S&P or
Moody’s(a) | | Principal
Amount | | | Fair
Value | |
| Multi-Family Housing 0.59% | | | | | | | | | | | | | | |
| Illinois Housing Development Authority–South Shore IL Preservation LP (FHA), (HUD) | | 4.00% | #(b) | 6/1/2026 | | Aaa | | $ | 2,700,000 | | | $ | 2,710,145 | |
| King County Housing Authority WA | | 3.50% | | 5/1/2038 | | AAA | | | 10,000,000 | | | | 9,727,637 | |
| Michigan State Housing Development Authority | | 3.80% | | 10/1/2038 | | AA+ | | | 10,000,000 | | | | 10,005,217 | |
| New Hampshire Business Finance Authority | | 3.625% | | 8/20/2039 | | A3 | | | 7,235,701 | | | | 6,939,742 | |
| Total | | | | | | | | | | | | | 29,382,741 | |
| | | | | | | | | | | | | | | |
| Other Revenue 3.27% | | | | | | | | | | | | | | |
| Black Belt Energy Gas District AL | | 4.00% | #(b) | 12/1/2049 | | A1 | | | 12,675,000 | | | | 12,749,270 | |
| Brooklyn Arena Local Development Corp.–Brooklyn Events Center LLC NY | | 5.00% | | 7/15/2042 | | Ba1 | | | 7,600,000 | | | | 7,757,528 | |
| Cleveland-Cuyahoga County Port Authority–Playhouse Square Foundation OH | | 5.00% | | 12/1/2033 | | BB+ | | | 2,000,000 | | | | 2,078,287 | |
| Cleveland-Cuyahoga County Port Authority–Playhouse Square Foundation OH | | 5.25% | | 12/1/2038 | | BB+ | | | 1,650,000 | | | | 1,708,478 | |
| Commonwealth of Puerto Rico GO | | Zero Coupon | #(b) | 11/1/2051 | | NR | | | 17,004,637 | | | | 11,138,037 | |
| Duval County Public Schools FL COPS (AGM) | | 5.00% | | 7/1/2034 | | AA | | | 2,000,000 | | | | 2,219,830 | |
| Illinois Finance Authority–Field Museum Natural of History | 4.588%
(SOFR * .67 + 1.20% | )# | 11/1/2034 | | A | | | 10,190,000 | | | | 10,179,673 | |
| Industrial Development Authority of the County of Pima–Edkey Inc Obligated Group† | | 5.00% | | 7/1/2035 | | NR | | | 5,000,000 | | | | 5,100,263 | |
| Lower Alabama Gas District | | 4.00% | #(b) | 12/1/2050 | | A2 | | | 30,995,000 | | | | 31,177,226 | |
| Maricopa County Industrial Development Authority–Legacy Traditional School Obligated Group AZ† | | 5.00% | | 7/1/2039 | | BBB- | | | 2,055,000 | | | | 2,114,805 | |
| Maricopa County Industrial Development Authority–Paragon Management Inc AZ† | | 5.00% | | 7/1/2036 | | BB+ | | | 2,500,000 | | | | 2,533,667 | |
| Maryland Economic Development Corp.(c) | | 5.00% | | 12/1/2016 | | NR | | | 700,000 | | | | 454,125 | |
| M-S-R Energy Authority CA | | 6.125% | | 11/1/2029 | | BBB+ | | | 2,835,000 | | | | 3,042,837 | |
| Triborough Bridge & Tunnel Authority–Metropolitan Transportation Authority Payroll Mobility Tax Revenue NY | | 5.00% | | 11/15/2036 | | AA+ | | | 5,750,000 | | | | 6,719,792 | |
| Triborough Bridge & Tunnel Authority–Metropolitan Transportation Authority Payroll Mobility Tax Revenue NY | | 5.00% | | 11/15/2037 | | AA+ | | | 5,000,000 | | | | 5,811,963 | |
| 44 | See Notes to Financial Statements. |
Schedule of Investments (continued)
INTERMEDIATE TAX FREE FUND September 30, 2024
| Investments | | Interest
Rate | | Maturity
Date | | Credit
Rating:
S&P or
Moody’s(a) | | Principal
Amount | | | Fair
Value | |
| Other Revenue (continued) | | | | | | | | | | | | | | |
| Triborough Bridge & Tunnel Authority–Metropolitan Transportation Authority Payroll Mobility Tax Revenue NY | | 5.00% | | 11/15/2038 | | AA+ | | $ | 6,400,000 | | | $ | 7,381,266 | |
| Triborough Bridge & Tunnel Authority–Metropolitan Transportation Authority Payroll Mobility Tax Revenue NY | | 5.00% | | 11/15/2041 | | AA+ | | | 9,000,000 | | | | 10,196,585 | |
| Triborough Bridge & Tunnel Authority–Metropolitan Transportation Authority Payroll Mobility Tax Revenue NY | | 5.25% | | 11/15/2039 | | AA+ | | | 13,050,000 | | | | 15,304,564 | |
| Triborough Bridge & Tunnel Authority–Metropolitan Transportation Authority Payroll Mobility Tax Revenue NY | | 5.25% | | 11/15/2040 | | AA+ | | | 11,000,000 | | | | 12,807,304 | |
| Triborough Bridge & Tunnel Authority–Metropolitan Transportation Authority Payroll Mobility Tax Revenue NY | | 5.25% | | 11/15/2042 | | AA+ | | | 10,000,000 | | | | 11,485,326 | |
| Total | | | | | | | | | | | | | 161,960,826 | |
| | | | | | | | | | | | | | | |
| Power 0.39% | | | | | | | | | | | | | | |
| Energy Northwest–Bonneville Power Administration WA | | 5.00% | | 7/1/2038 | | Aa1 | | | 14,000,000 | | | | 16,113,887 | |
| York County Economic Development Authority–Virginia Electric and Power Co | | 3.65% | #(b) | 5/1/2033 | | A2 | | | 3,000,000 | | | | 3,072,511 | |
| Total | | | | | | | | | | | | | 19,186,398 | |
| | | | | | | | | | | | | | | |
| Pre-Refunded 0.00% | | | | | | | | | | | | | | |
| New York State Dormitory Authority–State of New York Personal Income Tax Revenue | | 4.00% | | 2/15/2034 | | NR | | | 15,000 | | | | 15,553 | |
| | | | | | | | | | | | | | | |
| Single-Family Housing 0.20% | | | | | | | | | | | | | | |
| Pennsylvania Housing Finance Agency | | 5.50% | | 10/1/2053 | | AA+ | | | 9,145,000 | | | | 9,807,674 | |
| | | | | | | | | | | | | | | |
| Special Tax 1.80% | | | | | | | | | | | | | | |
| Allentown Neighborhood Improvement Zone Development Authority PA† | | 5.00% | | 5/1/2032 | | Ba3 | | | 1,250,000 | | | | 1,277,036 | |
| Allentown Neighborhood Improvement Zone Development Authority PA† | | 5.375% | | 5/1/2042 | | NR | | | 5,500,000 | | | | 5,571,491 | |
| Allentown Neighborhood Improvement Zone Development Authority PA† | | 6.00% | | 5/1/2042 | | NR | | | 1,795,000 | | | | 1,913,909 | |
| County of Orange CA Community Facilities District No 2015-1 | | 5.00% | | 8/15/2033 | | NR | | | 1,370,000 | | | | 1,387,896 | |
| County of Orange CA Community Facilities District No 2015-1 | | 5.00% | | 8/15/2035 | | NR | | | 975,000 | | | | 986,914 | |
| | See Notes to Financial Statements. | 45 |
Schedule of Investments (continued)
INTERMEDIATE TAX FREE FUND September 30, 2024
| Investments | | Interest
Rate | | Maturity
Date | | Credit
Rating:
S&P or
Moody’s(a) | | Principal
Amount | | | Fair
Value | |
| Special Tax (continued) | | | | | | | | | | | | | | |
| Emeryville Redevelopment Agency Successor Agency CA Tax Allocation (AGM) | | 5.00% | | 9/1/2025 | | AA | | $ | 2,650,000 | | | $ | 2,654,169 | |
| Industrial Development Authority of the City of St. Louis Missouri | | 4.375% | | 11/15/2035 | | NR | | | 3,955,000 | | | | 3,664,910 | |
| Industrial Development Authority of the City of St. Louis Missouri | | 4.75% | | 11/15/2047 | | NR | | | 3,000,000 | | | | 2,604,016 | |
| Lakewood Ranch Stewardship District FL | | 6.125% | | 5/1/2043 | | NR | | | 2,240,000 | | | | 2,414,826 | |
| Miami World Center Community Development District FL | | 4.75% | | 11/1/2027 | | NR | | | 575,000 | | | | 586,574 | |
| Mida Mountain Village Public Infrastructure District UT† | | 4.50% | | 8/1/2040 | | NR | | | 1,250,000 | | | | 1,227,863 | |
| New York City Industrial Development Agency–Queens Ballpark Co LLC NY (AGM) | | 3.00% | | 1/1/2034 | | AA | | | 1,000,000 | | | | 966,602 | |
| New York City Industrial Development Agency–Yankee Stadium LLC NY (AGM) | | 3.00% | | 3/1/2036 | | AA | | | 5,500,000 | | | | 5,298,844 | |
| Peninsula Town Center Community Development Authority VA† | | 4.50% | | 9/1/2028 | | NR | | | 450,000 | | | | 457,659 | |
| Peninsula Town Center Community Development Authority VA† | | 5.00% | | 9/1/2037 | | NR | | | 875,000 | | | | 882,702 | |
| River Islands Public Financing Authority CA Special Tax (AGM) | | 5.00% | | 9/1/2042 | | AA | | | 4,000,000 | | | | 4,413,913 | |
| State of Connecticut Special Tax Revenue | | 4.00% | | 9/1/2034 | | AA | | | 7,525,000 | | | | 7,589,713 | |
| State of Connecticut Special Tax Revenue | | 5.00% | | 10/1/2030 | | AA | | | 9,000,000 | | | | 9,826,869 | |
| State of Connecticut Special Tax Revenue | | 5.00% | | 7/1/2036 | | AA | | | 5,000,000 | | | | 5,868,053 | |
| State of Connecticut Special Tax Revenue | | 5.00% | | 7/1/2037 | | AA | | | 6,000,000 | | | | 7,011,973 | |
| State of Connecticut Special Tax Revenue | | 5.00% | | 7/1/2038 | | AA | | | 5,000,000 | | | | 5,814,331 | |
| Village Community Development District No. 12 FL | | 3.25% | | 5/1/2026 | | NR | | | 1,535,000 | | | | 1,537,802 | |
| Village Community Development District No. 12 FL | | 3.80% | | 5/1/2028 | | NR | | | 1,650,000 | | | | 1,666,137 | |
| Village Community Development District No. 12 FL | | 4.00% | | 5/1/2033 | | NR | | | 1,800,000 | | | | 1,818,463 | |
| Village Community Development District No. 13 FL | | 1.80% | | 5/1/2026 | | NR | | | 345,000 | | | | 336,989 | |
| Village Community Development District No. 13 FL | | 2.85% | | 5/1/2036 | | NR | | | 1,835,000 | | | | 1,628,728 | |
| Village Community Development District No. 13 FL | | 3.00% | | 5/1/2029 | | NR | | | 475,000 | | | | 463,811 | |
| Village Community Development District No. 13 FL† | | 3.00% | | 5/1/2035 | | NR | | | 3,345,000 | | | | 3,075,942 | |
| 46 | See Notes to Financial Statements. |
Schedule of Investments (continued)
INTERMEDIATE TAX FREE FUND September 30, 2024
| Investments | | Interest
Rate | | Maturity
Date | | Credit
Rating:
S&P or
Moody’s(a) | | Principal
Amount | | | Fair
Value | |
| Special Tax (continued) | | | | | | | | | | | | | | |
| Village Community Development District No. 13 FL† | | 3.25% | | 5/1/2040 | | NR | | $ | 4,180,000 | | | $ | 3,736,268 | |
| Village Community Development District No. 13 FL | | 3.375% | | 5/1/2034 | | NR | | | 2,450,000 | | | | 2,374,696 | |
| Total | | | | | | | | | | | | | 89,059,099 | |
| | | | | | | | | | | | | | | |
| Tax Revenue 3.94% | | | | | | | | | | | | | | |
| Chicago Board of Education IL GO | | 5.00% | | 12/1/2032 | | BB+ | | | 5,675,000 | | | | 6,020,094 | |
| City of Miami FL | | 5.00% | | 1/1/2041 | | AA | | | 7,590,000 | | | | 8,591,725 | |
| City of Sparks NV† | | 2.75% | | 6/15/2028 | | Baa2 | | | 1,375,000 | | | | 1,345,975 | |
| County of Cook Sales Tax Revenue IL | | 4.00% | | 11/15/2034 | | AA- | | | 3,750,000 | | | | 3,829,746 | |
| County of Cook Sales Tax Revenue IL | | 5.25% | | 11/15/2036 | | AA- | | | 10,000,000 | | | | 10,575,182 | |
| New Jersey Transportation Trust Fund Authority | | 5.00% | | 6/15/2041 | | A2 | | | 9,000,000 | | | | 10,084,398 | |
| New York City Transitional Finance Authority Building Aid Revenue NY (ST AID WITHHLDG) | | 5.25% | | 7/15/2036 | | AA | | | 11,700,000 | | | | 12,627,050 | |
| New York City Transitional Finance Authority Future Tax Secured Revenue NY | | 3.00% | | 11/1/2037 | | AAA | | | 2,500,000 | | | | 2,378,962 | |
| New York City Transitional Finance Authority Future Tax Secured Revenue NY | | 5.00% | | 8/1/2033 | | AAA | | | 6,000,000 | | | | 6,092,324 | |
| New York City Transitional Finance Authority Future Tax Secured Revenue NY | | 5.00% | | 2/1/2034 | | AAA | | | 10,000,000 | | | | 10,240,634 | |
| New York City Transitional Finance Authority Future Tax Secured Revenue NY(d) | | 5.00% | | 5/1/2040 | | AAA | | | 20,000,000 | | | | 22,873,336 | |
| New York City Transitional Finance Authority Future Tax Secured Revenue NY(d) | | 5.00% | | 5/1/2041 | | AAA | | | 13,590,000 | | | | 15,445,386 | |
| New York City Transitional Finance Authority NY | | 5.00% | | 11/1/2038 | | AAA | | | 5,000,000 | | | | 5,778,952 | |
| New York City Transitional Finance Authority NY | | 5.00% | | 5/1/2039 | | AAA | | | 5,000,000 | | | | 5,702,624 | |
| New York City Transitional Finance Authority NY | | 5.50% | | 5/1/2044 | | AAA | | | 8,500,000 | | | | 9,873,359 | |
| New York State Dormitory Authority–State of New York Personal Income Tax Revenue | | 5.00% | | 3/15/2034 | | AA+ | | | 10,000,000 | | | | 10,174,579 | |
| New York State Dormitory Authority–State of New York Personal Income Tax Revenue | | 5.00% | | 3/15/2041 | | Aa1 | | | 14,900,000 | | | | 16,917,211 | |
| | See Notes to Financial Statements. | 47 |
Schedule of Investments (continued)
INTERMEDIATE TAX FREE FUND September 30, 2024
| Investments | | Interest
Rate | | Maturity
Date | | Credit
Rating:
S&P or
Moody’s(a) | | Principal
Amount | | | Fair
Value | |
| Tax Revenue (continued) | | | | | | | | | | | | | | |
| New York State Dormitory Authority–State of New York Personal Income Tax Revenue | | 5.00% | | 3/15/2042 | | Aa1 | | $ | 10,250,000 | | | $ | 11,578,367 | |
| New York State Urban Development Corp.–State of New York Personal Income Tax Revenue | | 5.00% | | 3/15/2035 | | Aa1 | | | 5,000,000 | | | | 5,780,360 | |
| Puerto Rico Sales Tax Financing Corp. Sales Tax Revenue | | Zero Coupon | | 7/1/2029 | | NR | | | 1,616,000 | | | | 1,354,688 | |
| Puerto Rico Sales Tax Financing Corp. Sales Tax Revenue | | Zero Coupon | | 7/1/2031 | | NR | | | 1,774,000 | | | | 1,370,899 | |
| Puerto Rico Sales Tax Financing Corp. Sales Tax Revenue | | Zero Coupon | | 7/1/2033 | | NR | | | 11,643,000 | | | | 8,259,062 | |
| Puerto Rico Sales Tax Financing Corp. Sales Tax Revenue | | 4.536% | | 7/1/2053 | | NR | | | 81,000 | | | | 80,331 | |
| Puerto Rico Sales Tax Financing Corp. Sales Tax Revenue | | 4.55% | | 7/1/2040 | | NR | | | 268,000 | | | | 269,517 | |
| Puerto Rico Sales Tax Financing Corp. Sales Tax Revenue | | 4.75% | | 7/1/2053 | | NR | | | 1,967,000 | | | | 1,973,055 | |
| Puerto Rico Sales Tax Financing Corp. Sales Tax Revenue | | 4.784% | | 7/1/2058 | | NR | | | 1,092,000 | | | | 1,094,914 | |
| Puerto Rico Sales Tax Financing Corp. Sales Tax Revenue | | 5.00% | | 7/1/2058 | | NR | | | 4,974,000 | | | | 5,025,504 | |
| Total | | | | | | | | | | | | | 195,338,234 | |
| | | | | | | | | | | | | | | |
| Taxable Revenue–Water & Sewer 0.53% | | | | | | | | | | | | | | |
| City of Chicago Waterworks Revenue IL (AGM) | | 5.00% | | 11/1/2036 | | AA | | | 1,500,000 | | | | 1,684,462 | |
| City of Chicago Waterworks Revenue IL (AGM) | | 5.00% | | 11/1/2037 | | AA | | | 1,000,000 | | | | 1,122,295 | |
| City of Chicago Waterworks Revenue IL (AGM) | | 5.00% | | 11/1/2038 | | AA | | | 1,500,000 | | | | 1,671,046 | |
| County of Jefferson Sewer Revenue AL | | 5.00% | | 10/1/2039 | | BBB+ | | | 2,500,000 | | | | 2,776,316 | |
| New Jersey Economic Development Authority–New Jersey-American Water Co Inc AMT | | 3.75% | #(b) | 11/1/2034 | | A+ | | | 5,500,000 | | | | 5,564,071 | |
| Pittsburgh Water & Sewer Authority PA (AGM) | | 5.00% | | 9/1/2037 | | AA | | | 4,750,000 | | | | 5,491,123 | |
| Water Works Board of the City of Birmingham/The AL† | | 3.75% | | 9/1/2026 | | NR | | | 7,750,000 | | | | 7,759,437 | |
| Total | | | | | | | | | | | | | 26,068,750 | |
| 48 | See Notes to Financial Statements. |
Schedule of Investments (continued)
INTERMEDIATE TAX FREE FUND September 30, 2024
| Investments | | Interest
Rate | | Maturity
Date | | Credit
Rating:
S&P or
Moody’s(a) | | Principal
Amount | | | Fair
Value | |
| Tobacco 0.71% | | | | | | | | | | | | | | |
| Buckeye Tobacco Settlement Financing Authority OH | | 5.00% | | 6/1/2055 | | NR | | $ | 9,155,000 | | | $ | 8,628,087 | |
| Iowa Tobacco Settlement Authority | | 4.00% | | 6/1/2049 | | BBB+ | | | 830,000 | | | | 837,224 | |
| Nassau County Tobacco Settlement Corp. NY | | Zero Coupon | | 6/1/2060 | | NR | | | 35,000,000 | | | | 2,400,324 | |
| Northern Tobacco Securitization Corp. AK | | 4.00% | | 6/1/2050 | | BBB- | | | 980,000 | | | | 996,030 | |
| Tobacco Settlement Financing Corp. NJ | | 5.00% | | 6/1/2046 | | BBB- | | | 8,965,000 | | | | 9,046,833 | |
| Tobacco Settlement Financing Corp. NJ | | 5.25% | | 6/1/2046 | | BBB+ | | | 5,100,000 | | | | 5,299,252 | |
| Tobacco Settlement Financing Corp. RI | | 5.00% | | 6/1/2027 | | A | | | 2,500,000 | | | | 2,527,522 | |
| Tobacco Settlement Financing Corp. RI | | 5.00% | | 6/1/2028 | | BBB | | | 2,000,000 | | | | 2,022,210 | |
| Tobacco Settlement Financing Corp. VA | | 5.00% | | 6/1/2047 | | B- | | | 3,690,000 | | | | 3,592,144 | |
| Total | | | | | | | | | | | | | 35,349,626 | |
| | | | | | | | | | | | | | | |
| Transportation 17.76% | | | | | | | | | | | | | | |
| Allegheny County Airport Authority PA (AGM) AMT | | 5.25% | | 1/1/2036 | | AA | | | 1,000,000 | | | | 1,126,340 | |
| Allegheny County Airport Authority PA (AGM) AMT | | 5.25% | | 1/1/2037 | | AA | | | 350,000 | | | | 395,193 | |
| Allegheny County Airport Authority PA (AGM) AMT | | 5.25% | | 1/1/2038 | | AA | | | 350,000 | | | | 393,943 | |
| Allegheny County Airport Authority PA (AGM) AMT | | 5.25% | | 1/1/2039 | | AA | | | 1,000,000 | | | | 1,115,734 | |
| Allegheny County Airport Authority PA (AGM) AMT | | 5.25% | | 1/1/2040 | | AA | | | 1,105,000 | | | | 1,226,410 | |
| Allegheny County Airport Authority PA (AGM) AMT | | 5.50% | | 1/1/2041 | | AA | | | 750,000 | | | | 844,627 | |
| Allegheny County Airport Authority PA (AGM) AMT | | 5.50% | | 1/1/2042 | | AA | | | 680,000 | | | | 762,879 | |
| Burbank-Glendale-Pasadena Airport Authority Brick Campaign CA (AGM) AMT | | 4.125% | | 7/1/2041 | | AA | | | 3,000,000 | | | | 3,015,466 | |
| Burbank-Glendale-Pasadena Airport Authority Brick Campaign CA (AGM) AMT | | 4.25% | | 7/1/2043 | | AA | | | 5,390,000 | | | | 5,466,724 | |
| Burbank-Glendale-Pasadena Airport Authority Brick Campaign CA AMT | | 5.25% | | 7/1/2040 | | A | | | 2,250,000 | | | | 2,548,497 | |
| Burbank-Glendale-Pasadena Airport Authority Brick Campaign CA AMT | | 5.25% | | 7/1/2042 | | A | | | 3,000,000 | | | | 3,365,367 | |
| California Municipal Finance Authority–LAX Integrated Express Solutions LLC AMT | | 5.00% | | 6/30/2031 | | BB+ | (e) | | 3,250,000 | | | | 3,402,132 | |
| | See Notes to Financial Statements. | 49 |
Schedule of Investments (continued)
INTERMEDIATE TAX FREE FUND September 30, 2024
| Investments | | Interest
Rate | | Maturity
Date | | Credit
Rating:
S&P or
Moody’s(a) | | Principal
Amount | | | Fair
Value | |
| Transportation (continued) | | | | | | | | | | | | | | |
| California Municipal Finance Authority–LAX Integrated Express Solutions LLC AMT | | 5.00% | | 12/31/2036 | | BB+ | (e) | $ | 3,215,000 | | | $ | 3,338,327 | |
| California Municipal Finance Authority–LAX Integrated Express Solutions LLC AMT | | 5.00% | | 12/31/2037 | | BB+ | (e) | | 7,000,000 | | | | 7,256,969 | |
| Central Florida Expressway Authority | | 4.00% | | 7/1/2037 | | AA- | | | 7,380,000 | | | | 7,450,623 | |
| Central Texas Regional Mobility Authority | | 5.00% | | 1/1/2025 | | A | | | 7,500,000 | | | | 7,514,239 | |
| Central Texas Turnpike System | | 5.00% | | 8/15/2028 | | A- | | | 3,705,000 | | | | 3,710,296 | |
| Central Texas Turnpike System | | 5.00% | | 8/15/2033 | | A- | | | 7,650,000 | | | | 7,660,935 | |
| Central Texas Turnpike System | | 5.00% | | 8/15/2039 | | A- | | | 4,575,000 | | | | 5,158,040 | |
| Central Texas Turnpike System | | 5.00% | | 8/15/2040 | | A- | | | 5,500,000 | | | | 6,162,901 | |
| Chicago Midway International Airport IL | | 4.00% | | 1/1/2034 | | A | | | 2,175,000 | | | | 2,181,605 | |
| Chicago Midway International Airport IL AMT | | 5.00% | | 1/1/2031 | | A | | | 2,000,000 | | | | 2,032,447 | |
| Chicago Midway International Airport IL AMT | | 5.00% | | 1/1/2037 | | A | | | 5,225,000 | | | | 5,714,863 | |
| Chicago Midway International Airport IL AMT | | 5.00% | | 1/1/2038 | | A | | | 4,000,000 | | | | 4,359,786 | |
| Chicago O’Hare International Airport IL | | 4.00% | | 1/1/2038 | | A+ | | | 6,820,000 | | | | 6,937,700 | |
| Chicago O’Hare International Airport IL | | 5.00% | | 1/1/2039 | | A+ | | | 16,750,000 | | | | 17,268,302 | |
| Chicago O’Hare International Airport IL (BAM) | | 5.00% | | 1/1/2036 | | AA | | | 2,000,000 | | | | 2,294,313 | |
| Chicago O’Hare International Airport IL (BAM) | | 5.00% | | 1/1/2037 | | AA | | | 1,330,000 | | | | 1,513,866 | |
| Chicago O’Hare International Airport IL (BAM) | | 5.00% | | 1/1/2038 | | AA | | | 2,745,000 | | | | 3,103,836 | |
| Chicago O’Hare International Airport IL (BAM) | | 5.25% | | 1/1/2039 | | AA | | | 2,385,000 | | | | 2,717,588 | |
| Chicago O’Hare International Airport IL (BAM) | | 5.25% | | 1/1/2041 | | AA | | | 1,955,000 | | | | 2,205,714 | |
| Chicago O’Hare International Airport IL (BAM) | | 5.25% | | 1/1/2042 | | AA | | | 1,645,000 | | | | 1,848,823 | |
| Chicago O’Hare International Airport IL (BAM) | | 5.25% | | 1/1/2043 | | AA | | | 1,820,000 | | | | 2,037,977 | |
| Chicago O’Hare International Airport IL AMT | | 5.25% | | 1/1/2040 | | A+ | | | 4,000,000 | | | | 4,418,307 | |
| Chicago O’Hare International Airport IL AMT | | 5.25% | | 1/1/2041 | | A+ | | | 2,150,000 | | | | 2,371,726 | |
| 50 | See Notes to Financial Statements. |
Schedule of Investments (continued)
INTERMEDIATE TAX FREE FUND September 30, 2024
| Investments | | Interest
Rate | | Maturity
Date | | Credit
Rating:
S&P or
Moody’s(a) | | Principal
Amount | | | Fair
Value | |
| Transportation (continued) | | | | | | | | | | | | | | |
| Chicago O’Hare International Airport IL AMT | | 5.25% | | 1/1/2042 | | A+ | | $ | 2,450,000 | | | $ | 2,691,330 | |
| Chicago O’Hare International Airport IL AMT | | 5.25% | | 1/1/2043 | | A+ | | | 2,625,000 | | | | 2,876,242 | |
| Chicago O’Hare International Airport IL AMT | | 5.50% | | 1/1/2044 | | A+ | | | 2,625,000 | | | | 2,977,675 | |
| City & County of Denver Airport System Revenue CA AMT | | 5.00% | | 12/1/2028 | | A+ | | | 16,500,000 | | | | 17,685,664 | |
| City & County of Denver Airport System Revenue CO AMT | | 5.50% | | 11/15/2033 | | AA- | | | 8,365,000 | | | | 9,783,070 | |
| City & County of Denver Airport System Revenue CO AMT | | 5.75% | | 11/15/2034 | | AA- | | | 3,500,000 | | | | 4,144,645 | |
| City & County of Denver Airport System Revenue CO AMT | | 5.75% | | 11/15/2035 | | AA- | | | 3,250,000 | | | | 3,834,540 | |
| City & County of Denver Airport System Revenue CO AMT | | 5.75% | | 11/15/2037 | | AA- | | | 2,000,000 | | | | 2,342,563 | |
| City of Atlanta Airport Passenger Facility Charge GA AMT | | 4.00% | | 7/1/2037 | | AA- | | | 4,150,000 | | | | 4,161,057 | |
| City of Atlanta Airport Passenger Facility Charge GA AMT | | 5.00% | | 7/1/2036 | | Aa3 | | | 7,600,000 | | | | 8,415,627 | |
| City of Atlanta Airport Passenger Facility Charge GA AMT | | 5.00% | | 7/1/2037 | | Aa3 | | | 3,750,000 | | | | 4,138,843 | |
| City of Atlanta Airport Passenger Facility Charge GA AMT | | 5.00% | | 7/1/2038 | | Aa3 | | | 2,750,000 | | | | 3,020,909 | |
| City of Atlanta Airport Passenger Facility Charge GA AMT | | 5.25% | | 7/1/2041 | | Aa3 | | | 6,000,000 | | | | 6,684,763 | |
| City of Houston Airport System Revenue–United Airlines Inc TX AMT | | 5.00% | | 7/15/2027 | | BB- | (e) | | 1,000,000 | | | | 1,025,050 | |
| City of Houston Airport System Revenue TX (AGM) AMT | | 5.00% | | 7/1/2035 | | AA | | | 8,005,000 | | | | 8,907,135 | |
| City of Houston Airport System Revenue TX (AGM) AMT | | 5.00% | | 7/1/2036 | | AA | | | 2,850,000 | | | | 3,155,860 | |
| City of Houston Airport System Revenue TX (AGM) AMT | | 5.00% | | 7/1/2037 | | AA | | | 2,000,000 | | | | 2,207,383 | |
| City of Houston Airport System Revenue TX (AGM) AMT | | 5.00% | | 7/1/2038 | | AA | | | 2,000,000 | | | | 2,197,025 | |
| City of Houston Airport System Revenue TX (AGM) AMT | | 5.25% | | 7/1/2039 | | AA | | | 5,200,000 | | | | 5,832,901 | |
| City of Houston Airport System Revenue TX (AGM) AMT | | 5.25% | | 7/1/2040 | | AA | | | 5,000,000 | | | | 5,577,646 | |
| | | |
| | See Notes to Financial Statements. | 51 |
Schedule of Investments (continued)
INTERMEDIATE TAX FREE FUND September 30, 2024
| Investments | | Interest
Rate | | Maturity
Date | | Credit
Rating:
S&P or
Moody’s(a) | | Principal
Amount | | | Fair
Value | |
| Transportation (continued) | | | | | | | | | | | | | | |
| City of Houston Airport System Revenue TX (AGM) AMT | | 5.25% | | 7/1/2041 | | AA | | $ | 5,000,000 | | | $ | 5,550,908 | |
| City of Philadelphia Airport Revenue PA AMT | | 5.00% | | 7/1/2032 | | A2 | | | 3,660,000 | | | | 3,981,855 | |
| City of Phoenix Civic Improvement Corp. AZ | | 5.00% | | 7/1/2036 | | Aa3 | | | 5,000,000 | | | | 5,256,310 | |
| City of Salt Lake City Airport Revenue UT AMT | | 5.00% | | 7/1/2034 | | A+ | | | 10,000,000 | | | | 10,506,416 | |
| City of Salt Lake City Airport Revenue UT AMT | | 5.25% | | 7/1/2036 | | A+ | | | 1,500,000 | | | | 1,688,956 | |
| City of Salt Lake City Airport Revenue UT AMT | | 5.25% | | 7/1/2037 | | A+ | | | 2,325,000 | | | | 2,609,361 | |
| City of Salt Lake City Airport Revenue UT AMT | | 5.25% | | 7/1/2039 | | A+ | | | 3,000,000 | | | | 3,329,488 | |
| City of Salt Lake City Airport Revenue UT AMT | | 5.25% | | 7/1/2041 | | A+ | | | 4,425,000 | | | | 4,860,619 | |
| City of Salt Lake City Airport Revenue UT AMT | | 5.25% | | 7/1/2042 | | A+ | | | 3,500,000 | | | | 3,834,560 | |
| County of Lee Airport Revenue FL AMT(d) | | 5.00% | | 10/1/2036 | | A2 | | | 8,015,000 | | | | 8,843,161 | |
| County of Lee Airport Revenue FL AMT(d) | | 5.25% | | 10/1/2040 | | A2 | | | 6,500,000 | | | | 7,269,639 | |
| County of Lee Airport Revenue FL AMT(d) | | 5.25% | | 10/1/2041 | | A2 | | | 6,750,000 | | | | 7,515,019 | |
| County of Miami-Dade Aviation Revenue FL AMT | | 5.00% | | 10/1/2027 | | A+ | | | 5,145,000 | | | | 5,150,814 | |
| County of Miami-Dade Aviation Revenue FL AMT | | 5.00% | | 10/1/2028 | | A+ | | | 3,500,000 | | | | 3,503,955 | |
| Dallas Fort Worth International Airport TX | | 5.00% | | 11/1/2038 | | AA- | | | 3,000,000 | | | | 3,371,071 | |
| Dallas Fort Worth International Airport TX | | 5.00% | | 11/1/2039 | | AA- | | | 2,750,000 | | | | 3,120,206 | |
| E-470 Public Highway Authority CO | | 5.00% | | 9/1/2040 | | A+ | | | 2,850,000 | | | | 3,263,131 | |
| Florida Development Finance Corp.–AAF Operations Holdings LLC AMT† | | 12.00% | #(b) | 7/15/2032 | | NR | | | 5,500,000 | | | | 5,867,011 | |
| Kansas City Industrial Development Authority MO AMT | | 5.00% | | 3/1/2036 | | A | | | 5,000,000 | | | | 5,244,432 | |
| Kenton County Airport Board AMT | | 5.00% | | 1/1/2035 | | A1 | | | 3,500,000 | | | | 3,892,010 | |
| Kenton County Airport Board AMT | | 5.00% | | 1/1/2036 | | A1 | | | 6,625,000 | | | | 7,335,302 | |
| Kenton County Airport Board AMT | | 5.25% | | 1/1/2039 | | A1 | | | 1,795,000 | | | | 2,013,511 | |
| Kenton County Airport Board AMT | | 5.25% | | 1/1/2041 | | A1 | | | 2,725,000 | | | | 3,023,893 | |
| Kenton County Airport Board AMT | | 5.25% | | 1/1/2043 | | A1 | | | 4,355,000 | | | | 4,793,046 | |
| Maryland Economic Development Corp.–City of Baltimore Port Covington Development District Tax Allocation | | 4.00% | | 9/1/2040 | | NR | | | 5,000,000 | | | | 4,769,465 | |
| | |
| 52 | See Notes to Financial Statements. |
Schedule of Investments (continued)
INTERMEDIATE TAX FREE FUND September 30, 2024
| Investments | | Interest
Rate | | Maturity
Date | | Credit
Rating:
S&P or
Moody’s(a) | | Principal
Amount | | | Fair
Value | |
| Transportation (continued) | | | | | | | | | | | | | | |
| Maryland Economic Development Corp.–CONSOL Marine Terminals LLC | | 5.75% | | 9/1/2025 | | BB | | $ | 3,000,000 | | | $ | 3,023,949 | |
| Metropolitan Nashville Airport Authority TN AMT | | 5.25% | | 7/1/2034 | | A1 | | | 1,250,000 | | | | 1,408,652 | |
| Metropolitan Nashville Airport Authority TN AMT | | 5.25% | | 7/1/2035 | | A1 | | | 2,595,000 | | | | 2,915,140 | |
| Metropolitan Nashville Airport Authority TN AMT | | 5.50% | | 7/1/2036 | | A1 | | | 1,000,000 | | | | 1,152,190 | |
| Metropolitan Nashville Airport Authority TN AMT | | 5.50% | | 7/1/2037 | | A1 | | | 1,250,000 | | | | 1,436,007 | |
| Metropolitan Nashville Airport Authority TN AMT | | 5.50% | | 7/1/2038 | | A1 | | | 1,500,000 | | | | 1,715,956 | |
| Metropolitan Transportation Authority NY | | 5.00% | | 11/15/2033 | | A- | | | 4,025,000 | | | | 4,261,664 | |
| Metropolitan Transportation Authority NY | | 5.00% | | 11/15/2035 | | A- | | | 5,000,000 | | | | 5,094,502 | |
| Metropolitan Transportation Authority NY | | 5.00% | | 11/15/2035 | | A- | | | 4,130,000 | | | | 4,208,059 | |
| Metropolitan Transportation Authority NY | | 5.00% | | 11/15/2035 | | A- | | | 2,160,000 | | | | 2,179,333 | |
| Metropolitan Transportation Authority NY | | 5.25% | | 11/15/2030 | | A- | | | 6,540,000 | | | | 6,698,220 | |
| Metropolitan Washington Airports Authority Aviation Revenue DC | | 5.00% | | 10/1/2040 | | AA- | | | 1,675,000 | | | | 1,821,401 | |
| Metropolitan Washington Airports Authority Aviation Revenue DC | | 5.25% | | 10/1/2041 | | AA- | | | 2,000,000 | | | | 2,233,881 | |
| Metropolitan Washington Airports Authority Aviation Revenue DC AMT | | 5.00% | | 10/1/2036 | | AA- | | | 2,175,000 | | | | 2,388,360 | |
| Metropolitan Washington Airports Authority Aviation Revenue DC AMT | | 5.00% | | 10/1/2037 | | AA- | | | 2,335,000 | | | | 2,557,733 | |
| Metropolitan Washington Airports Authority Aviation Revenue DC AMT | | 5.00% | | 10/1/2038 | | AA- | | | 1,860,000 | | | | 2,027,280 | |
| Metropolitan Washington Airports Authority Aviation Revenue DC AMT | | 5.25% | | 10/1/2039 | | AA- | | | 4,305,000 | | | | 4,806,282 | |
| New Jersey Economic Development Authority–NYNJ Link Borrower LLC AMT | | 5.125% | | 1/1/2034 | | A- | | | 5,010,000 | | | | 5,015,888 | |
| New Jersey Transportation Trust Fund Authority | | 4.00% | | 6/15/2039 | | A2 | | | 6,000,000 | | | | 6,143,842 | |
| New Jersey Transportation Trust Fund Authority | | 5.00% | | 6/15/2028 | | A+ | | | 6,275,000 | | | | 6,500,107 | |
| New Jersey Transportation Trust Fund Authority | | 5.00% | | 6/15/2034 | | A2 | | | 10,000,000 | | | | 11,385,909 | |
| New Jersey Transportation Trust Fund Authority | | 5.00% | | 6/15/2034 | | A2 | | | 2,500,000 | | | | 2,866,359 | |
| New Jersey Transportation Trust Fund Authority | | 5.00% | | 6/15/2035 | | A2 | | | 2,250,000 | | | | 2,566,096 | |
| | | |
| | See Notes to Financial Statements. | 53 |
Schedule of Investments (continued)
INTERMEDIATE TAX FREE FUND September 30, 2024
| Investments | | Interest
Rate | | Maturity
Date | | Credit
Rating:
S&P or
Moody’s(a) | | Principal
Amount | | | Fair
Value | |
| Transportation (continued) | | | | | | | | | | | | | | |
| New Jersey Transportation Trust Fund Authority | | 5.00% | | 6/15/2037 | | A2 | | $ | 4,250,000 | | | $ | 4,802,988 | |
| New Jersey Transportation Trust Fund Authority | | 5.00% | | 6/15/2037 | | A2 | | | 4,000,000 | | | | 4,578,478 | |
| New Jersey Transportation Trust Fund Authority | | 5.00% | | 6/15/2038 | | A2 | | | 1,000,000 | | | | 1,125,728 | |
| New Jersey Transportation Trust Fund Authority | | 5.00% | | 6/15/2038 | | A2 | | | 2,000,000 | | | | 2,264,744 | |
| New Jersey Transportation Trust Fund Authority | | 5.00% | | 6/15/2039 | | A2 | | | 3,000,000 | | | | 3,379,362 | |
| New Jersey Turnpike Authority | | 5.00% | | 1/1/2031 | | AA- | | | 5,000,000 | | | | 5,018,280 | |
| New York City Transitional Development Corp.–JFK NTO LLC NY AMT | | 5.50% | | 6/30/2038 | | Baa3 | | | 1,000,000 | | | | 1,112,062 | |
| New York City Transitional Development Corp.–JFK NTO LLC NY AMT | | 6.00% | | 6/30/2054 | | Baa3 | | | 17,000,000 | | | | 18,588,800 | |
| New York Transportation Development Corp.–Delta Air Lines Inc AMT | | 5.625% | | 4/1/2040 | | Baa3 | | | 29,000,000 | | | | 31,539,095 | |
| New York Transportation Development Corp.–Delta Air Lines Inc AMT | | 6.00% | | 4/1/2035 | | Baa3 | | | 30,000,000 | | | | 33,949,758 | |
| New York Transportation Development Corp.–Empire State Thruway Partners LLC AMT | | 4.00% | | 10/31/2034 | | BBB- | (e) | | 750,000 | | | | 745,777 | |
| New York Transportation Development Corp.–Empire State Thruway Partners LLC AMT | | 4.00% | | 10/31/2041 | | BBB- | (e) | | 3,000,000 | | | | 2,839,642 | |
| New York Transportation Development Corp.–JFK International Air Terminal LLC | | 5.00% | | 12/1/2034 | | Baa1 | | | 2,000,000 | | | | 2,180,916 | |
| New York Transportation Development Corp.–JFK NTO LLC | | 5.25% | | 6/30/2038 | | Baa3 | | | 1,000,000 | | | | 1,110,719 | |
| New York Transportation Development Corp.–JFK NTO LLC | | 5.25% | | 6/30/2040 | | Baa3 | | | 1,500,000 | | | | 1,640,385 | |
| New York Transportation Development Corp.–JFK NTO LLC | | 5.25% | | 6/30/2043 | | Baa3 | | | 8,000,000 | | | | 8,657,190 | |
| New York Transportation Development Corp.–JFK NTO LLC | | 5.25% | | 6/30/2044 | | Baa3 | | | 11,000,000 | | | | 11,866,230 | |
| New York Transportation Development Corp.–JFK NTO LLC (AGM) | | 5.25% | | 6/30/2039 | | AA | | | 1,400,000 | | | | 1,564,783 | |
| New York Transportation Development Corp.–JFK NTO LLC AMT | | 5.25% | | 6/30/2041 | | Baa3 | | | 1,000,000 | | | | 1,090,679 | |
| New York Transportation Development Corp.–Laguardia Gateway Partner AMT | | 4.00% | | 7/1/2032 | | Baa2 | | | 3,000,000 | | | | 3,000,180 | |
| | |
| 54 | See Notes to Financial Statements. |
Schedule of Investments (continued)
INTERMEDIATE TAX FREE FUND September 30, 2024
| Investments | | Interest
Rate | | Maturity
Date | | Credit
Rating:
S&P or
Moody’s(a) | | Principal
Amount | | | Fair
Value | |
| Transportation (continued) | | | | | | | | | | | | | | |
| New York Transportation Development Corp.–Laguardia Gateway Partner AMT | | 4.00% | | 7/1/2033 | | Baa2 | | $ | 6,480,000 | | | $ | 6,480,263 | |
| New York Transportation Development Corp.–Laguardia Gateway Partner AMT | | 5.00% | | 7/1/2034 | | Baa2 | | | 2,250,000 | | | | 2,253,212 | |
| Niagara Frontier Transportation Authority NY AMT | | 5.00% | | 4/1/2027 | | A3 | | | 3,185,000 | | | | 3,187,242 | |
| Niagara Frontier Transportation Authority NY AMT | | 5.00% | | 4/1/2030 | | A3 | | | 365,000 | | | | 386,612 | |
| Niagara Frontier Transportation Authority NY AMT | | 5.00% | | 4/1/2031 | | A3 | | | 300,000 | | | | 316,628 | |
| Niagara Frontier Transportation Authority NY AMT | | 5.00% | | 4/1/2032 | | A3 | | | 775,000 | | | | 816,026 | |
| Niagara Frontier Transportation Authority NY AMT | | 5.00% | | 4/1/2034 | | A3 | | | 865,000 | | | | 908,120 | |
| Norman Y Mineta San Jose International Airport SJC CA | | 5.00% | | 3/1/2028 | | A | | | 1,655,000 | | | | 1,656,968 | |
| Norman Y Mineta San Jose International Airport SJC CA AMT | | 5.00% | | 3/1/2035 | | A | | | 1,500,000 | | | | 1,543,384 | |
| North Carolina Turnpike Authority | | 5.00% | | 1/1/2032 | | BBB | | | 1,000,000 | | | | 1,038,733 | |
| North Carolina Turnpike Authority (AGM) | | 4.00% | | 1/1/2037 | | AA | | | 6,895,000 | | | | 6,973,102 | |
| North Texas Tollway Authority | | 4.125% | | 1/1/2040 | | AA- | | | 5,000,000 | | | | 5,163,883 | |
| North Texas Tollway Authority | | 5.00% | | 1/1/2025 | | AA- | | | 5,000,000 | | | | 5,006,518 | |
| Pennsylvania Turnpike Commission Registration Fee Revenue | 4.00%
(MUNIPSA * 1 + .85% | )# | 7/15/2041 | | AA- | | | 25,000,000 | | | | 25,009,630 | |
| Port Authority of New York & New Jersey | | 5.00% | | 11/15/2036 | | AA- | | | 2,000,000 | | | | 2,115,631 | |
| Port Authority of New York & New Jersey | | 5.00% | | 12/1/2036 | | AA- | | | 2,750,000 | | | | 3,220,232 | |
| Port Authority of New York & New Jersey | | 5.00% | | 12/1/2037 | | AA- | | | 2,250,000 | | | | 2,624,168 | |
| Port Authority of New York & New Jersey | | 5.00% | | 12/1/2038 | | AA- | | | 2,500,000 | | | | 2,901,594 | |
| Port Authority of New York & New Jersey | | 5.00% | | 12/1/2039 | | AA- | | | 3,250,000 | | | | 3,754,951 | |
| Port Authority of New York & New Jersey AMT | | 4.00% | | 11/1/2034 | | AA- | | | 8,705,000 | | | | 8,966,188 | |
| Port Authority of New York & New Jersey AMT | | 5.00% | | 1/15/2036 | | AA- | | | 2,000,000 | | | | 2,214,493 | |
| Port Authority of New York & New Jersey AMT | | 5.00% | | 7/15/2036 | | AA- | | | 4,000,000 | | | | 4,439,540 | |
| Port Authority of New York & New Jersey AMT | | 5.00% | | 12/1/2036 | | AA- | | | 1,750,000 | | | | 1,946,236 | |
| Port Authority of New York & New Jersey AMT | | 5.00% | | 1/15/2037 | | AA- | | | 2,000,000 | | | | 2,206,593 | |
| | | |
| | See Notes to Financial Statements. | 55 |
Schedule of Investments (continued)
INTERMEDIATE TAX FREE FUND September 30, 2024
| Investments | | Interest
Rate | | Maturity
Date | | Credit
Rating:
S&P or
Moody’s(a) | | Principal
Amount | | | Fair
Value | |
| Transportation (continued) | | | | | | | | | | | | | | |
| Port Authority of New York & New Jersey AMT | | 5.00% | | 7/15/2037 | | AA- | | $ | 3,250,000 | | | $ | 3,598,216 | |
| Port Authority of New York & New Jersey AMT | | 5.00% | | 12/1/2037 | | AA- | | | 2,250,000 | | | | 2,496,073 | |
| Port Authority of New York & New Jersey AMT | | 5.00% | | 1/15/2038 | | AA- | | | 1,000,000 | | | | 1,102,674 | |
| Port Authority of New York & New Jersey AMT | | 5.00% | | 7/15/2038 | | AA- | | | 4,500,000 | | | | 4,972,380 | |
| Port Authority of New York & New Jersey AMT | | 5.00% | | 12/1/2038 | | AA- | | | 2,000,000 | | | | 2,212,993 | |
| Port Authority of New York & New Jersey AMT | | 5.00% | | 1/15/2039 | | AA- | | | 1,500,000 | | | | 1,639,789 | |
| Port Authority of New York & New Jersey AMT | | 5.00% | | 7/15/2039 | | AA- | | | 5,250,000 | | | | 5,764,319 | |
| Port of Portland Airport Revenue–Port of Portland OR Airport Revenue OR AMT | | 5.25% | | 7/1/2040 | | AA- | | | 10,605,000 | | | | 11,993,297 | |
| Port of Portland Airport Revenue–Port of Portland OR Airport Revenue OR AMT | | 5.25% | | 7/1/2041 | | AA- | | | 10,000,000 | | | | 11,249,899 | |
| Port of Portland Airport Revenue–Port of Portland OR Airport Revenue OR AMT | | 5.25% | | 7/1/2042 | | AA- | | | 12,500,000 | | | | 14,000,672 | |
| Port of Portland Airport Revenue OR AMT | | 5.00% | | 7/1/2037 | | AA- | | | 4,000,000 | | | | 4,386,448 | |
| Port of Portland Airport Revenue OR AMT | | 5.25% | | 7/1/2039 | | AA- | | | 3,500,000 | | | | 3,939,972 | |
| Port of Seattle WA | | 4.00% | | 6/1/2038 | | AA- | | | 2,700,000 | | | | 2,793,686 | |
| Port of Seattle WA AMT | | 5.25% | | 7/1/2040 | | AA- | | | 5,675,000 | | | | 6,343,782 | |
| Port of Seattle WA AMT | | 5.25% | | 7/1/2041 | | AA- | | | 4,500,000 | | | | 5,004,042 | |
| San Francisco City & County Airport Comm-San Francisco International Airport CA AMT | | 5.00% | | 5/1/2037 | | A+ | | | 4,065,000 | | | | 4,299,725 | |
| San Francisco City & County Airport Comm-San Francisco International Airport CA AMT | | 5.25% | | 5/1/2041 | | A1 | | | 23,100,000 | | | | 25,986,380 | |
| San Francisco City & County Airport Comm-San Francisco International Airport CA AMT | | 5.50% | | 5/1/2037 | | A1 | | | 10,000,000 | | | | 11,632,002 | |
| San Francisco City & County Airport Comm-San Francisco International Airport CA AMT | | 5.50% | | 5/1/2038 | | A1 | | | 14,815,000 | | | | 17,161,511 | |
| State of Alabama Docks Department (AGM) AMT | | 5.00% | | 10/1/2026 | | AA | | | 1,250,000 | | | | 1,288,087 | |
| State of Alabama Docks Department (AGM) AMT | | 5.00% | | 10/1/2027 | | AA | | | 2,000,000 | | | | 2,082,748 | |
| | |
| 56 | See Notes to Financial Statements. |
Schedule of Investments (continued)
INTERMEDIATE TAX FREE FUND September 30, 2024
| Investments | | Interest
Rate | | Maturity
Date | | Credit
Rating:
S&P or
Moody’s(a) | | Principal
Amount | | | Fair
Value | |
| Transportation (continued) | | | | | | | | | | | | | | |
| State of Alabama Docks Department (AGM) AMT | | 5.00% | | 10/1/2029 | | AA | | $ | 3,500,000 | | | $ | 3,634,142 | |
| State of Alaska International Airports System | | 5.00% | | 10/1/2034 | | Aa3 | | | 5,000,000 | | | | 5,080,772 | |
| State of Connecticut Special Tax Revenue | | 4.00% | | 5/1/2039 | | AA | | | 10,000,000 | | | | 10,311,842 | |
| State of Hawaii Airports System Revenue AMT | | 5.00% | | 7/1/2031 | | AA- | | | 1,275,000 | | | | 1,345,250 | |
| State of Hawaii Airports System Revenue AMT | | 5.00% | | 7/1/2033 | | AA- | | | 3,300,000 | | | | 3,471,398 | |
| State of Hawaii Airports System Revenue AMT | | 5.00% | | 7/1/2034 | | AA- | | | 2,000,000 | | | | 2,101,283 | |
| Texas Private Activity Bond Surface Transportation Corp.–NTE Mobility Partners Segments 3 LLC AMT | | 5.375% | | 6/30/2038 | | Baa1 | | | 2,500,000 | | | | 2,717,696 | |
| Texas Private Activity Bond Surface Transportation Corp.–NTE Mobility Partners Segments 3 LLC AMT | | 5.50% | | 6/30/2040 | | Baa1 | | | 2,000,000 | | | | 2,173,757 | |
| Triborough Bridge & Tunnel Authority NY | | 5.00% | | 11/15/2033 | | AA- | | | 6,175,000 | | | | 6,187,544 | |
| Virginia Small Business Financing Authority–95 Express Lanes LLC AMT | | 5.00% | | 1/1/2034 | | BBB | | | 5,100,000 | | | | 5,502,723 | |
| Virginia Small Business Financing Authority–95 Express Lanes LLC AMT | | 5.00% | | 7/1/2036 | | BBB | | | 11,165,000 | | | | 11,954,594 | |
| Virginia Small Business Financing Authority–95 Express Lanes LLC AMT | | 5.00% | | 1/1/2036 | | BBB | | | 2,500,000 | | | | 2,682,733 | |
| Wayne County Airport Authority–Detroit Metropolitan Wayne County Airport MI | | 5.00% | | 12/1/2035 | | A1 | | | 3,565,000 | | | | 3,626,726 | |
| Total | | | | | | | | | | | | | 880,508,270 | |
| |
| Utilities 17.51% | | | | | | | | | | | | | | |
| Amelia County Industrial Development Authority–Waste Management Inc VA AMT | | 1.45% | | 4/1/2027 | | A- | | | 2,500,000 | | | | 2,313,227 | |
| American Municipal Power, Inc.–Prairie St Energy Campus OH | | 5.00% | | 2/15/2037 | | A1 | | | 10,750,000 | | | | 12,262,009 | |
| American Municipal Power, Inc.–Prairie St Energy Campus OH | | 5.00% | | 2/15/2038 | | A1 | | | 10,000,000 | | | | 11,408,446 | |
| American Municipal Power, Inc.–Prairie St Energy Campus OH | | 5.00% | | 2/15/2039 | | A1 | | | 7,000,000 | | | | 7,940,869 | |
| Black Belt Energy Gas District AL | | 4.00% | #(b) | 10/1/2052 | | A2 | | | 23,270,000 | | | | 23,494,432 | |
| Black Belt Energy Gas District AL | | 4.00% | #(b) | 12/1/2052 | | Baa1 | | | 20,680,000 | | | | 20,850,424 | |
| Black Belt Energy Gas District AL | | 5.25% | #(b) | 5/1/2055 | | A1 | | | 8,125,000 | | | | 8,958,342 | |
| | | |
| | See Notes to Financial Statements. | 57 |
Schedule of Investments (continued)
INTERMEDIATE TAX FREE FUND September 30, 2024
| Investments | | Interest
Rate | | Maturity
Date | | Credit
Rating:
S&P or
Moody’s(a) | | Principal
Amount | | | Fair
Value | |
| Utilities (continued) | | | | | | | | | | | | | | |
| California Community Choice Financing Authority | | 5.00% | #(b) | 1/1/2055 | | A1 | | $ | 28,250,000 | | | $ | 31,035,444 | |
| California Community Choice Financing Authority | | 5.25% | | 11/1/2054 | | A2 | | | 8,800,000 | | | | 9,584,002 | |
| California Pollution Control Financing Authority–Poseidon Resources Channelside LP† | | 5.00% | | 7/1/2039 | | Baa3 | | | 5,000,000 | | | | 5,257,198 | |
| California Pollution Control Financing Authority–Poseidon Resources Channelside LP AMT† | | 5.00% | | 7/1/2037 | | Baa3 | | | 5,570,000 | | | | 5,582,818 | |
| Central Plains Energy Project NE | | 2.50% | #(b) | 12/1/2049 | | Aa1 | | | 8,650,000 | | | | 8,542,383 | |
| Central Plains Energy Project NE | | 5.00% | #(b) | 5/1/2054 | | Aa2 | | | 7,500,000 | | | | 8,047,617 | |
| Chautauqua County Capital Resource Corp.–NRG Energy Inc NY | | 4.25% | #(b) | 4/1/2042 | | BBB- | | | 7,250,000 | | | | 7,457,238 | |
| City & County Honolulu Wastewater System Revenue CI | | 4.00% | | 7/1/2035 | | Aa2 | | | 15,500,000 | | | | 15,552,103 | |
| City of Fort Lauderdale Water & Sewer Revenue FL | | 5.00% | | 9/1/2039 | | AA+ | | | 1,250,000 | | | | 1,439,616 | |
| City of Fort Lauderdale Water & Sewer Revenue FL | | 5.00% | | 9/1/2040 | | AA+ | | | 875,000 | | | | 1,001,277 | |
| City of Fort Lauderdale Water & Sewer Revenue FL | | 5.00% | | 9/1/2041 | | AA+ | | | 1,500,000 | | | | 1,708,000 | |
| City of Osceola–Plum Point Energy Associates LLC AR AMT | | 5.50% | #(b) | 4/1/2036 | | NR | | | 16,450,000 | | | | 16,548,374 | |
| City of San Antonio Electric & Gas Systems Revenue TX | | 5.00% | | 2/1/2040 | | Aa2 | | | 4,560,000 | | | | 5,184,872 | |
| City of San Antonio Electric & Gas Systems Revenue TX | | 5.00% | | 2/1/2041 | | Aa2 | | | 2,000,000 | | | | 2,261,943 | |
| City of San Antonio Electric & Gas Systems Revenue TX | | 5.00% | | 2/1/2042 | | Aa2 | | | 8,250,000 | | | | 9,274,186 | |
| City of San Antonio Electric & Gas Systems Revenue TX | | 5.00% | | 2/1/2042 | | Aa2 | | | 3,980,000 | | | | 4,474,092 | |
| City of San Antonio Electric & Gas Systems Revenue TX | | 5.25% | | 2/1/2040 | | Aa2 | | | 8,550,000 | | | | 9,774,386 | |
| City of Seattle Municipal Light & Power Revenue WA | 3.40%
(MUNIPSA * 1 + .25% | )# | 5/1/2045 | | AA | | | 5,000,000 | | | | 4,910,041 | |
| County of Jefferson Sewer Revenue AL | | 5.25% | | 10/1/2040 | | BBB+ | | | 16,910,000 | | | | 18,994,404 | |
| County of Jefferson Sewer Revenue AL | | 5.25% | | 10/1/2041 | | BBB+ | | | 16,815,000 | | | | 18,781,358 | |
| | |
| 58 | See Notes to Financial Statements. |
Schedule of Investments (continued)
INTERMEDIATE TAX FREE FUND September 30, 2024
| Investments | | Interest
Rate | | Maturity
Date | | Credit
Rating:
S&P or
Moody’s(a) | | Principal
Amount | | | Fair
Value | |
| Utilities (continued) | | | | | | | | | | | | | | |
| County of Trimble–Louisville Gas and Electric Co KY AMT | | 4.70% | #(b) | 6/1/2054 | | A1 | | $ | 6,750,000 | | | $ | 6,821,554 | |
| County of Washoe–Sierra Pacific Power Co NV | | 4.125% | #(b) | 3/1/2036 | | A | | | 5,500,000 | | | | 5,586,524 | |
| Delaware State Economic Development Authority–NRG Energy Inc | | 1.25% | #(b) | 10/1/2040 | | BBB- | | | 7,500,000 | | | | 7,301,972 | |
| Delaware State Economic Development Authority–NRG Energy Inc | | 1.25% | #(b) | 10/1/2045 | | BBB- | | | 32,300,000 | | | | 31,447,160 | |
| Development Authority of Appling County–Oglethorpe Power Corp GA | | 1.50% | #(b) | 1/1/2038 | | BBB+ | | | 1,250,000 | | | | 1,233,985 | |
| Development Authority of Burke County–Georgia Power Co | | 2.20% | | 10/1/2032 | | A | | | 1,000,000 | | | | 842,329 | |
| Development Authority of Monroe County–Georgia Power Co | | 3.875% | #(b) | 10/1/2048 | | A | | | 8,750,000 | | | | 8,874,519 | |
| Development Authority of Monroe County–Oglethorpe Power Corp GA | | 1.50% | #(b) | 1/1/2039 | | BBB+ | | | 1,875,000 | | | | 1,850,977 | |
| Energy Southeast A Cooperative District AL | | 5.25% | #(b) | 7/1/2054 | | A1 | | | 14,000,000 | | | | 15,508,394 | |
| Energy Southeast A Cooperative District AL | | 5.443%
(SOFR * .67 + 2.20% | )# | 4/1/2054 | | A1 | | | 5,000,000 | | | | 5,126,375 | |
| Energy Southeast A Cooperative District AL | | 5.75% | #(b) | 4/1/2054 | | A1 | | | 3,400,000 | | | | 3,864,687 | |
| Grand River Dam Authority OK | | 5.00% | | 6/1/2038 | | AA- | | | 3,350,000 | | | | 3,836,850 | |
| Grand River Dam Authority OK | | 5.00% | | 6/1/2039 | | AA- | | | 3,500,000 | | | | 3,977,859 | |
| Grand River Dam Authority OK | | 5.00% | | 6/1/2040 | | AA- | | | 2,500,000 | | | | 2,857,636 | |
| Grand River Dam Authority OK | | 5.00% | | 6/1/2041 | | AA- | | | 6,740,000 | | | | 7,663,620 | |
| Grand River Dam Authority OK | | 5.00% | | 6/1/2042 | | AA- | | | 5,925,000 | | | | 6,696,767 | |
| Illinois Finance Authority–Peoples Gas Light & Coke Co/The | | 3.90% | | 3/1/2030 | | Aa3 | | | 10,000,000 | | | | 9,999,684 | |
| Kentucky Municipal Power Agency | | 3.45% | #(b) | 9/1/2042 | | Baa1 | | | 5,935,000 | | | | 5,923,045 | |
| Kentucky Municipal Power Agency (NATL) | | 5.00% | | 9/1/2033 | | Baa1 | | | 11,295,000 | | | | 11,640,609 | |
| Kentucky Municipal Power Agency (NATL) | | 5.00% | | 9/1/2034 | | Baa1 | | | 5,000,000 | | | | 5,137,990 | |
| Kentucky Public Energy Authority | | 4.00% | #(b) | 8/1/2052 | | A1 | | | 18,770,000 | | | | 19,278,759 | |
| Kentucky Public Energy Authority | | 5.00% | #(b) | 1/1/2055 | | A1 | | | 26,110,000 | | | | 28,570,445 | |
| Kentucky Public Energy Authority | | 5.00% | #(b) | 5/1/2055 | | A2 | | | 12,500,000 | | | | 13,452,879 | |
| Kentucky Public Energy Authority | | 5.25% | #(b) | 4/1/2054 | | A1 | | | 10,000,000 | | | | 11,120,672 | |
| Long Beach Bond Finance Authority CA | 5.034%
(3 Mo. LIBOR * .67 + 1.43% | )# | 11/15/2026 | | A1 | | | 4,000,000 | | | | 4,039,893 | |
| Long Island Power Authority NY | | 0.85% | #(b) | 9/1/2050 | | A | | | 6,000,000 | | | | 5,845,447 | |
| Long Island Power Authority NY | | 5.00% | | 9/1/2041 | | A | | | 12,000,000 | | | | 13,741,104 | |
| | | |
| | See Notes to Financial Statements. | 59 |
Schedule of Investments (continued)
INTERMEDIATE TAX FREE FUND September 30, 2024
| Investments | | Interest
Rate | | Maturity
Date | | Credit
Rating:
S&P or
Moody’s(a) | | Principal
Amount | | | Fair
Value | |
| Utilities (continued) | | | | | | | | | | | | | | |
| Louisiana Local Government Environmental Facilities & Community Development Authority–East Baton Rouge Sewerage Commission | | 0.875% | #(b) | 2/1/2046 | | A+ | | $ | 34,500,000 | | | $ | 34,302,284 | |
| Lower Colorado River Authority TX | | 5.00% | | 5/15/2040 | | A | | | 10,000,000 | | | | 11,129,714 | |
| Lower Colorado River Authority TX | | 5.00% | | 5/15/2041 | | A | | | 10,000,000 | | | | 11,076,500 | |
| Lower Colorado River Authority TX | | 5.00% | | 5/15/2042 | | A | | | 1,750,000 | | | | 1,930,618 | |
| Luzerne County Industrial Development Authority–Pennsylvania-American Water Co AMT | | 2.45% | #(b) | 12/1/2039 | | A+ | | | 4,000,000 | | | | 3,672,884 | |
| Main Street Natural Gas, Inc. GA† | | 4.00% | #(b) | 8/1/2052 | | BBB- | | | 56,250,000 | | | | 56,180,891 | |
| Main Street Natural Gas, Inc. GA | | 4.00% | #(b) | 9/1/2052 | | A3 | | | 30,235,000 | | | | 30,825,384 | |
| Main Street Natural Gas, Inc. GA | | 5.00% | #(b) | 12/1/2053 | | Aa1 | | | 10,000,000 | | | | 10,896,021 | |
| Main Street Natural Gas, Inc. GA | | 5.00% | #(b) | 12/1/2054 | | A3 | | | 11,150,000 | | | | 12,040,862 | |
| Maricopa County Pollution Control Corp.–El Paso Electric Co AZ | | 3.60% | | 2/1/2040 | | Baa2 | | | 5,085,000 | | | | 4,741,289 | |
| Maricopa County Pollution Control Corp.–El Paso Electric Co AZ | | 3.60% | | 4/1/2040 | | Baa2 | | | 3,870,000 | | | | 3,610,745 | |
| Michigan Finance Authority–Great Lakes Water Authority Sewage Disposal System Revenue | | 5.00% | | 7/1/2034 | | A+ | | | 4,200,000 | | | | 4,253,504 | |
| Michigan Finance Authority–Great Lakes Water Authority Sewage Disposal System Revenue | | 5.00% | | 7/1/2035 | | A+ | | | 1,925,000 | | | | 1,949,666 | |
| Montgomery County Industrial Development Authority–Constellation Energy Generation LLC PA | | 4.10% | #(b) | 4/1/2053 | | BBB+ | | | 9,000,000 | | | | 9,254,530 | |
| Municipal Electric Authority of Georgia(d) | | 5.00% | | 1/1/2036 | | A2 | | | 4,200,000 | | | | 4,795,209 | |
| Municipal Electric Authority of Georgia(d) | | 5.00% | | 1/1/2039 | | A2 | | | 1,500,000 | | | | 1,689,618 | |
| Municipal Electric Authority of Georgia(d) | | 5.00% | | 1/1/2040 | | A2 | | | 1,500,000 | | | | 1,679,786 | |
| Municipal Electric Authority of Georgia(d) | | 5.00% | | 1/1/2042 | | A2 | | | 1,550,000 | | | | 1,717,096 | |
| Municipal Electric Authority of Georgia (BAM)(d) | | 5.25% | | 1/1/2041 | | AA | | | 1,250,000 | | | | 1,424,585 | |
| Okaloosa Gas District FL (AGM) | | 5.25% | | 10/1/2042 | | AA | | | 7,500,000 | | | | 8,627,212 | |
| Patriots Energy Group Financing Agency SC | | 5.25% | #(b) | 2/1/2054 | | Aa1 | | | 10,000,000 | | | | 11,001,976 | |
| Patriots Energy Group Financing Agency SC | | 5.25% | #(b) | 10/1/2054 | | A1 | | | 15,000,000 | | | | 16,296,883 | |
| Pennsylvania Economic Development Financing Authority–Talen Energy Supply LLC | | 5.25% | #(b) | 12/1/2038 | | BB- | | | 2,200,000 | | | | 2,242,237 | |
| | |
| 60 | See Notes to Financial Statements. |
Schedule of Investments (continued)
INTERMEDIATE TAX FREE FUND September 30, 2024
| Investments | | Interest
Rate | | Maturity
Date | | Credit
Rating:
S&P or
Moody’s(a) | | Principal
Amount | | | Fair
Value | |
| Utilities (continued) | | | | | | | | | | | | | | |
| Pennsylvania Economic Development Financing Authority–Waste Management Inc AMT | | 1.10% | #(b) | 6/1/2031 | | A- | | $ | 5,000,000 | | | $ | 4,723,980 | |
| Philadelphia Gas Works Co.–Philadelphia Gas Works Co | | 5.00% | | 8/1/2039 | | A | | | 2,250,000 | | | | 2,552,229 | |
| Philadelphia Gas Works Co.–Philadelphia Gas Works Co | | 5.00% | | 8/1/2040 | | A | | | 1,500,000 | | | | 1,692,510 | |
| Philadelphia Gas Works Co.–Philadelphia Gas Works Co | | 5.00% | | 8/1/2042 | | A | | | 2,000,000 | | | | 2,234,045 | |
| Philadelphia Gas Works Co. PA (AGC) | | 5.25% | | 8/1/2041 | | AA | | | 2,000,000 | | | | 2,303,593 | |
| Puerto Rico Electric Power Authority (AGM) | 4.263%
(3 Mo. LIBOR * .67 + .52% | )# | 7/1/2029 | | AA | | | 5,720,000 | | | | 5,509,947 | |
| Salt Verde Financial Corp. AZ | | 5.50% | | 12/1/2029 | | A3 | | | 5,100,000 | | | | 5,598,753 | |
| Southeast Alabama Gas Supply District AL | | 5.00% | #(b) | 8/1/2054 | | Aa3 | | | 10,000,000 | | | | 10,873,692 | |
| Southeast Energy Authority A Cooperative District AL | | 5.50% | #(b) | 1/1/2053 | | A1 | | | 5,000,000 | | | | 5,456,266 | |
| Southern California Public Power Authority–City of Anaheim Electric System Revenue CA | | 5.00% | #(b) | 4/1/2055 | | A2 | | | 10,500,000 | | | | 11,372,361 | |
| Tennergy Corp. TN | | 5.50% | #(b) | 10/1/2053 | | Baa1 | | | 15,000,000 | | | | 16,371,397 | |
| Tennessee Energy Acquisition Corp. | | 5.625% | | 9/1/2026 | | BBB | (e) | | 5,000,000 | | | | 5,210,150 | |
| Texas Municipal Gas Acquisition & Supply Corp. I | | 6.25% | | 12/15/2026 | | A1 | | | 7,680,000 | | | | 7,943,476 | |
| Texas Municipal Gas Acquisition & Supply Corp. IV | | 5.50% | #(b) | 1/1/2054 | | A1 | | | 10,000,000 | | | | 10,893,475 | |
| Texas Municipal Power Agency (AGM) | | 3.00% | | 9/1/2034 | | AA | | | 1,470,000 | | | | 1,412,641 | |
| Texas Municipal Power Agency (AGM) | | 3.00% | | 9/1/2036 | | AA | | | 5,250,000 | | | | 4,912,693 | |
| Texas Water Development Board–State Water Implementation Revenue Fund for Texas | | 5.00% | | 10/15/2036 | | AAA | | | 2,450,000 | | | | 2,841,594 | |
| Texas Water Development Board–State Water Implementation Revenue Fund for Texas | | 5.00% | | 10/15/2038 | | AAA | | | 5,000,000 | | | | 5,780,371 | |
| Total | | | | | | | | | | | | | 867,903,503 | |
| Total Municipal Bonds (cost $4,800,655,742) | | | | | | | | | | | | | 4,896,060,926 | |
| | | |
| | See Notes to Financial Statements. | 61 |
Schedule of Investments (continued)
INTERMEDIATE TAX FREE FUND September 30, 2024
| Investments | | Interest
Rate# | | Interest
Rate
Reset
Date(f) | | Final
Maturity
Date | | Credit
Rating:
S&P or
Moody’s(a) | | Principal
Amount | | | Fair
Value | |
| SHORT-TERM INVESTMENTS 1.62% | | | | | | | | | | | | | | | | |
| | | | | | | | | | | | | | | | | |
| VARIABLE RATE DEMAND NOTES 1.62% | | | | | | | | | | | | | | | | |
| | | | | | | | | | | | | | | | | |
| Education 0.06% | | | | | | | | | | | | | | | | |
| Connecticut State Health & Educational Facilities Authority–Yale University | | 3.600% | | 10/1/2024 | | 7/1/2042 | | AAA | | $ | 3,015,000 | | | $ | 3,015,000 | |
| | | | | | | | | | | | | | | | | |
| General Obligation 0.66% | | | | | | | | | | | | | | | | |
| City of New York NY GO | | 4.150% | | 10/1/2024 | | 4/1/2042 | | AA | | | 8,665,000 | | | | 8,665,000 | |
| City of New York NY GO | | 4.150% | | 10/1/2024 | | 4/1/2042 | | AA | | | 16,025,000 | | | | 16,025,000 | |
| City of New York NY GO | | 4.150% | | 10/1/2024 | | 12/1/2047 | | AA | | | 8,000,000 | | | | 8,000,000 | |
| Total | | | | | | | | | | | | | | | 32,690,000 | |
| | | | | | | | | | | | | | | | | |
| Health Care 0.81% | | | | | | | | | | | | | | | | |
| Wisconsin Health & Educational Facilities Authority–Marshfield Clinic Health System Obligated Group | | 5.000% | | 10/1/2024 | | 2/15/2053 | | BBB | | | 40,000,000 | | | | 40,000,000 | |
| | | | | | | | | | | | | | | | | |
| Taxable Revenue–Water & Sewer 0.05% | | | | | | | | | | | | | | | | |
| Los Angeles Department of Water & Power Water System Revenue CA | | 3.000% | | 10/1/2024 | | 7/1/2045 | | Aa2 | | | 2,400,000 | | | | 2,400,000 | |
| | | | | | | | | | | | | | | | | |
| Utilities 0.04% | | | | | | | | | | | | | | | | |
| Los Angeles Department of Water & Power–Los Angeles Department of Water & Power Power System Revenue CA | | 2.650% | | 10/1/2024 | | 7/1/2035 | | Aa2 | | | 2,000,000 | | | | 2,000,000 | |
| Total Short-Term Investments (cost $80,105,000) | | | | | | | | | | | | | | | 80,105,000 | |
| Total Investments in Securities 100.38% (cost $4,880,760,742) | | | | | | | | | | 4,976,165,926 | |
| Other Assets and Liabilities – Net (0.38)% | | | | | | | | | | | | | | | (18,631,122 | ) |
| Net Assets 100.00% | | | | | | | | | | | | | | $ | 4,957,534,804 | |
| | | |
| AGC | | Insured by–Assured Guarantee Corp. |
| AGM | | Insured by–Assured Guaranty Municipal Corporation. |
| AMBAC | | Insured by–AMBAC Assurance Corporation. |
| AMT | | Income from the security may be subject to Alternative Minimum Tax. |
| BAM | | Insured by–Build America Mutual. |
| COPS | | Certificates of Participation. |
| FHA | | Insured by–Federal Housing Administration. |
| FHLMC | | Insured by–Federal Home Loan Mortgage Corporation. |
| FNMA | | Federal National Mortgage Association. |
| | |
| 62 | See Notes to Financial Statements. |
Schedule of Investments (concluded)
INTERMEDIATE TAX FREE FUND September 30, 2024
| GNMA | | Government National Mortgage Association. |
| GTD | | Guaranteed. |
| HUD | | Insured by–Department of Housing and Urban Development. |
| LIBOR | | London Interbank Offered Rate. |
| MUNIPSA | | SIFMA Municipal Swap Index Yield. |
| NATL | | Insured by–National Public Finance Guarantee Corporation. |
| NR | | Not Rated. |
| PSF | | Permanent School Fund. |
| SIFMA | | Insured by–Securities Industry and Financial Markets Association. |
| SOFR | | Secured Overnight Financing Rate. |
| ST INTERCEPT | | State Intercept. |
| TRIPS | | Tax Refund Intercept Programs. |
| # | | Variable rate security. The interest rate represents the rate in effect at September 30, 2024. |
| † | | Security was purchased pursuant to Rule 144A under the Securities Act of 1933 and, unless registered under such Act or exempted from registration, may only be resold to qualified institutional buyers. At September 30, 2024, the total value of Rule 144A securities was $344,869,613, which represents 6.96% of net assets. |
| (a) | | Unaudited. |
| (b) | | Variable Rate is Fixed to Float: Rate remains fixed or at Zero Coupon until designated future date. |
| (c) | | Defaulted (non-income producing security). |
| (d) | | Securities purchased on a when-issued basis (See Note 2(g)). |
| (e) | | This investment has been rated by Fitch IBCA. |
| (f) | | The interest rate reset date shown represents the date in which the Fund has the right to sell a Variable Rate Demand Note (“VRDN”) back to the issuer for Principal Amount. The interest rate on the VRDN is generally reset daily based on the SIFMA Municipal Swap Index. |
The following is a summary of the inputs used as of September 30, 2024 in valuing the Fund’s investments carried at fair value(1):
| Investment Type(2) | | Level 1 | | | Level 2 | | | Level 3 | | | Total | |
| Long-Term Investments | | | | | | | | | | | | | | | | |
| Municipal Bonds | | $ | – | | | $ | 4,896,060,926 | | | $ | – | | | $ | 4,896,060,926 | |
| Short-Term Investments | | | | | | | | | | | | | | | | |
| Variable Rate Demand Notes | | | – | | | | 80,105,000 | | | | – | | | | 80,105,000 | |
| Total | | $ | – | | | $ | 4,976,165,926 | | | $ | – | | | $ | 4,976,165,926 | |
| | | |
| (1) | | Refer to Note 2(i) for a description of fair value measurements and the three-tier hierarchy of inputs. |
| (2) | | See Schedule of Investments for fair values in each industry. The table above is presented by Investment Type. Industries are presented within an Investment Type should such Investment Type include securities classified as two or more levels within the three-tier fair value hierarchy. When applicable, each Level 3 security is identified on the Schedule of Investments along with the valuation technique utilized. |
A reconciliation of Level 3 investments is presented when the Fund has a material amount of Level 3 investments at the beginning or end of the year in relation to the Fund’s net assets. Management has determined not to provide a reconciliation as the balance of Level 3 investments was not considered to be material to the Fund’s net assets at the beginning or end of the year.
| | See Notes to Financial Statements. | 63 |
Schedule of Investments
NATIONAL TAX FREE FUND September 30, 2024
| Investments | | Interest
Rate | | Maturity
Date | | Credit
Rating:
S&P or
Moody’s(a) | | Principal
Amount | | | Fair
Value | |
| LONG-TERM INVESTMENTS 100.52% | | | | | | | | | | | | | | |
| | | | | | | | | | | | | | | |
| MUNICIPAL BONDS 100.52% | | | | | | | | | | | | | | |
| | | | | | | | | | | | | | | |
| Corporate-Backed 7.21% | | | | | | | | | | | | | | |
| Arkansas Development Finance Authority–Big River Steel LLC AMT† | | 4.50% | | 9/1/2049 | | Ba2 | | $ | 12,500,000 | | | $ | 12,443,896 | |
| Arkansas Development Finance Authority–United States Steel Corp AMT | | 5.45% | | 9/1/2052 | | BB- | | | 3,500,000 | | | | 3,670,897 | |
| Arkansas Development Finance Authority–US Steel Corp AMT | | 5.70% | | 5/1/2053 | | BB- | | | 4,600,000 | | | | 4,899,819 | |
| Black Belt Energy Gas District AL | | 4.00% | #(b) | 10/1/2052 | | A2 | | | 5,300,000 | | | | 5,351,117 | |
| California Infrastructure & Economic Development Bank–DesertXpress Enterprises LLC AMT† | | 8.00% | #(b) | 1/1/2050 | | NR | | | 6,000,000 | | | | 6,179,527 | |
| California Municipal Finance Authority–Waste Management Inc AMT | | 4.80% | #(b) | 11/1/2041 | | A- | | | 5,250,000 | | | | 5,269,622 | |
| California Pollution Control Financing Authority–Poseidon Resources Channelside LP AMT† | | 5.00% | | 11/21/2045 | | Baa3 | | | 18,025,000 | | | | 18,052,908 | |
| City of Valparaiso–Pratt Paper LLC AMT IN† | | 4.875% | | 1/1/2044 | | NR | | | 1,000,000 | | | | 1,051,236 | |
| City of Valparaiso–Pratt Paper LLC AMT IN† | | 5.00% | | 1/1/2054 | | NR | | | 5,200,000 | | | | 5,438,672 | |
| City of Whiting–BP Products North America Inc IN AMT | | 3.00% | | 11/1/2051 | | A1 | | | 6,165,000 | | | | 5,363,622 | |
| Florida Development Finance Corp.–Waste pro USA Inc AMT† | | 6.125% | #(b) | 7/1/2032 | | NR | | | 4,500,000 | | | | 4,626,203 | |
| Grapevine Wash Local District–Grapevine Wash Local District Assessment Area No 1 UT† | | 5.25% | | 12/1/2044 | | NR | | | 8,000,000 | | | | 8,034,265 | |
| Hoover Industrial Development Board–United States Steel Corp AL AMT | | 5.75% | | 10/1/2049 | | BB- | | | 4,090,000 | | | | 4,316,643 | |
| Indiana Finance Authority–United States Steel Corp | | 4.125% | | 12/1/2026 | | BB- | | | 1,625,000 | | | | 1,651,388 | |
| Iowa Finance Authority–Howmet Aerospace Inc | | 4.75% | | 8/1/2042 | | Baa1 | | | 6,140,000 | | | | 6,146,857 | |
| Iowa Finance Authority–Iowa Fertilizer Co LLC | | 4.00% | #(b) | 12/1/2050 | | AA+ | | | 4,795,000 | | | | 5,270,828 | |
| Iowa Finance Authority–Iowa Fertilizer Co LLC | | 5.00% | #(b) | 12/1/2050 | | AA+ | | | 24,000,000 | | | | 28,134,158 | |
| Iowa Finance Authority–Iowa Fertilizer Co LLC | | 5.00% | | 12/1/2050 | | AA+ | | | 25,025,000 | | | | 29,335,721 | |
| 64 | See Notes to Financial Statements. |
Schedule of Investments (continued)
NATIONAL TAX FREE FUND September 30, 2024
| Investments | | Interest
Rate | | Maturity
Date | | Credit
Rating:
S&P or
Moody’s(a) | | Principal
Amount | | | Fair
Value | |
| Corporate-Backed (continued) | | | | | | | | | | | | | | |
| Jefferson County Port Authority–JSW Steel USA Ohio Inc OH† | | 5.00% | #(b) | 12/1/2053 | | Ba1 | | $ | 5,350,000 | | | $ | 5,491,338 | |
| Love Field Airport Modernization Corp.–Southwest Airlines Co TX | | 5.00% | | 11/1/2028 | | Baa1 | | | 2,855,000 | | | | 2,855,965 | |
| Maryland Economic Development Corp.(c) | | 5.00% | | 12/1/2016 | | NR | | | 855,000 | | | | 554,681 | |
| Mission Economic Development Corp.–Natgasoline LLC TX AMT† | | 4.625% | | 10/1/2031 | | BB- | | | 5,250,000 | | | | 5,274,376 | |
| Mobile County Industrial Development Authority–AM/NS Calvert LLC AL | | 5.00% | | 6/1/2054 | | BBB- | | | 16,750,000 | | | | 17,402,349 | |
| New Hampshire Business Finance Authority–Covanta Holding Corp AMT† | | 4.875% | | 11/1/2042 | | B | | | 5,000,000 | | | | 4,967,133 | |
| New Hampshire Business Finance Authority–New York State Electric & Gas Corp AMT | | 4.00% | | 12/1/2028 | | A- | | | 5,000,000 | | | | 5,089,095 | |
| New Jersey Economic Development Authority–United Airlines Inc | | 5.25% | | 9/15/2029 | | BB- | | | 5,790,000 | | | | 5,796,766 | |
| New York City Industrial Development Agency–TRIPS Obligated Group NY | | 5.00% | | 7/1/2028 | | BBB+ | | | 7,695,000 | | | | 7,698,441 | |
| New York Liberty Development Corp. | | 3.00% | | 11/15/2051 | | A+ | | | 14,805,000 | | | | 11,755,454 | |
| New York Liberty Development Corp.–7 World Trade Center II LLC | | 3.00% | | 9/15/2043 | | Aaa | | | 27,780,000 | | | | 23,946,679 | |
| New York Liberty Development Corp.–7 World Trade Center II LLC | | 3.125% | | 9/15/2050 | | Aaa | | | 5,000,000 | | | | 4,119,641 | |
| New York State Environmental Facilities Corp.–Casella Waste Systems Inc AMT† | | 3.125% | #(b) | 12/1/2044 | | B+ | | | 3,000,000 | | | | 2,957,502 | |
| New York State Environmental Facilities Corp.–Casella Waste Systems Inc AMT† | | 5.125% | #(b) | 9/1/2050 | | B+ | | | 1,000,000 | | | | 1,052,901 | |
| New York Transportation Development Corp.–American Airlines Inc AMT | | 5.25% | | 8/1/2031 | | B+ | | | 795,000 | | | | 851,746 | |
| New York Transportation Development Corp.–American Airlines Inc AMT | | 5.375% | | 8/1/2036 | | B+ | | | 3,000,000 | | | | 3,219,598 | |
| Niagara Area Development Corp.–Covanta Holding Corp NY† | | 3.50% | | 11/1/2024 | | B | | | 2,500,000 | | | | 2,499,789 | |
| Niagara Area Development Corp.–Covanta Holding Corp NY AMT† | | 4.75% | | 11/1/2042 | | B | | | 5,000,000 | | | | 4,863,749 | |
| Ohio Air Quality Development Authority–AMG Vanadium LLC AMT† | | 5.00% | | 7/1/2049 | | B- | | | 8,360,000 | | | | 8,366,353 | |
| Parish of St. James–NuStar Logistics LP LA† | | 5.85% | #(b) | 8/1/2041 | | BB+ | | | 1,000,000 | | | | 1,013,573 | |
| Parish of St. James–NuStar Logistics LP LA† | | 6.10% | #(b) | 6/1/2038 | | BB+ | | | 3,050,000 | | | | 3,414,320 | |
| Parish of St. James–NuStar Logistics LP LA† | | 6.10% | #(b) | 12/1/2040 | | BB+ | | | 3,250,000 | | | | 3,647,024 | |
| | See Notes to Financial Statements. | 65 |
Schedule of Investments (continued)
NATIONAL TAX FREE FUND September 30, 2024
| Investments | | Interest
Rate | | Maturity
Date | | Credit
Rating:
S&P or
Moody’s(a) | | Principal
Amount | | | Fair
Value | |
| Corporate-Backed (continued) | | | | | | | | | | | | | | |
| Parish of St. James–NuStar Logistics LP LA† | | 6.35% | | 7/1/2040 | | BB+ | | $ | 3,250,000 | | | $ | 3,617,938 | |
| Parish of St. James–NuStar Logistics LP LA† | | 6.35% | | 10/1/2040 | | BB+ | | | 2,500,000 | | | | 2,783,029 | |
| Phenix City Industrial Development Board AL | | 3.625% | | 5/15/2030 | | BBB | | | 3,160,000 | | | | 3,141,629 | |
| Port of Beaumont Navigation District–Jefferson 2020 Bond Lessee & Borrower LLC Obligated Group TX† | | 5.25% | | 1/1/2054 | | NR | | | 4,900,000 | | | | 5,126,123 | |
| Port of Seattle Industrial Development Corp.–Delta Air Lines Inc WA AMT | | 5.00% | | 4/1/2030 | | BB+ | | | 9,200,000 | | | | 9,203,708 | |
| Public Finance Authority–Sky Harbour Capital LLC Obligated Group WI AMT | | 4.00% | | 7/1/2041 | | NR | | | 1,000,000 | | | | 892,651 | |
| Public Finance Authority–Sky Harbour Capital LLC Obligated Group WI AMT | | 4.25% | | 7/1/2054 | | NR | | | 1,000,000 | | | | 861,839 | |
| Public Finance Authority–TRIPS Obligated Group WI AMT | | 5.00% | | 7/1/2042 | | BBB+ | | | 15,055,000 | | | | 15,058,973 | |
| Tulsa Airports Improvement Trust–American Airlines Inc OK AMT | | 5.50% | | 6/1/2035 | | NR | | | 5,000,000 | | | | 5,009,716 | |
| Tuscaloosa County Industrial Development Authority–Hunt Refining Co AL† | | 5.25% | | 5/1/2044 | | NR | | | 5,000,000 | | | | 5,130,650 | |
| Virginia Small Business Financing Authority–Covanta Holding Corp AMT† | | 5.00% | #(b) | 1/1/2048 | | B | | | 910,000 | | | | 910,160 | |
| West Pace Cooperative District AL(c) | | 9.125% | | 5/1/2039 | | NR | | | 4,900,000 | | | | 3,724,000 | |
| West Virginia Economic Development Authority–Kentucky Power Co AMT | | 4.70% | #(b) | 4/1/2036 | | BBB | | | 3,000,000 | | | | 3,043,167 | |
| Williamsburg Economic Development Authority VA–Provident Group–Williamsburg Properties LLC (AGM) | | 5.25% | | 7/1/2053 | | AA | | | 2,500,000 | | | | 2,753,321 | |
| Total | | | | | | | | | | | | | 343,332,756 | |
| | | | | | | | | | | | | | | |
| Education 9.00% | | | | | | | | | | | | | | |
| Brunswick City School District OH(d) | | 5.50% | | 12/1/2060 | | A1 | | | 11,000,000 | | | | 12,051,774 | |
| Build NYC Resource Corp.–Kipp NYC Public Charter Schools NY | | 5.25% | | 7/1/2052 | | BBB- | | | 4,000,000 | | | | 4,228,538 | |
| California Educational Facilities Authority–Chapman University | | 5.00% | | 4/1/2045 | | A2 | | | 5,000,000 | | | | 5,020,645 | |
| California Educational Facilities Authority–St Mary’s College of California | | 5.25% | | 10/1/2044 | | BBB- | | | 600,000 | | | | 648,845 | |
| California Educational Facilities Authority–St Mary’s College of California | | 5.50% | | 10/1/2053 | | BBB- | | | 2,200,000 | | | | 2,376,484 | |
| 66 | See Notes to Financial Statements. |
Schedule of Investments (continued)
NATIONAL TAX FREE FUND September 30, 2024
| Investments | | Interest
Rate | | Maturity
Date | | Credit
Rating:
S&P or
Moody’s(a) | | Principal
Amount | | | Fair
Value | |
| Education (continued) | | | | | | | | | | | | | | |
| California School Finance Authority–Green Dot Public Schools Obligated Group† | | 5.00% | | 8/1/2045 | | BBB- | | $ | 1,500,000 | | | $ | 1,507,231 | |
| California School Finance Authority–Kipp SoCal Public Schools Obligated† | | 5.00% | | 7/1/2047 | | BBB | | | 2,050,000 | | | | 2,078,770 | |
| Camden County Improvement Authority–KIPP Cooper Norcross Obligated Group NJ | | 6.00% | | 6/15/2062 | | BBB | | | 2,540,000 | | | | 2,746,452 | |
| Chicago Board of Education Dedicated Capital Improvement Tax IL | | 5.75% | | 4/1/2048 | | A | (e) | | 7,250,000 | | | | 8,095,759 | |
| Chicago Board of Education Dedicated Capital Improvement Tax IL | | 6.10% | | 4/1/2036 | | A | (e) | | 4,235,000 | | | | 4,492,467 | |
| Chicago Board of Education Dedicated Capital Improvement Tax IL TCRS (BAM) | | 5.00% | | 4/1/2045 | | AA | | | 2,500,000 | | | | 2,691,714 | |
| Chicago Board of Education IL GO | | 4.00% | | 12/1/2047 | | BB+ | | | 15,510,000 | | | | 13,803,469 | |
| Chicago Board of Education IL GO | | 5.00% | | 12/1/2044 | | BB+ | | | 1,750,000 | | | | 1,769,895 | |
| City of Waltham MA GO | | 2.00% | | 10/15/2035 | | AA+ | | | 4,920,000 | | | | 4,153,732 | |
| City of Waltham MA GO | | 2.00% | | 10/15/2036 | | AA+ | | | 5,015,000 | | | | 4,134,911 | |
| Clifton Higher Education Finance Corp.–International Leadership of Texas Inc | | 6.00% | | 8/15/2038 | | Baa3 | | | 4,045,000 | | | | 4,126,307 | |
| Clifton Higher Education Finance Corp.–International Leadership of Texas Inc (PSF-GTD) | | 3.00% | | 8/15/2051 | | Aaa | | | 5,750,000 | | | | 4,520,243 | |
| Connecticut State Health & Educational Facilities Authority–Quinnipiac University | | 5.25% | | 7/1/2053 | | A- | | | 15,000,000 | | | | 16,270,876 | |
| Dutchess County Local Development Corp.–Bard College NY | | 5.00% | | 7/1/2045 | | BBB- | | | 1,000,000 | | | | 1,037,476 | |
| Florida Development Finance Corp.–Mater Academy Inc | | 5.00% | | 6/15/2047 | | BBB | | | 6,600,000 | | | | 6,679,475 | |
| Florida Higher Educational Facilities Financial Authority–Nova Southeastern University Inc | | 5.00% | | 4/1/2033 | | A- | | | 1,475,000 | | | | 1,506,826 | |
| Florida Higher Educational Facilities Financial Authority–Nova Southeastern University Inc | | 5.00% | | 4/1/2036 | | A- | | | 2,000,000 | | | | 2,040,156 | |
| Great Oaks Career Campuses Board of Education OH | | 3.00% | | 12/1/2050 | | Aa1 | | | 15,460,000 | | | | 12,539,000 | |
| Homewood Educational Building Authority–Samford University AL | | 5.00% | | 12/1/2047 | | Baa2 | | | 13,425,000 | | | | 13,608,102 | |
| Illinois Finance Authority–Illinois Institute of Technology | | 4.00% | | 9/1/2037 | | Ba2 | | | 3,135,000 | | | | 2,754,500 | |
| | See Notes to Financial Statements. | 67 |
Schedule of Investments (continued)
NATIONAL TAX FREE FUND September 30, 2024
| Investments | | Interest
Rate | | Maturity
Date | | Credit
Rating:
S&P or
Moody’s(a) | | Principal
Amount | | | Fair
Value | |
| Education (continued) | | | | | | | | | | | | | | |
| Illinois Finance Authority–Illinois Institute of Technology | | 4.00% | | 9/1/2039 | | Ba2 | | $ | 4,295,000 | | | $ | 3,664,518 | |
| Illinois Finance Authority–Illinois Institute of Technology | | 5.00% | | 9/1/2040 | | Ba2 | | | 2,020,000 | | | | 1,932,274 | |
| Illinois Finance Authority–University of Chicago | | 5.25% | | 5/15/2048 | | Aa2 | | | 7,500,000 | | | | 8,372,101 | |
| Illinois Finance Authority–University of Chicago | | 5.25% | | 5/15/2054 | | Aa2 | | | 18,850,000 | | | | 20,852,173 | |
| Iowa Higher Education Loan Authority–Des Moines University Osteopathic Medical Center IA | | 5.00% | | 10/1/2038 | | BBB+ | | | 2,730,000 | | | | 2,899,570 | |
| Iowa Higher Education Loan Authority–Des Moines University Osteopathic Medical Center IA | | 5.00% | | 10/1/2039 | | BBB+ | | | 2,870,000 | | | | 3,036,774 | |
| Iowa Higher Education Loan Authority–Des Moines University Osteopathic Medical Center IA | | 5.00% | | 10/1/2040 | | BBB+ | | | 3,535,000 | | | | 3,725,374 | |
| Iowa Higher Education Loan Authority–Des Moines University Osteopathic Medical Center IA | | 5.00% | | 10/1/2047 | | BBB+ | | | 1,800,000 | | | | 1,864,140 | |
| Louisiana Public Facilities Authority–Loyola University New Orleans | | 5.25% | | 10/1/2053 | | Baa1 | | | 21,000,000 | | | | 22,128,454 | |
| Louisiana Public Facilities Authority–Tulane University | | 4.00% | | 4/1/2050 | | A+ | | | 11,540,000 | | | | 11,297,864 | |
| Maine Health & Higher Educational Facilities Authority–Northeastern University | | 5.25% | | 10/1/2054 | | A1 | | | 13,750,000 | | | | 15,391,607 | |
| Massachusetts Development Finance Agency–Suffolk University | | 5.00% | | 7/1/2032 | | Baa3 | | | 3,750,000 | | | | 3,860,916 | |
| Massachusetts Development Finance Agency–Suffolk University | | 5.00% | | 7/1/2033 | | Baa3 | | | 1,250,000 | | | | 1,285,512 | |
| Massachusetts Development Finance Agency–Suffolk University | | 5.00% | | 7/1/2034 | | Baa3 | | | 1,600,000 | | | | 1,643,515 | |
| Massachusetts Development Finance Agency–Trustees of Boston University | | 5.00% | | 10/1/2048 | | AA- | | | 4,650,000 | | | | 5,130,012 | |
| Metropolitan Government Nashville & Davidson County Health & Educational Facilities Board–Lipscomb University Obligated Group TN | | 5.25% | | 10/1/2058 | | BBB- | | | 6,065,000 | | | | 6,197,614 | |
| Miami-Dade County Educational Facilities Authority–University of Miami FL | | 5.00% | | 4/1/2053 | | A2 | | | 5,000,000 | | | | 5,168,014 | |
| 68 | See Notes to Financial Statements. |
Schedule of Investments (continued)
NATIONAL TAX FREE FUND September 30, 2024
| Investments | | Interest
Rate | | Maturity
Date | | Credit
Rating:
S&P or
Moody’s(a) | | Principal
Amount | | | Fair
Value | |
| Education (continued) | | | | | | | | | | | | | | |
| Middlesex County Improvement Authority–Rutgers The State University of New Jersey(d) | | 5.00% | | 8/15/2053 | | Aa3 | | $ | 15,000,000 | | | $ | 16,566,916 | |
| Montebello Unified School District CA GO (AGM) | | 5.50% | | 8/1/2047 | | AA | | | 6,500,000 | | | | 7,139,299 | |
| New Jersey Educational Facilities Authority | | 5.25% | | 9/1/2053 | | A2 | | | 2,100,000 | | | | 2,299,928 | |
| New York State Dormitory Authority–Cornell University | | 5.50% | | 7/1/2054 | | Aa1 | | | 22,500,000 | | | | 26,040,789 | |
| New York State Dormitory Authority–Icahn School of Medicine Mount Sinai | | 5.00% | | 7/1/2040 | | BBB+ | | | 5,000,000 | | | | 5,017,813 | |
| New York State Dormitory Authority–New School | | 4.00% | | 7/1/2052 | | A3 | | | 7,870,000 | | | | 7,605,067 | |
| New York State Dormitory Authority–New York Institute of Technology NY | | 5.25% | | 7/1/2049 | | BBB | | | 1,300,000 | | | | 1,420,195 | |
| New York State Dormitory Authority–New York Institute of Technology NY | | 5.25% | | 7/1/2054 | | BBB | | | 1,900,000 | | | | 2,059,165 | |
| New York State Dormitory Authority–Pace University | | 5.50% | | 5/1/2056 | | BBB- | | | 8,500,000 | | | | 9,382,787 | |
| New York State Dormitory Authority–Yeshiva University | | 5.00% | | 7/15/2042 | | BBB- | | | 3,720,000 | | | | 3,888,920 | |
| New York State Dormitory Authority–Yeshiva University | | 5.00% | | 7/15/2050 | | BBB- | | | 8,000,000 | | | | 8,234,386 | |
| Ohio Higher Educational Facility Commission(d) | | 5.25% | | 10/1/2053 | | AA- | | | 11,500,000 | | | | 12,744,703 | |
| Ohio Higher Educational Facility Commission–Oberlin College | | 5.25% | | 10/1/2053 | | AA- | | | 2,680,000 | | | | 2,971,121 | |
| Onondaga County Trust for Cultural Resources–Syracuse University NY | | 5.00% | | 12/1/2043 | | AA- | | | 8,000,000 | | | | 8,570,690 | |
| Public Finance Authority–Wingate University WI | | 5.25% | | 10/1/2038 | | BBB- | | | 2,220,000 | | | | 2,231,006 | |
| Public Finance Authority–Wingate University WI | | 5.25% | | 10/1/2043 | | BBB- | | | 1,000,000 | | | | 989,222 | |
| Rhode Island Health & Educational Building Corp.–Providence College | | 5.00% | | 11/1/2053 | | A | | | 12,975,000 | | | | 14,146,029 | |
| Shaker Heights City School District OH | | 5.25% | | 12/15/2059 | | AA | | | 7,380,000 | | | | 8,251,883 | |
| Sierra Vista Industrial Development Authority–American Leadership Academy Inc AZ†(f) | | 5.00% | | 6/15/2054 | | NR | | | 700,000 | | | | 706,668 | |
| Sierra Vista Industrial Development Authority–American Leadership Academy Inc AZ†(f) | | 5.00% | | 6/15/2059 | | NR | | | 700,000 | | | | 704,691 | |
| | See Notes to Financial Statements. | 69 |
Schedule of Investments (continued)
NATIONAL TAX FREE FUND September 30, 2024
| Investments | | Interest
Rate | | Maturity
Date | | Credit
Rating:
S&P or
Moody’s(a) | | Principal
Amount | | | Fair
Value | |
| Education (continued) | | | | | | | | | | | | | | |
| Sierra Vista Industrial Development Authority–American Leadership Academy Inc AZ†(f) | | 5.00% | | 6/15/2064 | | NR | | $ | 720,000 | | | $ | 722,789 | |
| Town of Davie–Nova Southeastern University Inc FL | | 5.00% | | 4/1/2048 | | A- | | | 3,000,000 | | | | 3,091,943 | |
| University of Connecticut | | 5.25% | | 11/15/2047 | | Aa3 | | | 8,080,000 | | | | 8,547,236 | |
| University of Illinois (AGM) | | 4.00% | | 4/1/2038 | | AA | | | 4,965,000 | | | | 4,999,874 | |
| University of North Carolina at Wilmington | | 5.00% | | 6/1/2037 | | A1 | | | 7,055,000 | | | | 7,116,642 | |
| Vermont Educational & Health Buildings Financing Agency–President & Fellows of Middlebury College | | 4.00% | | 11/1/2050 | | AA | | | 4,625,000 | | | | 4,639,680 | |
| Washington State Housing Finance Commission–Seattle Academy of Arts & Sciences† | | 6.125% | | 7/1/2053 | | BBB | | | 2,500,000 | | | | 2,768,044 | |
| Washington State Housing Finance Commission–Seattle Academy of Arts & Sciences† | | 6.375% | | 7/1/2063 | | BBB | | | 2,000,000 | | | | 2,222,138 | |
| Total | | | | | | | | | | | | | 428,413,703 | |
| | | | | | | | | | | | | | | |
| Electric Revenue Bonds 0.34% | | | | | | | | | | | | | | |
| City of San Antonio TX Electric & Gas Systems Revenue(d) | | 5.00% | | 2/1/2054 | | Aa2 | | | 15,000,000 | | | | 16,307,066 | |
| | | | | | | | | | | | | | | |
| Energy 0.60% | | | | | | | | | | | | | | |
| Main Street Natural Gas, Inc. GA | | 5.00% | | 5/15/2038 | | A1 | | | 3,745,000 | | | | 4,084,505 | |
| PEFA, Inc. IA | | 5.00% | #(b) | 9/1/2049 | | A3 | | | 23,635,000 | | | | 24,312,679 | |
| Total | | | | | | | | | | | | | 28,397,184 | |
| | | | | | | | | | | | | | | |
| Financial Services 0.11% | | | | | | | | | | | | | | |
| Massachusetts Educational Financing Authority AMT | | 4.125% | | 7/1/2046 | | BBB | | | 5,755,000 | | | | 5,423,066 | |
| | | | | | | | | | | | | | | |
| General Obligation 14.56% | | | | | | | | | | | | | | |
| Black Belt Energy Gas District AL | | 5.25% | #(b) | 2/1/2053 | | A1 | | | 7,500,000 | | | | 8,047,567 | |
| California Community Choice Financing Authority | | 5.25% | #(b) | 1/1/2054 | | Baa1 | | | 41,700,000 | | | | 45,077,083 | |
| California State Public Works Board–State of California Department of General Services | | 5.00% | | 4/1/2049 | | Aa3 | | | 9,600,000 | | | | 10,813,393 | |
| Chicago Board of Education IL GO | | 4.00% | | 12/1/2040 | | BB+ | | | 2,600,000 | | | | 2,468,935 | |
| Chicago Board of Education IL GO | | 4.00% | | 12/1/2041 | | BB+ | | | 5,000,000 | | | | 4,698,073 | |
| Chicago Board of Education IL GO | | 5.00% | | 12/1/2029 | | BB+ | | | 2,000,000 | | | | 2,090,794 | |
| 70 | See Notes to Financial Statements. |
Schedule of Investments (continued)
NATIONAL TAX FREE FUND September 30, 2024
| Investments | | Interest
Rate | | Maturity
Date | | Credit
Rating:
S&P or
Moody’s(a) | | Principal
Amount | | | Fair
Value | |
| General Obligation (continued) | | | | | | | | | | | | | | |
| Chicago Board of Education IL GO | | 5.00% | | 12/1/2030 | | BB+ | | $ | 2,070,000 | | | $ | 2,153,044 | |
| Chicago Board of Education IL GO | | 5.00% | | 12/1/2031 | | BB+ | | | 1,000,000 | | | | 1,039,533 | |
| Chicago Board of Education IL GO | | 5.00% | | 12/1/2047 | | BB+ | | | 4,435,000 | | | | 4,533,842 | |
| Chicago Board of Education IL GO | | 5.875% | | 12/1/2047 | | BB+ | | | 3,750,000 | | | | 4,148,630 | |
| Chicago Board of Education IL GO | | 6.00% | | 12/1/2049 | | BB+ | | | 4,875,000 | | | | 5,422,683 | |
| Chicago Board of Education IL GO | | 6.50% | | 12/1/2046 | | BB+ | | | 1,100,000 | | | | 1,145,003 | |
| Chicago Board of Education IL GO† | | 7.00% | | 12/1/2046 | | BB+ | | | 1,200,000 | | | | 1,298,566 | |
| City of Chicago IL GO | | 5.00% | | 1/1/2044 | | BBB+ | | | 4,060,000 | | | | 4,279,419 | |
| City of Chicago IL GO | | 5.00% | | 1/1/2045 | | BBB+ | | | 7,200,000 | | | | 7,567,444 | |
| City of Chicago IL GO | | 5.25% | | 1/1/2045 | | BBB+ | | | 13,400,000 | | | | 14,361,934 | |
| City of Chicago IL GO | | 5.50% | | 1/1/2034 | | BBB+ | | | 2,400,000 | | | | 2,407,973 | |
| City of Chicago IL GO | | 5.50% | | 1/1/2037 | | BBB+ | | | 3,245,000 | | | | 3,254,157 | |
| City of Chicago IL GO | | 5.50% | | 1/1/2039 | | BBB+ | | | 2,125,000 | | | | 2,348,167 | |
| City of Chicago IL GO | | 5.50% | | 1/1/2040 | | BBB+ | | | 2,500,000 | | | | 2,505,620 | |
| City of Chicago IL GO | | 5.50% | | 1/1/2042 | | BBB+ | | | 5,000,000 | | | | 5,009,659 | |
| City of Chicago IL GO | | 5.50% | | 1/1/2049 | | BBB+ | | | 18,285,000 | | | | 19,093,998 | |
| City of Chicago IL GO | | 6.00% | | 1/1/2038 | | BBB+ | | | 19,430,000 | | | | 20,315,314 | |
| City of New York NY GO | | 5.00% | | 8/1/2051 | | AA | | | 7,275,000 | | | | 7,935,957 | |
| City of New York NY GO | | 5.25% | | 9/1/2043 | | AA | | | 6,500,000 | | | | 7,303,837 | |
| City of New York NY GO | | 5.25% | | 4/1/2054 | | AA | | | 8,500,000 | | | | 9,472,635 | |
| City of New York NY GO | | 5.50% | | 5/1/2046 | | AA | | | 2,675,000 | | | | 3,016,236 | |
| City of New York NY GO TCRS (BAM) | | 3.00% | | 3/1/2051 | | AA | | | 5,000,000 | | | | 3,974,649 | |
| City of Philadelphia PA GO | | 5.00% | | 8/1/2037 | | A1 | | | 3,250,000 | | | | 3,418,088 | |
| Commonwealth of Massachusetts GO | | 5.00% | | 1/1/2054 | | AA+ | | | 7,740,000 | | | | 8,468,670 | |
| Commonwealth of Pennsylvania GO | | 4.00% | | 3/1/2037 | | Aa3 | | | 4,255,000 | | | | 4,341,141 | |
| Commonwealth of Puerto Rico GO | | 4.00% | | 7/1/2037 | | NR | | | 13,782,789 | | | | 13,694,530 | |
| Commonwealth of Puerto Rico GO | | 4.00% | | 7/1/2046 | | NR | | | 15,000,000 | | | | 14,173,739 | |
| Commonwealth of Puerto Rico GO | | 5.375% | | 7/1/2025 | | NR | | | 2,576,932 | | | | 2,592,289 | |
| County of Anne Arundel MD GO | | 3.00% | | 10/1/2044 | | AAA | | | 7,415,000 | | | | 6,431,110 | |
| County of Cook IL GO | | 5.00% | | 11/15/2030 | | A+ | | | 1,000,000 | | | | 1,045,667 | |
| County of Cook IL GO | | 5.00% | | 11/15/2035 | | A+ | | | 1,000,000 | | | | 1,038,952 | |
| County of Luzerne PA GO (AGM) | | 5.00% | | 11/15/2029 | | AA | | | 4,215,000 | | | | 4,316,047 | |
| County of Pasco–State of Florida Cigarette Tax Revenue (AGM) | | 5.75% | | 9/1/2054 | | AA | | | 4,770,000 | | | | 5,403,853 | |
| Forney Independent School District TX GO (PSF-GTD) | | 3.00% | | 2/15/2045 | | AAA | | | 6,050,000 | | | | 5,040,786 | |
| Grant County Public Hospital District No. 1 WA GO | | 5.125% | | 12/1/2048 | | Baa2 | | | 5,000,000 | | | | 5,158,592 | |
| | See Notes to Financial Statements. | 71 |
Schedule of Investments (continued)
NATIONAL TAX FREE FUND September 30, 2024
| Investments | | Interest
Rate | | Maturity
Date | | Credit
Rating:
S&P or
Moody’s(a) | | Principal
Amount | | | Fair
Value | |
| General Obligation (continued) | | | | | | | | | | | | | | |
| Hudson Yards Infrastructure Corp. NY | | 4.00% | | 2/15/2044 | | AA | | $ | 9,400,000 | | | $ | 9,598,890 | |
| Irvine Unified School District–Community Facilities District No 01-1 CA Special Tax (BAM) | | 5.00% | | 9/1/2056 | | AA | | | 500,000 | | | | 514,959 | |
| King County Public Hospital District No. 4 WA GO | | 5.00% | | 12/1/2038 | | NR | | | 5,000,000 | | | | 5,015,750 | |
| Louisiana Stadium & Exposition District | | 5.00% | | 7/1/2048 | | A2 | | | 4,750,000 | | | | 5,212,121 | |
| Louisiana Stadium & Exposition District | | 5.25% | | 7/1/2053 | | A2 | | | 15,715,000 | | | | 17,424,508 | |
| Main Street Natural Gas, Inc. GA | | 5.00% | | 5/15/2027 | | A1 | | | 4,500,000 | | | | 4,684,247 | |
| Main Street Natural Gas, Inc. GA | | 5.00% | | 5/15/2029 | | A1 | | | 2,940,000 | | | | 3,144,313 | |
| Main Street Natural Gas, Inc. GA | | 5.00% | #(b) | 6/1/2053 | | A3 | | | 20,965,000 | | | | 22,396,299 | |
| Metropolitan Government Nashville & Davidson County Sports Authority TN (AGM) | | 5.25% | | 7/1/2048 | | AA | | | 2,000,000 | | | | 2,216,981 | |
| Metropolitan Government Nashville & Davidson County Sports Authority TN (AGM) | | 5.25% | | 7/1/2048 | | AA | | | 3,980,000 | | | | 4,405,260 | |
| Metropolitan Government Nashville & Davidson County Sports Authority TN (AGM) | | 5.25% | | 7/1/2053 | | AA | | | 4,000,000 | | | | 4,398,504 | |
| Metropolitan Government Nashville & Davidson County Sports Authority TN (AGM) | | 5.25% | | 7/1/2053 | | AA | | | 5,000,000 | | | | 5,490,001 | |
| Metropolitan Pier & Exposition Authority IL | | 4.00% | | 6/15/2050 | | A | | | 25,900,000 | | | | 24,743,531 | |
| Metropolitan Pier & Exposition Authority IL (AGM) | | 4.00% | | 6/15/2050 | | AA | | | 6,000,000 | | | | 5,832,356 | |
| New Jersey Economic Development Authority–New Jersey Transit Corp | | 5.25% | | 11/1/2047 | | A2 | | | 11,050,000 | | | | 12,188,738 | |
| New Jersey Transportation Trust Fund Authority | Zero Coupon | | 12/15/2029 | | A2 | | | 15,365,000 | | | | 13,096,568 | |
| New Jersey Transportation Trust Fund Authority | | 5.00% | | 6/15/2048 | | A2 | | | 5,000,000 | | | | 5,425,049 | |
| New Jersey Transportation Trust Fund Authority–State of New Jersey | | 5.25% | | 6/15/2041 | | A2 | | | 6,250,000 | | | | 7,135,995 | |
| New Jersey Transportation Trust Fund Authority–State of New Jersey | | 5.25% | | 6/15/2042 | | A2 | | | 2,000,000 | | | | 2,273,713 | |
| New York City Transitional Finance Authority Future Tax Secured Revenue NY | | 5.00% | | 2/1/2044 | | AAA | | | 15,000,000 | | | | 16,527,294 | |
| New York City Transitional Finance Authority Future Tax Secured Revenue NY | | 5.50% | | 11/1/2045 | | AAA | | | 7,500,000 | | | | 8,589,353 | |
| New York State Thruway Authority–State of New York Personal Income Tax Revenue | | 3.00% | | 3/15/2048 | | AA+ | | | 19,635,000 | | | | 16,096,649 | |
| New York State Thruway Authority–State of New York Personal Income Tax Revenue | | 3.00% | | 3/15/2049 | | AA+ | | | 7,085,000 | | | | 5,761,993 | |
| 72 | See Notes to Financial Statements. |
Schedule of Investments (continued)
NATIONAL TAX FREE FUND September 30, 2024
| Investments | | Interest
Rate | | Maturity
Date | | Credit
Rating:
S&P or
Moody’s(a) | | Principal
Amount | | | Fair
Value | |
| General Obligation (continued) | | | | | | | | | | | | | | |
| New York State Thruway Authority–State of New York Personal Income Tax Revenue | | 3.00% | | 3/15/2051 | | AA+ | | $ | 4,110,000 | | | $ | 3,289,580 | |
| New York State Urban Development Corp.–State of New York Sales Tax Revenue | | 3.00% | | 3/15/2049 | | Aa1 | | | 4,970,000 | | | | 4,072,252 | |
| Pennsylvania Economic Development Financing Authority–Commonwealth of Pennsylvania Department of Transportation AMT | | 6.00% | | 6/30/2061 | | Baa2 | | | 30,325,000 | | | | 34,296,414 | |
| Royse City Independent School District TX (PSF-GTD) | | 5.00% | | 2/15/2054 | | Aaa | | | 7,000,000 | | | | 7,625,999 | |
| San Bernardino Community College District CA GO | Zero Coupon | | 8/1/2044 | | Aa1 | | | 7,750,000 | | | | 3,549,894 | |
| San Francisco Bay Area Rapid Transit District Sales Tax Revenue CA | | 3.00% | | 7/1/2044 | | AA+ | | | 6,505,000 | | | | 5,689,671 | |
| School District of Philadelphia PA GO (ST AID WITHHLDG) | | 5.00% | | 9/1/2037 | | A1 | | | 1,200,000 | | | | 1,230,740 | |
| Southwest Local School District/Hamilton County OH GO (SD CRED PROG) | | 4.00% | | 1/15/2055 | | Aa1 | | | 7,000,000 | | | | 6,862,762 | |
| St. Louis County Reorganized School District No. R-6 MO GO | | 3.35% | | 2/1/2037 | | AAA | | | 6,350,000 | | | | 6,220,890 | |
| St. Louis County Reorganized School District No. R-6 MO GO | | 3.40% | | 2/1/2038 | | AAA | | | 6,150,000 | | | | 6,021,739 | |
| State of California GO | | 5.00% | | 8/1/2038 | | Aa2 | | | 3,700,000 | | | | 3,823,604 | |
| State of California GO | | 5.25% | | 8/1/2032 | | Aa2 | | | 7,500,000 | | | | 7,640,495 | |
| State of California GO | | 5.25% | | 10/1/2050 | | Aa2 | | | 7,500,000 | | | | 8,523,918 | |
| State of Connecticut GO | | 5.00% | | 6/15/2038 | | AA- | | | 1,000,000 | | | | 1,064,921 | |
| State of Connecticut GO | | 5.00% | | 4/15/2039 | | AA- | | | 1,650,000 | | | | 1,778,071 | |
| State of Illinois GO | | 4.00% | | 11/1/2037 | | A- | | | 6,810,000 | | | | 6,880,163 | |
| State of Illinois GO | | 5.00% | | 1/1/2035 | | A- | | | 6,200,000 | | | | 6,306,091 | |
| State of Illinois GO | | 5.00% | | 12/1/2035 | | A- | | | 2,145,000 | | | | 2,239,243 | |
| State of Illinois GO | | 5.00% | | 5/1/2038 | | A- | | | 4,515,000 | | | | 4,706,332 | |
| State of Illinois GO | | 5.00% | | 1/1/2041 | | A- | | | 3,580,000 | | | | 3,620,603 | |
| State of Illinois GO | | 5.00% | | 5/1/2043 | | A- | | | 3,000,000 | | | | 3,096,612 | |
| State of Illinois GO | | 5.25% | | 5/1/2045 | | A- | | | 2,500,000 | | | | 2,766,414 | |
| State of Illinois GO | | 5.25% | | 5/1/2047 | | A- | | | 1,500,000 | | | | 1,652,442 | |
| State of Illinois GO | | 5.25% | | 5/1/2048 | | A- | | | 1,500,000 | | | | 1,648,853 | |
| State of Illinois GO | | 5.25% | | 5/1/2049 | | A- | | | 1,750,000 | | | | 1,919,460 | |
| State of Illinois GO | | 5.50% | | 5/1/2039 | | A- | | | 8,250,000 | | | | 9,073,461 | |
| State of Illinois GO | | 5.50% | | 10/1/2039 | | A- | | | 6,000,000 | | | | 6,813,138 | |
| State of Illinois GO | | 5.50% | | 3/1/2042 | | A- | | | 5,250,000 | | | | 5,863,290 | |
| | See Notes to Financial Statements. | 73 |
Schedule of Investments (continued)
NATIONAL TAX FREE FUND September 30, 2024
| Investments | | Interest
Rate | | Maturity
Date | | Credit
Rating:
S&P or
Moody’s(a) | | Principal
Amount | | | Fair
Value | |
| General Obligation (continued) | | | | | | | | | | | | | | |
| State of Illinois GO | | 5.50% | | 3/1/2047 | | A- | | $ | 10,950,000 | | | $ | 12,060,796 | |
| State of Illinois GO | | 5.50% | | 5/1/2047 | | A- | | | 11,165,000 | | | | 12,316,395 | |
| State of Illinois GO | | 5.75% | | 5/1/2045 | | A- | | | 2,600,000 | | | | 2,858,877 | |
| Union County Utilities Authority–Covanta Union LLC NJ GTD AMT | | 4.75% | | 12/1/2031 | | AA+ | | | 3,855,000 | | | | 3,856,116 | |
| Washington & Multnomah Counties School District No. 48J Beaverton OR GO (SCH BD GTY) | | 5.00% | | 6/15/2036 | | AA+ | | | 8,000,000 | | | | 8,433,971 | |
| Washington State Convention Center Public Facilities District | | 5.00% | | 7/1/2048 | | Baa1 | | | 7,000,000 | | | | 7,164,087 | |
| Washington Township Health Care District CA GO | | 5.50% | | 8/1/2053 | | AA | | | 2,000,000 | | | | 2,288,611 | |
| Wilkes-Barre Area School District PA GO (BAM), (ST AID WITHHLDG) | | 5.00% | | 4/15/2059 | | AA | | | 2,500,000 | | | | 2,582,502 | |
| Total | | | | | | | | | | | | | 692,919,088 | |
| | | | | | | | | | | | | | | |
| Health Care 15.05% | | | | | | | | | | | | | | |
| Antelope Valley Healthcare District Obligated Group CA | | 5.00% | | 3/1/2041 | | BBB | | | 3,000,000 | | | | 3,002,315 | |
| Antelope Valley Healthcare District Obligated Group CA | | 5.00% | | 3/1/2046 | | BBB | | | 2,615,000 | | | | 2,596,253 | |
| Astoria Hospital Facilities Authority–Columbia Lutheran Charities Obligated Group OR | | 5.25% | | 8/1/2049 | | BBB | | | 2,700,000 | | | | 2,914,771 | |
| Astoria Hospital Facilities Authority–Columbia Lutheran Charities Obligated Group OR | | 5.25% | | 8/1/2054 | | BBB | | | 4,250,000 | | | | 4,559,642 | |
| Berks County Municipal Authority–Tower Health Obligated Group PA | Zero Coupon | | 6/30/2044 | | NR | | | 8,008,000 | | | | 5,105,574 | |
| Berks County Municipal Authority–Tower Health Obligated Group PA | | 5.00% | | 6/30/2039 | | NR | | | 16,473,000 | | | | 16,330,186 | |
| Berks County Municipal Authority–Tower Health Obligated Group PA | | 6.00% | | 6/30/2034 | | NR | | | 1,160,196 | | | | 1,261,509 | |
| Berks County Municipal Authority–Tower Health Obligated Group PA | | 6.00% | | 6/30/2034 | | NR | | | 58,718 | | | | 63,845 | |
| Berks County Municipal Authority–Tower Health Obligated Group PA | | 8.00% | | 6/30/2034 | | NR | | | 2,315,173 | | | | 2,369,696 | |
| Berks County Municipal Authority–Tower Health Obligated Group PA | | 8.00% | | 6/30/2034 | | NR | | | 117,436 | | | | 117,436 | |
| Board of Managers Joint Guadalupe County-City of Seguin Hospital TX | | 5.00% | | 12/1/2045 | | BB | | | 2,000,000 | | | | 1,902,799 | |
| 74 | See Notes to Financial Statements. |
Schedule of Investments (continued)
NATIONAL TAX FREE FUND September 30, 2024
| Investments | | Interest
Rate | | Maturity
Date | | Credit
Rating:
S&P or
Moody’s(a) | | Principal
Amount | | | Fair
Value | |
| Health Care (continued) | | | | | | | | | | | | | | |
| California Health Facilities Financing Authority–Children’s Hospital Los Angeles Obligated Group | | 5.00% | | 8/15/2047 | | BBB | | $ | 3,025,000 | | | $ | 3,101,260 | |
| California Health Facilities Financing Authority–City of Hope Obligated Group | | 4.00% | | 11/15/2045 | | A | | | 7,050,000 | | | | 6,942,860 | |
| California Municipal Finance Authority–Community Hospitals of Central California Obligated Group | | 5.00% | | 2/1/2047 | | A3 | | | 6,940,000 | | | | 6,998,302 | |
| California Municipal Finance Authority (AGM) | | 4.00% | | 2/1/2051 | | AA | | | 8,900,000 | | | | 8,698,100 | |
| California Statewide Communities Development Authority–Loma Linda University Medical Obligated Group† | | 5.25% | | 12/1/2043 | | BB | | | 4,510,000 | | | | 4,695,401 | |
| California Statewide Communities Development Authority–Loma Linda University Medical Obligated Group | | 5.50% | | 12/1/2054 | | BB | | | 6,875,000 | | | | 6,882,959 | |
| California Statewide Communities Development Authority–Loma Linda University Medical Obligated Group† | | 5.50% | | 12/1/2058 | | BB | | | 3,375,000 | | | | 3,497,667 | |
| Chattanooga Health Educational & Housing Facility Board–Erlanger Health Obligated Group TN | | 5.25% | | 12/1/2054 | | A | | | 20,000,000 | | | | 21,906,694 | |
| City of Colby KS–Citizens Medical Center Inc | | 5.50% | | 7/1/2026 | | NR | | | 7,400,000 | | | | 7,462,181 | |
| City of Jacksonville–Genesis Health Inc Obligated Group FL | | 5.00% | | 11/1/2050 | | A- | | | 4,605,000 | | | | 4,767,650 | |
| City of Minneapolis–Fairview Health Services Obligated Group MN | | 5.00% | | 11/15/2049 | | BBB+ | | | 9,650,000 | | | | 9,785,799 | |
| City of Seneca–Nemaha Valley Community Hospital KS | | 5.00% | | 9/1/2025 | | NR | | | 4,000,000 | | | | 4,020,226 | |
| City of St. Cloud–CentraCare Health System Obligated Group MN(f) | | 5.00% | | 5/1/2054 | | A2 | | | 7,250,000 | | | | 7,860,044 | |
| City of Tampa–H Lee Moffitt Cancer Center & Research Institute Obligated Group FL | | 4.00% | | 7/1/2045 | | A | | | 7,400,000 | | | | 7,216,742 | |
| Colorado Health Facilities Authority–CommonSpirit Health Obligated Group | | 5.00% | | 8/1/2044 | | A- | | | 3,000,000 | | | | 3,129,388 | |
| Colorado Health Facilities Authority–CommonSpirit Health Obligated Group | | 5.50% | | 11/1/2047 | | A- | | | 4,390,000 | | | | 4,943,593 | |
| Columbia County Hospital Authority–WellStar Health System Obligated Group GA | | 5.75% | | 4/1/2053 | | A+ | | | 2,670,000 | | | | 3,057,210 | |
| Connecticut State Health & Educational Facilities Authority–Nuvance Health Obligated Group | | 4.00% | | 7/1/2041 | | BBB | | | 7,920,000 | | | | 7,665,757 | |
| | See Notes to Financial Statements. | 75 |
Schedule of Investments (continued)
NATIONAL TAX FREE FUND September 30, 2024
| Investments | | Interest
Rate | | Maturity
Date | | Credit
Rating:
S&P or
Moody’s(a) | | Principal
Amount | | | Fair
Value | |
| Health Care (continued) | | | | | | | | | | | | | | |
| Connecticut State Health & Educational Facilities Authority–Nuvance Health Obligated Group | | 4.00% | | 7/1/2049 | | BBB | | $ | 6,875,000 | | | $ | 6,472,614 | |
| County of Cuyahoga–MetroHealth System OH | | 5.50% | | 2/15/2052 | | BBB | | | 8,925,000 | | | | 9,138,960 | |
| County of Cuyahoga–MetroHealth System OH | | 5.50% | | 2/15/2057 | | BBB | | | 5,250,000 | | | | 5,363,791 | |
| County of Montgomery–Premier Health Partners Obligated Group OH | | 4.00% | | 11/15/2042 | | Baa1 | | | 10,800,000 | | | | 10,307,344 | |
| County of Muskingum–Genesis Healthcare Obligated Group OH | | 5.00% | | 2/15/2044 | | BB+ | | | 2,650,000 | | | | 2,649,960 | |
| County of Warren–Bowling Green-Warren County Community Hospital Corp KY | | 5.25% | | 4/1/2049 | | AA- | | | 8,610,000 | | | | 9,504,009 | |
| County of Warren–Bowling Green-Warren County Community Hospital Corp KY | | 5.25% | | 4/1/2054 | | AA- | | | 8,000,000 | | | | 8,768,344 | |
| Crawford County Hospital Authority–Meadville Medical Center Obligated Group PA | | 6.00% | | 6/1/2046 | | NR | | | 950,000 | | | | 961,377 | |
| Crawford County Hospital Authority–Meadville Medical Center Obligated Group PA | | 6.00% | | 6/1/2051 | | NR | | | 1,115,000 | | | | 1,124,370 | |
| Cumberland County Municipal Authority–Penn State Health Obligated Group PA | | 3.00% | | 11/1/2038 | | A | | | 4,315,000 | | | | 3,870,620 | |
| Denver Health & Hospital Authority CO | | 5.25% | | 12/1/2045 | | BBB | | | 700,000 | | | | 700,428 | |
| Duluth Economic Development Authority–Essentia Health Obligated Group MN | | 5.25% | | 2/15/2053 | | A- | | | 2,870,000 | | | | 2,958,247 | |
| Duluth Economic Development Authority–Essentia Health Obligated Group MN | | 5.25% | | 2/15/2058 | | A- | | | 21,000,000 | | | | 21,609,993 | |
| Duluth Economic Development Authority–St Luke’s Hospital of Duluth Obligated MN | | 5.25% | | 6/15/2052 | | AA- | | | 5,000,000 | | | | 5,459,701 | |
| Genesee County Funding Corp.–Rochester Regional Health Obligated NY | | 5.25% | | 12/1/2052 | | BBB+ | | | 4,000,000 | | | | 4,205,166 | |
| Greater Texas Cultural Education Facilities Finance Corp.–Texas Biomedical Research Institute TX | | 5.00% | | 6/1/2043 | | Baa2 | | | 4,720,000 | | | | 5,012,970 | |
| Greater Texas Cultural Education Facilities Finance Corp.–Texas Biomedical Research Institute TX | | 5.00% | | 6/1/2044 | | Baa2 | | | 4,135,000 | | | | 4,376,625 | |
| Greenville Health System–Prisma Health Obligated Group SC | | 5.00% | | 5/1/2034 | | A | | | 3,970,000 | | | | 3,971,885 | |
| Hospitals & Higher Education Facilities Authority of Philadelphia–Temple University Health Obligated Group PA | | 5.00% | | 7/1/2032 | | BBB | | | 1,000,000 | | | | 1,022,496 | |
| 76 | See Notes to Financial Statements. |
Schedule of Investments (continued)
NATIONAL TAX FREE FUND September 30, 2024
| Investments | | Interest
Rate | | Maturity
Date | | Credit
Rating:
S&P or
Moody’s(a) | | Principal
Amount | | | Fair
Value | |
| Health Care (continued) | | | | | | | | | | | | | | |
| Hospitals & Higher Education Facilities Authority of Philadelphia–Temple University Health Obligated Group PA | | 5.00% | | 7/1/2033 | | BBB | | $ | 2,950,000 | | | $ | 3,013,716 | |
| Illinois Finance Authority–University of Chicago Medical Center Obligated Group | | 5.00% | | 8/15/2052 | | AA- | | | 15,000,000 | | | | 15,765,442 | |
| Isle of Weight County Economic Development Authority–Riverside Healthcare Association Obligated Group VA (AGM) | | 5.25% | | 7/1/2048 | | AA | | | 3,000,000 | | | | 3,333,289 | |
| Isle of Weight County Economic Development Authority–Riverside Healthcare Association Obligated Group VA (AGM) | | 5.25% | | 7/1/2053 | | AA | | | 6,000,000 | | | | 6,582,376 | |
| Lee Memorial Health System Obligated Group FL | | 4.00% | | 4/1/2049 | | A+ | | | 5,500,000 | | | | 5,318,745 | |
| Louisville/Jefferson County Metropolitan Government–Norton Healthcare Obligated Group KY | | 5.00% | | 10/1/2041 | | A | | | 3,200,000 | | | | 3,515,999 | |
| Maryland Health & Higher Educational Facilities Authority–Adventist Healthcare Obligated Group | | 5.00% | | 1/1/2036 | | Baa3 | | | 3,290,000 | | | | 3,496,220 | |
| Maryland Health & Higher Educational Facilities Authority–Adventist Healthcare Obligated Group | | 5.50% | | 1/1/2046 | | Baa3 | | | 17,990,000 | | | | 18,325,229 | |
| Maryland Health & Higher Educational Facilities Authority–Mercy Medical Center Obligated Group | | 5.00% | | 7/1/2036 | | A- | | | 1,320,000 | | | | 1,346,027 | |
| Maryland Health & Higher Educational Facilities Authority–Mercy Medical Center Obligated Group | | 5.00% | | 7/1/2038 | | A- | | | 2,250,000 | | | | 2,286,285 | |
| Massachusetts Development Finance Agency–Boston Medical Center Corp Obligated Group | | 5.00% | | 7/1/2031 | | BBB | | | 1,980,000 | | | | 2,041,441 | |
| Massachusetts Development Finance Agency–Boston Medical Center Corp Obligated Group | | 5.00% | | 7/1/2035 | | BBB | | | 5,115,000 | | | | 5,232,208 | |
| Massachusetts Development Finance Agency–Boston Medical Center Corp Obligated Group | | 5.25% | | 7/1/2048 | | BBB | | | 2,600,000 | | | | 2,875,333 | |
| Massachusetts Development Finance Agency–Mass General Brigham Inc | | 5.00% | | 7/1/2054 | | AA- | | | 11,000,000 | | | | 11,946,091 | |
| Massachusetts Development Finance Agency–Tufts Medicine Obligated Group | | 4.00% | | 7/1/2035 | | BBB- | | | 2,000,000 | | | | 1,916,494 | |
| | See Notes to Financial Statements. | 77 |
Schedule of Investments (continued)
NATIONAL TAX FREE FUND September 30, 2024
| Investments | | Interest
Rate | | Maturity
Date | | Credit
Rating:
S&P or
Moody’s(a) | | Principal
Amount | | | Fair
Value | |
| Health Care (continued) | | | | | | | | | | | | |
| Massachusetts Development Finance Agency–Tufts Medicine Obligated Group | | 4.00% | | 7/1/2044 | | BBB- | | $ | 5,380,000 | | | $ | 4,901,373 | |
| Massachusetts Development Finance Agency–Tufts Medicine Obligated Group | | 5.00% | | 7/1/2039 | | BBB- | | | 3,360,000 | | | | 3,397,632 | |
| Massachusetts Development Finance Agency–Tufts Medicine Obligated Group | | 5.00% | | 7/1/2044 | | BBB- | | | 1,600,000 | | | | 1,611,710 | |
| Massachusetts Development Finance Agency–Tufts Medicine Obligated Group | | 8.50% | | 10/1/2026 | | BBB- | | | 8,910,000 | | | | 9,105,208 | |
| Michigan Finance Authority Provident Group–HFH Energy LLC | | 5.50% | | 2/28/2049 | | A3 | | | 3,100,000 | | | | 3,536,985 | |
| Michigan Finance Authority Provident Group–HFH Energy LLC | | 5.50% | | 2/28/2057 | | A3 | | | 2,200,000 | | | | 2,476,109 | |
| Michigan State Hospital Finance Authority–Ascension Health Credit Group | | 5.00% | | 11/15/2047 | | AA+ | | | 4,000,000 | | | | 4,221,561 | |
| Minnesota Agricultural & Economic Development Board–HealthPartners Obligated Group | | 5.25% | | 1/1/2054 | | A | | | 12,900,000 | | | | 14,232,240 | |
| Monroe County Hospital Authority–Centurion Foundation Lehigh Valley LLC PA† | | 5.10% | | 6/15/2039 | | NR | | | 10,000,000 | | | | 10,192,111 | |
| Montana Facility Finance Authority–Kalispell Regional Medical Center Obligated Group | | 5.00% | | 7/1/2043 | | A | | | 4,000,000 | | | | 4,072,517 | |
| Montana Facility Finance Authority–Kalispell Regional Medical Center Obligated Group | | 5.00% | | 7/1/2048 | | A | | | 5,760,000 | | | | 5,850,381 | |
| Montgomery County Higher Education & Health Authority–Thomas Jefferson University Obligated Group PA | | 4.00% | | 9/1/2049 | | A | | | 3,960,000 | | | | 3,739,180 | |
| Nassau County Local Economic Assistance Corp.–Catholic Health Services of Long Island Obligated Group NY | | 5.00% | | 7/1/2029 | | A- | | | 1,000,000 | | | | 1,001,105 | |
| Nassau County Local Economic Assistance Corp.–Catholic Health Services of Long Island Obligated Group NY | | 5.00% | | 7/1/2030 | | A- | | | 580,000 | | | | 580,574 | |
| Nassau County Local Economic Assistance Corp.–Catholic Health Services of Long Island Obligated Group NY | | 5.00% | | 7/1/2031 | | A- | | | 1,620,000 | | | | 1,621,425 | |
| Nassau County Local Economic Assistance Corp.–Catholic Health Services of Long Island Obligated Group NY | | 5.00% | | 7/1/2034 | | A- | | | 1,100,000 | | | | 1,100,712 | |
| Nebraska Educational Health Cultural & Social Services Finance Authority–Immanuel Retirement Communities Obligated Group | | 4.00% | | 1/1/2044 | | AA | (e) | | 3,500,000 | | | | 3,315,046 | |
| 78 | See Notes to Financial Statements. |
Schedule of Investments (continued)
NATIONAL TAX FREE FUND September 30, 2024
| Investments | | Interest
Rate | | Maturity
Date | | Credit
Rating:
S&P or
Moody’s(a) | | Principal
Amount | | | Fair
Value | |
| Health Care (continued) | | | | | | | | | | | | | | |
| New Hampshire Business Finance Authority–NFA UH SPV LLC† | | 5.625% | | 12/15/2033 | | NR | | $ | 2,500,000 | | | $ | 2,580,317 | |
| New Hampshire Business Finance Authority–NFA UH SPV LLC† | | 6.25% | | 12/15/2038 | | NR | | | 2,565,000 | | | | 2,694,833 | |
| New Jersey Health Care Facilities Financing Authority–St Joseph’s Healthcare System Obligated Group | | 4.00% | | 7/1/2048 | | BBB- | | | 8,110,000 | | | | 7,550,377 | |
| New York State Dormitory Authority–Garnet Health Medical Center Obligated Group† | | 5.00% | | 12/1/2031 | | Ba2 | | | 1,300,000 | | | | 1,301,332 | |
| New York State Dormitory Authority–Garnet Health Medical Center Obligated Group† | | 5.00% | | 12/1/2040 | | Ba2 | | | 1,300,000 | | | | 1,271,423 | |
| New York State Dormitory Authority–Montefiore Obligated Group | | 4.00% | | 8/1/2038 | | BBB- | | | 4,900,000 | | | | 4,890,051 | |
| New York State Dormitory Authority–Montefiore Obligated Group | | 5.00% | | 8/1/2028 | | BBB- | | | 3,055,000 | | | | 3,199,908 | |
| New York State Dormitory Authority–Northwell Health Obligated Group | | 5.00% | | 5/1/2037 | | A- | | | 7,450,000 | | | | 7,514,152 | |
| New York State Dormitory Authority–Northwell Health Obligated Group | | 5.00% | | 5/1/2052 | | A- | | | 8,085,000 | | | | 8,651,264 | |
| New York State Dormitory Authority–Northwell Health Obligated Group(d) | | 5.00% | | 5/1/2052 | | A- | | | 33,500,000 | | | | 35,819,618 | |
| Niagara Area Development Corp.–Catholic Health System Obligated Group NY | | 5.00% | | 7/1/2052 | | B- | | | 1,500,000 | | | | 1,456,069 | |
| Oklahoma Development Finance Authority–OU Medicine Obligated Group | | 5.25% | | 8/15/2048 | | BB | | | 4,660,000 | | | | 4,786,957 | |
| Oklahoma Development Finance Authority–OU Medicine Obligated Group | | 5.50% | | 8/15/2052 | | BB | | | 10,015,000 | | | | 10,369,646 | |
| Oklahoma Development Finance Authority–OU Medicine Obligated Group | | 5.50% | | 8/15/2057 | | BB | | | 10,000,000 | | | | 10,328,388 | |
| Oregon State Facilities Authority–Providence St Joseph Health Obligated Group | | 5.00% | | 10/1/2045 | | A | | | 7,000,000 | | | | 7,048,334 | |
| Palm Beach County Health Facilities Authority–Baptist Health South Obligated Group FL | | 4.00% | | 8/15/2049 | | AA- | | | 6,765,000 | | | | 6,589,955 | |
| Palomar Health Obligated Group CA | | 5.00% | | 11/1/2036 | | BB+ | | | 11,025,000 | | | | 11,082,498 | |
| Palomar Health Obligated Group CA | | 5.00% | | 11/1/2039 | | BB+ | | | 8,240,000 | | | | 8,255,096 | |
| Pennsylvania Economic Development Financing Authority–UPMC Obligated Group | | 4.00% | | 5/15/2048 | | A | | | 3,500,000 | | | | 3,421,932 | |
| Public Finance Authority–Moses H Cone Memorial Hospital Obligated Group WI | | 5.00% | | 10/1/2052 | | AA- | | | 8,750,000 | | | | 9,373,804 | |
| Public Finance Authority–Proton International Alabama LLC WI†(c) | | 6.85% | | 10/1/2047 | | NR | | | 1,410,000 | | | | 141,000 | |
| | See Notes to Financial Statements. | 79 |
Schedule of Investments (continued)
NATIONAL TAX FREE FUND September 30, 2024
| Investments | | Interest
Rate | | Maturity
Date | | Credit
Rating:
S&P or
Moody’s(a) | | Principal
Amount | | | Fair
Value | |
| Health Care (continued) | | | | | | | | | | | | | | |
| Rhode Island Health & Educational Building Corp.–Lifespan Obligated Group | | 5.25% | | 5/15/2049 | | BBB+ | | $ | 1,825,000 | | | $ | 1,984,386 | |
| Rhode Island Health & Educational Building Corp.–Lifespan Obligated Group | | 5.25% | | 5/15/2054 | | BBB+ | | | 4,680,000 | | | | 5,060,246 | |
| Roanoke Economic Development Authority–Carilion Clinic Obligated Group | | 3.00% | | 7/1/2045 | | AA- | | | 20,740,000 | | | | 17,795,911 | |
| Skagit County Public Hospital District No. 1 WA | | 5.50% | | 12/1/2054 | | Baa3 | | | 3,590,000 | | | | 3,878,409 | |
| South Broward Hospital District Obligated Group FL TCRS (BAM) | | 3.00% | | 5/1/2051 | | AA | | | 5,150,000 | | | | 4,227,006 | |
| South Carolina Jobs-Economic Development Authority–Bon Secours Mercy Health Inc | | 5.00% | | 12/1/2046 | | A+ | | | 8,000,000 | | | | 8,464,380 | |
| South Carolina Jobs-Economic Development Authority–Novant Health Obligated Group | | 5.50% | | 11/1/2046 | | A+ | | | 9,500,000 | | | | 10,906,174 | |
| South Carolina Jobs-Economic Development Authority–Novant Health Obligated Group | | 5.50% | | 11/1/2054 | | A+ | | | 16,465,000 | | | | 18,605,452 | |
| State of Ohio–Premier Health Partners Obligated | | 4.00% | | 11/15/2039 | | Baa1 | | | 2,640,000 | | | | 2,520,155 | |
| Tarrant County Cultural Education Facilities Finance Corp TX(d) | | 5.00% | | 7/1/2053 | | A1 | | | 9,550,000 | | | | 10,142,777 | |
| Washington Health Care Facilities Authority–Overlake Hospital Medical Center Obligated Group | | 5.00% | | 7/1/2038 | | BBB+ | | | 4,000,000 | | | | 3,999,906 | |
| West Virginia Hospital Finance Authority–Vandalia Health Inc Obligated Group | | 6.00% | | 9/1/2048 | | BBB+ | | | 2,060,000 | | | | 2,373,991 | |
| West Virginia Hospital Finance Authority–Vandalia Health Inc Obligated Group | | 6.00% | | 9/1/2053 | | BBB+ | | | 3,250,000 | | | | 3,716,892 | |
| Westchester County Health Care Corp Obligated Group NY | | 6.00% | | 11/1/2030 | | BBB- | | | 100,000 | | | | 100,184 | |
| Westchester County Health Care Corp Obligated Group NY | | 6.125% | | 11/1/2037 | | BBB- | | | 30,000 | | | | 30,086 | |
| Westchester County Health Care Corp Obligated Group NY | | 6.25% | | 11/1/2052 | | BBB- | | | 1,280,000 | | | | 1,471,002 | |
| Westchester County Health Care Corp Obligated Group NY (AGM) | | 5.00% | | 11/1/2051 | | AA | | | 2,750,000 | | | | 2,955,479 | |
| Westchester County Health Care Corp Obligated Group NY (AGM) | | 5.75% | | 11/1/2048 | | AA | | | 1,750,000 | | | | 2,003,590 | |
| Wisconsin Health & Educational Facilities Authority–Ascension Health Credit Group | | 4.00% | | 11/15/2046 | | AA+ | | | 8,000,000 | | | | 7,595,714 | |
| 80 | See Notes to Financial Statements. |
Schedule of Investments (continued)
NATIONAL TAX FREE FUND September 30, 2024
| Investments | | Interest
Rate | | Maturity
Date | | Credit
Rating:
S&P or
Moody’s(a) | | Principal
Amount | | | Fair
Value | |
| Health Care (continued) | | | | | | | | | | | | | | |
| Wisconsin Health & Educational Facilities Authority–Marshfield Clinic Health System Obligated Group | | 5.50% | | 2/15/2054 | | BBB | | $ | 9,750,000 | | | $ | 10,744,199 | |
| Wisconsin Health & Educational Facilities Authority–Marshfield Clinic Health System Obligated Group (BAM) | | 5.25% | | 2/15/2054 | | AA | | | 1,250,000 | | | | 1,360,511 | |
| Wisconsin Health & Educational Facilities Authority–Sauk-Prairie Memorial Hospital Inc Obligated Group | | 5.375% | | 2/1/2048 | | Ba2 | | | 840,000 | | | | 840,005 | |
| Yuma Industrial Development Authority–Yuma Regional Medical Center Obligated Group AZ(f) | | 5.25% | | 8/1/2054 | | A | | | 13,500,000 | | | | 14,880,752 | |
| Total | | | | | | | | | | | | | 716,269,684 | |
| | | | | | | | | | | | | | | |
| Housing 2.99% | | | | | | | | | | | | | | |
| California Municipal Finance Authority–Bowles Hall Foundation | | 5.00% | | 6/1/2050 | | Baa3 | | | 1,410,000 | | | | 1,416,261 | |
| Capital Projects Finance Authority–Provident Group–Continuum Properties LLC FL | | 5.00% | | 11/1/2039 | | Baa3 | | | 1,000,000 | | | | 1,041,125 | |
| Capital Projects Finance Authority–Provident Group–Continuum Properties LLC FL | | 5.00% | | 11/1/2041 | | Baa3 | | | 1,000,000 | | | | 1,033,906 | |
| Capital Projects Finance Authority–Provident Group–Continuum Properties LLC FL | | 5.00% | | 11/1/2048 | | Baa3 | | | 1,350,000 | | | | 1,375,177 | |
| Capital Projects Finance Authority–Provident Group–Continuum Properties LLC FL | | 5.00% | | 11/1/2053 | | Baa3 | | | 1,745,000 | | | | 1,770,024 | |
| Capital Projects Finance Authority–Provident Group–Continuum Properties LLC FL | | 5.00% | | 11/1/2058 | | Baa3 | | | 1,750,000 | | | | 1,766,017 | |
| CMFA Special Finance Agency CA† | | 4.00% | | 12/1/2045 | | NR | | | 5,000,000 | | | | 4,200,172 | |
| CSCDA Community Improvement Authority Jefferson Platinum Triangle Apartments CA† | | 3.125% | | 8/1/2056 | | NR | | | 4,500,000 | | | | 3,557,912 | |
| CSCDA Community Improvement Authority Westgate Apartments CA† | | 4.00% | | 6/1/2057 | | NR | | | 4,020,000 | | | | 1,409,244 | |
| Delaware State Housing Authority (FHLMC), (FNMA), (GNMA) | | 6.00% | | 1/1/2055 | | Aa1 | | | 8,400,000 | | | | 9,409,701 | |
| Florida Housing Finance Corp. (FHLMC), (FNMA), (GNMA) | | 6.25% | | 7/1/2055 | | Aaa | | | 5,000,000 | | | | 5,685,778 | |
| Indiana Finance Authority–CHF-Tippecanoe LLC | | 5.00% | | 6/1/2053 | | BBB- | | | 1,350,000 | | | | 1,407,490 | |
| Indiana Finance Authority–CHF-Tippecanoe LLC | | 5.125% | | 6/1/2058 | | BBB- | | | 1,700,000 | | | | 1,775,014 | |
| | See Notes to Financial Statements. | 81 |
Schedule of Investments (continued)
NATIONAL TAX FREE FUND September 30, 2024
| Investments | | Interest
Rate | | Maturity
Date | | Credit
Rating:
S&P or
Moody’s(a) | | Principal
Amount | | | Fair
Value | |
| Housing (continued) | | | | | | | | | | | | | | |
| Indiana Finance Authority–CHF-Tippecanoe LLC | | 5.375% | | 6/1/2064 | | BBB- | | $ | 4,460,000 | | | $ | 4,703,322 | |
| Indiana Finance Authority–SFP-PUFW I LLC | | 5.00% | | 7/1/2054 | | BBB- | | | 1,175,000 | | | | 1,221,486 | |
| Indiana Finance Authority–SFP-PUFW I LLC | | 5.25% | | 7/1/2064 | | BBB- | | | 1,625,000 | | | | 1,698,863 | |
| Industrial Development Authority of the City of Phoenix Arizona–Downtown Phoenix Student Housing LLC AZ | | 5.00% | | 7/1/2037 | | Baa3 | | | 1,000,000 | | | | 1,033,498 | |
| Knox County Health Educational & Housing Facility Board–Provident Group–UTK Properties LLC TN (BAM) | | 5.25% | | 7/1/2049 | | AA | | | 2,700,000 | | | | 2,928,311 | |
| Knox County Health Educational & Housing Facility Board–Provident Group–UTK Properties LLC TN (BAM) | | 5.50% | | 7/1/2054 | | AA | | | 1,150,000 | | | | 1,268,764 | |
| Knox County Health Educational & Housing Facility Board–Provident Group–UTK Properties LLC TN (BAM) | | 5.50% | | 7/1/2059 | | AA | | | 2,000,000 | | | | 2,189,597 | |
| Knox County Health Educational & Housing Facility Board TN (BAM) | | 5.125% | | 7/1/2054 | | AA | | | 3,775,000 | | | | 4,030,088 | |
| Knox County Health Educational & Housing Facility Board TN (BAM) | | 5.125% | | 7/1/2059 | | AA | | | 1,330,000 | | | | 1,407,880 | |
| Maryland Economic Development Corp. | | 5.75% | | 7/1/2053 | | BBB- | | | 2,000,000 | | | | 2,204,125 | |
| Maryland Economic Development Corp. | | 6.00% | | 7/1/2058 | | BBB- | | | 5,000,000 | | | | 5,585,009 | |
| Maryland Economic Development Corp.–University of Maryland College Park (AGM) | | 5.00% | | 7/1/2054 | | AA | | | 5,000,000 | | | | 5,315,165 | |
| Maryland Economic Development Corp.–University of Maryland College Park (AGM) | | 5.125% | | 7/1/2059 | | AA | | | 3,000,000 | | | | 3,213,831 | |
| Maryland Economic Development Corp.–University of Maryland College Park (AGM) | | 5.25% | | 7/1/2064 | | AA | | | 5,000,000 | | | | 5,383,819 | |
| New Hampshire Business Finance Authority | | 4.00% | | 10/20/2036 | | BBB | | | 10,714,335 | | | | 10,733,613 | |
| New Hampshire Business Finance Authority | | 4.25% | | 7/20/2041 | | A2 | | | 6,465,274 | | | | 6,507,780 | |
| New Hampshire Business Finance Authority | | 4.375% | | 9/20/2036 | | BBB | | | 5,340,485 | | | | 5,497,116 | |
| New York State Dormitory Authority–State University of New York Dormitory Facilities Revenue | | 3.00% | | 7/1/2045 | | Aa3 | | | 5,037,000 | | | | 4,181,577 | |
| Public Finance Authority–CHF-Manoa LLC WI† | | 5.50% | | 7/1/2043 | | BBB- | | | 4,500,000 | | | | 4,948,227 | |
| Public Finance Authority–CHF-Manoa LLC WI† | | 5.75% | | 7/1/2053 | | BBB- | | | 6,285,000 | | | | 6,889,119 | |
| 82 | See Notes to Financial Statements. |
Schedule of Investments (continued)
NATIONAL TAX FREE FUND September 30, 2024
| Investments | | Interest
Rate | | Maturity
Date | | Credit
Rating:
S&P or
Moody’s(a) | | Principal
Amount | | | Fair
Value | |
| Housing (continued) | | | | | | | | | | | | | | |
| Toledo-Lucas County Port Authority–CHF-Toledo LLC OH | | 5.00% | | 7/1/2034 | | BBB- | | $ | 1,000,000 | | | $ | 1,000,130 | |
| Toledo-Lucas County Port Authority–CHF-Toledo LLC OH | | 5.00% | | 7/1/2039 | | BBB- | | | 1,500,000 | | | | 1,500,056 | |
| Toledo-Lucas County Port Authority–CHF-Toledo LLC OH | | 5.00% | | 7/1/2046 | | BBB- | | | 1,000,000 | | | | 995,347 | |
| Washington State Housing Finance Commission | | 4.084% | #(b) | 3/20/2040 | | NR | | | 11,000,000 | | | | 10,939,090 | |
| Washington State Housing Finance Commission–Provident Group-SH I Properties LLC | | 5.00% | | 7/1/2054 | | BBB- | | | 2,500,000 | | | | 2,624,115 | |
| Washington State Housing Finance Commission–Provident Group-SH I Properties LLC | | 5.50% | | 7/1/2044 | | BBB- | | | 1,350,000 | | | | 1,502,322 | |
| Washington State Housing Finance Commission–Provident Group-SH I Properties LLC | | 5.50% | | 7/1/2049 | | BBB- | | | 1,000,000 | | | | 1,097,733 | |
| Washington State Housing Finance Commission–Provident Group-SH I Properties LLC | | 5.50% | | 7/1/2059 | | BBB- | | | 5,135,000 | | | | 5,589,798 | |
| Total | | | | | | | | | | | | | 142,037,602 | |
| | | | | | | | | | | | | | | |
| Lease Obligations 1.76% | | | | | | | | | | | | | | |
| Illinois Sports Facilities Authority (AGM) | | 5.00% | | 6/15/2027 | | AA | | | 3,500,000 | | | | 3,519,323 | |
| Indiana Finance Authority–Marion County Capital Improvement Board | | 5.25% | | 2/1/2032 | | AA+ | | | 5,000,000 | | | | 5,085,058 | |
| Kentucky Bond Development Corp. | | 4.00% | | 9/1/2048 | | A+ | | | 6,645,000 | | | | 6,461,979 | |
| New Jersey Economic Development Authority–New Jersey Transit Corp | | 5.00% | | 11/1/2044 | | A2 | | | 5,500,000 | | | | 5,804,746 | |
| New Jersey Economic Development Authority–NYNJ Link Borrower LLC AMT | | 5.625% | | 1/1/2052 | | A- | | | 9,000,000 | | | | 9,008,824 | |
| New Jersey Economic Development Authority–State Capitol Joint Management Commission | | 5.00% | | 6/15/2043 | | A2 | | | 4,500,000 | | | | 4,711,888 | |
| New Jersey Economic Development Authority–State of New Jersey Department of the Treasury | | 5.00% | | 6/15/2036 | | A2 | | | 1,285,000 | | | | 1,346,548 | |
| New Jersey Economic Development Authority–State of New Jersey Department of the Treasury | | 5.00% | | 6/15/2047 | | A2 | | | 6,050,000 | | | | 6,227,270 | |
| | See Notes to Financial Statements. | 83 |
Schedule of Investments (continued)
NATIONAL TAX FREE FUND September 30, 2024
| Investments | | Interest
Rate | | Maturity
Date | | Credit
Rating:
S&P or
Moody’s(a) | | Principal
Amount | | | Fair
Value | |
| Lease Obligations (continued) | | | | | | | | | | | | | | |
| New Jersey Transportation Trust Fund Authority | | Zero Coupon | | 12/15/2028 | | A2 | | $ | 10,000,000 | | | $ | 8,813,446 | |
| New Jersey Transportation Trust Fund Authority | | Zero Coupon | | 12/15/2031 | | A2 | | | 1,935,000 | | | | 1,526,549 | |
| New Jersey Transportation Trust Fund Authority | | Zero Coupon | | 12/15/2037 | | A2 | | | 3,390,000 | | | | 2,099,392 | |
| New Jersey Transportation Trust Fund Authority | | 5.00% | | 6/15/2030 | | A+ | | | 3,000,000 | | | | 3,097,651 | |
| New Jersey Transportation Trust Fund Authority | | 5.00% | | 6/15/2031 | | A+ | | | 2,400,000 | | | | 2,475,540 | |
| New Jersey Transportation Trust Fund Authority | | 5.00% | | 12/15/2035 | | A2 | | | 4,200,000 | | | | 4,497,682 | |
| New Jersey Transportation Trust Fund Authority | | 5.00% | | 12/15/2036 | | A2 | | | 3,500,000 | | | | 3,737,136 | |
| New Jersey Transportation Trust Fund Authority | | 5.00% | | 6/15/2046 | | A2 | | | 14,595,000 | | | | 15,243,000 | |
| Total | | | | | | | | | | | | | 83,656,032 | |
| | | | | | | | | | | | | | | |
| Multi-Family Housing 0.20% | | | | | | | | | | | | | | |
| New Hampshire Business Finance Authority | | 3.625% | | 8/20/2039 | | A3 | | | 6,986,194 | | | | 6,700,440 | |
| New York City Housing Development Corp. NY | | 2.40% | | 11/1/2046 | | AA+ | | | 3,800,000 | | | | 2,689,721 | |
| Total | | | | | | | | | | | | | 9,390,161 | |
| | | | | | | | | | | | | | | |
| Other Revenue 3.20% | | | | | | | | | | | | | | |
| California School Finance Authority–Green Dot Public Schools Obligated Group† | | 5.00% | | 8/1/2048 | | BBB- | | | 1,650,000 | | | | 1,684,222 | |
| City of Miami Beach Parking Revenue FL (BAM) | | 5.00% | | 9/1/2040 | | AA | | | 2,000,000 | | | | 2,020,998 | |
| Clifton Higher Education Finance Corp.–International Leadership of Texas Inc | | 6.125% | | 8/15/2048 | | Baa3 | | | 9,775,000 | | | | 9,945,342 | |
| Commonwealth of Puerto Rico GO | | Zero Coupon | #(b) | 11/1/2051 | | NR | | | 4,972,687 | | | | 3,257,110 | |
| County of Broward FL Convention Center Hotel Revenue(d) | | 5.50% | | 1/1/2055 | | AA | | | 31,540,000 | | | | 35,177,751 | |
| District of Columbia–Friendship Public Charter School Inc | | 5.00% | | 6/1/2041 | | BBB | | | 2,080,000 | | | | 2,098,395 | |
| Fayette County Development Authority–United States Soccer Federation Inc GA | | 5.25% | | 10/1/2049 | | BBB | (e) | | 2,000,000 | | | | 2,195,788 | |
| Fayette County Development Authority–United States Soccer Federation Inc GA | | 5.25% | | 10/1/2054 | | BBB | (e) | | 3,250,000 | | | | 3,536,426 | |
| Grand River Hospital District CO GO (AGM) | | 5.25% | | 12/1/2034 | | AA | | | 1,000,000 | | | | 1,059,911 | |
| 84 | See Notes to Financial Statements. |
Schedule of Investments (continued)
NATIONAL TAX FREE FUND September 30, 2024
| Investments | | Interest
Rate | | Maturity
Date | | Credit
Rating:
S&P or
Moody’s(a) | | Principal
Amount | | | Fair
Value | |
| Other Revenue (continued) | | | | | | | | | | | | | | |
| Grand River Hospital District CO GO (AGM) | | 5.25% | | 12/1/2035 | | AA | | $ | 1,000,000 | | | $ | 1,056,837 | |
| Grand River Hospital District CO GO (AGM) | | 5.25% | | 12/1/2037 | | AA | | | 1,160,000 | | | | 1,215,590 | |
| Illinois Finance Authority–Noble Network of Charter Schools | | 6.125% | | 9/1/2039 | | BBB | | | 6,000,000 | | | | 6,008,371 | |
| Indianapolis Local Public Improvement Bond Bank | | 5.00% | | 2/1/2031 | | AA- | | | 7,120,000 | | | | 7,125,982 | |
| Long Beach Bond Finance Authority CA | | 5.054%
(3 Mo. LIBOR * .67 + 1.45% | )# | 11/15/2027 | | A1 | | | 9,000,000 | | | | 9,112,433 | |
| Main Street Natural Gas, Inc. GA | | 5.00% | | 5/15/2037 | | A1 | | | 2,990,000 | | | | 3,267,747 | |
| Main Street Natural Gas, Inc. GA | | 5.00% | | 5/15/2043 | | A1 | | | 3,250,000 | | | | 3,374,513 | |
| Michigan Finance Authority–Bradford Academy | | 4.30% | | 9/1/2030 | | NR | | | 230,000 | | | | 217,211 | |
| Michigan Finance Authority–Bradford Academy | | 4.80% | | 9/1/2040 | | NR | | | 565,000 | | | | 499,250 | |
| Michigan Finance Authority–Bradford Academy | | 5.00% | | 9/1/2050 | | NR | | | 925,000 | | | | 784,807 | |
| M-S-R Energy Authority CA | | 6.125% | | 11/1/2029 | | BBB+ | | | 1,650,000 | | | | 1,770,964 | |
| New Jersey Economic Development Authority–Friends of TEAM Academy Charter School Obligated Group | | 6.00% | | 10/1/2043 | | BBB | | | 3,500,000 | | | | 3,504,774 | |
| New Jersey Economic Development Authority–New Jersey Transit Corp | | 5.00% | | 11/1/2052 | | A2 | | | 11,375,000 | | | | 12,253,966 | |
| Ridley School District PA (AGM), (ST AID WITHHLDG) | | 5.00% | | 11/15/2050 | | AA | | | 5,000,000 | | | | 5,345,542 | |
| Triborough Bridge & Tunnel Authority–Metropolitan Transportation Authority Payroll Mobility Tax Revenue NY | | 5.25% | | 5/15/2054 | | AA+ | | | 20,000,000 | | | | 22,414,808 | |
| Washington State Convention Center Public Facilities District | | 4.00% | | 7/1/2031 | | NR | | | 10,000,000 | | | | 10,093,605 | |
| Washington State Convention Center Public Facilities District | | 4.00% | | 7/1/2048 | | BBB- | | | 3,745,000 | | | | 3,481,395 | |
| Total | | | | | | | | | | | | | 152,503,738 | |
| | | | | | | | | | | | | | | |
| Pre-Refunded 0.02% | | | | | | | | | | | | | | |
| School District of Philadelphia PA GO (ST AID WITHHLDG) | | 5.00% | | 9/1/2038 | | A1 | | | 995,000 | | | | 1,019,375 | |
| | | | | | | | | | | | | | | |
| Single-Family Housing 0.17% | | | | | | | | | | | | | | |
| Pennsylvania Housing Finance Agency | | 5.00% | | 10/1/2050 | | AA+ | | | 7,725,000 | | | | 8,062,223 | |
| | See Notes to Financial Statements. | 85 |
Schedule of Investments (continued)
NATIONAL TAX FREE FUND September 30, 2024
| Investments | | Interest
Rate | | Maturity
Date | | Credit
Rating:
S&P or
Moody’s(a) | | Principal
Amount | | | Fair
Value | |
| Special Tax 1.52% | | | | | | | | | | | | | | |
| Allentown Neighborhood Improvement Zone Development Authority PA† | | 5.00% | | 5/1/2032 | | Ba3 | | $ | 1,845,000 | | | $ | 1,884,905 | |
| Allentown Neighborhood Improvement Zone Development Authority PA† | | 5.25% | | 5/1/2042 | | NR | | | 3,115,000 | | | | 3,166,836 | |
| Gramercy Farms Community Development District FL~ | | Zero Coupon | | 5/1/2039 | | NR | | | 2,375,000 | | | | 1,235,000 | |
| Gramercy Farms Community Development District FL(c) | | 5.25% | | 5/1/2039 | | NR | | | 1,340,000 | | | | 214 | (g) |
| Industrial Development Authority of the City of St. Louis Missouri | | 4.75% | | 11/15/2047 | | NR | | | 3,000,000 | | | | 2,604,016 | |
| Inland Valley Development Agency CA Tax Allocation | | 5.25% | | 9/1/2037 | | A+ | | | 4,875,000 | | | | 4,912,150 | |
| Irvine Facilities Financing Authority–City of Irvine Community Facilities District No 2013-3 CA Special Tax (BAM) | | 5.25% | | 9/1/2053 | | AA | | | 8,000,000 | | | | 9,016,629 | |
| New Jersey Economic Development Authority–NJ Metromall Urban Renewal Inc | | 6.50% | | 4/1/2028 | | Baa2 | | | 1,634,245 | | | | 1,649,420 | |
| New York City Industrial Development Agency–Queens Ballpark Co LLC NY (AGM) | | 3.00% | | 1/1/2046 | | AA | | | 16,455,000 | | | | 13,640,119 | |
| Rancho Cucamonga Redevelopment Agency Successor Agency CA Tax Allocation (AGM) | | 5.00% | | 9/1/2030 | | AA | | | 1,500,000 | | | | 1,503,121 | |
| Rancho Cucamonga Redevelopment Agency Successor Agency CA Tax Allocation (AGM) | | 5.00% | | 9/1/2031 | | AA | | | 1,400,000 | | | | 1,402,696 | |
| River Islands Public Financing Authority CA Special Tax (AGM) | | 5.25% | | 9/1/2052 | | AA | | | 2,500,000 | | | | 2,745,919 | |
| Riverside County Redevelopment Successor Agency CA Tax Allocation | | 8.50% | | 10/1/2041 | | A2 | | | 11,195,000 | | | | 12,504,199 | |
| State of Connecticut Special Tax Revenue | | 5.00% | | 8/1/2034 | | AA | | | 3,600,000 | | | | 3,651,346 | |
| State of Connecticut Special Tax Revenue | | 5.00% | | 1/1/2037 | | AA | | | 7,000,000 | | | | 7,418,801 | |
| State of Connecticut Special Tax Revenue | | 5.00% | | 1/1/2038 | | AA | | | 4,250,000 | | | | 4,496,951 | |
| Stone Canyon Community Improvement District MO(c) | | 5.70% | | 4/1/2022 | | NR | | | 1,000,000 | | | | 280,000 | |
| Stone Canyon Community Improvement District MO(c) | | 5.75% | | 4/1/2027 | | NR | | | 1,300,000 | | | | 364,000 | |
| Total | | | | | | | | | | | | | 72,476,322 | |
| | | | | | | | | | | | | | | |
| Tax Revenue 4.36% | | | | | | | | | | | | | | |
| Casino Reinvestment Development Authority, Inc. NJ | | 5.25% | | 11/1/2039 | | BBB+ | | | 3,300,000 | | | | 3,304,821 | |
| Chicago Transit Authority Sales Tax Receipts Fund IL | | 4.00% | | 12/1/2050 | | A+ | | | 13,615,000 | | | | 13,159,886 | |
| 86 | See Notes to Financial Statements. |
Schedule of Investments (continued)
NATIONAL TAX FREE FUND September 30, 2024
| Investments | | Interest
Rate | | Maturity
Date | | Credit
Rating:
S&P or
Moody’s(a) | | Principal
Amount | | | Fair
Value | |
| Tax Revenue (continued) | | | | | | | | | | | | | | |
| Chicago Transit Authority Sales Tax Receipts Fund IL | | 5.25% | | 12/1/2049 | | AA | | $ | 13,245,000 | | | $ | 13,262,992 | |
| City of Sparks NV† | | 2.75% | | 6/15/2028 | | Baa2 | | | 455,000 | | | | 445,395 | |
| Compton Community Redevelopment Agency Successor Agency CA Tax Allocation (AGM) | | 5.00% | | 8/1/2042 | | AA | | | 1,250,000 | | | | 1,375,128 | |
| County of Cook Sales Tax Revenue IL | | 4.00% | | 11/15/2034 | | AA- | | | 3,750,000 | | | | 3,829,746 | |
| County of Miami-Dade Transit System FL | | 5.00% | | 7/1/2051 | | AA | | | 12,405,000 | | | | 13,391,602 | |
| Lower Colorado River Authority–LCRA Transmission Services Corp TX | | 6.00% | | 5/15/2052 | | A | | | 1,700,000 | | | | 1,930,739 | |
| Metropolitan Pier & Exposition Authority IL | | 4.00% | | 6/15/2052 | | A | | | 7,210,000 | | | | 6,825,811 | |
| Metropolitan Pier & Exposition Authority IL | | 5.00% | | 6/15/2050 | | A | | | 4,365,000 | | | | 4,545,543 | |
| Metropolitan Pier & Exposition Authority IL (NATL) | | Zero Coupon | | 12/15/2030 | | A | | | 10,535,000 | | | | 8,570,886 | |
| Metropolitan Pier & Exposition Authority IL (NATL) | | Zero Coupon | | 6/15/2033 | | A | | | 15,000,000 | | | | 11,035,512 | |
| Metropolitan Pier & Exposition Authority IL (NATL) | | Zero Coupon | | 12/15/2036 | | A | | | 10,000,000 | | | | 6,364,334 | |
| Metropolitan Pier & Exposition Authority IL TCRS (BAM) | | 5.00% | | 6/15/2053 | | AA | | | 915,000 | | | | 933,271 | |
| New York Convention Center Development Corp.–New York City Hotel Unit Fee Revenue | | 5.00% | | 11/15/2040 | | A2 | | | 5,000,000 | | | | 5,057,223 | |
| New York State Dormitory Authority | | 3.00% | | 3/15/2049 | | Aa1 | | | 2,480,000 | | | | 2,032,665 | |
| New York State Dormitory Authority–State of New York Personal Income Tax Revenue | | 3.00% | | 3/15/2042 | | Aa1 | | | 5,000,000 | | | | 4,401,366 | |
| New York State Dormitory Authority–State of New York Personal Income Tax Revenue | | 3.00% | | 3/15/2050 | | AA+ | | | 8,980,000 | | | | 7,312,319 | |
| New York State Dormitory Authority–State of New York Personal Income Tax Revenue | | 5.00% | | 3/15/2046 | | AA+ | | | 2,455,000 | | | | 2,675,463 | |
| New York State Urban Development Corp.–State of New York Personal Income Tax Revenue | | 3.00% | | 3/15/2047 | | AA+ | | | 5,775,000 | | | | 4,916,798 | |
| New York State Urban Development Corp.–State of New York Personal Income Tax Revenue | | 3.00% | | 3/15/2048 | | AA+ | | | 9,590,000 | | | | 8,075,639 | |
| | See Notes to Financial Statements. | 87 |
Schedule of Investments (continued)
NATIONAL TAX FREE FUND September 30, 2024
| Investments | | Interest
Rate | | Maturity
Date | | Credit
Rating:
S&P or
Moody’s(a) | | Principal
Amount | | | Fair
Value | |
| Tax Revenue (continued) | | | | | | | | | | | | | | |
| New York State Urban Development Corp.–State of New York Personal Income Tax Revenue | | 3.00% | | 3/15/2049 | | AA+ | | $ | 6,495,000 | | | $ | 5,412,592 | |
| New York State Urban Development Corp.–State of New York Personal Income Tax Revenue | | 3.00% | | 3/15/2050 | | AA+ | | | 7,620,000 | | | | 6,331,270 | |
| Puerto Rico Sales Tax Financing Corp. Sales Tax Revenue | | Zero Coupon | | 7/1/2029 | | NR | | | 1,271,000 | | | | 1,065,475 | |
| Puerto Rico Sales Tax Financing Corp. Sales Tax Revenue | | Zero Coupon | | 7/1/2031 | | NR | | | 2,122,000 | | | | 1,639,824 | |
| Puerto Rico Sales Tax Financing Corp. Sales Tax Revenue | | Zero Coupon | | 7/1/2033 | | NR | | | 2,549,000 | | | | 1,808,155 | |
| Puerto Rico Sales Tax Financing Corp. Sales Tax Revenue | | Zero Coupon | | 7/1/2051 | | NR | | | 2,523,000 | | | | 622,262 | |
| Puerto Rico Sales Tax Financing Corp. Sales Tax Revenue | | 4.329% | | 7/1/2040 | | NR | | | 11,598,000 | | | | 11,592,281 | |
| Puerto Rico Sales Tax Financing Corp. Sales Tax Revenue | | 4.329% | | 7/1/2040 | | NR | | | 5,253,000 | | | | 5,250,410 | |
| Puerto Rico Sales Tax Financing Corp. Sales Tax Revenue | | 4.536% | | 7/1/2053 | | NR | | | 39,000 | | | | 38,678 | |
| Puerto Rico Sales Tax Financing Corp. Sales Tax Revenue | | 4.75% | | 7/1/2053 | | NR | | | 12,847,000 | | | | 12,886,544 | |
| San Leandro Unified School District CA GO | | 5.25% | | 8/1/2048 | | AA- | | | 10,500,000 | | | | 11,751,222 | |
| Triborough Bridge & Tunnel Authority Sales Tax Revenue NY | | 5.25% | | 5/15/2052 | | AA+ | | | 10,335,000 | | | | 11,432,875 | |
| Triborough Bridge & Tunnel Authority Sales Tax Revenue NY | | 5.25% | | 5/15/2057 | | AA+ | | | 2,500,000 | | | | 2,748,705 | |
| Triborough Bridge & Tunnel Authority Sales Tax Revenue NY | | 5.25% | | 5/15/2062 | | AA+ | | | 10,655,000 | | | | 11,676,004 | |
| Total | | | | | | | | | | | | | 207,703,436 | |
| | | | | | | | | | | | | | | |
| Taxable Revenue–Water & Sewer 1.19% | | | | | | | | | | | | | | |
| City of Chicago IL Waterworks Revenue(d) | | 5.50% | | 11/1/2062 | | AA | | | 20,300,000 | | | | 22,536,983 | |
| County of Miami-Dade Water & Sewer System Revenue FL | | 5.25% | | 10/1/2054 | | AA | | | 2,960,000 | | | | 3,303,707 | |
| New York City Municipal Water Finance Authority–New York City Water & Sewer System NY | | 5.25% | | 6/15/2054 | | AA+ | | | 12,500,000 | | | | 13,976,767 | |
| Oklahoma City Water Utilities Trust | | 5.25% | | 7/1/2064 | | AAA | | | 7,500,000 | | | | 8,324,799 | |
| Pittsburgh Water & Sewer Authority PA (AGM) | | 5.00% | | 9/1/2048 | | AA | | | 3,000,000 | | | | 3,261,903 | |
| 88 | See Notes to Financial Statements. |
Schedule of Investments (continued)
NATIONAL TAX FREE FUND September 30, 2024
| Investments | | Interest
Rate | | Maturity
Date | | Credit
Rating:
S&P or
Moody’s(a) | | Principal
Amount | | | Fair
Value | |
| Taxable Revenue–Water & Sewer (continued) | | | | | | | | | | | | | | |
| Washington Suburban Sanitary Commission MD | | 3.00% | | 6/1/2045 | | AAA | | $ | 6,165,000 | | | $ | 5,294,087 | |
| Total | | | | | | | | | | | | | 56,698,246 | |
| | | | | | | | | | | | | | | |
| Tobacco 2.02% | | | | | | | | | | | | | | |
| Buckeye Tobacco Settlement Financing Authority OH | | 5.00% | | 6/1/2055 | | NR | | | 44,815,000 | | | | 42,235,686 | |
| Golden State Tobacco Securitization Corp. CA | | 5.00% | | 6/1/2051 | | BBB+ | | | 8,900,000 | | | | 9,392,565 | |
| Michigan Finance Authority Tobacco Settlement Revenue | | 5.00% | | 6/1/2049 | | BBB+ | | | 2,445,000 | | | | 2,524,667 | |
| Nassau County Tobacco Settlement Corp. NY | | Zero Coupon | | 6/1/2060 | | NR | | | 20,000,000 | | | | 1,371,614 | |
| Tobacco Securitization Authority of Northern California–Sacramento County Tobacco Securitization Corp | | 4.00% | | 6/1/2049 | | BBB+ | | | 2,850,000 | | | | 2,724,828 | |
| Tobacco Securitization Authority of Southern California–San Diego County Tobacco Asset Securitization Corp | | 5.00% | | 6/1/2048 | | BBB+ | | | 8,900,000 | | | | 9,277,481 | |
| Tobacco Settlement Financing Corp. NJ | | 5.00% | | 6/1/2046 | | BBB+ | | | 3,415,000 | | | | 3,507,922 | |
| Tobacco Settlement Financing Corp. NJ | | 5.25% | | 6/1/2046 | | BBB+ | | | 4,305,000 | | | | 4,473,192 | |
| Tobacco Settlement Financing Corp. VA | | 5.00% | | 6/1/2047 | | B- | | | 7,540,000 | | | | 7,340,045 | |
| TSASC, Inc. NY | | 5.00% | | 6/1/2035 | | A- | | | 1,390,000 | | | | 1,439,820 | |
| TSASC, Inc. NY | | 5.00% | | 6/1/2045 | | CCC+ | | | 7,500,000 | | | | 6,812,492 | |
| TSASC, Inc. NY | | 5.00% | | 6/1/2048 | | NR | | | 5,550,000 | | | | 5,015,556 | |
| Total | | | | | | | | | | | | | 96,115,868 | |
| | | | | | | | | | | | | | | |
| Transportation 23.25% | | | | | | | | | | | | | | |
| Alameda Corridor Transportation Authority CA (AGM) | | Zero Coupon | | 10/1/2051 | | AA | | | 5,000,000 | | | | 2,934,442 | |
| Alameda Corridor Transportation Authority CA (AGM) | | 5.00% | | 10/1/2034 | | AA | | | 3,650,000 | | | | 3,798,337 | |
| Bay Area Toll Authority CA | | 3.00% | | 4/1/2054 | | AA- | | | 5,100,000 | | | | 4,143,577 | |
| Burbank-Glendale-Pasadena Airport Authority Brick Campaign CA AMT | | 5.25% | | 7/1/2049 | | A | | | 3,875,000 | | | | 4,256,166 | |
| Burbank-Glendale-Pasadena Airport Authority Brick Campaign CA AMT | | 5.25% | | 7/1/2054 | | A | | | 2,875,000 | | | | 3,132,663 | |
| California Municipal Finance Authority–LAX Integrated Express Solutions LLC AMT | | 5.00% | | 12/31/2038 | | BB+ | (e) | | 5,000,000 | | | | 5,170,394 | |
| California Municipal Finance Authority–LAX Integrated Express Solutions LLC AMT | | 5.00% | | 12/31/2043 | | BB+ | (e) | | 2,500,000 | | | | 2,562,332 | |
| | See Notes to Financial Statements. | 89 |
Schedule of Investments (continued)
NATIONAL TAX FREE FUND September 30, 2024
| Investments | | Interest
Rate | | Maturity
Date | | Credit
Rating:
S&P or
Moody’s(a) | | Principal
Amount | | | Fair
Value | |
| Transportation (continued) | | | | | | | | | | | | | | |
| Canaveral Port Authority FL | | 5.00% | | 6/1/2048 | | A3 | | $ | 4,890,000 | | | $ | 5,040,478 | |
| Canaveral Port Authority FL AMT | | 5.00% | | 6/1/2045 | | A3 | | | 4,630,000 | | | | 4,742,276 | |
| Central Texas Regional Mobility Authority | | 5.00% | | 1/1/2045 | | A+ | | | 4,500,000 | | | | 4,568,834 | |
| Central Texas Turnpike System | | 5.00% | | 8/15/2033 | | A- | | | 5,750,000 | | | | 5,758,219 | |
| Central Texas Turnpike System | | 5.00% | | 8/15/2037 | | A- | | | 3,630,000 | | | | 3,635,189 | |
| Central Texas Turnpike System | | 5.00% | | 8/15/2042 | | A- | | | 6,265,000 | | | | 6,273,955 | |
| Charleston County Airport District SC AMT(f) | | 5.25% | | 7/1/2049 | | A+ | | | 3,500,000 | | | | 3,825,942 | |
| Charleston County Airport District SC AMT(f) | | 5.25% | | 7/1/2054 | | A+ | | | 6,500,000 | | | | 7,081,464 | |
| Chicago O’Hare International Airport–TRIPS Obligated Group IL AMT | | 5.00% | | 7/1/2048 | | BBB+ | | | 7,840,000 | | | | 7,950,562 | |
| Chicago O’Hare International Airport IL | | 4.00% | | 1/1/2044 | | A+ | | | 11,315,000 | | | | 11,215,979 | |
| Chicago O’Hare International Airport IL (BAM) | | 5.25% | | 1/1/2041 | | AA | | | 1,950,000 | | | | 2,200,073 | |
| Chicago O’Hare International Airport IL (BAM) | | 5.25% | | 1/1/2042 | | AA | | | 1,470,000 | | | | 1,652,139 | |
| Chicago O’Hare International Airport IL (BAM) | | 5.25% | | 1/1/2043 | | AA | | | 1,660,000 | | | | 1,858,815 | |
| Chicago O’Hare International Airport IL AMT | | 5.00% | | 1/1/2047 | | A+ | | | 9,375,000 | | | | 9,523,856 | |
| Chicago O’Hare International Airport IL AMT | | 5.00% | | 1/1/2048 | | A+ | | | 20,000,000 | | | | 20,549,466 | |
| Chicago O’Hare International Airport IL AMT | | 5.50% | | 1/1/2059 | | A+ | | | 6,000,000 | | | | 6,644,001 | |
| City of Atlanta Department of Aviation GA | | 5.00% | | 7/1/2048 | | Aa3 | | | 5,200,000 | | | | 5,715,639 | |
| City of Charlotte Airport Revenue NC | | 5.25% | | 7/1/2053 | | Aa3 | | | 18,650,000 | | | | 20,818,380 | |
| City of Charlotte Airport Revenue NC AMT | | 5.25% | | 7/1/2053 | | Aa3 | | | 4,325,000 | | | | 4,679,800 | |
| City of Fresno Airport Revenue CA (BAM) AMT | | 5.00% | | 7/1/2053 | | AA | | | 2,000,000 | | | | 2,136,751 | |
| City of Houston Airport System Revenue–United Airlines Inc TX AMT | | 6.625% | | 7/15/2038 | | BB- | | | 2,500,000 | | | | 2,525,282 | |
| City of Los Angeles Department of Airports CA AMT | | 3.00% | | 5/15/2049 | | AA- | | | 5,890,000 | | | | 4,631,177 | |
| City of Los Angeles Department of Airports CA AMT | | 4.00% | | 5/15/2049 | | AA- | | | 5,000,000 | | | | 4,900,139 | |
| City of Los Angeles Department of Airports CA AMT | | 5.00% | | 5/15/2045 | | AA | | | 6,410,000 | | | | 6,694,462 | |
| City of Los Angeles Department of Airports CA AMT | | 5.50% | | 5/15/2047 | | AA | | | 6,440,000 | | | | 7,083,719 | |
| City of Salt Lake City Airport Revenue UT AMT | | 5.50% | | 7/1/2053 | | A+ | | | 7,500,000 | | | | 8,309,902 | |
| City of St. Louis Airport Revenue MO (AGM) | | 5.00% | | 7/1/2047 | | AA | | | 7,500,000 | | | | 7,728,620 | |
| Colorado Bridge & Tunnel Enterprise (AGM) | | 5.25% | | 12/1/2049 | | AA | | | 3,825,000 | | | | 4,302,739 | |
| Colorado Bridge & Tunnel Enterprise (AGM) | | 5.50% | | 12/1/2054 | | AA | | | 4,250,000 | | | | 4,856,853 | |
| County of Lee Airport Revenue FL AMT(f) | | 5.25% | | 10/1/2049 | | A2 | | | 6,200,000 | | | | 6,763,225 | |
| County of Miami-Dade Aviation Revenue FL AMT | | 5.00% | | 10/1/2028 | | A+ | | | 4,435,000 | | | | 4,440,012 | |
| 90 | See Notes to Financial Statements. |
Schedule of Investments (continued)
NATIONAL TAX FREE FUND September 30, 2024
| Investments | | Interest
Rate | | Maturity
Date | | Credit
Rating:
S&P or
Moody’s(a) | | Principal
Amount | | | Fair
Value | |
| Transportation (continued) | | | | | | | | | | | | | | |
| County of Miami-Dade Aviation Revenue FL AMT | | 5.00% | | 10/1/2029 | | A+ | | $ | 2,500,000 | | | $ | 2,502,825 | |
| County of Miami-Dade Aviation Revenue FL AMT | | 5.00% | | 10/1/2035 | | A+ | | | 10,000,000 | | | | 10,011,301 | |
| County of Osceola Transportation Revenue FL | | 4.00% | | 10/1/2054 | | BBB+ | | | 3,775,000 | | | | 3,572,121 | |
| County of Osceola Transportation Revenue FL | | 5.00% | | 10/1/2039 | | BBB+ | | | 1,000,000 | | | | 1,055,470 | |
| County of Sacramento Airport System Revenue CA | | 5.00% | | 7/1/2041 | | A | | | 8,000,000 | | | | 8,226,292 | |
| Delaware River Joint Toll Bridge Commission PA | | 5.00% | | 7/1/2047 | | A+ | | | 11,100,000 | | | | 11,448,926 | |
| E-470 Public Highway Authority CO (NATL) | | Zero Coupon | | 9/1/2032 | | A+ | | | 4,200,000 | | | | 3,195,715 | |
| E-470 Public Highway Authority CO (NATL) | | Zero Coupon | | 9/1/2037 | | A+ | | | 7,720,000 | | | | 4,132,122 | |
| Eagle County Airport Terminal Corp. CO AMT | | 5.00% | | 5/1/2037 | | Baa2 | | | 1,000,000 | | | | 1,020,078 | |
| Eagle County Airport Terminal Corp. CO AMT | | 5.00% | | 5/1/2041 | | Baa2 | | | 4,240,000 | | | | 4,293,083 | |
| Foothill-Eastern Transportation Corridor Agency CA | | Zero Coupon | | 1/15/2033 | | A | | | 5,000,000 | | | | 3,724,588 | |
| Foothill-Eastern Transportation Corridor Agency CA | | 3.50% | | 1/15/2053 | | A | | | 10,830,000 | | | | 9,560,570 | |
| Foothill-Eastern Transportation Corridor Agency CA | | 3.95% | | 1/15/2053 | | A | | | 5,000,000 | | | | 4,791,755 | |
| Foothill-Eastern Transportation Corridor Agency CA | | 4.00% | | 1/15/2046 | | A | | | 10,000,000 | | | | 9,935,902 | |
| Greater Asheville Regional Airport Authority NC (AGM) AMT | | 5.25% | | 7/1/2048 | | AA | | | 1,250,000 | | | | 1,356,218 | |
| Greater Asheville Regional Airport Authority NC (AGM) AMT | | 5.25% | | 7/1/2053 | | AA | | | 2,000,000 | | | | 2,164,069 | |
| Greater Orlando Aviation Authority FL AMT | | 4.00% | | 10/1/2049 | | AA | | | 6,375,000 | | | | 6,207,971 | |
| Greenville-Spartanburg Airport District SC | | 5.25% | | 7/1/2054 | | A+ | | | 4,160,000 | | | | 4,596,146 | |
| Kenton County Airport Board AMT | | 5.25% | | 1/1/2049 | | A1 | | | 8,500,000 | | | | 9,252,664 | |
| Kenton County Airport Board AMT | | 5.25% | | 1/1/2054 | | A1 | | | 10,750,000 | | | | 11,621,217 | |
| Louisiana Public Facilities Authority–Calcasieu Bridge Partners LLC AMT | | 5.50% | | 9/1/2059 | | Baa3 | | | 13,450,000 | | | | 14,752,789 | |
| Louisiana Public Facilities Authority–Calcasieu Bridge Partners LLC AMT | | 5.75% | | 9/1/2064 | | Baa3 | | | 20,910,000 | | | | 23,273,545 | |
| | See Notes to Financial Statements. | 91 |
Schedule of Investments (continued)
NATIONAL TAX FREE FUND September 30, 2024
| Investments | | Interest
Rate | | Maturity
Date | | Credit
Rating:
S&P or
Moody’s(a) | | Principal
Amount | | | Fair
Value | |
| Transportation (continued) | | | | | | | | | | | | | | |
| Maryland Economic Development Corp.–City of Baltimore Port Covington Development District Tax Allocation | | 4.00% | | 9/1/2040 | | NR | | $ | 2,000,000 | | | $ | 1,907,786 | |
| Maryland Economic Development Corp.–Purple Line Transit Partners LLC AMT | | 5.00% | | 11/12/2028 | | Baa3 | | | 5,000,000 | | | | 5,124,245 | |
| Maryland Economic Development Corp.–Purple Line Transit Partners LLC AMT | | 5.25% | | 6/30/2047 | | Baa3 | | | 2,500,000 | | | | 2,644,870 | |
| Maryland Economic Development Corp.–Purple Line Transit Partners LLC AMT | | 5.25% | | 6/30/2052 | | Baa3 | | | 2,760,000 | | | | 2,900,977 | |
| Maryland Economic Development Corp.–Purple Line Transit Partners LLC AMT | | 5.25% | | 6/30/2055 | | Baa3 | | | 14,500,000 | | | | 15,200,270 | |
| Maryland State Transportation Authority | | 5.00% | | 7/1/2051 | | Aa2 | | | 10,000,000 | | | | 10,720,333 | |
| Maryland State Transportation Authority Passenger Facility Charge Revenue AMT | | 3.00% | | 6/1/2036 | | A+ | | | 7,310,000 | | | | 6,728,150 | |
| Metropolitan Nashville Airport Authority TN AMT | | 5.00% | | 7/1/2049 | | A2 | | | 5,000,000 | | | | 5,212,579 | |
| Metropolitan Nashville Airport Authority TN AMT | | 5.50% | | 7/1/2052 | | A1 | | | 6,500,000 | | | | 7,142,980 | |
| Metropolitan Transportation Authority NY | | 4.00% | | 11/15/2045 | | A- | | | 4,675,000 | | | | 4,637,015 | |
| Metropolitan Transportation Authority NY | | 4.00% | | 11/15/2048 | | A- | | | 9,825,000 | | | | 9,628,699 | |
| Metropolitan Transportation Authority NY | | 4.00% | | 11/15/2049 | | A- | | | 6,605,000 | | | | 6,449,953 | |
| Metropolitan Transportation Authority NY | | 4.00% | | 11/15/2050 | | A- | | | 6,500,000 | | | | 6,326,014 | |
| Metropolitan Transportation Authority NY(d) | | 4.75% | | 11/15/2045 | | A- | | | 13,890,000 | | | | 14,365,007 | |
| Metropolitan Transportation Authority NY | | 5.00% | | 11/15/2035 | | A- | | | 4,265,000 | | | | 4,416,918 | |
| Metropolitan Transportation Authority NY | | 5.00% | #(b) | 11/15/2045 | | A3 | | | 2,700,000 | | | | 2,958,788 | |
| Metropolitan Transportation Authority NY | | 5.00% | | 11/15/2050 | | A- | | | 4,680,000 | | | | 4,911,549 | |
| Metropolitan Transportation Authority NY | | 5.25% | | 11/15/2044 | | A- | | | 12,180,000 | | | | 12,196,344 | |
| Metropolitan Transportation Authority NY | | 5.25% | | 11/15/2049 | | A- | | | 15,750,000 | | | | 17,335,343 | |
| Metropolitan Transportation Authority NY | | 5.25% | | 11/15/2055 | | A- | | | 10,850,000 | | | | 11,487,110 | |
| Metropolitan Transportation Authority NY(d) | | 5.25% | | 11/15/2055 | | A3 | | | 6,610,000 | | | | 6,996,196 | |
| Metropolitan Washington Airports Authority Aviation Revenue DC | | 5.50% | | 10/1/2054 | | AA- | | | 7,000,000 | | | | 7,762,789 | |
| Minneapolis–St. Paul Metropolitan Airports Commission AMT | | 5.00% | | 1/1/2047 | | A+ | | | 3,000,000 | | | | 3,146,667 | |
| Minneapolis-St. Paul Metropolitan Airports Commission AMT | | 5.25% | | 1/1/2049 | | A+ | | | 15,000,000 | | | | 16,376,541 | |
| New Jersey Transportation Trust Fund Authority | | 4.00% | | 6/15/2045 | | A2 | | | 23,630,000 | | | | 23,738,084 | |
| New Jersey Transportation Trust Fund Authority | | 5.00% | | 6/15/2045 | | A2 | | | 5,000,000 | | | | 5,367,114 | |
| 92 | See Notes to Financial Statements. |
Schedule of Investments (continued)
NATIONAL TAX FREE FUND September 30, 2024
| Investments | | Interest
Rate | | Maturity
Date | | Credit
Rating:
S&P or
Moody’s(a) | | Principal
Amount | | | Fair
Value | |
| Transportation (continued) | | | | | | | | | | | | | | |
| New Jersey Transportation Trust Fund Authority | | 5.25% | | 6/15/2050 | | A2 | | $ | 15,155,000 | | | $ | 16,990,712 | |
| New Jersey Transportation Trust Fund Authority | | 5.50% | | 6/15/2050 | | A2 | | | 2,000,000 | | | | 2,253,312 | |
| New Jersey Turnpike Authority | | 5.25% | | 1/1/2054 | | AA- | | | 9,000,000 | | | | 10,183,232 | |
| New York City Transitional Development Corp.–JFK NTO LLC NY AMT | | 5.375% | | 6/30/2060 | | Baa3 | | | 21,750,000 | | | | 22,737,789 | |
| New York City Transitional Development Corp.–JFK NTO LLC NY AMT | | 6.00% | | 6/30/2054 | | Baa3 | | | 18,500,000 | | | | 20,228,988 | |
| New York State Thruway Authority–New York State Thruway Authority | | 5.25% | | 1/1/2056 | | A1 | | | 7,455,000 | | | | 7,579,601 | |
| New York Transportation Development Corp.–Delta Air Lines Inc AMT | | 4.00% | | 1/1/2036 | | Baa3 | | | 5,210,000 | | | | 5,212,891 | |
| New York Transportation Development Corp.–Delta Air Lines Inc AMT | | 5.00% | | 1/1/2029 | | Baa3 | | | 2,955,000 | | | | 3,080,336 | |
| New York Transportation Development Corp.–Delta Air Lines Inc AMT | | 5.00% | | 1/1/2030 | | Baa3 | | | 4,440,000 | | | | 4,621,299 | |
| New York Transportation Development Corp.–Delta Air Lines Inc AMT | | 5.00% | | 1/1/2033 | | Baa3 | | | 12,450,000 | | | | 12,874,265 | |
| New York Transportation Development Corp.–Delta Air Lines Inc AMT | | 5.00% | | 1/1/2036 | | Baa3 | | | 11,100,000 | | | | 11,434,030 | |
| New York Transportation Development Corp.–Delta Air Lines Inc AMT | | 5.00% | | 10/1/2040 | | Baa3 | | | 21,000,000 | | | | 21,801,635 | |
| New York Transportation Development Corp.–Delta Air Lines Inc AMT | | 5.625% | | 4/1/2040 | | Baa3 | | | 7,000,000 | | | | 7,612,885 | |
| New York Transportation Development Corp.–Delta Air Lines Inc AMT | | 6.00% | | 4/1/2035 | | Baa3 | | | 16,530,000 | | | | 18,706,317 | |
| New York Transportation Development Corp.–JFK International Air Terminal LLC AMT | | 5.00% | | 12/1/2039 | | Baa1 | | | 5,840,000 | | | | 6,212,058 | |
| New York Transportation Development Corp.–JFK International Air Terminal LLC AMT | | 5.00% | | 12/1/2042 | | Baa1 | | | 3,270,000 | | | | 3,431,427 | |
| New York Transportation Development Corp.–JFK NTO LLC | | 5.50% | | 6/30/2060 | | Baa3 | | | 34,685,000 | | | | 37,106,797 | |
| New York Transportation Development Corp.–Laguardia Gateway Partner AMT | | 4.00% | | 7/1/2041 | | Baa2 | | | 12,365,000 | | | | 12,011,342 | |
| New York Transportation Development Corp.–Laguardia Gateway Partner AMT | | 4.00% | | 7/1/2046 | | Baa2 | | | 2,440,000 | | | | 2,286,289 | |
| New York Transportation Development Corp.–Laguardia Gateway Partner AMT | | 5.25% | | 1/1/2050 | | Baa2 | | | 19,245,000 | | | | 19,246,007 | |
| | See Notes to Financial Statements. | 93 |
Schedule of Investments (continued)
NATIONAL TAX FREE FUND September 30, 2024
| Investments | | Interest
Rate | | Maturity
Date | | Credit
Rating:
S&P or
Moody’s(a) | | Principal
Amount | | | Fair
Value | |
| Transportation (continued) | | | | | | | | | | | | | | |
| New York Transportation Development Corp.–Laguardia Gateway Partners LLC (AGM) AMT | | 4.00% | | 1/1/2051 | | AA | | $ | 4,740,000 | | | $ | 4,531,733 | |
| North Carolina Turnpike Authority | | 5.00% | | 1/1/2043 | | BBB | | | 1,150,000 | | | | 1,213,880 | |
| North Carolina Turnpike Authority (AGM) | | 4.00% | | 1/1/2037 | | AA | | | 8,255,000 | | | | 8,348,507 | |
| North Texas Tollway Authority | | 5.00% | | 1/1/2048 | | A+ | | | 5,000,000 | | | | 5,162,093 | |
| Northern Indiana Commuter Transportation District IN | | 5.00% | | 1/1/2054 | | A+ | | | 4,750,000 | | | | 5,132,686 | |
| Northern Indiana Commuter Transportation District IN | | 5.25% | | 1/1/2049 | | A+ | | | 4,150,000 | | | | 4,621,994 | |
| Oklahoma Turnpike Authority | | 5.50% | | 1/1/2053 | | AA- | | | 7,500,000 | | | | 8,347,563 | |
| Pennsylvania Economic Development Financing Authority–Commonwealth of Pennsylvania Motor License Fund AMT (AGM) | | 5.75% | | 12/31/2062 | | AA | | | 8,100,000 | | | | 9,141,803 | |
| Pennsylvania Turnpike Commission | | 4.00% | | 12/1/2038 | | A2 | | | 3,425,000 | | | | 3,481,061 | |
| Pennsylvania Turnpike Commission | | 5.00% | | 6/1/2029 | | A2 | | | 9,000,000 | | | | 9,234,017 | |
| Port Authority of New York & New Jersey AMT | | 5.00% | | 7/15/2035 | | AA- | | | 6,250,000 | | | | 6,971,007 | |
| Port Authority of New York & New Jersey AMT | | 5.00% | | 7/15/2036 | | AA- | | | 4,000,000 | | | | 4,439,540 | |
| Port Authority of New York & New Jersey AMT | | 5.00% | | 7/15/2037 | | AA- | | | 3,250,000 | | | | 3,598,216 | |
| Port Authority of New York & New Jersey AMT | | 5.00% | | 7/15/2038 | | AA- | | | 5,000,000 | | | | 5,524,866 | |
| Port Authority of New York & New Jersey AMT | | 5.00% | | 11/15/2041 | | AA- | | | 6,950,000 | | | | 7,125,130 | |
| Port Authority of New York & New Jersey AMT | | 5.00% | | 1/15/2052 | | AA- | | | 13,855,000 | | | | 14,661,239 | |
| Port Authority of New York & New Jersey AMT | | 5.00% | | 12/1/2053 | | AA- | | | 7,100,000 | | | | 7,537,635 | |
| Port Authority of New York & New Jersey AMT | | 5.50% | | 8/1/2052 | | AA- | | | 3,940,000 | | | | 4,325,559 | |
| Port Authority of New York & New Jersey NY | | 4.00% | | 7/15/2061 | | AA- | | | 10,000,000 | | | | 9,459,111 | |
| Port of Portland Airport Revenue–Port of Portland OR Airport Revenue OR AMT | | 5.25% | | 7/1/2054 | | AA- | | | 11,000,000 | | | | 11,995,071 | |
| Port of Portland Airport Revenue OR AMT | | 5.00% | | 7/1/2039 | | AA- | | | 2,000,000 | | | | 2,003,210 | |
| Port of Portland Airport Revenue OR AMT | | 5.00% | | 7/1/2049 | | AA- | | | 5,000,000 | | | | 5,157,326 | |
| Port of Portland Airport Revenue OR AMT | | 5.50% | | 7/1/2048 | | AA- | | | 6,250,000 | | | | 6,953,401 | |
| Reno-Tahoe Airport Authority NV AMT | | 5.25% | | 7/1/2049 | | A | | | 2,100,000 | | | | 2,285,350 | |
| 94 | See Notes to Financial Statements. |
Schedule of Investments (continued)
NATIONAL TAX FREE FUND September 30, 2024
| Investments | | Interest
Rate | | Maturity
Date | | Credit
Rating:
S&P or
Moody’s(a) | | Principal
Amount | | | Fair
Value | |
| Transportation (continued) | | | | | | | | | | | | | | |
| Reno-Tahoe Airport Authority NV AMT | | 5.25% | | 7/1/2054 | | A | | $ | 2,340,000 | | | $ | 2,526,300 | |
| San Diego County Regional Airport Authority CA | | 5.00% | | 7/1/2051 | | A2 | | | 15,475,000 | | | | 16,820,246 | |
| San Diego County Regional Airport Authority CA AMT | | 5.00% | | 7/1/2053 | | A1 | | | 5,330,000 | | | | 5,678,273 | |
| San Francisco City & County Airport Comm-San Francisco International Airport CA AMT | | 5.25% | | 5/1/2049 | | A1 | | | 9,400,000 | | | | 10,311,918 | |
| San Joaquin Hills Transportation Corridor Agency CA | | 5.25% | | 1/15/2049 | | A- | | | 1,600,000 | | | | 1,606,717 | |
| State of Florida Department of Transportation Turnpike System Revenue | | 3.00% | | 7/1/2051 | | AA | | | 11,745,000 | | | | 9,455,990 | |
| State of Maryland Department of Transportation–Maryland Aviation Administration AMT | | 4.00% | | 8/1/2051 | | A1 | | | 10,000,000 | | | | 9,570,824 | |
| State of Michigan Trunk Line Revenue | | 5.50% | | 11/15/2049 | | AA+ | | | 15,000,000 | | | | 17,211,607 | |
| Texas Private Activity Bond Surface Transportation Corp.–NTE Mobility Partners LLC AMT | | 5.50% | | 12/31/2058 | | Baa1 | | | 5,000,000 | | | | 5,500,269 | |
| Triborough Bridge & Tunnel Authority Sales Tax Revenue NY | | 5.25% | | 5/15/2058 | | AA+ | | | 7,300,000 | | | | 8,058,430 | |
| Virginia Small Business Financing Authority–95 Express Lanes LLC AMT | | 5.00% | | 7/1/2036 | | BBB | | | 6,685,000 | | | | 7,157,767 | |
| Washington Metropolitan Area Transit Authority Dedicated Revenue DC | | 5.00% | | 7/15/2054 | | AA | | | 17,585,000 | | | | 19,230,105 | |
| Wayne County Airport Authority–Detroit Metropolitan Wayne County Airport MI AMT | | 5.00% | | 12/1/2039 | | A1 | | | 1,700,000 | | | | 1,701,584 | |
| Wayne County Airport Authority–Detroit Metropolitan Wayne County Airport MI AMT | | 5.00% | | 12/1/2042 | | A1 | | | 1,200,000 | | | | 1,232,901 | |
| Wayne County Airport Authority–Detroit Metropolitan Wayne County Airport MI AMT | | 5.00% | | 12/1/2046 | | A1 | | | 2,825,000 | | | | 2,982,272 | |
| Total | | | | | | | | | | | | | 1,106,391,960 | |
| | | | | | | | | | | | | | | |
| Utilities 12.97% | | | | | | | | | | | | | | |
| Adelanto Public Utility Authority CA (AGM) | | 5.00% | | 7/1/2039 | | AA | | | 1,500,000 | | | | 1,576,681 | |
| Black Belt Energy Gas District AL | | 4.00% | #(b) | 10/1/2052 | | A2 | | | 11,660,000 | | | | 11,772,457 | |
| Black Belt Energy Gas District AL | | 4.00% | #(b) | 12/1/2052 | | Baa1 | | | 15,600,000 | | | | 15,728,560 | |
| Black Belt Energy Gas District AL | | 5.00% | #(b) | 5/1/2055 | | Aa3 | | | 5,000,000 | | | | 5,445,206 | |
| Black Belt Energy Gas District AL | | 5.25% | #(b) | 5/1/2055 | | A1 | | | 3,750,000 | | | | 4,134,620 | |
| Black Belt Energy Gas District AL | | 5.50% | #(b) | 6/1/2049 | | A2 | | | 9,450,000 | | | | 10,228,632 | |
| | See Notes to Financial Statements. | 95 |
Schedule of Investments (continued)
NATIONAL TAX FREE FUND September 30, 2024
| Investments | | Interest
Rate | | Maturity
Date | | Credit
Rating:
S&P or
Moody’s(a) | | Principal
Amount | | | Fair
Value | |
| Utilities (continued) | | | | | | | | | | | | | | |
| Black Belt Energy Gas District AL | | 5.50% | #(b) | 11/1/2053 | | A2 | | $ | 6,665,000 | | | $ | 7,183,584 | |
| California Community Choice Financing Authority | | 5.00% | #(b) | 1/1/2055 | | A1 | | | 16,250,000 | | | | 17,852,247 | |
| California Community Choice Financing Authority(d) | | 5.25% | | 11/1/2054 | | A2 | | | 14,000,000 | | | | 15,210,873 | |
| California Pollution Control Financing Authority–Poseidon Resources Channelside LP† | | 5.00% | | 7/1/2039 | | Baa3 | | | 2,200,000 | | | | 2,313,167 | |
| Casitas Municipal Water District CA Special Tax (BAM) | | 5.25% | | 9/1/2047 | | AA | | | 500,000 | | | | 523,669 | |
| Central Plains Energy Project NE | | 5.00% | | 9/1/2042 | | BBB+ | | | 3,305,000 | | | | 3,730,839 | |
| Chautauqua County Capital Resource Corp.–NRG Energy Inc NY | | 4.25% | #(b) | 4/1/2042 | | BBB- | | | 5,000,000 | | | | 5,142,923 | |
| City of Baltimore MD | | 5.00% | | 7/1/2039 | | A1 | | | 4,750,000 | | | | 4,761,476 | |
| City of Baltimore MD(d) | | 5.25% | | 7/1/2047 | | AA- | | | 7,190,000 | | | | 7,911,563 | |
| City of Baltimore MD(d) | | 5.25% | | 7/1/2052 | | AA- | | | 12,190,000 | | | | 13,413,346 | |
| City of Chicago Waterworks Revenue IL | | 5.00% | | 11/1/2036 | | A+ | | | 1,775,000 | | | | 1,860,974 | |
| City of Chicago Waterworks Revenue IL | | 5.00% | | 11/1/2039 | | A+ | | | 3,455,000 | | | | 3,467,546 | |
| City of Chicago Waterworks Revenue IL (AGM) | | 5.00% | | 11/1/2036 | | AA | | | 3,000,000 | | | | 3,147,104 | |
| City of Chicago Waterworks Revenue IL (AGM) | | 5.00% | | 11/1/2037 | | AA | | | 2,500,000 | | | | 2,616,645 | |
| City of Compton Water Revenue CA | | 6.00% | | 8/1/2039 | | NR | | | 5,500,000 | | | | 5,614,575 | |
| City of Fort Lauderdale Water & Sewer Revenue FL | | 5.50% | | 9/1/2053 | | AA+ | | | 5,000,000 | | | | 5,689,186 | |
| City of Philadelphia Water & Wastewater Revenue PA | | 5.00% | | 7/1/2030 | | A+ | | | 3,355,000 | | | | 3,401,990 | |
| City of Philadelphia Water & Wastewater Revenue PA | | 5.25% | | 10/1/2052 | | A+ | | | 6,610,000 | | | | 6,882,794 | |
| City of Rock Hill Combined Utility System Revenue SC | | 5.00% | | 1/1/2054 | | A+ | | | 1,125,000 | | | | 1,220,849 | |
| City of Rock Hill Combined Utility System Revenue SC | | 5.00% | | 1/1/2064 | | A+ | | | 12,250,000 | | | | 13,185,181 | |
| City of San Antonio Electric & Gas Systems Revenue–City of San Antonio TX Electric & Gas Systems Revenue TX | | 5.00% | | 2/1/2054 | | Aa2 | | | 15,710,000 | | | | 17,091,303 | |
| City of San Antonio Electric & Gas Systems Revenue TX | | 5.50% | | 2/1/2049 | | Aa2 | | | 2,000,000 | | | | 2,289,107 | |
| City of San Antonio Electric & Gas Systems Revenue TX | | 5.50% | | 2/1/2050 | | Aa2 | | | 10,880,000 | | | | 12,310,328 | |
| 96 | See Notes to Financial Statements. |
Schedule of Investments (continued)
NATIONAL TAX FREE FUND September 30, 2024
| Investments | | Interest
Rate | | Maturity
Date | | Credit
Rating:
S&P or
Moody’s(a) | | Principal
Amount | | | Fair
Value | |
| Utilities (continued) | | | | | | | | | | | | | | |
| City of San Francisco Public Utilities Commission Water Revenue CA | | 5.25% | | 11/1/2052 | | Aa2 | | $ | 7,000,000 | | | $ | 7,910,000 | |
| County of Jefferson Sewer Revenue AL | | 5.25% | | 10/1/2049 | | BBB+ | | | 20,345,000 | | | | 22,171,466 | |
| County of Jefferson Sewer Revenue AL | | 5.50% | | 10/1/2053 | | BBB+ | | | 14,150,000 | | | | 15,591,779 | |
| County of Washoe–Sierra Pacific Power Co NV | | 4.125% | #(b) | 3/1/2036 | | A | | | 2,500,000 | | | | 2,539,329 | |
| Energy Southeast A Cooperative District AL | | 5.25% | #(b) | 7/1/2054 | | A1 | | | 22,500,000 | | | | 24,924,204 | |
| Energy Southeast A Cooperative District AL | | 5.75% | #(b) | 4/1/2054 | | A1 | | | 10,710,000 | | | | 12,173,762 | |
| Florida Development Finance Corp.–Waste Pro USA Inc AMT† | | 5.25% | | 8/1/2029 | | NR | | | 1,500,000 | | | | 1,566,160 | |
| Great Lakes Water Authority Sewage Disposal System Revenue MI | | 5.50% | | 7/1/2052 | | A+ | | | 12,000,000 | | | | 13,446,212 | |
| JEA Water & Sewer System Revenue FL | | 5.50% | | 10/1/2054 | | AA+ | | | 5,000,000 | | | | 5,653,578 | |
| Kentucky Municipal Power Agency (NATL) | | 5.00% | | 9/1/2035 | | Baa1 | | | 5,000,000 | | | | 5,125,843 | |
| Kentucky Municipal Power Agency (NATL) | | 5.00% | | 9/1/2036 | | Baa1 | | | 5,000,000 | | | | 5,111,872 | |
| Kentucky Public Energy Authority | | 4.00% | #(b) | 8/1/2052 | | A1 | | | 15,500,000 | | | | 15,920,126 | |
| Kentucky Public Energy Authority | | 5.25% | #(b) | 4/1/2054 | | A1 | | | 26,455,000 | | | | 29,419,738 | |
| Los Angeles Department of Water & Power CA | | 5.00% | | 7/1/2053 | | Aa2 | | | 9,000,000 | | | | 9,993,174 | |
| Lower Colorado River Authority–LCRA Transmission Services Corp TX | | 5.00% | | 5/15/2040 | | A | | | 2,970,000 | | | | 2,993,228 | |
| Lower Colorado River Authority–LCRA Transmission Services Corp TX (AGM) | | 5.25% | | 5/15/2054 | | AA | | | 9,000,000 | | | | 9,928,097 | |
| Main Street Natural Gas, Inc. GA† | | 4.00% | #(b) | 8/1/2052 | | BBB- | | | 17,500,000 | | | | 17,478,499 | |
| Main Street Natural Gas, Inc. GA | | 4.00% | #(b) | 9/1/2052 | | A3 | | | 14,205,000 | | | | 14,482,374 | |
| Main Street Natural Gas, Inc. GA | | 5.00% | #(b) | 12/1/2052 | | A3 | | | 13,400,000 | | | | 14,179,612 | |
| Main Street Natural Gas, Inc. GA | | 5.00% | #(b) | 12/1/2054 | | A3 | | | 11,000,000 | | | | 11,878,877 | |
| Michigan Finance Authority–Great Lakes Water Authority Sewage Disposal System Revenue | | 5.00% | | 7/1/2034 | | A+ | | | 1,980,000 | | | | 2,005,223 | |
| Municipal Electric Authority of Georgia | | 5.00% | | 1/1/2033 | | A2 | | | 1,910,000 | | | | 1,917,946 | |
| Municipal Electric Authority of Georgia(f) | | 5.25% | | 1/1/2049 | | A2 | | | 3,250,000 | | | | 3,598,220 | |
| Municipal Electric Authority of Georgia (AGM) | | 5.00% | | 7/1/2048 | | AA | | | 1,100,000 | | | | 1,188,274 | |
| Municipal Electric Authority of Georgia (AGM) | | 5.00% | | 7/1/2048 | | AA | | | 1,750,000 | | | | 1,895,582 | |
| Municipal Electric Authority of Georgia (AGM) | | 5.00% | | 7/1/2053 | | AA | | | 2,300,000 | | | | 2,473,053 | |
| | See Notes to Financial Statements. | 97 |
Schedule of Investments (continued)
NATIONAL TAX FREE FUND September 30, 2024
| Investments | | Interest
Rate | | Maturity
Date | | Credit
Rating:
S&P or
Moody’s(a) | | Principal
Amount | | | Fair
Value | |
| Utilities (continued) | | | | | | | | | | | | | | |
| Municipal Electric Authority of Georgia (BAM)(f) | | 5.25% | | 1/1/2054 | | AA | | $ | 5,000,000 | | | $ | 5,530,084 | |
| New York City Municipal Water Finance Authority–New York City Water & Sewer System NY | | 3.50% | | 6/15/2048 | | AA+ | | | 5,000,000 | | | | 4,636,073 | |
| New York City Municipal Water Finance Authority–New York City Water & Sewer System NY | | 5.25% | | 6/15/2047 | | AA+ | | | 4,500,000 | | | | 5,047,051 | |
| Omaha Public Power District Nebraska City Station Unit 2 | | 5.25% | | 2/1/2042 | | A+ | | | 4,000,000 | | | | 4,020,256 | |
| Paducah Electric Plant Board KY (AGM) | | 5.00% | | 10/1/2035 | | AA | | | 1,000,000 | | | | 1,033,013 | |
| Patriots Energy Group Financing Agency SC | | 5.25% | #(b) | 2/1/2054 | | Aa1 | | | 10,000,000 | | | | 11,001,976 | |
| Patriots Energy Group Financing Agency SC | | 5.25% | #(b) | 10/1/2054 | | A1 | | | 15,000,000 | | | | 16,296,883 | |
| Philadelphia Gas Works Co.–Philadelphia Gas Works Co | | 5.25% | | 8/1/2049 | | A | | | 13,000,000 | | | | 14,458,115 | |
| Puerto Rico Commonwealth Aqueduct & Sewer Authority† | | 4.00% | | 7/1/2042 | | NR | | | 5,000,000 | | | | 4,801,281 | |
| Salt Verde Financial Corp. AZ | | 5.25% | | 12/1/2027 | | A3 | | | 3,750,000 | | | | 3,977,773 | |
| South Carolina Public Service Authority | | 5.25% | | 12/1/2049 | | A- | | | 4,095,000 | | | | 4,540,687 | |
| South Carolina Public Service Authority | | 5.50% | | 12/1/2054 | | A- | | | 6,780,000 | | | | 7,638,313 | |
| Southeast Alabama Gas Supply District AL | | 5.00% | #(b) | 6/1/2049 | | A1 | | | 10,000,000 | | | | 10,995,745 | |
| Southeast Alabama Gas Supply District AL | | 5.00% | #(b) | 8/1/2054 | | Aa3 | | | 13,750,000 | | | | 14,951,326 | |
| Southeast Energy Authority A Cooperative District AL | | 5.50% | #(b) | 1/1/2053 | | A1 | | | 5,000,000 | | | | 5,456,267 | |
| Southern California Public Power Authority | | 5.161%
(3 Mo. LIBOR * .67 + 1.47% | )# | 11/1/2038 | | A2 | | | 3,090,000 | | | | 3,034,389 | |
| Southern California Public Power Authority–City of Anaheim Electric System Revenue CA | | 5.00% | #(b) | 4/1/2055 | | A2 | | | 5,500,000 | | | | 5,956,951 | |
| Tennergy Corp. TN | | 5.50% | #(b) | 10/1/2053 | | Baa1 | | | 6,000,000 | | | | 6,548,559 | |
| Tennessee Energy Acquisition Corp. | | 5.625% | | 9/1/2026 | | BBB | (e) | | 10,550,000 | | | | 10,993,416 | |
| Texas Municipal Gas Acquisition & Supply Corp. IV | | 5.50% | #(b) | 1/1/2054 | | A1 | | | 5,000,000 | | | | 5,689,839 | |
| Texas Water Development Board–State Water Implementation Revenue Fund for Texas | | 4.00% | | 10/15/2037 | | AAA | | | 7,760,000 | | | | 7,939,976 | |
| Transbay Joint Powers Authority CA Tax Allocation | | 5.00% | | 10/1/2049 | | A- | (e) | | 1,310,000 | | | | 1,349,980 | |
| Total | | | | | | | | | | | | | 617,171,606 | |
| Total Municipal Bonds (cost $4,646,170,885) | | | | | | | | | | | | | 4,784,289,116 | |
| 98 | See Notes to Financial Statements. |
Schedule of Investments (continued)
NATIONAL TAX FREE FUND September 30, 2024
| Investments | | Interest
Rate# | | Interest
Rate
Reset
Date(h) | | Final
Maturity
Date | | Credit
Rating:
S&P or
Moody’s(a) | | Principal
Amount | | | Fair
Value | |
| SHORT-TERM INVESTMENTS 2.04% | | | | | | | | | | | | | | | | |
| | | | | | | | | | | | | | | | | |
| VARIABLE RATE DEMAND NOTES 2.04% | | | | | | | | | | | |
| | | | | | | | | | | | | | | | | |
| Education 0.17% | | | | | | | | | | | | | | | | |
| Connecticut State Health & Educational Facilities Authority–Yale University | | 3.600% | | 10/1/2024 | | 7/1/2042 | | AAA | | $ | 2,500,000 | | | $ | 2,500,000 | |
| Philadelphia Authority for Industrial Development–Thomas Jefferson University Obligated PA | | 3.950% | | 10/1/2024 | | 9/1/2050 | | A | | | 5,475,000 | | | | 5,475,000 | |
| Total | | | | | | | | | | | | | | | 7,975,000 | |
| | | | | | | | | | | | | | | | | |
| General Obligation 0.96% | | | | | | | | | | | | | | | | |
| City of New York NY GO | | 4.050% | | 10/1/2024 | | 3/1/2040 | | AA | | | 7,600,000 | | | | 7,600,000 | |
| City of New York NY GO | | 4.050% | | 10/1/2024 | | 10/1/2046 | | AA | | | 1,700,000 | | | | 1,700,000 | |
| City of New York NY GO | | 4.150% | | 10/1/2024 | | 4/1/2042 | | AA | | | 16,200,000 | | | | 16,200,000 | |
| City of New York NY GO | | 4.150% | | 10/1/2024 | | 4/1/2042 | | AA | | | 10,600,000 | | | | 10,600,000 | |
| City of New York NY GO | | 4.150% | | 10/1/2024 | | 12/1/2047 | | AA | | | 9,615,000 | | | | 9,615,000 | |
| Total | | | | | | | | | | | | | | | 45,715,000 | |
| | | | | | | | | | | | | | | | | |
| Taxable Revenue–Water & Sewer 0.42% | | | | | | | | | | | | | | | | |
| Los Angeles Department of Water & Power Water System Revenue CA | | 3.000% | | 10/1/2024 | | 7/1/2045 | | Aa2 | | | 18,600,000 | | | | 18,600,000 | |
| New York City Municipal Water Finance Authority–New York City Water & Sewer System NY | | 4.000% | | 10/15/2024 | | 6/15/2049 | | AA+ | | | 1,610,000 | | | | 1,610,000 | |
| Total | | | | | | | | | | | | | | | 20,210,000 | |
| | | | | | | | | | | | | | | | | |
| Utilities 0.49% | | | | | | | | | | | | | | | | |
| Development Authority of Appling County–Georgia Power Co | | 4.400% | | 10/1/2024 | | 9/1/2041 | | A | | | 20,635,000 | | | | 20,635,000 | |
| Los Angeles Department of Water & Power–Los Angeles Department of Water & Power Power System Revenue CA | | 2.650% | | 10/1/2024 | | 7/1/2035 | | Aa2 | | | 2,455,000 | | | | 2,455,000 | |
| Total | | | | | | | | | | | | | | | 23,090,000 | |
| Total Short-Term Investments (cost $96,990,000) | | | | | | | | | | 96,990,000 | |
| Total Investments in Securities 102.56% (cost $4,743,160,885) | | | | | | | | | | 4,881,279,116 | |
| Other Assets and Liabilities – Net(i) (2.56)% | | | | | | | | | | (122,053,592 | ) |
| Net Assets 100.00% | | | | | | | | | | | | | | $ | 4,759,225,524 | |
| | See Notes to Financial Statements. | 99 |
Schedule of Investments (continued)
NATIONAL TAX FREE FUND September 30, 2024
| AGM | | Insured by–Assured Guaranty Municipal Corporation. |
| AMT | | Income from the security may be subject to Alternative Minimum Tax. |
| BAM | | Insured by–Build America Mutual. |
| FHLMC | | Insured by–Federal Home Loan Mortgage Corporation. |
| FNMA | | Federal National Mortgage Association. |
| GNMA | | Government National Mortgage Association. |
| GTD | | Guaranteed. |
| LIBOR | | London Interbank Offered Rate. |
| NATL | | Insured by–National Public Finance Guarantee Corporation. |
| PSF | | Permanent School Fund. |
| SIFMA | | Insured by–Securities Industry and Financial Markets Association. |
| TCRS | | Transferable Custodial Receipts. |
| TRIPS | | Tax Refund Intercept Programs. |
| † | | Security was purchased pursuant to Rule 144A under the Securities Act of 1933 and, unless registered under such Act or exempted from registration, may only be resold to qualified institutional buyers. At September 30, 2024, the total value of Rule 144A securities was $209,670,785, which represents 4.41% of net assets. |
| # | | Variable rate security. The interest rate represents the rate in effect at September 30, 2024. |
| ~ | | Deferred interest debentures pay no interest for a stipulated number of years, after which they pay a predetermined interest rate. |
| (a) | | Unaudited. |
| (b) | | Variable Rate is Fixed to Float: Rate remains fixed or at Zero Coupon until designated future date. |
| (c) | | Defaulted (non-income producing security). |
| (d) | | Municipal Bonds Held in Trust–Securities represent underlying bonds transferred to a separate securitization trust established in a tender option bond transaction in which the Fund acquired the residual interest certificates. These securities serve as collateral in a financing transaction. See Note 2(h) to Financial Statements for details of Municipal Bonds Held in Trust. |
| (e) | | This investment has been rated by Fitch IBCA. |
| (f) | | Securities purchased on a when-issued basis (See Note 2(g)). |
| (g) | | Level 3 Investment as described in Note 2(i) in the Notes to Financial Statements. Security valued utilizing third party pricing information without adjustment. Such valuations are based on unobservable inputs. A significant change in third party information could result in a significantly lower or higher value of such Level 3 investments. |
| (h) | | The interest rate reset date shown represents the date in which the Fund has the right to sell a Variable Rate Demand Note (“VRDN”) back to the issuer for Principal Amount. The interest rate on the VRDN is generally reset daily based on the SIFMA Municipal Swap Index. |
| (i) | | Other Assets and Liabilities – Net include net unrealized appreciation/depreciation on futures contracts as follows: |
Futures Contracts at September 30, 2024:
| Type | | Expiration | | Contracts | | Position | | Notional
Amount | | | Notional
Value | | | Unrealized
Appreciation | |
| U.S. Long Bond | | December 2024 | | 306 | | Short | | $ | (38,073,191 | ) | | $ | (38,001,375 | ) | | | $71,816 | |
The following is a summary of the inputs used as of September 30, 2024 in valuing the Fund’s investments carried at fair value(1):
| Investment Type(2) | | Level 1 | | | Level 2 | | | Level 3 | | | Total | |
| Long-Term Investments | | | | | | | | | | | | | | | | |
| Municipal Bonds(3) | | | | | | | | | | | | | | | | |
| Special Tax | | $ | – | | | $ | 72,476,108 | | | $ | 214 | | | $ | 72,476,322 | |
| Remaining Industries | | | – | | | | 4,711,812,794 | | | | – | | | | 4,711,812,794 | |
| Short-Term Investments | | | | | | | | | | | | | | | | |
| Variable Rate Demand Notes | | | – | | | | 96,990,000 | | | | – | | | | 96,990,000 | |
| Total | | $ | – | | | $ | 4,881,278,902 | | | $ | 214 | | | $ | 4,881,279,116 | |
| Other Financial Instruments | | | | | | | | | | | | | | | | |
| Futures Contracts | | | | | | | | | | | | | | | | |
| Assets | | $ | 71,816 | | | $ | – | | | $ | – | | | $ | 71,816 | |
| Liabilities | | | – | | | | – | | | | – | | | | – | |
| Total | | $ | 71,816 | | | $ | – | | | $ | – | | | $ | 71,816 | |
| 100 | See Notes to Financial Statements. |
Schedule of Investments (concluded)
NATIONAL TAX FREE FUND September 30, 2024
| (1) | | Refer to Note 2(i) for a description of fair value measurements and the three-tier hierarchy of inputs. |
| (2) | | See Schedule of Investments for fair values in each industry. The table above is presented by Investment Type. Industries are presented within an Investment Type should such Investment Type include securities classified as two or more levels within the three-tier fair value hierarchy. When applicable, each Level 3 security is identified on the Schedule of Investments along with the valuation technique utilized. |
| (3) | | Includes Municipal Bonds held in the Trust (See Note 2(h)). |
A reconciliation of Level 3 investments is presented when the Fund has a material amount of Level 3 investments at the beginning or end of the year in relation to the Fund’s net assets. Management has determined not to provide a reconciliation as the balance of Level 3 investments was not considered to be material to the Fund’s net assets at the beginning or end of the year.
| | See Notes to Financial Statements. | 101 |
Schedule of Investments
HIGH INCOME MUNICIPAL BOND FUND September 30, 2024
| Investments | | Interest
Rate | | Maturity
Date | | Credit
Rating:
S&P or
Moody’s(a) | | Principal
Amount | | | Fair
Value | |
| LONG-TERM INVESTMENTS 99.28% | | | | | | | | | | | | | | |
| | | | | | | | | | | | | | | |
| CORPORATE BONDS 0.12% | | | | | | | | | | | | | | |
| | | | | | | | | | | | | | | |
| Health Care Services 0.12% | | | | | | | | | | | | | | |
Care New England Health System
(cost $4,790,627) | | 5.50% | | 9/1/2026 | | | | $ | 5,000,000 | | | $ | 4,850,000 | |
| | | | | | | | | | | | | | | |
| MUNICIPAL BONDS 99.16% | | | | | | | | | | | | | | |
| | | | | | | | | | | | | | | |
| Corporate-Backed 18.58% | | | | | | | | | | | | | | |
| Allegheny County Industrial Development Authority-United States Steel Corp PA | | 5.125% | | 5/1/2030 | | BB- | | | 3,990,000 | | | | 4,360,558 | |
| Arkansas Development Finance Authority-Big River Steel LLC AMT† | | 4.50% | | 9/1/2049 | | Ba2 | | | 35,135,000 | | | | 34,977,304 | |
| Arkansas Development Finance Authority-Hybar LLC AMT† | | 6.875% | | 7/1/2048 | | NR | | | 10,250,000 | | | | 11,362,208 | |
| Arkansas Development Finance Authority-Hybar LLC AMT† | | 7.375% | | 7/1/2048 | | NR | | | 16,000,000 | | | | 17,829,923 | |
| Arkansas Development Finance Authority-United States Steel Corp AMT | | 5.45% | | 9/1/2052 | | BB- | | | 18,000,000 | | | | 18,878,897 | |
| Arkansas Development Finance Authority-US Steel Corp AMT | | 5.70% | | 5/1/2053 | | BB- | | | 17,250,000 | | | | 18,374,320 | |
| Avenir Community Development District FL | | 5.375% | | 5/1/2043 | | NR | | | 3,230,000 | | | | 3,329,007 | |
| Avenir Community Development District FL | | 5.625% | | 5/1/2054 | | NR | | | 3,830,000 | | | | 3,973,088 | |
| Boggy Creek Improvement District FL | | 5.125% | | 5/1/2043 | | NR | | | 1,775,000 | | | | 1,833,332 | |
| Boggy Creek Improvement District FL | | 5.375% | | 5/1/2053 | | NR | | | 4,300,000 | | | | 4,423,725 | |
| Cabot Citrus Farms Community Development District FL | | 5.25% | | 3/1/2029 | | NR | | | 3,800,000 | | | | 3,851,041 | |
| Calhoun County Navigation Industrial Development Authority-Max Midstream Texas LLC AMT† | | 3.625% | | 7/1/2026 | | NR | | | 7,800,000 | | | | 6,681,906 | |
| California Infrastructure & Economic Development Bank-DesertXpress Enterprises LLC AMT† | | 8.00% | #(b) | 1/1/2050 | | NR | | | 12,000,000 | | | | 12,359,054 | |
| California Pollution Control Financing Authority-Poseidon Resources Channelside LP AMT† | | 5.00% | | 11/21/2045 | | Baa3 | | | 3,025,000 | | | | 3,029,684 | |
| City of Henderson-Pratt Paper LLC KY AMT† | | 4.70% | | 1/1/2052 | | NR | | | 10,500,000 | | | | 10,537,705 | |
| City of Houston Airport System Revenue-United Airlines Inc TX AMT | | 4.00% | | 7/15/2041 | | BB- | (c) | | 4,475,000 | | | | 4,405,405 | |
| 102 | See Notes to Financial Statements. |
Schedule of Investments (continued)
HIGH INCOME MUNICIPAL BOND FUND September 30, 2024
| Investments | | Interest
Rate | | Maturity
Date | | Credit
Rating:
S&P or
Moody’s(a) | | Principal
Amount | | | Fair
Value | |
| Corporate-Backed (continued) | | | | | | | | | | | | | | |
| City of Houston Airport System Revenue-United Airlines Inc TX AMT | | 5.00% | | 7/15/2028 | | BB- | | $ | 5,000,000 | | | $ | 5,174,205 | |
| City of Houston Airport System Revenue-United Airlines Inc TX AMT | | 5.00% | | 7/1/2029 | | BB- | | | 18,325,000 | | | | 18,333,356 | |
| City of Valparaiso-Pratt Paper LLC AMT IN† | | 4.875% | | 1/1/2044 | | NR | | | 2,000,000 | | | | 2,102,471 | |
| City of Valparaiso-Pratt Paper LLC AMT IN† | | 5.00% | | 1/1/2054 | | NR | | | 6,100,000 | | | | 6,379,981 | |
| Crosswinds East Community Development District FL | | 5.50% | | 5/1/2044 | | NR | | | 1,000,000 | | | | 1,034,860 | |
| Crosswinds East Community Development District FL | | 5.75% | | 5/1/2054 | | NR | | | 1,500,000 | | | | 1,547,856 | |
| Downtown Doral South Community Development District FL† | | 4.75% | | 12/15/2038 | | NR | | | 625,000 | | | | 635,424 | |
| Downtown Doral South Community Development District FL† | | 5.00% | | 12/15/2048 | | NR | | | 1,500,000 | | | | 1,522,229 | |
| Florida Development Finance Corp.-Waste pro USA Inc AMT† | | 6.125% | #(b) | 7/1/2032 | | NR | | | 9,000,000 | | | | 9,252,407 | |
| Grapevine Wash Local District-Grapevine Wash Local District Assessment Area No 1 UT† | | 5.25% | | 12/1/2044 | | NR | | | 8,000,000 | | | | 8,034,265 | |
| Greater Orlando Aviation Authority-JetBlue Airways Corp FL | | 5.00% | | 11/15/2036 | | NR | | | 5,570,000 | | | | 5,573,431 | |
| Hobe-St Lucie Conservancy District Unit of Development No 1A | | 5.60% | | 5/1/2044 | | NR | | | 1,840,000 | | | | 1,927,016 | |
| Hobe-St Lucie Conservancy District Unit of Development No 1A | | 5.875% | | 5/1/2055 | | NR | | | 4,000,000 | | | | 4,179,134 | |
| Hoover Industrial Development Board-United States Steel Corp AL AMT | | 5.75% | | 10/1/2049 | | BB- | | | 17,770,000 | | | | 18,754,705 | |
| Illinois Finance Authority-LRS Holdings LLC AMT† | | 7.375% | #(b) | 9/1/2042 | | NR | | | 10,000,000 | | | | 11,830,642 | |
| Indiana Finance Authority-United States Steel Corp AMT | | 6.75% | | 5/1/2039 | | BB- | | | 3,500,000 | | | | 4,066,265 | |
| Iowa Finance Authority-Howmet Aerospace Inc | | 4.75% | | 8/1/2042 | | Baa1 | | | 18,950,000 | | | | 18,971,163 | |
| Iowa Finance Authority-Iowa Fertilizer Co LLC | | 5.00% | #(b) | 12/1/2050 | | AA+ | | | 9,145,000 | | | | 10,720,287 | |
| Iowa Finance Authority-Iowa Fertilizer Co LLC | | 5.00% | | 12/1/2050 | | AA+ | | | 23,370,000 | | | | 27,395,637 | |
| Jefferson County Port Authority-JSW Steel USA Ohio Inc OH† | | 5.00% | #(b) | 12/1/2053 | | Ba1 | | | 12,500,000 | | | | 12,830,230 | |
| | See Notes to Financial Statements. | 103 |
Schedule of Investments (continued)
HIGH INCOME MUNICIPAL BOND FUND September 30, 2024
| Investments | | Interest
Rate | | Maturity
Date | | Credit
Rating:
S&P or
Moody’s(a) | | Principal
Amount | | | Fair
Value | |
| Corporate-Backed (continued) | | | | | | | | | | | | | | |
| Jefferson County Port Authority-JSW Steel USA Ohio Inc OH AMT† | | 3.50% | | 12/1/2051 | | Ba1 | | $ | 4,200,000 | | | $ | 3,370,418 | |
| Louisiana Public Facilities Authority-Waste Pro USA Inc AMT† | | 6.75% | #(b) | 10/1/2053 | | NR | | | 2,000,000 | | | | 2,176,770 | |
| Louisiana Public Facilities Authority-Waste Pro USA Inc LA† | | 6.50% | #(b) | 10/1/2053 | | NR | | | 3,745,000 | | | | 4,043,784 | |
| Maricopa County Industrial Development Authority-Commercial Metals Co AZ† | | 4.00% | | 10/15/2047 | | BB+ | | | 8,080,000 | | | | 7,427,921 | |
| Maryland Economic Development Corp.(d) | | 5.00% | | 12/1/2016 | | NR | | | 3,430,000 | | | | 2,225,213 | |
| Miami-Dade County Industrial Development Authority-CFC MB I LLC FL† | | 6.25% | | 1/1/2059 | | NR | | | 8,000,000 | | | | 8,214,064 | |
| Mission Economic Development Corp.-Natgasoline LLC TX AMT† | | 4.625% | | 10/1/2031 | | BB- | | | 12,915,000 | | | | 12,974,964 | |
| Mobile County Industrial Development Authority-AM/NS Calvert LLC AL | | 5.00% | | 6/1/2054 | | BBB- | | | 16,750,000 | | | | 17,402,349 | |
| New Hampshire Business Finance Authority-Covanta Holding Corp AMT† | | 4.00% | | 11/1/2027 | | B | | | 1,250,000 | | | | 1,250,005 | |
| New Hampshire Business Finance Authority-Covanta Holding Corp AMT† | | 4.875% | | 11/1/2042 | | B | | | 17,000,000 | | | | 16,888,254 | |
| New Jersey Economic Development Authority-United Airlines Inc | | 5.25% | | 9/15/2029 | | BB- | | | 14,760,000 | | | | 14,777,249 | |
| New Jersey Economic Development Authority-United Airlines Inc | | 5.50% | | 6/1/2033 | | BB- | | | 6,960,000 | | | | 7,007,324 | |
| New York City Industrial Development Agency-TRIPS Obligated Group NY | | 5.00% | | 7/1/2028 | | BBB+ | | | 4,290,000 | | | | 4,291,918 | |
| New York Liberty Development Corp.-3 World Trade Center LLC† | | 5.00% | | 11/15/2044 | | NR | | | 16,700,000 | | | | 16,710,701 | |
| New York Liberty Development Corp.-3 World Trade Center LLC† | | 5.15% | | 11/15/2034 | | NR | | | 5,100,000 | | | | 5,106,777 | |
| New York Liberty Development Corp.-3 World Trade Center LLC† | | 5.375% | | 11/15/2040 | | NR | | | 5,000,000 | | | | 5,006,004 | |
| New York Liberty Development Corp.-7 World Trade Center II LLC | | 3.125% | | 9/15/2050 | | Aaa | | | 2,500,000 | | | | 2,059,821 | |
| New York State Environmental Facilities Corp.-Casella Waste Systems Inc AMT† | | 3.125% | #(b) | 12/1/2044 | | B+ | | | 2,000,000 | | | | 1,971,668 | |
| New York State Environmental Facilities Corp.-Casella Waste Systems Inc AMT† | | 5.125% | #(b) | 9/1/2050 | | B+ | | | 1,000,000 | | | | 1,052,901 | |
| New York Transportation Development Corp.-American Airlines Inc AMT | | 5.00% | | 8/1/2026 | | B+ | | | 1,330,000 | | | | 1,332,476 | |
| New York Transportation Development Corp.-American Airlines Inc AMT | | 5.00% | | 8/1/2031 | | B+ | | | 21,495,000 | | | | 21,525,048 | |
| 104 | See Notes to Financial Statements. |
Schedule of Investments (continued)
HIGH INCOME MUNICIPAL BOND FUND September 30, 2024
| Investments | | Interest
Rate | | Maturity
Date | | Credit
Rating:
S&P or
Moody’s(a) | | Principal
Amount | | | Fair
Value | |
| Corporate-Backed (continued) | | | | | | | | | | | | | | |
| New York Transportation Development Corp.-American Airlines Inc AMT | | 5.25% | | 8/1/2031 | | B+ | | $ | 8,185,000 | | | $ | 8,769,229 | |
| New York Transportation Development Corp.-American Airlines Inc AMT | | 5.375% | | 8/1/2036 | | B+ | | | 9,165,000 | | | | 9,835,872 | |
| New York Transportation Development Corp.-Delta Air Lines Inc AMT | | 5.00% | | 10/1/2035 | | Baa3 | | | 10,500,000 | | | | 11,093,751 | |
| Niagara Area Development Corp.-Covanta Holding Corp NY AMT† | | 4.75% | | 11/1/2042 | | B | | | 10,000,000 | | | | 9,727,497 | |
| Normandy Community Development District Assessment Area One FL† | | 5.30% | | 5/1/2044 | | NR | | | 1,500,000 | | | | 1,510,672 | |
| Normandy Community Development District Assessment Area One FL† | | 5.55% | | 5/1/2054 | | NR | | | 2,500,000 | | | | 2,511,601 | |
| Ohio Air Quality Development Authority-AMG Vanadium LLC AMT† | | 5.00% | | 7/1/2049 | | B- | | | 33,290,000 | | | | 33,315,297 | |
| Parish of Beauregard-OfficeMax Inc LA | | 6.80% | | 2/1/2027 | | NR | | | 5,000,000 | | | | 5,011,754 | |
| Parish of St. James-NuStar Logistics LP LA† | | 5.85% | #(b) | 8/1/2041 | | BB+ | | | 1,000,000 | | | | 1,013,573 | |
| Parish of St. James-NuStar Logistics LP LA† | | 6.10% | #(b) | 6/1/2038 | | BB+ | | | 6,375,000 | | | | 7,136,489 | |
| Parish of St. James-NuStar Logistics LP LA† | | 6.10% | #(b) | 12/1/2040 | | BB+ | | | 2,750,000 | | | | 3,085,943 | |
| Parish of St. James-NuStar Logistics LP LA† | | 6.35% | | 7/1/2040 | | BB+ | | | 5,000,000 | | | | 5,566,058 | |
| Parish of St. James-NuStar Logistics LP LA† | | 6.35% | | 10/1/2040 | | BB+ | | | 7,690,000 | | | | 8,560,597 | |
| Peninsula Town Center Community Development Authority VA† | | 4.50% | | 9/1/2045 | | NR | | | 1,375,000 | | | | 1,280,696 | |
| Pennsylvania Economic Development Financing Authority-CONSOL Energy Inc AMT† | | 9.00% | #(b) | 4/1/2051 | | BB | | | 4,250,000 | | | | 4,897,463 | |
| Pennsylvania Economic Development Financing Authority-New NGC Inc AMT | | 5.50% | | 11/1/2044 | | NR | | | 1,000,000 | | | | 1,000,745 | |
| Polk County Industrial Development Authority-Mineral Development LLC FL† | | 5.875% | | 1/1/2033 | | NR | | | 7,020,000 | | | | 6,342,927 | |
| Port of Beaumont Navigation District-Jefferson 2020 Bond Lessee & Borrower LLC Obligated Group TX† | | 5.125% | | 1/1/2044 | | NR | | | 500,000 | | | | 522,243 | |
| Port of Beaumont Navigation District-Jefferson 2020 Bond Lessee & Borrower LLC Obligated Group TX† | | 5.25% | | 1/1/2054 | | NR | | | 19,750,000 | | | | 20,661,413 | |
| Prairie Center Metropolitan District No 3 | | 5.875% | | 12/15/2046 | | NR | | | 3,125,000 | | | | 3,410,716 | |
| Public Finance Authority-Sky Harbour Capital LLC Obligated Group WI AMT | | 4.25% | | 7/1/2054 | | NR | | | 24,745,000 | | | | 21,326,206 | |
| Public Finance Authority-TRIPS Obligated Group WI AMT | | 5.00% | | 7/1/2042 | | BBB+ | | | 11,000,000 | | | | 11,002,903 | |
| | See Notes to Financial Statements. | 105 |
Schedule of Investments (continued)
HIGH INCOME MUNICIPAL BOND FUND September 30, 2024
| Investments | | Interest
Rate | | Maturity
Date | | Credit
Rating:
S&P or
Moody’s(a) | | Principal
Amount | | | Fair
Value | |
| Corporate-Backed (continued) | | | | | | | | | | | | | | |
| Public Finance Authority WI† | | 5.375% | | 12/15/2032 | | NR | | $ | 3,500,000 | | | $ | 3,511,144 | |
| Public Finance Authority WI† | | 5.50% | | 12/15/2028 | | NR | | | 11,000,000 | | | | 11,068,192 | |
| Southwestern Illinois Development Authority-United States Street Corp | | 5.75% | | 8/1/2042 | | BB- | | | 2,500,000 | | | | 2,502,626 | |
| Spring Valley Community Infrastructure District No. 1 ID† | | 6.25% | | 9/1/2053 | | NR | | | 7,000,000 | | | | 7,482,208 | |
| Town of Rumford-OfficeMax Inc ME | | 6.875% | | 10/1/2026 | | NR | | | 1,500,000 | | | | 1,503,572 | |
| Tulsa Airports Improvement Trust-American Airlines Inc OK AMT | | 5.00% | #(b) | 6/1/2035 | | B+ | | | 6,750,000 | | | | 6,802,030 | |
| Tulsa Airports Improvement Trust-American Airlines Inc OK AMT | | 5.50% | | 12/1/2035 | | NR | | | 2,700,000 | | | | 2,705,165 | |
| Tuscaloosa County Industrial Development Authority-Hunt Refining Co AL† | | 5.25% | | 5/1/2044 | | NR | | | 22,035,000 | | | | 22,610,777 | |
| Vermont Economic Development Authority-Casella Waste Systems Inc AMT† | | 5.00% | #(b) | 6/1/2052 | | B+ | | | 9,000,000 | | | | 9,207,615 | |
| Village Community Development District No 15 Series 2024 Special Assessment FL†(e) | | 4.80% | | 5/1/2055 | | NR | | | 7,250,000 | | | | 7,349,325 | |
| Village Community Development District No. 15 FL† | | 5.25% | | 5/1/2054 | | NR | | | 4,120,000 | | | | 4,299,608 | |
| Virginia Small Business Financing Authority-Covanta Holding Corp AMT† | | 5.00% | #(b) | 1/1/2048 | | B | | | 3,150,000 | | | | 3,150,555 | |
| West Pace Cooperative District AL(d) | | 9.125% | | 5/1/2039 | | NR | | | 13,770,000 | | | | 10,465,200 | |
| West Virginia Economic Development Authority-Kentucky Power Co AMT | | 4.70% | #(b) | 4/1/2036 | | BBB | | | 4,000,000 | | | | 4,057,556 | |
| Total | | | | | | | | | | | | | 761,587,568 | |
| | | | | | | | | | | | | | | |
| Education 7.25% | | | | | | | | | | | | | | |
| Arizona Industrial Development Authority-Academies of Math & Science Obligated Group† | | 5.625% | | 7/1/2048 | | BB+ | | | 2,235,000 | | | | 2,270,364 | |
| Arizona Industrial Development Authority-Academies of Math & Science Obligated Group† | | 5.75% | | 7/1/2053 | | BB+ | | | 3,000,000 | | | | 3,050,888 | |
| Arlington Higher Education Finance Corp.-BASIS Texas Charter Schools Inc TX† | | 4.75% | | 6/15/2049 | | Ba2 | | | 915,000 | | | | 916,780 | |
| Arlington Higher Education Finance Corp.-BASIS Texas Charter Schools Inc TX† | | 4.875% | | 6/15/2054 | | Ba2 | | | 1,100,000 | | | | 1,104,208 | |
| 106 | See Notes to Financial Statements. |
Schedule of Investments (continued)
HIGH INCOME MUNICIPAL BOND FUND September 30, 2024
| Investments | | Interest
Rate | | Maturity
Date | | Credit
Rating:
S&P or
Moody’s(a) | | Principal
Amount | | | Fair
Value | |
| Education (continued) | | | | | | | | | | | | | | |
| Arlington Higher Education Finance Corp.-BASIS Texas Charter Schools Inc TX† | | 4.875% | | 6/15/2059 | | Ba2 | | $ | 1,000,000 | | | $ | 1,002,566 | |
| Arlington Higher Education Finance Corp.-BASIS Texas Charter Schools Inc TX† | | 5.00% | | 6/15/2064 | | Ba2 | | | 1,400,000 | | | | 1,404,460 | |
| Build NYC Resource Corp.-East Harlem Scholars Academy Charter School Obligated Group NY† | | 5.75% | | 6/1/2052 | | BB | | | 1,250,000 | | | | 1,334,360 | |
| Build NYC Resource Corp.-East Harlem Scholars Academy Charter School Obligated Group NY† | | 5.75% | | 6/1/2062 | | BB | | | 3,750,000 | | | | 3,995,386 | |
| California Educational Facilities Authority-St Mary’s College of California | | 5.25% | | 10/1/2044 | | BBB- | | | 600,000 | | | | 648,845 | |
| California Educational Facilities Authority-St Mary’s College of California | | 5.50% | | 10/1/2053 | | BBB- | | | 2,200,000 | | | | 2,376,484 | |
| California Municipal Finance Authority-SDORI Charter School Properties LLC† | | 5.625% | | 3/1/2045 | | B+ | | | 11,500,000 | | | | 11,246,909 | |
| California Municipal Finance Authority-Westside Neighborhood School† | | 6.20% | | 6/15/2054 | | BB | | | 2,650,000 | | | | 2,873,431 | |
| California Municipal Finance Authority-Westside Neighborhood School† | | 6.375% | | 6/15/2064 | | BB | | | 5,000,000 | | | | 5,446,984 | |
| Camden County Improvement Authority-KIPP Cooper Norcross Obligated Group NJ | | 6.00% | | 6/15/2062 | | BBB | | | 2,535,000 | | | | 2,741,046 | |
| Capital Trust Agency, Inc.-Renaissance Charter School Inc Series 2019 Obligated Group FL† | | 5.00% | | 6/15/2039 | | NR | | | 1,950,000 | | | | 1,953,327 | |
| Capital Trust Agency, Inc.-Renaissance Charter School Inc Series 2019 Obligated Group FL† | | 5.00% | | 6/15/2049 | | NR | | | 9,815,000 | | | | 9,677,260 | |
| Capital Trust Agency, Inc.-Southeastern University Obligated Group FL† | | 6.375% | | 5/1/2053 | | BB | | | 6,150,000 | | | | 6,339,973 | |
| Capital Trust Authority-Kipp Miami Obligated Group FL† | | 5.625% | | 6/15/2044 | | BB | | | 815,000 | | | | 857,283 | |
| Capital Trust Authority-Kipp Miami Obligated Group FL† | | 6.00% | | 6/15/2054 | | BB | | | 1,155,000 | | | | 1,221,957 | |
| Capital Trust Authority-Kipp Miami Obligated Group FL† | | 6.125% | | 6/15/2060 | | BB | | | 800,000 | | | | 847,457 | |
| Chicago Board of Education Dedicated Capital Improvement Tax IL | | 5.75% | | 4/1/2048 | | A | (c) | | 8,500,000 | | | | 9,491,579 | |
| Chicago Board of Education Dedicated Capital Improvement Tax IL TCRS (BAM) | | 5.00% | | 4/1/2045 | | AA | | | 2,500,000 | | | | 2,691,714 | |
| | See Notes to Financial Statements. | 107 |
Schedule of Investments (continued)
HIGH INCOME MUNICIPAL BOND FUND September 30, 2024
| Investments | | Interest
Rate | | Maturity
Date | | Credit
Rating:
S&P or
Moody’s(a) | | Principal
Amount | | | Fair
Value | |
| Education (continued) | | | | | | | | | | | | | | |
| Chicago Board of Education IL GO | | 4.00% | | 12/1/2043 | | BB+ | | $ | 2,975,000 | | | $ | 2,736,481 | |
| Chicago Board of Education IL GO | | 4.00% | | 12/1/2047 | | BB+ | | | 29,045,000 | | | | 25,849,243 | |
| Chicago Board of Education IL GO | | 5.00% | | 12/1/2036 | | BB+ | | | 4,000,000 | | | | 4,087,435 | |
| City of Jacksonville-Jacksonville University FL† | | 5.00% | | 6/1/2053 | | NR | | | 6,500,000 | | | | 6,344,775 | |
| Clarksville Public Educational Facilities Board-University of the Ozarks AR | | 6.00% | | 8/1/2044 | | NR | | | 1,000,000 | | | | 1,044,849 | |
| Clarksville Public Educational Facilities Board-University of the Ozarks AR | | 6.25% | | 8/1/2049 | | NR | | | 1,195,000 | | | | 1,251,600 | |
| Clarksville Public Educational Facilities Board-University of the Ozarks AR | | 6.25% | | 8/1/2056 | | NR | | | 2,000,000 | | | | 2,083,145 | |
| Clifton Higher Education Finance Corp.-International Leadership of Texas Inc | | 5.75% | | 8/15/2045 | | NR | | | 6,500,000 | | | | 6,592,854 | |
| Colorado Educational & Cultural Facilities Authority† | | 5.75% | | 4/1/2059 | | BB | | | 2,250,000 | | | | 2,349,860 | |
| Colorado Educational & Cultural Facilities Authority† | | 5.80% | | 4/1/2054 | | BB | | | 3,200,000 | | | | 3,370,988 | |
| Columbus-Franklin County Finance Authority-Ohio Dominican University | | 6.50% | | 3/1/2048 | | NR | | | 4,920,000 | | | | 3,439,043 | |
| Columbus-Franklin County Finance Authority-Ohio Dominican University | | 6.50% | | 3/1/2053 | | NR | | | 3,500,000 | | | | 2,386,723 | |
| County of Tuscarawas-Ashland University OH | | 6.00% | | 3/1/2045 | | NR | | | 5,000,000 | | | | 5,007,983 | |
| Development Authority Of The City of Marietta-Life University Inc GA† | | 5.00% | | 11/1/2047 | | Ba3 | | | 8,000,000 | | | | 8,029,110 | |
| Development Authority Of The City Of Marietta-Life University Inc GA† | | 5.00% | | 11/1/2037 | | Ba3 | | | 13,000,000 | | | | 13,218,379 | |
| Florida Development Finance Corp.-Renaissance Charter School Inc† | | 6.75% | | 6/15/2053 | | NR | | | 8,000,000 | | | | 8,880,510 | |
| Florida Development Finance Corp.-Renaissance Charter School Inc Series 2020C/D Obligated Group† | | 5.00% | | 9/15/2040 | | NR | | | 1,505,000 | | | | 1,477,376 | |
| Florida Higher Educational Facilities Financial Authority-Jacksonville University† | | 5.00% | | 6/1/2048 | | NR | | | 9,000,000 | | | | 8,913,107 | |
| Illinois Finance Authority-DePaul College Prep† | | 5.50% | | 8/1/2043 | | BB+ | | | 1,360,000 | | | | 1,490,324 | |
| Illinois Finance Authority-DePaul College Prep† | | 5.625% | | 8/1/2053 | | BB+ | | | 4,500,000 | | | | 4,867,738 | |
| 108 | See Notes to Financial Statements. |
Schedule of Investments (continued)
HIGH INCOME MUNICIPAL BOND FUND September 30, 2024
| Investments | | Interest
Rate | | Maturity
Date | | Credit
Rating:
S&P or
Moody’s(a) | | Principal
Amount | | | Fair
Value | |
| Education (continued) | | | | | | | | | | | | | | |
| Industrial Development Authority of the City of Phoenix Arizona-BASIS Schools Inc Obligated Group AZ† | | 5.00% | | 7/1/2045 | | BB | | $ | 7,200,000 | | | $ | 7,213,217 | |
| Louisiana Public Facilities Authority-Loyola University New Orleans | | 5.25% | | 10/1/2053 | | Baa1 | | | 14,000,000 | | | | 14,752,303 | |
| Maricopa County Industrial Development Authority-Morrison Education Group Obligated Group AZ† | | 6.25% | | 7/1/2044 | | NR | | | 3,490,000 | | | | 3,681,813 | |
| Maricopa County Industrial Development Authority-Morrison Education Group Obligated Group AZ† | | 6.50% | | 7/1/2054 | | NR | | | 5,660,000 | | | | 5,948,932 | |
| Maricopa County Industrial Development Authority-Morrison Education Group Obligated Group AZ† | | 6.625% | | 7/1/2059 | | NR | | | 3,125,000 | | | | 3,297,261 | |
| Maricopa County Industrial Development Authority-Morrison Education Group Obligated Group AZ† | | 6.75% | | 7/1/2063 | | NR | | | 1,000,000 | | | | 1,059,185 | |
| Maricopa County Industrial Development Authority-Ottawa University AZ† | | 5.25% | | 10/1/2040 | | NR | | | 3,000,000 | | | | 2,896,129 | |
| Maricopa County Industrial Development Authority-Ottawa University AZ† | | 5.50% | | 10/1/2051 | | NR | | | 7,915,000 | | | | 7,449,413 | |
| Middlesex County Improvement Authority-Rutgers The State University of New Jersey(f) | | 5.00% | | 8/15/2053 | | Aa3 | | | 15,000,000 | | | | 16,566,916 | |
| New York State Dormitory Authority-Yeshiva University | | 5.00% | | 7/15/2042 | | BBB- | | | 3,725,000 | | | | 3,894,147 | |
| Public Finance Authority-Mater Academy of Nevada WI†(e) | | 5.00% | | 12/15/2044 | | BB | | | 500,000 | | | | 513,500 | |
| Public Finance Authority-Mater Academy of Nevada WI†(e) | | 5.00% | | 12/15/2054 | | BB | | | 2,000,000 | | | | 2,036,212 | |
| Public Finance Authority-UMA Education Inc WI† | | 5.00% | | 10/1/2034 | | BB+ | | | 2,610,000 | | | | 2,704,480 | |
| Public Finance Authority-UMA Education Inc WI† | | 5.00% | | 10/1/2039 | | BB+ | | | 8,250,000 | | | | 8,440,280 | |
| Public Finance Authority-Wingate University WI | | 5.25% | | 10/1/2043 | | BBB- | | | 2,000,000 | | | | 1,978,445 | |
| Sierra Vista Industrial Development Authority-American Leadership Academy Inc AZ†(e) | | 5.00% | | 6/15/2054 | | NR | | | 1,050,000 | | | | 1,060,001 | |
| Sierra Vista Industrial Development Authority-American Leadership Academy Inc AZ†(e) | | 5.00% | | 6/15/2059 | | NR | | | 1,050,000 | | | | 1,057,037 | |
| | See Notes to Financial Statements. | 109 |
Schedule of Investments (continued)
HIGH INCOME MUNICIPAL BOND FUND September 30, 2024
| Investments | | Interest
Rate | | Maturity
Date | | Credit
Rating:
S&P or
Moody’s(a) | | Principal
Amount | | | Fair
Value | |
| Education (continued) | | | | | | | | | | | | | | |
| Sierra Vista Industrial Development Authority-American Leadership Academy Inc AZ†(e) | | 5.00% | | 6/15/2064 | | NR | | $ | 1,080,000 | | | $ | 1,084,183 | |
| Sierra Vista Industrial Development Authority-American Leadership Academy Inc AZ† | | 5.75% | | 6/15/2058 | | NR | | | 19,000,000 | | | | 20,006,210 | |
| Washington State Housing Finance Commission-Seattle Academy of Arts & Sciences† | | 6.25% | | 7/1/2059 | | BBB | | | 2,250,000 | | | | 2,496,752 | |
| Washington State Housing Finance Commission-Seattle Academy of Arts & Sciences† | | 6.375% | | 7/1/2063 | | BBB | | | 2,000,000 | | | | 2,222,138 | |
| Total | | | | | | | | | | | | | 297,273,338 | |
| | | | | | | | | | | | | | | |
| Energy 0.08% | | | | | | | | | | | | | | |
| PEFA, Inc. IA | | 5.00% | #(b) | 9/1/2049 | | A3 | | | 3,180,000 | | | | 3,271,179 | |
| | | | | | | | | | | | | | | |
| General Obligation 10.10% | | | | | | | | | | | | | | |
| American Samoa Economic Development Authority | | 6.625% | | 9/1/2035 | | Ba3 | | | 2,275,000 | | | | 2,328,277 | |
| American Samoa Economic Development Authority† | | 7.125% | | 9/1/2038 | | Ba3 | | | 7,020,000 | | | | 7,631,273 | |
| Black Belt Energy Gas District AL | | 5.25% | #(b) | 2/1/2053 | | A1 | | | 17,500,000 | | | | 18,777,656 | |
| California Community Choice Financing Authority | | 5.25% | #(b) | 1/1/2054 | | Baa1 | | | 20,500,000 | | | | 22,160,197 | |
| Chicago Board of Education IL GO | | 4.00% | | 12/1/2041 | | BB+ | | | 11,150,000 | | | | 10,476,702 | |
| Chicago Board of Education IL GO | | 5.00% | | 12/1/2029 | | BB+ | | | 5,000,000 | | | | 5,226,986 | |
| Chicago Board of Education IL GO | | 5.00% | | 12/1/2030 | | BB+ | | | 5,170,000 | | | | 5,377,409 | |
| Chicago Board of Education IL GO | | 5.00% | | 12/1/2031 | | BB+ | | | 2,500,000 | | | | 2,598,833 | |
| Chicago Board of Education IL GO | | 5.00% | | 12/1/2033 | | BB+ | | | 1,500,000 | | | | 1,554,394 | |
| Chicago Board of Education IL GO | | 5.00% | | 12/1/2034 | | BB+ | | | 9,515,000 | | | | 10,032,779 | |
| Chicago Board of Education IL GO | | 5.875% | | 12/1/2047 | | BB+ | | | 6,750,000 | | | | 7,467,534 | |
| Chicago Board of Education IL GO | | 6.00% | | 12/1/2049 | | BB+ | | | 4,875,000 | | | | 5,422,683 | |
| Chicago Board of Education IL GO | | 6.50% | | 12/1/2046 | | BB+ | | | 5,000,000 | | | | 5,204,560 | |
| Chicago Board of Education IL GO† | | 6.75% | | 12/1/2030 | | BB+ | | | 2,000,000 | | | | 2,193,961 | |
| Chicago Board of Education IL GO | | 7.00% | | 12/1/2044 | | BB+ | | | 3,840,000 | | | | 3,946,015 | |
| Chicago Board of Education IL GO† | | 7.00% | | 12/1/2046 | | BB+ | | | 6,560,000 | | | | 7,098,825 | |
| City of Chicago IL GO | | 5.00% | | 1/1/2044 | | BBB+ | | | 4,060,000 | | | | 4,279,419 | |
| City of Chicago IL GO | | 5.00% | | 1/1/2045 | | BBB+ | | | 8,800,000 | | | | 9,249,098 | |
| City of Chicago IL GO | | 5.25% | | 1/1/2045 | | BBB+ | | | 8,425,000 | | | | 9,029,798 | |
| 110 | See Notes to Financial Statements. |
Schedule of Investments (continued)
HIGH INCOME MUNICIPAL BOND FUND September 30, 2024
| Investments | | Interest
Rate | | Maturity
Date | | Credit
Rating:
S&P or
Moody’s(a) | | Principal
Amount | | | Fair
Value | |
| General Obligation (continued) | | | | | | | | | | | | | | |
| City of Chicago IL GO | | 5.50% | | 1/1/2030 | | BBB+ | | $ | 3,435,000 | | | $ | 3,446,931 | |
| City of Chicago IL GO | | 5.50% | | 1/1/2033 | | BBB+ | | | 3,305,000 | | | | 3,316,202 | |
| City of Chicago IL GO | | 5.50% | | 1/1/2037 | | BBB+ | | | 1,000,000 | | | | 1,002,822 | |
| City of Chicago IL GO | | 5.50% | | 1/1/2039 | | BBB+ | | | 2,125,000 | | | | 2,348,167 | |
| City of Chicago IL GO | | 5.50% | | 1/1/2049 | | BBB+ | | | 9,090,000 | | | | 9,492,176 | |
| City of Chicago IL GO | | 6.00% | | 1/1/2038 | | BBB+ | | | 18,085,000 | | | | 18,909,030 | |
| City of New Haven CT GO | | 5.50% | | 8/1/2037 | | A- | | | 1,280,000 | | | | 1,368,262 | |
| Commonwealth of Puerto Rico GO | | Zero Coupon | #(b) | 11/1/2043 | | NR | | | 11,703,676 | | | | 7,548,871 | |
| Commonwealth of Puerto Rico GO | | 4.00% | | 7/1/2041 | | NR | | | 19,134,000 | | | | 18,512,514 | |
| Commonwealth of Puerto Rico GO | | 4.00% | | 7/1/2046 | | NR | | | 47,163,156 | | | | 44,565,216 | |
| County of Pasco-State of Florida Cigarette Tax Revenue (AGM) | | 5.75% | | 9/1/2054 | | AA | | | 2,000,000 | | | | 2,265,766 | |
| Grant County Public Hospital District No. 1 WA GO | | 5.125% | | 12/1/2052 | | Baa2 | | | 4,750,000 | | | | 4,869,527 | |
| Grapevine Wash Local District-Grapevine Wash Local District Residential Facilities Fee Revenue UT GO† | | 6.00% | | 3/1/2055 | | NR | | | 14,000,000 | | | | 14,055,643 | |
| Idaho Falls Auditorium District COPS† | | 5.25% | | 5/15/2051 | | NR | | | 12,420,000 | | | | 12,557,850 | |
| Main Street Natural Gas, Inc. GA | | 5.00% | #(b) | 6/1/2053 | | A3 | | | 4,000,000 | | | | 4,273,084 | |
| Metropolitan Government Nashville & Davidson County Sports Authority TN (AGM) | | 5.25% | | 7/1/2048 | | AA | | | 2,000,000 | | | | 2,216,981 | |
| Metropolitan Government Nashville & Davidson County Sports Authority TN (AGM) | | 5.25% | | 7/1/2048 | | AA | | | 3,975,000 | | | | 4,399,726 | |
| Metropolitan Government Nashville & Davidson County Sports Authority TN (AGM) | | 5.25% | | 7/1/2053 | | AA | | | 4,000,000 | | | | 4,398,504 | |
| Metropolitan Government Nashville & Davidson County Sports Authority TN (AGM) | | 5.25% | | 7/1/2053 | | AA | | | 3,000,000 | | | | 3,294,000 | |
| New Jersey Transportation Trust Fund Authority-State of New Jersey | | 5.25% | | 6/15/2041 | | A2 | | | 1,500,000 | | | | 1,712,639 | |
| New Jersey Transportation Trust Fund Authority-State of New Jersey | | 5.25% | | 6/15/2042 | | A2 | | | 1,000,000 | | | | 1,136,857 | |
| New York State Urban Development Corp.-State of New York Sales Tax Revenue | | 3.00% | | 3/15/2049 | | Aa1 | | | 10,000,000 | | | | 8,193,666 | |
| Pajaro Valley Health Care District CA GO | | 5.00% | | 9/1/2054 | | Ba2 | | | 7,250,000 | | | | 7,702,005 | |
| Pennsylvania Economic Development Financing Authority-Commonwealth of Pennsylvania Department of Transportation AMT | | 6.00% | | 6/30/2061 | | Baa2 | | | 23,480,000 | | | | 26,554,981 | |
| Puerto Rico Public Finance Corp. | | Zero Coupon | | 8/1/2031 | | NR | | | 12,250,000 | | | | 122 | (g) |
| State of Illinois GO | | 5.00% | | 12/1/2048 | | A- | | | 7,190,000 | | | | 7,730,007 | |
| | See Notes to Financial Statements. | 111 |
Schedule of Investments (continued)
HIGH INCOME MUNICIPAL BOND FUND September 30, 2024
| Investments | | Interest
Rate | | Maturity
Date | | Credit
Rating:
S&P or
Moody’s(a) | | Principal
Amount | | | Fair
Value | |
| General Obligation (continued) | | | | | | | | | | | | | | |
| State of Illinois GO | | 5.25% | | 5/1/2045 | | A- | | $ | 2,500,000 | | | $ | 2,766,414 | |
| State of Illinois GO | | 5.25% | | 5/1/2047 | | A- | | | 1,500,000 | | | | 1,652,442 | |
| State of Illinois GO | | 5.25% | | 5/1/2048 | | A- | | | 1,500,000 | | | | 1,648,853 | |
| State of Illinois GO | | 5.25% | | 5/1/2049 | | A- | | | 1,750,000 | | | | 1,919,460 | |
| State of Illinois GO | | 5.50% | | 5/1/2039 | | A- | | | 8,280,000 | | | | 9,106,455 | |
| State of Illinois GO | | 5.50% | | 10/1/2039 | | A- | | | 4,000,000 | | | | 4,542,092 | |
| State of Illinois GO | | 5.50% | | 3/1/2042 | | A- | | | 5,250,000 | | | | 5,863,290 | |
| State of Illinois GO | | 5.50% | | 3/1/2047 | | A- | | | 15,270,000 | | | | 16,819,028 | |
| State of Illinois GO | | 5.50% | | 5/1/2047 | | A- | | | 6,000,000 | | | | 6,618,752 | |
| University City Industrial Development Authority MO | | 4.875% | | 6/15/2036 | | NR | | | 1,120,000 | | | | 1,154,377 | |
| University City Industrial Development Authority MO | | 5.50% | | 6/15/2042 | | NR | | | 6,000,000 | | | | 6,170,700 | |
| Total | | | | | | | | | | | | | 414,189,811 | |
| | | | | | | | | | | | | | | |
| Health Care 19.93% | | | | | | | | | | | | | | |
| Antelope Valley Healthcare District Obligated Group CA | | 5.00% | | 3/1/2041 | | BBB | | | 4,000,000 | | | | 4,003,087 | |
| Antelope Valley Healthcare District Obligated Group CA | | 5.00% | | 3/1/2046 | | BBB | | | 3,300,000 | | | | 3,276,342 | |
| Antelope Valley Healthcare District Obligated Group CA | | 5.25% | | 3/1/2036 | | BBB | | | 1,000,000 | | | | 1,005,686 | |
| Astoria Hospital Facilities Authority-Columbia Lutheran Charities Obligated Group OR | | 5.25% | | 8/1/2049 | | BBB | | | 5,195,000 | | | | 5,608,236 | |
| Astoria Hospital Facilities Authority-Columbia Lutheran Charities Obligated Group OR | | 5.25% | | 8/1/2054 | | BBB | | | 8,350,000 | | | | 8,958,356 | |
| Atlanta Development Authority-Georgia ProtonCare Center Inc(d) | | 6.00% | | 1/1/2023 | | NR | | | 2,000,000 | | | | 900,000 | |
| Atlanta Development Authority-Georgia ProtonCare Center Inc(d) | | 6.75% | | 1/1/2035 | | NR | | | 1,500,000 | | | | 675,000 | |
| Atlanta Development Authority-Georgia ProtonCare Center Inc(d) | | 7.00% | | 1/1/2040 | | NR | | | 4,000,000 | | | | 1,800,000 | |
| Berks County Municipal Authority-Tower Health Obligated Group PA | | Zero Coupon | | 6/30/2044 | | NR | | | 23,200,000 | | | | 14,791,373 | |
| Berks County Municipal Authority-Tower Health Obligated Group PA | | 5.00% | | 6/30/2039 | | NR | | | 43,616,000 | | | | 43,237,867 | |
| Berks County Municipal Authority-Tower Health Obligated Group PA | | 6.00% | | 6/30/2034 | | NR | | | 3,097,087 | | | | 3,367,537 | |
| | | | | | | | | | | | | | | |
| 112 | See Notes to Financial Statements. |
Schedule of Investments (continued)
HIGH INCOME MUNICIPAL BOND FUND September 30, 2024
| Investments | | Interest
Rate | | Maturity
Date | | Credit
Rating:
S&P or
Moody’s(a) | | Principal
Amount | | | Fair
Value | |
| Health Care (continued) | | | | | | | | | | | | | | |
| Berks County Municipal Authority-Tower Health Obligated Group PA | | 6.00% | | 6/30/2034 | | NR | | $ | 156,745 | | | $ | 170,433 | |
| Berks County Municipal Authority-Tower Health Obligated Group PA | | 8.00% | | 6/30/2034 | | NR | | | 6,180,243 | | | | 6,325,790 | |
| Berks County Municipal Authority-Tower Health Obligated Group PA | | 8.00% | | 6/30/2034 | | NR | | | 313,491 | | | | 313,490 | |
| Board of Managers Joint Guadalupe County-City of Seguin Hospital TX | | 5.00% | | 12/1/2040 | | BB | | | 4,880,000 | | | | 4,751,918 | |
| Board of Managers Joint Guadalupe County-City of Seguin Hospital TX | | 5.00% | | 12/1/2045 | | BB | | | 910,000 | | | | 865,774 | |
| Bucks County Industrial Development Authority-Grand View Hospital/Sellersville Obligated Group PA | | 4.00% | | 7/1/2046 | | BB- | | | 20,000,000 | | | | 17,353,524 | |
| Buffalo & Erie County Industrial Land Development Corp.-Catholic Health System Obligated Group NY | | 5.00% | | 7/1/2040 | | B- | | | 11,020,000 | | | | 10,959,775 | |
| California Municipal Finance Authority-Community Hospitals of Central California Obligated Group | | 3.00% | | 2/1/2046 | | A3 | | | 5,000,000 | | | | 3,982,233 | |
| California Public Finance Authority-Kendal At Ventura† | | 10.00% | | 5/15/2028 | | NR | | | 6,500,000 | | | | 7,681,196 | |
| California Public Finance Authority-Kendal At Ventura† | | 12.00% | | 5/15/2028 | | NR | | | 1,000,000 | | | | 1,243,157 | |
| California Statewide Communities Development Authority-Loma Linda University Medical Center Obligated Group† | | 5.25% | | 12/1/2048 | | BB | | | 3,080,000 | | | | 3,179,746 | |
| California Statewide Communities Development Authority-Loma Linda University Medical Obligated Group† | | 5.00% | | 12/1/2041 | | BB | | | 1,700,000 | | | | 1,724,865 | |
| California Statewide Communities Development Authority-Loma Linda University Medical Obligated Group† | | 5.00% | | 12/1/2046 | | BB | | | 6,000,000 | | | | 6,070,855 | |
| California Statewide Communities Development Authority-Loma Linda University Medical Obligated Group | | 5.25% | | 12/1/2044 | | BB | | | 12,840,000 | | | | 12,840,520 | |
| California Statewide Communities Development Authority-Loma Linda University Medical Obligated Group† | | 5.25% | | 12/1/2056 | | BB | | | 29,545,000 | | | | 29,921,844 | |
| California Statewide Communities Development Authority-Loma Linda University Medical Obligated Group | | 5.50% | | 12/1/2054 | | BB | | | 13,255,000 | | | | 13,270,345 | |
| | | |
| | See Notes to Financial Statements. | 113 |
Schedule of Investments (continued)
HIGH INCOME MUNICIPAL BOND FUND September 30, 2024
| Investments | | Interest
Rate | | Maturity
Date | | Credit
Rating:
S&P or
Moody’s(a) | | Principal
Amount | | | Fair
Value | |
| Health Care (continued) | | | | | | | | | | | | | | |
| California Statewide Communities Development Authority-Loma Linda University Medical Obligated Group† | | 5.50% | | 12/1/2058 | | BB | | $ | 17,750,000 | | | $ | 18,395,140 | |
| California Statewide Communities Development Authority-Verity Health System of California Inc Obligated Group(d) | | 5.50% | | 7/1/2039 | | NR | | | 26,376 | | | | 24,793 | |
| California Statewide Communities Development Authority-Verity Health System of California Inc Obligated Group(d) | | 5.75% | | 7/1/2024 | | NR | | | 6,458 | | | | 6,071 | |
| California Statewide Communities Development Authority-Verity Health System of California Inc Obligated Group(d) | | 5.75% | | 7/1/2035 | | NR | | | 12,917 | | | | 12,142 | |
| Capital Trust Authority-Convivial St Petersburg LLC FL†(e) | | 12.00% | | 10/3/2029 | | NR | | | 6,000,000 | | | | 6,000,078 | |
| Chester County Health & Education Facilities Authority-Immaculata University PA | | 5.00% | | 11/1/2037 | | BB- | (c) | | 4,000,000 | | | | 3,597,090 | |
| Chester County Health & Education Facilities Authority-Immaculata University PA | | 5.00% | | 11/1/2046 | | BB- | (c) | | 4,100,000 | | | | 3,384,019 | |
| City of Blaine-Crest View Obligated Group MN | | 6.125% | | 7/1/2050 | | NR | | | 5,000,000 | | | | 2,750,000 | |
| City of Colby KS-Citizens Medical Center Inc | | 5.50% | | 7/1/2026 | | NR | | | 7,400,000 | | | | 7,462,181 | |
| City of Fruita Healthcare Revenue-Lower Valley Hospital Association Obligated Group CO† | | 5.375% | | 1/1/2033 | | NR | | | 3,400,000 | | | | 3,449,609 | |
| City of Fruita Healthcare Revenue-Lower Valley Hospital Association Obligated Group CO† | | 5.50% | | 1/1/2048 | | NR | | | 16,350,000 | | | | 16,523,297 | |
| City of Minneapolis-Fairview Health Services Obligated Group MN | | 5.00% | | 11/15/2049 | | BBB+ | | | 5,000,000 | | | | 5,070,362 | |
| City of Wichita-Presbyterian Manors Obligated Group KS(e) | | 5.25% | | 5/15/2039 | | NR | | | 1,500,000 | | | | 1,505,541 | |
| City of Wichita-Presbyterian Manors Obligated Group KS(e) | | 5.75% | | 5/15/2045 | | NR | | | 2,000,000 | | | | 2,017,472 | |
| City of Wichita-Presbyterian Manors Obligated Group KS(e) | | 5.875% | | 5/15/2050 | | NR | | | 2,000,000 | | | | 2,006,437 | |
| County of Cuyahoga-MetroHealth System OH | | 5.50% | | 2/15/2057 | | BBB | | | 4,900,000 | | | | 5,006,205 | |
| County of Howard-Columbia Vantage House Corp MD | | 5.00% | | 4/1/2044 | | NR | | | 1,955,000 | | | | 1,884,242 | |
| | |
| 114 | See Notes to Financial Statements. |
Schedule of Investments (continued)
HIGH INCOME MUNICIPAL BOND FUND September 30, 2024
| Investments | | Interest
Rate | | Maturity
Date | | Credit
Rating:
S&P or
Moody’s(a) | | Principal
Amount | | | Fair
Value | |
| Health Care (continued) | | | | | | | | | | | | | | |
| County of Howard-Columbia Vantage House Corp MD | | 5.00% | | 4/1/2046 | | NR | | $ | 7,000,000 | | | $ | 6,663,478 | |
| County of Muskingum-Genesis Healthcare Obligated Group OH | | 5.00% | | 2/15/2033 | | BB+ | | | 2,765,000 | | | | 2,765,564 | |
| County of Muskingum-Genesis Healthcare Obligated Group OH | | 5.00% | | 2/15/2044 | | BB+ | | | 20,000,000 | | | | 19,999,700 | |
| County of Washington-Marietta Area Health Care Inc Obligated Group OH | | 6.75% | | 12/1/2052 | | NR | | | 15,100,000 | | | | 16,775,901 | |
| County of Wilson-Wilson County Hospital KS | | 5.60% | | 9/1/2036 | | NR | | | 3,530,000 | | | | 3,043,905 | |
| Crawford County Hospital Authority-Meadville Medical Center Obligated Group PA | | 6.00% | | 6/1/2046 | | NR | | | 2,225,000 | | | | 2,251,645 | |
| Crawford County Hospital Authority-Meadville Medical Center Obligated Group PA | | 6.00% | | 6/1/2051 | | NR | | | 2,600,000 | | | | 2,621,849 | |
| Denver Health & Hospital Authority CO | | 5.25% | | 12/1/2045 | | BBB | | | 3,700,000 | | | | 3,702,262 | |
| Doylestown Hospital Authority-Doylestown Hospital Obligated Group PA† | | 5.375% | | 7/1/2039 | | NR | | | 2,000,000 | | | | 2,193,275 | |
| Duluth Economic Development Authority-Essentia Health Obligated Group MN | | 5.25% | | 2/15/2058 | | A- | | | 12,000,000 | | | | 12,348,568 | |
| Duluth Economic Development Authority-St Luke’s Hospital of Duluth Obligated MN | | 5.25% | | 6/15/2052 | | AA- | | | 5,500,000 | | | | 6,005,671 | |
| Glendale Industrial Development Authority-Beatitudes Campus Obligated Group AZ | | 5.00% | | 11/15/2036 | | NR | | | 1,500,000 | | | | 1,434,183 | |
| Glendale Industrial Development Authority-Beatitudes Campus Obligated Group AZ | | 5.00% | | 11/15/2040 | | NR | | | 3,000,000 | | | | 2,759,467 | |
| Grays Harbor County Public Hospital District No. 1 WA | | 6.875% | | 12/1/2049 | | BB+ | | | 7,500,000 | | | | 8,535,277 | |
| Grays Harbor County Public Hospital District No. 1 WA | | 6.875% | | 12/1/2053 | | BB+ | | | 8,000,000 | | | | 9,089,770 | |
| Harris County Cultural Education Facilities Finance Corp.-Brazos Presbyterian Homes Obligated Group TX | | 5.125% | | 1/1/2048 | | BB+ | (c) | | 1,655,000 | | | | 1,655,376 | |
| Holmes County Hospital Corp. FL(d) | | 5.75% | | 11/1/2026 | | NR | | | 3,280,000 | | | | 3,166,469 | |
| Holmes County Hospital Corp. FL | | 6.00% | | 11/1/2038 | | NR | | | 7,115,000 | | | | 6,514,912 | |
| Idaho Health Facilities Authority-North Canyon Medical Center Inc | | 7.00% | | 11/1/2048 | | NR | | | 8,000,000 | | | | 8,504,870 | |
| Idaho Health Facilities Authority-North Canyon Medical Center Inc | | 7.125% | | 11/1/2057 | | NR | | | 7,000,000 | | | | 7,362,927 | |
| | | |
| | See Notes to Financial Statements. | 115 |
Schedule of Investments (continued)
HIGH INCOME MUNICIPAL BOND FUND September 30, 2024
| Investments | | Interest
Rate | | Maturity
Date | | Credit
Rating:
S&P or
Moody’s(a) | | Principal
Amount | | | Fair
Value | |
| Health Care (continued) | | | | | | | | | | | | | | |
| Industrial Development Authority of the County of Pima-La Posada at Park Centre Inc Obligated Group AZ† | | 6.875% | | 11/15/2052 | | NR | | $ | 4,000,000 | | | $ | 4,378,442 | |
| Industrial Development Authority of the County of Pima-La Posada at Park Centre Inc Obligated Group AZ† | | 7.00% | | 11/15/2057 | | NR | | | 5,500,000 | | | | 6,032,582 | |
| Jefferson County Public Hospital District No. 2 WA | | 6.875% | | 12/1/2053 | | NR | | | 10,000,000 | | | | 10,232,033 | |
| Kentucky Economic Development Finance Authority-Masonic Homes of Kentucky Inc Obligated Group | | 5.375% | | 11/15/2032 | | NR | | | 1,100,000 | | | | 1,054,863 | |
| King County Public Hospital District No. 4 WA | | 6.25% | | 12/1/2045 | | NR | | | 4,000,000 | | | | 4,014,398 | |
| Kremmling Memorial Hospital District CO† | | 6.375% | | 12/1/2049 | | NR | | | 4,495,000 | | | | 4,447,428 | |
| Kremmling Memorial Hospital District CO† | | 6.625% | | 12/1/2056 | | NR | | | 6,125,000 | | | | 6,069,104 | |
| Louisiana Local Government Environmental Facilities & Community Development Authority-St James Place of Baton Rouge Obligated Group | | 6.25% | | 11/15/2045 | | NR | | | 6,100,000 | | | | 6,121,690 | |
| Magnolia West Community Development District FL | | 5.35% | | 5/1/2037 | | NR | | | 190,000 | | | | 191,373 | |
| Massachusetts Development Finance Agency-Ascentria Care Alliance Obligated Group† | | 5.00% | | 7/1/2041 | | NR | | | 3,500,000 | | | | 3,287,865 | |
| Massachusetts Development Finance Agency-Ascentria Care Alliance Obligated Group† | | 5.00% | | 7/1/2051 | | NR | | | 5,625,000 | | | | 4,927,100 | |
| Massachusetts Development Finance Agency-Tufts Medicine Obligated Group | | 4.00% | | 7/1/2044 | | BBB- | | | 10,420,000 | | | | 9,492,994 | |
| Massachusetts Development Finance Agency-Tufts Medicine Obligated Group | | 8.50% | | 10/1/2026 | | BBB- | | | 8,905,000 | | | | 9,100,099 | |
| Michigan Finance Authority Provident Group-HFH Energy LLC | | 5.50% | | 2/28/2049 | | A3 | | | 1,100,000 | | | | 1,255,059 | |
| Michigan Finance Authority Provident Group-HFH Energy LLC | | 5.50% | | 2/28/2057 | | A3 | | | 1,375,000 | | | | 1,547,568 | |
| Monroe County Hospital Authority-Centurion Foundation Lehigh Valley LLC PA† | | 5.10% | | 6/15/2039 | | NR | | | 20,000,000 | | | | 20,384,222 | |
| Moon Industrial Development Authority-Baptist Homes Society Obligated Group PA | | 6.00% | | 7/1/2045 | | NR | | | 9,250,000 | | | | 6,601,176 | |
| New Hampshire Business Finance Authority-Ascentria Care Alliance Obligated Group† | | 5.00% | | 7/1/2041 | | NR | | | 1,885,000 | | | | 1,770,750 | |
| | |
| 116 | See Notes to Financial Statements. |
Schedule of Investments (continued)
HIGH INCOME MUNICIPAL BOND FUND September 30, 2024
| Investments | | Interest
Rate | | Maturity
Date | | Credit
Rating:
S&P or
Moody’s(a) | | Principal
Amount | | | Fair
Value | |
| Health Care (continued) | | | | | | | | | | | | | | |
| New Hampshire Business Finance Authority-Ascentria Care Alliance Obligated Group† | | 5.00% | | 7/1/2051 | | NR | | $ | 3,225,000 | | | $ | 2,824,871 | |
| New Hampshire Business Finance Authority-NFA UH SPV LLC† | | 5.625% | | 12/15/2033 | | NR | | | 4,420,000 | | | | 4,562,001 | |
| New Hampshire Business Finance Authority-NFA UH SPV LLC† | | 6.25% | | 12/15/2038 | | NR | | | 5,000,000 | | | | 5,253,085 | |
| New Jersey Economic Development Authority-Bancroft Neurohealth Obligated Group | | 5.00% | | 6/1/2036 | | NR | | | 1,500,000 | | | | 1,508,231 | |
| New Jersey Health Care Facilities Financing Authority-RWJ Barnabas Health Obligated Group | | 3.00% | | 7/1/2051 | | AA- | | | 3,690,000 | | | | 3,067,409 | |
| New York State Dormitory Authority-Catholic Health System Obligated Group | | 4.00% | | 7/1/2045 | | B- | | | 5,500,000 | | | | 4,699,087 | |
| Niagara Area Development Corp.-Catholic Health System Obligated Group NY | | 4.50% | | 7/1/2052 | | B- | | | 3,240,000 | | | | 2,908,557 | |
| Niagara Area Development Corp.-Catholic Health System Obligated Group NY | | 5.00% | | 7/1/2052 | | B- | | | 8,545,000 | | | | 8,294,739 | |
| Oklahoma Development Finance Authority-OU Medicine Obligated Group | | 5.00% | | 8/15/2038 | | BB | | | 6,015,000 | | | | 6,212,845 | |
| Oklahoma Development Finance Authority-OU Medicine Obligated Group | | 5.25% | | 8/15/2048 | | BB | | | 16,795,000 | | | | 17,252,563 | |
| Oklahoma Development Finance Authority-OU Medicine Obligated Group | | 5.45% | | 8/15/2028 | | BB | | | 3,000,000 | | | | 2,914,519 | |
| Oklahoma Development Finance Authority-OU Medicine Obligated Group | | 5.50% | | 8/15/2044 | | NR | | | 1,000,000 | | | | 1,041,682 | |
| Oklahoma Development Finance Authority-OU Medicine Obligated Group | | 5.50% | | 8/15/2052 | | BB | | | 15,000,000 | | | | 15,531,172 | |
| Oklahoma Development Finance Authority-OU Medicine Obligated Group | | 5.50% | | 8/15/2057 | | BB | | | 23,690,000 | | | | 24,467,951 | |
| Onondaga Civic Development Corp.-Crouse Health Hospital Inc Obligated Group NY | | 5.375% | | 8/1/2054 | | BB | (c) | | 4,000,000 | | | | 4,151,790 | |
| Philadelphia Authority for Industrial Development-Greater Philadelphia Health Action Inc PA | | 6.50% | | 6/1/2045 | | NR | | | 2,485,000 | | | | 2,495,153 | |
| Philadelphia Authority for Industrial Development-Greater Philadelphia Health Action Inc PA | | 6.625% | | 6/1/2050 | | NR | | | 3,415,000 | | | | 3,430,147 | |
| | | |
| | See Notes to Financial Statements. | 117 |
Schedule of Investments (continued)
HIGH INCOME MUNICIPAL BOND FUND September 30, 2024
| Investments | | Interest
Rate | | Maturity
Date | | Credit
Rating:
S&P or
Moody’s(a) | | Principal
Amount | | | Fair
Value | |
| Health Care (continued) | | | | | | | | | | | | | | |
| Public Finance Authority-Bancroft Neurohealth Obligated Group† | | 4.625% | | 6/1/2036 | | NR | | $ | 4,380,000 | | | $ | 4,391,935 | |
| Public Finance Authority-Bancroft Neurohealth Obligated Group† | | 5.125% | | 6/1/2048 | | NR | | | 7,165,000 | | | | 7,175,245 | |
| Public Finance Authority-Lehigh Valley Health Network Inc WI† | | 7.25% | | 12/1/2042 | | NR | | | 8,750,000 | | | | 8,997,991 | |
| Public Finance Authority-Lehigh Valley Health Network Inc WI† | | 7.50% | | 12/1/2052 | | NR | | | 8,650,000 | | | | 8,974,173 | |
| Public Finance Authority-Proton International Alabama LLC WI†(d) | | 6.85% | | 10/1/2047 | | NR | | | 3,000,000 | | | | 300,000 | |
| Public Finance Authority-Proton Intl-Delray LLC WI†(d) | | 6.85% | | 11/1/2046 | | NR | | | 2,000,000 | | | | 1,100,000 | |
| Public Finance Authority-QCF Behavioral Hospitals I Obligated Group WI† | | 7.50% | | 7/1/2059 | | NR | | | 13,400,000 | | | | 14,988,085 | |
| Public Finance Authority-RBS Evolution LLC WI† | | 10.00% | | 11/1/2038 | | NR | | | 13,100,000 | | | | 14,926,424 | |
| Rhode Island Health & Educational Building Corp.-Care New England Health System Obligated Group | | 5.00% | | 9/1/2036 | | B+ | | | 7,000,000 | | | | 7,043,765 | |
| Rhode Island Health & Educational Building Corp.-Lifespan Obligated Group | | 5.25% | | 5/15/2049 | | BBB+ | | | 1,825,000 | | | | 1,984,386 | |
| Rhode Island Health & Educational Building Corp.-Lifespan Obligated Group | | 5.25% | | 5/15/2054 | | BBB+ | | | 4,500,000 | | | | 4,865,621 | |
| Roanoke County Economic Development Authority-Friendship Foundation | | 5.50% | #(b) | 9/1/2058 | | NR | | | 9,340,000 | | | | 9,350,467 | |
| Shelby County Health Educational & Housing Facilities Board-Luke Inc Obligated Group TN | | 5.75% | | 10/1/2059 | | NR | | | 10,000,000 | | | | 6,923,164 | |
| Skagit County Public Hospital District No. 1 WA | | 5.50% | | 12/1/2054 | | Baa3 | | | 5,680,000 | | | | 6,136,314 | |
| South Carolina Jobs-Economic Development Authority-Hampton Regional Medical Center Obligated Group | | 5.00% | | 11/1/2042 | | NR | | | 3,815,000 | | | | 3,591,106 | |
| South Carolina Jobs-Economic Development Authority-Hampton Regional Medical Center Obligated Group | | 5.00% | | 11/1/2046 | | NR | | | 6,070,000 | | | | 5,607,912 | |
| South Carolina Jobs-Economic Development Authority-Kiawah Life Plan Village Inc | | 5.75% | | 11/15/2029 | | NR | | | 3,500,000 | | | | 3,486,355 | |
| South Carolina Jobs-Economic Development Authority-Kiawah Life Plan Village Inc | | 7.50% | | 11/15/2053 | | NR | | | 9,000,000 | | | | 9,478,248 | |
| | | | | | | | | | | | | | | |
| 118 | See Notes to Financial Statements. |
Schedule of Investments (continued)
HIGH INCOME MUNICIPAL BOND FUND September 30, 2024
| Investments | | Interest
Rate | | Maturity
Date | | Credit
Rating:
S&P or
Moody’s(a) | | Principal
Amount | | | Fair
Value | |
| Health Care (continued) | | | | | | | | | | | | | | |
| South Carolina Jobs-Economic Development Authority-Kiawah Life Plan Village Inc | | 7.75% | | 11/15/2058 | | NR | | $ | 17,600,000 | | | $ | 18,586,082 | |
| Southeastern Ohio Port Authority-Marietta Area Healthcare Inc Obligated Group | | 5.50% | | 12/1/2043 | | B+ | (c) | | 5,025,000 | | | | 5,024,324 | |
| Tarrant County Cultural Education Facilities Finance Corp TX(f) | | 5.00% | | 7/1/2053 | | A1 | | | 9,550,000 | | | | 10,142,777 | |
| Upper San Juan Health Service District Medical Center Revenue CO | | 6.00% | | 6/1/2041 | | NR | | | 2,225,000 | | | | 2,231,069 | |
| Upper San Juan Health Service District Medical Center Revenue CO | | 6.125% | | 6/1/2046 | | NR | | | 3,015,000 | | | | 3,019,888 | |
| West Virginia Hospital Finance Authority-Vandalia Health Inc Obligated Group | | 6.00% | | 9/1/2048 | | BBB+ | | | 2,060,000 | | | | 2,373,991 | |
| West Virginia Hospital Finance Authority-Vandalia Health Inc Obligated Group | | 6.00% | | 9/1/2053 | | BBB+ | | | 3,250,000 | | | | 3,716,892 | |
| Westchester County Health Care Corp Obligated Group NY | | 6.25% | | 11/1/2052 | | BBB- | | | 1,280,000 | | | | 1,471,002 | |
| Westchester County Health Care Corp Obligated Group NY (AGM) | | 5.00% | | 11/1/2047 | | AA | | | 3,325,000 | | | | 3,597,243 | |
| Westchester County Health Care Corp Obligated Group NY (AGM) | | 5.75% | | 11/1/2053 | | AA | | | 2,250,000 | | | | 2,556,007 | |
| Wisconsin Health & Educational Facilities Authority-Marshfield Clinic Health System Obligated Group | | 5.50% | | 2/15/2054 | | BBB | | | 9,750,000 | | | | 10,744,199 | |
| Wisconsin Health & Educational Facilities Authority-Marshfield Clinic Health System Obligated Group (BAM) | | 5.25% | | 2/15/2054 | | AA | | | 1,250,000 | | | | 1,360,511 | |
| Wisconsin Health & Educational Facilities Authority-Sauk-Prairie Memorial Hospital Inc Obligated Group | | 5.375% | | 2/1/2048 | | Ba2 | | | 4,000,000 | | | | 4,000,022 | |
| Wisconsin Health & Educational Facilities Authority-Wisconsin Masonic Home Obligated Group | | 5.75% | | 8/15/2059 | | BBB- | (c) | | 2,380,000 | | | | 2,593,104 | |
| Total | | | | | | | | | | | | | 817,031,547 | |
| | | | | | | | | | | | | | | |
| Housing 4.80% | | | | | | | | | | | | | | |
| California Community Housing Agency Arbors Apartments† | | 5.00% | | 8/1/2050 | | NR | | | 10,630,000 | | | | 10,568,221 | |
| California Community Housing Agency Summit at Sausalito Apartments† | | 3.00% | | 2/1/2057 | | NR | | | 14,310,000 | | | | 10,592,299 | |
| | | |
| | See Notes to Financial Statements. | 119 |
Schedule of Investments (continued)
HIGH INCOME MUNICIPAL BOND FUND September 30, 2024
| Investments | | Interest
Rate | | Maturity
Date | | Credit
Rating:
S&P or
Moody’s(a) | | Principal
Amount | | | Fair
Value | |
| Housing (continued) | | | | | | | | | | | | | | |
| California Community Housing Agency Summit at Sausalito Apartments† | | 4.00% | | 2/1/2050 | | NR | | $ | 20,000,000 | | | $ | 16,017,062 | |
| Capital Projects Finance Authority-Provident Group-Continuum Properties LLC FL | | 5.00% | | 11/1/2038 | | Baa3 | | | 1,000,000 | | | | 1,050,800 | |
| Capital Projects Finance Authority-Provident Group-Continuum Properties LLC FL | | 5.00% | | 11/1/2040 | | Baa3 | | | 1,000,000 | | | | 1,037,505 | |
| Capital Projects Finance Authority-Provident Group-Continuum Properties LLC FL | | 5.00% | | 11/1/2048 | | Baa3 | | | 1,350,000 | | | | 1,375,177 | |
| Capital Projects Finance Authority-Provident Group-Continuum Properties LLC FL | | 5.00% | | 11/1/2053 | | Baa3 | | | 1,770,000 | | | | 1,795,383 | |
| Capital Projects Finance Authority-Provident Group-Continuum Properties LLC FL | | 5.00% | | 11/1/2058 | | Baa3 | | | 1,750,000 | | | | 1,766,017 | |
| CMFA Special Finance Agency CA† | | 4.00% | | 12/1/2045 | | NR | | | 9,650,000 | | | | 8,106,332 | |
| CSCDA Community Improvement Authority Dublin CA† | | 4.00% | | 2/1/2057 | | NR | | | 4,500,000 | | | | 3,570,194 | |
| CSCDA Community Improvement Authority Jefferson Platinum Triangle Apartments CA† | | 3.125% | | 8/1/2056 | | NR | | | 14,500,000 | | | | 11,464,381 | |
| CSCDA Community Improvement Authority Orange Portfolio CA† | | 3.00% | | 3/1/2057 | | NR | | | 7,000,000 | | | | 5,227,592 | |
| CSCDA Community Improvement Authority Orange Portfolio CA† | | 4.00% | | 3/1/2057 | | NR | | | 3,500,000 | | | | 2,758,232 | |
| CSCDA Community Improvement Authority Pasadena Portfolio CA† | | 4.00% | | 12/1/2056 | | NR | | | 13,250,000 | | | | 10,315,986 | |
| CSCDA Community Improvement Authority Westgate Apartments CA† | | 3.00% | | 6/1/2047 | | NR | | | 16,640,000 | | | | 12,174,613 | |
| CSCDA Community Improvement Authority Westgate Apartments CA† | | 4.00% | | 6/1/2057 | | NR | | | 25,980,000 | | | | 9,107,505 | |
| Indiana Finance Authority-CHF-Tippecanoe LLC | | 5.00% | | 6/1/2053 | | BBB- | | | 3,285,000 | | | | 3,424,893 | |
| Indiana Finance Authority-CHF-Tippecanoe LLC | | 5.375% | | 6/1/2064 | | BBB- | | | 5,450,000 | | | | 5,747,333 | |
| Indiana Finance Authority-SFP-PUFW I LLC | | 5.00% | | 7/1/2054 | | BBB- | | | 1,445,000 | | | | 1,502,168 | |
| Indiana Finance Authority-SFP-PUFW I LLC | | 5.00% | | 7/1/2059 | | BBB- | | | 1,400,000 | | | | 1,442,003 | |
| | |
| 120 | See Notes to Financial Statements. |
Schedule of Investments (continued)
HIGH INCOME MUNICIPAL BOND FUND September 30, 2024
| Investments | | Interest
Rate | | Maturity
Date | | Credit
Rating:
S&P or
Moody’s(a) | | Principal
Amount | | | Fair
Value | |
| Housing (continued) | | | | | | | | | | | | | | |
| Indiana Finance Authority-SFP-PUFW I LLC | | 5.25% | | 7/1/2064 | | BBB- | | $ | 3,975,000 | | | $ | 4,155,680 | |
| Iowa Finance Authority-Lifespace Communities Inc Obligated Group IA | | 7.50% | | 5/15/2053 | | BBB | (c) | | 5,750,000 | | | | 6,571,089 | |
| Knox County Health Educational & Housing Facility Board-Provident Group-UTK Properties LLC TN (BAM) | | 5.25% | | 7/1/2049 | | AA | | | 2,500,000 | | | | 2,711,399 | |
| Knox County Health Educational & Housing Facility Board TN (BAM) | | 5.125% | | 7/1/2059 | | AA | | | 1,100,000 | | | | 1,164,412 | |
| Knox County Health Educational & Housing Facility Board TN (BAM) | | 5.25% | | 7/1/2064 | | AA | | | 2,300,000 | | | | 2,450,268 | |
| Maryland Economic Development Corp. | | 5.75% | | 7/1/2053 | | BBB- | | | 2,000,000 | | | | 2,204,125 | |
| Maryland Economic Development Corp. | | 6.00% | | 7/1/2058 | | BBB- | | | 5,000,000 | | | | 5,585,008 | |
| Maryland Economic Development Corp.-University of Maryland College Park (AGM) | | 5.00% | | 7/1/2054 | | AA | | | 5,000,000 | | | | 5,315,165 | |
| Maryland Economic Development Corp.-University of Maryland College Park (AGM) | | 5.125% | | 7/1/2059 | | AA | | | 3,000,000 | | | | 3,213,831 | |
| Maryland Economic Development Corp.-University of Maryland College Park (AGM) | | 5.25% | | 7/1/2064 | | AA | | | 5,000,000 | | | | 5,383,818 | |
| Massachusetts Development Finance Agency-CHF Merrimack Inc MA† | | 5.00% | | 7/1/2054 | | BB | | | 1,200,000 | | | | 1,241,103 | |
| Massachusetts Development Finance Agency-CHF Merrimack Inc MA† | | 5.00% | | 7/1/2060 | | BB | | | 1,100,000 | | | | 1,128,960 | |
| Palm Beach County School District-Lifespace Communities Inc Obligated Group FL | | 7.50% | | 5/15/2053 | | BBB | (c) | | 1,000,000 | | | | 1,142,798 | |
| Palm Beach County School District-Lifespace Communities Inc Obligated Group FL | | 7.625% | | 5/15/2058 | | BBB | (c) | | 2,000,000 | | | | 2,291,319 | |
| Public Finance Authority-CHF-Manoa LLC WI† | | 5.75% | | 7/1/2053 | | BBB- | | | 5,040,000 | | | | 5,524,449 | |
| Public Finance Authority-CHF-Manoa LLC WI† | | 5.75% | | 7/1/2063 | | BBB- | | | 9,870,000 | | | | 10,743,409 | |
| Virginia Beach Development Authority-Westminster-Canterbury on Chesapeake Bay Obligated Group | | 7.00% | | 9/1/2053 | | BB+ | (c) | | 8,000,000 | | | | 9,322,458 | |
| Washington State Housing Finance Commission-Provident Group-SH I Properties LLC | | 5.00% | | 7/1/2054 | | BBB- | | | 2,000,000 | | | | 2,099,292 | |
| | | |
| | See Notes to Financial Statements. | 121 |
Schedule of Investments (continued)
HIGH INCOME MUNICIPAL BOND FUND September 30, 2024
| Investments | | Interest
Rate | | Maturity
Date | | Credit
Rating:
S&P or
Moody’s(a) | | Principal
Amount | | | Fair
Value | |
| Housing (continued) | | | | | | | | | | | | | | |
| Washington State Housing Finance Commission-Provident Group-SH I Properties LLC | | 5.50% | | 7/1/2044 | | BBB- | | $ | 1,350,000 | | | $ | 1,502,322 | |
| Washington State Housing Finance Commission-Provident Group-SH I Properties LLC | | 5.50% | | 7/1/2049 | | BBB- | | | 1,000,000 | | | | 1,097,733 | |
| Washington State Housing Finance Commission-Provident Group-SH I Properties LLC | | 5.50% | | 7/1/2059 | | BBB- | | | 2,500,000 | | | | 2,721,421 | |
| Total | | | | | | | | | | | | | 196,613,755 | |
| |
| Lease Obligations 0.48% | | | | | | | | | | | | | | |
| Kansas City Industrial Development Authority-City of Kansas City MO Historic Northeast Redevelopment Area MO† | | 5.00% | | 6/1/2046 | | NR | | | 2,790,000 | | | | 2,838,543 | |
| Kansas City Industrial Development Authority-City of Kansas City MO Historic Northeast Redevelopment Area MO† | | 5.00% | | 6/1/2054 | | NR | | | 1,525,000 | | | | 1,536,919 | |
| New Jersey Economic Development Authority-NYNJ Link Borrower LLC AMT | | 5.375% | | 1/1/2043 | | A- | | | 1,175,000 | | | | 1,176,113 | |
| New Jersey Economic Development Authority-NYNJ Link Borrower LLC AMT | | 5.625% | | 1/1/2052 | | A- | | | 6,500,000 | | | | 6,506,373 | |
| New Jersey Economic Development Authority-State Capitol Joint Management Commission | | 5.00% | | 6/15/2043 | | A2 | | | 3,800,000 | | | | 3,978,927 | |
| New Jersey Transportation Trust Fund Authority | | 5.00% | | 12/15/2035 | | A2 | | | 3,250,000 | | | | 3,480,349 | |
| Total | | | | | | | | | | | | | 19,517,224 | |
| |
| Miscellaneous 0.32% | | | | | | | | | | | | | | |
| Black Desert Public Infrastructure District Black Desert Assessment Area No 1 UT† | | 5.625% | | 12/1/2053 | | NR | | | 12,435,000 | | | | 12,991,361 | |
| |
| Other Revenue 5.26% | | | | | | | | | | | | | | |
| Allentown Neighborhood Improvement Zone Development Authority PA† | | 6.00% | | 5/1/2042 | | NR | | | 3,500,000 | | | | 3,721,790 | |
| Anson Education Facilities Corp.-Arlington Classics Academy TX | | 5.00% | | 8/15/2045 | | BBB- | | | 2,250,000 | | | | 2,265,164 | |
| Arizona Industrial Development Authority-American Charter Schools Foundation† | | 6.00% | | 7/1/2047 | | BB+ | | | 2,460,000 | | | | 2,529,248 | |
| | |
| 122 | See Notes to Financial Statements. |
Schedule of Investments (continued)
HIGH INCOME MUNICIPAL BOND FUND September 30, 2024
| Investments | | Interest
Rate | | Maturity
Date | | Credit
Rating:
S&P or
Moody’s(a) | | Principal
Amount | | | Fair
Value | |
| Other Revenue (continued) | | | | | | | | | | | | | | |
| Arizona Industrial Development Authority-Odyssey Preparatory Academy Inc† | | 5.50% | | 7/1/2052 | | BB- | | $ | 2,850,000 | | | $ | 2,869,221 | |
| Arlington Higher Education Finance Corp.-Newman International Academy TX | | 5.50% | | 8/15/2046 | | NR | | | 5,000,000 | | | | 4,943,244 | |
| California School Finance Authority-Kipp SoCal Public Schools Obligated† | | 5.125% | | 7/1/2044 | | BBB | | | 2,390,000 | | | | 2,391,383 | |
| Capital Trust Agency, Inc.-Educational Growth Fund FL† | | 5.00% | | 7/1/2056 | | NR | | | 18,350,000 | | | | 18,204,180 | |
| Capital Trust Agency, Inc.-Franklin Academy Series 2020 Obligated Group FL† | | 5.00% | | 12/15/2050 | | NR | | | 10,000,000 | | | | 9,428,429 | |
| Chester County Industrial Development Authority-Collegium Charter School PA | | 5.25% | | 10/15/2047 | | BB | | | 3,000,000 | | | | 3,011,227 | |
| Cleveland-Cuyahoga County Port Authority-Playhouse Square Foundation OH | | 5.25% | | 12/1/2038 | | BB+ | | | 1,400,000 | | | | 1,449,617 | |
| Cleveland-Cuyahoga County Port Authority-Playhouse Square Foundation OH | | 5.50% | | 12/1/2043 | | BB+ | | | 3,350,000 | | | | 3,454,713 | |
| Cleveland-Cuyahoga County Port Authority-Playhouse Square Foundation OH | | 5.50% | | 12/1/2053 | | BB+ | | | 11,485,000 | | | | 11,706,377 | |
| Clifton Higher Education Finance Corp.-International Leadership of Texas Inc | | 6.125% | | 8/15/2048 | | Baa3 | | | 22,025,000 | | | | 22,408,814 | |
| Commonwealth of Puerto Rico | | Zero Coupon | #(b) | 11/1/2051 | | NR | | | 796,127 | | | | 257,746 | |
| Commonwealth of Puerto Rico GO | | Zero Coupon | #(b) | 11/1/2051 | | NR | | | 25,593,914 | | | | 16,764,014 | |
| County of Broward FL Convention Center Hotel Revenue(f) | | 5.50% | | 1/1/2055 | | AA | | | 17,000,000 | | | | 18,960,741 | |
| Fayette County Development Authority-United States Soccer Federation Inc GA | | 5.25% | | 10/1/2049 | | BBB | (c) | | 2,000,000 | | | | 2,195,788 | |
| Fayette County Development Authority-United States Soccer Federation Inc GA | | 5.25% | | 10/1/2054 | | BBB | (c) | | 3,250,000 | | | | 3,536,426 | |
| Florida Development Finance Corp.-Franklin Academy Series 2016 Obligated Group† | | 5.00% | | 7/15/2046 | | NR | | | 4,000,000 | | | | 3,968,231 | |
| Florida Development Finance Corp.-Palm Bay Academy Inc† | | Zero Coupon | | 5/15/2037 | | NR | | | 940,000 | | | | 9 | |
| Florida Development Finance Corp.-Palm Bay Academy Inc† | | 6.375% | | 5/15/2037 | | NR | | | 2,620,000 | | | | 2,377,908 | |
| Florida Development Finance Corp.-Palm Bay Academy Inc† | | 6.375% | | 5/15/2037 | | NR | | | 1,220,000 | | | | 244,000 | |
| Florida Development Finance Corp.-Renaissance Charter School Inc Series 2015 Obligated Group† | | 6.125% | | 6/15/2046 | | NR | | | 5,000,000 | | | | 5,035,475 | |
| | | |
| | See Notes to Financial Statements. | 123 |
Schedule of Investments (continued)
HIGH INCOME MUNICIPAL BOND FUND September 30, 2024
| Investments | | Interest
Rate | | Maturity
Date | | Credit
Rating:
S&P or
Moody’s(a) | | Principal
Amount | | | Fair
Value | |
| Other Revenue (continued) | | | | | | | | | | | | | | |
| Florida Development Finance Corp.-Renaissance Charter School Inc Series 2020C/D Obligated Group† | | 5.00% | | 9/15/2050 | | NR | | $ | 3,505,000 | | | $ | 3,273,360 | |
| GDB Debt Recovery Authority of Puerto Rico | | 7.50% | | 8/20/2040 | | NR | | | 393,456 | | | | 374,767 | |
| Industrial Development Authority of the City of Phoenix Arizona-BASIS Schools Inc Obligated Group AZ† | | 5.00% | | 7/1/2046 | | BB | | | 5,130,000 | | | | 5,138,342 | |
| Industrial Development Authority of the County of Pima-Edkey Inc Obligated Group† | | 5.00% | | 7/1/2049 | | NR | | | 6,000,000 | | | | 5,808,654 | |
| Industrial Development Authority of the County of Pima-Edkey Inc Obligated Group† | | 5.00% | | 7/1/2055 | | NR | | | 4,000,000 | | | | 3,829,856 | |
| Jefferson Parish Economic Development & Port District-Kenner Discovery Health Science Foundation Inc LA† | | 5.50% | | 6/15/2038 | | NR | | | 3,200,000 | | | | 3,266,260 | |
| Jefferson Parish Economic Development & Port District-Kenner Discovery Health Science Foundation Inc LA† | | 5.625% | | 6/15/2048 | | NR | | | 4,350,000 | | | | 4,403,901 | |
| Maricopa County Industrial Development Authority-Paragon Management Inc AZ† | | 5.00% | | 7/1/2047 | | BB+ | | | 4,000,000 | | | | 4,018,292 | |
| Maryland Economic Development Corp.(d) | | 5.00% | | 12/1/2031 | | NR | | | 10,700,000 | | | | 6,941,625 | |
| Maryland Economic Development Corp.(d) | | 5.25% | | 12/1/2031 | | NR | | | 3,000,000 | | | | 1,946,250 | |
| Michigan Finance Authority-Bradford Academy | | 4.30% | | 9/1/2030 | | NR | | | 755,000 | | | | 713,017 | |
| Michigan Finance Authority-Bradford Academy | | 4.80% | | 9/1/2040 | | NR | | | 1,845,000 | | | | 1,630,293 | |
| Michigan Finance Authority-Bradford Academy | | 5.00% | | 9/1/2050 | | NR | | | 3,010,000 | | | | 2,553,804 | |
| Michigan Public Educational Facilities Authority-Crescent Academy | | 7.00% | | 10/1/2036 | | NR | | | 572,500 | | | | 573,058 | |
| New Jersey Economic Development Authority-New Jersey Transit Corp | | 5.00% | | 11/1/2052 | | A2 | | | 12,010,000 | | | | 12,938,033 | |
| Plymouth Educational Center Charter School MI | | 5.375% | | 11/1/2030 | | NR | | | 1,425,000 | | | | 712,500 | |
| Utah Charter School Finance Authority-Freedom Academy Foundation† | | 5.375% | | 6/15/2048 | | NR | | | 5,150,000 | | | | 5,024,881 | |
| Washington State Convention Center Public Facilities District | | 3.00% | | 7/1/2043 | | BBB- | | | 4,375,000 | | | | 3,544,299 | |
| | |
| 124 | See Notes to Financial Statements. |
Schedule of Investments (continued)
HIGH INCOME MUNICIPAL BOND FUND September 30, 2024
| Investments | | Interest
Rate | | Maturity
Date | | Credit
Rating:
S&P or
Moody’s(a) | | Principal
Amount | | | Fair
Value | |
| Other Revenue (continued) | | | | | | | | | | | | | | |
| Washington State Convention Center Public Facilities District | | 3.00% | | 7/1/2058 | | BBB- | | $ | 2,400,000 | | | $ | 1,677,270 | |
| Washington State Convention Center Public Facilities District | | 4.00% | | 7/1/2058 | | BBB- | | | 6,000,000 | | | | 5,391,821 | |
| Total | | | | | | | | | | | | | 215,484,028 | |
| |
| Special Tax 3.34% | | | | | | | | | | | | | | |
| Allentown Neighborhood Improvement Zone Development Authority PA† | | 5.00% | | 5/1/2032 | | Ba3 | | | 2,425,000 | | | | 2,477,450 | |
| Allentown Neighborhood Improvement Zone Development Authority PA† | | 5.25% | | 5/1/2042 | | NR | | | 3,115,000 | | | | 3,166,836 | |
| Allentown Neighborhood Improvement Zone Development Authority PA† | | 5.25% | | 5/1/2042 | | NR | | | 2,500,000 | | | | 2,588,791 | |
| Allentown Neighborhood Improvement Zone Development Authority PA† | | 6.00% | | 5/1/2042 | | NR | | | 11,000,000 | | | | 11,728,688 | |
| Anne Arundel County Consolidated Special Taxing District MD | | 5.125% | | 7/1/2036 | | NR | | | 1,030,000 | | | | 1,030,463 | |
| Anne Arundel County Consolidated Special Taxing District MD | | 5.25% | | 7/1/2044 | | NR | | | 2,150,000 | | | | 2,150,592 | |
| Arborwood Community Development District FL | | 6.90% | | 5/1/2036 | | NR | | | 580,000 | | | | 580,449 | |
| Arborwood Community Development District FL | | 6.90% | | 5/1/2036 | | NR | | | 25,000 | | | | 25,015 | |
| Babcock Ranch Community Independent Special District FL | | 5.00% | | 5/1/2053 | | NR | | | 4,000,000 | | | | 4,047,652 | |
| Celebration Pointe Community Development District No. 1 FL | | 3.375% | | 5/1/2041 | | NR | | | 3,970,000 | | | | 3,426,665 | |
| Celebration Pointe Community Development District No. 1 FL | | 5.00% | | 5/1/2048 | | NR | | | 6,555,000 | | | | 6,590,970 | |
| Grandview Industrial Development Authority MO Tax Allocation(d) | | 5.75% | | 12/1/2028 | | NR | | | 1,000,000 | | | | 400,000 | |
| Industrial Development Authority of the City of St. Louis Missouri | | 4.375% | | 11/15/2035 | | NR | | | 3,520,000 | | | | 3,261,816 | |
| Industrial Development Authority of the City of St. Louis Missouri | | 4.75% | | 11/15/2047 | | NR | | | 9,820,000 | | | | 8,523,813 | |
| Inland Valley Development Agency CA Tax Allocation | | 5.25% | | 9/1/2037 | | A+ | | | 3,375,000 | | | | 3,400,719 | |
| Lakewood Ranch Stewardship District FL | | 6.30% | | 5/1/2054 | | NR | | | 4,455,000 | | | | 4,765,298 | |
| Maryland Stadium Authority Built to Learn Revenue | | 4.00% | | 6/1/2052 | | AA | | | 7,000,000 | | | | 6,848,400 | |
| | | |
| | See Notes to Financial Statements. | 125 |
Schedule of Investments (continued)
HIGH INCOME MUNICIPAL BOND FUND September 30, 2024
| Investments | | Interest
Rate | | Maturity
Date | | Credit
Rating:
S&P or
Moody’s(a) | | Principal
Amount | | | Fair
Value | |
| Special Tax (continued) | | | | | | | | | | | | | | |
| Miami World Center Community Development District FL | | 5.25% | | 11/1/2049 | | NR | | $ | 4,500,000 | | | $ | 4,602,483 | |
| Mida Mountain Village Public Infrastructure District-Mountain Village Assessment Area No 2 UT† | | 4.00% | | 8/1/2050 | | NR | | | 8,500,000 | | | | 7,475,720 | |
| Mida Mountain Village Public Infrastructure District UT† | | 4.25% | | 8/1/2035 | | NR | | | 3,290,000 | | | | 3,265,516 | |
| Mida Mountain Village Public Infrastructure District UT† | | 5.00% | | 8/1/2050 | | NR | | | 3,500,000 | | | | 3,510,705 | |
| Military Installation Development Authority UT | | 4.00% | | 6/1/2052 | | NR | | | 10,000,000 | | | | 8,706,057 | |
| Peninsula Town Center Community Development Authority VA† | | 5.00% | | 9/1/2037 | | NR | | | 875,000 | | | | 882,702 | |
| Peninsula Town Center Community Development Authority VA† | | 5.00% | | 9/1/2045 | | NR | | | 6,350,000 | | | | 6,361,038 | |
| Prince George’s County Revenue Authority-County of Prince George’s MD Suitland-Naylor Road Development District† | | 5.00% | | 7/1/2046 | | NR | | | 5,000,000 | | | | 5,023,340 | |
| River Islands Public Financing Authority CA Special Tax (AGM) | | 5.25% | | 9/1/2052 | | AA | | | 2,500,000 | | | | 2,745,919 | |
| Rocky Mountain Rail Park Metropolitan District CO GO† | | 5.00% | | 12/1/2041 | | NR | | | 2,000,000 | | | | 1,760,098 | |
| Rocky Mountain Rail Park Metropolitan District CO GO† | | 5.00% | | 12/1/2051 | | NR | | | 6,520,000 | | | | 5,609,191 | |
| Scranton Redevelopment Authority PA GTD | | 5.00% | | 11/15/2028 | | BBB+ | | | 3,720,000 | | | | 3,722,153 | |
| Stone Canyon Community Improvement District MO(d) | | 5.70% | | 4/1/2022 | | NR | | | 1,485,000 | | | | 415,800 | |
| Tern Bay Community Development District FL | | 5.375% | | 5/1/2037 | | NR | | | 330,000 | | | | 330,308 | |
| Town of Bridgeville-Heritage Shores Special Development District DE† | | 5.25% | | 7/1/2044 | | NR | | | 1,675,000 | | | | 1,772,917 | |
| Town of Bridgeville-Heritage Shores Special Development District DE† | | 5.625% | | 7/1/2053 | | NR | | | 3,070,000 | | | | 3,270,937 | |
| Village Metropolitan District CO GO | | 5.00% | | 12/1/2040 | | NR | | | 2,000,000 | | | | 2,027,356 | |
| Village Metropolitan District CO GO | | 5.00% | | 12/1/2049 | | NR | | | 4,085,000 | | | | 4,128,645 | |
| Westview South Community Development District FL | | 5.375% | | 5/1/2043 | | NR | | | 1,685,000 | | | | 1,741,692 | |
| Westview South Community Development District FL | | 5.375% | | 5/1/2043 | | NR | | | 1,000,000 | | | | 1,033,622 | |
| 126 | See Notes to Financial Statements. |
Schedule of Investments (continued)
HIGH INCOME MUNICIPAL BOND FUND September 30, 2024
| Investments | | Interest
Rate | | Maturity
Date | | Credit
Rating:
S&P or
Moody’s(a) | | Principal
Amount | | | Fair
Value | |
| Special Tax (continued) | | | | | | | | | | | | | | |
| Westview South Community Development District FL | | 5.60% | | 5/1/2053 | | NR | | $ | 2,525,000 | | | $ | 2,610,935 | |
| Westview South Community Development District FL | | 5.625% | | 5/1/2053 | | NR | | | 1,000,000 | | | | 1,039,604 | |
| Total | | | | | | | | | | | | | 137,050,355 | |
| | | | | | | | | | | | | | | |
| Tax Revenue 3.54% | | | | | | | | | | | | | | |
| American Samoa Economic Development Authority† | | 6.50% | | 9/1/2028 | | Ba3 | | | 2,285,000 | | | | 2,414,931 | |
| Chicago Trans Authority Sales Tax Receipts Fund IL | | 5.00% | | 12/1/2046 | | A+ | | | 6,000,000 | | | | 6,095,080 | |
| City of Reno-County of Washoe NV Sales Tax Revenue NV† | | Zero Coupon | | 7/1/2058 | | NR | | | 18,500,000 | | | | 2,006,730 | |
| City of Sparks NV† | | 2.75% | | 6/15/2028 | | Baa2 | | | 455,000 | | | | 445,395 | |
| County of Monongalia-Monongalia County Building Commission Development District No 4 WV Tax Allocation† | | 5.00% | | 6/1/2033 | | NR | | | 460,000 | | | | 486,684 | |
| County of Monongalia-Monongalia County Building Commission Development District No 4 WV Tax Allocation† | | 5.75% | | 6/1/2043 | | NR | | | 1,000,000 | | | | 1,088,596 | |
| County of Monongalia-Monongalia County Building Commission Development District No 4 WV Tax Allocation† | | 6.00% | | 6/1/2053 | | NR | | | 1,750,000 | | | | 1,904,337 | |
| Metropolitan Pier & Exposition Authority IL (NATL) | | Zero Coupon | | 12/15/2037 | | A | | | 10,000,000 | | | | 6,097,300 | |
| New York Liberty Development Corp. TCRS (BAM) | | 3.00% | | 2/15/2042 | | AA | | | 4,000,000 | | | | 3,514,020 | |
| New York State Dormitory Authority | | 3.00% | | 3/15/2049 | | Aa1 | | | 2,480,000 | | | | 2,032,665 | |
| New York State Urban Development Corp.-State of New York Personal Income Tax Revenue | | 3.00% | | 3/15/2047 | | AA+ | | | 3,740,000 | | | | 3,184,212 | |
| Public Finance Authority-Southeast Overtown Park West Community Redevelopment Agency WI† | | 5.00% | | 6/1/2041 | | NR | | | 4,500,000 | | | | 4,624,616 | |
| Puerto Rico Sales Tax Financing Corp. Sales Tax Revenue | | Zero Coupon | | 7/1/2033 | | NR | | | 3,965,000 | | | | 2,812,607 | |
| Puerto Rico Sales Tax Financing Corp. Sales Tax Revenue | | 4.329% | | 7/1/2040 | | NR | | | 15,225,000 | | | | 15,217,493 | |
| Puerto Rico Sales Tax Financing Corp. Sales Tax Revenue | | 4.329% | | 7/1/2040 | | NR | | | 124,000 | | | | 123,939 | |
| Puerto Rico Sales Tax Financing Corp. Sales Tax Revenue | | 4.75% | | 7/1/2053 | | NR | | | 39,699,000 | | | | 39,821,197 | |
| | See Notes to Financial Statements. | 127 |
Schedule of Investments (continued)
HIGH INCOME MUNICIPAL BOND FUND September 30, 2024
| Investments | | Interest
Rate | | Maturity
Date | | Credit
Rating:
S&P or
Moody’s(a) | | Principal
Amount | | | Fair
Value | |
| Tax Revenue (continued) | | | | | | | | | | | | | | |
| Puerto Rico Sales Tax Financing Corp. Sales Tax Revenue | | 5.00% | | 7/1/2058 | | NR | | $ | 44,960,000 | | | $ | 45,425,547 | |
| River Islands Public Financing Authority Community Facs District No 2023-1 Area 2 CA | | 5.00% | | 9/1/2054 | | NR | | | 2,500,000 | | | | 2,572,090 | |
| Washington State Convention Center Public Facilities District | | 3.00% | | 7/1/2048 | | BBB- | | | 6,710,000 | | | | 5,100,373 | |
| Total | | | | | | | | | | | | | 144,967,812 | |
| | | | | | | | | | | | | | | |
| Taxable Revenue-Water & Sewer 0.55% | | | | | | | | | | | | | | |
| City of Chicago IL Waterworks Revenue(f) | | 5.50% | | 11/1/2062 | | AA | | | 20,290,000 | | | | 22,525,882 | |
| | | | | | | | | | | | | | | |
| Tobacco 6.57% | | | | | | | | | | | | | | |
| Buckeye Tobacco Settlement Financing Authority OH | | 5.00% | | 6/1/2055 | | NR | | | 93,805,000 | | | | 88,406,081 | |
| California Statewide Financing Authority | | Zero Coupon | | 6/1/2046 | | NR | | | 26,325,000 | | | | 6,939,133 | |
| California Statewide Financing Authority† | | Zero Coupon | | 6/1/2055 | | NR | | | 42,500,000 | | | | 2,382,440 | |
| District of Columbia Tobacco Settlement Financing Corp. | | Zero Coupon | | 6/15/2046 | | NR | | | 4,780,000 | | | | 1,051,345 | |
| District of Columbia Tobacco Settlement Financing Corp. | | Zero Coupon | | 6/15/2055 | | NR | | | 21,000,000 | | | | 2,255,425 | |
| District of Columbia Tobacco Settlement Financing Corp. | | Zero Coupon | | 6/15/2055 | | NR | | | 100,000,000 | | | | 9,712,310 | |
| Erie Tobacco Asset Securitization Corp. NY† | | Zero Coupon | | 6/1/2060 | | NR | | | 30,000,000 | | | | 1,510,872 | |
| Golden State Tobacco Securitization Corp. CA | | Zero Coupon | | 6/1/2066 | | NR | | | 209,000,000 | | | | 24,967,391 | |
| Inland Empire Tobacco Securitization Corp.-Inland Empire Tobacco Securitization Corp CA | | Zero Coupon | | 6/1/2036 | | CCC | | | 19,000,000 | | | | 8,809,280 | |
| Inland Empire Tobacco Securitization Corp. CA† | | Zero Coupon | | 6/1/2057 | | CCC | | | 47,000,000 | | | | 3,670,371 | |
| Michigan Tobacco Settlement Finance Authority | | Zero Coupon | | 6/1/2058 | | NR | | | 93,300,000 | | | | 2,933,081 | |
| Monroe Tobacco Asset Securitization Corp. NY† | | Zero Coupon | | 6/1/2061 | | NR | | | 22,900,000 | | | | 1,175,368 | |
| Nassau County Tobacco Settlement Corp. NY | | Zero Coupon | | 6/1/2060 | | NR | | | 50,000,000 | | | | 3,429,035 | |
| Nassau County Tobacco Settlement Corp. NY | | 5.00% | | 6/1/2035 | | CCC+ | | | 3,170,000 | | | | 2,993,244 | |
| 128 | See Notes to Financial Statements. |
Schedule of Investments (continued)
HIGH INCOME MUNICIPAL BOND FUND September 30, 2024
| Investments | | Interest
Rate | | Maturity
Date | | Credit
Rating:
S&P or
Moody’s(a) | | Principal
Amount | | | Fair
Value | |
| Tobacco (continued) | | | | | | | | | | | | | | |
| Nassau County Tobacco Settlement Corp. NY | | 5.25% | | 6/1/2026 | | CCC+ | | $ | 3,218,190 | | | $ | 3,157,285 | |
| Rockland Tobacco Asset Securitization Corp. NY† | | Zero Coupon | | 8/15/2060 | | NR | | | 41,035,000 | | | | 2,801,722 | |
| Silicon Valley Tobacco Securitization Authority CA | | Zero Coupon | | 6/1/2036 | | NR | | | 10,000,000 | | | | 5,301,901 | |
| Silicon Valley Tobacco Securitization Authority CA | | Zero Coupon | | 6/1/2056 | | NR | | | 20,000,000 | | | | 2,053,304 | |
| Tobacco Securitization Authority of Southern California-San Diego County Tobacco Asset Securitization Corp | | Zero Coupon | | 6/1/2046 | | CCC- | | | 15,000,000 | | | | 3,158,597 | |
| Tobacco Settlement Financing Corp. RI | | Zero Coupon | | 6/1/2052 | | CCC- | | | 25,885,000 | | | | 4,779,714 | |
| Tobacco Settlement Financing Corp. VA | | Zero Coupon | | 6/1/2047 | | CCC- | | | 9,500,000 | | | | 2,616,970 | |
| Tobacco Settlement Financing Corp. VA | | Zero Coupon | | 6/1/2047 | | CCC- | | | 110,695,000 | | | | 31,172,664 | |
| Tobacco Settlement Financing Corp. VA | | 5.00% | | 6/1/2047 | | B- | | | 34,360,000 | | | | 33,448,800 | |
| TSASC, Inc. NY | | 5.00% | | 6/1/2045 | | CCC+ | | | 9,670,000 | | | | 8,783,573 | |
| TSASC, Inc. NY | | 5.00% | | 6/1/2048 | | NR | | | 12,835,000 | | | | 11,599,038 | |
| Total | | | | | | | | | | | | | 269,108,944 | |
| | | | | | | | | | | | | | | |
| Transportation 10.35% | | | | | | | | | | | | | | |
| Burbank-Glendale-Pasadena Airport Authority Brick Campaign CA AMT | | 5.25% | | 7/1/2049 | | A | | | 3,875,000 | | | | 4,256,166 | |
| Burbank-Glendale-Pasadena Airport Authority Brick Campaign CA AMT | | 5.25% | | 7/1/2054 | | A | | | 2,875,000 | | | | 3,132,663 | |
| California Municipal Finance Authority-LAX Integrated Express Solutions LLC AMT | | 4.00% | | 12/31/2047 | | BB+ | (c) | | 5,475,000 | | | | 5,165,929 | |
| California Municipal Finance Authority-LAX Integrated Express Solutions LLC AMT | | 5.00% | | 12/31/2043 | | BB+ | (c) | | 13,445,000 | | | | 13,780,219 | |
| California Municipal Finance Authority-LAX Integrated Express Solutions LLC AMT | | 5.00% | | 12/31/2047 | | BB+ | (c) | | 2,750,000 | | | | 2,803,439 | |
| Chicago O’Hare International Airport IL AMT | | 5.50% | | 1/1/2059 | | A+ | | | 6,000,000 | | | | 6,644,001 | |
| City of Houston Airport System Revenue-United Airlines Inc TX AMT | | 5.00% | | 7/15/2027 | | BB- | (c) | | 5,400,000 | | | | 5,535,271 | |
| City of Houston Airport System Revenue-United Airlines Inc TX AMT | | 5.00% | | 7/15/2028 | | BB- | | | 3,500,000 | | | | 3,621,944 | |
| City of Los Angeles Department of Airports CA AMT | | 5.00% | | 5/15/2040 | | AA | | | 8,495,000 | | | | 8,544,117 | |
| City of Reno-County of Washoe NV Sales Tax Revenue NV† | | Zero Coupon | | 7/1/2058 | | NR | | | 23,000,000 | | | | 3,399,161 | |
| | See Notes to Financial Statements. | 129 |
Schedule of Investments (continued)
HIGH INCOME MUNICIPAL BOND FUND September 30, 2024
| Investments | | Interest
Rate | | Maturity
Date | | Credit
Rating:
S&P or
Moody’s(a) | | Principal
Amount | | | Fair
Value | |
| Transportation (continued) | | | | | | | | | | | | | | |
| City of Salt Lake City Airport Revenue UT AMT | | 5.50% | | 7/1/2053 | | A+ | | $ | 2,500,000 | | | $ | 2,769,967 | |
| E-470 Public Highway Authority CO (NATL) | | Zero Coupon | | 9/1/2031 | | A+ | | | 20,000,000 | | | | 15,859,440 | |
| Florida Development Finance Corp.-AAF Operations Holdings LLC AMT† | | 12.00% | #(b) | 7/15/2032 | | NR | | | 16,500,000 | | | | 17,601,032 | |
| Foothill-Eastern Transportation Corridor Agency CA | | 3.95% | | 1/15/2053 | | A | | | 5,500,000 | | | | 5,270,930 | |
| Greater Asheville Regional Airport Authority NC (AGM) AMT | | 5.25% | | 7/1/2048 | | AA | | | 1,250,000 | | | | 1,356,218 | |
| Greater Asheville Regional Airport Authority NC (AGM) AMT | | 5.25% | | 7/1/2053 | | AA | | | 2,000,000 | | | | 2,164,069 | |
| Greater Orlando Aviation Authority FL AMT | | 4.00% | | 10/1/2049 | | AA | | | 6,370,000 | | | | 6,203,102 | |
| Louisiana Public Facilities Authority-Calcasieu Bridge Partners LLC AMT | | 5.50% | | 9/1/2059 | | Baa3 | | | 4,000,000 | | | | 4,387,446 | |
| Louisiana Public Facilities Authority-Calcasieu Bridge Partners LLC AMT | | 5.75% | | 9/1/2064 | | Baa3 | | | 20,905,000 | | | | 23,267,980 | |
| Maryland Economic Development Corp.-City of Baltimore Port Covington Development District Tax Allocation | | 4.00% | | 9/1/2050 | | NR | | | 10,000,000 | | | | 8,865,870 | |
| Maryland Economic Development Corp.-CONSOL Marine Terminals LLC | | 5.75% | | 9/1/2025 | | BB | | | 9,000,000 | | | | 9,071,846 | |
| Maryland Economic Development Corp.-Purple Line Transit Partners LLC AMT | | 5.25% | | 6/30/2047 | | Baa3 | | | 2,500,000 | | | | 2,644,870 | |
| Maryland Economic Development Corp.-Purple Line Transit Partners LLC AMT | | 5.25% | | 6/30/2055 | | Baa3 | | | 12,610,000 | | | | 13,218,994 | |
| Metropolitan Nashville Airport Authority TN AMT | | 5.50% | | 7/1/2052 | | A1 | | | 9,400,000 | | | | 10,329,848 | |
| Metropolitan Transportation Authority NY(f) | | 4.75% | | 11/15/2045 | | A- | | | 14,710,000 | | | | 15,213,049 | |
| Metropolitan Transportation Authority NY | | 5.25% | | 11/15/2049 | | A- | | | 7,500,000 | | | | 8,254,925 | |
| Metropolitan Transportation Authority NY(f) | | 5.25% | | 11/15/2055 | | A- | | | 7,000,000 | | | | 7,408,982 | |
| Metropolitan Washington Airports Authority Aviation Revenue DC | | 5.50% | | 10/1/2054 | | AA- | | | 7,000,000 | | | | 7,762,789 | |
| New Jersey Transportation Trust Fund Authority | | 5.50% | | 6/15/2050 | | A2 | | | 2,000,000 | | | | 2,253,312 | |
| New York City Transitional Development Corp.-JFK NTO LLC NY AMT | | 5.375% | | 6/30/2060 | | Baa3 | | | 34,340,000 | | | | 35,899,572 | |
| 130 | See Notes to Financial Statements. |
Schedule of Investments (continued)
HIGH INCOME MUNICIPAL BOND FUND September 30, 2024
| Investments | | Interest
Rate | | Maturity
Date | | Credit
Rating:
S&P or
Moody’s(a) | | Principal
Amount | | | Fair
Value | |
| Transportation (continued) | | | | | | | | | | | | | | |
| New York City Transitional Development Corp.-JFK NTO LLC NY AMT | | 6.00% | | 6/30/2054 | | Baa3 | | $ | 16,500,000 | | | $ | 18,042,070 | |
| New York State Thruway Authority TCRS (BAM) | | 3.00% | | 1/1/2051 | | AA | | | 5,365,000 | | | | 4,357,522 | |
| New York Transportation Development Corp.-Delta Air Lines Inc AMT | | 5.00% | | 10/1/2040 | | Baa3 | | | 8,480,000 | | | | 8,803,708 | |
| New York Transportation Development Corp.-Delta Air Lines Inc AMT | | 5.625% | | 4/1/2040 | | Baa3 | | | 13,000,000 | | | | 14,138,215 | |
| New York Transportation Development Corp.-Delta Air Lines Inc AMT | | 6.00% | | 4/1/2035 | | Baa3 | | | 9,000,000 | | | | 10,184,927 | |
| New York Transportation Development Corp.-JFK NTO LLC | | 5.50% | | 6/30/2060 | | Baa3 | | | 34,685,000 | | | | 37,106,797 | |
| New York Transportation Development Corp.-Laguardia Gateway Partner AMT | | 4.00% | | 7/1/2041 | | Baa2 | | | 5,000,000 | | | | 4,856,993 | |
| New York Transportation Development Corp.-Laguardia Gateway Partner AMT | | 5.25% | | 1/1/2050 | | Baa2 | | | 8,730,000 | | | | 8,730,457 | |
| North Parkway Municipal Management District No. 1 TX† | | 4.75% | | 9/15/2041 | | NR | | | 2,930,000 | | | | 2,940,759 | |
| North Parkway Municipal Management District No. 1 TX† | | 5.00% | | 9/15/2051 | | NR | | | 4,875,000 | | | | 4,903,587 | |
| Pennsylvania Turnpike Commission Oil Franchise Tax Revenue | | 3.00% | | 12/1/2051 | | Aa3 | | | 5,375,000 | | | | 4,334,133 | |
| Port Authority of New York & New Jersey AMT | | 5.00% | | 11/15/2041 | | AA- | | | 10,500,000 | | | | 10,764,585 | |
| Port Authority of New York & New Jersey AMT | | 5.25% | | 8/1/2047 | | AA- | | | 5,000,000 | | | | 5,429,727 | |
| Port Authority of New York & New Jersey AMT | | 5.50% | | 8/1/2052 | | AA- | | | 3,500,000 | | | | 3,842,502 | |
| Port of Portland Airport Revenue OR AMT | | 5.50% | | 7/1/2048 | | AA- | | | 6,250,000 | | | | 6,953,401 | |
| Reno-Tahoe Airport Authority NV AMT | | 5.25% | | 7/1/2049 | | A | | | 2,100,000 | | | | 2,285,350 | |
| Reno-Tahoe Airport Authority NV AMT | | 5.25% | | 7/1/2054 | | A | | | 2,335,000 | | | | 2,520,901 | |
| San Diego County Regional Airport Authority CA AMT | | 5.00% | | 7/1/2056 | | A2 | | | 5,000,000 | | | | 5,261,635 | |
| Texas Private Activity Bond Surface Transportation Corp.-NTE Mobility Partners LLC AMT | | 5.50% | | 12/31/2058 | | Baa1 | | | 5,000,000 | | | | 5,500,269 | |
| Virginia Small Business Financing Authority-95 Express Lanes LLC AMT | | 4.00% | | 1/1/2048 | | BBB | | | 7,205,000 | | | | 6,743,503 | |
| Total | | | | | | | | | | | | | 424,388,192 | |
| | See Notes to Financial Statements. | 131 |
Schedule of Investments (continued)
HIGH INCOME MUNICIPAL BOND FUND September 30, 2024
| Investments | | Interest
Rate | | Maturity
Date | | Credit
Rating:
S&P or
Moody’s(a) | | Principal
Amount | | | Fair
Value | |
| Utilities 8.01% | | | | | | | | | | | | | | |
| Black Belt Energy Gas District AL | | 4.00% | #(b) | 12/1/2052 | | Baa1 | | $ | 9,915,000 | | | $ | 9,996,710 | |
| Black Belt Energy Gas District AL | | 5.25% | #(b) | 5/1/2055 | | A1 | | | 6,250,000 | | | | 6,891,032 | |
| Black Belt Energy Gas District AL | | 5.50% | #(b) | 6/1/2049 | | A2 | | | 9,450,000 | | | | 10,228,632 | |
| Black Belt Energy Gas District AL | | 5.50% | #(b) | 11/1/2053 | | A2 | | | 16,335,000 | | | | 17,605,979 | |
| California Community Choice Financing Authority | | 5.00% | #(b) | 5/1/2054 | | A1 | | | 15,000,000 | | | | 16,510,131 | |
| California Community Choice Financing Authority | | 5.00% | #(b) | 1/1/2055 | | A1 | | | 16,250,000 | | | | 17,852,247 | |
| California Community Choice Financing Authority(f) | | 5.25% | | 11/1/2054 | | A2 | | | 14,000,000 | | | | 15,210,873 | |
| City of Baltimore MD(f) | | 5.25% | | 7/1/2047 | | AA- | | | 7,195,000 | | | | 7,915,023 | |
| City of Baltimore MD(f) | | 5.25% | | 7/1/2052 | | AA- | | | 12,190,000 | | | | 13,409,886 | |
| City of Compton Water Revenue CA | | 6.00% | | 8/1/2039 | | NR | | | 3,710,000 | | | | 3,787,286 | |
| City of Osceola-Plum Point Energy Associates LLC AR AMT | | 5.50% | #(b) | 4/1/2036 | | NR | | | 16,450,000 | | | | 16,548,374 | |
| County of Jefferson Sewer Revenue AL | | 5.25% | | 10/1/2049 | | BBB+ | | | 11,125,000 | | | | 12,123,744 | |
| County of Jefferson Sewer Revenue AL | | 5.50% | | 10/1/2053 | | BBB+ | | | 11,750,000 | | | | 12,947,237 | |
| Energy Southeast A Cooperative District AL | | 5.25% | #(b) | 7/1/2054 | | A1 | | | 6,000,000 | | | | 6,646,454 | |
| Energy Southeast A Cooperative District AL | | 5.75% | #(b) | 4/1/2054 | | A1 | | | 7,500,000 | | | | 8,525,044 | |
| Florida Development Finance Corp.-Waste Pro USA Inc AMT† | | 5.25% | | 8/1/2029 | | NR | | | 7,000,000 | | | | 7,308,745 | |
| Kentucky Public Energy Authority | | 5.00% | #(b) | 5/1/2055 | | A2 | | | 2,250,000 | | | | 2,421,518 | |
| Main Street Natural Gas, Inc. GA | | 4.00% | #(b) | 5/1/2052 | | A3 | | | 2,115,000 | | | | 2,152,152 | |
| Main Street Natural Gas, Inc. GA† | | 4.00% | #(b) | 8/1/2052 | | BBB- | | | 15,000,000 | | | | 14,981,571 | |
| Main Street Natural Gas, Inc. GA | | 4.00% | #(b) | 9/1/2052 | | A3 | | | 2,165,000 | | | | 2,207,275 | |
| Main Street Natural Gas, Inc. GA | | 5.00% | #(b) | 12/1/2052 | | A3 | | | 9,000,000 | | | | 9,523,620 | |
| Main Street Natural Gas, Inc. GA | | 5.00% | #(b) | 12/1/2054 | | A3 | | | 4,250,000 | | | | 4,589,566 | |
| Municipal Electric Authority of Georgia(e) | | 5.25% | | 1/1/2049 | | A2 | | | 3,250,000 | | | | 3,598,220 | |
| Municipal Electric Authority of Georgia (BAM)(e) | | 5.25% | | 1/1/2054 | | AA | | | 5,000,000 | | | | 5,530,084 | |
| Patriots Energy Group Financing Agency SC | | 5.25% | #(b) | 10/1/2054 | | A1 | | | 15,000,000 | | | | 16,296,883 | |
| Pennsylvania Economic Development Financing Authority-Talen Energy Supply LLC | | 5.25% | #(b) | 12/1/2037 | | BB- | | | 4,400,000 | | | | 4,484,819 | |
| Puerto Rico Commonwealth Aqueduct & Sewer Authority† | | 4.00% | | 7/1/2042 | | NR | | | 8,750,000 | | | | 8,402,242 | |
| Puerto Rico Commonwealth Aqueduct & Sewer Authority† | | 5.00% | | 7/1/2035 | | NR | | | 1,500,000 | | | | 1,575,426 | |
| 132 | See Notes to Financial Statements. |
Schedule of Investments (continued)
HIGH INCOME MUNICIPAL BOND FUND September 30, 2024
| Investments | | | | Interest
Rate | | Maturity
Date | | Credit
Rating:
S&P or
Moody’s(a) | | Principal
Amount | | | Fair
Value | |
| Utilities (continued) | | | | | | | | | | | | | | | | |
| Puerto Rico Commonwealth Aqueduct & Sewer Authority† | | | | 5.00% | | 7/1/2047 | | NR | | $ | 29,000,000 | | | $ | 29,694,585 | |
| South Carolina Public Service Authority | | | | 5.50% | | 12/1/2054 | | A- | | | 5,250,000 | | | | 5,914,623 | |
| Southeast Alabama Gas Supply District AL | | | | 5.00% | #(b) | 8/1/2054 | | Aa3 | | | 10,750,000 | | | | 11,689,219 | |
| Southeast Energy Authority A Cooperative District AL | | | | 5.50% | #(b) | 1/1/2053 | | A1 | | | 5,000,000 | | | | 5,456,266 | |
| Texas Municipal Gas Acquisition & Supply Corp. IV | | | | 5.50% | #(b) | 1/1/2054 | | A1 | | | 14,250,000 | | | | 16,216,043 | |
| Total | | | | | | | | | | | | | | | 328,241,509 | |
| Total Municipal Bonds (cost $3,961,337,702) | | | | | | | | | | 4,064,242,505 | |
| | | | | | | | | | | | | | | | | |
| | | Interest
Rate# | | Interest
Rate
Reset
Date(h) | | Final
Maturity
Date | | | | | | | | |
| | | | | | | | | | | | | | | | | |
| SHORT-TERM INVESTMENTS 1.59% | | | | | | | | | | | | | | | | |
| | | | | | | | | | | | | | | | | |
| VARIABLE RATE DEMAND NOTES 1.59% | | | | | | | | | | | | | | | | |
| | | | | | | | | | | | | | | | | |
| Education 0.06% | | | | | | | | | | | | | | | | |
| Connecticut State Health & Educational Facilities Authority-Yale University | | 3.600% | | 10/1/2024 | | 7/1/2042 | | AAA | | | 2,500,000 | | | | 2,500,000 | |
| | | | | | | | | | | | | | | | | |
| General Obligation 0.99% | | | | | | | | | | | | | | | | |
| City of New York NY GO | | 4.050% | | 10/1/2024 | | 10/1/2046 | | AA | | | 8,000,000 | | | | 8,000,000 | |
| City of New York NY GO | | 4.150% | | 10/1/2024 | | 4/1/2042 | | AA | | | 18,150,000 | | | | 18,150,000 | |
| City of New York NY GO | | 4.150% | | 10/1/2024 | | 4/1/2042 | | AA | | | 14,375,000 | | | | 14,375,000 | |
| Total | | | | | | | | | | | | | | | 40,525,000 | |
| | | | | | | | | | | | | | | | | |
| Pollution Control 0.03% | | | | | | | | | | | | | | | | |
| Port of Port Arthur Navigation District-Motiva Enterprises LLC TX | | 4.350% | | 10/1/2024 | | 4/1/2040 | | BBB+ | | | 1,000,000 | | | | 1,000,000 | |
| | | | | | | | | | | | | | | | | |
| Taxable Revenue-Water & Sewer 0.07% | | | | | | | | | | | |
| Los Angeles Department of Water & Power Water System Revenue CA | | 3.000% | | 10/1/2024 | | 7/1/2045 | | Aa2 | | | 2,990,000 | | | | 2,990,000 | |
| | See Notes to Financial Statements. | 133 |
Schedule of Investments (continued)
HIGH INCOME MUNICIPAL BOND FUND September 30, 2024
| Investments | | Interest
Rate# | | Interest
Rate
Reset
Date(h) | | Final
Maturity
Date | | Credit
Rating:
S&P or
Moody’s(a) | | Principal
Amount | | | Fair
Value | |
| Utilities 0.44% | | | | | | | | | | | | | | | | |
| Development Authority of Appling County-Georgia Power Co | | 4.400% | | 10/1/2024 | | 9/1/2041 | | A | | $ | 16,115,000 | | | $ | 16,115,000 | |
| Los Angeles Department of Water & Power-Los Angeles Department of Water & Power Power System Revenue CA | | 2.650% | | 10/1/2024 | | 7/1/2035 | | Aa2 | | | 1,980,000 | | | | 1,980,000 | |
| Total | | | | | | | | | | | | | | | 18,095,000 | |
| Total Short-Term Investments (cost $65,110,000) | | | | | | | | | | 65,110,000 | |
| Total Investments in Securities 100.87% (cost $4,031,238,329) | | | | | | | | | | 4,134,202,505 | |
| Other Assets and Liabilities – Net (0.87)% | | | | | | | | | | | | | | | (35,488,982 | ) |
| Net Assets 100.00% | | | | | | | | | | | | | | $ | 4,098,713,523 | |
| AGM | | Insured by-Assured Guaranty Municipal Corporation. |
| AMT | | Income from the security may be subject to Alternative Minimum Tax. |
| BAM | | Insured by-Build America Mutual. |
| COPS | | Certificates of Participation. |
| GTD | | Guaranteed. |
| NATL | | Insured by–National Public Finance Guarantee Corporation. |
| NR | | Not Rated. |
| SIFMA | | Insured by-Securities Industry and Financial Markets Association. |
| TCRS | | Transferable Custodial Receipts. |
| TRIPS | | Tax Refund Intercept Programs. |
| † | | Security was purchased pursuant to Rule 144A under the Securities Act of 1933 and, unless registered under such Act or exempted from registration, may only be resold to qualified institutional buyers. At September 30, 2024, the total value of Rule 144A securities was $1,258,389,657, which represents 30.70% of net assets. |
| # | | Variable rate security. The interest rate represents the rate in effect at September 30, 2024. |
| (a) | | Unaudited. |
| (b) | | Variable Rate is Fixed to Float: Rate remains fixed or at Zero Coupon until designated future date. |
| (c) | | This investment has been rated by Fitch IBCA. |
| (d) | | Defaulted (non-income producing security). |
| (e) | | Securities purchased on a when-issued basis (See Note 2(g)). |
| (f) | | Municipal Bonds Held in Trust-Securities represent underlying bonds transferred to a separate securitization trust established in a tender option bond transaction in which the Fund acquired the residual interest certificates. These securities serve as collateral in a financing transaction. See Note 2(h) to Financial Statements for details of Municipal Bonds Held in Trust. |
| (g) | | Level 3 Investment as described in Note 2(i) in the Notes to Financial Statements. Security valued utilizing third party pricing information without adjustment. Such valuations are based on unobservable inputs. A significant change in third party information could result in a significantly lower or higher value of such Level 3 investments. |
| (h) | | The interest rate reset date shown represents the date in which the Fund has the right to sell a Variable Rate Demand Note (“VRDN”) back to the issuer for Principal Amount. The interest rate on the VRDN is generally reset daily based on the SIFMA Municipal Swap Index. |
| 134 | See Notes to Financial Statements. |
Schedule of Investments (concluded)
HIGH INCOME MUNICIPAL BOND FUND September 30, 2024
The following is a summary of the inputs used as of September 30, 2024 in valuing the Fund’s investments carried at fair value(1):
| Investment Type(2) | | Level 1 | | | Level 2 | | | Level 3 | | | Total | |
| Long-Term Investments | | | | | | | | | | | | | | | | |
| Corporate Bonds | | $ | – | | | $ | 4,850,000 | | | $ | – | | | $ | 4,850,000 | |
| Municipal Bonds(3) | | | | | | | | | | | | | | | | |
| General Obligation | | | – | | | | 414,189,689 | | | | 122 | | | | 414,189,811 | |
| Remaining Industries | | | – | | | | 3,650,052,694 | | | | – | | | | 3,650,052,694 | |
| Short-Term Investments | | | | | | | | | | | | | | | | |
| Variable Rate Demand Notes | | | – | | | | 65,110,000 | | | | – | | | | 65,110,000 | |
| Total | | $ | – | | | $ | 4,134,202,383 | | | $ | 122 | | | $ | 4,134,202,505 | |
| (1) | | Refer to Note 2(i) for a description of fair value measurements and the three-tier hierarchy of inputs. |
| (2) | | See Schedule of Investments for fair values in each industry. The table above is presented by Investment Type. Industries are presented within an Investment Type should such Investment Type include securities classified as two or more levels within the three-tier fair value hierarchy. When applicable, each Level 3 security is identified on the Schedule of Investments along with the valuation technique utilized. |
| (3) | | Includes Municipal Bonds held in the Trust (See Note 2(h)). |
A reconciliation of Level 3 investments is presented when the Fund has a material amount of Level 3 investments at the beginning or end of the year in relation to the Fund’s net assets.
The following is a reconciliation of investments with unobservable inputs (Level 3) that were used in determining fair value:
| Investment Type | Municipal Bonds | |
| Balance as of October 1, 2023 | | $ | 60,493,822 | |
| Accrued Discounts (Premiums) | | | (2,956 | ) |
| Realized Gain (Loss) | | | (29,049 | ) |
| Change in Unrealized Appreciation (Depreciation) | | | 167,191 | |
| Purchases | | | – | |
| Sales | | | (2,447,052 | ) |
| Transfers into Level 3 | | | – | |
| Transfers out of Level 3(a) | | | (58,181,834 | ) |
| Balance as of September 30, 2024 | | $ | 122 | |
| Change in unrealized appreciation/depreciation for the year ended September 30, 2024, related to Level 3 investments held at September 30, 2024 | | $ | 77,204 | |
| (a) | | The Fund recognizes transfers within the fair value hierarchy as of the beginning of the period. Transfers into and out of Level 3 were primarily related to the availability of market quotations in accordance with valuation methodology. |
| | See Notes to Financial Statements. | 135 |
Schedule of Investments
SHORT DURATION HIGH INCOME MUNICIPAL BOND FUND September 30, 2024
| Investments | | Interest
Rate | | Maturity
Date | | Credit
Rating:
S&P or
Moody’s(a) | | Principal
Amount | | | Fair
Value | |
| LONG-TERM INVESTMENTS 96.78% | | | | | | | | | | | | | | |
| | | | | | | | | | | | | | | |
| CORPORATE BONDS 0.16% | | | | | | | | | | | | | | |
| | | | | | | | | | | | | | | |
| Health Care Services 0.16% | | | | | | | | | | | | | | |
Care New England Health System
(cost $2,395,314) | | 5.50% | | 9/1/2026 | | | | $ | 2,500,000 | | | $ | 2,425,000 | |
| | | | | | | | | | | | | | | |
| MUNICIPAL BONDS 96.62% | | | | | | | | | | | | | | |
| | | | | | | | | | | | | | | |
| Airlines 0.38% | | | | | | | | | | | | | | |
| New Jersey Economic Development Authority–Port Newark Container Terminal LLC AMT | | 5.00% | | 10/1/2026 | | Baa2 | | | 2,135,000 | | | | 2,196,343 | |
| New Jersey Economic Development Authority–Port Newark Container Terminal LLC AMT | | 5.00% | | 10/1/2027 | | Baa2 | | | 3,440,000 | | | | 3,591,728 | |
| Total | | | | | | | | | | | | | 5,788,071 | |
| | | | | | | | | | | | | | | |
| Corporate-Backed 24.47% | | | | | | | | | | | | | | |
| Allegheny County Industrial Development Authority–United States Steel Corp PA | | 4.875% | | 11/1/2024 | | BB- | | | 2,400,000 | | | | 2,402,458 | |
| Allegheny County Industrial Development Authority–United States Steel Corp PA | | 5.125% | | 5/1/2030 | | BB- | | | 10,485,000 | | | | 11,458,759 | |
| Allegheny County Industrial Development Authority–United States Steel Corp PA | | 5.75% | | 8/1/2042 | | BB- | | | 275,000 | | | | 275,289 | |
| Arkansas Development Finance Authority–Big River Steel LLC AR AMT† | | 4.75% | | 9/1/2049 | | Ba2 | | | 1,900,000 | | | | 1,902,889 | |
| Avenir Community Development District FL | | 4.50% | | 5/1/2030 | | NR | | | 1,955,000 | | | | 1,991,813 | |
| Boggy Creek Improvement District FL | | 4.50% | | 5/1/2033 | | NR | | | 1,005,000 | | | | 1,030,264 | |
| Cabot Citrus Farms Community Development District FL | | 5.25% | | 3/1/2029 | | NR | | | 6,200,000 | | | | 6,283,277 | |
| California Infrastructure & Economic Development Bank–DesertXpress Enterprises LLC AMT† | | 8.00% | #(b) | 1/1/2050 | | NR | | | 6,000,000 | | | | 6,179,527 | |
| California Municipal Finance Authority–United Airlines Inc AMT | | 4.00% | | 7/15/2029 | | BB- | | | 4,700,000 | | | | 4,740,589 | |
| California Municipal Finance Authority–Waste Management Inc AMT | | 4.80% | #(b) | 11/1/2041 | | A- | | | 2,500,000 | | | | 2,509,344 | |
| City of Houston Airport System Revenue–United Airlines Inc TX AMT | | 5.00% | | 7/15/2027 | | BB- | (c) | | 1,000,000 | | | | 1,025,050 | |
| 136 | See Notes to Financial Statements. |
Schedule of Investments (continued)
SHORT DURATION HIGH INCOME MUNICIPAL BOND FUND September 30, 2024
| Investments | | Interest
Rate | | Maturity
Date | | Credit
Rating:
S&P or
Moody’s(a) | | Principal
Amount | | | Fair
Value | |
| Corporate-Backed (continued) | | | | | | | | | | | | | | |
| City of Houston Airport System Revenue–United Airlines Inc TX AMT | | 5.00% | | 7/15/2028 | | BB- | | $ | 2,850,000 | | | $ | 2,949,297 | |
| City of Houston Airport System Revenue–United Airlines Inc TX AMT | | 5.00% | | 7/1/2029 | | BB- | | | 7,225,000 | | | | 7,228,295 | |
| City of Houston Airport System Revenue–United Airlines Inc TX AMT | | 6.50% | | 7/15/2030 | | BB- | | | 4,000,000 | | | | 4,040,452 | |
| City of Valparaiso–Pratt Paper LLC AMT IN† | | 4.50% | | 1/1/2034 | | NR | | | 2,765,000 | | | | 2,862,680 | |
| City of Whiting–BP Products North America Inc IN AMT | | 5.00% | #(b) | 11/1/2047 | | A1 | | | 4,550,000 | | | | 4,553,464 | |
| County of Clark–Southern California Edison Co NV | | 2.10% | | 6/1/2031 | | A2 | | | 5,060,000 | | | | 4,514,620 | |
| Crosswinds East Community Development District–Crosswinds East Community Development District Assessment Area One FL | | 4.625% | | 5/1/2031 | | NR | | | 500,000 | | | | 507,762 | |
| Florida Development Finance Corp.–Waste pro USA Inc AMT† | | 6.125% | #(b) | 7/1/2032 | | NR | | | 8,375,000 | | | | 8,609,878 | |
| Florida Development Finance Corp.–Waste Pro USA Inc AMT† | | 5.00% | | 5/1/2029 | | NR | | | 3,910,000 | | | | 3,996,256 | |
| Grapevine Wash Local District–Grapevine Wash Local District Assessment Area No 1 UT† | | 5.25% | | 12/1/2044 | | NR | | | 3,000,000 | | | | 3,012,849 | |
| Greater Orlando Aviation Authority–JetBlue Airways Corp FL | | 5.00% | | 11/15/2026 | | NR | | | 2,600,000 | | | | 2,602,162 | |
| Hobe-St Lucie Conservancy District Unit of Development No 1A | | 4.75% | | 5/1/2031 | | NR | | | 1,700,000 | | | | 1,760,852 | |
| Hoover Industrial Development Board–United States Steel Corp AL AMT | | 6.375% | #(b) | 11/1/2050 | | BB- | | | 1,570,000 | | | | 1,810,696 | |
| Illinois Finance Authority–LRS Holdings LLC AMT† | | 7.375% | #(b) | 9/1/2042 | | NR | | | 5,000,000 | | | | 5,915,321 | |
| Iowa Finance Authority–Howmet Aerospace Inc | | 4.75% | | 8/1/2042 | | Baa1 | | | 16,910,000 | | | | 16,928,885 | |
| Iowa Finance Authority–Iowa Fertilizer Co LLC | | 4.00% | #(b) | 12/1/2050 | | AA+ | | | 8,370,000 | | | | 9,200,590 | |
| Jefferson County Port Authority–JSW Steel USA Ohio Inc OH† | | 5.00% | #(b) | 12/1/2053 | | Ba1 | | | 11,880,000 | | | | 12,193,851 | |
| Love Field Airport Modernization Corp.–Southwest Airlines Co TX | | 5.00% | | 11/1/2028 | | Baa1 | | | 5,540,000 | | | | 5,541,872 | |
| | See Notes to Financial Statements. | 137 |
Schedule of Investments (continued)
SHORT DURATION HIGH INCOME MUNICIPAL BOND FUND September 30, 2024
| Investments | | Interest
Rate | | Maturity
Date | | Credit
Rating:
S&P or
Moody’s(a) | | Principal
Amount | | | Fair
Value | |
| Corporate-Backed (continued) | | | | | | | | | | | | | | |
| Michigan Strategic Fund–Graphic Packaging International LLC AMT | | 4.00% | #(b) | 10/1/2061 | | BB | | $ | 3,635,000 | | | $ | 3,655,837 | |
| Mission Economic Development Corp.–Natgasoline LLC TX AMT† | | 4.625% | | 10/1/2031 | | BB- | | | 20,250,000 | | | | 20,344,021 | |
| Mississippi Business Finance Corp.–Huntington Ingalls Industries Inc | | 4.55% | | 12/1/2028 | | BBB- | | | 2,000,000 | | | | 2,000,703 | |
| Montgomery County Industrial Development Authority–Constellation Energy Generation PA AMT | | 4.45% | #(b) | 10/1/2034 | | BBB+ | | | 7,500,000 | | | | 7,723,138 | |
| New Hampshire Business Finance Authority–Covanta Holding Corp AMT† | | 4.00% | | 11/1/2027 | | B | | | 4,730,000 | | | | 4,730,017 | |
| New Jersey Economic Development Authority–United Airlines Inc | | 5.25% | | 9/15/2029 | | BB- | | | 7,210,000 | | | | 7,218,426 | |
| New Jersey Economic Development Authority–United Airlines Inc | | 5.75% | | 9/15/2027 | | BB- | | | 5,795,000 | | | | 5,804,043 | |
| New York City Industrial Development Agency–TRIPS Obligated Group NY | | 5.00% | | 7/1/2028 | | BBB+ | | | 700,000 | | | | 700,313 | |
| New York Liberty Development Corp.–3 World Trade Center LLC† | | 5.00% | | 11/15/2044 | | NR | | | 5,000,000 | | | | 5,003,204 | |
| New York Liberty Development Corp.–3 World Trade Center LLC† | | 5.15% | | 11/15/2034 | | NR | | | 8,660,000 | | | | 8,671,508 | |
| New York State Environmental Facilities Corp.–Casella Waste Systems Inc AMT | | 2.75% | #(b) | 9/1/2050 | | B+ | | | 2,700,000 | | | | 2,665,952 | |
| New York State Environmental Facilities Corp.–Casella Waste Systems Inc AMT† | | 2.875% | #(b) | 12/1/2044 | | B+ | | | 1,000,000 | | | | 946,975 | |
| New York State Environmental Facilities Corp.–Casella Waste Systems Inc AMT† | | 3.125% | #(b) | 12/1/2044 | | B+ | | | 4,500,000 | | | | 4,436,253 | |
| New York State Environmental Facilities Corp.–Casella Waste Systems Inc AMT† | | 5.125% | #(b) | 9/1/2050 | | B+ | | | 1,000,000 | | | | 1,052,901 | |
| New York Transportation Development Corp.–American Airlines Inc AMT | | 5.00% | | 8/1/2026 | | B+ | | | 2,835,000 | | | | 2,840,278 | |
| New York Transportation Development Corp.–American Airlines Inc AMT | | 5.00% | | 8/1/2031 | | B+ | | | 13,455,000 | | | | 13,473,809 | |
| New York Transportation Development Corp.–American Airlines Inc AMT | | 5.25% | | 8/1/2031 | | B+ | | | 2,235,000 | | | | 2,394,530 | |
| New York Transportation Development Corp.–American Airlines Inc AMT | | 5.375% | | 8/1/2036 | | B+ | | | 2,500,000 | | | | 2,682,998 | |
| New York Transportation Development Corp.–Delta Air Lines Inc AMT | | 5.00% | | 1/1/2027 | | Baa3 | | | 5,100,000 | | | | 5,255,823 | |
| 138 | See Notes to Financial Statements. |
Schedule of Investments (continued)
SHORT DURATION HIGH INCOME MUNICIPAL BOND FUND September 30, 2024
| Investments | | Interest
Rate | | Maturity
Date | | Credit
Rating:
S&P or
Moody’s(a) | | Principal
Amount | | | Fair
Value | |
| Corporate-Backed (continued) | | | | | | | | | | | | | | |
| New York Transportation Development Corp.–JFK International Air Terminal LLC AMT | | 4.00% | | 12/1/2038 | | Baa1 | | $ | 1,790,000 | | | $ | 1,787,316 | |
| Niagara Area Development Corp.–Covanta Holding Corp NY† | | 3.50% | | 11/1/2024 | | B | | | 7,600,000 | | | | 7,599,357 | |
| Normandy Community Development District Assessment Area One FL† | | 4.625% | | 5/1/2031 | | NR | | | 600,000 | | | | 602,152 | |
| Ohio Air Quality Development Authority–Pratt Paper Inc AMT† | | 4.25% | | 1/15/2038 | | NR | | | 7,045,000 | | | | 7,117,902 | |
| Parish of St. James–NuStar Logistics LP LA† | | 5.85% | #(b) | 8/1/2041 | | BB+ | | | 4,225,000 | | | | 4,282,348 | |
| Parish of St. James–NuStar Logistics LP LA† | | 6.10% | #(b) | 6/1/2038 | | BB+ | | | 7,095,000 | | | | 7,942,493 | |
| Pennsylvania Economic Development Financing Authority–CONSOL Energy Inc AMT† | | 9.00% | #(b) | 4/1/2051 | | BB | | | 3,125,000 | | | | 3,601,076 | |
| Pennsylvania Economic Development Financing Authority–Covanta Holding Corp AMT† | | 3.25% | | 8/1/2039 | | B | | | 5,000,000 | | | | 4,165,276 | |
| Phenix City Industrial Development Board–WestRock Coated Board LLC AL AMT | | 4.125% | | 5/15/2035 | | BBB | | | 10,000,000 | | | | 9,999,707 | |
| Polk County Industrial Development Authority–Mineral Development LLC FL† | | 5.875% | | 1/1/2033 | | NR | | | 1,310,000 | | | | 1,183,652 | |
| Port of Beaumont Navigation District–Jefferson 2020 Bond Lessee & Borrower LLC Obligated Group TX† | | 5.00% | | 1/1/2039 | | NR | | | 5,400,000 | | | | 5,652,035 | |
| Port of Beaumont Navigation District–Jefferson 2020 Bond Lessee & Borrower LLC Obligated Group TX† | | 5.125% | | 1/1/2044 | | NR | | | 1,000,000 | | | | 1,044,485 | |
| Port of Seattle Industrial Development Corp.–Delta Air Lines Inc WA AMT | | 5.00% | | 4/1/2030 | | BB+ | | | 2,350,000 | | | | 2,350,947 | |
| Public Finance Authority–Celanese US Holdings LLC WI AMT | | 4.30% | | 11/1/2030 | | BBB- | | | 1,935,000 | | | | 1,944,354 | |
| Public Finance Authority–Celanese US Holdings LLC WI AMT | | 5.00% | | 12/1/2025 | | BBB- | | | 10,975,000 | | | | 11,122,086 | |
| Public Finance Authority–Sky Harbour Capital LLC Obligated Group WI AMT | | 4.00% | | 7/1/2036 | | NR | | | 9,585,000 | | | | 9,024,502 | |
| Public Finance Authority–Sky Harbour Capital LLC Obligated Group WI AMT | | 4.00% | | 7/1/2041 | | NR | | | 1,600,000 | | | | 1,428,241 | |
| Public Finance Authority WI† | | 5.375% | | 12/15/2032 | | NR | | | 3,000,000 | | | | 3,009,552 | |
| | See Notes to Financial Statements. | 139 |
Schedule of Investments (continued)
SHORT DURATION HIGH INCOME MUNICIPAL BOND FUND September 30, 2024
| Investments | | Interest
Rate | | Maturity
Date | | Credit
Rating:
S&P or
Moody’s(a) | | Principal
Amount | | | Fair
Value | |
| Corporate-Backed (continued) | | | | | | | | | | | | | | |
| Public Finance Authority WI† | | 5.50% | | 12/15/2028 | | NR | | $ | 4,000,000 | | | $ | 4,024,797 | |
| Southwestern Illinois Development Authority–United States Street Corp | | 5.75% | | 8/1/2042 | | BB- | | | 10,000,000 | | | | 10,010,504 | |
| Spring Valley Community Infrastructure District No. 1 Assessment Area One ID† | | 3.75% | | 9/1/2051 | | NR | | | 6,000,000 | | | | 5,794,172 | |
| Tulsa Airports Improvement Trust–American Airlines Inc OK AMT | | 5.00% | #(b) | 6/1/2035 | | B+ | | | 8,490,000 | | | | 8,555,443 | |
| Tulsa Airports Improvement Trust–American Airlines Inc OK AMT | | 5.50% | | 6/1/2035 | | NR | | | 2,875,000 | | | | 2,880,587 | |
| Tuscaloosa County Industrial Development Authority–Hunt Refining Co AL† | | 5.25% | | 5/1/2044 | | NR | | | 5,400,000 | | | | 5,541,102 | |
| Vermont Economic Development Authority–Casella Waste Systems Inc AMT† | | 5.00% | #(b) | 6/1/2052 | | B+ | | | 6,000,000 | | | | 6,138,410 | |
| Village Community Development District No. 15 FL† | | 4.25% | | 5/1/2028 | | NR | | | 1,000,000 | | | | 1,016,111 | |
| Village Community Development District No. 15 FL† | | 4.375% | | 5/1/2033 | | NR | | | 1,500,000 | | | | 1,557,194 | |
| West Virginia Economic Development Authority–Kentucky Power Co AMT | | 4.70% | #(b) | 4/1/2036 | | BBB | | | 3,210,000 | | | | 3,256,188 | |
| Total | | | | | | | | | | | | | 372,261,759 | |
| | | | | | | | | | | | | | | |
| Education 7.89% | | | | | | | | | | | | | | |
| Arizona Industrial Development Authority–Academies of Math & Science Obligated Group† | | 5.00% | | 7/1/2029 | | BB+ | | | 1,500,000 | | | | 1,534,800 | |
| Arizona Industrial Development Authority–BASIS Schools Inc Obligated Group† | | 5.125% | | 7/1/2037 | | BB | | | 970,000 | | | | 983,580 | |
| Arizona Industrial Development Authority–Odyssey Preparatory Academy Inc† | | 4.00% | | 7/1/2029 | | BB- | | | 345,000 | | | | 344,983 | |
| Arlington Higher Education Finance Corp.–BASIS Texas Charter Schools Inc TX† | | 4.125% | | 6/15/2034 | | Ba2 | | | 1,540,000 | | | | 1,546,776 | |
| Arlington Higher Education Finance Corp.–BASIS Texas Charter Schools Inc TX† | | 4.25% | | 6/15/2039 | | Ba2 | | | 1,075,000 | | | | 1,075,759 | |
| Build NYC Resource Corp.–East Harlem Scholars Academy Charter School Obligated Group NY† | | 5.00% | | 6/1/2032 | | BB | | | 275,000 | | | | 294,080 | |
| California Community Choice Financing Authority | | 4.943%
(SOFR * .67 + 1.70% | )# | 5/1/2053 | | A1 | | | 10,000,000 | | | | 10,038,548 | |
| 140 | See Notes to Financial Statements. |
Schedule of Investments (continued)
SHORT DURATION HIGH INCOME MUNICIPAL BOND FUND September 30, 2024
| Investments | | Interest
Rate | | Maturity
Date | | Credit
Rating:
S&P or
Moody’s(a) | | Principal
Amount | | | Fair
Value | |
| Education (continued) | | | | | | | | | | | | | | |
| California Municipal Finance Authority–SDORI Charter School Properties LLC† | | 5.00% | | 3/1/2025 | | B+ | | $ | 610,000 | | | $ | 609,424 | |
| California Municipal Finance Authority–SDORI Charter School Properties LLC† | | 5.00% | | 3/1/2027 | | B+ | | | 1,150,000 | | | | 1,140,935 | |
| California Municipal Finance Authority–Westside Neighborhood School† | | 5.00% | | 6/15/2034 | | BB | | | 915,000 | | | | 980,960 | |
| California Municipal Finance Authority–Westside Neighborhood School† | | 5.50% | | 6/15/2039 | | BB | | | 900,000 | | | | 971,969 | |
| Capital Trust Agency, Inc.–Advantage Academy of Hillsborough Obligated Group FL | | 4.00% | | 12/15/2024 | | Baa3 | | | 110,000 | | | | 109,825 | |
| Capital Trust Agency, Inc.–Advantage Academy of Hillsborough Obligated Group FL | | 5.00% | | 12/15/2029 | | Baa3 | | | 805,000 | | | | 814,618 | |
| Capital Trust Agency, Inc.–Renaissance Charter School Inc Series 2019 Obligated Group FL† | | 4.00% | | 6/15/2029 | | NR | | | 730,000 | | | | 715,242 | |
| Capital Trust Authority–Kipp Miami Obligated Group FL† | | 5.00% | | 6/15/2034 | | BB | | | 610,000 | | | | 646,750 | |
| Chester County Health & Education Facilities Authority–Immaculata University PA | | 4.25% | | 11/1/2032 | | BB- | (c) | | 1,855,000 | | | | 1,673,687 | |
| Chicago Board of Education Dedicated Capital Improvement Tax IL | | 5.25% | | 4/1/2033 | | A | (c) | | 1,250,000 | | | | 1,424,769 | |
| Chicago Board of Education Dedicated Capital Improvement Tax IL | | 5.75% | | 4/1/2033 | | A | (c) | | 5,000,000 | | | | 5,268,253 | |
| Chicago Board of Education Dedicated Capital Improvement Tax IL | | 6.10% | | 4/1/2036 | | A | | | 5,000,000 | | | | 5,303,975 | |
| Chicago Board of Education IL GO | | 5.00% | | 12/1/2033 | | BB+ | | | 1,485,000 | | | | 1,486,057 | |
| Chicago Board of Education IL GO | | 5.00% | | 12/1/2034 | | BB+ | | | 7,625,000 | | | | 7,821,098 | |
| Chicago Board of Education IL GO | | 5.00% | | 12/1/2034 | | BB+ | | | 5,540,000 | | | | 5,543,889 | |
| Chicago Board of Education IL GO | | 5.125% | | 12/1/2032 | | BB+ | | | 4,580,000 | | | | 4,585,850 | |
| Chicago Board of Education IL GO | | 5.25% | | 12/1/2035 | | BB+ | | | 7,000,000 | | | | 7,680,213 | |
| Clarksville Public Educational Facilities Board–University of the Ozarks AR | | 5.50% | | 8/1/2039 | | NR | | | 580,000 | | | | 599,620 | |
| Clifton Higher Education Finance Corp.–International Leadership of Texas Inc | | 4.625% | | 8/15/2025 | | NR | | | 685,000 | | | | 691,126 | |
| Clifton Higher Education Finance Corp.–International Leadership of Texas Inc | | 5.75% | | 8/15/2033 | | Baa3 | | | 2,025,000 | | | | 2,066,135 | |
| Clifton Higher Education Finance Corp.–International Leadership of Texas Inc | | 5.75% | | 8/15/2038 | | NR | | | 1,405,000 | | | | 1,430,886 | |
| | See Notes to Financial Statements. | 141 |
Schedule of Investments (continued)
SHORT DURATION HIGH INCOME MUNICIPAL BOND FUND September 30, 2024
| Investments | | Interest
Rate | | Maturity
Date | | Credit
Rating:
S&P or
Moody’s(a) | | Principal
Amount | | | Fair
Value | |
| Education (continued) | | | | | | | | | | | | | | |
| Clifton Higher Education Finance Corp.–International Leadership of Texas Inc | | 6.00% | | 8/15/2038 | | Baa3 | | $ | 3,000,000 | | | $ | 3,060,302 | |
| Colorado Educational & Cultural Facilities Authority† | | 4.75% | | 4/1/2034 | | BB | | | 3,290,000 | | | | 3,473,609 | |
| County of Frederick–Mount St Mary’s University Inc MD† | | 5.00% | | 9/1/2032 | | BB+ | | | 3,150,000 | | | | 3,192,482 | |
| Development Authority Of The City Of Marietta–Life University Inc GA† | | 5.00% | | 11/1/2037 | | Ba3 | | | 4,000,000 | | | | 4,067,194 | |
| Florida Development Finance Corp.–Renaissance Charter School Inc† | | 6.00% | | 6/15/2033 | | NR | | | 1,830,000 | | | | 2,077,980 | |
| Florida Higher Educational Facilities Financial Authority–Jacksonville University† | | 4.50% | | 6/1/2033 | | NR | | | 2,900,000 | | | | 2,930,113 | |
| Industrial Development Authority of the City of Phoenix Arizona–BASIS Schools Inc Obligated Group AZ† | | 5.00% | | 7/1/2035 | | BB | | | 2,125,000 | | | | 2,138,559 | |
| Maricopa County Industrial Development Authority–Morrison Education Group Obligated Group AZ† | | 5.25% | | 7/1/2034 | | NR | | | 1,745,000 | | | | 1,815,183 | |
| Maricopa County Industrial Development Authority–Ottawa University AZ† | | 5.00% | | 10/1/2026 | | NR | | | 135,000 | | | | 134,670 | |
| Maricopa County Industrial Development Authority–Ottawa University AZ† | | 5.125% | | 10/1/2030 | | NR | | | 425,000 | | | | 426,632 | |
| New York City Industrial Development Agency–Yankee Stadium LLC NY (FGIC) | | 3.785%
(CPI YoY * 1 + 0.89% | ) | 3/1/2027 | | Baa1 | | | 2,550,000 | | | | 2,570,058 | |
| New York State Dormitory Authority–Yeshiva University | | 5.00% | | 7/15/2030 | | BBB- | | | 2,200,000 | | | | 2,379,158 | |
| New York State Dormitory Authority–Yeshiva University | | 5.00% | | 7/15/2032 | | BBB- | | | 1,960,000 | | | | 2,141,247 | |
| Public Finance Authority–Mater Academy of Nevada WI†(d) | | 5.00% | | 12/15/2034 | | BB | | | 825,000 | | | | 878,722 | |
| Public Finance Authority–Mater Academy of Nevada WI†(d) | | 5.00% | | 12/15/2039 | | BB | | | 700,000 | | | | 733,516 | |
| Public Finance Authority–UMA Education Inc WI† | | 5.00% | | 10/1/2027 | | BB+ | | | 1,125,000 | | | | 1,158,329 | |
| Public Finance Authority–UMA Education Inc WI† | | 5.00% | | 10/1/2034 | | BB+ | | | 8,110,000 | | | | 8,403,576 | |
| Public Finance Authority–UMA Education Inc WI† | | 5.00% | | 10/1/2039 | | BB+ | | | 3,000,000 | | | | 3,069,193 | |
| 142 | See Notes to Financial Statements. |
Schedule of Investments (continued)
SHORT DURATION HIGH INCOME MUNICIPAL BOND FUND September 30, 2024
| Investments | | Interest
Rate | | Maturity
Date | | Credit
Rating:
S&P or
Moody’s(a) | | Principal
Amount | | | Fair
Value | |
| Education (continued) | | | | | | | | | | | | | | |
| Sierra Vista Industrial Development Authority–American Leadership Academy Inc AZ† | | 5.00% | | 6/15/2033 | | NR | | $ | 7,000,000 | | | $ | 7,309,950 | |
| Sierra Vista Industrial Development Authority–American Leadership Academy Inc AZ†(d) | | 5.00% | | 6/15/2034 | | NR | | | 625,000 | | | | 654,940 | |
| Total | | | | | | | | | | | | | 119,999,220 | |
| | | | | | | | | | | | | | | |
| Energy 0.69% | | | | | | | | | | | | | | |
| PEFA, Inc. IA | | 5.00% | #(b) | 9/1/2049 | | A3 | | | 10,165,000 | | | | 10,456,458 | |
| | | | | | | | | | | | | | | |
| General Obligation 7.61% | | | | | | | | | | | | | | |
| Academical Village Community Development District FL | | 3.25% | | 5/1/2031 | | NR | | | 4,265,000 | | | | 3,996,488 | |
| Allentown Neighborhood Improvement Zone Development Authority PA† | | 5.125% | | 5/1/2032 | | NR | | | 1,685,000 | | | | 1,724,605 | |
| California Community Choice Financing Authority | | 5.25% | #(b) | 1/1/2054 | | Baa1 | | | 12,575,000 | | | | 13,593,389 | |
| California Community Choice Financing Authority | | 5.50% | #(b) | 5/1/2054 | | A2 | | | 7,500,000 | | | | 8,098,477 | |
| Chicago Board of Education IL | | 4.00% | | 12/1/2035 | | BB+ | | | 1,500,000 | | | | 1,479,314 | |
| Chicago Board of Education IL | | 5.00% | | 12/1/2036 | | BB+ | | | 2,500,000 | | | | 2,620,717 | |
| Chicago Board of Education IL GO | | 5.00% | | 12/1/2034 | | BB+ | | | 7,325,000 | | | | 7,582,346 | |
| Chicago Board of Education IL GO | | 5.00% | | 12/1/2034 | | BB+ | | | 2,000,000 | | | | 2,051,436 | |
| Chicago Board of Education IL GO | | 5.25% | | 12/1/2035 | | BB+ | | | 5,160,000 | | | | 5,166,339 | |
| City of Chicago IL GO | | 5.00% | | 1/1/2031 | | BBB+ | | | 1,000,000 | | | | 1,062,000 | |
| City of Chicago IL GO | | 5.50% | | 1/1/2031 | | BBB+ | | | 2,595,000 | | | | 2,604,049 | |
| City of Chicago IL GO | | 5.50% | | 1/1/2033 | | BBB+ | | | 7,915,000 | | | | 7,941,915 | |
| City of Chicago IL GO | | 5.625% | | 1/1/2031 | | BBB+ | | | 2,500,000 | | | | 2,611,693 | |
| City of New York NY GO | | 5.00% | | 3/1/2032 | | AA | | | 5,150,000 | | | | 5,156,382 | |
| City of Scranton PA GO | | 5.00% | | 9/1/2029 | | BBB+ | | | 3,650,000 | | | | 3,806,818 | |
| Commonwealth of Puerto Rico GO | | Zero Coupon | | 7/1/2033 | | NR | | | 2,680,000 | | | | 1,822,626 | |
| Commonwealth of Puerto Rico GO | | 4.00% | | 7/1/2033 | | NR | | | 5,629,612 | | | | 5,640,370 | |
| Commonwealth of Puerto Rico GO | | 4.00% | | 7/1/2037 | | NR | | | 6,043,139 | | | | 6,004,441 | |
| Commonwealth of Puerto Rico GO | | 5.375% | | 7/1/2025 | | NR | | | 1,085,498 | | | | 1,091,967 | |
| Commonwealth of Puerto Rico GO | | 5.625% | | 7/1/2027 | | NR | | | 8,230,472 | | | | 8,596,508 | |
| Commonwealth of Puerto Rico GO | | 5.75% | | 7/1/2031 | | NR | | | 12,933,161 | | | | 14,392,552 | |
| New York Liberty Development Corp. | | 1.20% | | 11/15/2028 | | A+ | | | 2,870,000 | | | | 2,582,929 | |
| | See Notes to Financial Statements. | 143 |
Schedule of Investments (continued)
SHORT DURATION HIGH INCOME MUNICIPAL BOND FUND September 30, 2024
| Investments | | Interest
Rate | | Maturity
Date | | Credit
Rating:
S&P or
Moody’s(a) | | Principal
Amount | | | Fair
Value | |
| General Obligation (continued) | | | | | | | | | | | | | | |
| State of Illinois GO | | 5.25% | | 2/1/2031 | | A- | | $ | 5,000,000 | | | $ | 5,026,658 | |
| University City Industrial Development Authority MO | | 4.875% | | 6/15/2036 | | NR | | | 1,120,000 | | | | 1,154,377 | |
| Total | | | | | | | | | | | | | 115,808,396 | |
| | | | | | | | | | | | | | | |
| Health Care 17.99% | | | | | | | | | | | | | | |
| Antelope Valley Healthcare District Obligated Group CA | | 5.00% | | 3/1/2026 | | BBB | | | 1,025,000 | | | | 1,029,906 | |
| Atlanta Development Authority–Georgia ProtonCare Center Inc(e) | | 6.00% | | 1/1/2023 | | NR | | | 2,000,000 | | | | 900,000 | |
| Berks County Municipal Authority–Tower Health Obligated Group PA | | Zero Coupon | | 6/30/2044 | | NR | | | 5,693,000 | | | | 3,629,625 | |
| Berks County Municipal Authority–Tower Health Obligated Group PA | | 5.00% | | 6/30/2039 | | NR | | | 15,513,000 | | | | 15,378,509 | |
| Berks County Municipal Authority–Tower Health Obligated Group PA | | 6.00% | | 6/30/2034 | | NR | | | 947,444 | | | | 1,030,179 | |
| Berks County Municipal Authority–Tower Health Obligated Group PA | | 6.00% | | 6/30/2034 | | NR | | | 47,951 | | | | 52,138 | |
| Berks County Municipal Authority–Tower Health Obligated Group PA | | 8.00% | | 6/30/2034 | | NR | | | 1,890,625 | | | | 1,935,150 | |
| Berks County Municipal Authority–Tower Health Obligated Group PA | | 8.00% | | 6/30/2034 | | NR | | | 95,901 | | | | 95,901 | |
| Board of Managers Joint Guadalupe County-City of Seguin Hospital TX | | 4.00% | | 12/1/2026 | | BB | | | 1,255,000 | | | | 1,243,738 | |
| Board of Managers Joint Guadalupe County-City of Seguin Hospital TX | | 5.00% | | 12/1/2024 | | BB | | | 600,000 | | | | 599,261 | |
| Bucks County Industrial Development Authority PA | | 5.00% | | 7/1/2035 | | BB- | | | 1,100,000 | | | | 1,138,542 | |
| Bucks County Industrial Development Authority PA | | 5.00% | | 7/1/2036 | | BB- | | | 1,250,000 | | | | 1,288,815 | |
| California Municipal Finance Authority–Palomar Health Obligated Group COPS† | | 5.00% | | 11/1/2027 | | BB+ | | | 5,280,000 | | | | 5,395,494 | |
| California Public Finance Authority–Kendal At Ventura† | | 10.00% | | 5/15/2028 | | NR | | | 3,500,000 | | | | 4,136,028 | |
| California Public Finance Authority–Kendal At Ventura† | | 12.00% | | 5/15/2028 | | NR | | | 375,000 | | | | 466,184 | |
| California Statewide Communities Development Authority–Loma Linda University Medical Obligated Group† | | 5.00% | | 12/1/2031 | | BB | | | 1,000,000 | | | | 1,023,775 | |
| 144 | See Notes to Financial Statements. |
Schedule of Investments (continued)
SHORT DURATION HIGH INCOME MUNICIPAL BOND FUND September 30, 2024
| Investments | | Interest
Rate | | Maturity
Date | | Credit
Rating:
S&P or
Moody’s(a) | | Principal
Amount | | | Fair
Value | |
| Health Care (continued) | | | | | | | | | | | | | | |
| California Statewide Communities Development Authority–Loma Linda University Medical Obligated Group | | 5.25% | | 12/1/2034 | | BB | | $ | 14,275,000 | | | $ | 14,307,644 | |
| California Statewide Communities Development Authority–Loma Linda University Medical Obligated Group | | 5.25% | | 12/1/2044 | | BB | | | 4,575,000 | | | | 4,575,185 | |
| California Statewide Communities Development Authority–Verity Health System of California Inc Obligated Group(e) | | 5.50% | | 7/1/2022 | | NR | | | 518 | | | | 487 | |
| California Statewide Communities Development Authority–Verity Health System of California Inc Obligated Group(e) | | 5.75% | | 7/1/2024 | | NR | | | 3,229 | | | | 3,035 | |
| Capital Trust Authority–Convivial St Petersburg LLC FL†(d) | | 12.00% | | 10/3/2029 | | NR | | | 2,500,000 | | | | 2,500,033 | |
| Citizens Memorial Hospital District MO | | 5.00% | | 12/1/2026 | | NR | | | 8,825,000 | | | | 8,911,839 | |
| City of Blaine–Crest View Obligated Group MN(e) | | 5.125% | | 7/1/2025 | | NR | | | 60,000 | | | | 33,000 | |
| City of Colby KS–Citizens Medical Center Inc | | 5.50% | | 7/1/2026 | | NR | | | 4,600,000 | | | | 4,638,653 | |
| City of Fruita Healthcare Revenue–Lower Valley Hospital Association Obligated Group CO† | | 5.375% | | 1/1/2033 | | NR | | | 2,000,000 | | | | 2,029,182 | |
| City of Minneapolis–Fairview Health Services Obligated Group MN | | 5.00% | | 11/15/2033 | | BBB+ | | | 1,000,000 | | | | 1,043,388 | |
| City of Minneapolis–Fairview Health Services Obligated Group MN | | 5.00% | | 11/15/2034 | | BBB+ | | | 2,000,000 | | | | 2,013,761 | |
| City of Seneca–Nemaha Valley Community Hospital KS | | 5.00% | | 9/1/2025 | | NR | | | 1,500,000 | | | | 1,507,585 | |
| City of Wichita–Presbyterian Manors Obligated Group KS(d) | | 5.25% | | 5/15/2039 | | NR | | | 1,500,000 | | | | 1,505,541 | |
| Connecticut State Health & Educational Facilities Authority–Griffin Health Obligated Group† | | 5.00% | | 7/1/2032 | | BB+ | | | 1,000,000 | | | | 1,017,941 | |
| Connecticut State Health & Educational Facilities Authority–Hartford HealthCare Obligated Group | | 5.00% | | 7/1/2034 | | A | | | 2,360,000 | | | | 2,361,127 | |
| County of Cuyahoga–MetroHealth System/The OH | | 5.00% | | 2/15/2042 | | BBB | | | 9,295,000 | | | | 9,448,896 | |
| County of Cuyahoga–MetroHealth System/The OH | | 5.25% | | 2/15/2047 | | BBB | | | 2,440,000 | | | | 2,491,649 | |
| | See Notes to Financial Statements. | 145 |
Schedule of Investments (continued)
SHORT DURATION HIGH INCOME MUNICIPAL BOND FUND September 30, 2024
| Investments | | Interest
Rate | | Maturity
Date | | Credit
Rating:
S&P or
Moody’s(a) | | Principal
Amount | | | Fair
Value | |
| Health Care (continued) | | | | | | | | | | | | | | |
| County of Muskingum–Genesis Healthcare Obligated Group OH | | 5.00% | | 2/15/2027 | | BB+ | | $ | 2,115,000 | | | $ | 2,116,034 | |
| County of Muskingum–Genesis Healthcare Obligated Group OH | | 5.00% | | 2/15/2033 | | BB+ | | | 8,545,000 | | | | 8,546,744 | |
| County of Washington–Marietta Area Health Care Inc Obligated Group OH | | 5.50% | | 12/1/2027 | | NR | | | 7,300,000 | | | | 7,418,143 | |
| Crawford County Memorial Hospital Inc LA | | 5.00% | | 6/15/2027 | | NR | | | 1,255,000 | | | | 1,275,013 | |
| Doylestown Hospital Authority–Doylestown Hospital Obligated Group PA† | | 5.00% | | 7/1/2031 | | NR | | | 1,000,000 | | | | 1,067,987 | |
| Dutchess County Local Development Corp.–Nuvance Health Obligated Group NY | | 4.00% | | 7/1/2034 | | BBB | | | 6,435,000 | | | | 6,462,320 | |
| Fulton County Industrial Development Authority–Fulton County Medical Center PA | | 4.00% | | 7/1/2028 | | NR | | | 2,270,000 | | | | 2,191,575 | |
| Glendale Industrial Development Authority–Beatitudes Campus Obligated Group AZ | | 4.00% | | 11/15/2027 | | NR | | | 295,000 | | | | 286,307 | |
| Grays Harbor County Public Hospital District No. 1 WA | | 5.75% | | 12/1/2033 | | BB+ | | | 5,105,000 | | | | 5,362,377 | |
| Greater Texas Cultural Education Facilities Finance Corp.–Texas Biomedical Research Institute TX | | 5.00% | | 6/1/2037 | | Baa2 | | | 730,000 | | | | 801,288 | |
| Greater Texas Cultural Education Facilities Finance Corp.–Texas Biomedical Research Institute TX | | 5.00% | | 6/1/2038 | | Baa2 | | | 3,710,000 | | | | 4,052,628 | |
| Henry County Hospital Authority–Piedmont Healthcare Inc Obligated Group GA | | 5.00% | | 7/1/2034 | | AA- | | | 4,695,000 | | | | 4,710,538 | |
| Idaho Health Facilities Authority–North Canyon Medical Center Inc | | 5.50% | | 11/1/2029 | | NR | | | 1,365,000 | | | | 1,408,009 | |
| Idaho Health Facilities Authority–North Canyon Medical Center Inc | | 6.25% | | 11/1/2035 | | NR | | | 2,610,000 | | | | 2,783,038 | |
| Illinois Finance Authority–Lifespace Communities Inc Obligated Group | | 5.00% | | 5/15/2035 | | BBB | (c) | | 1,350,000 | | | | 1,350,578 | |
| Illinois Finance Authority–Plymouth Place Obligated Group | | 5.00% | | 5/15/2025 | | NR | | | 25,000 | | | | 25,270 | |
| Illinois Finance Authority–Rush Obligated Group | | 5.00% | | 11/15/2038 | | A+ | | | 1,825,000 | | | | 1,839,701 | |
| 146 | See Notes to Financial Statements. |
Schedule of Investments (continued)
SHORT DURATION HIGH INCOME MUNICIPAL BOND FUND September 30, 2024
| Investments | | Interest
Rate | | Maturity
Date | | Credit
Rating:
S&P or
Moody’s(a) | | Principal
Amount | | | Fair
Value | |
| Health Care (continued) | | | | | | | | | | | | | | |
| Industrial Development Authority of the County of Pima–La Posada at Park Centre Inc Obligated Group AZ† | | 5.125% | | 11/15/2029 | | NR | | $ | 1,500,000 | | | $ | 1,514,813 | |
| King County Public Hospital District No. 4 WA | | 5.00% | | 12/1/2025 | | NR | | | 45,000 | | | | 45,069 | |
| Kremmling Memorial Hospital District CO† | | 5.00% | | 12/1/2029 | | NR | | | 1,760,000 | | | | 1,765,923 | |
| Kremmling Memorial Hospital District CO† | | 5.125% | | 12/1/2034 | | NR | | | 2,825,000 | | | | 2,772,689 | |
| Maryland Health & Higher Educational Facilities Authority–Adventist Healthcare Obligated Group | | 5.00% | | 1/1/2033 | | BBB | | | 2,500,000 | | | | 2,678,059 | |
| Massachusetts Development Finance Agency–Boston Medical Center Corp Obligated Group | | 5.00% | | 7/1/2035 | | BBB | | | 1,000,000 | | | | 1,022,915 | |
| Massachusetts Development Finance Agency–Tufts Medicine Obligated Group | | 5.00% | | 7/1/2025 | | BBB- | | | 1,400,000 | | | | 1,414,743 | |
| Massachusetts Development Finance Agency–Tufts Medicine Obligated Group | | 5.00% | | 7/1/2036 | | BBB- | | | 3,460,000 | | | | 3,525,878 | |
| Massachusetts Development Finance Agency–Tufts Medicine Obligated Group | | 8.50% | | 10/1/2026 | | BBB- | | | 8,900,000 | | | | 9,094,989 | |
| Massachusetts Health & Educational Facilities Authority–Trinity Health Corp Obligated Group | | 4.05%
(MUNIPSA * 1 + .90% | )# | 11/15/2032 | | AA- | | | 1,265,000 | | | | 1,220,980 | |
| Monroe County Hospital Authority–Centurion Foundation Lehigh Valley LLC PA† | | 5.10% | | 6/15/2039 | | NR | | | 10,000,000 | | | | 10,192,111 | |
| Nassau County Local Economic Assistance Corp.–Catholic Health Services of Long Island Obligated Group NY | | 5.00% | | 7/1/2032 | | A- | | | 1,250,000 | | | | 1,250,990 | |
| New Hampshire Business Finance Authority–NFA UH SPV LLC† | | 5.625% | | 12/15/2033 | | NR | | | 5,500,000 | | | | 5,676,698 | |
| New York State Dormitory Authority–Catholic Health System Obligated Group | | 5.00% | | 7/1/2028 | | B- | | | 1,000,000 | | | | 999,585 | |
| New York State Dormitory Authority–Catholic Health System Obligated Group | | 5.00% | | 7/1/2030 | | B- | | | 1,750,000 | | | | 1,752,796 | |
| New York State Dormitory Authority–Catholic Health System Obligated Group | | 5.00% | | 7/1/2041 | | B- | | | 1,400,000 | | | | 1,384,248 | |
| New York State Dormitory Authority–Northwell Health Obligated Group | | 4.00% | | 5/1/2035 | | A- | | | 3,075,000 | | | | 3,075,932 | |
| | See Notes to Financial Statements. | 147 |
Schedule of Investments (continued)
SHORT DURATION HIGH INCOME MUNICIPAL BOND FUND September 30, 2024
| Investments | | Interest
Rate | | Maturity
Date | | Credit
Rating:
S&P or
Moody’s(a) | | Principal
Amount | | | Fair
Value | |
| Health Care (continued) | | | | | | | | | | | | | | |
| Oklahoma Development Finance Authority-OU Medicine Obligated Group | | 5.00% | | 8/15/2027 | | BB | | $ | 500,000 | | | $ | 520,199 | |
| Oklahoma Development Finance Authority–OU Medicine Obligated Group | | 5.00% | | 8/15/2029 | | BB | | | 1,200,000 | | | | 1,262,499 | |
| Oklahoma Development Finance Authority–OU Medicine Obligated Group | | 5.00% | | 8/15/2033 | | BB | | | 3,305,000 | | | | 3,446,186 | |
| Oklahoma Development Finance Authority–OU Medicine Obligated Group | | 5.00% | | 8/15/2038 | | BB | | | 4,600,000 | | | | 4,751,303 | |
| Oklahoma Development Finance Authority–OU Medicine Obligated Group | | 5.25% | | 8/15/2048 | | BB | | | 1,730,000 | | | | 1,777,132 | |
| Oklahoma Development Finance Authority–OU Medicine Obligated Group | | 5.45% | | 8/15/2028 | | BB | | | 3,500,000 | | | | 3,400,272 | |
| Palm Beach County Health Facilities Authority–Lifespace Communities Inc Obligated Group FL | | 5.00% | | 5/15/2038 | | BBB | (c) | | 2,380,000 | | | | 2,381,019 | |
| Palomar Health–Palomar Health Obligated Group CA | | 5.00% | | 11/1/2042 | | BB+ | | | 1,000,000 | | | | 963,463 | |
| Palomar Health Obligated Group CA | | 5.00% | | 11/1/2031 | | BB+ | | | 2,875,000 | | | | 2,903,643 | |
| Palomar Health Obligated Group CA | | 5.00% | | 11/1/2039 | | BB+ | | | 1,000,000 | | | | 1,001,832 | |
| Public Finance Authority–Bancroft Neurohealth Obligated Group† | | 5.00% | | 6/1/2026 | | NR | | | 470,000 | | | | 474,080 | |
| Public Finance Authority–Bancroft Neurohealth Obligated Group WI† | | 5.00% | | 6/1/2036 | | NR | | | 1,500,000 | | | | 1,508,231 | |
| Public Finance Authority–Lehigh Valley Health Network Inc WI† | | 6.625% | | 12/1/2032 | | NR | | | 2,975,000 | | | | 3,018,853 | |
| Public Finance Authority–RBS Evolution LLC WI† | | 9.00% | | 11/1/2028 | | NR | | | 4,000,000 | | | | 4,210,983 | |
| Rhode Island Health & Educational Building Corp.–Care New England Health System Obligated Group | | 5.00% | | 9/1/2036 | | B+ | | | 10,500,000 | | | | 10,565,647 | |
| Roanoke County Economic Development Authority–Friendship Foundation | | 5.50% | #(b) | 9/1/2058 | | NR | | | 350,000 | | | | 350,392 | |
| South Carolina Jobs-Economic Development Authority–Kiawah Life Plan Village Inc | | 5.25% | | 11/15/2028 | | NR | | | 2,850,000 | | | | 2,866,128 | |
| South Carolina Jobs-Economic Development Authority–Kiawah Life Plan Village Inc | | 5.75% | | 11/15/2029 | | NR | | | 9,500,000 | | | | 9,462,964 | |
| Southeastern Ohio Port Authority–Marietta Area Healthcare Inc Obligated Group | | 5.50% | | 12/1/2029 | | B+ | (c) | | 2,335,000 | | | | 2,337,056 | |
| 148 | See Notes to Financial Statements. |
Schedule of Investments (continued)
SHORT DURATION HIGH INCOME MUNICIPAL BOND FUND September 30, 2024
| Investments | | Interest
Rate | | Maturity
Date | | Credit
Rating:
S&P or
Moody’s(a) | | Principal
Amount | | | Fair
Value | |
| Health Care (continued) | | | | | | | | | | | | | | |
| Washington Health Care Facilities Authority–CommonSpirit Health Obligated Group | | 5.00% | #(b) | 8/1/2049 | | A- | | $ | 5,120,000 | | | $ | 5,233,762 | |
| Washington Health Care Facilities Authority–Providence St Joseph Health Obligated Group | | 5.00% | | 10/1/2038 | | A | | | 3,000,000 | | | | 3,000,932 | |
| Westchester County Health Care Corp Obligated Group NY | | 5.00% | | 11/1/2046 | | BBB- | | | 2,400,000 | | | | 2,326,616 | |
| Wisconsin Health & Educational Facilities Authority–Marshfield Clinic Health System Obligated Group | | 5.00% | | 2/15/2029 | | BBB | | | 3,265,000 | | | | 3,509,947 | |
| Wisconsin Health & Educational Facilities Authority–Sauk-Prairie Memorial Hospital Inc Obligated Group | | 5.125% | | 2/1/2038 | | Ba2 | | | 1,950,000 | | | | 1,950,222 | |
| Wisconsin Health & Educational Facilities Authority–Wisconsin Masonic Home Obligated Group | | 5.25% | | 8/15/2039 | | BBB- | (c) | | 1,415,000 | | | | 1,554,394 | |
| Total | | | | | | | | | | | | | 273,595,914 | |
| | | | | | | | | | | | | | | |
| Housing 2.34% | | | | | | | | | | | | | | |
| California Housing Finance Agency | | 3.25% | | 8/20/2036 | | BBB | | | 2,723,787 | | | | 2,605,695 | |
| Connecticut Housing Finance Authority (FHLMC), (FNMA), (GNMA) | | 6.00% | | 11/15/2054 | | AAA | | | 4,650,000 | | | | 5,140,924 | |
| Delaware State Housing Authority (FHLMC), (FNMA), (GNMA) | | 6.00% | | 1/1/2055 | | Aa1 | | | 3,600,000 | | | | 4,032,729 | |
| Indiana Finance Authority–SFP-PUFWI LLC | | 4.00% | | 7/1/2034 | | BBB- | | | 3,070,000 | | | | 3,075,314 | |
| Iowa Finance Authority–Lifespace Communities Inc Obligated Group IA | | 6.75% | | 5/15/2033 | | BBB | (c) | | 4,700,000 | | | | 5,394,712 | |
| Massachusetts Development Finance Agency–CHF Merrimack Inc MA† | | 4.25% | | 7/1/2034 | | BB | | | 450,000 | | | | 461,273 | |
| Minnesota Housing Finance Agency (FHLMC), (FNMA), (GNMA) | | 6.25% | | 1/1/2054 | | AA+ | | | 4,295,000 | | | | 4,782,466 | |
| Montgomery County Housing Opportunities Commission MD | | 4.00% | | 7/1/2048 | | Aa2 | | | 315,000 | | | | 316,089 | |
| New Hampshire Business Finance Authority | | 4.375% | | 9/20/2036 | | BBB | | | 2,233,294 | | | | 2,298,794 | |
| New Jersey Housing & Mortgage Finance Agency | | 6.00% | | 10/1/2055 | | AA | | | 1,780,000 | | | | 1,973,753 | |
| North Carolina Housing Finance Agency | | 4.00% | | 7/1/2047 | | AA+ | | | 200,000 | | | | 200,736 | |
| Pennsylvania Housing Finance Agency AMT | | 4.00% | | 4/1/2039 | | AA+ | | | 120,000 | | | | 119,754 | |
| | See Notes to Financial Statements. | 149 |
Schedule of Investments (continued)
SHORT DURATION HIGH INCOME MUNICIPAL BOND FUND September 30, 2024
| Investments | | Interest
Rate | | Maturity
Date | | Credit
Rating:
S&P or
Moody’s(a) | | Principal
Amount | | | Fair
Value | |
| Housing (continued) | | | | | | | | | | | | | | |
| Public Finance Authority–CHF–Manoa LLC WI† | | 5.25% | | 7/1/2038 | | BBB- | | $ | 3,175,000 | | | $ | 3,516,638 | |
| Virginia Beach Development Authority–Westminster-Canterbury on Chesapeake Bay Obligated Group | | 5.375% | | 9/1/2029 | | BB+ | (c) | | 1,650,000 | | | | 1,719,910 | |
| Total | | | | | | | | | | | | | 35,638,787 | |
| | | | | | | | | | | | | | | |
| Lease Obligations 0.27% | | | | | | | | | | | | | | |
| City of Phoenix Civic Improvement Corp. AZ AMT | | 5.00% | | 7/1/2036 | | Aa3 | | | 1,695,000 | | | | 1,800,636 | |
| New Jersey Economic Development Authority | 4.40%
(MUNIPSA * 1 + 1.25% | )# | 9/1/2025 | | A2 | | | 2,290,000 | | | | 2,291,709 | |
| Total | | | | | | | | | | | | | 4,092,345 | |
| | | | | | | | | | | | | | | |
| Multi-Family Housing 0.53% | | | | | | | | | | | | | | |
| Illinois Housing Development Authority–South Shore IL Preservation LP (FHA), (HUD) | | 4.00% | #(b) | 6/1/2026 | | Aaa | | | 1,350,000 | | | | 1,355,073 | |
| New Hampshire Business Finance Authority | | 3.625% | | 8/20/2039 | | A3 | | | 6,986,194 | | | | 6,700,440 | |
| Total | | | | | | | | | | | | | 8,055,513 | |
| | | | | | | | | | | | | | | |
| Other Revenue 2.07% | | | | | | | | | | | | | | |
| Arlington Higher Education Finance Corp.–Newman International Academy TX | | 4.00% | | 8/15/2031 | | NR | | | 360,000 | | | | 344,310 | |
| Capital Trust Agency, Inc.–Franklin Academy Series 2020 Obligated Group FL† | | 4.00% | | 12/15/2025 | | NR | | | 300,000 | | | | 298,973 | |
| Capital Trust Agency, Inc.–Franklin Academy Series 2020 Obligated Group FL† | | 5.00% | | 12/15/2026 | | NR | | | 300,000 | | | | 304,283 | |
| Capital Trust Agency, Inc.–Franklin Academy Series 2020 Obligated Group FL† | | 5.00% | | 12/15/2029 | | NR | | | 1,095,000 | | | | 1,108,369 | |
| Cleveland-Cuyahoga County Port Authority–Playhouse Square Foundation OH | | 5.00% | | 12/1/2028 | | BB+ | | | 2,595,000 | | | | 2,667,642 | |
| Clifton Higher Education Finance Corp.–International Leadership of Texas Inc | | 5.25% | | 8/15/2026 | | Baa3 | | | 4,305,000 | | | | 4,374,490 | |
| Clifton Higher Education Finance Corp.–International Leadership of Texas Inc | | 5.25% | | 8/15/2028 | | Baa3 | | | 3,040,000 | | | | 3,093,293 | |
| 150 | See Notes to Financial Statements. |
Schedule of Investments (continued)
SHORT DURATION HIGH INCOME MUNICIPAL BOND FUND September 30, 2024
| Investments | | Interest
Rate | | Maturity
Date | | Credit
Rating:
S&P or
Moody’s(a) | | Principal
Amount | | | Fair
Value | |
| Other Revenue (continued) | | | | | | | | | | | | | | |
| Florida Development Finance Corp.–Renaissance Charter School Inc Series 2015 Obligated Group† | | 5.00% | | 6/15/2025 | | NR | | $ | 100,000 | | | $ | 100,324 | |
| Industrial Development Authority of the County of Pima–Edkey Inc Obligated Group† | | 3.50% | | 7/1/2025 | | NR | | | 265,000 | | | | 263,088 | |
| Jefferson Parish Economic Development & Port District–Kenner Discovery Health Science Foundation Inc LA† | | 4.80% | | 6/15/2029 | | NR | | | 2,005,000 | | | | 2,027,894 | |
| Maryland Economic Development Corp.(e) | | 5.00% | | 12/1/2031 | | NR | | | 1,500,000 | | | | 973,125 | |
| Territory of Guam | | 5.00% | | 11/15/2024 | | BB | | | 4,500,000 | | | | 4,502,144 | |
| Washington State Convention Center Public Facilities District | | 4.00% | | 7/1/2031 | | NR | | | 11,350,000 | | | | 11,456,242 | |
| Total | | | | | | | | | | | | | 31,514,177 | |
| | | | | | | | | | | | | | | |
| Pollution Control 1.17% | | | | | | | | | | | | | | |
| California Pollution Control Financing Authority | | 3.375% | | 7/1/2025 | | A- | | | 1,000,000 | | | | 1,000,296 | |
| California Pollution Control Financing Authority–Republic Services Inc AMT† | | 4.05% | #(b) | 7/1/2043 | | BBB+ | | | 6,000,000 | | | | 5,995,118 | |
| Finance Authority of Maine–Casella Waste Systems Inc ME AMT† | | 4.375% | #(b) | 8/1/2035 | | B+ | | | 2,750,000 | | | | 2,754,656 | |
| Illinois Finance Authority–LRS Holdings LLC AMT† | | 7.25% | #(b) | 9/1/2052 | | NR | | | 4,500,000 | | | | 5,081,854 | |
| Matagorda County Navigation District No. 1–AEP Texas Inc | | 4.00% | | 6/1/2030 | | BBB+ | | | 1,000,000 | | | | 1,000,508 | |
| Mississippi Business Finance Corp.–Waste Pro USA Inc AMT† | | 5.00% | #(b) | 2/1/2036 | | NR | | | 1,500,000 | | | | 1,532,491 | |
| Vermont Economic Development Authority–Casella Waste Systems Inc AMT† | | 4.625% | #(b) | 4/1/2036 | | B+ | | | 475,000 | | | | 484,620 | |
| Total | | | | | | | | | | | | | 17,849,543 | |
| | | | | | | | | | | | | | | |
| Special Tax 2.62% | | | | | | | | | | | | | | |
| Allentown Neighborhood Improvement Zone Development Authority PA† | | 5.00% | | 5/1/2028 | | NR | | | 1,000,000 | | | | 1,031,355 | |
| Allentown Neighborhood Improvement Zone Development Authority PA† | | 5.25% | | 5/1/2032 | | NR | | | 1,750,000 | | | | 1,841,310 | |
| Allentown Neighborhood Improvement Zone Development Authority PA† | | 5.25% | | 5/1/2042 | | NR | | | 1,750,000 | | | | 1,812,154 | |
| Allentown Neighborhood Improvement Zone Development Authority PA† | | 6.00% | | 5/1/2042 | | NR | | | 3,720,000 | | | | 3,966,429 | |
| | See Notes to Financial Statements. | 151 |
Schedule of Investments (continued)
SHORT DURATION HIGH INCOME MUNICIPAL BOND FUND September 30, 2024
| Investments | | Interest
Rate | | Maturity
Date | | Credit
Rating:
S&P or
Moody’s(a) | | Principal
Amount | | | Fair
Value | |
| Special Tax (continued) | | | | | | | | | | | | | | |
| Babcock Ranch Community Independent Special District FL | | 4.125% | | 5/1/2027 | | NR | | $ | 940,000 | | | $ | 942,191 | |
| Babcock Ranch Community Independent Special District FL | | 4.25% | | 5/1/2032 | | NR | | | 2,000,000 | | | | 2,022,241 | |
| Celebration Pointe Community Development District No. 1 FL | | 2.375% | | 5/1/2026 | | NR | | | 430,000 | | | | 419,764 | |
| City of Baltimore MD | | 4.50% | | 6/1/2033 | | NR | | | 400,000 | | | | 408,533 | |
| Industrial Development Authority of the City of St. Louis Missouri | | 3.875% | | 11/15/2029 | | NR | | | 2,565,000 | | | | 2,441,095 | |
| Lakewood Ranch Stewardship District FL | | 5.40% | | 5/1/2028 | | NR | | | 990,000 | | | | 1,011,465 | |
| Lakewood Ranch Stewardship District FL | | 5.45% | | 5/1/2033 | | NR | | | 2,660,000 | | | | 2,831,357 | |
| Mida Mountain Village Public Infrastructure District–Mountain Village Assessment Area No 2 UT† | | 4.00% | | 8/1/2025 | | NR | | | 1,205,000 | | | | 1,205,398 | |
| Military Installation Development Authority UT | | 4.00% | | 6/1/2036 | | NR | | | 4,750,000 | | | | 4,473,490 | |
| New York City Industrial Development Agency–Yankee Stadium LLC NY (FGIC) | | 3.765%
(CPI YoY * 1 + 0.87% | ) | 3/1/2025 | | Baa1 | | | 1,585,000 | | | | 1,583,341 | |
| New York City Industrial Development Agency–Yankee Stadium LLC NY (FGIC) | | 3.775%
(CPI YoY * 1 + 0.88% | ) | 3/1/2026 | | Baa1 | | | 1,350,000 | | | | 1,354,177 | |
| Northern Palm Beach County Improvement District FL | | 5.00% | | 8/1/2046 | | NR | | | 2,150,000 | | | | 2,153,791 | |
| Peninsula Town Center Community Development Authority VA† | | 4.50% | | 9/1/2028 | | NR | | | 560,000 | | | | 569,531 | |
| Scranton Redevelopment Authority PA GTD | | 5.00% | | 11/15/2028 | | BBB+ | | | 190,000 | | | | 190,110 | |
| Village Community Development District No. 12 FL | | 4.00% | | 5/1/2033 | | NR | | | 1,305,000 | | | | 1,318,386 | |
| Village Metropolitan District CO GO | | 4.15% | | 12/1/2030 | | NR | | | 3,650,000 | | | | 3,631,507 | |
| West Villages Improvement District FL | | 4.25% | | 5/1/2029 | | NR | | | 1,935,000 | | | | 1,949,774 | |
| West Villages Improvement District FL | | 4.75% | | 5/1/2039 | | NR | | | 2,000,000 | | | | 1,993,880 | |
| Westview South Community Development District FL | | 4.75% | | 5/1/2028 | | NR | | | 185,000 | | | | 186,865 | |
| Westview South Community Development District FL | | 4.875% | | 5/1/2028 | | NR | | | 475,000 | | | | 480,486 | |
| Total | | | | | | | | | | | | | 39,818,630 | |
| 152 | See Notes to Financial Statements. |
Schedule of Investments (continued)
SHORT DURATION HIGH INCOME MUNICIPAL BOND FUND September 30, 2024
| Investments | | Interest
Rate | | Maturity
Date | | Credit
Rating:
S&P or
Moody’s(a) | | Principal
Amount | | | Fair
Value | |
| Tax Revenue 3.62% | | | | | | | | | | | | | | |
| American Samoa Economic Development Authority† | | 6.50% | | 9/1/2028 | | Ba3 | | $ | 1,040,000 | | | $ | 1,099,137 | |
| City of Sparks NV† | | 2.75% | | 6/15/2028 | | Baa2 | | | 3,995,000 | | | | 3,910,668 | |
| Matching Fund Special Purpose Securitization Corp.–United States Virgin Islands Federal Excise Tax | | 5.00% | | 10/1/2027 | | NR | | | 1,000,000 | | | | 1,043,111 | |
| Matching Fund Special Purpose Securitization Corp.–United States Virgin Islands Federal Excise Tax | | 5.00% | | 10/1/2032 | | NR | | | 2,535,000 | | | | 2,692,056 | |
| Matching Fund Special Purpose Securitization Corp.–United States Virgin Islands Federal Excise Tax | | 5.00% | | 10/1/2039 | | NR | | | 9,620,000 | | | | 10,075,579 | |
| Public Finance Authority–Southeast Overtown Park West Community Redevelopment Agency WI† | | 5.00% | | 6/1/2041 | | NR | | | 16,000,000 | | | | 16,443,079 | |
| Puerto Rico Sales Tax Financing Corp. Sales Tax Revenue | | 4.50% | | 7/1/2034 | | NR | | | 19,855,000 | | | | 19,894,186 | |
| Puerto Rico Sales Tax Financing Corp. Sales Tax Revenue | | 4.536% | | 7/1/2053 | | NR | | | 1,000 | | | | 992 | |
| Total | | | | | | | | | | | | | 55,158,808 | |
| | | | | | | | | | | | | | | |
| Tobacco 1.03% | | | | | | | | | | | | | | |
| Nassau County Tobacco Settlement Corp. NY | | 5.00% | | 6/1/2035 | | CCC+ | | | 1,670,000 | | | | 1,576,883 | |
| Nassau County Tobacco Settlement Corp. NY | | 5.25% | | 6/1/2026 | | CCC+ | | | 8,081,680 | | | | 7,928,731 | |
| TSASC, Inc. NY | | 5.00% | | 6/1/2025 | | B- | | | 6,100,000 | | | | 6,104,336 | |
| Total | | | | | | | | | | | | | 15,609,950 | |
| | | | | | | | | | | | | | | |
| Transportation 10.32% | | | | | | | | | | | | | | |
| California Municipal Finance Authority–LAX Integrated Express Solutions LLC | | 5.00% | | 6/30/2027 | | BB+ | (c) | | 695,000 | | | | 723,136 | |
| California Municipal Finance Authority–LAX Integrated Express Solutions LLC | | 5.00% | | 6/30/2028 | | BB+ | (c) | | 1,650,000 | | | | 1,737,882 | |
| California Municipal Finance Authority–LAX Integrated Express Solutions LLC AMT | | 5.00% | | 12/31/2028 | | BB+ | (c) | | 1,000,000 | | | | 1,053,034 | |
| Chicago O’Hare International Airport IL | | 5.00% | | 1/1/2032 | | A+ | | | 2,325,000 | | | | 2,333,919 | |
| City & County of Denver–United Airlines Inc CO AMT | | 5.00% | | 10/1/2032 | | BB- | | | 9,040,000 | | | | 9,042,743 | |
| City & County of Denver Airport System Revenue CO AMT | | 5.00% | | 12/1/2035 | | A+ | | | 4,165,000 | | | | 4,385,477 | |
| | See Notes to Financial Statements. | 153 |
Schedule of Investments (continued)
SHORT DURATION HIGH INCOME MUNICIPAL BOND FUND September 30, 2024
| Investments | | Interest
Rate | | Maturity
Date | | Credit
Rating:
S&P or
Moody’s(a) | | Principal
Amount | | | Fair
Value | |
| Transportation (continued) | | | | | | | | | | | | | | |
| County of Miami-Dade Aviation Revenue FL AMT | | 5.00% | | 10/1/2032 | | A+ | | $ | 10,000,000 | | | $ | 10,011,301 | |
| County of Miami-Dade Seaport Department FL AMT | | 5.00% | | 10/1/2036 | | A3 | | | 1,300,000 | | | | 1,419,960 | |
| Eagle County Airport Terminal Corp. CO AMT | | 5.00% | | 5/1/2037 | | Baa2 | | | 2,045,000 | | | | 2,086,059 | |
| Florida Development Finance Corp.–AAF Operations Holdings LLC AMT† | | 12.00% | #(b) | 7/15/2032 | | NR | | | 5,500,000 | | | | 5,867,011 | |
| Maryland Economic Development Corp.–CONSOL Marine Terminals LLC | | 5.75% | | 9/1/2025 | | BB | | | 14,270,000 | | | | 14,383,916 | |
| Maryland Economic Development Corp.–Purple Line Transit Partners LLC AMT | | 5.00% | | 11/12/2028 | | Baa3 | | | 9,995,000 | | | | 10,243,366 | |
| Metropolitan Transportation Authority NY | | 5.00% | | 11/15/2031 | | A- | | | 1,975,000 | | | | 2,016,278 | |
| Metropolitan Washington Airports Authority Dulles Toll Road Revenue DC | | 5.00% | | 10/1/2034 | | A- | | | 1,250,000 | | | | 1,339,238 | |
| New York City Transitional Development Corp.–JFK NTO LLC NY AMT | | 5.50% | | 6/30/2038 | | Baa3 | | | 2,000,000 | | | | 2,224,124 | |
| New York Transportation Development Corp.–Delta Air Lines Inc AMT | | 4.00% | | 10/1/2030 | | Baa3 | | | 14,725,000 | | | | 14,868,006 | |
| New York Transportation Development Corp.–Delta Air Lines Inc AMT | | 4.00% | | 1/1/2036 | | Baa3 | | | 5,000,000 | | | | 5,002,774 | |
| New York Transportation Development Corp.–Delta Air Lines Inc AMT | | 5.00% | | 1/1/2033 | | Baa3 | | | 2,500,000 | | | | 2,585,194 | |
| New York Transportation Development Corp.–Delta Air Lines Inc AMT | | 5.00% | | 1/1/2036 | | Baa3 | | | 14,000,000 | | | | 14,421,299 | |
| New York Transportation Development Corp.–Delta Air Lines Inc AMT | | 6.00% | | 4/1/2035 | | Baa3 | | | 3,000,000 | | | | 3,394,976 | |
| New York Transportation Development Corp.–Empire State Thruway Partners LLC AMT | | 2.50% | | 10/31/2031 | | BBB- | (c) | | 1,365,000 | | | | 1,172,243 | |
| New York Transportation Development Corp.–JFK International Air Terminal LLC AMT | | 5.00% | | 12/1/2038 | | Baa1 | | | 2,240,000 | | | | 2,392,447 | |
| New York Transportation Development Corp.–JFK NTO LLC | | 5.25% | | 6/30/2038 | | Baa3 | | | 2,565,000 | | | | 2,848,995 | |
| New York Transportation Development Corp.–JFK NTO LLC | | 5.25% | | 6/30/2040 | | Baa3 | | | 1,500,000 | | | | 1,640,385 | |
| New York Transportation Development Corp.–JFK NTO LLC AMT | | 5.25% | | 6/30/2041 | | Baa3 | | | 1,000,000 | | | | 1,090,679 | |
| New York Transportation Development Corp.–JFK NTO LLC NY AMT | | 5.50% | | 6/30/2039 | | Baa3 | | | 1,000,000 | | | | 1,106,280 | |
| 154 | See Notes to Financial Statements. |
Schedule of Investments (continued)
SHORT DURATION HIGH INCOME MUNICIPAL BOND FUND September 30, 2024
| Investments | | Interest
Rate | | Maturity
Date | | Credit
Rating:
S&P or
Moody’s(a) | | Principal
Amount | | | Fair
Value | |
| Transportation (continued) | | | | | | | | | | | | | | |
| New York Transportation Development Corp.–Laguardia Gateway Partner AMT | | 5.00% | | 7/1/2034 | | Baa2 | | $ | 6,000,000 | | | $ | 6,008,565 | |
| New York Transportation Development Corp.–Laguardia Gateway Partners LLC (AGM) AMT | | 4.00% | | 7/1/2031 | | AA | | | 3,925,000 | | | | 3,925,398 | |
| North Parkway Municipal Management District No. 1 TX† | | 3.625% | | 9/15/2026 | | NR | | | 400,000 | | | | 400,368 | |
| Pennsylvania Turnpike Commission Registration Fee Revenue | | 4.00%
(MUNIPSA * 1 + .85% | )# | 7/15/2041 | | AA- | | | 5,000,000 | | | | 5,001,926 | |
| Port of Beaumont Navigation District–Jefferson 2020 Bond Lessee & Borrower LLC Obligated Group TX AMT† | | 3.625% | | 1/1/2035 | | NR | | | 2,000,000 | | | | 1,876,274 | |
| Public Finance Authority–Air Cargo Obligated Group WI | | 5.00% | | 7/1/2031 | | BBB | | | 1,875,000 | | | | 2,028,572 | |
| Public Finance Authority–Air Cargo Obligated Group WI AMT | | 5.00% | | 7/1/2032 | | BBB | | | 1,845,000 | | | | 2,008,620 | |
| Texas Private Activity Bond Surface Transportation Corp.–NTE Mobility Partners Segments 3 LLC AMT | | 5.375% | | 6/30/2037 | | Baa1 | | | 1,750,000 | | | | 1,909,288 | |
| Texas Private Activity Bond Surface Transportation Corp.–NTE Mobility Partners Segments 3 LLC AMT | | 5.375% | | 6/30/2038 | | Baa1 | | | 1,000,000 | | | | 1,087,079 | |
| Texas Private Activity Bond Surface Transportation Corp.–NTE Mobility Partners Segments 3 LLC AMT | | 5.375% | | 6/30/2039 | | Baa1 | | | 1,580,000 | | | | 1,713,793 | |
| Virginia Small Business Financing Authority–95 Express Lanes LLC AMT | | 5.00% | | 1/1/2034 | | BBB | | | 6,605,000 | | | | 7,126,565 | |
| Virginia Small Business Financing Authority–Elizabeth River Crossings OpCo LLC AMT | | 4.00% | | 1/1/2038 | | BBB | | | 4,525,000 | | | | 4,513,249 | |
| Total | | | | | | | | | | | | | 156,990,419 | |
| | | | | | | | | | | | | | | |
| Utilities 13.62% | | | | | | | | | | | | | | |
| Black Belt Energy Gas District AL | | 4.00% | #(b) | 12/1/2052 | | Baa1 | | | 4,890,000 | | | | 4,930,298 | |
| Black Belt Energy Gas District AL | | 5.25% | #(b) | 5/1/2055 | | A1 | | | 8,905,000 | | | | 9,818,343 | |
| Black Belt Energy Gas District AL | | 5.50% | #(b) | 6/1/2049 | | A2 | | | 2,350,000 | | | | 2,543,628 | |
| California Community Choice Financing Authority | | 5.00% | #(b) | 1/1/2055 | | A1 | | | 16,250,000 | | | | 17,852,247 | |
| California Community Choice Financing Authority | | 5.25% | | 11/1/2054 | | A2 | | | 3,300,000 | | | | 3,594,001 | |
| | See Notes to Financial Statements. | 155 |
Schedule of Investments (continued)
SHORT DURATION HIGH INCOME MUNICIPAL BOND FUND September 30, 2024
| Investments | | Interest
Rate | | Maturity
Date | | Credit
Rating:
S&P or
Moody’s(a) | | Principal
Amount | | | Fair
Value | |
| Utilities (continued) | | | | | | | | | | | | | | |
| Central Plains Energy Project NE | | 5.00% | #(b) | 5/1/2054 | | Aa2 | | $ | 5,000,000 | | | $ | 5,365,078 | |
| Charlotte County Industrial Development Authority–MSKP Town & Country Utility LLC† | | 5.00% | | 10/1/2029 | | NR | | | 2,110,000 | | | | 2,186,009 | |
| Charlotte County Industrial Development Authority–MSKP Town & Country Utility LLC† | | 5.00% | | 10/1/2034 | | NR | | | 1,000,000 | | | | 1,024,769 | |
| Charlotte County Industrial Development Authority–MSKP Town & Country Utility LLC AMT† | | 5.50% | | 10/1/2036 | | NR | | | 3,345,000 | | | | 3,390,461 | |
| City of Osceola–Plum Point Energy Associates LLC AR AMT | | 5.50% | #(b) | 4/1/2036 | | NR | | | 11,750,000 | | | | 11,820,267 | |
| City of Seattle Municipal Light & Power Revenue WA | 3.40%
(MUNIPSA * 1 + .25% | )# | 5/1/2045 | | AA | | | 3,000,000 | | | | 2,946,024 | |
| County of Trimble–Louisville Gas and Electric Co KY AMT | | 4.70% | #(b) | 6/1/2054 | | A1 | | | 1,750,000 | | | | 1,768,551 | |
| County of Washoe–Sierra Pacific Power Co NV | | 4.125% | #(b) | 3/1/2036 | | A | | | 1,365,000 | | | | 1,386,474 | |
| Delaware State Economic Development Authority–NRG Energy Inc | | 1.25% | #(b) | 10/1/2045 | | BBB- | | | 5,000,000 | | | | 4,867,982 | |
| Energy Southeast A Cooperative District AL | | 5.25% | #(b) | 7/1/2054 | | A1 | | | 3,000,000 | | | | 3,323,227 | |
| Energy Southeast A Cooperative District AL | | 5.75% | #(b) | 4/1/2054 | | A1 | | | 2,000,000 | | | | 2,273,345 | |
| Florida Development Finance Corp.–Waste Pro USA Inc AMT | | 3.00% | | 6/1/2032 | | NR | | | 5,000,000 | | | | 4,472,848 | |
| Illinois Finance Authority–Peoples Gas Light & Coke Co/The | | 3.90% | | 3/1/2030 | | Aa3 | | | 5,000,000 | | | | 4,999,842 | |
| Kentucky Public Energy Authority | | 5.00% | #(b) | 5/1/2055 | | A2 | | | 4,500,000 | | | | 4,843,036 | |
| Main Street Natural Gas, Inc. GA† | | 4.00% | #(b) | 8/1/2052 | | BBB- | | | 17,800,000 | | | | 17,778,131 | |
| Main Street Natural Gas, Inc. GA | | 4.00% | #(b) | 9/1/2052 | | A3 | | | 1,190,000 | | | | 1,213,237 | |
| Main Street Natural Gas, Inc. GA | 4.943%
(SOFR * .67 + 1.70% | )# | 12/1/2053 | | Aa1 | | | 5,000,000 | | | | 5,158,715 | |
| Main Street Natural Gas, Inc. GA | | 5.00% | #(b) | 12/1/2054 | | A3 | | | 5,500,000 | | | | 5,939,438 | |
| Northern Palm Beach County Improvement District FL | | 5.00% | | 8/1/2034 | | NR | | | 3,200,000 | | | | 3,205,643 | |
| Pennsylvania Economic Development Financing Authority–Talen Energy Supply LLC | | 5.25% | #(b) | 12/1/2037 | | BB- | | | 6,320,000 | | | | 6,441,831 | |
| Pennsylvania Economic Development Financing Authority–Talen Energy Supply LLC | | 5.25% | #(b) | 12/1/2038 | | BB- | | | 4,390,000 | | | | 4,474,282 | |
| 156 | See Notes to Financial Statements. |
Schedule of Investments (continued)
SHORT DURATION HIGH INCOME MUNICIPAL BOND FUND September 30, 2024
| Investments | | Interest
Rate | | Maturity
Date | | Credit
Rating:
S&P or
Moody’s(a) | | Principal
Amount | | | Fair
Value | |
| Utilities (continued) | | | | | | | | | | | | | | |
| Puerto Rico Commonwealth Aqueduct & Sewer Authority† | | 4.00% | | 7/1/2042 | | NR | | $ | 6,370,000 | | | $ | 6,116,832 | |
| Puerto Rico Commonwealth Aqueduct & Sewer Authority† | | 5.00% | | 7/1/2030 | | NR | | | 6,285,000 | | | | 6,661,263 | |
| Puerto Rico Commonwealth Aqueduct & Sewer Authority† | | 5.00% | | 7/1/2033 | | NR | | | 5,230,000 | | | | 5,570,365 | |
| Puerto Rico Commonwealth Aqueduct & Sewer Authority† | | 5.00% | | 7/1/2035 | | NR | | | 1,500,000 | | | | 1,575,426 | |
| Puerto Rico Commonwealth Aqueduct & Sewer Authority PR† | | 5.00% | | 7/1/2037 | | NR | | | 1,000,000 | | | | 1,062,976 | |
| Southeast Alabama Gas Supply District AL | | 5.00% | #(b) | 8/1/2054 | | Aa3 | | | 9,000,000 | | | | 9,786,323 | |
| Southeast Energy Authority A Cooperative District AL | | 5.663%
(SOFR * .67 + 2.42% | )# | 1/1/2053 | | A1 | | | 10,000,000 | | | | 10,539,000 | |
| Southern California Public Power Authority–City of Anaheim Electric System Revenue CA | | 5.00% | #(b) | 4/1/2055 | | A2 | | | 5,250,000 | | | | 5,686,180 | |
| Tennergy Corp. TN | | 5.50% | #(b) | 10/1/2053 | | Baa1 | | | 8,195,000 | | | | 8,944,240 | |
| Texas Municipal Gas Acquisition & Supply Corp. III–Texas Municipal Gas Acquisition & Supply Corp III TX | | 5.00% | | 12/15/2032 | | A1 | | | 4,080,000 | | | | 4,466,712 | |
| Texas Municipal Gas Acquisition & Supply Corp. IV | | 5.50% | #(b) | 1/1/2054 | | A1 | | | 8,000,000 | | | | 9,103,743 | |
| Total | | | | | | | | | | | | | 207,130,767 | |
| Total Municipal Bonds (cost $1,434,855,634) | | | | | | | | | | | | | 1,469,768,757 | |
| | | Interest
Rate# | | Interest
Rate
Reset
Date(f) | | Final
Maturity
Date | | | | | | | | |
| SHORT-TERM INVESTMENTS 2.06% | | | | | | | | | | | | | | | | |
| | | | | | | | | | | | | | | | | |
| VARIABLE RATE DEMAND NOTES 2.06% | | | | | | | | | | | | | | | | |
| | | | | | | | | | | | | | | | | |
| Corporate-Backed 0.37% | | | | | | | | | | | | | | | | |
| Maryland Industrial Development Financing Authority–Occidental Petroleum Corp | | 5.200% | | 10/1/2024 | | 3/1/2030 | | Baa3 | | | 5,645,000 | | | | 5,645,000 | |
| | | | | | | | | | | | | | | | | |
| General Obligation 0.19% | | | | | | | | | | | | | | | | |
| City of New York NY GO | | 4.050% | | 10/1/2024 | | 10/1/2046 | | AA | | | 270,000 | | | | 270,000 | |
| City of New York NY GO | | 4.150% | | 10/1/2024 | | 4/1/2042 | | AA | | | 1,075,000 | | | | 1,075,000 | |
| City of New York NY GO | | 4.150% | | 10/1/2024 | | 4/1/2042 | | AA | | | 1,580,000 | | | | 1,580,000 | |
| Total | | | | | | | | | | | | | | | 2,925,000 | |
| | See Notes to Financial Statements. | 157 |
Schedule of Investments (continued)
SHORT DURATION HIGH INCOME MUNICIPAL BOND FUND September 30, 2024
| Investments | | Interest
Rate | | Interest
Rate
Reset
Date(f) | | Final
Maturity
Date | | Credit
Rating:
S&P or
Moody’s(a) | | Principal
Amount | | | Fair
Value | |
| Health Care 1.50% | | | | | | | | | | | | | | | | |
| Montgomery County Higher Education & Health Authority–Thomas Jefferson University Obligated Group PA | | 3.950% | | 10/1/2024 | | 9/1/2050 | | A | | $ | 16,265,000 | | | $ | 16,265,000 | |
| Wisconsin Health & Educational Facilities Authority–Marshfield Clinic Health System Obligated Group | | 5.000% | | 10/1/2024 | | 2/15/2053 | | BBB | | | 6,450,000 | | | | 6,450,000 | |
| Total | | | | | | | | | | | | | | | 22,715,000 | |
| Total Short-Term Investments (cost $31,285,000) | | | | | | | | | | | | | 31,285,000 | |
| Total Investments in Securities 98.84% (cost $1,468,535,948) | | | | | | | | | | | | | 1,503,478,757 | |
| Other Assets and Liabilities – Net(g)1.16% | | | | | | | | | | | | | 17,645,414 | |
| Net Assets 100.00% | | | | | | | | | | | | | | $ | 1,521,124,171 | |
| AGM | | Insured by–Assured Guaranty Municipal Corporation. |
| AMT | | Income from the security may be subject to Alternative Minimum Tax. |
| COPS | | Certificates of Participation. |
| CPI | | Consumer Price Index: Rate fluctuates based on CPI. |
| FGIC | | Insured by–Financial Guaranty Insurance Company. |
| FHA | | Insured by–Federal Housing Administration. |
| FHLMC | | Insured by-Federal Home Loan Mortgage Corporation. |
| FNMA | | Federal National Mortgage Association. |
| GNMA | | Government National Mortgage Association. |
| GTD | | Guaranteed. |
| HUD | | Insured by–Department of Housing and Urban Development. |
| MUNIPSA | | SIFMA Municipal Swap Index Yield. |
| NR | | Not Rated. |
| SIFMA | | Insured by–Securities Industry and Financial Markets Association. |
| SOFR | | Secured Overnight Financing Rate. |
| TRIPS | | Tax Refund Intercept Programs. |
| YoY | | Year on Year Inflation Rates. |
| † | | Security was purchased pursuant to Rule 144A under the Securities Act of 1933 and, unless registered under such Act or exempted from registration, may only be resold to qualified institutional buyers. At September 30, 2024, the total value of Rule 144A securities was $373,254,287, which represents 24.54% of net assets. |
| # | | Variable rate security. The interest rate represents the rate in effect at September 30, 2024. |
| (a) | | Unaudited. |
| (b) | | Variable Rate is Fixed to Float: Rate remains fixed or at Zero Coupon until designated future date. |
| (c) | | This investment has been rated by Fitch IBCA. |
| (d) | | Securities purchased on a when-issued basis (See Note 2(g)). |
| (e) | | Defaulted (non-income producing security). |
| (f) | | The interest rate reset date shown represents the date in which the Fund has the right to sell a Variable Rate Demand Note (“VRDN”) back to the issuer for Principal Amount. The interest rate on the VRDN is generally reset daily based on the SIFMA Municipal Swap Index. |
| (g) | | Other Assets and Liabilities–Net include net unrealized appreciation/depreciation on futures contracts as follows: |
| 158 | See Notes to Financial Statements. |
Schedule of Investments (concluded)
SHORT DURATION HIGH INCOME MUNICIPAL BOND FUND September 30, 2024
Futures Contracts at September 30, 2024:
| Type | | Expiration | | Contracts | | Position | | Notional
Amount | | | Notional
Value | | | Unrealized
Appreciation | |
| U.S. Long Bond | | December 2024 | | 40 | | Short | | | $(4,976,888 | ) | | | $(4,967,500 | ) | | | $9,388 | |
The following is a summary of the inputs used as of September 30, 2024 in valuing the Fund’s investments carried at fair value(1):
| Investment Type(2) | | Level 1 | | | Level 2 | | | Level 3 | | | Total | |
| Long-Term Investments | | | | | | | | | | | | | | | | |
| Corporate Bonds | | $ | – | | | $ | 2,425,000 | | | $ | – | | | $ | 2,425,000 | |
| Municipal Bonds | | | – | | | | 1,469,768,757 | | | | – | | | | 1,469,768,757 | |
| Short-Term Investments | | | | | | | | | | | | | | | | |
| Variable Rate Demand Notes | | | – | | | | 31,285,000 | | | | – | | | | 31,285,000 | |
| Total | | $ | – | | | $ | 1,503,478,757 | | | $ | – | | | $ | 1,503,478,757 | |
| Other Financial Instruments | | | | | | | | | | | | | | | | |
| Futures Contracts | | | | | | | | | | | | | | | | |
| Assets | | $ | 9,388 | | | $ | – | | | $ | – | | | $ | 9,388 | |
| Liabilities | | | – | | | | – | | | | – | | | | – | |
| Total | | $ | 9,388 | | | $ | – | | | $ | – | | | $ | 9,388 | |
| | | |
| (1) | | Refer to Note 2(i) for a description of fair value measurements and the three-tier hierarchy of inputs. |
| (2) | | See Schedule of Investments for fair values in each industry. The table above is presented by Investment Type. Industries are presented within an Investment Type should such Investment Type include securities classified as two or more levels within the three-tier fair value hierarchy. When applicable, each Level 3 security is identified on the Schedule of Investments along with the valuation technique utilized. |
A reconciliation of Level 3 investments is presented when the Fund has a material amount of Level 3 investments at the beginning or end of the year in relation to the Fund’s net assets.
The following is a reconciliation of investments with unobservable inputs (Level 3) that were used in determining fair value:
| Investment Type | | Municipal Bonds | |
| Balance as of October 1, 2023 | | $ | 14,882,022 | |
| Accrued Discounts (Premiums) | | | 13,012 | |
| Realized Gain (Loss) | | | (40,327 | ) |
| Change in Unrealized Appreciation (Depreciation) | | | 92,267 | |
| Purchases | | | – | |
| Sales | | | (4,732,500 | ) |
| Transfers into Level 3 | | | – | |
| Transfers out of Level 3(a) | | | (10,214,474 | ) |
| Balance as of September 30, 2024 | | $ | – | |
| Change in unrealized appreciation/depreciation for the year ended September 30, 2024, related to Level 3 investments held at September 30, 2024 | | $ | – | |
| | | |
| (a) | | The Fund recognizes transfers within the fair value hierarchy as of the beginning of the period. Transfers into and out of Level 3 were primarily related to the availability of market quotations in accordance with valuation methodology. |
| | See Notes to Financial Statements. | 159 |
Schedule of Investments
SUSTAINABLE MUNICIPAL BOND FUND September 30, 2024
| Investments | | Interest
Rate | | Maturity
Date | | Credit
Rating:
S&P or
Moody’s(a) | | Principal
Amount | | | Fair
Value | |
| LONG-TERM INVESTMENTS 98.38% | | | | | | | | | | | | | | |
| | | | | | | | | | | | | | | |
| MUNICIPAL BONDS 98.38% | | | | | | | | | | | | | | |
| | | | | | | | | | | | | | | |
| Corporate-Backed 2.21% | | | | | | | | | | | | | | |
| Michigan Strategic Fund–Graphic Packaging International LLC AMT | | 4.00% | #(b) | 10/1/2061 | | BB | | $ | 125,000 | | | $ | 125,716 | |
| | | | | | | | | | | | | | | |
| Education 16.47% | | | | | | | | | | | | | | |
| Build NYC Resource Corp.–East Harlem Scholars Academy Charter School Obligated Group NY† | | 5.00% | | 6/1/2032 | | BB | | | 100,000 | | | | 106,938 | |
| California Community Choice Financing Authority | | 4.00% | #(b) | 5/1/2053 | | A1 | | | 150,000 | | | | 153,649 | |
| Clifton Higher Education Finance Corp.–International Leadership of Texas Inc | | 6.00% | | 8/15/2038 | | Baa3 | | | 110,000 | | | | 112,211 | |
| Duval County Public Schools FL COPS (AGM) | | 5.00% | | 7/1/2035 | | AA | | | 150,000 | | | | 166,140 | |
| Florida Development Finance Corp.–Renaissance Charter School Inc Series 2020C/D Obligated Group† | | 5.00% | | 9/15/2040 | | NR | | | 100,000 | | | | 98,164 | |
| Fort Bend Independent School District TX GO (PSF-GTD) | | 0.875% | #(b) | 8/1/2050 | | AAA | | | 145,000 | | | | 142,071 | |
| Massachusetts Development Finance Agency–Franklin W Olin College of Engineering Inc | | 5.00% | | 11/1/2039 | | A | | | 140,000 | | | | 157,947 | |
| Total | | | | | | | | | | | | | 937,120 | |
| | | | | | | | | | | | | | | |
| General Obligation 15.90% | | | | | | | | | | | | | | |
| California Community Choice Financing Authority | | 5.00% | #(b) | 12/1/2053 | | A2 | | | 150,000 | | | | 160,589 | |
| California Community Choice Financing Authority | | 5.50% | #(b) | 5/1/2054 | | A2 | | | 100,000 | | | | 107,979 | |
| Chicago Board of Education IL GO | | 4.00% | | 12/1/2039 | | BB+ | | | 125,000 | | | | 121,147 | |
| New Jersey Transportation Trust Fund Authority | | 5.25% | | 6/15/2036 | | A2 | | | 200,000 | | | | 232,376 | |
| Pennsylvania Economic Development Financing Authority–Commonwealth of Pennsylvania Department of Transportation AMT | | 5.50% | | 6/30/2037 | | Baa2 | | | 125,000 | | | | 141,332 | |
| San Marcos Consolidated Independent School District TX (PSF-GTD) | | 5.00% | | 8/15/2040 | | Aaa | | | 125,000 | | | | 141,306 | |
| Total | | | | | | | | | | | | | 904,729 | |
| 160 | See Notes to Financial Statements. |
Schedule of Investments (continued)
SUSTAINABLE MUNICIPAL BOND FUND September 30, 2024
| Investments | | Interest
Rate | | Maturity
Date | | Credit
Rating:
S&P or
Moody’s(a) | | Principal
Amount | | | Fair
Value | |
| Health Care 26.80% | | | | | | | | | | | | | | |
| Antelope Valley Healthcare District Obligated Group CA | | 5.00% | | 3/1/2026 | | BBB | | $ | 80,000 | | | $ | 80,383 | |
| Board of Managers Joint Guadalupe County-City of Seguin Hospital TX | | 4.00% | | 12/1/2026 | | BB | | | 200,000 | | | | 198,205 | |
| Brevard County Health Facilities Authority–Health First Inc Obligated Group FL | | 5.00% | | 4/1/2038 | | A | | | 210,000 | | | | 234,397 | |
| California Statewide Communities Development Authority–John Muir Health Obligated Group | | 5.25% | | 12/1/2042 | | A+ | | | 110,000 | | | | 128,334 | |
| County of Franklin–Trinity Health Corp Obligated OH | | 5.00% | | 12/1/2036 | | AA- | | | 150,000 | | | | 161,300 | |
| Illinois Finance Authority–Rush Obligated Group | | 5.00% | | 11/15/2031 | | A+ | | | 150,000 | | | | 151,558 | |
| Maryland Health & Higher Educational Facilities Authority–Adventist Healthcare Obligated Group | | 5.50% | | 1/1/2046 | | Baa3 | | | 125,000 | | | | 127,329 | |
| Massachusetts Development Finance Agency–Tufts Medicine Obligated Group | | 5.00% | | 7/1/2038 | | BBB- | | | 95,000 | | | | 96,399 | |
| South Carolina Jobs-Economic Development Authority–Kiawah Life Plan Village Inc | | 5.25% | | 11/15/2028 | | NR | | | 100,000 | | | | 100,566 | |
| State of Ohio–University Hospitals Health System Inc Obligated Group | | 5.00% | | 1/15/2032 | | A | | | 150,000 | | | | 163,250 | |
| Westchester County Local Development Corp.–New York Blood Center Inc NY | | 5.00% | | 7/1/2038 | | Baa1 | | | 75,000 | | | | 83,158 | |
| Total | | | | | | | | | | | | | 1,524,879 | |
| | | | | | | | | | | | | | | |
| Housing 16.46% | | | | | | | | | | | | | | |
| Connecticut Housing Finance Authority (FHLMC), (FNMA), (GNMA) | | 6.00% | | 11/15/2054 | | AAA | | | 100,000 | | | | 110,558 | |
| Indiana Finance Authority–CHF-Tippecanoe LLC | | 5.00% | | 6/1/2043 | | BBB- | | | 150,000 | | | | 158,734 | |
| Maryland Economic Development Corp. | | 5.375% | | 7/1/2038 | | BBB- | | | 150,000 | | | | 165,801 | |
| Maryland Economic Development Corp.–University of Maryland College Park (AGM) | | 5.00% | | 7/1/2041 | | AA | | | 125,000 | | | | 136,209 | |
| Minnesota Housing Finance Agency (FHLMC), (FNMA), (GNMA) | | 6.25% | | 1/1/2055 | | AA+ | | | 125,000 | | | | 143,000 | |
| | See Notes to Financial Statements. | 161 |
Schedule of Investments (continued)
SUSTAINABLE MUNICIPAL BOND FUND September 30, 2024
| Investments | | Interest
Rate | | Maturity
Date | | Credit
Rating:
S&P or
Moody’s(a) | | Principal
Amount | | | Fair
Value | |
| Housing (continued) | | | | | | | | | | | | | | |
| New Jersey Housing & Mortgage Finance Agency | | 6.00% | | 10/1/2055 | | AA | | $ | 100,000 | | | $ | 110,885 | |
| Washington State Housing Finance Commission–Provident Group-SH I Properties LLC | | 5.50% | | 7/1/2044 | | BBB- | | | 100,000 | | | | 111,283 | |
| Total | | | | | | | | | | | | | 936,470 | |
| | | | | | | | | | | | | | | |
| Other Revenue 2.78% | | | | | | | | | | | | | | |
| Indiana Finance Authority–Indianapolis Museum of Art Inc IN | | 4.00% | | 2/1/2034 | | A2 | | | 150,000 | | | | 158,020 | |
| | | | | | | | | | | | | | | |
| Taxable Revenue–Water & Sewer 2.21% | | | | | | | | | | | | | | |
| Jersey City Municipal Utilities Authority Sewer Fund NJ | | 5.00% | | 5/1/2025 | | NR | | | 125,000 | | | | 126,030 | |
| | | | | | | | | | | | | | | |
| Transportation 5.46% | | | | | | | | | | | | | | |
| County of Osceola Transportation Revenue FL | | 5.00% | | 10/1/2028 | | BBB+ | | | 100,000 | | | | 105,502 | |
| Maryland Economic Development Corp.–Purple Line Transit Partners LLC AMT | | 5.00% | | 11/12/2028 | | Baa3 | | | 200,000 | | | | 204,970 | |
| Total | | | | | | | | | | | | | 310,472 | |
| | | | | | | | | | | | | | | |
| Utilities 10.09% | | | | | | | | | | | | | | |
| California Community Choice Financing Authority | | 5.00% | #(b) | 1/1/2055 | | A1 | | | 150,000 | | | | 164,790 | |
| California Pollution Control Financing Authority–Poseidon Resources Channelside LP† | | 5.00% | | 7/1/2039 | | Baa3 | | | 250,000 | | | | 262,860 | |
| City of Chicago Waterworks Revenue IL | | 5.00% | | 11/1/2029 | | A+ | | | 140,000 | | | | 146,212 | |
| Total | | | | | | | | | | | | | 573,862 | |
| Total Municipal Bonds (cost $5,443,007) | | | | | | | | | | | | | 5,597,298 | |
| 162 | See Notes to Financial Statements. |
Schedule of Investments (concluded)
SUSTAINABLE MUNICIPAL BOND FUND September 30, 2024
| Investments | | Interest
Rate# | | Interest
Rate
Reset
Date(c) | | Final
Maturity
Date | | Credit
Rating:
S&P or
Moody’s(a) | | Principal
Amount | | | Fair
Value | |
| SHORT-TERM INVESTMENTS 0.88% | | | | | | | | | | | | | | | | |
| | | | | | | | | | | | | | | | | |
| VARIABLE RATE DEMAND NOTES 0.88% | | | | | | | | | | | | | | | | |
| | | | | | | | | | | | | | | | | |
| Health Care | | | | | | | | | | | | | | | | |
| Wisconsin Health & Educational Facilities Authority–Marshfield Clinic Health System Obligated Group | | 5.000% | | 10/1/2024 | | 2/15/2053 | | BBB | | $ | 50,000 | | | $ | 50,000 | |
| Total Short-Term Investments (cost $50,000) | | | | | | | | | | | 50,000 | |
| Total Investments in Securities 99.26% (cost $5,493,007) | | | | | | | | | | | 5,647,298 | |
| Other Assets and Liabilities - Net 0.74% | | | | | | | | | | | 42,227 | |
| Net Assets 100.00% | | | | | | | | | | | | | | $ | 5,689,525 | |
| AGM | | Insured by–Assured Guaranty Municipal Corporation. |
| AMT | | Income from the security may be subject to Alternative Minimum Tax. |
| COPS | | Certificates of Participation. |
| FHLMC | | Insured by-Federal Home Loan Mortgage Corporation. |
| FNMA | | Federal National Mortgage Association. |
| GNMA | | Government National Mortgage Association. |
| GTD | | Guaranteed. |
| NR | | Not Rated. |
| PSF | | Permanent School Fund. |
| SIFMA | | Insured by–Securities Industry and Financial Markets Association. |
| # | | Variable rate security. The interest rate represents the rate in effect at September 30, 2024. |
| † | | Security was purchased pursuant to Rule 144A under the Securities Act of 1933 and, unless registered under such Act or exempted from registration, may only be resold to qualified institutional buyers. At September 30, 2024, the total value of Rule 144A securities was $467,962, which represents 8.22% of net assets. |
| (a) | | Unaudited. |
| (b) | | Variable Rate is Fixed to Float: Rate remains fixed or at Zero Coupon until designated future date. |
| (c) | | The interest rate reset date shown represents the date in which the Fund has the right to sell a Variable Rate Demand Note (“VRDN”) back to the issuer for Principal Amount. The interest rate on the VRDN is generally reset daily based on the SIFMA Municipal Swap Index. |
The following is a summary of the inputs used as of September 30, 2024 in valuing the Fund’s investments carried at fair value(1):
| Investment Type(2) | | Level 1 | | | Level 2 | | | Level 3 | | | Total | |
| Long-Term Investments | | | | | | | | | | | | | | | | |
| Municipal Bonds | | $ | – | | | $ | 5,597,298 | | | $ | – | | | $ | 5,597,298 | |
| Short-Term Investments | | | | | | | | | | | | | | | | |
| Variable Rate Demand Notes | | | – | | | | 50,000 | | | | – | | | | 50,000 | |
| Total | | $ | – | | | $ | 5,647,298 | | | $ | – | | | $ | 5,647,298 | |
| (1) | | Refer to Note 2(i) for a description of fair value measurements and the three-tier hierarchy of inputs. |
| (2) | | See Schedule of Investments for fair values in each industry. The table above is presented by Investment Type. Industries are presented within an Investment Type should such Investment Type include securities classified as two or more levels within the three-tier fair value hierarchy. When applicable, each Level 3 security is identified on the Schedule of Investments along with the valuation technique utilized. |
A reconciliation of Level 3 investments is presented when the Fund has a material amount of Level 3 investments at the beginning or end of the year in relation to the Fund’s net assets.
| | See Notes to Financial Statements. | 163 |
Schedule of Investments
CALIFORNIA TAX FREE FUND September 30, 2024
| Investments | | Interest
Rate | | Maturity
Date | | Credit
Rating:
S&P or
Moody’s(a) | | Principal
Amount | | | Fair
Value | |
| LONG-TERM INVESTMENTS 99.32% | | | | | | | | | | | | | | |
| | | | | | | | | | | | | | | |
| MUNICIPAL BONDS 99.32% | | | | | | | | | | | | | | |
| | | | | | | | | | | | | | | |
| Corporate-Backed 1.95% | | | | | | | | | | | | | | |
| California Infrastructure & Economic Development Bank–DesertXpress Enterprises LLC AMT† | | 8.00% | #(b) | 1/1/2050 | | NR | | $ | 1,500,000 | | | $ | 1,544,882 | |
| California Municipal Finance Authority–United Airlines Inc AMT | | 4.00% | | 7/15/2029 | | BB- | | | 2,020,000 | | | | 2,037,445 | |
| California Municipal Finance Authority–Waste Management Inc AMT | | 4.125% | #(b) | 10/1/2041 | | A- | | | 3,000,000 | | | | 3,017,394 | |
| California Pollution Control Financing Authority–Poseidon Resources Channelside LP AMT† | | 5.00% | | 11/21/2045 | | Baa3 | | | 4,410,000 | | | | 4,416,828 | |
| California Pollution Control Financing Authority–Waste Management Inc AMT | | 4.30% | | 7/1/2040 | | A- | | | 185,000 | | | | 186,310 | |
| San Francisco City & County Airport Comm-San Francisco International Airport–SFO Fuel Co LLC CA AMT | | 5.00% | | 1/1/2038 | | A+ | | | 1,715,000 | | | | 1,804,944 | |
| Total | | | | | | | | | | | | | 13,007,803 | |
| | | | | | | | | | | | | | | |
| Education 13.98% | | | | | | | | | | | | | | |
| Alameda Unified School District-Alameda County CA | | 5.00% | | 8/1/2049 | | AA | | | 1,700,000 | | | | 1,904,623 | |
| Alvord Unified School District CA GO (BAM) | | 5.00% | | 8/1/2052 | | AA | | | 4,000,000 | | | | 4,484,039 | |
| Brentwood Union School District CA GO | | 5.25% | | 8/1/2052 | | Aa3 | | | 2,125,000 | | | | 2,359,330 | |
| California Community Choice Financing Authority | | 4.00% | #(b) | 5/1/2053 | | A1 | | | 4,850,000 | | | | 4,967,968 | |
| California Educational Facilities Authority–Art Center College of Design | | 4.00% | | 12/1/2037 | | Baa1 | | | 1,150,000 | | | | 1,154,313 | |
| California Educational Facilities Authority–Art Center College of Design | | 5.00% | | 12/1/2044 | | Baa1 | | | 3,500,000 | | | | 3,610,455 | |
| California Educational Facilities Authority–Chapman University | | 5.00% | | 4/1/2040 | | A2 | | | 1,000,000 | | | | 1,005,286 | |
| California Educational Facilities Authority–Loyola Marymount University | | 5.00% | | 10/1/2048 | | A2 | | | 1,000,000 | | | | 1,046,246 | |
| California Educational Facilities Authority–St Mary’s College of California | | 5.50% | | 10/1/2053 | | BBB- | | | 1,125,000 | | | | 1,215,248 | |
| California Educational Facilities Authority–University of San Francisco | | 5.00% | | 10/1/2053 | | A3 | | | 2,000,000 | | | | 2,086,568 | |
| California Educational Facilities Authority–University of the Pacific | | 5.00% | | 11/1/2053 | | A2 | | | 2,900,000 | | | | 3,171,468 | |
| | |
| 164 | See Notes to Financial Statements. |
Schedule of Investments (continued)
CALIFORNIA TAX FREE FUND September 30, 2024
| Investments | | Interest
Rate | | Maturity
Date | | Credit
Rating:
S&P or
Moody’s(a) | | Principal
Amount | | | Fair
Value | |
| Education (continued) | | | | | | | | | | | | | | |
| California Enterprise Development Authority–Castilleja School Foundation(c) | | 5.00% | | 6/1/2049 | | A | | $ | 2,750,000 | | | $ | 3,058,209 | |
| California Health Facilities Financing Authority–Art Center College of Design | | 5.00% | | 12/1/2048 | | Baa1 | | | 1,000,000 | | | | 1,025,452 | |
| California Municipal Finance Authority–Biola University Inc | | 5.00% | | 10/1/2032 | | Baa1 | | | 400,000 | | | | 418,855 | |
| California Municipal Finance Authority–Biola University Inc | | 5.00% | | 10/1/2039 | | Baa1 | | | 1,000,000 | | | | 1,036,184 | |
| California Municipal Finance Authority–Emerson College | | 5.00% | | 1/1/2042 | | BBB+ | | | 4,245,000 | | | | 4,349,931 | |
| California Municipal Finance Authority–Samuel Merritt University | | 5.25% | | 6/1/2053 | | A3 | | | 5,500,000 | | | | 6,045,909 | |
| California Municipal Finance Authority–SDORI Charter School Properties LLC† | | 5.625% | | 3/1/2045 | | B+ | | | 500,000 | | | | 488,996 | |
| California Municipal Finance Authority–University of the Pacific | | 3.00% | | 11/1/2048 | | A2 | | | 4,000,000 | | | | 3,222,746 | |
| California Municipal Finance Authority–University of the Pacific | | 4.00% | | 11/1/2042 | | A2 | | | 1,175,000 | | | | 1,186,053 | |
| California Municipal Finance Authority–Westside Neighborhood School† | | 5.90% | | 6/15/2044 | | BB | | | 1,815,000 | | | | 1,967,657 | |
| California School Finance Authority–Aspire Public Schools Obligated Group† | | 5.00% | | 8/1/2046 | | NR | | | 85,000 | | | | 86,588 | |
| California School Finance Authority–Aspire Public Schools Obligated Group† | | 5.00% | | 8/1/2046 | | BBB | | | 3,450,000 | | | | 3,465,009 | |
| California School Finance Authority–Green Dot Public Schools Obligated Group† | | 5.00% | | 8/1/2045 | | BBB- | | | 620,000 | | | | 622,989 | |
| California School Finance Authority–Kipp SoCal Public Schools Obligated† | | 5.00% | | 7/1/2045 | | BBB | | | 2,190,000 | | | | 2,199,811 | |
| California School Finance Authority–Kipp SoCal Public Schools Obligated† | | 5.00% | | 7/1/2047 | | BBB | | | 4,415,000 | | | | 4,476,961 | |
| California School Finance Authority–Kipp SoCal Public Schools Obligated Group† | | 5.00% | | 7/1/2049 | | BBB | | | 1,000,000 | | | | 1,028,433 | |
| California State University | | 5.25% | | 11/1/2053 | | Aa2 | | | 8,075,000 | | | | 9,184,554 | |
| | | |
| | See Notes to Financial Statements. | 165 |
Schedule of Investments (continued)
CALIFORNIA TAX FREE FUND September 30, 2024
| Investments | | Interest
Rate | | Maturity
Date | | Credit
Rating:
S&P or
Moody’s(a) | | Principal
Amount | | | Fair
Value | |
| Education (continued) | | | | | | | | | | | | | | |
| California Statewide Communities Development Authority–Culinary Institute of America | | 5.00% | | 7/1/2046 | | Baa2 | | $ | 1,010,000 | | | $ | 1,018,933 | |
| Central Unified School District CA GO | | 5.25% | | 8/1/2052 | | Aa3 | | | 2,940,000 | | | | 3,315,555 | |
| Montebello Unified School District CA GO (AGM) | | 5.50% | | 8/1/2047 | | AA | | | 2,000,000 | | | | 2,196,707 | |
| Morgan Hill Unified School District CA GO | | 5.25% | | 8/1/2040 | | Aa1 | | | 1,000,000 | | | | 1,161,981 | |
| Rincon Valley Union School District CA | | 5.00% | | 8/1/2054 | | AA | | | 2,875,000 | | | | 3,199,780 | |
| San Rafael City High School District CA GO | | 4.00% | | 8/1/2053 | | Aa2 | | | 2,000,000 | | | | 2,004,446 | |
| Santa Clarita Community College District CA GO | | 5.25% | | 8/1/2045 | | AA | | | 1,500,000 | | | | 1,704,977 | |
| University of California | | 5.00% | | 5/15/2052 | | AA | | | 4,640,000 | | | | 5,101,343 | |
| University of California | | 5.00% | | 5/15/2054 | | AA | | | 2,500,000 | | | | 2,792,435 | |
| Total | | | | | | | | | | | | | 93,366,038 | |
| | | | | | | | | | | | | | | |
| General Obligation 12.68% | | | | | | | | | | | | | | |
| California Community Choice Financing Authority | | 5.00% | #(b) | 12/1/2053 | | A2 | | | 1,925,000 | | | | 2,060,891 | |
| California Community Choice Financing Authority | | 5.25% | #(b) | 1/1/2054 | | Baa1 | | | 8,595,000 | | | | 9,291,068 | |
| California Community Choice Financing Authority | | 5.50% | #(b) | 5/1/2054 | | A2 | | | 4,905,000 | | | | 5,296,404 | |
| California State Public Works Board | | 4.00% | | 5/1/2046 | | Aa3 | | | 3,765,000 | | | | 3,822,837 | |
| California State Public Works Board–State of California Department of General Services | | 5.00% | | 4/1/2049 | | Aa3 | | | 1,000,000 | | | | 1,126,395 | |
| Commonwealth of Puerto Rico GO | | 4.00% | | 7/1/2046 | | NR | | | 2,000,000 | | | | 1,889,832 | |
| Commonwealth of Puerto Rico GO | | 5.75% | | 7/1/2031 | | NR | | | 165,067 | | | | 183,693 | |
| Dublin Unified School District CA GO | | 3.00% | | 8/1/2041 | | AA+ | | | 2,425,000 | | | | 2,228,406 | |
| El Rancho Unified School District CA GO (BAM) | | 5.75% | | 8/1/2048 | | AA | | | 1,750,000 | | | | 2,092,625 | |
| Grossmont Union High School District CA GO (AGM) | | Zero Coupon | | 6/1/2040 | | AA | | | 2,000,000 | | | | 907,106 | |
| Imperial Community College District CA GO (AGM) | | 5.25% | | 8/1/2053 | | AA | | | 1,620,000 | | | | 1,824,197 | |
| Imperial Community College District GO (AGM) | | 5.00% | | 8/1/2054 | | AA | | | 2,500,000 | | | | 2,786,798 | |
| Irvine Facilities Financing Authority CA GO | | 4.25% | | 9/1/2050 | | Aa1 | | | 1,565,000 | | | | 1,600,266 | |
| | |
| 166 | See Notes to Financial Statements. |
Schedule of Investments (continued)
CALIFORNIA TAX FREE FUND September 30, 2024
| Investments | | Interest
Rate | | Maturity
Date | | Credit
Rating:
S&P or
Moody’s(a) | | Principal
Amount | | | Fair
Value | |
| General Obligation (continued) | | | | | | | | | | | | | | |
| Irvine Unified School District–Community Facilities District No 01-1 CA Special Tax (BAM) | | 5.00% | | 9/1/2038 | | AA | | $ | 1,000,000 | | | $ | 1,007,155 | |
| Irvine Unified School District–Community Facilities District No 01-1 CA Special Tax (BAM) | | 5.00% | | 9/1/2056 | | AA | | | 995,000 | | | | 1,024,769 | |
| Local Public Schools Funding Authority School Improvement District No. 2016-1 CA GO (BAM) | | 5.00% | | 8/1/2052 | | AA | | | 2,000,000 | | | | 2,092,039 | |
| Los Angeles Unified School District–Los Angeles Unified School District/CA(c) | | 5.25% | | 7/1/2049 | | Aa2 | | | 1,625,000 | | | | 1,872,259 | |
| Newport Mesa Unified School District CA GO | | Zero Coupon | | 8/1/2041 | | Aaa | | | 1,325,000 | | | | 686,541 | |
| Newport Mesa Unified School District CA GO | | Zero Coupon | | 8/1/2045 | | Aaa | | | 1,000,000 | | | | 435,698 | |
| North Orange County Community College District CA GO | | 2.75% | | 8/1/2036 | | AA+ | | | 2,000,000 | | | | 1,842,996 | |
| Pajaro Valley Health Care District CA GO | | 5.00% | | 9/1/2046 | | Ba2 | | | 2,750,000 | | | | 2,995,576 | |
| Ravenswood City School District CA GO (BAM) | | 5.25% | | 8/1/2053 | | AA | | | 2,000,000 | | | | 2,240,895 | |
| San Benito High School District CA GO | | Zero Coupon | | 8/1/2042 | | Aa3 | | | 1,795,000 | | | | 859,891 | |
| San Benito High School District CA GO | | Zero Coupon | | 8/1/2043 | | Aa3 | | | 2,600,000 | | | | 1,189,925 | |
| San Diego Public Facilities Financing Authority CA | | 5.25% | | 10/15/2052 | | AA- | | | 4,125,000 | | | | 4,633,780 | |
| San Diego Unified School District CA GO | | 5.00% | | 7/1/2048 | | Aa2 | | | 3,000,000 | | | | 3,359,459 | |
| Santa Monica-Malibu Unified School District CA GO | | 3.00% | | 8/1/2044 | | AA+ | | | 1,515,000 | | | | 1,344,463 | |
| Simi Valley Unified School District CA GO | | 5.25% | | 8/1/2051 | | Aa2 | | | 3,000,000 | | | | 3,321,023 | |
| Southwestern Community College District CA GO | | Zero Coupon | | 8/1/2041 | | Aa2 | | | 1,100,000 | | | | 605,365 | |
| State of California GO | | 5.00% | | 10/1/2041 | | Aa2 | | | 1,170,000 | | | | 1,300,703 | |
| State of California GO | | 5.00% | | 4/1/2042 | | Aa2 | | | 2,000,000 | | | | 2,248,774 | |
| State of California GO | | 5.00% | | 9/1/2053 | | Aa2 | | | 1,000,000 | | | | 1,117,486 | |
| State of California GO | | 5.25% | | 9/1/2047 | | Aa2 | | | 3,000,000 | | | | 3,393,525 | |
| State of California GO | | 5.25% | | 9/1/2053 | | Aa2 | | | 3,000,000 | | | | 3,403,294 | |
| State of California GO | | 5.25% | | 8/1/2054 | | Aa2 | | | 1,250,000 | | | | 1,431,336 | |
| State of California GO | | 5.50% | | 8/1/2054 | | Aa2 | | | 3,600,000 | | | | 4,203,125 | |
| | | |
| | See Notes to Financial Statements. | 167 |
Schedule of Investments (continued)
CALIFORNIA TAX FREE FUND September 30, 2024
| Investments | | Interest
Rate | | Maturity
Date | | Credit
Rating:
S&P or
Moody’s(a) | | Principal
Amount | | | Fair
Value | |
| General Obligation (continued) | | | | | | | | | | | | | | |
| Washington Township Health Care District CA GO | | 5.25% | | 8/1/2048 | | AA | | $ | 1,625,000 | | | $ | 1,831,468 | |
| West Contra Costa Unified School District CA GO | | 6.00% | | 8/1/2027 | | A+ | | | 1,000,000 | | | | 1,103,829 | |
| Total | | | | | | | | | | | | | 84,655,892 | |
| | | | | | | | | | | | | | | |
| Health Care 14.62% | | | | | | | | | | | | | | |
| Antelope Valley Healthcare District Obligated Group CA | | 5.00% | | 3/1/2026 | | BBB | | | 1,065,000 | | | | 1,070,097 | |
| Antelope Valley Healthcare District Obligated Group CA | | 5.25% | | 3/1/2036 | | BBB | | | 1,000,000 | | | | 1,005,685 | |
| California Community Choice Financing Authority–Providence St Joseph Health Obligated Group | | 3.00% | | 10/1/2041 | | A | | | 1,910,000 | | | | 1,695,614 | |
| California Community Choice Financing Authority–Providence St Joseph Health Obligated Group | | 3.00% | | 10/1/2047 | | A | | | 1,680,000 | | | | 1,363,090 | |
| California Community Choice Financing Authority–Providence St Joseph Health Obligated Group | | 5.00% | | 10/1/2044 | | A | | | 2,410,000 | | | | 2,410,025 | |
| California Health Facilities Financing Authority–Cedars-Saini Medical Center Obligated Group | | 3.00% | | 8/15/2051 | | AA- | | | 2,705,000 | | | | 2,193,123 | |
| California Health Facilities Financing Authority–Children’s Hospital Los Angeles Obligated Group | | 5.00% | | 8/15/2047 | | BBB | | | 4,000,000 | | | | 4,100,839 | |
| California Health Facilities Financing Authority–Children’s Hospital Los Angeles Obligated Group CA | | 5.00% | | 10/1/2030 | | A | | | 1,470,000 | | | | 1,473,119 | |
| California Health Facilities Financing Authority–Children’s Hospital Los Angeles Obligated Group CA | | 5.00% | | 8/15/2042 | | BBB | | | 1,250,000 | | | | 1,288,796 | |
| California Health Facilities Financing Authority–Children’s Hospital of Orange County Obligated Group | | 3.00% | | 11/1/2038 | | AA- | | | 3,000,000 | | | | 2,837,193 | |
| California Health Facilities Financing Authority–City of Hope Obligated Group | | 4.00% | | 11/15/2045 | | A | | | 3,370,000 | | | | 3,318,785 | |
| California Health Facilities Financing Authority–City of Hope Obligated Group | | 5.00% | | 11/15/2032 | | A | | | 1,300,000 | | | | 1,300,814 | |
| California Health Facilities Financing Authority–CommonSpirit Health Obligated Group | | 4.00% | | 4/1/2035 | | A- | | | 3,380,000 | | | | 3,486,893 | |
| | |
| 168 | See Notes to Financial Statements. |
Schedule of Investments (continued)
CALIFORNIA TAX FREE FUND September 30, 2024
| Investments | | Interest
Rate | | Maturity
Date | | Credit
Rating:
S&P or
Moody’s(a) | | Principal
Amount | | | Fair
Value | |
| Health Care (continued) | | | | | | | | | | | | | | |
| California Health Facilities Financing Authority–CommonSpirit Health Obligated Group | | 5.00% | | 12/1/2054 | | A- | | $ | 5,000,000 | | | $ | 5,446,086 | |
| California Health Facilities Financing Authority–CommonSpirit Health Obligated Group CA | | 5.00% | | 12/1/2044 | | A- | | | 1,485,000 | | | | 1,668,532 | |
| California Health Facilities Financing Authority–Lucile Salter Packard Children’s Hospital at Stanford Obligated Group | | 4.00% | | 5/15/2051 | | A+ | | | 2,000,000 | | | | 2,001,820 | |
| California Health Facilities Financing Authority–Lucile Salter Packard Children’s Hospital at Stanford Obligated Group | | 5.00% | | 8/15/2034 | | A+ | | | 2,000,000 | | | | 2,388,768 | |
| California Health Facilities Financing Authority–Lucile Salter Packard Children’s Hospital at Stanford Obligated Group | | 5.00% | | 11/15/2056 | | A+ | | | 1,225,000 | | | | 1,268,445 | |
| California Health Facilities Financing Authority–Scripps Health Obligated Group | | 5.00% | | 11/15/2044 | | AA- | | | 9,000,000 | | | | 10,169,479 | |
| California Health Facilities Financing Authority–Sutter Health Obligated Group | | 5.00% | | 11/15/2038 | | A+ | | | 2,250,000 | | | | 2,365,718 | |
| California Infrastructure & Economic Development Bank–Roseville Sustainable Energy Partner LLC | | 5.25% | | 7/1/2049 | | BBB+ | | | 2,450,000 | | | | 2,655,533 | |
| California Municipal Finance Authority | | 4.00% | | 8/15/2037 | | A- | | | 1,000,000 | | | | 1,008,846 | |
| California Municipal Finance Authority–Community Hospitals of Central California Obligated Group | | 5.00% | | 2/1/2037 | | A3 | | | 2,000,000 | | | | 2,061,064 | |
| California Municipal Finance Authority–Eisenhower Medical Center | | 5.00% | | 7/1/2036 | | Baa2 | | | 1,580,000 | | | | 1,626,435 | |
| California Municipal Finance Authority–Palomar Health Obligated Group COPS (AGM) | | 5.25% | | 11/1/2052 | | AA | | | 1,000,000 | | | | 1,086,164 | |
| California Municipal Finance Authority (AGM) | | 4.00% | | 2/1/2051 | | AA | | | 1,000,000 | | | | 977,315 | |
| California Public Finance Authority–Kendal At Ventura† | | 10.00% | | 5/15/2028 | | NR | | | 500,000 | | | | 590,861 | |
| California Statewide Communities Development Authority–HumanGood California Obligated Group | | 5.00% | | 10/1/2045 | | A- | (d) | | 1,000,000 | | | | 1,008,076 | |
| | | |
| | See Notes to Financial Statements. | 169 |
Schedule of Investments (continued)
CALIFORNIA TAX FREE FUND September 30, 2024
| Investments | | Interest
Rate | | Maturity
Date | | Credit
Rating:
S&P or
Moody’s(a) | | Principal
Amount | | | Fair
Value | |
| Health Care (continued) | | | | | | | | | | | | | | |
| California Statewide Communities Development Authority–John Muir Health Obligated Group | | 5.25% | | 12/1/2054 | | A+ | | $ | 3,750,000 | | | $ | 4,203,630 | |
| California Statewide Communities Development Authority–Loma Linda University Medical Obligated Group† | | 5.00% | | 12/1/2026 | | BB | | | 2,335,000 | | | | 2,400,035 | |
| California Statewide Communities Development Authority–Loma Linda University Medical Obligated Group† | | 5.00% | | 12/1/2041 | | BB | | | 1,000,000 | | | | 1,014,627 | |
| California Statewide Communities Development Authority–Loma Linda University Medical Obligated Group | | 5.25% | | 12/1/2034 | | BB | | | 2,150,000 | | | | 2,154,917 | |
| California Statewide Communities Development Authority–Loma Linda University Medical Obligated Group† | | 5.25% | | 12/1/2056 | | BB | | | 1,015,000 | | | | 1,027,946 | |
| California Statewide Communities Development Authority–Loma Linda University Medical Obligated Group | | 5.50% | | 12/1/2054 | | BB | | | 2,225,000 | | | | 2,227,576 | |
| California Statewide Communities Development Authority–Loma Linda University Medical Obligated Group† | | 5.50% | | 12/1/2058 | | BB | | | 2,600,000 | | | | 2,694,499 | |
| California Statewide Communities Development Authority–Verity Health System of California Inc Obligated Group(e) | | 5.50% | | 7/1/2039 | | NR | | | 2,268 | | | | 2,132 | |
| Los Angeles County Public Works Financing Authority–County of Los Angeles CA | | 5.50% | | 12/1/2053 | | AA+ | | | 2,000,000 | | | | 2,324,219 | |
| Palomar Health Obligated Group CA | | 5.00% | | 11/1/2036 | | BB+ | | | 3,555,000 | | | | 3,573,540 | |
| Palomar Health Obligated Group CA | | 5.00% | | 11/1/2039 | | BB+ | | | 4,750,000 | | | | 4,758,702 | |
| Regents of the University of California Medical Center Pooled Revenue | | 3.50% | | 5/15/2054 | | AA- | | | 3,000,000 | | | | 2,854,455 | |
| Regents of the University of California Medical Center Pooled Revenue | | 5.00% | | 5/15/2047 | | AA- | | | 2,000,000 | | | | 2,212,809 | |
| Washington Township Health Care District CA | | 5.75% | | 7/1/2053 | | Baa3 | | | 2,100,000 | | | | 2,297,069 | |
| Total | | | | | | | | | | | | | 97,613,371 | |
| | | | | | | | | | | | | | | |
| Housing 6.46% | | | | | | | | | | | | | | |
| California Community Housing Agency Arbors Apartments† | | 5.00% | | 8/1/2050 | | NR | | | 965,000 | | | | 959,392 | |
| California Community Housing Agency Summit at Sausalito Apartments† | | 4.00% | | 2/1/2050 | | NR | | | 4,495,000 | | | | 3,599,835 | |
| | |
| 170 | See Notes to Financial Statements. |
Schedule of Investments (continued)
CALIFORNIA TAX FREE FUND September 30, 2024
| Investments | | Interest
Rate | | Maturity
Date | | Credit
Rating:
S&P or
Moody’s(a) | | Principal
Amount | | | Fair
Value | |
| Housing (continued) | | | | | | | | | | | | | | |
| California Enterprise Development Authority–Provident Group-Pomona Properties LLC | | 5.00% | | 1/15/2045 | | Baa3 | | $ | 3,500,000 | | | $ | 3,716,891 | |
| California Enterprise Development Authority–Provident Group-SDSU Properties LLC | | 5.00% | | 8/1/2040 | | Baa3 | | | 1,625,000 | | | | 1,694,788 | |
| California Enterprise Development Authority–Provident Group-SDSU Properties LLC | | 5.00% | | 8/1/2050 | | Baa3 | | | 2,030,000 | | | | 2,099,542 | |
| California Enterprise Development Authority–Provident Group-SDSU Properties LLC | | 5.00% | | 8/1/2055 | | Baa3 | | | 1,075,000 | | | | 1,106,493 | |
| California Housing Finance Agency | | 3.25% | | 8/20/2036 | | BBB | | | 8,123,576 | | | | 7,771,371 | |
| California Housing Finance Agency | | 3.50% | | 11/20/2035 | | BBB+ | | | 2,281,740 | | | | 2,234,039 | |
| California Municipal Finance Authority–Bowles Hall Foundation | | 5.00% | | 6/1/2050 | | Baa3 | | | 500,000 | | | | 502,220 | |
| California Municipal Finance Authority–Caritas Corp CMFA Mobile Home Park Financing 2024 Portfolio | | 5.00% | | 8/15/2054 | | A- | | | 1,000,000 | | | | 1,075,488 | |
| California Municipal Finance Authority–CHF-Davis II LLC (BAM) | | 3.00% | | 5/15/2051 | | AA | | | 2,500,000 | | | | 2,060,439 | |
| California Municipal Finance Authority–CHF-Davis II LLC (BAM) | | 4.00% | | 5/15/2046 | | AA | | | 3,000,000 | | | | 3,021,638 | |
| California Statewide Communities Development Authority–CHF-Irvine LLC | | 5.00% | | 5/15/2035 | | Baa1 | | | 3,100,000 | | | | 3,172,754 | |
| California Statewide Communities Development Authority–CHF-Irvine LLC | | 5.00% | | 5/15/2050 | | Baa1 | | | 1,400,000 | | | | 1,423,363 | |
| California Statewide Communities Development Authority–CHF-Irvine LLC (BAM) | | 4.00% | | 5/15/2046 | | AA | | | 1,000,000 | | | | 1,000,260 | |
| CSCDA Community Improvement Authority Orange Portfolio CA† | | 3.00% | | 3/1/2057 | | NR | | | 2,000,000 | | | | 1,493,598 | |
| CSCDA Community Improvement Authority Parallel-Anaheim CA† | | 4.00% | | 8/1/2056 | | NR | | | 985,000 | | | | 893,765 | |
| CSCDA Community Improvement Authority Pasadena Portfolio CA† | | 2.65% | | 12/1/2046 | | NR | | | 2,425,000 | | | | 1,955,961 | |
| CSCDA Community Improvement Authority Pasadena Portfolio CA† | | 4.00% | | 12/1/2056 | | NR | | | 1,000,000 | | | | 778,565 | |
| | | |
| | See Notes to Financial Statements. | 171 |
Schedule of Investments (continued)
CALIFORNIA TAX FREE FUND September 30, 2024
| Investments | | Interest
Rate | | Maturity
Date | | Credit
Rating:
S&P or
Moody’s(a) | | Principal
Amount | | | Fair
Value | |
| Housing (continued) | | | | | | | | | | | | | | |
| CSCDA Community Improvement Authority Westgate Apartments CA† | | 3.00% | | 6/1/2047 | | NR | | $ | 3,000,000 | | | $ | 2,194,942 | |
| CSCDA Community Improvement Authority Westgate Apartments CA† | | 4.00% | | 6/1/2057 | | NR | | | 1,000,000 | | | | 350,558 | |
| Total | | | | | | | | | | | | | 43,105,902 | |
| | | | | | | | | | | | | | | |
| Lease Obligations 1.21% | | | | | | | | | | | | | | |
| California State Public Works Board | | 4.00% | | 11/1/2046 | | Aa3 | | | 2,500,000 | | | | 2,536,189 | |
| San Diego Public Facilities Financing Authority–City of San Diego CA | | 5.00% | | 10/15/2054 | | AA- | | | 5,000,000 | | | | 5,570,361 | |
| Total | | | | | | | | | | | | | 8,106,550 | |
| | | | | | | | | | | | | | | |
| Other Revenue 0.98% | | | | | | | | | | | | | | |
| California Infrastructure & Economic Development Bank–Los Angeles County Museum of Natural History Foundation | | 4.00% | | 7/1/2050 | | A2 | | | 2,625,000 | | | | 2,593,248 | |
| California School Finance Authority–Aspire Public Schools Obligated Group† | | 4.00% | | 8/1/2051 | | BBB | | | 785,000 | | | | 718,453 | |
| California School Finance Authority–Green Dot Public Schools Obligated Group† | | 5.00% | | 8/1/2038 | | BBB- | | | 1,000,000 | | | | 1,036,280 | |
| California School Finance Authority–Kipp SoCal Public Schools Obligated† | | 5.00% | | 7/1/2034 | | BBB | | | 600,000 | | | | 600,602 | |
| Commonwealth of Puerto Rico GO | | Zero Coupon | #(b) | 11/1/2051 | | NR | | | 2,417,316 | | | | 1,583,342 | |
| Total | | | | | | | | | | | | | 6,531,925 | |
| | | | | | | | | | | | | | | |
| Pollution Control 0.25% | | | | | | | | | | | | | | |
| California Municipal Finance Authority–Republic Services Inc AMT | | 3.875% | #(b) | 3/1/2054 | | BBB+ | | | 1,600,000 | | | | 1,637,805 | |
| | | | | | | | | | | | | | | |
| Power 0.54% | | | | | | | | | | | | | | |
| Southern California Public Power Authority | | 5.25% | | 7/1/2053 | | Aa2 | | | 3,180,000 | | | | 3,615,987 | |
| | | | | | | | | | | | | | | |
| Pre-Refunded 0.11% | | | | | | | | | | | | | | |
| M-S-R Energy Authority CA | | 6.50% | | 11/1/2039 | | BBB+ | | | 555,000 | | | | 726,998 | |
| | | | | | | | | | | | | | | |
| Special Tax 3.09% | | | | | | | | | | | | | | |
| City of Irvine CA | | 5.00% | | 9/2/2028 | | NR | | | 1,000,000 | | | | 1,018,695 | |
| City of Irvine CA Special Tax (BAM) | | 5.25% | | 9/1/2053 | | AA | | | 3,000,000 | | | | 3,369,055 | |
| City of Roseville Westpark Community Facilities District No 1 CA Special Tax | | 5.00% | | 9/1/2031 | | NR | | | 1,000,000 | | | | 1,013,821 | |
| 172 | See Notes to Financial Statements. | |
Schedule of Investments (continued)
CALIFORNIA TAX FREE FUND September 30, 2024
| Investments | | Interest
Rate | | Maturity
Date | | Credit
Rating:
S&P or
Moody’s(a) | | Principal
Amount | | | Fair
Value | |
| Special Tax (continued) | | | | | | | | | | | | | | |
| County of Los Angeles Community Facilities District No. CA Special Tax | | 5.00% | | 9/1/2052 | | NR | | $ | 1,500,000 | | | $ | 1,589,200 | |
| County of Orange CA Community Facilities District No 2023-1 | | 5.50% | | 8/15/2053 | | NR | | | 1,375,000 | | | | 1,493,350 | |
| Inland Valley Development Agency CA Tax Allocation | | 5.25% | | 9/1/2037 | | A+ | | | 1,325,000 | | | | 1,335,097 | |
| Irvine Facilities Financing Authority–City of Irvine Community Facilities District No 2013-3 CA Special Tax (BAM) | | 5.25% | | 9/1/2053 | | AA | | | 5,160,000 | | | | 5,815,726 | |
| Poway Unified School District Public Financing Authority CA Special Tax (BAM) | | 5.00% | | 9/1/2035 | | AA+ | | | 1,765,000 | | | | 1,798,548 | |
| River Islands Public Financing Authority CA Special Tax (AGM) | | 5.25% | | 9/1/2052 | | AA | | | 1,000,000 | | | | 1,098,367 | |
| Tejon Ranch Public Facilities Finance Authority–Tejon Ranch Public Facilities Finance Authority Community Facs District No 2008-1 CA | | 5.00% | | 9/1/2054 | | NR | | | 2,000,000 | | | | 2,108,105 | |
| Total | | | | | | | | | | | | | 20,639,964 | |
| | | | | | | | | | | | | | | |
| Tax Revenue 4.61% | | | | | | | | | | | | | | |
| City of Sacramento Transient Occupancy Tax Revenue CA | | 5.00% | | 6/1/2048 | | A1 | | | 1,000,000 | | | | 1,042,535 | |
| Compton Community Redevelopment Agency Successor Agency CA Tax Allocation (AGM) | | 5.00% | | 8/1/2037 | | AA | | | 1,700,000 | | | | 1,905,678 | |
| Matching Fund Special Purpose Securitization Corp.–United States Virgin Islands Federal Excise Tax | | 5.00% | | 10/1/2026 | | NR | | | 1,925,000 | | | | 1,987,420 | |
| Matching Fund Special Purpose Securitization Corp.–United States Virgin Islands Federal Excise Tax | | 5.00% | | 10/1/2039 | | NR | | | 2,000,000 | | | | 2,094,715 | |
| Puerto Rico Sales Tax Financing Corp. Sales Tax Revenue | | Zero Coupon | | 7/1/2051 | | NR | | | 1,283,000 | | | | 316,434 | |
| Puerto Rico Sales Tax Financing Corp. Sales Tax Revenue | | 4.329% | | 7/1/2040 | | NR | | | 503,000 | | | | 502,752 | |
| Puerto Rico Sales Tax Financing Corp. Sales Tax Revenue | | 4.329% | | 7/1/2040 | | NR | | | 4,283,000 | | | | 4,280,888 | |
| Puerto Rico Sales Tax Financing Corp. Sales Tax Revenue | | 4.536% | | 7/1/2053 | | NR | | | 7,000 | | | | 6,942 | |
| Puerto Rico Sales Tax Financing Corp. Sales Tax Revenue | | 4.75% | | 7/1/2053 | | NR | | | 7,298,854 | | | | 7,321,321 | |
| | See Notes to Financial Statements. | 173 |
Schedule of Investments (continued)
CALIFORNIA TAX FREE FUND September 30, 2024
| Investments | | Interest
Rate | | Maturity
Date | | Credit
Rating:
S&P or
Moody’s(a) | | Principal
Amount | | | Fair
Value | |
| Tax Revenue (continued) | | | | | | | | | | | | | | |
| River Islands Public Financing Authority Community Facs District No 2023-1 Area 2 CA | | 5.00% | | 9/1/2048 | | NR | | $ | 1,650,000 | | | $ | 1,706,760 | |
| River Islands Public Financing Authority Community Facs District No 2023-1 Area 2 CA | | 5.00% | | 9/1/2054 | | NR | | | 1,000,000 | | | | 1,028,836 | |
| San Diego Unified School District CA GO | | 3.00% | | 7/1/2044 | | Aa2 | | | 4,400,000 | | | | 3,881,883 | |
| San Leandro Unified School District CA GO | | 5.25% | | 8/1/2048 | | AA- | | | 2,100,000 | | | | 2,350,244 | |
| San Rafael City High School District CA GO | | 5.25% | | 8/1/2052 | | Aa2 | | | 1,215,000 | | | | 1,328,944 | |
| Tustin Community Facilities District CA Special Tax | | 5.00% | | 9/1/2037 | | A | | | 1,000,000 | | | | 1,014,265 | |
| Total | | | | | | | | | | | | | 30,769,617 | |
| | | | | | | | | | | |
| Taxable Revenue–Water & Sewer 2.68% | | | | | | | | | | | | | | |
| California Pollution Control Financing Authority–Poseidon Resources Channelside LP AMT† | | 5.00% | | 11/21/2045 | | Baa3 | | | 1,100,000 | | | | 1,178,793 | |
| San Diego Public Facilities Financing Authority–City of San Diego CA Sewer Utility Revenue CA | | 5.00% | | 5/15/2054 | | AA | | | 5,000,000 | | | | 5,606,523 | |
| San Francisco City & County Public Utilities Commission Wastewater Revenue CA(f) | | 5.00% | | 10/1/2054 | | AA | | | 10,000,000 | | | | 11,091,045 | |
| Total | | | | | | | | | | | | | 17,876,361 | |
| | | | | | | | | | | |
| Tobacco 2.56% | | | | | | | | | | | | | | |
| California Statewide Financing Authority | | Zero Coupon | | 6/1/2046 | | NR | | | 8,675,000 | | | | 2,286,685 | |
| California Statewide Financing Authority† | | Zero Coupon | | 6/1/2055 | | NR | | | 10,000,000 | | | | 560,574 | |
| Golden State Tobacco Securitization Corp. CA | | Zero Coupon | | 6/1/2066 | | NR | | | 21,500,000 | | | | 2,568,416 | |
| Golden State Tobacco Securitization Corp. CA | | 5.00% | | 6/1/2051 | | BBB+ | | | 5,200,000 | | | | 5,487,790 | |
| Inland Empire Tobacco Securitization Corp.–Inland Empire Tobacco Securitization Corp CA | | Zero Coupon | | 6/1/2036 | | CCC | | | 1,000,000 | | | | 463,646 | |
| Inland Empire Tobacco Securitization Corp. CA† | | Zero Coupon | | 6/1/2057 | | CCC | | | 3,000,000 | | | | 234,279 | |
| Silicon Valley Tobacco Securitization Authority CA | | Zero Coupon | | 6/1/2041 | | NR | | | 5,000,000 | | | | 1,966,025 | |
| 174 | See Notes to Financial Statements. | |
Schedule of Investments (continued)
CALIFORNIA TAX FREE FUND September 30, 2024
| Investments | | Interest
Rate | | Maturity
Date | | Credit
Rating:
S&P or
Moody’s(a) | | Principal
Amount | | | Fair
Value | |
| Tobacco (continued) | | | | | | | | | | | | | | |
| Silicon Valley Tobacco Securitization Authority CA | | Zero Coupon | | 6/1/2056 | | NR | | $ | 2,250,000 | | | $ | 230,997 | |
| Tobacco Securitization Authority of Southern California–San Diego County Tobacco Asset Securitization Corp | | Zero Coupon | | 6/1/2046 | | CCC- | | | 2,500,000 | | | | 526,433 | |
| Tobacco Securitization Authority of Southern California–San Diego County Tobacco Asset Securitization Corp | | 5.00% | | 6/1/2048 | | BBB+ | | | 2,675,000 | | | | 2,788,456 | |
| Total | | | | | | | | | | | | | 17,113,301 | |
| | | | | | | | | | | | | |
| Transportation 21.29% | | | | | | | | | | | | | | |
| Alameda Corridor Transportation Authority CA (AGM) | | Zero Coupon | | 10/1/2051 | | AA | | | 1,000,000 | | | | 586,888 | |
| Alameda Corridor Transportation Authority CA (AGM) | | Zero Coupon | | 10/1/2053 | | AA | | | 5,000,000 | | | | 1,252,530 | |
| Alameda Corridor Transportation Authority CA (AGM) | | 5.00% | | 10/1/2052 | | AA | | | 9,000,000 | | | | 9,802,600 | |
| Bay Area Toll Authority CA | | 5.00% | | 4/1/2054 | | AA | | | 2,720,000 | | | | 3,008,573 | |
| Burbank-Glendale-Pasadena Airport Authority Brick Campaign CA (AGM) AMT | | 4.375% | | 7/1/2049 | | AA | | | 1,000,000 | | | | 1,013,047 | |
| Burbank-Glendale-Pasadena Airport Authority Brick Campaign CA AMT | | 5.25% | | 7/1/2049 | | A | | | 1,000,000 | | | | 1,098,365 | |
| Burbank-Glendale-Pasadena Airport Authority Brick Campaign CA AMT | | 5.25% | | 7/1/2054 | | A | | | 4,350,000 | | | | 4,739,856 | |
| California Municipal Finance Authority–LAX Integrated Express Solutions LLC AMT | | 4.00% | | 12/31/2047 | | BB+ | (d) | | 1,000,000 | | | | 943,549 | |
| California Municipal Finance Authority–LAX Integrated Express Solutions LLC AMT | | 5.00% | | 12/31/2034 | | BB+ | (d) | | 1,700,000 | | | | 1,772,516 | |
| California Municipal Finance Authority–LAX Integrated Express Solutions LLC AMT | | 5.00% | | 12/31/2035 | | BB+ | (d) | | 1,205,000 | | | | 1,253,937 | |
| California Municipal Finance Authority–LAX Integrated Express Solutions LLC AMT | | 5.00% | | 12/31/2043 | | BB+ | (d) | | 3,565,000 | | | | 3,653,885 | |
| California Municipal Finance Authority–LAX Integrated Express Solutions LLC AMT | | 5.00% | | 12/31/2047 | | BB+ | (d) | | 6,500,000 | | | | 6,626,311 | |
| City of Fresno Airport Revenue CA (BAM) AMT | | 5.00% | | 7/1/2048 | | AA | | | 3,220,000 | | | | 3,459,421 | |
| City of Long Beach Airport System Revenue CA (AGM) AMT | | 5.25% | | 6/1/2047 | | AA | | | 1,330,000 | | | | 1,449,811 | |
| | See Notes to Financial Statements. | 175 |
Schedule of Investments (continued)
CALIFORNIA TAX FREE FUND September 30, 2024
| Investments | | Interest
Rate | | Maturity
Date | | Credit
Rating:
S&P or
Moody’s(a) | | Principal
Amount | | | Fair
Value | |
| Transportation (continued) | | | | | | | | | | | | | | |
| City of Los Angeles Department of Airports CA AMT | | 4.00% | | 5/15/2049 | | AA- | | $ | 2,000,000 | | | $ | 1,960,056 | |
| City of Los Angeles Department of Airports CA AMT | | 5.00% | | 5/15/2032 | | NR | | | 105,000 | | | | 118,217 | |
| City of Los Angeles Department of Airports CA AMT | | 5.00% | | 5/15/2032 | | AA- | | | 1,895,000 | | | | 2,117,325 | |
| City of Los Angeles Department of Airports CA AMT | | 5.00% | | 5/15/2051 | | AA- | | | 4,000,000 | | | | 4,216,254 | |
| City of Los Angeles Department of Airports CA AMT | | 5.25% | | 5/15/2048 | | AA- | | | 2,000,000 | | | | 2,189,207 | |
| City of Los Angeles Department of Airports CA AMT | | 5.50% | | 5/15/2036 | | AA | | | 1,100,000 | | | | 1,256,056 | |
| City of Los Angeles Department of Airports CA AMT | | 5.50% | | 5/15/2047 | | AA | | | 7,000,000 | | | | 7,699,694 | |
| County of Sacramento Airport System Revenue–County of Sacramento CA Airport System Revenue CA(c) | | 5.25% | | 7/1/2054 | | A+ | | | 3,500,000 | | | | 3,947,592 | |
| Foothill-Eastern Transportation Corridor Agency CA | | Zero Coupon | | 1/15/2033 | | A | | | 1,500,000 | | | | 1,117,376 | |
| Foothill-Eastern Transportation Corridor Agency CA | | 4.00% | | 1/15/2046 | | A | | | 1,225,000 | | | | 1,217,148 | |
| Foothill-Eastern Transportation Corridor Agency CA | | 4.00% | | 1/15/2046 | | A | | | 4,010,000 | | | | 3,984,297 | |
| Foothill-Eastern Transportation Corridor Agency CA | | 6.85% | | 1/15/2042 | | A | | | 1,150,000 | | | | 1,375,267 | |
| Norman Y Mineta San Jose International Airport SJC CA AMT | | 5.00% | | 3/1/2031 | | A | | | 1,750,000 | | | | 1,942,375 | |
| Port Commission of the City & County of San Francisco CA AMT | | 5.00% | | 3/1/2030 | | Aa3 | | | 1,415,000 | | | | 1,416,609 | |
| Riverside County Transportation Commission CA | | 4.00% | | 6/1/2047 | | A- | | | 3,520,000 | | | | 3,524,040 | |
| San Diego County Regional Airport Authority CA | | 5.00% | | 7/1/2039 | | A2 | | | 1,550,000 | | | | 1,741,681 | |
| San Diego County Regional Airport Authority CA AMT | | 4.00% | | 7/1/2046 | | A2 | | | 3,750,000 | | | | 3,672,450 | |
| San Diego County Regional Airport Authority CA AMT | | 5.00% | | 7/1/2051 | | A2 | | | 3,500,000 | | | | 3,692,347 | |
| San Diego County Regional Airport Authority CA AMT | | 5.00% | | 7/1/2053 | | A1 | | | 3,615,000 | | | | 3,851,212 | |
| 176 | See Notes to Financial Statements. | |
Schedule of Investments (continued)
CALIFORNIA TAX FREE FUND September 30, 2024
| Investments | | Interest
Rate | | Maturity
Date | | Credit
Rating:
S&P or
Moody’s(a) | | Principal
Amount | | | Fair
Value | |
| Transportation (continued) | | | | | | | | | | | | | | |
| San Francisco City & County Airport Comm-San Francisco International Airport CA | | 5.00% | | 5/1/2052 | | A1 | | $ | 1,025,000 | | | $ | 1,123,608 | |
| San Francisco City & County Airport Comm-San Francisco International Airport CA AMT | | 5.00% | | 5/1/2031 | | A1 | | | 6,500,000 | | | | 7,226,550 | |
| San Francisco City & County Airport Comm-San Francisco International Airport CA AMT | | 5.00% | | 5/1/2039 | | A1 | | | 2,695,000 | | | | 2,995,143 | |
| San Francisco City & County Airport Comm-San Francisco International Airport CA AMT | | 5.00% | | 5/1/2045 | | A+ | | | 1,515,000 | | | | 1,570,944 | |
| San Francisco City & County Airport Comm-San Francisco International Airport CA AMT | | 5.00% | | 5/1/2052 | | A1 | | | 7,100,000 | | | | 7,521,268 | |
| San Francisco City & County Airport Comm-San Francisco International Airport CA AMT | | 5.25% | | 5/1/2049 | | A1 | | | 3,600,000 | | | | 3,949,245 | |
| San Francisco City & County Airport Comm-San Francisco International Airport CA AMT | | 5.75% | | 5/1/2048 | | A1 | | | 2,000,000 | | | | 2,265,392 | |
| San Joaquin Hills Transportation Corridor Agency CA | | 4.00% | | 1/15/2044 | | A | | | 4,932,000 | | | | 5,036,438 | |
| San Joaquin Hills Transportation Corridor Agency CA | | 4.00% | | 1/15/2050 | | A | | | 1,825,000 | | | | 1,841,242 | |
| San Joaquin Hills Transportation Corridor Agency CA | | 5.25% | | 1/15/2044 | | A- | | | 8,920,000 | | | | 8,959,624 | |
| San Joaquin Hills Transportation Corridor Agency CA | | 5.25% | | 1/15/2049 | | A- | | | 6,930,000 | | | | 6,959,091 | |
| San Joaquin Hills Transportation Corridor Agency CA (NATL) | | Zero Coupon | | 1/15/2036 | | Baa2 | | | 1,450,000 | | | | 971,671 | |
| Total | | | | | | | | | | | | | 142,120,708 | |
| | | | | | | | | | | | | | | |
| Utilities 12.31% | | | | | | | | | | | | | | |
| California Community Choice Financing Authority | | 4.00% | #(b) | 2/1/2052 | | A1 | | | 4,000,000 | | | | 4,127,393 | |
| California Community Choice Financing Authority | | 4.00% | #(b) | 10/1/2052 | | A2 | | | 2,925,000 | | | | 2,972,599 | |
| California Community Choice Financing Authority | | 5.00% | #(b) | 2/1/2054 | | A1 | | | 2,500,000 | | | | 2,717,601 | |
| | See Notes to Financial Statements. | 177 |
Schedule of Investments (continued)
CALIFORNIA TAX FREE FUND September 30, 2024
| Investments | | Interest
Rate | | Maturity
Date | | Credit
Rating:
S&P or
Moody’s(a) | | Principal
Amount | | | Fair
Value | |
| Utilities (continued) | | | | | | | | | | | | | | |
| California Community Choice Financing Authority | | 5.00% | #(b) | 1/1/2055 | | A1 | | $ | 6,850,000 | | | $ | 7,525,409 | |
| California Community Choice Financing Authority | | 5.25% | | 11/1/2054 | | A2 | | | 1,125,000 | | | | 1,225,228 | |
| California Pollution Control Financing Authority–Poseidon Resources Channelside LP† | | 5.00% | | 11/21/2045 | | Baa3 | | | 3,870,000 | | | | 4,016,579 | |
| City of Burbank Electric Revenue CA | | 5.00% | | 6/1/2053 | | AA- | | | 3,790,000 | | | | 4,121,528 | |
| City of Glendale Electric Revenue CA | | 5.00% | | 2/1/2054 | | A+ | | | 2,500,000 | | | | 2,760,694 | |
| City of Glendale Electric Revenue CA | | 5.00% | | 2/1/2054 | | A+ | | | 2,000,000 | | | | 2,208,555 | |
| City of Los Angeles Wastewater System Revenue CA | | 5.00% | | 6/1/2043 | | AA+ | | | 3,125,000 | | | | 3,125,608 | |
| City of San Francisco Public Utilities Commission Water Revenue CA | | 5.25% | | 11/1/2052 | | Aa2 | | | 1,000,000 | | | | 1,130,000 | |
| Guam Waterworks Authority Water And Wastewater System | | 5.00% | | 7/1/2042 | | A- | | | 1,500,000 | | | | 1,640,749 | |
| Indio Electric Financing Authority–Imperial Irrigation District Electric System Revenue CA | | 5.25% | | 1/1/2053 | | A1 | | | 3,685,000 | | | | 4,141,442 | |
| Long Beach Bond Finance Authority CA | 5.034%
(3 Mo. LIBOR * .67 + 1.43% | )# | 11/15/2026 | | A1 | | | 1,000,000 | | | | 1,009,973 | |
| Los Angeles Department of Water & Power CA | | 5.00% | | 7/1/2043 | | Aa2 | | | 2,000,000 | | | | 2,233,804 | |
| Los Angeles Department of Water & Power CA | | 5.00% | | 7/1/2048 | | Aa2 | | | 2,000,000 | | | | 2,175,855 | |
| Los Angeles Department of Water & Power CA | | 5.00% | | 7/1/2051 | | Aa2 | | | 1,200,000 | | | | 1,308,077 | |
| Los Angeles Department of Water & Power CA | | 5.00% | | 7/1/2052 | | Aa2 | | | 4,645,000 | | | | 5,113,525 | |
| Los Angeles Department of Water & Power Water System Revenue CA | | 5.00% | | 7/1/2052 | | AA+ | | | 1,745,000 | | | | 1,923,503 | |
| Modesto Irrigation District CA | | 5.25% | | 10/1/2048 | | A+ | | | 3,060,000 | | | | 3,502,299 | |
| Northern California Energy Authority | | 5.00% | #(b) | 12/1/2054 | | Aa3 | | | 2,000,000 | | | | 2,164,689 | |
| Puerto Rico Commonwealth Aqueduct & Sewer Authority† | | 4.00% | | 7/1/2042 | | NR | | | 700,000 | | | | 672,179 | |
| Puerto Rico Commonwealth Aqueduct & Sewer Authority PR† | | 4.00% | | 7/1/2047 | | NR | | | 1,000,000 | | | | 937,212 | |
| Sacramento Municipal Utility District CA | | 5.00% | #(b) | 8/15/2049 | | AA- | | | 1,925,000 | | | | 1,946,972 | |
| 178 | See Notes to Financial Statements. | |
Schedule of Investments (continued)
CALIFORNIA TAX FREE FUND September 30, 2024
| Investments | | | | Interest
Rate | | Maturity
Date | | Credit
Rating:
S&P or
Moody’s(a) | | Principal
Amount | | | Fair
Value | |
| Utilities (continued) | | | | | | | | | | | | | | | | |
| Sacramento Municipal Utility District CA | | | | 5.00% | | 11/15/2054 | | Aa2 | | $ | 1,000,000 | | | $ | 1,125,656 | |
| Southern California Public Power Authority | | | | 5.00% | | 11/1/2033 | | A2 | | | 3,575,000 | | | | 3,825,553 | |
| Southern California Public Power Authority | | 5.161%
(3 Mo. LIBOR * .67 + 1.47% | )# | 11/1/2038 | | A2 | | | 815,000 | | | | 800,332 | |
| Southern California Public Power Authority–City of Anaheim Electric System Revenue CA | | | | 5.00% | #(b) | 4/1/2055 | | A2 | | | 5,500,000 | | | | 5,956,951 | |
| Southern California Public Power Authority–Los Angeles Department of Water & Power | | | | 5.00% | | 7/1/2053 | | Aa2 | | | 2,000,000 | | | | 2,250,700 | |
| Transbay Joint Powers Authority CA Tax Allocation | | | | 5.00% | | 10/1/2025 | | BBB+ | (d) | | 1,130,000 | | | | 1,146,079 | |
| Transbay Joint Powers Authority CA Tax Allocation | | | | 5.00% | | 10/1/2032 | | BBB+ | (d) | | 1,090,000 | | | | 1,159,612 | |
| Transbay Joint Powers Authority CA Tax Allocation | | | | 5.00% | | 10/1/2034 | | BBB+ | (d) | | 300,000 | | | | 317,657 | |
| Transbay Joint Powers Authority CA Tax Allocation | | | | 5.00% | | 10/1/2035 | | BBB+ | (d) | | 200,000 | | | | 211,237 | |
| Transbay Joint Powers Authority CA Tax Allocation | | | | 5.00% | | 10/1/2038 | | BBB+ | (d) | | 650,000 | | | | 676,876 | |
| Total | | | | | | | | | | | | | | | 82,172,126 | |
| Total Municipal Bonds (cost $646,929,536) | | | | | | | | | 663,060,348 | |
| | | | | | | | | | | | | | | | | |
| | | Interest
Rate# | | Interest
Rate
Reset
Date(g) | | Final
Maturity
Date | | | | | | | | |
| | | | | | | | | | | | | |
| SHORT-TERM INVESTMENTS 0.57% | | | | | | | | | | | | |
| | | | | | | | | | | | | | | | | |
| VARIABLE RATE DEMAND NOTES 0.57% | | | | | | | | | | | |
| | | | | | | | | | | | | | | | | |
| Taxable Revenue–Water & Sewer 0.24% | | | | | | | | | | | | |
| Los Angeles Department of Water & Power Water System Revenue CA | | 3.000% | | 10/1/2024 | | 7/1/2045 | | Aa2 | | | 1,650,000 | | | | 1,650,000 | |
| | | | | | | | | | | | | | | | | |
| Transportation 0.33% | | | | | | | | | | | | | | | | |
| Bay Area Toll Authority CA | | 3.400% | | 10/1/2024 | | 4/1/2055 | | AA+ | | | 2,200,000 | | | | 2,200,000 | |
| Total Short-Term Investments (cost $3,850,000) | | | | | | | | | | 3,850,000 | |
| Total Investments in Securities 99.89% (cost $650,779,536) | | | | | | | | | | 666,910,348 | |
| Other Assets and Liabilities – Net(h) 0.11% | | | | | | | | | | 710,877 | |
| Net Assets 100.00% | | | | | | | | | | | | | | $ | 667,621,225 | |
| | See Notes to Financial Statements. | 179 |
Schedule of Investments (concluded)
CALIFORNIA TAX FREE FUND September 30, 2024
| AGM | | Insured by–Assured Guaranty Municipal Corporation. |
| AMT | | Income from the security may be subject to Alternative Minimum Tax. |
| BAM | | Insured by–Build America Mutual. |
| COPS | | Certificates of Participation. |
| LIBOR | | London Interbank Offered Rate. |
| NATL | | Insured by–National Public Finance Guarantee Corporation. |
| NR | | Not Rated. |
| SIFMA | | Insured by–Securities Industry and Financial Markets Association. |
| † | | Security was purchased pursuant to Rule 144A under the Securities Act of 1933 and, unless registered under such Act or exempted from registration, may only be resold to qualified institutional buyers. At September 30, 2024, the total value of Rule 144A securities was $50,207,689, which represents 7.52% of net assets. |
| # | | Variable rate security. The interest rate represents the rate in effect at September 30, 2024. |
| (a) | | Unaudited. |
| (b) | | Variable Rate is Fixed to Float: Rate remains fixed or at Zero Coupon until designated future date. |
| (c) | | Securities purchased on a when-issued basis (See Note 2(g)). |
| (d) | | This investment has been rated by Fitch IBCA. |
| (e) | | Defaulted (non-income producing security). |
| (f) | | Municipal Bonds Held in Trust–Securities represent underlying bonds transferred to a separate securitization trust established in a tender option bond transaction in which the Fund acquired the residual interest certificates. These securities serve as collateral in a financing transaction. See Note 2(h) to Financial Statements for details of Municipal Bonds Held in Trust. |
| (g) | | The interest rate reset date shown represents the date in which the Fund has the right to sell a Variable Rate Demand Note (“VRDN”) back to the issuer for Principal Amount. The interest rate on the VRDN is generally reset daily based on the SIFMA Municipal Swap Index. |
| (h) | | Other Assets and Liabilities – Net include net unrealized appreciation/depreciation on futures contracts as follows: |
Futures Contracts at September 30, 2024:
| Type | | Expiration | | Contracts | | Position | | Notional
Amount | | | Notional
Value | | | Unrealized
Appreciation | |
| U.S. Long Bond | | December 2024 | | 39 | | Short | | | $(4,852,466 | ) | | | $(4,843,313 | ) | | | $9,153 | |
The following is a summary of the inputs used as of September 30, 2024 in valuing the Fund’s investments carried at fair value(1):
| Investment Type(2) | | Level 1 | | | Level 2 | | | Level 3 | | | Total | |
| Long-Term Investments | | | | | | | | | | | | | | | | |
| Municipal Bonds(3) | | $ | – | | | $ | 663,060,348 | | | $ | – | | | $ | 663,060,348 | |
| Short-Term Investments | | | | | | | | | | | | | | | | |
| Variable Rate Demand Notes | | | – | | | | 3,850,000 | | | | – | | | | 3,850,000 | |
| Total | | $ | – | | | $ | 666,910,348 | | | $ | – | | | $ | 666,910,348 | |
| Other Financial Instruments | | | | | | | | | | | | | | | | |
| Futures Contracts | | | | | | | | | | | | | | | | |
| Assets | | $ | 9,153 | | | $ | – | | | $ | – | | | $ | 9,153 | |
| Liabilities | | | – | | | | – | | | | – | | | | – | |
| Total | | $ | 9,153 | | | $ | – | | | $ | – | | | $ | 9,153 | |
| | | |
| (1) | | Refer to Note 2(i) for a description of fair value measurements and the three-tier hierarchy of inputs. |
| (2) | | See Schedule of Investments for fair values in each industry. The table above is presented by Investment Type. Industries are presented within an Investment Type should such Investment Type include securities classified as two or more levels within the three-tier fair value hierarchy. When applicable, each Level 3 security is identified on the Schedule of Investments along with the valuation technique utilized. |
| (3) | | Includes Municipal Bonds held in the Trust (See Note 2(h)). |
A reconciliation of Level 3 investments is presented when the Fund has a material amount of Level 3 investments at the beginning or end of the year in relation to the Fund’s net assets. Management has determined not to provide a reconciliation as the balance of Level 3 investments was not considered to be material to the Fund’s net assets at the beginning or the end of the year.
| 180 | See Notes to Financial Statements. | |
Schedule of Investments
NEW JERSEY TAX FREE FUND September 30, 2024
| Investments | | Interest
Rate | | Maturity
Date | | Credit
Rating:
S&P or
Moody’s(a) | | Principal
Amount | | | Fair
Value | |
| LONG-TERM INVESTMENTS 98.62% | | | | | | | | | | | | | | |
| | | | | | | | | | | | | |
| MUNICIPAL BONDS 98.62% | | | | | | | | | | | | | | |
| | | | | | | | | | | | | |
| Corporate-Backed 2.69% | | | | | | | | | | | | | | |
| New Jersey Economic Development Authority–NYNJ Link Borrower LLC (AGM) AMT | | 5.00% | | 1/1/2031 | | AA | | $ | 225,000 | | | $ | 225,298 | |
| New Jersey Economic Development Authority–NYNJ Link Borrower LLC AMT | | 5.00% | | 1/1/2028 | | A- | | | 100,000 | | | | 100,106 | |
| New Jersey Economic Development Authority–United Airlines Inc | | 5.25% | | 9/15/2029 | | BB- | | | 1,435,000 | | | | 1,436,677 | |
| New Jersey Economic Development Authority–United Airlines Inc | | 5.50% | | 6/1/2033 | | BB- | | | 650,000 | | | | 654,420 | |
| New Jersey Infrastructure Bank | | 2.125% | | 9/1/2046 | | AAA | | | 400,000 | | | | 268,902 | |
| Salem County Pollution Control Financing Authority–Constellation Energy Generation LLC NJ AMT | | 4.45% | | 3/1/2025 | | BBB+ | | | 1,085,000 | | | | 1,087,875 | |
| Total | | | | | | | | | | | | | 3,773,278 | |
| | | | | | | | | | | | | |
| Education 13.67% | | | | | | | | | | | | | | |
| Camden County Improvement Authority–KIPP Cooper Norcross Obligated Group NJ | | 6.00% | | 6/15/2047 | | BBB | | | 500,000 | | | | 546,982 | |
| Gloucester County Improvement Authority–Rowan University NJ (BAM) | | 5.00% | | 7/1/2054 | | AA | | | 1,000,000 | | | | 1,081,070 | |
| Hudson County Improvement Authority NJ | | 4.00% | | 6/1/2049 | | AA | | | 500,000 | | | | 498,318 | |
| Middlesex County Improvement Authority–Rutgers The State University of New Jersey | | 5.00% | | 8/15/2053 | | Aa3 | | | 1,960,000 | | | | 2,166,311 | |
| Middlesex County Improvement Authority NJ GTD | | 4.00% | | 8/15/2053 | | AAA | | | 1,000,000 | | | | 999,722 | |
| New Jersey Economic Development Authority–Provident Group-Montclair Properties LLC (AGM) | | 5.00% | | 6/1/2042 | | AA | | | 500,000 | | | | 513,564 | |
| New Jersey Educational Facilities Authority | | 5.00% | | 9/1/2036 | | A2 | | | 290,000 | | | | 330,255 | |
| New Jersey Educational Facilities Authority | | 5.25% | | 9/1/2053 | | A2 | | | 750,000 | | | | 821,403 | |
| New Jersey Educational Facilities Authority–Montclair State University Inc (AGM) | | 5.00% | | 7/1/2041 | | AA | | | 780,000 | | | | 895,841 | |
| New Jersey Educational Facilities Authority–Montclair State University Inc (AGM) | | 5.00% | | 7/1/2044 | | AA | | | 500,000 | | | | 567,801 | |
| | See Notes to Financial Statements. | 181 |
Schedule of Investments (continued)
NEW JERSEY TAX FREE FUND September 30, 2024
| Investments | | Interest
Rate | | Maturity
Date | | Credit
Rating:
S&P or
Moody’s(a) | | Principal
Amount | | | Fair
Value | |
| Education (continued) | | | | | | | | | | | | | | |
| New Jersey Educational Facilities Authority–New Jersey City University Inc (AGM) | | 4.00% | | 7/1/2036 | | AA | | $ | 745,000 | | | $ | 740,752 | |
| New Jersey Educational Facilities Authority–Ramapo College of New Jersey (AGM) | | 4.00% | | 7/1/2041 | | AA | | | 545,000 | | | | 557,543 | |
| New Jersey Educational Facilities Authority–Seton Hall University | | 4.00% | | 7/1/2046 | | BBB+ | | | 545,000 | | | | 511,390 | |
| New Jersey Educational Facilities Authority–Seton Hall University | | 5.00% | | 7/1/2034 | | BBB+ | | | 325,000 | | | | 332,497 | |
| New Jersey Educational Facilities Authority–Seton Hall University (AGM) | | 3.25% | | 7/1/2049 | | AA | | | 450,000 | | | | 391,291 | |
| New Jersey Educational Facilities Authority–Stevens Institute of Technology International Inc | | 3.00% | | 7/1/2050 | | BBB+ | | | 1,170,000 | | | | 911,759 | |
| New Jersey Educational Facilities Authority–Stevens Institute of Technology International Inc | | 4.00% | | 7/1/2050 | | BBB+ | | | 200,000 | | | | 189,269 | |
| New Jersey Educational Facilities Authority–Stevens Institute of Technology International Inc | | 5.00% | | 7/1/2030 | | BBB+ | | | 530,000 | | | | 556,877 | |
| New Jersey Educational Facilities Authority–Stockton University–Stockton University | | 5.00% | | 7/1/2041 | | A3 | | | 800,000 | | | | 816,221 | |
| New Jersey Educational Facilities Authority–Trustees of Princeton University | | 5.25% | | 3/1/2054 | | AAA | | | 3,885,000 | | | | 4,421,781 | |
| New Jersey Educational Facilities Authority–William Paterson University of New Jersey (AGM) | | 3.00% | | 7/1/2039 | | AA | | | 250,000 | | | | 236,181 | |
| New Jersey Educational Facilities Authority–William Paterson University of New Jersey (AGM) | | 3.00% | | 7/1/2040 | | AA | | | 250,000 | | | | 231,741 | |
| New Jersey Higher Education Student Assistance Authority AMT | | 2.50% | | 12/1/2040 | | AA | | | 465,000 | | | | 423,841 | |
| New Jersey Higher Education Student Assistance Authority AMT | | 3.25% | | 12/1/2039 | | Aa1 | | | 275,000 | | | | 262,977 | |
| New Jersey Institute of Technology | | 5.00% | | 7/1/2033 | | A1 | | | 170,000 | | | | 186,533 | |
| Total | | | | | | | | | | | | | 19,191,920 | |
| | | | | | | | | | | | | |
| Financial Services 0.15% | | | | | | | | | | | | | | |
| New Jersey Higher Education Student Assistance Authority AMT | | 5.00% | | 12/1/2028 | | Aaa | | | 200,000 | | | | 212,000 | |
| 182 | See Notes to Financial Statements. | |
Schedule of Investments (continued)
NEW JERSEY TAX FREE FUND September 30, 2024
| Investments | | Interest
Rate | | Maturity
Date | | Credit
Rating:
S&P or
Moody’s(a) | | Principal
Amount | | | Fair
Value | |
| General Obligation 11.29% | | | | | | | | | | | | | | |
| City of Atlantic City NJ GO (AGM), (ST AID WITHHLDG) | | 5.00% | | 3/1/2037 | | AA | | $ | 540,000 | | | $ | 561,796 | |
| City of Atlantic City NJ GO (BAM), (ST AID WITHHLDG) | | 5.00% | | 3/1/2042 | | AA | | | 750,000 | | | | 773,409 | |
| City of Jersey City NJ GO | | 4.00% | | 2/15/2036 | | A1 | | | 750,000 | | | | 771,836 | |
| City of Newark Mass Transit Access Tax Revenue NJ (AGM) | | 5.375% | | 11/15/2052 | | AA | | | 1,670,000 | | | | 1,885,637 | |
| City of Summit NJ GO | | 4.00% | | 7/15/2041 | | AAA | | | 500,000 | | | | 520,507 | |
| Commonwealth of Puerto Rico GO | | Zero Coupon | | 7/1/2033 | | NR | | | 52,676 | | | | 35,824 | |
| Commonwealth of Puerto Rico GO | | Zero Coupon | #(b) | 11/1/2043 | | NR | | | 180,626 | | | | 116,504 | |
| Commonwealth of Puerto Rico GO | | 4.00% | | 7/1/2033 | | NR | | | 40,933 | | | | 41,011 | |
| Commonwealth of Puerto Rico GO | | 4.00% | | 7/1/2035 | | NR | | | 36,793 | | | | 36,757 | |
| Commonwealth of Puerto Rico GO | | 4.00% | | 7/1/2037 | | NR | | | 31,578 | | | | 31,376 | |
| Commonwealth of Puerto Rico GO | | 5.375% | | 7/1/2025 | | NR | | | 22,763 | | | | 22,899 | |
| Commonwealth of Puerto Rico GO | | 5.625% | | 7/1/2027 | | NR | | | 45,175 | | | | 47,184 | |
| Commonwealth of Puerto Rico GO | | 5.625% | | 7/1/2029 | | NR | | | 44,442 | | | | 48,018 | |
| Commonwealth of Puerto Rico GO | | 5.75% | | 7/1/2031 | | NR | | | 43,166 | | | | 48,037 | |
| County of Atlantic NJ GO | | 4.00% | | 3/15/2039 | | AA | | | 450,000 | | | | 474,806 | |
| County of Hudson NJ GO | | 2.00% | | 11/15/2035 | | AA | | | 935,000 | | | | 761,150 | |
| Cumberland County Improvement Authority NJ GTD (BAM) | | 4.00% | | 10/1/2048 | | AA | | | 750,000 | | | | 748,349 | |
| New Jersey Economic Development Authority–New Jersey Transit Corp | | 5.25% | | 11/1/2047 | | A2 | | | 840,000 | | | | 926,565 | |
| New Jersey Health Care Facilities Financing Authority | | 5.00% | | 10/1/2037 | | A2 | | | 1,000,000 | | | | 1,051,222 | |
| New Jersey Infrastructure Bank | | 5.00% | | 9/1/2052 | | AAA | | | 500,000 | | | | 552,180 | |
| New Jersey Transportation Trust Fund Authority | | 4.25% | | 6/15/2044 | | A2 | | | 500,000 | | | | 511,870 | |
| New Jersey Transportation Trust Fund Authority | | 5.25% | | 6/15/2046 | | A2 | | | 790,000 | | | | 881,556 | |
| Rutherford Board of Education NJ GO | | 2.50% | | 12/15/2034 | | AA- | | | 1,000,000 | | | | 881,975 | |
| State of New Jersey GO | | 2.50% | | 6/1/2038 | | A1 | | | 1,020,000 | | | | 842,702 | |
| State of New Jersey GO | | 5.00% | | 6/1/2040 | | A1 | | | 750,000 | | | | 812,805 | |
| State of New Jersey GO | | 5.00% | | 6/1/2041 | | A1 | | | 400,000 | | | | 419,891 | |
| Township of Berkeley Heights NJ GO | | 4.00% | | 7/1/2041 | | Aa1 | | | 785,000 | | | | 821,419 | |
| Union County Improvement Authority | | 4.125% | | 4/15/2054 | | Aaa | | | 250,000 | | | | 252,482 | |
| Union County Utilities Authority–Covanta Union LLC NJ GTD AMT | | 4.75% | | 12/1/2031 | | AA+ | | | 965,000 | | | | 965,279 | |
| Total | | | | | | | | | | | | | 15,845,046 | |
| | See Notes to Financial Statements. | 183 |
Schedule of Investments (continued)
NEW JERSEY TAX FREE FUND September 30, 2024
| Investments | | Interest
Rate | | Maturity
Date | | Credit
Rating:
S&P or
Moody’s(a) | | Principal
Amount | | | Fair
Value | |
| Health Care 13.22% | | | | | | | | | | | | | | |
| New Jersey Economic Development Authority–Bancroft Neurohealth Obligated Group | | 5.00% | | 6/1/2036 | | NR | | $ | 220,000 | | | $ | 221,207 | |
| New Jersey Health Care Facilities Financing Authority–AtlantiCare Health System Obligated Group | | 2.375% | | 7/1/2046 | | AA- | | | 695,000 | | | | 471,759 | |
| New Jersey Health Care Facilities Financing Authority–Inspira Health Obligated Group | | 4.00% | | 7/1/2047 | | A2 | | | 975,000 | | | | 965,478 | |
| New Jersey Health Care Facilities Financing Authority–Inspira Health Obligated Group | | 4.125% | | 7/1/2054 | | A2 | | | 1,665,000 | | | | 1,649,855 | |
| New Jersey Health Care Facilities Financing Authority–Inspira Health Obligated Group | | 5.00% | | 7/1/2035 | | A2 | | | 460,000 | | | | 480,950 | |
| New Jersey Health Care Facilities Financing Authority–Inspira Health Obligated Group | | 5.00% | | 7/1/2042 | | A2 | | | 1,215,000 | | | | 1,252,017 | |
| New Jersey Health Care Facilities Financing Authority–Inspira Health Obligated Group | | 5.25% | | 7/1/2054 | | A2 | | | 1,720,000 | | | | 1,917,305 | |
| New Jersey Health Care Facilities Financing Authority–RWJ Barnabas Health Obligated Group | | 3.00% | | 7/1/2051 | | AA- | | | 1,225,000 | | | | 1,018,313 | |
| New Jersey Health Care Facilities Financing Authority–RWJ Barnabas Health Obligated Group | | 4.00% | | 7/1/2051 | | AA- | | | 1,350,000 | | | | 1,337,446 | |
| New Jersey Health Care Facilities Financing Authority–RWJ Barnabas Health Obligated Group | | 5.00% | | 7/1/2043 | | AA- | | | 1,925,000 | | | | 1,966,098 | |
| New Jersey Health Care Facilities Financing Authority–RWJ Barnabas Health Obligated Group | | 5.25% | | 7/1/2054 | | AA- | | | 1,500,000 | | | | 1,681,148 | |
| New Jersey Health Care Facilities Financing Authority–St Joseph’s Healthcare System Obligated Group | | 4.00% | | 7/1/2048 | | BBB- | | | 1,325,000 | | | | 1,233,570 | |
| New Jersey Health Care Facilities Financing Authority–St Joseph’s Healthcare System Obligated Group | | 5.00% | | 7/1/2027 | | BBB- | | | 100,000 | | | | 102,586 | |
| New Jersey Health Care Facilities Financing Authority–St Joseph’s Healthcare System Obligated Group | | 5.00% | | 7/1/2041 | | BBB- | | | 785,000 | | | | 790,694 | |
| 184 | See Notes to Financial Statements. | |
Schedule of Investments (continued)
NEW JERSEY TAX FREE FUND September 30, 2024
| Investments | | Interest
Rate | | Maturity
Date | | Credit
Rating:
S&P or
Moody’s(a) | | Principal
Amount | | | Fair
Value | |
| Health Care (continued) | | | | | | | | | | | | | | |
| New Jersey Health Care Facilities Financing Authority–University Hospital (AGM) | | 5.00% | | 7/1/2046 | | AA | | $ | 1,000,000 | | | $ | 1,006,837 | |
| New Jersey Health Care Facilities Financing Authority–University of Pennsylvania Health System Obligated Group | | 5.00% | | 7/1/2039 | | AA | | | 1,000,000 | | | | 1,027,017 | |
| New Jersey Health Care Facilities Financing Authority–Valley Health System Obligated Group | | 4.00% | | 7/1/2044 | | A | | | 1,055,000 | | | | 1,047,891 | |
| New Jersey Health Care Facilities Financing Authority–Valley Health System Obligated Group | | 5.00% | | 7/1/2030 | | A | | | 355,000 | | | | 388,604 | |
| Total | | | | | | | | | | | | | 18,558,775 | |
| | | | | | | | | | | | | | | |
| Housing 0.06% | | | | | | | | | | | | | | |
| New Jersey Housing & Mortgage Finance Agency (HUD) | | 3.15% | | 5/1/2053 | | AA- | | | 100,000 | | | | 77,154 | |
| | | | | | | | | | | | | | | |
| Lease Obligations 11.63% | | | | | | | | | | | | | | |
| Gloucester County Improvement Authority–Rowan University NJ (AGM) | | 5.00% | | 11/1/2029 | | AA | | | 295,000 | | | | 309,375 | |
| Gloucester County Improvement Authority–Rowan University NJ (AGM) | | 5.00% | | 11/1/2030 | | AA | | | 290,000 | | | | 304,252 | |
| New Jersey Economic Development Authority–NYNJ Link Borrower LLC AMT | | 5.375% | | 1/1/2043 | | A- | | | 1,660,000 | | | | 1,661,572 | |
| New Jersey Economic Development Authority–NYNJ Link Borrower LLC AMT | | 5.625% | | 1/1/2052 | | A- | | | 210,000 | | | | 210,206 | |
| New Jersey Economic Development Authority–State Capitol Joint Management Commission | | 5.00% | | 6/15/2035 | | A2 | | | 750,000 | | | | 802,354 | |
| New Jersey Economic Development Authority–State of New Jersey Department of the Treasury | | 5.00% | | 6/15/2029 | | A2 | | | 500,000 | | | | 527,642 | |
| New Jersey Economic Development Authority–State of New Jersey Department of the Treasury | | 5.00% | | 6/15/2047 | | A2 | | | 540,000 | | | | 555,822 | |
| New Jersey Economic Development Authority–State of New Jersey Department of the Treasury | | 5.00% | | 6/15/2048 | | A2 | | | 500,000 | | | | 519,114 | |
| New Jersey Educational Facilities Authority–State of New Jersey Department of the Treasury | | 5.00% | | 9/1/2033 | | A2 | | | 1,070,000 | | | | 1,071,230 | |
| | See Notes to Financial Statements. | 185 |
Schedule of Investments (continued)
NEW JERSEY TAX FREE FUND September 30, 2024
| Investments | | Interest
Rate | | Maturity
Date | | Credit
Rating:
S&P or
Moody’s(a) | | Principal
Amount | | | Fair
Value | |
| Lease Obligations (continued) | | | | | | | | | | | | | | |
| New Jersey Health Care Facilities Financing Authority | | 5.00% | | 10/1/2038 | | A2 | | $ | 520,000 | | | $ | 545,282 | |
| New Jersey Transportation Trust Fund Authority | | Zero Coupon | | 12/15/2031 | | A2 | | | 1,980,000 | | | | 1,562,050 | |
| New Jersey Transportation Trust Fund Authority | | Zero Coupon | | 12/15/2038 | | A2 | | | 1,120,000 | | | | 659,186 | |
| New Jersey Transportation Trust Fund Authority | | 4.00% | | 12/15/2039 | | A2 | | | 660,000 | | | | 672,316 | |
| New Jersey Transportation Trust Fund Authority | | 4.25% | | 12/15/2038 | | A2 | | | 470,000 | | | | 481,116 | |
| New Jersey Transportation Trust Fund Authority | | 4.75% | | 6/15/2038 | | A2 | | | 1,085,000 | | | | 1,093,622 | |
| New Jersey Transportation Trust Fund Authority | | 5.00% | | 6/15/2030 | | A+ | | | 545,000 | | | | 562,740 | |
| New Jersey Transportation Trust Fund Authority | | 5.00% | | 6/15/2031 | | A+ | | | 400,000 | | | | 412,590 | |
| New Jersey Transportation Trust Fund Authority | | 5.00% | | 12/15/2036 | | A2 | | | 935,000 | | | | 998,349 | |
| New Jersey Transportation Trust Fund Authority | | 5.00% | | 6/15/2038 | | A2 | | | 1,380,000 | | | | 1,382,847 | |
| New Jersey Transportation Trust Fund Authority | | 5.25% | | 6/15/2041 | | A2 | | | 235,000 | | | | 237,569 | |
| New Jersey Transportation Trust Fund Authority | | 5.25% | | 6/15/2043 | | A2 | | | 720,000 | | | | 769,504 | |
| New Jersey Transportation Trust Fund Authority–State of New Jersey | | 5.00% | | 9/1/2036 | | A2 | | | 545,000 | | | | 559,784 | |
| New Jersey Transportation Trust Fund Authority–State of New Jersey | | 5.50% | | 9/1/2033 | | A2 | | | 410,000 | | | | 426,445 | |
| Total | | | | | | | | | | | | | 16,324,967 | |
| | | | | | | | | | | | | | | |
| Miscellaneous 0.54% | | | | | | | | | | | | | | |
| Bergen County Improvement Authority–County of Bergen NJ | | 5.00% | | 6/1/2054 | | Aaa | | | 675,000 | | | | 758,961 | |
| | | | | | | | | | | | | | | |
| Other Revenue 1.50% | | | | | | | | | | | | | | |
| Casino Reinvestment Development Authority, Inc. GA (AGC) | | 4.00% | | 11/1/2044 | | AA | | | 1,250,000 | | | | 1,252,478 | |
| Casino Reinvestment Development Authority, Inc. GA (AGC) | | 5.00% | | 11/1/2041 | | AA | | | 250,000 | | | | 278,926 | |
| Casino Reinvestment Development Authority, Inc. GA (AGC) | | 5.00% | | 11/1/2044 | | AA | | | 200,000 | | | | 220,371 | |
| 186 | See Notes to Financial Statements. | |
Schedule of Investments (continued)
NEW JERSEY TAX FREE FUND September 30, 2024
| Investments | | Interest
Rate | | Maturity
Date | | Credit
Rating:
S&P or
Moody’s(a) | | Principal
Amount | | | Fair
Value | |
| Other Revenue (continued) | | | | | | | | | | | | | | |
| New Jersey Economic Development Authority–Bancroft Neurohealth Obligated Group | | 5.00% | | 6/1/2041 | | NR | | $ | 350,000 | | | $ | 351,030 | |
| Total | | | | | | | | | | | | | 2,102,805 | |
| | | | | | | | | | | | | | | |
| Special Tax 0.58% | | | | | | | | | | | | | | |
| New Jersey Economic Development Authority–NJ Metromall Urban Renewal Inc | | 6.50% | | 4/1/2028 | | Baa2 | | | 474,458 | | | | 478,864 | |
| New Jersey Infrastructure Bank | | 2.00% | | 9/1/2046 | | AAA | | | 520,000 | | | | 340,240 | |
| Total | | | | | | | | | | | | | 819,104 | |
| | | | | | | | | | | | | | | |
| Tax Revenue 5.49% | | | | | | | | | | | | | | |
| Casino Reinvestment Development Authority, Inc. NJ | | 5.25% | | 11/1/2039 | | BBB+ | | | 875,000 | | | | 876,278 | |
| Casino Reinvestment Development Authority, Inc. NJ | | 5.25% | | 11/1/2044 | | BBB+ | | | 810,000 | | | | 811,184 | |
| Casino Reinvestment Development Authority, Inc. NJ (AGM) | | 5.00% | | 11/1/2032 | | AA | | | 500,000 | | | | 500,628 | |
| Garden State Preservation Trust NJ (AGM) | | 5.75% | | 11/1/2028 | | AA | | | 1,205,000 | | | | 1,282,566 | |
| New Jersey Infrastructure Bank | | 5.00% | | 9/1/2049 | | AAA | | | 800,000 | | | | 905,542 | |
| New Jersey Transportation Trust Fund Authority | | 3.00% | | 6/15/2050 | | A2 | | | 550,000 | | | | 447,900 | |
| Puerto Rico Sales Tax Financing Corp. Sales Tax Revenue | | Zero Coupon | | 7/1/2029 | | NR | | | 18,000 | | | | 15,089 | |
| Puerto Rico Sales Tax Financing Corp. Sales Tax Revenue | | Zero Coupon | | 7/1/2031 | | NR | | | 235,000 | | | | 181,602 | |
| Puerto Rico Sales Tax Financing Corp. Sales Tax Revenue | | Zero Coupon | | 7/1/2033 | | NR | | | 646,000 | | | | 458,246 | |
| Puerto Rico Sales Tax Financing Corp. Sales Tax Revenue | | Zero Coupon | | 7/1/2051 | | NR | | | 2,675,000 | | | | 659,751 | |
| Puerto Rico Sales Tax Financing Corp. Sales Tax Revenue | | 4.329% | | 7/1/2040 | | NR | | | 96,000 | | | | 95,953 | |
| Puerto Rico Sales Tax Financing Corp. Sales Tax Revenue | | 4.329% | | 7/1/2040 | | NR | | | 492,000 | | | | 491,757 | |
| Puerto Rico Sales Tax Financing Corp. Sales Tax Revenue | | 4.536% | | 7/1/2053 | | NR | | | 18,000 | | | | 17,851 | |
| Puerto Rico Sales Tax Financing Corp. Sales Tax Revenue | | 4.55% | | 7/1/2040 | | NR | | | 19,000 | | | | 19,108 | |
| Puerto Rico Sales Tax Financing Corp. Sales Tax Revenue | | 4.55% | | 7/1/2040 | | NR | | | 380,000 | | | | 382,151 | |
| | See Notes to Financial Statements. | 187 |
Schedule of Investments (continued)
NEW JERSEY TAX FREE FUND September 30, 2024
| Investments | | Interest
Rate | | Maturity
Date | | Credit
Rating:
S&P or
Moody’s(a) | | Principal
Amount | | | Fair
Value | |
| Tax Revenue (continued) | | | | | | | | | | | | | | |
| Puerto Rico Sales Tax Financing Corp. Sales Tax Revenue | | 4.75% | | 7/1/2053 | | NR | | $ | 267,000 | | | $ | 267,822 | |
| Puerto Rico Sales Tax Financing Corp. Sales Tax Revenue | | 4.784% | | 7/1/2058 | | NR | | | 40,000 | | | | 40,107 | |
| Territory of Guam | | 4.00% | | 1/1/2042 | | Baa3 | | | 250,000 | | | | 247,021 | |
| Total | | | | | | | | | | | | | 7,700,556 | |
| | | | | | | | | | | | | | | |
| Taxable Revenue–Water & Sewer 0.76% | | | | | | | | | | | | | | |
| Jersey City Municipal Utilities Authority Sewer Fund NJ (AGM) | | 5.25% | | 10/15/2054 | | AA | | | 500,000 | | | | 564,777 | |
| New Jersey Economic Development Authority–New Jersey-American Water Co Inc AMT | | 3.75% | #(b) | 11/1/2034 | | A+ | | | 500,000 | | | | 505,825 | |
| Total | | | | | | | | | | | | | 1,070,602 | |
| | | | | | | | | | | | | | | |
| Tobacco 2.21% | | | | | | | | | | | | | | |
| Tobacco Settlement Financing Corp. NJ | | 5.00% | | 6/1/2046 | | BBB- | | | 2,045,000 | | | | 2,063,667 | |
| Tobacco Settlement Financing Corp. NJ | | 5.25% | | 6/1/2046 | | BBB+ | | | 1,000,000 | | | | 1,039,069 | |
| Total | | | | | | | | | | | | | 3,102,736 | |
| | | | | | | | | | | | | | | |
| Transportation 30.40% | | | | | | | | | | | | | | |
| Delaware River & Bay Authority | | 4.00% | | 1/1/2044 | | A+ | | | 515,000 | | | | 519,039 | |
| Delaware River & Bay Authority | | 5.00% | | 1/1/2039 | | A+ | | | 500,000 | | | | 558,497 | |
| Delaware River & Bay Authority | | 5.00% | | 1/1/2049 | | A+ | | | 1,250,000 | | | | 1,389,882 | |
| Delaware River Joint Toll Bridge Commission PA | | 3.00% | | 7/1/2049 | | A+ | | | 1,025,000 | | | | 794,892 | |
| Delaware River Port Authority PA | | 5.00% | | 1/1/2040 | | A+ | | | 600,000 | | | | 647,235 | |
| New Jersey Economic Development Authority–New Jersey Transit Corp | | 4.00% | | 11/1/2044 | | A2 | | | 275,000 | | | | 275,738 | |
| New Jersey Economic Development Authority–NYNJ Link Borrower LLC (AGM) AMT | | 5.125% | | 1/1/2039 | | AA | | | 925,000 | | | | 926,034 | |
| New Jersey Economic Development Authority–Port Newark Container Terminal LLC AMT | | 5.00% | | 10/1/2047 | | Baa2 | | | 940,000 | | | | 958,866 | |
| New Jersey Transportation Trust Fund Authority | | 4.00% | | 6/15/2050 | | A2 | | | 1,080,000 | | | | 1,073,826 | |
| New Jersey Transportation Trust Fund Authority | | 5.00% | | 6/15/2028 | | A+ | | | 1,000,000 | | | | 1,035,874 | |
| New Jersey Transportation Trust Fund Authority | | 5.25% | | 6/15/2050 | | A2 | | | 2,500,000 | | | | 2,802,823 | |
| New Jersey Transportation Trust Fund Authority | | 5.50% | | 6/15/2050 | | A2 | | | 500,000 | | | | 563,328 | |
| 188 | See Notes to Financial Statements. | |
Schedule of Investments (continued)
NEW JERSEY TAX FREE FUND September 30, 2024
| Investments | | Interest
Rate | | Maturity
Date | | Credit
Rating:
S&P or
Moody’s(a) | | Principal
Amount | | | Fair
Value | |
| Transportation (continued) | | | | | | | | | | | | | | |
| New Jersey Transportation Trust Fund Authority–State of New Jersey | | 3.00% | | 6/15/2050 | | A2 | | $ | 750,000 | | | $ | 610,773 | |
| New Jersey Turnpike Authority | | 4.00% | | 1/1/2043 | | AA- | | | 610,000 | | | | 623,944 | |
| New Jersey Turnpike Authority | | 4.00% | | 1/1/2048 | | AA- | | | 1,000,000 | | | | 995,706 | |
| New Jersey Turnpike Authority | | 5.00% | | 1/1/2030 | | AA- | | | 715,000 | | | | 753,771 | |
| New Jersey Turnpike Authority | | 5.00% | | 1/1/2034 | | AA- | | | 615,000 | | | | 642,528 | |
| New Jersey Turnpike Authority | | 5.00% | | 1/1/2042 | | AA- | | | 270,000 | | | | 302,142 | |
| New Jersey Turnpike Authority | | 5.00% | | 1/1/2046 | | AA- | | | 1,250,000 | | | | 1,388,098 | |
| New Jersey Turnpike Authority | | 5.00% | | 1/1/2048 | | AA- | | | 840,000 | | | | 884,367 | |
| New Jersey Turnpike Authority | | 5.25% | | 1/1/2052 | | AA- | | | 1,110,000 | | | | 1,243,621 | |
| New Jersey Turnpike Authority | | 5.25% | | 1/1/2054 | | AA- | | | 2,500,000 | | | | 2,828,675 | |
| New Jersey Turnpike Authority (AGM) | | 5.25% | | 1/1/2028 | | AA | | | 810,000 | | | | 883,419 | |
| Port Authority of New York & New Jersey | | 4.00% | | 9/1/2043 | | AA- | | | 870,000 | | | | 875,756 | |
| Port Authority of New York & New Jersey | | 5.00% | | 12/1/2035 | | AA- | | | 500,000 | | | | 588,875 | |
| Port Authority of New York & New Jersey | | 5.00% | | 7/15/2038 | | AA- | | | 710,000 | | | | 754,038 | |
| Port Authority of New York & New Jersey | | 5.00% | | 7/15/2045 | | AA- | | | 500,000 | | | | 561,813 | |
| Port Authority of New York & New Jersey | | 5.00% | | 7/15/2053 | | AA- | | | 360,000 | | | | 393,613 | |
| Port Authority of New York & New Jersey | | 5.00% | | 7/15/2053 | | AA- | | | 500,000 | | | | 546,685 | |
| Port Authority of New York & New Jersey(c) | | 5.00% | | 9/1/2054 | | AA- | | | 1,325,000 | | | | 1,460,633 | |
| Port Authority of New York & New Jersey | | 5.25% | | 8/1/2052 | | AA- | | | 1,330,000 | | | | 1,469,025 | |
| Port Authority of New York & New Jersey AMT | | 5.00% | | 9/15/2032 | | AA- | | | 675,000 | | | | 706,934 | |
| Port Authority of New York & New Jersey AMT | | 5.00% | | 9/15/2033 | | AA- | | | 1,105,000 | | | | 1,155,790 | |
| Port Authority of New York & New Jersey AMT | | 5.00% | | 9/15/2034 | | AA- | | | 290,000 | | | | 302,870 | |
| Port Authority of New York & New Jersey AMT | | 5.00% | | 7/15/2036 | | AA- | | | 545,000 | | | | 604,887 | |
| Port Authority of New York & New Jersey AMT | | 5.00% | | 9/1/2036 | | AA- | | | 750,000 | | | | 793,335 | |
| Port Authority of New York & New Jersey AMT | | 5.00% | | 10/15/2036 | | AA- | | | 1,410,000 | | | | 1,411,433 | |
| Port Authority of New York & New Jersey AMT | | 5.00% | | 11/15/2041 | | AA- | | | 500,000 | | | | 512,599 | |
| Port Authority of New York & New Jersey AMT | | 5.00% | | 12/1/2044 | | AA- | | | 500,000 | | | | 541,797 | |
| South Jersey Port Corp.–South Jersey Port Corp NJ AMT | | 5.00% | | 1/1/2036 | | A3 | | | 775,000 | | | | 808,981 | |
| South Jersey Port Corp. NJ AMT | | 5.00% | | 1/1/2048 | | A3 | | | 1,705,000 | | | | 1,744,091 | |
| South Jersey Transportation Authority NJ | | 5.00% | | 11/1/2039 | | BBB+ | | | 1,515,000 | | | | 1,515,929 | |
| | See Notes to Financial Statements. | 189 |
Schedule of Investments (continued)
NEW JERSEY TAX FREE FUND September 30, 2024
| Investments | | Interest
Rate | | Maturity
Date | | Credit
Rating:
S&P or
Moody’s(a) | | Principal
Amount | | | Fair
Value | |
| Transportation (continued) | | | | | | | | | | | | | | |
| South Jersey Transportation Authority NJ | | 5.25% | | 11/1/2052 | | BBB+ | | $ | 1,490,000 | | | $ | 1,611,965 | |
| South Jersey Transportation Authority NJ (BAM) | | 4.00% | | 11/1/2050 | | AA | | | 1,080,000 | | | | 1,075,111 | |
| South Jersey Transportation Authority NJ (BAM) | | 5.00% | | 11/1/2045 | | AA | | | 500,000 | | | | 538,289 | |
| Total | | | | | | | | | | | | | 42,677,527 | |
| | | | | | | | | | | | | | | |
| Utilities 4.43% | | | | | | | | | | | | | | |
| Guam Power Authority (AGM) | | 5.00% | | 10/1/2034 | | AA | | | 400,000 | | | | 400,436 | |
| New Jersey Economic Development Authority–Middlesex Water Co AMT | | 4.00% | | 8/1/2059 | | A+ | | | 500,000 | | | | 464,207 | |
| New Jersey Economic Development Authority–New Jersey Natural Gas Co | | 3.50% | | 4/1/2042 | | A1 | | | 1,680,000 | | | | 1,511,218 | |
| New Jersey Economic Development Authority–New Jersey Natural Gas Co AMT | | 3.00% | | 8/1/2041 | | A1 | | | 1,000,000 | | | | 845,716 | |
| New Jersey Economic Development Authority–New Jersey-American Water Co Inc AMT | | 2.20% | #(b) | 10/1/2039 | | A+ | | | 500,000 | | | | 449,081 | |
| New Jersey Economic Development Authority–UMM Energy Partners LLC AMT | | 4.75% | | 6/15/2032 | | Baa2 | | | 1,000,000 | | | | 1,000,352 | |
| Passaic Valley Sewerage Commission NJ (AGM) | | 3.00% | | 12/1/2038 | | AA | | | 1,000,000 | | | | 912,620 | |
| Puerto Rico Commonwealth Aqueduct & Sewer Authority† | | 4.00% | | 7/1/2042 | | NR | | | 380,000 | | | | 364,897 | |
| Puerto Rico Commonwealth Aqueduct & Sewer Authority† | | 5.00% | | 7/1/2030 | | NR | | | 250,000 | | | | 264,967 | |
| Total | | | | | | | | | | | | | 6,213,494 | |
| Total Municipal Bonds (cost $138,965,125) | | | | | | | | | | | | | 138,428,925 | |
| Total Investments in Securities 98.62% (cost $138,965,125) | | | | | | | | | 138,428,925 | |
| Other Assets and Liabilities – Net(d) 1.38% | | | | | | | | | | | | | 1,941,884 | |
| Net Assets 100.00% | | | | | | | | | | | | $ | 140,370,809 | |
| AGC | | Insured by–Assured Guarantee Corp. |
| AGM | | Insured by–Assured Guaranty Municipal Corporation. |
| AMT | | Income from the security may be subject to Alternative Minimum Tax. |
| BAM | | Insured by–Build America Mutual. |
| GTD | | Guaranteed. |
| HUD | | Insured by–Department of Housing and Urban Development. |
| NR | | Not Rated. |
| # | | Variable rate security. The interest rate represents the rate in effect at September 30, 2024. |
| † | | Security was purchased pursuant to Rule 144A under the Securities Act of 1933 and, unless registered under such Act or exempted from registration, may only be resold to qualified institutional buyers. At September 30, 2024, the total value of Rule 144A securities was $629,864, which represents 0.45% of net assets. |
| 190 | See Notes to Financial Statements. | |
Schedule of Investments (concluded)
NEW JERSEY TAX FREE FUND September 30, 2024
| (a) | | Unaudited. |
| (b) | | Variable Rate is Fixed to Float: Rate remains fixed or at Zero Coupon until designated future date. |
| (c) | | Securities purchased on a when-issued basis (See Note 2(g)). |
| (d) | | Other Assets and Liabilities–Net include net unrealized appreciation/depreciation on futures contracts as follows: |
Futures Contracts at September 30, 2024:
| Type | | Expiration | | Contracts | | Position | | Notional
Amount | | | Notional
Value | | | Unrealized
Appreciation | |
| U.S. Long Bond | | December 2024 | | 9 | | Short | | | $(1,119,800 | ) | | | $(1,117,688 | ) | | | $2,112 | |
The following is a summary of the inputs used as of September 30, 2024 in valuing the Fund’s investments carried at fair value(1):
| Investment Type(2) | | Level 1 | | | Level 2 | | | Level 3 | | | Total | |
| Long-Term Investments | | | | | | | | | | | | | | | | |
| Municipal Bonds | | $ | – | | | $ | 138,428,925 | | | $ | – | | | $ | 138,428,925 | |
| Total | | $ | – | | | $ | 138,428,925 | | | $ | – | | | $ | 138,428,925 | |
| Other Financial Instruments | | | | | | | | | | | | | | | | |
| Futures Contracts | | | | | | | | | | | | | | | | |
| Assets | | $ | 2,112 | | | $ | – | | | $ | – | | | $ | 2,112 | |
| Liabilities | | | – | | | | – | | | | – | | | | – | |
| Total | | $ | 2,112 | | | $ | – | | | $ | – | | | $ | 2,112 | |
| | | |
| (1) | | Refer to Note 2(i) for a description of fair value measurements and the three-tier hierarchy of inputs. |
| (2) | | See Schedule of Investments for fair values in each industry. The table above is presented by Investment Type. Industries are presented within an Investment Type should such Investment Type include securities classified as two or more levels within the three-tier fair value hierarchy. When applicable, each Level 3 security is identified on the Schedule of Investments along with the valuation technique utilized. |
A reconciliation of Level 3 investments is presented when the Fund has a material amount of Level 3 investments at the beginning or end of the year in relation to the Fund’s net assets.
The following is a reconciliation of investments with unobservable inputs (Level 3) that were used in determining fair value:
| Investment Type | | Municipal Bonds | |
| Balance as of October 1, 2023 | | $ | 1,132,981 | |
| Accrued Discounts (Premiums) | | | – | |
| Realized Gain (Loss) | | | – | |
| Change in Unrealized Appreciation (Depreciation) | | | – | |
| Purchases | | | – | |
| Sales | | | – | |
| Transfers into Level 3 | | | – | |
| Transfers out of Level 3(a) | | | (1,132,981 | ) |
| Balance as of September 30, 2024 | | $ | – | |
| Change in unrealized appreciation/depreciation for the year ended September 30, 2024, related to Level 3 investments held at September 30, 2024 | | $ | – | |
| | | |
| (a) | | The Fund recognizes transfers within the fair value hierarchy as of the beginning of the period. Transfers into and out of level 3 were related to the availability of mark quotations in accordance with valuation methodology. |
| | See Notes to Financial Statements. | 191 |
Schedule of Investments
NEW YORK TAX FREE FUND September 30, 2024
| Investments | | Interest
Rate | | Maturity
Date | | Credit
Rating:
S&P or
Moody’s(a) | | Principal
Amount | | | Fair
Value | |
| LONG-TERM INVESTMENTS 98.82% | | | | | | | | | | | | | | |
| | | | | | | | | | | | | | | |
| MUNICIPAL BONDS 98.82% | | | | | | | | | | | | | | |
| | | | | | | | | | | | | | | |
| Corporate-Backed 9.04% | | | | | | | | | | | | | | |
| Brooklyn Arena Local Development Corp.–Brooklyn Events Center LLC NY | | Zero Coupon | | 7/15/2047 | | Ba1 | | $ | 250,000 | | | $ | 91,084 | |
| Build NYC Resource Corp.–Pratt Paper Inc NY AMT† | | 4.50% | | 1/1/2025 | | NR | | | 100,000 | | | | 100,138 | |
| Build NYC Resource Corp.–Pratt Paper Inc NY AMT† | | 5.00% | | 1/1/2035 | | NR | | | 250,000 | | | | 250,726 | |
| New York City Industrial Development Agency–TRIPS Obligated Group NY | | 5.00% | | 7/1/2028 | | BBB+ | | | 1,275,000 | | | | 1,275,570 | |
| New York Liberty Development Corp. | | 2.10% | | 11/15/2032 | | A+ | | | 2,790,000 | | | | 2,454,186 | |
| New York Liberty Development Corp. | | 2.875% | | 11/15/2046 | | A+ | | | 7,355,000 | | | | 5,738,541 | |
| New York Liberty Development Corp.–3 World Trade Center LLC† | | 5.00% | | 11/15/2044 | | NR | | | 8,655,000 | | | | 8,660,546 | |
| New York Liberty Development Corp.–3 World Trade Center LLC† | | 5.15% | | 11/15/2034 | | NR | | | 750,000 | | | | 750,997 | |
| New York Liberty Development Corp.–3 World Trade Center LLC† | | 7.25% | | 11/15/2044 | | NR | | | 1,000,000 | | | | 1,002,004 | |
| New York Liberty Development Corp.–Goldman Sachs Headquarters LLC | | 5.25% | | 10/1/2035 | | A2 | | | 7,215,000 | | | | 8,521,196 | |
| New York Liberty Development Corp.–Goldman Sachs Headquarters LLC | | 5.50% | | 10/1/2037 | | A2 | | | 3,650,000 | | | | 4,434,456 | |
| New York Liberty Development Corp.–One Bryant Park LLC | | 2.80% | | 9/15/2069 | | Baa1 | | | 4,630,000 | | | | 4,273,379 | |
| New York State Energy Research & Development Authority–New York State Electric & Gas Corp | | 4.00% | | 4/1/2034 | | A- | | | 2,030,000 | | | | 2,106,656 | |
| New York State Environmental Facilities Corp.–Casella Waste Systems Inc AMT | | 2.75% | #(b) | 9/1/2050 | | B+ | | | 500,000 | | | | 493,695 | |
| New York State Environmental Facilities Corp.–Casella Waste Systems Inc AMT† | | 2.875% | #(b) | 12/1/2044 | | B+ | | | 1,500,000 | | | | 1,420,462 | |
| New York State Environmental Facilities Corp.–Casella Waste Systems Inc AMT† | | 5.125% | #(b) | 9/1/2050 | | B+ | | | 1,000,000 | | | | 1,052,901 | |
| New York Transportation Development Corp.–American Airlines Inc AMT | | 2.25% | | 8/1/2026 | | BB | (c) | | 105,000 | | | | 102,410 | |
| New York Transportation Development Corp.–American Airlines Inc AMT | | 3.00% | | 8/1/2031 | | BB | (c) | | 1,000,000 | | | | 944,707 | |
| New York Transportation Development Corp.–American Airlines Inc AMT | | 5.25% | | 8/1/2031 | | B+ | | | 1,165,000 | | | | 1,248,155 | |
| 192 | See Notes to Financial Statements. |
Schedule of Investments (continued)
NEW YORK TAX FREE FUND September 30, 2024
| Investments | | Interest
Rate | | Maturity
Date | | Credit
Rating:
S&P or
Moody’s(a) | | Principal
Amount | | | Fair
Value | |
| Corporate-Backed (continued) | | | | | | | | | | | | | | |
| New York Transportation Development Corp.–American Airlines Inc AMT | | 5.375% | | 8/1/2036 | | B+ | | $ | 1,025,000 | | | $ | 1,100,029 | |
| New York Transportation Development Corp.–Delta Air Lines Inc AMT | | 5.00% | | 10/1/2035 | | Baa3 | | | 1,000,000 | | | | 1,056,548 | |
| New York Transportation Development Corp.–JFK International Air Terminal LLC AMT | | 4.00% | | 12/1/2038 | | Baa1 | | | 2,600,000 | | | | 2,596,102 | |
| Niagara Area Development Corp.–Covanta Holding Corp NY AMT† | | 4.75% | | 11/1/2042 | | B | | | 1,750,000 | | | | 1,702,312 | |
| Westchester County Local Development Corp.–Miriam Osborn Memorial Home Association Obligated Group NY | | 5.00% | | 7/1/2034 | | A | (c) | | 200,000 | | | | 208,176 | |
| Total | | | | | | | | | | | | | 51,584,976 | |
| | | | | | | | | | | | | | | |
| Education 10.53% | | | | | | | | | | | | | | |
| Build NYC Resource Corp.–East Harlem Scholars Academy Charter School Obligated Group NY† | | 5.75% | | 6/1/2042 | | BB | | | 1,000,000 | | | | 1,083,669 | |
| Build NYC Resource Corp.–Kipp NYC Public Charter Schools NY | | 5.25% | | 7/1/2052 | | BBB- | | | 1,250,000 | | | | 1,321,418 | |
| Build NYC Resource Corp.–Manhattan College NY | | 5.00% | | 8/1/2033 | | BBB+ | | | 1,125,000 | | | | 1,162,389 | |
| Build NYC Resource Corp.–New York Law School | | 5.00% | | 7/1/2041 | | BBB- | | | 1,175,000 | | | | 1,178,158 | |
| Build NYC Resource Corp.–Packer Collegiate Institute NY | | 5.00% | | 6/1/2040 | | A2 | | | 1,000,000 | | | | 1,007,117 | |
| City of New Rochelle–Iona College NY | | 5.00% | | 7/1/2028 | | BBB | | | 205,000 | | | | 207,657 | |
| City of New Rochelle–Iona College NY | | 5.00% | | 7/1/2029 | | BBB | | | 250,000 | | | | 253,175 | |
| City of New Rochelle–Iona College NY | | 5.00% | | 7/1/2030 | | BBB | | | 220,000 | | | | 222,588 | |
| City of New Rochelle–Iona College NY | | 5.00% | | 7/1/2031 | | BBB | | | 200,000 | | | | 202,205 | |
| Dutchess County Local Development Corp.–Bard College NY | | 5.00% | | 7/1/2045 | | BBB- | | | 1,000,000 | | | | 1,037,476 | |
| Dutchess County Local Development Corp.–Bard College NY | | 5.00% | | 7/1/2051 | | BBB- | | | 1,000,000 | | | | 1,028,080 | |
| Dutchess County Local Development Corp.–Culinary Institute of America NY | | 4.00% | | 7/1/2035 | | Baa2 | | | 1,145,000 | | | | 1,150,781 | |
| Dutchess County Local Development Corp.–Culinary Institute of America NY | | 4.00% | | 7/1/2037 | | Baa2 | | | 965,000 | | | | 959,535 | |
| Dutchess County Local Development Corp.–Culinary Institute of America NY | | 4.00% | | 7/1/2040 | | Baa2 | | | 425,000 | | | | 407,110 | |
| Dutchess County Local Development Corp.–Culinary Institute of America NY | | 5.00% | | 7/1/2033 | | Baa2 | | | 390,000 | | | | 398,771 | |
| | See Notes to Financial Statements. | 193 |
Schedule of Investments (continued)
NEW YORK TAX FREE FUND September 30, 2024
| Investments | | Interest
Rate | | Maturity
Date | | Credit
Rating:
S&P or
Moody’s(a) | | Principal
Amount | | | Fair
Value | |
| Education (continued) | | | | | | | | | | | | | | |
| Dutchess County Local Development Corp.–Culinary Institute of America NY | | 5.00% | | 7/1/2041 | | Baa2 | | $ | 200,000 | | | $ | 202,559 | |
| Dutchess County Local Development Corp.–Culinary Institute of America NY | | 5.00% | | 7/1/2046 | | Baa2 | | | 275,000 | | | | 277,432 | |
| Dutchess County Local Development Corp.–Marist College NY | | 5.00% | | 7/1/2043 | | A2 | | | 2,120,000 | | | | 2,218,012 | |
| Dutchess County Local Development Corp.–Millbrook School NY | | 4.00% | | 9/1/2051 | | A | | | 1,530,000 | | | | 1,404,937 | |
| Dutchess County Local Development Corp.–Vassar College NY | | 5.00% | | 7/1/2034 | | Aa3 | | | 275,000 | | | | 288,960 | |
| Hempstead Town Local Development Corp.–Hofstra University NY | | 5.00% | | 7/1/2042 | | A | | | 545,000 | | | | 563,188 | |
| Hempstead Town Local Development Corp.–Molloy College NY | | 5.00% | | 7/1/2034 | | BBB | | | 825,000 | | | | 847,004 | |
| Hempstead Town Local Development Corp.–Molloy College NY | | 5.00% | | 7/1/2037 | | BBB | | | 630,000 | | | | 644,123 | |
| Hempstead Town Local Development Corp.–Molloy College NY | | 5.00% | | 7/1/2039 | | BBB | | | 555,000 | | | | 565,166 | |
| New York City Industrial Development Agency–Yankee Stadium LLC NY (AGM) | | 3.00% | | 3/1/2049 | | AA | | | 2,050,000 | | | | 1,636,005 | |
| New York State Dormitory Authority–Barnard College | | 4.00% | | 7/1/2034 | | A3 | | | 460,000 | | | | 471,344 | |
| New York State Dormitory Authority–Barnard College | | 4.00% | | 7/1/2036 | | A3 | | | 325,000 | | | | 331,312 | |
| New York State Dormitory Authority–Barnard College | | 4.00% | | 7/1/2037 | | A3 | | | 750,000 | | | | 763,387 | |
| New York State Dormitory Authority–Cornell University | | 5.50% | | 7/1/2054 | | Aa1 | | | 5,625,000 | | | | 6,510,197 | |
| New York State Dormitory Authority–Icahn School of Medicine Mount Sinai | | 5.00% | | 7/1/2040 | | BBB+ | | | 2,200,000 | | | | 2,207,838 | |
| New York State Dormitory Authority–Iona College | | 5.00% | | 7/1/2046 | | BBB | | | 375,000 | | | | 386,118 | |
| New York State Dormitory Authority–New School | | 4.00% | | 7/1/2047 | | A3 | | | 1,000,000 | | | | 989,872 | |
| New York State Dormitory Authority–New School | | 5.00% | | 7/1/2028 | | A3 | | | 780,000 | | | | 812,485 | |
| New York State Dormitory Authority–New York Institute of Technology NY | | 5.25% | | 7/1/2049 | | BBB | | | 2,355,000 | | | | 2,572,738 | |
| New York State Dormitory Authority–New York Institute of Technology NY | | 5.25% | | 7/1/2054 | | BBB | | | 1,485,000 | | | | 1,609,400 | |
| New York State Dormitory Authority–New York University NY | | 5.00% | | 7/1/2045 | | Aa2 | | | 1,000,000 | | | | 1,010,362 | |
| 194 | See Notes to Financial Statements. |
Schedule of Investments (continued)
NEW YORK TAX FREE FUND September 30, 2024
| Investments | | Interest
Rate | | Maturity
Date | | Credit
Rating:
S&P or
Moody’s(a) | | Principal
Amount | | | Fair
Value | |
| Education (continued) | | | | | | | | | | | | | | |
| New York State Dormitory Authority–Pace University | | 5.00% | | 5/1/2035 | | BBB- | | $ | 2,000,000 | | | $ | 2,257,252 | |
| New York State Dormitory Authority–Pace University | | 5.50% | | 5/1/2049 | | BBB- | | | 3,250,000 | | | | 3,610,258 | |
| New York State Dormitory Authority–Pratt Institute | | 5.00% | | 7/1/2039 | | A2 | | | 1,045,000 | | | | 1,068,403 | |
| New York State Dormitory Authority–St John’s University | | 5.00% | | 7/1/2027 | | A- | | | 250,000 | | | | 253,704 | |
| New York State Dormitory Authority–State of New York Personal Income Tax Revenue | | 5.00% | | 2/15/2041 | | NR | | | 5,000 | | | | 5,362 | |
| New York State Dormitory Authority–Yeshiva University | | 5.00% | | 7/15/2037 | | BBB- | | | 1,000,000 | | | | 1,070,562 | |
| New York State Dormitory Authority–Yeshiva University | | 5.00% | | 7/15/2042 | | BBB- | | | 1,030,000 | | | | 1,076,771 | |
| Onondaga Civic Development Corp.–Le Moyne College NY | | 4.00% | | 7/1/2038 | | Baa2 | | | 150,000 | | | | 147,150 | |
| Onondaga Civic Development Corp.–Le Moyne College NY | | 4.00% | | 7/1/2040 | | Baa2 | | | 300,000 | | | | 287,372 | |
| Onondaga Civic Development Corp.–Le Moyne College NY | | 4.00% | | 7/1/2041 | | Baa2 | | | 415,000 | | | | 394,041 | |
| Onondaga Civic Development Corp.–Le Moyne College NY | | 5.00% | | 7/1/2035 | | Baa2 | | | 365,000 | | | | 390,094 | |
| Onondaga Civic Development Corp.–Le Moyne College NY | | 5.00% | | 7/1/2036 | | Baa2 | | | 465,000 | | | | 495,044 | |
| Onondaga Civic Development Corp.–Le Moyne College NY | | 5.00% | | 7/1/2046 | | Baa2 | | | 600,000 | | | | 617,437 | |
| Schenectady County Capital Resource Corp.–Trustees of Union College NY | | 5.25% | | 7/1/2052 | | A1 | | | 740,000 | | | | 823,141 | |
| St. Lawrence County Industrial Development Agency–Clarkson University NY | | 5.00% | | 9/1/2037 | | Baa1 | | | 455,000 | | | | 486,694 | |
| St. Lawrence County Industrial Development Agency–Clarkson University NY | | 5.00% | | 9/1/2038 | | Baa1 | | | 475,000 | | | | 505,058 | |
| St. Lawrence County Industrial Development Agency–Clarkson University NY | | 5.00% | | 9/1/2041 | | Baa1 | | | 160,000 | | | | 167,611 | |
| Troy Capital Resource Corp.–Rensselaer Polytechnic Institute NY | | 4.00% | | 9/1/2040 | | A3 | | | 1,000,000 | | | | 1,004,424 | |
| Troy Capital Resource Corp.–Rensselaer Polytechnic Institute NY | | 5.00% | | 8/1/2032 | | A3 | | | 1,495,000 | | | | 1,527,666 | |
| | See Notes to Financial Statements. | 195 |
Schedule of Investments (continued)
NEW YORK TAX FREE FUND September 30, 2024
| Investments | | Interest
Rate | | Maturity
Date | | Credit
Rating:
S&P or
Moody’s(a) | | Principal
Amount | | | Fair
Value | |
| Education (continued) | | | | | | | | | | | | | | |
| Troy Capital Resource Corp.–Rensselaer Polytechnic Institute NY | | 5.00% | | 9/1/2034 | | A3 | | $ | 1,200,000 | | | $ | 1,329,204 | |
| Troy Capital Resource Corp. NY | | 4.00% | | 9/1/2034 | | A3 | | | 855,000 | | | | 882,420 | |
| Troy Capital Resource Corp. NY | | 4.00% | | 9/1/2035 | | A3 | | | 395,000 | | | | 405,504 | |
| Troy Capital Resource Corp. NY | | 4.00% | | 9/1/2036 | | A3 | | | 1,140,000 | | | | 1,165,919 | |
| Westchester County Local Development Corp.–Miriam Osborn Memorial Home Association Obligated Group NY | | 5.00% | | 7/1/2042 | | A | (c) | | 450,000 | | | | 463,025 | |
| Westchester County Local Development Corp.–Sarah Lawrence College NY | | 4.00% | | 6/1/2033 | | BBB- | | | 1,710,000 | | | | 1,691,935 | |
| Total | | | | | | | | | | | | | 60,058,619 | |
| | | | | | | | | | | | | | | |
| General Obligation 11.04% | | | | | | | | | | | | | | |
| City of Long Beach NY GO (BAM) | | 5.25% | | 7/15/2034 | | AA | | | 510,000 | | | | 574,412 | |
| City of Long Beach NY GO (BAM) | | 5.25% | | 7/15/2035 | | AA | | | 400,000 | | | | 448,941 | |
| City of Long Beach NY GO (BAM) | | 5.25% | | 7/15/2036 | | AA | | | 300,000 | | | | 335,208 | |
| City of Long Beach NY GO (BAM) | | 5.25% | | 7/15/2037 | | AA | | | 810,000 | | | | 902,130 | |
| City of Long Beach NY GO (BAM) | | 5.25% | | 7/15/2042 | | AA | | | 500,000 | | | | 544,192 | |
| City of New York NY GO | | 4.00% | | 4/1/2050 | | AA | | | 2,455,000 | | | | 2,432,498 | |
| City of New York NY GO | | 4.125% | | 8/1/2053 | | AA | | | 2,230,000 | | | | 2,230,262 | |
| City of New York NY GO | | 5.00% | | 8/1/2037 | | AA | | | 1,150,000 | | | | 1,322,464 | |
| City of New York NY GO | | 5.00% | | 10/1/2037 | | AA | | | 2,500,000 | | | | 2,632,423 | |
| City of New York NY GO | | 5.25% | | 9/1/2043 | | AA | | | 1,150,000 | | | | 1,292,217 | |
| City of New York NY GO | | 5.25% | | 10/1/2047 | | AA | | | 3,840,000 | | | | 4,263,095 | |
| City of New York NY GO | | 5.25% | | 3/1/2049 | | AA | | | 2,500,000 | | | | 2,799,391 | |
| City of New York NY GO | | 5.25% | | 9/1/2050 | | AA | | | 2,500,000 | | | | 2,808,532 | |
| City of New York NY GO | | 5.25% | | 4/1/2054 | | AA | | | 1,500,000 | | | | 1,671,641 | |
| City of New York NY GO | | 5.50% | | 5/1/2044 | | AA | | | 2,085,000 | | | | 2,364,191 | |
| Commonwealth of Puerto Rico GO | | Zero Coupon | | 7/1/2033 | | NR | | | 244,309 | | | | 166,151 | |
| Commonwealth of Puerto Rico GO | | Zero Coupon | #(b) | 11/1/2043 | | NR | | | 837,713 | | | | 540,325 | |
| Commonwealth of Puerto Rico GO | | 4.00% | | 7/1/2033 | | NR | | | 189,842 | | | | 190,205 | |
| Commonwealth of Puerto Rico GO | | 4.00% | | 7/1/2035 | | NR | | | 170,642 | | | | 170,473 | |
| Commonwealth of Puerto Rico GO | | 4.00% | | 7/1/2037 | | NR | | | 146,457 | | | | 145,519 | |
| Commonwealth of Puerto Rico GO | | 5.375% | | 7/1/2025 | | NR | | | 105,570 | | | | 106,199 | |
| Commonwealth of Puerto Rico GO | | 5.625% | | 7/1/2027 | | NR | | | 209,517 | | | | 218,835 | |
| Commonwealth of Puerto Rico GO | | 5.625% | | 7/1/2029 | | NR | | | 206,118 | | | | 222,703 | |
| Commonwealth of Puerto Rico GO | | 5.75% | | 7/1/2031 | | NR | | | 200,202 | | | | 222,793 | |
| County of Nassau NY GO | | 4.00% | | 4/1/2053 | | Aa2 | | | 2,140,000 | | | | 2,114,033 | |
| Hudson Yards Infrastructure Corp. NY | | 5.00% | | 2/15/2042 | | AA | | | 5,595,000 | | | | 5,793,713 | |
| 196 | See Notes to Financial Statements. |
Schedule of Investments (continued)
NEW YORK TAX FREE FUND September 30, 2024
| Investments | | Interest
Rate | | Maturity
Date | | Credit
Rating:
S&P or
Moody’s(a) | | Principal
Amount | | | Fair
Value | |
| General Obligation (continued) | | | | | | | | | | | | | | |
| Jefferson County Civic Facility Development Corp.–Samaritan Medical Center Obligated NY | | 5.00% | | 11/1/2037 | | BB | | $ | 2,000,000 | | | $ | 1,976,769 | |
| New York City Transitional Finance Authority Future Tax Secured Revenue NY | | 4.00% | | 2/1/2051 | | AAA | | | 3,750,000 | | | | 3,724,436 | |
| New York City Transitional Finance Authority Future Tax Secured Revenue NY | | 5.25% | | 11/1/2040 | | AAA | | | 2,000,000 | | | | 2,275,878 | |
| New York State Dormitory Authority | | 5.00% | | 3/15/2053 | | AA+ | | | 2,500,000 | | | | 2,713,019 | |
| New York State Dormitory Authority–State of New York Personal Income Tax Revenue | | 4.00% | | 3/15/2044 | | AA+ | | | 2,540,000 | | | | 2,550,491 | |
| New York State Thruway Authority–State of New York Personal Income Tax Revenue | | 5.00% | | 3/15/2053 | | AA+ | | | 1,550,000 | | | | 1,678,550 | |
| New York State Urban Development Corp. | | 5.00% | | 3/15/2044 | | Aa1 | | | 3,000,000 | | | | 3,358,993 | |
| New York State Urban Development Corp. | | 5.00% | | 3/15/2050 | | Aa1 | | | 5,000,000 | | | | 5,480,383 | |
| New York State Urban Development Corp.–State of New York Personal Income Tax Revenue | | 5.00% | | 3/15/2050 | | Aa1 | | | 2,500,000 | | | | 2,718,930 | |
| Total | | | | | | | | | | | | | 62,989,995 | |
| | | | | | | | | | | | | | | |
| Health Care 11.80% | | | | | | | | | | | | | | |
| Brookhaven Local Development Corp.–Active Retirement Community Inc Obligated Group NY | | 4.00% | | 11/1/2045 | | BBB | (c) | | 1,000,000 | | | | 976,281 | |
| Brookhaven Local Development Corp.–Active Retirement Community Inc Obligated Group NY | | 4.00% | | 11/1/2055 | | BBB | (c) | | 1,000,000 | | | | 929,362 | |
| Brookhaven Local Development Corp.–Long Island Community Hospital At NYU Langone Health Obligated NY | | 3.375% | | 10/1/2040 | | A | | | 365,000 | | | | 320,565 | |
| Broome County Local Development Corp.–United Health Services Hospitals Obligated Group NY (AGM) | | 3.00% | | 4/1/2036 | | AA | | | 1,030,000 | | | | 968,236 | |
| Broome County Local Development Corp.–United Health Services Hospitals Obligated Group NY (AGM) | | 3.00% | | 4/1/2037 | | AA | | | 1,500,000 | | | | 1,392,444 | |
| Buffalo & Erie County Industrial Land Development Corp.–Catholic Health System Obligated Group NY | | 5.00% | | 7/1/2025 | | B- | | | 300,000 | | | | 299,596 | |
| Buffalo & Erie County Industrial Land Development Corp.–Orchard Park CCRC Inc NY | | 5.00% | | 11/15/2037 | | BBB | (c) | | 1,000,000 | | | | 1,009,946 | |
| | See Notes to Financial Statements. | 197 |
Schedule of Investments (continued)
NEW YORK TAX FREE FUND September 30, 2024
| Investments | | Interest
Rate | | Maturity
Date | | Credit
Rating:
S&P or
Moody’s(a) | | Principal
Amount | | | Fair
Value | |
| Health Care (continued) | | | | | | | | | | | | | | |
| Dutchess County Local Development Corp.–Nuvance Health Obligated Group NY | | 4.00% | | 7/1/2044 | | BBB | | $ | 1,250,000 | | | $ | 1,215,686 | |
| Dutchess County Local Development Corp.–Nuvance Health Obligated Group NY | | 4.00% | | 7/1/2049 | | BBB | | | 3,620,000 | | | | 3,525,511 | |
| Dutchess County Local Development Corp.–Nuvance Health Obligated Group NY | | 5.00% | | 7/1/2035 | | BBB | | | 1,765,000 | | | | 1,797,331 | |
| Genesee County Funding Corp.–Rochester Regional Health Obligated NY | | 5.25% | | 12/1/2052 | | BBB+ | | | 1,000,000 | | | | 1,051,292 | |
| Monroe County Industrial Development Corp.–Rochester Regional Health Obligated Group NY | | 4.00% | | 12/1/2035 | | BBB+ | | | 600,000 | | | | 604,918 | |
| Monroe County Industrial Development Corp.–Rochester Regional Health Obligated Group NY | | 4.00% | | 12/1/2036 | | BBB+ | | | 450,000 | | | | 452,299 | |
| Monroe County Industrial Development Corp.–Rochester Regional Health Obligated Group NY | | 5.00% | | 12/1/2034 | | BBB+ | | | 250,000 | | | | 256,366 | |
| Nassau County Local Economic Assistance Corp.–Catholic Health Services of Long Island Obligated Group NY | | 5.00% | | 7/1/2027 | | A- | | | 625,000 | | | | 625,788 | |
| Nassau County Local Economic Assistance Corp.–Catholic Health Services of Long Island Obligated Group NY | | 5.00% | | 7/1/2028 | | A- | | | 2,045,000 | | | | 2,048,542 | |
| Nassau County Local Economic Assistance Corp.–Catholic Health Services of Long Island Obligated Group NY | | 5.00% | | 7/1/2033 | | A- | | | 905,000 | | | | 905,652 | |
| New York City Industrial Development Agency–Yankee Stadium LLC NY | | 3.00% | | 3/1/2049 | | Baa1 | | | 2,115,000 | | | | 1,633,409 | |
| New York State Dormitory Authority–Catholic Health System Obligated Group | | 4.00% | | 7/1/2045 | | B- | | | 2,895,000 | | | | 2,473,429 | |
| New York State Dormitory Authority–Catholic Health System Obligated Group | | 5.00% | | 7/1/2032 | | B- | | | 500,000 | | | | 499,643 | |
| New York State Dormitory Authority–Garnet Health Medical Center Obligated Group† | | 5.00% | | 12/1/2026 | | Ba2 | | | 1,000,000 | | | | 1,002,687 | |
| New York State Dormitory Authority–Garnet Health Medical Center Obligated Group† | | 5.00% | | 12/1/2029 | | Ba2 | | | 1,900,000 | | | | 1,908,905 | |
| New York State Dormitory Authority–Icahn School of Medicine Mount Sinai | | 5.00% | | 7/1/2033 | | BBB+ | | | 4,340,000 | | | | 4,365,787 | |
| 198 | See Notes to Financial Statements. |
Schedule of Investments (continued)
NEW YORK TAX FREE FUND September 30, 2024
| Investments | | Interest
Rate | | Maturity
Date | | Credit
Rating:
S&P or
Moody’s(a) | | Principal
Amount | | | Fair
Value | |
| Health Care (continued) | | | | | | | | | | | | | | |
| New York State Dormitory Authority–Icahn School of Medicine Mount Sinai | | 5.00% | | 7/1/2034 | | BBB+ | | $ | 1,750,000 | | | $ | 1,759,675 | |
| New York State Dormitory Authority–Maimonides Medical Center (FHA) | | 3.00% | | 2/1/2050 | | AA+ | | | 1,000,000 | | | | 799,754 | |
| New York State Dormitory Authority–Montefiore Obligated Group | | 4.00% | | 8/1/2036 | | BBB- | | | 475,000 | | | | 474,667 | |
| New York State Dormitory Authority–Montefiore Obligated Group | | 4.00% | | 8/1/2037 | | BBB- | | | 1,820,000 | | | | 1,810,898 | |
| New York State Dormitory Authority–Montefiore Obligated Group | | 4.00% | | 8/1/2038 | | BBB- | | | 1,540,000 | | | | 1,536,873 | |
| New York State Dormitory Authority–Montefiore Obligated Group | | 4.00% | | 9/1/2050 | | BBB- | | | 5,500,000 | | | | 5,083,143 | |
| New York State Dormitory Authority–Montefiore Obligated Group | | 5.00% | | 8/1/2035 | | BBB- | | | 525,000 | | | | 540,303 | |
| New York State Dormitory Authority–Northwell Health Obligated Group | | 4.00% | | 5/1/2045 | | A- | | | 2,130,000 | | | | 2,092,326 | |
| New York State Dormitory Authority–Northwell Health Obligated Group | | 5.00% | | 5/1/2028 | | A- | | | 1,000,000 | | | | 1,011,231 | |
| New York State Dormitory Authority–Northwell Health Obligated Group | | 5.00% | | 5/1/2038 | | A- | | | 1,005,000 | | | | 1,117,635 | |
| Niagara Area Development Corp.–Catholic Health System Obligated Group NY | | 5.00% | | 7/1/2052 | | B- | | | 1,000,000 | | | | 970,713 | |
| Oneida County Local Development Corp.–Mohawk Valley Health System Obligated Group NY (AGM) | | 4.00% | | 12/1/2049 | | AA | | | 4,645,000 | | | | 4,529,699 | |
| Onondaga Civic Development Corp.–Crouse Health Hospital Inc Obligated Group NY | | 5.125% | | 8/1/2044 | | BB | (c) | | 1,250,000 | | | | 1,285,849 | |
| Onondaga Civic Development Corp.–Crouse Health Hospital Inc Obligated Group NY | | 5.375% | | 8/1/2054 | | BB | (c) | | 500,000 | | | | 518,974 | |
| Southold Local Development Corp.–Peconic Landing at Southold Inc NY | | 5.00% | | 12/1/2045 | | BBB- | (c) | | 1,000,000 | | | | 1,000,585 | |
| Tompkins County Development Corp.–Kendal at Ithaca Inc NY | | 5.00% | | 7/1/2044 | | BBB+ | | | 920,000 | | | | 920,654 | |
| Westchester County Health Care Corp Obligated Group NY | | 5.00% | | 11/1/2046 | | BBB- | | | 2,240,000 | | | | 2,171,508 | |
| Westchester County Health Care Corp Obligated Group NY | | 6.00% | | 11/1/2030 | | BBB- | | | 100,000 | | | | 100,184 | |
| Westchester County Health Care Corp Obligated Group NY | | 6.125% | | 11/1/2037 | | BBB- | | | 40,000 | | | | 40,115 | |
| See Notes to Financial Statements. | 199 |
Schedule of Investments (continued)
NEW YORK TAX FREE FUND September 30, 2024
| Investments | | Interest
Rate | | Maturity
Date | | Credit
Rating:
S&P or
Moody’s(a) | | Principal
Amount | | | Fair
Value | |
| Health Care (continued) | | | | | | | | | | | | | | |
| Westchester County Health Care Corp Obligated Group NY (AGM) | | 5.75% | | 11/1/2049 | | AA | | $ | 4,295,000 | | | $ | 4,908,384 | |
| Westchester County Health Care Corp Obligated Group NY (AGM) | | 5.75% | | 11/1/2053 | | AA | | | 1,640,000 | | | | 1,863,045 | |
| Westchester County Local Development Corp.–New York Blood Center Inc NY | | 5.00% | | 7/1/2035 | | Baa1 | | | 1,510,000 | | | | 1,697,128 | |
| Westchester County Local Development Corp.–New York Blood Center Inc NY | | 5.00% | | 7/1/2038 | | Baa1 | | | 750,000 | | | | 831,583 | |
| Total | | | | | | | | | | | | | 67,328,601 | |
| | | | | | | | | | | | | | | |
| Housing 1.53% | | | | | | | | | | | | | | |
| New York City Housing Development Corp.–FC 8 Spruce Street Residential LLC NY | | 4.50% | | 2/15/2048 | | NR | | | 1,000,000 | | | | 996,996 | |
| New York City Housing Development Corp. NY | | 3.35% | | 11/1/2065 | | AA+ | | | 1,270,000 | | | | 982,642 | |
| New York State Dormitory Authority | | 5.00% | | 7/1/2048 | | Aa3 | | | 1,040,000 | | | | 1,134,990 | |
| New York State Dormitory Authority | | 5.00% | | 7/1/2053 | | Aa3 | | | 2,090,000 | | | | 2,264,931 | |
| New York State Dormitory Authority–State University of New York Dormitory Facilities Revenue | | 5.00% | | 7/1/2042 | | Aa3 | | | 1,510,000 | | | | 1,566,940 | |
| New York State Housing Finance Agency–New York State Housing Finance Agency | | 3.15% | | 11/1/2054 | | Aa2 | | | 1,000,000 | | | | 809,122 | |
| Westchester County Local Development Corp.–Purchase Housing Corp II NY | | 5.00% | | 6/1/2047 | | BBB | | | 1,000,000 | | | | 1,008,882 | |
| Total | | | | | | | | | | | | | 8,764,503 | |
| | | | | | | | | | | | | | | |
| Other 0.47% | | | | | | | | | | | | | | |
| Build NYC Resource Corp.–Children’s Aid Society NY | | 4.00% | | 7/1/2049 | | A+ | | | 2,775,000 | | | | 2,690,611 | |
| | | | | | | | | | | | | | | |
| Other Revenue 3.43% | | | | | | | | | | | | | | |
| Brooklyn Arena Local Development Corp.–Brooklyn Events Center LLC NY | | 5.00% | | 7/15/2042 | | Ba1 | | | 3,000,000 | | | | 3,062,182 | |
| Build NYC Resource Corp.–Shefa School NY† | | 5.00% | | 6/15/2051 | | NR | | | 1,315,000 | | | | 1,318,616 | |
| New York State Thruway Authority–State of New York Personal Income Tax Revenue | | 5.00% | | 3/15/2046 | | AA+ | | | 2,500,000 | | | | 2,735,715 | |
| New York State Thruway Authority–State of New York Personal Income Tax Revenue | | 5.00% | | 3/15/2048 | | AA+ | | | 3,365,000 | | | | 3,660,573 | |
| 200 | See Notes to Financial Statements. |
Schedule of Investments (continued)
NEW YORK TAX FREE FUND September 30, 2024
| Investments | | Interest
Rate | | Maturity
Date | | Credit
Rating:
S&P or
Moody’s(a) | | Principal
Amount | | | Fair
Value | |
| Other Revenue (continued) | | | | | | | | | | | | | | |
| Triborough Bridge & Tunnel Authority–Metropolitan Transportation Authority Payroll Mobility Tax Revenue NY | | 5.00% | | 11/15/2032 | | AA+ | | $ | 1,250,000 | | | $ | 1,457,051 | |
| Triborough Bridge & Tunnel Authority–Metropolitan Transportation Authority Payroll Mobility Tax Revenue NY | | 5.25% | | 5/15/2054 | | AA+ | | | 1,500,000 | | | | 1,681,111 | |
| Triborough Bridge & Tunnel Authority–Metropolitan Transportation Authority Payroll Mobility Tax Revenue NY | | 5.50% | | 5/15/2052 | | AA+ | | | 5,020,000 | | | | 5,655,525 | |
| Total | | | | | | | | | | | | | 19,570,773 | |
| | | | | | | | | | | | | | | |
| Special Tax 2.14% | | | | | | | | | | | | | | |
| New York City Industrial Development Agency–Queens Ballpark Co LLC NY (AGM) | | 3.00% | | 1/1/2040 | | AA | | | 2,145,000 | | | | 1,926,484 | |
| New York City Industrial Development Agency–Queens Ballpark Co LLC NY (AGM) | | 3.00% | | 1/1/2046 | | AA | | | 3,100,000 | | | | 2,569,697 | |
| New York City Industrial Development Agency–Yankee Stadium LLC NY | | 4.00% | | 3/1/2045 | | Baa1 | | | 1,950,000 | | | | 1,917,159 | |
| New York City Industrial Development Agency–Yankee Stadium LLC NY (AGC) | | Zero Coupon | | 3/1/2043 | | AA | | | 425,000 | | | | 188,586 | |
| New York City Industrial Development Agency–Yankee Stadium LLC NY (AGC) | | Zero Coupon | | 3/1/2044 | | AA | | | 640,000 | | | | 269,438 | |
| New York City Industrial Development Agency–Yankee Stadium LLC NY (AGC) | | Zero Coupon | | 3/1/2047 | | AA | | | 385,000 | | | | 138,309 | |
| New York City Industrial Development Agency–Yankee Stadium LLC NY (FGIC) | | 3.775%
(CPI YoY * 1 + 0.88% | ) | 3/1/2026 | | Baa1 | | | 3,590,000 | | | | 3,601,108 | |
| New York City Transitional Finance Authority Future Tax Secured Revenue NY | | 5.25% | | 11/1/2037 | | AAA | | | 1,370,000 | | | | 1,587,375 | |
| Total | | | | | | | | | | | | | 12,198,156 | |
| | | | | | | | | | | | | | | |
| Tax Revenue 14.39% | | | | | | | | | | | | | | |
| Metropolitan Transportation Authority Dedicated Tax Fund NY | | 5.25% | | 11/15/2054 | | AA | | | 3,060,000 | | | | 3,448,191 | |
| Metropolitan Transportation Authority NY | | 5.00% | | 11/15/2034 | | AA | | | 1,440,000 | | | | 1,517,847 | |
| Metropolitan Transportation Authority NY | | 5.00% | | 11/15/2042 | | AA | | | 2,555,000 | | | | 2,644,399 | |
| New York City Transitional Finance Authority Future Tax Secured Revenue NY | | 4.00% | | 5/1/2053 | | AAA | | | 1,215,000 | | | | 1,203,061 | |
| | | |
| | See Notes to Financial Statements. | 201 |
Schedule of Investments (continued)
NEW YORK TAX FREE FUND September 30, 2024
| Investments | | Interest
Rate | | Maturity
Date | | Credit
Rating:
S&P or
Moody’s(a) | | Principal
Amount | | | Fair
Value | |
| Tax Revenue (continued) | | | | | | | | | | | | | | |
| New York City Transitional Finance Authority Future Tax Secured Revenue NY | | 5.00% | | 2/1/2037 | | AAA | | $ | 2,145,000 | | | $ | 2,190,686 | |
| New York City Transitional Finance Authority Future Tax Secured Revenue NY | | 5.00% | | 2/1/2043 | | AAA | | | 4,000,000 | | | | 4,143,948 | |
| New York City Transitional Finance Authority Future Tax Secured Revenue NY(d) | | 5.00% | | 5/1/2050 | | AAA | | | 7,350,000 | | | | 8,077,666 | |
| New York City Transitional Finance Authority Future Tax Secured Revenue NY | | 5.00% | | 5/1/2053 | | AAA | | | 2,500,000 | | | | 2,707,844 | |
| New York City Transitional Finance Authority Future Tax Secured Revenue NY | | 5.25% | | 5/1/2051 | | AAA | | | 6,205,000 | | | | 6,927,157 | |
| New York City Transitional Finance Authority NY | | 5.00% | | 5/1/2046 | | AAA | | | 1,600,000 | | | | 1,758,547 | |
| New York City Transitional Finance Authority NY | | 5.25% | | 2/1/2053 | | AAA | | | 1,750,000 | | | | 1,945,876 | |
| New York City Transitional Finance Authority NY | | 5.50% | | 5/1/2047 | | AAA | | | 5,000,000 | | | | 5,764,025 | |
| New York Convention Center Development Corp.–New York City Hotel Unit Fee Revenue | | 5.00% | | 11/15/2040 | | A2 | | | 4,585,000 | | | | 4,637,474 | |
| New York State Dormitory Authority–State of New York Personal Income Tax Revenue | | 5.00% | | 3/15/2035 | | AA+ | | | 1,100,000 | | | | 1,118,995 | |
| New York State Dormitory Authority–State of New York Personal Income Tax Revenue | | 5.25% | | 3/15/2052 | | Aa1 | | | 3,500,000 | | | | 3,922,994 | |
| New York State Dormitory Authority–State of New York Sales Tax Revenue | | 5.00% | | 3/15/2043 | | AA+ | | | 2,550,000 | | | | 2,692,909 | |
| New York State Dormitory Authority–State of New York Sales Tax Revenue | | 5.00% | | 3/15/2052 | | Aa1 | | | 3,000,000 | | | | 3,298,179 | |
| New York State Dormitory Authority–State of New York Sales Tax Revenue | | 5.00% | | 3/15/2053 | | Aa1 | | | 2,375,000 | | | | 2,606,729 | |
| New York State Dormitory Authority–State of New York Sales Tax Revenue | | 5.00% | | 3/15/2054 | | Aa1 | | | 1,500,000 | | | | 1,643,653 | |
| New York State Urban Development Corp. | | 5.00% | | 3/15/2048 | | Aa1 | | | 3,950,000 | | | | 4,350,972 | |
| New York State Urban Development Corp. | | 5.00% | | 3/15/2053 | | Aa1 | | | 1,835,000 | | | | 2,001,849 | |
| Puerto Rico Sales Tax Financing Corp. Sales Tax Revenue | | Zero Coupon | | 7/1/2029 | | NR | | | 163,000 | | | | 136,642 | |
| Puerto Rico Sales Tax Financing Corp. Sales Tax Revenue | | Zero Coupon | | 7/1/2031 | | NR | | | 708,000 | | | | 547,123 | |
| Puerto Rico Sales Tax Financing Corp. Sales Tax Revenue | | Zero Coupon | | 7/1/2033 | | NR | | | 710,000 | | | | 503,645 | |
| | |
| 202 | See Notes to Financial Statements. |
Schedule of Investments (continued)
NEW YORK TAX FREE FUND September 30, 2024
| Investments | | Interest
Rate | | Maturity
Date | | Credit
Rating:
S&P or
Moody’s(a) | | Principal
Amount | | | Fair
Value | |
| Tax Revenue (continued) | | | | | | | | | | | | | | |
| Puerto Rico Sales Tax Financing Corp. Sales Tax Revenue | | Zero Coupon | | 7/1/2051 | | NR | | $ | 7,476,000 | | | $ | 1,843,848 | |
| Puerto Rico Sales Tax Financing Corp. Sales Tax Revenue | | 4.329% | | 7/1/2040 | | NR | | | 489,000 | | | | 488,759 | |
| Puerto Rico Sales Tax Financing Corp. Sales Tax Revenue | | 4.329% | | 7/1/2040 | | NR | | | 858,000 | | | | 857,577 | |
| Puerto Rico Sales Tax Financing Corp. Sales Tax Revenue | | 4.536% | | 7/1/2053 | | NR | | | 64,000 | | | | 63,472 | |
| Puerto Rico Sales Tax Financing Corp. Sales Tax Revenue | | 4.55% | | 7/1/2040 | | NR | | | 153,000 | | | | 153,866 | |
| Puerto Rico Sales Tax Financing Corp. Sales Tax Revenue | | 4.55% | | 7/1/2040 | | NR | | | 380,000 | | | | 382,151 | |
| Puerto Rico Sales Tax Financing Corp. Sales Tax Revenue | | 4.75% | | 7/1/2053 | | NR | | | 1,199,000 | | | | 1,202,691 | |
| Puerto Rico Sales Tax Financing Corp. Sales Tax Revenue | | 4.784% | | 7/1/2058 | | NR | | | 180,000 | | | | 180,480 | |
| Puerto Rico Sales Tax Financing Corp. Sales Tax Revenue | | 5.00% | | 7/1/2058 | | NR | | | 1,922,000 | | | | 1,941,902 | |
| Territory of Guam | | 4.00% | | 1/1/2042 | | Baa3 | | | 750,000 | | | | 741,064 | |
| Triborough Bridge & Tunnel Authority Sales Tax Revenue NY | | 5.00% | | 5/15/2047 | | AA+ | | | 3,000,000 | | | | 3,284,661 | |
| Triborough Bridge & Tunnel Authority Sales Tax Revenue NY | | 5.00% | | 5/15/2054 | | AA+ | | | 1,050,000 | | | | 1,150,399 | |
| Total | | | | | | | | | | | | | 82,081,281 | |
| | | | | | | | | | | | | | | |
| Taxable Revenue–Water & Sewer 1.92% | | | | | | | | | | | | | | |
| New York City Municipal Water Finance Authority(d) | | 5.25% | | 6/15/2053 | | AA+ | | | 3,000,000 | | | | 3,372,254 | |
| New York City Municipal Water Finance Authority–New York City Water & Sewer System NY | | 5.00% | | 6/15/2040 | | AA+ | | | 4,560,000 | | | | 4,814,798 | |
| New York City Municipal Water Finance Authority–New York City Water & Sewer System NY | | 5.25% | | 6/15/2054 | | AA+ | | | 2,500,000 | | | | 2,795,353 | |
| Total | | | | | | | | | | | | | 10,982,405 | |
| | | | | | | | | | | | | | | |
| Tobacco 2.60% | | | | | | | | | | | | | | |
| Erie Tobacco Asset Securitization Corp. NY | | Zero Coupon | | 6/1/2055 | | NR | | | 8,000,000 | | | | 678,421 | |
| Erie Tobacco Asset Securitization Corp. NY† | | Zero Coupon | | 6/1/2060 | | NR | | | 20,000,000 | | | | 1,007,248 | |
| | | |
| | See Notes to Financial Statements. | 203 |
Schedule of Investments (continued)
NEW YORK TAX FREE FUND September 30, 2024
| Investments | | Interest
Rate | | Maturity
Date | | Credit
Rating:
S&P or
Moody’s(a) | | Principal
Amount | | | Fair
Value | |
| Tobacco (continued) | | | | | | | | | | | | | | |
| Monroe Tobacco Asset Securitization Corp. NY† | | Zero Coupon | | 6/1/2061 | | NR | | $ | 10,000,000 | | | $ | 513,261 | |
| Nassau County Tobacco Settlement Corp. NY | | Zero Coupon | | 6/1/2060 | | NR | | | 15,000,000 | | | | 1,028,710 | |
| Nassau County Tobacco Settlement Corp. NY | | 5.125% | | 6/1/2046 | | CCC+ | | | 2,085,000 | | | | 1,913,446 | |
| New York Counties Tobacco Trust IV | | Zero Coupon | | 6/1/2060 | | NR | | | 20,000,000 | | | | 1,328,036 | |
| Rockland Tobacco Asset Securitization Corp. NY† | | Zero Coupon | | 8/15/2060 | | NR | | | 10,575,000 | | | | 722,023 | |
| Suffolk Tobacco Asset Securitization Corp. NY | | Zero Coupon | | 6/1/2066 | | NR | | | 7,700,000 | | | | 829,332 | |
| TSASC, Inc. NY | | 5.00% | | 6/1/2034 | | A- | | | 1,000,000 | | | | 1,037,816 | |
| TSASC, Inc. NY | | 5.00% | | 6/1/2035 | | A- | | | 300,000 | | | | 310,752 | |
| TSASC, Inc. NY | | 5.00% | | 6/1/2036 | | A- | | | 100,000 | | | | 103,308 | |
| TSASC, Inc. NY | | 5.00% | | 6/1/2041 | | A- | | | 545,000 | | | | 556,688 | |
| TSASC, Inc. NY | | 5.00% | | 6/1/2048 | | NR | | | 3,300,000 | | | | 2,982,222 | |
| Westchester Tobacco Asset Securitization Corp. NY | | 5.125% | | 6/1/2051 | | BB- | | | 1,845,000 | | | | 1,832,924 | |
| Total | | | | | | | | | | | | | 14,844,187 | |
| | | | | | | | | | | | | | | |
| Transportation 24.42% | | | | | | | | | | | | | | |
| Metropolitan Transportation Authority NY | | 4.00% | | 11/15/2051 | | A- | | | 3,200,000 | | | | 3,109,774 | |
| Metropolitan Transportation Authority NY | | 4.75% | | 11/15/2045 | | A- | | | 3,255,000 | | | | 3,375,465 | |
| Metropolitan Transportation Authority NY | | 5.00% | | 11/15/2029 | | A- | | | 1,730,000 | | | | 1,768,469 | |
| Metropolitan Transportation Authority NY | | 5.00% | | 11/15/2030 | | A- | | | 1,885,000 | | | | 1,962,089 | |
| Metropolitan Transportation Authority NY | | 5.00% | | 11/15/2030 | | A- | | | 700,000 | | | | 748,366 | |
| Metropolitan Transportation Authority NY | | 5.00% | | 11/15/2033 | | A- | | | 1,900,000 | | | | 2,011,717 | |
| Metropolitan Transportation Authority NY | | 5.00% | #(b) | 11/15/2045 | | A3 | | | 3,030,000 | | | | 3,320,417 | |
| Metropolitan Transportation Authority NY | | 5.00% | | 11/15/2050 | | A- | | | 2,115,000 | | | | 2,219,642 | |
| Metropolitan Transportation Authority NY | | 5.25% | | 11/15/2028 | | A- | | | 3,740,000 | | | | 3,834,239 | |
| Metropolitan Transportation Authority NY | | 5.50% | | 11/15/2047 | | A- | | | 2,385,000 | | | | 2,697,982 | |
| New York City Transitional Development Corp.–JFK NTO LLC NY AMT | | 5.375% | | 6/30/2060 | | Baa3 | | | 6,945,000 | | | | 7,260,411 | |
| New York City Transitional Development Corp.–JFK NTO LLC NY AMT | | 6.00% | | 6/30/2054 | | Baa3 | | | 10,000,000 | | | | 10,934,588 | |
| New York State Thruway Authority–Junior Lien | | 5.00% | | 1/1/2036 | | A1 | | | 1,510,000 | | | | 1,542,928 | |
| New York State Thruway Authority–New York State Thruway Authority | | 4.00% | | 1/1/2050 | | A1 | | | 1,920,000 | | | | 1,901,262 | |
| New York State Thruway Authority NY | | 5.25% | | 1/1/2054 | | Aa3 | | | 1,500,000 | | | | 1,680,883 | |
| | |
| 204 | See Notes to Financial Statements. |
Schedule of Investments (continued)
NEW YORK TAX FREE FUND September 30, 2024
| Investments | | Interest
Rate | | Maturity
Date | | Credit
Rating:
S&P or
Moody’s(a) | | Principal
Amount | | | Fair
Value | |
| Transportation (continued) | | | | | | | | | | | | | | |
| New York Transportation Development Corp.–Delta Air Lines Inc AMT | | 4.00% | | 1/1/2036 | | Baa3 | | $ | 3,625,000 | | | $ | 3,627,011 | |
| New York Transportation Development Corp.–Delta Air Lines Inc AMT | | 5.00% | | 1/1/2033 | | Baa3 | | | 1,550,000 | | | | 1,602,820 | |
| New York Transportation Development Corp.–Delta Air Lines Inc AMT | | 5.00% | | 1/1/2036 | | Baa3 | | | 3,295,000 | | | | 3,394,156 | |
| New York Transportation Development Corp.–Delta Air Lines Inc AMT | | 5.00% | | 10/1/2040 | | Baa3 | | | 2,645,000 | | | | 2,745,968 | |
| New York Transportation Development Corp.–Delta Air Lines Inc AMT | | 5.625% | | 4/1/2040 | | Baa3 | | | 1,500,000 | | | | 1,631,333 | |
| New York Transportation Development Corp.–Delta Air Lines Inc AMT | | 6.00% | | 4/1/2035 | | Baa3 | | | 1,500,000 | | | | 1,697,488 | |
| New York Transportation Development Corp.–Empire State Thruway Partners LLC AMT | | 4.00% | | 10/31/2041 | | BBB- | (c) | | 860,000 | | | | 814,031 | |
| New York Transportation Development Corp.–Empire State Thruway Partners LLC AMT | | 4.00% | | 4/30/2053 | | BBB- | (c) | | 4,910,000 | | | | 4,342,299 | |
| New York Transportation Development Corp.–JFK International Air Terminal LLC | | 4.00% | | 12/1/2041 | | Baa1 | | | 1,180,000 | | | | 1,177,071 | |
| New York Transportation Development Corp.–JFK International Air Terminal LLC | | 4.00% | | 12/1/2042 | | Baa1 | | | 1,800,000 | | | | 1,793,796 | |
| New York Transportation Development Corp.–JFK International Air Terminal LLC AMT | | 4.00% | | 12/1/2039 | | Baa1 | | | 345,000 | | | | 342,493 | |
| New York Transportation Development Corp.–JFK International Air Terminal LLC AMT | | 4.00% | | 12/1/2040 | | Baa1 | | | 1,400,000 | | | | 1,376,666 | |
| New York Transportation Development Corp.–JFK International Air Terminal LLC AMT | | 4.00% | | 12/1/2041 | | Baa1 | | | 2,950,000 | | | | 2,874,755 | |
| New York Transportation Development Corp.–JFK International Air Terminal LLC AMT | | 5.00% | | 12/1/2034 | | Baa1 | | | 1,115,000 | | | | 1,189,610 | |
| New York Transportation Development Corp.–JFK International Air Terminal LLC AMT | | 5.00% | | 12/1/2039 | | Baa1 | | | 1,405,000 | | | | 1,494,511 | |
| New York Transportation Development Corp.–JFK International Air Terminal LLC AMT | | 5.00% | | 12/1/2042 | | Baa1 | | | 1,020,000 | | | | 1,070,354 | |
| New York Transportation Development Corp.–JFK NTO LLC | | 5.50% | | 6/30/2060 | | Baa3 | | | 9,880,000 | | | | 10,569,847 | |
| | | |
| | See Notes to Financial Statements. | 205 |
Schedule of Investments (continued)
NEW YORK TAX FREE FUND September 30, 2024
| Investments | | Interest
Rate | | Maturity
Date | | Credit
Rating:
S&P or
Moody’s(a) | | Principal
Amount | | | Fair
Value | |
| Transportation (continued) | | | | | | | | | | | | | | |
| New York Transportation Development Corp.–JFK NTO LLC AMT | | 5.25% | | 6/30/2049 | | AA | | $ | 2,500,000 | | | $ | 2,656,514 | |
| New York Transportation Development Corp.–Laguardia Gateway Partner AMT | | 4.00% | | 7/1/2033 | | Baa2 | | | 2,840,000 | | | | 2,840,115 | |
| New York Transportation Development Corp.–Laguardia Gateway Partner AMT | | 4.00% | | 7/1/2046 | | Baa2 | | | 2,285,000 | | | | 2,141,053 | |
| New York Transportation Development Corp.–Laguardia Gateway Partner AMT | | 5.25% | | 1/1/2050 | | Baa2 | | | 13,805,000 | | | | 13,805,722 | |
| Niagara Frontier Transportation Authority NY AMT | | 5.00% | | 4/1/2036 | | A3 | | | 850,000 | | | | 880,340 | |
| Niagara Frontier Transportation Authority NY AMT | | 5.00% | | 4/1/2039 | | A3 | | | 350,000 | | | | 362,036 | |
| Port Authority of New York & New Jersey | | 5.00% | | 10/15/2041 | | AA- | | | 4,090,000 | | | | 4,157,841 | |
| Port Authority of New York & New Jersey | | 5.00% | | 7/15/2046 | | AA- | | | 1,250,000 | | | | 1,399,274 | |
| Port Authority of New York & New Jersey | | 5.00% | | 7/15/2053 | | AA- | | | 1,000,000 | | | | 1,093,370 | |
| Port Authority of New York & New Jersey | | 5.00% | | 7/15/2053 | | AA- | | | 2,000,000 | | | | 2,186,739 | |
| Port Authority of New York & New Jersey(d) | | 5.00% | | 9/1/2054 | | AA- | | | 2,675,000 | | | | 2,948,824 | |
| Port Authority of New York & New Jersey AMT | | 5.00% | | 7/15/2036 | | AA- | | | 2,500,000 | | | | 2,774,713 | |
| Port Authority of New York & New Jersey AMT | | 5.00% | | 9/1/2036 | | AA- | | | 2,200,000 | | | | 2,327,115 | |
| Port Authority of New York & New Jersey AMT | | 5.00% | | 11/15/2041 | | AA- | | | 2,000,000 | | | | 2,050,397 | |
| Port Authority of New York & New Jersey AMT | | 5.50% | | 8/1/2052 | | AA- | | | 4,225,000 | | | | 4,638,449 | |
| Triborough Bridge & Tunnel Authority NY | | 5.25% | | 11/15/2053 | | AA- | | | 2,650,000 | | | | 2,938,861 | |
| Total | | | | | | | | | | | | | 139,313,804 | |
| | | | | | | | | | | | | | | |
| Utilities 5.51% | | | | | | | | | | | | | | |
| Chautauqua County Capital Resource Corp.–NRG Energy Inc NY | | 4.25% | #(b) | 4/1/2042 | | BBB- | | | 1,000,000 | | | | 1,028,585 | |
| Long Island Power Authority NY | | 5.00% | | 9/1/2039 | | A | | | 2,265,000 | | | | 2,269,601 | |
| Long Island Power Authority NY | | 5.00% | | 9/1/2053 | | A | | | 2,000,000 | | | | 2,181,427 | |
| Long Island Power Authority NY | | 5.00% | | 9/1/2054 | | A | | | 5,000,000 | | | | 5,486,610 | |
| New York City Municipal Water Finance Authority–New York City Water & Sewer System NY | | 5.25% | | 6/15/2048 | | AA+ | | | 2,050,000 | | | | 2,303,646 | |
| New York City Municipal Water Finance Authority–New York City Water & Sewer System NY | | 5.25% | | 6/15/2052 | | AA+ | | | 2,220,000 | | | | 2,451,262 | |
| | |
| 206 | See Notes to Financial Statements. |
Schedule of Investments (continued)
NEW YORK TAX FREE FUND September 30, 2024
| Investments | | | | Interest
Rate | | Maturity
Date | | Credit
Rating:
S&P or
Moody’s(a) | | Principal
Amount | | | Fair
Value | |
| Utilities (continued) | | | | | | | | | | | | | | | | |
| New York City Municipal Water Finance Authority–New York City Water & Sewer System NY | | 5.25% | | 6/15/2053 | | AA+ | | $ | 3,000,000 | | | $ | 3,341,788 | |
| New York City Municipal Water Finance Authority NY | | 5.25% | | 6/15/2054 | | AA+ | | | 2,500,000 | | | | 2,782,613 | |
| New York State Environmental Facilities Corp.–State of New York State Revolving Fund | | 5.25% | | 9/15/2052 | | AAA | | | 4,470,000 | | | | 4,978,886 | |
| New York State Environmental Facilities Corp.–State of New York State Revolving Fund | | 5.25% | | 6/15/2053 | | AAA | | | 3,000,000 | | | | 3,401,557 | |
| Puerto Rico Commonwealth Aqueduct & Sewer Authority† | | 4.00% | | 7/1/2042 | | NR | | | 700,000 | | | | 672,179 | |
| Puerto Rico Commonwealth Aqueduct & Sewer Authority† | | 5.00% | | 7/1/2030 | | NR | | | 500,000 | | | | 529,933 | |
| Total | | | | | | | | | | | | | | | 31,428,087 | |
| Total Municipal Bonds (cost $567,268,870) | | | | | | | | | | | | | 563,835,998 | |
| | | | | | | | | | | | | | | |
| | | Interest
Rate# | | Interest
Rate
Reset
Date(e) | | Final
Maturity
Date | | | | | | | | |
| SHORT-TERM INVESTMENTS 2.15% | | | | | | | | | | | | | | | | |
| | | | | | | | | | | | | | | | | |
| VARIABLE RATE DEMAND NOTES 2.15% | | | | | | | | | | | | | | | |
| | | | | | | | | | | | | | | | | |
| General Obligation | | | | | | | | | | | | | | | | |
| City of New York NY GO | | 4.050% | | 10/1/2024 | | 10/1/2046 | | AA | | | 5,000,000 | | | | 5,000,000 | |
| City of New York NY GO | | 4.150% | | 10/1/2024 | | 4/1/2042 | | AA | | | 5,250,000 | | | | 5,250,000 | |
| City of New York NY GO | | 4.150% | | 10/1/2024 | | 4/1/2042 | | AA | | | 2,000,000 | | | | 2,000,000 | |
| Total | | | | | | | | | | | | | | | 12,250,000 | |
| Total Short-Term Investments (cost $12,250,000) | | | | | | | | | | | | | 12,250,000 | |
| Total Investments in Securities 100.97% (cost $579,518,870) | | | | | | | | | | | 576,085,998 | |
| Other Assets and Liabilities – Net(f) (0.97)% | | | | | | | | | | | | | (5,530,065 | ) |
| Net Assets 100.00% | | | | | | | | | | | | | | $ | 570,555,933 | |
| | | |
| AGC | | Insured by–Assured Guarantee Corp. |
| AGM | | Insured by–Assured Guaranty Municipal Corporation. |
| AMT | | Income from the security may be subject to Alternative Minimum Tax. |
| BAM | | Insured by–Build America Mutual. |
| CPI | | Consumer Price Index: Rate fluctuates based on CPI. |
| FGIC | | Insured by–Financial Guaranty Insurance Company. |
| FHA | | Insured by–Federal Housing Administration. |
| NR | | Not Rated. |
| | | |
| | See Notes to Financial Statements. | 207 |
Schedule of Investments (concluded)
NEW YORK TAX FREE FUND September 30, 2024
| SIFMA | | Insured by–Securities Industry and Financial Markets Association. |
| TRIPS | | Tax Refund Intercept Programs. |
| YoY | | Year on Year Inflation Rates. |
| † | | Security was purchased pursuant to Rule 144A under the Securities Act of 1933 and, unless registered under such Act or exempted from registration, may only be resold to qualified institutional buyers. At September 30, 2024, the total value of Rule 144A securities was $23,698,607, which represents 4.15% of net assets. |
| # | | Variable rate security. The interest rate represents the rate in effect at September 30, 2024. |
| (a) | | Unaudited. |
| (b) | | Variable Rate is Fixed to Float: Rate remains fixed or at Zero Coupon until designated future date. |
| (c) | | This investment has been rated by Fitch IBCA. |
| (d) | | Securities purchased on a when-issued basis (See Note 2(g)). |
| (e) | | The interest rate reset date shown represents the date in which the Fund has the right to sell a Variable Rate Demand Note (“VRDN”) back to the issuer for Principal Amount. The interest rate on the VRDN is generally reset daily based on the SIFMA Municipal Swap Index. |
| (f) | | Other Assets and Liabilities – Net include net unrealized appreciation/depreciation on futures contracts as follows: |
Futures Contracts at September 30, 2024:
| Type | | Expiration | | Contracts | | Position | | Notional
Amount | | | Notional
Value | | | Unrealized
Appreciation | |
| U.S. Long Bond | | December 2024 | | 67 | | Short | | | $(8,336,287 | ) | | | $(8,320,562 | ) | | | $15,725 | |
The following is a summary of the inputs used as of September 30, 2024 in valuing the Fund’s investments carried at fair value(1):
| Investment Type(2) | | Level 1 | | | Level 2 | | | Level 3 | | | Total | |
| Long-Term Investments | | | | | | | | | | | | | | | | |
| Municipal Bonds | | $ | – | | | $ | 563,835,998 | | | $ | – | | | $ | 563,835,998 | |
| Short-Term Investments | | | | | | | | | | | | | | | | |
| Variable Rate Demand Notes | | | – | | | | 12,250,000 | | | | – | | | | 12,250,000 | |
| Total | | $ | – | | | $ | 576,085,998 | | | $ | – | | | $ | 576,085,998 | |
| Other Financial Instruments | | | | | | | | | | | | | | | | |
| Futures Contracts | | | | | | | | | | | | | | | | |
| Assets | | $ | 15,725 | | | $ | – | | | $ | – | | | $ | 15,725 | |
| Liabilities | | | – | | | | – | | | | – | | | | – | |
| Total | | $ | 15,725 | | | $ | – | | | $ | – | | | $ | 15,725 | |
| | | |
| (1) | | Refer to Note 2(i) for a description of fair value measurements and the three-tier hierarchy of inputs. |
| (2) | | See Schedule of Investments for fair values in each industry. The table above is presented by Investment Type. Industries are presented within an Investment Type should such Investment Type include securities classified as two or more levels within the three-tier fair value hierarchy. When applicable, each Level 3 security is identified on the Schedule of Investments along with the valuation technique utilized. |
A reconciliation of Level 3 investments is presented when the Fund has a material amount of Level 3 investments at the beginning or end of the year in relation to the Fund’s net assets. Management has determined not to provide a reconciliation as the balance of Level 3 investments was not considered to be material to the Fund’s net assets at the beginning or end of the year.
| | |
| 208 | See Notes to Financial Statements. |
This page is intentionally left blank.
209
Statements of Assets and Liabilities
September 30, 2024
| | | Short Duration | | | Intermediate | | | National | |
| ASSETS: | | | | | | | | | | | | |
| Investments in securities, at cost | | $ | 1,531,050,466 | | | $ | 4,880,760,742 | | | $ | 4,743,160,885 | |
| Investments in securities, at fair value | | $ | 1,541,028,094 | | | $ | 4,976,165,926 | | | $ | 4,881,279,116 | |
| Cash | | | 10,052,913 | | | | 11,496,230 | | | | 22,249,567 | |
| Deposits with brokers for futures collateral | | | – | | | | – | | | | 1,132,200 | |
| Receivables: | | | | | | | | | | | | |
| Investment securities sold | | | 79,339,637 | | | | 6,490,306 | | | | 6,665,000 | |
| Interest | | | 14,075,481 | | | | 59,397,924 | | | | 62,908,606 | |
| Capital shares sold | | | 4,602,052 | | | | 23,707,660 | | | | 21,940,231 | |
| From advisor (See Note 3) | | | 8,120 | | | | – | | | | – | |
| Variation margin for futures contracts | | | – | | | | – | | | | 211,084 | |
| Prepaid expenses and other assets | | | 31,838 | | | | 72,840 | | | | 112,241 | |
| Total assets | | | 1,649,138,135 | | | | 5,077,330,886 | | | | 4,996,498,045 | |
| LIABILITIES: | | | | | | | | | | | | |
| Payables: | | | | | | | | | | | | |
| Investment securities purchased | | | 80,931,376 | | | | 96,213,004 | | | | 110,685,576 | |
| Capital shares reacquired | | | 2,018,219 | | | | 6,434,106 | | | | 7,255,997 | |
| Management fee | | | 432,582 | | | | 1,551,005 | | | | 1,448,588 | |
| Directors’ fees | | | 240,698 | | | | 589,428 | | | | 463,261 | |
| 12b–1 distribution plan | | | 170,806 | | | | 665,006 | | | | 649,436 | |
| Fund administration | | | 50,892 | | | | 161,069 | | | | 151,501 | |
| Trust certificates (See Note 2(h)) | | | – | | | | – | | | | 100,635,000 | |
| Interest expense and fees | | | – | | | | – | | | | 1,367,623 | |
| Distributions payable | | | 3,856,630 | | | | 13,569,215 | | | | 14,150,359 | |
| Accrued expenses | | | 205,468 | | | | 613,249 | | | | 465,180 | |
| Total liabilities | | | 87,906,671 | | | | 119,796,082 | | | | 237,272,521 | |
| NET ASSETS | | $ | 1,561,231,464 | | | $ | 4,957,534,804 | | | $ | 4,759,225,524 | |
| COMPOSITION OF NET ASSETS: | | | | | | | | | | | | |
| Paid-in capital | | $ | 1,652,103,190 | | | $ | 5,276,899,791 | | | $ | 5,006,349,513 | |
| Total distributable earnings (loss) | | | (90,871,726 | ) | | | (319,364,987 | ) | | | (247,123,989 | ) |
| Net Assets | | $ | 1,561,231,464 | | | $ | 4,957,534,804 | | | $ | 4,759,225,524 | |
| 210 | See Notes to Financial Statements. |
| High Income | | | Short Duration
High Income | | | Sustainable | | | California | | | New Jersey | | | New York | |
| | | | | | | | | | | | | | | | | |
| $ | 4,031,238,329 | | | $ | 1,468,535,948 | | | $ | 5,493,007 | | | $ | 650,779,536 | | | $ | 138,965,125 | | | $ | 579,518,870 | |
| $ | 4,134,202,505 | | | $ | 1,503,478,757 | | | $ | 5,647,298 | | | $ | 666,910,348 | | | $ | 138,428,925 | | | $ | 576,085,998 | |
| | 4,910,588 | | | | 3,278,986 | | | | 5,316 | | | | 6,294,588 | | | | 1,918,052 | | | | 2,429,665 | |
| | – | | | | 148,000 | | | | – | | | | 144,300 | | | | 33,300 | | | | 247,900 | |
| | | | | | | | | | | | | | | | | | | | | | | |
| | 40,000 | | | | 820,000 | | | | – | | | | – | | | | – | | | | – | |
| | 57,337,495 | | | | 20,530,103 | | | | 71,535 | | | | 8,034,338 | | | | 1,539,617 | | | | 6,779,201 | |
| | 19,393,977 | | | | 9,199,582 | | | | 2,893 | | | | 3,131,151 | | | | 500,184 | | | | 2,355,017 | |
| | – | | | | 20,023 | | | | 11,423 | | | | – | | | | 2,839 | | | | – | |
| | – | | | | 27,556 | | | | – | | | | 27,022 | | | | 6,260 | | | | 46,311 | |
| | 70,404 | | | | 57,398 | | | | 12,965 | | | | 14,797 | | | | 10,136 | | | | 13,515 | |
| | 4,215,954,969 | | | | 1,537,560,405 | | | | 5,751,430 | | | | 684,556,544 | | | | 142,439,313 | | | | 587,957,607 | |
| | | | | | | | | | | | | | | | | | | | | | | |
| | 33,567,509 | | | | 6,767,283 | | | | – | | | | 8,840,304 | | | | 1,481,825 | | | | 14,358,696 | |
| | 6,989,861 | | | | 3,756,625 | | | | 1,716 | | | | 702,367 | | | | 83,111 | | | | 1,070,318 | |
| | 1,442,238 | | | | 408,793 | | | | 1,488 | | | | 242,730 | | | | 51,026 | | | | 205,191 | |
| | 375,485 | | | | 55,947 | | | | 587 | | | | 76,844 | | | | 22,243 | | | | 75,308 | |
| | 410,439 | | | | 94,158 | | | | 1,044 | | | | 94,329 | | | | 24,396 | | | | 104,050 | |
| | 131,929 | | | | 48,517 | | | | 186 | | | | 21,576 | | | | 4,536 | | | | 18,239 | |
| | 58,465,000 | | | | – | | | | – | | | | 5,000,000 | | | | – | | | | – | |
| | 642,152 | | | | – | | | | – | | | | 33,657 | | | | – | | | | – | |
| | 14,577,375 | | | | 5,073,280 | | | | 16,580 | | | | 1,829,085 | | | | 356,063 | | | | 1,484,175 | |
| | 639,458 | | | | 231,631 | | | | 40,304 | | | | 94,427 | | | | 45,304 | | | | 85,697 | |
| | 117,241,446 | | | | 16,436,234 | | | | 61,905 | | | | 16,935,319 | | | | 2,068,504 | | | | 17,401,674 | |
| $ | 4,098,713,523 | | | $ | 1,521,124,171 | | | $ | 5,689,525 | | | $ | 667,621,225 | | | $ | 140,370,809 | | | $ | 570,555,933 | |
| | | | | | | | | | | | | | | | | | | | | | | |
| $ | 4,607,707,770 | | | $ | 1,611,271,582 | | | $ | 5,975,221 | | | $ | 692,365,211 | | | $ | 145,341,974 | | | $ | 595,602,780 | |
| | (508,994,247 | ) | | | (90,147,411 | ) | | | (285,696 | ) | | | (24,743,986 | ) | | | (4,971,165 | ) | | | (25,046,847 | ) |
| $ | 4,098,713,523 | | | $ | 1,521,124,171 | | | $ | 5,689,525 | | | $ | 667,621,225 | | | $ | 140,370,809 | | | $ | 570,555,933 | |
| | See Notes to Financial Statements. | 211 |
Statements of Assets and Liabilities (concluded)
September 30, 2024
| | | Short Duration | | | Intermediate | | | National | |
| Net Assets by class: | | | | | | | | | | | | |
| Class A Shares | | $ | 764,411,569 | | | $ | 1,974,387,223 | | | $ | 2,715,060,275 | |
| Class C Shares | | $ | 15,739,669 | | | $ | 66,670,883 | | | $ | 63,652,742 | |
| Class F Shares | | $ | 27,240,451 | | | $ | 90,249,462 | | | $ | 68,623,718 | |
| Class F3 Shares | | $ | 246,042,356 | | | $ | 316,234,055 | | | $ | 499,689,560 | |
| Class I Shares | | $ | 507,797,419 | | | $ | 2,509,993,181 | | | $ | 1,412,199,229 | |
| Outstanding shares by class*: | | | | | | | | | | | | |
| Class A Shares | | | 50,272,790 | | | | 190,065,494 | | | | 253,858,543 | |
| Class C Shares | | | 1,035,205 | | | | 6,426,229 | | | | 5,945,559 | |
| Class F Shares | | | 1,791,309 | | | | 8,691,836 | | | | 6,423,198 | |
| Class F3 Shares | | | 16,175,376 | | | | 30,429,460 | | | | 46,744,835 | |
| Class I Shares | | | 33,386,774 | | | | 241,653,798 | | | | 132,114,539 | |
Net Asset Value, offering and redemption price per share
(Net assets divided by outstanding shares): | | | | | | | | | | | | |
| Class A Shares-Net asset value | | | $15.21 | | | | $10.39 | | | | $10.70 | |
Class A Shares-Maximum offering price
(Net asset value plus sales charge of 2.25%) | | | $15.56 | | | | $10.63 | | | | $10.95 | |
| Class C Shares-Net asset value | | | $15.20 | | | | $10.37 | | | | $10.71 | |
| Class F Shares-Net asset value | | | $15.21 | | | | $10.38 | | | | $10.68 | |
| Class F3 Shares-Net asset value | | | $15.21 | | | | $10.39 | | | | $10.69 | |
| Class I Shares-Net asset value | | | $15.21 | | | | $10.39 | | | | $10.69 | |
| * | Lord Abbett Municipal Income Fund, Inc. has 11,757,501,500 authorized shares of capital stock (par value $.001), which are designated as follows: 1,950,001,500 to Short Duration, 2,445,000,000 to Intermediate, 1,250,000,000 to National, 1,987,500,000 to High Income, 1,950,000,000 to Short Duration High Income, 750,000,000 to Sustainable, 450,000,000 to California, 525,000,000 to New Jersey and 450,000,000 to New York (as of September 30, 2024). |
| 212 | See Notes to Financial Statements. |
| High Income | | | Short Duration
High Income | | | Sustainable | | | California | | | New Jersey | | | New York | |
| | | | | | | | | | | | | | | | | |
| $ | 2,025,711,335 | | | $ | 409,917,859 | | | $ | 3,250,190 | | | $ | 422,860,658 | | | $ | 105,746,892 | | | $ | 410,876,890 | |
| $ | 127,062,303 | | | $ | 21,802,299 | | | $ | 156,373 | | | $ | 18,312,666 | | | $ | – | | | $ | 17,496,976 | |
| $ | 85,596,901 | | | $ | 12,342,127 | | | $ | 70,323 | | | $ | 12,612,105 | | | $ | 2,997,572 | | | $ | 9,767,851 | |
| $ | 166,069,802 | | | $ | 50,999,126 | | | $ | 93,756 | | | $ | 59,191,610 | | | $ | 2,730,907 | | | $ | 5,525,634 | |
| $ | 1,694,273,182 | | | $ | 1,026,062,760 | | | $ | 2,118,883 | | | $ | 154,644,186 | | | $ | 28,895,438 | | | $ | 126,888,582 | |
| | | | | | | | | | | | | | | | | | | | | | | |
| | 181,375,265 | | | | 28,443,431 | | | | 346,675 | | | | 40,928,808 | | | | 21,956,776 | | | | 37,892,464 | |
| | 11,373,095 | | | | 1,512,653 | | | | 16,679 | | | | 1,771,704 | | | | – | | | | 1,615,723 | |
| | 7,658,255 | | | | 856,450 | | | | 7,500 | | | | 1,220,786 | | | | 622,076 | | | | 900,051 | |
| | 14,898,028 | | | | 3,538,706 | | | | 10,000 | | | | 5,731,179 | | | | 566,300 | | | | 509,363 | |
| | 151,979,982 | | | | 71,196,460 | | | | 226,001 | | | | 14,978,190 | | | | 5,993,881 | | | | 11,696,352 | |
| | | | | | | | | | | | | | | | | | | | | | | |
| | $11.17 | | | | $14.41 | | | | $9.38 | | | | $10.33 | | | | $4.82 | | | | $10.84 | |
| | | | | | | | | | | | | | | | | | | | | | | |
| | $11.43 | | | | $14.74 | | | | $9.60 | | | | $10.57 | | | | $4.93 | | | | $11.09 | |
| | $11.17 | | | | $14.41 | | | | $9.38 | | | | $10.34 | | | | $ – | | | | $10.83 | |
| | $11.18 | | | | $14.41 | | | | $9.38 | | | | $10.33 | | | | $4.82 | | | | $10.85 | |
| | $11.15 | | | | $14.41 | | | | $9.38 | | | | $10.33 | | | | $4.82 | | | | $10.85 | |
| | $11.15 | | | | $14.41 | | | | $9.38 | | | | $10.32 | | | | $4.82 | | | | $10.85 | |
| | See Notes to Financial Statements. | 213 |
Statements of Operations
For the Year Ended September 30, 2024
| | | Short Duration | | | Intermediate | | | National | |
| Investment income: | | | | | | | | | | | | |
| Interest and other | | $ | 54,770,479 | | | $ | 186,450,579 | | | $ | 187,640,156 | |
| Expenses: | | | | | | | | | | | | |
| Management fee | | | 5,295,253 | | | | 18,635,236 | | | | 16,281,601 | |
| 12b-1 distribution plan–Class A | | | 1,516,137 | | | | 3,887,396 | | | | 5,011,803 | |
| 12b-1 distribution plan–Class C | | | 136,652 | | | | 634,402 | | | | 550,465 | |
| 12b-1 distribution plan–Class F | | | 29,844 | | | | 100,236 | | | | 78,242 | |
| Shareholder servicing | | | 627,554 | | | | 2,844,787 | | | | 1,803,355 | |
| Fund administration | | | 622,971 | | | | 1,934,425 | | | | 1,689,326 | |
| Registration | | | 207,553 | | | | 303,999 | | | | 322,108 | |
| Professional | | | 82,955 | | | | 112,549 | | | | 131,745 | |
| Directors’ fees | | | 61,521 | | | | 197,138 | | | | 169,020 | |
| Reports to shareholders | | | 44,414 | | | | 134,888 | | | | 133,852 | |
| Custody | | | 18,281 | | | | 53,740 | | | | 42,936 | |
| Interest expense and fees (See Note 2(h)) | | | – | | | | – | | | | 3,795,444 | |
| Other | | | 118,941 | | | | 171,386 | | | | 139,128 | |
| Gross expenses | | | 8,762,076 | | | | 29,010,182 | | | | 30,149,025 | |
| Fees waived and expenses reimbursed (See Note 3) | | | (172,095 | ) | | | (53,740 | ) | | | (42,936 | ) |
| Net expenses | | | 8,589,981 | | | | 28,956,442 | | | | 30,106,089 | |
| Net investment income | | | 46,180,498 | | | | 157,494,137 | | | | 157,534,067 | |
| Net realized and unrealized gain (loss): | | | | | | | | | | | | |
| Net realized gain (loss) on investments | | | (10,470,958 | ) | | | (74,635,048 | ) | | | (47,185,350 | ) |
| Net realized gain (loss) on futures contracts | | | (433,622 | ) | | | – | | | | (930,580 | ) |
| Net change in unrealized appreciation/depreciation on investments | | | 51,666,787 | | | | 368,932,218 | | | | 379,908,911 | |
| Net change in unrealized appreciation/depreciation on futures contracts | | | 487,900 | | | | – | | | | (1,894,554 | ) |
| Net realized and unrealized gain (loss) | | | 41,250,107 | | | | 294,297,170 | | | | 329,898,427 | |
| Net Increase in Net Assets Resulting From Operations | | $ | 87,430,605 | | | $ | 451,791,307 | | | $ | 487,432,494 | |
| 214 | See Notes to Financial Statements. |
| High Income | | | Short Duration
High Income | | | Sustainable | | | California | | | New Jersey | | | New York | |
| | | | | | | | | | | | | | | | | |
| $ | 196,904,529 | | | $ | 58,015,953 | | | $ | 211,431 | | | $ | 24,790,414 | | | $ | 4,677,187 | | | $ | 19,571,957 | |
| | | | | | | | | | | | | | | | | | | | | | | |
| | 16,137,454 | | | | 4,133,953 | | | | 17,503 | | | | 2,699,455 | | | | 544,843 | | | | 2,228,010 | |
| | 3,658,018 | | | | 637,115 | | | | 6,182 | | | | 769,562 | | | | 182,996 | | | | 709,248 | |
| | 1,079,883 | | | | 166,435 | | | | 1,416 | | | | 153,163 | | | | – | | | | 141,744 | |
| | 96,996 | | | | 15,393 | | | | 72 | | | | 11,682 | | | | 3,500 | | | | 8,764 | |
| | 1,896,470 | | | | 696,872 | | | | 1,081 | | | | 187,193 | | | | 44,286 | | | | 206,618 | |
| | 1,463,745 | | | | 482,406 | | | | 2,188 | | | | 239,951 | | | | 48,431 | | | | 198,045 | |
| | 247,577 | | | | 149,134 | | | | 78,071 | | | | 81,701 | | | | 66,187 | | | | 80,428 | |
| | 64,142 | | | | 77,907 | | | | 41,560 | | | | 64,096 | | | | 44,081 | | | | 51,113 | |
| | 146,308 | | | | 45,766 | | | | 453 | | | | 24,037 | | | | 5,400 | | | | 19,677 | |
| | 92,080 | | | | 34,975 | | | | 4,863 | | | | 21,016 | | | | 6,421 | | | | 14,912 | |
| | 39,709 | | | | 13,546 | | | | 504 | | | | 8,476 | | | | 2,900 | | | | 7,010 | |
| | 2,143,094 | | | | – | | | | – | | | | 33,657 | | | | – | | | | – | |
| | 356,248 | | | | 106,736 | | | | 13,716 | | | | 77,533 | | | | 21,561 | | | | 64,903 | |
| | 27,421,724 | | | | 6,560,238 | | | | 167,609 | | | | 4,371,522 | | | | 970,606 | | | | 3,730,472 | |
| | (39,709 | ) | | | (338,669 | ) | | | (136,450 | ) | | | (8,476 | ) | | | (34,103 | ) | | | (7,010 | ) |
| | 27,382,015 | | | | 6,221,569 | | | | 31,159 | | | | 4,363,046 | | | | 936,503 | | | | 3,723,462 | |
| | 169,522,514 | | | | 51,794,384 | | | | 180,272 | | | | 20,427,368 | | | | 3,740,684 | | | | 15,848,495 | |
| | | | | | | | | | | | | | | | | | | | | | | |
| | (114,043,257 | ) | | | (17,588,548 | ) | | | 70 | | | | (3,318,933 | ) | | | (1,501,263 | ) | | | (3,222,772 | ) |
| | 806,960 | | | | (350,715 | ) | | | – | | | | (155,431 | ) | | | (48,361 | ) | | | (333,172 | ) |
| | | | | | | | | | | | | | | | | | | | | | | |
| | 463,709,221 | | | | 68,856,217 | | | | 303,672 | | | | 47,742,652 | | | | 10,081,292 | | | | 41,209,473 | |
| | | | | | | | | | | | | | | | | | | | | | | |
| | (1,861,694 | ) | | | 9,388 | | | | – | | | | (345,230 | ) | | | (40,414 | ) | | | (327,717 | ) |
| | 348,611,230 | | | | 50,926,342 | | | | 303,742 | | | | 43,923,058 | | | | 8,491,254 | | | | 37,325,812 | |
| | | | | | | | | | | | | | | | | | | | | | | |
| $ | 518,133,744 | | | $ | 102,720,726 | | | $ | 484,014 | | | $ | 64,350,426 | | | $ | 12,231,938 | | | $ | 53,174,307 | |
| | See Notes to Financial Statements. | 215 |
Statements of Changes in Net Assets
| | | Short Duration |
| INCREASE (DECREASE) IN NET ASSETS | | For the
Year Ended
September 30, 2024 | | | For the
Year Ended
September 30, 2023 | |
| Operations: | | | | | | | | |
| Net investment income | | | $ | 46,180,498 | | | | $ | 39,883,579 | |
| Net realized gain (loss) on investments and futures contracts | | | | (10,904,580 | ) | | | | (39,902,898 | ) |
| Net change in unrealized appreciation/depreciation on investments and futures contracts | | | | 52,154,687 | | | | | 47,204,705 | |
| Net increase in net assets resulting from operations | | | | 87,430,605 | | | | | 47,185,386 | |
| Distributions to Shareholders(1) | | | | | | | | | | |
| Class A | | | | (21,627,929 | ) | | | | (17,584,763 | ) |
| Class C | | | | (378,150 | ) | | | | (324,642 | ) |
| Class F | | | | (880,678 | ) | | | | (2,101,757 | ) |
| Class F3 | | | | (7,813,681 | ) | | | | (7,188,716 | ) |
| Class I | | | | (15,261,638 | ) | | | | (12,588,098 | ) |
| Total distribution to shareholders | | | | (45,962,076 | ) | | | | (39,787,976 | ) |
| Capital share transactions (See Note 14): | | | | | | | | | | |
| Net proceeds from sales of shares | | | | 537,940,631 | | | | | 783,794,119 | |
| Reinvestment of distributions | | | | 35,728,540 | | | | | 29,953,750 | |
| Cost of shares reacquired | | | | (646,117,873 | ) | | | | (1,300,105,517 | ) |
| Net increase (decrease) in net assets resulting from capital share transactions | | | | (72,448,702 | ) | | | | (486,357,648 | ) |
| Net increase (decrease) in net assets | | | | (30,980,173 | ) | | | | (478,960,238 | ) |
| NET ASSETS: | | | | | | | | | | |
| Beginning of year | | | $ | 1,592,211,637 | | | | $ | 2,071,171,875 | |
| End of year | | | $ | 1,561,231,464 | | | | $ | 1,592,211,637 | |
| | |
| (1) | Refer to Note 4 in the Notes to Financial Statements for the tax character of distributions. |
| | | |
| 216 | See Notes to Financial Statements. | |
| | Intermediate | | National | |
| | For the
Year Ended
September 30, 2024 | | | For the
Year Ended
September 30, 2023 | | | For the
Year Ended
September 30, 2024 | | | For the
Year Ended
September 30, 2023 | |
| | | | | | | | | | | | |
| | | $ | 157,494,137 | | | | $ | 141,645,834 | | | | $ | 157,534,067 | | | | $ | 124,651,299 | |
| | | | (74,635,048 | ) | | | | (133,123,729 | ) | | | | (48,115,930 | ) | | | | (134,588,997 | ) |
| | | | | | | | | | | | | | | | | | | | |
| | | | 368,932,218 | | | | | 151,612,635 | | | | | 378,014,357 | | | | | 116,122,825 | |
| | | | 451,791,307 | | | | | 160,134,740 | | | | | 487,432,494 | | | | | 106,185,127 | |
| | | | | | | | | | | | | | | | | | | | |
| | | | (60,246,031 | ) | | | | (55,377,086 | ) | | | | (89,801,459 | ) | | | | (77,238,597 | ) |
| | | | (1,943,680 | ) | | | | (2,236,636 | ) | | | | (2,017,748 | ) | | | | (2,184,343 | ) |
| | | | (3,199,421 | ) | | | | (7,640,736 | ) | | | | (2,881,101 | ) | | | | (4,878,775 | ) |
| | | | (9,945,514 | ) | | | | (7,471,644 | ) | | | | (16,261,099 | ) | | | | (11,071,073 | ) |
| | | | (79,795,617 | ) | | | | (67,416,716 | ) | | | | (43,423,463 | ) | | | | (26,764,425 | ) |
| | | | (155,130,263 | ) | | | | (140,142,818 | ) | | | | (154,384,870 | ) | | | | (122,137,213 | ) |
| | | | | | | | | | | | | | | | | | | | |
| | | | 1,480,121,755 | | | | | 2,440,944,276 | | | | | 1,797,998,461 | | | | | 1,660,801,824 | |
| | | | 118,883,166 | | | | | 104,469,308 | | | | | 141,143,008 | | | | | 110,830,832 | |
| | | | (1,782,675,662 | ) | | | | (2,768,876,136 | ) | | | | (1,186,020,738 | ) | | | | (1,461,281,131 | ) |
| | | | | | | | | | | | | | | | | | | | |
| | | | (183,670,741 | ) | | | | (223,462,552 | ) | | | | 753,120,731 | | | | | 310,351,525 | |
| | | | 112,990,303 | | | | | (203,470,630 | ) | | | | 1,086,168,355 | | | | | 294,399,439 | |
| | | | | | | | | | | | | | | | | | | | |
| | | $ | 4,844,544,501 | | | | $ | 5,048,015,131 | | | | $ | 3,673,057,169 | | | | $ | 3,378,657,730 | |
| | | $ | 4,957,534,804 | | | | $ | 4,844,544,501 | | | | $ | 4,759,225,524 | | | | $ | 3,673,057,169 | |
| | | |
| | See Notes to Financial Statements. | 217 |
Statements of Changes in Net Assets (continued)
| | | High Income |
| INCREASE (DECREASE) IN NET ASSETS | | For the
Year Ended
September 30, 2024 | | | For the
Year Ended
September 30, 2023 | |
| Operations: | | | | | | | | |
| Net investment income | | | $ | 169,522,514 | | | | $ | 145,539,733 | |
| Net realized gain (loss) on investments and futures contracts | | | | (113,236,297 | ) | | | | (204,668,914 | ) |
| Net change in unrealized appreciation/depreciation on investments and futures contracts | | | | 461,847,527 | | | | | 160,647,553 | |
| Net increase in net assets resulting from operations | | | | 518,133,744 | | | | | 101,518,372 | |
| Distributions to Shareholders(1) | | | | | | | | | | |
| Class A | | | | (81,380,815 | ) | | | | (72,790,503 | ) |
| Class C | | | | (5,122,399 | ) | | | | (5,689,822 | ) |
| Class F | | | | (4,419,955 | ) | | | | (9,499,288 | ) |
| Class F3 | | | | (6,652,640 | ) | | | | (5,375,725 | ) |
| Class I | | | | (67,807,483 | ) | | | | (48,818,252 | ) |
| Total distribution to shareholders | | | | (165,383,292 | ) | | | | (142,173,590 | ) |
| Capital share transactions (See Note 14): | | | | | | | | | | |
| Net proceeds from sales of shares | | | | 1,482,234,622 | | | | | 1,594,496,427 | |
| Reinvestment of distributions | | | | 149,273,252 | | | | | 128,033,512 | |
| Cost of shares reacquired | | | | (1,170,684,610 | ) | | | | (1,803,019,789 | ) |
| Net increase (decrease) in net assets resulting from capital share transactions | | | | 460,823,264 | | | | | (80,489,850 | ) |
| Net increase (decrease) in net assets | | | | 813,573,716 | | | | | (121,145,068 | ) |
| NET ASSETS: | | | | | | | | | | |
| Beginning of year | | | $ | 3,285,139,807 | | | | $ | 3,406,284,875 | |
| End of year | | | $ | 4,098,713,523 | | | | $ | 3,285,139,807 | |
| | |
| (1) | Refer to Note 4 in the Notes to Financial Statements for the tax character of distributions. |
| | | |
| 218 | See Notes to Financial Statements. | |
| | Short Duration High Income | | | Sustainable | |
| | For the
Year Ended
September 30, 2024 | | | For the
Year Ended
September 30, 2023 | | | For the
Year Ended
September 30, 2024 | | | For the
Year Ended
September 30, 2023 | |
| | | | | | | | | | | | | | | | |
| | | $ | 51,794,384 | | | | $ | 34,301,157 | | | | $ | 180,272 | | | | $ | 142,461 | |
| | | | (17,939,263 | ) | | | | (33,739,132 | ) | | | | 70 | | | | | (155,523 | ) |
| | | | | | | | | | | | | | | | | | | | |
| | | | 68,865,605 | | | | | 27,460,386 | | | | | 303,672 | | | | | 169,162 | |
| | | | 102,720,726 | | | | | 28,022,411 | | | | | 484,014 | | | | | 156,100 | |
| | | | | | | | | | | | | | | | | | | | |
| | | | (12,726,619 | ) | | | | (10,532,484 | ) | | | | (98,995 | ) | | | | (79,924 | ) |
| | | | (694,519 | ) | | | | (607,265 | ) | | | | (4,241 | ) | | | | (2,896 | ) |
| | | | (629,616 | ) | | | | (2,560,295 | ) | | | | (2,370 | ) | | | | (1,919 | ) |
| | | | (1,767,207 | ) | | | | (1,231,546 | ) | | | | (3,159 | ) | | | | (2,685 | ) |
| | | | (34,033,491 | ) | | | | (17,898,923 | ) | | | | (69,705 | ) | | | | (53,809 | ) |
| | | | (49,851,452 | ) | | | | (32,830,513 | ) | | | | (178,470 | ) | | | | (141,233 | ) |
| | | | | | | | | | | | | | | | | | | | |
| | | | 1,021,021,301 | | | | | 685,583,676 | | | | | 295,833 | | | | | 588,055 | |
| | | | 47,827,129 | | | | | 31,503,674 | | | | | 28,161 | | | | | 14,916 | |
| | | | (500,872,805 | ) | | | | (689,567,706 | ) | | | | (91,589 | ) | | | | (6,445 | ) |
| | | | | | | | | | | | | | | | | | | | |
| | | | 567,975,625 | | | | | 27,519,644 | | | | | 232,405 | | | | | 596,526 | |
| | | | 620,844,899 | | | | | 22,711,542 | | | | | 537,949 | | | | | 611,393 | |
| | | | | | | | | | | | | | | | | | | | |
| | | | | | | | | | | | | | | | | | | | |
| | | $ | 900,279,272 | | | | $ | 877,567,730 | | | | $ | 5,151,576 | | | | $ | 4,540,183 | |
| | | $ | 1,521,124,171 | | | | $ | 900,279,272 | | | | $ | 5,689,525 | | | | $ | 5,151,576 | |
| | | | | | | | | | | | | | | | | | | | |
| | See Notes to Financial Statements. | 219 |
Statements of Changes in Net Assets (concluded)
| | | California |
| INCREASE (DECREASE) IN NET ASSETS | | For the
Year Ended
September 30, 2024 | | | For the
Year Ended
September 30, 2023 | |
| Operations: | | | | | | | | |
| Net investment income | | | $ | 20,427,368 | | | | $ | 15,447,264 | |
| Net realized gain (loss) on investments and futures contracts | | | | (3,474,364 | ) | | | | (18,231,152 | ) |
| Net change in unrealized appreciation/depreciation on investments and futures contracts | | | | 47,397,422 | | | | | 16,977,014 | |
| Net increase in net assets resulting from operations | | | | 64,350,426 | | | | | 14,193,126 | |
| Distributions to Shareholders(1) | | | | | | | | | | |
| Class A | | | | (12,660,728 | ) | | | | (10,048,395 | ) |
| Class C | | | | (514,874 | ) | | | | (498,898 | ) |
| Class F | | | | (396,208 | ) | | | | (413,866 | ) |
| Class F3 | | | | (1,838,400 | ) | | | | (1,268,786 | ) |
| Class I | | | | (4,614,513 | ) | | | | (2,913,247 | ) |
| Total distribution to shareholders | | | | (20,024,723 | ) | | | | (15,143,192 | ) |
| Capital share transactions (See Note 14): | | | | | | | | | | |
| Net proceeds from sales of shares | | | | 261,027,649 | | | | | 220,080,799 | |
| Reinvestment of distributions | | | | 18,447,524 | | | | | 13,735,450 | |
| Cost of shares reacquired | | | | (172,050,143 | ) | | | | (171,125,316 | ) |
| Net increase (decrease) in net assets resulting from capital share transactions | | | | 107,425,030 | | | | | 62,690,933 | |
| Net increase (decrease) in net assets | | | | 151,750,733 | | | | | 61,740,867 | |
| NET ASSETS: | | | | | | | | | | |
| Beginning of year | | | $ | 515,870,492 | | | | $ | 454,129,625 | |
| End of year | | | $ | 667,621,225 | | | | $ | 515,870,492 | |
| | |
| (1) | Refer to Note 4 in the Notes to Financial Statements for the tax character of distributions. |
| | | |
| 220 | See Notes to Financial Statements. | |
| | New Jersey | | | New York | |
| | For the
Year Ended
September 30, 2024 | | | For the
Year Ended
September 30, 2023 | | | For the
Year Ended
September 30, 2024 | | | For the
Year Ended
September 30, 2023 | |
| | | | | | | | | | | | | | | | |
| | | $ | 3,740,684 | | | | $ | 3,039,809 | | | | $ | 15,848,495 | | | | $ | 12,894,727 | |
| | | | (1,549,624 | ) | | | | (1,642,816 | ) | | | | (3,555,944 | ) | | | | (6,393,410 | ) |
| | | | | | | | | | | | | | | | | | | | |
| | | | 10,040,878 | | | | | 2,908,510 | | | | | 40,881,756 | | | | | 9,672,228 | |
| | | | 12,231,938 | | | | | 4,305,503 | | | | | 53,174,307 | | | | | 16,173,545 | |
| | | | | | | | | | | | | | | | | | | | |
| | | | (2,771,026 | ) | | | | (2,358,640 | ) | | | | (11,157,801 | ) | | | | (9,296,202 | ) |
| | | | – | | | | | – | | | | | (443,278 | ) | | | | (471,328 | ) |
| | | | (109,345 | ) | | | | (136,716 | ) | | | | (284,503 | ) | | | | (347,324 | ) |
| | | | (66,109 | ) | | | | (50,515 | ) | | | | (125,401 | ) | | | | (78,854 | ) |
| | | | (777,542 | ) | | | | (484,548 | ) | | | | (3,698,928 | ) | | | | (2,587,779 | ) |
| | | | (3,724,022 | ) | | | | (3,030,419 | ) | | | | (15,709,911 | ) | | | | (12,781,487 | ) |
| | | | | | | | | | | | | | | | | | | | |
| | | | 54,223,269 | | | | | 28,363,257 | | | | | 229,341,745 | | | | | 124,898,947 | |
| | | | 2,953,296 | | | | | 2,409,229 | | | | | 13,771,800 | | | | | 10,761,359 | |
| | | | (26,597,145 | ) | | | | (32,259,812 | ) | | | | (127,701,141 | ) | | | | (156,382,096 | ) |
| | | | | | | | | | | | | | | | | | | | |
| | | | 30,579,420 | | | | | (1,487,326 | ) | | | | 115,412,404 | | | | | (20,721,790 | ) |
| | | | 39,087,336 | | | | | (212,242 | ) | | | | 152,876,800 | | | | | (17,329,732 | ) |
| | | | | | | | | | | | | | | | | | | | |
| | | | | | | | | | | | | | | | | | | | |
| | | $ | 101,283,473 | | | | $ | 101,495,715 | | | | $ | 417,679,133 | | | | $ | 435,008,865 | |
| | | $ | 140,370,809 | | | | $ | 101,283,473 | | | | $ | 570,555,933 | | | | $ | 417,679,133 | |
| | | |
| | See Notes to Financial Statements. | 221 |
Financial Highlights
SHORT DURATION TAX FREE FUND
| | | | | | Per Share Operating Performance: | | | |
| | | | | | Investment Operations: | | Distributions
to
shareholders
from: | | |
| | | Net asset
value,
beginning of
period | | Net
investment
income
(loss)(a) | | Net
realized and
unrealized
gain (loss) | | Total from
investment
operations | | Net
investment
income | | Net asset
value,
end of
period |
| Class A | | | | | | | | | | | | | | | | | | | | | | | | |
| 9/30/2024 | | | $14.81 | | | | $0.43 | | | $ | 0.40 | | | $ | 0.83 | | | | $(0.43 | ) | | | $15.21 | |
| 9/30/2023 | | | 14.78 | | | | 0.32 | | | | 0.03 | | | | 0.35 | | | | (0.32 | ) | | | 14.81 | |
| 9/30/2022 | | | 15.84 | | | | 0.15 | | | | (1.06 | ) | | | (0.91 | ) | | | (0.15 | ) | | | 14.78 | |
| 9/30/2021 | | | 15.80 | | | | 0.15 | | | | 0.04 | | | | 0.19 | | | | (0.15 | ) | | | 15.84 | |
| 9/30/2020 | | | 15.78 | | | | 0.24 | | | | 0.02 | | | | 0.26 | | | | (0.24 | ) | | | 15.80 | |
| Class C | | | | | | | | | | | | | | | | | | | | | | | | |
| 9/30/2024 | | | 14.81 | | | | 0.34 | | | | 0.39 | | | | 0.73 | | | | (0.34 | ) | | | 15.20 | |
| 9/30/2023 | | | 14.78 | | | | 0.23 | | | | 0.03 | | | | 0.26 | | | | (0.23 | ) | | | 14.81 | |
| 9/30/2022 | | | 15.84 | | | | 0.05 | | | | (1.05 | ) | | | (1.00 | ) | | | (0.06 | ) | | | 14.78 | |
| 9/30/2021 | | | 15.80 | | | | 0.05 | | | | 0.04 | | | | 0.09 | | | | (0.05 | ) | | | 15.84 | |
| 9/30/2020 | | | 15.78 | | | | 0.15 | | | | 0.01 | | | | 0.16 | | | | (0.14 | ) | | | 15.80 | |
| Class F | | | | | | | | | | | | | | | | | | | | | | | | |
| 9/30/2024 | | | 14.81 | | | | 0.45 | | | | 0.39 | | | | 0.84 | | | | (0.44 | ) | | | 15.21 | |
| 9/30/2023 | | | 14.79 | | | | 0.30 | | | | 0.05 | | | | 0.35 | | | | (0.33 | ) | | | 14.81 | |
| 9/30/2022 | | | 15.85 | | | | 0.16 | | | | (1.05 | ) | | | (0.89 | ) | | | (0.17 | ) | | | 14.79 | |
| 9/30/2021 | | | 15.80 | | | | 0.16 | | | | 0.05 | | | | 0.21 | | | | (0.16 | ) | | | 15.85 | |
| 9/30/2020 | | | 15.78 | | | | 0.26 | | | | 0.02 | | | | 0.28 | | | | (0.26 | ) | | | 15.80 | |
| Class F3 | | | | | | | | | | | | | | | | | | | | | | | | |
| 9/30/2024 | | | 14.81 | | | | 0.47 | | | | 0.39 | | | | 0.86 | | | | (0.46 | ) | | | 15.21 | |
| 9/30/2023 | | | 14.79 | | | | 0.35 | | | | 0.02 | | | | 0.37 | | | | (0.35 | ) | | | 14.81 | |
| 9/30/2022 | | | 15.85 | | | | 0.19 | | | | (1.06 | ) | | | (0.87 | ) | | | (0.19 | ) | | | 14.79 | |
| 9/30/2021 | | | 15.80 | | | | 0.18 | | | | 0.06 | | | | 0.24 | | | | (0.19 | ) | | | 15.85 | |
| 9/30/2020 | | | 15.79 | | | | 0.27 | | | | 0.02 | | | | 0.29 | | | | (0.28 | ) | | | 15.80 | |
| Class I | | | | | | | | | | | | | | | | | | | | | | | | |
| 9/30/2024 | | | 14.81 | | | | 0.46 | | | | 0.40 | | | | 0.86 | | | | (0.46 | ) | | | 15.21 | |
| 9/30/2023 | | | 14.79 | | | | 0.35 | | | | 0.02 | | | | 0.37 | | | | (0.35 | ) | | | 14.81 | |
| 9/30/2022 | | | 15.85 | | | | 0.20 | | | | (1.08 | ) | | | (0.88 | ) | | | (0.18 | ) | | | 14.79 | |
| 9/30/2021 | | | 15.80 | | | | 0.18 | | | | 0.05 | | | | 0.23 | | | | (0.18 | ) | | | 15.85 | |
| 9/30/2020 | | | 15.78 | | | | 0.27 | | | | 0.02 | | | | 0.29 | | | | (0.27 | ) | | | 15.80 | |
| | |
| (a) | Calculated based on average shares outstanding during the period. |
| (b) | Total return for Classes A and C does not consider the effects of sales loads and assumes the reinvestment of all distributions. Total return for all other classes assumes the reinvestment of all distributions. |
| | |
| 222 | See Notes to Financial Statements. |
| | | | Ratios to Average Net Assets: | | Supplemental Data: |
| | | | | | | | |
Total
return
(%)(b) | | Total
expenses
after
waivers
and/or reim-
bursements
(%) | | Total
expenses
(%) | | Net
investment
income (loss)
(%) | | Net
assets,
end of
period
(000) | | Portfolio
turnover
rate
(%) |
| | | | | | | | | | | | | | | | | | | | | | | |
| | 5.67 | | | | 0.65 | | | | 0.66 | | | | 2.87 | | | $ | 764,412 | | | | 66 | |
| | 2.29 | | | | 0.65 | | | | 0.66 | | | | 2.12 | | | | 758,931 | | | | 59 | |
| | (5.68 | ) | | | 0.65 | | | | 0.65 | | | | 0.99 | | | | 875,792 | | | | 43 | |
| | 1.20 | | | | 0.65 | | | | 0.65 | | | | 0.93 | | | | 1,067,651 | | | | 26 | |
| | 1.68 | | | | 0.65 | | | | 0.66 | | | | 1.52 | | | | 895,461 | | | | 28 | |
| | | | | | | | | | | | | | | | | | | | | | | |
| | 4.96 | | | | 1.26 | | | | 1.27 | | | | 2.26 | | | | 15,740 | | | | 66 | |
| | 1.74 | | | | 1.26 | | | | 1.27 | | | | 1.51 | | | | 17,796 | | | | 59 | |
| | (6.34 | ) | | | 1.29 | | | | 1.29 | | | | 0.35 | | | | 23,284 | | | | 43 | |
| | 0.54 | | | | 1.30 | | | | 1.31 | | | | 0.30 | | | | 31,450 | | | | 26 | |
| | 1.05 | | | | 1.27 | | | | 1.28 | | | | 0.96 | | | | 39,779 | | | | 28 | |
| | | | | | | | | | | | | | | | | | | | | | | |
| | 5.77 | | | | 0.55 | | | | 0.56 | | | | 2.97 | | | | 27,240 | | | | 66 | |
| | 2.39 | | | | 0.55 | | | | 0.56 | | | | 2.03 | | | | 33,367 | | | | 59 | |
| | (5.65 | ) | | | 0.55 | | | | 0.55 | | | | 1.01 | | | | 246,974 | | | | 43 | |
| | 1.36 | | | | 0.55 | | | | 0.55 | | | | 1.03 | | | | 736,826 | | | | 26 | |
| | 1.77 | | | | 0.55 | | | | 0.56 | | | | 1.62 | | | | 587,635 | | | | 28 | |
| | | | | | | | | | | | | | | | | | | | | | | |
| | 5.92 | | | | 0.41 | | | | 0.41 | | | | 3.11 | | | | 246,042 | | | | 66 | |
| | 2.54 | | | | 0.41 | | | | 0.42 | | | | 2.35 | | | | 264,658 | | | | 59 | |
| | (5.52 | ) | | | 0.41 | | | | 0.41 | | | | 1.25 | | | | 361,359 | | | | 43 | |
| | 1.50 | | | | 0.42 | | | | 0.42 | | | | 1.16 | | | | 331,257 | | | | 26 | |
| | 1.84 | | | | 0.42 | | | | 0.43 | | | | 1.74 | | | | 246,193 | | | | 28 | |
| | | | | | | | | | | | | | | | | | | | | | | |
| | 5.88 | | | | 0.45 | | | | 0.46 | | | | 3.07 | | | | 507,797 | | | | 66 | |
| | 2.50 | | | | 0.45 | | | | 0.46 | | | | 2.34 | | | | 517,459 | | | | 59 | |
| | (5.55 | ) | | | 0.45 | | | | 0.46 | | | | 1.30 | | | | 563,762 | | | | 43 | |
| | 1.46 | | | | 0.45 | | | | 0.45 | | | | 1.13 | | | | 206,551 | | | | 26 | |
| | 1.87 | | | | 0.45 | | | | 0.46 | | | | 1.70 | | | | 177,634 | | | | 28 | |
| | | |
| See Notes to Financial Statements. | 223 |
Financial Highlights (continued)
INTERMEDIATE TAX FREE FUND
| | | | | | Per Share Operating Performance: | | | |
| | | | | | Investment Operations: | | Distributions
to
shareholders
from: | | | |
| | | Net asset
value,
beginning of
period | | Net
investment
income
(loss)(a) | | Net
realized and
unrealized
gain (loss) | | Total from
investment
operations | | Net
investment
income | | Net asset
value,
end of
period |
| Class A | | | | | | | | | | | | | | | | | | | | | | | | |
| 9/30/2024 | | $ | 9.76 | | | | $0.32 | | | $ | 0.63 | | | $ | 0.95 | | | | $(0.32 | ) | | $ | 10.39 | |
| 9/30/2023 | | | 9.71 | | | | 0.27 | | | | 0.05 | | | | 0.32 | | | | (0.27 | ) | | | 9.76 | |
| 9/30/2022 | | | 11.33 | | | | 0.23 | | | | (1.63 | ) | | | (1.40 | ) | | | (0.22 | ) | | | 9.71 | |
| 9/30/2021 | | | 11.11 | | | | 0.24 | | | | 0.22 | | | | 0.46 | | | | (0.24 | ) | | | 11.33 | |
| 9/30/2020 | | | 11.17 | | | | 0.27 | | | | (0.06 | ) | | | 0.21 | | | | (0.27 | ) | | | 11.11 | |
| Class C | | | | | | | | | | | | | | | | | | | | | | | | |
| 9/30/2024 | | | 9.75 | | | | 0.26 | | | | 0.61 | | | | 0.87 | | | | (0.25 | ) | | | 10.37 | |
| 9/30/2023 | | | 9.70 | | | | 0.21 | | | | 0.05 | | | | 0.26 | | | | (0.21 | ) | | | 9.75 | |
| 9/30/2022 | | | 11.32 | | | | 0.16 | | | | (1.62 | ) | | | (1.46 | ) | | | (0.16 | ) | | | 9.70 | |
| 9/30/2021 | | | 11.10 | | | | 0.17 | | | | 0.22 | | | | 0.39 | | | | (0.17 | ) | | | 11.32 | |
| 9/30/2020 | | | 11.16 | | | | 0.21 | | | | (0.07 | ) | | | 0.14 | | | | (0.20 | ) | | | 11.10 | |
| Class F | | | | | | | | | | | | | | | | | | | | | | | | |
| 9/30/2024 | | | 9.76 | | | | 0.33 | | | | 0.62 | | | | 0.95 | | | | (0.33 | ) | | | 10.38 | |
| 9/30/2023 | | | 9.71 | | | | 0.28 | | | | 0.05 | | | | 0.33 | | | | (0.28 | ) | | | 9.76 | |
| 9/30/2022 | | | 11.33 | | | | 0.23 | | | | (1.61 | ) | | | (1.38 | ) | | | (0.24 | ) | | | 9.71 | |
| 9/30/2021 | | | 11.11 | | | | 0.25 | | | | 0.22 | | | | 0.47 | | | | (0.25 | ) | | | 11.33 | |
| 9/30/2020 | | | 11.17 | | | | 0.28 | | | | (0.06 | ) | | | 0.22 | | | | (0.28 | ) | | | 11.11 | |
| Class F3 | | | | | | | | | | | | | | | | | | | | | | | | |
| 9/30/2024 | | | 9.77 | | | | 0.35 | | | | 0.61 | | | | 0.96 | | | | (0.34 | ) | | | 10.39 | |
| 9/30/2023 | | | 9.72 | | | | 0.30 | | | | 0.05 | | | | 0.35 | | | | (0.30 | ) | | | 9.77 | |
| 9/30/2022 | | | 11.34 | | | | 0.25 | | | | (1.62 | ) | | | (1.37 | ) | | | (0.25 | ) | | | 9.72 | |
| 9/30/2021 | | | 11.12 | | | | 0.27 | | | | 0.22 | | | | 0.49 | | | | (0.27 | ) | | | 11.34 | |
| 9/30/2020 | | | 11.18 | | | | 0.30 | | | | (0.06 | ) | | | 0.24 | | | | (0.30 | ) | | | 11.12 | |
| Class I | | | | | | | | | | | | | | | | | | | | | | | | |
| 9/30/2024 | | | 9.76 | | | | 0.34 | | | | 0.63 | | | | 0.97 | | | | (0.34 | ) | | | 10.39 | |
| 9/30/2023 | | | 9.71 | | | | 0.30 | | | | 0.04 | | | | 0.34 | | | | (0.29 | ) | | | 9.76 | |
| 9/30/2022 | | | 11.33 | | | | 0.25 | | | | (1.62 | ) | | | (1.37 | ) | | | (0.25 | ) | | | 9.71 | |
| 9/30/2021 | | | 11.12 | | | | 0.27 | | | | 0.21 | | | | 0.48 | | | | (0.27 | ) | | | 11.33 | |
| 9/30/2020 | | | 11.17 | | | | 0.29 | | | | (0.05 | ) | | | 0.24 | | | | (0.29 | ) | | | 11.12 | |
| | |
| (a) | Calculated using average shares outstanding during the period. |
| (b) | Total return for Classes A and C does not consider the effects of sales loads and assumes the reinvestment of all distributions. Total return for all other classes assumes the reinvestment of all distributions. |
| | |
| 224 | See Notes to Financial Statements. |
| | | | Ratios to Average Net Assets: | | Supplemental Data: |
| | | | | | | | | | | | | | | | | |
Total
return
(%)(b) | | Total
expenses
after
waivers
and/or reim-
bursements
(%) | | Total
expenses
(%) | | Net
investment
income (loss)
(%) | | Net
assets,
end of
period
(000) | | Portfolio
turnover
rate
(%) |
| | | | | | | | | | | | | | | | | | | | | | | |
| | 9.80 | | | | 0.71 | | | | 0.71 | | | | 3.15 | | | $ | 1,974,387 | | | | 49 | |
| | 3.17 | | | | 0.71 | | | | 0.71 | | | | 2.74 | | | | 1,935,887 | | | | 44 | |
| | (12.36 | ) | | | 0.71 | | | | 0.71 | | | | 2.11 | | | | 2,075,394 | | | | 33 | |
| | 4.19 | | | | 0.70 | | | | 0.70 | | | | 2.15 | | | | 2,656,030 | | | | 13 | |
| | 1.93 | | | | 0.70 | | | | 0.70 | | | | 2.45 | | | | 2,239,629 | | | | 14 | |
| | | | | | | | | | | | | | | | | | | | | | | |
| | 9.03 | | | | 1.32 | | | | 1.32 | | | | 2.53 | | | | 66,671 | | | | 49 | |
| | 2.64 | | | | 1.32 | | | | 1.32 | | | | 2.12 | | | | 86,956 | | | | 44 | |
| | (13.02 | ) | | | 1.35 | | | | 1.35 | | | | 1.47 | | | | 123,238 | | | | 33 | |
| | 3.53 | | | | 1.33 | | | | 1.33 | | | | 1.52 | | | | 190,855 | | | | 13 | |
| | 1.30 | | | | 1.32 | | | | 1.32 | | | | 1.86 | | | | 215,475 | | | | 14 | |
| | | | | | | | | | | | | | | | | | | | | | | |
| | 9.80 | | | | 0.61 | | | | 0.61 | | | | 3.24 | | | | 90,249 | | | | 49 | |
| | 3.38 | | | | 0.60 | | | | 0.60 | | | | 2.78 | | | | 113,056 | | | | 44 | |
| | (12.37 | ) | | | 0.60 | | | | 0.60 | | | | 2.13 | | | | 522,922 | | | | 33 | |
| | 4.30 | | | | 0.60 | | | | 0.60 | | | | 2.24 | | | | 2,697,578 | | | | 13 | |
| | 2.03 | | | | 0.60 | | | | 0.60 | | | | 2.56 | | | | 2,140,068 | | | | 14 | |
| | | | | | | | | | | | | | | | | | | | | | | |
| | 9.97 | | | | 0.44 | | | | 0.44 | | | | 3.41 | | | | 316,234 | | | | 49 | |
| | 3.54 | | | | 0.45 | | | | 0.45 | | | | 3.00 | | | | 274,934 | | | | 44 | |
| | (12.21 | ) | | | 0.45 | | | | 0.45 | | | | 2.39 | | | | 194,787 | | | | 33 | |
| | 4.45 | | | | 0.45 | | | | 0.45 | | | | 2.36 | | | | 171,655 | | | | 13 | |
| | 2.17 | | | | 0.46 | | | | 0.46 | | | | 2.68 | | | | 85,559 | | | | 14 | |
| | | | | | | | | | | | | | | | | | | | | | | |
| | 10.02 | | | | 0.51 | | | | 0.51 | | | | 3.35 | | | | 2,509,993 | | | | 49 | |
| | 3.48 | | | | 0.51 | | | | 0.51 | | | | 2.95 | | | | 2,433,710 | | | | 44 | |
| | (12.28 | ) | | | 0.52 | | | | 0.52 | | | | 2.39 | | | | 2,131,673 | | | | 33 | |
| | 4.31 | | | | 0.50 | | | | 0.50 | | | | 2.35 | | | | 896,545 | | | | 13 | |
| | 2.22 | | | | 0.50 | | | | 0.50 | | | | 2.65 | | | | 870,771 | | | | 14 | |
| | | |
| See Notes to Financial Statements. | 225 |
Financial Highlights (continued)
NATIONAL TAX FREE FUND
| | | | | | Per Share Operating Performance: | | | |
| | | | | | | | | | | | | | | | | | | |
| | | | | | Investment Operations: | | Distributions
to
shareholders
from: | | | |
| | | Net asset
value,
beginning of
period | | Net
investment
income
(loss)(a) | | Net
realized and
unrealized
gain (loss) | | Total from
investment
operations | | Net
investment
income | | Net asset
value,
end of
period |
| Class A | | | | | | | | | | | | | | | | | | | | | | | | |
| 9/30/2024 | | $ | 9.85 | | | $ | 0.38 | | | $ | 0.84 | | | $ | 1.22 | | | | $(0.37 | ) | | $ | 10.70 | |
| 9/30/2023 | | | 9.83 | | | | 0.35 | | | | 0.01 | (d) | | | 0.36 | | | | (0.34 | ) | | | 9.85 | |
| 9/30/2022 | | | 12.06 | | | | 0.30 | | | | (2.23 | ) | | | (1.93 | ) | | | (0.30 | ) | | | 9.83 | |
| 9/30/2021 | | | 11.70 | | | | 0.31 | | | | 0.36 | | | | 0.67 | | | | (0.31 | ) | | | 12.06 | |
| 9/30/2020 | | | 11.80 | | | | 0.34 | | | | (0.10 | ) | | | 0.24 | | | | (0.34 | ) | | | 11.70 | |
| Class C | | | | | | | | | | | | | | | | | | | | | | | | |
| 9/30/2024 | | | 9.86 | | | | 0.32 | | | | 0.84 | | | | 1.16 | | | | (0.31 | ) | | | 10.71 | |
| 9/30/2023 | | | 9.84 | | | | 0.29 | | | | 0.01 | (d) | | | 0.30 | | | | (0.28 | ) | | | 9.86 | |
| 9/30/2022 | | | 12.08 | | | | 0.23 | | | | (2.24 | ) | | | (2.01 | ) | | | (0.23 | ) | | | 9.84 | |
| 9/30/2021 | | | 11.71 | | | | 0.23 | | | | 0.37 | | | | 0.60 | | | | (0.23 | ) | | | 12.08 | |
| 9/30/2020 | | | 11.82 | | | | 0.26 | | | | (0.11 | ) | | | 0.15 | | | | (0.26 | ) | | | 11.71 | |
| Class F | | | | | | | | | | | | | | | | | | | | | | | | |
| 9/30/2024 | | | 9.84 | | | | 0.39 | | | | 0.83 | | | | 1.22 | | | | (0.38 | ) | | | 10.68 | |
| 9/30/2023 | | | 9.82 | | | | 0.35 | | | | 0.02 | (d) | | | 0.37 | | | | (0.35 | ) | | | 9.84 | |
| 9/30/2022 | | | 12.05 | | | | 0.31 | | | | (2.23 | ) | | | (1.92 | ) | | | (0.31 | ) | | | 9.82 | |
| 9/30/2021 | | | 11.69 | | | | 0.32 | | | | 0.36 | | | | 0.68 | | | | (0.32 | ) | | | 12.05 | |
| 9/30/2020 | | | 11.79 | | | | 0.35 | | | | (0.10 | ) | | | 0.25 | | | | (0.35 | ) | | | 11.69 | |
| Class F3 | | | | | | | | | | | | | | | | | | | | | | | | |
| 9/30/2024 | | | 9.84 | | | | 0.41 | | | | 0.84 | | | | 1.25 | | | | (0.40 | ) | | | 10.69 | |
| 9/30/2023 | | | 9.83 | | | | 0.37 | | | | 0.01 | (d) | | | 0.38 | | | | (0.37 | ) | | | 9.84 | |
| 9/30/2022 | | | 12.06 | | | | 0.32 | | | | (2.23 | ) | | | (1.91 | ) | | | (0.32 | ) | | | 9.83 | |
| 9/30/2021 | | | 11.69 | | | | 0.34 | | | | 0.37 | | | | 0.71 | | | | (0.34 | ) | | | 12.06 | |
| 9/30/2020 | | | 11.80 | | | | 0.36 | | | | (0.11 | ) | | | 0.25 | | | | (0.36 | ) | | | 11.69 | |
| Class I | | | | | | | | | | | | | | | | | | | | | | | | |
| 9/30/2024 | | | 9.84 | | | | 0.40 | | | | 0.84 | | | | 1.24 | | | | (0.39 | ) | | | 10.69 | |
| 9/30/2023 | | | 9.83 | | | | 0.37 | | | | – | (d)(e) | | | 0.37 | | | | (0.36 | ) | | | 9.84 | |
| 9/30/2022 | | | 12.06 | | | | 0.32 | | | | (2.23 | ) | | | (1.91 | ) | | | (0.32 | ) | | | 9.83 | |
| 9/30/2021 | | | 11.69 | | | | 0.34 | | | | 0.36 | | | | 0.70 | | | | (0.33 | ) | | | 12.06 | |
| 9/30/2020 | | | 11.80 | | | | 0.36 | | | | (0.11 | ) | | | 0.25 | | | | (0.36 | ) | | | 11.69 | |
| | |
| (a) | Calculated using average shares outstanding during the period. |
| (b) | Total return for Classes A and C does not consider the effects of sales loads and assumes the reinvestment of all distributions. Total return for all other classes assumes the reinvestment of all distributions. |
| (c) | Interest expense, if applicable, relates to the liability for floating rate notes issued in conjunction with tender option bond trusts. |
| (d) | Realized and unrealized gain (loss) per share does not correlate to the aggregate of the net realized and unrealized gain (loss) in the Statement of Operations for the period ended September 30, 2023, primarily due to the timing of the sales and repurchases of the Fund’s shares in relation to fluctuating market values of the Fund’s portfolio. |
| (e) | Amount less than $0.01. |
| | |
| 226 | See Notes to Financial Statements. |
| | | | Ratios to Average Net Assets: | | Supplemental Data: |
Total
return
(%)(b) | | Total
expenses
after
waivers
and/or reim-
bursements
(includes
interest
expense)
(%)(c) | | Total
expenses
after
waivers
and/or reim-
bursements
(excludes
interest
expense)
(%)(c) | | Total
expenses
(%) | | Net
investment
income (loss)
(%) | | Net
assets,
end of
period
(000) | | Portfolio
turnover
rate
(%) |
| | | | | | | | | | | | | | | | | | | | |
| | 12.58 | | | | 0.78 | | | | 0.69 | | | | 0.78 | | | | 3.66 | | | $ | 2,715,060 | | | | 27 | |
| | 3.61 | | | | 0.77 | | | | 0.70 | | | | 0.77 | | | | 3.41 | | | | 2,257,591 | | | | 41 | |
| | (16.27 | ) | | | 0.71 | | | | 0.70 | | | | 0.71 | | | | 2.66 | | | | 2,235,687 | | | | 40 | |
| | 5.77 | | | | 0.70 | | | | 0.70 | | | | 0.70 | | | | 2.58 | | | | 2,925,529 | | | | 18 | |
| | 2.06 | | | | 0.71 | | | | 0.71 | | | | 0.71 | | | | 2.90 | | | | 2,504,023 | | | | 24 | |
| | | | | | | | | | | | | | | | | | | | | | | | | | | |
| | 11.89 | | | | 1.40 | | | | 1.30 | | | | 1.40 | | | | 3.05 | | | | 63,653 | | | | 27 | |
| | 2.97 | | | | 1.40 | | | | 1.33 | | | | 1.40 | | | | 2.78 | | | | 70,892 | | | | 41 | |
| | (16.86 | ) | | | 1.35 | | | | 1.34 | | | | 1.35 | | | | 2.01 | | | | 83,743 | | | | 40 | |
| | 5.16 | | | | 1.35 | | | | 1.35 | | | | 1.35 | | | | 1.94 | | | | 135,544 | | | | 18 | |
| | 1.32 | | | | 1.35 | | | | 1.35 | | | | 1.35 | | | | 2.27 | | | | 138,705 | | | | 24 | |
| | | | | | | | | | | | | | | | | | | | | | | | | | | |
| | 12.60 | | | | 0.68 | | | | 0.59 | | | | 0.68 | | | | 3.76 | | | | 68,624 | | | | 27 | |
| | 3.72 | | | | 0.67 | | | | 0.60 | | | | 0.67 | | | | 3.48 | | | | 79,394 | | | | 41 | |
| | (16.20 | ) | | | 0.61 | | | | 0.60 | | | | 0.61 | | | | 2.66 | | | | 222,942 | | | | 40 | |
| | 5.88 | | | | 0.60 | | | | 0.60 | | | | 0.60 | | | | 2.68 | | | | 984,235 | | | | 18 | |
| | 2.15 | | | | 0.61 | | | | 0.61 | | | | 0.61 | | | | 2.99 | | | | 871,094 | | | | 24 | |
| | | | | | | | | | | | | | | | | | | | | | | | | | | |
| | 12.86 | | | | 0.54 | | | | 0.45 | | | | 0.54 | | | | 3.90 | | | | 499,690 | | | | 27 | |
| | 3.75 | | | | 0.53 | | | | 0.46 | | | | 0.53 | | | | 3.65 | | | | 346,879 | | | | 41 | |
| | (16.07 | ) | | | 0.47 | | | | 0.46 | | | | 0.47 | | | | 2.91 | | | | 268,560 | | | | 40 | |
| | 6.10 | | | | 0.45 | | | | 0.45 | | | | 0.45 | | | | 2.78 | | | | 288,718 | | | | 18 | |
| | 2.19 | | | | 0.48 | | | | 0.48 | | | | 0.48 | | | | 3.10 | | | | 140,730 | | | | 24 | |
| | | | | | | | | | | | | | | | | | | | | | | | | | | |
| | 12.81 | | | | 0.58 | | | | 0.49 | | | | 0.58 | | | | 3.85 | | | | 1,412,199 | | | | 27 | |
| | 3.72 | | | | 0.57 | | | | 0.50 | | | | 0.57 | | | | 3.63 | | | | 918,301 | | | | 41 | |
| | (16.10 | ) | | | 0.52 | | | | 0.51 | | | | 0.52 | | | | 2.99 | | | | 567,725 | | | | 40 | |
| | 6.07 | | | | 0.50 | | | | 0.50 | | | | 0.50 | | | | 2.78 | | | | 209,640 | | | | 18 | |
| | 2.17 | | | | 0.51 | | | | 0.51 | | | | 0.51 | | | | 3.09 | | | | 155,620 | | | | 24 | |
| | | |
| See Notes to Financial Statements. | 227 |
Financial Highlights (continued)
HIGH INCOME MUNICIPAL BOND FUND
| | | | | | Per Share Operating Performance: | | | |
| | | | | | | | | | | | | | | | | | | |
| | | | | | Investment Operations: | | Distributions
to
shareholders
from: | | | |
| | | Net asset
value,
beginning of
period | | Net
investment
income
(loss)(a) | | Net
realized and
unrealized
gain (loss) | | Total from
investment
operations | | Net
investment
income | | Net asset
value,
end of
period |
| Class A | | | | | | | | | | | | | | | | | | | | | | | | |
| 9/30/2024 | | | $10.12 | | | | $0.49 | | | $ | 1.04 | | | $ | 1.53 | | | | $(0.48 | ) | | | $11.17 | |
| 9/30/2023 | | | 10.22 | | | | 0.45 | | | | (0.11 | ) | | | 0.34 | | | | (0.44 | ) | | | 10.12 | |
| 9/30/2022 | | | 12.91 | | | | 0.39 | | | | (2.69 | ) | | | (2.30 | ) | | | (0.39 | ) | | | 10.22 | |
| 9/30/2021 | | | 12.14 | | | | 0.41 | | | | 0.77 | | | | 1.18 | | | | (0.41 | ) | | | 12.91 | |
| 9/30/2020 | | | 12.60 | | | | 0.45 | | | | (0.47 | ) | | | (0.02 | ) | | | (0.44 | ) | | | 12.14 | |
| Class C | | | | | | | | | | | | | | | | | | | | | | | | |
| 9/30/2024 | | | 10.12 | | | | 0.42 | | | | 1.04 | | | | 1.46 | | | | (0.41 | ) | | | 11.17 | |
| 9/30/2023 | | | 10.22 | | | | 0.38 | | | | (0.11 | ) | | | 0.27 | | | | (0.37 | ) | | | 10.12 | |
| 9/30/2022 | | | 12.92 | | | | 0.31 | | | | (2.70 | ) | | | (2.39 | ) | | | (0.31 | ) | | | 10.22 | |
| 9/30/2021 | | | 12.14 | | | | 0.33 | | | | 0.78 | | | | 1.11 | | | | (0.33 | ) | | | 12.92 | |
| 9/30/2020 | | | 12.61 | | | | 0.37 | | | | (0.48 | ) | | | (0.11 | ) | | | (0.36 | ) | | | 12.14 | |
| Class F | | | | | | | | | | | | | | | | | | | | | | | | |
| 9/30/2024 | | | 10.13 | | | | 0.50 | | | | 1.04 | | | | 1.54 | | | | (0.49 | ) | | | 11.18 | |
| 9/30/2023 | | | 10.23 | | | | 0.45 | | | | (0.10 | ) | | | 0.35 | | | | (0.45 | ) | | | 10.13 | |
| 9/30/2022 | | | 12.92 | | | | 0.40 | | | | (2.69 | ) | | | (2.29 | ) | | | (0.40 | ) | | | 10.23 | |
| 9/30/2021 | | | 12.15 | | | | 0.42 | | | | 0.77 | | | | 1.19 | | | | (0.42 | ) | | | 12.92 | |
| 9/30/2020 | | | 12.61 | | | | 0.46 | | | | (0.47 | ) | | | (0.01 | ) | | | (0.45 | ) | | | 12.15 | |
| Class F3 | | | | | | | | | | | | | | | | | | | | | | | | |
| 9/30/2024 | | | 10.10 | | | | 0.52 | | | | 1.03 | | | | 1.55 | | | | (0.50 | ) | | | 11.15 | |
| 9/30/2023 | | | 10.20 | | | | 0.47 | | | | (0.11 | ) | | | 0.36 | | | | (0.46 | ) | | | 10.10 | |
| 9/30/2022 | | | 12.89 | | | | 0.42 | | | | (2.70 | ) | | | (2.28 | ) | | | (0.41 | ) | | | 10.20 | |
| 9/30/2021 | | | 12.12 | | | | 0.44 | | | | 0.77 | | | | 1.21 | | | | (0.44 | ) | | | 12.89 | |
| 9/30/2020 | | | 12.58 | | | | 0.47 | | | | (0.46 | ) | | | 0.01 | | | | (0.47 | ) | | | 12.12 | |
| Class I | | | | | | | | | | | | | | | | | | | | | | | | |
| 9/30/2024 | | | 10.10 | | | | 0.51 | | | | 1.04 | | | | 1.55 | | | | (0.50 | ) | | | 11.15 | |
| 9/30/2023 | | | 10.20 | | | | 0.47 | | | | (0.11 | ) | | | 0.36 | | | | (0.46 | ) | | | 10.10 | |
| 9/30/2022 | | | 12.89 | | | | 0.42 | | | | (2.70 | ) | | | (2.28 | ) | | | (0.41 | ) | | | 10.20 | |
| 9/30/2021 | | | 12.12 | | | | 0.44 | | | | 0.76 | | | | 1.20 | | | | (0.43 | ) | | | 12.89 | |
| 9/30/2020 | | | 12.58 | | | | 0.47 | | | | (0.47 | ) | | | – | (d) | | | (0.46 | ) | | | 12.12 | |
| | |
| (a) | Calculated using average shares outstanding during the period. |
| (b) | Total return for Classes A and C does not consider the effects of sales loads and assumes the reinvestment of all distributions. Total return for all other classes assumes the reinvestment of all distributions. |
| (c) | Interest expense, if applicable, relates to the liability for floating rate notes issued in conjunction with tender option bond trusts. |
| (d) | Amount less than $0.01. |
| 228 | See Notes to Financial Statements. |
| | | | Ratios to Average Net Assets: | | Supplemental Data: |
Total
return
(%)(b) | | Total
expenses
after
waivers
and/or reim- bursements
(includes
interest
expense)
(%)(c) | | Total
expenses
after
waivers
and/or reim-
bursements
(excludes
interest
expense)
(%)(c) | | Total
expenses
(%) | | Net
investment
income (loss)
(%) | | Net
assets,
end of
period
(000) | | Portfolio
turnover
rate
(%) |
| | | | | | | | | | | | | | | | | | | | | | | | | | | |
| | 15.38 | | | | 0.82 | | | | 0.76 | | | | 0.82 | | | | 4.56 | | | $ | 2,025,711 | | | | 27 | |
| | 3.23 | | | | 0.81 | | | | 0.77 | | | | 0.81 | | | | 4.26 | | | | 1,680,507 | | | | 42 | |
| | (18.19 | ) | | | 0.77 | | | | 0.77 | | | | 0.77 | | | | 3.28 | | | | 1,787,225 | | | | 40 | |
| | 9.81 | | | | 0.75 | | | | 0.75 | | | | 0.75 | | | | 3.23 | | | | 2,388,758 | | | | 15 | |
| | (0.09 | ) | | | 0.77 | | | | 0.77 | | | | 0.77 | | | | 3.69 | | | | 1,822,069 | | | | 43 | |
| | | | | | | | | | | | | | | | | | | | | | | | | | | |
| | 14.68 | | | | 1.43 | | | | 1.37 | | | | 1.43 | | | | 3.96 | | | | 127,062 | | | | 27 | |
| | 2.58 | | | | 1.44 | | | | 1.40 | | | | 1.44 | | | | 3.63 | | | | 141,950 | | | | 42 | |
| | (18.78 | ) | | | 1.41 | | | | 1.41 | | | | 1.41 | | | | 2.63 | | | | 174,127 | | | | 40 | |
| | 9.19 | | | | 1.40 | | | | 1.40 | | | | 1.40 | | | | 2.60 | | | | 267,871 | | | | 15 | |
| | (0.81 | ) | | | 1.42 | | | | 1.42 | | | | 1.42 | | | | 3.06 | | | | 242,392 | | | | 43 | |
| | | | | | | | | | | | | | | | | | | | | | | | | | | |
| | 15.48 | | | | 0.72 | | | | 0.66 | | | | 0.72 | | | | 4.68 | | | | 85,597 | | | | 27 | |
| | 3.33 | | | | 0.71 | | | | 0.67 | | | | 0.71 | | | | 4.31 | | | | 112,452 | | | | 42 | |
| | (18.09 | ) | | | 0.66 | | | | 0.66 | | | | 0.66 | | | | 3.27 | | | | 369,471 | | | | 40 | |
| | 9.90 | | | | 0.65 | | | | 0.65 | | | | 0.65 | | | | 3.30 | | | | 1,450,736 | | | | 15 | |
| | 0.00 | | | | 0.67 | | | | 0.67 | | | | 0.67 | | | | 3.78 | | | | 861,795 | | | | 43 | |
| | | | | | | | | | | | | | | | | | | | | | | | | | | |
| | 15.69 | | | | 0.56 | | | | 0.51 | | | | 0.56 | | | | 4.81 | | | | 166,070 | | | | 27 | |
| | 3.48 | | | | 0.57 | | | | 0.53 | | | | 0.57 | | | | 4.50 | | | | 122,429 | | | | 42 | |
| | (18.01 | ) | | | 0.51 | | | | 0.51 | | | | 0.51 | | | | 3.55 | | | | 114,134 | | | | 40 | |
| | 10.07 | | | | 0.52 | | | | 0.51 | | | | 0.51 | | | | 3.42 | | | | 118,100 | | | | 15 | |
| | 0.14 | | | | 0.53 | | | | 0.53 | | | | 0.53 | | | | 3.92 | | | | 55,503 | | | | 43 | |
| | | | | | | | | | | | | | | | | | | | | | | | | | | |
| | 15.63 | | | | 0.62 | | | | 0.56 | | | | 0.62 | | | | 4.75 | | | | 1,694,273 | | | | 27 | |
| | 3.43 | | | | 0.61 | | | | 0.57 | | | | 0.61 | | | | 4.46 | | | | 1,227,801 | | | | 42 | |
| | (18.06 | ) | | | 0.57 | | | | 0.57 | | | | 0.57 | | | | 3.59 | | | | 961,328 | | | | 40 | |
| | 10.03 | | | | 0.56 | | | | 0.55 | | | | 0.55 | | | | 3.41 | | | | 487,688 | | | | 15 | |
| | 0.09 | | | | 0.57 | | | | 0.57 | | | | 0.57 | | | | 3.88 | | | | 301,236 | | | | 43 | |
| | | |
| | See Notes to Financial Statements. | 229 |
Financial Highlights (continued)
SHORT DURATION HIGH INCOME MUNICIPAL BOND FUND
| | | | | | Per Share Operating Performance: | | | |
| | | | | | Investment Operations: | | Distributions
to
shareholders
from: | | | |
| | | Net asset
value,
beginning of
period | | Net
investment
income
(loss)(a) | | Net
realized and
unrealized
gain (loss) | | Total from
investment
operations | | Net
investment
income | | Net asset
value,
end of
period |
| Class A | | | | | | | | | | | | | | | | | | | | | | | | |
| 9/30/2024 | | | $13.79 | | | | $0.59 | | | | $0.59 | | | $ | 1.18 | | | | $(0.56 | ) | | | $14.41 | |
| 9/30/2023 | | | 13.84 | | | | 0.53 | | | | (0.08 | ) | | | 0.45 | | | | (0.50 | ) | | | 13.79 | |
| 9/30/2022 | | | 15.88 | | | | 0.34 | | | | (2.05 | ) | | | (1.71 | ) | | | (0.33 | ) | | | 13.84 | |
| 9/30/2021 | | | 15.20 | | | | 0.33 | | | | 0.69 | | | | 1.02 | | | | (0.34 | ) | | | 15.88 | |
| 9/30/2020 | | | 15.64 | | | | 0.43 | | | | (0.45 | ) | | | (0.02 | ) | | | (0.42 | ) | | | 15.20 | |
| Class C | | | | | | | | | | | | | | | | | | | | | | | | |
| 9/30/2024 | | | 13.79 | | | | 0.50 | | | | 0.60 | | | | 1.10 | | | | (0.48 | ) | | | 14.41 | |
| 9/30/2023 | | | 13.84 | | | | 0.43 | | | | (0.07 | ) | | | 0.36 | | | | (0.41 | ) | | | 13.79 | |
| 9/30/2022 | | | 15.88 | | | | 0.23 | | | | (2.04 | ) | | | (1.81 | ) | | | (0.23 | ) | | | 13.84 | |
| 9/30/2021 | | | 15.20 | | | | 0.23 | | | | 0.68 | | | | 0.91 | | | | (0.23 | ) | | | 15.88 | |
| 9/30/2020 | | | 15.65 | | | | 0.33 | | | | (0.46 | ) | | | (0.13 | ) | | | (0.32 | ) | | | 15.20 | |
| Class F | | | | | | | | | | | | | | | | | | | | | | | | |
| 9/30/2024 | | | 13.79 | | | | 0.60 | | | | 0.60 | | | | 1.20 | | | | (0.58 | ) | | | 14.41 | |
| 9/30/2023 | | | 13.84 | | | | 0.52 | | | | (0.05 | ) | | | 0.47 | | | | (0.52 | ) | | | 13.79 | |
| 9/30/2022 | | | 15.88 | | | | 0.33 | | | | (2.02 | ) | | | (1.69 | ) | | | (0.35 | ) | | | 13.84 | |
| 9/30/2021 | | | 15.20 | | | | 0.34 | | | | 0.69 | | | | 1.03 | | | | (0.35 | ) | | | 15.88 | |
| 9/30/2020 | | | 15.64 | | | | 0.45 | | | | (0.46 | ) | | | (0.01 | ) | | | (0.43 | ) | | | 15.20 | |
| Class F3 | | | | | | | | | | | | | | | | | | | | | | | | |
| 9/30/2024 | | | 13.79 | | | | 0.62 | | | | 0.60 | | | | 1.22 | | | | (0.60 | ) | | | 14.41 | |
| 9/30/2023 | | | 13.84 | | | | 0.57 | | | | (0.08 | ) | | | 0.49 | | | | (0.54 | ) | | | 13.79 | |
| 9/30/2022 | | | 15.88 | | | | 0.38 | | | | (2.05 | ) | | | (1.67 | ) | | | (0.37 | ) | | | 13.84 | |
| 9/30/2021 | | | 15.20 | | �� | | 0.37 | | | | 0.69 | | | | 1.06 | | | | (0.38 | ) | | | 15.88 | |
| 9/30/2020 | | | 15.65 | | | | 0.47 | | | | (0.46 | ) | | | 0.01 | | | | (0.46 | ) | | | 15.20 | |
| Class I | | | | | | | | | | | | | | | | | | | | | | | | |
| 9/30/2024 | | | 13.79 | | | | 0.61 | | | | 0.60 | | | | 1.21 | | | | (0.59 | ) | | | 14.41 | |
| 9/30/2023 | | | 13.84 | | | | 0.56 | | | | (0.08 | ) | | | 0.48 | | | | (0.53 | ) | | | 13.79 | |
| 9/30/2022 | | | 15.88 | | | | 0.38 | | | | (2.06 | ) | | | (1.68 | ) | | | (0.36 | ) | | | 13.84 | |
| 9/30/2021 | | | 15.20 | | | | 0.36 | | | | 0.69 | | | | 1.05 | | | | (0.37 | ) | | | 15.88 | |
| 9/30/2020 | | | 15.65 | | | | 0.46 | | | | (0.46 | ) | | | – | | | | (0.45 | ) | | | 15.20 | |
| | |
| (a) | Calculated using average shares outstanding during the period. |
| (b) | Total return for Classes A and C does not consider the effects of sales loads and assumes the reinvestment of all distributions. Total return for all other classes assumes the reinvestment of all distributions. |
| | |
| 230 | See Notes to Financial Statements. |
| | | | Ratios to Average Net Assets: | | Supplemental Data: |
| | | | | | | | | | | | | | | | | |
Total
return
(%)(b) | | Total
expenses
after
waivers
and/or reim-
bursements
(%) | | Total
expenses
(%) | | Net
investment
income (loss)
(%) | | Net
assets,
end of
period
(000) | | Portfolio
turnover
rate
(%) |
| | | | | | | | | | | | | | | | | | | | | | |
| | 8.74 | | | | 0.65 | | | | 0.68 | | | | 4.15 | | | | $409,918 | | | | 38 | |
| | 3.27 | | | | 0.66 | | | | 0.71 | | | | 3.73 | | | | 261,115 | | | | 71 | |
| | (10.85 | ) | | | 0.70 | | | | 0.77 | | | | 2.27 | | | | 325,756 | | | | 81 | |
| | 6.74 | | | | 0.69 | | | | 0.75 | | | | 2.09 | | | | 409,286 | | | | 14 | |
| | (0.12 | ) | | | 0.62 | | | | 0.78 | | | | 2.83 | | | | 176,351 | | | | 61 | |
| | | | | | | | | | | | | | | | | | | | | | | |
| | 8.08 | | | | 1.26 | | | | 1.29 | | | | 3.55 | | | | 21,802 | | | | 38 | |
| | 2.59 | | | | 1.32 | | | | 1.37 | | | | 3.08 | | | | 19,626 | | | | 71 | |
| | (11.48 | ) | | | 1.40 | | | | 1.47 | | | | 1.56 | | | | 21,392 | | | | 81 | |
| | 6.03 | | | | 1.36 | | | | 1.43 | | | | 1.43 | | | | 26,412 | | | | 14 | |
| | (0.85 | ) | | | 1.28 | | | | 1.45 | | | | 2.18 | | | | 12,758 | | | | 61 | |
| | | | | | | | | | | | | | | | | | | | | | | |
| | 8.85 | | | | 0.55 | | | | 0.58 | | | | 4.26 | | | | 12,342 | | | | 38 | |
| | 3.36 | | | | 0.57 | | | | 0.62 | | | | 3.72 | | | | 17,573 | | | | 71 | |
| | (10.77 | ) | | | 0.60 | | | | 0.66 | | | | 2.18 | | | | 139,299 | | | | 81 | |
| | 6.84 | | | | 0.59 | | | | 0.65 | | | | 2.17 | | | | 495,439 | | | | 14 | |
| | (0.03 | ) | | | 0.52 | | | | 0.68 | | | | 2.92 | | | | 171,092 | | | | 61 | |
| | | | | | | | | | | | | | | | | | | | | | | |
| | 9.03 | | | | 0.39 | | | | 0.42 | | | | 4.41 | | | | 50,999 | | | | 38 | |
| | 3.55 | | | | 0.38 | | | | 0.45 | | | | 4.03 | | | | 35,447 | | | | 71 | |
| | (10.62 | ) | | | 0.44 | | | | 0.50 | | | | 2.56 | | | | 28,251 | | | | 81 | |
| | 7.02 | | | | 0.43 | | | | 0.49 | | | | 2.31 | | | | 31,122 | | | | 14 | |
| | 0.07 | | | | 0.36 | | | | 0.52 | | | | 3.10 | | | | 8,538 | | | | 61 | |
| | | | | | | | | | | | | | | | | | | | | | | |
| | 8.96 | | | | 0.45 | | | | 0.48 | | | | 4.35 | | | | 1,026,063 | | | | 38 | |
| | 3.40 | | | | 0.46 | | | | 0.50 | | | | 3.97 | | | | 566,518 | | | | 71 | |
| | (10.61 | ) | | | 0.50 | | | | 0.58 | | | | 2.59 | | | | 362,870 | | | | 81 | |
| | 6.95 | | | | 0.50 | | | | 0.55 | | | | 2.28 | | | | 244,728 | | | | 14 | |
| | 0.01 | | | | 0.42 | | | | 0.59 | | | | 3.03 | | | | 93,013 | | | | 61 | |
| | | |
| | See Notes to Financial Statements. | 231 |
Financial Highlights (continued)
SUSTAINABLE MUNICIPAL BOND FUND
| | | | | | | Per Share Operating Performance: | | | | |
| | | | | | | Investment Operations: | | Distributions
to
shareholders
from: | | | | |
| | | Net asset
value,
beginning of
period | | Net
investment
income
(loss)(a) | | Net
realized and
unrealized
gain (loss) | | Total from
investment
operations | | Net
investment
income | | Net asset
value,
end of
period |
| Class A | | | | | | | | | | | | | | | | | | | | | | | | |
| 9/30/2024 | | | $8.86 | | | | $0.30 | | | | $0.51 | | | | $0.81 | | | | $(0.29 | ) | | | $9.38 | |
| 9/30/2023 | | | 8.79 | | | | 0.25 | | | | 0.07 | | | | 0.32 | | | | (0.25 | ) | | | 8.86 | |
| 1/5/2022 to 9/30/2022(c) | | | 10.00 | | | | 0.10 | | | | (1.21 | ) | | | (1.11 | ) | | | (0.10 | ) | | | 8.79 | |
| Class C | | | | | | | | | | | | | | | | | | | | | | | | |
| 9/30/2024 | | | 8.86 | | | | 0.24 | | | | 0.51 | | | | 0.75 | | | | (0.23 | ) | | | 9.38 | |
| 9/30/2023 | | | 8.79 | | | | 0.18 | | | | 0.07 | | | | 0.25 | | | | (0.18 | ) | | | 8.86 | |
| 1/5/2022 to 9/30/2022(c) | | | 10.00 | | | | 0.05 | | | | (1.21 | ) | | | (1.16 | ) | | | (0.05 | ) | | | 8.79 | |
| Class F | | | | | | | | | | | | | | | | | | | | | | | | |
| 9/30/2024 | | | 8.86 | | | | 0.31 | | | | 0.51 | | | | 0.82 | | | | (0.30 | ) | | | 9.38 | |
| 9/30/2023 | | | 8.79 | | | | 0.26 | | | | 0.07 | | | | 0.33 | | | | (0.26 | ) | | | 8.86 | |
| 1/5/2022 to 9/30/2022(c) | | | 10.00 | | | | 0.11 | | | | (1.21 | ) | | | (1.10 | ) | | | (0.11 | ) | | | 8.79 | |
| Class F3 | | | | | | | | | | | | | | | | | | | | | | | | |
| 9/30/2024 | | | 8.86 | | | | 0.32 | | | | 0.52 | | | | 0.84 | | | | (0.32 | ) | | | 9.38 | |
| 9/30/2023 | | | 8.79 | | | | 0.27 | | | | 0.07 | | | | 0.34 | | | | (0.27 | ) | | | 8.86 | |
| 1/5/2022 to 9/30/2022(c) | | | 10.00 | | | | 0.12 | | | | (1.21 | ) | | | (1.09 | ) | | | (0.12 | ) | | | 8.79 | |
| Class I | | | | | | | | | | | | | | | | | | | | | | | | |
| 9/30/2024 | | | 8.86 | | | | 0.32 | | | | 0.51 | | | | 0.83 | | | | (0.31 | ) | | | 9.38 | |
| 9/30/2023 | | | 8.79 | | | | 0.27 | | | | 0.06 | | | | 0.33 | | | | (0.26 | ) | | | 8.86 | |
| 1/5/2022 to 9/30/2022(c) | | | 10.00 | | | | 0.12 | | | | (1.21 | ) | | | (1.09 | ) | | | (0.12 | ) | | | 8.79 | |
| | |
| (a) | Calculated using average shares outstanding during the period. |
| (b) | Total return for Classes A and C does not consider the effects of sales loads and assumes the reinvestment of all distributions. Total return for all other classes assumes the reinvestment of all distributions. |
| (c) | Commenced on January 5, 2022. |
| (d) | Not annualized. |
| (e) | Annualized. |
| | |
| 232 | See Notes to Financial Statements. |
| | | | Ratios to Average Net Assets: | | Supplemental Data: |
| | | | | | | | | | | | | | | | | |
Total
return
(%)(b) | | Total
expenses
after
waivers
and/or reim-
bursements
(%) | | Total
expenses
(%) | | Net
investment
income (loss)
(%) | | Net
assets,
end of
period
(000) | | Portfolio
turnover
rate
(%) |
| | | | | | | | | | | | | | | | | | | | | | | |
| | 9.30 | | | | 0.63 | | | | 3.12 | | | | 3.23 | | | | $3,250 | | | | 48 | |
| | 3.57 | | | | 0.63 | | | | 2.92 | | | | 2.74 | | | | 2,910 | | | | 58 | |
| | (11.11 | )(d) | | | 0.63 | (e) | | | 2.16 | (e) | | | 1.48 | (e) | | | 2,682 | | | | 90 | (d) |
| | | | | | | | | | | | | | | | | | | | | | | |
| | 8.60 | | | | 1.27 | | | | 3.75 | | | | 2.58 | | | | 156 | | | | 48 | |
| | 2.77 | | | | 1.41 | | | | 3.86 | | | | 2.01 | | | | 169 | | | | 58 | |
| | (11.64 | )(d) | | | 1.43 | (e) | | | 2.96 | (e) | | | 0.68 | (e) | | | 66 | | | | 90 | (d) |
| | | | | | | | | | | | | | | | | | | | | | | |
| | 9.41 | | | | 0.53 | | | | 3.02 | | | | 3.33 | | | | 70 | | | | 48 | |
| | 3.67 | | | | 0.53 | | | | 2.80 | | | | 2.84 | | | | 66 | | | | 58 | |
| | (11.05 | )(d) | | | 0.53 | (e) | | | 2.06 | (e) | | | 1.58 | (e) | | | 66 | | | | 90 | (d) |
| | | | | | | | | | | | | | | | | | | | | | | |
| | 9.56 | | | | 0.40 | | | | 2.92 | | | | 3.46 | | | | 94 | | | | 48 | |
| | 3.82 | | | | 0.39 | | | | 2.67 | | | | 2.97 | | | | 89 | | | | 58 | |
| | (10.95 | )(d) | | | 0.39 | (e) | | | 1.91 | (e) | | | 1.72 | (e) | | | 88 | | | | 90 | (d) |
| | | | | | | | | | | | | | | | | | | | | | | |
| | 9.52 | | | | 0.43 | | | | 2.92 | | | | 3.43 | | | | 2,119 | | | | 48 | |
| | 3.78 | | | | 0.43 | | | | 2.74 | | | | 2.95 | | | | 1,917 | | | | 58 | |
| | (10.98 | )(d) | | | 0.43 | (e) | | | 1.96 | (e) | | | 1.68 | (e) | | | 1,638 | | | | 90 | (d) |
| | | |
| | See Notes to Financial Statements. | 233 |
Financial Highlights (continued)
CALIFORNIA TAX FREE FUND
| | | | | Per Share Operating Performance: | | |
| | | | | | | | | |
| | | | | Investment Operations: | | Distributions
to
shareholders
from: | | |
| | | Net asset
value,
beginning of
period | | Net
investment
income
(loss)(a) | | Net
realized and
unrealized
gain (loss) | | Total from
investment
operations | | Net
investment
income | | Net asset
value,
end of
period |
| Class A | | | | | | | | | | | | | | | | | | | | | | | | |
| 9/30/2024 | | $ | 9.55 | | | | $0.34 | | | $ | 0.77 | | | $ | 1.11 | | | | $(0.33 | ) | | $ | 10.33 | |
| 9/30/2023 | | | 9.50 | | | | 0.31 | | | | 0.04 | | | | 0.35 | | | | (0.30 | ) | | | 9.55 | |
| 9/30/2022 | | | 11.61 | | | | 0.26 | | | | (2.11 | ) | | | (1.85 | ) | | | (0.26 | ) | | | 9.50 | |
| 9/30/2021 | | | 11.40 | | | | 0.26 | | | | 0.21 | | | | 0.47 | | | | (0.26 | ) | | | 11.61 | |
| 9/30/2020 | | | 11.42 | | | | 0.29 | | | | (0.03 | ) | | | 0.26 | | | | (0.28 | ) | | | 11.40 | |
| Class C | | | | | | | | | | | | | | | | | | | | | | | | |
| 9/30/2024 | | | 9.56 | | | | 0.28 | | | | 0.77 | | | | 1.05 | | | | (0.27 | ) | | | 10.34 | |
| 9/30/2023 | | | 9.51 | | | | 0.24 | | | | 0.05 | | | | 0.29 | | | | (0.24 | ) | | | 9.56 | |
| 9/30/2022 | | | 11.62 | | | | 0.19 | | | | (2.11 | ) | | | (1.92 | ) | | | (0.19 | ) | | | 9.51 | |
| 9/30/2021 | | | 11.41 | | | | 0.19 | | | | 0.21 | | | | 0.40 | | | | (0.19 | ) | | | 11.62 | |
| 9/30/2020 | | | 11.42 | | | | 0.21 | | | | (0.01 | ) | | | 0.20 | | | | (0.21 | ) | | | 11.41 | |
| Class F | | | | | | | | | | | | | | | | | | | | | | | | |
| 9/30/2024 | | | 9.55 | | | | 0.35 | | | | 0.77 | | | | 1.12 | | | | (0.34 | ) | | | 10.33 | |
| 9/30/2023 | | | 9.50 | | | | 0.31 | | | | 0.05 | | | | 0.36 | | | | (0.31 | ) | | | 9.55 | |
| 9/30/2022 | | | 11.61 | | | | 0.26 | | | | (2.10 | ) | | | (1.84 | ) | | | (0.27 | ) | | | 9.50 | |
| 9/30/2021 | | | 11.40 | | | | 0.28 | | | | 0.20 | | | | 0.48 | | | | (0.27 | ) | | | 11.61 | |
| 9/30/2020 | | | 11.42 | | | | 0.30 | | | | (0.02 | ) | | | 0.28 | | | | (0.30 | ) | | | 11.40 | |
| Class F3 | | | | | | | | | | | | | | | | | | | | | | | | |
| 9/30/2024 | | | 9.55 | | | | 0.36 | | | | 0.77 | | | | 1.13 | | | | (0.35 | ) | | | 10.33 | |
| 9/30/2023 | | | 9.50 | | | | 0.33 | | | | 0.04 | | | | 0.37 | | | | (0.32 | ) | | | 9.55 | |
| 9/30/2022 | | | 11.61 | | | | 0.28 | | | | (2.11 | ) | | | (1.83 | ) | | | (0.28 | ) | | | 9.50 | |
| 9/30/2021 | | | 11.40 | | | | 0.29 | | | | 0.21 | | | | 0.50 | | | | (0.29 | ) | | | 11.61 | |
| 9/30/2020 | | | 11.41 | | | | 0.31 | | | | (0.01 | ) | | | 0.30 | | | | (0.31 | ) | | | 11.40 | |
| Class I | | | | | | | | | | | | | | | | | | | | | | | | |
| 9/30/2024 | | | 9.54 | | | | 0.36 | | | | 0.77 | | | | 1.13 | | | | (0.35 | ) | | | 10.32 | |
| 9/30/2023 | | | 9.50 | | | | 0.33 | | | | 0.03 | | | | 0.36 | | | | (0.32 | ) | | | 9.54 | |
| 9/30/2022 | | | 11.61 | | | | 0.28 | | | | (2.11 | ) | | | (1.83 | ) | | | (0.28 | ) | | | 9.50 | |
| 9/30/2021 | | | 11.40 | | | | 0.29 | | | | 0.21 | | | | 0.50 | | | | (0.29 | ) | | | 11.61 | |
| 9/30/2020 | | | 11.41 | | | | 0.31 | | | | (0.01 | ) | | | 0.30 | | | | (0.31 | ) | | | 11.40 | |
| (a) | Calculated using average shares outstanding during the period. |
| (b) | Total return for Classes A and C does not consider the effects of sales loads and assumes the reinvestment of all distributions. Total return for all other classes assumes the reinvestment of all distributions. |
| (c) | Interest expense, if applicable, relates to the liability for floating rate notes issued in conjunction with tender option bond trusts. |
| 234 | See Notes to Financial Statements. |
| | | Ratios to Average Net Assets: | | Supplemental Data: |
Total
return
(%)(b) | | Total
expenses
after
waivers
and/or reim-
bursements
(includes
interest
expense)
(%)(c) | | Total
expenses
after
waivers
and/or reim-
bursements
(excludes
interest
expense)
(%)(c) | | Total
expenses
(%) | | Net
investment
income (loss)
(%) | | Net
assets,
end of
period
(000) | | Portfolio
turnover
rate
(%) |
| | | | | | | | | | | | | | | | | | | | | | | | | | | |
| | 11.78 | | | | 0.77 | | | | 0.77 | | | | 0.77 | | | | 3.36 | | | $ | 422,861 | | | | 26 | |
| | 3.50 | | | | 0.76 | | | | 0.76 | | | | 0.76 | | | | 3.08 | | | | 341,314 | | | | 57 | |
| | (16.10 | ) | | | 0.77 | | | | 0.77 | | | | 0.77 | | | | 2.39 | | | | 303,455 | | | | 44 | |
| | 4.16 | | | | 0.77 | | | | 0.77 | | | | 0.77 | | | | 2.27 | | | | 381,200 | | | | 14 | |
| | 2.36 | | | | 0.78 | | | | 0.78 | | | | 0.78 | | | | 2.53 | | | | 342,426 | | | | 18 | |
| | | | | | | | | | | | | | | | | | | | | | | | | | | |
| | 11.10 | | | | 1.37 | | | | 1.37 | | | | 1.37 | | | | 2.76 | | | | 18,313 | | | | 26 | |
| | 2.97 | | | | 1.38 | | | | 1.39 | | | | 1.38 | | | | 2.45 | | | | 18,912 | | | | 57 | |
| | (16.70 | ) | | | 1.40 | | | | 1.40 | | | | 1.40 | | | | 1.75 | | | | 21,221 | | | | 44 | |
| | 3.49 | | | | 1.41 | | | | 1.41 | | | | 1.41 | | | | 1.63 | | | | 33,274 | | | | 14 | |
| | 1.78 | | | | 1.44 | | | | 1.44 | | | | 1.44 | | | | 1.88 | | | | 37,078 | | | | 18 | |
| | | | | | | | | | | | | | | | | | | | | | | | | | | |
| | 11.89 | | | | 0.67 | | | | 0.67 | | | | 0.67 | | | | 3.45 | | | | 12,612 | | | | 26 | |
| | 3.61 | | | | 0.66 | | | | 0.67 | | | | 0.66 | | | | 3.13 | | | | 7,929 | | | | 57 | |
| | (16.02 | ) | | | 0.67 | | | | 0.67 | | | | 0.67 | | | | 2.37 | | | | 20,964 | | | | 44 | |
| | 4.26 | | | | 0.67 | | | | 0.67 | | | | 0.67 | | | | 2.36 | | | | 130,104 | | | | 14 | |
| | 2.46 | | | | 0.68 | | | | 0.68 | | | | 0.68 | | | | 2.61 | | | | 112,378 | | | | 18 | |
| | | | | | | | | | | | | | | | | | | | | | | | | | | |
| | 12.04 | | | | 0.54 | | | | 0.54 | | | | 0.54 | | | | 3.59 | | | | 59,192 | | | | 26 | |
| | 3.84 | | | | 0.54 | | | | 0.54 | | | | 0.54 | | | | 3.31 | | | | 45,077 | | | | 57 | |
| | (16.00 | ) | | | 0.54 | | | | 0.54 | | | | 0.54 | | | | 2.64 | | | | 29,694 | | | | 44 | |
| | 4.39 | | | | 0.54 | | | | 0.54 | | | | 0.54 | | | | 2.48 | | | | 20,625 | | | | 14 | |
| | 2.67 | | | | 0.56 | | | | 0.56 | | | | 0.56 | | | | 2.73 | | | | 13,170 | | | | 18 | |
| | | | | | | | | | | | | | | | | | | | | | | | | | | |
| | 12.01 | | | | 0.57 | | | | 0.57 | | | | 0.57 | | | | 3.55 | | | | 154,644 | | | | 26 | |
| | 3.71 | | | | 0.56 | | | | 0.56 | | | | 0.56 | | | | 3.29 | | | | 102,638 | | | | 57 | |
| | (16.02 | ) | | | 0.58 | | | | 0.57 | | | | 0.58 | | | | 2.69 | | | | 78,796 | | | | 44 | |
| | 4.37 | | | | 0.57 | | | | 0.57 | | | | 0.57 | | | | 2.46 | | | | 39,117 | | | | 14 | |
| | 2.65 | | | | 0.58 | | | | 0.58 | | | | 0.58 | | | | 2.73 | | | | 30,880 | | | | 18 | |
| | See Notes to Financial Statements. | 235 |
Financial Highlights (continued)
NEW JERSEY TAX FREE FUND
| | | | | Per Share Operating Performance: | | |
| | | | | Investment Operations: | | Distributions
to
shareholders
from: | | |
| | | Net asset
value,
beginning of
period | | Net
investment
income
(loss)(a) | | Net
realized and
unrealized
gain (loss) | | Total from
investment
operations | | Net
investment
income | | Net asset
value,
end of
period |
| Class A | | | | | | | | | | | | | | | | | | | | | | | | |
| 9/30/2024 | | | $4.47 | | | | $0.14 | | | $ | 0.35 | | | $ | 0.49 | | | | $(0.14 | ) | | | $4.82 | |
| 9/30/2023 | | | 4.42 | | | | 0.13 | | | | 0.05 | | | | 0.18 | | | | (0.13 | ) | | | 4.47 | |
| 9/30/2022 | | | 5.35 | | | | 0.12 | | | | (0.93 | ) | | | (0.81 | ) | | | (0.12 | ) | | | 4.42 | |
| 9/30/2021 | | | 5.18 | | | | 0.12 | | | | 0.17 | | | | 0.29 | | | | (0.12 | ) | | | 5.35 | |
| 9/30/2020 | | | 5.21 | | | | 0.13 | | | | (0.03 | ) | | | 0.10 | | | | (0.13 | ) | | | 5.18 | |
| Class F | | | | | | | | | | | | | | | | | | | | | | | | |
| 9/30/2024 | | | 4.47 | | | | 0.15 | | | | 0.35 | | | | 0.50 | | | | (0.15 | ) | | | 4.82 | |
| 9/30/2023 | | | 4.42 | | | | 0.14 | | | | 0.05 | | | | 0.19 | | | | (0.14 | ) | | | 4.47 | |
| 9/30/2022 | | | 5.35 | | | | 0.12 | | | | (0.93 | ) | | | (0.81 | ) | | | (0.12 | ) | | | 4.42 | |
| 9/30/2021 | | | 5.18 | | | | 0.12 | | | | 0.17 | | | | 0.29 | | | | (0.12 | ) | | | 5.35 | |
| 9/30/2020 | | | 5.21 | | | | 0.13 | | | | (0.03 | ) | | | 0.10 | | | | (0.13 | ) | | | 5.18 | |
| Class F3 | | | | | | | | | | | | | | | | | | | | | | | | |
| 9/30/2024 | | | 4.48 | | | | 0.15 | | | | 0.34 | | | | 0.49 | | | | (0.15 | ) | | | 4.82 | |
| 9/30/2023 | | | 4.42 | | | | 0.15 | | | | 0.06 | | | | 0.21 | | | | (0.15 | ) | | | 4.48 | |
| 9/30/2022 | | | 5.35 | | | | 0.13 | | | | (0.93 | ) | | | (0.80 | ) | | | (0.13 | ) | | | 4.42 | |
| 9/30/2021 | | | 5.18 | | | | 0.13 | | | | 0.17 | | | | 0.30 | | | | (0.13 | ) | | | 5.35 | |
| 9/30/2020 | | | 5.22 | | | | 0.14 | | | | (0.04 | ) | | | 0.10 | | | | (0.14 | ) | | | 5.18 | |
| Class I | | | | | | | | | | | | | | | | | | | | | | | | |
| 9/30/2024 | | | 4.47 | | | | 0.15 | | | | 0.35 | | | | 0.50 | | | | (0.15 | ) | | | 4.82 | |
| 9/30/2023 | | | 4.42 | | | | 0.14 | | | | 0.05 | | | | 0.19 | | | | (0.14 | ) | | | 4.47 | |
| 9/30/2022 | | | 5.35 | | | | 0.13 | | | | (0.93 | ) | | | (0.80 | ) | | | (0.13 | ) | | | 4.42 | |
| 9/30/2021 | | | 5.18 | | | | 0.13 | | | | 0.17 | | | | 0.30 | | | | (0.13 | ) | | | 5.35 | |
| 9/30/2020 | | | 5.22 | | | | 0.14 | | | | (0.04 | ) | | | 0.10 | | | | (0.14 | ) | | | 5.18 | |
| (a) | Calculated using average shares outstanding during the period. |
| (b) | Total return for Class A does not consider the effects of sales loads and assumes the reinvestment of all distributions. Total return for all other classes assumes the reinvestment of all distributions. |
| 236 | See Notes to Financial Statements. |
| | | Ratios to Average Net Assets: | | Supplemental Data: |
| | | | | | | | | | | |
Total
return
(%)(b) | | Total
expenses
after
waivers
and/or reim-
bursements
(%) | | Total
expenses
(%) | | Net
investment
income (loss)
(%) | | Net
assets,
end of
period
(000) | | Portfolio
turnover
rate
(%) |
| | | | | | | | | | | | | | | | | | | | | | | |
| | 11.14 | | | | 0.82 | | | | 0.85 | | | | 3.04 | | | $ | 105,747 | | | | 8 | |
| | 4.11 | | | | 0.82 | | | | 0.87 | | | | 2.91 | | | | 77,950 | | | | 23 | |
| | (15.36 | ) | | | 0.82 | | | | 0.84 | | | | 2.39 | | | | 80,854 | | | | 11 | |
| | 5.58 | | | | 0.82 | | | | 0.84 | | | | 2.21 | | | | 99,356 | | | | 13 | |
| | 1.92 | | | | 0.82 | | | | 0.85 | | | | 2.48 | | | | 101,085 | | | | 15 | |
| | | | | | | | | | | | | | | | | | | | | | | |
| | 11.25 | | | | 0.72 | | | | 0.75 | | | | 3.14 | | | | 2,998 | | | | 8 | |
| | 4.21 | | | | 0.72 | | | | 0.77 | | | | 3.00 | | | | 3,693 | | | | 23 | |
| | (15.28 | ) | | | 0.72 | | | | 0.74 | | | | 2.40 | | | | 5,885 | | | | 11 | |
| | 5.68 | | | | 0.72 | | | | 0.74 | | | | 2.30 | | | | 28,097 | | | | 13 | |
| | 2.02 | | | | 0.72 | | | | 0.75 | | | | 2.58 | | | | 23,903 | | | | 15 | |
| | | | | | | | | | | | | | | | | | | | | | | |
| | 11.15 | | | | 0.59 | | | | 0.62 | | | | 3.27 | | | | 2,731 | | | | 8 | |
| | 4.59 | | | | 0.58 | | | | 0.63 | | | | 3.15 | | | | 1,697 | | | | 23 | |
| | (15.16 | ) | | | 0.58 | | | | 0.60 | | | | 2.65 | | | | 1,342 | | | | 11 | |
| | 5.82 | | | | 0.59 | | | | 0.60 | | | | 2.40 | | | | 1,148 | | | | 13 | |
| | 1.96 | | | | 0.59 | | | | 0.62 | | | | 2.71 | | | | 618 | | | | 15 | |
| | | | | | | | | | | | | | | | | | | | | | | |
| | 11.36 | | | | 0.62 | | | | 0.65 | | | | 3.24 | | | | 28,895 | | | | 8 | |
| | 4.32 | | | | 0.62 | | | | 0.66 | | | | 3.11 | | | | 17,943 | | | | 23 | |
| | (15.19 | ) | | | 0.62 | | | | 0.65 | | | | 2.68 | | | | 13,415 | | | | 11 | |
| | 5.79 | | | | 0.62 | | | | 0.64 | | | | 2.38 | | | | 6,905 | | | | 13 | |
| | 1.93 | | | | 0.62 | | | | 0.65 | | | | 2.68 | | | | 3,746 | | | | 15 | |
| | See Notes to Financial Statements. | 237 |
Financial Highlights (concluded)
NEW YORK TAX FREE FUND
| | | | | Per Share Operating Performance: | | |
| | | | | Investment Operations: | | Distributions
to
shareholders
from: | | |
| | | Net asset
value,
beginning of
period | | Net
investment
income
(loss)(a) | | Net
realized and
unrealized
gain (loss) | | Total from
investment
operations | | Net
investment
income | | Net asset
value,
end of
period |
| Class A | | | | | | | | | | | | | | | | | | | | | | | | |
| 9/30/2024 | | $ | 9.99 | | | | $0.34 | | | $ | 0.84 | | | $ | 1.18 | | | | $(0.33 | ) | | $ | 10.84 | |
| 9/30/2023 | | | 9.90 | | | | 0.31 | | | | 0.09 | | | | 0.40 | | | | (0.31 | ) | | | 9.99 | |
| 9/30/2022 | | | 12.06 | | | | 0.27 | | | | (2.16 | ) | | | (1.89 | ) | | | (0.27 | ) | | | 9.90 | |
| 9/30/2021 | | | 11.64 | | | | 0.27 | | | | 0.41 | | | | 0.68 | | | | (0.26 | ) | | | 12.06 | |
| 9/30/2020 | | | 11.77 | | | | 0.27 | | | | (0.13 | ) | | | 0.14 | | | | (0.27 | ) | | | 11.64 | |
| Class C | | | | | | | | | | | | | | | | | | | | | | | | |
| 9/30/2024 | | | 9.97 | | | | 0.27 | | | | 0.86 | | | | 1.13 | | | | (0.27 | ) | | | 10.83 | |
| 9/30/2023 | | | 9.89 | | | | 0.24 | | | | 0.08 | | | | 0.32 | | | | (0.24 | ) | | | 9.97 | |
| 9/30/2022 | | | 12.04 | | | | 0.20 | | | | (2.15 | ) | | | (1.95 | ) | | | (0.20 | ) | | | 9.89 | |
| 9/30/2021 | | | 11.63 | | | | 0.19 | | | | 0.41 | | | | 0.60 | | | | (0.19 | ) | | | 12.04 | |
| 9/30/2020 | | | 11.75 | | | | 0.20 | | | | (0.13 | ) | | | 0.07 | | | | (0.19 | ) | | | 11.63 | |
| Class F | | | | | | | | | | | | | | | | | | | | | | | | |
| 9/30/2024 | | | 10.00 | | | | 0.35 | | | | 0.84 | | | | 1.19 | | | | (0.34 | ) | | | 10.85 | |
| 9/30/2023 | | | 9.91 | | | | 0.32 | | | | 0.09 | | | | 0.41 | | | | (0.32 | ) | | | 10.00 | |
| 9/30/2022 | | | 12.07 | | | | 0.28 | | | | (2.16 | ) | | | (1.88 | ) | | | (0.28 | ) | | | 9.91 | |
| 9/30/2021 | | | 11.66 | | | | 0.28 | | | | 0.41 | | | | 0.69 | | | | (0.28 | ) | | | 12.07 | |
| 9/30/2020 | | | 11.78 | | | | 0.28 | | | | (0.12 | ) | | | 0.16 | | | | (0.28 | ) | | | 11.66 | |
| Class F3 | | | | | | | | | | | | | | | | | | | | | | | | |
| 9/30/2024 | | | 9.99 | | | | 0.36 | | | | 0.86 | | | | 1.22 | | | | (0.36 | ) | | | 10.85 | |
| 9/30/2023 | | | 9.91 | | | | 0.33 | | | | 0.08 | | | | 0.41 | | | | (0.33 | ) | | | 9.99 | |
| 9/30/2022 | | | 12.07 | | | | 0.30 | | | | (2.17 | ) | | | (1.87 | ) | | | (0.29 | ) | | | 9.91 | |
| 9/30/2021 | | | 11.65 | | | | 0.29 | | | | 0.42 | | | | 0.71 | | | | (0.29 | ) | | | 12.07 | |
| 9/30/2020 | | | 11.78 | | | | 0.30 | | | | (0.13 | ) | | | 0.17 | | | | (0.30 | ) | | | 11.65 | |
| Class I | | | | | | | | | | | | | | | | | | | | | | | | |
| 9/30/2024 | | | 9.99 | | | | 0.36 | | | | 0.85 | | | | 1.21 | | | | (0.35 | ) | | | 10.85 | |
| 9/30/2023 | | | 9.91 | | | | 0.33 | | | | 0.08 | | | | 0.41 | | | | (0.33 | ) | | | 9.99 | |
| 9/30/2022 | | | 12.07 | | | | 0.29 | | | | (2.16 | ) | | | (1.87 | ) | | | (0.29 | ) | | | 9.91 | |
| 9/30/2021 | | | 11.65 | | | | 0.29 | | | | 0.42 | | | | 0.71 | | | | (0.29 | ) | | | 12.07 | |
| 9/30/2020 | | | 11.78 | | | | 0.29 | | | | (0.13 | ) | | | 0.16 | | | | (0.29 | ) | | | 11.65 | |
| (a) | Calculated using average shares outstanding during the period. |
| (b) | Total return for Classes A and C does not consider the effects of sales loads and assumes the reinvestment of all distributions. Total return for all other classes assumes the reinvestment of all distributions. |
| 238 | See Notes to Financial Statements. |
| | | Ratios to Average Net Assets: | | Supplemental Data: |
| | | | | | | | | | | |
Total
return
(%)(b) | | Total
expenses
after
waivers
and/or reim-
bursements
(%) | | Total
expenses
(%) | | Net
investment
income (loss)
(%) | | Net
assets,
end of
period
(000) | | Portfolio
turnover
rate
(%) |
| | | | | | | | | | | | | | | | | | | | | | | |
| | 11.96 | | | | 0.78 | | | | 0.78 | | | | 3.17 | | | $ | 410,877 | | | | 18 | |
| | 3.93 | | | | 0.78 | | | | 0.78 | | | | 2.98 | | | | 303,557 | | | | 24 | |
| | (15.91 | ) | | | 0.78 | | | | 0.78 | | | | 2.39 | | | | 322,138 | | | | 23 | |
| | 5.90 | | | | 0.77 | | | | 0.77 | | | | 2.20 | | | | 390,194 | | | | 13 | |
| | 1.21 | | | | 0.78 | | | | 0.78 | | | | 2.33 | | | | 357,909 | | | | 22 | |
| | | | | | | | | | | | | | | | | | | | | | | |
| | 11.29 | | | | 1.39 | | | | 1.39 | | | | 2.56 | | | | 17,497 | | | | 18 | |
| | 3.29 | | | | 1.40 | | | | 1.40 | | | | 2.36 | | | | 17,453 | | | | 24 | |
| | (16.39 | ) | | | 1.42 | | | | 1.42 | | | | 1.74 | | | | 20,927 | | | | 23 | |
| | 5.13 | | | | 1.42 | | | | 1.42 | | | | 1.56 | | | | 32,845 | | | | 13 | |
| | 0.64 | | | | 1.44 | | | | 1.44 | | | | 1.68 | | | | 34,749 | | | | 22 | |
| | | | | | | | | | | | | | | | | | | | | | | |
| | 12.07 | | | | 0.68 | | | | 0.68 | | | | 3.27 | | | | 9,768 | | | | 18 | |
| | 4.04 | | | | 0.68 | | | | 0.68 | | | | 3.06 | | | | 6,898 | | | | 24 | |
| | (15.81 | ) | | | 0.68 | | | | 0.68 | | | | 2.40 | | | | 19,360 | | | | 23 | |
| | 6.00 | | | | 0.67 | | | | 0.67 | | | | 2.30 | | | | 71,401 | | | | 13 | |
| | 1.31 | | | | 0.68 | | | | 0.68 | | | | 2.43 | | | | 63,388 | | | | 22 | |
| | | | | | | | | | | | | | | | | | | | | | | |
| | 12.33 | | | | 0.54 | | | | 0.54 | | | | 3.41 | | | | 5,526 | | | | 18 | |
| | 4.07 | | | | 0.55 | | | | 0.55 | | | | 3.21 | | | | 2,290 | | | | 24 | |
| | (15.70 | ) | | | 0.54 | | | | 0.54 | | | | 2.65 | | | | 2,364 | | | | 23 | |
| | 6.14 | | | | 0.54 | | | | 0.54 | | | | 2.41 | | | | 2,071 | | | | 13 | |
| | 1.44 | | | | 0.56 | | | | 0.56 | | | | 2.56 | | | | 1,366 | | | | 22 | |
| | | | | | | | | | | | | | | | | | | | | | | |
| | 12.29 | | | | 0.58 | | | | 0.58 | | | | 3.37 | | | | 126,889 | | | | 18 | |
| | 4.04 | | | | 0.58 | | | | 0.58 | | | | 3.18 | | | | 87,480 | | | | 24 | |
| | (15.73 | ) | | | 0.58 | | | | 0.58 | | | | 2.66 | | | | 70,220 | | | | 23 | |
| | 6.11 | | | | 0.57 | | | | 0.57 | | | | 2.38 | | | | 43,385 | | | | 13 | |
| | 1.41 | | | | 0.59 | | | | 0.59 | | | | 2.51 | | | | 29,600 | | | | 22 | |
| | See Notes to Financial Statements. | 239 |
Notes to Financial Statements
Lord Abbett Municipal Income Fund, Inc. (the “Company”) is registered under the Investment Company Act of 1940, as amended (the “Act”), as an open-end management investment company. The Company was organized as a Maryland corporation on December 27, 1983.
The Company currently consists of the following nine funds (separately, a “Fund” and collectively, the “Funds”) and their respective active share classes:
| Funds | | Classes |
| Lord Abbett Short Duration Tax Free Fund (“Short Duration”) | | A,C,F,F3 and I |
| Lord Abbett Intermediate Tax Free Fund (“Intermediate”) | | A,C,F,F3 and I |
| Lord Abbett National Tax-Free Income Fund (“National”) | | A,C,F,F3 and I |
| Lord Abbett High Income Municipal Bond Fund (“High Income”) | | A,C,F,F3 and I |
| Lord Abbett Short Duration High Income Municipal Bond Fund (“Short Duration High Income”) | | A,C,F,F3 and I |
| Lord Abbett Sustainable Municipal Bond Fund (“Sustainable”) | | A,C,F,F3 and I |
| Lord Abbett California Tax-Free Income Fund (“California”) | | A,C,F,F3 and I |
| Lord Abbett New Jersey Tax-Free Income Fund (“New Jersey”) | | A,F,F3 and I |
| Lord Abbett New York Tax-Free Income Fund (“New York”) | | A,C,F,F3 and I |
Short Duration, Intermediate, National, High Income, Short Duration High Income, Sustainable and California are diversified as defined in the Act. New Jersey and New York are non-diversified as defined in the Act.
The investment objective of each Fund (except for High Income and Short Duration High Income) is to seek the maximum amount of interest income exempt from federal income tax as is consistent with reasonable risk. The investment objective of High Income and Short Duration High Income is to seek a high level of income exempt from federal income tax. Each of California, New Jersey and New York also seeks as high a level of interest income exempt from the personal income tax of its corresponding state as is consistent with reasonable risk. In addition, New York seeks as high a level of interest income exempt from New York City personal income tax as is consistent with reasonable risk.
Each class of shares has different expenses and dividends. A front-end sales charge is normally added to the net asset value (“NAV”) for Class A shares. There is no front-end sales charge in the case of Class C, F, F3 and I shares, although there may be a contingent deferred sales charge (“CDSC”) in certain cases as follows: Class A shares purchased without a sales charge and redeemed before the first day of the month in which the eighteen-month anniversary of the purchase falls (subject to certain exceptions as set forth in each Fund’s prospectus); and Class C shares redeemed before the first anniversary of purchase. Class C shares automatically convert to Class A shares on the 25th day of the month (or, if the 25th day is not a business day, the next business day thereafter) following the eighth anniversary of the month on which the purchase order was accepted, provided that the Funds or financial intermediary through which a shareholder purchased Class C shares has records verifying that the Class C shares have been held at least eight years.
The Funds are investment companies and apply the accounting and reporting guidance of the Financial Accounting Standards Board (“FASB”) Accounting Standards Codification Topic 946 Financial Services - Investment Companies. The preparation of the financial statements in conformity with accounting principles generally accepted in the United States of America (“U.S. GAAP”) requires management to make certain estimates and assumptions that affect the
240
Notes to Financial Statements (continued)
reported amounts of assets and liabilities and disclosure of contingent assets and liabilities at the date of the financial statements and the reported amounts of increases and decreases in net assets from operations during the reporting period. Actual results could differ from those estimates.
| 2. | SIGNIFICANT ACCOUNTING POLICIES |
| | |
| (a) | Investment Valuation–Under procedures approved by the Funds’ Board of Directors (the “Board”), the Board has designated the determination of fair value of the Funds’ portfolio investments to Lord, Abbett & Co. LLC (“Lord Abbett”) as its valuation designee. Accordingly, Lord Abbett is responsible for, among other things, assessing and managing valuation risks, establishing, applying and testing fair value methodologies, and evaluating pricing services. Lord Abbett has formed a Pricing Committee that performs these responsibilities on behalf of Lord Abbett, administers the pricing and valuation of portfolio investments and ensures that prices utilized reasonably reflect fair value. Among other things, these procedures allow Lord Abbett, subject to Board oversight, to utilize independent pricing services, quotations from securities and financial instrument dealers and other market sources to determine fair value. |
| | |
| | Securities are valued based on evaluated prices supplied by independent pricing services, which reflect broker/dealer supplied valuations and the independent pricing services’ own electronic data processing techniques. Exchange traded options and futures contracts are valued at the last quoted sale price in the market where they are principally traded. If no sale has occurred, the mean between the most recently quoted bid and ask prices is used. |
| | |
| | Securities for which prices are not readily available are valued at fair value as determined by the Pricing Committee. The Pricing Committee considers a number of factors, including observable and unobservable inputs, when arriving at fair value. The Pricing Committee may use observable inputs such as yield curves, broker quotes, observable trading activity, option adjusted spread models and other relevant information to determine the fair value of portfolio investments. The Board or a designated committee thereof periodically reviews reports that may include fair value determinations made by the Pricing Committee, related market activity, inputs and assumptions, and retrospective comparison of prices of subsequent purchases and sales transactions to fair value determinations made by the Pricing Committee. |
| | |
| | Short-term securities with 60 days or less remaining to maturity are valued using the amortized cost method, which approximates fair value. |
| | |
| (b) | Security Transactions–Security transactions are recorded as of the date that the securities are purchased or sold (trade date). Realized gains and losses on sales of portfolio securities are calculated using the identified-cost method. Realized and unrealized gains (losses) are allocated to each class of shares based upon the relative proportion of net assets at the beginning of the day. |
| | |
| (c) | Investment Income–Dividend income is recorded on the ex-dividend date. Interest income is recorded on the accrual basis as earned. Discounts are accreted and premiums are amortized using the effective interest method and are included in Interest and other, if applicable, in the Statements of Operations. Investment income is allocated to each class of shares based upon the relative proportion of net assets at the beginning of the day. |
| | |
| (d) | Income Taxes–It is the policy of each Fund to meet the requirements of Subchapter M of the Internal Revenue Code applicable to regulated investment companies and to distribute substantially all taxable income and capital gains to its shareholders. Therefore, no income tax provision is required. |
241
Notes to Financial Statements (continued)
| | Each Fund files U.S. federal and various state and local tax returns. No income tax returns are currently under examination. The statute of limitations on each Fund’s, except Sustainable’s, filed U.S. federal tax returns remains open for the fiscal years ended September 30, 2021 through September 30, 2024. The statute of limitation for Sustainable’s filed U.S. federal tax return remains open for the period ended September 30, 2022 through the year ended September 30, 2024. The statutes of limitations on the Company’s state and local tax returns may remain open for an additional year depending upon the Fund’s jurisdiction. |
| | |
| (e) | Expenses–Expenses incurred by the Company that do not specifically relate to an individual fund are generally allocated to the Funds within the Company on a pro rata basis by relative net assets. Expenses, excluding class-specific expenses, are allocated to each class of shares based upon the relative proportion of net assets at the beginning of the day. In addition, Class F3 shares bear their class-specific share of shareholder servicing expenses. Class A, C and F shares bear their class-specific share of all expenses and fees relating to the Funds’ 12b-1 Distribution Plan. |
| | |
| (f) | Futures Contracts–Each Fund may purchase and sell futures contracts to enhance returns, to attempt to economically hedge some of its investment risk, or as a substitute position in lieu of holding the underlying asset on which the instrument is based. At the time of entering into a futures transaction, an investor is required to deposit and maintain a specified amount of cash or eligible securities called “initial margin.” Subsequent payments made or received by the Funds called “variation margin” are made on a daily basis as the market price of the futures contract fluctuates. Each Fund will record an unrealized gain (loss) based on the amount of variation margin. When a contract is closed, a realized gain (loss) is recorded equal to the difference between the opening and closing value of the contract. |
| | |
| (g) | When-Issued Municipal Bonds–Each Fund may purchase new issues of municipal bonds, which are generally offered on a when-issued basis. Payment and delivery may take place after customary settlement period for that security. |
| | |
| (h) | Municipal Bonds Held in Trust–Each Fund may invest in leveraged residual certificates (“TOB Residuals”) issued by tender option bond trusts (“TOBs”). A TOB is established by a third party sponsor forming a special purpose entity into which a Fund, or an agent on behalf of the Fund, transfers municipal securities. A TOB typically issues two classes of beneficial interests: short-term floating rate certificates (trust certificates), which are sold to third party investors, and residual certificates, which are generally issued to the Fund which made the transfer or to affiliates of the Fund. Each Fund’s transfer of the municipal securities to a TOB is accounted for as a secured borrowing, therefore the municipal securities deposited into a TOB are presented as investments in a Fund’s Schedule of Investments and the proceeds from the transactions are reported as a liability for Trust certificates in the Statements of Assets and Liabilities. Similarly, proceeds from residual certificates issued to affiliates, if any, from the transaction are included in the liability for Trust certificates. Interest income from the underlying security is recorded by a Fund on an accrual basis. Interest expense incurred on the secured borrowing and other expenses related to remarketing, administration and trustee services to a TOB are reported as expenses of a Fund. The floating rate certificates have interest rates that generally reset weekly and their holders have the option to tender certificates to the TOB for redemption at par at each reset date. The residual interests held by a Fund include the right of the Fund (1) to cause the holders of a proportional share of floating rate certificates to tender their certificates at par and (2) to transfer a corresponding |
242
Notes to Financial Statements (continued)
| | share of the municipal securities from the TOB to the Fund. The TOB may also be terminated without the consent of the Fund upon the occurrence of certain events as defined in the TOB agreements. Such termination events may include the bankruptcy or default of the municipal bond, a substantial downgrade in credit quality of the municipal bond, the inability of the TOB to obtain quarterly or annual renewal of the liquidity support agreement, a substantial decline in market value of the municipal bond or the inability to remarket the short-term floating rate certificates to third party investors. |
| | |
| | The following is a summary of TOBs as of and during the fiscal year ended September 30, 2024: |
| | |
| | Fund | | Liability for
Trust Certificates | | | Interest Rate
or Range of
Interest Rates | | | Underlying
Municipal Bonds
Transferred
to TOBs | | | Average
Trust
Certificates
Outstanding | |
| | Short Duration | | $ | – | | | | – | | | $ | – | | | $ | – | |
| | Intermediate | | | – | | | | – | | | | – | | | | – | |
| | National | | | 100,635,000 | | | | 3.16%–3.67% | | | | 219,244,573 | | | | 94,736,000 | |
| | High Income | | | 58,465,000 | | | | 3.16%–3.67% | | | | 127,354,129 | | | | 57,065,000 | |
| | Short Duration High Income | | | – | | | | – | | | | – | | | | – | |
| | Sustainable | | | – | | | | – | | | | – | | | | – | |
| | California | | | 5,000,000 | | | | 3.17% | | | | 11,091,045 | | | | 1,000,000 | |
| | New Jersey | | | – | | | | – | | | | – | | | | – | |
| | New York | | | – | | | | – | | | | – | | | | – | |
| | | | | | | | | | | | | | | | | | |
| | Financial transactions executed through TOBs generally will underperform the market for fixed rate municipal bonds in a rising interest rate environment, but tend to outperform the market for fixed rate municipal bonds when interest rates decline or remain relatively stable. Should short-term interest rates rise, a Fund’s investment in TOB Residuals likely will adversely affect a Fund’s net investment income and distributions to shareholders. Fluctuations in the market value of municipal securities deposited into the TOB may adversely affect a Fund’s NAV per share. The carrying value of each Fund’s liability for Trust certificates approximates its fair value. |
| | |
| | While the Funds’ investment policies and restrictions expressly permit investments in inverse floating rate securities such as TOB Residuals, they generally do not allow the Funds to borrow money for purposes of making investments. The Funds’ management believes that the Funds’ restrictions on borrowings do not apply to TOB transactions, accounted for as secured borrowings. |
| | |
| (i) | Fair Value Measurements–Fair value is defined as the price that each Fund would receive upon selling an investment or transferring a liability in an orderly transaction to an independent buyer in the principal or most advantageous market of the investment. A three-tier hierarchy is used to maximize the use of observable market data and minimize the use of unobservable inputs and to establish classification of fair value measurements for disclosure purposes. Inputs refer broadly to the assumptions that market participants would use in pricing the asset or liability, including assumptions about risk - for example, the risk inherent in a particular valuation technique used to measure fair value (such as a pricing model) and/or the risk inherent in the inputs to the valuation technique. Inputs may be observable or unobservable. Observable inputs reflect the assumptions market participants would use in pricing the asset or liability. Observable inputs are based on market data obtained from sources independent of the reporting entity. Unobservable inputs reflect the reporting entity’s own assumptions about the assumptions market participants would use in pricing the asset or liability. Unobservable inputs are based on the best information available in the circumstances. The three-tier hierarchy classification is |
| | |
243
Notes to Financial Statements (continued)
| | determined based on the lowest level of inputs that is significant to the fair value measurement, and is summarized in the three broad Levels listed below: |
| | |
| | ● | Level 1 – | unadjusted quoted prices in active markets for identical investments; |
| | | | |
| | ● | Level 2 – | other significant observable inputs (including quoted prices for similar investments, interest rates, prepayment speeds, credit risk, etc.); and |
| | | | |
| | ● | Level 3 – | significant unobservable inputs (including each Fund’s own assumptions in determining the fair value of investments). |
| | | | |
| | A summary of inputs used in valuing each Fund’s investments and other financial instruments as of September 30, 2024 and, if applicable, Level 3 rollforwards for the fiscal year then ended is included in each Fund’s Schedule of Investments. |
| | |
| | Changes in valuation techniques may result in transfers into or out of an assigned level within the three-tier hierarchy. The inputs or methodology used for valuing securities are not necessarily an indication of the risk associated with investing in those securities. |
| | |
| 3. | MANAGEMENT FEE AND OTHER TRANSACTIONS WITH AFFILIATES |
Management Fee
The Company has a management agreement with Lord Abbett, pursuant to which Lord Abbett provides each Fund with investment management services and executive and other personnel, provides office space and pays for ordinary and necessary office and clerical expenses relating to research and statistical work and supervision of each Fund’s investment portfolio. The management fee is accrued daily and payable monthly.
The management fee for Short Duration is based on the Fund’s average daily net assets at the following annual rates:
| First $2 billion | .34% |
| Next $3 billion | .32% |
| Over $5 billion | .29% |
The management fee for Intermediate is based on the Fund’s average daily net assets at the following annual rates:
| First $2 billion | .40% |
| Next $3 billion | .375% |
| Next $5 billion | .35% |
| Over $10 billion | .32% |
The management fee for each of National, California, New Jersey and New York is based on the Fund’s average daily net assets at the following annual rates:
| First $1 billion | .45% |
| Next $1 billion | .40% |
| Over $2 billion | .35% |
The management fee for High Income is based on the Fund’s average daily net assets at the following annual rates:
| First $1 billion | .50% |
| Next $1 billion | .45% |
| Over $2 billion | .40% |
244
Notes to Financial Statements (continued)
The management fee for Short Duration High Income is based on the Fund’s average daily net assets at the following annual rates:
| First $1 billion | .35% |
| Over $1 billion | .31% |
The management fee for Sustainable is based on the Fund’s average daily net assets at the following annual rates:
| First $1 billion | .32% |
| Over $1 billion | .29% |
For the fiscal year ended September 30, 2024, the effective management fee, net of any applicable waivers, was at the following annualized rate of each Fund’s average daily net assets:
| | Net Effective
Management Fee |
| Short Duration | .33% |
| Intermediate | .39% |
| National | .39% |
| High Income | .44% |
| Short Duration High Income | .32% |
| Sustainable | .00% |
| California | .45% |
| New Jersey | .42% |
| New York | .45% |
In addition, Lord Abbett provides certain administrative services to each Fund pursuant to an Administrative Services Agreement in return for a fee at an annual rate of ..04% of each Fund’s average daily net assets. The fund administration fee is accrued daily and payable monthly. Lord Abbett voluntarily waived the following fund administration fees during the fiscal year ended September 30, 2024:
| Fund | Fund
Administration Fee |
| Short Duration | $18,281 |
| Intermediate | 53,740 |
| National | 42,936 |
| High Income | 39,709 |
| Short Duration High Income | 13,546 |
| Sustainable | 504 |
| California | 8,476 |
| New Jersey | 2,900 |
| New York | 7,010 |
245
Notes to Financial Statements (continued)
For the fiscal year ended September 30, 2024 and continuing through January 31, 2025, Lord Abbett has contractually agreed to waive its fees and reimburse expenses to limit the total net annual operating expenses for each class, excluding certain of the Funds’ expenses, and interest related expenses, to the following annual rates:
| | | Effective February 1, 2024 | | Prior to February 1, 2024 |
| | | Classes* | | Classes* |
| Fund | | A,C,F and I | | F3 | | A,C,F and I | | F3 |
| Short Duration | | .45% | | .41% | | .45% | | .41% |
| Short Duration High Income | | .45% | | .40% | | .45% | | .37% |
| Sustainable | | .43% | | .40% | | .43% | | .39% |
| New Jersey | | .62% | | .59% | | .62% | | .58% |
| | | | | | | | | |
All contractual fee waivers and expense reimbursement agreements between the Funds and Lord Abbett may be terminated only upon the approval of the Board.
12b-1 Distribution Plan
Each Fund has adopted a distribution plan with respect to Class A, C and F shares pursuant to Rule 12b-1 under the Act, which provides for the payment of ongoing distribution and service fees to Lord Abbett Distributor LLC (the “Distributor”), an affiliate of Lord Abbett. The distribution and service fees are accrued daily and payable monthly.
The following annual rates have been authorized by the Board pursuant to the plan:
| Fees | Class A | Class C(1) | Class F(2) |
| Service | .15% | .25% | – |
| Distribution | .05% | .75% | .10% |
| | | | |
| (1) | The Rule 12b-1 fee each applicable Fund pays on Class C shares is a blended rate based on 1.00% of each Fund’s average daily net assets attributable to Class C shares held less than 1 year and .80% (.25% service and .55% distribution) of each Fund’s average daily net assets attributable to Class C for 1 year or more. All Class C shareholders will bear Rule 12b-1 fees at the same rate. |
| (2) | The Class F shares Rule 12b-1 fee may be designated as a service fee in limited circumstances as described in the Funds’ prospectus. |
Class F3 and Class I Shares do not have a distribution plan.
Commissions
The Distributor received the following commissions on sales of shares of the Funds, after concessions were paid to authorized dealers, during the fiscal year ended September 30, 2024:
| | | Distributor
Commissions | | | Dealers’
Concessions | |
| Short Duration | | $ | 23,035 | | | | $1,501,372 | |
| Intermediate | | | 51,690 | | | | 2,427,346 | |
| National | | | 119,247 | | | | 4,963,398 | |
| High Income | | | 75,120 | | | | 3,661,718 | |
| Short Duration High Income | | | 14,797 | | | | 1,585,461 | |
| Sustainable | | | 28 | | | | 1,514 | |
| California | | | 10,860 | | | | 997,376 | |
| New Jersey | | | 3,415 | | | | 279,745 | |
| New York | | | 8,354 | | | | 1,174,179 | |
246
Notes to Financial Statements (continued)
The Distributor received the following amounts of CDSCs for the fiscal year ended September 30, 2024 :
| | | Class A | | | Class C | |
| Short Duration | | $ | 68,575 | | | $ | 908 | |
| Intermediate | | | 176,584 | | | | 4,577 | |
| National | | | 226,346 | | | | 5,590 | |
| High Income | | | 152,302 | | | | 8,017 | |
| Short Duration High Income | | | 19,018 | | | | 1,949 | |
| Sustainable | | | – | | | | – | |
| California | | | 67,335 | | | | 2,419 | |
| New Jersey | | | 10,584 | | | | – | |
| New York | | | 27,373 | | | | 4,326 | |
One Director and certain of the Funds’ officers have an interest in Lord Abbett.
| 4. | DISTRIBUTIONS AND TAX INFORMATION |
Dividends are paid from net investment income, if any. Capital gain distributions are paid from taxable net realized gains from investments transactions, reduced by allowable capital loss carryforwards, if any. The capital loss carryforward amount, if any, is available to offset future net capital gains. Dividends and distributions to shareholders are recorded on the ex-dividend date. The amounts of dividends and distributions from net investment income and net realized capital gains are determined in accordance with federal income tax regulations, which may differ from U.S. GAAP. These book/tax differences are either considered temporary or permanent in nature. To the extent these differences are permanent in nature, such amounts are reclassified within the components of net assets based on their federal tax basis treatment; temporary differences do not require reclassification. Dividends and distributions, which exceed earnings and profits for tax purposes, are reported as a tax return of capital.
The tax character of distributions paid during the fiscal year ended September 30, 2024 was as follows:
| Fund | | Tax-Exempt
Income | | | Ordinary
Income | | | Net
Long-Term
Capital Gains | | | Return of
Capital | | | Total
Distributions
Paid | |
| Short Duration Tax Free Fund | | $ | 45,804,910 | | | $ | 157,166 | | | $ | – | | | $ | – | | | $ | 45,962,076 | |
| Intermediate Tax Free Fund | | | 154,066,237 | | | | 1,064,026 | | | | – | | | | – | | | | 155,130,263 | |
| National Tax Free Fund | | | 153,677,257 | | | | 707,613 | | | | – | | | | – | | | | 154,384,870 | |
| High Income Municipal Bond Fund | | | 164,256,718 | | | | 1,126,574 | | | | – | | | | – | | | | 165,383,292 | |
| Short Duration High Income Municipal Bond Fund | | | 49,177,767 | | | | 673,685 | | | | – | | | | – | | | | 49,851,452 | |
| Sustainable Municipal Bond Fund | | | 177,598 | | | | 872 | | | | – | | | | – | | | | 178,470 | |
| California Tax Free Fund | | | 20,011,035 | | | | 13,688 | | | | – | | | | – | | | | 20,024,723 | |
| New Jersey Tax Free Fund | | | 3,724,022 | | | | – | | | | – | | | | – | | | | 3,724,022 | |
| New York Tax Free Fund | | | 15,709,324 | | | | 587 | | | | – | | | | – | | | | 15,709,911 | |
247
Notes to Financial Statements (continued)
The tax character of distributions paid during the fiscal year ended September 30, 2023 was as follows:
| Fund | | Tax-Exempt
Income | | | Ordinary
Income | | | Net
Long-Term
Capital Gains | | | Return of
Capital | | | Total
Distributions
Paid | |
| Short Duration Tax Free Fund | | $ | 39,787,976 | | | $ | – | | | $ | – | | | $ | – | | | $ | 39,787,976 | |
| Intermediate Tax Free Fund | | | 139,976,590 | | | | 166,228 | | | | – | | | | – | | | | 140,142,818 | |
| National Tax Free Fund | | | 121,933,970 | | | | 203,243 | | | | – | | | | – | | | | 122,137,213 | |
| High Income Municipal Bond Fund | | | 141,937,657 | | | | 235,933 | | | | – | | | | – | | | | 142,173,590 | |
| Short Duration High Income Municipal Bond Fund | | | 32,629,085 | | | | 201,428 | | | | – | | | | – | | | | 32,830,513 | |
| Sustainable Municipal Bond Fund | | | 141,231 | | | | 2 | | | | – | | | | – | | | | 141,233 | |
| California Tax Free Fund | | | 15,142,551 | | | | 641 | | | | – | | | | – | | | | 15,143,192 | |
| New Jersey Tax Free Fund | | | 3,029,991 | | | | 428 | | | | – | | | | – | | | | 3,030,419 | |
| New York Tax Free Fund | | | 12,781,487 | | | | – | | | | – | | | | – | | | | 12,781,487 | |
As of September 30, 2024, the components of distributable earnings (loss) on a tax basis were as follows:
| Fund | | Undistributed
Tax-Exempt
Income | | | Undistributed
Ordinary
Income | | | Undistributed
Net
Long-Term
Capital
Gains | | | Accumulated
Capital and
Other
Losses | | | Unrealized
Appreciation/
(Depreciation) | | | Temporary
Differences | | | Total
Distributable
Earnings
(Loss) - Net | |
| Short Duration Tax Free Fund | | $ | 5,109,491 | | | $ | – | | | $ | – | | | $ | (102,074,414 | ) | | $ | 10,190,525 | | | $ | (4,097,328 | ) | | $ | (90,871,726 | ) |
| Intermediate Tax Free Fund | | | 27,902,151 | | | | – | | | | – | | | | (431,082,381 | ) | | | 97,973,886 | | | | (14,158,643 | ) | | | (319,364,987 | ) |
| National Tax Free Fund | | | 22,910,820 | | | | – | | | | – | | | | (399,260,076 | ) | | | 143,838,887 | | | | (14,613,620 | ) | | | (247,123,989 | ) |
| High Income Municipal Bond Fund | | | 40,360,091 | | | | – | | | | – | | | | (642,502,234 | ) | | | 108,100,756 | | | | (14,952,860 | ) | | | (508,994,247 | ) |
| Short Duration High Income Municipal Bond Fund | | | 7,733,403 | | | | – | | | | – | | | | (129,505,591 | ) | | | 36,754,004 | | | | (5,129,227 | ) | | | (90,147,411 | ) |
| Sustainable Municipal Bond Fund | | | 19,822 | | | | – | | | | – | | | | (444,583 | ) | | | 156,232 | | | | (17,167 | ) | | | (285,696 | ) |
| California Tax Free Fund | | | 2,240,150 | | | | – | | | | – | | | | (42,246,848 | ) | | | 17,168,641 | | | | (1,905,929 | ) | | | (24,743,986 | ) |
| New Jersey Tax Free Fund | | | 349,153 | | | | – | | | | – | | | | (4,436,357 | ) | | | (505,655 | ) | | | (378,306 | ) | | | (4,971,165 | ) |
| New York Tax Free Fund | | | 1,043,952 | | | | – | | | | – | | | | (21,680,691 | ) | | | (2,850,625 | ) | | | (1,559,483 | ) | | | (25,046,847 | ) |
Net capital losses recognized by the Funds may be carried forward indefinitely and retain their character as short-term and/or long-term losses. Capital losses incurred that will be carried forward are as follows:
| Fund | | Short-Term
Losses | | | Long-Term
Losses | | | Net Capital
Losses | |
| Short Duration Tax Free Fund | | $ | (26,910,668 | ) | | $ | (75,163,746 | ) | | $ | (102,074,414 | ) |
| Intermediate Tax Free Fund | | | (152,489,542 | ) | | | (278,592,839 | ) | | | (431,082,381 | ) |
| National Tax Free Fund | | | (154,555,554 | ) | | | (244,704,522 | ) | | | (399,260,076 | ) |
| High Income Municipal Bond Fund | | | (213,033,898 | ) | | | (429,468,336 | ) | | | (642,502,234 | ) |
| Short Duration High Income Municipal Bond Fund | | | (72,159,461 | ) | | | (57,346,130 | ) | | | (129,505,591 | ) |
| Sustainable Municipal Bond Fund | | | (385,783 | ) | | | (58,800 | ) | | | (444,583 | ) |
| California Tax Free Fund | | | (13,554,242 | ) | | | (28,692,606 | ) | | | (42,246,848 | ) |
| New Jersey Tax Free Fund | | | (529,018 | ) | | | (3,907,339 | ) | | | (4,436,357 | ) |
| New York Tax Free Fund | | | (6,890,156 | ) | | | (14,790,535 | ) | | | (21,680,691 | ) |
248
Notes to Financial Statements (continued)
As of September 30, 2024, the tax cost of investments and the breakdown of unrealized appreciation/(depreciation) for each Fund are shown below. The difference between book-basis and tax basis unrealized appreciation/(depreciation) is attributable to the tax treatment of certain securities, other financial instruments, amortization of premium, and wash sales.
| Fund | | Tax Cost of
Investments | | | Gross
Unrealized
Appreciation | | | Gross
Unrealized
Depreciation | | | Net
Unrealized
Appreciation/
(Depreciation) | |
| Short Duration Tax Free Fund | | $ | 1,530,837,569 | | | $ | 15,969,746 | | | $ | (5,779,221 | ) | | $ | 10,190,525 | |
| Intermediate Tax Free Fund | | | 4,878,192,040 | | | | 130,349,925 | | | | (32,376,039 | ) | | | 97,973,886 | |
| National Tax Free Fund | | | 4,636,877,045 | | | | 166,642,565 | | | | (22,803,678 | ) | | | 143,838,887 | |
| High Income Municipal Bond Fund | | | 3,967,636,744 | | | | 180,651,852 | | | | (72,551,091 | ) | | | 108,100,761 | |
| Short Duration High Income Municipal Bond Fund | | | 1,466,734,141 | | | | 40,002,911 | | | | (3,248,907 | ) | | | 36,754,004 | |
| Sustainable Municipal Bond Fund | | | 5,491,066 | | | | 157,405 | | | | (1,173 | ) | | | 156,232 | |
| California Tax Free Fund | | | 644,750,860 | | | | 19,627,560 | | | | (2,458,919 | ) | | | 17,168,641 | |
| New Jersey Tax Free Fund | | | 138,936,692 | | | | 2,535,728 | | | | (3,041,383 | ) | | | (505,655 | ) |
| New York Tax Free Fund | | | 578,952,348 | | | | 9,995,003 | | | | (12,845,628 | ) | | | (2,850,625 | ) |
| 5. | PORTFOLIO SECURITIES TRANSACTIONS |
Purchases and sales of investment securities (excluding short-term investments) during the fiscal year ended September 30, 2024 were as follows:
| | | Purchases | | | Sales | |
| Short Duration | | $ | 813,933,259 | | | $ | 820,303,239 | |
| Intermediate | | | 2,306,538,701 | | | | 2,385,571,123 | |
| National | | | 1,940,862,269 | | | | 1,155,141,073 | |
| High Income | | | 1,438,401,386 | | | | 1,004,471,266 | |
| Short Duration High Income | | | 996,205,566 | | | | 446,650,429 | |
| Sustainable | | | 2,868,069 | | | | 2,580,896 | |
| California | | | 269,468,495 | | | | 157,069,234 | |
| New Jersey | | | 40,869,456 | | | | 9,504,373 | |
| New York | | | 205,135,981 | | | | 88,087,678 | |
There were no purchases or sales of U.S. Government securities during the fiscal year ended September 30, 2024.
| 6. | DISCLOSURES ABOUT DERIVATIVE INSTRUMENTS AND HEDGING ACTIVITIES |
Each Fund except Intermediate and Sustainable entered into U.S. Treasury futures contracts during the fiscal year ended September 30, 2024 (as described in Note 2(f)) to economically hedge against changes in interest rates. The Funds bear the risk of interest rates moving unexpectedly, in which case the Funds may not achieve the anticipated benefits of the futures contracts and realize a loss. There is minimal counterparty credit risk to the Funds since futures are exchange traded and the exchange’s clearinghouse, as counterparty to all exchange traded futures, guarantees futures against default.
As of September 30, 2024, the Funds had interest rate futures contracts with cumulative net unrealized appreciation/depreciation which are included in the Schedules of Investments. Only the current day’s variation margin is included in the Statements of Assets and Liabilities. The net realized gain (loss) on futures contracts and change in unrealized appreciation/depreciation on
249
Notes to Financial Statements (continued)
futures contracts are included in the Statements of Operations under the captions Net realized gain (loss) on futures contracts and Net change in unrealized appreciation/depreciation on futures contracts, respectively.
The following is a summary of U.S. Treasury futures contracts as of and during the fiscal year ended September 30, 2024:
| | | Net Unrealized
Appreciation
(Depreciation) as of
September 30, 2024 | | | Net
Realized
Gain (Loss) | | | Net Change
in Unrealized
Appreciation
(Depreciation) | | | Average
Number of
Contracts* | |
| Short Duration | | $ | – | | | $ | (433,622 | ) | | $ | 487,900 | | | | 47 | |
| National | | | 71,816 | | | | (930,580 | ) | | | (1,894,554 | ) | | | 441 | |
| High Income | | | – | | | | 806,960 | | | | (1,861,694 | ) | | | 151 | |
| Short Duration High Income | | | 9,388 | | | | (350,715 | ) | | | 9,388 | | | | 19 | |
| California | | | 9,153 | | | | (155,431 | ) | | | (345,230 | ) | | | 62 | |
| New Jersey | | | 2,112 | | | | (48,361 | ) | | | (40,414 | ) | | | 9 | |
| New York | | | 15,725 | | | | (333,172 | ) | | | (327,717 | ) | | | 67 | |
| * | Calculated based on the number of contracts for the fiscal year ended September 30, 2024. |
| 7. | DISCLOSURES ABOUT OFFSETTING ASSETS AND LIABILITIES |
FASB requires disclosure intended to help better assess the effect or potential effect of offsetting arrangements on a fund’s financial position. These requirements include the disclosure of gross and net information about recognized assets and liabilities eligible for offset in the Statement of Assets and Liabilities; and disclose such amounts subject to an enforceable master netting agreement or similar agreement, by the counterparty. A master netting agreement is an agreement between a fund and a counterparty which provides for the net settlement of amounts owed under all contracts traded under that agreement, as well as cash collateral, through a single payment by one party to the other in the event of default on or termination of any one contract. The Funds’ accounting policy with respect to balance sheet offsetting is that, absent an event of default by the counterparty or a termination of the agreement, the master netting agreement does not result in an offset of reported amounts of financial assets and liabilities in the Statement of Assets and Liabilities across transactions between a Fund and the applicable counterparty. As of September 30, 2024, the Funds did not have assets or liabilities subject to the FASB disclosure requirements.
| 8. | DIRECTORS’ REMUNERATION |
The Company’s officers and one Director, who are associated with Lord Abbett, do not receive any compensation from the Company for serving in such capacities. Independent Directors’ fees are allocated among all Lord Abbett-sponsored funds primarily based on the relative net assets of each fund. There is an equity-based plan available to all Independent Directors under which Independent Directors may elect to defer receipt of a portion of Directors’ fees. The deferred amounts are treated as though equivalent dollar amounts had been invested in the Funds. Such amounts and earnings accrued thereon are included in Directors’ fees in the Statements of Operations and in Directors’ fees payable in the Statements of Assets and Liabilities and are not deductible for U.S. federal income tax purposes until such amounts are paid.
250
Notes to Financial Statements (continued)
For the period ended July 31, 2024, the Funds and certain other funds managed by Lord Abbett (collectively, the “Participating Funds”) were party to a syndicated line of credit facility with various lenders for $1.6 billion (the “Syndicated Facility”) under which State Street Bank and Trust Company (“SSB”) participated as a lender and as agent for the lenders. The Participating Funds were subject to graduated borrowing limits of one-third of fund net assets (if fund net assets are less than $750 million), $250 million, $300 million, $700 million, or $1 billion, based on past borrowings and likelihood of future borrowings, among other factors.
Effective August 1, 2024, the Participating Funds renewed the Syndicated Facility for $1.6 billion. The Participating Funds are subject to graduated borrowing limits of one-third of fund net assets (if fund net assets are less than $750 million), $250 million, $700 million, or $1 billion, based on past borrowings and likelihood of future borrowings, among other factors.
For the period ended July 31, 2024, the Participating Funds were also party to an additional uncommitted line of credit facility with SSB for $330 million (the “Bilateral Facility”). Under the Bilateral Facility, the Participating Funds were subject to graduated borrowing limits of one-third of fund net assets (if fund net assets are less than $750 million), or $250 million based on past borrowings and likelihood of future borrowings, among other factors.
Effective August 1, 2024, the Participating Funds renewed the Bilateral Facility in the same amount. The Participating Funds remain subject to the same borrowing limits as were in place prior to the renewal.
These credit facilities are to be used for short-term working capital purposes as additional sources of liquidity to satisfy redemptions.
For the fiscal year ended September 30, 2024, the Funds did not utilize the Syndicated Facility or Bilateral Facility.
| 10. | INTERFUND LENDING PROGRAM |
Pursuant to an exemptive order issued by the U.S. Securities and Exchange Commission (“SEC exemptive order”) certain registered open-end management investment companies managed by Lord Abbett, including each Fund, participate in a joint lending and borrowing program (the “Interfund Lending Program”). The SEC exemptive order allows the funds that participate in the Interfund Lending Program to borrow money from and lend money to each other for temporary or emergency purposes subject to the limitations and conditions.
For the fiscal year ended September 30, 2024, the Funds did not participate as a borrower or lender in the Interfund Lending Program.
| 11. | CUSTODIAN AND ACCOUNTING AGENT |
SSB is the Company’s custodian and accounting agent. SSB performs custodial, accounting and recordkeeping functions relating to portfolio transactions and calculating each Fund’s NAV.
| 12. | SECURITIES LENDING AGREEMENT |
The Funds have established a securities lending agreement with Citibank, N.A. for the lending of securities to qualified brokers in exchange for securities or cash collateral equal to at least the market value of securities loaned, plus interest, if applicable. Cash collateral is invested in an approved money market fund. In accordance with the Funds’ securities lending agreement, the
251
Notes to Financial Statements (continued)
market value of securities on loan is determined each day at the close of business and any additional collateral required to cover the value of securities on loan is delivered to the Funds on the next business day. As with other extensions of credit, the Funds may experience a delay in the recovery of their securities or incur a loss should the borrower of the securities breach its agreement with the Funds or the borrower becomes insolvent at a time when the collateral is insufficient to cover the cost of repurchasing securities on loan. Any income earned from securities lending is included in securities lending net income in each Fund’s Statement of Operations.
The initial collateral received by the Funds is required to have a value equal to at least 100% of the market value of the securities loaned. The collateral must be marked-to-market daily to cover increases in the market value of the securities loaned (or potentially a decline in the value of the collateral). In general, the risk of borrower default will be borne by Citibank, N.A.; the Funds will bear the risk of loss with respect to the investment of the cash collateral. The advantage of such loans is that the Funds continue to receive income on loaned securities while receiving a portion of any securities lending fees and earning returns on the cash amounts which may be reinvested for the purchase of investments in securities.
As of September 30, 2024, the Funds did not have any securities on loan.
Each Fund’s performance and the fair value of its investments will vary in response to changes in interest rates and other market factors. As interest rates rise, a Fund’s investments typically will lose value. This risk is usually greater for long-term bonds and particularly for TOB Residuals. As a result, each Fund, to the extent it invests in long-term bonds and TOB Residuals, is subject to such greater market risk. During periods of falling interest rates, a Fund’s investments may gain value; however, because Short Duration and Short Duration High Income typically invest in shorter term bonds, those Funds are subject to the risk that they will underperform funds invested in longer-term bonds during such periods.
Additional risks that could reduce each Fund’s performance or increase volatility include call risk, credit risk, defaulted bonds risk (High Income and Short Duration High Income only), derivatives risk, distressed debt risk (High Income and Short Duration High Income only), extension risk, floating rate interest risk (Sustainable only), fixed income securities risk, governmental risk, industry risk, liquidity risk, market and portfolio management risks, market disruption and geopolitical risk, municipal securities risk, short duration risk (Short Duration and Short Duration High Income only), state and territory risks, taxability risk and zero coupon, deferred interest, pay-in-kind, and capital appreciation bonds risk (all Funds except Short Duration, Intermediate, Sustainable and Short Duration High Income). Credit risk varies among states based upon the economic and fiscal conditions of each state and the municipalities within the state.
There is the risk that an issuer of a municipal bond may fail to make timely payments of principal or interest to a Fund, a risk that is greater with municipal bonds rated below investment grade (sometimes called “lower rated bonds” or “junk bonds”). High Income, Short Duration High Income, Sustainable and, to a lesser extent, other Funds invest a portion of its assets in such bonds. Some issuers, particularly of junk bonds, may default as to principal and/or interest payments after a Fund purchases their securities. A default, or concerns in the market about an increase in risk of default or the deterioration in the creditworthiness of an issuer, may result in losses to a Fund. Junk bonds are considered predominantly speculative by traditional investment standards. In addition, the market for lower rated municipal bonds generally is less liquid and more volatile than the market for higher rated bonds, subjecting them to greater price fluctuations which could result in losses.
252
Notes to Financial Statements (continued)
New Jersey and New York are non-diversified, which means that they may invest a greater portion of their assets in a single issuer than a diversified fund. Thus, they may be exposed to greater risk.
Because each of California, New Jersey, and New York focuses on a particular state or territory, the Fund’s performance may be more affected by local, state and regional factors than a Fund that invests in municipal bonds issued in many states. These factors may include, for example, economic or political developments, erosion of the tax base and the possibility of credit problems. In addition, downturns or developments in the U.S. economy or in foreign economies or significant world events may harm the performance of any of the Funds (including Short Duration, Intermediate, National, High Income, Short Duration High Income and Sustainable), and may do so disproportionately as a result of the corresponding disproportionate impact of such occurrences on particular state, territory, or local economies.
Because Sustainable considers sustainability factors when evaluating an investment, the Fund may underperform funds that do not take sustainability-related factors into account. There is no guarantee that Lord Abbett will successfully implement and make investments in issuers that create a positive environmental, social or governance impact while achieving the desired financial returns. In evaluating an issuer, Lord Abbett may be dependent on data or information that may be incomplete, inaccurate or unavailable. Sustainable is a newly organized fund and there can be no assurance that it will reach or maintain a sufficient asset size to effectively implement its investment strategy.
Each Fund may invest in private activity bonds (sometimes called “AMT paper”). The credit quality of AMT paper usually is directly related to the credit standing of the private user of the facilities.
National, High Income, Short Duration High Income, California and, to a lesser extent, other Funds may invest in TOB Residuals. A TOB Residual, sometimes referred to as an inverse floater or a residual interest bond (“RIB”), is a type of derivative debt instrument with a floating or variable interest rate that moves in the opposite direction of the interest rate on another specific fixed-rate security. Changes in the interest rate on the specific fixed-rate security inversely affect the residual interest paid on the TOB Residual, with the result that when interest rates rise, TOB Residuals’ interest payments are lowered and their value falls faster than securities similar to the specific fixed-rate security. When interest rates fall, not only do TOB Residuals generally provide interest payments that are higher than securities similar to the specific fixed-rate security, but their values generally also rise faster than such similar securities.
In addition, loss may result from a Fund’s investments in certain derivative transactions such as futures contracts, swap transactions, interest rate caps, TOB Residuals and similar transactions. These instruments may be leveraged so that small changes may produce disproportionate and substantial losses to a Fund. They also may increase a Fund’s interest rate risk.
Each Fund may purchase securities on a forward commitment or when-issued basis. Delivery and payment for such securities can take place a month or more after the transaction date. During this period such securities are subject to market fluctuations.
Geopolitical and other events (e.g., wars, terrorism, natural disasters, infectious illness outbreaks, epidemics or pandemics) may disrupt securities markets and adversely affect global economies and markets, thereby decreasing the value of each Fund’s investments. Market disruptions can also prevent the Funds from implementing their investment strategies and achieving their investment objectives.
253
Notes to Financial Statements (continued)
Adverse developments that affect financial institutions or the financial services industry generally, or concerns or rumors about any events of these kinds or other similar risks, may reduce liquidity in the market generally or have other adverse effects on the economy, each Fund or issuers in which each Fund invests. In addition, issuers in which each Fund invests and each Fund may not be able to identify all potential solvency or stress concerns with respect to a financial institution or to transfer assets from one bank or financial institution to another in a timely manner in the event such bank or financial institution comes under stress or fails.
The impacts and effects of infectious illness outbreaks, epidemics or pandemics (such as the COVID-19 outbreak), may be short term or may continue for an extended period of time. For example, a global pandemic or other widespread health crises could negatively affect the global economy, the economies of individual countries, and the financial performance of individual issuers, sectors, industries, asset classes, and markets in significant and unforeseen ways. Health crises caused by outbreaks of disease may also exacerbate other pre-existing political, social, and economic risks in certain countries or globally. The foregoing could disrupt the operations of each Fund and its service providers, adversely affect the value and liquidity of each Fund’s investments, and negatively impact each Fund’s performance and your investment in each Fund.
Advancements in technology may also adversely impact markets and the overall performance of the Funds. For instance, the economy may be significantly impacted by the advanced development and increased regulation of technology. As the use of technology grows, liquidity and market movements may be affected. As technology is used more widely in the asset management industry, the profitability and growth of each Fund’s holdings may be impacted, which could significantly impact the overall performance of each Fund.
| 14. | SUMMARY OF CAPITAL TRANSACTIONS |
Transactions in shares of capital stock were as follows:
| Short Duration | | Year Ended
September 30, 2024 | | | Year Ended
September 30, 2023 | |
| Class A Shares | | | Shares | | | | Amount | | | | Shares | | | | Amount | |
| Shares sold | | | 15,643,152 | | | $ | 234,690,754 | | | | 18,770,106 | | | $ | 280,029,821 | |
| Reinvestment of distributions | | | 1,219,224 | | | | 18,316,255 | | | | 984,630 | | | | 14,707,986 | |
| Shares reacquired | | | (17,840,915 | ) | | | (267,666,142 | ) | | | (27,741,560 | ) | | | (414,525,176 | ) |
| Decrease | | | (978,539 | ) | | $ | (14,659,133 | ) | | | (7,986,824 | ) | | $ | (119,787,369 | ) |
| | | | | | | | | | | | | | | | | |
| Class C Shares | | | | | | | | | | | | | | | | |
| Shares sold | | | 237,113 | | | $ | 3,560,165 | | | | 500,473 | | | $ | 7,481,248 | |
| Reinvestment of distributions | | | 21,813 | | | | 327,611 | | | | 18,679 | | | | 279,015 | |
| Shares reacquired | | | (425,544 | ) | | | (6,393,128 | ) | | | (892,335 | ) | | | (13,327,281 | ) |
| Decrease | | | (166,618 | ) | | $ | (2,505,352 | ) | | | (373,183 | ) | | $ | (5,567,018 | ) |
| | | | | | | | | | | | | | | | | |
| Class F Shares | | | | | | | | | | | | | | | | |
| Shares sold | | | 384,442 | | | $ | 5,785,476 | | | | 2,003,418 | | | $ | 29,862,090 | |
| Reinvestment of distributions | | | 53,950 | | | | 810,353 | | | | 135,914 | | | | 2,029,051 | |
| Shares reacquired | | | (900,148 | ) | | | (13,520,219 | ) | | | (16,589,985 | ) | | | (248,233,169 | ) |
| Decrease | | | (461,756 | ) | | $ | (6,924,390 | ) | | | (14,450,653 | ) | | $ | (216,342,028 | ) |
| | | | | | | | | | | | | | | | | |
| Class F3 Shares | | | | | | | | | | | | | | | | |
| Shares sold | | | 4,720,776 | | | $ | 70,770,896 | | | | 8,782,648 | | | $ | 131,150,210 | |
| Reinvestment of distributions | | | 303,446 | | | | 4,560,161 | | | | 268,196 | | | | 4,007,378 | |
| Shares reacquired | | | (6,715,104 | ) | | | (100,752,974 | ) | | | (15,617,826 | ) | | | (233,120,113 | ) |
| Decrease | | | (1,690,882 | ) | | $ | (25,421,917 | ) | | | (6,566,982 | ) | | $ | (97,962,525 | ) |
254
Notes to Financial Statements (continued)
| Short Duration | | Year Ended
September 30, 2024 | | | Year Ended
September 30, 2023 | |
| Class I Shares | | | | | | | | | | | | | | | | |
| Shares sold | | | 14,864,720 | | | $ | 223,133,340 | | | | 22,391,479 | | | $ | 335,270,750 | |
| Reinvestment of distributions | | | 779,500 | | | | 11,714,160 | | | | 597,701 | | | | 8,930,320 | |
| Shares reacquired | | | (17,191,531 | ) | | | (257,785,410 | ) | | | (26,175,013 | ) | | | (390,899,778 | ) |
| Decrease | | | (1,547,311 | ) | | $ | (22,937,910 | ) | | | (3,185,833 | ) | | $ | (46,698,708 | ) |
| | | | | | | | | | | | | | | | | |
| Intermediate | | | Year Ended
September 30, 2024 | | | | Year Ended
September 30, 2023 | |
| Class A Shares | | | Shares | | | | Amount | | | | Shares | | | | Amount | |
| Shares sold | | | 39,660,511 | | | $ | 403,340,644 | | | | 49,174,165 | | | $ | 492,503,761 | |
| Reinvestment of distributions | | | 5,207,337 | | | | 53,029,586 | | | | 4,828,479 | | | | 48,337,760 | |
| Shares reacquired | | | (53,113,566 | ) | | | (538,007,792 | ) | | | (69,325,924 | ) | | | (692,617,725 | ) |
| Decrease | | | (8,245,718 | ) | | $ | (81,637,562 | ) | | | (15,323,280 | ) | | $ | (151,776,204 | ) |
| | | | | | | | | | | | | | | | | |
| Class C Shares | | | | | | | | | | | | | | | | |
| Shares sold | | | 768,785 | | | $ | 7,815,343 | | | | 1,102,429 | | | $ | 11,030,272 | |
| Reinvestment of distributions | | | 158,491 | | | | 1,610,363 | | | | 181,800 | | | | 1,817,681 | |
| Shares reacquired | | | (3,419,719 | ) | | | (34,751,804 | ) | | | (5,066,758 | ) | | | (50,621,023 | ) |
| Decrease | | | (2,492,443 | ) | | $ | (25,326,098 | ) | | | (3,782,529 | ) | | $ | (37,773,070 | ) |
| | | | | | | | | | | | | | | | | |
| Class F Shares | | | | | | | | | | | | | | | | |
| Shares sold | | | 808,598 | | | $ | 8,183,961 | | | | 10,483,265 | | | $ | 104,175,251 | |
| Reinvestment of distributions | | | 275,312 | | | | 2,799,496 | | | | 722,128 | | | | 7,207,593 | |
| Shares reacquired | | | (3,978,642 | ) | | | (40,209,214 | ) | | | (53,473,167 | ) | | | (538,192,977 | ) |
| Decrease | | | (2,894,732 | ) | | $ | (29,225,757 | ) | | | (42,267,774 | ) | | $ | (426,810,133 | ) |
| | | | | | | | | | | | | | | | | |
| Class F3 Shares | | | | | | | | | | | | | | | | |
| Shares sold | | | 10,118,593 | | | $ | 102,537,324 | | | | 17,855,155 | | | $ | 177,891,929 | |
| Reinvestment of distributions | | | 716,304 | | | | 7,298,581 | | | | 591,824 | | | | 5,928,632 | |
| Shares reacquired | | | (8,557,573 | ) | | | (86,426,044 | ) | | | (10,335,665 | ) | | | (103,204,790 | ) |
| Increase | | | 2,277,324 | | | $ | 23,409,861 | | | | 8,111,314 | | | $ | 80,615,771 | |
| | | | | | | | | | | | | | | | | |
| Class I Shares | | | | | | | | | | | | | | | | |
| Shares sold | | | 94,367,146 | | | $ | 958,244,483 | | | | 164,710,208 | | | $ | 1,655,343,063 | |
| Reinvestment of distributions | | | 5,316,230 | | | | 54,145,140 | | | | 4,112,613 | | | | 41,177,642 | |
| Shares reacquired | | | (107,360,202 | ) | | | (1,083,280,808 | ) | | | (138,932,589 | ) | | | (1,384,239,621 | ) |
| Increase (decrease) | | | (7,676,826 | ) | | $ | (70,891,185 | ) | | | 29,890,232 | | | $ | 312,281,084 | |
| | | | | | | | | | | | | | | | | |
| National | | | Year Ended
September 30, 2024 | | | | Year Ended
September 30, 2023 | |
| Class A Shares | | | Shares | | | | Amount | | | | Shares | | | | Amount | |
| Shares sold | | | 69,788,527 | | | $ | 724,457,933 | | | | 60,088,538 | | | $ | 614,813,100 | |
| Reinvestment of distributions | | | 8,094,456 | | | | 84,253,985 | | | | 7,019,689 | | | | 71,670,379 | |
| Shares reacquired | | | (53,325,836 | ) | | | (551,704,951 | ) | | | (65,161,550 | ) | | | (661,976,768 | ) |
| Increase | | | 24,557,147 | | | $ | 257,006,967 | | | | 1,946,677 | | | $ | 24,506,711 | |
| | | | | | | | | | | | | | | | | |
| Class C Shares | | | | | | | | | | | | | | | | |
| Shares sold | | | 942,131 | | | $ | 9,771,525 | | | | 1,515,238 | | | $ | 15,488,288 | |
| Reinvestment of distributions | | | 172,598 | | | | 1,795,567 | | | | 191,119 | | | | 1,952,996 | |
| Shares reacquired | | | (2,362,347 | ) | | | (24,474,066 | ) | | | (3,020,841 | ) | | | (30,840,554 | ) |
| Decrease | | | (1,247,618 | ) | | $ | (12,906,974 | ) | | | (1,314,484 | ) | | $ | (13,399,270 | ) |
255
Notes to Financial Statements (continued)
| National | | | Year Ended
September 30, 2024 | | | | Year Ended
September 30, 2023 | |
| Class F Shares | | | | | | | | | | | | | | | | |
| Shares sold | | | 2,087,349 | | | $ | 21,089,393 | | | | 5,080,629 | | | $ | 52,023,332 | |
| Reinvestment of distributions | | | 266,012 | | | | 2,761,736 | | | | 465,880 | | | | 4,742,198 | |
| Shares reacquired | | | (4,002,770 | ) | | | (41,446,446 | ) | | | (20,167,972 | ) | | | (206,545,983 | ) |
| Decrease | | | (1,649,409 | ) | | $ | (17,595,317 | ) | | | (14,621,463 | ) | | $ | (149,780,453 | ) |
| | | | | | | | | | | | | | | | | |
| Class F3 Shares | | | | | | | | | | | | | | | | |
| Shares sold | | | 22,107,409 | | | $ | 228,612,522 | | | | 19,758,267 | | | $ | 201,800,808 | |
| Reinvestment of distributions | | | 1,561,340 | | | | 16,259,694 | | | | 1,084,751 | | | | 11,068,830 | |
| Shares reacquired | | | (12,175,178 | ) | | | (125,116,719 | ) | | | (12,916,088 | ) | | | (131,080,515 | ) |
| Increase | | | 11,493,571 | | | $ | 119,755,497 | | | | 7,926,930 | | | $ | 81,789,123 | |
| | | | | | | | | | | | | | | | | |
| Class I Shares | | | | | | | | | | | | | | | | |
| Shares sold | | | 78,535,986 | | | $ | 814,067,088 | | | | 75,819,727 | | | $ | 776,676,296 | |
| Reinvestment of distributions | | | 3,462,908 | | | | 36,072,026 | | | | 2,095,587 | | | | 21,396,429 | |
| Shares reacquired | | | (43,208,000 | ) | | | (443,278,556 | ) | | | (42,356,376 | ) | | | (430,837,311 | ) |
| Increase | | | 38,790,894 | | | $ | 406,860,558 | | | | 35,558,938 | | | $ | 367,235,414 | |
| | | | | | | | | | | | | | | | | |
| High Income | | | Year Ended
September 30, 2024 | | | | Year Ended
September 30, 2023 | |
| Class A Shares | | | Shares | | | | Amount | | | | Shares | | | | Amount | |
| Shares sold | | | 52,151,746 | | | $ | 558,676,538 | | | | 43,175,387 | | | $ | 455,701,191 | |
| Reinvestment of distributions | | | 6,947,144 | | | | 74,628,508 | | | | 6,304,263 | | | | 66,202,615 | |
| Shares reacquired | | | (43,799,732 | ) | | | (465,898,841 | ) | | | (58,270,465 | ) | | | (611,695,648 | ) |
| Increase (decrease) | | | 15,299,158 | | | $ | 167,406,205 | | | | (8,790,815 | ) | | $ | (89,791,842 | ) |
| | | | | | | | | | | | | | | | | |
| Class C Shares | | | | | | | | | | | | | | | | |
| Shares sold | | | 1,765,117 | | | $ | 18,944,541 | | | | 2,009,353 | | | $ | 21,245,804 | |
| Reinvestment of distributions | | | 446,335 | | | | 4,786,662 | | | | 500,249 | | | | 5,255,523 | |
| Shares reacquired | | | (4,861,990 | ) | | | (51,888,761 | ) | | | (5,517,532 | ) | | | (57,995,411 | ) |
| Decrease | | | (2,650,538 | ) | | $ | (28,157,558 | ) | | | (3,007,930 | ) | | $ | (31,494,084 | ) |
| | | | | | | | | | | | | | | | | |
| Class F Shares | | | | | | | | | | | | | | | | |
| Shares sold | | | 1,022,752 | | | $ | 10,793,489 | | | | 8,919,354 | | | $ | 93,789,815 | |
| Reinvestment of distributions | | | 402,922 | | | | 4,318,227 | | | | 889,451 | | | | 9,334,333 | |
| Shares reacquired | | | (4,871,935 | ) | | | (51,514,143 | ) | | | (34,828,395 | ) | | | (369,484,678 | ) |
| Decrease | | | (3,446,261 | ) | | $ | (36,402,427 | ) | | | (25,019,590 | ) | | $ | (266,360,530 | ) |
| | | | | | | | | | | | | | | | | |
| Class F3 Shares | | | | | | | | | | | | | | | | |
| Shares sold | | | 6,598,739 | | | $ | 70,424,087 | | | | 6,739,512 | | | $ | 70,945,394 | |
| Reinvestment of distributions | | | 619,706 | | | | 6,651,490 | | | | 512,731 | | | | 5,375,304 | |
| Shares reacquired | | | (4,443,345 | ) | | | (46,908,409 | ) | | | (6,318,034 | ) | | | (66,175,713 | ) |
| Increase | | | 2,775,100 | | | $ | 30,167,168 | | | | 934,209 | | | $ | 10,144,985 | |
| | | | | | | | | | | | | | | | | |
| Class I Shares | | | | | | | | | | | | | | | | |
| Shares sold | | | 77,485,314 | | | $ | 823,395,967 | | | | 90,058,661 | | | $ | 952,814,223 | |
| Reinvestment of distributions | | | 5,485,797 | | | | 58,888,365 | | | | 3,991,925 | | | | 41,865,737 | |
| Shares reacquired | | | (52,553,924 | ) | | | (554,474,456 | ) | | | (66,709,134 | ) | | | (697,668,339 | ) |
| Increase | | | 30,417,187 | | | $ | 327,809,876 | | | | 27,341,452 | | | $ | 297,011,621 | |
256
Notes to Financial Statements (continued)
| Short Duration High Income | | Year Ended
September 30, 2024 | | | Year Ended
September 30, 2023 | |
| Class A Shares | | | Shares | | | | Amount | | | | Shares | | | | Amount | |
| Shares sold | | | 16,100,631 | | | $ | 227,346,901 | | | | 6,812,042 | | | $ | 95,722,989 | |
| Reinvestment of distributions | | | 865,187 | | | | 12,232,826 | | | | 727,887 | | | | 10,222,070 | |
| Shares reacquired | | | (7,459,418 | ) | | | (104,862,047 | ) | | | (12,136,845 | ) | | | (170,439,304 | ) |
| Increase (decrease) | | | 9,506,400 | | | $ | 134,717,680 | | | | (4,596,916 | ) | | $ | (64,494,245 | ) |
| | | | | | | | | | | | | | | | | |
| Class C Shares | | | | | | | | | | | | | | | | |
| Shares sold | | | 484,575 | | | $ | 6,838,819 | | | | 470,549 | | | $ | 6,605,568 | |
| Reinvestment of distributions | | | 47,497 | | | | 670,972 | | | | 41,977 | | | | 589,760 | |
| Shares reacquired | | | (442,559 | ) | | | (6,236,978 | ) | | | (634,589 | ) | | | (8,936,164 | ) |
| Increase (decrease) | | | 89,513 | | | $ | 1,272,813 | | | | (122,063 | ) | | $ | (1,740,836 | ) |
| | | | | | | | | | | | | | | | | |
| Class F Shares | | | | | | | | | | | | | | | | |
| Shares sold | | | 389,729 | | | $ | 5,447,630 | | | | 3,946,365 | | | $ | 55,097,018 | |
| Reinvestment of distributions | | | 44,631 | | | | 629,309 | | | | 179,679 | | | | 2,523,527 | |
| Shares reacquired | | | (852,394 | ) | | | (11,992,743 | ) | | | (12,914,805 | ) | | | (182,516,643 | ) |
| Decrease | | | (418,034 | ) | | $ | (5,915,804 | ) | | | (8,788,761 | ) | | $ | (124,896,098 | ) |
| | | | | | | | | | | | | | | | | |
| Class F3 Shares | | | | | | | | | | | | | | | | |
| Shares sold | | | 2,480,479 | | | $ | 34,867,355 | | | | 1,695,166 | | | $ | 23,937,717 | |
| Reinvestment of distributions | | | 124,730 | | | | 1,763,206 | | | | 87,418 | | | | 1,227,833 | |
| Shares reacquired | | | (1,637,174 | ) | | | (22,917,481 | ) | | | (1,252,638 | ) | | | (17,587,532 | ) |
| Increase | | | 968,035 | | | $ | 13,713,080 | | | | 529,946 | | | $ | 7,578,018 | |
| | | | | | | | | | | | | | | | | |
| Class I Shares | | | | | | | | | | | | | | | | |
| Shares sold | | | 53,043,819 | | | $ | 746,520,596 | | | | 35,782,001 | | | $ | 504,220,384 | |
| Reinvestment of distributions | | | 2,299,047 | | | | 32,530,816 | | | | 1,206,000 | | | | 16,940,484 | |
| Shares reacquired | | | (25,227,624 | ) | | | (354,863,556 | ) | | | (22,116,692 | ) | | | (310,088,063 | ) |
| Increase | | | 30,115,242 | | | $ | 424,187,856 | | | | 14,871,309 | | | $ | 211,072,805 | |
| | | | | | | | | | | | | | | | | |
| Sustainable | | | Year Ended
September 30, 2024 | | | | Year Ended
September 30, 2023 | |
| Class A Shares | | | Shares | | | | Amount | | | | Shares | | | | Amount | |
| Shares sold | | | 20,015 | | | $ | 183,096 | | | | 22,877 | | | $ | 208,187 | |
| Reinvestment of distributions | | | 1,154 | | | | 10,648 | | | | 648 | | | | 5,894 | |
| Shares reacquired | | | (3,003 | ) | | | (27,844 | ) | | | – | | | | – | |
| Increase | | | 18,166 | | | $ | 165,900 | | | | 23,525 | | | $ | 214,081 | |
| | | | | | | | | | | | | | | | | |
| Class C Shares | | | | | | | | | | | | | | | | |
| Shares sold | | | 1,069 | | | $ | 10,000 | | | | 11,460 | | | $ | 104,753 | |
| Reinvestment of distributions | | | 270 | | | | 2,481 | | | | 173 | | | | 1,578 | |
| Shares reacquired | | | (3,784 | ) | | | (34,888 | ) | | | (9 | ) | | | (83 | ) |
| Increase (decrease) | | | (2,445 | ) | | $ | (22,407 | ) | | | 11,624 | | | $ | 106,248 | |
| | | | | | | | | | | | | | | | | |
| Class F Shares | | | | | | | | | | | | | | | | |
| Shares sold | | | 1,616 | | | $ | 15,009 | | | | – | | | $ | – | |
| Reinvestment of distributions | | | 9 | | | | 83 | | | | – | | | | – | |
| Shares reacquired | | | (1,625 | ) | | | (14,995 | ) | | | – | | | | – | |
| Increase | | | – | | | $ | 97 | | | | – | | | $ | – | |
257
Notes to Financial Statements (continued)
| Sustainable | | Year Ended
September 30, 2024 | | | Year Ended
September 30, 2023 | |
| Class I Shares | | | | | | | | | | | | | | | | |
| Shares sold | | | 9,486 | | | $ | 87,728 | | | | 29,967 | | | $ | 275,115 | |
| Reinvestment of distributions | | | 1,621 | | | | 14,949 | | | | 820 | | | | 7,444 | |
| Shares reacquired | | | (1,503 | ) | | | (13,862 | ) | | | (701 | ) | | | (6,362 | ) |
| Increase | | | 9,604 | | | $ | 88,815 | | | | 30,086 | | | $ | 276,197 | |
| | | | | | | | | | | | | | | | | |
| California | | | Year Ended
September 30, 2024 | | | | Year Ended
September 30, 2023 | |
| Class A Shares | | | Shares | | | | Amount | | | | Shares | | | | Amount | |
| Shares sold | | | 13,083,533 | | | $ | 131,047,706 | | | | 11,208,367 | | | $ | 111,038,999 | |
| Reinvestment of distributions | | | 1,180,461 | | | | 11,916,739 | | | | 940,809 | | | | 9,324,002 | |
| Shares reacquired | | | (9,070,571 | ) | | | (90,849,925 | ) | | | (8,345,793 | ) | | | (82,402,978 | ) |
| Increase | | | 5,193,423 | | | $ | 52,114,520 | | | | 3,803,383 | | | $ | 37,960,023 | |
| | | | | | | | | | | | | | | | | |
| Class C Shares | | | | | | | | | | | | | | | | |
| Shares sold | | | 485,872 | | | $ | 4,915,824 | | | | 387,190 | | | $ | 3,861,120 | |
| Reinvestment of distributions | | | 47,529 | | | | 479,600 | | | | 46,040 | | | | 456,338 | |
| Shares reacquired | | | (740,947 | ) | | | (7,478,376 | ) | | | (686,018 | ) | | | (6,812,975 | ) |
| Decrease | | | (207,546 | ) | | $ | (2,082,952 | ) | | | (252,788 | ) | | $ | (2,495,517 | ) |
| | | | | | | | | | | | | | | | | |
| Class F Shares | | | | | | | | | | | | | | | | |
| Shares sold | | | 967,474 | | | $ | 9,637,066 | | | | 269,732 | | | $ | 2,620,114 | |
| Reinvestment of distributions | | | 37,418 | | | | 378,590 | | | | 38,798 | | | | 383,623 | |
| Shares reacquired | | | (614,205 | ) | | | (6,131,825 | ) | | | (1,684,119 | ) | | | (16,876,219 | ) |
| Increase (decrease) | | | 390,687 | | | $ | 3,883,831 | | | | (1,375,589 | ) | | $ | (13,872,482 | ) |
| | | | | | | | | | | | | | | | | |
| Class F3 Shares | | | | | | | | | | | | | | | | |
| Shares sold | | | 2,319,004 | | | $ | 23,322,491 | | | | 2,730,663 | | | $ | 27,105,849 | |
| Reinvestment of distributions | | | 182,130 | | | | 1,838,410 | | | | 128,028 | | | | 1,268,743 | |
| Shares reacquired | | | (1,491,244 | ) | | | (14,835,695 | ) | | | (1,263,307 | ) | | | (12,461,095 | ) |
| Increase | | | 1,009,890 | | | $ | 10,325,206 | | | | 1,595,384 | | | $ | 15,913,497 | |
| | | | | | | | | | | | | | | | | |
| Class I Shares | | | | | | | | | | | | | | | | |
| Shares sold | | | 9,148,226 | | | $ | 92,104,562 | | | | 7,564,129 | | | $ | 75,454,717 | |
| Reinvestment of distributions | | | 379,571 | | | | 3,834,185 | | | | 232,500 | | | | 2,302,744 | |
| Shares reacquired | | | (5,303,164 | ) | | | (52,754,322 | ) | | | (5,340,054 | ) | | | (52,572,049 | ) |
| Increase | | | 4,224,633 | | | $ | 43,184,425 | | | | 2,456,575 | | | $ | 25,185,412 | |
| | | | | | | | | | | | | | | | | |
| New Jersey | | | Year Ended
September 30, 2024 | | | | Year Ended
September 30, 2023 | |
| Class A Shares | | | Shares | | | | Amount | | | | Shares | | | | Amount | |
| Shares sold | | | 7,632,346 | | | $ | 35,975,977 | | | | 2,800,538 | | | $ | 12,920,067 | |
| Reinvestment of distributions | | | 461,873 | | | | 2,177,577 | | | | 403,987 | | | | 1,865,997 | |
| Shares reacquired | | | (3,575,896 | ) | | | (16,864,980 | ) | | | (4,072,862 | ) | | | (18,751,446 | ) |
| Increase (decrease) | | | 4,518,323 | | | $ | 21,288,574 | | | | (868,337 | ) | | $ | (3,965,382 | ) |
| | | | | | | | | | | | | | | | | |
| Class F Shares | | | | | | | | | | | | | | | | |
| Shares sold | | | 167,784 | | | $ | 787,584 | | | | 354,525 | | | $ | 1,619,038 | |
| Reinvestment of distributions | | | 22,344 | | | | 105,213 | | | | 28,480 | | | | 131,187 | |
| Shares reacquired | | | (393,820 | ) | | | (1,855,462 | ) | | | (889,706 | ) | | | (4,134,346 | ) |
| Decrease | | | (203,692 | ) | | $ | (962,665 | ) | | | (506,701 | ) | | $ | (2,384,121 | ) |
258
Notes to Financial Statements (concluded)
| New Jersey | | Year Ended
September 30, 2024 | | | Year Ended
September 30, 2023 | |
| Class F3 Shares | | | | | | | | | | | | | | | | |
| Shares sold | | | 234,483 | | | $ | 1,114,745 | | | | 194,925 | | | $ | 880,635 | |
| Reinvestment of distributions | | | 14,003 | | | | 66,109 | | | | 10,920 | | | | 50,515 | |
| Shares reacquired | | | (61,471 | ) | | | (287,684 | ) | | | (130,090 | ) | | | (597,879 | ) |
| Increase | | | 187,015 | | | $ | 893,170 | | | | 75,755 | | | $ | 333,271 | |
| | | | | | | | | | | | | | | | | |
| Class I Shares | | | | | | | | | | | | | | | | |
| Shares sold | | | 3,468,564 | | | $ | 16,344,963 | | | | 2,798,519 | | | $ | 12,943,517 | |
| Reinvestment of distributions | | | 128,020 | | | | 604,397 | | | | 78,209 | | | | 361,530 | |
| Shares reacquired | | | (1,613,138 | ) | | | (7,589,019 | ) | | | (1,900,516 | ) | | | (8,776,141 | ) |
| Increase | | | 1,983,446 | | | $ | 9,360,341 | | | | 976,212 | | | $ | 4,528,906 | |
| | | | | | | | | | | | | | | | | |
| New York | | | Year Ended
September 30, 2024 | | | | Year Ended
September 30, 2023 | |
| Class A Shares | | | Shares | | | | Amount | | | | Shares | | | | Amount | |
| Shares sold | | | 13,575,400 | | | $ | 144,378,225 | | | | 6,385,398 | | | $ | 66,001,310 | |
| Reinvestment of distributions | | | 938,378 | | | | 9,955,744 | | | | 770,866 | | | | 7,974,668 | |
| Shares reacquired | | | (7,014,215 | ) | | | (73,999,182 | ) | | | (9,299,195 | ) | | | (95,454,500 | ) |
| Increase (decrease) | | | 7,499,563 | | | $ | 80,334,787 | | | | (2,142,931 | ) | | $ | (21,478,522 | ) |
| | | | | | | | | | | | | | | | | |
| Class C Shares | | | | | | | | | | | | | | | | |
| Shares sold | | | 431,344 | | | $ | 4,588,622 | | | | 341,562 | | | $ | 3,519,754 | |
| Reinvestment of distributions | | | 37,363 | | | | 395,251 | | | | 40,695 | | | | 420,468 | |
| Shares reacquired | | | (602,710 | ) | | | (6,360,926 | ) | | | (748,800 | ) | | | (7,720,191 | ) |
| Decrease | | | (134,003 | ) | | $ | (1,377,053 | ) | | | (366,543 | ) | | $ | (3,779,969 | ) |
| | | | | | | | | | | | | | | | | |
| Class F Shares | | | | | | | | | | | | | | | | |
| Shares sold | | | 471,608 | | | $ | 5,046,265 | | | | 318,808 | | | $ | 3,262,153 | |
| Reinvestment of distributions | | | 22,626 | | | | 240,409 | | | | 28,697 | | | | 295,966 | |
| Shares reacquired | | | (284,182 | ) | | | (3,042,979 | ) | | | (1,611,382 | ) | | | (16,699,767 | ) |
| Increase (decrease) | | | 210,052 | | | $ | 2,243,695 | | | | (1,263,877 | ) | | $ | (13,141,648 | ) |
| | | | | | | | | | | | | | | | | |
| Class F3 Shares | | | | | | | | | | | | | | | | |
| Shares sold | | | 358,466 | | | $ | 3,815,825 | | | | 164,383 | | | $ | 1,657,672 | |
| Reinvestment of distributions | | | 11,792 | | | | 125,402 | | | | 7,620 | | | | 78,852 | |
| Shares reacquired | | | (90,078 | ) | | | (950,857 | ) | | | (181,489 | ) | | | (1,879,392 | ) |
| Increase (decrease) | | | 280,180 | | | $ | 2,990,370 | | | | (9,486 | ) | | $ | (142,868 | ) |
| | | | | | | | | | | | | | | | | |
| Class I Shares | | | | | | | | | | | | | | | | |
| Shares sold | | | 6,750,679 | | | $ | 71,512,808 | | | | 4,841,720 | | | $ | 50,458,058 | |
| Reinvestment of distributions | | | 287,663 | | | | 3,054,994 | | | | 192,194 | | | | 1,991,405 | |
| Shares reacquired | | | (4,096,431 | ) | | | (43,347,197 | ) | | | (3,368,217 | ) | | | (34,628,246 | ) |
| Increase | | | 2,941,911 | | | $ | 31,220,605 | | | | 1,665,697 | | | $ | 17,821,217 | |
259
Report of Independent Registered Public Accounting Firm
To the shareholders and the Board of Directors of Lord Abbett Municipal Income Fund, Inc.
Opinion on the Financial Statements and Financial Highlights
We have audited the accompanying statements of assets and liabilities of Lord Abbett Municipal Income Fund, Inc. comprising the Lord Abbett Short Duration Tax Free Fund, Lord Abbett Intermediate Tax Free Fund, Lord Abbett National Tax-Free Income Fund, Lord Abbett High Income Municipal Bond Fund, Lord Abbett Short Duration High Income Municipal Bond Fund, Lord Abbett Sustainable Municipal Bond Fund, Lord Abbett California Tax-Free Income Fund, Lord Abbett New Jersey Tax-Free Income Fund, and Lord Abbett New York Tax-Free Income Fund (the “Funds”), including the schedules of investments, as of September 30, 2024; the related statements of operations for the year then ended, the statements of changes in net assets for each of the two years in the period then ended, and the financial highlights for each of the five years in the period then ended for each of the funds constituting the Lord Abbett Municipal Income Fund, Inc., except Lord Abbett Sustainable Municipal Bond Fund; the related statement of operations for the year then ended, and the statements of changes in net assets for each of the two years in the period then ended, and financial highlights for the years ended September 30, 2024 and 2023 and the period from January 5, 2022 (commencement of operations) to September 30, 2022; and the related notes. In our opinion, the financial statements and financial highlights present fairly, in all material respects, the financial position of each of the funds constituting the Lord Abbett Municipal Income Fund, Inc., except Lord Abbett Sustainable Municipal Bond Fund, as of September 30, 2024, and the results of their operations for the year then ended, the changes in their net assets for each of the two years in the period then ended, and the financial highlights for each of the five years in the period then ended in conformity with accounting principles generally accepted in the United States of America. Also, in our opinion, the financial statements and financial highlights present fairly, in all material respects, the financial position of Lord Abbett Sustainable Municipal Bond Fund as of September 30, 2024, the results of its operations for the year then ended, the changes in its net assets for each of the two years in the period then ended, and financial highlights for the years ended September 30, 2024 and 2023 and the period from January 5, 2022 (commencement of operations) to September 30, 2022, in conformity with accounting principles generally accepted in the United States of America.
Basis for Opinion
These financial statements and financial highlights are the responsibility of the Funds’ management. Our responsibility is to express an opinion on the Funds’ financial statements and financial highlights based on our audits. We are a public accounting firm registered with the Public Company Accounting Oversight Board (United States) (PCAOB) and are required to be independent with respect to the Funds in accordance with the U.S. federal securities laws and the applicable rules and regulations of the Securities and Exchange Commission and the PCAOB. We conducted our audits in accordance with the standards of the PCAOB. Those standards require that we plan and perform the audit to obtain reasonable assurance about whether the financial statements and financial highlights are free of material misstatement, whether due to error or fraud. The Funds are not required to have, nor were we engaged to perform, an audit of their internal control over financial reporting. As part of our audits we are required to obtain an understanding of internal control over financial reporting but not for the purpose of expressing an opinion on the effectiveness of the Funds’ internal control over financial reporting. Accordingly, we express no such opinion.
Our audits included performing procedures to assess the risks of material misstatement of the financial statements and financial highlights, whether due to error or fraud, and performing procedures that respond to those risks. Such procedures included examining, on a test basis, evidence regarding the amounts and disclosures in the financial statements and financial highlights. Our audits also included evaluating the accounting principles used and significant estimates made by management, as well as evaluating the overall presentation of the financial statements and financial highlights. Our procedures included confirmation of securities owned as of September 30, 2024, by correspondence with the custodian or counterparties; when replies were not received from counterparties, we performed other auditing procedures. We believe that our audits provide a reasonable basis for our opinion.
/s/ Deloitte & Touche LLP
New York, New York
November 22, 2024
We have served as the auditor of one or more Lord Abbett Family of Funds’ investment companies since 1932.
260
Changes in and Disagreements with Accountants
There were no changes in or disagreements with accountants during the period.
Proxy Disclosures
There were no matters submitted to a vote of shareholders during the period.
Remuneration Paid to Trustees, Officers, and Others
Remuneration paid to directors, officers, and others is included in “Trustees’ Remuneration” under Item 7 of this Form N-CSR.
261
Tax Information (unaudited)
The percentages below reflect the portion of ordinary income distributions paid during the fiscal year ended September 30, 2024 that is tax-exempt dividend income.
| Fund Name | Tax-Exempt
Dividends |
| Short Duration Tax Free Fund | 100% |
| Intermediate Tax Free Fund | 100% |
| National Tax Free Fund | 100% |
| High Income Municipal Bond Fund | 100% |
| Short Duration High Income Municipal Bond Fund | 99% |
| Sustainable Municipal Bond Fund | 100% |
| California Tax Free Fund | 100% |
| New Jersey Tax Free Fund | 100% |
| New York Tax Free Fund | 100% |
262


This report, when not used for the general information of shareholders of the Fund, is to be distributed only if preceded or accompanied by a current fund prospectus. Lord Abbett mutual fund shares are distributed by
LORD ABBETT DISTRIBUTOR LLC. | | Lord Abbett Municipal Income Fund, Inc. Lord Abbett Short Duration Tax Free Fund Lord Abbett Intermediate Tax Free Fund Lord Abbett National Tax-Free Income Fund Lord Abbett High Income Municipal Bond Fund Lord Abbett Short Duration High Income Municipal Bond Fund Lord Abbett Sustainable Municipal Bond Fund Lord Abbett California Tax-Free Income Fund Lord Abbett New Jersey Tax-Free Income Fund Lord Abbett New York Tax-Free Income Fund | | LATFI-2
(11/24) |
| Item 12: | Disclosure of Proxy Voting Policies and Procedures for Closed-End Management Investment Companies. |
| Not applicable. |
| | |
| Item 13: | Portfolio Managers of Closed-End Management Investment Companies. |
| Not applicable. |
| | |
| Item 14: | Purchases of Equity Securities by Closed-End Management Investment Company and Affiliated Purchasers. |
| Not applicable. |
| | |
| Item 15: | Submission of Matters to a Vote of Security Holders. |
| Not applicable. |
| | |
| Item 16: | Controls and Procedures. |
| (a) | The principal executive officer and principal financial & accounting officer have concluded as of a date within 90 days of the filing date of this report, based on their evaluation of the Registrant’s disclosure controls and procedures (as defined in Rule 30a-3(c) under the Investment Company Act of 1940), that the design of such procedures is effective to provide reasonable assurance that material information required to be disclosed by the Registrant on Form N-CSR is recorded, processed, summarized and reported within the time periods specified in the Commission’s rules and forms. |
| | | |
| (b) | There were no changes in the Registrant’s internal control over financial reporting (as defined in Rule 30a-3(d) under the Investment Company Act of 1940) that occurred during the period covered by this report that have materially affected, or are reasonably likely to materially affect, the Registrant’s internal control over financial reporting. |
| | |
| Item 17: | Disclosure of Securities Lending Activities for Closed-End Management Investment Companies. |
| Not applicable. |
| | |
| Item 18: | Recovery of Erroneously Awarded Compensation. |
| Not applicable. |
| | |
| Item 19: | Exhibits. |
SIGNATURES
Pursuant to the requirements of the Securities Exchange Act of 1934 and the Investment Company Act of 1940, the Registrant has duly caused this report to be signed on its behalf by the undersigned, thereunto duly authorized.
| | LORD ABBETT MUNICIPAL INCOME FUND, INC. |
| | By: | /s/ Douglas B. Sieg |
| | | Douglas B. Sieg |
| | | President and Chief Executive Officer
(Principal Executive Officer) |
Date: November 26, 2024
Pursuant to the requirements of the Securities Exchange Act of 1934 and the Investment Company Act of 1940, this report has been signed below by the following persons on behalf of the Registrant and in the capacities and on the dates indicated.
| | By: | /s/ Douglas B. Sieg |
| | | Douglas B. Sieg |
| | | President and Chief Executive Officer
(Principal Executive Officer) |
Date: November 26, 2024
| | By: | /s/ Michael J. Hebert |
| | | Michael J. Hebert |
| | | Chief Financial Officer and Treasurer
(Principal Financial Officer) |
Date: November 26, 2024
0000737800lordabbett:LordAbbettIndexBloombergAggregateBondIndex17049AdditionalIndexMember2019-04-300000737800lordabbett:LordAbbettIndexBloombergAggregateBondIndex16716AdditionalIndexMember2017-06-300000737800lordabbett:LordAbbettIndexLipperCaliforniaMunicipalDebtFundsAverage16719AdditionalIndexMember2021-08-310000737800lordabbett:C000096632Member2015-06-300000737800lordabbett:LordAbbettIndexBloomberg1Minus15YearMunicipalBondIndex17031BroadBasedIndexMember2016-08-310000737800lordabbett:LordAbbettIndexBloombergAggregateBondIndex16724AdditionalIndexMember2020-06-300000737800lordabbett:LordAbbettIndexBloombergAggregateBondIndex16722AdditionalIndexMember2024-08-310000737800lordabbett:LordAbbettIndexBloombergMunicipalBondIndex16727BroadBasedIndexMember2015-08-310000737800lordabbett:LordAbbettIndexLipperNewJerseyMunicipalDebtFundsAverage16726AdditionalIndexMember2020-01-310000737800lordabbett:C000096635Member2021-07-310000737800lordabbett:C000188228Memberlordabbett:OtherLineCTIMember2024-09-300000737800lordabbett:LordAbbettIndexBloomberg1Minus15YearMunicipalBondIndex16707BroadBasedIndexMember2024-09-300000737800lordabbett:LordAbbettIndexBloombergAggregateBondIndex16733AdditionalIndexMember2019-12-310000737800lordabbett:LordAbbettIndexBloombergMunicipalBond1Minus8YearIndex17063BroadBasedIndexMember2022-03-31iso4217:USDxbrli:shares