Lord Abbett Municipal Income Fund Lord Abbett Short Duration Tax Free Fund, Lord Abbett Intermediate Tax Free Fund, Lord Abbett National Tax Free Income Fund, Lord Abbett High Income Municipal Bond Fund, Lord Abbett Short Duration High Income Municipal Bond Fund, Lord Abbett Sustainable Municipal Bond Fund, Lord Abbett California Tax Free Income Fund, Lord Abbett New Jersey Tax Free Income Fund, and Lord Abbett New York Tax Free Income Fund Annual Report
For the fiscal year ended September 30, 2023
From left to right: James L.L. Tullis, Chair of the Lord Abbett Funds and Douglas B. Sieg Director, President and Chief Executive Officer of the Lord Abbett Funds.
Dear Shareholders: We are pleased to provide you with this overview of the performance of the Funds for the fiscal year ended September 30, 2023. On this page and the following pages, we discuss the major factors that influenced period performance. For detailed and timely information about the Funds, please visit our website at www.lordabbett.com, where you can also access the quarterly commentaries that provide updates on each Fund’s performance and other portfolio related updates.
Thank you for investing in Lord Abbett mutual funds. We value the trust that you place in us and look forward to serving your investment needs in the years to come.
Best regards,
Douglas B. Sieg
Director, President and Chief Executive Officer
Municipal Bond Market Review
The municipal bond market continued to be impacted by interest rate volatility, aggressive tightening of
monetary policy by the U.S. Federal Reserve (the Fed), and fluctuating inflation expectations over the fiscal year. However, municipal bonds generated positive returns, as measured
1
by the Bloomberg Municipal Bond Index3, and outperformed Treasuries over the period. Demand stabilized from 2022’s record-setting redemptions with a deceleration in tax-loss selling, and the fundamental backdrop of the market remained strong as upgrades significantly outpaced downgrades and states’ rainy-day balances remained near record levels.
The fiscal year began with cautious sentiment due to persistently high inflation data and a hawkish tone from global central banks. Benchmark municipal yields increased dramatically and outflows from municipal bond funds intensified on the back of rising Treasury yields, while concerns emerged about a potential economic downturn.
The market shifted to a more positive tone with inflation showing signs of decelerating, resulting in a rally in November of 2022 and the best January performance for the Bloomberg Municipal Bond Index3 since 2009. A significantly inverted Treasury curve and strong demand for tax-free bonds maturing within 10 years led to the municipal yield curve becoming inverted from 2 to 10 years for the first time in history in December and remained inverted for the rest of the period. Turmoil in the regional banking sector dominated the headlines in the spring, with the focus on liquidity from increasing deposit withdrawals and the impact of the Fed’s aggressive tightening cycle. As a result, high quality municipal yields fell across the curve and credit spreads widened.
Optimism regarding a soft economic landing grew heading into the summer months given signs of disinflation and strong consumer data, and municipals benefitted from technical tailwinds from substantial reinvestment of coupons and maturity proceeds. However, by the close of the fiscal year, stronger-than-expected economic data and elevated inflation readings once again put upward pressure on interest rates. Consequently, benchmark municipal yields eclipsed the previous local highs set in October of 2022 amid the Treasury curve bear steepening at the close of the fiscal year.1
Overall, municipal yields rose across the curve over the period, while long maturities slightly outperformed bonds with shorter maturities. Lower-rated bonds outperformed higher-rated issues amid constrained supply and some compression of credit spreads. From a technical perspective, new issuance of municipal bonds from January to the end of September was $268 billion, representing a 11% decrease from the same period in 2022. Meanwhile, according to Lipper data, municipal bond funds experienced modest outflows overall from January to the end of September with year-to-date net flows of approximately -$12.0 billion.2
Short Duration Tax Free
The Short Duration Tax Free Fund returned 2.29%, reflecting performance at the net asset value (NAV) of class A Shares with all distributions reinvested,
2
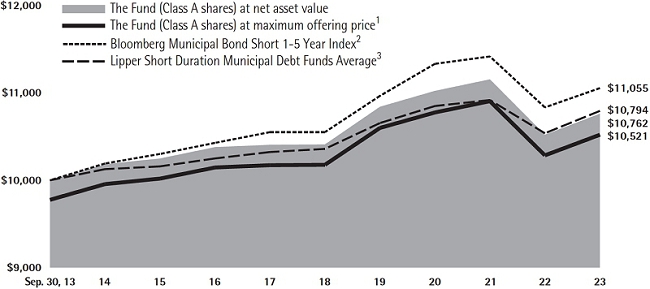
for the 12-month period ended September 30, 2023. The Fund’s benchmark, the Bloomberg Municipal Bond Short 1-5 Year Index6, returned 2.05% during the same period. The primary drivers of relative outperformance were the Fund’s duration and yield curve positioning. Municipal yields rose across the curve on the back of rising Treasury yields amid “higher-for-longer” messaging by the Fed and strong economic data releases. Therefore, the Fund’s shorter duration relative to the benchmark contributed to relative performance. Additionally, an underweight to short-term maturities, where yields rose most, and a slight overweight to intermediate maturities, where yields rose less, led to a positive impact on relative performance.
The Fund’s credit quality positioning also contributed to relative performance, mainly due to an overweight to bonds rated BBB and below. Lower rated, investment grade and non-investment grade bonds outperformed higher rated bonds over the period, partially due to lower supply of lower-rated bonds and a compression of credit spreads.
Security selection and the Fund’s sector allocation led to a negative impact on relative performance. In particular, an overweight to, as well as selection within, the Power, Industrial Development (IDR) and Health Care sectors detracted from relative returns. Within Health Care, an allocation to non-
investment grade Hospitals detracted from relative returns amid the selling pressures the segment faced due to negative financial results for 2022.
Intermediate Tax Free
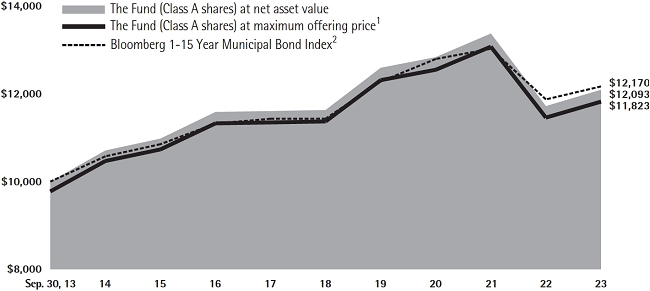
The Intermediate Tax Free Fund returned 3.17%, reflecting performance at the net asset value (NAV) of class A Shares with all distributions reinvested, for the 12-month period ended September 30, 2023. The Fund’s benchmark, the Bloomberg 1-15 Year Municipal Bond Index7, returned 2.50% during the same period. The primary driver of relative performance over the period was the Fund’s credit quality positioning, specifically the Fund’s overweight to bonds rated BBB and below. Lower rated, investment grade and non-investment grade bonds outperformed, partially due to lower supply of lower-rated bonds and a compression of credit spreads.
Security selection also contributed to relative returns. In particular, selection within the General Obligation (GO), Leasing, Transportation and Special Tax sectors were contributors. Within the State GO sector, selection of Illinois State bonds contributed to relative returns as the issuer was upgraded amid the state government’s growing tax revenues, increased reserves and improvements in pension funding.
The Fund’s sector allocation detracted from relative performance, mainly from allocations to the IDR, Health Care and
3
Education sectors. Within Health Care, an allocation to non-investment grade Hospitals detracted from relative returns amid the selling pressures the segment has faced given the negative financial results for 2022.
Duration positioning also detracted from relative performance. Overall, municipal yields rose across the curve on the back of rising Treasury yields amid “higher-for-longer” messaging by the Fed and strong economic data releases. Therefore, the Fund’s longer duration relative to the benchmark detracted from relative performance. However, some of this was offset by yield curve positioning. More specifically, an underweight to short maturity bonds, where yields rose most, and an overweight to intermediate-term bonds, where yields rose less, led to a positive impact on relative performance.
National Tax Free
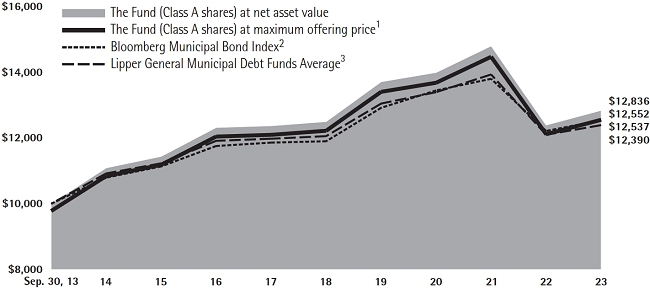
The National Tax Free Fund returned 3.61%, reflecting performance at the net asset value (NAV) of class A Shares with all distributions reinvested, for the 12-month period ended September 30, 2023. The Fund’s benchmark, the Bloomberg Municipal Bond Index3, returned 2.66% during the same period. The primary driver of relative performance over the period was the Fund’s credit quality positioning, specifically the Fund’s overweight to bonds rated BBB and below. Lower-rated, investment grade and non-investment grade bonds outperformed higher-rated
bonds, partially due to lower supply of lower-rated bonds and a compression of credit spreads.
Security selection also contributed to relative returns. In particular, selection within the General Obligation, Leasing, IDR, Transportation and Special Tax sectors were contributors. The positive impact across many of these sectors was tied to selection of credits with favorable bond structures, including coupon, call protection and convexity profile.
The Fund’s sector allocation detracted from relative performance, mainly from allocations to the IDR, Health Care and Power sectors. Within Health Care, an allocation to non-investment grade Hospitals detracted from relative returns amid the selling pressures the segment has faced given the negative financial results for 2022.
Duration positioning also detracted from relative performance. Overall, municipal yields rose across the curve on the back of rising Treasury yields amid “higher-for-longer” messaging by the Fed and strong economic data releases. Therefore, the Fund’s longer duration relative to the benchmark detracted from relative performance. However, some of this was offset by yield curve positioning. More specifically, an underweight to short maturity bonds, where yields rose most, and an overweight to intermediate-term bonds, where yields rose less, led to a positive impact on relative performance.
4
High Income Municipal Bond
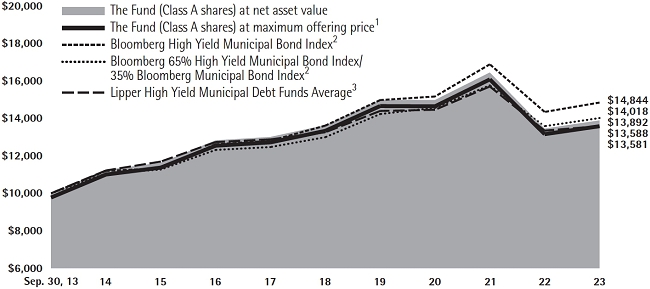
The High Income Municipal Bond Fund returned 3.23%, reflecting performance at the net asset value (NAV) of class A Shares with all distributions reinvested, for the 12-month period ended September 30, 2023. The Fund’s benchmark, the Bloomberg High Yield Municipal Bond Index5, returned 3.48% during the same period. The primary drivers of relative underperformance over the period were security selection and the Fund’s sector allocation. In particular, allocations to, as well as selection within, the Education, Special Tax and IDR sectors detracted from relative performance. Within the Education sector, selection of lower-rated colleges, universities and charter schools experienced selling pressures and detracted from relative performance. Additionally, the Fund’s positioning within the Special Tax sector relative to the index, particularly its lesser weighting to various Puerto Rico bonds, led to a negative impact on relative performance.
The Fund’s credit quality positioning also detracted from relative performance. As high yield municipal bonds generally outperformed investment grade bonds over the period, the Fund’s modest exposure to AA and A-rated bonds, which the Fund maintains to enhance liquidity and provide diversification, compared to the fully non-investment grade benchmark, detracted from relative performance.
The Fund’s duration and yield curve positioning contributed to relative performance. An underweight to short maturity bonds, where yields rose most, and an overweight to intermediate-term bonds, where yields rose less, led to a positive impact on relative performance.
Short Duration High Income Municipal Bond
The Short Duration High Yield Municipal Bond Fund returned 3.27%, reflecting performance at the net asset value (NAV) of class A Shares with all distributions reinvested, for the 12-month period ended September 30, 2022. The Fund’s benchmark, the Bloomberg Municipal Bond 1-8 Year Index8, returned 2.08% during the same period. The primary drivers of relative performance were the Fund’s duration and yield curve positioning. In particular, an underweight to short-term maturities, where yields rose most, and a slight overweight to intermediate maturities, where yields rose less, led to a positive impact on relative performance.
The Fund’s credit quality positioning, specifically the Fund’s overweight to BBB-rated bonds, also contributed to relative performance. Lower-rated, investment grade bonds outperformed higher-rated bonds over the period, partially due to lower supply of lower-rated bonds and a compression of credit spreads.
Security selection led to a positive impact on relative performance, particularly within the IDR sector. More
5
specifically, selection of various prepaid gas and commodity issuers outperformed and benefitted relative performance.
The Fund’s sector allocation detracted from relative returns. Most notably, an overweight to the Health Care sector and underweight to the Power sector dragged on relative performance. Within Health Care, an allocation to non-investment grade Hospitals detracted from relative returns amid the selling pressures the segment has faced given the negative financial results for 2022.
Sustainable Municipal Bond Fund
The Sustainable Municipal Bond Fund returned 3.57%, reflecting performance at the net asset value (NAV) of class A Shares with all distributions reinvested, for the 12-month period ended September 30, 2023. The Fund’s benchmark, the Bloomberg 1-15 Year Municipal Bond Index7, returned 2.50% during the same period. The primary driver of relative outperformance over the period was the Fund’s credit quality positioning. The Fund’s overweight to bonds rated BBB and below contributed to relative returns as lower rated, investment grade and non-investment grade bonds outperformed higher rated bonds over the period, partially due to lower supply and a compression of credit spreads.
Security selection also contributed to relative returns. In particular, selection within the Leasing, Education and Local GO sectors were contributors. The positive
impact across many of these sectors was tied to selection of credits with favorable bond structures, including coupon, call protection and convexity profile.
The Fund’s sector allocation had little impact on relative performance. While an overweight to the IDR and Housing sectors contributed to relative returns, this was offset by an overweight to the Education and Health Care sectors, which dragged on relative returns.
Duration positioning detracted from relative performance. The Fund’s longer duration relative to the benchmark detracted from relative performance as municipal yields rose across the curve on the back of rising Treasury yields amid “higher-for-longer” messaging by the Fed and strong economic data releases.
California Tax Free
The California Tax Free Fund returned 3.50%, reflecting performance at the net asset value (NAV) of class A Shares with all distributions reinvested, for the 12-month period ended September 30, 2023. The Fund’s benchmark, the Bloomberg Municipal Bond Index3, returned 2.66% during the same period. The primary driver of relative performance over the period was the Fund’s credit quality positioning, specifically the Fund’s overweight to bonds rated BBB and below. Lower-rated, investment grade and non-investment grade bonds outperformed higher-rated bonds, partially due to lower supply of lower-rated bonds and a compression of credit spreads.
6
Security selection also contributed to relative returns. In particular, selection within the General Obligation, Health Care, Education, Transportation and Power sectors were contributors. The positive impact across many of these sectors was tied to selection of credits with favorable bond structures, including coupon, call protection and convexity profile.
Duration positioning detracted from relative performance. Municipal yields rose across the curve on the back of rising Treasury yields amid “higher-for-longer” messaging by the Fed and strong economic data releases. Therefore, the Fund’s longer duration detracted from relative performance. However, some of this was offset by yield curve positioning. More specifically, an underweight to short maturity bonds, where yields rose most, and an overweight to intermediate-term bonds, where yields rose less, led to a positive impact on relative performance.
The Fund’s sector allocation also detracted from relative performance. In particular, an overweight to the Education and Health Care sectors as well as an underweight to the Leasing sector led to a negative impact on relative performance. In regard to Health Care, an allocation to non-investment grade Hospitals detracted from relative returns amid the selling pressures the segment has faced given the negative financial results for 2022.
New Jersey Tax Free
The New Jersey Tax Free Fund returned 4.11%, reflecting performance at the net asset value (NAV) of class A Shares with all distributions reinvested, for the 12-month period ended September 30, 2023. The Fund’s benchmark, the Bloomberg Municipal Bond Index3, returned 2.66% during the same period. The primary driver of relative performance over the period was the Fund’s credit quality positioning. Lower-rated, investment grade and non-investment grade bonds outperformed higher-rated bonds over the period, partially due to lower supply of lower-rated bonds and a compression of credit spreads. Therefore, the Fund’s overweight to bonds rated BBB and below contributed to relative returns.
Security selection also contributed to relative returns. In particular, selection within the General Obligation, Health Care, Education, Leasing and Transportation sectors were contributors. Within the State GO sector, holdings of New Jersey state bonds led to a positive impact as the issuer was upgraded over the period amid its budget surplus and increasing pension payments.
The Fund’s sector allocation led to a positive impact on relative performance, particularly overweight allocations to the Tobacco and Leasing sectors.
New York Tax Free
The New York Tax Free Fund returned 3.93%, reflecting performance at the net asset value (NAV) of class A Shares with
7
all distributions reinvested, for the 12-month period ended September 30, 2023. The Fund’s benchmark, the Bloomberg Municipal Bond Index3, returned 2.66% during the same period. The primary driver of relative outperformance over the period was the Fund’s credit quality positioning. Lower rated, investment grade and non-investment grade bonds outperformed higher rated bonds over the period, partially due to lower supply of lower-rated bonds and a compression of credit spreads. Therefore, the Fund’s overweight to bonds rated BBB and below contributed to relative returns.
Security selection also contributed to relative returns, mainly within the Transportation, Special Tax and Leasing sectors. The positive impact across many of these sectors was tied to selection of credits with favorable bond structures, including coupon, call protection and convexity profile.
Duration positioning detracted from relative performance. The Fund’s longer duration relative to the benchmark detracted from relative performance as municipal yields rose across the curve on the back of rising Treasury yields amid “higher-for-longer” messaging by the Fed and strong economic data releases.
The Fund’s sector allocation also detracted from relative performance. In particular, an overweight to the Health Care and Education sectors dragged on relative performance. Within Health Care, an allocation to non-investment grade Hospitals detracted from relative returns amid the selling pressures the segment has faced given the negative financial results for 2022 that were reported throughout the period.
Each Fund’s portfolio is actively managed and, therefore, holdings and the weightings of a particular issuer or particular sector as a percentage of portfolio assets are subject to change. Sectors may include many industries.
1 Factset as of 9/30/2023
2 JPM as of 9/30/2023
3The Bloomberg Municipal Bond Index is a rules-based, market-value-weighted index engineered for the long-term tax-exempt bond market. Bonds must be rated investment-grade (Baa3/BBB- or higher) by at least two ratings agencies. They must have an outstanding par value of at least $7 million and be issued as part of a transaction of at least $75 million. The bonds must be fixed rate, have a dated-date after December 31, 1990, and must be at least one year from their maturity date.
4 Bloomberg BVAL AAA GO Municipal Yield Curve
5The Bloomberg High Yield Municipal Bond Index is an unmanaged index consisting of noninvestment-grade, unrated or below Ba1 bonds.
6The Bloomberg Municipal Bond Short 1-5 Year Index is the Muni Short 1-5 year component of the Municipal Bond index. The Bloomberg Municipal Bond Index is a rules-based, market-value-weighted index engineered for the long-term tax-exempt bond market. The index is a broad measure of the municipal bond market with maturities of at least one year. To be included in the index, bonds must be rated investment-grade (Baa3/BBB- or higher) by at least two of the following ratings agencies: Moody’s, S&P, Fitch. If only two of the three agencies rate the security, the lower rating is used to determine index eligibility. If only one of the three agencies rates a security, the rating must be investment grade. They must have an outstanding par value of at least $7 million and be issued as part of a transaction of at
8
least $75 million. The bonds must be fixed rate, have a dated-date after December 31, 1990, and must be at least one year from their maturity date.
7The Bloomberg 1-15 Year Municipal Bond index is the 1-15 year component of the Municipal Bond index. The Bloomberg Municipal Bond Index is a rules-based, market-value-weighted index engineered for the long-term tax-exempt bond market. The index is a broad measure of the municipal bond market with maturities of at least one year. To be included in the index, bonds must be rated investment-grade (Baa3/BBB- or higher) by at least two of the following ratings agencies: Moody’s, S&P, Fitch. If only two of the three agencies rate the security, the lower rating is used to determine index eligibility. If only one of the three agencies rates a security, the rating must be investment-grade. They must have an outstanding par value of at least $7 million and be issued as part of a transaction of at least $75 million. The bonds must be fixed rate, have a dated-date after December 31, 1990, and must be at least one year from their maturity date.
8The Bloomberg Municipal Bond 1-8 Year Index is the 1-8 year component of the Municipal Bond index. The Bloomberg Municipal Bond Index is a rules-based, market-value-weighted index engineered for the long-term tax-exempt bond market. The index is a broad measure of the municipal bond market with maturities of at least one year. Bonds must have an outstanding par value of at least $7 million and be issued as part of a transaction of at least $75 million.
Unless otherwise specified, indexes reflect total return, with all dividends reinvested. Indexes are unmanaged, do not reflect the deduction of fees or expenses, and are not available for direct investment.
Important Performance and Other Information Performance data quoted in the following pages reflect past performance and are no guarantee of future results. Current performance may be higher or lower than the performance quoted. The investment return and principal value of an investment in the Funds will fluctuate so that shares, on any given day or when redeemed, may be worth more or less than their original cost. You can obtain performance data current to the most recent month end by calling Lord Abbett at 888-522-2388 or referring to www.lordabbett.com.
Except where noted, comparative Fund performance does not account for the deduction of sales charges and would be different if sales charges were included. Each Fund offers classes of shares with distinct pricing options. For a full description of the differences in pricing alternatives, please see each Fund’s prospectus.
During certain periods shown, expense waivers and reimbursements were in place. Without such expense waivers and reimbursements, each Fund’s returns would have been lower.
The annual commentary above discusses the views of the Funds’ management and various portfolio holdings of the Funds as of September 30, 2023. These views and portfolio holdings may have changed after this date. Information provided in the commentary is not a recommendation to buy or sell securities. Because the Funds’ portfolios are actively managed and may change significantly, the Funds may no longer own the securities described above or may have otherwise changed their positions in the securities. For more recent information about the Funds’ portfolio holdings, please visit www.lordabbett.com.
A Note about Risk: See Notes to Financial Statements for a discussion of investment risks. For a more detailed discussion of the risks associated with each Fund, please see the Fund’s prospectus.
Mutual funds are not insured by the FDIC, are not deposits or other obligations of, or guaranteed by, banks, and are subject to investment risks including possible loss of principal amount invested.
9
Short Duration Tax Free Fund
Investment Comparison
Below is a comparison of a $10,000 investment in Class A shares to the same investment in the Bloomberg Municipal Bond Short 1-5 Year Index and the Lipper Short Duration Municipal Debt Funds Average, assuming reinvestment of all dividends and distributions. The performance of other classes will be greater than or less than the performance shown in the graph below due to different sales loads and expenses applicable to such classes. The graph and performance table below do not reflect the deduction of taxes that a shareholder would pay on Fund distributions or the redemption of Fund shares. During certain periods, expenses of the Fund have been waived or reimbursed by Lord Abbett; without such waiver or reimbursement of expenses, the Fund’s returns would have been lower. Past performance is no guarantee of future results.
Average Annual Total Returns at Maximum Applicable Sales Charge for the Periods Ended September 30, 2023
1 Year
5 Year
10 Year
Life of Class
Class A4
-0.01%
0.21%
0.51%
–
Class C5
0.74%
0.04%
0.11%
–
Class F6
2.39%
0.77%
0.83%
–
Class F37
2.54%
0.90%
–
0.91%
Class I6
2.50%
0.87%
0.94%
–
1 Reflects the deduction of the maximum initial sales charge of 2.25%.
2 Performance for the unmanaged index does not reflect any fees or expenses. The performance of the index is not necessarily representative of the Fund’s performance.
3 Source: Lipper Inc. The performance of the average is not necessarily representative of the Fund’s performance.
4 Total return, which is the percent change in value, after deduction of the maximum initial sales charge of 2.25% applicable to Class A shares, with all dividends and distributions
reinvested for period shown ended September 30, 2023, is calculated using the SEC required uniform method to compute such return.
5 The 1% CDSC for Class C shares normally applies before the first anniversary of the purchase date. Performance for other periods is at net asset value.
6 Performance is at net asset value.
7 Class F3 shares commenced operations and performance for the class began on April 4, 2017. Performance is at net asset value.
10
Intermediate Tax Free Fund
Investment Comparison
Below is a comparison of a $10,000 investment in Class A shares to the same investment in the Bloomberg 1-15 Year Municipal Bond Index, assuming reinvestment of all dividends and distributions. The performance of other classes will be greater than or less than the performance shown in the graph below due to different sales loads and expenses applicable to such classes. The graph and performance table below do not reflect the deduction of taxes that a shareholder would pay on Fund distributions or the redemption of Fund shares. During certain periods, expenses of the Fund have been waived or reimbursed by Lord Abbett; without such waiver or reimbursement of expenses, the Fund’s returns would have been lower. Past performance is no guarantee of future results.
Average Annual Total Returns at Maximum Applicable Sales Charge for the Periods Ended September 30, 2023
1 Year
5 Year
10 Year
Life of Class
Class A3
0.89%
0.33%
1.69%
–
Class C4
1.64%
0.15%
1.28%
–
Class F5
3.38%
0.88%
2.02%
–
Class F36
3.54%
1.05%
–
1.35%
Class I5
3.48%
0.98%
2.12%
–
1 Reflects the deduction of the maximum initial sales charge of 2.25%.
2 Performance for the unmanaged index does not reflect any fees or expenses. The performance of the index is not necessarily representative of the Fund’s performance.
3 Total return, which is the percent change in value, after deduction of the maximum initial sales charge of 2.25% applicable to Class A shares, with all dividends and distributions reinvested for periods shown ended September 30, 2023, is calculated using the SEC required uniform method to compute such return.
4 The 1% CDSC for Class C shares normally applies before the first anniversary of the purchase date. Performance for other periods is at net asset value.
5 Performance is at net asset value.
6 Class F3 shares commenced operations and performance for the class began on April 4, 2017. Performance is at net asset value.
11
National Tax Free Fund
Investment Comparison
Below is a comparison of a $10,000 investment in Class A shares to the same investment in the Bloomberg Municipal Bond Index and the Lipper General Municipal Debt Funds Average, assuming reinvestment of all dividends and distributions. The performance of other classes will be greater than or less than the performance shown in the graph below due to different sales loads and expenses applicable to such classes. The graph and performance table below do not reflect the deduction of taxes that a shareholder would pay on Fund distributions or the redemption of Fund shares. During certain periods, expenses of the Fund have been waived or reimbursed by Lord Abbett; without such waiver or reimbursement of expenses, the Fund’s returns would have been lower. Past performance is no guarantee of future results.
Average Annual Total Returns at Maximum Applicable Sales Charge for the Periods Ended September 30, 2023
1 Year
5 Year
10 Year
Life of Class
Class A4
1.24%
0.08%
2.30%
–
Class C5
1.97%
-0.11%
1.88%
–
Class F6
3.72%
0.63%
2.63%
–
Class F37
3.75%
0.75%
–
1.37%
Class I6
3.72%
0.72%
2.71%
–
1 Reflects the deduction of the maximum initial sales charge of 2.25%.
2 Performance for the unmanaged index does not reflect any fees or expenses. The performance of the index is not necessarily representative of the Fund’s performance.
3 Source: Lipper Inc. The performance of the average is not necessarily representative of the Fund’s performance.
4 Total return, which is the percent change in value, after deduction of the maximum initial sales charge of 2.25% applicable to Class A shares, with all dividends and distributions reinvested for periods shown ended September 30, 2023, is calculated using the SEC required uniform method to compute such return.
5 The 1% CDSC for Class C shares normally applies before the first anniversary of the purchase date. Performance for other periods is at net asset value.
6 Performance is at net asset value.
7 Class F3 shares commenced operations and performance for the class began on April 4, 2017. Performance is at net asset value.
12
High Income Municipal Bond Fund
Investment Comparison
Below is a comparison of a $10,000 investment in Class A shares to the same investment in the Bloomberg High Yield Municipal Bond Index, Bloomberg 65% High Yield Municipal Bond Index/35% Bloomberg Municipal Bond Index and the Lipper High Yield Municipal Debt Funds Average, assuming reinvestment of all dividends and distributions. The performance of other classes will be greater than or less than the performance shown in the graph below due to different sales loads and expenses applicable to such classes. The graph and performance table below do not reflect the deduction of taxes that a shareholder would pay on Fund distributions or the redemption of Fund shares. During certain periods, expenses of the Fund have been waived or reimbursed by Lord Abbett; without such waiver or reimbursement of expenses, the Fund’s returns would have been lower. Past performance is no guarantee of future results.
Average Annual Total Returns at Maximum Applicable Sales Charge for the Periods Ended September 30, 2023
1 Year
5 Year
10 Year
Life of Class
Class A4
0.86%
-0.08%
3.11%
–
Class C5
1.59%
-0.27%
2.68%
–
Class F6
3.33%
0.49%
3.44%
–
Class F37
3.48%
0.62%
–
1.86%
Class I6
3.43%
0.58%
3.51%
–
1 Reflects the deduction of the maximum initial sales charge of 2.25%.
2 Performance for the unmanaged index does not reflect any fees or expenses. The performance of the index is not necessarily representative of the Fund’s performance.
3 Source: Lipper Inc. The performance of the average is not necessarily representative of the Fund’s performance.
4 Total return, which is the percent change in value, after deduction of the maximum initial sales charge of 2.25% applicable to Class A shares, with all dividends and distributions reinvested for
periods shown ended September 30, 2023, is calculated using SEC required uniform method to compute such return.
5 The 1% CDSC for Class C shares normally applies before the first anniversary of the purchase date. Performance for other periods is at net asset value.
6 Performance is at net asset value.
7 Class F3 shares commenced operations and performance for the class began on April 4, 2017. Performance is at net asset value.
13
Short Duration High Income Municipal Bond Fund
Investment Comparison
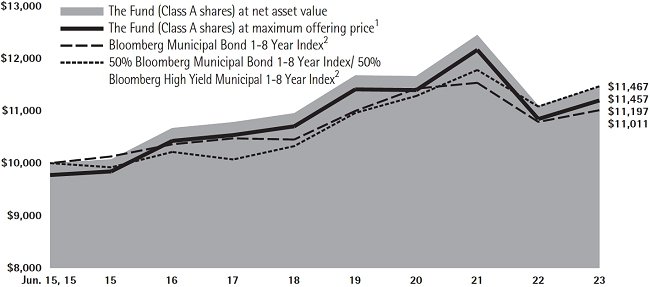
Below is a comparison of a $10,000 investment in Class A shares to the same investment in the Bloomberg Municipal Bond 1-8 Year Index and the 50% Bloomberg Municipal Bond 1-8 Year Index/50% Bloomberg High Yield Municipal 1-8 Year Index, assuming reinvestment of all dividends and distributions. The performance of other classes will be greater than or less than the performance shown in the graph below due to different sales loads and expenses applicable to such classes. The graph and performance table below do not reflect the deduction of taxes that a shareholder would pay on Fund distributions or the redemption of Fund shares. During certain periods, expenses of the Fund have been waived or reimbursed by Lord Abbett; without such waiver or reimbursement of expenses, the Fund’s returns would have been lower. Past performance is no guarantee of future results.
Average Annual Total Returns at Maximum Applicable Sales Charge for the Periods Ended September 30, 2023
1 Year
5 Year
10 Year
Life of Class
Class A3
0.93%
0.44%
–
1.37%
Class C4
1.59%
0.22%
–
0.95%
Class F5
3.36%
1.00%
–
1.75%
Class F36
3.55%
1.16%
–
1.70%
Class I5
3.40%
1.09%
–
1.85%
1 Reflects the deduction of the maximum initial sales charge of 2.25%.
2 Performance for the unmanaged index does not reflect any fees or expenses. The performance of the index is not necessarily representative of the Fund’s performance.
3 Class A shares commenced operations on June 1, 2015 and performance for the Class began on June 15, 2015. Total return, which is the percent change in value, after deduction of the maximum initial sales charge of 2.25% applicable to Class A shares, with all dividends and distributions reinvested for periods shown ended September 30, 2023, is calculated using SEC required uniform method to compute such return.
4 Class C shares commenced operations on June 1, 2015 and performance for the Class began on June 15, 2015. The 1% CDSC for Class C shares normally applies before the first anniversary of the purchase date. Performance for other periods is at net asset value.
5 Class F and Class I shares commenced operations on June 1, 2015 and performance for each class began on June 15, 2015. Performance is at net asset value.
6 Class F3 shares commenced operations and performance for the class began on April 4, 2017. Performance is at net asset value.
14
Sustainable Municipal Bond Fund
Investment Comparison
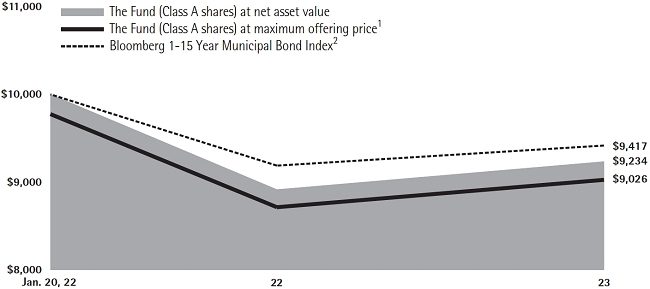
Below is a comparison of a $10,000 investment in Class A shares to the same investment in the Bloomberg 1-15 Year Municipal Bond Index, assuming reinvestment of all dividends and distributions. The performance of other classes will be greater than or less than the performance shown in the graph below due to different sales loads and expenses applicable to such classes. The graph and performance table below do not reflect the deduction of taxes that a shareholder would pay on Fund distributions or the redemption of Fund shares. During certain periods, expenses of the Fund have been waived or reimbursed by Lord Abbett; without such waiver or reimbursement of expenses, the Fund’s returns would have been lower. Past performance is no guarantee of future results.
Average Annual Total Returns at Maximum Applicable Sales Charge for the Periods Ended September 30, 2023
1 Year
5 Year
10 Year
Life of Class
Class A3
1.27%
–
–
-5.88%
Class C4
1.77%
–
–
-5.37%
Class F5
3.67%
–
–
-4.50%
Class F35
3.82%
–
–
-4.36%
Class I5
3.78%
–
–
-4.40%
1 Reflects the deduction of the maximum initial sales charge of 2.25%.
2 Performance for the unmanaged index does not reflect any fees or expenses. The performance of the index is not necessarily representative of the Fund’s performance.
3 Class A shares commenced operations on January 5, 2022 and performance for the Class began on January 20, 2022. Total return, which is the percent change in value, after deduction of the maximum initial sales charge of 2.25% applicable to Class A shares, with all dividends and distributions reinvested for periods
shown ended September 30, 2023, is calculated using SEC required uniform method to compute such return.
4 Class C shares commenced operations on January 5, 2022 and performance for the Class began on January 20, 2022. The 1% CDSC for Class C shares normally applies before the first anniversary of the purchase date. Performance for other periods is at net asset value.
5 Commenced operations on January 5, 2022 and performance for the Classes began on January 20, 2022. Performance is at net asset value.
15
California Tax Free Fund
Investment Comparison
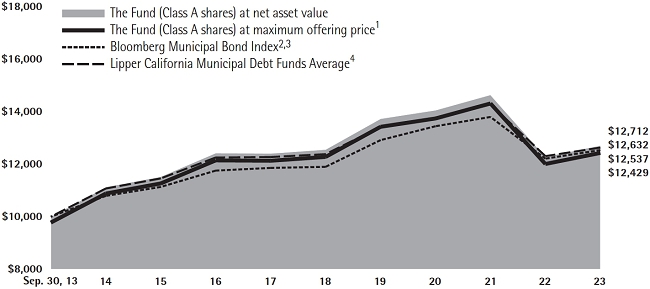
Below is a comparison of a $10,000 investment in Class A shares to the same investment in the Bloomberg Municipal Bond Index and the Lipper California Municipal Debt Funds Average, assuming reinvestment of all dividends and distributions. The performance of other classes will be greater than or less than the performance shown in the graph below due to different sales loads and expenses applicable to such classes. The graph and performance table below do not reflect the deduction of taxes that a shareholder would pay on Fund distributions or the redemption of Fund shares. During certain periods, expenses of the Fund have been waived or reimbursed by Lord Abbett; without such waiver or reimbursement of expenses, the Fund’s returns would have been lower. Past performance is no guarantee of future results.
Average Annual Total Returns at Maximum Applicable Sales Charge for the Periods Ended September 30, 2023
1 Year
5 Year
10 Year
Life of Class
Class A5
1.16%
-0.21%
2.20%
–
Class C6
1.97%
-0.37%
1.79%
–
Class F7
3.61%
0.36%
2.53%
–
Class F38
3.84%
0.49%
–
1.10%
Class I7
3.71%
0.44%
2.63%
–
1 Reflects the deduction of the maximum initial sales charge of 2.25%.
2 Performance for the unmanaged index does not reflect any fees or expenses. The performance of the index is not necessarily representative of the Fund’s performance.
3 The Index is composed of municipal bonds from many states while the Fund is a single-state municipal bond portfolio.
4 Source: Lipper Inc. The performance of the average is not necessarily representative of the Fund’s performance.
5 Total return, which is the percent change in value, after deduction of the maximum initial sales charge of 2.25% applicable to Class A shares, with all dividends and distributions
reinvested for periods shown ended September 30, 2023, is calculated using the SEC required uniform method to compute such return.
6 The 1% CDSC for Class C shares normally applies before the first anniversary of the purchase date. Performance for other periods is at net asset value.
7 Performance is at net asset value.
8 Class F3 shares commenced operations and performance for the class began on April 4, 2017. Performance is at net asset value.
16
New Jersey Tax Free Fund
Investment Comparison
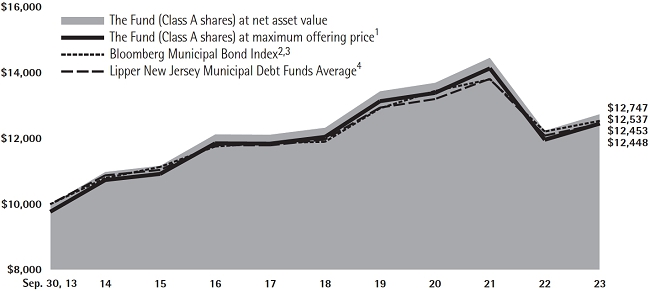
Below is a comparison of a $10,000 investment in Class A shares to the same investment in the Bloomberg Municipal Bond Index and the Lipper New Jersey Municipal Debt Funds Average, assuming reinvestment of all dividends and distributions. The performance of the other class will be greater than or less than the performance shown in the graph below due to different sales loads and expenses applicable to such classes. The graph and performance table below do not reflect the deduction of taxes that a shareholder would pay on Fund distributions or the redemption of Fund shares. During certain periods, expenses of the Fund have been waived or reimbursed by Lord Abbett; without such waiver or reimbursement of expenses, the Fund’s returns would have been lower. Past performance is no guarantee of future results.
Average Annual Total Returns at Maximum Applicable Sales Charge for the Periods Ended September 30, 2023
1 Year
5 Year
10 Year
Life of Class
Class A5
1.80%
0.22%
2.22%
–
Class F6
4.21%
0.76%
2.56%
–
Class F37
4.59%
0.90%
–
1.54%
Class I6
4.32%
0.82%
2.67%
–
1 Reflects the deduction of the maximum initial sales charge of 2.25%.
2 Performance for the unmanaged index does not reflect any fees or expenses. The performance of the index is not necessarily representative of the Fund’s performance.
3 The Index is composed of municipal bonds from many states while the Fund is a single-state municipal bond portfolio.
4 Source: Lipper Inc. The performance of the average is not necessarily representative of the Fund’s performance.
5 Total return, which is the percent change in value, after deduction of the maximum initial sales charge of 2.25%
applicable to Class A shares, with all dividends and distributions reinvested for periods shown ended September 30, 2023, is calculated using the SEC required uniform method to compute such return.
6 Performance is at net asset value.
7 Class F3 shares commenced operations and performance for the class began on April 4, 2017. Performance is at net asset value.
17
New York Tax Free Fund
Investment Comparison
Below is a comparison of a $10,000 investment in Class A shares to the same investment in the Bloomberg Municipal Bond Index and the Lipper New York Municipal Debt Funds Average, assuming reinvestment of all dividends and distributions. The performance of the other classes will be greater than or less than the performance shown in the graph below due to different sales loads and expenses applicable to such classes. The graph and performance table below do not reflect the deduction of taxes that a shareholder would pay on Fund distributions or the redemption of Fund shares. During certain periods, expenses of the Fund have been waived or reimbursed by Lord Abbett; without such waiver or reimbursement of expenses, the Fund’s returns would have been lower. Past performance is no guarantee of future results.
Average Annual Total Returns at Maximum Applicable Sales Charge for the Periods Ended September 30, 2023
1 Year
5 Year
10 Year
Life of Class
Class A5
1.57%
-0.05%
1.89%
–
Class C6
2.29%
-0.20%
1.47%
–
Class F7
4.04%
0.52%
2.22%
–
Class F38
4.07%
0.65%
–
0.98%
Class I7
4.04%
0.61%
2.31%
–
1 Reflects the deduction of the maximum initial sales charge of 2.25%.
2 Performance for the unmanaged index does not reflect any fees or expenses. The performance of the index is not necessarily representative of the Fund’s performance.
3 The Index is composed of municipal bonds from many states while the Fund is a single-state municipal bond portfolio.
4 Source: Lipper Inc. The performance of the average is not necessarily representative of the Fund’s performance.
5 Total return, which is the percent change in value, after deduction of the maximum initial sales charge of 2.25% applicable to Class A shares, with all dividends and distributions
reinvested for periods shown ended September 30, 2023, is calculated using the SEC required uniform method to compute such return.
6 The 1% CDSC for Class C shares normally applies before the first anniversary of the purchase date. Performance for other periods is at net asset value.
7 Performance is at net asset value.
8 Class F3 shares commenced operations and performance for the class began on April 4, 2017. Performance is at net asset value.
18
Expense Example
As a shareholder of a Fund, you incur two types of costs: (1) transaction costs, including sales charges (loads) on purchase payments (these charges vary among the share classes); and (2) ongoing costs, including management fees, distribution and service (12b-1) fees (these charges vary among the share classes), and other Fund expenses. This Example is intended to help you understand your ongoing costs (in dollars) of investing in each Fund and to compare these costs with the ongoing costs of investing in other mutual funds.
The Example is based on an investment of $1,000 invested at the beginning of the period and held for the entire period (April 1, 2023 through September 30, 2023).
Actual Expenses
For each class of each Fund, the first line of the applicable table on the following pages provides information about actual account values and actual expenses. You may use the information in this line, together with the amount you invested, to estimate the expenses that you paid over the period. Simply divide your account value by $1,000 (for example, an $8,600 account value divided by $1,000 = 8.6), then multiply the result by the number in the first line under the heading titled “Expenses Paid During Period 4/1/23 – 9/30/23” to estimate the expenses you paid on your account during this period.
Hypothetical Example for Comparison Purposes
For each class of each Fund, the second line of the applicable table on the following pages provides information about hypothetical account values and hypothetical expenses based on the Fund’s actual expense ratio and an assumed rate of return of 5% per year before expenses, which is not the Fund’s actual return. The hypothetical account values and expenses may not be used to estimate the actual ending account balance or expenses you paid for the period. You may use this information to compare the ongoing costs of investing in each Fund and other funds. To do so, compare this 5% hypothetical example with the 5% hypothetical examples that appear in the shareholder reports of the other funds.
19
Short Duration Tax Free Fund
Please note that the expenses shown in the table are meant to highlight your ongoing costs only and do not reflect any transactional costs, such as sales charges (loads). Therefore, the second line of the table is useful in comparing ongoing costs only, and will not help you determine the relative total costs of owning different funds. In addition, if these transactional costs were included, your costs would have been higher.
Beginning Account Value
Ending Account Value
Expenses Paid During Period†
4/1/23
9/30/23
4/1/23 - 9/30/23
Class A
Actual
$1,000.00
$ 996.10
$3.25
Hypothetical (5% Return Before Expenses)
$1,000.00
$1,021.81
$3.29
Class C
Actual
$1,000.00
$ 993.70
$6.30
Hypothetical (5% Return Before Expenses)
$1,000.00
$1,018.75
$6.38
Class F
Actual
$1,000.00
$ 996.60
$2.75
Hypothetical (5% Return Before Expenses)
$1,000.00
$1,022.31
$2.79
Class F3
Actual
$1,000.00
$ 997.30
$2.05
Hypothetical (5% Return Before Expenses)
$1,000.00
$1,023.01
$2.08
Class I
Actual
$1,000.00
$ 997.10
$2.25
Hypothetical (5% Return Before Expenses)
$1,000.00
$1,022.81
$2.28
†
For each class of the Fund, net expenses are equal to the annualized expense ratio for such class (0.65% for Class A, 1.26% for Class C, 0.55% for Class F, 0.41% for Class F3, and 0.45% for Class I) multiplied by the average account value over the period, multiplied by 183/365 (to reflect one-half year period).
Portfolio Holdings Presented by Credit Rating
September 30, 2023
Credit Rating: S&P or Moody’s(a)
%*
AAA
4.08
%
AA+
6.45
%
AA
10.90
%
AA-
9.10
%
A+
14.53
%
A
18.57
%
A-
10.10
%
BBB+
7.57
%
Credit Rating: S&P or Moody’s(a)
%*
BBB
1.16
%
BBB-
5.55
%
BB+
0.34
%
BB
0.41
%
BB-
0.73
%
B
0.21
%
NR
10.30
%
Total
100.00
%
(a)
Certain investments have been rated by Fitch IBCA.
*
Represents percent of total investments, which excludes derivatives.
20
Intermediate Tax Free Fund
Please note that the expenses shown in the table are meant to highlight your ongoing costs only and do not reflect any transactional costs, such as sales charges (loads). Therefore, the second line of the table is useful in comparing ongoing costs only, and will not help you determine the relative total costs of owning different funds. In addition, if these transactional costs were included, your costs would have been higher.
Beginning Account Value
Ending Account Value
Expenses Paid During Period†
4/1/23
9/30/23
4/1/23 - 9/30/23
Class A
Actual
$1,000.00
$ 974.20
$3.51
Hypothetical (5% Return Before Expenses)
$1,000.00
$1,021.51
$3.60
Class C
Actual
$1,000.00
$ 971.20
$6.52
Hypothetical (5% Return Before Expenses)
$1,000.00
$1,018.45
$6.68
Class F
Actual
$1,000.00
$ 974.70
$2.97
Hypothetical (5% Return Before Expenses)
$1,000.00
$1,022.06
$3.04
Class F3
Actual
$1,000.00
$ 976.40
$2.23
Hypothetical (5% Return Before Expenses)
$1,000.00
$1,022.81
$2.28
Class I
Actual
$1,000.00
$ 975.20
$2.53
Hypothetical (5% Return Before Expenses)
$1,000.00
$1,022.51
$2.59
†
For each class of the Fund, net expenses are equal to the annualized expense ratio for such class (0.71% for Class A, 1.32% for Class C, 0.60% for Class F, 0.45% for Class F3, and 0.51% for Class I) multiplied by the average account value over the period, multiplied by 183/365 (to reflect one-half year period).
Portfolio Holdings Presented by Credit Rating
September 30, 2023
Credit Rating: S&P or Moody’s(a)
%*
AAA
6.08
%
AA+
5.08
%
AA
11.01
%
AA-
9.50
%
A+
12.07
%
A
12.89
%
A-
9.46
%
BBB+
6.95
%
BBB
4.54
%
Credit Rating: S&P or Moody’s(a)
%*
BBB-
7.17
%
BB+
1.95
%
BB
0.80
%
BB-
1.58
%
B+
0.52
%
B
0.58
%
B-
0.53
%
NR
9.29
%
Total
100.00
%
(a)
Certain investments have been rated by Fitch IBCA.
*
Represents percent of total investments, which excludes derivatives.
21
National Tax Free Fund
Please note that the expenses shown in the table are meant to highlight your ongoing costs only and do not reflect any transactional costs, such as sales charges (loads). Therefore, the second line of the table is useful in comparing ongoing costs only, and will not help you determine the relative total costs of owning different funds. In addition, if these transactional costs were included, your costs would have been higher.
Beginning Account Value
Ending Account Value
Expenses Paid During Period†
4/1/23
9/30/23
4/1/23 - 9/30/23
Class A
Actual
$1,000.00
$ 965.40
$3.79
Hypothetical (5% Return Before Expenses)
$1,000.00
$1,021.21
$3.90
Class C
Actual
$1,000.00
$ 962.40
$6.89
Hypothetical (5% Return Before Expenses)
$1,000.00
$1,018.05
$7.08
Class F
Actual
$1,000.00
$ 965.80
$3.35
Hypothetical (5% Return Before Expenses)
$1,000.00
$1,021.66
$3.45
Class F3
Actual
$1,000.00
$ 965.60
$2.66
Hypothetical (5% Return Before Expenses)
$1,000.00
$1,022.36
$2.74
Class I
Actual
$1,000.00
$ 965.40
$2.81
Hypothetical (5% Return Before Expenses)
$1,000.00
$1,022.21
$2.89
†
For each class of the Fund, net expenses are equal to the annualized expense ratio for such class (0.77% for Class A, 1.40% for Class C, 0.68% for Class F, 0.54% for Class F3, and 0.57% for Class I) multiplied by the average account value over the period, multiplied by 183/365 (to reflect one-half year period).
Portfolio Holdings Presented by Credit Rating
September 30, 2023
Credit Rating: S&P or Moody’s(a)
%*
AAA
2.73
%
AA+
4.74
%
AA
13.04
%
AA-
8.38
%
A+
11.39
%
A
14.86
%
A-
10.77
%
BBB+
7.79
%
BBB
7.65
%
Credit Rating: S&P or Moody’s(a)
%*
BBB-
8.27
%
BB+
1.16
%
BB
0.92
%
BB-
1.15
%
B+
0.17
%
B
0.79
%
B-
0.59
%
NR
5.60
%
Total
100.00
%
(a)
Certain investments have been rated by Fitch IBCA.
*
Represents percent of total investments, which excludes derivatives.
22
High Income Municipal Bond Fund
Please note that the expenses shown in the table are meant to highlight your ongoing costs only and do not reflect any transactional costs, such as sales charges (loads). Therefore, the second line of the table is useful in comparing ongoing costs only, and will not help you determine the relative total costs of owning different funds. In addition, if these transactional costs were included, your costs would have been higher.
Beginning Account Value
Ending Account Value
Expenses Paid During Period†
4/1/23
9/30/23
4/1/23 - 9/30/23
Class A
Actual
$1,000.00
$ 976.20
$4.06
Hypothetical (5% Return Before Expenses)
$1,000.00
$1,020.96
$4.15
Class C
Actual
$1,000.00
$ 972.30
$7.12
Hypothetical (5% Return Before Expenses)
$1,000.00
$1,017.85
$7.28
Class F
Actual
$1,000.00
$ 976.80
$3.57
Hypothetical (5% Return Before Expenses)
$1,000.00
$1,021.46
$3.65
Class F3
Actual
$1,000.00
$ 977.30
$2.87
Hypothetical (5% Return Before Expenses)
$1,000.00
$1,022.16
$2.94
Class I
Actual
$1,000.00
$ 977.10
$3.07
Hypothetical (5% Return Before Expenses)
$1,000.00
$1,021.96
$3.14
†
For each class of the Fund, net expenses are equal to the annualized expense ratio for such class (0.82% for Class A, 1.44% for Class C, 0.72% for Class F, 0.58% for Class F3, and 0.62% for Class I) multiplied by the average account value over the period, multiplied by 183/365 (to reflect one-half year period).
Portfolio Holdings Presented by Credit Rating
September 30, 2023
Credit Rating: S&P or Moody’s(a)
%*
AAA
0.12
%
AA+
0.51
%
AA
2.86
%
AA-
2.36
%
A+
2.66
%
A
5.40
%
A-
4.73
%
BBB+
3.22
%
BBB
4.92
%
BBB-
8.05
%
BB+
5.68
%
Credit Rating: S&P or Moody’s(a)
%*
BB
4.79
%
BB-
6.77
%
B+
2.56
%
B
2.19
%
B-
3.49
%
CCC+
0.37
%
CCC
0.09
%
CCC-
1.06
%
D
0.03
%
NR
38.14
%
Total
100.00
%
(a)
Certain investments have been rated by Fitch IBCA.
*
Represents percent of total investments, which excludes derivatives.
23
Short Duration High Income Municipal Bond Fund
Please note that the expenses shown in the table are meant to highlight your ongoing costs only and do not reflect any transactional costs, such as sales charges (loads). Therefore, the second line of the table is useful in comparing ongoing costs only, and will not help you determine the relative total costs of owning different funds. In addition, if these transactional costs were included, your costs would have been higher.
Beginning Account Value
Ending Account Value
Expenses Paid During Period†
4/1/23
9/30/23
4/1/23 - 9/30/23
Class A
Actual
$1,000.00
$ 992.10
$3.25
Hypothetical (5% Return Before Expenses)
$1,000.00
$1,021.81
$3.29
Class C
Actual
$1,000.00
$ 988.90
$6.48
Hypothetical (5% Return Before Expenses)
$1,000.00
$1,018.55
$6.58
Class F
Actual
$1,000.00
$ 992.60
$2.75
Hypothetical (5% Return Before Expenses)
$1,000.00
$1,022.31
$2.79
Class F3
Actual
$1,000.00
$ 993.50
$1.85
Hypothetical (5% Return Before Expenses)
$1,000.00
$1,023.21
$1.88
Class I
Actual
$1,000.00
$ 993.10
$2.25
Hypothetical (5% Return Before Expenses)
$1,000.00
$1,022.81
$2.28
†
For each class of the Fund, net expenses are equal to the annualized expense ratio for such class (0.65% for Class A, 1.30% for Class C, 0.55% for Class F, 0.37% for Class F3, and 0.45% for Class I) multiplied by the average account value over the period, multiplied by 183/365 (to reflect one-half year period).
Portfolio Holdings Presented by Credit Rating
September 30, 2023
Credit Rating: S&P or Moody’s(a)
%*
AAA
0.15
%
AA+
0.61
%
AA
3.46
%
AA-
0.75
%
A+
4.27
%
A
7.19
%
A-
4.49
%
BBB+
6.15
%
BBB
5.31
%
BBB-
12.01
%
Credit Rating: S&P or Moody’s(a)
%*
BB+
6.25
%
BB
4.50
%
BB-
9.61
%
B+
5.24
%
B
3.08
%
B-
2.32
%
CCC+
0.84
%
NR
23.77
%
Total
100.00
%
(a)
Certain investments have been rated by Fitch IBCA.
*
Represents percent of total investments, which excludes derivatives.
24
Sustainable Municipal Bond Fund
Please note that the expenses shown in the table are meant to highlight your ongoing costs only and do not reflect any transactional costs, such as sales charges (loads). Therefore, the second line of the table is useful in comparing ongoing costs only, and will not help you determine the relative total costs of owning different funds. In addition, if these transactional costs were included, your costs would have been higher.
Beginning Account Value
Ending Account Value
Expenses Paid During Period†
4/1/23
9/30/23
4/1/23 - 9/30/23
Class A
Actual
$1,000.00
$ 977.00
$3.12
Hypothetical (5% Return Before Expenses)
$1,000.00
$1,021.91
$3.19
Class C
Actual
$1,000.00
$ 973.20
$6.93
Hypothetical (5% Return Before Expenses)
$1,000.00
$1,018.05
$7.08
Class F
Actual
$1,000.00
$ 977.50
$2.63
Hypothetical (5% Return Before Expenses)
$1,000.00
$1,022.41
$2.69
Class F3
Actual
$1,000.00
$ 978.20
$1.93
Hypothetical (5% Return Before Expenses)
$1,000.00
$1,023.11
$1.98
Class I
Actual
$1,000.00
$ 978.00
$2.13
Hypothetical (5% Return Before Expenses)
$1,000.00
$1,022.91
$2.18
†
For each class of the Fund, net expenses are equal to the annualized expense ratio for such class (0.63% for Class A, 1.40% for Class C, 0.53% for Class F, 0.39% for Class F3, and 0.43% for Class I) multiplied by the average account value over the period, multiplied by 183/365 (to reflect one-half year period).
Portfolio Holdings Presented by Credit Rating
September 30, 2023
Credit Rating: S&P or Moody’s(a)
%*
AAA
10.41
%
AA+
0.51
%
AA
6.23
%
AA-
5.13
%
A+
16.94
%
A
18.95
%
BBB+
4.68
%
Credit Rating: S&P or Moody’s(a)
%*
BBB
4.83
%
BBB-
10.57
%
BB+
4.04
%
BB
6.10
%
NR
11.61
%
Total
100.00
%
(a)
Certain investments have been rated by Fitch IBCA.
*
Represents percent of total investments, which excludes derivatives.
25
California Tax Free Fund
Please note that the expenses shown in the table are meant to highlight your ongoing costs only and do not reflect any transactional costs, such as sales charges (loads). Therefore, the second line of the table is useful in comparing ongoing costs only, and will not help you determine the relative total costs of owning different funds. In addition, if these transactional costs were included, your costs would have been higher.
Beginning Account Value
Ending Account Value
Expenses Paid During Period†
4/1/23
9/30/23
4/1/23 - 9/30/23
Class A
Actual
$1,000.00
$ 961.40
$3.74
Hypothetical (5% Return Before Expenses)
$1,000.00
$1,021.26
$3.85
Class C
Actual
$1,000.00
$ 959.40
$6.78
Hypothetical (5% Return Before Expenses)
$1,000.00
$1,018.15
$6.98
Class F
Actual
$1,000.00
$ 961.90
$3.25
Hypothetical (5% Return Before Expenses)
$1,000.00
$1,021.76
$3.35
Class F3
Actual
$1,000.00
$ 963.50
$2.66
Hypothetical (5% Return Before Expenses)
$1,000.00
$1,022.36
$2.74
Class I
Actual
$1,000.00
$ 962.30
$2.75
Hypothetical (5% Return Before Expenses)
$1,000.00
$1,022.26
$2.84
†
For each class of the Fund, net expenses are equal to the annualized expense ratio for such class (0.76% for Class A, 1.38% for Class C, 0.66% for Class F, 0.54% for Class F3, and 0.56% for Class I) multiplied by the average account value over the period, multiplied by 183/365 (to reflect one-half year period).
Portfolio Holdings Presented by Credit Rating
September 30, 2023
Credit Rating: S&P or Moody’s(a)
%*
AAA
0.66
%
AA+
2.85
%
AA
29.08
%
AA-
10.80
%
A+
7.81
%
A
11.57
%
A-
6.81
%
BBB+
6.22
%
BBB
5.44
%
Credit Rating: S&P or Moody’s(a)
%*
BBB-
6.21
%
BB
1.82
%
BB-
0.64
%
B+
0.09
%
B
0.19
%
CCC
0.04
%
CCC-
0.08
%
NR
9.69
%
Total
100.00
%
(a)
Certain investments have been rated by Fitch IBCA.
*
Represents percent of total investments, which excludes derivatives.
26
New Jersey Tax Free Fund
Please note that the expenses shown in the table are meant to highlight your ongoing costs only and do not reflect any transactional costs, such as sales charges (loads). Therefore, the second line of the table is useful in comparing ongoing costs only, and will not help you determine the relative total costs of owning different funds. In addition, if these transactional costs were included, your costs would have been higher.
Beginning Account Value
Ending Account Value
Expenses Paid During Period†
4/1/23
9/30/23
4/1/23 - 9/30/23
Class A
Actual
$1,000.00
$ 965.20
$4.04
Hypothetical (5% Return Before Expenses)
$1,000.00
$1,020.96
$4.15
Class F
Actual
$1,000.00
$ 965.60
$3.55
Hypothetical (5% Return Before Expenses)
$1,000.00
$1,021.46
$3.65
Class F3
Actual
$1,000.00
$ 966.40
$2.86
Hypothetical (5% Return Before Expenses)
$1,000.00
$1,022.16
$2.94
Class I
Actual
$1,000.00
$ 964.10
$3.05
Hypothetical (5% Return Before Expenses)
$1,000.00
$1,021.96
$3.14
†
For each class of the Fund, net expenses are equal to the annualized expense ratio for such class (0.82% for Class A, 0.72% for Class F, 0.58% for Class F3, and 0.62% for Class I) multiplied by the average account value over the period, multiplied by 183/365 (to reflect one-half year period).
Portfolio Holdings Presented by Credit Rating
September 30, 2023
Credit Rating: S&P or Moody’s(a)
%*
AAA
1.20
%
AA+
2.10
%
AA
16.12
%
AA-
19.33
%
A+
9.58
%
A
24.90
%
A-
2.43
%
Credit Rating: S&P or Moody’s(a)
%*
BBB+
8.43
%
BBB
3.98
%
BBB-
3.83
%
BB+
0.21
%
BB-
2.35
%
NR
5.54
%
Total
100.00
%
(a)
Certain investments have been rated by Fitch IBCA.
*
Represents percent of total investments, which excludes derivatives.
27
New York Tax Free Fund
Please note that the expenses shown in the table are meant to highlight your ongoing costs only and do not reflect any transactional costs, such as sales charges (loads). Therefore, the second line of the table is useful in comparing ongoing costs only, and will not help you determine the relative total costs of owning different funds. In addition, if these transactional costs were included, your costs would have been higher.
Beginning Account Value
Ending Account Value
Expenses Paid During Period†
4/1/23
9/30/23
4/1/23 - 9/30/23
Class A
Actual
$1,000.00
$ 962.10
$3.84
Hypothetical (5% Return Before Expenses)
$1,000.00
$1,021.16
$3.95
Class C
Actual
$1,000.00
$ 959.00
$6.83
Hypothetical (5% Return Before Expenses)
$1,000.00
$1,018.10
$7.03
Class F
Actual
$1,000.00
$ 962.60
$3.35
Hypothetical (5% Return Before Expenses)
$1,000.00
$1,021.66
$3.45
Class F3
Actual
$1,000.00
$ 962.30
$2.66
Hypothetical (5% Return Before Expenses)
$1,000.00
$1,022.36
$2.74
Class I
Actual
$1,000.00
$ 962.10
$2.85
Hypothetical (5% Return Before Expenses)
$1,000.00
$1,022.16
$2.94
†
For each class of the Fund, net expenses are equal to the annualized expense ratio for such class (0.78% for Class A, 1.39% for Class C, 0.68% for Class F, 0.54% for Class F3, and 0.58% for Class I) multiplied by the average account value over the period, multiplied by 183/365 (to reflect one-half year period).
Portfolio Holdings Presented by Credit Rating
September 30, 2023
Credit Rating: S&P or Moody’s(a)
%*
AAA
4.26
%
AA+
14.33
%
AA
11.36
%
AA-
9.44
%
A+
3.34
%
A
6.59
%
A-
13.95
%
BBB+
7.37
%
BBB
8.17
%
BBB-
8.92
%
Credit Rating: S&P or Moody’s(a)
%*
BB+
1.08
%
BB
0.42
%
BB-
0.68
%
B+
1.22
%
B
0.35
%
B-
0.83
%
CCC+
0.43
%
NR
7.26
%
Total
100.00
%
(a)
Certain investments have been rated by Fitch IBCA.
*
Represents percent of total investments, which excludes derivatives.
28
Schedule of Investments
SHORT DURATION TAX FREE FUND September 30, 2023
Investments
Interest Rate
Maturity Date
Credit Rating: S&P or Moody’s(a)
Principal Amount
Fair Value
LONG-TERM INVESTMENTS 92.80%
MUNICIPAL BONDS 92.80%
Corporate-Backed 6.88%
Allegheny County Industrial Development Authority–US Steel Corporation PA
4.875%
11/1/2024
BB-
$
4,500,000
$
4,492,125
Black Belt Energy Gas District AL
4.00%
#(b)
10/1/2052
A2
19,500,000
18,959,156
City of Farmington–Public Service Co of NM
3.90%
#(b)
6/1/2040
BBB
2,500,000
2,427,944
County of Nez Perce–Potlatchdeltic Corp ID
2.75%
10/1/2024
BBB-
11,310,000
11,109,200
Development Authority of Burke County–Oglethorpe Power Corp GA
1.50%
#(b)
1/1/2040
BBB+
3,750,000
3,549,408
Downtown Doral South Community Development District FL†
3.875%
12/15/2023
NR
55,000
54,895
Industrial Development Board of the City of Mobile Alabama–Alabama Power Company
1.00%
#(b)
6/1/2034
A1
3,100,000
2,923,586
Industrial Development Board of the City of Mobile Alabama–Alabama Power Company
2.90%
#(b)
7/15/2034
A1
20,000,000
19,933,626
Matagorda County Navigation District No. 1–Aep Texas Inc (AMBAC)
4.40%
5/1/2030
A-
1,500,000
1,461,026
Niagara Area Development Corp.–Covanta Holding Corp NY†
3.50%
11/1/2024
B
750,000
736,397
Ohio Air Quality Development Authority–American Electric Pwr Co
1.90%
#(b)
5/1/2026
BBB+
2,000,000
1,928,305
Ohio Air Quality Development Authority–American Electric Pwr Co
2.40%
#(b)
12/1/2038
BBB+
10,700,000
8,945,623
Ohio Air Quality Development Authority–Ohio valley Electric Corp
1.50%
#(b)
2/1/2026
Baa3
1,000,000
909,462
Parish of St. James–Nustar Logistics LP LA†
5.85%
#(b)
8/1/2041
BB-
3,500,000
3,556,067
Parish of St. John the Baptist–Marathon Oil Corporation LA
2.10%
#(b)
6/1/2037
BBB-
8,000,000
7,853,311
Parish of St. John the Baptist–Marathon Oil Corporation LA
2.125%
#(b)
6/1/2037
BBB-
6,150,000
6,038,343
Parish of St. John the Baptist–Marathon Oil Corporation LA
2.375%
#(b)
6/1/2037
BBB-
4,575,000
4,275,960
See Notes to Financial Statements.
29
Schedule of Investments (continued)
SHORT DURATION TAX FREE FUND September 30, 2023
Investments
Interest Rate
Maturity Date
Credit Rating: S&P or Moody’s(a)
Principal Amount
Fair Value
Corporate-Backed (continued)
Parish of St. John the Baptist–Marathon Oil Corporation LA
4.05%
#(b)
6/1/2037
BBB-
$
4,650,000
$
4,569,230
Public Finance Authority–Ameream LLC WI†
5.00%
12/1/2027
NR
1,455,000
1,322,900
Selma Industrial Development Board–International Paper Co AL
2.00%
#(b)
11/1/2033
BBB
2,625,000
2,565,093
State of Ohio–Republic Services Inc
3.95%
#(b)
11/1/2035
BBB+
2,000,000
1,998,895
Total
109,610,552
Education 6.38%
California Community Choice Financing Authority
5.258% (SOFR * .67 + 1.70%
)#
5/1/2053
A1
15,000,000
14,986,123
California State University
0.55%
#(b)
11/1/2049
Aa2
5,000,000
4,383,790
Capital Trust Agency, Inc.–Renaissance Chtr Sch 2019 FL†
4.00%
6/15/2029
NR
1,215,000
1,129,026
Connecticut State Health & Educational Facilities Authority
2.80%
#(b)
7/1/2057
AAA
9,850,000
9,498,423
Connecticut State Health & Educational Facilities Authority–Yale University
3.95%
#(b)
7/1/2042
AAA
9,700,000
9,700,000
Development Authority Of The City Of Marietta–Life University Inc GA†
Illinois Housing Development Authority (HUD SECT8) (FHA)
4.00%
#(b)
6/1/2026
Aaa
2,700,000
2,660,136
Tender Option Bond Trust Receipts/Certificates SC†
4.35%
#
7/1/2028
A1
24,400,000
24,400,000
Total
27,060,136
Other Revenue 4.97%
Black Belt Energy Gas District AL
4.00%
#(b)
12/1/2049
A1
12,325,000
12,102,391
California Infrastructure & Economic Development Bank–Museum Associates
4.68% (MUNIPSA * 1 + .70%
)#
12/1/2050
A3
6,500,000
6,319,132
Clifton Higher Education Finance Corp.–Intl American Edu Fed TX
5.25%
8/15/2026
Baa3
1,605,000
1,593,646
Clifton Higher Education Finance Corp.–Intl American Edu Fed TX
5.25%
8/15/2028
Baa3
1,920,000
1,906,791
Illinois Finance Authority–Field Museum Natural Hist
4.917% (SOFR * .70 + 1.20%
)#
11/1/2034
A
4,435,000
4,411,313
Industrial Development Authority of the County of Pima–Edkey Oblig Group AZ†
3.50%
7/1/2025
NR
830,000
801,231
Lower Alabama Gas District
4.00%
#(b)
12/1/2050
A2
34,085,000
33,419,156
Main Street Natural Gas, Inc. GA
5.00%
5/15/2025
A2
4,850,000
4,845,193
Patriots Energy Group Financing Agency SC
4.00%
#(b)
10/1/2048
Aa1
8,000,000
7,976,607
Triborough Bridge & Tunnel Authority NY
5.00%
#(b)
5/15/2051
AA+
5,700,000
5,810,956
Total
79,186,416
Pollution Control 0.75%
Port of Port Arthur Navigation District–Motiva Enterprises LLC TX
5.15%
#(b)
4/1/2040
BBB+
11,900,000
11,900,000
38
See Notes to Financial Statements.
Schedule of Investments (continued)
SHORT DURATION TAX FREE FUND September 30, 2023
Investments
Interest Rate
Maturity Date
Credit Rating: S&P or Moody’s(a)
Principal Amount
Fair Value
Power 0.65%
Energy Northwest–Bonneville Power Admin WA
5.00%
7/1/2027
Aa1
$
10,000,000
$
10,318,247
Single-Family Housing 0.42%
Colorado Housing & Finance Authority (GNMA)
3.00%
5/1/2051
AAA
7,085,000
6,713,769
Special Tax 0.80%
Allentown Neighborhood Improvement Zone Development Authority PA†
5.00%
5/1/2028
NR
3,050,000
3,055,319
New York City Industrial Development Agency–Yankee Stadium LLC NY (FGIC)
4.058% (CPI YoY * 1 + .88%
)
3/1/2026
Baa1
2,000,000
1,994,160
State of Connecticut Special Tax Revenue
5.00%
1/1/2026
AA
5,000,000
5,138,984
Village Community Development District No. 13 FL†
1.875%
5/1/2025
NR
1,165,000
1,116,175
Village Community Development District No. 13 FL
2.625%
5/1/2024
NR
65,000
64,257
Village Community Development District No. 13 FL†
2.625%
5/1/2030
NR
1,465,000
1,292,075
Total
12,660,970
Tax Revenue 1.77%
Anaheim Public Financing Authority CA (AGM)
5.00%
9/1/2026
AA
7,500,000
7,715,791
City of Sparks NV†
2.75%
6/15/2028
Ba1
290,000
265,273
Matching Fund Special Purpose Securitization Corp. VI
5.00%
10/1/2026
NR
2,000,000
2,009,282
New York State Dormitory Authority (AGM)
5.00%
10/1/2024
AA
5,000
5,057
New York State Dormitory Authority (AGM)
5.00%
10/1/2024
AA
2,245,000
2,272,627
New York State Dormitory Authority (AGM)
5.00%
10/1/2025
AA
1,650,000
1,690,471
Sales Tax Securitization Corp. IL
5.00%
1/1/2025
AA-
5,000,000
5,054,408
State of Illinois Sales Tax Revenue
5.00%
6/15/2024
A
7,260,000
7,311,197
Territory of Guam
5.00%
1/1/2029
Ba1
750,000
752,801
Virginia Small Business Financing Authority–NATL Senior Cmntys Oblig
5.00%
1/1/2028
A
(c)
1,100,000
1,116,443
Total
28,193,350
See Notes to Financial Statements.
39
Schedule of Investments (continued)
SHORT DURATION TAX FREE FUND September 30, 2023
Investments
Interest Rate
Maturity Date
Credit Rating: S&P or Moody’s(a)
Principal Amount
Fair Value
Taxable Revenue–Water & Sewer 2.40%
Jersey City Municipal Utilities Authority NJ
4.00%
5/3/2024
NR
$
11,150,000
$
11,145,664
Louisville & Jefferson County Metropolitan Sewer District KY
5.00%
5/15/2035
Aa3
5,000,000
5,511,522
Pittsburgh Water & Sewer Authority PA (AGM)
5.00%
9/1/2036
A1
6,750,000
7,339,117
Pittsburgh Water & Sewer Authority PA (AGM)
5.00%
9/1/2037
A1
4,750,000
5,100,951
San Francisco City & County Public Utilities Commission Wastewater Revenue CA
4.00%
#(b)
10/1/2048
AA
9,000,000
9,086,531
Total
38,183,785
Tobacco 0.32%
Commonwealth Financing Authority PA
5.00%
6/1/2024
A1
5,000,000
5,025,418
Transportation 5.77%
Bay Area Toll Authority CA
5.23% (MUNIPSA * 1 + 1.25%
)#
4/1/2036
AA
2,375,000
2,379,726
Central Texas Regional Mobility Authority
5.00%
1/1/2025
A-
2,500,000
2,511,446
Central Texas Regional Mobility Authority
5.00%
1/1/2027
A-
15,000,000
15,259,050
Central Texas Turnpike System
5.00%
8/15/2031
A-
4,500,000
4,497,139
Chicago O’Hare International Airport IL
5.00%
1/1/2031
A+
4,750,000
4,744,621
Chicago Transit Authority IL
5.00%
6/1/2025
A+
2,000,000
2,016,104
Dallas Fort Worth International Airport TX
5.00%
11/1/2026
A+
1,750,000
1,812,287
E-470 Public Highway Authority CO
3.908% (SOFR * .67 + .35%
)#
9/1/2039
A+
3,375,000
3,362,787
Louisiana Offshore Terminal Authority–Loop LLC
1.65%
#(b)
9/1/2027
A3
3,500,000
3,478,262
Maryland Economic Development Corp.–Consol Marine Terminals L
5.75%
9/1/2025
BB
3,505,000
3,534,495
Metropolitan Transportation Authority NY
5.00%
11/15/2033
A3
5,400,000
5,400,368
New Jersey Turnpike Authority
5.00%
1/1/2027
AA-
3,200,000
3,335,575
New Jersey Turnpike Authority
5.00%
1/1/2028
AA-
23,000,000
23,656,427
New York Transportation Development Corp.–JFK Intl Air Terminal LLC
5.00%
12/1/2028
Baa1
1,390,000
1,448,512
North Carolina Turnpike Authority (AGM)
5.00%
1/1/2028
AA
1,500,000
1,549,445
Pennsylvania Turnpike Commission
5.00%
12/1/2026
Aa3
400,000
415,806
State of Illinois GO
5.00%
11/1/2025
A-
3,000,000
3,050,957
Texas Private Activity Bond Surface Transportation Corp.–LBJ Infrastructure Group
4.00%
12/31/2030
Baa2
3,000,000
2,865,472
40
See Notes to Financial Statements.
Schedule of Investments (continued)
SHORT DURATION TAX FREE FUND September 30, 2023
Investments
Interest Rate
Maturity Date
Credit Rating: S&P or Moody’s(a)
Principal Amount
Fair Value
Transportation (continued)
Triborough Bridge & Tunnel Authority NY
3.944% (SOFR * .67 + .38%
)#
1/1/2032
AA-
$
6,610,000
$
6,581,828
Total
91,900,307
Utilities 12.64%
Central Plains Energy Project NE
5.00%
9/1/2027
BBB+
1,305,000
1,309,976
Central Plains Energy Project NE
5.738% (SOFR * .67 + 2.18%
)#
5/1/2053
A2
20,000,000
19,991,440
City of Chicago Waterworks Revenue IL (AGM)
5.00%
11/1/2028
AA
2,500,000
2,571,620
City of Rockport–Indiana Michigan Pwr Co
3.05%
6/1/2025
A-
3,500,000
3,413,088
City of San Antonio Electric & Gas Systems Revenue TX
5.00%
2/1/2024
Aa2
1,250,000
1,253,937
Delaware State Economic Development Authority
1.05%
#(b)
1/1/2031
A
6,315,000
5,924,962
Delaware State Economic Development Authority–NRG Energy Inc
1.25%
#(b)
10/1/2040
BBB-
10,000,000
9,092,858
Delaware State Economic Development Authority–NRG Energy Inc
1.25%
#(b)
10/1/2045
BBB-
11,000,000
10,002,144
Development Authority of Appling County–Oglethorpe Power Corp GA
1.50%
#(b)
1/1/2038
BBB+
1,250,000
1,183,136
Development Authority of Burke County–Georgia Power Company
2.875%
#(b)
12/1/2049
BBB+
5,650,000
5,433,105
Development Authority of Burke County–Georgia Power Company
3.875%
#(b)
6/1/2042
BBB+
6,000,000
5,876,138
Development Authority of Burke County–Georgia Power Company
5.06%
#(b)
9/1/2029
BBB+
1,000,000
1,000,000
Development Authority of Monroe County–Oglethorpe Power Corp GA
1.50%
#(b)
1/1/2039
BBB+
1,875,000
1,774,704
Indiana Finance Authority–Indianapolis Pwr & Lt Co
0.65%
8/1/2025
A2
4,500,000
4,099,843
Intermountain Power Agency UT
5.00%
7/1/2036
Aa3
4,000,000
4,303,287
Intermountain Power Agency UT
5.00%
7/1/2037
Aa3
3,500,000
3,728,617
Kentucky Municipal Power Agency
3.45%
#(b)
9/1/2042
Baa1
1,700,000
1,644,574
Kentucky Public Energy Authority
4.00%
#(b)
4/1/2048
A1
3,110,000
3,097,925
Long Island Power Authority NY
0.85%
#(b)
9/1/2050
A
12,000,000
11,177,461
Long Island Power Authority NY
1.65%
#(b)
9/1/2049
A
4,000,000
3,898,374
Long Island Power Authority NY
4.43% (MUNIPSA * 1 + .45%
)#
9/1/2038
A
20,000,000
19,882,962
See Notes to Financial Statements.
41
Schedule of Investments (continued)
SHORT DURATION TAX FREE FUND September 30, 2023
Investments
Interest Rate
Maturity Date
Credit Rating: S&P or Moody’s(a)
Principal Amount
Fair Value
Utilities (continued)
Long Island Power Authority NY
5.00%
9/1/2026
A
$
500,000
$
518,987
Long Island Power Authority NY
5.00%
9/1/2027
A
500,000
526,795
Louisiana Local Government Environmental Facilities & Community Development Authority
0.875%
#(b)
2/1/2046
A+
16,000,000
15,198,730
Main Street Natural Gas, Inc. GA†
4.00%
#(b)
8/1/2052
BBB-
20,000,000
18,863,026
New York City Municipal Water Finance Authority NY
4.80%
#(b)
6/15/2044
AA+
2,000,000
2,000,000
North Carolina Capital Facilities Finance Agency–Republic Services Inc
3.95%
#(b)
7/1/2034
BBB+
10,000,000
10,000,000
Northern California Energy Authority
4.00%
#(b)
7/1/2049
A2
5,000,000
4,986,387
Philadelphia Gas Works Co. PA
5.00%
8/1/2024
A
800,000
806,337
Southeast Energy Authority A Cooperative District AL
5.348% (SOFR * .67 + 1.79%
)#
5/1/2053
A2
18,000,000
17,831,792
West Virginia Economic Development Authority–Appalachian Power Co
0.625%
#(b)
12/1/2038
A-
8,500,000
7,691,419
West Virginia Economic Development Authority–Appalachian Power Co
2.55%
#(b)
3/1/2040
A-
2,200,000
2,171,328
Total
201,254,952
Total Municipal Bonds (cost $1,519,174,499)
1,477,485,340
Interest Rate#
Interest Rate Reset Date(d)
Final Maturity Date
SHORT-TERM INVESTMENTS 7.18%
VARIABLE RATE DEMAND NOTES 7.18%
Corporate-Backed 0.57%
Columbia Industrial Development Board – Alabama Power Company
4.750%
10/2/2023
12/1/2037
A1
9,000,000
9,000,000
General Obligation 3.57%
City of New York NY GO
4.170%
10/2/2023
4/1/2042
AA
5,050,000
5,050,000
City of New York NY GO
4.170%
10/2/2023
4/1/2042
AA
10,900,000
10,900,000
City of New York NY GO
4.250%
10/2/2023
10/1/2046
AA
36,735,000
36,735,000
City of New York NY GO
4.750%
10/2/2023
3/1/2040
AA
3,000,000
3,000,000
City of New York NY GO
4.800%
10/2/2023
6/1/2044
AA
1,200,000
1,200,000
Total
56,885,000
42
See Notes to Financial Statements.
Schedule of Investments (continued)
SHORT DURATION TAX FREE FUND September 30, 2023
Investments
Interest Rate#
Interest Rate Reset Date(d)
Final Maturity Date
Credit Rating: S&P or Moody’s(a)
Principal Amount
Fair Value
Health Care 1.68%
Health Care Authority for Baptist Health
5.360%
10/5/2023
11/1/2042
A3
$
16,769,000
$
16,769,000
State of Ohio - Univ Hosp Hlth Sys Oblig Gp
4.460%
10/5/2023
1/15/2033
A
10,000,000
10,000,000
Total
26,769,000
Tax Revenue 0.19%
New York City Transitional Finance Authority Future Tax Secured Revenue
4.800%
10/2/2023
5/1/2034
AAA
3,000,000
3,000,000
Utilities 1.17%
Development Authority of Appling County - Georgia Power Company
5.060%
10/2/2023
9/1/2041
BBB+
18,700,000
18,700,000
Total Short-Term Investments (cost $114,354,000)
114,354,000
Total Investments in Securities 99.98% (cost $1,633,528,499)
1,591,839,340
Other Assets and Liabilities – Net(e) 0.02%
372,297
Net Assets 100.00%
$
1,592,211,637
AGM
Insured by–Assured Guaranty Municipal Corporation.
AMBAC
Insured by–AMBAC Assurance Corporation.
COPS
Certificates of Participation.
CPI
Consumer Price Index: Rate fluctuates based on CPI.
FGIC
Insured by–Financial Guaranty Insurance Company.
FHA
Insured by–Federal Housing Administration.
FHLMC
Federal Home Loan Mortgage Corporation.
FNMA
Federal National Mortgage Association.
GNMA
Government National Mortgage Association.
GTD
Guaranteed.
HUD
Insured by–Department of Housing and Urban Development.
LIBOR
London Interbank Offered Rate.
MUNIPSA
SIFMA Municipal Swap Index Yield.
NR
Not Rated.
PSF
Permanent School Fund.
SIFMA
Insured by–Securities Industry and Financial Markets Association.
SOFR
Secured Overnight Financing Rate.
SONYMA
State of New York Mortgage Agency.
YoY
Year on Year Inflation Rates.
#
Variable rate security. The interest rate represents the rate in effect at September 30, 2023.
†
Security was purchased pursuant to Rule 144A under the Securities Act of 1933 and, unless registered under such Act or exempted from registration, may only be resold to qualified institutional buyers. At September 30, 2023, the total value of Rule 144A securities was $174,658,255, which represents 10.97% of net assets.
(a)
Unaudited.
(b)
Variable Rate is Fixed to Float: Rate remains fixed or at Zero Coupon until designated future date.
(c)
This investment has been rated by Fitch IBCA.
(d)
The interest rate reset date shown represents the date in which the Fund has the right to sell a Variable Rate Demand Note (“VRDN”) back to the issuer for Principal Amount. The interest rate on the VRDN is generally reset daily or weekly based on the SIFMA Municipal Swap Index.
(e)
Other Assets and Liabilities – Net include net unrealized appreciation/depreciation on futures contracts as follows:
See Notes to Financial Statements.
43
Schedule of Investments (concluded)
SHORT DURATION TAX FREE FUND September 30, 2023
Futures Contracts at September 30, 2023:
Type
Expiration
Contracts
Position
Notional Amount
Notional Value
Unrealized Depreciation
U.S. 2-Year Treasury Note
December 2023
382
Long
$
77,689,804
$
77,435,578
$(254,226
)
U.S. 5-Year Treasury Note
December 2023
228
Long
24,255,612
24,021,938
(233,674
)
Total Unrealized Depreciation on Futures Contracts
$(487,900
)
The following is a summary of the inputs used as of September 30, 2023 in valuing the Fund’s investments carried at fair value(1):
Investment Type(2)
Level 1
Level 2
Level 3
Total
Long-Term Investments
Municipal Bonds
$
–
$
1,447,485,340
$
–
$
1,447,485,340
Short-Term Investments
Variable Rate Demand Notes
–
114,354,000
–
114,354,000
Total
$
–
$
1,591,839,340
$
–
$
1,591,839,340
Other Financial Instruments
Futures Contracts
Assets
$
–
$
–
$
–
$
–
Liabilities
(487,900
)
–
–
(487,900
)
Total
$
(487,900
)
$
–
$
–
$
(487,900
)
(1)
Refer to Note 2(i) for a description of fair value measurements and the three-tier hierarchy of inputs.
(2)
See Schedule of Investments for fair values in each industry. The table above is presented by Investment Type. When applicable, each Level 3 security is identified on the Schedule of Investments along with the valuation technique utilized.
A reconciliation of Level 3 investments is presented when the Fund has a material amount of Level 3 investments at the beginning or end of the year in relation to the Fund’s net assets.
The following is a reconciliation of investments with unobservable inputs (Level 3) that were used in determining fair value:
Investment Type
Municipal Bonds
Balance as of October 1, 2022
$
28,124,780
Accrued Discounts (Premiums)
(103,280
)
Realized Gain (Loss)
(1,010,988
)
Change in Unrealized Appreciation (Depreciation)
1,489,115
Purchases
1,428,060
Sales
(10,796,660
)
Transfers into Level 3
–
Transfers out of Level 3(a)
(19,131,027
)
Balance as of September 30, 2023
$
–
Change in unrealized appreciation/depreciation for the year ended September 30, 2023, related to Level 3 investments held at September 30, 2023
$
–
(a)
The Fund recognizes transfers within the fair value hierarchy as of the beginning of the period. Transfers into and out of Level 3 were primarily related to the availability of market quotations in accordance with valuation methodology.
44
See Notes to Financial Statements.
Schedule of Investments
INTERMEDIATE TAX FREE FUND September 30, 2023
Investments
Interest Rate
Maturity Date
Credit Rating: S&P or Moody’s(a)
Principal Amount
Fair Value
LONG-TERM INVESTMENTS 98.43%
MUNICIPAL BONDS 98.43%
Building & Construction 0.13%
Virginia College Building Authority
5.00%
2/1/2036
AA+
$
2,250,000
$
2,449,886
Virginia College Building Authority
5.00%
2/1/2038
AA+
3,500,000
3,738,453
Total
6,188,339
Corporate-Backed 11.46%
Allegheny County Industrial Development Authority–US Steel Corporation PA
4.875%
11/1/2024
BB-
4,300,000
4,292,475
Arizona Industrial Development Authority
3.625%
5/20/2033
BBB
9,297,453
8,181,592
Black Belt Energy Gas District AL
4.00%
#(b)
10/1/2052
A2
41,580,000
40,426,754
Build NYC Resource Corp.–Pratt Paper Inc NY AMT†
4.50%
1/1/2025
NR
1,565,000
1,567,403
Build NYC Resource Corp.–Pratt Paper Inc NY AMT†
5.00%
1/1/2035
NR
550,000
554,049
California Community Choice Financing Authority†
4.25%
#(b)
7/1/2043
NR
20,000,000
19,878,670
California Municipal Finance Authority–Waste Mgmt Inc AMT
4.125%
#(b)
10/1/2041
A-
7,250,000
7,201,393
California Pollution Control Financing Authority–Waste Mgmt Inc AMT
3.00%
11/1/2025
A-
9,850,000
9,506,862
Chandler Industrial Development Authority–Intel Corporation AZ
3.80%
#(b)
12/1/2035
A2
17,195,000
16,881,699
City of Farmington–Public Service Co of NM
3.90%
#(b)
6/1/2040
BBB
7,000,000
6,798,243
City of Granite City–Waste Mgmt of Inc IL AMT
1.25%
5/1/2027
A-
5,485,000
4,838,500
City of Henderson–Pratt Paper LLC KY AMT†
3.70%
1/1/2032
NR
8,700,000
8,253,345
City of Henderson–Pratt Paper LLC KY AMT†
4.45%
1/1/2042
NR
1,500,000
1,388,359
City of Houston Airport System Revenue–United Airlines Inc TX AMT
5.00%
7/1/2029
BB-
2,295,000
2,261,096
City of Valparaiso–Pratt Paper LLC IN AMT
5.875%
1/1/2024
NR
105,000
105,583
City of Valparaiso–Pratt Paper LLC IN AMT
6.75%
1/1/2034
NR
5,000,000
5,031,088
County of Nez Perce–Potlatchdeltic Corp ID
2.75%
10/1/2024
BBB-
10,500,000
10,313,581
See Notes to Financial Statements.
45
Schedule of Investments (continued)
INTERMEDIATE TAX FREE FUND September 30, 2023
Investments
Interest Rate
Maturity Date
Credit Rating: S&P or Moody’s(a)
Principal Amount
Fair Value
Corporate-Backed (continued)
Development Authority of Burke County–Oglethorpe Power Corp GA
1.50%
#(b)
1/1/2040
BBB+
$
3,750,000
$
3,549,408
Development Authority of Rockdale County–Pratt Paper LLC GA AMT†
4.00%
1/1/2038
NR
5,205,000
4,788,714
Downtown Doral South Community Development District FL†
4.75%
12/15/2038
NR
625,000
572,637
Florida Development Finance Corp.–Waste pro USA Inc AMT†
6.125%
#(b)
7/1/2032
NR
7,430,000
7,394,970
Florida Development Finance Corp.–Waste Pro USA Inc AMT†
Montgomery County Higher Education & Health Authority–Thomas Jefferson Univ Oblig PA
4.00%
9/1/2036
A
1,350,000
1,252,373
Montgomery County Higher Education & Health Authority–Thomas Jefferson Univ Oblig PA
4.00%
9/1/2038
A
2,250,000
2,049,707
Montgomery County Industrial Development Authority–Albert Einstein Hlthcr Oblig PA
5.00%
1/15/2024
NR
4,000,000
4,009,684
Montgomery County Industrial Development Authority–Albert Einstein Hlthcr Oblig PA
5.25%
1/15/2026
NR
2,000,000
2,032,126
Montgomery County Industrial Development Authority–Albert Einstein Hlthcr Oblig PA
5.25%
1/15/2028
NR
3,000,000
3,048,188
Montgomery County Industrial Development Authority–Whitemarsh Cont Care Oblig PA
5.00%
1/1/2030
NR
2,000,000
1,904,921
Moon Industrial Development Authority–Baptist Homes Society Oblig PA
5.125%
7/1/2025
NR
1,975,000
1,881,533
New Jersey Health Care Facilities Financing Authority–Hackensack Merdn Hlth Oblig
5.00%
7/1/2028
AA-
5,500,000
5,742,026
New Jersey Health Care Facilities Financing Authority–St Joseph’s Hlthcr Oblig
5.00%
7/1/2028
BBB-
1,300,000
1,303,928
New Jersey Health Care Facilities Financing Authority–St Joseph’s Hlthcr Oblig
5.00%
7/1/2029
BBB-
1,605,000
1,608,075
New Jersey Health Care Facilities Financing Authority–St Joseph’s Hlthcr Oblig
5.00%
7/1/2030
BBB-
1,100,000
1,100,579
New Jersey Health Care Facilities Financing Authority–St Joseph’s Hlthcr Oblig
5.00%
7/1/2031
BBB-
1,110,000
1,107,894
New Jersey Health Care Facilities Financing Authority–St Joseph’s Hlthcr Oblig
5.00%
7/1/2035
BBB-
3,185,000
3,127,656
New Jersey Health Care Facilities Financing Authority–University Hospital (AGM)
5.00%
7/1/2028
AA
2,000,000
2,021,542
See Notes to Financial Statements.
65
Schedule of Investments (continued)
INTERMEDIATE TAX FREE FUND September 30, 2023
Investments
Interest Rate
Maturity Date
Credit Rating: S&P or Moody’s(a)
Principal Amount
Fair Value
��
Health Care (continued)
New Jersey Health Care Facilities Financing Authority–Valley Hlth Sys Oblig Grp
4.00%
7/1/2036
A
$
1,000,000
$
918,815
New Jersey Health Care Facilities Financing Authority–Valley Hlth Sys Oblig Grp
4.00%
7/1/2037
A
1,000,000
909,380
New York State Dormitory Authority–Catholic Hlth Sys Oblig
4.00%
7/1/2037
B-
1,100,000
815,566
New York State Dormitory Authority–Catholic Hlth Sys Oblig
4.00%
7/1/2039
B-
1,000,000
722,530
New York State Dormitory Authority–Catholic Hlth Sys Oblig
4.00%
7/1/2040
B-
850,000
602,737
New York State Dormitory Authority–Catholic Hlth Sys Oblig
5.00%
7/1/2036
B-
1,945,000
1,598,829
New York State Dormitory Authority–Garnet Hlth Med Ctr Oblig†
5.00%
12/1/2026
BBB-
1,500,000
1,462,618
New York State Dormitory Authority–Garnet Hlth Med Ctr Oblig†
5.00%
12/1/2029
BBB-
2,700,000
2,587,848
New York State Dormitory Authority–Garnet Hlth Med Ctr Oblig†
5.00%
12/1/2030
BBB-
1,100,000
1,048,121
New York State Dormitory Authority–Garnet Hlth Med Ctr Oblig†
5.00%
12/1/2031
BBB-
1,600,000
1,516,018
New York State Dormitory Authority–Montefiore Oblig Grp
4.00%
8/1/2036
BBB-
1,780,000
1,614,999
New York State Dormitory Authority–Montefiore Oblig Grp
4.00%
9/1/2036
BBB-
1,555,000
1,408,605
New York State Dormitory Authority–Montefiore Oblig Grp
4.00%
8/1/2037
BBB-
650,000
578,208
New York State Dormitory Authority–Montefiore Oblig Grp
4.00%
8/1/2038
BBB-
4,000,000
3,499,406
New York State Dormitory Authority–Montefiore Oblig Grp
4.00%
9/1/2038
BBB-
2,940,000
2,570,750
New York State Dormitory Authority–Montefiore Oblig Grp
4.00%
9/1/2040
BBB-
3,150,000
2,686,033
New York State Dormitory Authority–Northwell Hlth Oblig Grp
5.00%
#(b)
5/1/2048
A-
2,000,000
2,000,954
Norfolk Economic Development Authority–Sentara Hlthcr Oblig Gp VA
5.00%
#(b)
11/1/2048
AA
11,245,000
11,817,378
Oklahoma Development Finance Authority–OU Medicine Oblig Grp
5.00%
8/15/2033
BB-
2,045,000
1,879,441
66
See Notes to Financial Statements.
Schedule of Investments (continued)
INTERMEDIATE TAX FREE FUND September 30, 2023
Investments
Interest Rate
Maturity Date
Credit Rating: S&P or Moody’s(a)
Principal Amount
Fair Value
Health Care (continued)
Oklahoma Development Finance Authority–OU Medicine Oblig Grp
5.00%
8/15/2038
BB-
$
6,160,000
$
5,496,490
Oklahoma Development Finance Authority–OU Medicine Oblig Grp
5.25%
8/15/2043
BB-
6,710,000
6,015,043
Oneida County Local Development Corp.–Mohawk Valley Hlth Oblig NY (AGM)
4.00%
12/1/2035
AA
1,000,000
937,949
Oneida County Local Development Corp.–Mohawk Valley Hlth Oblig NY (AGM)
4.00%
12/1/2036
AA
1,250,000
1,155,787
Oneida County Local Development Corp.–Mohawk Valley Hlth Oblig NY (AGM)
4.00%
12/1/2037
AA
2,210,000
2,003,382
Orange County Health Facilities Authority–Orlando Hlth Oblig Group FL
5.00%
10/1/2035
A+
1,730,000
1,836,087
Orange County Health Facilities Authority–Orlando Hlth Oblig Group FL
5.00%
10/1/2037
A+
2,350,000
2,435,060
Orange County Health Facilities Authority–Orlando Hlth Oblig Group FL
5.00%
10/1/2038
A+
1,530,000
1,573,935
Orange County Health Facilities Authority–Orlando Hlth Oblig Group FL
5.00%
10/1/2039
A+
1,500,000
1,536,506
Orange County Health Facilities Authority–Orlando Hlth Oblig Group FL
5.00%
10/1/2040
A+
1,500,000
1,530,374
Palomar Health CA–Palomar Health Oblig Grp
5.00%
11/1/2036
BBB
5,280,000
5,199,631
Pennsylvania Economic Development Financing Authority–UPMC Oblig Grp
4.00%
2/15/2040
A
2,820,000
2,526,656
Public Finance Authority–Proton Intl Alabama LLC WI†(c)
6.85%
10/1/2047
NR
1,410,000
846,000
(d)
Rhode Island Health & Educational Building Corp.–Care New England Hlth Oblig
5.00%
9/1/2031
B+
5,000,000
4,664,836
South Carolina Jobs-Economic Development Authority–Kiawah Life Plan Vlg Inc
5.25%
11/15/2028
NR
5,700,000
5,611,930
Southeastern Ohio Port Authority–Marietta Area Hlthcr Oblig
5.00%
12/1/2035
B+
(e)
3,850,000
3,295,874
Southeastern Ohio Port Authority–Marietta Area Hlthcr Oblig
5.50%
12/1/2029
B+
(e)
750,000
710,365
State of Ohio–Univ Hosp Hlth Sys Oblig Gp
5.00%
1/15/2036
A
3,295,000
3,380,325
Tarrant County Cultural Education Facilities Finance Corp.–Baylor Scott & White Oblig TX
5.00%
#(b)
11/15/2052
AA-
4,000,000
4,245,154
Tarrant County Cultural Education Facilities Finance Corp.–Christus Health Oblig Group TX
5.00%
#(b)
7/1/2053
A1
8,850,000
9,235,560
See Notes to Financial Statements.
67
Schedule of Investments (continued)
INTERMEDIATE TAX FREE FUND September 30, 2023
Investments
Interest Rate
Maturity Date
Credit Rating: S&P or Moody’s(a)
Principal Amount
Fair Value
Health Care (continued)
Tulsa County Industrial Authority–Montereau Oblig Group OK
5.25%
11/15/2037
BBB-
(e)
$
1,250,000
$
1,215,932
University of Kansas Hospital Authority–Univ KS Hlth Sys Oblig Grp
5.00%
9/1/2034
AA-
5,000,000
5,046,684
Washington Health Care Facilities Authority–Commonspirit Hlth Oblig
5.00%
#(b)
8/1/2049
A-
4,550,000
4,554,819
Washington Health Care Facilities Authority–Providence St Joseph Oblig
4.00%
#(b)
10/1/2042
A
24,690,000
23,560,593
Washington State Housing Finance Commission–Spokane United Method Hms†
6.00%
1/1/2024
NR
245,000
245,956
West Virginia Hospital Finance Authority–WV United Hlth Sys Oblig
4.00%
6/1/2030
A
5,500,000
5,312,309
West Virginia Hospital Finance Authority–WV United Hlth Sys Oblig
4.00%
6/1/2035
A
1,570,000
1,463,875
Wisconsin Health & Educational Facilities Authority–Amer Baptist Homes Oblig
5.00%
8/1/2032
NR
1,375,000
1,166,101
Wisconsin Health & Educational Facilities Authority–Amer Baptist Homes Oblig
5.00%
8/1/2037
NR
1,500,000
1,167,466
Wisconsin Health & Educational Facilities Authority–Marshfield Clinic Hlth Oblig
5.36%
#
2/15/2053
BBB+
40,000,000
40,000,000
Total
545,846,147
Housing 1.26%
California Housing Finance Agency
3.25%
8/20/2036
BBB
7,289,368
6,385,921
California Housing Finance Agency
3.50%
11/20/2035
BBB+
5,632,507
4,943,132
California Housing Finance Agency
4.00%
3/20/2033
BBB+
4,555,954
4,336,790
California Housing Finance Agency
4.25%
1/15/2035
BBB+
4,219,883
3,960,438
California Municipal Finance Authority–Park Western Housing LP (FNMA)
2.65%
8/1/2036
Aaa
4,288,912
3,336,793
California Statewide Communities Development Authority–Community Improvement Authority CA†
3.00%
6/1/2047
NR
5,000,000
3,341,503
California Statewide Communities Development Authority–CHF-Irvine LLC
5.00%
5/15/2026
Baa1
1,000,000
1,018,094
California Statewide Communities Development Authority–CHF-Irvine LLC
5.00%
5/15/2027
Baa1
750,000
765,620
Florida Housing Finance Corp. (GNMA/FNMA/FHLMC)
3.00%
1/1/2052
Aaa
3,560,000
3,369,376
Florida Housing Finance Corp. (GNMA/FNMA/FHLMC)
3.00%
7/1/2052
Aaa
4,805,000
4,514,250
68
See Notes to Financial Statements.
Schedule of Investments (continued)
INTERMEDIATE TAX FREE FUND September 30, 2023
Investments
Interest Rate
Maturity Date
Credit Rating: S&P or Moody’s(a)
Principal Amount
Fair Value
Housing (continued)
Indiana Finance Authority–Chf-Tippecanoe LLC
5.00%
6/1/2038
NR
$
1,550,000
$
1,551,072
Indiana Finance Authority–Chf-Tippecanoe LLC
5.00%
6/1/2043
NR
2,525,000
2,478,343
Industrial Development Authority of the City of Phoenix Arizona–Downtown Phoenix Std Hsg AZ
5.00%
7/1/2032
Baa3
1,080,000
1,099,071
Maryland Community Development Administration
3.00%
9/1/2039
Aa1
10,000,000
7,895,126
Missouri Housing Development Commission (GNMA/FNMA/FHLMC)
3.25%
11/1/2052
AA+
2,750,000
2,603,944
Missouri Housing Development Commission (GNMA/FNMA/FHLMC)
4.25%
5/1/2047
AA+
1,335,000
1,311,670
New York City Housing Development Corp. NY
2.10%
11/1/2036
AA+
5,725,000
4,051,150
Washington State Housing Finance Commission
3.50%
12/20/2035
BBB+
4,828,942
4,176,320
Total
61,138,613
Lease Obligations 2.82%
County of Cuyahoga OH COPS
5.00%
12/1/2023
AA-
5,640,000
5,646,042
Illinois Sports Facilities Authority (AGM)
5.00%
6/15/2027
AA
3,000,000
3,000,098
Indiana Finance Authority
5.25%
2/1/2029
AA+
2,500,000
2,554,533
Michigan State Building Authority
5.00%
4/15/2034
Aa2
6,525,000
6,656,126
New Jersey Economic Development Authority
4.00%
11/1/2037
A2
3,000,000
2,823,916
New Jersey Economic Development Authority
4.00%
11/1/2038
A2
3,000,000
2,786,098
New Jersey Economic Development Authority
5.00%
6/15/2025
A2
5,085,000
5,158,721
New Jersey Economic Development Authority
5.00%
6/15/2033
A2
7,215,000
7,472,489
New Jersey Economic Development Authority
5.00%
6/15/2034
A2
3,000,000
3,154,606
New Jersey Economic Development Authority
5.00%
6/15/2034
A2
13,645,000
14,104,811
New Jersey Economic Development Authority
5.00%
6/15/2035
A2
4,925,000
5,023,759
New Jersey Economic Development Authority
5.00%
6/15/2035
A2
1,000,000
1,051,535
See Notes to Financial Statements.
69
Schedule of Investments (continued)
INTERMEDIATE TAX FREE FUND September 30, 2023
Investments
Interest Rate
Maturity Date
Credit Rating: S&P or Moody’s(a)
Principal Amount
Fair Value
Lease Obligations (continued)
New Jersey Economic Development Authority
5.00%
6/15/2036
A2
$
1,320,000
$
1,343,026
New Jersey Economic Development Authority
5.00%
6/15/2042
A2
1,400,000
1,472,150
New Jersey Economic Development Authority†
5.25%
9/1/2027
A-
24,555,000
25,708,235
New Jersey Transportation Trust Fund Authority
3.25%
6/15/2039
A2
2,000,000
1,663,779
New Jersey Transportation Trust Fund Authority
4.00%
6/15/2035
A2
3,750,000
3,665,927
New Jersey Transportation Trust Fund Authority
4.00%
6/15/2036
A2
2,770,000
2,656,250
New Jersey Transportation Trust Fund Authority
5.00%
6/15/2030
A+
3,000,000
3,056,643
New Jersey Transportation Trust Fund Authority
5.00%
6/15/2031
A+
2,400,000
2,442,222
New Jersey Transportation Trust Fund Authority
5.00%
12/15/2033
A2
25,410,000
26,291,158
Redevelopment Authority of the City of Philadelphia PA
5.00%
4/15/2028
A1
4,380,000
4,442,499
School Board of Miami-Dade County FL GO
4.00%
3/15/2034
AA-
4,535,000
4,538,193
Total
136,712,816
Multi-Family Housing 0.05%
Illinois Housing Development Authority (HUD SECT8) (FHA)
4.00%
#(b)
6/1/2026
Aaa
2,700,000
2,660,136
Other Revenue 2.55%
Black Belt Energy Gas District AL
4.00%
#(b)
12/1/2049
A1
12,675,000
12,446,069
Brooklyn Arena Local Development Corp.–Brooklyn Events Ctr LLC NY
5.00%
7/15/2042
Ba1
7,600,000
7,226,128
Brooklyn Arena Local Development Corp.–Brooklyn Events Ctr LLC NY (AGM)
4.00%
7/15/2029
AA
1,500,000
1,454,175
Brooklyn Arena Local Development Corp.–Brooklyn Events Ctr LLC NY
5.00%
7/15/2024
Ba1
3,550,000
3,563,543
Cleveland-Cuyahoga County Port Authority–Playhouse Square Fdtn OH
5.00%
12/1/2033
BB+
2,000,000
1,954,717
Cleveland-Cuyahoga County Port Authority–Playhouse Square Fdtn OH
5.25%
12/1/2038
BB+
1,650,000
1,594,652
Commonwealth of Puerto Rico
5.069%
#(b)
11/1/2051
NR
17,586,280
9,056,934
Duval County Public Schools FL COPS (AGM)
5.00%
7/1/2034
AA
2,000,000
2,124,996
70
See Notes to Financial Statements.
Schedule of Investments (continued)
INTERMEDIATE TAX FREE FUND September 30, 2023
Investments
Interest Rate
Maturity Date
Credit Rating: S&P or Moody’s(a)
Principal Amount
Fair Value
Other Revenue (continued)
Illinois Finance Authority–Field Museum Natural Hist
4.917% (SOFR * .70 + 1.20%
)#
11/1/2034
A
$
10,350,000
$
10,294,721
Industrial Development Authority of the County of Pima–Edkey Oblig Group AZ†
5.00%
7/1/2035
NR
5,000,000
4,738,075
Lower Alabama Gas District
4.00%
#(b)
12/1/2050
A2
30,995,000
30,389,519
Maricopa County Industrial Development Authority–Paragon Management Inc AZ†
5.00%
7/1/2036
BB+
2,500,000
2,404,057
Maricopa County Industrial Development Authority AZ†
5.00%
7/1/2039
BB+
2,055,000
1,912,683
Maryland Economic Development Corp.(c)
5.00%
12/1/2016
NR
700,000
420,000
M-S-R Energy Authority CA
6.125%
11/1/2029
BBB+
3,380,000
3,526,044
Triborough Bridge & Tunnel Authority NY
2.00%
#(b)
5/15/2045
AA+
5,000,000
4,913,390
Triborough Bridge & Tunnel Authority NY
5.00%
11/15/2032
AA+
14,810,000
16,149,188
Washington State Convention Center Public Facilities District
4.00%
7/1/2031
NR
10,180,000
9,385,015
Total
123,553,906
Power 0.15%
Energy Northwest–Bonneville Power Admin WA
5.00%
7/1/2038
Aa1
4,000,000
4,282,425
York County Economic Development Authority–Virginia Elec & Pwr Co
3.65%
#(b)
5/1/2033
A2
3,000,000
2,907,652
Total
7,190,077
Pre-Refunded 0.00%
New York State Dormitory Authority
4.00%
2/15/2034
NR
15,000
15,197
Single-Family Housing 0.20%
Pennsylvania Housing Finance Agency
5.50%
10/1/2053
AA+
9,500,000
9,770,736
Special Tax 1.75%
Allentown Neighborhood Improvement Zone Development Authority PA†
5.00%
5/1/2032
Ba3
1,250,000
1,257,338
Allentown Neighborhood Improvement Zone Development Authority PA†
5.375%
5/1/2042
NR
5,500,000
5,320,479
Allentown Neighborhood Improvement Zone Development Authority PA†
6.00%
5/1/2042
NR
1,860,000
1,857,826
Emeryville Redevelopment Agency Successor Agency CA Tax Allocation (AGM)
5.00%
9/1/2025
AA
2,650,000
2,678,385
Industrial Development Authority of the City of St. Louis Missouri
4.375%
11/15/2035
NR
3,955,000
3,043,557
See Notes to Financial Statements.
71
Schedule of Investments (continued)
INTERMEDIATE TAX FREE FUND September 30, 2023
Investments
Interest Rate
Maturity Date
Credit Rating: S&P or Moody’s(a)
Principal Amount
Fair Value
Special Tax (continued)
Industrial Development Authority of the City of St. Louis Missouri
4.75%
11/15/2047
NR
$
3,000,000
$
2,089,376
Lakewood Ranch Stewardship District FL(f)
6.125%
5/1/2043
NR
2,250,000
2,257,963
Miami World Center Community Development District FL
4.75%
11/1/2027
NR
750,000
749,730
Mida Mountain Village Public Infrastructure District UT†
4.50%
8/1/2040
NR
1,250,000
1,023,706
New York City Industrial Development Agency–Queens Ballpark Co LLC NY (AGM)
3.00%
1/1/2033
AA
1,750,000
1,509,636
New York City Industrial Development Agency–Queens Ballpark Co LLC NY (AGM)
3.00%
1/1/2034
AA
1,000,000
848,526
New York City Industrial Development Agency–Yankee Stadium LLC NY (AGM)
3.00%
3/1/2036
AA
5,500,000
4,514,818
Orange County Community Facilities District CA Special Tax
5.00%
8/15/2033
NR
1,370,000
1,388,593
Orange County Community Facilities District CA Special Tax
5.00%
8/15/2035
NR
975,000
986,237
Peninsula Town Center Community Development Authority VA†
4.50%
9/1/2028
NR
545,000
529,146
Peninsula Town Center Community Development Authority VA†
5.00%
9/1/2037
NR
875,000
819,062
River Islands Public Financing Authority CA Special Tax
4.00%
9/1/2051
NR
990,000
741,111
River Islands Public Financing Authority CA Special Tax (AGM)
5.00%
9/1/2042
AA
4,000,000
4,181,564
State of Connecticut Special Tax Revenue
4.00%
9/1/2034
AA
8,075,000
8,031,154
State of Connecticut Special Tax Revenue
5.00%
10/1/2030
AA
9,000,000
9,542,951
State of Connecticut Special Tax Revenue
5.00%
1/1/2032
AA
14,375,000
15,053,270
Village Community Development District No. 12 FL
3.25%
5/1/2026
NR
2,280,000
2,232,916
Village Community Development District No. 12 FL
3.80%
5/1/2028
NR
2,055,000
2,010,122
Village Community Development District No. 12 FL
4.00%
5/1/2033
NR
1,830,000
1,744,989
Village Community Development District No. 13 FL
1.80%
5/1/2026
NR
535,000
499,215
Village Community Development District No. 13 FL
2.85%
5/1/2036
NR
1,880,000
1,476,895
Village Community Development District No. 13 FL
3.00%
5/1/2029
NR
475,000
434,493
72
See Notes to Financial Statements.
Schedule of Investments (continued)
INTERMEDIATE TAX FREE FUND September 30, 2023
Investments
Interest Rate
Maturity Date
Credit Rating: S&P or Moody’s(a)
Principal Amount
Fair Value
Special Tax (continued)
Village Community Development District No. 13 FL†
3.00%
5/1/2035
NR
$
3,360,000
$
2,758,909
Village Community Development District No. 13 FL†
3.25%
5/1/2040
NR
4,200,000
3,176,828
Village Community Development District No. 13 FL
3.375%
5/1/2034
NR
2,465,000
2,169,493
Total
84,928,288
Tax Revenue 2.51%
Chicago Board of Education IL GO
5.00%
12/1/2032
BB+
5,675,000
5,722,486
City of Sparks NV†
2.75%
6/15/2028
Ba1
2,205,000
2,016,988
Clear Creek Independent School District TX GO (PSF GTD)
0.28%
#(b)
2/15/2038
AAA
4,930,000
4,758,954
County of Cook Sales Tax Revenue IL
4.00%
11/15/2034
AA-
3,750,000
3,654,975
County of Cook Sales Tax Revenue IL
5.25%
11/15/2036
AA-
10,000,000
10,318,097
Metropolitan Atlanta Rapid Transit Authority GA
5.00%
7/1/2032
AAA
5,000,000
5,155,962
New Jersey Transportation Trust Fund Authority
5.00%
6/15/2031
A2
3,200,000
3,325,799
New York City Transitional Finance Authority
5.00%
5/1/2039
Aa1
5,000,000
5,250,586
New York City Transitional Finance Authority
5.50%
5/1/2044
Aa1
8,500,000
9,151,073
New York City Transitional Finance Authority Building Aid Revenue NY
5.25%
7/15/2036
AA
11,700,000
12,262,623
New York City Transitional Finance Authority Future Tax Secured Revenue NY
3.00%
11/1/2037
AAA
2,500,000
2,004,960
New York State Thruway Authority
5.00%
3/15/2035
AA+
6,000,000
6,481,106
New York State Urban Development Corp.
5.00%
3/15/2034
Aa1
12,140,000
13,199,634
New York State Urban Development Corp.
5.00%
3/15/2035
Aa1
5,000,000
5,408,765
Puerto Rico Sales Tax Financing Corp. Sales Tax Revenue
Zero Coupon
7/1/2029
NR
1,616,000
1,258,523
Puerto Rico Sales Tax Financing Corp. Sales Tax Revenue
Zero Coupon
7/1/2031
NR
1,774,000
1,258,968
Puerto Rico Sales Tax Financing Corp. Sales Tax Revenue
Zero Coupon
7/1/2033
NR
11,643,000
7,474,804
Puerto Rico Sales Tax Financing Corp. Sales Tax Revenue
4.329%
7/1/2040
NR
5,223,000
4,691,108
See Notes to Financial Statements.
73
Schedule of Investments (continued)
INTERMEDIATE TAX FREE FUND September 30, 2023
Investments
Interest Rate
Maturity Date
Credit Rating: S&P or Moody’s(a)
Principal Amount
Fair Value
Tax Revenue (continued)
Puerto Rico Sales Tax Financing Corp. Sales Tax Revenue
4.329%
7/1/2040
NR
$
12,051,000
$
10,823,768
Puerto Rico Sales Tax Financing Corp. Sales Tax Revenue
4.536%
7/1/2053
NR
81,000
69,298
Puerto Rico Sales Tax Financing Corp. Sales Tax Revenue
4.55%
7/1/2040
NR
268,000
247,251
Puerto Rico Sales Tax Financing Corp. Sales Tax Revenue
4.75%
7/1/2053
NR
1,967,000
1,743,867
Puerto Rico Sales Tax Financing Corp. Sales Tax Revenue
4.784%
7/1/2058
NR
1,092,000
955,876
Puerto Rico Sales Tax Financing Corp. Sales Tax Revenue
5.00%
7/1/2058
NR
4,974,000
4,511,833
Total
121,747,304
Taxable Revenue–Water & Sewer 1.07%
City of Chicago Waterworks Revenue IL (AGM)
5.00%
11/1/2036
AA
1,500,000
1,586,626
City of Chicago Waterworks Revenue IL (AGM)
5.00%
11/1/2037
AA
1,000,000
1,046,471
City of Chicago Waterworks Revenue IL (AGM)
5.00%
11/1/2038
AA
1,500,000
1,562,860
Louisville & Jefferson County Metropolitan Sewer District KY
5.00%
5/15/2035
Aa3
10,000,000
11,023,043
New Jersey Economic Development Authority–New Jersey Amern Wtr Co AMT
3.75%
#(b)
11/1/2034
A+
5,500,000
5,227,943
Pittsburgh Water & Sewer Authority PA (AGM)
5.00%
9/1/2036
A1
6,750,000
7,339,117
Pittsburgh Water & Sewer Authority PA (AGM)
5.00%
9/1/2037
A1
4,750,000
5,100,951
Pittsburgh Water & Sewer Authority PA (AGM)
5.00%
9/1/2038
A1
4,500,000
4,780,820
San Francisco City & County Public Utilities Commission Wastewater Revenue CA
4.00%
#(b)
10/1/2048
AA
14,000,000
14,134,605
Total
51,802,436
Tobacco 1.40%
Buckeye Tobacco Settlement Financing Authority OH
5.00%
6/1/2055
NR
31,215,000
26,928,266
Iowa Tobacco Settlement Authority
4.00%
6/1/2049
BBB+
6,105,000
5,651,654
Michigan Finance Authority
4.00%
6/1/2034
A-
1,000,000
995,413
Michigan Finance Authority
4.00%
6/1/2035
A-
2,000,000
1,967,111
74
See Notes to Financial Statements.
Schedule of Investments (continued)
INTERMEDIATE TAX FREE FUND September 30, 2023
Investments
Interest Rate
Maturity Date
Credit Rating: S&P or Moody’s(a)
Principal Amount
Fair Value
Tobacco (continued)
Nassau County Tobacco Settlement Corp. NY
Zero Coupon
6/1/2060
NR
$
35,000,000
$
1,722,165
Northern Tobacco Securitization Corp. AK
4.00%
6/1/2037
A-
1,500,000
1,410,410
Northern Tobacco Securitization Corp. AK
4.00%
6/1/2050
BBB-
1,345,000
1,243,083
Tobacco Settlement Financing Corp. NJ
5.00%
6/1/2046
BBB-
9,600,000
8,934,778
Tobacco Settlement Financing Corp. NJ
5.25%
6/1/2046
BBB+
5,100,000
5,128,927
Tobacco Settlement Financing Corp. RI
5.00%
6/1/2027
BBB
2,500,000
2,523,969
Tobacco Settlement Financing Corp. RI
5.00%
6/1/2028
BBB
2,000,000
2,020,730
Tobacco Settlement Financing Corp. VA
5.00%
6/1/2047
B-
3,690,000
3,264,701
TSASC, Inc. NY
5.00%
6/1/2029
A
5,775,000
5,958,017
Total
67,749,224
Transportation 20.88%
Alameda Corridor Transportation Authority CA (AGM)
5.00%
10/1/2034
AA
3,650,000
3,741,110
California Municipal Finance Authority–Lax Integrated Express AMT
5.00%
6/30/2031
BBB-
(e)
3,250,000
3,317,265
California Municipal Finance Authority–Lax Integrated Express AMT
5.00%
12/31/2036
BBB-
(e)
3,215,000
3,239,853
California Municipal Finance Authority–Lax Integrated Express AMT
5.00%
12/31/2037
BBB-
(e)
7,000,000
7,018,299
Central Florida Expressway Authority
4.00%
7/1/2037
A+
7,380,000
6,717,605
Central Texas Regional Mobility Authority
4.00%
1/1/2034
A
4,750,000
4,659,036
Central Texas Regional Mobility Authority
4.00%
1/1/2035
A
4,000,000
3,890,559
Central Texas Regional Mobility Authority
4.00%
1/1/2036
A
4,510,000
4,330,199
Central Texas Regional Mobility Authority
5.00%
1/1/2025
A-
7,500,000
7,534,339
Central Texas Regional Mobility Authority
5.00%
1/1/2027
A-
15,000,000
15,259,050
Central Texas Regional Mobility Authority
5.00%
1/1/2030
A
800,000
814,499
Central Texas Regional Mobility Authority
5.00%
1/1/2031
A
1,675,000
1,705,356
Central Texas Regional Mobility Authority
5.00%
1/1/2032
A
2,000,000
2,036,246
Central Texas Turnpike System
5.00%
8/15/2025
A-
2,250,000
2,254,171
Central Texas Turnpike System
5.00%
8/15/2026
A-
2,500,000
2,499,353
Central Texas Turnpike System
5.00%
8/15/2027
A-
3,300,000
3,301,027
See Notes to Financial Statements.
75
Schedule of Investments (continued)
INTERMEDIATE TAX FREE FUND September 30, 2023
Investments
Interest Rate
Maturity Date
Credit Rating: S&P or Moody’s(a)
Principal Amount
Fair Value
Transportation (continued)
Central Texas Turnpike System
5.00%
8/15/2028
A-
$
3,705,000
$
3,707,232
Central Texas Turnpike System
5.00%
8/15/2033
A-
7,650,000
7,612,281
Chicago Midway International Airport IL
4.00%
1/1/2034
A
2,175,000
2,099,977
Chicago Midway International Airport IL
5.00%
1/1/2026
A
6,075,000
6,073,846
Chicago Midway International Airport IL AMT
5.00%
1/1/2026
A
4,605,000
4,600,260
Chicago Midway International Airport IL AMT
5.00%
1/1/2030
A
5,000,000
4,985,125
Chicago Midway International Airport IL AMT
5.00%
1/1/2031
A
2,000,000
2,011,329
Chicago O’Hare International Airport IL
4.00%
1/1/2038
A+
6,820,000
6,469,066
Chicago O’Hare International Airport IL
5.00%
1/1/2031
A+
6,500,000
6,548,049
Chicago O’Hare International Airport IL (BAM)
5.00%
1/1/2036
NR
2,000,000
2,091,034
Chicago O’Hare International Airport IL (BAM)
5.00%
1/1/2037
NR
1,330,000
1,378,329
Chicago O’Hare International Airport IL (BAM)
5.00%
1/1/2038
NR
1,785,000
1,831,055
Chicago O’Hare International Airport IL (BAM)
5.25%
1/1/2039
NR
1,190,000
1,242,237
City & County of Denver Airport System Revenue CO AMT
5.00%
11/15/2031
AA-
16,500,000
17,376,699
City & County of Denver Airport System Revenue CO AMT
5.00%
12/1/2031
A+
15,000,000
15,355,354
City & County of Denver Airport System Revenue CO AMT
5.00%
12/1/2035
A+
5,000,000
5,083,076
City & County of Denver Airport System Revenue CO AMT
5.50%
11/15/2033
AA-
8,365,000
9,156,168
City & County of Denver Airport System Revenue CO AMT
5.75%
11/15/2034
AA-
3,500,000
3,933,383
City & County of Denver Airport System Revenue CO AMT
5.75%
11/15/2035
Aa3
3,250,000
3,626,268
City & County of Denver Airport System Revenue CO AMT
5.75%
11/15/2037
AA-
2,000,000
2,187,327
City of Atlanta Airport Passenger Facility Charge GA AMT
4.00%
7/1/2037
AA-
4,150,000
3,905,201
City of Atlanta Airport Passenger Facility Charge GA AMT
5.00%
1/1/2029
AA-
2,500,000
2,499,043
City of Atlanta Airport Passenger Facility Charge GA AMT
5.00%
7/1/2036
Aa3
7,600,000
7,924,248
City of Atlanta Airport Passenger Facility Charge GA AMT
5.00%
7/1/2037
Aa3
3,750,000
3,874,627
City of Atlanta Airport Passenger Facility Charge GA AMT
5.00%
7/1/2038
Aa3
2,750,000
2,824,006
City of Atlanta Airport Passenger Facility Charge GA AMT
5.25%
7/1/2041
Aa3
6,000,000
6,268,303
76
See Notes to Financial Statements.
Schedule of Investments (continued)
INTERMEDIATE TAX FREE FUND September 30, 2023
Investments
Interest Rate
Maturity Date
Credit Rating: S&P or Moody’s(a)
Principal Amount
Fair Value
Transportation (continued)
City of Houston Airport System Revenue–United Airlines Inc TX AMT
4.75%
7/1/2024
BB-
$
2,390,000
$
2,385,511
City of Houston Airport System Revenue–United Airlines Inc TX AMT
5.00%
7/15/2027
B-
(e)
1,000,000
995,405
City of Houston Airport System Revenue (AGM) AMT
5.00%
7/1/2035
A1
8,005,000
8,416,820
City of Houston Airport System Revenue (AGM) AMT
5.00%
7/1/2036
A1
2,850,000
2,969,304
City of Houston Airport System Revenue (AGM) AMT
5.00%
7/1/2037
A1
2,000,000
2,061,705
City of Houston Airport System Revenue (AGM) AMT
5.00%
7/1/2038
A1
2,000,000
2,044,380
City of Houston Airport System Revenue (AGM) AMT
5.25%
7/1/2039
A1
2,700,000
2,800,044
City of Los Angeles Department of Airports CA AMT
5.00%
5/15/2033
AA
4,500,000
4,779,407
City of Los Angeles Department of Airports CA AMT
5.00%
5/15/2034
AA-
2,930,000
3,070,923
City of Los Angeles Department of Airports CA AMT
5.00%
5/15/2034
AA
6,000,000
6,363,687
City of Philadelphia Airport Revenue PA AMT
5.00%
7/1/2032
A2
3,660,000
3,807,360
City of Phoenix Civic Improvement Corp. AZ
5.00%
7/1/2036
Aa2
4,045,000
4,182,047
City of Phoenix Civic Improvement Corp. AZ
5.00%
7/1/2036
Aa3
5,000,000
5,151,863
City of Salt Lake City Airport Revenue UT AMT
5.00%
7/1/2029
A+
3,000,000
3,079,799
City of Salt Lake City Airport Revenue UT AMT
5.00%
7/1/2030
A+
2,275,000
2,319,434
City of Salt Lake City Airport Revenue UT AMT
5.00%
7/1/2031
A+
3,000,000
3,058,342
City of Salt Lake City Airport Revenue UT AMT
5.00%
7/1/2034
A+
14,645,000
14,980,498
City of Salt Lake City Airport Revenue UT AMT
5.00%
7/1/2034
A+
4,455,000
4,537,226
City of Salt Lake City Airport Revenue UT AMT
5.25%
7/1/2036
A2
1,500,000
1,610,555
City of Salt Lake City Airport Revenue UT AMT
5.25%
7/1/2037
A2
2,325,000
2,470,111
City of Salt Lake City Airport Revenue UT AMT
5.25%
7/1/2039
A2
3,000,000
3,146,938
City of Salt Lake City Airport Revenue UT AMT
5.25%
7/1/2041
A2
4,425,000
4,605,288
City of Salt Lake City Airport Revenue UT AMT
5.25%
7/1/2042
A2
3,500,000
3,625,714
County of Broward Airport System Revenue FL AMT
5.00%
10/1/2035
A+
2,660,000
2,720,829
County of Broward Airport System Revenue FL AMT
5.00%
10/1/2036
A+
2,615,000
2,655,617
County of Broward Airport System Revenue FL AMT
5.00%
10/1/2037
A+
4,000,000
4,033,647
See Notes to Financial Statements.
77
Schedule of Investments (continued)
INTERMEDIATE TAX FREE FUND September 30, 2023
Investments
Interest Rate
Maturity Date
Credit Rating: S&P or Moody’s(a)
Principal Amount
Fair Value
Transportation (continued)
County of Lee Airport Revenue FL AMT
5.00%
10/1/2029
A2
$
11,000,000
$
11,365,548
County of Miami-Dade Aviation Revenue FL
5.00%
10/1/2025
A1
3,690,000
3,716,211
County of Miami-Dade Aviation Revenue FL AMT
5.00%
10/1/2027
A1
5,145,000
5,143,043
County of Miami-Dade Aviation Revenue FL AMT
5.00%
10/1/2028
A1
3,500,000
3,497,804
County of Sacramento Airport System Revenue CA AMT
5.00%
7/1/2027
A+
5,950,000
6,110,671
County of Sacramento Airport System Revenue CA AMT
5.00%
7/1/2034
A+
4,000,000
4,119,218
County of Sacramento Airport System Revenue CA AMT
5.00%
7/1/2036
A+
5,645,000
5,755,623
Dallas Fort Worth International Airport TX
5.00%
11/1/2033
A+
2,000,000
2,001,350
Dallas Fort Worth International Airport TX
5.00%
11/1/2038
A+
3,000,000
3,132,854
Dallas Fort Worth International Airport TX
5.00%
11/1/2039
A1
2,750,000
2,869,587
Delaware River Joint Toll Bridge Commission PA
5.00%
7/1/2030
A+
1,920,000
1,988,140
Delaware River Joint Toll Bridge Commission PA
5.00%
7/1/2032
A+
2,025,000
2,095,863
E-470 Public Highway Authority CO
3.908% (SOFR * .67 + .35%
)#
9/1/2039
A+
1,690,000
1,683,884
Greater Orlando Aviation Authority FL AMT
4.00%
10/1/2035
AA-
8,000,000
7,675,615
Greater Orlando Aviation Authority FL AMT
4.00%
10/1/2039
AA-
2,900,000
2,664,586
Greater Orlando Aviation Authority FL AMT
5.00%
10/1/2029
A+
3,000,000
3,108,553
Illinois State Toll Highway Authority
5.00%
1/1/2027
AA-
1,000,000
1,001,848
Illinois State Toll Highway Authority
5.00%
1/1/2028
AA-
2,535,000
2,539,725
Kansas City Industrial Development Authority MO AMT
5.00%
3/1/2036
A2
5,000,000
5,068,827
Kansas City Industrial Development Authority MO AMT
5.00%
3/1/2038
A2
6,205,000
6,203,177
Maryland Economic Development Corp.–Consol Marine Terminals L
5.75%
9/1/2025
BB
5,000,000
5,042,075
Maryland Economic Development Corp. Tax Allocation
4.00%
9/1/2040
NR
5,000,000
4,195,568
Metropolitan Nashville Airport Authority TN AMT
5.25%
7/1/2034
A1
1,250,000
1,339,725
Metropolitan Nashville Airport Authority TN AMT
5.25%
7/1/2035
A1
2,595,000
2,765,930
Metropolitan Nashville Airport Authority TN AMT
5.50%
7/1/2036
A1
1,000,000
1,077,959
78
See Notes to Financial Statements.
Schedule of Investments (continued)
INTERMEDIATE TAX FREE FUND September 30, 2023
Investments
Interest Rate
Maturity Date
Credit Rating: S&P or Moody’s(a)
Principal Amount
Fair Value
Transportation (continued)
Metropolitan Nashville Airport Authority TN AMT
5.50%
7/1/2037
A1
$
1,250,000
$
1,334,547
Metropolitan Nashville Airport Authority TN AMT
5.50%
7/1/2038
A1
1,500,000
1,589,262
Metropolitan Transportation Authority NY
4.00%
11/15/2032
A3
8,500,000
8,264,247
Metropolitan Transportation Authority NY
5.00%
11/15/2028
A3
9,090,000
9,422,609
Metropolitan Transportation Authority NY
5.00%
11/15/2033
A3
4,025,000
4,147,408
Metropolitan Transportation Authority NY
5.00%
11/15/2035
A3
5,000,000
5,014,597
Metropolitan Transportation Authority NY
5.00%
11/15/2038
A3
1,500,000
1,488,922
Metropolitan Transportation Authority NY
5.25%
11/15/2028
A3
6,760,000
6,856,767
Metropolitan Transportation Authority NY
5.25%
11/15/2035
A3
7,500,000
7,479,589
Metropolitan Washington Airports Authority Aviation Revenue DC AMT
5.00%
10/1/2032
AA-
11,195,000
11,833,751
Metropolitan Washington Airports Authority Aviation Revenue DC AMT
5.00%
10/1/2036
AA-
2,175,000
2,256,403
Metropolitan Washington Airports Authority Aviation Revenue DC AMT
5.00%
10/1/2037
AA-
2,335,000
2,402,014
Metropolitan Washington Airports Authority Aviation Revenue DC AMT
5.00%
10/1/2038
AA-
1,860,000
1,907,067
Metropolitan Washington Airports Authority Aviation Revenue DC AMT
5.25%
10/1/2039
AA-
4,305,000
4,506,262
Metropolitan Washington Airports Authority Dulles Toll Road Revenue DC
4.00%
10/1/2035
A-
1,000,000
969,409
Metropolitan Washington Airports Authority Dulles Toll Road Revenue DC
4.00%
10/1/2036
A-
1,500,000
1,429,707
Metropolitan Washington Airports Authority Dulles Toll Road Revenue DC
4.00%
10/1/2037
A-
1,500,000
1,403,954
Minneapolis-St. Paul Metropolitan Airports Commission MN
5.00%
1/1/2028
A+
3,500,000
3,508,115
New Jersey Economic Development Authority–NYNJ Link Borrower LLC AMT
5.125%
1/1/2034
BBB+
5,010,000
5,021,648
New Jersey Transportation Trust Fund Authority
4.00%
6/15/2038
A2
3,000,000
2,800,058
New Jersey Transportation Trust Fund Authority
4.00%
6/15/2039
A2
6,000,000
5,559,292
New Jersey Transportation Trust Fund Authority
5.00%
6/15/2028
A+
6,275,000
6,401,473
New Jersey Transportation Trust Fund Authority
5.00%
6/15/2032
A2
6,960,000
7,473,768
See Notes to Financial Statements.
79
Schedule of Investments (continued)
INTERMEDIATE TAX FREE FUND September 30, 2023
Investments
Interest Rate
Maturity Date
Credit Rating: S&P or Moody’s(a)
Principal Amount
Fair Value
Transportation (continued)
New Jersey Transportation Trust Fund Authority
5.00%
6/15/2034
A2
$
10,000,000
$
10,675,703
New Jersey Transportation Trust Fund Authority
5.00%
6/15/2034
A2
2,500,000
2,676,958
New Jersey Transportation Trust Fund Authority
5.00%
6/15/2035
A2
2,250,000
2,395,851
New Jersey Transportation Trust Fund Authority
5.00%
6/15/2037
A2
4,250,000
4,465,000
New Jersey Transportation Trust Fund Authority
5.00%
6/15/2038
A2
1,000,000
1,044,084
New Jersey Transportation Trust Fund Authority
5.00%
6/15/2038
A2
2,000,000
2,090,419
New Jersey Transportation Trust Fund Authority
5.00%
6/15/2039
A2
3,000,000
3,119,257
New Jersey Turnpike Authority
5.00%
1/1/2029
AA-
5,000,000
5,033,201
New Jersey Turnpike Authority
5.00%
1/1/2031
AA-
5,000,000
5,054,946
New Jersey Turnpike Authority
5.00%
1/1/2033
AA-
2,100,000
2,170,191
New Jersey Turnpike Authority
5.00%
1/1/2034
AA-
1,500,000
1,572,003
New York State Dormitory Authority
4.00%
1/1/2038
A1
13,000,000
12,254,709
New York State Thruway Authority
4.00%
1/1/2037
A1
11,770,000
11,336,042
New York State Thruway Authority
5.00%
1/1/2026
A1
5,115,000
5,177,155
New York Transportation Development Corp.–Delta Air Lines Inc AMT
4.00%
10/1/2030
Baa3
4,225,000
4,079,739
New York Transportation Development Corp.–Delta Air Lines Inc AMT
4.00%
1/1/2036
Baa3
10,010,000
9,237,340
New York Transportation Development Corp.–Delta Air Lines Inc AMT
5.00%
1/1/2033
Baa3
11,000,000
11,093,677
New York Transportation Development Corp.–Delta Air Lines Inc AMT
5.00%
1/1/2034
Baa3
3,450,000
3,477,460
New York Transportation Development Corp.–Delta Air Lines Inc AMT
5.00%
1/1/2036
Baa3
10,500,000
10,454,040
New York Transportation Development Corp.–Empire St Thruway Partnrs AMT
4.00%
10/31/2034
BBB-
(e)
750,000
707,315
New York Transportation Development Corp.–Empire St Thruway Partnrs AMT
4.00%
10/31/2041
BBB-
(e)
3,000,000
2,574,170
New York Transportation Development Corp.–JFK Intl Air Terminal LLC
5.00%
12/1/2034
Baa1
2,000,000
2,087,754
New York Transportation Development Corp.–JFK Intl Air Terminal LLC AMT
5.00%
12/1/2024
Baa1
2,000,000
2,009,603
80
See Notes to Financial Statements.
Schedule of Investments (continued)
INTERMEDIATE TAX FREE FUND September 30, 2023
Investments
Interest Rate
Maturity Date
Credit Rating: S&P or Moody’s(a)
Principal Amount
Fair Value
Transportation (continued)
New York Transportation Development Corp.–JFK Intl Air Terminal LLC AMT
5.00%
12/1/2030
Baa1
$
10,000,000
$
10,273,412
New York Transportation Development Corp.–Laguardia Gateway Partner AMT
4.00%
7/1/2032
Baa2
3,000,000
2,803,494
New York Transportation Development Corp.–Laguardia Gateway Partner AMT
4.00%
7/1/2033
Baa2
6,480,000
6,016,326
New York Transportation Development Corp.–Laguardia Gateway Partner AMT
5.00%
7/1/2034
Baa2
2,250,000
2,230,043
Niagara Frontier Transportation Authority NY AMT
5.00%
4/1/2027
A3
3,185,000
3,184,795
Niagara Frontier Transportation Authority NY AMT
5.00%
4/1/2030
A3
365,000
372,452
Niagara Frontier Transportation Authority NY AMT
5.00%
4/1/2031
A3
300,000
306,087
Niagara Frontier Transportation Authority NY AMT
5.00%
4/1/2032
A3
775,000
790,654
Niagara Frontier Transportation Authority NY AMT
5.00%
4/1/2034
A3
865,000
881,649
Norman Y Mineta San Jose International Airport SJC CA
5.00%
3/1/2026
A
1,200,000
1,205,172
Norman Y Mineta San Jose International Airport SJC CA
5.00%
3/1/2027
A
2,260,000
2,270,803
Norman Y Mineta San Jose International Airport SJC CA
5.00%
3/1/2028
A
1,655,000
1,662,744
Norman Y Mineta San Jose International Airport SJC CA AMT
5.00%
3/1/2035
A
1,500,000
1,526,040
North Carolina Turnpike Authority
5.00%
1/1/2032
BBB
1,000,000
1,025,809
North Carolina Turnpike Authority (AGM)
4.00%
1/1/2037
AA
12,895,000
12,108,985
North Carolina Turnpike Authority (AGM)
4.00%
1/1/2038
AA
9,000,000
8,404,831
North Carolina Turnpike Authority (AGM)
5.00%
1/1/2031
AA
1,000,000
1,032,312
North Texas Tollway Authority
4.00%
1/1/2037
AA-
8,740,000
8,291,565
North Texas Tollway Authority
4.125%
1/1/2040
AA-
5,000,000
4,678,146
North Texas Tollway Authority
5.00%
1/1/2025
AA-
5,000,000
5,012,973
North Texas Tollway Authority
5.00%
1/1/2031
A+
8,085,000
8,084,124
North Texas Tollway Authority
5.00%
1/1/2036
AA-
5,000,000
5,066,888
Pennsylvania Turnpike Commission
4.83% (MUNIPSA * 1 + .85%
)#
7/15/2041
A1
25,000,000
25,004,420
Port Authority of New York & New Jersey
4.00%
11/1/2037
AA-
3,540,000
3,391,085
Port Authority of New York & New Jersey
5.00%
12/1/2023
AA-
5,300,000
5,309,133
Port Authority of New York & New Jersey
5.00%
12/1/2025
AA-
10,000,000
10,018,615
See Notes to Financial Statements.
81
Schedule of Investments (continued)
INTERMEDIATE TAX FREE FUND September 30, 2023
Investments
Interest Rate
Maturity Date
Credit Rating: S&P or Moody’s(a)
Principal Amount
Fair Value
Transportation (continued)
Port Authority of New York & New Jersey
5.00%
11/15/2036
AA-
$
5,000,000
$
5,150,164
Port Authority of New York & New Jersey
5.00%
12/1/2036
Aa3
2,750,000
2,950,890
Port Authority of New York & New Jersey
5.00%
12/1/2037
Aa3
2,250,000
2,388,077
Port Authority of New York & New Jersey
5.00%
12/1/2038
Aa3
2,500,000
2,635,861
Port Authority of New York & New Jersey
5.00%
12/1/2039
Aa3
3,250,000
3,405,721
Port Authority of New York & New Jersey AMT
3.00%
10/1/2027
AA-
6,405,000
5,959,967
Port Authority of New York & New Jersey AMT
4.00%
7/15/2034
AA-
4,250,000
4,181,549
Port Authority of New York & New Jersey AMT
4.00%
11/1/2034
AA-
13,705,000
13,446,890
Port Authority of New York & New Jersey AMT
4.00%
7/15/2035
AA-
2,250,000
2,151,638
Port Authority of New York & New Jersey AMT
4.00%
7/15/2036
AA-
1,500,000
1,416,943
Port Authority of New York & New Jersey AMT
4.00%
7/15/2037
AA-
2,000,000
1,850,865
Port Authority of New York & New Jersey AMT
4.00%
7/15/2038
AA-
3,000,000
2,728,638
Port Authority of New York & New Jersey AMT
5.00%
9/15/2028
AA-
4,000,000
4,109,534
Port Authority of New York & New Jersey AMT
5.00%
7/15/2034
Aa3
10,000,000
10,736,597
Port Authority of New York & New Jersey AMT
5.00%
10/15/2034
AA-
9,170,000
9,189,298
Port Authority of New York & New Jersey AMT
5.00%
7/15/2035
Aa3
6,250,000
6,663,021
Port Authority of New York & New Jersey AMT
5.00%
1/15/2036
AA-
2,000,000
2,115,477
Port Authority of New York & New Jersey AMT
5.00%
7/15/2036
Aa3
4,000,000
4,218,080
Port Authority of New York & New Jersey AMT
5.00%
12/1/2036
Aa3
1,750,000
1,840,683
Port Authority of New York & New Jersey AMT
5.00%
1/15/2037
AA-
2,000,000
2,093,703
Port Authority of New York & New Jersey AMT
5.00%
7/15/2037
Aa3
3,250,000
3,390,804
Port Authority of New York & New Jersey AMT
5.00%
12/1/2037
Aa3
2,250,000
2,342,795
82
See Notes to Financial Statements.
Schedule of Investments (continued)
INTERMEDIATE TAX FREE FUND September 30, 2023
Investments
Interest Rate
Maturity Date
Credit Rating: S&P or Moody’s(a)
Principal Amount
Fair Value
Transportation (continued)
Port Authority of New York & New Jersey AMT
5.00%
1/15/2038
AA-
$
1,000,000
$
1,033,510
Port Authority of New York & New Jersey AMT
5.00%
7/15/2038
Aa3
4,500,000
4,657,278
Port Authority of New York & New Jersey AMT
5.00%
12/1/2038
Aa3
2,000,000
2,072,051
Port Authority of New York & New Jersey AMT
5.00%
1/15/2039
Aa3
1,500,000
1,543,772
Port Authority of New York & New Jersey AMT
5.00%
7/15/2039
Aa3
5,250,000
5,409,773
Port of Portland Airport Revenue OR AMT
5.00%
7/1/2037
AA-
2,420,000
2,443,554
Port of Portland Airport Revenue OR AMT
5.00%
7/1/2037
AA-
4,000,000
4,123,409
Port of Portland Airport Revenue OR AMT
5.00%
7/1/2038
AA-
3,250,000
3,263,847
Port of Portland Airport Revenue OR AMT
5.00%
7/1/2039
AA-
3,330,000
3,334,827
Port of Portland Airport Revenue OR AMT
5.25%
7/1/2039
AA-
3,500,000
3,635,219
Port of Seattle WA
4.00%
6/1/2038
AA-
2,700,000
2,552,961
Puerto Rico Highway & Transportation Authority
Zero Coupon
7/1/2032
NR
520,276
336,228
Puerto Rico Highway & Transportation Authority
5.00%
7/1/2053
NR
889,979
552,901
Puerto Rico Highway & Transportation Authority
5.00%
7/1/2062
NR
800,592
766,567
Regional Transportation District–Denver Transit Partners CO
4.00%
1/15/2033
Baa1
850,000
831,144
Regional Transportation District–Denver Transit Partners CO
4.00%
7/15/2034
Baa1
7,650,000
7,441,254
Regional Transportation District–Denver Transit Partners CO
4.00%
7/15/2036
Baa1
700,000
664,240
Regional Transportation District–Denver Transit Partners CO
5.00%
1/15/2032
Baa1
950,000
992,376
Riverside County Transportation Commission CA
4.00%
6/1/2040
A
2,000,000
1,813,011
San Francisco City & County Airport Comm-San Francisco International Airport CA AMT
5.00%
5/1/2036
A+
3,195,000
3,275,878
San Francisco City & County Airport Comm-San Francisco International Airport CA AMT
5.00%
5/1/2037
A+
4,065,000
4,140,098
San Joaquin Hills Transportation Corridor Agency CA
4.00%
1/15/2034
A
3,130,000
3,108,222
See Notes to Financial Statements.
83
Schedule of Investments (continued)
INTERMEDIATE TAX FREE FUND September 30, 2023
Investments
Interest Rate
Maturity Date
Credit Rating: S&P or Moody’s(a)
Principal Amount
Fair Value
Transportation (continued)
State of Alabama Docks Department (AGM) AMT
5.00%
10/1/2026
AA
$
1,250,000
$
1,265,798
State of Alabama Docks Department (AGM) AMT
5.00%
10/1/2027
AA
2,000,000
2,034,683
State of Alabama Docks Department (AGM) AMT
5.00%
10/1/2028
AA
4,710,000
4,784,153
State of Alabama Docks Department (AGM) AMT
5.00%
10/1/2029
AA
3,500,000
3,553,874
State of Alaska International Airports System
5.00%
10/1/2028
A1
2,000,000
2,036,653
State of Alaska International Airports System
5.00%
10/1/2034
A1
5,000,000
5,048,546
State of Connecticut Special Tax Revenue
4.00%
5/1/2039
AA
10,000,000
9,460,743
State of Hawaii Airports System Revenue AMT
5.00%
7/1/2031
AA-
1,275,000
1,305,779
State of Hawaii Airports System Revenue AMT
5.00%
7/1/2033
AA-
3,300,000
3,379,055
State of Hawaii Airports System Revenue AMT
5.00%
7/1/2034
AA-
2,000,000
2,045,817
Texas Private Activity Bond Surface Transportation Corp.–LBJ Infrastructure Group
4.00%
12/31/2033
Baa2
6,500,000
6,106,940
Texas Private Activity Bond Surface Transportation Corp.–LBJ Infrastructure Group
4.00%
12/31/2034
Baa2
6,500,000
6,073,853
Texas Private Activity Bond Surface Transportation Corp.–LBJ Infrastructure Group
4.00%
12/31/2035
Baa2
6,000,000
5,567,185
Texas Private Activity Bond Surface Transportation Corp.–LBJ Infrastructure Group
4.00%
6/30/2036
Baa2
4,125,000
3,807,485
Texas Private Activity Bond Surface Transportation Corp.–LBJ Infrastructure Group
4.00%
12/31/2036
Baa2
5,500,000
5,039,682
Triborough Bridge & Tunnel Authority NY
5.00%
11/15/2033
Aa3
6,175,000
6,207,024
Virginia Small Business Financing Authority–95 Express Lanes LLC AMT
5.00%
1/1/2034
BBB
5,100,000
5,326,668
Virginia Small Business Financing Authority–95 Express Lanes LLC AMT
5.00%
7/1/2036
BBB
11,165,000
11,471,919
Virginia Small Business Financing Authority–95 Express Lanes LLC AMT
5.00%
1/1/2036
BBB
2,500,000
2,570,450
84
See Notes to Financial Statements.
Schedule of Investments (continued)
INTERMEDIATE TAX FREE FUND September 30, 2023
Investments
Interest Rate
Maturity Date
Credit Rating: S&P or Moody’s(a)
Principal Amount
Fair Value
Transportation (continued)
Wayne County Airport Authority MI†
4.00%
12/1/2027
A1
$
10,630,000
$
10,504,758
Wayne County Airport Authority MI
5.00%
12/1/2035
A1
3,565,000
3,593,581
Wayne County Airport Authority MI AMT
5.00%
12/1/2026
A1
1,590,000
1,602,418
Wayne County Airport Authority MI AMT
5.00%
12/1/2027
A1
2,000,000
2,015,292
Total
1,011,589,042
Utilities 11.66%
Amelia County Industrial Development Authority–Waste Mgmt Inc VA AMT
1.45%
4/1/2027
A-
2,500,000
2,231,259
Bartow County Development Authority–Georgia Power Company
2.875%
#(b)
8/1/2043
BBB+
6,500,000
6,250,475
Black Belt Energy Gas District AL
4.00%
#(b)
10/1/2052
A2
23,270,000
22,624,593
Black Belt Energy Gas District AL
4.00%
#(b)
12/1/2052
Baa1
25,780,000
24,091,908
California Pollution Control Financing Authority–Poseidon Resources†
5.00%
7/1/2039
Baa3
5,000,000
5,013,332
California Pollution Control Financing Authority–Poseidon Resources AMT†
5.00%
7/1/2037
Baa3
5,570,000
5,569,822
Central Plains Energy Project NE
2.50%
#(b)
12/1/2049
Aa1
8,650,000
8,256,364
Central Plains Energy Project NE
5.00%
#(b)
5/1/2054
Aa2
7,500,000
7,591,180
Chautauqua County Capital Resource Corp.–NRG Energy Inc NY
4.25%
#(b)
4/1/2042
BBB-
7,250,000
6,998,835
City of Chicago Wastewater Transmission Revenue IL
5.00%
1/1/2029
A+
4,335,000
4,396,271
City of Chicago Wastewater Transmission Revenue IL
5.00%
1/1/2030
A+
6,500,000
6,600,107
City of Chicago Waterworks Revenue IL (AGM)
5.00%
11/1/2034
AA
6,275,000
6,436,694
City of Chicago Waterworks Revenue IL (AGM)
5.00%
11/1/2035
AA
5,000,000
5,110,287
City of Chicago Waterworks Revenue IL (AGM)
5.25%
11/1/2030
AA
5,510,000
5,756,466
City of Houston Combined Utility System Revenue TX
5.00%
11/15/2026
AA
5,355,000
5,407,141
City of San Antonio Electric & Gas Systems Revenue TX
5.25%
2/1/2040
Aa2
8,550,000
9,017,826
Cleveland Department of Public Utilities Division of Public Power OH (AGM)
4.00%
11/15/2036
AA
1,000,000
940,440
Delaware State Economic Development Authority–NRG Energy Inc
1.25%
#(b)
10/1/2040
BBB-
7,500,000
6,819,643
See Notes to Financial Statements.
85
Schedule of Investments (continued)
INTERMEDIATE TAX FREE FUND September 30, 2023
Investments
Interest Rate
Maturity Date
Credit Rating: S&P or Moody’s(a)
Principal Amount
Fair Value
Utilities (continued)
Delaware State Economic Development Authority–NRG Energy Inc
1.25%
#(b)
10/1/2045
BBB-
$
20,300,000
$
18,458,502
Development Authority of Appling County–Oglethorpe Power Corp GA
1.50%
#(b)
1/1/2038
BBB+
1,250,000
1,183,136
Development Authority of Burke County–Georgia Power Company
2.20%
10/1/2032
BBB+
1,000,000
768,264
Development Authority of Burke County–Georgia Power Company
3.875%
#(b)
10/1/2048
BBB+
8,750,000
8,569,368
Development Authority of Burke County–Georgia Power Company
5.06%
#(b)
9/1/2029
BBB+
1,500,000
1,500,000
Development Authority of Monroe County–Oglethorpe Power Corp GA
1.50%
#(b)
1/1/2039
BBB+
1,875,000
1,774,704
Florida Development Finance Corp.–Waste Pro USA Inc AMT
3.00%
6/1/2032
NR
4,000,000
3,081,377
Guam Government Waterworks Authority
5.00%
7/1/2029
A-
1,000,000
1,001,941
Guam Government Waterworks Authority
5.00%
7/1/2036
A-
1,000,000
1,000,821
Illinois Municipal Electric Agency
5.00%
2/1/2032
A1
3,900,000
3,941,412
Indiana Municipal Power Agency
5.00%
1/1/2034
A+
4,000,000
4,184,016
Kansas Development Finance Authority
5.00%
5/1/2036
Aaa
9,765,000
10,754,748
Kentucky Municipal Power Agency
3.45%
#(b)
9/1/2042
Baa1
5,935,000
5,741,498
Kentucky Public Energy Authority
4.00%
#(b)
4/1/2048
A1
3,200,000
3,187,576
Kentucky Public Energy Authority
4.00%
#(b)
8/1/2052
A1
18,770,000
17,739,281
Long Beach Bond Finance Authority CA
5.20% (3 mo. USD LIBOR * .67 + 1.43%
)#
11/15/2026
A1
4,000,000
3,936,547
Long Island Power Authority NY
0.85%
#(b)
9/1/2050
A
6,000,000
5,588,731
Long Island Power Authority NY
1.65%
#(b)
9/1/2049
A
9,500,000
9,258,639
Long Island Power Authority NY
5.00%
#(b)
9/1/2052
A
8,000,000
8,261,902
Louisiana Local Government Environmental Facilities & Community Development Authority
0.875%
#(b)
2/1/2046
A+
16,000,000
15,198,730
86
See Notes to Financial Statements.
Schedule of Investments (continued)
INTERMEDIATE TAX FREE FUND September 30, 2023
Investments
Interest Rate
Maturity Date
Credit Rating: S&P or Moody’s(a)
Principal Amount
Fair Value
Utilities (continued)
Lower Colorado River Authority TX (AGM)
5.00%
5/15/2036
AA
$
7,175,000
$
7,604,592
Luzerne County Industrial Development Authority–Pennsylvania-Amern Wtr Co AMT
2.45%
#(b)
12/1/2039
A+
4,000,000
3,467,454
Main Street Natural Gas, Inc. GA†
4.00%
#(b)
8/1/2052
BBB-
58,250,000
54,938,563
Main Street Natural Gas, Inc. GA
4.00%
#(b)
9/1/2052
A3
30,235,000
28,559,700
Main Street Natural Gas, Inc. GA
5.00%
#(b)
12/1/2052
A3
19,240,000
19,213,476
Main Street Natural Gas, Inc. GA
5.00%
#(b)
12/1/2053
Aa1
10,000,000
10,119,909
Maricopa County Pollution Control Corp.–El Paso Electric Company AZ
3.60%
2/1/2040
Baa2
5,085,000
4,098,703
Maricopa County Pollution Control Corp.–El Paso Electric Company AZ
3.60%
4/1/2040
Baa2
3,870,000
3,114,783
Michigan Finance Authority
5.00%
7/1/2034
A+
4,200,000
4,250,259
Michigan Finance Authority
5.00%
7/1/2035
A+
1,925,000
1,943,197
Michigan Finance Authority (AGM)
5.00%
7/1/2037
AA
5,000,000
5,013,930
Missouri Joint Municipal Electric Utility Commission
5.00%
1/1/2025
A2
1,500,000
1,503,560
Montgomery County Industrial Development Authority–Constellation Energy Gen PA
4.10%
#(b)
4/1/2053
BBB
9,000,000
8,978,046
New York City Municipal Water Finance Authority NY
4.00%
6/15/2037
AA+
3,630,000
3,500,847
Northern California Energy Authority
4.00%
#(b)
7/1/2049
A2
7,500,000
7,479,580
Omaha Public Power District NE
5.00%
2/1/2029
AA
5,000,000
5,135,949
Patriots Energy Group Financing Agency SC
5.25%
#(b)
10/1/2054
A1
15,000,000
15,107,479
Pennsylvania Economic Development Financing Authority–Waste Mgmt Inc AMT
1.10%
#(b)
6/1/2031
A-
5,000,000
4,505,291
Philadelphia Gas Works Co. PA
5.00%
8/1/2026
A
1,000,000
1,012,723
Philadelphia Gas Works Co. PA
5.00%
8/1/2027
A
1,000,000
1,011,846
Philadelphia Gas Works Co. PA
5.00%
8/1/2029
A
1,700,000
1,748,384
Philadelphia Gas Works Co. PA
5.00%
8/1/2030
A
1,425,000
1,464,757
Philadelphia Gas Works Co. PA
5.00%
10/1/2033
A
2,390,000
2,420,863
Piedmont Municipal Power Agency SC
4.00%
1/1/2033
A-
7,300,000
6,908,135
See Notes to Financial Statements.
87
Schedule of Investments (continued)
INTERMEDIATE TAX FREE FUND September 30, 2023
Investments
Interest Rate
Maturity Date
Credit Rating: S&P or Moody’s(a)
Principal Amount
Fair Value
Utilities (continued)
Puerto Rico Commonwealth Aqueduct & Sewer Authority†
4.00%
7/1/2042
NR
$
10,955,000
$
9,137,442
Puerto Rico Commonwealth Aqueduct & Sewer Authority†
5.00%
7/1/2024
NR
3,430,000
3,436,695
Puerto Rico Commonwealth Aqueduct & Sewer Authority†
5.00%
7/1/2033
NR
850,000
843,276
Puerto Rico Commonwealth Aqueduct & Sewer Authority†
5.00%
7/1/2033
NR
5,000,000
4,960,450
Puerto Rico Electric Power Authority (AGM)
4.227% (3 mo. USD LIBOR * .67 + .52%
)#
7/1/2029
AA
5,720,000
5,374,848
Salt Verde Financial Corp. AZ
5.50%
12/1/2029
A3
5,100,000
5,267,677
Southeast Energy Authority A Cooperative District AL
5.50%
#(b)
1/1/2053
A1
5,000,000
5,133,584
Stockton Public Financing Authority CA (BAM)
5.00%
9/1/2024
AA
1,000,000
1,009,930
Tennergy Corp. TN
5.50%
#(b)
10/1/2053
Baa1
15,000,000
15,243,544
Tennessee Energy Acquisition Corp.
5.25%
9/1/2024
A2
8,940,000
8,966,640
Tennessee Energy Acquisition Corp.
5.625%
9/1/2026
BBB
(e)
5,000,000
5,026,612
Texas Municipal Gas Acquisition & Supply Corp. I
5.25%
12/15/2023
A1
2,925,000
2,927,258
Texas Municipal Gas Acquisition & Supply Corp. I
6.25%
12/15/2026
A1
9,825,000
10,032,257
Texas Municipal Power Agency (AGM)
3.00%
9/1/2034
AA
1,470,000
1,252,777
Texas Municipal Power Agency (AGM)
3.00%
9/1/2036
AA
5,250,000
4,267,416
Texas Water Development Board
3.00%
10/15/2033
AAA
4,000,000
3,592,109
Texas Water Development Board(f)
5.00%
10/15/2036
AAA
2,450,000
2,668,334
Texas Water Development Board(f)
5.00%
10/15/2038
AAA
5,000,000
5,373,828
Transbay Joint Powers Authority CA Tax Allocation
5.00%
10/1/2032
A-
(e)
500,000
513,074
Transbay Joint Powers Authority CA Tax Allocation
5.00%
10/1/2033
A-
(e)
900,000
923,372
Transbay Joint Powers Authority CA Tax Allocation
5.00%
10/1/2035
A-
(e)
900,000
916,994
Transbay Joint Powers Authority CA Tax Allocation
5.00%
10/1/2037
A-
(e)
675,000
681,082
Total
564,895,061
Total Municipal Bonds (cost $5,042,027,479)
4,768,500,445
88
See Notes to Financial Statements.
Schedule of Investments (continued)
INTERMEDIATE TAX FREE FUND September 30, 2023
Investments
Interest Rate#
Interest Rate Reset Date(g)
Final Maturity Date
Credit Rating: S&P or Moody’s(a)
Principal Amount
Fair Value
SHORT-TERM INVESTMENTS 0.99%
VARIABLE RATE DEMAND NOTES 0.99%
Corporate-Backed 0.07%
Columbia Industrial Development Board – Alabama Power Company
4.750%
10/2/2023
12/1/2037
A1
$
3,500,000
$
3,500,000
General Obligation 0.67%
City of New York NY GO
4.170%
10/2/2023
4/1/2042
AA
3,300,000
3,300,000
City of New York NY GO
4.170%
10/2/2023
4/1/2042
AA
3,640,000
3,640,000
City of New York NY GO
4.250%
10/2/2023
10/1/2046
AA
8,970,000
8,970,000
City of New York NY GO
4.750%
10/2/2023
3/1/2040
AA
16,650,000
16,650,000
Total
32,560,000
Tax Revenue 0.14%
New York City Transitional Finance Authority Future Tax Secured Revenue
4.800%
10/2/2023
5/1/2034
AAA
6,600,000
6,600,000
Utilities 0.11%
Development Authority of Appling County – Georgia Power Company
5.060%
10/2/2023
9/1/2041
BBB+
5,500,000
5,500,000
Total Short-Term Investments (cost $48,160,000)
48,160,000
Total Investments in Securities 99.42% (cost $5,090,187,479)
4,816,660,445
Other Assets and Liabilities – Net 0.58%
27,884,056
Net Assets 100.00%
$
4,844,544,501
AGM
Insured by–Assured Guaranty Municipal Corporation.
AMBAC
Insured by–AMBAC Assurance Corporation.
AMT
Income from the security may be subject to Alternative Minimum Tax.
BAM
Insured by–Build America Mutual.
COPS
Certificates of Participation.
FHA
Insured by–Federal Housing Administration.
FHLMC
Federal Home Loan Mortgage Corporation.
FNMA
Federal National Mortgage Association.
GNMA
Government National Mortgage Association.
GTD
Guaranteed.
HUD
Insured by–Department of Housing and Urban Development.
LIBOR
London Interbank Offered Rate.
MUNIPSA
SIFMA Municipal Swap Index Yield.
NATL
National Public Finance Guarantee Corporation.
NR
Not Rated.
PSF
Permanent School Fund.
SIFMA
Insured by–Securities Industry and Financial Markets Association.
See Notes to Financial Statements.
89
Schedule of Investments (concluded)
INTERMEDIATE TAX FREE FUND September 30, 2023
SOFR
Secured Overnight Financing Rate.
TRIPS
Tax Refund Intercept Programs.
#
Variable rate security. The interest rate represents the rate in effect at September 30, 2023.
†
Security was purchased pursuant to Rule 144A under the Securities Act of 1933 and, unless registered under such Act or exempted from registration, may only be resold to qualified institutional buyers. At September 30, 2023, the total value of Rule 144A securities was $318,298,252, which represents 6.57% of net assets.
(a)
Unaudited.
(b)
Variable Rate is Fixed to Float: Rate remains fixed or at Zero Coupon until designated future date.
(c)
Defaulted (non-income producing security).
(d)
Level 3 Investment as described in Note 2(i) in the Notes to Financials. Security valued utilizing third party pricing information without adjustment. Such valuations are based on unobservable inputs. A significant change in third party information could result in a significantly lower or higher value of such Level 3 investments.
(e)
This investment has been rated by Fitch IBCA.
(f)
Securities purchased on a when-issued basis (See Note 2(g)).
(g)
The interest rate reset date shown represents the date in which the Fund has the right to sell a Variable Rate Demand Note (“VRDN”) back to the issuer for Principal Amount. The interest rate on the VRDN is generally reset daily based on the SIFMA Municipal Swap Index.
The following is a summary of the inputs used as of September 30, 2023 in valuing the Fund’s investments carried at fair value(1):
Investment Type(2)
Level 1
Level 2
Level 3
Total
Long-Term Investments
Municipal Bonds
Corporate-Backed
$
–
$
544,784,514
$
10,273,845
$
555,058,359
Health Care
–
544,499,647
1,346,500
545,846,147
Remaining Industries
–
3,667,595,939
–
3,667,595,939
Short-Term Investments
Variable Rate Demand Notes
–
48,160,000
–
48,160,000
Total
$
–
$
4,805,040,100
$
11,620,345
$
4,816,660,445
(1)
Refer to Note 2(i) for a description of fair value measurements and the three-tier hierarchy of inputs.
(2)
See Schedule of Investments for fair values in each industry. The table above is presented by Investment Type. Industries are presented within an Investment Type should such Investment Type include securities classified as two or more levels within the three-tier fair value hierarchy. When applicable, each Level 3 security is identified on the Schedule of Investments along with the valuation technique utilized.
A reconciliation of Level 3 investments is presented when the Fund has a material amount of Level 3 investments at the beginning or end of the year in relation to the Fund’s net assets. Management has determined not to provide a reconciliation as the balance of Level 3 investments was not considered to be material to the Fund’s net assets at the beginning or end of the year.
90
See Notes to Financial Statements.
Schedule of Investments
NATIONAL TAX FREE FUND September 30, 2023
Investments
Interest Rate
Maturity Date
Credit Rating: S&P or Moody’s(a)
Principal Amount
Fair Value
LONG-TERM INVESTMENTS 100.36%
MUNICIPAL BONDS 100.36%
Building & Construction 0.28%
Virginia College Building Authority
4.00%
2/1/2043
AA+
$
11,000,000
$
10,110,344
Corporate-Backed 9.16%
Arkansas Development Finance Authority–Big River Steel LLC AMT†
4.50%
9/1/2049
Ba2
11,000,000
9,982,986
Arkansas Development Finance Authority AMT
5.70%
5/1/2053
BB-
4,600,000
4,415,908
Black Belt Energy Gas District AL
4.00%
#(b)
10/1/2052
A2
5,300,000
5,153,001
California Pollution Control Financing Authority–Poseidon Resources AMT†
5.00%
11/21/2045
Baa3
18,025,000
17,211,139
California Pollution Control Financing Authority–Waste Mgmt Inc AMT
4.30%
7/1/2040
A-
2,575,000
2,505,859
Chandler Industrial Development Authority–Intel Corporation AZ AMT
5.00%
#(b)
9/1/2052
A
11,000,000
11,126,230
Chandler Industrial Development Authority–Intel Corporation AZ AMT
4.10%
#(b)
12/1/2037
A2
3,500,000
3,426,527
City of Farmington–Public Service Co of NM
3.90%
#(b)
6/1/2040
BBB
5,000,000
4,855,888
City of Valparaiso–Pratt Paper LLC IN AMT
7.00%
1/1/2044
NR
2,000,000
2,013,186
City of Whiting–BP Prods North America IN AMT
3.00%
11/1/2051
A2
5,000,000
3,418,850
Florida Development Finance Corp.–Waste pro USA Inc AMT†
6.125%
#(b)
7/1/2032
NR
4,500,000
4,478,784
Hoover Industrial Development Board–US Steel Corporation AL AMT
5.75%
10/1/2049
BB-
1,100,000
1,079,631
Indiana Finance Authority–US Steel Corporation
4.125%
12/1/2026
BB-
1,625,000
1,588,907
Iowa Finance Authority–Howmet Aerospace Inc
4.75%
8/1/2042
BB+
5,000,000
4,596,307
Iowa Finance Authority–Iowa Fertilizer Co LLC
4.00%
#(b)
12/1/2050
BBB-
4,600,000
4,297,111
Iowa Finance Authority–Iowa Fertilizer Co LLC
5.00%
#(b)
12/1/2050
BBB-
23,150,000
22,454,380
Iowa Finance Authority–Iowa Fertilizer Co LLC
5.00%
12/1/2050
BBB-
24,985,000
23,910,540
See Notes to Financial Statements.
91
Schedule of Investments (continued)
NATIONAL TAX FREE FUND September 30, 2023
Investments
Interest Rate
Maturity Date
Credit Rating: S&P or Moody’s(a)
Principal Amount
Fair Value
Corporate-Backed (continued)
Louisiana Local Government Environmental Facilities & Community Development Authority–Entergy Louisiana LLC
2.50%
4/1/2036
A
$
8,390,000
$
6,360,140
Love Field Airport Modernization Corp.–Southwest Airlines Co TX
5.00%
11/1/2028
Baa1
3,345,000
3,330,062
Maricopa County Pollution Control Corp.–Southern CA Edison Co AZ
2.40%
6/1/2035
A2
13,755,000
10,180,468
Maryland Economic Development Corp.(c)
5.00%
12/1/2016
NR
855,000
513,000
Mission Economic Development Corp.–Natgasoline LLC TX AMT†
4.625%
10/1/2031
BB-
5,250,000
5,034,678
New Hampshire Business Finance Authority–Covanta Holding Corp AMT†
4.875%
11/1/2042
B
5,000,000
4,264,558
New Hampshire Business Finance Authority–New York St Elec & Gas AMT
4.00%
12/1/2028
A-
5,000,000
4,817,482
New Jersey Economic Development Authority–United Airlines Inc
5.25%
9/15/2029
BB-
6,750,000
6,732,760
New York City Industrial Development Agency–TRIPS Oblig Group NY
5.00%
7/1/2028
BBB+
9,490,000
9,379,739
New York Liberty Development Corp.
3.00%
11/15/2051
A+
11,795,000
7,793,169
New York Liberty Development Corp.–7 World Trade Center Ii
3.125%
9/15/2050
Aaa
5,000,000
3,424,796
New York Liberty Development Corp.–7 World Trade Center II
3.00%
9/15/2043
Aaa
27,780,000
20,021,896
New York State Environmental Facilities Corp.–Casella Waste Systems Inc AMT†
3.125%
#(b)
12/1/2044
B+
3,000,000
2,854,159
New York State Environmental Facilities Corp.–Casella Waste Systems Inc AMT†
5.125%
#(b)
9/1/2050
B1
1,000,000
987,087
New York Transportation Development Corp.–American Airlines Inc AMT
5.25%
8/1/2031
B+
885,000
895,881
New York Transportation Development Corp.–American Airlines Inc AMT
5.375%
8/1/2036
B+
1,500,000
1,469,550
Niagara Area Development Corp.–Covanta Holding Corp NY†
3.50%
11/1/2024
B
2,500,000
2,454,657
Niagara Area Development Corp.–Covanta Holding Corp NY AMT†
4.75%
11/1/2042
B
5,000,000
4,195,206
Ohio Air Quality Development Authority–American Electric Pwr Co AMT
2.10%
#(b)
4/1/2028
BBB+
6,495,000
6,274,562
Ohio Air Quality Development Authority–American Electric Pwr Co AMT
2.10%
#(b)
7/1/2028
BBB+
5,000,000
4,830,301
Ohio Air Quality Development Authority–AMG Vanadium LLC AMT†
5.00%
7/1/2049
B-
8,360,000
7,048,839
92
See Notes to Financial Statements.
Schedule of Investments (continued)
NATIONAL TAX FREE FUND September 30, 2023
Investments
Interest Rate
Maturity Date
Credit Rating: S&P or Moody’s(a)
Principal Amount
Fair Value
Corporate-Backed (continued)
Parish of St. James–Nustar Logistics LP LA†
5.85%
#(b)
8/1/2041
BB-
$
1,000,000
$
1,016,019
Parish of St. James–Nustar Logistics LP LA†
6.10%
#(b)
12/1/2040
BB-
3,250,000
3,435,094
Parish of St. James–Nustar Logistics LP LA†
6.35%
7/1/2040
BB-
3,250,000
3,461,634
Parish of St. James–Nustar Logistics LP LA†
6.35%
10/1/2040
BB-
2,500,000
2,662,796
Parish of St. John the Baptist–Marathon Oil Corporation LA
2.10%
#(b)
6/1/2037
BBB-
8,000,000
7,853,311
Parish of St. John the Baptist–Marathon Oil Corporation LA
4.05%
#(b)
6/1/2037
BBB-
7,750,000
7,615,383
Pennsylvania Economic Development Financing Authority–Covanta Holding Corp AMT†
3.25%
8/1/2039
B
5,535,000
3,880,921
Phenix City Industrial Development Board AL
3.625%
5/15/2030
BBB
3,050,000
2,903,667
Port Beaumont Navigation District–Jefferson 2020 Bond Oblig TX AMT†
3.00%
1/1/2050
NR
5,500,000
3,027,569
Port of Seattle Industrial Development Corp.–Delta Air Lines Inc WA AMT
5.00%
4/1/2030
BB+
6,090,000
6,090,438
Public Finance Authority–Ameream LLC WI†
5.00%
12/1/2027
NR
1,455,000
1,322,900
Public Finance Authority–Ameream LLC WI†
6.50%
12/1/2037
NR
3,000,000
2,666,981
Public Finance Authority–Celanese US Holdings LLC WI
4.05%
11/1/2030
BBB-
500,000
475,685
Public Finance Authority–Celanese US Holdings LLC WI AMT
5.00%
1/1/2024
BBB-
5,000,000
5,004,491
Public Finance Authority–TRIPS Oblig Group WI AMT
5.00%
7/1/2042
BBB+
15,055,000
13,958,260
Selma Industrial Development Board–International Paper Co AL
2.00%
#(b)
11/1/2033
BBB
2,000,000
1,954,357
South Carolina Jobs–Economic Development Authority–International Paper Co AMT
4.00%
#(b)
4/1/2033
BBB
5,250,000
5,204,549
Sumter County Industrial Development Authority–Enviva Inc AL AMT
6.00%
#(b)
7/15/2052
B-
10,000,000
7,036,890
Tuscaloosa County Industrial Development Authority–Hunt Refining Company AL†
4.50%
5/1/2032
NR
3,185,700
2,912,813
Tuscaloosa County Industrial Development Authority–Hunt Refining Company AL†
5.25%
5/1/2044
NR
5,000,000
4,357,349
Virginia Small Business Financing Authority–Covanta Holding Corp AMT†
5.00%
#(b)
1/1/2048
B
910,000
811,035
West Pace Cooperative District AL(c)
9.125%
5/1/2039
NR
4,900,000
3,724,000
(d)
West Virginia Economic Development Authority–Kentucky Power Co AMT
4.70%
#(b)
4/1/2036
Baa3
3,000,000
2,973,542
Williamsburg Economic Development Authority VA
5.25%
7/1/2053
NR
2,500,000
2,603,049
Total
336,330,957
See Notes to Financial Statements.
93
Schedule of Investments (continued)
NATIONAL TAX FREE FUND September 30, 2023
Investments
Interest Rate
Maturity Date
Credit Rating: S&P or Moody’s(a)
Principal Amount
Fair Value
Education 7.95%
Brunswick City School District OH(e)
5.50%
12/1/2060
A1
$
11,000,000
$
11,497,662
Build NYC Resource Corp.–Kipp NYC Public Chtr Schs NY
5.25%
7/1/2052
BBB-
4,000,000
3,852,198
California Educational Facilities Authority–Chapman University
5.00%
4/1/2045
A2
5,000,000
5,008,784
California School Finance Authority–Green Dot Public Schs Oblig†
5.00%
8/1/2045
BBB-
1,500,000
1,387,938
California School Finance Authority–Kipp Socal Pub Schs Oblig†
5.00%
7/1/2047
BBB
2,050,000
1,935,168
Camden County Improvement Authority–Kipp Cooper Norcross Oblig NJ
6.00%
6/15/2062
BBB
2,540,000
2,625,626
Capital Trust Agency, Inc.–Advantage Admy Oblig Grp FL
5.00%
12/15/2049
Baa3
1,000,000
866,504
Capital Trust Agency, Inc.–Advantage Admy Oblig Grp FL
5.00%
12/15/2054
Baa3
1,030,000
876,891
Chicago Board of Education Dedicated Capital Improvement Tax IL
5.75%
4/1/2048
A
(f)
7,250,000
7,601,106
Chicago Board of Education Dedicated Capital Improvement Tax IL TCRS (BAM)
5.00%
4/1/2045
AA
2,500,000
2,504,355
Chicago Board of Education IL GO
4.00%
12/1/2047
BB+
15,510,000
12,082,360
Chicago Board of Education IL GO
5.00%
12/1/2044
BB+
1,750,000
1,606,827
City of Waltham MA GO
2.00%
10/15/2035
Aa2
4,920,000
3,672,765
City of Waltham MA GO
2.00%
10/15/2036
Aa2
5,015,000
3,619,704
Clifton Higher Education Finance Corp.–Intl American Edu Fed TX (PSF GTD)
3.00%
8/15/2051
Aaa
5,750,000
3,669,460
Connecticut State Health & Educational Facilities Authority–Quinnipiac University
5.25%
7/1/2053
A-
15,000,000
15,142,146
Dutchess County Local Development Corp.–Bard College NY
Maryland Health & Higher Educational Facilities Authority–Mercy Medical Center Oblig
5.00%
7/1/2036
BBB+
1,320,000
1,325,786
Maryland Health & Higher Educational Facilities Authority–Mercy Medical Center Oblig
5.00%
7/1/2038
BBB+
2,250,000
2,194,280
Massachusetts Development Finance Agency–Boston Med Ctr Oblig Grp
5.00%
7/1/2031
BBB
1,980,000
2,030,930
Massachusetts Development Finance Agency–Boston Med Ctr Oblig Grp
5.00%
7/1/2035
BBB
5,115,000
5,160,800
Massachusetts Development Finance Agency–Boston Med Ctr Oblig Grp
5.25%
7/1/2048
BBB
2,600,000
2,563,350
Massachusetts Development Finance Agency–Boston Med Ctr Oblig Grp
5.25%
7/1/2052
BBB
2,500,000
2,442,891
Massachusetts Development Finance Agency–Wellforce Oblig Group
4.00%
7/1/2035
BBB-
2,000,000
1,751,374
Massachusetts Development Finance Agency–Wellforce Oblig Group
5.00%
7/1/2039
BBB-
2,685,000
2,486,095
Michigan State Hospital Finance Authority–Ascension Hlth Credit Grp
5.00%
11/15/2047
AA+
4,000,000
3,975,164
Montana Facility Finance Authority–Kalispell Regl Med Ctr Oblig
5.00%
7/1/2043
BBB
4,000,000
3,687,098
Montana Facility Finance Authority–Kalispell Regl Med Ctr Oblig
5.00%
7/1/2048
BBB
5,760,000
5,160,093
Montgomery County Higher Education & Health Authority–Thomas Jefferson Univ Oblig PA
4.00%
9/1/2049
A
3,960,000
3,294,046
Nassau County Local Economic Assistance Corp.–Catholic Hlth Lng Isl Oblig NY
5.00%
7/1/2029
A-
1,000,000
1,004,779
Nassau County Local Economic Assistance Corp.–Catholic Hlth Lng Isl Oblig NY
5.00%
7/1/2030
A-
580,000
582,329
See Notes to Financial Statements.
103
Schedule of Investments (continued)
NATIONAL TAX FREE FUND September 30, 2023
Investments
Interest Rate
Maturity Date
Credit Rating: S&P or Moody’s(a)
Principal Amount
Fair Value
Health Care (continued)
Nassau County Local Economic Assistance Corp.–Catholic Hlth Lng Isl Oblig NY
5.00%
7/1/2031
A-
$
1,620,000
$
1,625,297
Nassau County Local Economic Assistance Corp.–Catholic Hlth Lng Isl Oblig NY
5.00%
7/1/2034
A-
1,100,000
1,102,488
Nebraska Educational Health Cultural & Social Services Finance Authority–Immanuel Retire Comm Oblig
4.00%
1/1/2044
AA
(f)
3,500,000
2,934,826
Nebraska Educational Health Cultural & Social Services Finance Authority–Immanuel Retire Comm Oblig
4.00%
1/1/2049
AA
(f)
6,500,000
5,286,720
New Jersey Health Care Facilities Financing Authority–St Joseph’s Hlthcr Oblig
4.00%
7/1/2048
BBB-
8,000,000
6,348,305
New York State Dormitory Authority–Garnet Hlth Med Ctr Oblig†
5.00%
12/1/2031
BBB-
1,300,000
1,231,765
New York State Dormitory Authority–Garnet Hlth Med Ctr Oblig†
5.00%
12/1/2040
BBB-
1,300,000
1,164,047
New York State Dormitory Authority–Montefiore Oblig Grp
4.00%
8/1/2036
BBB-
1,450,000
1,315,589
New York State Dormitory Authority–Montefiore Oblig Grp
4.00%
8/1/2038
BBB-
4,725,000
4,133,674
New York State Dormitory Authority–Montefiore Oblig Grp
5.00%
8/1/2028
BBB-
3,055,000
3,064,745
New York State Dormitory Authority–Northwell Hlth Oblig Grp
5.00%
5/1/2037
A-
7,450,000
7,460,715
New York State Dormitory Authority–Northwell Hlth Oblig Grp
5.00%
5/1/2052
A-
8,085,000
8,069,852
New York State Dormitory Authority–Northwell Hlth Oblig Grp(e)
5.00%
5/1/2052
A-
33,500,000
33,437,234
Niagara Area Development Corp.–Catholic Hlth Sys Oblig NY
5.00%
7/1/2052
B-
1,500,000
1,120,265
Oklahoma Development Finance Authority–OU Medicine Oblig Grp
5.50%
8/15/2052
BB-
10,015,000
8,970,594
Orange County Health Facilities Authority–Orlando Hlth Oblig Group FL
5.00%
10/1/2053
A+
4,000,000
3,959,191
Oregon State Facilities Authority–Providence St Joseph Oblig
5.00%
10/1/2045
A
7,000,000
6,688,296
Palomar Health CA–Palomar Health Oblig Grp
5.00%
11/1/2036
BBB
11,025,000
10,857,184
Palomar Health CA–Palomar Health Oblig Grp
5.00%
11/1/2039
BBB
8,240,000
7,778,511
Pennsylvania Economic Development Financing Authority–UPMC Oblig Group
4.00%
5/15/2048
A
3,500,000
2,965,655
104
See Notes to Financial Statements.
Schedule of Investments (continued)
NATIONAL TAX FREE FUND September 30, 2023
Investments
Interest Rate
Maturity Date
Credit Rating: S&P or Moody’s(a)
Principal Amount
Fair Value
Health Care (continued)
Public Finance Authority–Moses Cone Hospital Oblig Gp WI
5.00%
10/1/2052
AA-
$
8,750,000
$
8,392,177
Public Finance Authority–Proton Intl Alabama LLC WI†(c)
6.85%
10/1/2047
NR
1,410,000
846,000
(d)
Roanoke Economic Development Authority–Carilion Clinic VA Oblig Grp
3.00%
7/1/2045
AA-
12,950,000
9,057,844
Savannah Hospital Authority–St Joseph��s/Candler Oblig GA
4.00%
7/1/2043
A2
5,000,000
4,306,961
South Broward Hospital District Oblig FL (BAM)
3.00%
5/1/2051
Aa3
5,000,000
3,381,453
South Carolina Jobs-Economic Development Authority–Bon Secours Mercy Hlth
5.00%
12/1/2046
A+
8,000,000
8,010,970
State of Ohio–Premier Hlth Partners Oblig
4.00%
11/15/2039
Baa1
2,640,000
2,207,908
Vermont Educational & Health Buildings Financing Agency–Univ of VT Hlth Oblig Grp
5.00%
12/1/2035
A
4,500,000
4,543,604
Washington Health Care Facilities Authority–Overlake Hosp Med Ctr Oblig
5.00%
7/1/2038
BBB+
4,000,000
3,619,972
Westchester County Healthcare Corp. Oblig NY
6.00%
11/1/2030
BBB-
105,000
105,110
Westchester County Healthcare Corp. Oblig NY
6.125%
11/1/2037
BBB-
30,000
30,058
Westchester County Local Development Corp. Health Oblig NY
5.00%
11/1/2046
BBB-
1,470,000
1,269,672
Wisconsin Health & Educational Facilities Authority–Sauk-Prairie Mem Hosp Oblig
5.375%
2/1/2048
Ba2
840,000
736,801
Total
451,568,572
Housing 1.69%
California Municipal Finance Authority–Bowles Hall Foundation
5.00%
6/1/2050
Baa3
1,410,000
1,355,632
California Municipal Finance Authority–Caritas Affordable Hsg
5.25%
8/15/2039
A-
650,000
653,462
Capital Projects Finance Authority–Provident Group–Continu FL
5.00%
11/1/2039
Baa3
1,000,000
999,959
Capital Projects Finance Authority–Provident Group–Continu FL
5.00%
11/1/2041
Baa3
1,000,000
985,918
Capital Projects Finance Authority–Provident Group–Continu FL
5.00%
11/1/2048
Baa3
1,350,000
1,281,552
Capital Projects Finance Authority–Provident Group–Continu FL
5.00%
11/1/2053
Baa3
1,745,000
1,634,319
Capital Projects Finance Authority–Provident Group–Continu FL
5.00%
11/1/2058
Baa3
1,750,000
1,619,647
CMFA Special Finance Agency CA†
4.00%
12/1/2045
NR
5,000,000
3,713,207
See Notes to Financial Statements.
105
Schedule of Investments (continued)
NATIONAL TAX FREE FUND September 30, 2023
Investments
Interest Rate
Maturity Date
Credit Rating: S&P or Moody’s(a)
Principal Amount
Fair Value
Housing (continued)
CSCDA Community Improvement Authority CA†
3.125%
8/1/2056
NR
$
4,500,000
$
2,874,123
FHLMC Multifamily VRD Certificates VA
4.60%
12/15/2044
AA+
5,415,000
5,275,521
Indiana Finance Authority–Chf-Tippecanoe LLC
5.00%
6/1/2053
NR
1,350,000
1,294,294
Indiana Finance Authority–Chf-Tippecanoe LLC
5.125%
6/1/2058
NR
1,700,000
1,646,015
Indiana Finance Authority–Chf-Tippecanoe LLC
5.375%
6/1/2064
NR
4,460,000
4,348,237
Industrial Development Authority of the City of Phoenix Arizona–Downtown Phoenix Std Hsg AZ
5.00%
7/1/2037
Baa3
1,000,000
998,938
Maryland Economic Development Corp.
5.75%
7/1/2053
BBB-
2,000,000
2,087,748
Maryland Economic Development Corp.
6.00%
7/1/2058
BBB-
5,000,000
5,324,716
Michigan State Housing Development Authority
3.60%
10/1/2060
AA+
6,115,000
4,502,042
New Hampshire Business Finance Authority
4.00%
10/20/2036
BBB
10,865,398
9,742,427
New Hampshire Business Finance Authority
4.375%
9/20/2036
BBB
5,413,448
5,016,730
New York State Dormitory Authority
3.00%
7/1/2045
Aa3
5,037,000
3,475,688
Toledo-Lucas County Port Authority–CHF-Toledo LLC OH
5.00%
7/1/2034
BBB-
1,000,000
951,960
Toledo-Lucas County Port Authority–CHF-Toledo LLC OH
5.00%
7/1/2039
BBB-
1,500,000
1,390,222
Toledo-Lucas County Port Authority–CHF-Toledo LLC OH
5.00%
7/1/2046
BBB-
1,000,000
884,593
Total
62,056,950
Lease Obligations 2.69%
Illinois Sports Facilities Authority (AGM)
5.00%
6/15/2027
AA
3,500,000
3,500,114
Indiana Finance Authority
5.25%
2/1/2032
AA+
5,000,000
5,088,741
Kentucky Bond Development Corp.
4.00%
9/1/2048
A+
6,645,000
5,472,684
New Jersey Economic Development Authority
5.00%
6/15/2036
A2
1,285,000
1,307,415
New Jersey Economic Development Authority
5.00%
6/15/2041
A2
5,050,000
5,267,362
New Jersey Economic Development Authority
5.00%
6/15/2042
A2
4,930,000
5,184,070
New Jersey Economic Development Authority
5.00%
6/15/2043
A2
4,500,000
4,523,451
New Jersey Economic Development Authority
5.00%
11/1/2044
A2
5,500,000
5,564,676
New Jersey Economic Development Authority
5.00%
6/15/2047
A2
6,050,000
6,057,357
New Jersey Economic Development Authority–NYNJ Link Borrower LLC AMT
5.625%
1/1/2052
BBB+
7,500,000
7,511,457
New Jersey Educational Facilities Authority
4.00%
9/1/2029
A2
5,445,000
5,260,121
106
See Notes to Financial Statements.
Schedule of Investments (continued)
NATIONAL TAX FREE FUND September 30, 2023
Investments
Interest Rate
Maturity Date
Credit Rating: S&P or Moody’s(a)
Principal Amount
Fair Value
Lease Obligations (continued)
New Jersey Transportation Trust Fund Authority
Zero Coupon
12/15/2028
A2
$
10,000,000
$
8,045,462
New Jersey Transportation Trust Fund Authority
Zero Coupon
12/15/2031
A2
1,935,000
1,341,291
New Jersey Transportation Trust Fund Authority
Zero Coupon
12/15/2037
A2
3,390,000
1,669,130
New Jersey Transportation Trust Fund Authority
5.00%
6/15/2030
A+
3,000,000
3,056,643
New Jersey Transportation Trust Fund Authority
5.00%
6/15/2031
A+
2,400,000
2,442,222
New Jersey Transportation Trust Fund Authority
5.00%
6/15/2033
A2
4,565,000
4,859,427
New Jersey Transportation Trust Fund Authority
5.00%
12/15/2035
A2
4,200,000
4,317,673
New Jersey Transportation Trust Fund Authority
5.00%
12/15/2036
A2
3,500,000
3,584,514
New Jersey Transportation Trust Fund Authority
5.00%
6/15/2046
A2
14,595,000
14,648,032
Total
98,701,842
Multi-Family Housing 0.06%
New York City Housing Development Corp. NY
2.40%
11/1/2046
AA+
3,800,000
2,328,282
Other Revenue 2.25%
Black Belt Energy Gas District AL
4.00%
#(b)
12/1/2049
A1
4,125,000
4,050,496
California School Finance Authority–Green Dot Public Schs Oblig†
5.00%
8/1/2048
BBB-
1,650,000
1,502,975
City of Miami Beach Parking Revenue FL (BAM)
5.00%
9/1/2040
AA
2,000,000
2,001,168
Clifton Higher Education Finance Corp.–Idea Public Schools TX
6.00%
8/15/2043
A-
1,000,000
1,000,721
Clifton Higher Education Finance Corp.–Intl American Edu Fed TX
6.125%
8/15/2048
Baa3
7,825,000
7,602,917
Commonwealth of Puerto Rico
Zero Coupon
#(b)
11/1/2051
NR
5,142,778
2,648,531
District of Columbia–Friendship Pub Chtr Sch DC
5.00%
6/1/2041
BBB
1,935,000
1,803,130
Grand River Hospital District CO GO (AGM)
5.25%
12/1/2034
AA
1,000,000
1,027,595
Grand River Hospital District CO GO (AGM)
5.25%
12/1/2035
AA
1,000,000
1,022,826
Grand River Hospital District CO GO (AGM)
5.25%
12/1/2037
AA
1,160,000
1,169,240
Illinois Finance Authority–Noble Network Charter Sch
6.125%
9/1/2039
BBB
6,000,000
6,002,761
See Notes to Financial Statements.
107
Schedule of Investments (continued)
NATIONAL TAX FREE FUND September 30, 2023
Investments
Interest Rate
Maturity Date
Credit Rating: S&P or Moody’s(a)
Principal Amount
Fair Value
Other Revenue (continued)
Indianapolis Local Public Improvement Bond Bank
5.00%
2/1/2031
AA-
$
7,120,000
$
7,124,061
Long Beach Bond Finance Authority CA
5.22% (3 mo. USD LIBOR * .67 + 1.45%
)#
11/15/2027
A1
9,000,000
8,784,922
Lower Alabama Gas District
4.00%
#(b)
12/1/2050
A2
2,000,000
1,960,930
Main Street Natural Gas, Inc. GA
5.00%
5/15/2037
A2
2,990,000
2,903,598
Main Street Natural Gas, Inc. GA
5.00%
5/15/2043
A2
3,250,000
3,131,777
Main Street Natural Gas, Inc. GA
5.00%
5/15/2049
A2
1,500,000
1,435,214
Michigan Finance Authority–Bradford Academy
4.30%
9/1/2030
NR
260,000
228,545
Michigan Finance Authority–Bradford Academy
4.80%
9/1/2040
NR
565,000
442,864
Michigan Finance Authority–Bradford Academy
5.00%
9/1/2050
NR
925,000
680,104
Middlesex County Improvement Authority NJ
6.125%
1/1/2025
NR
1,250,000
15,625
Middlesex County Improvement Authority NJ
6.25%
1/1/2037
NR
1,700,000
21,250
M-S-R Energy Authority CA
6.125%
11/1/2029
BBB+
1,965,000
2,049,904
New Jersey Economic Development Authority
5.00%
11/1/2052
A2
11,375,000
11,386,643
New Jersey Economic Development Authority–Friends of Team Acdmy Oblig
6.00%
10/1/2043
BBB
3,500,000
3,503,489
Washington State Convention Center Public Facilities District
4.00%
7/1/2031
NR
10,000,000
9,219,072
Total
82,720,358
Power 0.07%
Chesapeake Economic Development Authority–Virginia Elec & Pwr Co
3.65%
#(b)
2/1/2032
A2
2,500,000
2,423,044
Pre-Refunded 0.03%
School District of Philadelphia PA GO
5.00%
9/1/2038
A1
995,000
995,208
Single-Family Housing 0.20%
Pennsylvania Housing Finance Agency
5.00%
10/1/2050
AA+
7,725,000
7,424,409
Special Tax 2.06%
Allentown Neighborhood Improvement Zone Development Authority PA†
5.00%
5/1/2032
Ba3
1,845,000
1,855,831
Allentown Neighborhood Improvement Zone Development Authority PA†
5.25%
5/1/2042
NR
3,215,000
3,053,902
108
See Notes to Financial Statements.
Schedule of Investments (continued)
NATIONAL TAX FREE FUND September 30, 2023
Investments
Interest Rate
Maturity Date
Credit Rating: S&P or Moody’s(a)
Principal Amount
Fair Value
Special Tax (continued)
City of Irvine CA Special Tax
5.00%
9/1/2044
NR
$
500,000
$
497,172
Commonwealth of Pennsylvania COPS
4.00%
7/1/2046
A
2,375,000
1,990,807
Gramercy Farms Community Development District FL~
Zero Coupon
5/1/2039
NR
2,500,000
1,300,000
Gramercy Farms Community Development District FL(c)
5.25%
5/1/2039
NR
1,340,000
214
(d)
Industrial Development Authority of the City of St. Louis Missouri
4.75%
11/15/2047
NR
3,000,000
2,089,376
Inland Valley Development Agency CA Tax Allocation
5.25%
9/1/2037
A
4,875,000
4,889,236
Irvine Facilities Financing Authority CA (BAM)
5.25%
9/1/2053
AA
8,000,000
8,484,054
New Jersey Economic Development Authority Mtromall Urban
6.50%
4/1/2028
Baa2
1,944,245
1,904,376
New York City Industrial Development Agency–Queens Ballpark Co LLC NY (AGM)
3.00%
1/1/2046
AA
18,955,000
13,076,603
Rancho Cucamonga Redevelopment Agency Successor Agency CA Tax Allocation (AGM)
5.00%
9/1/2030
AA
1,500,000
1,515,178
Rancho Cucamonga Redevelopment Agency Successor Agency CA Tax Allocation (AGM)
5.00%
9/1/2031
AA
1,400,000
1,414,378
River Islands Public Financing Authority CA Special Tax (AGM)
5.25%
9/1/2052
AA
2,500,000
2,612,765
Riverside County Redevelopment Successor Agency CA Tax Allocation
8.50%
10/1/2041
A
11,195,000
12,703,691
State of Connecticut Special Tax Revenue
5.00%
8/1/2034
AA
3,600,000
3,650,592
State of Connecticut Special Tax Revenue
5.00%
1/1/2037
AA
7,000,000
7,217,557
State of Connecticut Special Tax Revenue
5.00%
1/1/2038
AA
4,250,000
4,351,063
Stone Canyon Community Improvement District MO(c)
5.70%
4/1/2022
NR
1,000,000
90,000
(d)
Stone Canyon Community Improvement District MO(c)
5.75%
4/1/2027
NR
1,300,000
117,000
(d)
Village Community Development District No. 13 FL
3.00%
5/1/2041
NR
1,250,000
893,304
Village Community Development District No. 13 FL
3.25%
5/1/2052
NR
2,710,000
1,762,042
Total
75,469,141
Tax Revenue 5.86%
Casino Reinvestment Development Authority, Inc. NJ
5.25%
11/1/2039
BBB+
3,300,000
3,300,907
See Notes to Financial Statements.
109
Schedule of Investments (continued)
NATIONAL TAX FREE FUND September 30, 2023
Investments
Interest Rate
Maturity Date
Credit Rating: S&P or Moody’s(a)
Principal Amount
Fair Value
Tax Revenue (continued)
Casino Reinvestment Development Authority, Inc. NJ
5.25%
11/1/2044
BBB+
$
3,950,000
$
3,854,561
Chicago Board of Education IL
5.00%
4/1/2042
A
(f)
2,685,000
2,605,594
Chicago Transit Authority Sales Tax Receipts Fund IL
4.00%
12/1/2050
A+
13,615,000
11,193,041
Chicago Transit Authority Sales Tax Receipts Fund IL
5.25%
12/1/2049
AA
33,245,000
33,320,204
City of Reno NV (AGM)
4.00%
6/1/2043
AA
4,725,000
4,036,925
City of Reno NV (AGM)
4.00%
6/1/2046
AA
6,800,000
5,686,242
City of Sparks NV†
2.75%
6/15/2028
Ba1
730,000
667,756
Compton Community Redevelopment Agency Successor Agency CA Tax Allocation (AGM)
5.00%
8/1/2042
AA
1,250,000
1,283,846
County of Cook Sales Tax Revenue IL
4.00%
11/15/2034
AA-
3,750,000
3,654,975
Lower Colorado River Authority TX
6.00%
5/15/2052
A
1,700,000
1,849,119
Metropolitan Pier & Exposition Authority IL
4.00%
6/15/2052
A
4,055,000
3,252,892
Metropolitan Pier & Exposition Authority IL
5.50%
6/15/2053
A
4,415,000
4,435,775
Metropolitan Pier & Exposition Authority IL (NATL)
Zero Coupon
12/15/2030
A
10,535,000
7,605,269
Metropolitan Pier & Exposition Authority IL (NATL)
Zero Coupon
12/15/2036
A
10,000,000
5,293,140
Metropolitan Pier & Exposition Authority IL (NATL)
Zero Coupon
12/15/2037
A
15,000,000
7,436,859
Metropolitan Pier & Exposition Authority IL TCRS (BAM)
5.00%
6/15/2053
AA
915,000
931,782
New York City Transitional Finance Authority Future Tax Secured Revenue NY
4.00%
5/1/2037
AAA
3,000,000
2,890,204
New York City Transitional Finance Authority Future Tax Secured Revenue NY
4.00%
8/1/2042
AAA
1,000,000
911,538
New York City Transitional Finance Authority Future Tax Secured Revenue NY
4.00%
11/1/2042
AAA
5,720,000
5,209,950
New York City Transitional Finance Authority Future Tax Secured Revenue NY
5.00%
2/1/2036
AAA
1,000,000
1,001,418
New York State Dormitory Authority
3.00%
3/15/2050
AA+
5,000,000
3,362,575
New York State Urban Development Corp.
3.00%
3/15/2047
AA+
3,740,000
2,611,584
New York State Urban Development Corp.
3.00%
3/15/2048
AA+
9,590,000
6,618,538
110
See Notes to Financial Statements.
Schedule of Investments (continued)
NATIONAL TAX FREE FUND September 30, 2023
Investments
Interest Rate
Maturity Date
Credit Rating: S&P or Moody’s(a)
Principal Amount
Fair Value
Tax Revenue (continued)
New York State Urban Development Corp.
3.00%
3/15/2050
AA+
$
7,620,000
$
5,169,607
New York State Urban Development Corp.
4.00%
3/15/2042
Aa1
5,000,000
4,533,661
Puerto Rico Sales Tax Financing Corp. Sales Tax Revenue
Zero Coupon
7/1/2029
NR
1,271,000
989,841
Puerto Rico Sales Tax Financing Corp. Sales Tax Revenue
Zero Coupon
7/1/2031
NR
2,122,000
1,505,936
Puerto Rico Sales Tax Financing Corp. Sales Tax Revenue
Zero Coupon
7/1/2033
NR
2,549,000
1,636,457
Puerto Rico Sales Tax Financing Corp. Sales Tax Revenue
Zero Coupon
7/1/2051
NR
2,523,000
470,565
Puerto Rico Sales Tax Financing Corp. Sales Tax Revenue
4.329%
7/1/2040
NR
11,598,000
10,416,900
Puerto Rico Sales Tax Financing Corp. Sales Tax Revenue
4.329%
7/1/2040
NR
5,253,000
4,718,053
Puerto Rico Sales Tax Financing Corp. Sales Tax Revenue
4.536%
7/1/2053
NR
39,000
33,366
Puerto Rico Sales Tax Financing Corp. Sales Tax Revenue
4.75%
7/1/2053
NR
12,847,000
11,389,657
Puerto Rico Sales Tax Financing Corp. Sales Tax Revenue
5.00%
7/1/2058
NR
2,174,000
1,971,999
San Francisco Bay Area Rapid Transit District CA GO
3.00%
8/1/2042
Aaa
5,180,000
3,977,035
San Leandro Unified School District CA GO
5.25%
8/1/2048
AA-
10,500,000
11,060,476
Territory of Guam
4.00%
1/1/2042
Ba1
1,500,000
1,218,353
Triborough Bridge & Tunnel Authority NY
5.00%
5/15/2051
AA+
6,555,000
6,656,141
Triborough Bridge & Tunnel Authority Sales Tax Revenue NY
5.25%
5/15/2052
AA+
10,335,000
10,816,868
Triborough Bridge & Tunnel Authority Sales Tax Revenue NY
5.25%
5/15/2057
AA+
2,500,000
2,607,183
Triborough Bridge & Tunnel Authority Sales Tax Revenue NY
5.25%
5/15/2062
AA+
10,655,000
11,071,698
Vermont Student Assistance Corp. AMT
3.375%
6/15/2036
A
2,030,000
1,875,794
Total
215,134,284
Taxable Revenue–Water & Sewer 0.76%
City of Chicago Waterworks Revenue IL (AGM)(e)
5.50%
11/1/2062
AA
20,300,000
21,195,317
New Jersey Economic Development Authority–New Jersey Amern Wtr Co AMT
3.75%
#(b)
11/1/2034
A+
4,000,000
3,802,140
Pittsburgh Water & Sewer Authority PA (AGM)
5.00%
9/1/2048
A1
3,000,000
3,086,632
Total
28,084,089
See Notes to Financial Statements.
111
Schedule of Investments (continued)
NATIONAL TAX FREE FUND September 30, 2023
Investments
Interest Rate
Maturity Date
Credit Rating: S&P or Moody’s(a)
Principal Amount
Fair Value
Tobacco 2.19%
Buckeye Tobacco Settlement Financing Authority OH
5.00%
6/1/2055
NR
$
36,560,000
$
31,539,241
Golden State Tobacco Securitization Corp. CA
Zero Coupon
6/1/2066
NR
30,000,000
2,606,235
Michigan Finance Authority
4.00%
6/1/2049
BBB+
4,000,000
3,419,904
Michigan Finance Authority
5.00%
6/1/2049
BBB+
3,775,000
3,781,501
Nassau County Tobacco Settlement Corp. NY
Zero Coupon
6/1/2060
NR
20,000,000
984,094
Tobacco Securitization Authority of Northern California–Sacramento County Tobacco
4.00%
6/1/2049
BBB+
2,850,000
2,429,357
Tobacco Securitization Authority of Southern California–San Diego County Tobacco
5.00%
6/1/2048
BBB+
3,500,000
3,509,515
Tobacco Settlement Financing Corp. LA
5.25%
5/15/2035
A-
1,880,000
1,894,307
Tobacco Settlement Financing Corp. NJ
5.00%
6/1/2031
A
4,605,000
4,759,227
Tobacco Settlement Financing Corp. NJ
5.00%
6/1/2046
BBB+
3,415,000
3,320,051
Tobacco Settlement Financing Corp. NJ
5.25%
6/1/2046
BBB+
9,300,000
9,352,750
Tobacco Settlement Financing Corp. VA
5.00%
6/1/2047
B-
7,540,000
6,670,961
TSASC, Inc. NY
5.00%
6/1/2035
A-
1,390,000
1,417,986
TSASC, Inc. NY
5.00%
6/1/2048
NR
5,550,000
4,818,028
Total
80,503,157
Transportation 22.96%
Alameda Corridor Transportation Authority CA (AGM)
5.00%
10/1/2034
AA
3,650,000
3,741,110
Allegheny County Airport Authority PA AMT
5.00%
1/1/2056
A2
5,505,000
5,378,302
California Municipal Finance Authority–Lax Integrated Express AMT
4.00%
12/31/2047
BBB-
(f)
9,450,000
7,637,894
California Municipal Finance Authority–Lax Integrated Express AMT
5.00%
12/31/2038
BBB-
(f)
5,000,000
5,001,193
Canaveral Port Authority FL
5.00%
6/1/2048
A3
4,890,000
4,763,981
Canaveral Port Authority FL AMT
5.00%
6/1/2045
A3
4,630,000
4,561,963
Central Texas Regional Mobility Authority
5.00%
1/1/2045
A
4,500,000
4,581,554
Central Texas Turnpike System
5.00%
8/15/2033
A-
5,750,000
5,721,649
Central Texas Turnpike System
5.00%
8/15/2037
A-
2,500,000
2,458,243
Chicago Midway International Airport IL
4.00%
1/1/2034
A
1,000,000
965,507
Chicago O’Hare International Airport–Trips Oblig Group IL AMT
5.00%
7/1/2048
BBB+
3,500,000
3,197,253
Chicago O’Hare International Airport IL
4.00%
1/1/2044
A+
13,500,000
12,153,069
112
See Notes to Financial Statements.
Schedule of Investments (continued)
NATIONAL TAX FREE FUND September 30, 2023
Investments
Interest Rate
Maturity Date
Credit Rating: S&P or Moody’s(a)
Principal Amount
Fair Value
Transportation (continued)
Chicago O’Hare International Airport IL
5.00%
1/1/2053
A+
$
2,500,000
$
2,501,349
Chicago O’Hare International Airport IL (BAM)
5.25%
1/1/2041
NR
1,950,000
2,020,271
Chicago O’Hare International Airport IL (BAM)
5.25%
1/1/2042
NR
1,470,000
1,518,418
Chicago O’Hare International Airport IL (BAM)
5.25%
1/1/2043
NR
1,660,000
1,710,087
Chicago O’Hare International Airport IL AMT
5.00%
1/1/2047
A+
9,375,000
9,172,507
Chicago O’Hare International Airport IL AMT
5.00%
1/1/2048
A+
20,000,000
19,851,754
City & County of Denver Airport System Revenue CO AMT
4.00%
12/1/2048
A+
4,255,000
3,541,217
City & County of Denver Airport System Revenue CO AMT
5.25%
11/15/2043
A+
8,000,000
8,000,532
City of Atlanta Airport Passenger Facility Charge GA AMT
5.00%
1/1/2028
AA-
2,000,000
1,999,363
City of Atlanta Airport Passenger Facility Charge GA AMT
5.00%
1/1/2031
AA-
4,000,000
3,995,470
City of Atlanta Department of Aviation GA
5.00%
7/1/2048
Aa3
5,200,000
5,360,350
City of Burbank Electric Revenue NC
4.00%
7/1/2047
Aa3
7,415,000
6,665,283
City of Charlotte Airport Revenue NC
5.25%
7/1/2053
Aa3
15,000,000
15,725,847
City of Fresno Airport Revenue CA (BAM)
5.00%
7/1/2053
AA
2,000,000
1,982,557
City of Houston Airport System Revenue–United Airlines Inc TX AMT
6.625%
7/15/2038
BB-
2,500,000
2,500,494
City of Los Angeles Department of Airports CA AMT
4.00%
5/15/2041
AA-
3,595,000
3,250,509
City of Los Angeles Department of Airports CA AMT
4.00%
5/15/2049
AA-
5,000,000
4,257,438
City of Los Angeles Department of Airports CA AMT
5.00%
5/15/2039
AA
9,000,000
9,177,635
City of Los Angeles Department of Airports CA AMT
5.50%
5/15/2047
AA
6,440,000
6,703,878
City of Philadelphia Airport Revenue PA AMT
5.00%
7/1/2042
A+
4,440,000
4,368,823
City of Salt Lake City Airport Revenue UT AMT
5.00%
7/1/2036
A+
10,045,000
10,326,911
City of Salt Lake City Airport Revenue UT AMT
5.50%
7/1/2053
A2
2,500,000
2,582,325
City of San Antonio Airport System TX AMT
5.00%
7/1/2045
A+
8,435,000
8,405,038
City of St. Louis Airport Revenue MO (AGM)
5.00%
7/1/2047
AA
7,500,000
7,506,615
County of Miami–Dade Aviation Revenue FL AMT
5.00%
10/1/2035
A1
10,000,000
9,991,350
County of Miami-Dade Aviation Revenue FL AMT
5.00%
10/1/2028
A1
4,435,000
4,432,217
See Notes to Financial Statements.
113
Schedule of Investments (continued)
NATIONAL TAX FREE FUND September 30, 2023
Investments
Interest Rate
Maturity Date
Credit Rating: S&P or Moody’s(a)
Principal Amount
Fair Value
Transportation (continued)
County of Miami-Dade Aviation Revenue FL AMT
5.00%
10/1/2029
A1
$
2,500,000
$
2,499,491
County of Miami-Dade Aviation Revenue FL AMT
5.00%
10/1/2034
A1
10,000,000
9,995,361
County of Miami-Dade Aviation Revenue FL AMT
5.00%
10/1/2044
A
6,000,000
5,897,608
County of Osceola Transportation Revenue FL
5.00%
10/1/2039
BBB+
1,000,000
1,001,461
County of Sacramento Airport System Revenue CA
5.00%
7/1/2041
A
8,000,000
8,146,616
Delaware River Joint Toll Bridge Commission PA
5.00%
7/1/2047
A+
11,100,000
11,207,167
E-470 Public Highway Authority CO (NATL)
Zero Coupon
9/1/2032
A+
4,200,000
2,829,855
E-470 Public Highway Authority CO (NATL)
Zero Coupon
9/1/2037
A+
7,720,000
3,856,314
Eagle County Airport Terminal Corp. CO AMT
5.00%
5/1/2037
Baa2
1,000,000
963,702
Eagle County Airport Terminal Corp. CO AMT
5.00%
5/1/2041
Baa2
3,000,000
2,808,944
(d)
Foothill-Eastern Transportation Corridor Agency CA
Zero Coupon
1/15/2033
A
5,000,000
3,286,502
Foothill-Eastern Transportation Corridor Agency CA
3.50%
1/15/2053
A
7,190,000
5,534,590
Foothill-Eastern Transportation Corridor Agency CA
3.95%
1/15/2053
A
5,000,000
4,246,958
Foothill-Eastern Transportation Corridor Agency CA
4.00%
1/15/2043
A-
16,123,000
14,511,080
Foothill-Eastern Transportation Corridor Agency CA
4.00%
1/15/2046
A
10,000,000
8,951,460
Greater Asheville Regional Airport Authority NC (AGM) AMT
5.25%
7/1/2048
AA
1,250,000
1,263,886
Greater Asheville Regional Airport Authority NC (AGM) AMT
5.25%
7/1/2053
AA
2,000,000
2,012,493
Greater Orlando Aviation Authority FL AMT
4.00%
10/1/2049
AA-
6,375,000
5,405,289
Hampton Roads Transportation VA(e)
5.25%
7/1/2060
AA
20,000,000
20,831,524
Kansas City Industrial Development Authority MO AMT
4.00%
3/1/2036
A2
3,000,000
2,812,732
Maryland Economic Development Corp.–Purple Line Transit Ptr AMT
5.25%
6/30/2047
Baa3
2,500,000
2,423,398
114
See Notes to Financial Statements.
Schedule of Investments (continued)
NATIONAL TAX FREE FUND September 30, 2023
Investments
Interest Rate
Maturity Date
Credit Rating: S&P or Moody’s(a)
Principal Amount
Fair Value
Transportation (continued)
Maryland Economic Development Corp.–Purple Line Transit Ptr AMT
5.25%
6/30/2052
Baa3
$
2,500,000
$
2,400,665
Maryland Economic Development Corp.–Purple Line Transit Ptr AMT
5.25%
6/30/2055
Baa3
12,500,000
11,930,432
Maryland Economic Development Corp. Tax Allocation
4.00%
9/1/2040
NR
2,000,000
1,678,227
Maryland State Transportation Authority
5.00%
7/1/2051
Aa2
10,000,000
10,280,191
Maryland State Transportation Authority Passenger Facility Charge Revenue AMT
3.00%
6/1/2036
A+
7,310,000
5,830,005
Massachusetts Port Authority AMT
5.00%
7/1/2040
AA
1,500,000
1,503,052
Massachusetts Port Authority AMT
5.00%
7/1/2045
AA
3,315,000
3,281,600
Metropolitan Nashville Airport Authority TN AMT
5.00%
7/1/2049
A2
5,000,000
4,908,528
Metropolitan Nashville Airport Authority TN AMT
5.50%
7/1/2052
A1
6,500,000
6,677,851
Metropolitan Transportation Authority NY
4.00%
11/15/2048
A3
9,825,000
8,164,772
Metropolitan Transportation Authority NY
4.00%
11/15/2049
A3
6,605,000
5,462,869
Metropolitan Transportation Authority NY
4.00%
11/15/2050
A3
6,500,000
5,352,452
Metropolitan Transportation Authority NY
5.00%
11/15/2035
A3
4,265,000
4,313,988
Metropolitan Transportation Authority NY
5.00%
#(b)
11/15/2045
A3
2,700,000
2,780,050
Metropolitan Transportation Authority NY
5.00%
11/15/2050
A3
4,680,000
4,564,400
Metropolitan Transportation Authority NY
5.25%
11/15/2044
A3
12,180,000
12,142,706
Metropolitan Transportation Authority NY
5.25%
11/15/2055
A3
10,850,000
10,928,556
Metropolitan Transportation Authority NY(e)
5.25%
11/15/2055
A3
20,500,000
20,648,424
Metropolitan Washington Airports Authority DC AMT
4.00%
10/1/2039
AA-
5,445,000
5,002,989
Minneapolis–St. Paul Metropolitan Airports Commission MN
5.00%
1/1/2031
A+
2,000,000
2,004,637
Minneapolis–St. Paul Metropolitan Airports Commission MN AMT
5.00%
1/1/2047
A+
3,000,000
2,978,722
New Jersey Transportation Trust Fund Authority
4.00%
6/15/2045
A2
25,630,000
22,752,612
New Jersey Transportation Trust Fund Authority
5.00%
6/15/2045
A2
5,000,000
5,077,836
New Jersey Transportation Trust Fund Authority
5.50%
6/15/2050
A2
2,000,000
2,108,760
New York State Thruway Authority
5.25%
1/1/2056
A2
7,455,000
7,496,169
New York State Thruway Authority (AGM)
4.00%
1/1/2051
AA
2,725,000
2,341,607
See Notes to Financial Statements.
115
Schedule of Investments (continued)
NATIONAL TAX FREE FUND September 30, 2023
Investments
Interest Rate
Maturity Date
Credit Rating: S&P or Moody’s(a)
Principal Amount
Fair Value
Transportation (continued)
New York Transportation Development Corp.–Delta Air Lines Inc AMT
4.00%
1/1/2036
Baa3
$
3,295,000
$
3,040,663
New York Transportation Development Corp.–Delta Air Lines Inc AMT
5.00%
1/1/2029
Baa3
2,955,000
2,984,240
New York Transportation Development Corp.–Delta Air Lines Inc AMT
5.00%
1/1/2030
Baa3
3,990,000
4,032,018
New York Transportation Development Corp.–Delta Air Lines Inc AMT
5.00%
1/1/2033
Baa3
12,450,000
12,556,025
New York Transportation Development Corp.–Delta Air Lines Inc AMT
5.00%
1/1/2034
Baa3
4,205,000
4,238,469
New York Transportation Development Corp.–Delta Air Lines Inc AMT
5.00%
1/1/2036
Baa3
2,250,000
2,240,152
New York Transportation Development Corp.–Delta Air Lines Inc AMT
5.00%
10/1/2040
Baa3
21,000,000
20,186,187
New York Transportation Development Corp.–JFK Intl Air Terminal LLC AMT
5.00%
12/1/2039
Baa1
5,840,000
5,814,540
New York Transportation Development Corp.–JFK Intl Air Terminal LLC AMT
5.00%
12/1/2042
Baa1
3,250,000
3,170,160
New York Transportation Development Corp.–Laguardia Gateway Partner (AGM) AMT
4.00%
7/1/2031
AA
5,000,000
4,797,077
New York Transportation Development Corp.–Laguardia Gateway Partner AMT
4.00%
7/1/2041
Baa2
12,365,000
10,438,341
New York Transportation Development Corp.–Laguardia Gateway Partner AMT
4.00%
7/1/2046
Baa2
2,340,000
1,872,235
New York Transportation Development Corp.–Laguardia Gateway Partner AMT
5.25%
1/1/2050
Baa2
19,245,000
18,889,068
Niagara Frontier Transportation Authority NY AMT
5.00%
4/1/2025
A3
2,750,000
2,755,431
Norman Y Mineta San Jose International Airport SJC CA
5.00%
3/1/2047
A
750,000
762,616
North Carolina Turnpike Authority
5.00%
1/1/2043
BBB
1,150,000
1,163,422
North Carolina Turnpike Authority (AGM)
4.00%
1/1/2037
AA
14,255,000
13,386,086
North Carolina Turnpike Authority (AGM)
4.00%
1/1/2038
AA
1,000,000
933,870
North Texas Tollway Authority
5.00%
1/1/2048
A+
5,000,000
5,000,175
Pennsylvania Turnpike Commission
4.00%
12/1/2038
A2
3,425,000
3,158,127
Pennsylvania Turnpike Commission
5.00%
6/1/2029
A2
9,000,000
9,154,046
116
See Notes to Financial Statements.
Schedule of Investments (continued)
NATIONAL TAX FREE FUND September 30, 2023
Investments
Interest Rate
Maturity Date
Credit Rating: S&P or Moody’s(a)
Principal Amount
Fair Value
Transportation (continued)
Port Authority of New York & New Jersey
5.25%
10/15/2055
AA-
$
3,965,000
$
4,002,084
Port Authority of New York & New Jersey AMT
5.00%
7/15/2035
Aa3
6,250,000
6,663,021
Port Authority of New York & New Jersey AMT
5.00%
7/15/2036
Aa3
4,000,000
4,218,080
Port Authority of New York & New Jersey AMT
5.00%
7/15/2037
Aa3
3,250,000
3,390,804
Port Authority of New York & New Jersey AMT
5.00%
7/15/2038
Aa3
5,000,000
5,174,754
Port Authority of New York & New Jersey AMT
5.00%
11/15/2041
AA-
6,950,000
6,966,807
Port Authority of New York & New Jersey AMT
5.00%
1/15/2052
AA-
13,855,000
13,798,027
Port Authority of New York & New Jersey AMT
5.00%
12/1/2053
Aa3
7,100,000
7,059,541
Port of Portland Airport Revenue OR AMT
5.00%
7/1/2039
AA-
2,000,000
1,978,558
Port of Portland Airport Revenue OR AMT
5.00%
7/1/2049
AA-
5,000,000
4,957,955
Port of Portland Airport Revenue OR AMT
5.50%
7/1/2048
AA-
6,250,000
6,462,466
Puerto Rico Highway & Transportation Authority
Zero Coupon
7/1/2032
NR
5,014,595
3,240,682
Puerto Rico Highway & Transportation Authority
Zero Coupon
7/1/2053
NR
24,967
15,511
Puerto Rico Highway & Transportation Authority
5.00%
7/1/2062
NR
4,204,459
4,025,769
San Diego Cnty Regional Arpt Auth CA(e)
5.00%
7/1/2056
A2
11,545,000
11,913,107
San Diego County Regional Airport Authority CA
5.00%
7/1/2044
A
4,500,000
4,664,625
San Diego County Regional Airport Authority CA
5.00%
7/1/2051
A2
15,475,000
16,051,710
San Diego County Regional Airport Authority CA AMT
4.00%
7/1/2046
A2
4,500,000
3,843,978
San Francisco City & County Airport Comm-San Francisco International Airport CA AMT
5.25%
5/1/2033
A+
7,000,000
6,999,909
South Carolina Ports Authority AMT
5.00%
7/1/2044
A+
5,000,000
4,877,477
State of Alabama Docks Department (AGM)
5.00%
10/1/2036
AA
750,000
762,210
State of Alabama Docks Department (AGM) AMT
5.00%
10/1/2034
AA
2,000,000
2,024,119
State of Alabama Docks Department (AGM) AMT
5.00%
10/1/2035
AA
2,000,000
2,017,294
State of Florida Department of Transportation Turnpike System Revenue
3.00%
7/1/2051
AA
10,705,000
7,094,590
State of Hawaii Airports System Revenue AMT
5.00%
7/1/2041
AA-
5,000,000
4,992,322
See Notes to Financial Statements.
117
Schedule of Investments (continued)
NATIONAL TAX FREE FUND September 30, 2023
Investments
Interest Rate
Maturity Date
Credit Rating: S&P or Moody’s(a)
Principal Amount
Fair Value
Transportation (continued)
State of Michigan Trunk Line Revenue
5.50%
11/15/2049
Aa2
$
15,000,000
$
16,197,088
Texas Private Activity Bond Surface Transportation Corp.–LBJ Infrastructure Group
4.00%
6/30/2037
Baa2
2,950,000
2,683,094
Texas Private Activity Bond Surface Transportation Corp.–LBJ Infrastructure Group
4.00%
12/31/2037
Baa2
2,125,000
1,925,200
Texas Private Activity Bond Surface Transportation Corp.–LBJ Infrastructure Group
4.00%
6/30/2038
Baa2
1,050,000
945,157
Texas Private Activity Bond Surface Transportation Corp.–LBJ Infrastructure Group
4.00%
12/31/2038
Baa2
1,375,000
1,234,554
Texas Private Activity Bond Surface Transportation Corp. AMT
5.50%
12/31/2058
Baa1
5,000,000
5,099,022
Triborough Bridge & Tunnel Authority NY
5.00%
11/15/2042
AA-
1,640,000
1,670,821
Triborough Bridge & Tunnel Authority Sales Tax Revenue NY
5.25%
5/15/2058
AA+
7,300,000
7,620,888
Virginia Small Business Financing Authority–95 Express Lanes LLC AMT
5.00%
1/1/2032
BBB
6,225,000
6,506,979
Virginia Small Business Financing Authority–95 Express Lanes LLC AMT
5.00%
7/1/2036
BBB
6,685,000
6,868,767
Virginia Small Business Financing Authority–Elizabeth River Crossings AMT
4.00%
1/1/2038
BBB
4,500,000
4,069,694
Virginia Small Business Financing Authority–Elizabeth River Crossings AMT
4.00%
1/1/2040
BBB
4,825,000
4,310,987
Wayne County Airport Authority MI AMT
5.00%
12/1/2039
A1
1,700,000
1,698,178
Wayne County Airport Authority MI AMT
5.00%
12/1/2042
A1
1,200,000
1,197,936
Wayne County Airport Authority MI AMT
5.00%
12/1/2046
A1
2,825,000
2,802,335
Total
843,407,535
Utilities 11.73%
Adelanto Public Utility Authority CA (AGM)
5.00%
7/1/2039
AA
1,500,000
1,546,447
Baltimore Proj Revenue MD(e)
5.25%
7/1/2047
AA-
7,190,000
7,522,745
Baltimore Proj Revenue MD(e)
5.25%
7/1/2052
AA-
12,190,000
12,754,139
Black Belt Energy Gas District AL
4.00%
#(b)
7/1/2052
Aa1
6,000,000
5,844,809
Black Belt Energy Gas District AL
4.00%
#(b)
10/1/2052
A2
11,660,000
11,336,603
118
See Notes to Financial Statements.
Schedule of Investments (continued)
NATIONAL TAX FREE FUND September 30, 2023
Investments
Interest Rate
Maturity Date
Credit Rating: S&P or Moody’s(a)
Principal Amount
Fair Value
Utilities (continued)
Black Belt Energy Gas District AL
4.00%
#(b)
12/1/2052
Baa1
$
18,600,000
$
17,382,059
Black Belt Energy Gas District AL
5.50%
#(b)
6/1/2049
A2
9,450,000
9,642,120
Black Belt Energy Gas District AL
5.50%
#(b)
11/1/2053
A2
6,665,000
6,810,973
California Pollution Control Financing Authority–Poseidon Resources†
5.00%
7/1/2039
Baa3
2,200,000
2,205,866
California Pollution Control Financing Authority–Poseidon Resources†
5.00%
11/21/2045
Baa3
2,750,000
2,678,013
Casitas Municipal Water District CA Special Tax (BAM)
5.25%
9/1/2047
AA
500,000
513,835
Central Plains Energy Project NE
5.00%
9/1/2042
BBB+
3,305,000
3,185,987
Chautauqua County Capital Resource Corp.–NRG Energy Inc NY
4.25%
#(b)
4/1/2042
BBB-
5,000,000
4,826,782
City of Baltimore MD
5.00%
7/1/2039
A+
4,750,000
4,762,180
City of Baltimore MD
5.00%
7/1/2046
Aa3
10,000,000
10,074,013
City of Chicago Waterworks Revenue IL
5.00%
11/1/2036
A+
1,775,000
1,814,169
City of Chicago Waterworks Revenue IL
5.00%
11/1/2039
A+
3,455,000
3,411,423
City of Chicago Waterworks Revenue IL (AGM)
5.00%
11/1/2036
AA
3,000,000
3,055,190
City of Chicago Waterworks Revenue IL (AGM)
5.00%
11/1/2037
AA
2,500,000
2,540,063
City of Colorado Springs Utilities System Revenue CO
4.00%
11/15/2046
AA+
10,100,000
8,912,067
City of Compton Water Revenue CA
6.00%
8/1/2039
NR
5,500,000
5,117,546
City of Philadelphia Water & Wastewater Revenue PA
5.00%
7/1/2030
A+
3,355,000
3,388,399
City of Philadelphia Water & Wastewater Revenue PA
5.25%
10/1/2052
A+
6,610,000
6,674,634
City of San Antonio Electric & Gas Systems Revenue TX
5.50%
2/1/2050
Aa2
8,000,000
8,445,813
City of San Francisco Public Utilities Commission Water Revenue CA
5.25%
11/1/2052
Aa2
7,000,000
7,429,001
County of Jefferson Sewer Revenue AL
Zero Coupon
10/1/2039
BBB
350,000
368,004
County of Jefferson Sewer Revenue AL
6.00%
10/1/2042
BBB
5,000,000
5,197,647
County of Jefferson Sewer Revenue AL
6.50%
10/1/2053
BBB
7,700,000
8,087,722
County of Jefferson Sewer Revenue AL (AGM)
Zero Coupon
10/1/2026
AA
1,000,000
839,132
See Notes to Financial Statements.
119
Schedule of Investments (continued)
NATIONAL TAX FREE FUND September 30, 2023
Investments
Interest Rate
Maturity Date
Credit Rating: S&P or Moody’s(a)
Principal Amount
Fair Value
Utilities (continued)
County of Jefferson Sewer Revenue AL (AGM)
Zero Coupon
10/1/2027
AA
$
4,875,000
$
3,861,519
County of Jefferson Sewer Revenue AL (AGM)
Zero Coupon
10/1/2046
AA
6,000,000
6,302,115
County of Jefferson Sewer Revenue AL (AGM)
5.50%
10/1/2053
AA
3,555,000
3,567,844
County of Trimble–Louisville Gas & Elec Co KY
3.75%
6/1/2033
A1
12,500,000
11,696,739
Development Authority of Burke County–Georgia Power Company
5.06%
#(b)
9/1/2029
BBB+
1,700,000
1,700,000
Great Lakes Water Authority Sewage Disposal System Revenue MI
5.50%
7/1/2052
A+
12,000,000
12,450,746
Kentucky Municipal Power Agency (NATL)
5.00%
9/1/2035
Baa1
5,000,000
5,001,777
Kentucky Municipal Power Agency (NATL)
5.00%
9/1/2036
Baa1
5,000,000
4,930,978
Kentucky Public Energy Authority
4.00%
#(b)
8/1/2052
A1
15,500,000
14,648,847
Lower Colorado River Authority TX
5.00%
5/15/2040
A
2,970,000
2,984,538
Main Street Natural Gas, Inc. GA
4.00%
#(b)
3/1/2050
A3
4,125,000
4,032,715
Main Street Natural Gas, Inc. GA†
4.00%
#(b)
8/1/2052
BBB-
25,000,000
23,578,782
Main Street Natural Gas, Inc. GA
4.00%
#(b)
9/1/2052
A3
14,205,000
13,417,911
Main Street Natural Gas, Inc. GA
5.00%
5/15/2035
A2
2,000,000
1,987,008
Main Street Natural Gas, Inc. GA
5.00%
#(b)
12/1/2052
A3
13,400,000
13,381,527
Maricopa County Pollution Control Corp.–El Paso Electric Company AZ
3.60%
2/1/2040
Baa2
3,085,000
2,486,627
Maricopa County Pollution Control Corp.–El Paso Electric Company AZ
3.60%
4/1/2040
Baa2
4,315,000
3,472,943
Michigan Finance Authority
5.00%
7/1/2034
A+
1,980,000
2,003,694
Montgomery County Industrial Development Authority–Constellation Energy Gen PA
4.10%
#(b)
4/1/2053
BBB
8,000,000
7,980,486
Municipal Electric Authority of Georgia
5.00%
1/1/2033
A2
1,910,000
1,915,990
Municipal Electric Authority of Georgia
5.00%
1/1/2048
BBB+
5,000,000
4,794,345
Municipal Electric Authority of Georgia (AGM)
5.00%
7/1/2048
AA
1,100,000
1,111,864
Municipal Electric Authority of Georgia (AGM)
5.00%
7/1/2048
AA
1,750,000
1,768,874
Municipal Electric Authority of Georgia (AGM)
5.00%
7/1/2053
AA
2,300,000
2,313,956
Municipal Electric Authority of Georgia (AGM)
5.00%
7/1/2055
AA
2,350,000
2,362,524
New York City Municipal Water Finance Authority NY
4.00%
6/15/2051
AA+
6,155,000
5,352,292
120
See Notes to Financial Statements.
Schedule of Investments (continued)
NATIONAL TAX FREE FUND September 30, 2023
Investments
Interest Rate
Maturity Date
Credit Rating: S&P or Moody’s(a)
Principal Amount
Fair Value
Utilities (continued)
New York City Municipal Water Finance Authority NY
5.25%
6/15/2047
AA+
$
4,500,000
$
4,711,556
New York Power Authority
4.00%
11/15/2050
AA
4,950,000
4,391,515
Omaha Public Power District NE
4.00%
2/1/2046
AA
8,500,000
7,674,231
Omaha Public Power District Nebraska City Station Unit 2
5.25%
2/1/2042
A+
4,000,000
4,019,386
Paducah Electric Plant Board KY (AGM)
5.00%
10/1/2035
AA
1,000,000
1,013,750
Patriots Energy Group Financing Agency SC
5.25%
#(b)
10/1/2054
A1
15,000,000
15,107,479
Philadelphia Gas Works Co. PA
5.00%
8/1/2029
A
2,000,000
2,016,340
Philadelphia Gas Works Co. PA
5.00%
8/1/2030
A
1,500,000
1,510,162
Puerto Rico Commonwealth Aqueduct & Sewer Authority†
4.00%
7/1/2042
NR
5,000,000
4,170,444
Puerto Rico Electric Power Authority(c)
4.407% (3 mo. USD LIBOR * .67 + .70%
)#
7/1/2031
NR
4,000,000
1,010,000
Puerto Rico Electric Power Authority(c)
5.00%
7/1/2028
NR
270,000
68,175
Salt Verde Financial Corp. AZ
5.25%
12/1/2027
A3
3,750,000
3,808,322
Southeast Alabama Gas Supply District
4.00%
#(b)
4/1/2049
A3
2,500,000
2,489,988
Southeast Energy Authority A Cooperative District AL
4.00%
#(b)
12/1/2051
A1
11,955,000
11,126,761
Southeast Energy Authority A Cooperative District AL
5.50%
#(b)
1/1/2053
A1
5,000,000
5,133,584
Southern California Public Power Authority
5.244% (3 mo. USD LIBOR * .67 + 1.47%
)#
11/1/2038
A2
3,090,000
2,628,008
Tennergy Corp. TN
5.50%
#(b)
10/1/2053
Baa1
6,000,000
6,097,418
Tennessee Energy Acquisition Corp.
5.625%
9/1/2026
BBB
(f)
10,550,000
10,606,151
Texas Water Development Board
4.00%
10/15/2037
AAA
7,760,000
7,460,951
Transbay Joint Powers Authority CA Tax Allocation
5.00%
10/1/2049
A-
(f)
1,310,000
1,237,555
Washington Suburban Sanitary Commission MD
4.00%
6/1/2047
AAA
10,000,000
9,065,348
Total
430,821,146
Total Municipal Bonds (cost $3,928,133,629)
3,686,342,949
See Notes to Financial Statements.
121
Schedule of Investments (continued)
NATIONAL TAX FREE FUND September 30, 2023
Investments
Interest Rate#
Interest Rate Reset Date(h)
Final Maturity Date
Credit Rating: S&P or Moody’s(a)
Principal Amount
Fair Value
SHORT-TERM INVESTMENTS 1.04%
VARIABLE RATE DEMAND NOTES 1.04%
Corporate-Backed 0.03%
Columbia Industrial Development Board - Alabama Power Company
4.750%
10/2/2023
12/1/2037
A1
$
1,000,000
$
1,000,000
General Obligation 0.87%
City of New York NY GO
4.170%
10/2/2023
4/1/2042
AA
9,000,000
9,000,000
City of New York NY GO
4.170%
10/2/2023
4/1/2042
AA
9,700,000
9,700,000
City of New York NY GO
4.750%
10/2/2023
3/1/2040
AA
3,675,000
3,675,000
City of New York NY GO
4.800%
10/2/2023
6/1/2044
AA
9,505,000
9,505,000
Total
31,880,000
Tax Revenue 0.06%
New York City Transitional Finance Authority Future Tax Secured Revenue
4.800%
10/2/2023
5/1/2034
AAA
2,200,000
2,200,000
Utilities 0.08%
Development Authority of Appling County - Georgia Power Company
5.060%
10/2/2023
9/1/2041
BBB+
3,000,000
3,000,000
Total Short-Term Investments (cost $38,080,000)
38,080,000
Total Investments in Securities 101.40% (cost $3,966,213,629)
3,724,422,949
Other Assets and Liabilities – Net(i) (1.40)%
(51,365,780
)
Net Assets 100.00%
$
3,673,057,169
AGM
Insured by–Assured Guaranty Municipal Corporation.
AMT
Income from the security may be subject to Alternative Minimum Tax.
BAM
Insured by–Build America Mutual.
COPS
Certificates of Participation.
FHLMC
Insured by–Federal Home Loan Mortgage Corporation.
GTD
Guaranteed.
LIBOR
London Interbank Offered Rate.
NATL
National Public Finance Guarantee Corporation.
NR
Not Rated.
PSF
Permanent School Fund.
SIFMA
Insured by–Securities Industry and Financial Markets Association.
TCRS
Transferable Custodial Receipts.
TRIPS
Tax Refund Intercept Programs.
†
Security was purchased pursuant to Rule 144A under the Securities Act of 1933 and, unless registered under such Act or exempted from registration, may only be resold to qualified institutional buyers. At September 30, 2023, the total value of Rule 144A securities was $149,677,974, which represents 4.08% of net assets.
#
Variable rate security. The interest rate represents the rate in effect at September 30, 2023.
~
Deferred interest debentures pay no interest for a stipulated number of years, after which they pay a predetermined interest rate.
122
See Notes to Financial Statements.
Schedule of Investments (concluded)
NATIONAL TAX FREE FUND September 30, 2023
(a)
Unaudited.
(b)
Variable Rate is Fixed to Float: Rate remains fixed or at Zero Coupon until designated future date.
(c)
Defaulted (non-income producing security).
(d)
Level 3 Investment as described in Note 2(i) in the Notes to Financials. Security valued utilizing third party pricing information without adjustment. Such valuations are based on unobservable inputs. A significant change in third party information could result in a significantly lower or higher value of such Level 3 investments.
(e)
Municipal Bonds Held in Trust–Securities represent underlying bonds transferred to a separate securitization trust established in a tender option bond transaction in which the Fund acquired the residual interest certificates. These securities serve as collateral in a financing transaction. See Note 2(h) to Financial Statements for details of Municipal Bonds Held in Trust.
(f)
This investment has been rated by Fitch IBCA.
(g)
Securities purchased on a when-issued basis (See Note 2(g)).
(h)
The interest rate reset date shown represents the date in which the Fund has the right to sell a Variable Rate Demand Note (“VRDN”) back to the issuer for Principal Amount. The interest rate on the VRDN is generally reset daily based on the SIFMA Municipal Swap Index.
(i)
Other Assets and Liabilities – Net include net unrealized appreciation/depreciation on futures contracts as follows:
Futures Contracts at September 30, 2023:
Type
Expiration
Contracts
Position
Notional Amount
Notional Value
Unrealized Appreciation
U.S. Long Bond
December 2023
402
Short
$(47,706,433
)
$(45,740,063
)
$1,966,370
The following is a summary of the inputs used as of September 30, 2023 in valuing the Fund’s investments carried at fair value(1):
Investment Type(2)
Level 1
Level 2
Level 3
Total
Long-Term Investments
Municipal Bonds(3)
Corporate-Backed
$
–
$
332,606,957
$
3,724,000
$
336,330,957
General Obligation
–
621,664,206
4,118,927
625,783,133
Health Care
–
445,720,022
5,848,550
451,568,572
Special Tax
–
75,261,927
207,214
75,469,141
Transportation
–
840,598,591
2,808,944
843,407,535
Remaining Industries
–
1,353,783,611
–
1,353,783,611
Short-Term Investments
Variable Rate Demand Notes
–
38,080,000
–
38,080,000
Total
$
–
$
3,707,715,314
$
16,707,635
$
3,724,422,949
Other Financial Instruments
Futures Contracts
Assets
$
1,966,370
$
–
$
–
$
1,966,370
Liabilities
–
–
–
–
Total
$
1,966,370
$
–
$
–
$
1,966,370
(1)
Refer to Note 2(i) for a description of fair value measurements and the three-tier hierarchy of inputs.
(2)
See Schedule of Investments for fair values in each industry. The table above is presented by Investment Type. Industries are presented within an Investment Type should such Investment Type include securities classified as two or more levels within the three-tier fair value hierarchy. When applicable, each Level 3 security is identified on the Schedule of Investments along with the valuation technique utilized.
(3)
Includes Municipal Bonds held in the Trust (See Note 2(h)).
A reconciliation of Level 3 investments is presented when the Fund has a material amount of Level 3 investments at the beginning or end of the year in relation to the Fund’s net assets. Management has determined not to provide a reconciliation as the balance of Level 3 investments was not considered to be material to the Fund’s net assets at the beginning or end of the year.
See Notes to Financial Statements.
123
Schedule of Investments
HIGH INCOME MUNICIPAL BOND FUND September 30, 2023
Investments
Interest Rate
Maturity Date
Credit Rating: S&P or Moody’s(a)
Principal Amount
Fair Value
LONG-TERM INVESTMENTS 99.90%
CORPORATE BONDS 0.09%
Health Care Services 0.09%
Care New England Health System (cost $2,750,217)
5.50%
9/1/2026
$
3,000,000
$
2,715,000
MUNICIPAL BONDS 99.81%
Corporate-Backed 20.74%
Allegheny County Industrial Development Authority–US Steel Corporation PA
4.875%
11/1/2024
BB-
1,000,000
998,250
Allegheny County Industrial Development Authority–US Steel Corporation PA
5.125%
5/1/2030
BB-
3,990,000
3,999,765
Arkansas Development Finance Authority–Big River Steel LLC AMT†
4.50%
9/1/2049
Ba2
35,135,000
31,886,565
Arkansas Development Finance Authority–Hybar LLC†
12.00%
7/1/2048
NR
15,000,000
15,396,010
Arkansas Development Finance Authority–Hybar LLC AMT†
6.875%
7/1/2048
NR
9,250,000
9,264,908
Arkansas Development Finance Authority–US Steel Corporation AMT
5.45%
9/1/2052
BB-
18,000,000
16,810,936
Arkansas Development Finance Authority AMT
5.70%
5/1/2053
BB-
17,250,000
16,559,653
Avenir Community Development District FL
5.375%
5/1/2043
NR
4,000,000
3,780,045
Avenir Community Development District FL
5.625%
5/1/2054
NR
4,750,000
4,446,221
Black Belt Energy Gas District AL
4.00%
#(b)
10/1/2052
A2
17,240,000
16,761,838
Boggy Creek Improvement District FL
5.125%
5/1/2043
NR
1,775,000
1,668,610
Boggy Creek Improvement District FL
5.375%
5/1/2053
NR
4,300,000
3,994,849
Build NYC Resource Corp.–Pratt Paper Inc NY AMT†
5.00%
1/1/2035
NR
1,450,000
1,460,676
Calhoun County Navigation Industrial Development Authority–Max Midstream Texas LLC AMT†
3.625%
7/1/2026
NR
12,800,000
11,653,852
California Pollution Control Financing Authority–Poseidon Resources AMT†
5.00%
11/21/2045
Baa3
3,025,000
2,888,416
Chandler Industrial Development Authority–Intel Corporation AZ AMT
4.10%
#(b)
12/1/2037
A2
3,500,000
3,426,527
City of Henderson–Pratt Paper LLC KY AMT†
4.70%
1/1/2052
NR
15,475,000
14,142,841
City of Houston Airport System Revenue–United Airlines Inc TX AMT
4.00%
7/15/2041
B-
(c)
4,475,000
3,722,326
124
See Notes to Financial Statements.
Schedule of Investments (continued)
HIGH INCOME MUNICIPAL BOND FUND September 30, 2023
Investments
Interest Rate
Maturity Date
Credit Rating: S&P or Moody’s(a)
Principal Amount
Fair Value
Corporate-Backed (continued)
City of Houston Airport System Revenue–United Airlines Inc TX AMT
5.00%
7/1/2029
BB-
$
18,325,000
$
18,054,285
City of Valparaiso–Pratt Paper LLC IN AMT
5.875%
1/1/2024
NR
105,000
105,583
City of Valparaiso–Pratt Paper LLC IN AMT
7.00%
1/1/2044
NR
4,000,000
4,026,372
Downtown Doral South Community Development District FL†
4.75%
12/15/2038
NR
625,000
572,637
Downtown Doral South Community Development District FL†
5.00%
12/15/2048
NR
1,500,000
1,338,590
Florida Development Finance Corp.–Waste pro USA Inc AMT†
6.125%
#(b)
7/1/2032
NR
9,000,000
8,957,568
Florida Development Finance Corp.–Waste Pro USA Inc AMT†
California School Finance Authority–Kipp Socal Pub Schs Oblig†
5.125%
7/1/2044
BBB
2,390,000
2,357,152
Capital Trust Agency, Inc.–Educational Growth Fund FL†
5.00%
7/1/2056
NR
13,350,000
11,354,232
Capital Trust Agency, Inc.–Franklin Acad Ser 2020 Oblig FL†
5.00%
12/15/2050
NR
14,700,000
11,747,621
Chester County Industrial Development Authority–Collegium Charter School PA
5.125%
10/15/2037
BB
1,000,000
937,593
Chester County Industrial Development Authority–Collegium Charter School PA
5.25%
10/15/2047
BB
2,500,000
2,216,551
Cleveland-Cuyahoga County Port Authority–Playhouse Square Fdtn OH
5.25%
12/1/2038
BB+
1,400,000
1,353,038
Cleveland-Cuyahoga County Port Authority–Playhouse Square Fdtn OH
5.50%
12/1/2043
BB+
1,850,000
1,777,997
Cleveland-Cuyahoga County Port Authority–Playhouse Square Fdtn OH
5.50%
12/1/2053
BB+
11,485,000
10,597,974
Clifton Higher Education Finance Corp.–Idea Public Schools TX
6.00%
8/15/2043
A-
1,000,000
1,000,721
Clifton Higher Education Finance Corp.–Intl American Edu Fed TX
6.125%
8/15/2048
Baa3
22,025,000
21,399,904
Commonwealth of Puerto Rico
Zero Coupon
#(b)
11/1/2051
NR
796,127
125,390
Commonwealth of Puerto Rico
5.069%
#(b)
11/1/2051
NR
26,469,353
13,631,717
140
See Notes to Financial Statements.
Schedule of Investments (continued)
HIGH INCOME MUNICIPAL BOND FUND September 30, 2023
Investments
Interest Rate
Maturity Date
Credit Rating: S&P or Moody’s(a)
Principal Amount
Fair Value
Other Revenue (continued)
Florida Development Finance Corp.–Franklin Acad Ser 2016 Oblig†
5.00%
7/15/2046
NR
$
4,000,000
$
3,448,586
(e)
Florida Development Finance Corp.–Palm Bay Academy Inc†
Zero Coupon
5/15/2037
NR
940,000
9
Florida Development Finance Corp.–Palm Bay Academy Inc†
6.375%
5/15/2037
NR
2,620,000
2,159,032
Florida Development Finance Corp.–Palm Bay Academy Inc†
6.375%
5/15/2037
NR
1,220,000
244,000
Florida Development Finance Corp.–Renaissance Chtr 2020 C/D†
5.00%
9/15/2050
NR
3,505,000
2,744,424
Florida Development Finance Corp.–Renaissance Chtr Sch 2015†
6.125%
6/15/2046
NR
5,000,000
4,824,406
George L Smith II Congress Center Authority–Signia Hotel Mgmt LLC GA†
5.00%
1/1/2054
NR
10,000,000
7,623,214
Industrial Development Authority of the City of Phoenix Arizona–Basis Schools Inc Oblig†
5.00%
7/1/2046
BB
2,000,000
1,764,644
Industrial Development Authority of the County of Pima–Edkey Oblig Group AZ†
5.00%
7/1/2049
NR
6,000,000
5,007,493
Industrial Development Authority of the County of Pima–Edkey Oblig Group AZ†
5.00%
7/1/2055
NR
4,000,000
3,263,494
Jefferson Parish Economic Development & Port District–Kenner Discovery Hlth Sci LA†
5.50%
6/15/2038
NR
3,200,000
3,059,892
(e)
Jefferson Parish Economic Development & Port District–Kenner Discovery Hlth Sci LA†
5.625%
6/15/2048
NR
4,350,000
3,974,042
(e)
Main Street Natural Gas, Inc. GA
5.00%
5/15/2043
A2
1,900,000
1,830,885
Maricopa County Industrial Development Authority–Paragon Management Inc AZ†
5.00%
7/1/2047
BB+
4,000,000
3,552,200
Maryland Economic Development Corp.(d)
5.00%
12/1/2031
NR
10,700,000
6,420,000
Maryland Economic Development Corp.(d)
5.25%
12/1/2031
NR
3,000,000
1,800,000
Michigan Finance Authority–Bradford Academy
4.30%
9/1/2030
NR
845,000
742,770
Michigan Finance Authority–Bradford Academy
4.80%
9/1/2040
NR
1,845,000
1,446,168
Michigan Finance Authority–Bradford Academy
5.00%
9/1/2050
NR
3,010,000
2,213,095
Michigan Public Educational Facilities Authority–Crescent Academy
7.00%
10/1/2036
NR
607,500
607,536
Middlesex County Improvement Authority NJ
6.125%
1/1/2025
NR
2,790,000
34,875
Middlesex County Improvement Authority NJ
6.25%
1/1/2037
NR
5,755,000
71,938
See Notes to Financial Statements.
141
Schedule of Investments (continued)
HIGH INCOME MUNICIPAL BOND FUND September 30, 2023
Investments
Interest Rate
Maturity Date
Credit Rating: S&P or Moody’s(a)
Principal Amount
Fair Value
Other Revenue (continued)
New Jersey Economic Development Authority
5.00%
11/1/2052
A2
$
10,370,000
$
10,380,615
Plymouth Educational Center Charter School MI
5.375%
11/1/2030
D
1,425,000
869,250
Utah Charter School Finance Authority–Freedom Academy Fndtn†
5.00%
6/15/2041
NR
1,020,000
885,526
Utah Charter School Finance Authority–Freedom Academy Fndtn†
5.00%
6/15/2052
NR
1,300,000
1,057,343
Utah Charter School Finance Authority–Freedom Academy Fndtn†
5.375%
6/15/2048
NR
5,150,000
4,515,979
Washington State Convention Center Public Facilities District
3.00%
7/1/2043
Baa3
4,375,000
3,083,998
Washington State Convention Center Public Facilities District
3.00%
7/1/2058
Baa3
2,400,000
1,432,565
Washington State Convention Center Public Facilities District
4.00%
7/1/2058
Baa3
6,000,000
4,714,439
Total
171,852,797
Special Tax 4.16%
Allentown Neighborhood Improvement Zone Development Authority PA†
5.00%
5/1/2032
Ba3
2,425,000
2,439,236
Allentown Neighborhood Improvement Zone Development Authority PA†
5.25%
5/1/2042
NR
3,215,000
3,053,902
Allentown Neighborhood Improvement Zone Development Authority PA†
6.00%
5/1/2042
NR
11,375,000
11,361,707
Anne Arundel County Consolidated Special Taxing District MD Special Tax
5.125%
7/1/2036
NR
1,030,000
1,029,961
Anne Arundel County Consolidated Special Taxing District MD Special Tax
5.25%
7/1/2044
NR
2,150,000
2,074,514
Arborwood Community Development District FL
6.90%
5/1/2036
NR
610,000
599,417
Arborwood Community Development District FL
6.90%
5/1/2036
NR
50,000
48,249
Babcock Ranch Community Independent Special District FL
5.00%
5/1/2042
NR
4,000,000
3,703,092
Babcock Ranch Community Independent Special District FL
5.00%
5/1/2053
NR
4,000,000
3,473,900
Celebration Pointe Community Development District No. 1 FL
3.375%
5/1/2041
NR
3,970,000
2,928,299
Celebration Pointe Community Development District No. 1 FL
5.00%
5/1/2048
NR
6,555,000
5,872,347
City of Baltimore MD
4.875%
6/1/2042
NR
1,275,000
1,171,499
142
See Notes to Financial Statements.
Schedule of Investments (continued)
HIGH INCOME MUNICIPAL BOND FUND September 30, 2023
Investments
Interest Rate
Maturity Date
Credit Rating: S&P or Moody’s(a)
Principal Amount
Fair Value
Special Tax (continued)
City of Baltimore MD
5.00%
6/1/2051
NR
$
1,600,000
$
1,442,846
City of North Las Vegas NV
4.50%
6/1/2039
NR
470,000
426,566
City of North Las Vegas NV
4.625%
6/1/2043
NR
470,000
418,334
City of North Las Vegas NV
4.625%
6/1/2049
NR
715,000
616,286
County of Prince George’s MD Tax Allocation†
5.125%
7/1/2039
NR
1,100,000
1,034,738
County of Prince George’s MD Tax Allocation†
5.25%
7/1/2048
NR
5,125,000
4,733,243
Grandview Industrial Development Authority MO Tax Allocation(d)
5.75%
12/1/2028
NR
1,000,000
220,000
(e)
Industrial Development Authority of the City of St. Louis Missouri
4.375%
11/15/2035
NR
3,500,000
2,693,413
Industrial Development Authority of the City of St. Louis Missouri
4.75%
11/15/2047
NR
8,975,000
6,250,717
Inland Valley Development Agency CA Tax Allocation
5.25%
9/1/2037
A
3,375,000
3,384,856
Lakewood Ranch Stewardship District FL(g)
6.30%
5/1/2054
NR
4,500,000
4,509,378
Miami World Center Community Development District FL
5.25%
11/1/2049
NR
4,500,000
4,219,028
Mida Mountain Village Public Infrastructure District UT†
4.00%
8/1/2050
NR
8,500,000
6,017,310
Mida Mountain Village Public Infrastructure District UT†
4.25%
8/1/2035
NR
3,290,000
2,881,859
Mida Mountain Village Public Infrastructure District UT†
4.50%
8/1/2040
NR
1,250,000
1,023,705
Mida Mountain Village Public Infrastructure District UT†
5.00%
8/1/2050
NR
3,500,000
2,814,546
Military Installation Development Authority UT
4.00%
6/1/2052
NR
11,485,000
7,817,702
Northern Palm Beach County Improvement District FL
5.00%
8/1/2046
NR
5,000,000
4,585,622
Orange County Community Facilities District CA Special Tax
5.00%
8/15/2042
NR
2,000,000
1,946,642
Orange County Community Facilities District CA Special Tax
5.00%
8/15/2047
NR
2,000,000
1,905,720
Peninsula Town Center Community Development Authority VA†
5.00%
9/1/2037
NR
875,000
819,062
Peninsula Town Center Community Development Authority VA†
5.00%
9/1/2045
NR
6,050,000
5,317,430
See Notes to Financial Statements.
143
Schedule of Investments (continued)
HIGH INCOME MUNICIPAL BOND FUND September 30, 2023
Investments
Interest Rate
Maturity Date
Credit Rating: S&P or Moody’s(a)
Principal Amount
Fair Value
Special Tax (continued)
Plaza at Noah’s Ark Community Improvement District MO
3.00%
5/1/2030
NR
$
725,000
$
638,195
Prince George’s County Revenue Authority MD Tax Allocation†
5.00%
7/1/2046
NR
5,000,000
4,758,298
River Islands Public Financing Authority CA Special Tax (AGM)
5.25%
9/1/2052
AA
2,500,000
2,612,764
Rocky Mountain Rail Park Metropolitan District CO GO†
5.00%
12/1/2041
NR
2,000,000
1,297,467
Rocky Mountain Rail Park Metropolitan District CO GO†
5.00%
12/1/2051
NR
6,520,000
3,612,263
Scranton Redevelopment Authority PA GTD
5.00%
11/15/2028
BBB-
4,385,000
4,332,246
Stone Canyon Community Improvement District MO(d)
5.70%
4/1/2022
NR
1,485,000
133,650
(e)
Tern Bay Community Development District FL
5.375%
5/1/2037
NR
350,000
349,981
Village Metropolitan District CO GO
5.00%
12/1/2040
NR
2,000,000
1,826,583
Village Metropolitan District CO GO
5.00%
12/1/2049
NR
4,085,000
3,583,453
West Villages Improvement District FL
4.75%
5/1/2039
NR
1,750,000
1,586,557
West Villages Improvement District FL
5.00%
5/1/2050
NR
3,090,000
2,715,609
Westview South Community Development District FL
5.375%
5/1/2043
NR
2,000,000
1,865,831
Westview South Community Development District FL
5.375%
5/1/2043
NR
1,000,000
938,363
Westview South Community Development District FL
5.60%
5/1/2053
NR
3,000,000
2,766,853
Westview South Community Development District FL
5.625%
5/1/2053
NR
1,000,000
932,663
Total
136,785,902
Tax Revenue 4.35%
American Samoa Economic Development Authority†
6.50%
9/1/2028
Ba3
2,750,000
2,847,768
City of Reno NV†
Zero Coupon
7/1/2058
NR
18,500,000
1,834,974
City of Sparks NV†
2.75%
6/15/2028
Ba1
730,000
667,756
County of Monongalia WV†
5.00%
6/1/2033
NR
500,000
498,451
County of Monongalia WV†
5.75%
6/1/2043
NR
1,000,000
1,012,551
County of Monongalia WV†
6.00%
6/1/2053
NR
1,750,000
1,794,572
Metropolitan Pier & Exposition Authority IL
5.50%
6/15/2053
A
9,150,000
9,193,055
144
See Notes to Financial Statements.
Schedule of Investments (continued)
HIGH INCOME MUNICIPAL BOND FUND September 30, 2023
Investments
Interest Rate
Maturity Date
Credit Rating: S&P or Moody’s(a)
Principal Amount
Fair Value
Tax Revenue (continued)
Metropolitan Pier & Exposition Authority IL (NATL)
Zero Coupon
12/15/2037
A
$
10,000,000
$
4,957,906
Monongalia County Commission Excise Tax District WV†
4.125%
6/1/2043
NR
5,380,000
4,560,776
New York Liberty Development Corp. TCRS (BAM)
3.00%
2/15/2042
AA
4,000,000
2,878,555
New York State Dormitory Authority
3.00%
3/15/2050
AA+
2,500,000
1,681,287
New York State Urban Development Corp.
3.00%
3/15/2047
AA+
3,740,000
2,611,584
Puerto Rico Sales Tax Financing Corp. Sales Tax Revenue
Zero Coupon
7/1/2033
NR
3,965,000
2,545,529
Puerto Rico Sales Tax Financing Corp. Sales Tax Revenue
4.329%
7/1/2040
NR
17,225,000
15,470,866
Puerto Rico Sales Tax Financing Corp. Sales Tax Revenue
4.329%
7/1/2040
NR
2,010,000
1,805,309
Puerto Rico Sales Tax Financing Corp. Sales Tax Revenue
4.75%
7/1/2053
NR
47,484,000
42,097,491
Puerto Rico Sales Tax Financing Corp. Sales Tax Revenue
4.784%
7/1/2058
NR
5,800,000
5,076,995
Puerto Rico Sales Tax Financing Corp. Sales Tax Revenue
5.00%
7/1/2058
NR
36,356,000
32,977,924
Territory of Guam
4.00%
1/1/2042
Ba1
5,000,000
4,061,177
Washington State Convention Center Public Facilities District
3.00%
7/1/2048
Baa3
6,710,000
4,373,356
Total
142,947,882
Taxable Revenue–Water & Sewer 0.64%
City of Chicago Waterworks Revenue IL (AGM)(f)
5.50%
11/1/2062
AA
20,290,000
21,184,876
Tobacco 7.34%
Buckeye Tobacco Settlement Financing Authority OH
Zero Coupon
6/1/2057
NR
63,000,000
6,155,818
Buckeye Tobacco Settlement Financing Authority OH
5.00%
6/1/2055
NR
80,275,000
69,250,890
California Statewide Financing Authority
Zero Coupon
6/1/2046
NR
26,325,000
5,964,787
California Statewide Financing Authority†
Zero Coupon
6/1/2055
NR
42,500,000
1,871,691
See Notes to Financial Statements.
145
Schedule of Investments (continued)
HIGH INCOME MUNICIPAL BOND FUND September 30, 2023
Investments
Interest Rate
Maturity Date
Credit Rating: S&P or Moody’s(a)
Principal Amount
Fair Value
Tobacco (continued)
District of Columbia Tobacco Settlement Financing Corp.
Zero Coupon
6/15/2046
NR
$
4,780,000
$
856,395
District of Columbia Tobacco Settlement Financing Corp.
Zero Coupon
6/15/2055
NR
21,000,000
1,843,376
District of Columbia Tobacco Settlement Financing Corp.
Zero Coupon
6/15/2055
NR
100,000,000
7,887,330
Erie Tobacco Asset Securitization Corp. NY†
Zero Coupon
6/1/2060
NR
30,000,000
1,554,096
Golden State Tobacco Securitization Corp. CA
Zero Coupon
6/1/2066
NR
240,000,000
20,849,880
Inland Empire Tobacco Securitization Corp. CA†
Zero Coupon
6/1/2057
CCC
47,000,000
2,889,259
Iowa Tobacco Settlement Authority
4.00%
6/1/2049
BBB+
4,000,000
3,425,010
Michigan Finance Authority
4.00%
6/1/2049
BBB+
4,005,000
3,424,179
Michigan Finance Authority
5.00%
6/1/2049
BBB+
2,350,000
2,354,047
Michigan Tobacco Settlement Finance Authority
Zero Coupon
6/1/2058
NR
103,300,000
3,773,198
Monroe Tobacco Asset Securitization Corp. NY†
Zero Coupon
6/1/2061
NR
22,900,000
936,798
Nassau County Tobacco Settlement Corp. NY
Zero Coupon
6/1/2060
NR
50,000,000
2,460,235
Nassau County Tobacco Settlement Corp. NY
5.00%
6/1/2035
CCC+
3,170,000
2,837,783
Nassau County Tobacco Settlement Corp. NY
5.25%
6/1/2026
CCC+
3,305,108
3,238,349
Rockland Tobacco Asset Securitization Corp. NY†
Zero Coupon
8/15/2060
NR
41,035,000
2,506,869
Silicon Valley Tobacco Securitization Authority CA
Zero Coupon
6/1/2036
NR
10,000,000
4,678,745
Silicon Valley Tobacco Securitization Authority CA
Zero Coupon
6/1/2056
NR
20,000,000
1,509,958
Tobacco Securitization Authority of Southern California–San Diego County Tobacco
Zero Coupon
6/1/2046
CCC-
15,000,000
2,507,581
Tobacco Securitization Authority of Southern California–San Diego County Tobacco
Zero Coupon
6/1/2054
NR
16,000,000
2,924,746
Tobacco Settlement Financing Corp. RI
Zero Coupon
6/1/2052
CCC-
25,885,000
3,861,164
Tobacco Settlement Financing Corp. VA
Zero Coupon
6/1/2047
CCC-
9,500,000
2,224,868
146
See Notes to Financial Statements.
Schedule of Investments (continued)
HIGH INCOME MUNICIPAL BOND FUND September 30, 2023
Investments
Interest Rate
Maturity Date
Credit Rating: S&P or Moody’s(a)
Principal Amount
Fair Value
Tobacco (continued)
Tobacco Settlement Financing Corp. VA
Zero Coupon
6/1/2047
CCC-
$
110,695,000
$
26,526,286
Tobacco Settlement Financing Corp. VA
5.00%
6/1/2047
B-
39,860,000
35,265,852
TSASC, Inc. NY
5.00%
6/1/2045
CCC+
7,170,000
6,338,164
TSASC, Inc. NY
5.00%
6/1/2048
NR
12,835,000
11,142,232
Total
241,059,586
Transportation 8.94%
Chicago O’Hare International Airport IL AMT
5.00%
1/1/2047
A+
5,000,000
4,892,003
City & County of Denver Airport System Revenue CO AMT
5.50%
11/15/2025
A+
3,410,000
3,411,524
City of Houston Airport System Revenue–United Airlines Inc TX AMT
4.75%
7/1/2024
BB-
1,410,000
1,407,352
City of Houston Airport System Revenue–United Airlines Inc TX AMT
5.00%
7/15/2028
BB-
3,500,000
3,488,493
City of Los Angeles Department of Airports CA AMT
4.00%
5/15/2049
AA-
5,000,000
4,257,438
City of Los Angeles Department of Airports CA AMT
5.00%
5/15/2040
AA
8,495,000
8,498,134
City of Reno NV†
Zero Coupon
7/1/2058
NR
26,000,000
2,837,146
City of Salt Lake City Airport Revenue UT AMT
5.50%
7/1/2053
A2
2,500,000
2,582,325
County of Miami-Dade Aviation Revenue FL AMT
5.00%
10/1/2044
A
5,000,000
4,914,673
E-470 Public Highway Authority CO (NATL)
Zero Coupon
9/1/2031
A+
20,000,000
14,142,292
Foothill-Eastern Transportation Corridor Agency CA
3.95%
1/15/2053
A
5,500,000
4,671,654
Greater Asheville Regional Airport Authority NC (AGM) AMT
5.25%
7/1/2048
AA
1,250,000
1,263,886
Greater Asheville Regional Airport Authority NC (AGM) AMT
5.25%
7/1/2053
AA
2,000,000
2,012,493
Greater Orlando Aviation Authority FL AMT
4.00%
10/1/2049
AA-
6,370,000
5,401,050
Maryland Economic Development Corp.–Consol Marine Terminals L
5.75%
9/1/2025
BB
9,000,000
9,075,735
Maryland Economic Development Corp.–Purple Line Transit Ptr AMT
5.25%
6/30/2047
Baa3
2,500,000
2,423,398
Maryland Economic Development Corp.–Purple Line Transit Ptr AMT
5.25%
6/30/2055
��
Baa3
12,610,000
12,035,420
See Notes to Financial Statements.
147
Schedule of Investments (continued)
HIGH INCOME MUNICIPAL BOND FUND September 30, 2023
Investments
Interest Rate
Maturity Date
Credit Rating: S&P or Moody’s(a)
Principal Amount
Fair Value
Transportation (continued)
Maryland Economic Development Corp. Tax Allocation
4.00%
9/1/2050
NR
$
12,350,000
$
9,408,305
Metropolitan Nashville Airport Authority TN AMT
5.50%
7/1/2052
A1
9,150,000
9,400,360
Metropolitan Transportation Authority NY
5.25%
11/15/2044
A3
12,500,000
12,461,726
Metropolitan Transportation Authority NY(f)
5.25%
11/15/2055
A3
21,710,000
21,867,185
New Jersey Transportation Trust Fund Authority
5.50%
6/15/2050
A2
2,000,000
2,108,760
New York Transportation Development Corp.–Delta Air Lines Inc AMT
4.00%
1/1/2036
Baa3
9,305,000
8,586,758
New York Transportation Development Corp.–Delta Air Lines Inc AMT
4.375%
10/1/2045
Baa3
19,765,000
17,244,443
New York Transportation Development Corp.–Delta Air Lines Inc AMT
5.00%
1/1/2036
Baa3
1,195,000
1,189,769
New York Transportation Development Corp.–Delta Air Lines Inc AMT
5.00%
10/1/2040
Baa3
8,480,000
8,151,375
New York Transportation Development Corp.–Laguardia Gateway Partner AMT
4.00%
7/1/2041
Baa2
5,000,000
4,220,923
New York Transportation Development Corp.–Laguardia Gateway Partner AMT
5.25%
1/1/2050
Baa2
13,730,000
13,476,066
North Parkway Municipal Management District No. 1 TX†
4.75%
9/15/2041
NR
2,930,000
2,598,408
North Parkway Municipal Management District No. 1 TX†
5.00%
9/15/2051
NR
4,875,000
4,173,907
Port Authority of New York & New Jersey AMT
5.00%
11/15/2041
AA-
10,500,000
10,525,392
Port Authority of New York & New Jersey AMT
5.00%
12/1/2053
Aa3
7,075,000
7,034,683
Port Authority of New York & New Jersey AMT
5.25%
8/1/2047
AA-
5,000,000
5,119,657
Port Authority of New York & New Jersey AMT
5.50%
8/1/2052
AA-
3,500,000
3,644,478
Port of Portland Airport Revenue OR AMT
5.50%
7/1/2048
AA-
6,250,000
6,462,466
Puerto Rico Highway & Transportation Authority
Zero Coupon
7/1/2032
NR
462,833
299,106
Puerto Rico Highway & Transportation Authority
5.00%
7/1/2053
NR
791,717
491,856
Puerto Rico Highway & Transportation Authority
5.00%
7/1/2062
NR
15,712,199
15,044,431
Regional Transportation District–Denver Transit Partners CO
3.00%
7/15/2037
Baa1
3,825,000
3,046,967
148
See Notes to Financial Statements.
Schedule of Investments (continued)
HIGH INCOME MUNICIPAL BOND FUND September 30, 2023
Investments
Interest Rate
Maturity Date
Credit Rating: S&P or Moody’s(a)
Principal Amount
Fair Value
Transportation (continued)
San Diego Cnty Regional Arpt Auth CA(f)
5.00%
7/1/2056
A2
$
17,000,000
$
17,542,273
San Diego County Regional Airport Authority CA AMT
4.00%
7/1/2046
A2
4,500,000
3,843,978
San Diego County Regional Airport Authority CA AMT
5.00%
7/1/2056
A2
5,000,000
4,899,744
Texas Private Activity Bond Surface Transportation Corp. AMT
5.50%
12/31/2058
Baa1
5,000,000
5,099,021
Virginia Small Business Financing Authority–95 Express Lanes LLC AMT
4.00%
1/1/2048
BBB
7,205,000
6,000,947
Virginia Small Business Financing Authority–95 Express Lanes LLC AMT
5.00%
7/1/2037
BBB
2,355,000
2,395,794
Total
293,653,794
Utilities 7.47%
Baltimore Proj Revenue MD(f)
5.25%
7/1/2047
AA-
7,195,000
7,526,034
Baltimore Proj Revenue MD(f)
5.25%
7/1/2052
AA-
12,190,000
12,750,849
Black Belt Energy Gas District AL
4.00%
#(b)
10/1/2052
A2
4,100,000
3,986,284
Black Belt Energy Gas District AL
4.00%
#(b)
12/1/2052
Baa1
6,100,000
5,700,568
Black Belt Energy Gas District AL
5.50%
#(b)
6/1/2049
A2
9,450,000
9,642,120
Black Belt Energy Gas District AL
5.50%
#(b)
11/1/2053
A2
16,335,000
16,692,761
Charlotte County Industrial Development Authority–Mskp Town And Cntry Util FL†
5.00%
10/1/2034
NR
1,000,000
951,586
Charlotte County Industrial Development Authority–Mskp Town And Cntry Util FL†
5.00%
10/1/2049
NR
5,500,000
4,834,002
City of Compton Water Revenue CA
6.00%
8/1/2039
NR
3,710,000
3,452,018
County of Jefferson Sewer Revenue AL
Zero Coupon
10/1/2039
BBB
5,000,000
5,257,196
County of Jefferson Sewer Revenue AL
Zero Coupon
10/1/2046
BBB
5,445,000
5,725,573
County of Jefferson Sewer Revenue AL
6.00%
10/1/2042
BBB
7,175,000
7,458,623
County of Jefferson Sewer Revenue AL
6.50%
10/1/2053
BBB
26,800,000
28,149,474
County of Jefferson Sewer Revenue AL (AGM)
Zero Coupon
10/1/2028
AA
4,035,000
3,004,238
County of Jefferson Sewer Revenue AL (AGM)
5.00%
10/1/2044
AA
5,070,000
4,983,478
Florida Development Finance Corp.–Waste Pro Usa Inc AMT†
5.25%
8/1/2029
NR
7,000,000
6,603,101
Florida Development Finance Corp.–Waste Pro USA Inc AMT
3.00%
6/1/2032
NR
4,250,000
3,273,963
Main Street Natural Gas, Inc. GA
4.00%
#(b)
5/1/2052
A3
2,115,000
2,020,929
Main Street Natural Gas, Inc. GA†
4.00%
#(b)
8/1/2052
BBB-
33,000,000
31,123,993
Main Street Natural Gas, Inc. GA
4.00%
#(b)
9/1/2052
A3
2,165,000
2,045,039
See Notes to Financial Statements.
149
Schedule of Investments (continued)
HIGH INCOME MUNICIPAL BOND FUND September 30, 2023
Investments
Interest Rate
Maturity Date
Credit Rating: S&P or Moody’s(a)
Principal Amount
Fair Value
Utilities (continued)
Main Street Natural Gas, Inc. GA
5.00%
#(b)
12/1/2052
A3
$
9,000,000
$
8,987,593
Montgomery County Industrial Development Authority–Constellation Energy Gen PA
4.10%
#(b)
4/1/2053
BBB
8,000,000
7,980,486
Municipal Electric Authority of Georgia (AGM)
5.00%
7/1/2048
AA
1,100,000
1,111,864
Municipal Electric Authority of Georgia (AGM)
5.00%
7/1/2048
AA
1,750,000
1,768,874
Municipal Electric Authority of Georgia (AGM)
5.00%
7/1/2053
AA
2,300,000
2,313,956
Municipal Electric Authority of Georgia (AGM)
5.00%
7/1/2055
AA
2,350,000
2,362,524
Northern Palm Beach County Improvement District FL
5.00%
8/1/2034
NR
2,000,000
1,970,305
Patriots Energy Group Financing Agency SC
5.25%
#(b)
10/1/2054
A1
15,000,000
15,107,479
Puerto Rico Commonwealth Aqueduct & Sewer Authority†
4.00%
7/1/2042
NR
11,250,000
9,383,498
Puerto Rico Commonwealth Aqueduct & Sewer Authority†
5.00%
7/1/2047
NR
11,500,000
10,713,025
Puerto Rico Electric Power Authority(d)
5.25%
7/1/2026
NR
7,500,000
1,893,750
Puerto Rico Electric Power Authority(d)
5.25%
7/1/2031
NR
5,895,000
1,488,488
Puerto Rico Electric Power Authority(d)
5.25%
7/1/2040
NR
7,500,000
1,893,750
Puerto Rico Electric Power Authority(d)
6.75%
7/1/2036
NR
10,000,000
2,525,000
Southeast Energy Authority A Cooperative District AL
4.00%
#(b)
12/1/2051
A1
6,000,000
5,584,322
Southeast Energy Authority A Cooperative District AL
5.50%
#(b)
1/1/2053
A1
5,000,000
5,133,584
Total
245,400,327
Total Municipal Bonds (cost $3,639,680,641)
3,278,970,813
150
See Notes to Financial Statements.
Schedule of Investments (continued)
HIGH INCOME MUNICIPAL BOND FUND September 30, 2023
Investments
Interest Rate#
Interest Rate Reset Date(h)
Final Maturity Date
Credit Rating: S&P or Moody’s(a)
Principal Amount
Fair Value
SHORT-TERM INVESTMENTS 0.79%
VARIABLE RATE DEMAND NOTES 0.79%
General Obligation 0.75%
City of New York NY GO
4.170%
10/2/2023
4/1/2042
AA
$
7,030,000
$
7,030,000
City of New York NY GO
4.170%
10/2/2023
4/1/2042
AA
5,900,000
5,900,000
City of New York NY GO
4.250%
10/2/2023
10/1/2046
AA
7,830,000
7,830,000
City of New York NY GO
4.800%
10/2/2023
6/1/2044
AA
3,865,000
3,865,000
Total
24,625,000
Tax Revenue 0.04%
New York City Transitional Finance Authority Future Tax Secured Revenue
4.800%
10/2/2023
5/1/2034
AAA
1,425,000
1,425,000
Total Short-Term Investments (cost $26,050,000)
26,050,000
Total Investments in Securities 100.69% (cost $3,668,480,858)
3,307,735,813
Other Assets and Liabilities – Net(i) (0.69)%
(22,596,006
)
Net Assets 100.00%
$
3,285,139,807
AGM
Insured by–Assured Guaranty Municipal Corporation.
AMT
Income from the security may be subject to Alternative Minimum Tax.
BAM
Insured by–Build America Mutual.
COPS
Certificates of Participation.
FNMA
Federal National Mortgage Association.
GTD
Guaranteed.
NATL
National Public Finance Guarantee Corporation.
NR
Not Rated.
SIFMA
Insured by–Securities Industry and Financial Markets Association.
SONYMA
State of New York Mortgage Association.
TCRS
Transferable Custodial Receipts.
TRIPS
Tax Refund Intercept Programs.
†
Security was purchased pursuant to Rule 144A under the Securities Act of 1933 and, unless registered under such Act or exempted from registration, may only be resold to qualified institutional buyers. At September 30, 2023, the total value of Rule 144A securities was $936,387,035, which represents 28.50% of net assets.
#
Variable rate security. The interest rate represents the rate in effect at September 30, 2023.
(a)
Unaudited.
(b)
Variable Rate is Fixed to Float: Rate remains fixed or at Zero Coupon until designated future date.
(c)
This investment has been rated by Fitch IBCA.
(d)
Defaulted (non-income producing security).
(e)
Level 3 Investment as described in Note 2(i) in the Notes to Financials. Security valued utilizing third party pricing information without adjustment. Such valuations are based on unobservable inputs. A significant change in third party information could result in a significantly lower or higher value of such Level 3 investments.
(f)
Municipal Bonds Held in Trust–Securities represent underlying bonds transferred to a separate securitization trust established in a tender option bond transaction in which the Fund acquired the residual interest certificates. These securities serve as collateral in a financing transaction. See Note 2(h) to Financial Statements for details of Municipal Bonds Held in Trust.
(g)
Securities purchased on a when-issued basis (See Note 2(g)).
(h)
The interest rate reset date shown represents the date in which the Fund has the right to sell a Variable Rate Demand Note (“VRDN”) back to the issuer for Principal Amount. The interest rate on the VRDN is generally reset daily based on the SIFMA Municipal Swap Index.
(i)
Other Assets and Liabilities–Net include net unrealized appreciation/depreciation on futures contracts as follows:
See Notes to Financial Statements.
151
Schedule of Investments (continued)
HIGH INCOME MUNICIPAL BOND FUND September 30, 2023
Futures Contracts at September 30, 2023:
Type
Expiration
Contracts
Position
Notional Amount
Notional Value
Unrealized Appreciation
U.S. Long Bond
December 2023
394
Short
$(46,691,507
)
$(44,829,813
)
$1,861,694
The following is a summary of the inputs used as of September 30, 2023 in valuing the Fund’s investments carried at fair value(1):
Investment Type(2)
Level 1
Level 2
Level 3
Total
Long-Term Investments
Corporate Bonds
$
–
$
2,715,000
$
–
$
2,715,000
Municipal Bonds(3)
Corporate-Backed
–
668,780,119
12,430,154
681,210,273
Education
–
242,589,918
25,471
242,615,389
General Obligation
–
422,267,414
4,440,490
426,707,904
Health Care
–
453,560,604
32,761,537
486,322,141
Other Revenue
–
161,370,277
10,482,520
171,852,797
Special Tax
–
136,432,252
353,650
136,785,902
Remaining Industries
–
1,133,476,407
–
1,133,476,407
Short-Term Investments
Variable Rate Demand Notes
–
26,050,000
–
26,050,000
Total
$
–
$
3,247,241,991
$
60,493,822
$
3,307,735,813
Other Financial Instruments
Futures Contracts
Assets
$
1,861,694
$
–
$
–
$
1,861,694
Liabilities
–
–
–
–
Total
$
1,861,694
$
–
$
–
$
1,861,694
(1)
Refer to Note 2(i) for a description of fair value measurements and the three-tier hierarchy of inputs.
(2)
See Schedule of Investments for fair values in each industry. The table above is presented by Investment Type. Industries are presented within an Investment Type should such Investment Type include securities classified as two or more levels within the three-tier fair value hierarchy. When applicable, each Level 3 security is identified on the Schedule of Investments along with the valuation technique utilized.
(3)
Includes Municipal Bonds held in the Trust (See Note 2(h)).
A reconciliation of Level 3 investments is presented when the Fund has a material amount of Level 3 investments at the beginning or end of the year in relation to the Fund’s net assets.
152
See Notes to Financial Statements.
Schedule of Investments (concluded)
HIGH INCOME MUNICIPAL BOND FUND September 30, 2023
The following is a reconciliation of investments with unobservable inputs (Level 3) that were used in determining fair value:
Investment Type
Municipal Bonds
Balance as of October 1, 2022
$
99,330,812
Accrued Discounts (Premiums)
(41,172
)
Realized Gain (Loss)
(4,078,009
)
Change in Unrealized Appreciation (Depreciation)
(633,862
)
Purchases
12,363,787
Sales
(20,475,803
)
Transfers into Level 3(a)
24,176,503
Transfers out of Level 3(a)
(50,148,434
)
Balance as of September 30, 2023
$
60,493,822
Change in unrealized appreciation/depreciation for the year ended September 30, 2023, related to Level 3 investments held at September 30, 2023
$
(3,681,046
)
(a)
The Fund recognizes transfers within the fair value hierarchy as of the beginning of the period. Transfers into and out of Level 3 were primarily related to the availability of market quotations in accordance with valuation methodology.
See Notes to Financial Statements.
153
Schedule of Investments
SHORT DURATION HIGH INCOME MUNICIPAL BOND FUND September 30, 2023
Investments
Interest Rate
Maturity Date
Credit Rating: S&P or Moody’s(a)
Principal Amount
Fair Value
LONG-TERM INVESTMENTS 98.01%
CORPORATE BONDS 0.20%
Health Care Services 0.20%
Care New England Health System (cost $1,833,478)
5.50%
9/1/2026
$
2,000,000
$
1,810,000
MUNICIPAL BONDS 97.81%
Airlines 0.62%
New Jersey Economic Development Authority–Port Newark Container AMT
5.00%
10/1/2026
Baa2
2,135,000
2,154,471
New Jersey Economic Development Authority–Port Newark Container AMT
5.00%
10/1/2027
Baa2
3,355,000
3,404,675
Total
5,559,146
Corporate-Backed 31.61%
Allegheny County Industrial Development Authority–US Steel Corporation PA
5.125%
5/1/2030
BB-
10,485,000
10,510,661
Avenir Community Development District FL
4.50%
5/1/2030
NR
2,000,000
1,949,921
Black Belt Energy Gas District AL
4.00%
#(b)
10/1/2052
A2
19,670,000
19,124,441
Boggy Creek Improvement District FL
4.50%
5/1/2033
NR
1,075,000
1,033,720
Calhoun County Navigation Industrial Development Authority–Max Midstream Texas LLC AMT†
3.625%
7/1/2026
NR
2,500,000
2,276,143
California Municipal Finance Authority AMT
4.00%
7/15/2029
BB-
7,700,000
7,380,398
Chandler Industrial Development Authority–Intel Corporation AZ AMT
5.00%
#(b)
6/1/2049
A
3,155,000
3,158,030
Chandler Industrial Development Authority–Intel Corporation AZ AMT
5.00%
#(b)
9/1/2052
A
11,000,000
11,126,230
City of Farmington–Public Service Co of NM
3.90%
#(b)
6/1/2040
BBB
4,500,000
4,370,299
City of Henderson–Pratt Paper LLC KY AMT†
3.70%
1/1/2032
NR
5,230,000
4,961,494
City of Houston Airport System Revenue–United Airlines Inc TX AMT
5.00%
7/1/2029
BB-
2,465,000
2,428,585
City of Houston Airport System Revenue–United Airlines Inc TX AMT
6.50%
7/15/2030
BB-
4,000,000
4,000,415
City of Valparaiso–Pratt Paper LLC IN AMT
5.875%
1/1/2024
NR
170,000
170,944
County of Clark–Southern CA Edison Co NV
2.10%
6/1/2031
A2
5,060,000
3,947,538
154
See Notes to Financial Statements.
Schedule of Investments (continued)
SHORT DURATION HIGH INCOME MUNICIPAL BOND FUND September 30, 2023
Investments
Interest Rate
Maturity Date
Credit Rating: S&P or Moody’s(a)
Principal Amount
Fair Value
Corporate-Backed (continued)
Downtown Doral South Community Development District FL†
3.875%
12/15/2023
NR
$
50,000
$
49,904
Florida Development Finance Corp.–Waste pro USA Inc AMT†
6.125%
#(b)
7/1/2032
NR
3,375,000
3,359,088
Florida Development Finance Corp.–Waste Pro USA Inc AMT†
Capital Trust Agency, Inc.–Franklin Acad Ser 2020 Oblig FL†
4.00%
12/15/2023
NR
370,000
368,881
Capital Trust Agency, Inc.–Franklin Acad Ser 2020 Oblig FL†
4.00%
12/15/2025
NR
300,000
289,717
Capital Trust Agency, Inc.–Franklin Acad Ser 2020 Oblig FL†
5.00%
12/15/2026
NR
300,000
293,428
Capital Trust Agency, Inc.–Franklin Acad Ser 2020 Oblig FL†
5.00%
12/15/2027
NR
660,000
645,063
Capital Trust Agency, Inc.–Franklin Acad Ser 2020 Oblig FL†
5.00%
12/15/2028
NR
690,000
673,254
164
See Notes to Financial Statements.
Schedule of Investments (continued)
SHORT DURATION HIGH INCOME MUNICIPAL BOND FUND September 30, 2023
Investments
Interest Rate
Maturity Date
Credit Rating: S&P or Moody’s(a)
Principal Amount
Fair Value
Other Revenue (continued)
Capital Trust Agency, Inc.–Franklin Acad Ser 2020 Oblig FL†
5.00%
12/15/2029
NR
$
730,000
$
709,834
Cleveland-Cuyahoga County Port Authority–Playhouse Square Fdtn OH
5.00%
12/1/2028
BB+
3,045,000
3,027,038
Clifton Higher Education Finance Corp.–Intl American Edu Fed TX
5.25%
8/15/2026
Baa3
1,600,000
1,588,682
Clifton Higher Education Finance Corp.–Intl American Edu Fed TX
5.25%
8/15/2028
Baa3
3,040,000
3,019,086
Florida Development Finance Corp.–Renaissance Chtr 2020 C/D†
4.00%
9/15/2030
NR
470,000
421,407
Florida Development Finance Corp.–Renaissance Chtr Sch 2015†
5.00%
6/15/2025
NR
130,000
128,638
George L Smith II Congress Center Authority–Signia Hotel Mgmt LLC GA†
3.625%
1/1/2031
NR
1,850,000
1,560,967
(c)
Industrial Development Authority of the County of Pima–Edkey Oblig Group AZ†
3.50%
7/1/2025
NR
515,000
497,149
Jefferson Parish Economic Development & Port District–Kenner Discovery Hlth Sci LA†
4.80%
6/15/2029
NR
2,225,000
2,150,550
Maryland Economic Development Corp.(e)
5.00%
12/1/2031
NR
1,500,000
900,000
Puerto Rico Electric Power Authority(e)
5.00%
7/1/2018
NR
50,000
12,500
Utah Charter School Finance Authority–Freedom Academy Fndtn†
3.25%
6/15/2031
NR
540,000
466,997
Utah Charter School Finance Authority–Freedom Academy Fndtn†
4.50%
6/15/2027
NR
1,945,000
1,874,870
Washington State Convention Center Public Facilities District
4.00%
7/1/2031
NR
7,600,000
7,006,495
Total
25,955,116
Pollution Control 0.26%
Matagorda County Navigation District No. 1–Aep Texas Inc
4.00%
6/1/2030
A-
1,000,000
950,086
Mississippi Business Finance Corp.–Waste Pro USA Inc AMT†
5.00%
#(b)
2/1/2036
NR
1,500,000
1,428,052
Total
2,378,138
Power 0.16%
Chesapeake Economic Development Authority–Virginia Elec & Pwr Co
3.65%
#(b)
2/1/2032
A2
1,520,000
1,473,211
See Notes to Financial Statements.
165
Schedule of Investments (continued)
SHORT DURATION HIGH INCOME MUNICIPAL BOND FUND September 30, 2023
Investments
Interest Rate
Maturity Date
Credit Rating: S&P or Moody’s(a)
Principal Amount
Fair Value
Special Tax 3.40%
Allentown Neighborhood Improvement Zone Development Authority PA†
5.00%
5/1/2028
NR
$
1,220,000
$
1,222,127
Allentown Neighborhood Improvement Zone Development Authority PA†
5.00%
5/1/2032
Ba3
2,000,000
2,011,741
Allentown Neighborhood Improvement Zone Development Authority PA†
6.00%
5/1/2042
NR
3,850,000
3,845,501
Babcock Ranch Community Independent Special District FL
4.125%
5/1/2027
NR
1,225,000
1,195,955
Babcock Ranch Community Independent Special District FL
4.25%
5/1/2032
NR
2,000,000
1,890,464
Celebration Pointe Community Development District No. 1 FL
2.375%
5/1/2026
NR
430,000
403,007
Celebration Pointe Community Development District No. 1 FL
3.00%
5/1/2031
NR
665,000
575,071
City of Baltimore MD
4.50%
6/1/2033
NR
400,000
379,301
Industrial Development Authority of the City of St. Louis Missouri
3.875%
11/15/2029
NR
1,090,000
926,330
Lakewood Ranch Stewardship District FL(f)
5.40%
5/1/2028
NR
1,000,000
1,001,354
Lakewood Ranch Stewardship District FL(f)
5.45%
5/1/2033
NR
2,680,000
2,688,105
Military Installation Development Authority UT
4.00%
6/1/2036
NR
2,750,000
2,213,997
New York City Industrial Development Agency–Yankee Stadium LLC NY (FGIC)
4.048% (CPI YoY * 1 + 0.87%
)
3/1/2025
Baa1
1,585,000
1,580,086
New York City Industrial Development Agency–Yankee Stadium LLC NY (FGIC)
4.058% (CPI YoY * 1 + .88%
)
3/1/2026
Baa1
1,350,000
1,346,058
Peninsula Town Center Community Development Authority VA†
4.50%
9/1/2028
NR
680,000
660,219
Plaza at Noah’s Ark Community Improvement District MO
3.00%
5/1/2030
NR
2,200,000
1,936,591
Scranton Redevelopment Authority PA GTD
5.00%
11/15/2028
BBB-
225,000
222,293
Village Community Development District No. 12 FL
4.00%
5/1/2033
NR
1,335,000
1,272,984
Village Metropolitan District CO GO
4.15%
12/1/2030
NR
3,510,000
3,242,015
West Villages Improvement District FL
4.00%
5/1/2024
NR
190,000
189,154
West Villages Improvement District FL
4.25%
5/1/2029
NR
940,000
912,884
166
See Notes to Financial Statements.
Schedule of Investments (continued)
SHORT DURATION HIGH INCOME MUNICIPAL BOND FUND September 30, 2023
Investments
Interest Rate
Maturity Date
Credit Rating: S&P or Moody’s(a)
Principal Amount
Fair Value
Special Tax (continued)
Westview South Community Development District FL
4.75%
5/1/2028
NR
$
225,000
$
220,286
Westview South Community Development District FL
4.875%
5/1/2028
NR
705,000
692,294
Total
30,627,817
Tax Revenue 1.89%
American Samoa Economic Development Authority†
6.50%
9/1/2028
Ba3
1,000,000
1,035,552
City of Sparks NV†
2.75%
6/15/2028
Ba1
4,900,000
4,482,197
Matching Fund Special Purpose Securitization Corp. VI
5.00%
10/1/2026
NR
3,930,000
3,948,239
Matching Fund Special Purpose Securitization Corp. VI
5.00%
10/1/2027
NR
1,000,000
1,004,038
Matching Fund Special Purpose Securitization Corp. VI
5.00%
10/1/2028
NR
1,050,000
1,051,958
Matching Fund Special Purpose Securitization Corp. VI
5.00%
10/1/2032
NR
2,535,000
2,515,307
Puerto Rico Sales Tax Financing Corp. Sales Tax Revenue
4.329%
7/1/2040
NR
27,000
24,250
Puerto Rico Sales Tax Financing Corp. Sales Tax Revenue
4.50%
7/1/2034
NR
3,030,000
2,924,570
Puerto Rico Sales Tax Financing Corp. Sales Tax Revenue
4.536%
7/1/2053
NR
1,000
855
Puerto Rico Sales Tax Financing Corp. Sales Tax Revenue
4.75%
7/1/2053
NR
19,000
16,845
Total
17,003,811
Taxable Revenue–Water & Sewer 0.49%
Jersey City Municipal Utilities Authority NJ
4.00%
5/3/2024
NR
3,000,000
2,998,833
New Jersey Economic Development Authority–New Jersey Amern Wtr Co AMT
3.75%
#(b)
11/1/2034
A+
1,500,000
1,425,803
Total
4,424,636
Tobacco 1.27%
Nassau County Tobacco Settlement Corp. NY
5.00%
6/1/2035
CCC+
850,000
760,920
Nassau County Tobacco Settlement Corp. NY
5.25%
6/1/2026
CCC+
6,895,281
6,756,005
TSASC, Inc. NY
5.00%
6/1/2025
B-
3,850,000
3,880,247
Total
11,397,172
See Notes to Financial Statements.
167
Schedule of Investments (continued)
SHORT DURATION HIGH INCOME MUNICIPAL BOND FUND September 30, 2023
Investments
Interest Rate
Maturity Date
Credit Rating: S&P or Moody’s(a)
Principal Amount
Fair Value
Transportation 10.64%
91 Express Lanes Toll Road CA
5.00%
8/15/2029
AA-
$
1,550,000
$
1,550,039
Central Texas Turnpike System
5.00%
8/15/2031
A-
3,000,000
2,998,093
City & County of Denver–United Airlines Inc CO AMT
5.00%
10/1/2032
BB-
9,040,000
8,797,542
County of Miami–Dade Aviation Revenue FL AMT
5.00%
10/1/2032
A3
2,905,000
3,048,575
County of Miami–Dade Aviation Revenue FL AMT
5.00%
10/1/2036
A3
1,300,000
1,328,369
County of Miami-Dade Aviation Revenue FL AMT
5.00%
10/1/2032
A1
7,650,000
7,644,123
E-470 Public Highway Authority CO
3.908% (SOFR * .67 + .35%
)#
9/1/2039
A+
1,800,000
1,793,486
Maryland Economic Development Corp.–Consol Marine Terminals L
5.75%
9/1/2025
BB
13,890,000
14,006,884
Metropolitan Transportation Authority NY
5.00%
11/15/2031
A3
1,850,000
1,862,426
New York Transportation Development Corp.–Delta Air Lines Inc AMT
4.00%
10/1/2030
Baa3
13,945,000
13,465,553
New York Transportation Development Corp.–Delta Air Lines Inc AMT
5.00%
1/1/2036
Baa3
5,000,000
4,978,114
New York Transportation Development Corp.–Empire St Thruway Partnrs AMT
2.50%
10/31/2031
BBB-
(d)
1,365,000
1,096,934
New York Transportation Development Corp.–Laguardia Gateway Partner (AGM) AMT
4.00%
7/1/2031
AA
3,925,000
3,765,705
New York Transportation Development Corp.–Laguardia Gateway Partner AMT
5.00%
7/1/2034
Baa2
5,000,000
4,955,651
North Parkway Municipal Management District No. 1 TX†
3.625%
9/15/2026
NR
500,000
473,806
North Parkway Municipal Management District No. 1 TX†
4.25%
9/15/2031
NR
1,500,000
1,398,930
Pennsylvania Turnpike Commission
4.83% (MUNIPSA * 1 + .85%
)#
7/15/2041
A1
5,000,000
5,000,884
Port of Portland Airport Revenue OR AMT
5.00%
7/1/2029
AA-
3,745,000
3,882,429
Public Finance Authority–Air Cargo Oblig Group WI AMT
5.00%
7/1/2032
BBB
1,845,000
1,848,707
Puerto Rico Highway & Transportation Authority
Zero Coupon
7/1/2032
NR
5,133,000
3,317,201
Texas Private Activity Bond Surface Transportation Corp.–NTE Mobility Partners Segm AMT
7.00%
12/31/2038
Baa2
8,560,000
8,576,460
Total
95,789,911
168
See Notes to Financial Statements.
Schedule of Investments (continued)
SHORT DURATION HIGH INCOME MUNICIPAL BOND FUND September 30, 2023
Investments
Interest Rate
Maturity Date
Credit Rating: S&P or Moody’s(a)
Principal Amount
Fair Value
Utilities 7.97%
Black Belt Energy Gas District AL
4.00%
#(b)
12/1/2052
Baa1
$
2,875,000
$
2,686,743
Black Belt Energy Gas District AL
5.50%
#(b)
6/1/2049
A2
2,350,000
2,397,776
Charlotte County Industrial Development Authority–Mskp Town And Cntry Util FL†
5.00%
10/1/2029
NR
785,000
764,250
Charlotte County Industrial Development Authority–Mskp Town And Cntry Util FL†
5.00%
10/1/2034
NR
1,000,000
951,586
Chautauqua County Capital Resource Corp.–NRG Energy Inc NY
4.25%
#(b)
4/1/2042
BBB-
1,500,000
1,448,035
Florida Development Finance Corp.–Waste Pro USA Inc AMT
3.00%
6/1/2032
NR
7,910,000
6,093,423
Main Street Natural Gas, Inc. GA†
4.00%
#(b)
8/1/2052
BBB-
23,600,000
22,258,371
Main Street Natural Gas, Inc. GA
4.00%
#(b)
9/1/2052
A3
1,190,000
1,124,063
Main Street Natural Gas, Inc. GA
5.258% (SOFR * .67 + 1.70%
)#
12/1/2053
Aa1
5,000,000
4,967,879
Northern Palm Beach County Improvement District FL
5.00%
8/1/2034
NR
2,700,000
2,659,912
Puerto Rico Electric Power Authority(e)
4.10%
7/1/2019
NR
240,000
60,000
Puerto Rico Electric Power Authority(e)
4.25%
7/1/2020
NR
970,000
242,500
Puerto Rico Electric Power Authority(e)
5.25%
7/1/2026
NR
10,000,000
2,525,000
Southeast Energy Authority A Cooperative District AL
5.978% (SOFR * .67 + 2.42%
)#
1/1/2053
A1
10,000,000
10,115,961
Tennergy Corp. TN
5.50%
#(b)
10/1/2053
Baa1
13,195,000
13,409,238
Total
71,704,737
Total Municipal Bonds (cost $914,481,909)
880,591,979
Interest Rate#
Interest Rate Reset Date(g)
Final Maturity Date
SHORT-TERM INVESTMENTS 1.74%
VARIABLE RATE DEMAND NOTES 1.74%
General Obligation
City of New York NY GO
4.170%
10/2/2023
4/1/2042
AA
1,400,000
1,400,000
City of New York NY GO
4.750%
10/2/2023
3/1/2040
AA
14,215,000
14,215,000
Total Short-Term Investments (cost $15,615,000)
15,615,000
Total Investments in Securities 99.75% (cost $931,930,387)
898,016,979
Other Assets and Liabilities – Net 0.25%
2,262,293
Net Assets 100.00%
$
900,279,272
See Notes to Financial Statements.
169
Schedule of Investments (continued)
SHORT DURATION HIGH INCOME MUNICIPAL BOND FUND September 30, 2023
AGM
Insured by–Assured Guaranty Municipal Corporation.
AMT
Income from the security may be subject to Alternative Minimum Tax.
BAM
Insured by–Build America Mutual.
COPS
Certificates of Participation.
CPI
Consumer Price Index: Rate fluctuates based on CPI.
FGIC
Insured by–Financial Guaranty Insurance Company.
FHA
Insured by–Federal Housing Administration.
GTD
Guaranteed.
HUD
Insured by–Department of Housing and Urban Development.
LIBOR
London Interbank Offered Rate.
MUNIPSA
SIFMA Municipal Swap Index Yield
NR
Not Rated.
SIFMA
Insured by–Securities Industry and Financial Markets Association.
SOFR
Secured Overnight Financing Rate.
TRIPS
Tax Refund Intercept Programs.
YoY
Year on Year Inflation Rates.
#
Variable rate security. The interest rate represents the rate in effect at September 30, 2023.
†
Security was purchased pursuant to Rule 144A under the Securities Act of 1933 and, unless registered under such Act or exempted from registration, may only be resold to qualified institutional buyers. At September 30, 2023, the total value of Rule 144A securities was $195,063,449, which represents 21.67% of net assets.
(a)
Unaudited.
(b)
Variable Rate is Fixed to Float: Rate remains fixed or at Zero Coupon until designated future date.
(c)
Level 3 Investment as described in Note 2(i) in the Notes to Financials. Security valued utilizing third party pricing information without adjustment. Such valuations are based on unobservable inputs. A significant change in third party information could result in a significantly lower or higher value of such Level 3 investments.
(d)
This investment has been rated by Fitch IBCA.
(e)
Defaulted (non-income producing security).
(f)
Securities purchased on a when-issued basis (See Note 2(g)).
(g)
The interest rate reset date shown represents the date in which the Fund has the right to sell a Variable Rate Demand Note (“VRDN”) back to the issuer for Principal Amount. The interest rate on the VRDN is generally reset daily based on the SIFMA Municipal Swap Index.
The following is a summary of the inputs used as of September 30, 2023 in valuing the Fund’s investments carried at fair value(1):
Investment Type(2)
Level 1
Level 2
Level 3
Total
Long-Term Investments
Corporate Bonds
$
–
$
1,810,000
$
–
$
1,810,000
Municipal Bonds
Corporate-Backed
–
276,396,712
8,144,925
284,541,637
Health Care
–
100,843,960
5,176,130
106,020,090
Other Revenue
–
24,394,149
1,560,967
25,955,116
Remaining Industries
–
464,075,136
–
464,075,136
Short-Term Investments
Variable Rate Demand Notes
–
15,615,000
–
15,615,000
Total
$
–
$
883,134,957
$
14,882,022
$
898,016,979
(1)
Refer to Note 2(i) for a description of fair value measurements and the three-tier hierarchy of inputs.
(2)
See Schedule of Investments for fair values in each industry. The table above is presented by Investment Type. Industries are presented within an Investment Type should such Investment Type include securities classified as two or more levels within the three-tier fair value hierarchy. When applicable, each Level 3 security is identified on the Schedule of Investments along with the valuation technique utilized.
A reconciliation of Level 3 investments is presented when the Fund has a material amount of Level 3 investments at the beginning or end of the year in relation to the Fund’s net assets.
170
See Notes to Financial Statements.
Schedule of Investments (concluded)
SHORT DURATION HIGH INCOME MUNICIPAL BOND FUND September 30, 2023
The following is a reconciliation of investments with unobservable inputs (Level 3) that were used in determining fair value:
Investment Type
Municipal Bonds
Balance as of October 1, 2022
$
21,044,477
Accrued Discounts (Premiums)
(44,379
)
Realized Gain (Loss)
(346,002
)
Change in Unrealized Appreciation (Depreciation)
96,712
Purchases
6,424,808
Sales
(6,804,766
)
Transfers into Level 3(a)
8,705,222
Transfers out of Level 3(a)
(14,194,050
)
Balance as of September 30, 2023
$
14,882,022
Change in unrealized appreciation/depreciation for the year ended September 30, 2023, related to Level 3 investments held at September 30, 2023
$
(287,311
)
(a)
The Fund recognizes transfers within the fair value hierarchy as of the beginning of the period. Transfers into and out of Level 3 were primarily related to the availability of market quotations in accordance with valuation methodology.
See Notes to Financial Statements.
171
Schedule of Investments
SUSTAINABLE MUNICIPAL BOND FUND September 30, 2023
Investments
Interest Rate
Maturity Date
Credit Rating: S&P or Moody’s(a)
Principal Amount
Fair Value
LONG-TERM INVESTMENTS 98.69%
MUNICIPAL BONDS 98.69%
Corporate-Backed 2.38%
Michigan Strategic Fund–Graphic Packaging Intl AMT
4.00%
#(b)
10/1/2061
BB
$
125,000
$
122,753
Education 27.64%
Build NYC Resource Corp.–E Harlem Scholars Oblig Gp NY†
5.00%
6/1/2032
BB+
100,000
99,924
California Community Choice Financing Authority
4.00%
#(b)
5/1/2053
A1
150,000
145,274
Cleveland State University OH
5.00%
6/1/2031
A+
100,000
102,129
Clifton Higher Education Finance Corp.–Intl American Edu Fed TX
6.00%
8/15/2038
Baa3
110,000
109,324
Connecticut State Health & Educational Facilities Authority
2.80%
#(b)
7/1/2057
AAA
150,000
144,646
Duval County Public Schools FL COPs (AGM)
5.00%
7/1/2035
AA
150,000
159,365
Florida Development Finance Corp.–Renaissance Chtr 2020 C/D†
5.00%
9/15/2040
NR
100,000
85,180
Fort Bend Independent School District TX GO (PSF GTD)
0.875%
#(b)
8/1/2050
AAA
150,000
140,796
Louisiana Public Facilities Authority–Tulane University
5.00%
10/15/2036
A+
150,000
158,530
Massachusetts Development Finance Agency–Franklin W Olin College
5.00%
11/1/2039
A2
140,000
145,897
Stephen F Austin State University TX
5.00%
10/15/2028
Aa1
25,000
25,735
Wayne State University MI
4.00%
11/15/2034
Aa3
110,000
107,225
Total
1,424,025
General Obligation 21.58%
California Community Choice Financing Authority
5.00%
#(b)
12/1/2053
A2
150,000
151,147
California Community Choice Financing Authority
5.50%
#(b)
5/1/2054
A2
100,000
102,952
Chicago Board of Education IL GO
4.00%
12/1/2039
BB+
125,000
105,680
New Caney Independent School District TX GO (PSF GTD)
1.25%
#(b)
2/15/2050
Aaa
150,000
146,018
New Jersey Transportation Trust Fund Authority
5.25%
6/15/2036
A2
200,000
216,076
172
See Notes to Financial Statements.
Schedule of Investments (continued)
SUSTAINABLE MUNICIPAL BOND FUND September 30, 2023
Investments
Interest Rate
Maturity Date
Credit Rating: S&P or Moody’s(a)
Principal Amount
Fair Value
General Obligation (continued)
Northside Independent School District TX GO (PSF GTD)
1.60%
#(b)
8/1/2049
Aaa
$
100,000
$
97,738
Pennsylvania Economic Development Financing Authority AMT
5.50%
6/30/2037
Baa2
125,000
132,447
Washington Metropolitan Area Transit Authority Dedicated Revenue
5.00%
7/15/2038
NR
150,000
159,630
Total
1,111,688
Health Care 31.88%
Antelope Valley Healthcare District CA
5.00%
3/1/2026
BBB
115,000
113,371
Board of Managers Joint Guadalupe County-City of Seguin Hospital TX
4.00%
12/1/2026
BB
200,000
187,248
Connecticut State Health & Educational Facilities Authority–Hartford Healthcare Oblig Gp
5.00%
7/1/2028
A
185,000
191,794
County of Franklin–Trinity Hlth Corp Oblig OH
5.00%
12/1/2036
AA-
150,000
153,414
Lee Memorial Hlth Sys Oblig FL
5.00%
4/1/2029
A+
50,000
52,396
Maryland Health & Higher Educational Facilities Authority–Adventist Hlthcare Oblig
5.50%
1/1/2046
Baa3
125,000
121,572
New Jersey Health Care Facilities Financing Authority–St Joseph’s Hlthcr Oblig
5.00%
7/1/2025
BBB-
150,000
150,059
Norfolk Economic Development Authority–Sentara Hlthcr Oblig Gp VA
5.00%
#(b)
11/1/2048
AA
150,000
157,635
South Carolina Jobs-Economic Development Authority–Kiawah Life Plan Vlg Inc
5.25%
11/15/2028
NR
100,000
98,455
State of Ohio–Univ Hosp Hlth Sys Oblig Gp
5.00%
1/15/2032
A
150,000
155,396
Tarrant County Cultural Education Facilities Finance Corp.–Christus Health Oblig Group TX
5.00%
#(b)
7/1/2053
A1
250,000
260,892
Total
1,642,232
Housing 8.50%
California Housing Finance Agency
4.00%
3/20/2033
BBB+
140,906
134,128
Indiana Finance Authority-Chf-Tippecanoe LLC
5.00%
6/1/2043
NR
150,000
147,228
Maryland Economic Development Corp.
5.375%
7/1/2038
BBB-
150,000
156,633
Total
437,989
See Notes to Financial Statements.
173
Schedule of Investments (continued)
SUSTAINABLE MUNICIPAL BOND FUND September 30, 2023
Investments
Interest Rate
Maturity Date
Credit Rating: S&P or Moody’s(a)
Principal Amount
Fair Value
Taxable Revenue–Water & Sewer 1.94%
Jersey City Municipal Utilities Authority NJ
4.00%
5/3/2024
NR
$
100,000
$
99,961
Transportation 2.01%
County of Osceola Transportation Revenue FL
5.00%
10/1/2028
BBB+
100,000
103,567
Utilities 2.76%
City of Chicago Waterworks Revenue IL
5.00%
11/1/2029
A+
140,000
141,959
Total Investments in Securities 98.69% (cost $5,233,555)
5,084,174
Other Assets and Liabilities – Net 1.31%
67,402
Net Assets 100.00%
$
5,151,576
AGM
Insured by–Assured Guaranty Municipal Corporation.
AMT
Income from the security may be subject to Alternative Minimum Tax.
COP
Certificates of Participation.
GTD
Guaranteed.
NR
Not Rated.
PSF
Permanent School Fund.
VA
Insured by–Department of Veteran Affairs.
#
Variable rate security. The interest rate represents the rate in effect at September 30, 2023.
†
Security was purchased pursuant to Rule 144A under the Securities Act of 1933 and, unless registered under such Act or exempted from registration, may only be resold to qualified institutional buyers. At September 30, 2023, the total value of Rule 144A securities was $185,104, which represents 3.59% of net assets.
(a)
Unaudited.
(b)
Variable Rate is Fixed to Float: Rate remains fixed or at Zero Coupon until designated future date.
The following is a summary of the inputs used as of September 30, 2023 in valuing the Fund’s investments carried at fair value(1):
Investment Type(2)
Level 1
Level 2
Level 3
Total
Long-Term Investments
Municipal Bonds
$
–
$
5,084,174
$
–
$
5,084,174
Total
$
–
$
5,084,174
$
–
$
5,084,174
(1)
Refer to Note 2(i) for a description of fair value measurements and the three-tier hierarchy of inputs.
(2)
See Schedule of Investments for fair values in each industry. The table above is presented by Investment Type. When applicable, each Level 3 security is identified on the Schedule of Investments along with the valuation technique utilized.
A reconciliation of Level 3 investments is presented when the Fund has a material amount of Level 3 investments at the beginning or end of the year in relation to the Fund’s net assets.
174
See Notes to Financial Statements.
Schedule of Investments (concluded)
SUSTAINABLE MUNICIPAL BOND FUND September 30, 2023
The following is a reconciliation of investments with unobservable inputs (Level 3) that were used in determining fair value:
Investment Type
Municipal Bonds
Balance as of October 1, 2022
$
81,853
Accrued Discounts (Premiums)
15
Realized Gain (Loss)
(13,964
)
Change in Unrealized Appreciation (Depreciation)
17,681
Purchases
–
Sales
(85,585
)
Transfers into Level 3
–
Transfers out of Level 3
–
Balance as of September 30, 2023
$
–
Change in unrealized appreciation/depreciation for the year ended September 30, 2023, related to Level 3 investments held at September 30, 2023
$
–
See Notes to Financial Statements.
175
Schedule of Investments
CALIFORNIA TAX FREE FUND September 30, 2023
Investments
Interest Rate
Maturity Date
Credit Rating: S&P or Moody’s(a)
Principal Amount
Fair Value
LONG-TERM INVESTMENTS 100.26%
MUNICIPAL BONDS 100.26%
Corporate-Backed 1.83%
California Municipal Finance Authority AMT
4.00%
7/15/2029
BB-
$
3,450,000
$
3,306,801
California Pollution Control Financing Authority–Poseidon Resources AMT†
5.00%
11/21/2045
Baa3
4,410,000
4,210,881
California Pollution Control Financing Authority–Waste Mgmt Inc AMT
4.30%
7/1/2040
A-
185,000
180,033
San Francisco City & County Airport Comm-San Francisco International Airport–SFO Fuel Co LLC CA AMT
5.00%
1/1/2038
A+
1,715,000
1,730,417
Total
9,428,132
Education 13.95%
Alvord Unified School District CA GO (BAM)
5.00%
8/1/2052
NR
4,000,000
4,145,323
Brentwood Union School District CA GO
5.25%
8/1/2052
Aa3
2,125,000
2,218,656
California Community Choice Financing Authority
4.00%
#(b)
5/1/2053
A1
4,350,000
4,212,945
California Educational Facilities Authority–Art Center Clg of Design
5.00%
12/1/2030
Baa1
1,175,000
1,212,785
California Educational Facilities Authority–Art Center Clg of Design
5.00%
12/1/2044
Baa1
3,500,000
3,348,369
California Educational Facilities Authority–Chapman University
5.00%
4/1/2040
A2
1,000,000
1,004,673
California Educational Facilities Authority–Loyola Marymount Univ
5.00%
10/1/2048
A2
1,000,000
1,004,256
California Educational Facilities Authority–Santa Clara University
5.00%
4/1/2039
Aa3
1,000,000
1,012,031
California Educational Facilities Authority–Univ of San Francisco
5.00%
10/1/2053
A2
2,000,000
2,002,925
California Educational Facilities Authority–University of The Pacific
5.00%
11/1/2053
A2
2,900,000
2,937,356
California Municipal Finance Authority–Biola University
5.00%
10/1/2032
Baa1
400,000
407,666
California Municipal Finance Authority–Emerson College
5.00%
1/1/2042
BBB+
4,245,000
4,100,012
California Municipal Finance Authority–Samuel Merritt University
5.25%
6/1/2053
A3
3,000,000
3,061,782
California Municipal Finance Authority–Sdori Charter Sch Pptys†
5.625%
3/1/2045
B+
500,000
442,930
176
See Notes to Financial Statements.
Schedule of Investments (continued)
CALIFORNIA TAX FREE FUND September 30, 2023
Investments
Interest Rate
Maturity Date
Credit Rating: S&P or Moody’s(a)
Principal Amount
Fair Value
Education (continued)
California Municipal Finance Authority–Touro Clg & Univ Sys Oblig
5.25%
1/1/2040
NR
$
1,085,000
$
1,097,131
California Municipal Finance Authority–University of San Diego
3.00%
11/1/2048
A2
2,000,000
1,259,566
California School Finance Authority–Aspire Public Schools Oblig†
5.00%
8/1/2046
NR
85,000
86,923
California School Finance Authority–Aspire Public Schools Oblig†
5.00%
8/1/2046
BBB
2,285,000
2,112,520
California School Finance Authority–Green Dot Public Schs Oblig†
5.00%
8/1/2045
BBB-
620,000
573,681
California School Finance Authority–Kipp Socal Pub Schs Oblig†
5.00%
7/1/2045
BBB
540,000
514,739
California School Finance Authority–Kipp Socal Pub Schs Oblig†
5.00%
7/1/2047
BBB
2,915,000
2,751,715
California State University
5.25%
11/1/2053
Aa2
8,075,000
8,610,632
California Statewide Communities Development Authority–Culinary Inst of America
5.00%
7/1/2046
Baa2
1,010,000
938,801
Central Unified School District CA GO
5.25%
8/1/2052
Aa3
2,940,000
3,078,428
Montebello Unified School District CA GO (AGM)
5.50%
8/1/2047
AA
2,000,000
2,111,754
Morgan Hill Unified School District CA GO
5.25%
8/1/2040
Aa1
1,000,000
1,088,094
Ripon Unified School District CA GO (BAM)
5.50%
8/1/2043
AA
1,000,000
1,034,068
Santa Clarita Community College District CA GO
5.25%
8/1/2045
AA
1,500,000
1,584,344
University of California
4.00%
5/15/2041
AA
1,635,000
1,570,102
University of California
5.00%
5/15/2035
Aa2
3,000,000
3,381,880
University of California
5.00%
5/15/2036
AA-
1,500,000
1,655,860
University of California
5.00%
5/15/2052
AA
4,640,000
4,813,169
University of California
5.25%
5/15/2058
AA
2,500,000
2,589,211
Total
71,964,327
General Obligation 15.36%
Banning Unified School District CA GO (AGM)
5.25%
8/1/2042
AA
1,115,000
1,150,611
California Community Choice Financing Authority
5.00%
#(b)
7/1/2053
A1
3,000,000
3,027,484
California Community Choice Financing Authority
5.00%
#(b)
12/1/2053
A2
1,750,000
1,763,379
See Notes to Financial Statements.
177
Schedule of Investments (continued)
CALIFORNIA TAX FREE FUND September 30, 2023
Investments
Interest Rate
Maturity Date
Credit Rating: S&P or Moody’s(a)
Principal Amount
Fair Value
General Obligation (continued)
California Community Choice Financing Authority
5.25%
#(b)
1/1/2054
Baa1
$
5,905,000
$
5,894,878
California Community Choice Financing Authority
5.50%
#(b)
5/1/2054
A2
4,500,000
4,632,820
California State Public Works Board
4.00%
5/1/2046
Aa3
3,765,000
3,444,449
Commonwealth of Puerto Rico GO
Zero Coupon
7/1/2024
NR
25,521
24,659
Commonwealth of Puerto Rico GO
Zero Coupon
#(b)
11/1/2043
NR
739,145
384,356
Commonwealth of Puerto Rico GO
4.00%
7/1/2037
NR
20,754
17,474
Commonwealth of Puerto Rico GO
4.00%
7/1/2046
NR
2,000,000
1,548,256
Commonwealth of Puerto Rico GO
5.75%
7/1/2031
NR
165,067
172,706
Cupertino Union School District CA GO
2.50%
8/1/2033
Aa1
740,000
631,611
Dublin Unified School District CA GO
3.00%
8/1/2041
AA+
2,425,000
1,869,219
Grossmont Union High School District CA GO (AGM)
Zero Coupon
6/1/2040
AA
2,000,000
826,499
Imperial Community College District CA GO (AGM)
5.25%
8/1/2053
NR
1,620,000
1,709,415
Imperial Unified School District CA GO (BAM)
5.25%
8/1/2043
AA
2,000,000
2,132,338
Irvine Unified School District CA Special Tax (BAM)
5.00%
9/1/2038
AA
1,000,000
1,011,966
Irvine Unified School District CA Special Tax (BAM)
5.00%
9/1/2056
AA
995,000
1,011,675
Local Public Schools Funding Authority School Improvement District No. 2016-1 CA GO (BAM)
5.00%
8/1/2052
AA
2,000,000
2,033,720
Newport Mesa Unified School District CA GO
Zero Coupon
8/1/2041
Aaa
1,325,000
560,785
(c)
Newport Mesa Unified School District CA GO
Zero Coupon
8/1/2045
Aaa
1,000,000
336,287
North Orange County Community College District CA GO
2.75%
8/1/2036
AA+
2,000,000
1,649,888
San Benito High School District CA GO
Zero Coupon
8/1/2042
Aa3
1,795,000
674,971
San Benito High School District CA GO
Zero Coupon
8/1/2043
Aa3
2,600,000
921,085
San Diego Public Facilities Financing Authority CA
5.25%
10/15/2052
AA-
4,125,000
4,353,813
San Diego Unified School District CA GO(d)
5.00%
7/1/2048
Aa2
3,000,000
3,150,190
178
See Notes to Financial Statements.
Schedule of Investments (continued)
CALIFORNIA TAX FREE FUND September 30, 2023
Investments
Interest Rate
Maturity Date
Credit Rating: S&P or Moody’s(a)
Principal Amount
Fair Value
General Obligation (continued)
San Francisco Bay Area Rapid Transit District CA GO
5.25%
8/1/2047
Aaa
$
2,345,000
$
2,532,135
San Leandro Unified School District CA GO (BAM)
5.25%
8/1/2046
AA
1,750,000
1,800,307
Santa Barbara Unified School District CA GO
4.00%
8/1/2036
Aa1
750,000
744,413
Santa Monica–Malibu Unified School District CA GO
3.00%
8/1/2044
AA+
1,515,000
1,121,539
Santa Rita Union School District CA GO
2.50%
8/1/2031
AA-
1,235,000
1,073,708
Simi Valley Unified School District CA GO
5.25%
8/1/2051
Aa2
3,000,000
3,152,302
Southwestern Community College District CA GO
Zero Coupon
8/1/2041
Aa2
1,100,000
455,602
State of California GO
4.00%
11/1/2037
Aa2
3,000,000
2,938,835
State of California GO
4.00%
10/1/2041
Aa2
3,000,000
2,894,414
State of California GO
5.00%
10/1/2041
Aa2
1,000,000
1,052,786
State of California GO
5.00%
4/1/2042
Aa2
2,000,000
2,112,802
State of California GO
5.25%
8/1/2032
Aa2
2,500,000
2,564,160
State of California GO
5.25%
9/1/2047
Aa2
3,000,000
3,201,772
State of California GO
5.25%
10/1/2050
Aa2
2,500,000
2,661,117
State of California GO
5.25%
9/1/2053
Aa2
3,000,000
3,186,456
Washington Township Health Care District CA GO
5.25%
8/1/2048
A2
1,625,000
1,699,879
West Contra Costa Unified School District CA GO
6.00%
8/1/2027
AA-
1,000,000
1,088,750
Total
79,215,511
Health Care 12.85%
Abag Finance Authority for Nonprofit Corps–Sharp Healthcare Oblig CA
5.00%
8/1/2043
AA
1,000,000
1,001,002
Antelope Valley Healthcare District CA
5.00%
3/1/2026
BBB
650,000
640,794
Antelope Valley Healthcare District CA
5.25%
3/1/2036
BBB
1,000,000
993,832
California Community Choice Financing Authority–Providence St Joseph Oblig
3.00%
10/1/2041
A
1,180,000
843,201
California Community Choice Financing Authority–Providence St Joseph Oblig
3.00%
10/1/2047
A2
1,295,000
862,341
California Community Choice Financing Authority–Providence St Joseph Oblig
5.00%
10/1/2044
A
2,410,000
2,353,655
See Notes to Financial Statements.
179
Schedule of Investments (continued)
CALIFORNIA TAX FREE FUND September 30, 2023
Investments
Interest Rate
Maturity Date
Credit Rating: S&P or Moody’s(a)
Principal Amount
Fair Value
Health Care (continued)
California Health Facilities Financing Authority–Cedars-Sinai Med Ctr Oblig
3.00%
8/15/2051
AA-
$
2,705,000
$
1,882,371
California Health Facilities Financing Authority–Children’s Hosp La Oblig
5.00%
8/15/2047
BBB
4,000,000
3,801,105
California Health Facilities Financing Authority–Childrens Hosp Orange Oblig
3.00%
11/1/2038
AA-
3,000,000
2,319,445
California Health Facilities Financing Authority–City of Hope Oblig Group
4.00%
11/15/2045
A
3,370,000
2,885,353
California Health Facilities Financing Authority–Commonspirit Hlth Oblig
4.00%
4/1/2035
A-
3,350,000
3,216,188
California Health Facilities Financing Authority–Commonspirit Hlth Oblig
4.00%
4/1/2044
A-
1,250,000
1,075,414
California Health Facilities Financing Authority–Commonspirit Hlth Oblig
4.00%
4/1/2045
A-
1,250,000
1,070,219
California Health Facilities Financing Authority–Lucile S Packard Chld Hsp
4.00%
5/15/2051
A+
2,000,000
1,734,418
California Health Facilities Financing Authority–Sutter Health Oblig Group
4.00%
11/15/2048
A+
1,750,000
1,527,255
California Municipal Finance Authority
4.00%
8/15/2037
A-
1,000,000
922,530
California Municipal Finance Authority–Cmnty Hosps Ctrl Grp
5.00%
2/1/2037
A3
2,000,000
1,994,319
California Municipal Finance Authority–Cmnty Hosps Ctrl Grp
5.00%
2/1/2040
A3
500,000
508,694
California Municipal Finance Authority–Cmnty Hosps Ctrl Grp (AGM)
4.00%
2/1/2051
AA
1,455,000
1,236,245
California Municipal Finance Authority–Palomar Health Oblig Grp (AGM)
5.25%
11/1/2052
AA
1,000,000
1,032,247
California Public Finance Authority–Hoag Mem Hosp Oblig Grp
4.00%
7/15/2051
AA
1,000,000
866,503
California Public Finance Authority–Kendal At Ventura†
10.00%
5/15/2028
NR
500,000
487,389
(c)
California Statewide Communities Development Authority–Cedars-Sinai Med Ctr Oblig
4.00%
7/1/2048
AA-
1,000,000
873,312
California Statewide Communities Development Authority–Humangood Oblig Group
5.00%
10/1/2045
A-
(e)
1,000,000
938,293
(c)
California Statewide Communities Development Authority–Kaiser Fdtn Hospitals
5.00%
#(b)
5/1/2033
AA-
1,030,000
1,102,013
180
See Notes to Financial Statements.
Schedule of Investments (continued)
CALIFORNIA TAX FREE FUND September 30, 2023
Investments
Interest Rate
Maturity Date
Credit Rating: S&P or Moody’s(a)
Principal Amount
Fair Value
Health Care (continued)
California Statewide Communities Development Authority–Loma Linda Univ Med Oblig†
5.00%
12/1/2026
BB
$
1,735,000
$
1,736,462
California Statewide Communities Development Authority–Loma Linda Univ Med Oblig
5.25%
12/1/2034
BB
2,150,000
2,155,330
California Statewide Communities Development Authority–Loma Linda Univ Med Oblig†
5.25%
12/1/2056
BB
1,015,000
930,827
California Statewide Communities Development Authority–Loma Linda Univ Med Oblig
5.50%
12/1/2054
BB
2,225,000
2,167,722
California Statewide Communities Development Authority–Loma Linda Univ Med Oblig†
5.50%
12/1/2058
BB
2,555,000
2,430,609
California Statewide Communities Development Authority–Verity Hlth Sys Oblig
5.50%
7/1/2039
NR
5,057
4,754
City of Oroville–Oroville Hospital CA
5.25%
4/1/2049
B
1,695,000
971,011
Palomar Health CA–Palomar Health Oblig Grp
5.00%
11/1/2036
BBB
3,555,000
3,500,888
Palomar Health CA–Palomar Health Oblig Grp
5.00%
11/1/2039
BBB
4,750,000
4,483,972
Regents of the University of California Medical Center Pooled Revenue
3.50%
5/15/2054
AA-
3,000,000
2,312,025
Regents of the University of California Medical Center Pooled Revenue
5.00%
5/15/2035
AA-
2,000,000
2,211,968
Regents of the University of California Medical Center Pooled Revenue
5.00%
5/15/2047
AA-
2,000,000
2,068,781
Regents of the University of California Medical Center Pooled Revenue CA
5.00%
5/15/2047
AA-
3,000,000
3,045,139
Washington Township Health Care District CA
5.75%
7/1/2053
Baa3
2,100,000
2,115,909
Total
66,303,535
Housing 6.08%
California Community Housing Agency†
4.00%
2/1/2050
NR
4,495,000
3,143,174
California Community Housing Agency†
5.00%
8/1/2050
NR
1,000,000
865,111
California Enterprise Development Authority–Provident Grp-Sdsu Pptys
5.00%
8/1/2040
Baa3
1,625,000
1,633,287
See Notes to Financial Statements.
181
Schedule of Investments (continued)
CALIFORNIA TAX FREE FUND September 30, 2023
Investments
Interest Rate
Maturity Date
Credit Rating: S&P or Moody’s(a)
Principal Amount
Fair Value
Housing (continued)
California Enterprise Development Authority–Provident Grp-Sdsu Pptys
5.00%
8/1/2050
Baa3
$
1,030,000
$
1,013,481
California Housing Finance Agency
3.25%
8/20/2036
BBB
7,289,368
6,385,921
California Housing Finance Agency
3.50%
11/20/2035
BBB+
3,283,222
2,881,381
California Municipal Finance Authority–Biola University
5.00%
10/1/2034
Baa1
1,000,000
1,018,623
California Municipal Finance Authority–Bowles Hall Foundation
5.00%
6/1/2050
Baa3
500,000
480,721
California Municipal Finance Authority–Caritas Affordable Hsg
5.00%
8/15/2030
A-
1,050,000
1,060,357
California Municipal Finance Authority–CHF-Davis II LLC (BAM)
4.00%
5/15/2046
AA
4,625,000
3,886,996
California Statewide Communities Development Authority–CHF-Irvine LLC
5.00%
5/15/2035
Baa1
1,100,000
1,115,278
California Statewide Communities Development Authority–CHF-Irvine LLC (BAM)
4.00%
5/15/2046
AA
1,000,000
852,278
CSCDA Community Improvement Authority CA†
2.65%
12/1/2046
NR
3,445,000
2,419,980
CSCDA Community Improvement Authority CA†
3.00%
6/1/2047
NR
3,000,000
2,004,902
CSCDA Community Improvement Authority CA†
3.00%
3/1/2057
NR
2,000,000
1,247,824
CSCDA Community Improvement Authority CA†
4.00%
8/1/2056
NR
1,000,000
704,636
CSCDA Community Improvement Authority CA†
4.00%
12/1/2056
NR
1,000,000
665,370
Total
31,379,320
Lease Obligations 1.12%
California State Public Works Board
4.00%
11/1/2046
Aa3
2,500,000
2,285,150
County of Santa Barbara CA COPS AMT
5.00%
12/1/2036
AA
3,395,000
3,468,945
Total
5,754,095
Other Revenue 1.33%
California Infrastructure & Economic Development Bank–Los Angeles Cnty Museum
4.00%
7/1/2050
A2
4,000,000
3,387,666
California School Finance Authority–Aspire Public Schools Oblig†
4.00%
8/1/2051
BBB
785,000
594,012
182
See Notes to Financial Statements.
Schedule of Investments (continued)
CALIFORNIA TAX FREE FUND September 30, 2023
Investments
Interest Rate
Maturity Date
Credit Rating: S&P or Moody’s(a)
Principal Amount
Fair Value
Other Revenue (continued)
California School Finance Authority–Green Dot Public Schs Oblig†
5.00%
8/1/2038
BBB-
$
1,000,000
$
970,138
California School Finance Authority–Kipp Socal Pub Schs Oblig†
5.00%
7/1/2034
BBB
600,000
602,536
Commonwealth of Puerto Rico
5.069%
#(b)
11/1/2051
NR
2,500,000
1,287,500
Total
6,841,852
Power 1.21%
Southern California Public Power Authority
5.25%
7/1/2053
Aa2
2,700,000
2,878,660
Southern California Public Power Authority
5.25%
7/1/2053
Aa2
3,180,000
3,390,422
Total
6,269,082
Pre-Refunded 0.12%
M-S-R Energy Authority CA
6.50%
11/1/2039
BBB+
555,000
629,731
Special Tax 3.31%
City of Irvine CA
5.00%
9/2/2028
NR
1,000,000
1,013,824
City of Irvine CA (BAM)
5.25%
9/1/2053
NR
3,000,000
3,186,456
City of Irvine CA Special Tax
5.00%
9/1/2044
NR
500,000
497,172
City of Roseville CA Special Tax
5.00%
9/1/2031
NR
1,000,000
1,011,410
County of Los Angeles Community Facilities District No. CA Special Tax
5.00%
9/1/2052
NR
1,500,000
1,378,405
Inland Valley Development Agency CA Tax Allocation
5.25%
9/1/2037
A
1,325,000
1,328,869
Irvine Facilities Financing Authority CA (BAM)
5.25%
9/1/2053
AA
3,160,000
3,351,201
Orange County Community Facilities District CA Special Tax
5.00%
8/15/2047
NR
1,000,000
952,860
Poway Unified School District Public Financing Authority CA Special Tax (BAM)
5.00%
9/1/2035
AA+
1,770,000
1,806,720
River Islands Public Financing Authority CA Special Tax (AGM)
5.25%
9/1/2052
AA
1,000,000
1,045,106
Temecula Valley Unified School District Financing Authority CA Special Tax (BAM)
5.00%
9/1/2035
AA
1,505,000
1,530,540
Total
17,102,563
Tax Revenue 4.12%
City of Sacramento Transient Occupancy Tax Revenue CA
5.00%
6/1/2048
A1
1,000,000
1,014,208
Compton Community Redevelopment Agency Successor Agency CA (AGM)
5.00%
8/1/2037
AA
1,700,000
1,773,336
See Notes to Financial Statements.
183
Schedule of Investments (continued)
CALIFORNIA TAX FREE FUND September 30, 2023
Investments
Interest Rate
Maturity Date
Credit Rating: S&P or Moody’s(a)
Principal Amount
Fair Value
Tax Revenue (continued)
Fresno Unified School District CA GO
5.00%
8/1/2046
Aa3
$
1,000,000
$
1,025,888
Matching Fund Special Purpose Securitization Corp. VI
5.00%
10/1/2026
NR
1,925,000
1,933,934
Puerto Rico Sales Tax Financing Corp. Sales Tax Revenue
Zero Coupon
7/1/2051
NR
501,000
93,442
Puerto Rico Sales Tax Financing Corp. Sales Tax Revenue
4.329%
7/1/2040
NR
350,000
314,357
Puerto Rico Sales Tax Financing Corp. Sales Tax Revenue
4.329%
7/1/2040
NR
3,971,000
3,566,607
Puerto Rico Sales Tax Financing Corp. Sales Tax Revenue
4.536%
7/1/2053
NR
7,000
5,989
Puerto Rico Sales Tax Financing Corp. Sales Tax Revenue
4.75%
7/1/2053
NR
4,298,854
3,811,199
San Diego Unified School District CA GO
3.00%
7/1/2044
Aa2
4,400,000
3,208,177
San Leandro Unified School District CA GO
5.25%
8/1/2048
AA-
2,100,000
2,212,095
San Rafael City High School District CA GO
5.25%
8/1/2052
Aa2
1,215,000
1,278,553
Tustin Community Facilities District CA Special Tax
5.00%
9/1/2037
A-
1,000,000
1,012,206
Total
21,249,991
Taxable Revenue–Water & Sewer 1.49%
California Pollution Control Financing Authority–Poseidon Resources AMT†
5.00%
11/21/2045
Baa3
1,100,000
1,071,205
Los Angeles Department of Water & Power Water System Revenue CA
3.00%
#(b)
7/1/2045
Aa2
6,620,000
6,620,000
Total
7,691,205
Tobacco 2.99%
California County Tobacco Securitization Agency
Zero Coupon
6/1/2055
NR
3,000,000
444,861
California Statewide Financing Authority
Zero Coupon
6/1/2046
NR
8,675,000
1,965,604
California Statewide Financing Authority†
Zero Coupon
6/1/2055
NR
10,000,000
440,398
Golden State Tobacco Securitization Corp. CA
Zero Coupon
6/1/2066
NR
7,000,000
608,121
Golden State Tobacco Securitization Corp. CA
5.00%
6/1/2034
NR
1,050,000
1,122,611
Inland Empire Tobacco Securitization Corp. CA†
Zero Coupon
6/1/2057
CCC
3,000,000
184,421
184
See Notes to Financial Statements.
Schedule of Investments (continued)
CALIFORNIA TAX FREE FUND September 30, 2023
Investments
Interest Rate
Maturity Date
Credit Rating: S&P or Moody’s(a)
Principal Amount
Fair Value
Tobacco (continued)
Silicon Valley Tobacco Securitization Authority CA
Zero Coupon
6/1/2041
NR
$
5,000,000
$
1,689,153
Silicon Valley Tobacco Securitization Authority CA
Zero Coupon
6/1/2056
NR
2,250,000
169,870
Tobacco Securitization Authority of Northern California–Sacramento County Tobacco
4.00%
6/1/2036
A-
1,050,000
1,018,444
Tobacco Securitization Authority of Northern California–Sacramento County Tobacco
4.00%
6/1/2049
BBB+
3,250,000
2,770,319
Tobacco Securitization Authority of Southern California–San Diego County Tobacco
Zero Coupon
6/1/2046
CCC-
2,500,000
417,930
Tobacco Securitization Authority of Southern California–San Diego County Tobacco
Zero Coupon
6/1/2054
NR
4,800,000
877,424
Tobacco Securitization Authority of Southern California–San Diego County Tobacco
5.00%
6/1/2038
A-
1,000,000
1,025,735
Tobacco Securitization Authority of Southern California–San Diego County Tobacco
5.00%
6/1/2039
A-
1,000,000
1,022,173
Tobacco Securitization Authority of Southern California–San Diego County Tobacco
5.00%
6/1/2048
BBB+
1,675,000
1,679,553
Total
15,436,617
Transportation 22.61%
Alameda Corridor Transportation Authority CA (AGM)
5.00%
10/1/2052
AA
9,000,000
9,158,539
Bay Area Toll Authority CA
5.00%
4/1/2054
AA
2,720,000
2,831,286
California Municipal Finance Authority–Lax Integrated Express AMT
4.00%
12/31/2047
BBB-
(e)
5,590,000
4,518,077
California Municipal Finance Authority–Lax Integrated Express AMT
5.00%
12/31/2034
BBB-
(e)
1,700,000
1,730,804
California Municipal Finance Authority–Lax Integrated Express AMT
5.00%
12/31/2035
BBB-
(e)
1,205,000
1,221,416
California Municipal Finance Authority–Lax Integrated Express AMT
5.00%
12/31/2043
BBB-
(e)
1,395,000
1,368,734
California Municipal Finance Authority–Lax Integrated Express AMT
5.00%
12/31/2047
BBB-
(e)
6,500,000
6,337,560
See Notes to Financial Statements.
185
Schedule of Investments (continued)
CALIFORNIA TAX FREE FUND September 30, 2023
Investments
Interest Rate
Maturity Date
Credit Rating: S&P or Moody’s(a)
Principal Amount
Fair Value
Transportation (continued)
City of Fresno Airport Revenue CA (BAM) AMT
5.00%
7/1/2048
AA
$
3,220,000
$
3,195,885
City of Long Beach Airport System Revenue CA AMT (AGM)
5.25%
6/1/2047
AA
1,250,000
1,273,279
City of Long Beach Harbor Revenue CA AMT
5.00%
5/15/2028
AA+
1,000,000
1,014,515
City of Los Angeles Department of Airports CA AMT
4.00%
5/15/2049
AA-
2,000,000
1,702,975
City of Los Angeles Department of Airports CA AMT
5.00%
5/15/2032
NR
105,000
111,395
City of Los Angeles Department of Airports CA AMT
5.00%
5/15/2032
AA-
1,895,000
2,002,262
City of Los Angeles Department of Airports CA AMT
5.00%
5/15/2043
AA-
1,000,000
1,001,874
City of Los Angeles Department of Airports CA AMT
5.00%
5/15/2051
AA-
1,000,000
991,757
City of Los Angeles Department of Airports CA AMT
5.25%
5/15/2047
AA
3,000,000
3,073,164
City of Los Angeles Department of Airports CA AMT
5.25%
5/15/2048
AA-
2,000,000
2,012,672
City of Los Angeles Department of Airports CA AMT
5.50%
5/15/2036
AA
1,000,000
1,082,367
City of Los Angeles Department of Airports CA AMT
5.50%
5/15/2047
AA
7,000,000
7,286,824
County of Sacramento Airport System Revenue CA
5.00%
7/1/2041
A
1,130,000
1,150,710
Foothill-Eastern Transportation Corridor Agency CA
Zero Coupon
1/15/2033
A
1,500,000
985,950
Foothill-Eastern Transportation Corridor Agency CA
Zero Coupon
1/15/2042
A
1,150,000
1,304,761
Foothill-Eastern Transportation Corridor Agency CA
4.00%
1/15/2043
A-
8,110,000
7,299,191
Foothill-Eastern Transportation Corridor Agency CA
4.00%
1/15/2046
A
4,010,000
3,589,535
Norman Y Mineta San Jose International Airport SJC CA AMT
5.00%
3/1/2031
A
1,750,000
1,829,468
Norman Y Mineta San Jose International Airport SJC CA AMT
5.00%
3/1/2047
A
4,000,000
3,928,548
Port Commission of the City & County of San Francisco CA AMT
5.00%
3/1/2030
Aa3
1,415,000
1,420,880
186
See Notes to Financial Statements.
Schedule of Investments (continued)
CALIFORNIA TAX FREE FUND September 30, 2023
Investments
Interest Rate
Maturity Date
Credit Rating: S&P or Moody’s(a)
Principal Amount
Fair Value
Transportation (continued)
Puerto Rico Highway & Transportation Authority
5.00%
7/1/2062
NR
$
2,000,000
$
1,915,000
Riverside County Transportation Commission CA
Zero Coupon
6/1/2028
NR
465,000
391,011
Riverside County Transportation Commission CA
Zero Coupon
6/1/2028
A
535,000
430,390
Riverside County Transportation Commission CA
4.00%
6/1/2047
A-
3,520,000
2,990,495
San Diego County Regional Airport Authority CA
4.00%
7/1/2046
A2
2,005,000
1,826,104
San Diego County Regional Airport Authority CA AMT
4.00%
7/1/2046
A2
1,750,000
1,494,880
San Diego County Regional Airport Authority CA AMT
5.00%
7/1/2051
A2
3,500,000
3,435,161
San Francisco City & County Airport Comm–San Francisco International Airport CA AMT
5.00%
5/1/2041
A+
3,500,000
3,494,783
San Francisco City & County Airport Comm-San Francisco International Airport CA
5.00%
5/1/2052
A1
1,025,000
1,066,512
San Francisco City & County Airport Comm-San Francisco International Airport CA AMT
5.00%
5/1/2031
A1
6,500,000
6,822,124
San Francisco City & County Airport Comm-San Francisco International Airport CA AMT
5.00%
5/1/2032
A+
1,500,000
1,575,153
San Francisco City & County Airport Comm-San Francisco International Airport CA AMT
5.00%
5/1/2045
A+
1,515,000
1,509,697
San Francisco City & County Airport Comm-San Francisco International Airport CA AMT
5.00%
5/1/2052
A1
7,100,000
7,039,000
San Joaquin Hills Transportation Corridor Agency CA
4.00%
1/15/2050
A
1,825,000
1,578,326
San Joaquin Hills Transportation Corridor Agency CA
5.25%
1/15/2044
A-
4,880,000
4,906,421
San Joaquin Hills Transportation Corridor Agency CA
5.25%
1/15/2049
A-
1,930,000
1,938,434
San Joaquin Hills Transportation Corridor Agency CA (NATL)
Zero Coupon
1/15/2036
Baa2
1,450,000
798,120
Total
116,636,039
See Notes to Financial Statements.
187
Schedule of Investments (continued)
CALIFORNIA TAX FREE FUND September 30, 2023
Investments
Interest Rate
Maturity Date
Credit Rating: S&P or Moody’s(a)
Principal Amount
Fair Value
Utilities 11.89%
Adelanto Public Utility Authority CA (AGM)
5.00%
7/1/2039
AA
$
1,335,000
$
1,376,338
California Community Choice Financing Authority
4.00%
#(b)
10/1/2052
A2
2,350,000
2,278,269
California Community Choice Financing Authority
5.00%
#(b)
2/1/2054
A1
1,500,000
1,514,128
California Pollution Control Financing Authority–Poseidon Resources†
5.00%
7/1/2039
Baa3
1,120,000
1,122,986
California Pollution Control Financing Authority–Poseidon Resources†
5.00%
11/21/2045
Baa3
3,870,000
3,768,694
Casitas Municipal Water District CA Special Tax (BAM)
5.25%
9/1/2047
AA
1,525,000
1,567,197
City of Burbank Electric Revenue CA
5.00%
6/1/2053
AA-
3,750,000
3,842,451
City of Los Angeles Wastewater System Revenue CA
5.00%
6/1/2043
AA+
3,000,000
3,000,094
City of San Francisco Public Utilities Commission Water Revenue CA
5.25%
11/1/2052
Aa2
1,000,000
1,061,286
Guam Power Authority (AGM)
5.00%
10/1/2034
AA
705,000
710,329
Long Beach Bond Finance Authority CA
5.20% (3 mo. USD LIBOR * .67 +1.43%
)#
11/15/2026
A1
1,000,000
984,137
Los Angeles Department of Water & Power CA
3.00%
#(b)
7/1/2034
Aa2
2,450,000
2,450,000
Los Angeles Department of Water & Power CA
5.00%
7/1/2043
Aa2
2,000,000
2,115,585
Los Angeles Department of Water & Power CA
5.00%
7/1/2048
Aa2
2,000,000
2,071,404
Los Angeles Department of Water & Power CA
5.00%
7/1/2051
Aa2
1,200,000
1,243,392
Los Angeles Department of Water & Power CA
5.00%
7/1/2052
Aa2
4,645,000
4,823,283
Los Angeles Department of Water & Power CA
5.25%
7/1/2037
Aa2
1,500,000
1,557,231
Los Angeles Department of Water & Power Water System Revenue CA
5.00%
7/1/2052
AA+
1,745,000
1,817,107
Modesto Irrigation District CA
5.25%
10/1/2048
A+
3,000,000
3,166,422
M-S-R Energy Authority CA
6.50%
11/1/2039
BBB+
2,625,000
2,972,318
Northern California Energy Authority
4.00%
#(b)
7/1/2049
A2
3,750,000
3,739,790
Puerto Rico Commonwealth Aqueduct & Sewer Authority†
4.00%
7/1/2042
NR
700,000
583,862
188
See Notes to Financial Statements.
Schedule of Investments (continued)
CALIFORNIA TAX FREE FUND September 30, 2023
Investments
Interest Rate
Maturity Date
Credit Rating: S&P or Moody’s(a)
Principal Amount
Fair Value
Utilities (continued)
San Diego Public Facilities Financing Authority CA
5.00%
8/1/2043
Aa3
$
1,000,000
$
1,036,522
San Francisco City & County Public Utilities Commission Wastewater Revenue CA
5.00%
10/1/2046
AA
2,000,000
2,083,036
Southern California Public Power Authority
5.00%
11/1/2033
A2
3,575,000
3,595,544
Southern California Public Power Authority
5.00%
7/1/2038
AA-
1,000,000
1,004,460
Southern California Public Power Authority
5.244% (3 mo. USD LIBOR * .67 + 1.47%
)#
11/1/2038
A2
815,000
693,148
Stockton Public Financing Authority CA (BAM)
5.00%
9/1/2029
AA
1,000,000
1,006,790
Transbay Joint Powers Authority CA Tax Allocation
5.00%
10/1/2025
BBB+
(e)
1,130,000
1,137,820
Transbay Joint Powers Authority CA Tax Allocation
5.00%
10/1/2031
BBB+
(e)
765,000
766,712
Transbay Joint Powers Authority CA Tax Allocation
5.00%
10/1/2032
BBB+
(e)
1,090,000
1,105,640
Transbay Joint Powers Authority CA Tax Allocation
5.00%
10/1/2034
BBB+
(e)
300,000
303,555
Transbay Joint Powers Authority CA Tax Allocation
5.00%
10/1/2035
BBB+
(e)
200,000
201,215
Transbay Joint Powers Authority CA Tax Allocation
5.00%
10/1/2038
BBB+
(e)
650,000
632,458
Total
61,333,203
Total Investments in Securities 100.26% (cost $548,847,043)
517,235,203
Other Assets and Liabilities – Net(f) (0.26)%
(1,364,711
)
Net Assets 100.00%
$
515,870,492
AGM
Insured by–Assured Guaranty Municipal Corporation.
AMT
Income from the security may be subject to Alternative Minimum Tax.
BAM
Insured by–Build America Mutual.
COPS
Certificates of Participation.
LIBOR
London Interbank Offered Rate.
NATL
National Public Finance Guarantee Corporation.
NR
Not Rated.
†
Security was purchased pursuant to Rule 144A under the Securities Act of 1933 and, unless registered under such Act or exempted from registration, may only be resold to qualified institutional buyers. At September 30, 2023, the total value of Rule 144A securities was $36,667,925, which represents 7.11% of net assets.
#
Variable rate security. The interest rate represents the rate in effect at September 30, 2023.
(a)
Unaudited.
(b)
Variable Rate is Fixed to Float: Rate remains fixed or at Zero Coupon until designated future date.
(c)
Level 3 Investment as described in Note 2(i) in the Notes to Financials. Security valued utilizing third party pricing information without adjustment. Such valuations are based on unobservable inputs. A significant change in third party information could result in a significantly lower or higher value of such Level 3 investments.
(d)
Securities purchased on a when-issued basis (See Note 2(g)).
(e)
This investment has been rated by Fitch IBCA.
(f)
Other Assets and Liabilities – Net include net unrealized appreciation/depreciation on futures contracts as follows:
See Notes to Financial Statements.
189
Schedule of Investments (concluded)
CALIFORNIA TAX FREE FUND September 30, 2023
Futures Contracts at September 30, 2023:
Type
Expiration
Contracts
Position
Notional Amount
Notional Value
Unrealized Appreciation
U.S. Long Bond
December 2023
75
Short
$(8,887,977
)
$(8,533,594
)
$354,383
The following is a summary of the inputs used as of September 30, 2023 in valuing the Fund’s investments carried at fair value(1):
Investment Type(2)
Level 1
Level 2
Level 3
Total
Long-Term Investments
Municipal Bonds
General Obligation
$
–
$
78,654,726
$
560,785
$
79,215,511
Health Care
–
64,877,853
1,425,682
66,303,535
Remaining Industries
–
371,716,157
–
371,716,157
Total
$
–
$
515,248,736
$
1,986,467
$
517,235,203
Other Financial Instruments
Futures Contracts
Assets
$
354,383
$
–
$
–
$
354,383
Liabilities
–
–
–
–
Total
$
354,383
$
–
$
–
$
354,383
(1)
Refer to Note 2(i) for a description of fair value measurements and the three-tier hierarchy of inputs.
(2)
See Schedule of Investments for fair values in each industry. The table above is presented by Investment Type. Industries are presented within an Investment Type should such Investment Type include securities classified as two or more levels within the three-tier fair value hierarchy. When applicable, each Level 3 security is identified on the Schedule of Investments along with the valuation technique utilized.
A reconciliation of Level 3 investments is presented when the Fund has a material amount of Level 3 investments at the beginning or end of the year in relation to the Fund’s net assets. Management has determined not to provide a reconciliation as the balance of Level 3 investments was not considered to be material to the Fund’s net assets at the beginning or end of the year.
190
See Notes to Financial Statements.
Schedule of Investments
NEW JERSEY TAX FREE FUND September 30, 2023
Investments
Interest Rate
Maturity Date
Credit Rating: S&P or Moody’s(a)
Principal Amount
Fair Value
LONG-TERM INVESTMENTS 97.81%
MUNICIPAL BONDS 97.81%
Corporate-Backed 3.92%
Industrial Pollution Control Financing Authority of Gloucester County–Logan Generating Co LP NJ AMT
5.00%
12/1/2024
NR
$
85,000
$
85,152
New Jersey Economic Development Authority–NYNJ Link Borrower LLC (AGM) AMT
5.00%
1/1/2031
AA
225,000
225,480
New Jersey Economic Development Authority–NYNJ Link Borrower LLC AMT
5.00%
1/1/2028
BBB+
100,000
100,200
New Jersey Economic Development Authority–United Airlines Inc
5.25%
9/15/2029
BB-
1,675,000
1,670,722
New Jersey Economic Development Authority–United Airlines Inc
5.50%
6/1/2033
BB-
650,000
653,261
New Jersey Infrastructure Bank
2.125%
9/1/2046
AAA
400,000
231,070
Salem County Pollution Control Financing Authority–Constellation Energy Gen NJ AMT
4.45%
3/1/2025
Baa2
1,015,000
1,008,669
Total
3,974,554
Education 10.34%
Camden County Improvement Authority–Kipp Cooper Norcross Oblig NJ
6.00%
6/15/2047
BBB
500,000
522,148
Hudson County Improvement Authority NJ
4.00%
6/1/2049
AA
500,000
435,189
Middlesex County Improvement Authority NJ
5.00%
8/15/2053
Aa3
1,360,000
1,404,154
Middlesex County Improvement Authority NJ GTD
4.00%
8/15/2053
NR
1,000,000
871,741
New Jersey Economic Development Authority–Provident Group-Montclair (AGM)
5.00%
6/1/2042
AA
500,000
500,239
New Jersey Educational Facilities Authority(b)
5.00%
9/1/2036
A2
285,000
301,274
New Jersey Educational Facilities Authority(b)
5.25%
9/1/2053
A2
750,000
773,222
New Jersey Educational Facilities Authority–New Jersey City Univ Inc (AGM)
4.00%
7/1/2036
AA
745,000
692,356
New Jersey Educational Facilities Authority–Ramapo College of NJ (AGM)
4.00%
7/1/2041
AA
545,000
483,384
New Jersey Educational Facilities Authority–Seton Hall University
4.00%
7/1/2046
BBB+
545,000
437,257
See Notes to Financial Statements.
191
Schedule of Investments (continued)
NEW JERSEY TAX FREE FUND September 30, 2023
Investments
Interest Rate
Maturity Date
Credit Rating: S&P or Moody’s(a)
Principal Amount
Fair Value
Education (continued)
��
New Jersey Educational Facilities Authority–Seton Hall University
5.00%
7/1/2034
BBB+
$
325,000
$
329,654
New Jersey Educational Facilities Authority–Seton Hall University (AGM)
3.25%
7/1/2049
AA
400,000
280,458
New Jersey Educational Facilities Authority–Stevens Inst of Tech
3.00%
7/1/2050
BBB+
1,005,000
622,807
New Jersey Educational Facilities Authority–Stevens Inst of Tech
4.00%
7/1/2050
BBB+
200,000
156,311
New Jersey Educational Facilities Authority–Stevens Inst of Tech
5.00%
7/1/2030
BBB+
530,000
540,169
New Jersey Educational Facilities Authority–Stockton University
5.00%
7/1/2041
A3
800,000
786,287
New Jersey Educational Facilities Authority–William Paterson Univ (AGM)
3.00%
7/1/2039
AA
250,000
197,465
New Jersey Educational Facilities Authority–William Paterson Univ (AGM)
3.00%
7/1/2040
AA
250,000
194,165
New Jersey Higher Education Student Assistance Authority AMT
2.50%
12/1/2040
AA
500,000
395,197
New Jersey Higher Education Student Assistance Authority AMT
3.25%
12/1/2039
Aa1
405,000
366,404
New Jersey Institute of Technology
5.00%
7/1/2033
A1
170,000
179,975
Total
10,469,856
Financial Services 0.20%
New Jersey Higher Education Student Assistance Authority AMT
5.00%
12/1/2028
Aaa
200,000
203,790
General Obligation 11.84%
City of Atlantic City NJ GO (AGM)
5.00%
3/1/2037
AA
540,000
550,607
City of Atlantic City NJ GO (BAM)
5.00%
3/1/2042
AA
750,000
755,615
City of Jersey City NJ GO
4.00%
2/15/2036
A1
750,000
732,516
City of Newark Mass Transit Access Tax Revenue NJ (AGM)
5.375%
11/15/2052
AA
710,000
753,445
City of Summit NJ GO
4.00%
7/15/2041
AAA
500,000
463,848
Commonwealth of Puerto Rico GO
Zero Coupon
7/1/2024
NR
6,674
6,448
Commonwealth of Puerto Rico GO
Zero Coupon
7/1/2033
NR
52,676
31,134
Commonwealth of Puerto Rico GO
Zero Coupon
#(c)
11/1/2043
NR
192,940
100,329
Commonwealth of Puerto Rico GO
4.00%
7/1/2033
NR
40,933
36,776
Commonwealth of Puerto Rico GO
4.00%
7/1/2035
NR
36,793
32,062
Commonwealth of Puerto Rico GO
4.00%
7/1/2037
NR
31,578
26,588
192
See Notes to Financial Statements.
Schedule of Investments (continued)
NEW JERSEY TAX FREE FUND September 30, 2023
Investments
Interest Rate
Maturity Date
Credit Rating: S&P or Moody’s(a)
Principal Amount
Fair Value
General Obligation (continued)
Commonwealth of Puerto Rico GO
5.375%
7/1/2025
NR
$
45,588
$
46,079
Commonwealth of Puerto Rico GO
5.625%
7/1/2027
NR
45,175
46,404
Commonwealth of Puerto Rico GO
5.625%
7/1/2029
NR
44,442
45,990
Commonwealth of Puerto Rico GO
5.75%
7/1/2031
NR
43,166
45,164
County of Atlantic NJ GO
4.00%
3/15/2039
Aa2
450,000
433,454
County of Hudson NJ GO
2.00%
11/15/2035
AA
935,000
683,169
Cumberland County Improvement Authority NJ GTD (BAM)
4.00%
10/1/2048
AA
750,000
644,969
New Jersey Economic Development Authority
5.25%
11/1/2047
A2
750,000
777,063
New Jersey Health Care Facilities Financing Authority
5.00%
10/1/2037
A2
500,000
509,007
New Jersey Transportation Trust Fund Authority
4.25%
6/15/2044
A2
500,000
460,239
New Jersey Transportation Trust Fund Authority
5.25%
6/15/2046
A2
750,000
776,595
Rutherford Board of Education NJ GO
2.50%
12/15/2034
AA-
1,000,000
811,843
State of New Jersey GO
2.50%
6/1/2038
A1
1,020,000
734,981
(d)
State of New Jersey GO
5.00%
6/1/2040
A1
750,000
778,175
Township of Berkeley Heights NJ GO
4.00%
7/1/2041
Aa1
785,000
729,373
Union County Utilities Authority–Covanta Union LLC NJ GTD AMT
4.75%
12/1/2031
AA+
980,000
980,580
Total
11,992,453
Health Care 12.53%
Camden County Improvement Authority–Cooper Hlth Sys Oblig Grp NJ
5.00%
2/15/2030
A-
530,000
531,705
Camden County Improvement Authority–Cooper Hlth Sys Oblig Grp NJ
5.00%
2/15/2032
A-
500,000
501,609
New Jersey Economic Development Authority–Bancroft Neurohealth Oblig
5.00%
6/1/2036
NR
220,000
200,116
New Jersey Health Care Facilities Financing Authority–Atlanticare Hlth Sys Oblig
2.375%
7/1/2046
AA-
695,000
398,000
(d)
New Jersey Health Care Facilities Financing Authority–Inspira Health Oblig Grp
4.00%
7/1/2047
A2
885,000
741,495
New Jersey Health Care Facilities Financing Authority–Inspira Health Oblig Grp
5.00%
7/1/2035
A2
460,000
469,506
New Jersey Health Care Facilities Financing Authority–Inspira Health Oblig Grp
5.00%
7/1/2042
A2
1,000,000
990,781
See Notes to Financial Statements.
193
Schedule of Investments (continued)
NEW JERSEY TAX FREE FUND September 30, 2023
Investments
Interest Rate
Maturity Date
Credit Rating: S&P or Moody’s(a)
Principal Amount
Fair Value
Health Care (continued)
New Jersey Health Care Facilities Financing Authority–RWJ Barnabas Health Oblig
3.00%
7/1/2051
AA-
$
1,190,000
$
791,649
New Jersey Health Care Facilities Financing Authority–RWJ Barnabas Health Oblig
4.00%
7/1/2051
AA-
1,350,000
1,166,317
New Jersey Health Care Facilities Financing Authority–RWJ Barnabas Health Oblig
5.00%
7/1/2043
AA-
1,925,000
1,931,521
New Jersey Health Care Facilities Financing Authority–St Joseph’s Hlthcr Oblig
4.00%
7/1/2048
BBB-
1,200,000
952,246
New Jersey Health Care Facilities Financing Authority–St Joseph’s Hlthcr Oblig
5.00%
7/1/2027
BBB-
100,000
100,371
New Jersey Health Care Facilities Financing Authority–St Joseph’s Hlthcr Oblig
5.00%
7/1/2041
BBB-
750,000
705,966
New Jersey Health Care Facilities Financing Authority–Univ of Penn Hlth Sys Oblig
5.00%
7/1/2039
AA
1,000,000
1,012,311
New Jersey Health Care Facilities Financing Authority–University Hospital (AGM)
5.00%
7/1/2046
AA
1,000,000
970,895
New Jersey Health Care Facilities Financing Authority–Valley Hlth Sys Oblig Grp
4.00%
7/1/2044
A
1,055,000
894,036
New Jersey Health Care Facilities Financing Authority–Valley Hlth Sys Oblig Grp
5.00%
7/1/2030
A
315,000
328,559
Total
12,687,083
Housing 0.07%
New Jersey Housing & Mortgage Finance Agency (HUD SECT 8)
3.15%
5/1/2053
AA-
100,000
66,261
Lease Obligations 19.24%
Gloucester County Improvement Authority–Rowan University NJ (AGM)
5.00%
11/1/2029
AA
250,000
256,895
Gloucester County Improvement Authority–Rowan University NJ (AGM)
5.00%
11/1/2030
AA
290,000
297,660
New Jersey Economic Development Authority
4.00%
6/15/2049
A2
1,390,000
1,202,285
New Jersey Economic Development Authority
5.00%
6/15/2029
A2
500,000
516,900
New Jersey Economic Development Authority
5.00%
6/15/2034
A2
390,000
391,909
New Jersey Economic Development Authority
5.00%
6/15/2035
A2
750,000
772,614
New Jersey Economic Development Authority
5.00%
6/15/2035
A2
640,000
648,547
194
See Notes to Financial Statements.
Schedule of Investments (continued)
NEW JERSEY TAX FREE FUND September 30, 2023
Investments
Interest Rate
Maturity Date
Credit Rating: S&P or Moody’s(a)
Principal Amount
Fair Value
Lease Obligations (continued)
New Jersey Economic Development Authority
5.00%
6/15/2042
A2
$
505,000
$
531,025
New Jersey Economic Development Authority
5.00%
6/15/2047
A2
540,000
540,657
New Jersey Economic Development Authority
5.00%
6/15/2048
A2
500,000
498,611
New Jersey Economic Development Authority–NYNJ Link Borrower LLC AMT
5.375%
1/1/2043
BBB+
1,660,000
1,662,048
New Jersey Economic Development Authority–NYNJ Link Borrower LLC AMT
5.625%
1/1/2052
BBB+
210,000
210,321
New Jersey Educational Facilities Authority
5.00%
9/1/2033
A2
1,060,000
1,066,016
New Jersey Educational Facilities Authority
5.00%
9/1/2036
A2
535,000
540,922
New Jersey Educational Facilities Authority
5.50%
9/1/2033
A2
410,000
422,254
New Jersey Health Care Facilities Financing Authority
5.00%
10/1/2038
A2
520,000
527,618
New Jersey Transportation Trust Fund Authority
Zero Coupon
12/15/2031
A2
1,980,000
1,372,483
New Jersey Transportation Trust Fund Authority
Zero Coupon
12/15/2038
A2
1,120,000
519,963
New Jersey Transportation Trust Fund Authority
4.00%
12/15/2039
A2
1,160,000
1,069,059
New Jersey Transportation Trust Fund Authority
4.00%
6/15/2050
A2
1,360,000
1,153,216
New Jersey Transportation Trust Fund Authority
4.25%
12/15/2038
A2
470,000
447,203
New Jersey Transportation Trust Fund Authority
4.75%
6/15/2038
A2
980,000
983,730
New Jersey Transportation Trust Fund Authority
5.00%
6/15/2030
A+
545,000
555,290
New Jersey Transportation Trust Fund Authority
5.00%
6/15/2031
A+
400,000
407,037
New Jersey Transportation Trust Fund Authority
5.00%
12/15/2036
A2
555,000
568,402
New Jersey Transportation Trust Fund Authority
5.00%
6/15/2038
A2
1,380,000
1,380,735
New Jersey Transportation Trust Fund Authority
5.25%
6/15/2041
A2
205,000
205,815
New Jersey Transportation Trust Fund Authority
5.25%
6/15/2043
A2
720,000
733,583
Total
19,482,798
See Notes to Financial Statements.
195
Schedule of Investments (continued)
NEW JERSEY TAX FREE FUND September 30, 2023
Investments
Interest Rate
Maturity Date
Credit Rating: S&P or Moody’s(a)
Principal Amount
Fair Value
Other Revenue 0.31%
Middlesex County Improvement Authority NJ
6.25%
1/1/2037
NR
$
1,300,000
$
16,250
New Jersey Economic Development Authority–Bancroft Neurohealth Oblig
5.00%
6/1/2041
NR
350,000
302,568
Total
318,818
Special Tax 0.83%
New Jersey Economic Development Authority Mtromall Urban
6.50%
4/1/2028
Baa2
564,458
552,883
New Jersey Infrastructure Bank
2.00%
9/1/2046
AAA
520,000
291,597
Total
844,480
Tax Revenue 5.38%
Casino Reinvestment Development Authority, Inc. NJ
5.25%
11/1/2039
BBB+
��
525,000
525,144
Casino Reinvestment Development Authority, Inc. NJ
5.25%
11/1/2044
BBB+
310,000
302,510
Casino Reinvestment Development Authority, Inc. NJ (AGM)
5.00%
11/1/2032
AA
500,000
503,783
Garden State Preservation Trust NJ (AGM)
5.75%
11/1/2028
AA
1,205,000
1,265,168
New Jersey Transportation Trust Fund Authority
3.00%
6/15/2050
A2
540,000
368,141
Puerto Rico Sales Tax Financing Corp. Sales Tax Revenue
Zero Coupon
7/1/2029
NR
18,000
14,018
Puerto Rico Sales Tax Financing Corp. Sales Tax Revenue
Zero Coupon
7/1/2031
NR
235,000
166,774
Puerto Rico Sales Tax Financing Corp. Sales Tax Revenue
Zero Coupon
7/1/2033
NR
646,000
414,732
Puerto Rico Sales Tax Financing Corp. Sales Tax Revenue
Zero Coupon
7/1/2051
NR
2,675,000
498,915
Puerto Rico Sales Tax Financing Corp. Sales Tax Revenue
4.329%
7/1/2040
NR
96,000
86,224
Puerto Rico Sales Tax Financing Corp. Sales Tax Revenue
4.329%
7/1/2040
NR
492,000
441,897
Puerto Rico Sales Tax Financing Corp. Sales Tax Revenue
4.536%
7/1/2053
NR
18,000
15,400
Puerto Rico Sales Tax Financing Corp. Sales Tax Revenue
4.55%
7/1/2040
NR
19,000
17,529
Puerto Rico Sales Tax Financing Corp. Sales Tax Revenue
4.55%
7/1/2040
NR
380,000
350,580
196
See Notes to Financial Statements.
Schedule of Investments (continued)
NEW JERSEY TAX FREE FUND September 30, 2023
Investments
Interest Rate
Maturity Date
Credit Rating: S&P or Moody’s(a)
Principal Amount
Fair Value
Tax Revenue (continued)
Puerto Rico Sales Tax Financing Corp. Sales Tax Revenue
4.75%
7/1/2053
NR
$
267,000
$
236,712
Puerto Rico Sales Tax Financing Corp. Sales Tax Revenue
4.784%
7/1/2058
NR
40,000
35,014
Territory of Guam
4.00%
1/1/2042
Ba1
250,000
203,059
Total
5,445,600
Taxable Revenue–Water & Sewer 1.21%
Jersey City Municipal Utilities Authority NJ
4.00%
5/3/2024
NR
750,000
749,708
New Jersey Economic Development Authority–New Jersey Amern Wtr Co AMT
3.75%
#(c)
11/1/2034
A+
500,000
475,268
Total
1,224,976
Tobacco 3.01%
Tobacco Settlement Financing Corp. NJ
5.00%
6/1/2046
BBB-
2,190,000
2,038,246
Tobacco Settlement Financing Corp. NJ
5.25%
6/1/2046
BBB+
1,000,000
1,005,672
Total
3,043,918
Transportation 23.37%
Delaware River & Bay Authority DE
5.00%
1/1/2039
A1
500,000
522,652
Delaware River Joint Toll Bridge Commission PA
3.00%
7/1/2049
A+
1,025,000
655,335
Delaware River Port Authority PA
5.00%
1/1/2040
A+
600,000
619,839
New Jersey Economic Development Authority
4.00%
11/1/2044
A2
275,000
245,215
New Jersey Economic Development Authority–NYNJ Link Borrower LLC (AGM) AMT
5.125%
1/1/2039
AA
925,000
926,028
New Jersey Economic Development Authority–Port Newark Container AMT
5.00%
10/1/2047
Baa2
930,000
886,296
New Jersey Transportation Trust Fund Authority
4.00%
6/15/2050
A2
1,080,000
940,093
New Jersey Transportation Trust Fund Authority
5.00%
6/15/2028
A+
1,000,000
1,020,155
New Jersey Turnpike Authority
4.00%
1/1/2043
AA-
610,000
567,597
New Jersey Turnpike Authority
4.00%
1/1/2048
AA-
1,000,000
878,053
New Jersey Turnpike Authority
5.00%
1/1/2030
AA-
715,000
740,700
New Jersey Turnpike Authority
5.00%
1/1/2034
AA-
510,000
515,657
New Jersey Turnpike Authority
5.00%
1/1/2034
AA-
615,000
635,362
New Jersey Turnpike Authority
5.00%
1/1/2046
AA-
750,000
770,926
See Notes to Financial Statements.
197
Schedule of Investments (continued)
NEW JERSEY TAX FREE FUND September 30, 2023
Investments
Interest Rate
Maturity Date
Credit Rating: S&P or Moody’s(a)
Principal Amount
Fair Value
Transportation (continued)
New Jersey Turnpike Authority
5.25%
1/1/2052
AA-
$
1,110,000
$
1,154,567
New Jersey Turnpike Authority (AGM)
5.25%
1/1/2028
AA
810,000
866,194
Port Authority of New York & New Jersey
4.00%
9/1/2043
AA-
870,000
793,995
Port Authority of New York & New Jersey
5.00%
12/1/2035
Aa3
500,000
543,434
Port Authority of New York & New Jersey
5.00%
7/15/2038
AA-
420,000
432,517
Port Authority of New York & New Jersey
5.00%
7/15/2053
Aa3
250,000
253,527
Port Authority of New York & New Jersey
5.00%
7/15/2053
Aa3
500,000
507,055
Port Authority of New York & New Jersey
5.25%
8/1/2052
AA-
250,000
258,785
Port Authority of New York & New Jersey AMT
5.00%
9/15/2032
AA-
590,000
604,617
Port Authority of New York & New Jersey AMT
5.00%
9/15/2033
AA-
850,000
870,607
Port Authority of New York & New Jersey AMT
5.00%
9/15/2034
AA-
275,000
281,328
Port Authority of New York & New Jersey AMT
5.00%
7/15/2036
Aa3
545,000
574,713
Port Authority of New York & New Jersey AMT
5.00%
10/15/2036
AA-
1,190,000
1,191,317
Port Authority of New York & New Jersey AMT
5.00%
11/15/2041
AA-
500,000
501,209
Port Authority of New York & New Jersey AMT
5.00%
12/1/2044
Aa3
500,000
505,379
South Jersey Port Corp. NJ AMT
5.00%
1/1/2048
A3
500,000
490,384
South Jersey Transportation Authority NJ
5.00%
11/1/2039
BBB+
1,320,000
1,263,796
South Jersey Transportation Authority NJ
5.25%
11/1/2052
BBB+
1,200,000
1,195,175
South Jersey Transportation Authority NJ (BAM)
4.00%
11/1/2050
AA
1,080,000
952,513
South Jersey Transportation Authority NJ (BAM)
5.00%
11/1/2045
AA
500,000
508,128
Total
23,673,148
Utilities 5.56%
Guam Government Waterworks Authority
5.00%
7/1/2036
A-
100,000
100,082
Guam Power Authority (AGM)
5.00%
10/1/2034
AA
400,000
403,024
New Jersey Economic Development Authority–Middlesex Water Co AMT
4.00%
8/1/2059
A+
500,000
389,813
New Jersey Economic Development Authority–New Jersey Amern Wtr Co AMT
2.20%
#(c)
10/1/2039
A+
500,000
412,993
New Jersey Economic Development Authority–New Jersey Natural Gas Co
3.50%
4/1/2042
A1
1,655,000
1,295,039
198
See Notes to Financial Statements.
Schedule of Investments (continued)
NEW JERSEY TAX FREE FUND September 30, 2023
Investments
Interest Rate
Maturity Date
Credit Rating: S&P or Moody’s(a)
Principal Amount
Fair Value
Utilities (continued)
New Jersey Economic Development Authority–New Jersey Natural Gas Co AMT
3.00%
8/1/2041
A1
$
1,000,000
$
714,031
New Jersey Economic Development Authority–Umm Energy Partners LLC AMT
4.75%
6/15/2032
Baa2
1,000,000
975,565
Passaic Valley Sewerage Commission NJ (AGM)
3.00%
12/1/2038
AA
1,000,000
776,061
Puerto Rico Commonwealth Aqueduct & Sewer Authority†
4.00%
7/1/2042
NR
380,000
316,954
Puerto Rico Commonwealth Aqueduct & Sewer Authority†
5.00%
7/1/2030
NR
250,000
249,698
Total
5,633,260
Total Investments in Securities 97.81% (cost $109,678,487)
99,060,995
Other Assets and Liabilities – Net(e) 2.19%
2,222,478
Net Assets 100.00%
$
101,283,473
AGM
Insured by–Assured Guaranty Municipal Corporation.
AMT
Income from the security may be subject to Alternative Minimum Tax.
BAM
Insured by–Build America Mutual.
GTD
Guaranteed.
HUD
Insured by–Department of Housing and Urban Development.
NR
Not Rated.
#
Variable rate security. The interest rate represents the rate in effect at September 30, 2023.
†
Security was purchased pursuant to Rule 144A under the Securities Act of 1933 and, unless registered under such Act or exempted from registration, may only be resold to qualified institutional buyers. At September 30, 2023, the total value of Rule 144A securities was $ 566,652, which represents 0.56% of net assets.
(a)
Unaudited.
(b)
Securities purchased on a when-issued basis (See Note 2(g)).
(c)
Variable Rate is Fixed to Float: Rate remains fixed or at Zero Coupon until designated future date.
(d)
Level 3 Investment as described in Note 2(i) in the Notes to Financials. Security valued utilizing third party pricing information without adjustment. Such valuations are based on unobservable inputs. A significant change in third party information could result in a significantly lower or higher value of such Level 3 investments.
(e)
Other Assets and Liabilities–Net include net unrealized appreciation/depreciation on futures contracts as follows:
Futures Contracts at September 30, 2023:
Type
Expiration
Contracts
Position
Notional Amount
Notional Value
Unrealized Appreciation
U.S. Long Bond
December 2023
9
Short
$(1,066,557
)
$(1,024,031
)
$42,526
See Notes to Financial Statements.
199
Schedule of Investments (concluded)
NEW JERSEY TAX FREE FUND September 30, 2023
The following is a summary of the inputs used as of September 30, 2023 in valuing the Fund’s investments carried at fair value(1):
Investment Type(2)
Level 1
Level 2
Level 3
Total
Long-Term Investments
Municipal Bonds
General Obligation
$
–
$
11,257,472
$
734,981
$
11,992,453
Health Care
–
12,289,083
398,000
12,687,083
Remaining Industries
–
74,381,459
–
74,381,459
Total
$
–
$
97,928,014
$
1,132,981
$
99,060,995
Other Financial Instruments
Futures Contracts
Assets
$
42,526
$
–
$
–
$
42,526
Liabilities
–
–
–
–
Total
$
42,526
$
–
$
–
$
42,526
(1)
Refer to Note 2(i) for a description of fair value measurements and the three-tier hierarchy of inputs.
(2)
See Schedule of Investments for fair values in each industry. The table above is presented by Investment Type. Industries are presented within an Investment Type should such Investment Type include securities classified as two or more levels within the three-tier fair value hierarchy. When applicable, each Level 3 security is identified on the Schedule of Investments along with the valuation technique utilized.
A reconciliation of Level 3 investments is presented when the Fund has a material amount of Level 3 investments at the beginning or end of the year in relation to the Fund’s net assets.
The following is a reconciliation of investments with unobservable inputs (Level 3) that were used in determining fair value:
Investment Type
Municipal Bonds
Balance as of October 1, 2022
$
–
Accrued Discounts (Premiums)
1,141
Realized Gain (Loss)
–
Change in Unrealized Appreciation (Depreciation)
(11,710
)
Purchases
–
Sales
–
Transfers into Level 3(a)
1,143,550
Transfers out of Level 3
–
Balance as of September 30, 2023
$
1,132,981
Change in unrealized appreciation/ depreciation for the year ended September 30, 2023, related to Level 3 investments held at September 30, 2023
$
(11,710
)
(a)
The Fund recognizes transfers within the fair value hierarchy as of the beginning of the period. Transfers into and out of Level 3 were primarily related to the availability of mark quotations in accordance with valuation methodology.
200
See Notes to Financial Statements.
Schedule of Investments
NEW YORK TAX FREE FUND September 30, 2023
Investments
Interest Rate
Maturity Date
Credit Rating: S&P or Moody’s(a)
Principal Amount
Fair Value
LONG-TERM INVESTMENTS 98.58%
MUNICIPAL BONDS 98.58%
Corporate-Backed 11.17%
Brooklyn Arena Local Development Corp.–Brooklyn Events Ctr LLC NY
Zero Coupon
7/15/2047
Ba1
$
250,000
$
65,375
Build NYC Resource Corp.–Pratt Paper Inc NY AMT†
4.50%
1/1/2025
NR
100,000
100,154
Build NYC Resource Corp.–Pratt Paper Inc NY AMT†
5.00%
1/1/2035
NR
250,000
251,841
New York City Industrial Development Agency–TRIPS Oblig Group NY
5.00%
7/1/2028
BBB+
1,575,000
1,556,701
New York Liberty Development Corp.
2.10%
11/15/2032
A+
2,720,000
2,187,885
New York Liberty Development Corp.
2.875%
11/15/2046
A+
7,345,000
4,953,581
New York Liberty Development Corp.–3 World Trade Center LLC†
5.00%
11/15/2044
NR
8,655,000
8,026,128
New York Liberty Development Corp.–3 World Trade Center LLC†
5.15%
11/15/2034
NR
750,000
731,377
New York Liberty Development Corp.–3 World Trade Center LLC†
7.25%
11/15/2044
NR
1,000,000
1,005,185
New York Liberty Development Corp.–Goldman Sachs Hdqtrs LLC
5.25%
10/1/2035
A2
7,215,000
7,852,326
New York Liberty Development Corp.–Goldman Sachs Hdqtrs LLC
5.50%
10/1/2037
A2
3,650,000
3,952,199
New York Liberty Development Corp.–One Bryant Park LLC
2.80%
9/15/2069
Baa1
4,630,000
3,988,644
New York State Energy Research & Development Authority–New york ST Elec & Gas(b)
4.00%
4/1/2034
Baa1
2,000,000
1,896,271
New York State Environmental Facilities Corp.–Casella Waste Systems Inc AMT
2.75%
#(c)
9/1/2050
B+
500,000
479,256
New York State Environmental Facilities Corp.–Casella Waste Systems Inc AMT†
2.875%
#(c)
12/1/2044
B+
1,500,000
1,310,705
New York State Environmental Facilities Corp.–Casella Waste Systems Inc AMT†
5.125%
#(c)
9/1/2050
B1
1,000,000
987,087
New York Transportation Development Corp.–American Airlines Inc AMT
2.25%
8/1/2026
BB-
(d)
155,000
146,316
New York Transportation Development Corp.–American Airlines Inc AMT
3.00%
8/1/2031
BB-
(d)
1,000,000
865,281
New York Transportation Development Corp.–American Airlines Inc AMT
5.25%
8/1/2031
B+
1,300,000
1,315,984
See Notes to Financial Statements.
201
Schedule of Investments (continued)
NEW YORK TAX FREE FUND September 30, 2023
Investments
Interest Rate
Maturity Date
Credit Rating: S&P or Moody’s(a)
Principal Amount
Fair Value
Corporate-Backed (continued)
New York Transportation Development Corp.–American Airlines Inc AMT
5.375%
8/1/2036
B+
$
1,025,000
$
1,004,193
New York Transportation Development Corp.–JFK Intl Air Terminal LLC AMT
4.00%
12/1/2038
Baa1
2,570,000
2,295,823
Niagara Area Development Corp.–Covanta Holding Corp NY AMT†
4.75%
11/1/2042
B
1,750,000
1,468,322
Westchester County Local Development Corp.–Miriam Osborn Mem Home Oblig NY
5.00%
7/1/2034
A
(d)
200,000
204,153
Total
46,644,787
Education 9.64%
Build NYC Resource Corp.–E Harlem Scholars Oblig Gp NY†
5.75%
6/1/2042
BB+
1,000,000
1,005,951
Build NYC Resource Corp.–Kipp NYC Public Chtr Schs NY
5.25%
7/1/2052
BBB-
1,250,000
1,203,812
Build NYC Resource Corp.–Manhattan College NY
5.00%
8/1/2033
BBB+
1,125,000
1,147,552
Build NYC Resource Corp.–New York Law School
5.00%
7/1/2041
BBB-
1,175,000
1,082,286
Build NYC Resource Corp.–Packer Collegiate Inst NY
5.00%
6/1/2040
A2
1,000,000
999,963
City of New Rochelle–Iona College NY
5.00%
7/1/2028
BBB
205,000
207,483
City of New Rochelle–Iona College NY
5.00%
7/1/2029
BBB
250,000
252,888
City of New Rochelle–Iona College NY
5.00%
7/1/2030
BBB
220,000
222,377
City of New Rochelle–Iona College NY
5.00%
7/1/2031
BBB
200,000
202,052
Dutchess County Local Development Corp.–Bard College NY
5.00%
7/1/2045
BBB-
1,000,000
967,319
Dutchess County Local Development Corp.–Bard College NY
5.00%
7/1/2051
BBB-
1,000,000
946,639
Dutchess County Local Development Corp.–Culinary Inst of America NY
4.00%
7/1/2035
Baa2
1,145,000
1,041,679
Dutchess County Local Development Corp.–Culinary Inst of America NY
4.00%
7/1/2037
Baa2
965,000
841,631
Dutchess County Local Development Corp.–Culinary Inst of America NY
4.00%
7/1/2040
Baa2
425,000
353,640
Dutchess County Local Development Corp.–Culinary Inst of America NY
5.00%
7/1/2033
Baa2
390,000
392,423
Dutchess County Local Development Corp.–Culinary Inst of America NY
5.00%
7/1/2041
Baa2
200,000
190,869
202
See Notes to Financial Statements.
Schedule of Investments (continued)
NEW YORK TAX FREE FUND September 30, 2023
Investments
Interest Rate
Maturity Date
Credit Rating: S&P or Moody’s(a)
Principal Amount
Fair Value
Education (continued)
Dutchess County Local Development Corp.–Culinary Inst of America NY
5.00%
7/1/2046
Baa2
$
275,000
$
255,614
Dutchess County Local Development Corp.–Millbrook School NY
4.00%
9/1/2051
A
1,500,000
1,201,502
Dutchess County Local Development Corp.–Vassar College NY
5.00%
7/1/2034
Aa3
275,000
285,089
Hempstead Town Local Development Corp.–Adelphi University NY
4.00%
2/1/2039
A-
2,240,000
1,929,426
Hempstead Town Local Development Corp.–Adelphi University NY
5.00%
6/1/2029
A-
500,000
521,457
Hempstead Town Local Development Corp.–Adelphi University NY
5.00%
6/1/2030
A-
200,000
209,605
Hempstead Town Local Development Corp.–Adelphi University NY
5.00%
6/1/2031
A-
565,000
595,510
Hempstead Town Local Development Corp.–Adelphi University NY
5.00%
6/1/2032
A-
330,000
347,558
Hempstead Town Local Development Corp.–Hofstra University NY
5.00%
7/1/2042
A
545,000
552,267
Hempstead Town Local Development Corp.–Molloy College NY
5.00%
7/1/2034
BBB
825,000
826,406
Hempstead Town Local Development Corp.–Molloy College NY
5.00%
7/1/2037
BBB
630,000
612,705
Hempstead Town Local Development Corp.–Molloy College NY
5.00%
7/1/2039
BBB
555,000
528,830
Monroe County Industrial Development Corp.–University of Rochester NY
5.00%
7/1/2031
AA-
350,000
363,566
New York City Industrial Development Agency–Yankee Stadium LLLC NY (AGM)
3.00%
3/1/2049
AA
2,050,000
1,355,089
New York State Dormitory Authority
5.00%
2/15/2041
NR
5,000
5,265
New York State Dormitory Authority–Barnard College
4.00%
7/1/2034
A3
460,000
437,307
New York State Dormitory Authority–Barnard College
4.00%
7/1/2036
A3
325,000
301,148
New York State Dormitory Authority–Barnard College
4.00%
7/1/2037
A3
710,000
644,848
New York State Dormitory Authority–Fordham University
5.00%
7/1/2035
A
550,000
562,533
New York State Dormitory Authority–Icahn Sch of Med Mt Sinai
5.00%
7/1/2040
A-
2,200,000
2,174,159
See Notes to Financial Statements.
203
Schedule of Investments (continued)
NEW YORK TAX FREE FUND September 30, 2023
Investments
Interest Rate
Maturity Date
Credit Rating: S&P or Moody’s(a)
Principal Amount
Fair Value
Education (continued)
New York State Dormitory Authority–Iona College
5.00%
7/1/2046
BBB
$
375,000
$
354,581
New York State Dormitory Authority–Pratt Institute
5.00%
7/1/2039
A2
1,045,000
1,047,298
New York State Dormitory Authority–St John’s University
5.00%
7/1/2027
A-
250,000
252,879
New York State Dormitory Authority–The New School
4.00%
7/1/2047
A3
1,000,000
803,851
New York State Dormitory Authority–The New School
5.00%
7/1/2028
A3
780,000
797,071
New York State Dormitory Authority–Yeshiva University
5.00%
7/15/2037
BBB-
1,000,000
985,426
New York State Dormitory Authority–Yeshiva University
5.00%
7/15/2042
BBB-
1,000,000
944,780
Onondaga Civic Development Corp.–Le Moyne College NY
4.00%
7/1/2038
Baa2
150,000
129,899
Onondaga Civic Development Corp.–Le Moyne College NY
4.00%
7/1/2040
Baa2
300,000
253,119
Onondaga Civic Development Corp.–Le Moyne College NY
4.00%
7/1/2041
Baa2
415,000
345,732
Onondaga Civic Development Corp.–Le Moyne College NY
5.00%
7/1/2035
Baa2
365,000
369,038
Onondaga Civic Development Corp.–Le Moyne College NY
5.00%
7/1/2036
Baa2
465,000
466,308
Onondaga Civic Development Corp.–Le Moyne College NY
5.00%
7/1/2046
Baa2
600,000
559,170
Schenectady County Capital Resource Corp.–Union College NY
5.25%
7/1/2052
A1
545,000
566,089
St. Lawrence County Industrial Development Agency–Clarkson University NY
5.00%
9/1/2037
Baa1
455,000
450,686
St. Lawrence County Industrial Development Agency–Clarkson University NY
5.00%
9/1/2038
Baa1
475,000
466,053
St. Lawrence County Industrial Development Agency–Clarkson University NY
5.00%
9/1/2041
Baa1
160,000
153,724
Troy Capital Resource Corp.–Rensselaer Polytech Inst NY
4.00%
9/1/2040
A3
1,000,000
864,360
Troy Capital Resource Corp.–Rensselaer Polytech Inst NY
5.00%
8/1/2032
A3
1,415,000
1,437,086
Troy Capital Resource Corp. NY
4.00%
9/1/2034
A3
855,000
797,818
Troy Capital Resource Corp. NY
4.00%
9/1/2035
A3
395,000
370,972
204
See Notes to Financial Statements.
Schedule of Investments (continued)
NEW YORK TAX FREE FUND September 30, 2023
Investments
Interest Rate
Maturity Date
Credit Rating: S&P or Moody’s(a)
Principal Amount
Fair Value
Education (continued)
Troy Capital Resource Corp. NY
4.00%
9/1/2036
A3
$
1,140,000
$
1,044,541
Westchester County Local Development Corp.–Miriam Osborn Mem Home Oblig NY
5.00%
7/1/2042
A
(d)
450,000
448,149
Westchester County Local Development Corp.–Sarah Lawrence College NY
4.00%
6/1/2033
BBB-
1,710,000
1,604,802
Total
40,281,880
General Obligation 10.91%
City of Long Beach NY GO (BAM)
5.25%
7/15/2034
AA
510,000
541,644
City of Long Beach NY GO (BAM)
5.25%
7/15/2035
AA
400,000
422,856
City of Long Beach NY GO (BAM)
5.25%
7/15/2036
AA
300,000
313,894
City of Long Beach NY GO (BAM)
5.25%
7/15/2037
AA
810,000
839,934
City of Long Beach NY GO (BAM)
5.25%
7/15/2042
AA
500,000
506,115
City of New York GO
4.00%
4/1/2050
AA
2,455,000
2,127,898
City of New York NY GO
4.125%
8/1/2053
Aa2
2,230,000
1,941,440
City of New York NY GO
5.00%
8/1/2027
AA
1,750,000
1,774,815
City of New York NY GO
5.00%
8/1/2037
Aa2
1,000,000
1,060,173
City of New York NY GO
5.00%
10/1/2037
AA
2,500,000
2,588,960
City of New York NY GO
5.00%
3/1/2044
AA
3,000,000
3,064,363
City of New York NY GO
5.25%
9/1/2043
AA
1,150,000
1,206,648
City of New York NY GO
5.25%
10/1/2047
AA
1,860,000
1,934,108
City of New York NY GO
5.50%
5/1/2044
AA
2,085,000
2,223,727
Commonwealth of Puerto Rico GO
Zero Coupon
7/1/2024
NR
30,952
29,906
Commonwealth of Puerto Rico GO
Zero Coupon
7/1/2033
NR
244,309
144,398
Commonwealth of Puerto Rico GO
Zero Coupon
#(c)
11/1/2043
NR
894,821
465,307
Commonwealth of Puerto Rico GO
4.00%
7/1/2033
NR
189,842
170,563
Commonwealth of Puerto Rico GO
4.00%
7/1/2035
NR
170,642
148,700
Commonwealth of Puerto Rico GO
4.00%
7/1/2037
NR
146,457
123,314
Commonwealth of Puerto Rico GO
5.375%
7/1/2025
NR
211,432
213,709
Commonwealth of Puerto Rico GO
5.625%
7/1/2027
NR
209,517
215,215
Commonwealth of Puerto Rico GO
5.625%
7/1/2029
NR
206,118
213,296
Commonwealth of Puerto Rico GO
5.75%
7/1/2031
NR
200,202
209,467
County of Nassau NY GO
4.00%
4/1/2053
AA-
2,000,000
1,703,790
Jefferson County Civic Facility Development Corp.–Samaritan Med Ctr Oblig NY
5.00%
11/1/2037
BB
2,000,000
1,743,150
New York City Transitional Finance Authority Future Tax Secured Revenue
5.00%
2/1/2044
AAA
2,700,000
2,765,637
See Notes to Financial Statements.
205
Schedule of Investments (continued)
NEW YORK TAX FREE FUND September 30, 2023
Investments
Interest Rate
Maturity Date
Credit Rating: S&P or Moody’s(a)
Principal Amount
Fair Value
General Obligation (continued)
New York City Transitional Finance
Authority Future Tax Secured Revenue NY
4.00%
2/1/2051
AAA
$
3,200,000
$
2,792,437
New York City Transitional Finance Authority Future Tax Secured Revenue NY
5.25%
11/1/2040
AAA
2,000,000
2,125,660
New York State Dormitory Authority
4.00%
3/15/2044
AA+
2,500,000
2,257,649
New York State Dormitory Authority
5.00%
3/15/2053
Aa1
2,500,000
2,551,565
New York State Dormitory Authority (AGM)
5.00%
10/1/2027
AA
1,000,000
1,008,894
New York State Thruway Authority
5.00%
3/15/2053
AA+
1,550,000
1,565,949
New York State Urban Development Corp.
4.00%
3/15/2047
AA+
2,295,000
2,028,200
New York State Urban Development Corp.
5.00%
3/15/2050
Aa1
2,500,000
2,541,105
Total
45,564,486
Health Care 13.05%
Brookhaven Local Development Corp.–Active Ret Cmnty Oblig Gp NY
4.00%
11/1/2045
BBB
(d)
1,000,000
794,350
Brookhaven Local Development Corp.–Active Ret Cmnty Oblig Gp NY
4.00%
11/1/2055
BBB
(d)
1,000,000
732,327
Brookhaven Local Development Corp.–Long Island Cmnty Hosp Oblig NY
3.375%
10/1/2040
A
365,000
272,934
Brookhaven Local Development Corp.–Long Island Cmnty Hosp Oblig NY
4.00%
10/1/2045
A
1,865,000
1,549,221
Brookhaven Local Development Corp.–Long Island Cmnty Hosp Oblig NY
5.00%
10/1/2050
A
1,000,000
966,675
Broome County Local Development Corp.–United Hlth Svcs Hosps Oblig NY (AGM)
3.00%
4/1/2036
AA
1,030,000
811,363
Broome County Local Development Corp.–United Hlth Svcs Hosps Oblig NY (AGM)
3.00%
4/1/2037
AA
1,500,000
1,146,595
Buffalo & Erie County Industrial Land Development Corp.–Catholic Hlth Sys Oblig NY
5.00%
7/1/2025
B-
300,000
289,941
Buffalo & Erie County Industrial Land Development Corp.–Orchard Park Ccrc Inc NY
5.00%
11/15/2037
BBB
(d)
1,000,000
969,420
Dutchess County Local Development Corp.–Nuvance Health Oblig Grp NY
4.00%
7/1/2044
BBB
1,250,000
1,017,786
Dutchess County Local Development Corp.–Nuvance Health Oblig Grp NY
4.00%
7/1/2049
BBB
2,120,000
1,613,310
Dutchess County Local Development Corp.–Nuvance Health Oblig Grp NY
5.00%
7/1/2035
BBB
1,765,000
1,748,501
206
See Notes to Financial Statements.
Schedule of Investments (continued)
NEW YORK TAX FREE FUND September 30, 2023
Investments
Interest Rate
Maturity Date
Credit Rating: S&P or Moody’s(a)
Principal Amount
Fair Value
Health Care (continued)
Genesee County Funding Corp.–Rochester Regl Health Oblig NY
5.25%
12/1/2052
BBB+
$
1,000,000
$
964,246
Monroe County Industrial Development Corp.–Rochester General Hosp Oblig NY
5.00%
12/1/2034
BBB+
250,000
252,301
Monroe County Industrial Development Corp.–Rochester Regl Health Oblig NY
4.00%
12/1/2035
BBB+
600,000
543,317
Monroe County Industrial Development Corp.–Rochester Regl Health Oblig NY
4.00%
12/1/2036
BBB+
450,000
408,076
Nassau County Local Economic Assistance Corp.–Catholic Hlth Lng Isl Oblig NY
5.00%
7/1/2027
A-
625,000
628,536
Nassau County Local Economic Assistance Corp.–Catholic Hlth Lng Isl Oblig NY
5.00%
7/1/2028
A-
2,045,000
2,056,167
Nassau County Local Economic Assistance Corp.–Catholic Hlth Lng Isl Oblig NY
5.00%
7/1/2033
A-
905,000
907,142
New York City Industrial Development Agency–Yankee Stadium LLC NY
3.00%
3/1/2049
Baa1
2,115,000
1,357,587
New York State Dormitory Authority–Catholic Hlth Sys Oblig
4.00%
7/1/2045
B-
2,895,000
1,981,193
New York State Dormitory Authority–Catholic Hlth Sys Oblig
5.00%
7/1/2032
B-
500,000
431,817
New York State Dormitory Authority–Garnet Hlth Med Ctr Oblig†
5.00%
12/1/2026
BBB-
1,000,000
975,079
New York State Dormitory Authority–Garnet Hlth Med Ctr Oblig†
5.00%
12/1/2029
BBB-
1,900,000
1,821,078
New York State Dormitory Authority–Icahn Sch of Med Mt Sinai
5.00%
7/1/2033
A-
4,015,000
4,035,456
New York State Dormitory Authority–Icahn Sch of Med Mt Sinai
5.00%
7/1/2034
A-
1,750,000
1,758,569
New York State Dormitory Authority–Maimonides Medical Ctr (FHA)
3.00%
2/1/2050
AA+
1,000,000
659,252
New York State Dormitory Authority–Montefiore Oblig Grp
4.00%
8/1/2036
BBB-
475,000
430,969
New York State Dormitory Authority–Montefiore Oblig Grp
4.00%
8/1/2037
BBB-
1,820,000
1,618,983
New York State Dormitory Authority–Montefiore Oblig Grp
4.00%
8/1/2038
BBB-
1,520,000
1,329,774
New York State Dormitory Authority–Montefiore Oblig Grp
4.00%
9/1/2050
BBB-
5,500,000
4,257,377
New York State Dormitory Authority–Montefiore Oblig Grp
5.00%
8/1/2035
BBB-
525,000
512,885
See Notes to Financial Statements.
207
Schedule of Investments (continued)
NEW YORK TAX FREE FUND September 30, 2023
Investments
Interest Rate
Maturity Date
Credit Rating: S&P or Moody’s(a)
Principal Amount
Fair Value
Health Care (continued)
New York State Dormitory Authority–Northwell Hlth Oblig Grp
4.00%
5/1/2045
A-
$
2,120,000
$
1,801,357
New York State Dormitory Authority–Northwell Hlth Oblig Grp
5.00%
5/1/2028
A-
1,000,000
1,008,998
New York State Dormitory Authority–Northwell Hlth Oblig Grp
5.00%
5/1/2038
A-
1,005,000
1,031,552
New York State Dormitory Authority–NYU Langone Hosps Oblig
5.00%
7/1/2032
A+
810,000
827,150
New York State Dormitory Authority–NYU Langone Hosps Oblig
5.00%
7/1/2033
A+
760,000
775,991
Niagara Area Development Corp.–Catholic Hlth Sys Oblig NY
5.00%
7/1/2052
B-
1,000,000
746,843
Oneida County Local Development Corp.–Mohawk Valley Hlth Oblig NY (AGM)
4.00%
12/1/2049
AA
4,645,000
3,761,789
(e)
Southold Local Development Corp.–Peconic Lndg At Southold NY
5.00%
12/1/2045
BBB-
(d)
1,000,000
887,170
Tompkins County Development Corp.–Kendal At Ithaca Inc NY
5.00%
7/1/2044
BBB+
920,000
827,680
Westchester County Healthcare Corp. Oblig NY
6.00%
11/1/2030
BBB-
105,000
105,110
Westchester County Healthcare Corp. Oblig NY
6.125%
11/1/2037
BBB-
40,000
40,077
Westchester County Local Development Corp. Health Oblig NY
5.00%
11/1/2033
BBB-
1,000,000
940,528
Westchester County Local Development Corp. Health Oblig NY
5.00%
11/1/2034
BBB-
1,065,000
989,987
Westchester County Local Development Corp. Health Oblig NY
5.00%
11/1/2046
BBB-
2,240,000
1,934,739
Total
54,521,198
Housing 1.57%
New York City Housing Development Corp. NY
3.35%
11/1/2065
AA+
1,375,000
899,239
New York City Housing Development Corp. NY
4.50%
2/15/2048
NR
1,000,000
981,112
New York State Dormitory Authority
5.00%
7/1/2048
Aa3
1,000,000
1,019,028
New York State Dormitory Authority
5.00%
7/1/2053
Aa3
2,060,000
2,087,371
New York State Housing Finance Agency
3.15%
11/1/2054
Aa2
1,000,000
640,403
Westchester County Local Development Corp.–Purchase Housing Corp Ii NY
5.00%
6/1/2047
BBB
1,000,000
935,452
Total
6,562,605
208
See Notes to Financial Statements.
Schedule of Investments (continued)
NEW YORK TAX FREE FUND September 30, 2023
Investments
Interest Rate
Maturity Date
Credit Rating: S&P or Moody’s(a)
Principal Amount
Fair Value
Lease Obligations 0.76%
Hudson Yards Infrastructure Corp. NY
5.00%
2/15/2033
AA
$
1,075,000
$
1,117,019
New York City Transitional Finance Authority Building Aid Revenue NY
5.00%
7/15/2035
AA
2,005,000
2,068,963
Total
3,185,982
Other 0.55%
Build NYC Resource Corp.–Children’s Aid Society NY
4.00%
7/1/2049
A+
2,775,000
2,281,020
Other Revenue 3.65%
Brooklyn Arena Local Development Corp.–Brooklyn Events Ctr LLC NY
5.00%
7/15/2042
Ba1
3,000,000
2,852,419
Build NYC Resource Corp.–Shefa School NY†
5.00%
6/15/2051
NR
1,315,000
1,040,492
New York State Thruway Authority
5.00%
3/15/2046
AA+
2,500,000
2,552,625
New York State Thruway Authority
5.00%
3/15/2048
AA+
2,070,000
2,103,877
Triborough Bridge & Tunnel Authority NY
5.00%
11/15/2032
AA+
1,250,000
1,363,031
Triborough Bridge & Tunnel Authority NY
5.50%
5/15/2052
AA+
5,020,000
5,315,918
Total
15,228,362
Special Tax 2.59%
New York City Industrial Development Agency–Queens Ballpark Co LLC NY (AGM)
3.00%
1/1/2040
AA
1,975,000
1,508,102
New York City Industrial Development Agency–Queens Ballpark Co LLC NY (AGM)
3.00%
1/1/2046
AA
3,100,000
2,138,616
New York City Industrial Development Agency–Yankee Stadium LLC NY
4.00%
3/1/2045
Baa1
1,950,000
1,650,396
New York City Industrial Development Agency–Yankee Stadium LLC NY (AGC)
Zero Coupon
3/1/2043
AA
425,000
154,245
New York City Industrial Development Agency–Yankee Stadium LLC NY (AGC)
Zero Coupon
3/1/2044
AA
640,000
218,995
New York City Industrial Development Agency–Yankee Stadium LLC NY (AGC)
Zero Coupon
3/1/2047
AA
385,000
110,295
New York City Industrial Development Agency–Yankee Stadium LLC NY (FGIC)
4.058% (CPI YoY * 1 + .88%
)
3/1/2026
Baa1
3,590,000
3,579,517
New York City Transitional Finance Authority Future Tax Secured Revenue NY
5.25%
11/1/2037
AAA
1,370,000
1,478,355
Total
10,838,521
See Notes to Financial Statements.
209
Schedule of Investments (continued)
NEW YORK TAX FREE FUND September 30, 2023
Investments
Interest Rate
Maturity Date
Credit Rating: S&P or Moody’s(a)
Principal Amount
Fair Value
Tax Revenue 8.69%
Metropolitan Transportation Authority NY
5.00%
11/15/2034
AA
$
1,085,000
$
1,135,043
Metropolitan Transportation Authority NY
5.00%
11/15/2047
AA
2,060,000
2,116,069
Metropolitan Transportation Authority NY
5.25%
11/15/2032
AA
670,000
696,085
Metropolitan Transportation Authority NY
5.25%
11/15/2034
AA
455,000
471,784
New York City Transitional Finance Authority
5.50%
5/1/2047
Aa1
5,000,000
5,342,140
New York City Transitional Finance Authority Future Tax Secured Revenue
4.00%
5/1/2053
Aa1
1,000,000
853,972
New York City Transitional Finance Authority Future Tax Secured Revenue
5.00%
5/1/2053
Aa1
2,500,000
2,532,855
New York City Transitional Finance Authority Future Tax Secured Revenue NY
5.00%
11/1/2032
AAA
1,555,000
1,590,640
New York City Transitional Finance Authority Future Tax Secured Revenue NY
5.00%
5/1/2035
AAA
1,290,000
1,317,449
New York City Transitional Finance Authority Future Tax Secured Revenue NY
5.00%
2/1/2047
AAA
2,180,000
2,216,740
New York State Dormitory Authority
4.00%
3/15/2043
AA+
2,000,000
1,818,981
New York State Urban Development Corp.
5.00%
3/15/2033
AA+
2,010,000
2,014,399
New York State Urban Development Corp.
5.00%
3/15/2036
AA+
1,500,000
1,505,082
Puerto Rico Sales Tax Financing Corp. Sales Tax Revenue
Zero Coupon
7/1/2029
NR
163,000
126,943
Puerto Rico Sales Tax Financing Corp. Sales Tax Revenue
Zero Coupon
7/1/2031
NR
708,000
502,452
Puerto Rico Sales Tax Financing Corp. Sales Tax Revenue
Zero Coupon
7/1/2033
NR
710,000
455,820
Puerto Rico Sales Tax Financing Corp. Sales Tax Revenue
Zero Coupon
7/1/2051
NR
7,476,000
1,394,350
Puerto Rico Sales Tax Financing Corp. Sales Tax Revenue
4.329%
7/1/2040
NR
489,000
439,202
Puerto Rico Sales Tax Financing Corp. Sales Tax Revenue
4.329%
7/1/2040
NR
858,000
770,624
Puerto Rico Sales Tax Financing Corp. Sales Tax Revenue
4.536%
7/1/2053
NR
64,000
54,754
Puerto Rico Sales Tax Financing Corp. Sales Tax Revenue
4.55%
7/1/2040
NR
153,000
141,155
Puerto Rico Sales Tax Financing Corp. Sales Tax Revenue
4.55%
7/1/2040
NR
380,000
350,580
Puerto Rico Sales Tax Financing Corp. Sales Tax Revenue
4.75%
7/1/2053
NR
1,199,000
1,062,987
210
See Notes to Financial Statements.
Schedule of Investments (continued)
NEW YORK TAX FREE FUND September 30, 2023
Investments
Interest Rate
Maturity Date
Credit Rating: S&P or Moody’s(a)
Principal Amount
Fair Value
Tax Revenue (continued)
Puerto Rico Sales Tax Financing Corp. Sales Tax Revenue
4.784%
7/1/2058
NR
$
180,000
$
157,562
Puerto Rico Sales Tax Financing Corp. Sales Tax Revenue
5.00%
7/1/2058
NR
1,922,000
1,743,414
Territory of Guam
4.00%
1/1/2042
Ba1
750,000
609,176
Triborough Bridge & Tunnel Authority NY
4.00%
5/15/2046
AA+
2,015,000
1,782,064
Triborough Bridge & Tunnel Authority Sales Tax Revenue NY
5.00%
5/15/2047
AA+
3,000,000
3,083,521
Total
36,285,843
Tobacco 3.27%
Erie Tobacco Asset Securitization Corp. NY
Zero Coupon
6/1/2055
NR
8,000,000
501,765
Erie Tobacco Asset Securitization Corp. NY†
Zero Coupon
6/1/2060
NR
20,000,000
1,036,064
Monroe Tobacco Asset Securitization Corp. NY†
Zero Coupon
6/1/2061
NR
10,000,000
409,082
Nassau County Tobacco Settlement Corp. NY
Zero Coupon
6/1/2060
NR
15,000,000
738,071
Nassau County Tobacco Settlement Corp. NY
5.125%
6/1/2046
CCC+
2,085,000
1,818,500
New York Counties Tobacco Trust IV
Zero Coupon
6/1/2060
NR
20,000,000
1,107,782
Rockland Tobacco Asset Securitization Corp. NY†
Zero Coupon
8/15/2060
NR
10,575,000
646,037
Suffolk Tobacco Asset Securitization Corp. NY
Zero Coupon
6/1/2066
NR
7,700,000
717,799
TSASC, Inc. NY
5.00%
6/1/2034
A-
1,000,000
1,023,752
TSASC, Inc. NY
5.00%
6/1/2035
A-
300,000
306,040
TSASC, Inc. NY
5.00%
6/1/2036
A-
100,000
101,587
TSASC, Inc. NY
5.00%
6/1/2041
A-
545,000
545,685
TSASC, Inc. NY
5.00%
6/1/2048
NR
3,300,000
2,864,773
Westchester Tobacco Asset Securitization Corp. NY
5.125%
6/1/2051
BB-
1,845,000
1,822,023
Total
13,638,960
Transportation 25.67%
Buffalo & Fort Erie Public Bridge Authority NY
5.00%
1/1/2034
A+
600,000
617,467
Metropolitan Transportation Authority NY
4.00%
11/15/2051
A3
3,190,000
2,611,742
Metropolitan Transportation Authority NY
4.75%
11/15/2045
A3
3,255,000
3,035,293
See Notes to Financial Statements.
211
Schedule of Investments (continued)
NEW YORK TAX FREE FUND September 30, 2023
Investments
Interest Rate
Maturity Date
Credit Rating: S&P or Moody’s(a)
Principal Amount
Fair Value
Transportation (continued)
Metropolitan Transportation Authority NY
5.00%
11/15/2029
A3
$
2,450,000
$
2,537,609
Metropolitan Transportation Authority NY
5.00%
11/15/2029
A3
1,730,000
1,744,395
Metropolitan Transportation Authority NY
5.00%
11/15/2030
A3
1,885,000
1,917,050
Metropolitan Transportation Authority NY
5.00%
11/15/2030
A3
700,000
724,091
Metropolitan Transportation Authority NY
5.00%
11/15/2033
A3
1,900,000
1,957,783
Metropolitan Transportation Authority NY
5.00%
#(c)
11/15/2045
A3
2,995,000
3,083,796
Metropolitan Transportation Authority NY
5.00%
11/15/2050
A3
2,115,000
2,062,758
Metropolitan Transportation Authority NY
5.25%
11/15/2028
A3
3,740,000
3,793,537
Metropolitan Transportation Authority NY
5.25%
11/15/2035
A3
1,170,000
1,166,816
Metropolitan Transportation Authority NY
5.25%
11/15/2038
A3
1,640,000
1,640,073
New York State Thruway Authority
4.00%
1/1/2050
A2
1,920,000
1,630,564
New York State Thruway Authority
5.00%
1/1/2036
A1
1,760,000
1,762,093
New York Transportation Development Corp.–Delta Air Lines Inc AMT
4.00%
1/1/2036
Baa3
3,625,000
3,345,191
New York Transportation Development Corp.–Delta Air Lines Inc AMT
5.00%
1/1/2036
Baa3
2,295,000
2,284,955
New York Transportation Development Corp.–Delta Air Lines Inc AMT
5.00%
10/1/2040
Baa3
2,645,000
2,542,498
New York Transportation Development Corp.–Empire St Thruway Partnrs AMT
4.00%
10/31/2041
BBB-
(d)
860,000
737,929
New York Transportation Development Corp.–Empire St Thruway Partnrs AMT
4.00%
4/30/2053
BBB-
(d)
4,910,000
3,841,927
New York Transportation Development Corp.–JFK Intl Air Terminal LLC
4.00%
12/1/2041
Baa1
1,180,000
1,037,291
New York Transportation Development Corp.–JFK Intl Air Terminal LLC
4.00%
12/1/2042
Baa1
1,800,000
1,562,866
New York Transportation Development Corp.–JFK Intl Air Terminal LLC AMT
4.00%
12/1/2039
Baa1
345,000
305,668
New York Transportation Development Corp.–JFK Intl Air Terminal LLC AMT
4.00%
12/1/2040
Baa1
1,380,000
1,208,792
New York Transportation Development Corp.–JFK Intl Air Terminal LLC AMT
4.00%
12/1/2041
Baa1
2,875,000
2,490,111
New York Transportation Development Corp.–JFK Intl Air Terminal LLC AMT
5.00%
12/1/2034
Baa1
565,000
578,582
New York Transportation Development Corp.–JFK Intl Air Terminal LLC AMT
5.00%
12/1/2039
Baa1
1,190,000
1,184,812
New York Transportation Development Corp.–JFK Intl Air Terminal LLC AMT
5.00%
12/1/2042
Baa1
930,000
907,153
212
See Notes to Financial Statements.
Schedule of Investments (continued)
NEW YORK TAX FREE FUND September 30, 2023
Investments
Interest Rate
Maturity Date
Credit Rating: S&P or Moody’s(a)
Principal Amount
Fair Value
Transportation (continued)
New York Transportation Development Corp.–Laguardia Gateway Partner AMT
4.00%
7/1/2033
Baa2
$
2,840,000
$
2,636,785
New York Transportation Development Corp.–Laguardia Gateway Partner AMT
4.00%
7/1/2046
Baa2
2,210,000
1,768,222
New York Transportation Development Corp.–Laguardia Gateway Partner AMT
5.25%
1/1/2050
Baa2
13,805,000
13,549,679
Niagara Frontier Transportation Authority NY AMT
5.00%
4/1/2027
A3
1,000,000
999,936
Niagara Frontier Transportation Authority NY AMT
5.00%
4/1/2036
A3
850,000
861,003
Niagara Frontier Transportation Authority NY AMT
5.00%
4/1/2038
A3
725,000
724,076
Niagara Frontier Transportation Authority NY AMT
5.00%
4/1/2039
A3
350,000
347,423
Port Authority of New York & New Jersey
5.00%
7/15/2053
Aa3
1,000,000
1,014,109
Port Authority of New York & New Jersey
5.00%
7/15/2053
Aa3
2,000,000
2,028,219
Port Authority of New York & New Jersey AMT
4.00%
9/1/2043
AA-
3,000,000
2,599,101
Port Authority of New York & New Jersey AMT
5.00%
9/15/2029
AA-
600,000
615,769
Port Authority of New York & New Jersey AMT
5.00%
11/15/2031
AA-
3,430,000
3,507,931
Port Authority of New York & New Jersey AMT
5.00%
9/1/2032
AA-
805,000
834,935
Port Authority of New York & New Jersey AMT
5.00%
9/15/2033
AA-
5,335,000
5,464,341
Port Authority of New York & New Jersey AMT
5.00%
10/15/2033
AA-
1,000,000
1,017,289
Port Authority of New York & New Jersey AMT
5.00%
10/15/2033
AA-
1,595,000
1,699,679
Port Authority of New York & New Jersey AMT
5.00%
9/15/2034
AA-
1,030,000
1,053,702
Port Authority of New York & New Jersey AMT
5.00%
7/15/2036
Aa3
2,500,000
2,636,300
Port Authority of New York & New Jersey AMT
5.00%
11/15/2041
AA-
2,000,000
2,004,837
Port Authority of New York & New Jersey AMT
5.00%
9/15/2048
AA-
365,000
352,240
Port Authority of New York & New Jersey AMT
5.50%
8/1/2052
AA-
4,225,000
4,399,405
See Notes to Financial Statements.
213
Schedule of Investments (continued)
NEW YORK TAX FREE FUND September 30, 2023
Investments
Interest Rate
Maturity Date
Credit Rating: S&P or Moody’s(a)
Principal Amount
Fair Value
Transportation (continued)
Triborough Bridge & Tunnel Authority NY
5.25%
11/15/2053
Aa3
$
2,600,000
$
2,697,718
Triborough Bridge & Tunnel Authority NY
5.50%
11/15/2057
AA-
2,000,000
2,102,806
Total
107,228,347
Utilities 7.06%
Chautauqua County Capital Resource
Corp.–NRG Energy Inc NY
4.25%
#(c)
4/1/2042
BBB-
1,000,000
965,357
Guam Government Waterworks Authority
5.00%
7/1/2036
A-
400,000
400,328
Long Island Power Authority NY
5.00%
9/1/2034
A
2,000,000
2,014,293
Long Island Power Authority NY
5.00%
9/1/2039
A
2,265,000
2,275,347
Long Island Power Authority NY
5.00%
9/1/2053
A2
2,000,000
2,046,104
New York City Municipal Water Finance Authority(b)
5.25%
6/15/2048
AA+
1,750,000
1,839,755
New York City Municipal Water Finance Authority(b)
5.25%
6/15/2053
AA+
3,000,000
3,138,035
New York City Municipal Water Finance Authority NY
5.00%
6/15/2035
AA+
1,700,000
1,706,562
New York City Municipal Water Finance Authority NY
5.00%
6/15/2036
AA+
2,775,000
2,783,429
New York City Municipal Water Finance Authority NY
5.00%
6/15/2036
AA+
2,250,000
2,256,834
New York City Municipal Water Finance Authority NY
5.25%
6/15/2052
AA+
5,220,000
5,449,161
New York State Environmental Facilities Corp.
5.25%
9/15/2052
AAA
3,335,000
3,518,302
Puerto Rico Commonwealth Aqueduct & Sewer Authority†
4.00%
7/1/2042
NR
700,000
583,862
Puerto Rico Commonwealth Aqueduct & Sewer Authority†
5.00%
7/1/2030
NR
500,000
499,395
Total
29,476,764
Total Municipal Bonds (cost $456,381,100)
411,738,755
214
See Notes to Financial Statements.
Schedule of Investments (continued)
NEW YORK TAX FREE FUND September 30, 2023
Investments
Interest Rate#
Interest Rate Reset Date(f)
Final Maturity Date
Credit Rating: S&P or Moody’s(a)
Principal Amount
Fair Value
SHORT-TERM INVESTMENTS 1.55%
VARIABLE RATE DEMAND NOTES 1.55%
General Obligation
City of New York NY GO
4.750%
10/2/2023
3/1/2040
AA
$
6,500,000
$
6,500,000
Total Short-Term Investments (cost $6,500,000)
6,500,000
Total Investments in Securities 100.13% (cost $462,881,100)
418,238,755
Other Assets and Liabilities – Net(g) (0.13)%
(559,622
)
Net Assets 100.00%
$
417,679,133
AGC
Insured by–Assured Guarantee Corp.
AGM
Insured by–Assured Guaranty Municipal Corporation.
AMT
Income from the security may be subject to Alternative Minimum Tax.
BAM
Insured by–Build America Mutual.
CPI
Consumer Price Index: Rate fluctuates based on CPI.
FGIC
Insured by–Financial Guaranty Insurance Company.
FHA
Insured by–Federal Housing Administration.
NR
Not Rated.
SIFMA
Insured by–Securities Industry and Financial Markets Association.
TRIPS
Tax Refund Intercept Programs.
YoY
Year on Year Inflation Rates.
†
Security was purchased pursuant to Rule 144A under the Securities Act of 1933 and, unless registered under such Act or exempted from registration, may only be resold to qualified institutional buyers. At September 30, 2023, the total value of Rule 144A securities was $21,897,839, which represents 5.24% of net assets.
#
Variable rate security. The interest rate represents the rate in effect at September 30, 2023.
(a)
Unaudited.
(b)
Securities purchased on a when-issued basis (See Note 2(g)).
(c)
Variable Rate is Fixed to Float: Rate remains fixed or at Zero Coupon until designated future date.
(d)
This investment has been rated by Fitch IBCA.
(e)
Level 3 Investment as described in Note 2(i) in the Notes to Financials. Security valued utilizing third party pricing information without adjustment. Such valuations are based on unobservable inputs. A significant change in third party information could result in a significantly lower or higher value of such Level 3 investments.
(f)
The interest rate reset date shown represents the date in which the Fund has the right to sell a Variable Rate Demand Note (“VRDN”) back to the issuer for Principal Amount. The interest rate on the VRDN is generally reset daily based on the SIFMA Municipal Swap Index.
(g)
Other Assets and Liabilities – Net include net unrealized appreciation/depreciation on futures contracts as follows:
See Notes to Financial Statements.
215
Schedule of Investments (concluded)
NEW YORK TAX FREE FUND September 30, 2023
Futures Contracts at September 30, 2023:
Type
Expiration
Contracts
Position
Notional Amount
Notional Value
Unrealized Appreciation
U.S. Long Bond
December 2023
67
Short
$(7,966,786
)
$(7,623,344
)
$343,442
The following is a summary of the inputs used as of September 30, 2023 in valuing the Fund’s investments carried at fair value(1):
Investment Type(2)
Level 1
Level 2
Level 3
Total
Long-Term Investments
Municipal Bonds
Health Care
$
–
$
50,759,409
$
3,761,789
$
54,521,198
Remaining Industries
–
357,217,557
–
357,217,557
Short-Term Investments
Variable Rate Demand Notes
–
6,500,000
–
6,500,000
Total
$
–
$
414,476,966
$
3,761,789
$
418,238,755
Other Financial Instruments
Futures Contracts
Assets
$
343,442
$
–
$
–
$
343,442
Liabilities
–
–
–
–
Total
$
343,442
$
–
$
–
$
343,442
(1)
Refer to Note 2(i) for a description of fair value measurements and the three-tier hierarchy of inputs.
(2)
See Schedule of Investments for fair values in each industry. The table above is presented by Investment Type. Industries are presented within an Investment Type should such Investment Type include securities classified as two or more levels within the three-tier fair value hierarchy. When applicable, each Level 3 security is identified on the Schedule of Investments along with the valuation technique utilized.
A reconciliation of Level 3 investments is presented when the Fund has a material amount of Level 3 investments at the beginning or end of the year in relation to the Fund’s net assets. Management has determined not to provide a reconciliation as the balance of Level 3 investments was not considered to be material to the Fund’s net assets at the beginning or end of the year.
216
See Notes to Financial Statements.
This page is intentionally left blank.
217
Statements of Assets and Liabilities
September 30, 2023
Short Duration
Intermediate
National
ASSETS:
Investments in securities, at cost
$
1,633,528,499
$
5,090,187,479
$
3,966,213,629
Investments in securities, at fair value
$
1,591,839,340
$
4,816,660,445
$
3,724,422,949
Cash
1,089,400
1,069,688
1,128,665
Deposits with brokers for futures collateral
741,400
–
1,567,800
Receivables:
Interest
15,105,827
60,185,342
51,697,496
Capital shares sold
7,795,275
18,564,337
18,711,728
Investment securities sold
6,400,343
905,745
5,304,627
Variation margin for futures contracts
93,519
–
–
From advisor (See Note 3)
5,131
–
–
Prepaid expenses and other assets
37,506
131,937
113,027
Total assets
1,623,107,741
4,897,517,494
3,802,946,292
LIABILITIES:
Payables:
Investment securities purchased
22,925,000
23,362,853
15,628,715
Capital shares reacquired
3,028,345
13,407,297
12,915,043
Management fee
449,731
1,562,811
1,198,863
Directors’ fees
264,486
618,250
476,923
12b-1 distribution plan
174,401
684,275
600,553
Fund administration
52,910
162,316
122,923
Trust certificates (See Note 2(h))
–
–
86,140,000
Interest expense and fees
–
–
1,017,584
Variation margin for futures contracts
–
–
112,423
Distributions payable
3,779,835
12,446,713
11,188,850
Accrued expenses
221,396
728,478
487,246
Total liabilities
30,896,104
52,972,993
129,889,123
NET ASSETS
$
1,592,211,637
$
4,844,544,501
$
3,673,057,169
COMPOSITION OF NET ASSETS:
Paid-in capital
$
1,724,551,892
$
5,460,570,532
$
4,253,228,782
Total distributable earnings (loss)
(132,340,255
)
(616,026,031
)
(580,171,613
)
Net Assets
$
1,592,211,637
$
4,844,544,501
$
3,673,057,169
218
See Notes to Financial Statements.
High Income
Short Duration High Income
Sustainable
California
New Jersey
New York
$
3,668,480,858
$
931,930,387
$
5,233,555
$
548,847,043
$
109,678,487
$
462,881,100
$
3,307,735,813
$
898,016,979
$
5,084,174
$
517,235,203
$
99,060,995
$
418,238,755
1,108,065
1,118,328
17,633
1,029,575
2,546,337
687,863
1,536,600
–
–
292,500
35,100
261,300
49,594,583
12,111,361
61,652
6,654,576
1,248,254
5,306,283
14,714,213
9,256,906
1,942
2,749,896
286,731
1,325,545
4,781,845
7,441,593
–
2,526,274
–
–
–
–
–
–
–
–
–
29,221
13,997
–
2,676
–
81,040
53,720
28,240
29,968
22,490
29,260
3,379,552,159
928,028,108
5,207,638
530,517,992
103,202,583
425,849,006
11,489,618
21,225,757
–
11,705,415
1,409,140
6,031,810
15,866,997
2,935,350
937
1,014,663
113,082
553,212
1,234,795
257,726
1,378
193,852
37,955
158,482
381,723
43,872
355
81,209
23,950
81,678
384,006
72,659
969
84,537
20,509
89,901
111,151
29,454
172
17,231
3,374
14,087
51,465,000
–
–
–
–
–
531,240
–
–
–
–
–
110,137
–
–
20,905
2,467
18,643
12,152,403
2,956,793
14,130
1,454,228
264,189
1,133,174
685,282
227,225
38,121
75,460
44,444
88,886
94,412,352
27,748,836
56,062
14,647,500
1,919,110
8,169,873
$
3,285,139,807
$
900,279,272
$
5,151,576
$
515,870,492
$
101,283,473
$
417,679,133
$
4,146,884,506
$
1,043,295,957
$
5,742,816
$
584,940,181
$
114,762,554
$
480,190,376
(861,744,699
)
(143,016,685
)
(591,240
)
(69,069,689
)
(13,479,081
)
(62,511,243
)
$
3,285,139,807
$
900,279,272
$
5,151,576
$
515,870,492
$
101,283,473
$
417,679,133
See Notes to Financial Statements.
219
Statements of Assets and Liabilities (concluded)
September 30, 2023
Short Duration
Intermediate
National
Net Assets by class:
Class A Shares
$
758,930,814
$
1,935,887,234
$
2,257,591,450
Class C Shares
$
17,796,310
$
86,956,042
$
70,892,057
Class F Shares
$
33,366,569
$
113,056,456
$
79,394,239
Class F3 Shares
$
264,658,455
$
274,934,426
$
346,878,853
Class I Shares
$
517,459,489
$
2,433,710,343
$
918,300,570
Outstanding shares by class*:
Class A Shares
51,251,329
198,311,212
229,301,396
Class C Shares
1,201,823
8,918,672
7,193,177
Class F Shares
2,253,065
11,586,568
8,072,607
Class F3 Shares
17,866,258
28,152,136
35,251,264
Class I Shares
34,934,085
249,330,624
93,323,645
Net Asset Value, offering and redemption price per share (Net assets divided by outstanding shares):
Class A Shares-Net asset value
$14.81
$9.76
$ 9.85
Class A Shares-Maximum offering price (Net asset value plus sales charge of 2.25%)
$15.15
$9.98
$10.08
Class C Shares-Net asset value
$14.81
$9.75
$ 9.86
Class F Shares-Net asset value
$14.81
$9.76
$ 9.84
Class F3 Shares-Net asset value
$14.81
$9.77
$ 9.84
Class I Shares-Net asset value
$14.81
$9.76
$ 9.84
*
Lord Abbett Municipal Income Fund, Inc. has 11,757,501,500 authorized shares of capital stock (par value $.001), which are designated as follows: 1,950,001,500 to Short Duration, 2,445,000,000 to Intermediate, 1,250,000,000 to National, 1,987,500,000 to High Income, 1,950,000,000 to Short Duration High Income, 750,000,000 to Sustainable, 450,000,000 to California, 525,000,000 to New Jersey and 450,000,000 to New York (as of September 30, 2023).
220
See Notes to Financial Statements.
High Income
Short Duration High Income
Sustainable
California
New Jersey
New York
$
1,680,507,492
$
261,115,317
$
2,910,121
$
341,314,157
$
77,949,644
$
303,557,041
$
141,950,130
$
19,626,306
$
169,428
$
18,912,350
$
–
$
17,453,358
$
112,452,031
$
17,572,813
$
66,441
$
7,929,080
$
3,693,175
$
6,898,315
$
122,429,230
$
35,447,051
$
88,587
$
45,076,723
$
1,697,485
$
2,290,176
$
1,227,800,924
$
566,517,785
$
1,916,999
$
102,638,182
$
17,943,169
$
87,480,243
166,076,107
18,937,031
328,509
35,735,385
17,438,453
30,392,901
14,023,633
1,423,140
19,124
1,979,250
–
1,749,726
11,104,516
1,274,484
7,500
830,099
825,768
689,999
12,122,928
2,570,671
10,000
4,721,289
379,285
229,183
121,562,795
41,081,218
216,397
10,753,557
4,010,435
8,754,441
$10.12
$13.79
$8.86
$9.55
$4.47
$ 9.99
$10.35
$14.11
$9.06
$9.77
$4.57
$10.22
$10.12
$13.79
$8.86
$9.56
$ –
$ 9.97
$10.13
$13.79
$8.86
$9.55
$4.47
$10.00
$10.10
$13.79
$8.86
$9.55
$4.48
$ 9.99
$10.10
$13.79
$8.86
$9.54
$4.47
$ 9.99
See Notes to Financial Statements.
221
Statements of Operations
For the Year Ended September 30, 2023
Short Duration
Intermediate
National
Investment income:
Interest and other
$
49,824,795
$
172,006,641
$
150,372,904
Interest earned from Interfund Lending (See Note 11)
–
–
–
Total investment income
49,824,795
172,006,641
150,372,904
Expenses:
Management fee
6,135,521
19,216,181
14,079,047
12b-1 distribution plan–Class A
1,662,614
4,090,095
4,620,563
12b-1 distribution plan–Class C
175,572
878,552
666,484
12b-1 distribution plan–Class F
104,557
278,564
143,466
Shareholder servicing
763,223
3,053,632
1,569,768
Fund administration
721,895
1,996,970
1,437,605
Registration
221,318
323,930
341,583
Reports to shareholders
75,796
223,552
140,740
Professional
51,550
79,948
82,513
Directors’ fees
47,171
127,902
90,810
Custody
25,183
59,261
37,659
Interest expense and fees (See Note 2(h))
–
–
2,458,636
Other
125,810
179,812
149,502
Gross expenses
10,110,210
30,508,399
25,818,376
Expense reductions (See Note 9)
(29,190
)
(88,331
)
(59,112
)
Fees waived and expenses reimbursed (See Note 3)
(139,804
)
(59,261
)
(37,659
)
Net expenses
9,941,216
30,360,807
25,721,605
Net investment income
39,883,579
141,645,834
124,651,299
Net realized and unrealized gain (loss):
Net realized gain (loss) on investments
(39,903,246
)
(138,140,578
)
(141,447,091
)
Net realized gain (loss) on futures contracts
348
5,016,849
6,858,094
Net change in unrealized appreciation/depreciation on investments
47,692,605
157,004,027
118,518,205
Net change in unrealized appreciation/depreciation on futures contracts
(487,900
)
(5,391,392
)
(2,395,380
)
Net realized and unrealized gain (loss)
7,301,807
18,488,906
(18,466,172
)
Net Increase in Net Assets Resulting From Operations
$
47,185,386
$
160,134,740
$
106,185,127
222
See Notes to Financial Statements.
High Income
Short Duration High Income
Sustainable
California
New Jersey
New York
$
171,173,907
$
39,205,898
$
171,645
$
19,089,010
$
3,846,912
$
16,216,304
–
1,650
–
–
–
–
171,173,907
39,207,548
171,645
19,089,010
3,846,912
16,216,304
15,021,497
3,197,302
16,260
2,231,684
464,704
1,942,518
3,505,351
591,273
5,877
664,985
162,904
630,766
1,336,331
179,547
1,425
172,258
–
165,449
226,010
72,173
69
13,516
4,583
11,479
1,768,580
550,557
2,114
150,256
44,751
191,423
1,352,150
356,218
2,033
198,372
41,307
172,668
287,819
151,861
62,332
77,972
61,995
77,684
149,198
30,128
3,720
14,706
5,561
13,937
62,096
63,928
40,416
47,787
39,902
48,446
86,437
22,839
469
12,446
2,638
11,004
38,526
19,371
577
9,086
3,906
12,594
1,462,318
–
–
–
–
–
435,926
88,566
10,728
66,026
21,128
64,089
25,732,239
5,323,763
146,020
3,659,094
853,379
3,342,057
(59,539
)
(15,830
)
(91
)
(8,262
)
(1,872
)
(7,885
)
(38,526
)
(401,542
)
(116,745
)
(9,086
)
(44,404
)
(12,595
)
25,634,174
4,906,391
29,184
3,641,746
807,103
3,321,577
145,539,733
34,301,157
142,461
15,447,264
3,039,809
12,894,727
(212,889,647
)
(37,319,525
)
(155,523
)
(19,241,902
)
(1,835,430
)
(7,262,572
)
8,220,733
3,580,393
–
1,010,750
192,614
869,162
164,701,549
30,181,217
169,162
17,206,484
2,973,152
9,778,893
(4,053,996
)
(2,720,831
)
–
(229,470
)
(64,642
)
(106,665
)
(44,021,361
)
(6,278,746
)
13,639
(1,254,138
)
1,265,694
3,278,818
$
101,518,372
$
28,022,411
$
156,100
$
14,193,126
$
4,305,503
$
16,173,545
See Notes to Financial Statements.
223
Statements of Changes in Net Assets
Short Duration
INCREASE (DECREASE) IN NET ASSETS
For the Year Ended September 30, 2023
For the Year Ended September 30, 2022
Operations:
Net investment income
$
39,883,579
$
24,201,636
Net realized gain (loss) on investments and futures contracts
(39,902,898
)
(22,970,656
)
Net change in unrealized appreciation/depreciation on investments and futures contracts
47,204,705
(129,113,613
)
Net increase (decrease) in net assets resulting from operations
47,185,386
(127,882,633
)
Distributions to shareholders:(1)
Class A
(17,584,763
)
(9,685,207
)
Class C
(324,642
)
(94,961
)
Class F
(2,101,757
)
(4,881,413
)
Class F3
(7,188,716
)
(4,336,314
)
Class I
(12,588,098
)
(5,165,908
)
Total distributions to shareholders
(39,787,976
)
(24,163,803
)
Capital share transactions (See Note 15):
Net proceeds from sales of shares
783,794,119
1,763,864,555
Reinvestment of distributions
29,953,750
16,863,725
Cost of shares reacquired
(1,300,105,517
)
(1,931,244,877
)
Net increase (decrease) in net assets resulting from capital share transactions
(486,357,648
)
(150,516,597
)
Net increase (decrease) in net assets
(478,960,238
)
(302,563,033
)
NET ASSETS:
Beginning of year
$
2,071,171,875
$
2,373,734,908
End of year
$
1,592,211,637
$
2,071,171,875
(1)
Refer to Note 4 in the Notes to Financial Statements for the tax character of distributions.
224
See Notes to Financial Statements.
Intermediate
National
For the Year Ended September 30, 2023
For the Year Ended September 30, 2022
For the Year Ended September 30, 2023
For the Year Ended September 30, 2022
$
141,645,834
$
131,446,925
$
124,651,299
$
110,639,910
(133,123,729
)
(152,425,906
)
(134,588,997
)
(164,615,349
)
151,612,635
(771,236,486
)
116,122,825
(657,682,785
)
160,134,740
(792,215,467
)
106,185,127
(711,658,224
)
(55,377,086
)
(51,244,377
)
(77,238,597
)
(70,690,253
)
(2,236,636
)
(2,324,854
)
(2,184,343
)
(2,256,462
)
(7,640,736
)
(38,501,878
)
(4,878,775
)
(17,459,525
)
(7,471,644
)
(4,596,185
)
(11,071,073
)
(8,742,056
)
(67,416,716
)
(34,327,561
)
(26,764,425
)
(10,879,330
)
(140,142,818
)
(130,994,855
)
(122,137,213
)
(110,027,626
)
2,440,944,276
3,855,743,096
1,660,801,824
1,818,078,604
104,469,308
99,272,234
110,830,832
99,822,938
(2,768,876,136
)
(4,596,451,995
)
(1,461,281,131
)
(2,261,223,177
)
(223,462,552
)
(641,436,665
)
310,351,525
(343,321,635
)
(203,470,630
)
(1,564,646,987
)
294,399,439
(1,165,007,485
)
$
5,048,015,131
$
6,612,662,118
$
3,378,657,730
$
4,543,665,215
$
4,844,544,501
$
5,048,015,131
$
3,673,057,169
$
3,378,657,730
See Notes to Financial Statements.
225
Statements of Changes in Net Assets (continued)
High Income
INCREASE (DECREASE) IN NET ASSETS
For the Year Ended September 30, 2023
For the Year Ended September 30, 2022
Operations:
Net investment income
$
145,539,733
$
140,772,751
Net realized gain (loss) on investments and futures contracts
(204,668,914
)
(168,245,743
)
Net change in unrealized appreciation/depreciation on investments and futures contracts
160,647,553
(803,283,390
)
Net increase (decrease) in net assets resulting from operations
101,518,372
(830,756,382
)
Distributions to shareholders:(1)
Class A
(72,790,503
)
(71,083,164
)
Class C
(5,689,822
)
(5,926,875
)
Class F
(9,499,288
)
(32,027,041
)
Class F3
(5,375,725
)
(4,432,261
)
Class I
(48,818,252
)
(25,551,036
)
Total distributions to shareholders
(142,173,590
)
(139,020,377
)
Capital share transactions (See Note 15):
Net proceeds from sales of shares
1,594,496,427
2,559,922,817
Reinvestment of distributions
128,033,512
121,604,651
Cost of shares reacquired
(1,803,019,789
)
(3,018,619,337
)
Net increase (decrease) in net assets resulting from capital share transactions
(80,489,850
)
(337,091,869
)
Net increase (decrease) in net assets
(121,145,068
)
(1,306,868,628
)
NET ASSETS:
Beginning of year
$
3,406,284,875
$
4,713,153,503
End of year
$
3,285,139,807
$
3,406,284,875
(1)
Refer to Note 4 in the Notes to Financial Statements for the tax character of distributions.
(2)
For the period January 5, 2022, commencement of operations, to September 30, 2022.
226
See Notes to Financial Statements.
Short Duration High Income
Sustainable
For the Year Ended September 30, 2023
For the Year Ended September 30, 2022
For the Year Ended September 30, 2023
For the Year Ended September 30, 2022(2)
$
34,301,157
$
26,141,378
$
142,461
$
53,715
(33,739,132
)
(57,214,461
)
(155,523
)
(289,439
)
27,460,386
(98,425,537
)
169,162
(318,543
)
28,022,411
(129,498,620
)
156,100
(554,267
)
(10,532,484
)
(8,688,573
)
(79,924
)
(30,845
)
(607,265
)
(392,609
)
(2,896
)
(348
)
(2,560,295
)
(7,267,298
)
(1,919
)
(814
)
(1,231,546
)
(799,544
)
(2,685
)
(1,181
)
(17,898,923
)
(8,379,287
)
(53,809
)
(20,220
)
(32,830,513
)
(25,527,311
)
(141,233
)
(53,408
)
685,583,676
960,334,431
588,055
5,147,500
31,503,674
24,955,977
14,916
399
(689,567,706
)
(1,159,684,331
)
(6,445
)
(41
)
27,519,644
(174,393,923
)
596,526
5,147,858
22,711,542
(329,419,854
)
611,393
4,540,183
$
877,567,730
$
1,206,987,584
$
4,540,183
$
–
$
900,279,272
$
877,567,730
$
5,151,576
$
4,540,183
.
See Notes to Financial Statements.
227
Statements of Changes in Net Assets (concluded)
California
INCREASE (DECREASE) IN NET ASSETS
For the Year Ended September 30, 2023
For the Year Ended September 30, 2022
Operations:
Net investment income
$
15,447,264
$
12,740,026
Net realized gain (loss) on investments and futures contracts
(18,231,152
)
(18,545,763
)
Net change in unrealized appreciation/depreciation on investments and futures contracts
16,977,014
(85,281,685
)
Net increase (decrease) in net assets resulting from operations
14,193,126
(91,087,422
)
Distributions to shareholders:(1)
Class A
(10,048,395
)
(8,047,205
)
Class C
(498,898
)
(479,633
)
Class F
(413,866
)
(1,872,942
)
Class F3
(1,268,786
)
(635,428
)
Class I
(2,913,247
)
(1,550,729
)
Total distributions to shareholders
(15,143,192
)
(12,585,937
)
Capital share transactions (See Note 15):
Net proceeds from sales of shares
220,080,799
276,101,921
Reinvestment of distributions
13,735,450
10,926,214
Cost of shares reacquired
(171,125,316
)
(333,545,364
)
Net increase (decrease) in net assets resulting from capital share transactions
62,690,933
(46,517,229
)
Net increase (decrease) in net assets
61,740,867
(150,190,588
)
NET ASSETS:
Beginning of year
$
454,129,625
$
604,320,213
End of year
$
515,870,492
$
454,129,625
(1)
Refer to Note 4 in the Notes to Financial Statements for the tax character of distributions.
228
See Notes to Financial Statements.
New Jersey
New York
For the Year Ended September 30, 2023
For the Year Ended September 30, 2022
For the Year Ended September 30, 2023
For the Year Ended September 30, 2022
$
3,039,809
$
2,987,944
$
12,894,727
$
11,831,388
(1,642,816
)
(1,232,431
)
(6,393,410
)
(7,372,893
)
2,908,510
(21,488,579
)
9,672,228
(87,732,773
)
4,305,503
(19,733,066
)
16,173,545
(83,274,278
)
(2,358,640
)
(2,225,957
)
(9,296,202
)
(8,459,566
)
–
–
(471,328
)
(479,877
)
(136,716
)
(425,020
)
(347,324
)
(1,152,222
)
(50,515
)
(37,239
)
(78,854
)
(61,174
)
(484,548
)
(291,769
)
(2,587,779
)
(1,587,444
)
(3,030,419
)
(2,979,985
)
(12,781,487
)
(11,740,283
)
28,363,257
36,024,111
124,898,947
169,981,763
2,409,229
2,450,485
10,761,359
9,730,316
(32,259,812
)
(49,773,261
)
(156,382,096
)
(189,584,632
)
(1,487,326
)
(11,298,665
)
(20,721,790
)
(9,872,553
)
(212,242
)
(34,011,716
)
(17,329,732
)
(104,887,114
)
$
101,495,715
$
135,507,431
$
435,008,865
$
539,895,979
$
101,283,473
$
101,495,715
$
417,679,133
$
435,008,865
See Notes to Financial Statements.
229
Financial Highlights
SHORT DURATION TAX FREE FUND
Per Share Operating Performance:
Investment Operations:
Distributions to shareholders from:
Net asset value, beginning of period
Net investment income (loss)(a)
Net realized and unrealized gain (loss)
Total from investment operations
Net investment income
Net asset value, end of period
Class A
9/30/2023
$14.78
$0.32
$ 0.03
$ 0.35
$(0.32
)
$14.81
9/30/2022
15.84
0.15
(1.06
)
(0.91
)
(0.15
)
14.78
9/30/2021
15.80
0.15
0.04
0.19
(0.15
)
15.84
9/30/2020
15.78
0.24
0.02
0.26
(0.24
)
15.80
9/30/2019
15.43
0.29
0.34
0.63
(0.28
)
15.78
Class C
9/30/2023
14.78
0.23
0.03
0.26
(0.23
)
14.81
9/30/2022
15.84
0.05
(1.05
)
(1.00
)
(0.06
)
14.78
9/30/2021
15.80
0.05
0.04
0.09
(0.05
)
15.84
9/30/2020
15.78
0.15
0.01
0.16
(0.14
)
15.80
9/30/2019
15.43
0.19
0.35
0.54
(0.19
)
15.78
Class F
9/30/2023
14.79
0.30
0.05
0.35
(0.33
)
14.81
9/30/2022
15.85
0.16
(1.05
)
(0.89
)
(0.17
)
14.79
9/30/2021
15.80
0.16
0.05
0.21
(0.16
)
15.85
9/30/2020
15.78
0.26
0.02
0.28
(0.26
)
15.80
9/30/2019
15.43
0.30
0.35
0.65
(0.30
)
15.78
Class F3
9/30/2023
14.79
0.35
0.02
0.37
(0.35
)
14.81
9/30/2022
15.85
0.19
(1.06
)
(0.87
)
(0.19
)
14.79
9/30/2021
15.80
0.18
0.06
0.24
(0.19
)
15.85
9/30/2020
15.79
0.27
0.02
0.29
(0.28
)
15.80
9/30/2019
15.43
0.32
0.36
0.68
(0.32
)
15.79
Class I
9/30/2023
14.79
0.35
0.02
0.37
(0.35
)
14.81
9/30/2022
15.85
0.20
(1.08
)
(0.88
)
(0.18
)
14.79
9/30/2021
15.80
0.18
0.05
0.23
(0.18
)
15.85
9/30/2020
15.78
0.27
0.02
0.29
(0.27
)
15.80
9/30/2019
15.43
0.32
0.35
0.67
(0.32
)
15.78
(a)
Calculated based on average shares outstanding during the period.
(b)
Total return for Classes A and C does not consider the effects of sales loads and assumes the reinvestment of all distributions. Total return for all other classes assumes the reinvestment of all distributions.
230
See Notes to Financial Statements.
Ratios to Average Net Assets:
Supplemental Data:
Total return (%)(b)
Total expenses after waivers and/or reim- bursements (%)
Total expenses (%)
Net investment income (loss) (%)
Net assets, end of period (000)
Portfolio turnover rate (%)
2.29
0.65
0.66
2.12
$
758,931
59
(5.68
)
0.65
0.65
0.99
875,792
43
1.20
0.65
0.65
0.93
1,067,651
26
1.68
0.65
0.66
1.52
895,461
28
4.15
0.65
0.66
1.83
632,983
33
1.74
1.26
1.27
1.51
17,796
59
(6.34
)
1.29
1.29
0.35
23,284
43
0.54
1.30
1.31
0.30
31,450
26
1.05
1.27
1.28
0.96
39,779
28
3.52
1.26
1.28
1.22
86,435
33
2.39
0.55
0.56
2.03
33,367
59
(5.65
)
0.55
0.55
1.01
246,974
43
1.36
0.55
0.55
1.03
736,826
26
1.77
0.55
0.56
1.62
587,635
28
4.25
0.55
0.56
1.92
577,258
33
2.54
0.41
0.42
2.35
264,658
59
(5.52
)
0.41
0.41
1.25
361,359
43
1.50
0.42
0.42
1.16
331,257
26
1.84
0.42
0.43
1.74
246,193
28
4.44
0.42
0.43
2.04
46,899
33
2.50
0.45
0.46
2.34
517,459
59
(5.55
)
0.45
0.46
1.30
563,762
43
1.46
0.45
0.45
1.13
206,551
26
1.87
0.45
0.46
1.70
177,634
28
4.35
0.45
0.46
2.02
108,949
33
See Notes to Financial Statements.
231
Financial Highlights (continued)
INTERMEDIATE TAX FREE FUND
Per Share Operating Performance:
Investment Operations:
Distributions to shareholders from:
Net asset value, beginning of period
Net investment income (loss)(a)
Net realized and unrealized gain (loss)
Total from investment operations
Net investment income
Net asset value, end of period
Class A
9/30/2023
$
9.71
$0.27
$ 0.05
$ 0.32
$(0.27
)
$
9.76
9/30/2022
11.33
0.23
(1.63
)
(1.40
)
(0.22
)
9.71
9/30/2021
11.11
0.24
0.22
0.46
(0.24
)
11.33
9/30/2020
11.17
0.27
(0.06
)
0.21
(0.27
)
11.11
9/30/2019
10.60
0.30
0.57
0.87
(0.30
)
11.17
Class C
9/30/2023
9.70
0.21
0.05
0.26
(0.21
)
9.75
9/30/2022
11.32
0.16
(1.62
)
(1.46
)
(0.16
)
9.70
9/30/2021
11.10
0.17
0.22
0.39
(0.17
)
11.32
9/30/2020
11.16
0.21
(0.07
)
0.14
(0.20
)
11.10
9/30/2019
10.59
0.23
0.57
0.80
(0.23
)
11.16
Class F
9/30/2023
9.71
0.28
0.05
0.33
(0.28
)
9.76
9/30/2022
11.33
0.23
(1.61
)
(1.38
)
(0.24
)
9.71
9/30/2021
11.11
0.25
0.22
0.47
(0.25
)
11.33
9/30/2020
11.17
0.28
(0.06
)
0.22
(0.28
)
11.11
9/30/2019
10.60
0.31
0.57
0.88
(0.31
)
11.17
Class F3
9/30/2023
9.72
0.30
0.05
0.35
(0.30
)
9.77
9/30/2022
11.34
0.25
(1.62
)
(1.37
)
(0.25
)
9.72
9/30/2021
11.12
0.27
0.22
0.49
(0.27
)
11.34
9/30/2020
11.18
0.30
(0.06
)
0.24
(0.30
)
11.12
9/30/2019
10.60
0.32
0.58
0.90
(0.32
)
11.18
Class I
9/30/2023
9.71
0.30
0.04
0.34
(0.29
)
9.76
9/30/2022
11.33
0.25
(1.62
)
(1.37
)
(0.25
)
9.71
9/30/2021
11.12
0.27
0.21
0.48
(0.27
)
11.33
9/30/2020
11.17
0.29
(0.05
)
0.24
(0.29
)
11.12
9/30/2019
10.60
0.32
0.57
0.89
(0.32
)
11.17
(a)
Calculated using average shares outstanding during the period.
(b)
Total return for Classes A and C does not consider the effects of sales loads and assumes the reinvestment of all distributions. Total return for all other classes assumes the reinvestment of all distributions.
(c)
Interest expense, if applicable, relates to the liability for floating rate notes issued in conjunction with tender option bond trusts.
232
See Notes to Financial Statements.
Ratios to Average Net Assets:
Supplemental Data:
Total return (%)(b)
Total expenses after waivers and/or reim- bursements (includes interest expense) (%)(c)
Total expenses after waivers and/or reim- bursements (excludes interest expense) (%)(c)
Total expenses (%)
Net investment income (loss) (%)
Net assets, end of period (000)
Portfolio turnover rate (%)
3.17
0.71
0.71
0.71
2.74
$
1,935,887
44
(12.36
)
0.71
0.71
0.71
2.11
2,075,394
33
4.19
0.70
0.70
0.70
2.15
2,656,030
13
1.93
0.70
0.70
0.70
2.45
2,239,629
14
8.27
0.70
0.70
0.71
2.73
1,704,883
19
2.64
1.32
1.32
1.32
2.12
86,956
44
(13.02
)
1.35
1.35
1.35
1.47
123,238
33
3.53
1.33
1.33
1.33
1.52
190,855
13
1.30
1.32
1.32
1.32
1.86
215,475
14
7.62
1.31
1.31
1.32
2.13
390,735
19
3.38
0.60
0.60
0.60
2.78
113,056
44
(12.37
)
0.60
0.60
0.60
2.13
522,922
33
4.30
0.60
0.60
0.60
2.24
2,697,578
13
2.03
0.60
0.60
0.60
2.56
2,140,068
14
8.38
0.60
0.60
0.61
2.83
1,871,641
19
3.54
0.45
0.45
0.45
3.00
274,934
44
(12.21
)
0.45
0.45
0.45
2.39
194,787
33
4.45
0.45
0.45
0.45
2.36
171,655
13
2.17
0.46
0.46
0.46
2.68
85,559
14
8.62
0.46
0.46
0.47
2.94
43,659
19
3.48
0.51
0.51
0.51
2.95
2,433,710
44
(12.28
)
0.52
0.52
0.52
2.39
2,131,673
33
4.31
0.50
0.50
0.50
2.35
896,545
13
2.22
0.50
0.50
0.50
2.65
870,771
14
8.48
0.50
0.50
0.51
2.92
652,729
19
See Notes to Financial Statements.
233
Financial Highlights (continued)
NATIONAL TAX FREE FUND
Per Share Operating Performance:
Investment Operations:
Distributions to shareholders from:
Net asset value, beginning of period
Net investment income (loss)(a)
Net realized and unrealized gain (loss)
Total from investment operations
Net investment income
Net asset value, end of period
Class A
9/30/2023
$
9.83
$
0.35
$ 0.01
(d)
$ 0.36
$(0.34
)
$
9.85
9/30/2022
12.06
0.30
(2.23
)
(1.93
)
(0.30
)
9.83
9/30/2021
11.70
0.31
0.36
0.67
(0.31
)
12.06
9/30/2020
11.80
0.34
(0.10
)
0.24
(0.34
)
11.70
9/30/2019
11.11
0.37
0.69
1.06
(0.37
)
11.80
Class C
9/30/2023
9.84
0.29
0.01
(d)
0.30
(0.28
)
9.86
9/30/2022
12.08
0.23
(2.24
)
(2.01
)
(0.23
)
9.84
9/30/2021
11.71
0.23
0.37
0.60
(0.23
)
12.08
9/30/2020
11.82
0.26
(0.11
)
0.15
(0.26
)
11.71
9/30/2019
11.13
0.30
0.69
0.99
(0.30
)
11.82
Class F
9/30/2023
9.82
0.35
0.02
(d)
0.37
(0.35
)
9.84
9/30/2022
12.05
0.31
(2.23
)
(1.92
)
(0.31
)
9.82
9/30/2021
11.69
0.32
0.36
0.68
(0.32
)
12.05
9/30/2020
11.79
0.35
(0.10
)
0.25
(0.35
)
11.69
9/30/2019
11.10
0.38
0.69
1.07
(0.38
)
11.79
Class F3
9/30/2023
9.83
0.37
0.01
(d)
0.38
(0.37
)
9.84
9/30/2022
12.06
0.32
(2.23
)
(1.91
)
(0.32
)
9.83
9/30/2021
11.69
0.34
0.37
0.71
(0.34
)
12.06
9/30/2020
11.80
0.36
(0.11
)
0.25
(0.36
)
11.69
9/30/2019
11.11
0.39
0.70
1.09
(0.40
)
11.80
Class I
9/30/2023
9.83
0.37
–
(d)(e)
0.37
(0.36
)
9.84
9/30/2022
12.06
0.32
(2.23
)
(1.91
)
(0.32
)
9.83
9/30/2021
11.69
0.34
0.36
0.70
(0.33
)
12.06
9/30/2020
11.80
0.36
(0.11
)
0.25
(0.36
)
11.69
9/30/2019
11.11
0.39
0.69
1.08
(0.39
)
11.80
(a)
Calculated using average shares outstanding during the period.
(b)
Total return for Classes A and C does not consider the effects of sales loads and assumes the reinvestment of all distributions. Total return for all other classes assumes the reinvestment of all distributions.
(c)
Interest expense, if applicable, relates to the liability for floating rate notes issued in conjunction with tender option bond trusts.
(d)
Realized and unrealized gain (loss) per share does not correlate to the aggregate of the net realized and unrealized gain (loss) in the Statement of Operations for the period ended September 30, 2023, primarily due to the timing of the sales and repurchases of the Fund’s shares in relation to fluctuating market values of the Fund’s portfolio.
(e)
Amount less than $0.01.
234
See Notes to Financial Statements.
Ratios to Average Net Assets:
Supplemental Data:
Total return (%)(b)
Total expenses after waivers and/or reim- bursements (includes interest expense) (%)(c)
Total expenses after waivers and/or reim- bursements (excludes interest expense) (%)(c)
Total expenses (%)
Net investment income (loss) (%)
Net assets, end of period (000)
Portfolio turnover rate (%)
3.61
0.77
0.70
0.77
3.41
$
2,257,591
41
(16.27
)
0.71
0.70
0.71
2.66
2,235,687
40
5.77
0.70
0.70
0.70
2.58
2,925,529
18
2.06
0.71
0.71
0.71
2.90
2,504,023
24
9.70
0.77
0.75
0.77
3.25
2,011,535
11
2.97
1.40
1.33
1.40
2.78
70,892
41
(16.86
)
1.35
1.34
1.35
2.01
83,743
40
5.16
1.35
1.35
1.35
1.94
135,544
18
1.32
1.35
1.35
1.35
2.27
138,705
24
9.01
1.39
1.37
1.39
2.63
165,263
11
3.72
0.67
0.60
0.67
3.48
79,394
41
(16.20
)
0.61
0.60
0.61
2.66
222,942
40
5.88
0.60
0.60
0.60
2.68
984,235
18
2.15
0.61
0.61
0.61
2.99
871,094
24
9.80
0.67
0.65
0.67
3.32
594,320
11
3.75
0.53
0.46
0.53
3.65
346,879
41
(16.07
)
0.47
0.46
0.47
2.91
268,560
40
6.10
0.45
0.45
0.45
2.78
288,718
18
2.19
0.48
0.48
0.48
3.10
140,730
24
9.95
0.53
0.50
0.53
3.42
59,942
11
3.72
0.57
0.50
0.57
3.63
918,301
41
(16.10
)
0.52
0.51
0.52
2.99
567,725
40
6.07
0.50
0.50
0.50
2.78
209,640
18
2.17
0.51
0.51
0.51
3.09
155,620
24
9.91
0.57
0.55
0.57
3.40
111,141
11
See Notes to Financial Statements.
235
Financial Highlights (continued)
HIGH INCOME MUNICIPAL BOND FUND
Per Share Operating Performance:
Investment Operations:
Distributions to shareholders from:
Net asset value, beginning of period
Net investment income (loss)(a)
Net realized and unrealized gain (loss)
Total from investment operations
Net investment income
Net asset value, end of period
Class A
9/30/2023
$
10.22
$
0.45
$
(0.11
)
$
0.34
$
(0.44
)
$
10.12
9/30/2022
12.91
0.39
(2.69
)
(2.30
)
(0.39
)
10.22
9/30/2021
12.14
0.41
0.77
1.18
(0.41
)
12.91
9/30/2020
12.60
0.45
(0.47
)
(0.02
)
(0.44
)
12.14
9/30/2019
11.93
0.50
0.66
1.16
(0.49
)
12.60
Class C
9/30/2023
10.22
0.38
(0.11
)
0.27
(0.37
)
10.12
9/30/2022
12.92
0.31
(2.70
)
(2.39
)
(0.31
)
10.22
9/30/2021
12.14
0.33
0.78
1.11
(0.33
)
12.92
9/30/2020
12.61
0.37
(0.48
)
(0.11
)
(0.36
)
12.14
9/30/2019
11.93
0.42
0.67
1.09
(0.41
)
12.61
Class F
9/30/2023
10.23
0.45
(0.10
)
0.35
(0.45
)
10.13
9/30/2022
12.92
0.40
(2.69
)
(2.29
)
(0.40
)
10.23
9/30/2021
12.15
0.42
0.77
1.19
(0.42
)
12.92
9/30/2020
12.61
0.46
(0.47
)
(0.01
)
(0.45
)
12.15
9/30/2019
11.93
0.51
0.67
1.18
(0.50
)
12.61
Class F3
9/30/2023
10.20
0.47
(0.11
)
0.36
(0.46
)
10.10
9/30/2022
12.89
0.42
(2.70
)
(2.28
)
(0.41
)
10.20
9/30/2021
12.12
0.44
0.77
1.21
(0.44
)
12.89
9/30/2020
12.58
0.47
(0.46
)
0.01
(0.47
)
12.12
9/30/2019
11.90
0.52
0.67
1.19
(0.51
)
12.58
Class I
9/30/2023
10.20
0.47
(0.11
)
0.36
(0.46
)
10.10
9/30/2022
12.89
0.42
(2.70
)
(2.28
)
(0.41
)
10.20
9/30/2021
12.12
0.44
0.76
1.20
(0.43
)
12.89
9/30/2020
12.58
0.47
(0.47
)
–
(d)
(0.46
)
12.12
9/30/2019
11.90
0.51
0.68
1.19
(0.51
)
12.58
(a)
Calculated using average shares outstanding during the period.
(b)
Total return for Classes A and C does not consider the effects of sales loads and assumes the reinvestment of all distributions. Total return for all other classes assumes the reinvestment of all distributions.
(c)
Interest expense, if applicable, relates to the liability for floating rate notes issued in conjunction with tender option bond trusts.
(d)
Amount less than $0.01.
236
See Notes to Financial Statements.
Ratios to Average Net Assets:
Supplemental Data:
Total return (%)(b)
Total expenses after waivers and/or reim- bursements (includes interest expense) (%)(c)
Total expenses after waivers and/or reim- bursements (excludes interest expense) (%)(c)
Total expenses (%)
Net investment income (loss) (%)
Net assets, end of period (000)
Portfolio turnover rate (%)
3.23
0.81
0.77
0.81
4.26
$
1,680,507
42
(18.19
)
0.77
0.77
0.77
3.28
1,787,225
40
9.81
0.75
0.75
0.75
3.23
2,388,758
15
(0.09
)
0.77
0.77
0.77
3.69
1,822,069
43
9.94
0.79
0.79
0.79
4.09
1,728,665
11
2.58
1.44
1.40
1.44
3.63
141,950
42
(18.78
)
1.41
1.41
1.41
2.63
174,127
40
9.19
1.40
1.40
1.40
2.60
267,871
15
(0.81
)
1.42
1.42
1.42
3.06
242,392
43
9.34
1.42
1.42
1.42
3.48
346,925
11
3.33
0.71
0.67
0.71
4.31
112,452
42
(18.09
)
0.66
0.66
0.66
3.27
369,471
40
9.90
0.65
0.65
0.65
3.30
1,450,736
15
0.00
0.67
0.67
0.67
3.78
861,795
43
10.13
0.69
0.69
0.69
4.16
895,691
11
3.48
0.57
0.53
0.57
4.50
122,429
42
(18.01
)
0.51
0.51
0.51
3.55
114,134
40
10.07
0.52
0.51
0.51
3.42
118,100
15
0.14
0.53
0.53
0.53
3.92
55,503
43
10.28
0.55
0.55
0.55
4.24
32,101
11
3.43
0.61
0.57
0.61
4.46
1,227,801
42
(18.06
)
0.57
0.57
0.57
3.59
961,328
40
10.03
0.56
0.55
0.55
3.41
487,688
15
0.09
0.57
0.57
0.57
3.88
301,236
43
10.25
0.59
0.59
0.59
4.22
282,296
11
See Notes to Financial Statements.
237
Financial Highlights (continued)
SHORT DURATION HIGH INCOME MUNICIPAL BOND FUND
Per Share Operating Performance:
Investment Operations:
Distributions to shareholders from:
Net asset value, beginning of period
Net investment income (loss)(a)
Net realized and unrealized gain (loss)
Total from investment operations
Net investment income
Net asset value, end of period
Class A
9/30/2023
$
13.84
$
0.53
$
(0.08
)
$
0.45
$
(0.50
)
$
13.79
9/30/2022
15.88
0.34
(2.05
)
(1.71
)
(0.33
)
13.84
9/30/2021
15.20
0.33
0.69
1.02
(0.34
)
15.88
9/30/2020
15.64
0.43
(0.45
)
(0.02
)
(0.42
)
15.20
9/30/2019
15.10
0.46
0.52
0.98
(0.44
)
15.64
Class C
9/30/2023
13.84
0.43
(0.07
)
0.36
(0.41
)
13.79
9/30/2022
15.88
0.23
(2.04
)
(1.81
)
(0.23
)
13.84
9/30/2021
15.20
0.23
0.68
0.91
(0.23
)
15.88
9/30/2020
15.65
0.33
(0.46
)
(0.13
)
(0.32
)
15.20
9/30/2019
15.11
0.36
0.52
0.88
(0.34
)
15.65
Class F
9/30/2023
13.84
0.52
(0.05
)
0.47
(0.52
)
13.79
9/30/2022
15.88
0.33
(2.02
)
(1.69
)
(0.35
)
13.84
9/30/2021
15.20
0.34
0.69
1.03
(0.35
)
15.88
9/30/2020
15.64
0.45
(0.46
)
(0.01
)
(0.43
)
15.20
9/30/2019
15.10
0.47
0.53
1.00
(0.46
)
15.64
Class F3
9/30/2023
13.84
0.57
(0.08
)
0.49
(0.54
)
13.79
9/30/2022
15.88
0.38
(2.05
)
(1.67
)
(0.37
)
13.84
9/30/2021
15.20
0.37
0.69
1.06
(0.38
)
15.88
9/30/2020
15.65
0.47
(0.46
)
0.01
(0.46
)
15.20
9/30/2019
15.11
0.50
0.52
1.02
(0.48
)
15.65
Class I
9/30/2023
13.84
0.56
(0.08
)
0.48
(0.53
)
13.79
9/30/2022
15.88
0.38
(2.06
)
(1.68
)
(0.36
)
13.84
9/30/2021
15.20
0.36
0.69
1.05
(0.37
)
15.88
9/30/2020
15.65
0.46
(0.46
)
–
(0.45
)
15.20
9/30/2019
15.11
0.49
0.52
1.01
(0.47
)
15.65
(a)
Calculated using average shares outstanding during the period.
(b)
Total return for Classes A and C does not consider the effects of sales loads and assumes the reinvestment of all distributions. Total return for all other classes assumes the reinvestment of all distributions.
238
See Notes to Financial Statements.
Ratios to Average Net Assets:
Supplemental Data:
Total return (%)(b)
Total expenses after waivers and/or reim- bursements (%)
Total expenses (%)
Net investment income (loss) (%)
Net assets, end of period (000)
Portfolio turnover rate (%)
3.27
0.66
0.71
3.73
$
261,115
71
(10.85
)
0.70
0.77
2.27
325,756
81
6.74
0.69
0.75
2.09
409,286
14
(0.12
)
0.62
0.78
2.83
176,351
61
6.59
0.55
0.78
2.99
176,214
29
2.59
1.32
1.37
3.08
19,626
71
(11.48
)
1.40
1.47
1.56
21,392
81
6.03
1.36
1.43
1.43
26,412
14
(0.85
)
1.28
1.45
2.18
12,758
61
5.90
1.21
1.44
2.34
12,303
29
3.36
0.57
0.62
3.72
17,573
71
(10.77
)
0.60
0.66
2.18
139,299
81
6.84
0.59
0.65
2.17
495,439
14
(0.03
)
0.52
0.68
2.92
171,092
61
6.70
0.45
0.68
3.08
156,308
29
3.55
0.38
0.45
4.03
35,447
71
(10.62
)
0.44
0.50
2.56
28,251
81
7.02
0.43
0.49
2.31
31,122
14
0.07
0.36
0.52
3.10
8,538
61
6.86
0.30
0.53
3.24
6,546
29
3.40
0.46
0.50
3.97
566,518
71
(10.61
)
0.50
0.58
2.59
362,870
81
6.95
0.50
0.55
2.28
244,728
14
0.01
0.42
0.59
3.03
93,013
61
6.80
0.35
0.59
3.18
65,005
29
See Notes to Financial Statements.
239
Financial Highlights (continued)
SUSTAINABLE MUNICIPAL BOND FUND
Per Share Operating Performance:
Investment Operations:
Distributions to shareholders from:
Net asset value, beginning of period
Net investment income (loss)(a)
Net realized and unrealized gain (loss)
Total from investment operations
Net investment income
Net asset value, end of period
Class A
9/30/2023
$
8.79
$
0.25
$
0.07
$
0.32
$
(0.25
)
$
8.86
1/5/2022 to 9/30/2022(c)
10.00
0.10
(1.21
)
(1.11
)
(0.10
)
8.79
Class C
9/30/2023
8.79
0.18
0.07
0.25
(0.18
)
8.86
1/5/2022 to 9/30/2022(c)
10.00
0.05
(1.21
)
(1.16
)
(0.05
)
8.79
Class F
9/30/2023
8.79
0.26
0.07
0.33
(0.26
)
8.86
1/5/2022 to 9/30/2022(c)
10.00
0.11
(1.21
)
(1.10
)
(0.11
)
8.79
Class F3
9/30/2023
8.79
0.27
0.07
0.34
(0.27
)
8.86
1/5/2022 to 9/30/2022(c)
10.00
0.12
(1.21
)
(1.09
)
(0.12
)
8.79
Class I
9/30/2023
8.79
0.27
0.06
0.33
(0.26
)
8.86
1/5/2022 to 9/30/2022(c)
10.00
0.12
(1.21
)
(1.09
)
(0.12
)
8.79
(a)
Calculated using average shares outstanding during the period.
(b)
Total return for Classes A and C does not consider the effects of sales loads and assumes the reinvestment of all distributions. Total return for all other classes assumes the reinvestment of all distributions.
(c)
Commenced on January 5, 2022.
(d)
Not annualized.
(e)
Annualized.
240
See Notes to Financial Statements.
Ratios to Average Net Assets:
Supplemental Data:
Total return (%)(b)
Total expenses after waivers and/or reim- bursements (%)
Total expenses (%)
Net investment income (loss) (%)
Net assets, end of period (000)
Portfolio turnover rate (%)
3.57
0.63
2.92
2.74
$
2,910
58
(11.11
)(d)
0.63
(e)
2.16
(e)
1.48
(e)
2,682
90
(d)
2.77
1.41
3.86
2.01
169
58
(11.64
)(d)
1.43
(e)
2.96
(e)
0.68
(e)
66
90
(d)
3.67
0.53
2.80
2.84
66
58
(11.05
)(d)
0.53
(e)
2.06
(e)
1.58
(e)
66
90
(d)
3.82
0.39
2.67
2.97
89
58
(10.95
)(d)
0.39
(e)
1.91
(e)
1.72
(e)
88
90
(d)
3.78
0.43
2.74
2.95
1,917
58
(10.98
)(d)
0.43
(e)
1.96
(e)
1.68
(e)
1,638
90
(d)
See Notes to Financial Statements.
241
Financial Highlights (continued)
CALIFORNIA TAX FREE FUND
Per Share Operating Performance:
Investment Operations:
Distributions to shareholders from:
Net asset value, beginning of period
Net investment income (loss)(a)
Net realized and unrealized gain (loss)
Total from investment operations
Net investment income
Net asset value, end of period
Class A
9/30/2023
$
9.50
$
0.31
$
0.04
$
0.35
$
(0.30
)
$
9.55
9/30/2022
11.61
0.26
(2.11
)
(1.85
)
(0.26
)
9.50
9/30/2021
11.40
0.26
0.21
0.47
(0.26
)
11.61
9/30/2020
11.42
0.29
(0.03
)
0.26
(0.28
)
11.40
9/30/2019
10.76
0.33
0.66
0.99
(0.33
)
11.42
Class C
9/30/2023
9.51
0.24
0.05
0.29
(0.24
)
9.56
9/30/2022
11.62
0.19
(2.11
)
(1.92
)
(0.19
)
9.51
9/30/2021
11.41
0.19
0.21
0.40
(0.19
)
11.62
9/30/2020
11.42
0.21
(0.01
)
0.20
(0.21
)
11.41
9/30/2019
10.76
0.26
0.66
0.92
(0.26
)
11.42
Class F
9/30/2023
9.50
0.31
0.05
0.36
(0.31
)
9.55
9/30/2022
11.61
0.26
(2.10
)
(1.84
)
(0.27
)
9.50
9/30/2021
11.40
0.28
0.20
0.48
(0.27
)
11.61
9/30/2020
11.42
0.30
(0.02
)
0.28
(0.30
)
11.40
9/30/2019
10.75
0.34
0.67
1.01
(0.34
)
11.42
Class F3
9/30/2023
9.50
0.33
0.04
0.37
(0.32
)
9.55
9/30/2022
11.61
0.28
(2.11
)
(1.83
)
(0.28
)
9.50
9/30/2021
11.40
0.29
0.21
0.50
(0.29
)
11.61
9/30/2020
11.41
0.31
(0.01
)
0.30
(0.31
)
11.40
9/30/2019
10.75
0.35
0.66
1.01
(0.35
)
11.41
Class I
9/30/2023
9.50
0.33
0.03
0.36
(0.32
)
9.54
9/30/2022
11.61
0.28
(2.11
)
(1.83
)
(0.28
)
9.50
9/30/2021
11.40
0.29
0.21
0.50
(0.29
)
11.61
9/30/2020
11.41
0.31
(0.01
)
0.30
(0.31
)
11.40
9/30/2019
10.75
0.35
0.66
1.01
(0.35
)
11.41
(a)
Calculated using average shares outstanding during the period.
(b)
Total return for Classes A and C does not consider the effects of sales loads and assumes the reinvestment of all distributions. Total return for all other classes assumes the reinvestment of all distributions.
242
See Notes to Financial Statements.
Ratios to Average Net Assets:
Supplemental Data:
Total return (%)(b)
Total expenses after waivers and/or reim- bursements (%)
Total expenses (%)
Net investment income (loss) (%)
Net assets, end of period (000)
Portfolio turnover rate (%)
3.50
0.76
0.76
3.08
$
341,314
57
(16.10
)
0.77
0.77
2.39
303,455
44
4.16
0.77
0.77
2.27
381,200
14
2.36
0.78
0.78
2.53
342,426
18
9.34
0.79
0.79
3.00
289,148
15
2.97
1.38
1.38
2.45
18,912
57
(16.70
)
1.40
1.40
1.75
21,221
44
3.49
1.41
1.41
1.63
33,274
14
1.78
1.44
1.44
1.88
37,078
18
8.68
1.40
1.40
2.39
42,957
15
3.61
0.66
0.66
3.13
7,929
57
(16.02
)
0.67
0.67
2.37
20,964
44
4.26
0.67
0.67
2.36
130,104
14
2.46
0.68
0.68
2.61
112,378
18
9.55
0.69
0.69
3.08
73,687
15
3.84
0.54
0.54
3.31
45,077
57
(16.00
)
0.54
0.54
2.64
29,694
44
4.39
0.54
0.54
2.48
20,625
14
2.67
0.56
0.56
2.73
13,170
18
9.59
0.56
0.56
3.19
8,373
15
3.71
0.56
0.56
3.29
102,638
57
(16.02
)
0.58
0.58
2.69
78,796
44
4.37
0.57
0.57
2.46
39,117
14
2.65
0.58
0.58
2.73
30,880
18
9.56
0.58
0.58
3.18
29,782
15
See Notes to Financial Statements.
243
Financial Highlights (continued)
NEW JERSEY TAX FREE FUND
Per Share Operating Performance:
Investment Operations:
Distributions to shareholders from:
Net asset value, beginning of period
Net investment income (loss)(a)
Net realized and unrealized gain (loss)
Total from investment operations
Net investment income
Net asset value, end of period
Class A
9/30/2023
$
4.42
$
0.13
$
0.05
$
0.18
$
(0.13
)
$
4.47
9/30/2022
5.35
0.12
(0.93
)
(0.81
)
(0.12
)
4.42
9/30/2021
5.18
0.12
0.17
0.29
(0.12
)
5.35
9/30/2020
5.21
0.13
(0.03
)
0.10
(0.13
)
5.18
9/30/2019
4.91
0.14
0.30
0.44
(0.14
)
5.21
Class F
9/30/2023
4.42
0.14
0.05
0.19
(0.14
)
4.47
9/30/2022
5.35
0.12
(0.93
)
(0.81
)
(0.12
)
4.42
9/30/2021
5.18
0.12
0.17
0.29
(0.12
)
5.35
9/30/2020
5.21
0.13
(0.03
)
0.10
(0.13
)
5.18
9/30/2019
4.91
0.14
0.30
0.44
(0.14
)
5.21
Class F3
9/30/2023
4.42
0.15
0.06
0.21
(0.15
)
4.48
9/30/2022
5.35
0.13
(0.93
)
(0.80
)
(0.13
)
4.42
9/30/2021
5.18
0.13
0.17
0.30
(0.13
)
5.35
9/30/2020
5.22
0.14
(0.04
)
0.10
(0.14
)
5.18
9/30/2019
4.92
0.14
0.31
0.45
(0.15
)
5.22
Class I
9/30/2023
4.42
0.14
0.05
0.19
(0.14
)
4.47
9/30/2022
5.35
0.13
(0.93
)
(0.80
)
(0.13
)
4.42
9/30/2021
5.18
0.13
0.17
0.30
(0.13
)
5.35
9/30/2020
5.22
0.14
(0.04
)
0.10
(0.14
)
5.18
9/30/2019
4.92
0.14
0.31
0.45
(0.15
)
5.22
(a)
Calculated using average shares outstanding during the period.
(b)
Total return for Class A does not consider the effects of sales loads and assumes the reinvestment of all distributions. Total return for all other classes assumes the reinvestment of all distributions.
244
See Notes to Financial Statements.
Ratios to Average Net Assets:
Supplemental Data:
Total return (%)(b)
Total expenses after waivers and/or reim- bursements (%)
Total expenses (%)
Net investment income (loss) (%)
Net assets, end of period (000)
Portfolio turnover rate (%)
4.11
0.82
0.87
2.91
$
77,950
23
(15.36
)
0.82
0.84
2.39
80,854
11
5.58
0.82
0.84
2.21
99,356
13
1.92
0.82
0.85
2.48
101,085
15
9.00
0.82
0.86
2.69
99,027
4
4.21
0.72
0.77
3.00
3,693
23
(15.28
)
0.72
0.74
2.40
5,885
11
5.68
0.72
0.74
2.30
28,097
13
2.02
0.72
0.75
2.58
23,903
15
9.10
0.72
0.76
2.77
20,893
4
4.59
0.58
0.63
3.15
1,697
23
(15.16
)
0.58
0.60
2.65
1,342
11
5.82
0.59
0.60
2.40
1,148
13
1.96
0.59
0.62
2.71
618
15
9.22
0.58
0.63
2.79
531
4
4.32
0.62
0.66
3.11
17,943
23
(15.19
)
0.62
0.65
2.68
13,415
11
5.79
0.62
0.64
2.38
6,905
13
1.93
0.62
0.65
2.68
3,746
15
9.20
0.62
0.66
2.86
2,593
4
See Notes to Financial Statements.
245
Financial Highlights (concluded)
NEW YORK TAX FREE FUND
Per Share Operating Performance:
Investment Operations:
Distributions to shareholders from:
Net asset value, beginning of period
Net invest- ment income (loss)(a)
Net realized and unrealized gain (loss)
Total from invest- ment opera- tions
Net investment income
Net realized gain
Total distri- butions
Class A
9/30/2023
$
9.90
$
0.31
$
0.09
$
0.40
$
(0.31
)
$
–
$
(0.31
)
9/30/2022
12.06
0.27
(2.16
)
(1.89
)
(0.27
)
–
(0.27
)
9/30/2021
11.64
0.27
0.41
0.68
(0.26
)
–
(0.26
)
9/30/2020
11.77
0.27
(0.13
)
0.14
(0.27
)
–
(0.27
)
9/30/2019
11.08
0.29
0.69
0.98
(0.29
)
–
(c)
(0.29
)
Class C
9/30/2023
9.89
0.24
0.08
0.32
(0.24
)
–
(0.24
)
9/30/2022
12.04
0.20
(2.15
)
(1.95
)
(0.20
)
–
(0.20
)
9/30/2021
11.63
0.19
0.41
0.60
(0.19
)
–
(0.19
)
9/30/2020
11.75
0.20
(0.13
)
0.07
(0.19
)
–
(0.19
)
9/30/2019
11.06
0.22
0.69
0.91
(0.22
)
–
(c)
(0.22
)
Class F
9/30/2023
9.91
0.32
0.09
0.41
(0.32
)
–
(0.32
)
9/30/2022
12.07
0.28
(2.16
)
(1.88
)
(0.28
)
–
(0.28
)
9/30/2021
11.66
0.28
0.41
0.69
(0.28
)
–
(0.28
)
9/30/2020
11.78
0.28
(0.12
)
0.16
(0.28
)
–
(0.28
)
9/30/2019
11.09
0.30
0.69
0.99
(0.30
)
–
(c)
(0.30
)
Class F3
9/30/2023
9.91
0.33
0.08
0.41
(0.33
)
–
(0.33
)
9/30/2022
12.07
0.30
(2.17
)
(1.87
)
(0.29
)
–
(0.29
)
9/30/2021
11.65
0.29
0.42
0.71
(0.29
)
–
(0.29
)
9/30/2020
11.78
0.30
(0.13
)
0.17
(0.30
)
–
(0.30
)
9/30/2019
11.08
0.31
0.70
1.01
(0.31
)
–
(c)
(0.31
)
Class I
9/30/2023
9.91
0.33
0.08
0.41
(0.33
)
–
(0.33
)
9/30/2022
12.07
0.29
(2.16
)
(1.87
)
(0.29
)
–
(0.29
)
9/30/2021
11.65
0.29
0.42
0.71
(0.29
)
–
(0.29
)
9/30/2020
11.78
0.29
(0.13
)
0.16
(0.29
)
–
(0.29
)
9/30/2019
11.08
0.31
0.70
1.01
(0.31
)
–
(c)
(0.31
)
(a)
Calculated using average shares outstanding during the period.
(b)
Total return for Classes A and C does not consider the effects of sales loads and assumes the reinvestment of all distributions. Total return for all other classes assumes the reinvestment of all distributions.
(c)
Amount less than $0.01.
246
See Notes to Financial Statements.
Ratios to Average Net Assets:
Supplemental Data:
Net asset value, end of period
Total return (%)(b)
Total expenses after waivers and/or reim- bursements (%)
Total expenses (%)
Net investment income (loss) (%)
Net assets, end of period (000)
Portfolio turnover rate (%)
$
9.99
3.93
0.78
0.78
2.98
$
303,557
24
9.90
(15.91
)
0.78
0.78
2.39
322,138
23
12.06
5.90
0.77
0.77
2.20
390,194
13
11.64
1.21
0.78
0.78
2.33
357,909
22
11.77
8.98
0.79
0.79
2.52
332,822
7
9.97
3.29
1.40
1.40
2.36
17,453
24
9.89
(16.39
)
1.42
1.42
1.74
20,927
23
12.04
5.13
1.42
1.42
1.56
32,845
13
11.63
0.64
1.44
1.44
1.68
34,749
22
11.75
8.33
1.40
1.40
1.92
45,213
7
��
10.00
4.04
0.68
0.68
3.06
6,898
24
9.91
(15.81
)
0.68
0.68
2.40
19,360
23
12.07
6.00
0.67
0.67
2.30
71,401
13
11.66
1.31
0.68
0.68
2.43
63,388
22
11.78
9.08
0.69
0.69
2.62
55,301
7
9.99
4.07
0.55
0.55
3.21
2,290
24
9.91
(15.70
)
0.54
0.54
2.65
2,364
23
12.07
6.14
0.54
0.54
2.41
2,071
13
11.65
1.44
0.56
0.56
2.56
1,366
22
11.78
9.32
0.56
0.56
2.74
1,234
7
9.99
4.04
0.58
0.58
3.18
87,480
24
9.91
(15.73
)
0.58
0.58
2.66
70,220
23
12.07
6.11
0.57
0.57
2.38
43,385
13
11.65
1.41
0.59
0.59
2.51
29,600
22
11.78
9.29
0.59
0.59
2.72
12,674
7
See Notes to Financial Statements.
247
Notes to Financial Statements
1.
ORGANIZATION
Lord Abbett Municipal Income Fund, Inc. (the “Company”) is registered under the Investment Company Act of 1940, as amended (the “Act”), as an open-end management investment company. The Company was organized as a Maryland corporation on December 27, 1983.
The Company currently consists of the following nine funds (separately, a “Fund” and collectively, the “Funds”) and their respective active share classes:
Funds
Classes
Lord Abbett Short Duration Tax Free Fund (“Short Duration”)
A,C,F,F3 and I
Lord Abbett Intermediate Tax Free Fund (“Intermediate”)
A,C,F,F3 and I
Lord Abbett National Tax-Free Income Fund (“National”)
A,C,F,F3 and I
Lord Abbett High Income Municipal Bond Fund (“High Income”)
A,C,F,F3 and I
Lord Abbett Short Duration High Income Municipal Bond Fund (“Short Duration High Income”)
A,C,F,F3 and I
Lord Abbett Sustainable Municipal Bond Fund (“Sustainable”)
A,C,F,F3 and I
Lord Abbett California Tax-Free Income Fund (“California”)
A,C,F,F3 and I
Lord Abbett New Jersey Tax-Free Income Fund (“New Jersey”)
A,F,F3 and I
Lord Abbett New York Tax-Free Income Fund (“New York”)
A,C,F,F3 and I
Short Duration, Intermediate, National, High Income, Short Duration High Income, Sustainable and California are diversified as defined in the Act. New Jersey and New York are non-diversified as defined in the Act.
The investment objective of each Fund (except for High Income and Short Duration High Income) is to seek the maximum amount of interest income exempt from federal income tax as is consistent with reasonable risk. The investment objective of High Income and Short Duration High Income is to seek a high level of income exempt from federal income tax. Each of California, New Jersey and New York also seeks as high a level of interest income exempt from the personal income tax of its corresponding state as is consistent with reasonable risk. In addition, New York seeks as high a level of interest income exempt from New York City personal income tax as is consistent with reasonable risk.
Each class of shares has different expenses and dividends. A front-end sales charge is normally added to the net asset value (“NAV”) for Class A shares. There is no front-end sales charge in the case of Class C, F, F3 and I shares, although there may be a contingent deferred sales charge (“CDSC”) in certain cases as follows: Class A shares purchased without a sales charge and redeemed before the first day of the month in which the eighteen-month anniversary of the purchase falls (subject to certain exceptions as set forth in each Fund’s prospectus); and Class C shares redeemed before the first anniversary of purchase. Class C shares automatically convert to Class A shares on the 25th day of the month (or, if the 25th day is not a business day, the next business day thereafter) following the eighth anniversary of the month on which the purchase order was accepted, provided that the Funds or financial intermediary through which a shareholder purchased Class C shares has records verifying that the Class C shares have been held at least eight years.
Sustainable commenced operations on January 5, 2022.
The preparation of the financial statements in conformity with accounting principles generally accepted in the United States of America (“U.S. GAAP”) requires management to make certain estimates and assumptions that affect the reported amounts of assets and liabilities and disclosure of contingent assets and liabilities at the date of the financial statements and the reported amounts
248
Notes to Financial Statements (continued)
of increases and decreases in net assets from operations during the reporting period. Actual results could differ from those estimates. Each Fund is considered an investment company under U.S. GAAP and follows the accounting and reporting guidance applicable to investment companies.
2.
SIGNIFICANT ACCOUNTING POLICIES
(a)
Investment Valuation–Under procedures approved by the Funds’ Board of Directors (the “Board”), the Board has designated the determination of fair value of the Funds’ portfolio investments to Lord, Abbett & Co. LLC (“Lord Abbett”) as its valuation designee. Accordingly, Lord Abbett is responsible for, among other things, assessing and managing valuation risks, establishing, applying and testing fair value methodologies, and evaluating pricing services. Lord Abbett has formed a Pricing Committee that performs these responsibilities on behalf of Lord Abbett, administers the pricing and valuation of portfolio investments and ensures that prices utilized reasonably reflect fair value. Among other things, these procedures allow Lord Abbett, subject to Board oversight, to utilize independent pricing services, quotations from securities and financial instrument dealers and other market sources to determine fair value.
Securities are valued based on evaluated prices supplied by independent pricing services, which reflect broker/dealer supplied valuations and the independent pricing services’ own electronic data processing techniques. Exchange traded options and futures contracts are valued at the last quoted sale price in the market where they are principally traded. If no sale has occurred, the mean between the most recently quoted bid and ask prices is used.
Securities for which prices are not readily available are valued at fair value as determined by the Pricing Committee. The Pricing Committee considers a number of factors, including observable and unobservable inputs, when arriving at fair value. The Pricing Committee may use observable inputs such as yield curves, broker quotes, observable trading activity, option adjusted spread models and other relevant information to determine the fair value of portfolio investments. The Board or a designated committee thereof periodically reviews reports that may include fair value determinations made by the Pricing Committee, related market activity, inputs and assumptions, and retrospective comparison of prices of subsequent purchases and sales transactions to fair value determinations made by the Pricing Committee.
Short-term securities with 60 days or less remaining to maturity are valued using the amortized cost method, which approximates fair value.
(b)
Security Transactions–Security transactions are recorded as of the date that the securities are purchased or sold (trade date). Realized gains and losses on sales of portfolio securities are calculated using the identified-cost method. Realized and unrealized gains (losses) are allocated to each class of shares based upon the relative proportion of net assets at the beginning of the day.
(c)
Investment Income–Dividend income is recorded on the ex-dividend date. Interest income is recorded on the accrual basis as earned. Discounts are accreted and premiums are amortized using the effective interest method and are included in Interest and other, if applicable, in the Statements of Operations. Investment income is allocated to each class of shares based upon the relative proportion of net assets at the beginning of the day.
(d)
Income Taxes–It is the policy of each Fund to meet the requirements of Subchapter M of the Internal Revenue Code applicable to regulated investment companies and to distribute substantially all taxable income and capital gains to its shareholders. Therefore, no income tax provision is required.
249
Notes to Financial Statements (continued)
Each Fund files U.S. federal and various state and local tax returns. No income tax returns are currently under examination. The statute of limitations on each Fund’s, except Sustainable, filed U.S. federal tax returns remains open for the fiscal years ended September 30, 2020 through September 30, 2023. The statute of limitation for Sustainable filed U.S. federal tax return remains open for the period ended September 30, 2022 through September 30, 2023. The statutes of limitations on the Company’s state and local tax returns may remain open for an additional year depending upon the Fund’s jurisdiction.
(e)
Expenses–Expenses incurred by the Company that do not specifically relate to an individual fund are generally allocated to the Funds within the Company on a pro rata basis by relative net assets. Expenses, excluding class-specific expenses, are allocated to each class of shares based upon the relative proportion of net assets at the beginning of the day. In addition, Class F3 bear their class-specific share of shareholder servicing expenses. Class A, C and F shares bear their class-specific share of all expenses and fees relating to the Funds’ 12b-1 Distribution Plan.
(f)
Futures Contracts–Each Fund may purchase and sell futures contracts to enhance returns, to attempt to economically hedge some of its investment risk, or as a substitute position in lieu of holding the underlying asset on which the instrument is based. At the time of entering into a futures transaction, an investor is required to deposit and maintain a specified amount of cash or eligible securities called “initial margin.” Subsequent payments made or received by the Funds called “variation margin” are made on a daily basis as the market price of the futures contract fluctuates. Each Fund will record an unrealized gain (loss) based on the amount of variation margin. When a contract is closed, a realized gain (loss) is recorded equal to the difference between the opening and closing value of the contract.
(g)
When-Issued Municipal Bonds–Each Fund may purchase new issues of municipal bonds, which are generally offered on a when-issued basis. Payment and delivery may take place after customary settlement period for that security.
(h)
Municipal Bonds Held in Trust–Each Fund may invest in leveraged residual certificates (“TOB Residuals”) issued by tender option bond trusts (“TOBs”). A TOB is established by a third party sponsor forming a special purpose entity into which a Fund, or an agent on behalf of the Fund, transfers municipal securities. A TOB typically issues two classes of beneficial interests: short-term floating rate certificates (trust certificates), which are sold to third party investors, and residual certificates, which are generally issued to the Fund which made the transfer or to affiliates of the Fund. Each Fund’s transfer of the municipal securities to a TOB is accounted for as a secured borrowing, therefore the municipal securities deposited into a TOB are presented as investments in a Fund’s Schedule of Investments and the proceeds from the transactions are reported as a liability for Trust certificates in the Statements of Assets and Liabilities. Similarly, proceeds from residual certificates issued to affiliates, if any, from the transaction are included in the liability for Trust certificates. Interest income from the underlying security is recorded by a Fund on an accrual basis. Interest expense incurred on the secured borrowing and other expenses related to remarketing, administration and trustee services to a TOB are reported as expenses of a Fund. The floating rate certificates have interest rates that generally reset weekly and their holders have the option to tender certificates to the TOB for redemption at par at each reset date. The residual interests held by a Fund include the right of the Fund (1) to cause the holders of a proportional share of floating rate certificates to tender their certificates at par and (2) to transfer a corresponding
250
Notes to Financial Statements (continued)
share of the municipal securities from the TOB to the Fund. The TOB may also be terminated without the consent of the Fund upon the occurrence of certain events as defined in the TOB agreements. Such termination events may include the bankruptcy or default of the municipal bond, a substantial downgrade in credit quality of the municipal bond, the inability of the TOB to obtain quarterly or annual renewal of the liquidity support agreement, a substantial decline in market value of the municipal bond or the inability to remarket the short-term floating rate certificates to third party investors.
The following is a summary of TOBs as of and during the fiscal year ended September 30, 2023:
Fund
Liability for Trust Certificates
Interest Rate or Range of Interest Rates
Underlying Municipal Bonds Transferred to TOBs
Average Trust Certificates Outstanding
Short Duration
$
–
–
$
–
$
–
Intermediate
–
–
–
–
National
86,140,000
4.01%–4.65%
176,472,158
68,797,000
High Income
51,465,000
4.01%–4.65%
105,642,234
40,878,000
Short Duration High Income
–
–
–
–
Sustainable
–
–
–
–
California
–
–
–
–
New Jersey
–
–
–
–
New York
–
–
–
–
Financial transactions executed through TOBs generally will underperform the market for fixed rate municipal bonds in a rising interest rate environment, but tend to outperform the market for fixed rate municipal bonds when interest rates decline or remain relatively stable. Should short-term interest rates rise, a Fund’s investment in TOB Residuals likely will adversely affect a Fund’s net investment income and distributions to shareholders. Fluctuations in the market value of municipal securities deposited into the TOB may adversely affect a Fund’s NAV per share. The carrying value of each Fund’s liability for Trust certificates approximates its fair value.
While the Funds’ investment policies and restrictions expressly permit investments in inverse floating rate securities such as TOB Residuals, they generally do not allow the Funds to borrow money for purposes of making investments. The Funds’ management believes that the Funds’ restrictions on borrowings do not apply to TOB transactions, accounted for as secured borrowings.
(i)
Fair Value Measurements–Fair value is defined as the price that each Fund would receive upon selling an investment or transferring a liability in an orderly transaction to an independent buyer in the principal or most advantageous market of the investment. A three-tier hierarchy is used to maximize the use of observable market data and minimize the use of unobservable inputs and to establish classification of fair value measurements for disclosure purposes. Inputs refer broadly to the assumptions that market participants would use in pricing the asset or liability, including assumptions about risk - for example, the risk inherent in a particular valuation technique used to measure fair value (such as a pricing model) and/or the risk inherent in the inputs to the valuation technique. Inputs may be observable or unobservable. Observable inputs reflect the assumptions market participants would use in pricing the asset or liability. Observable inputs are based on market data obtained from sources independent of the reporting entity. Unobservable inputs reflect the reporting entity’s own assumptions about the assumptions market participants
251
Notes to Financial Statements (continued)
would use in pricing the asset or liability. Unobservable inputs are based on the best information available in the circumstances. The three-tier hierarchy classification is determined based on the lowest level of inputs that is significant to the fair value measurement, and is summarized in the three broad Levels listed below:
●
Level 1 –
unadjusted quoted prices in active markets for identical investments;
●
Level 2 –
other significant observable inputs (including quoted prices for similar investments, interest rates, prepayment speeds, credit risk, etc.); and
●
Level 3 –
significant unobservable inputs (including each Fund’s own assumptions in determining the fair value of investments).
A summary of inputs used in valuing each Fund’s investments and other financial instruments as of September 30, 2023 and, if applicable, Level 3 rollforwards for the fiscal year then ended is included in each Fund’s Schedule of Investments.
Changes in valuation techniques may result in transfers into or out of an assigned level within the three-tier hierarchy. The inputs or methodology used for valuing securities are not necessarily an indication of the risk associated with investing in those securities.
3.
MANAGEMENT FEE AND OTHER TRANSACTIONS WITH AFFILIATES
Management Fee
The Company has a management agreement with Lord Abbett, pursuant to which Lord Abbett provides each Fund with investment management services and executive and other personnel, provides office space and pays for ordinary and necessary office and clerical expenses relating to research and statistical work and supervision of each Fund’s investment portfolio. The management fee is accrued daily and payable monthly.
The management fee for Short Duration is based on the Fund’s average daily net assets at the following annual rates:
First $2 billion
.34%
Next $3 billion
.32%
Over $5 billion
.29%
The management fee for Intermediate is based on the Fund’s average daily net assets at the following annual rates:
First $2 billion
.40%
Next $3 billion
.375%
Next $5 billion
.35%
Over $10 billion
.32%
The management fee for each of National, California, New Jersey and New York is based on the Fund’s average daily net assets at the following annual rates:
First $1 billion
.45%
Next $1 billion
.40%
Over $2 billion
.35%
The management fee for High Income is based on the Fund’s average daily net assets at the following annual rates:
First $1 billion
.50%
Next $1 billion
.45%
Over $2 billion
.40%
252
Notes to Financial Statements (continued)
The management fee for Short Duration High Income is based on the Fund’s average daily net assets at the following annual rates:(1)
First $1 billion
.35%
Over $1 billion
.31%
The management fee for Sustainable is based on the Fund’s average daily net assets at the following annual rates:
First $1 billion
.32%
Over $1 billion
.29%
(1)
Prior to December 9, 2022, the management fee is based on the Fund’s average daily net assets at the following annual rate:
First $2 billion
.40%
Next $1 billion
.375%
Over $3 billion
.35%
For the fiscal year ended September 30, 2023, the effective management fee, net of any applicable waivers, was at the following annualized rate of each Fund’s average daily net assets:
Net Effective Management Fee
Short Duration
.33%
Intermediate
.38%
National
.39%
High Income
.44%
Short Duration High Income
.32%
Sustainable
.00%
California
.45%
New Jersey
.41%
New York
.45%
In addition, Lord Abbett provides certain administrative services to each Fund pursuant to an Administrative Services Agreement in return for a fee at an annual rate of .04% of each Fund’s average daily net assets. The fund administration fee is accrued daily and payable monthly. Lord Abbett voluntarily waived the following fund administration fees during the fiscal year ended September 30, 2023:
Fund
Fund Administration Fee
Short Duration
$25,183
Intermediate
59,261
National
37,659
High Income
38,526
Short Duration High Income
19,371
Sustainable
577
California
9,086
New Jersey
3,906
New York
12,594
253
Notes to Financial Statements (continued)
For the fiscal year ended September 30, 2023 and continuing through January 31, 2024 Lord Abbett has contractually agreed to waive its fees and reimburse expenses to limit the total net annual operating expenses for each class, excluding certain of the Funds’ expenses, and interest related expenses, to the following annual rates:
Effective December 9, 2022
Prior to December 9, 2022
Classes*
Classes*
Fund
A,C,F and I
F3
A,C,F and I
F3
Short Duration
.45%
.41%
.45%
.41%
Short Duration High Income
.45%
.37%
.50%
.44%
Sustainable
.43%
.39%
.43%
.39%
New Jersey
.62%
.58%
.62%
.58%
*
If applicable.
All contractual fee waivers and expense reimbursement agreements between the Funds and Lord Abbett may be terminated only upon the approval of the Board.
12b-1 Distribution Plan
Each Fund has adopted a distribution plan with respect to Class A, C and F shares pursuant to Rule 12b-1 under the Act, which provides for the payment of ongoing distribution and service fees to Lord Abbett Distributor LLC (the “Distributor”), an affiliate of Lord Abbett. The distribution and service fees are accrued daily and payable monthly. The following annual rates have been authorized by the Board pursuant to the plan:
Fees
Class A
Class C(1)
Class F(2)
Service
.15%
.75%
–
Distribution
.05%
.25%
.10%
(1)
The Rule 12b-1 fee each applicable Fund pays on Class C shares is a blended rate based on 1.00% of each Fund’s daily net assets attributable to Class C shares held less than 1 year and .80% (25% service and 55% distribution) of each Fund’s daily net assets attributable to Class C for 1 year or more. All Class C shareholders will bear Rule 12b-1 fees at the same rate.
(2)
The Class F share Rule 12b-1 fee may be designated as a service fee in limited circumstances as described in the Funds’ prospectus.
Class F3 and Class I Shares do not have a distribution plan.
Commissions
Distributor received the following commissions on sales of shares of the Funds, after concessions were paid to authorized dealers, during the fiscal year ended September 30, 2023:
Distributor Commissions
Dealers’ Concessions
Short Duration
$
15,935
��
$
517,735
Intermediate
40,745
1,057,402
National
80,384
2,085,650
High Income
52,384
1,382,275
Short Duration High Income
5,942
249,993
Sustainable
8
60
California
9,646
495,485
New Jersey
3,274
52,422
New York
4,390
266,587
254
Notes to Financial Statements (continued)
Distributor received the following amount of CDSCs during the fiscal year ended September 30, 2023:
Class A
Class C
Short Duration
$
110,837
$
2,015
Intermediate
158,172
2,697
National
141,764
3,817
High Income
177,256
7,543
Short Duration High Income
35,355
289
Sustainable
–
–
California
30,995
1,129
New Jersey
25,257
50
New York
22,547
177
One Director and certain of the Funds’ officers have an interest in Lord Abbett.
4.
DISTRIBUTIONS AND CAPITAL LOSS CARRYFORWARDS
Dividends from net investment income, if any, are declared daily and paid monthly. Taxable net realized gains from investment transactions, reduced by allowable capital loss carryforwards, if any, are declared and distributed to shareholders at least annually. The capital loss carryforward amount, if any, is available to offset future net capital gains. Dividends and distributions to shareholders are recorded on the ex-dividend date. The amounts of dividends and distributions from net investment income and net realized capital gains are determined in accordance with federal income tax regulations, which may differ from U.S. GAAP. These book/tax differences are either considered temporary or permanent in nature. To the extent these differences are permanent in nature, such amounts are reclassified within the components of net assets based on their federal tax basis treatment; temporary differences do not require reclassification. Dividends and distributions, which exceed earnings and profits for tax purposes, are reported as a tax return of capital.
The tax character of distributions paid during the fiscal year ended September 30, 2023 and period ended September 30, 2022 was as follows:
Short Duration Tax Free Fund
Intermediate Tax Free Fund
Year Ended 9/30/2023
Year Ended 9/30/2022
Year Ended 9/30/2023
Year Ended 9/30/2022
Distributions paid from:
Tax-exempt income
$
39,787,976
$
24,078,685
$
139,976,590
$
130,537,335
Ordinary income
–
85,118
166,228
457,520
Total distributions paid
$
39,787,976
$
24,163,803
$
140,142,818
$
130,994,855
National Tax Free Fund
High Income Municipal Bond Fund
Year Ended 9/30/2023
Year Ended 9/30/2022
Year Ended 9/30/2023
Year Ended 9/30/2022
Distributions paid from:
Tax-exempt income
$
121,933,970
$
109,477,825
$
141,937,657
$
137,361,933
Ordinary income
203,243
549,801
235,933
1,658,444
Total distributions paid
$
122,137,213
$
110,027,626
$
142,173,590
$
139,020,377
255
Notes to Financial Statements (continued)
Short Duration High Income Municipal Bond Fund
Sustainable Municipal Bond Fund
Year Ended 9/30/2023
Year Ended 9/30/2022
Year Ended 9/30/2023
Period Ended 9/30/2022
Distributions paid from:
Tax-exempt income
$
32,629,085
$
24,801,277
$
141,231
$
53,408
Ordinary income
201,428
726,034
2
—
Total distributions paid
$
32,830,513
$
25,527,311
$
141,233
$
53,408
California Tax Free Fund
New Jersey Tax Free Fund
Year Ended 9/30/2023
Year Ended 9/30/2022
Year Ended 9/30/2023
Year Ended 9/30/2022
Distributions paid from:
Tax-exempt income
$
15,142,551
$
12,532,074
$
3,029,991
$
2,977,642
Ordinary income
641
53,863
428
2,343
Total distributions paid
$
15,143,192
$
12,585,937
$
3,030,419
$
2,979,985
New York Tax Free Fund
Year Ended 9/30/2023
Year Ended 9/30/2022
Distributions paid from:
Tax-exempt income
$
12,781,487
$
11,731,906
Ordinary income
–
8,377
Total distributions paid
$
12,781,487
$
11,740,283
As of September 30, 2023, the components of accumulated gains (losses) on a tax-basis were as follows:
Short Duration
Intermediate
National
Undistributed tax-exempt income – net
$
4,865,112
$
25,522,773
$
19,137,658
Total undistributed earnings
4,865,112
25,522,773
19,137,658
Capital loss carryforwards*
(91,674,622
)
(356,216,466
)
(351,441,220
)
Other temporary differences
(4,044,321
)
(13,064,963
)
(11,665,773
)
Unrealized gains (losses) - net
(41,486,424
)
(272,267,375
)
(236,202,278
)
Total accumulated gains (losses) - net
$
(132,340,255
)
$
(616,026,031
)
$
(580,171,613
)
High Income
Short Duration High Income
Sustainable
Undistributed tax-exempt income – net
$
36,741,908
$
4,889,768
$
16,131
Total undistributed earnings
36,741,908
4,889,768
16,131
Capital loss carryforwards*
(530,820,153
)
(111,432,262
)
(444,874
)
Other temporary differences
(12,534,126
)
(3,000,665
)
(14,485
)
Unrealized gains (losses) - net
(355,132,328
)
(33,473,526
)
(148,012
)
Total accumulated gains (losses) - net
$
(861,744,699
)
$
(143,016,685
)
$
(591,240
)
California
New Jersey
New York
Undistributed tax-exempt income – net
$
1,852,285
$
256,875
$
708,409
Total undistributed earnings
1,852,285
256,875
708,409
Capital loss carryforwards*
(38,413,391
)
(2,853,476
)
(17,800,373
)
Other temporary differences
(1,535,437
)
(288,139
)
(1,214,852
)
Unrealized gains (losses) - net
(30,973,146
)
(10,594,341
)
(44,204,427
)
Total accumulated gains (losses) - net
$
(69,069,689
)
$
(13,479,081
)
$
(62,511,243
)
*
The capital losses will carry forward indefinitely
As of September 30, 2023, the aggregate unrealized security gains and losses on investments and other financial instruments based on cost for U.S. federal income tax purposes were as follows:
256
Notes to Financial Statements (continued)
Tax Cost
Gross Unrealized Gain
Gross Unrealized Loss
Net Unrealized Gain/(Loss)
Short Duration
$
1,632,837,864
$
245,079
$
(41,731,503
)
$
(41,486,424
)
Intermediate
5,088,927,820
9,688,645
(281,956,020
)
(272,267,375
)
National
3,876,451,597
16,902,182
(253,104,460
)
(236,202,278
)
High Income
3,613,264,830
20,991,971
(376,124,294
)
(355,132,323
)
Short Duration High Income
931,490,505
1,585,469
(35,058,995
)
(33,473,526
)
Sustainable
5,232,186
14,576
(162,588
)
(148,012
)
California
548,562,732
757,406
(31,730,552
)
(30,973,146
)
New Jersey
109,697,862
323,546
(10,917,887
)
(10,594,341
)
New York
462,786,624
930,187
(45,134,614
)
(44,204,427
)
The difference between book-basis and tax-basis unrealized gains (losses) is attributable to the tax treatment of accretion on market discount, tender option bond trusts, other financial instruments and wash sales.
5.
PORTFOLIO SECURITIES TRANSACTIONS
Purchases and sales of investment securities (excluding short-term investments) during the fiscal year ended September 30, 2023 were as follows:
Purchases
Sales
Short Duration
$
940,289,544
$
1,297,706,205
Intermediate
2,135,080,778
2,189,138,737
National
1,756,137,448
1,402,723,348
High Income
1,369,176,611
1,400,078,251
Short Duration High Income
645,939,576
617,717,536
Sustainable
3,804,455
2,809,317
California
357,829,424
278,841,579
New Jersey
23,285,154
25,586,303
New York
101,913,417
117,774,801
There were no purchases or sales of U.S. Government securities during the fiscal year ended September 30, 2023.
6.
DISCLOSURES ABOUT DERIVATIVE INSTRUMENTS AND HEDGING ACTIVITIES
Each Fund except Sustainable, entered into U.S. Treasury futures contracts during the fiscal year ended September 30, 2023 (as described in Note 2(f)) to economically hedge against changes in interest rates. The Funds bear the risk of interest rates moving unexpectedly, in which case the Funds may not achieve the anticipated benefits of the futures contracts and realize a loss. There is minimal counterparty credit risk to the Funds since futures are exchange traded and the exchange’s clearinghouse, as counterparty to all exchange traded futures, guarantees futures against default.
As of September 30, 2023, the Funds had interest rate futures contracts with cumulative net unrealized appreciation/depreciation which are included in the Schedules of Investments. Only the current day’s variation margin is included in the Statements of Assets and Liabilities. The net realized gain (loss) on futures contracts and change in unrealized appreciation/depreciation on futures contracts are included in the Statements of Operations under the captions Net realized gain (loss) on futures contracts and Net change in unrealized appreciation/depreciation on futures contracts, respectively.
257
Notes to Financial Statements (continued)
The following is a summary of U.S. Treasury futures contracts as of and during the fiscal year ended September 30, 2023:
Net Unrealized Appreciation (Depreciation)
Net Realized Gain (Loss)
Net Change in Unrealized Appreciation (Depreciation)
Average Number of Contracts*
Short Duration
$
(487,900
)
$
348
$
(487,900
)
47
Intermediate
–
5,016,849
(5,391,392
)
102
National
1,966,370
6,858,094
(2,395,380
)
360
High Income
1,861,694
8,220,733
(4,053,996
)
472
Short Duration High Income
–
3,580,393
(2,720,831
)
410
California
354,383
1,010,750
(229,470
)
75
New Jersey
42,526
192,614
(64,642
)
9
New York
343,442
869,162
(106,665
)
45
*
Calculated based on the number of contracts for the fiscal year ended September 30, 2023.
7.
DISCLOSURES ABOUT OFFSETTING ASSETS AND LIABILITIES
The Financial Accounting Standards Board (“FASB”) requires disclosure intended to help better assess the effect or potential effect of offsetting arrangements on a fund’s financial position. These requirements include the disclosure of gross and net information about recognized assets and liabilities eligible for offset in the Statement of Assets and Liabilities; and disclose such amounts subject to an enforceable master netting agreement or similar agreement, by the counterparty. A master netting agreement is an agreement between a fund and a counterparty which provides for the net settlement of amounts owed under all contracts traded under that agreement, as well as cash collateral, through a single payment by one party to the other in the event of default on or termination of any one contract. The Funds’ accounting policy with respect to balance sheet offsetting is that, absent an event of default by the counterparty or a termination of the agreement, the master netting agreement does not result in an offset of reported amounts of financial assets and liabilities in the Statement of Assets and Liabilities across transactions between a Fund and the applicable counterparty. As of September 30, 2023, the Funds did not have assets or liabilities subject to the FASB disclosure requirements.
8.
DIRECTORS’ REMUNERATION
The Company’s officers and the one Director, who are associated with Lord Abbett, do not receive any compensation from the Company for serving in such capacities. Independent Directors’ fees are allocated among all Lord Abbett-sponsored funds based on the net assets of each fund. There is an equity-based plan available to all Independent Directors under which Independent Directors may elect to defer receipt of an additional portion of Directors’ fees. The deferred amounts are treated as though equivalent dollar amounts had been invested in the Funds. Such amounts and earnings accrued thereon are included in Directors’ fees in the Statements of Operations and in Directors’ fees payable in the Statements of Assets and Liabilities and are not deductible for U.S. federal income tax purposes until such amounts are paid.
258
Notes to Financial Statements (continued)
9.
EXPENSE REDUCTIONS
The Company has entered into an arrangement with its prior transfer agent and its custodian, whereby credits realized as a result of uninvested cash balances are used to reduce a portion of each Fund’s expenses. The arrangement with the Funds’ prior transfer agent was discontinued effective March 6, 2023.
10.
LINE OF CREDIT
For the period ended August 2, 2023, the Funds and certain other funds managed by Lord Abbett (collectively, the “Participating Funds”) were party to a syndicated line of credit facility with various lenders for $1.625 billion (the “Syndicated Facility”) under which State Street Bank and Trust Company (“SSB”) participated as a lender and as agent for the lenders. The Participating Funds were subject to graduated borrowing limits of one-third of fund net assets (if fund net assets are less than $750 million), $250 million, $300 million, $700 million, or $1 billion, based on past borrowings and likelihood of future borrowings, among other factors.
Effective August 3, 2023, the Participating Funds renewed the Syndicated Facility for $1.6 billion. The Participating Funds remain subject to the same borrowing limits as before.
For the period ended August 2, 2023, the Participating Funds were also party to an additional uncommitted line of credit facility with SSB for $330 million (the “Bilateral Facility”). Under the Bilateral Facility, the Participating Funds were subject to graduated borrowing limits of one-third of fund net assets (if fund net assets are less than $750 million), or $250 million based on past borrowings and likelihood of future borrowings, among other factors.
Effective August 3, 2023, the Participating Funds renewed the Bilateral Facility in the same amount. The Participating Funds remain subject to the same borrowing limits as before.
These credit facilities are to be used for temporary or emergency purposes as additional sources of liquidity to satisfy redemptions.
For the fiscal year ended September 30, 2023, the Funds did not utilize the Syndicated Facility or Bilateral Facility.
11.
INTERFUND LENDING PROGRAM
Pursuant to an exemptive order issued by the U.S. Securities and Exchange Commission (“SEC exemptive order”) certain registered open-end management investment companies managed by Lord Abbett, including each Fund, participate in a joint lending and borrowing program (the “Interfund Lending Program”). The SEC exemptive order allows the funds that participate in the Interfund Lending Program to borrow money from and lend money to each other for temporary or emergency purposes subject to the limitations and conditions.
For the fiscal year ended September 30, 2023, the following Fund participated as a lender in the Interfund Lending Program. For the period in which the loan was outstanding, the average amount loaned, interest rate and interest income were as follows:
Fund
Average Amount Loaned
Average Interest Rate
Interest Income*
Short Duration High Income
$
15,442,539
3.90%
$1,650
*
Included in the Statements of Operations.
259
Notes to Financial Statements (continued)
12.
CUSTODIAN AND ACCOUNTING AGENT
SSB is the Company’s custodian and accounting agent. SSB performs custodial, accounting and recordkeeping functions relating to portfolio transactions and calculating each Fund’s NAV.
13.
SECURITIES LENDING AGREEMENT
The Funds have established a securities lending agreement with Citibank, N.A. for the lending of securities to qualified brokers in exchange for securities or cash collateral equal to at least the market value of securities loaned, plus interest, if applicable. Cash collateral is invested in an approved money market fund. In accordance with the Funds’ securities lending agreement, the market value of securities on loan is determined each day at the close of business and any additional collateral required to cover the value of securities on loan is delivered to the Funds on the next business day. As with other extensions of credit, the Funds may experience a delay in the recovery of their securities or incur a loss should the borrower of the securities breach its agreement with the Funds or the borrower becomes insolvent at a time when the collateral is insufficient to cover the cost of repurchasing securities on loan. Any income earned from securities lending is included in securities lending net income in the Statements of Operations.
The initial collateral received by the Funds is required to have a value equal to at least 100% of the market value of the securities loaned. The collateral must be marked-to-market daily to cover increases in the market value of the securities loaned (or potentially a decline in the value of the collateral). In general, the risk of borrower default will be borne by Citibank, N.A.; the Funds will bear the risk of loss with respect to the investment of the cash collateral. The advantage of such loans is that the Funds continue to receive income on loaned securities while receiving a portion of any securities lending fees and earning returns on the cash amounts which may be reinvested for the purchase of investments in securities.
As of September 30, 2023, the Funds did not loan any securities.
14.
INVESTMENT RISKS
Each Fund’s performance and the fair value of its investments will vary in response to changes in interest rates and other market factors. As interest rates rise, a Fund’s investments typically will lose value. This risk is usually greater for long-term bonds and particularly for TOB Residuals. As a result, each Fund, to the extent it invests in long-term bonds and TOB Residuals, is subject to such greater market risk. During periods of falling interest rates, a Fund’s investments may gain value; however, because Short Duration and Short Duration High Income typically invest in shorter term bonds, those Funds are subject to the risk that they will underperform funds invested in longer-term bonds during such periods.
Additional risks that could reduce each Fund’s performance or increase volatility include call risk, credit risk, defaulted bonds risk (High Income and Short Duration High Income only), derivatives risk, distressed debt risk (High Income and Short Duration High Income only), extension risk, fixed income securities risk, governmental risk, industry risk, liquidity risk, market and portfolio management risks, market disruption and geopolitical risk, state and territory risks, taxability risk and zero coupon, deferred interest, pay-in-kind, and capital appreciation bonds risk (all Funds except Short Duration, Intermediate, and Short Duration High Income). Credit risk varies among states based upon the economic and fiscal conditions of each state and the municipalities within the state.
There is the risk that an issuer of a municipal bond may fail to make timely payments of principal or interest to a Fund, a risk that is greater with municipal bonds rated below investment grade (sometimes called “lower rated bonds” or “junk bonds”). High Income, Short Duration High Income,
260
Notes to Financial Statements (continued)
Sustainable and, to a lesser extent, other Funds invest a portion of its assets in such bonds. Some issuers, particularly of junk bonds, may default as to principal and/or interest payments after a Fund purchases their securities. A default, or concerns in the market about an increase in risk of default or the deterioration in the creditworthiness of an issuer, may result in losses to a Fund. Junk bonds are considered predominantly speculative by traditional investment standards. In addition, the market for lower rated municipal bonds generally is less liquid and more volatile than the market for higher rated bonds, subjecting them to greater price fluctuations which could result in losses.
New Jersey and New York are non-diversified, which means that they may invest a greater portion of their assets in a single issuer than a diversified fund. Thus, they may be exposed to greater risk.
Because each of California, New Jersey, and New York focuses on a particular state or territory, the Fund’s performance may be more affected by local, state and regional factors than a Fund that invests in municipal bonds issued in many states. These factors may include, for example, economic or political developments, erosion of the tax base and the possibility of credit problems. In addition, downturns or developments in the U.S. economy or in foreign economies or significant world events may harm the performance of any of the Funds (including Short Duration, Intermediate, National, High Income, Short Duration High Income and Sustainable), and may do so disproportionately as a result of the corresponding disproportionate impact of such occurrences on particular state, territory, or local economies.
Because Sustainable considers sustainability factors when evaluating an investment, the Fund may underperform funds that do not take sustainability-related factors into account. There is no guarantee that Lord Abbett will successfully implement and make investments in issuers that create a positive environmental, social or governance impact while achieving the desired financial returns. In evaluating an issuer, Lord Abbett may be dependent on data or information that may be incomplete, inaccurate or unavailable. Sustainable is a newly organized fund and there can be no assurance that it will reach or maintain a sufficient asset size to effectively implement its investment strategy.
Each Fund may invest in private activity bonds (sometimes called “AMT paper”). The credit quality of AMT paper usually is directly related to the credit standing of the private user of the facilities.
High Income, National, Short Duration High Income and, to a lesser extent, other Funds may invest in TOB Residuals. A TOB Residual, sometimes referred to as an inverse floater or a residual interest bond (“RIB”), is a type of derivative debt instrument with a floating or variable interest rate that moves in the opposite direction of the interest rate on another specific fixed-rate security. Changes in the interest rate on the specific fixed-rate security inversely affect the residual interest paid on the TOB Residual, with the result that when interest rates rise, TOB Residuals’ interest payments are lowered and their value falls faster than securities similar to the specific fixed-rate security. When interest rates fall, not only do TOB Residuals generally provide interest payments that are higher than securities similar to the specific fixed-rate security, but their values generally also rise faster than such similar securities.
In addition, loss may result from a Fund’s investments in certain derivative transactions such as futures contracts, swap transactions, interest rate caps, TOB Residuals and similar transactions. These instruments may be leveraged so that small changes may produce disproportionate and substantial losses to a Fund. They also may increase a Fund’s interest rate risk.
Each Fund may purchase securities on a forward commitment or when-issued basis. Delivery and payment for such securities can take place a month or more after the transaction date. During this period such securities are subject to market fluctuations.
261
Notes to Financial Statements (continued)
Geopolitical and other events (e.g., wars, terrorism, natural disasters, epidemics or pandemics,) may disrupt securities markets and adversely affect global economies and markets, thereby decreasing the value of each Fund’s investments. Market disruptions can also prevent the Funds from implementing their investment strategies and achieving their investment objectives.
In March 2023, the shut-down of certain financial institutions raised economic concerns over disruption in the U.S. banking system. There can be no certainty that the actions taken by the U.S. government to strengthen public confidence in the U.S. banking system will be effective in mitigating the effects of financial institution failures on the economy and restoring public confidence in the U.S. banking system objective.
The impact of the COVID-19 outbreak, and the effects of other infectious illness outbreaks, epidemics, or pandemics, may be short term or may continue for an extended period of time. For example, a global pandemic or other widespread health crises could negatively affect the global economy, the economies of individual countries, and the financial performance of individual issuers, sectors, industries, asset classes, and markets in significant and unforeseen ways. Health crises caused by outbreaks of disease may also exacerbate other pre-existing political, social, and economic risks in certain countries or globally. The foregoing could disrupt the operations of each Fund and its service providers, adversely affect the value and liquidity of each Fund’s investments, and negatively impact each Fund’s performance and your investment in the Fund.
15.
SUMMARY OF CAPITAL TRANSACTIONS
Transactions in shares of capital stock were as follows:
Short Duration
Year Ended September 30, 2023
Year Ended September 30, 2022
Class A Shares
Shares
Amount
Shares
Amount
Shares sold
18,770,106
$
280,029,821
27,929,872
$
427,766,947
Reinvestment of distributions
984,630
14,707,986
505,852
7,720,199
Shares reacquired
(27,741,560
)
(414,525,176
)
(36,579,371
)
(560,984,644
)
Decrease
(7,986,824
)
$
(119,787,369
)
(8,143,647
)
$
(125,497,498
)
Class C Shares
Shares sold
500,473
$
7,481,248
486,705
$
7,451,767
Reinvestment of distributions
18,679
279,015
5,212
78,840
Shares reacquired
(892,335
)
(13,327,281
)
(901,801
)
(13,852,116
)
Decrease
(373,183
)
$
(5,567,018
)
(409,884
)
$
(6,321,509
)
Class F Shares
Shares sold
2,003,418
$
29,862,090
23,585,488
$
362,962,189
Reinvestment of distributions
135,914
2,029,051
226,476
3,474,114
Shares reacquired
(16,589,985
)
(248,233,169
)
(53,603,175
)
(822,067,362
)
Decrease
(14,450,653
)
$
(216,342,028
)
(29,791,211
)
$
(455,631,059
)
262
Notes to Financial Statements (continued)
Short Duration
Year Ended September 30, 2023
Year Ended September 30, 2022
Class F3 Shares
Shares
Amount
Shares
Amount
Shares sold
8,782,648
$
131,150,210
16,986,800
$
259,774,089
Reinvestment of distributions
268,196
4,007,378
123,424
1,879,203
Shares reacquired
(15,617,826
)
(233,120,113
)
(13,574,621
)
(207,668,141
)
Increase (decrease)
(6,566,982
)
$
(97,962,525
)
3,535,603
$
53,985,151
Class I Shares
Shares sold
22,391,479
$
335,270,750
46,559,487
$
709,825,767
Reinvestment of distributions
597,701
8,930,320
244,174
3,711,369
Shares reacquired
(26,175,013
)
(390,899,778
)
(21,715,386
)
(330,588,818
)
Increase (decrease)
(3,185,833
)
$
(46,698,708
)
25,088,275
$
382,948,318
Year Ended
Year Ended
Intermediate
September 30, 2023
September 30, 2022
Class A Shares
Shares
Amount
Shares
Amount
Shares sold
49,174,165
$
492,503,761
54,726,114
$
581,579,427
Reinvestment of distributions
4,828,479
48,337,760
4,160,439
43,941,102
Shares reacquired
(69,325,924
)
(692,617,725
)
(79,626,277
)
(835,050,076
)
Decrease
(15,323,280
)
$
(151,776,204
)
(20,739,724
)
$
(209,529,547
)
Class C Shares
Shares sold
1,102,429
$
11,030,272
1,420,669
$
15,106,194
Reinvestment of distributions
181,800
1,817,681
175,963
1,856,840
Shares reacquired
(5,066,758
)
(50,621,023
)
(5,757,620
)
(60,765,016
)
Decrease
(3,782,529
)
$
(37,773,070
)
(4,160,988
)
$
(43,801,982
)
Class F Shares
Shares sold
10,483,265
$
104,175,251
62,145,003
$
672,104,399
Reinvestment of distributions
722,128
7,207,593
2,423,374
25,919,024
Shares reacquired
(53,473,167
)
(538,192,977
)
(248,827,572
)
(2,593,667,356
)
Decrease
(42,267,774
)
$
(426,810,133
)
(184,259,195
)
$
(1,895,643,933
)
Class F3 Shares
Shares sold
17,855,155
$
177,891,929
15,426,863
$
162,911,001
Reinvestment of distributions
591,824
5,928,632
420,880
4,427,409
Shares reacquired
(10,335,665
)
(103,204,790
)
(10,946,063
)
(113,845,957
)
Increase
8,111,314
$
80,615,771
4,901,680
$
53,492,453
Class I Shares
Shares sold
164,710,208
$
1,655,343,063
236,204,233
$
2,441,772,747
Reinvestment of distributions
4,112,613
41,177,642
2,214,271
23,127,859
Shares reacquired
(138,932,589
)
(1,384,239,621
)
(98,080,911
)
(1,010,854,262
)
Increase
29,890,232
$
312,281,084
140,337,593
$
1,454,046,344
263
Notes to Financial Statements (continued)
National
Year Ended September 30, 2023
Year Ended September 30, 2022
Class A Shares
Shares
Amount
Shares
Amount
Shares sold
60,088,538
$
614,813,100
50,178,282
$
555,416,467
Reinvestment of distributions
7,019,689
71,670,379
5,916,818
65,326,061
Shares reacquired
(65,161,550
)
(661,976,768
)
(71,253,096
)
(776,390,605
)
Increase (decrease)
1,946,677
$
24,506,711
(15,157,996
)
$
(155,648,077
)
Class C Shares
Shares sold
1,515,238
$
15,488,288
1,212,720
$
13,592,731
Reinvestment of distributions
191,119
1,952,996
180,935
2,003,649
Shares reacquired
(3,020,841
)
(30,840,554
)
(4,110,806
)
��
(45,245,126
)
Decrease
(1,314,484
)
$
(13,399,270
)
(2,717,151
)
$
(29,648,746
)
Class F Shares
Shares sold
5,080,629
$
52,023,332
22,343,150
$
252,636,831
Reinvestment of distributions
465,880
4,742,198
1,296,695
14,601,779
Shares reacquired
(20,167,972
)
(206,545,983
)
(82,597,556
)
(904,741,426
)
Decrease
(14,621,463
)
$
(149,780,453
)
(58,957,711
)
$
(637,502,816
)
Class F3 Shares
Shares sold
19,758,267
$
201,800,808
19,250,148
$
213,368,948
Reinvestment of distributions
1,084,751
11,068,830
794,371
8,742,056
Shares reacquired
(12,916,088
)
(131,080,515
)
(16,664,587
)
(180,063,515
)
Increase
7,926,930
$
81,789,123
3,379,932
$
42,047,489
Class I Shares
Shares sold
75,819,727
$
776,676,296
73,940,091
$
792,826,906
Reinvestment of distributions
2,095,587
21,396,429
849,840
9,149,393
Shares reacquired
(42,356,376
)
(430,837,311
)
(34,412,635
)
(364,545,784
)
Increase
35,558,938
$
367,235,414
40,377,296
$
437,430,515
High Income
Year Ended September 30, 2023
Year Ended September 30, 2022
Class A Shares
Shares
Amount
Shares
Amount
Shares sold
43,175,387
$
455,701,191
55,554,656
$
659,872,446
Reinvestment of distributions
6,304,263
66,202,615
5,438,271
63,720,375
Shares reacquired
(58,270,465
)
(611,695,648
)
(71,107,986
)
(826,335,850
)
Decrease
(8,790,815
)
$
(89,791,842
)
(10,115,059
)
$
(102,743,029
)
Class C Shares
Shares sold
2,009,353
$
21,245,804
2,746,793
$
32,964,823
Reinvestment of distributions
500,249
5,255,523
461,133
5,408,574
Shares reacquired
(5,517,532
)
(57,995,411
)
(6,913,279
)
(80,993,296
)
Decrease
(3,007,930
)
$
(31,494,084
)
(3,705,353
)
$
(42,619,899
)
Class F Shares
Shares sold
8,919,354
$
93,789,815
40,725,267
$
498,388,960
Reinvestment of distributions
889,451
9,334,333
2,209,756
26,435,132
Shares reacquired
(34,828,395
)
(369,484,678
)
(119,065,773
)
(1,395,866,809
)
Decrease
(25,019,590
)
$
(266,360,530
)
(76,130,750
)
$
(871,042,717
)
264
Notes to Financial Statements (continued)
High Income
Year Ended September 30, 2023
Year Ended September 30, 2022
Class F3 Shares
Shares
Amount
Shares
Amount
Shares sold
6,739,512
$
70,945,394
8,209,512
$
96,241,910
Reinvestment of distributions
512,731
5,375,304
380,805
4,431,135
Shares reacquired
(6,318,034
)
(66,175,713
)
(6,564,018
)
(74,887,060
)
Increase
934,209
$
10,144,985
2,026,299
$
25,785,985
Class I Shares
Shares sold
90,058,661
$
952,814,223
112,854,562
$
1,289,014,098
Reinvestment of distributions
3,991,925
41,865,737
1,883,209
21,609,435
Shares reacquired
(66,709,134
)
(697,668,339
)
(58,348,142
)
(657,095,742
)
Increase
27,341,452
$
297,011,621
56,389,629
$
653,527,791
Short Duration High Income
Year Ended September 30, 2023
Year Ended September 30, 2022
Class A Shares
Shares
Amount
Shares
Amount
Shares sold
6,812,042
$
95,722,989
10,907,124
$
165,602,425
Reinvestment of distributions
727,887
10,222,070
576,692
8,541,073
Shares reacquired
(12,136,845
)
(170,439,304
)
(13,720,715
)
(203,780,390
)
Decrease
(4,596,916
)
$
(64,494,245
)
(2,236,899
)
$
(29,636,892
)
Class C Shares
Shares sold
470,549
$
6,605,568
554,590
$
8,531,204
Reinvestment of distributions
41,977
589,760
26,289
387,852
Shares reacquired
(634,589
)
(8,936,164
)
(698,527
)
(10,331,324
)
Decrease
(122,063
)
$
(1,740,836
)
(117,648
)
$
(1,412,268
)
Class F Shares
Shares sold
3,946,365
$
55,097,018
18,007,811
$
275,931,312
Reinvestment of distributions
179,679
2,523,527
478,068
7,201,066
Shares reacquired
(12,914,805
)
(182,516,643
)
(39,621,077
)
(595,140,802
)
Decrease
(8,788,761
)
$
(124,896,098
)
(21,135,198
)
$
(312,008,424
)
Class F3 Shares
Shares sold
1,695,166
$
23,937,717
1,471,688
$
21,965,315
Reinvestment of distributions
87,418
1,227,833
53,900
797,173
Shares reacquired
(1,252,638
)
(17,587,532
)
(1,444,184
)
(21,130,565
)
Increase
529,946
$
7,578,018
81,404
$
1,631,923
Class I Shares
Shares sold
35,782,001
$
504,220,384
32,825,243
$
488,939,553
Reinvestment of distributions
1,206,000
16,940,484
546,776
8,028,813
Shares reacquired
(22,116,692
)
(310,088,063
)
(22,568,457
)
(329,936,628
)
Increase
14,871,309
$
211,072,805
10,803,562
$
167,031,738
Sustainable
Year Ended September 30, 2023
For the period Ended September 30, 2022(a)
Class A Shares
Shares
Amount
Shares
Amount
Shares sold
22,877
$
208,187
304,943
$
3,047,500
Reinvestment of distributions
648
5,894
41
372
Increase
23,525
$
214,081
304,984
$
3,047,872
265
Notes to Financial Statements (continued)
Sustainable
Year Ended September 30, 2023
For the period ended September 30, 2022(a)
Class C Shares
Shares
Amount
Shares
Amount
Shares sold
11,460
$
104,753
7,500
$
75,000
Reinvestment of distributions
173
1,578
–
–
Shares reacquired
(9
)
(83
)
–
–
Increase
11,624
$
106,248
7,500
$
75,000
Class F Shares
Shares sold
–
$
–
7,500
$
75,000
Increase
–
$
–
7,500
$
75,000
Class F3 Shares
Shares sold
–
$
–
10,000
$
100,000
Increase
–
$
–
10,000
$
100,000
Class I Shares
Shares sold
29,967
$
275,115
186,313
$
1,850,000
Reinvestment of distributions
820
7,444
3
27
Shares reacquired
(701
)
(6,362
)
(5
)
(41
)
Increase
30,086
$
276,197
186,311
$
1,849,986
California
Year Ended September 30, 2023
Year Ended September 30, 2022
Class A Shares
Shares
Amount
Shares
Amount
Shares sold
11,208,367
$
111,038,999
9,952,420
$
105,270,092
Reinvestment of distributions
940,809
9,324,002
686,472
7,300,515
Shares reacquired
(8,345,793
)
(82,402,978
)
(11,528,626
)
(123,722,571
)
Increase (decrease)
3,803,383
$
37,960,023
(889,734
)
$
(11,151,964
)
Class C Shares
Shares sold
387,190
$
3,861,120
409,728
$
4,413,910
Reinvestment of distributions
46,040
456,338
40,742
433,795
Shares reacquired
(686,018
)
(6,812,975
)
(1,082,285
)
(11,552,855
)
Decrease
(252,788
)
$
(2,495,517
)
(631,815
)
$
(6,705,150
)
Class F Shares
Shares sold
269,732
$
2,620,114
3,531,708
$
38,386,295
Reinvestment of distributions
38,798
383,623
123,708
1,353,557
Shares reacquired
(1,684,119
)
(16,876,219
)
(12,651,669
)
(134,354,919
)
Decrease
(1,375,589
)
$
(13,872,482
)
(8,996,253
)
$
(94,615,067
)
Class F3 Shares
Shares sold
2,730,663
$
27,105,849
2,732,124
$
28,646,820
Reinvestment of distributions
128,028
1,268,743
60,399
635,428
Shares reacquired
(1,263,307
)
(12,461,095
)
(1,442,987
)
(15,152,394
)
Increase
1,595,384
$
15,913,497
1,349,536
$
14,129,854
Class I Shares
Shares sold
7,564,129
$
75,454,717
9,758,019
$
101,943,212
Reinvestment of distributions
232,500
2,302,744
114,578
1,202,919
Shares reacquired
(5,340,054
)
(52,572,049
)
(4,946,127
)
(51,321,033
)
Increase
2,456,575
$
25,185,412
4,926,470
$
51,825,098
266
Notes to Financial Statements (concluded)
New Jersey
Year Ended September 30, 2023
Year Ended September 30, 2022
Class A Shares
Shares
Amount
Shares
Amount
Shares sold
2,800,538
$
12,920,067
2,767,063
$
13,514,049
Reinvestment of distributions
403,987
1,865,997
367,992
1,817,051
Shares reacquired
(4,072,862
)
(18,751,446
)
(3,416,025
)
(16,598,593
)
Decrease
(868,337
)
$
(3,965,382
)
(280,970
)
$
(1,267,493
)
Class F Shares
Shares sold
354,525
$
1,619,038
931,336
$
4,823,229
Reinvestment of distributions
28,480
131,187
69,563
351,154
Shares reacquired
(889,706
)
(4,134,346
)
(4,924,806
)
(24,332,270
)
Decrease
(506,701
)
$
(2,384,121
)
(3,923,907
)
$
(19,157,887
)
Class F3 Shares
Shares sold
194,925
$
880,635
211,945
$
1,051,022
Reinvestment of distributions
10,920
50,515
7,587
37,239
Shares reacquired
(130,090
)
(597,879
)
(130,591
)
(620,915
)
Increase
75,755
$
333,271
88,941
$
467,346
Class I Shares
Shares sold
2,798,519
$
12,943,517
3,426,486
$
16,635,811
Reinvestment of distributions
78,209
361,530
50,354
245,041
Shares reacquired
(1,900,516
)
(8,776,141
)
(1,733,364
)
(8,221,483
)
Increase
976,212
$
4,528,906
1,743,476
$
8,659,369
New York
Year Ended September 30, 2023
Year Ended September 30, 2022
Class A Shares
Shares
Amount
Shares
Amount
Shares sold
6,385,398
$
66,001,310
7,514,861
$
81,864,284
Reinvestment of distributions
770,866
7,974,668
650,952
7,216,866
Shares reacquired
(9,299,195
)
(95,454,500
)
(7,984,467
)
(88,420,625
)
Increase (decrease)
(2,142,931
)
$
(21,478,522
)
181,346
$
660,525
Class C Shares
Shares sold
341,562
$
3,519,754
227,831
$
2,615,587
Reinvestment of distributions
40,695
420,468
39,269
435,328
Shares reacquired
(748,800
)
(7,720,191
)
(877,823
)
(9,735,032
)
Decrease
(366,543
)
$
(3,779,969
)
(610,723
)
$
(6,684,117
)
Class F Shares
Shares sold
318,808
$
3,262,153
1,352,775
$
15,718,470
Reinvestment of distributions
28,697
295,966
72,464
816,787
Shares reacquired
(1,611,382
)
(16,699,767
)
(5,386,852
)
(59,765,477
)
Decrease
(1,263,877
)
$
(13,141,648
)
(3,961,613
)
$
(43,230,220
)
Class F3 Shares
Shares sold
164,383
��
$
1,657,672
172,387
$
1,898,630
Reinvestment of distributions
7,620
78,852
5,557
61,174
Shares reacquired
(181,489
)
(1,879,392
)
(110,926
)
(1,192,434
)
Increase (decrease)
(9,486
)
$
(142,868
)
67,018
$
767,370
Class I Shares
Shares sold
4,841,720
$
50,458,058
6,493,470
$
70,567,286
Reinvestment of distributions
192,194
1,991,405
109,516
1,200,161
Shares reacquired
(3,368,217
)
(34,628,246
)
(3,109,286
)
(33,153,558
)
Increase
1,665,697
$
17,821,217
3,493,700
$
38,613,889
(a)
For the period January 5, 2022, commencement of operations, to September 30, 2022.
267
Report of Independent Registered Public Accounting Firm
To the shareholders and the Board of Directors of Lord Abbett Municipal Income Fund, Inc.
Opinion on the Financial Statements and Financial Highlights
We have audited the accompanying statements of assets and liabilities of Lord Abbett Municipal Income Fund, Inc. comprising the Lord Abbett Short Duration Tax Free Fund, Lord Abbett Intermediate Tax Free Fund, Lord Abbett National Tax-Free Income Fund, Lord Abbett High Income Municipal Bond Fund, Lord Abbett Short Duration High Income Municipal Bond Fund, Lord Abbett Sustainable Municipal Bond Fund, Lord Abbett California Tax-Free Income Fund, Lord Abbett New Jersey Tax-Free Income Fund, and Lord Abbett New York Tax-Free Income Fund (the “Funds”), including the schedules of investments, as of September 30, 2023; the related statements of operations for the year then ended, the statements of changes in net assets for each of the two years in the period then ended, and the financial highlights for each of the five years in the period then ended for each of the funds constituting the Lord Abbett Municipal Income Fund, Inc., except Lord Abbett Sustainable Municipal Bond Fund; the related statement of operations for the year then ended, and the statements of changes in net assets and financial highlights for the year then ended, and the period from January 5, 2022 (commencement of operations) to September 30, 2022; and the related notes. In our opinion, the financial statements and financial highlights present fairly, in all material respects, the financial position of each of the funds constituting the Lord Abbett Municipal Income Fund, Inc., except Lord Abbett Sustainable Municipal Bond Fund, as of September 30, 2023, and the results of their operations for the year then ended, the changes in their net assets for each of the two years in the period then ended, and the financial highlights for each of the five years in the period then ended in conformity with accounting principles generally accepted in the United States of America. Also, in our opinion, the financial statements and financial highlights present fairly, in all material respects, the financial position of Lord Abbett Sustainable Municipal Bond Fund as of September 30, 2023, the results of its operations for the year then ended, and the changes in its net assets and financial highlights for the year then ended, and the period from January 5, 2022 (commencement of operations) to September 30, 2022, in conformity with accounting principles generally accepted in the United States of America.
Basis for Opinion
These financial statements and financial highlights are the responsibility of the Funds’ management. Our responsibility is to express an opinion on the Funds’ financial statements and financial highlights based on our audits. We are a public accounting firm registered with the Public Company Accounting Oversight Board (United States) (PCAOB) and are required to be independent with respect to the Funds in accordance with the U.S. federal securities laws and the applicable rules and regulations of the Securities and Exchange Commission and the PCAOB. We conducted our audits in accordance with the standards of the PCAOB. Those standards require that we plan and perform the audit to obtain reasonable assurance about whether the financial statements and financial highlights are free of material misstatement, whether due to error or fraud. The Funds are not required to have, nor were we engaged to perform, an audit of their internal control over financial reporting. As part of our audits we are required to obtain an understanding of internal control over financial reporting but not for the purpose of expressing an opinion on the effectiveness of the Funds’ internal control over financial reporting. Accordingly, we express no such opinion.
Our audits included performing procedures to assess the risks of material misstatement of the financial statements and financial highlights, whether due to error or fraud, and performing procedures that respond to those risks. Such procedures included examining, on a test basis, evidence regarding the amounts and disclosures in the financial statements and financial highlights. Our audits also included evaluating the accounting principles used and significant estimates made by management, as well as evaluating the overall presentation of the financial statements and financial highlights. Our procedures included confirmation of securities owned as of September 30, 2023, by correspondence with the custodian or counterparties; when replies were not received, we performed other auditing procedures. We believe that our audits provide a reasonable basis for our opinion.
/s/ Deloitte & Touche LLP New York, New York November 22, 2023
We have served as the auditor of one or more Lord Abbett Family of Funds’ investment companies since 1932.
268
Basic Information About Management
The Board is responsible for the management of the business and affairs of the Fund in accordance with the laws of the state of organization. The Board elects officers who are responsible for the day-to-day operations of the Fund and who execute policies authorized by the Board. The Board also approves an investment adviser to the Fund and continues to monitor the cost and quality of the services the investment adviser provides, and annually considers whether to renew the contract with the investment adviser. Generally, each Board member holds office until his/her successor is elected and qualified or until his/her earlier resignation or removal, as provided in the Fund’s organizational documents.
Lord, Abbett & Co. LLC (“Lord Abbett”), a Delaware limited liability company, is the Fund’s investment adviser. Designated Lord Abbett personnel are responsible for the day-to-day management of the Fund.
Independent Board Members
The following Independent Board Members also are board members of each of the 15 investment companies in the Lord Abbett Family of Funds, which consist of 64 investment portfolios.
Name, Address and Year of Birth
Current Position and Length of Service with the Fund
Principal Occupation and Other Directorships During the Past Five Years
Evelyn E. Guernsey Lord, Abbett & Co. LLC c/o Legal Dept. 90 Hudson Street Jersey City, NJ 07302 (1955)
Board member since 2011; Vice Chair since 2023
Principal Occupation: None.
Other Directorships: None.
Julie A. Hill Lord, Abbett & Co. LLC c/o Legal Dept. 90 Hudson Street Jersey City, NJ 07302 (1946)
Board member since 2004
Principal Occupation: Owner and CEO of The Hill Company, a business consulting firm (since 1998).
Other Directorships: Currently serves as director of Columbia Care (CCHW) (since 2021). Previously served as director of Anthem, Inc., a health benefits company (1994–2021).
Kathleen M. Lutito Lord, Abbett & Co. LLC c/o Legal Dept. 90 Hudson Street Jersey City, NJ 07302 (1963)
Board member since 2017
Principal Occupation: President and Chief Investment Officer of CenturyLink Investment Management Company (since 2006).
Other Directorships: None.
James M. McTaggart Lord, Abbett & Co. LLC c/o Legal Dept. 90 Hudson Street Jersey City, NJ 07302 (1947)
Board member since 2012
Principal Occupation: Owner of McTaggart LLC (since 2011).
Other Directorships: None.
Charles O. Prince Lord, Abbett & Co. LLC c/o Legal Dept. 90 Hudson Street Jersey City, NJ 07302 (1950)
Board member since 2019
Principal Occupation: None. Formerly Chair and Chief Executive Officer, Citigroup, Inc. (Retired 2007).
Other Directorships: Previously served as director of Johnson & Johnson (2005–2022). Director of Xerox Corporation (2007–2018).
269
Basic Information About Management (continued)
Name, Address and Year of Birth
Current Position and Length of Service with the Fund
Principal Occupation and Other Directorships During the Past Five Years
Karla M. Rabusch Lord, Abbett & Co. LLC c/o Legal Dept. 90 Hudson Street Jersey City, NJ 07302 (1959)
Board member since 2017
Principal Occupation: President and Director of Wells Fargo Funds Management, LLC (2003–2017); President of Wells Fargo Funds (2003–2016).
Other Directorships: None.
Lorin Patrick Taylor Radtke Lord, Abbett & Co. LLC c/o Legal Dept. 90 Hudson Street Jersey City, NJ 07302 (1968)
Board member since 2021
Principal Occupation: Partner and Co-Founder of M Seven 8 Partners LLC, a venture capital firm (since 2016). Formerly Partner, Goldman Sachs (1992–2016).
Other Directorships: Currently serves as director of Assured Guaranty (since 2021); Virtual Combine (since 2018). Previously served as director of SummerMoon Coffee (2022); Mariposa Family Learning Center (2021-2022).
Leah Song Richardson Lord, Abbett & Co. LLC c/o Legal Dept. 90 Hudson Street Jersey City, NJ 07302 (1966)
Board member since 2021
Principal Occupation: President of Colorado College (since 2021) and was formerly Dean at University of California, Irvine – School of Law (2017–2021); Professor of Law at University of California, Irvine (2014–2017).
Other Directorships: None.
Mark A. Schmid Lord, Abbett & Co. LLC c/o Legal Dept. 90 Hudson Street Jersey City, NJ 07302 (1959)
Board member since 2016
Principal Occupation: Vice President and Chief Investment Officer of the University of Chicago (2009–2021).
Other Directorships: Currently serves as director of Underwriters Laboratories Research Institute (since 2022).
James L.L. Tullis Lord, Abbett & Co. LLC c/o Legal Dept. 90 Hudson Street Jersey City, NJ 07302 (1947)
Board member since 2006; Chairman since 2017
Principal Occupation: Chair of Tullis Health Investors – FL LLC (since 2019, CEO from 2012–2018); Formerly CEO of Tullis-Dickerson and Co. Inc., a venture capital management firm (1990–2016).
Other Directorships: Currently serves as Chair of Crane Co. (since 2020, Director since 1998), Director of Crane NXT, Co. (since 2023), Director of Alphatec Spine (since 2018). Previously served as Director of Exagen Inc. (2019–2023); Director of electroCore, Inc. (2018–2020).
270
Basic Information About Management (continued)
Interested Board Members
Mr. Sieg is affiliated with Lord Abbett and is an “interested person” of the Fund as defined in the Act. Mr. Sieg is a board member of each of the 15 investment companies in the Lord Abbett Family of Funds, which consist of 64 investment portfolios. Mr. Sieg is an officer of the Lord Abbett Family of Funds.
Name, Address and Year of Birth
Current Position and Length of Service with the Fund
Principal Occupation and Other Directorships During the Past Five Years
Douglas B. Sieg Lord, Abbett & Co. LLC 90 Hudson Street Jersey City, NJ 07302 (1969)
Board member since 2016
Principal Occupation: Managing Partner of Lord Abbett (since 2018); Formerly Head of Client Services, joined Lord Abbett in 1994.
Other Directorships: None.
Officers
None of the officers listed below have received compensation from the Fund. All of the officers of the Fund also may be officers of the other Lord Abbett Funds and maintain offices at 90 Hudson Street, Jersey City, NJ 07302. Unless otherwise indicated, the position(s) and title(s) listed under the “Principal Occupation During the Past Five Years” column indicate each officer’s position(s) and title(s) with Lord Abbett. Each officer serves for an indefinite term (i.e., until his or her death, resignation, retirement, or removal).
Name and Year of Birth
Current Position with the Fund
Length of Service of Current Position
Principal Occupation During the Past Five Years
Douglas B. Sieg (1969)
President and Chief Executive Officer
Elected as President and Chief Executive Officer in 2018
Managing Partner of Lord Abbett (since 2018). Formerly Head of Client Services, joined Lord Abbett in 1994.
Jackson C. Chan (1964)
AML Compliance Officer
Elected in 2018
Deputy Chief Compliance Officer and Director of Regulatory Affairs, joined Lord Abbett in 2014.
Nicholas D. Emguschowa (1986)
Data Protection Officer
Elected in 2022
Assistant General Counsel, joined Lord Abbett in 2018 and was formerly Associate at Shearman & Sterling (2014–2018).
Brooke A. Fapohunda (1975)
Vice President, Secretary and Chief Legal Officer
Elected in 2023
Partner and Senior Counsel, joined Lord Abbett in 2006.
271
Basic Information About Management (concluded)
Name and Year of Birth
Current Position with the Fund
Length of Service of Current Position
Principal Occupation During the Past Five Years
Michael J. Hebert (1976)
Chief Financial Officer and Treasurer
Elected as Chief Financial Officer and Treasurer in 2021
Head of Global Fund Finance, joined Lord Abbett in 2021 and was formerly Vice President at Eaton Vance Management (EVM) (2014–2021) and Calvert Research & Management (CRM) (2016–2021), and Assistant Treasurer of registered investment companies managed, advised or administered by EVM and CRM during such years.
Parker J. Milender (1989)
Vice President and Assistant Secretary
Elected in 2023
Counsel, joined Lord Abbett in 2021 and was formerly an Associate at Milbank LLP (2017–2021).
Mary Ann Picciotto (1973)
Chief Compliance Officer
Elected in 2023
Managing Director and Global Chief Compliance Officer, joined Lord Abbett in 2023 and was formerly Vice President and Head of Global Compliance at T. Rowe Price (2019–2023) and Senior Vice President, Head of Compliance at OppenheimerFunds, Inc. (2014–2019).
Matthew A. Press (1987)
Vice President and Assistant Secretary
Elected in 2023
Counsel, joined Lord Abbett in 2022 and was formerly an Associate at Clifford Chance US LLP (2014–2022).
Victoria Zozulya (1983)
Vice President and Assistant Secretary
Elected in 2022
Counsel, joined Lord Abbett in 2022 and was formerly Senior Director and Counsel at Equitable (2018–2022) and Assistant General Counsel at Neuberger Berman (2014–2018).
Please call 888-522-2388 for a copy of the statement of additional information, which contains further information about the Fund’s Board members. It is available free upon request.
272
Liquidity Risk Management Program
Pursuant to Rule 22e-4 under the 1940 Act, each Fund has adopted a Liquidity Risk Management Program and Policy (“Program”). The Program is designed to assess, manage and periodically review each Fund’s liquidity risk. Liquidity risk is defined under Rule 22e-4 as the risk that each Fund could not meet redemption requests without significant dilution of remaining investors’ interests in the Fund. The Board has appointed Lord Abbett as the administrator for each Fund’s Program. At the May 17, 2023 meeting, Lord Abbett provided the Board with a report addressing the operation of the Program and assessing its adequacy and effectiveness of implementation for the period April 1, 2022 through March 31, 2023. Lord Abbett reported that the Program operated effectively during the period. In particular, Lord Abbett reported that: no Fund breached its 15% limit on illiquid investments at any point during the period and all regulatory reporting related to Rule 22e-4 was completed on time and without issue during the period. There can be no assurance that the Program will achieve its objectives in the future. Please refer to the Funds’ prospectus for more information regarding each Fund’s exposure to liquidity risk and other principal risks to which an investment in each Fund may be subject.
Householding
The Company has adopted a policy that allows it to send only one copy of each Fund’s prospectus, proxy material, annual report and semiannual report (or related notice of internet availability of annual report and semiannual report) to certain shareholders residing at the same “household.” This reduces Fund expenses, which benefits you and other shareholders. If you need additional copies or do not want your mailings to be “householded,” please call Lord Abbett at 888-522-2388 or send a written request with your name, the name of your fund or funds and your account number or numbers to Lord Abbett Funds Service Center, P.O. Box 534489, Pittsburgh, PA 15253-4489 (regular mail) or 500 Ross Street 154-0520, Attention: 534489, Pittsburgh, PA 15262 (overnight mail).
Proxy Voting Policies, Procedures and Records
A description of the policies and procedures that Lord Abbett uses to vote proxies related to each Fund’s portfolio securities, and information on how Lord Abbett voted each Fund’s proxies during the 12-month period ended June 30 are available without charge, upon request, (i) by calling 888-522-2388; (ii) on Lord Abbett’s website at www.lordabbett.com; and (iii) on the Securities and Exchange Commission’s (“SEC”) website at www.sec.gov.
Shareholder Reports and Quarterly Portfolio Disclosure
The Funds are required to file its complete schedule of portfolio holdings with the SEC for its first and third fiscal quarters as an attachment to Form N-PORT. Copies of the filings are available without charge, upon request on the SEC’s website at www.sec.gov and may be available by calling Lord Abbett at 888-522-2388.
273
Tax Information (unaudited)
The percentages below reflect the portion of ordinary income distributions paid during the fiscal year ended September 30, 2023 that is tax-exempt dividend income.
Short Duration
100
%
Intermediate
100
%
National
100
%
High Income
100
%
Short Duration High Income
99
%
Sustainable
100
%
California
100
%
New Jersey
100
%
New York
100
%
274
Lord Abbett Municipal Income Fund, Inc.
Lord Abbett Short Duration Tax Free Fund
Lord Abbett Intermediate Tax Free Fund
Lord Abbett National Tax-Free Income Fund
Lord Abbett High Income Municipal Bond Fund
Lord Abbett Short Duration High Income Municipal Bond Fund
Lord Abbett Sustainable Municipal Bond Fund
Lord Abbett California Tax-Free Income Fund
Lord Abbett New Jersey Tax-Free Income Fund
Lord Abbett New York Tax-Free Income Fund
This report, when not used for the general information of shareholders of the Fund, is to be distributed only if preceded or accompanied by a current fund prospectus.
Lord Abbett mutual fund shares are distributed by LORD ABBETT DISTRIBUTOR LLC.
LATFI-2 (11/23)
Item 2:
Code of Ethics.
(a)
In accordance with applicable requirements, the Registrant adopted a Sarbanes-Oxley Code of Ethics on June 19, 2003 that applies to the principal executive officer and senior financial officers of the Registrant (“Code of Ethics”). The Code of Ethics was in effect during the fiscal year ended September 30, 2023 (the “Period”).
(b)
Not applicable.
(c)
The Registrant has not amended the Code of Ethics as described in Form N-CSR during the Period.
(d)
The Registrant has not granted any waiver, including an implicit waiver, from a provision of the Code of Ethics as described in Form N-CSR during the Period.
(e)
Not applicable.
(f)
See Item 13(a)(1) concerning the filing of the Code of Ethics.
Item 3:
Audit Committee Financial Expert.
The Registrant’s board of directors has determined that each of the following independent directors who are members of the audit committee is an audit committee financial expert: Evelyn E. Guernsey, Karla M. Rabusch and Mark A. Schmid. Each of these persons is independent within the meaning of the Form N-CSR.
Item 4:
Principal Accountant Fees and Services.
In response to sections (a), (b), (c) and (d) of Item 4, the aggregate fees billed to the Registrant for the fiscal years ended September 30, 2023 and 2022 by the Registrant’s principal accounting firm, Deloitte & Touche LLP, the member firms of Deloitte Touche Tohmatsu and their respective affiliates (collectively, “Deloitte”) were as follows:
Fiscal year ended:
2023
2022
Audit Fees {a}
$385,000
$366,000
Audit-Related Fees
- 0 -
- 0 -
Total audit and audit-related fees
$385,000
$366,000
Tax Fees
- 0 -
- 0 -
All Other Fees
- 0 -
- 0 -
Total Fees
$385,000
$366,000
{a} Consists of fees for audits of the Registrant’s annual financial statements.
(e) (1) Pursuant to Rule 2-01(c) (7) of Regulation S-X, the Registrant’s Audit Committee has adopted pre-approval policies and procedures. Such policies and procedures generally provide that the Audit Committee must pre-approve:
·
any audit, audit-related, tax, and other services to be provided to the Lord Abbett Funds, including the Registrant, and
·
any audit-related, tax, and other services to be provided to the Registrant’s investment adviser and any entity controlling, controlled by or under common control with the investment adviser that provides ongoing services to one or more Funds comprising the Registrant if the engagement relates directly to operations and financial reporting of a Fund, by the independent auditor to assure that the provision of such services does not impair the auditor’s independence.
The Audit Committee has delegated pre-approval authority to its Chair, subject to a fee limit of $10,000 per event, and not to exceed $25,000 annually. The Chair will report any pre-approval decisions to the Audit Committee at its next scheduled meeting. Unless a type of service to be provided by the independent auditor has received general pre-approval, it must be pre-approved by the Audit Committee. Any proposed services exceeding pre-approved cost levels will require specific pre-approval by the Audit Committee.
(e) (2) The Registrant’s Audit Committee has approved 100% of the services described in paragraphs (b) through (d) of this Item 4, no amount was approved by the Audit Committee pursuant to paragraph (c)(7)(i)(C) of Rule 2-01 of Regulation S-X.
(f) Not applicable.
(g) The aggregate non-audit fees billed by Deloitte for services rendered to the Registrant are shown above in the response to Item 4 (a), (b), (c) and (d) as “All Other Fees”.
The aggregate non-audit fees billed by Deloitte for services rendered to the Registrant’s investment adviser, Lord, Abbett & Co. LLC (“Lord Abbett”), for the fiscal years ended September 30, 2023 and 2022 were:
Fiscal year ended:
2023
2022
All Other Fees {a}
$230,000
$270,000
{a} Consist of fees for Independent Services Auditors’ Report on Controls Placed in Operation and Tests of Operating Effectiveness related to Lord Abbett’s Asset Management Services (“SOC-1 Report”).
The aggregate non-audit fees billed by Deloitte for services rendered to entities under the common control of Lord Abbett for the fiscal years ended September 30, 2023 and 2022 were:
Fiscal year ended:
2023
2022
All Other Fees
$ - 0 -
$ - 0-
(h) The Registrant’s Audit Committee has considered the provision of non-audit services that were rendered to the Registrant’s investment adviser, and any entity controlling, controlled by or under common control with the investment adviser that provides ongoing services to the Registrant, that were not pre-approved pursuant to Rule 2-01 (c)(7)(ii) of Regulation S-X and has determined that the provision of such services is compatible with maintaining Deloitte’s independence.
(i) Not Applicable.
(j) Not Applicable.
Item 5:
Audit Committee of Listed Registrants.
Not applicable.
Item 6:
Investments.
The Schedule of Investments is included as part of the Reports to Shareholders under Item 1.
Item 7:
Disclosure of Proxy Voting Policies and Procedures for Closed-End Management Investment Companies.
Not applicable.
Item 8:
Portfolio Managers of Closed-End Management Investment Companies.
Not applicable.
Item 9:
Purchases of Equity Securities by Closed-End Management Investment Company and Affiliated Purchasers.
Not applicable.
Item 10:
Submission of Matters to a Vote of Security Holders.
Not applicable.
Item 11:
Controls and Procedures.
(a)
The principal executive officer and principal financial & accounting officer have concluded as of a date within 90 days of the filing date of this report, based on their evaluation of the Registrant’s disclosure controls and procedures (as defined in Rule 30a-3(c) under the Investment Company Act of 1940), that the design of such procedures is effective to provide reasonable assurance that material information required to be disclosed by the Registrant on Form N-CSR is recorded, processed, summarized and reported within the time periods specified in the Commission’s rules and forms.
(b)
There were no changes in the Registrant’s internal control over financial reporting (as defined in Rule 30a-3(d) under the Investment Company Act of 1940) that occurred during the period covered by this report that have materially affected, or are reasonably likely to materially affect, the Registrant’s internal control over financial reporting.
Item 12:
Disclosure of Securities Lending Activities for Closed-End Management Investment Companies.
Pursuant to the requirements of the Securities Exchange Act of 1934 and the Investment Company Act of 1940, the Registrant has duly caused this report to be signed on its behalf by the undersigned, thereunto duly authorized.
LORD ABBETT MUNICIPAL INCOME FUND, INC.
By:
/s/ Douglas B. Sieg
Douglas B. Sieg
President and Chief Executive Officer
Date: November 22, 2023
Pursuant to the requirements of the Securities Exchange Act of 1934 and the Investment Company Act of 1940, this report has been signed below by the following persons on behalf of the Registrant and in the capacities and on the dates indicated.
By:
/s/ Douglas B. Sieg
Douglas B. Sieg
President and Chief Executive Officer
Date: November 22, 2023
By:
/s/ Michael J. Hebert
Michael J. Hebert
Chief Financial Officer and Treasurer
Date: November 22, 2023
We use cookies on this site to provide a more responsive and personalized service. Continuing to browse, clicking I Agree, or closing this banner indicates agreement. See our Cookie Policy for more information.