UNITED STATES
SECURITIES AND EXCHANGE COMMISSION
Washington, D.C. 20549
FORM N-CSR
CERTIFIED SHAREHOLDER REPORT OF REGISTERED
MANAGEMENT INVESTMENT COMPANIES
Investment Company Act File Number: 811-03942
LORD ABBETT MUNICIPAL INCOME FUND, INC.
(Exact name of Registrant as specified in charter)
90 Hudson Street, Jersey City, NJ 07302
(Address of principal executive offices) (Zip code)
Thomas R. Phillips, Esq., Vice President & Assistant Secretary
90 Hudson Street, Jersey City, NJ 07302
(Name and address of agent for service)
Registrant’s telephone number, including area code: (800) 201-6984
Date of fiscal year end: 9/30
Date of reporting period: 9/30/09
| Item 1: | Report(s) to Shareholders. |
2009
LORD ABBETT
ANNUAL
REPORT 
Lord Abbett
Municipal Income Fund
Municipal Income Trust
| | |
National Tax Free Fund California Tax Free Fund Connecticut Tax Free Fund Hawaii Tax Free Fund Missouri Tax Free Fund New Jersey Tax Free Fund | | New York Tax Free Fund Intermediate Tax Free Fund Short Duration Tax Free Fund Georgia Tax Free Trust High Yield Municipal Bond Fund Pennsylvania Tax Free Trust |
For the fiscal year ended September 30, 2009

Lord Abbett Municipal Income Fund and
Lord Abbett Municipal Income Trust
Annual Report
For the fiscal year ended September 30, 2009

From left to right: Robert S. Dow, Director and Chairman of the Lord Abbett Funds; E. Thayer Bigelow, Independent Lead Director of the Lord Abbett Funds; and Daria L. Foster, Director and President of the Lord Abbett Funds.
Dear Shareholders: We are pleased to provide you with this overview of the Lord Abbett Municipal Income Fund and Lord Abbett Municipal Income Trust for the fiscal year ended September 30, 2009. On this page and the following pages, we discuss the major factors that influenced performance. For detailed and more timely information about the Funds, please visit our Website at www.lordabbett.com, where you also can access the quarterly commentaries of the Funds’ portfolio managers.
Thank you for investing in Lord Abbett mutual funds. We value the trust that you place in us and look forward to serving your investment needs in the years to come.
Best regards,

Robert S. Dow
Chairman
Q: What were the overall market conditions during the fiscal year ended September 30, 2009?
A: Yields in the municipal bond market experienced two different directional trends during the 12-month period that ended September 30, 2009. Following Lehman Brothers’ bankruptcy filing in September 2008, yields on high-quality municipal bonds rose significantly in the beginning of the fourth quarter of 2008 before falling steadily afterward and throughout most of the first three quarters of 2009. After Lehman Brothers filed for bankruptcy, investors sought assets that were free of credit risk, such as U.S. government debt, and Treasury yields dropped in the fourth quarter of 2008. Amid this flight to quality, yields on ‘AAA’ general obligation municipal bonds at all points on the yield curve surpassed yields on Treasuries with similar maturities.
The monoline bond insurers continued to face ratings downgrades during the year due to their exposure to residential real estate.
1
In addition to reducing the fed funds target rate to a range of 0–0.25%, the Federal Reserve implemented a range of initiatives designed to stabilize conditions in the credit markets. Also, the American Recovery and Reinvestment Act of 2009 (the stimulus bill) created by the Obama administration was also a factor in the municipal bond market. The package allows states and municipalities to issue a new form of debt securities called Build America Bonds (BABs), which are taxable municipal bonds providing a federal government subsidy for a portion of the interest cost to either the investor buying the bonds or the entity issuing the securities.
Municipal bond issuance for 2009 was $286.9 billion as of September 30, or about 10% lower than the same period a year earlier. As the BAB program gained acceptance among issuers, about 30% of the market volume in the latter months of the fiscal year consisted of the taxable bonds. This use of taxable bonds reduced the supply of tax-exempt securities and was cited as a factor behind the strong performance of the tax-exempt municipal bond market in which the Funds invest.
With the yields on many money market funds close to 0%, Treasury yields near multiyear lows, and signs that the economy was stabilizing, investors became more willing to accept some credit risk and increased their demand for a range of bonds including municipal securities.
The price recovery phase in the municipal bond market lasted throughout much of the first three quarters of 2009. As this occurred, the municipal yield curve remained steep, and yields on most ‘AAA’ municipal bonds eventually returned to levels that were lower than those on similarly dated Treasury bonds, while long- term benchmark rates approached those of comparable Treasuries. Securities with lower credit ratings and longer maturities outperformed those with the highest credit ratings and short maturities.
Despite the price recovery in the overall municipal bond market, yields in the non-investment-grade segment remained above pre-Lehman levels.
Q: How did each Fund perform during the fiscal year ended September 30, 2009?
A: (Please see Table 1 for the relative performance of each Fund.)
2
Table 1: Fund Performance
| | | | | | | | | | | | | | | | | | |
| | | Class A Shares
@ NAV
9/30/09
12-Mo. Return | | | Lipper
Funds
Average1 | | | BC Muni
Bond Index2 | | | BC Muni
Bond Index:
7 Yr (6-8)3 | | | BC HY Muni
Bond Index4 | | | BC Muni
Bond Index:
1 Year (1-2)5 | |
National Tax Free Fund | | 15.40 | % | | 13.29 | % | | 14.85 | % | | — | | | — | | | — | |
California Tax Free Fund | | 13.92 | | | 13.07 | | | 14.85 | | | — | | | — | | | — | |
Connecticut Tax Free Fund | | 14.60 | | | 14.12 | | | 14.85 | | | — | | | — | | | — | |
Hawaii Tax Free Fund | | 13.15 | | | 13.44 | | | 14.85 | | | — | | | — | | | — | |
Missouri Tax Free Fund | | 13.93 | | | 14.05 | | | 14.85 | | | — | | | — | | | — | |
New Jersey Tax Free Fund | | 13.13 | | | 13.91 | | | 14.85 | | | — | | | — | | | — | |
New York Tax Free Fund | | 16.49 | | | 14.12 | | | 14.85 | | | — | | | — | | | — | |
Intermediate Tax Free Fund | | 13.50 | | | 11.43 | | | — | | | 12.52 | % | | — | | | — | |
Short Duration Tax Free Fund* | | 5.72 | 6 | | 4.49 | 6 | | — | | | — | | | — | | | 2.90 | %6 |
Georgia Tax Free Trust | | 15.91 | | | 14.40 | | | 14.85 | | | — | | | — | | | — | |
High Yield Municipal Bond Fund | | 4.14 | | | 7.76 | | | — | | | — | | | 4.55 | % | | — | |
Pennsylvania Tax Free Trust | | 13.69 | | | 13.73 | | | 14.85 | | | — | | | — | | | — | |
* Performance is from December 31, 2008, to September 30, 2009.
Peer Groups
The Lipper Funds Average for each state fund consists of municipal debt funds for its particular state, except that the Hawaii Tax Free Fund consists of Other States Municipal Debt Funds because there is no Lipper Average that is restricted to Hawaii municipal debt funds. In the case of the National Tax Free Fund, Intermediate Tax Free Fund, Short Duration Tax Free Fund, and High Yield Municipal Bond Fund, the applicable Lipper Funds Averages are for General Municipal Debt Funds, Intermediate Municipal Debt Funds, Short Municipal Debt Funds, and High Yield Municipal Debt Funds, respectively.
Benchmarks
The Barclays Capital Municipal Bond Index is applicable for all funds, except the Intermediate Tax Free Fund, the Short Duration Tax Free Fund, and the High Yield Municipal Bond Fund. The Barclays Capital Municipal Bond Index: 7 Year (6–8) is applicable for the Intermediate Tax Free Fund. The Barclays Capital Municipal Bond Index: 1 Year (1–2) is applicable for the Short Duration Tax Free Fund. The Barclays Capital High Yield Municipal Bond Index is applicable for the High Yield Municipal Bond Fund.
Q. What were the most significant factors affecting performance?
A: The most significant factors affecting each Fund’s performance were as follows:
National Tax Free Fund
The National Tax Free Fund outperformed its benchmark, the Barclays Capital Municipal Bond Index, during the 12-month period ended September 30, 2009.
3
During the year, bonds with longer maturities and higher credit ratings outperformed those with shorter maturities and lower credit ratings. The municipal yield curve remained steep, and the Fund’s exposure to bonds with maturities of 20 years and longer contributed positively to performance. The Fund’s holdings of charter school and senior living bonds underperformed the broader portfolio.
California Tax Free Fund
The Fund underperformed its benchmark during the year. The Fund’s holdings of lease appropriated bonds underperformed relative to other sectors. Even so, they provided positive returns.
The California Tax Free Fund benefited from its yield curve positioning, particularly from its weighting in bonds with maturities of 16 years and longer. The Fund also capitalized on its exposure to lower-rated, investment-grade credits, as its holdings of ‘A’ rated securities were beneficial to performance.
General obligation (GO) debt issued by the State of California was rated ‘Baa1’ by Moody’s and ‘A’ by Standard & Poor’s as of September 30, 2009. These ratings are based on weak economic performance trends, recent budget amendments to solve the 2009 budget gap, inflexibility in the state’s revenue system and governmental structures, as well as a diverse, wealthy economy and a well-funded pension obligation.
Fiscal year 2008 was one of the most difficult economic periods in California’s history. While measures were taken to cut state expenses, minimize budget gaps, and improve financial liquidity, there are still concerns that the current budget package is based on nonrecurring actions, material out-year obligations, and perhaps optimistic beliefs about revenue performance and expenditure savings.
At 12.2% as of September 2009, California’s seasonally adjusted unemployment rate is the fourth highest in the nation. As of September 2009, the national rate was 9.8%.
The outlook for California’s ratings was recently designated as stable (according to Moody’s) and negative (according to S&P). It is possible the outlooks may change given the state’s recent history in facing steep budget deficits. According to Moody’s 2009 State Debt Medians Report, California has the largest total net tax-supported debt of the 50 states. Net tax-supported debt per capita for California is $1,805 in 2009, or 4.4% of 2007 personal income. The average funded ratio for state public pension plans is 81% as of February 2009.
Connecticut Tax Free Fund
The Fund underperformed its benchmark during the fiscal year. The Fund’s holdings in pre-refunded bonds7 were a drag on performance, as pre-refunded bonds, which typically have short maturities and are of the highest credit quality,
4
underperformed most of the Fund’s other holdings. Even so, they provided positive returns.
The Connecticut Tax Free Fund benefited from its yield curve positioning, in particular its weighting in bonds 13 years and longer. Sector allocation was also an important contributor. Electric utilities, higher education, and industrial development bonds boosted Fund performance.
GO debt issued by the State of Connecticut was rated ‘Aa3’ by Moody’s and ‘AA’ by Standard & Poor’s as of September 30, 2009. These ratings are based on good reserve levels, high levels of income and wealth, as well as a substantial and diverse economic base. In addition, Connecticut is, according to recent data, the most affluent of the 50 states, with per capita income ahead of the national average by 38%.
The state ended fiscal year 2008 with a budget surplus of about $99 million. Connecticut’s budget reserve fund at the end of fiscal year 2008 matched its 2007 level at $1.38 billion. Personal income and oil company taxes boosted net taxes after refunds to $70 million over forecasted amounts. Revenues from sales, corporate, real estate, and other tax resources were less than expected.
Connecticut’s seasonally adjusted unemployment rate increased to 8.4% in September 2009. The state reported the greatest job losses in the leisure, hospitality, and government sectors. The educational and health services areas were the only ones to show job increases. The recent loss of financial sector jobs hurt Connecticut’s high-end housing market.
Connecticut’s net tax-supported debt per capita ranks first in the nation, according to Moody’s 2009 State Debt Medians Report. While the national median net tax-supported debt is $865 per capita, the state’s debt equals $4,490 per capita. Yet, when viewed within the context of the state’s high income levels, its debt ratios are relatively manageable.
Hawaii Tax Free Fund
The Fund underperformed its benchmark during the year. The performance of the Fund’s holdings in bonds shorter than six years lagged that of the broader portfolio. Even so, they had positive returns. As typical with the general market, longer maturity bonds outperformed shorter maturity bonds.
Strategic allocations to maturities longer than nine years were beneficial to the Fund’s performance. Sector allocation was also an important contributor. Insured, general obligation, and special tax district bonds boosted Fund performance.
GO debt issued by the State of Hawaii was rated ‘Aa2’ by Moody’s and ‘AA’ by Standard & Poor’s as of September 30, 2009. These strong ratings are based on the state’s history of fiscal conservatism, aggressive budget solutions, ongoing military housing construction, proactive budget monitoring practices, and a high debt burden.
5
Throughout fiscal year 2009, revenue performance declined. Late in its fiscal year, Hawaii’s council on revenues lowered its forecast for tax revenue growth to a contraction of 9% for 2009, which would cause a $730 million budget shortfall. Hawaii’s economy was weakened by a variety of factors including a decline in tourism, reduced consumer spending, job losses, stock market declines, and the swine flu epidemic. To help replace lost revenues, Governor Linda Lingle announced a mandatory three-day-per-month furlough for all executive branch staff for two years, and the plan’s projected savings is $688 million.
As of September 30, 2009, the state’s seasonally adjusted unemployment rate increased to 7.2% from 4.4% a year earlier. The most recent rates are the worst in 30 years. After four years of operating surpluses, tax revenues failed to meet expenditures for fiscal year 2008. The state reported a decline in its unreserved, undesignated general fund balance from a peak of $915 million for fiscal year 2006 to $464 million for fiscal year 2008.
According to Moody’s 2009 State Debt Medians Report, Hawaii ranks third highest in the nation with net tax-supported debt per capita of $3,675. The national median net tax-supported debt is $865 per capita. As a percentage of 2007 personal income, Hawaii’s debt level in 2009 is the nation’s highest at 9.4%. However, this is a decrease from 9.9% reported in 2008.
While Hawaii’s retirement system funded ratio was below average, 69% at the end of fiscal year 2008, this reflects an improvement from 65% in 2006. In addition, the state has been making its annually required contributions.
Missouri Tax Free Fund
The Fund underperformed its benchmark during the fiscal year. The performance of the Fund’s holdings of bonds shorter than 13 years trailed that of longer maturity bonds. Even so, they had positive returns. As was typical with the general market, longer maturity bonds outperformed shorter maturity bonds.
Strategic allocations to maturities longer than 13 years were beneficial to the Fund’s performance. Sector allocation was also an important contributor to the Fund’s performance. In particular, insured, healthcare, and lease appropriation bonds were significant contributors.
GO debt issued by the State of Missouri was rated ‘Aaa’ by Moody’s and ‘AAA’ by Standard & Poor’s as of September 30, 2009. These ratings are based on Missouri’s history of large available balances, solid financial management, and moderate debt burden.
Fiscal 2009 net general revenue collections fell 6.9% to $7.5 billion from $8.0 billion collected in fiscal 2008. This followed a 3.7% increase in fiscal 2008 net general revenues over fiscal 2007. Missouri’s actual expenditures for fiscal 2008 were under budget, enabling the
6
state to increase its already strong reserves by nearly $166 million.
As of September 2009, seasonally adjusted unemployment rate for Missouri was 9.5%, versus a national average of 9.8%. In September 2008, the state’s unemployment rate stood at 6.3%. Missouri’s net tax-supported per capita debt level for 2009 is low at $670, or 2.0% of 2007 personal income, versus a national median of $865, or 2.5%.
New Jersey Tax Free Fund
The Fund underperformed its benchmark during the year. During the fourth quarter of 2008, difficulties in the financial markets led to a steepening yield curve and a significant widening of credit spreads. This scenario hurt performance due to the Fund’s holdings of longer-dated bonds. Exposure to lower quality credit, selected due to its attractive long-term total return characteristics, was also a detracting factor for this period.
However, in 2009, this same structure helped the Fund’s performance as a strong rally ensued. Credit spreads compressed significantly causing the Fund’s lower quality exposure to boost performance. In addition, the Fund’s holdings of longer-dated bonds contributed to performance.
The Fund’s exposure to the healthcare sector, as well as lease appropriated debt, also contributed to performance. While returns in all sectors were positive, the performance of the Fund’s holdings of senior living bonds trailed that of the broader portfolio.
GO debt issued by the State of New Jersey was rated ‘Aa3’ by Moody’s and ‘AA’ by Standard & Poor’s as of September 30, 2009. These ratings are based on New Jersey’s varied economy, high wealth and income levels, and ongoing improvement in balancing resources to needs. They also reflect decreased revenues, a high debt burden, and a large unfunded pension liability.
New Jersey ended fiscal year 2009 with a budget gap of $6.1 billion, or 18.8% of the state’s general fund. Revenue from personal income tax, sales tax, and corporate business tax all declined as social service expenses increased. The state applied numerous expense reductions to mitigate the drop in revenues. Many of the measures, including Federal stimulus funds, were non-recurring.
The state’s seasonally adjusted unemployment rate increased from 5.8% in September 2008 to 9.8% in September 2009, equaling the national rate. The financial, manufacturing, and construction sectors have been hard hit. Additional job loss could result due to New Jersey’s exposure to financial services and pharmaceutical company mergers.
In 2008, New Jersey’s per capita personal income ranked second among the 50 states at $50,919. New Jersey’s net tax-supported debt burden per capita is high at $3,621, compared to the national median of $865, according to Moody’s 2009 State Debt Medians Report. As a percentage of 2007 personal income, New Jersey’s 2009
7
debt ranks fourth among the states at 7.3%. The funded ratio for New Jersey state pensions is low, at 69.6% as of June 2008. This is a decline from 100.8% in 2002.
New York Tax Free Fund
The Fund outperformed its benchmark during the year. During the fourth quarter of 2008, difficulties in the financial markets led to a steepening yield curve and a significant widening of credit spreads. This scenario hurt performance due to the Fund’s weighting in longer-dated bonds. Exposure to lower quality credit, selected due to its attractive long-term total return characteristics, was also a detracting factor for this period.
In 2009, this same structure helped the Fund’s performance as a strong rally ensued. Credit spreads compressed significantly causing the Fund’s lower quality exposure to bolster performance. However, it was the ‘AA’ and ‘A’ rated buckets that had the highest returns. In addition, the Fund’s holdings of longer-dated bonds contributed positively to performance.
The Fund’s exposure to higher education bonds, as well as lease appropriated debt also contributed to performance. While returns in all sectors were positive, the performance of insured bonds trailed that of the majority of the portfolio.
GO debt issued by the State of New York was rated ‘Aa3’ by Moody’s and ‘AA’ by Standard & Poor’s as of September 30, 2009. These ratings are based on the state’s diversified, mature, affluent economy, as well as its comprehensive financial planning process, track record of closing annual budget gaps, and accumulated budget reserves. Even though the national housing crisis did not impact New York as much as other states, New York’s dependence on the financial industry led the state into recession.
New York reported unaudited net assets of $33.9 billion for fiscal year 2009 (ended March 31, 2009), resulting from $125.9 billion in total assets offset by $92 billion in total liabilities. The general fund reported a deficit of $6.9 billion for 2009, reducing the accumulated fund balance to a $2.9 billion deficit.
As of September 2009, New York’s seasonally adjusted unemployment rate stood at 8.9%, up 3.1% from the previous year. New York’s per capita personal income ranked sixth highest among the 50 states at $48,076 in 2008.
While unfunded retiree health care liabilities are about $49.9 billion, New York’s pension system is well funded relative to other states. New York’s net tax-supported debt burden per capita was high at $2,921, compared to the national median of $865, ranking fifth in the nation, according to Moody’s 2009 State Debt Medians Report.
8
Intermediate Tax Free Fund
The Intermediate Tax Free Fund outperformed its benchmark, the Barclays Capital Municipal Bond Index: 7 Year (6-8), during the 12-month period ended September 30, 2009. During the year, bonds with longer maturities and higher credit ratings outperformed those with shorter maturities and lower credit ratings. The Fund’s holdings of bonds with maturities of 10 years or longer contributed positively to its performance. The performance of the Fund’s insured bonds trailed that of the broader portfolio.
Short Duration Tax Free Fund*
*(The Fund commenced operations on December 12, 2008, and investment performance began on December 31, 2008.)
The Short Duration Tax Free Fund outperformed its benchmark, the Barclays Capital Municipal Bond Index: 1 Year (1-2), during the period from December 31, 2008, to September 30, 2009. The Fund’s position in variable-rate demand notes (VRDNs) contributed positively to performance for significant portions of the year. Due to the steep municipal yield curve, the Fund benefitted from a barbell position in the VRDNs at the short end of the curve, with bonds in the three- to five-year range at the other end. Securities with ‘A’ and ‘BBB’ credit ratings contributed positively to performance during the period.
Georgia Tax Free Trust
The Fund outperformed its benchmark during the year. The Georgia Tax Free Trust benefited from its yield curve positioning, in particular its weighting in bonds 10 years and longer.
Sector allocation was also an important contributor. General obligation, water/sewer, and industrial development bonds boosted Fund performance. The Fund’s holdings in pre-refunded and senior living bonds underperformed other sectors. Even so, they provided positive returns.
GO debt issued by the State of Georgia was rated ‘Aaa’ by Moody’s and ‘AAA’ by Standard & Poor’s as of September 30, 2009. These strong ratings are based on a history of conservative fiscal management, solid long-term fundamentals, moderate debt burden, well funded pensions, and modest budget reserves.
Georgia’s seasonally adjusted unemployment rate jumped from 6.6% in September 2008 to 10.1% in September 2009. Construction, manufacturing, and financial services were the sectors with the most significant job losses, while education and healthcare reported gains.
After several years of tax revenue growth, Georgia’s 2007 revenue shortfall reserve stood at $1.5 billion, or 8.2% of net revenues. In fiscal 2008, the state’s tax revenues declined, dropping to $17.7 billion, or 3.9% below budget. As a result, $333 million from the reserve was needed to complete the year. For fiscal 2009, tax revenues fell 10.5% to $15.6 billion.
9
Georgia is using its American Recovery and Reinvestment Act (ARRA) stimulus package funds to help mitigate budget shortfalls.
High Yield Municipal Bond Fund
The High Yield Municipal Bond Fund underperformed its benchmark, the Barclays Capital High Yield Municipal Bond Index, during the 12-month period ended September 30, 2009. Holdings of special tax district bonds were detractors during the period.
Exposure to securities with maturities of 21 years and longer contributed positively to performance, as did exposure to bonds with credit ratings of ‘BBB.’ Holdings of bonds from the airline and healthcare sectors helped performance.
Pennsylvania Tax Free Trust
The Fund underperformed its benchmark during the year. The performance of the Fund’s holdings in bonds shorter than five years trailed that of the broader portfolio. Even so, they had positive returns for the year.
As typical with the general market, longer maturity bonds outperformed shorter maturity bonds. Strategic allocations to maturities longer than 13 years were beneficial to the Fund’s performance. Sector allocation was also an important contributor. Healthcare, higher education, and insured bonds boosted Fund performance.
GO debt issued by the Commonwealth of Pennsylvania was rated ‘Aa2’ by Moody’s and ‘AA’ by Standard & Poor’s as of September 30, 2009. These ratings are based on the Commonwealth’s varied economic base, good wealth levels, and favorable debt profile. In August, Moody’s revised Pennsylvania’s rating outlook from stable to negative, due to declining available fund balances, the challenge of rebuilding fund balances, and delays in reversing budget gaps caused by reduced revenues.
As of September 2009, Pennsylvania’s seasonally adjusted unemployment rate was 8.8%, lower than the national unemployment rate of 9.8%. Revenues declined significantly in fiscal 2009 (ended June 30, 2009), causing a large deficit. The general fund revenues finished the year at $3.25 billion, about 10% less than in 2008. Pennsylvania ended fiscal 2009 with an unappropriated balance of negative $2.74 billion.
Pennsylvania’s State Employees’ Retirement Fund and the Public School Employees’ Retirement Fund are well funded, with funded ratios of 89.0% and 84.1%, respectively, as of December 31, 2008. The Commonwealth’s debt position is strong, with a burden per capita of $950, compared with the national median of $865, according to Moody’s 2009 State Debt Medians Report.
10
Each Fund’s portfolio is actively managed and, therefore, its holdings and the weightings of a particular issuer or particular sector as a percentage of portfolio assets are subject to change.
Note: Class A shares purchased subject to a front-end sales charge have no contingent deferred sales charge (CDSC). However, certain purchases of Class A shares made without a front-end sales charge may be subject to a CDSC of 1% if the shares are redeemed before the first day of the month in which the one-year anniversary of the purchase falls. Please see each Fund’s prospectus for more information on redemptions that may be subject to a CDSC.
1 The Lipper Funds Average: Lipper, Inc. is a nationally recognized organization that reports on mutual fund total return performance and calculates fund rankings. Peer averages are based on universes of funds with similar investment objectives. Peer group averages include reinvested dividends and capital gains, if any, and exclude sales charges.
2 The Barclays Capital Municipal Bond Index is a broad measure of the municipal bond market with maturities of at least one year. To be included in this index, bonds must have a minimum credit rating of Baa, an outstanding par value of at least $3 million, and be issued as part of a transaction of at least $50 million. Includes zero coupon bonds subject to the alternative minimum tax.
3 The Barclays Capital Municipal Bond Index: 7 Yr (6-8) is an unmanaged total return performance benchmark for the investment-grade, geographically unrestricted seven-year tax-exempt bond market, consisting of municipal bonds with maturities of 6-8 years.
4 The Barclays Capital High Yield Municipal Bond Index is an unmanaged index that includes municipal bonds having a maximum quality rating of Ba1, or non-rated, original issue size of $20 million or larger and maturities of at least one year.
5 The Barclays Capital Municipal Bond Index: 1 Year (1-2) is an unmanaged index composed of national municipal bond issues with a maturity range of 1-2 years.
6 The Short Duration Tax Free Fund commenced operations on December 12, 2008. Investment performance began on December 31, 2008, and the total returns for the Fund, its Lipper Average, and the Barclays Capital Municipal Bond Index: 1 Year (1-2) are each for the period December 31, 2008 to September 30, 2009.
7 Pre-refunded bonds are older, tax-free bonds that typically pay coupons higher than current market rates and that have been refinanced or “prepaid” by the proceeds of a second bond issue. The proceeds of this second issuance are used to “call” or pay off the original issue at its first call date. Until that time, the monies are held in escrow and are usually invested in U.S. Treasuries. As a result, pre-refunded bonds are generally deemed to have virtually no default risk. Typically, when a bond becomes pre-refunded it appreciates in value because of its higher credit quality and improved marketability.
Unless otherwise indicated, indexes are unmanaged and reflect total returns with all distributions reinvested, but do not reflect the deduction of fees or expenses, and are not available for direct investment.
Note: During certain periods of each Fund’s performance shown, fee and expense waiver/reimbursement arrangements were in effect. Without waivers/reimbursements, performance would have been lower. See each Fund’s prospectus for a history of fees waived and expenses assumed. Existing expense waivers may be revised or terminated at any time.
Copyright © 2009 by Reuters. All rights reserved. Any copying, republication, or redistribution of Lipper content is expressly prohibited without the prior written consent of Lipper. An investor cannot invest directly in an average.
Important Performance and Other Information
Performance data quoted reflect past performance and are no guarantee of future results. Current performance may be higher or lower than the performance quoted. The investment return and principal value of an investment in a Fund will fluctuate so that
11
shares, on any given day or when redeemed, may be worth more or less than their original cost. You can obtain performance data current to the most recent month end by calling Lord Abbett at 888-522-2388 or referring to our Web site at www.lordabbett.com.
Except where noted, comparative fund performance does not account for the deduction of sales charges, and would be different if sales charges were included. Each Fund offers several classes of shares with distinct pricing options. For a full description of the differences in pricing alternatives, please see each Fund’s prospectus.
The views of each Fund’s management and the portfolio holdings described in this report are as of September 30, 2009; these views and holdings may have changed subsequent to this date, and they do not guarantee the future performance of the markets or the Funds. Information provided in this report should not be considered a recommendation to purchase or sell securities.
A Note about Risk: See Notes to Financial Statements for a discussion of investment risks. For a more detailed discussion of the risks associated with each Fund, please see each Fund’s prospectus.
Mutual funds are not insured by the FDIC, are not deposits or other obligations of, or guaranteed by, banks, and are subject to investment risks, including possible loss of principal amount invested.
12
National Tax Free Fund
Investment Comparison
Below is a comparison of a $10,000 investment in Class A shares to the same investment in the Barclays Capital Municipal Bond Index and the Lipper General Municipal Debt Funds Average, assuming reinvestment of all dividends and distributions. The performance of other classes will be greater than or less than the performance shown in the graph below due to different sales loads and expenses applicable to such classes. The graph and performance table below do not reflect the deduction of taxes that a shareholder would pay on Fund distributions or the redemption of Fund shares. Past performance is no guarantee of future results.
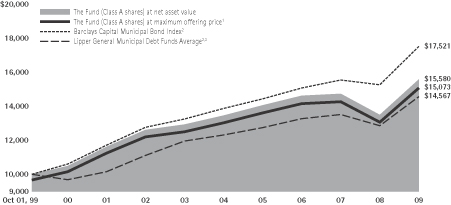
Average Annual Total Returns at Maximum Applicable
Sales Charge for the Periods Ended September 30, 2009
| | | | | | | | |
| | | 1 Year | | 5 Years | | 10 Years | | Life of Class |
Class A4 | | 11.61% | | 2.28% | | 4.19% | | – |
Class B5 | | 10.48% | | 2.08% | | 3.99% | | – |
Class C6 | | 14.58% | | 2.32% | | 3.86% | | – |
Class F7 | | 15.44% | | – | | – | | 2.87% |
Standardized Yield for the Year Ended September 30, 2009
| | | | | | |
| Class A | | Class B | | Class C | | Class F |
| 4.82% | | 4.04% | | 4.00% | | 4.92% |
1 Reflects the deduction of the maximum initial sales charge of 3.25%.
2 Performance for the average or the unmanaged index does not reflect any fees or expenses. The performance of the average or the index is not necessarily representative of the Fund’s performance.
3 Source: Lipper Inc.
4 Total return, which is the percent change in value, after deduction of the maximum initial sales charge of 3.25% applicable to Class A shares, with all dividends and distributions reinvested for periods shown ended September 30, 2009, is calculated using the SEC required uniform method to compute such return.
5 Performance reflects the deduction of a CDSC of 4% for 1 year, 1% for 5 years and 0% for 10 years. Class B shares automatically convert to Class A shares after approximately 8 years. (There is no initial sales charge for automatic conversions.) All returns for periods greater than 8 years reflect this conversion.
6 The 1% CDSC for Class C shares normally applies before the first anniversary of the purchase date. Performance is at net asset value.
7 Class F shares commenced operations and performance for the class began on September 28, 2007. Performance is at net asset value.
13
California Tax Free Fund
Investment Comparison
Below is a comparison of a $10,000 investment in Class A shares to the same investment in the Barclays Capital Municipal Bond Index and the Lipper California Municipal Debt Funds Average, assuming reinvestment of all dividends and distributions. The performance of the other classes will be greater than or less than the performance shown in the graph below due to different sales loads and expenses applicable to such classes. The graph and performance table below do not reflect the deduction of taxes that a shareholder would pay on Fund distributions or the redemption of Fund shares. Past performance is no guarantee of future results.

Average Annual Total Returns at Maximum Applicable
Sales Charge for the Periods Ended September 30, 2009
| | | | | | | | |
| | | 1 Year | | 5 Years | | 10 Years | | Life of Class |
Class A4 | | 10.16% | | 2.31% | | 4.21% | | – |
Class C5 | | 13.13% | | 2.32% | | 3.91% | | – |
Class F6 | | 14.06% | | – | | – | | 2.95% |
Standardized Yield for the Year Ended September 30, 2009
| | | | |
| Class A | | Class C | | Class F |
| 4.51% | | 3.59% | | 4.61% |
1 Reflects the deduction of the maximum initial sales charge of 3.25%.
2 Performance for the average or the unmanaged index does not reflect any fees or expenses. The performance of the average or the index is not necessarily representative of the Fund’s performance. The Index is composed of municipal bonds from many states while the Fund is a single-state municipal bond portfolio.
3 Source: Lipper Inc.
4 Total return, which is the percent change in value, after deduction of the maximum initial sales charge of 3.25% applicable to Class A shares, with all dividends and distributions reinvested for periods shown ended September 30, 2009, is calculated using the SEC required uniform method to compute such return.
5 The 1% CDSC for Class C shares normally applies before the first anniversary of the purchase date. Performance is at net asset value.
6 Class F shares commenced operations and performance for the class began on September 28, 2007. Performance is at net asset value.
14
Connecticut Tax Free Fund
Investment Comparison
Below is a comparison of a $10,000 investment in Class A shares to the same investment in the Barclays Capital Municipal Bond Index and the Lipper Connecticut Municipal Debt Funds Average, assuming reinvestment of all dividends and distributions. The performance of the other class will be greater than or less than the performance shown in the graph below due to different sales loads and expenses applicable to such class. The graph and performance table below do not reflect the deduction of taxes that a shareholder would pay on Fund distributions or the redemption of Fund shares. Past performance is no guarantee of future results.
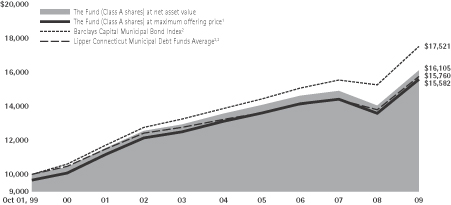
Average Annual Total Returns at Maximum Applicable
Sales Charge for the Periods Ended September 30, 2009
| | | | | | | | |
| | | 1 Year | | 5 Years | | 10 Years | | Life of Class |
Class A4 | | 10.89% | | 2.80% | | 4.54% | | – |
Class F5 | | 14.65% | | – | | – | | 3.93% |
Standardized Yield for the Year Ended September 30, 2009
| | | | | | |
| | | Class A | | Class F | | |
| | | 4.04% | | 4.14% | | |
1 Reflects the deduction of the maximum initial sales charge of 3.25%.
2 Performance for the average or the unmanaged index does not reflect any fees or expenses. The performance of the average or the index is not necessarily representative of the Fund’s performance. The Index is composed of municipal bonds from many states while the Fund is a single-state municipal bond portfolio.
3 Source: Lipper Inc.
4 Total return, which is the percent change in value, after deduction of the maximum initial sales charge of 3.25% applicable to Class A shares, with all dividends and distributions reinvested for periods shown ended September 30, 2009, is calculated using the SEC required uniform method to compute such return.
5 Class F shares commenced operations and performance for the class began on September 28, 2007. Performance is at net asset value.
15
Hawaii Tax Free Fund
Investment Comparison
Below is a comparison of a $10,000 investment in Class A shares to the same investment in the Barclays Capital Municipal Bond Index and the Lipper Other States Municipal Debt Funds Average, assuming reinvestment of all dividends and distributions. The performance of the other class will be greater than or less than the performance shown in the graph below due to different sales loads and expenses applicable to such class. The graph and performance table below do not reflect the deduction of taxes that a shareholder would pay on Fund distributions or the redemption of Fund shares. Past performance is no guarantee of future results.
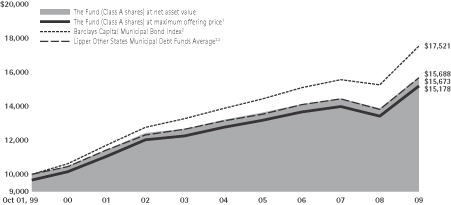
Average Annual Total Returns at Maximum Applicable
Sales Charge for the Periods Ended September 30, 2009
| | | | | | | | |
| | | 1 Year | | 5 Years | | 10 Years | | Life of Class |
Class A4 | | 9.52% | | 2.85% | | 4.27% | | – |
Class F5 | | 13.28% | | – | | – | | 4.33% |
Standardized Yield for the Year Ended September 30, 2009
| | | | | | |
| | | Class A | | Class F | | |
| | | 3.73% | | 3.83% | | |
1 Reflects the deduction of the maximum initial sales charge of 3.25%.
2 Performance for the average or the unmanaged index does not reflect any fees or expenses. The performance of the average or the index is not necessarily representative of the Fund’s performance. The Index and the average are composed of municipal bonds from many states while the Fund is a single-state municipal bond portfolio.
3 Source: Lipper Inc.
4 Total return, which is the percent change in value, after deduction of the maximum initial sales charge of 3.25% applicable to Class A shares, with all dividends and distributions reinvested for periods shown ended September 30, 2009, is calculated using the SEC required uniform method to compute such return.
5 Class F shares commenced operations and performance for the class began on September 28, 2007. Performance is at net asset value.
16
Missouri Tax Free Fund
Investment Comparison
Below is a comparison of a $10,000 investment in Class A shares to the same investment in the Barclays Capital Municipal Bond Index and the Lipper Missouri Municipal Debt Funds Average, assuming reinvestment of all dividends and distributions. The performance of the other class will be greater than or less than the performance shown in the graph below due to different sales loads and expenses applicable to such class. The graph and performance table below do not reflect the deduction of taxes that a shareholder would pay on Fund distributions or the redemption of Fund shares. Past performance is no guarantee of future results.
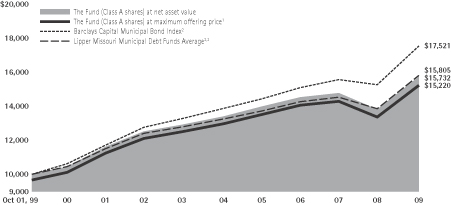
Average Annual Total Returns at Maximum Applicable
Sales Charge for the Periods Ended September 30, 2009
| | | | | | | | |
| | | 1 Year | | 5 Years | | 10 Years | | Life of Class |
Class A4 | | 10.14% | | 2.57% | | 4.29% | | – |
Class F5 | | 14.05% | | – | | – | | 3.34% |
Standardized Yield for the Year Ended September 30, 2009
| | | | | | |
| | | Class A | | Class F | | |
| | | 4.13% | | 4.23% | | |
1 Reflects the deduction of the maximum initial sales charge of 3.25%.
2 Performance for the average or the unmanaged index does not reflect any fees or expenses. The performance of the average or the index is not necessarily representative of the Fund’s performance. The Index is composed of municipal bonds from many states while the Fund is a single-state municipal bond portfolio.
3 Source: Lipper Inc.
4 Total return, which is the percent change in value, after deduction of the maximum initial sales charge of 3.25% applicable to Class A shares, with all dividends and distributions reinvested for periods shown ended September 30, 2009, is calculated using the SEC required uniform method to compute such return.
5 Class F shares commenced operations and performance for the class began on September 28, 2007. Performance is at net asset value.
17
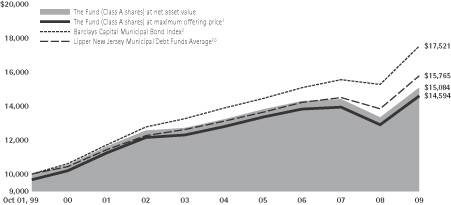
New Jersey Tax Free Fund
Investment Comparison
Below is a comparison of a $10,000 investment in Class A shares to the same investment in the Barclays Capital Municipal Bond Index and the Lipper New Jersey Municipal Debt Funds Average, assuming reinvestment of all dividends and distributions. The performance of the other class will be greater than or less than the performance shown in the graph below due to different sales loads and expenses applicable to such class. The graph and performance table below do not reflect the deduction of taxes that a shareholder would pay on Fund distributions or the redemption of Fund shares. Past performance is no guarantee of future results.
Average Annual Total Returns at Maximum Applicable
Sales Charge for the Periods Ended September 30, 2009
| | | | | | | | |
| | | 1 Year | | 5 Years | | 10 Years | | Life of Class |
Class A4 | | 9.42% | | 2.02% | | 3.85% | | – |
Class F5 | | 13.26% | | – | | – | | 2.48% |
Standardized Yield for the Year Ended September 30, 2009
| | | | | | |
| | | Class A | | Class F | | |
| | | 4.25% | | 4.35% | | |
1 Reflects the deduction of the maximum initial sales charge of 3.25%.
2 Performance for the average or the unmanaged index does not reflect any fees or expenses. The performance of the average or the index is not necessarily representative of the Fund’s performance. The Index is composed of municipal bonds from many states while the Fund is a single-state municipal bond portfolio.
3 Source: Lipper Inc.
4 Total return, which is the percent change in value, after deduction of the maximum initial sales charge of 3.25% applicable to Class A shares, with all dividends and distributions reinvested for periods shown ended September 30, 2009, is calculated using the SEC required uniform method to compute such return.
5 Class F shares commenced operations and performance for the class began on September 28, 2007. Performance is at net asset value.
18
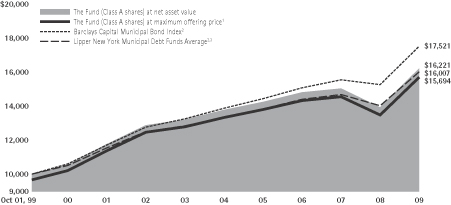
New York Tax Free Fund
Investment Comparison
Below is a comparison of a $10,000 investment in Class A shares to the same investment in the Barclays Capital Municipal Bond Index and the Lipper New York Municipal Debt Funds Average, assuming reinvestment of all dividends and distributions. The performance of the other classes will be greater than or less than the performance shown in the graph below due to different sales loads and expenses applicable to such classes. The graph and performance table below do not reflect the deduction of taxes that a shareholder would pay on Fund distributions or the redemption of Fund shares. Past performance is no guarantee of future results.
Average Annual Total Returns at Maximum Applicable
Sales Charge for the Periods Ended September 30, 2009
| | | | | | | | |
| | | 1 Year | | 5 Years | | 10 Years | | Life of Class |
Class A4 | | 12.66% | | 2.64% | | 4.61% | | – |
Class C5 | | 15.69% | | 2.65% | | 4.30% | | – |
Class F6 | | 16.51% | | – | | – | | 3.98% |
Standardized Yield for the Year Ended September 30, 2009
| | | | |
| Class A | | Class C | | Class F |
| 4.37% | | 3.45% | | 4.48% |
1 Reflects the deduction of the maximum initial sales charge of 3.25%.
2 Performance for the average or the unmanaged index does not reflect any fees or expenses. The performance of the average or the index is not necessarily representative of the Fund’s performance. The Index is composed of municipal bonds from many states while the Fund is a single-state municipal bond portfolio.
3 Source: Lipper Inc.
4 Total return, which is the percent change in value, after deduction of the maximum initial sales charge of 3.25% applicable to Class A shares, with all dividends and distributions reinvested for periods shown ended September 30, 2009, is calculated using the SEC required uniform method to compute such return.
5 The 1% CDSC for Class C shares normally applies before the first anniversary of the purchase date. Performance is at net asset value.
6 Class F shares commenced operations and performance for the class began on September 28, 2007. Performance is at net asset value.
19
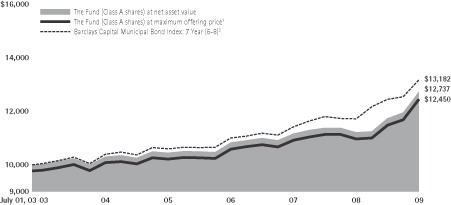
Intermediate Tax Free Fund
Investment Comparison
Below is a comparison of a $10,000 investment in Class A shares to the same investment in the Barclays Capital Municipal Bond Index: 7 Year (6-8) assuming reinvestment of all dividends and distributions. The performance of other classes will be greater than or less than the performance shown in the graph below due to different sales loads and expenses applicable to such classes. The graph and performance table below do not reflect the deduction of taxes that a shareholder would pay on Fund distributions or the redemption of Fund shares. Past performance is no guarantee of future results.
Average Annual Total Returns at Maximum Applicable
Sales Charge for the Periods Ended September 30, 2009
| | | | | | |
| | | 1 Year | | 5 Years | | Life of Class |
Class A3 | | 10.91% | | 3.84% | | 3.55% |
Class B4 | | 8.65% | | 3.36% | | 3.16% |
Class C5 | | 12.76% | | 3.56% | | 3.17% |
Class F6 | | 13.61% | | – | | 6.87% |
Class P7 | | 13.27% | | 4.12% | | 3.73% |
Standardized Yield for the Year Ended September 30, 2009
| | | | | | | | |
| Class A | | Class B | | Class C | | Class F | | Class P |
| 3.39% | | 2.60% | | 2.78% | | 3.49% | | 3.16% |
1 Reflects the deduction of the maximum initial sales charge of 2.25%.
2 Performance for the unmanaged index does not reflect any fees or expenses. The performance of the index is not necessarily representative of the Fund’s performance.
3 Total return, which is the percent change in value, after deduction of the maximum initial sales charge of 2.25% applicable to Class A shares, with all dividends and distributions reinvested for periods shown ended September 30, 2009, is calculated using the SEC required uniform method to compute such return. The Class A share inception date is June 30, 2003.
4 Class B shares were first offered on June 30, 2003. Performance reflects the deduction of a CDSC of 4% for 1 year, 1% for 5 years and 0% for the life of the Class.
5 Class C shares were first offered on June 30, 2003. The 1% CDSC for Class C shares normally applies before the first anniversary of the purchase date. Performance is at net asset value.
6 Class F shares commenced operations and performance for the class began on September 28, 2007. Performance is at net asset value.
7 Class P shares were first offered on June 30, 2003. Performance is at net asset value.
20
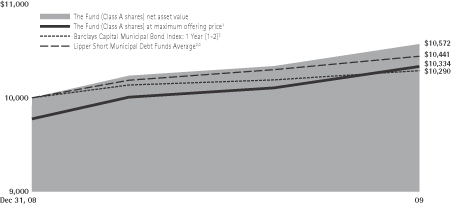
Short Duration Tax Free Fund
Investment Comparison
Below is a comparison of a $10,000 investment in Class A shares to the same investment in the Barclays Capital Municipal Bond Index: 1 Year (1-2) and the Lipper Short Municipal Debt Funds Average assuming reinvestment of all dividends and distributions. The performance of other classes will be greater than or less than the performance shown in the graph below due to different sales loads and expenses applicable to such classes. The graph and performance table below do not reflect the deduction of taxes that a shareholder would pay on Fund distributions or the redemption of Fund shares. Past performance is no guarantee of future results.
Total Returns at Maximum Applicable
Sales Charge for the Period Ended September 30, 2009
| | |
| | | Life of Class* |
Class A4 | | 3.33% |
Class C5 | | 4.04% |
Class F6 | | 5.79% |
Class I7 | | 5.92% |
Standardized Yield for the Period Ended September 30, 2009
| | | | | | |
| Class A | | Class C | | Class F | | Class I |
| 2.18% | | 1.40% | | 2.28% | | 2.38% |
1 Reflects the deduction of the maximum initial sales charge of 2.25%.
2 Performance for the average or the unmanaged index does not reflect any fees or expenses. The performance of the average or the index is not necessarily representative of the Fund’s performance.
3 Source: Lipper Inc.
4 Total return, which is the percent change in value, after deduction of the maximum initial sales charge of 2.25% applicable to Class A shares, with all dividends and distributions reinvested for period shown ended September 30, 2009, is calculated using the SEC required uniform method to compute such return. Class A shares commenced operations on December 12, 2008. Performance for the class began December 31, 2008.
5 Class C shares commenced operations on December 12, 2008. The 1% CDSC for Class C shares normally applies before the first anniversary of the purchase date. Performance for the class began December 31, 2008. Performance is at net asset value.
6 Class F shares commenced operations on December 12, 2008. Performance for the class began December 31, 2008. Performance is at net asset value.
7 Class I shares commenced operations on December 12, 2008. Performance for the class began December 31, 2008. Performance is at net asset value.
* Because Class A, C, F and I shares have existed for less than one year, average annual returns are not provided.
21
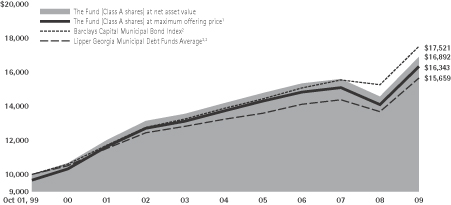
Georgia Tax Free Trust
Investment Comparison
Below is a comparison of a $10,000 investment in Class A shares to the same investment in the Barclays Capital Municipal Bond Index and the Lipper Georgia Municipal Debt Funds Average, assuming reinvestment of all dividends and distributions. The performance of the other class will be greater than or less than the performance shown in the graph below due to different sales loads and expenses applicable to such class. The graph and performance table below do not reflect the deduction of taxes that a shareholder would pay on Fund distributions or the redemption of Fund shares. Past performance is no guarantee of future results.
Average Annual Total Returns at Maximum Applicable
Sales Charge for the Periods Ended September 30, 2009
| | | | | | | | |
| | | 1 Year | | 5 Years | | 10 Years | | Life of Class |
Class A4 | | 12.04% | | 2.88% | | 5.03% | | – |
Class F5 | | 16.47% | | – | | – | | 4.33% |
Standardized Yield for the Year Ended September 30, 2009
| | | | | | |
| | | Class A | | Class F | | |
| | | 4.20% | | 4.30% | | |
1 Reflects the deduction of the maximum initial sales charge of 3.25%.
2 Performance for the average or the unmanaged index does not reflect any fees or expenses. The performance of the average or the index is not necessarily representative of the Fund’s performance. The Index is composed of municipal bonds from many states while the Fund is a single-state municipal bond portfolio.
3 Source: Lipper Inc.
4 Total return, which is the percent change in value, after deduction of the maximum initial sales charge of 3.25% applicable to Class A shares, with all dividends and distributions reinvested for periods shown ended September 30, 2009, is calculated using the SEC required uniform method to compute such return.
5 Class F shares commenced operations and performance for the class began on September 28, 2007. Performance is at net asset value.
22
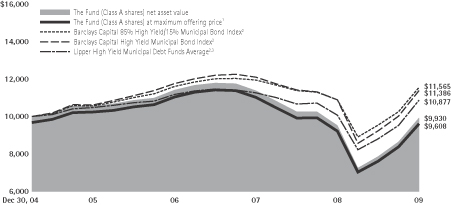
High Yield Municipal Bond Fund
Investment Comparison
Below is a comparison of a $10,000 investment in Class A shares to the same investment in the Barclays Capital 85% High Yield/15% Municipal Bond Index, the Barclays Capital High Yield Municipal Bond Index, and the Lipper High Yield Municipal Debt Funds Average, assuming reinvestment of all dividends and distributions. The performance of other classes will be greater than or less than the performance shown in the graph below due to different sales loads and expenses applicable to such classes. The graph and performance table below do not reflect the deduction of taxes that a shareholder would pay on Fund distributions or the redemption of Fund shares. Past performance is no guarantee of future results.
Average Annual Total Returns at Maximum Applicable
Sales Charge for the Periods Ended September 30, 2009
| | | | |
| | | 1 Year | | Life of Class |
Class A4 | | 0.75% | | -0.84% |
Class B5 | | -0.40% | | -0.88% |
Class C6 | | 3.57% | | -0.55% |
Class F7 | | 4.25% | | -6.51% |
Class P8 | | 3.87% | | -0.20% |
Standardized Yield for the Year Ended September 30, 2009
| | | | | | | | |
| Class A | | Class B | | Class C | | Class F | | Class P |
| 6.18% | | 5.41% | | 5.49% | | 6.27% | | 5.94% |
1 Reflects the deduction of the maximum initial sales charge of 3.25%.
2 Performance for the average or the unmanaged indexes does not reflect any fees or expenses. The performance of the average or the indexes is not necessarily representative of the Fund’s performance. Indexes and average are calculated from December 31, 2004 to September 30, 2009.
3 Source: Lipper Inc.
4 Total return, which is the percent change in value, after deduction of the maximum initial sales charge of 3.25% applicable to Class A shares, with all dividends and distributions reinvested for periods shown ended September 30, 2009, is calculated using SEC required uniform method to compute such return. The Class A inception date is December 30, 2004.
5 Class B shares were first offered on December 30, 2004. Performance reflects the deduction of a CDSC of 4% for 1 year and 2% for the life of the Class.
6 Class C shares were first offered on December 30, 2004. The 1% CDSC for Class C shares normally applies before the first anniversary of the purchase date. Performance is at net asset value.
7 Class F shares commenced operations and performance for the class began on September 28, 2007. Performance is at net asset value.
8 Class P shares were first offered on December 30, 2004. Performance is at net asset value.
23
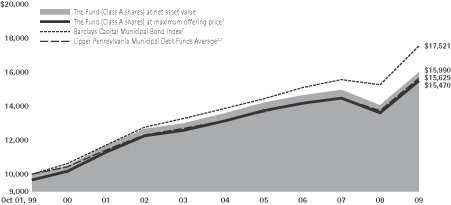
Pennsylvania Tax Free Trust
Investment Comparison
Below is a comparison of a $10,000 investment in Class A shares to the same investment in the Barclays Capital Municipal Bond Index and the Lipper Pennsylvania Municipal Debt Funds Average, assuming reinvestment of all dividends and distributions. The performance of the other class will be greater than or less than the performance shown in the graph below due to different sales loads and expenses applicable to such class. The graph and performance table below do not reflect the deduction of taxes that a shareholder would pay on Fund distributions or the redemption of Fund shares. Past performance is no guarantee of future results.
Average Annual Total Returns at Maximum Applicable
Sales Charge for the Periods Ended September 30, 2009
| | | | | | | | |
| | | 1 Year | | 5 Years | | 10 Years | | Life of Class |
Class A4 | | 9.88% | | 2.63% | | 4.47% | | – |
Class F5 | | 13.83% | | – | | – | | 3.54% |
Standardized Yield for the Year Ended September 30, 2009
| | | | | | |
| | | Class A | | Class F | | |
| | | 4.34% | | 4.43% | | |
1 Reflects the deduction of the maximum initial sales charge of 3.25%.
2 Performance for the average or the unmanaged index does not reflect any fees or expenses. The performance of the average or the index is not necessarily representative of the Fund’s performance. The Index is composed of municipal bonds from many states while the Fund is a single-state municipal bond portfolio.
3 Source: Lipper Inc.
4 Total return, which is the percent change in value, after deduction of the maximum initial sales charge of 3.25% applicable to Class A shares, with all dividends and distributions reinvested for periods shown ended September 30, 2009, is calculated using the SEC required uniform method to compute such return.
5 Class F shares commenced operations and performance for the class began on September 28, 2007. Performance is at net asset value.
24
Expense Example
As a shareholder of a Fund, you incur two types of costs: (1) transaction costs, including sales charges (loads) on purchase payments (these charges vary among the share classes); and (2) ongoing costs, including management fees; distribution and service (12b-1) fees (these charges vary among the share classes; also, certain Funds do not yet have effective a Rule 12b-1 plan under which distribution and service fees are paid); and other Fund expenses. This Example is intended to help you understand your ongoing costs (in dollars) of investing in each Fund and to compare these costs with the ongoing costs of investing in other mutual funds.
The Example is based on an investment of $1,000 invested at the beginning of the period and held for the entire period (April 1, 2009 through September 30, 2009).
Actual Expenses
For each class of each Fund, the first line of the applicable table on the following pages provides information about actual account values and actual expenses. You may use the information in this line, together with the amount you invested, to estimate the expenses that you paid over the period. Simply divide your account value by $1,000 (for example, an $8,600 account value divided by $1,000 = 8.6), then multiply the result by the number in the first line under the heading titled “Expenses Paid During the Period 4/1/09 – 9/30/09” to estimate the expenses you paid on your account during this period.
Hypothetical Example for Comparison Purposes
For each class of each Fund, the second line of the applicable table on the following pages provides information about hypothetical account values and hypothetical expenses based on the Fund’s actual expense ratio and an assumed rate of return of 5% per year before expenses, which is not the Fund’s actual return. The hypothetical account values and expenses may not be used to estimate the actual ending account balance or expenses you paid for the period. You may use this information to compare the ongoing costs of investing in each Fund and other funds. To do so, compare this 5% hypothetical example with the 5% hypothetical examples that appear in the shareholder reports of the other funds.
25
National Tax Free Fund
| | | | | | | | | |
| | | Beginning
Account
Value | | Ending
Account
Value | | Expenses
Paid During
Period† |
| | | 4/1/09 | | 9/30/09 | | 4/1/09 -
9/30/09 |
Class A | | | | | | | | | |
Actual | | $ | 1,000.00 | | $ | 1,175.30 | | $ | 4.69 |
Hypothetical (5% Return Before Expenses) | | $ | 1,000.00 | | $ | 1,020.74 | | $ | 4.36 |
Class B | | | | | | | | | |
Actual | | $ | 1,000.00 | | $ | 1,171.10 | | $ | 9.03 |
Hypothetical (5% Return Before Expenses) | | $ | 1,000.00 | | $ | 1,016.76 | | $ | 8.39 |
Class C | | | | | | | | | |
Actual | | $ | 1,000.00 | | $ | 1,170.70 | | $ | 8.60 |
Hypothetical (5% Return Before Expenses) | | $ | 1,000.00 | | $ | 1,017.13 | | $ | 7.99 |
Class F | | | | | | | | | |
Actual | | $ | 1,000.00 | | $ | 1,175.00 | | $ | 4.36 |
Hypothetical (5% Return Before Expenses) | | $ | 1,000.00 | | $ | 1,021.06 | | $ | 4.05 |
| † | | For each class of the Fund, net expenses (including interest expense) are equal to the annualized expense ratio for such class (0.86% for Class A, 1.66% for Class B, 1.58% for Class C and 0.80% for Class F) multiplied by the average account value over the period, multiplied by 183/365 (to reflect one-half year period). |
Portfolio Holdings Presented by Credit Rating
September 30, 2009
| | | | | | | | |
| Credit Rating: | | | | | | Credit Rating: | | |
| S&P or Moody’s(a) | | %* | | | | S&P or Moody’s(a) | | %* |
AAA | | 19.24% | | | | BB | | 1.60% |
AA+ | | 5.74% | | | | BB- | | 0.44% |
AA | | 8.03% | | | | B+ | | 0.13% |
AA- | | 6.86% | | | | B | | 0.12% |
A+ | | 5.77% | | | | B- | | 0.88% |
A | | 13.04% | | | | CCC+ | | 0.40% |
A- | | 6.62% | | | | CCC | | 0.60% |
BBB+ | | 5.21% | | | | NR | | 9.29% |
BBB | | 10.87% | | | | Short-Term Investments | | 0.48% |
BBB- | | 2.79% | | | | Total | | 100.00% |
BB+ | | 1.89% | | | | | | |
| (a) | | Certain investments have been rated by Fitch IBCA. |
| * | | Represents percent of total investments. |
26
California Tax Free Fund
| | | | | | | | | |
| | | Beginning
Account
Value | | Ending
Account
Value | | Expenses
Paid During
Period† |
| | | 4/1/09 | | 9/30/09 | | 4/1/09 -
9/30/09 |
Class A | | | | | | | | | |
Actual | | $ | 1,000.00 | | $ | 1,154.50 | | $ | 4.43 |
Hypothetical (5% Return Before Expenses) | | $ | 1,000.00 | | $ | 1,020.95 | | $ | 4.15 |
Class C | | | | | | | | | |
Actual | | $ | 1,000.00 | | $ | 1,148.80 | | $ | 8.56 |
Hypothetical (5% Return Before Expenses) | | $ | 1,000.00 | | $ | 1,017.11 | | $ | 8.04 |
Class F | | | | | | | | | |
Actual | | $ | 1,000.00 | | $ | 1,153.90 | | $ | 4.21 |
Hypothetical (5% Return Before Expenses) | | $ | 1,000.00 | | $ | 1,021.17 | | $ | 3.95 |
| † | | For each class of the Fund, net expenses (including interest expense) are equal to the annualized expense ratio for such class (0.82% for Class A, 1.59% for Class C and 0.78% for Class F) multiplied by the average account value over the period, multiplied by 183/365 (to reflect one-half year period). |
Portfolio Holdings Presented by Credit Rating
September 30, 2009
| | | | | | | | |
| Credit Rating: | | | | | | Credit Rating: | | |
| S&P or Moody’s(a) | | %* | | | | S&P or Moody’s(a) | | %* |
AAA | | 17.41% | | | | BBB | | 10.01% |
AA+ | | 2.72% | | | | BBB- | | 3.03% |
AA | | 7.32% | | | | BB+ | | 1.65% |
AA- | | 7.94% | | | | B+ | | 0.21% |
A+ | | 6.01% | | | | NR | | 6.93% |
A | | 26.97% | | | | Short-Term Investments | | 0.25% |
A- | | 6.00% | | | | Total | | 100.00% |
BBB+ | | 3.55% | | | | | | |
| (a) | | Certain investments have been rated by Fitch IBCA. |
| * | | Represents percent of total investments. |
27
Connecticut Tax Free Fund
| | | | | | | | | |
| | | Beginning
Account
Value | | Ending
Account
Value | | Expenses
Paid During
Period† |
| | | 4/1/09 | | 9/30/09 | | 4/1/09 -
9/30/09 |
Class A | | | | | | | | | |
Actual | | $ | 1,000.00 | | $ | 1,129.80 | | $ | 4.65 |
Hypothetical (5% Return Before Expenses) | | $ | 1,000.00 | | $ | 1,020.68 | | $ | 4.41 |
Class F | | | | | | | | | |
Actual | | $ | 1,000.00 | | $ | 1,130.80 | | $ | 4.27 |
Hypothetical (5% Return Before Expenses) | | $ | 1,000.00 | | $ | 1,021.08 | | $ | 4.05 |
| † | | For each class of the Fund, net expenses (including interest expense) are equal to the annualized expense ratio for such class (0.87% for Class A and 0.80% for Class F) multiplied by the average account value over the period, multiplied by 183/365 (to reflect one-half year period). |
Portfolio Holdings Presented by Credit Rating
September 30, 2009
| | | | | | | | | |
| Credit Rating: | | | | | | Credit Rating: | | | |
| S&P or Moody’s | | %* | | | | S&P or Moody’s | | %* | |
AAA | | 24.12% | | | | Baa1 | | 3.24% | |
AA+ | | 0.83% | | | | BBB | | 2.89% | |
AA | | 13.82% | �� | | | BBB- | | 7.59% | |
AA- | | 5.65% | | | | B+ | | 0.21% | |
A+ | | 7.02% | | | | NR | | 9.71% | |
A | | 14.38% | | | | Short-Term Investment | | 0.00% | ** |
A- | | 10.54% | | | | Total | | 100.00% | |
| * | | Represents percent of total investments. |
| ** | | Amount is less than .01%. |
28
Hawaii Tax Free Fund
| | | | | | | | | |
| | | Beginning
Account
Value | | Ending
Account
Value | | Expenses
Paid During
Period† |
| | | 4/1/09 | | 9/30/09 | | 4/1/09 -
9/30/09 |
Class A | | | | | | | | | |
Actual | | $ | 1,000.00 | | $ | 1,102.30 | | $ | 4.59 |
Hypothetical (5% Return Before Expenses) | | $ | 1,000.00 | | $ | 1,020.71 | | $ | 4.41 |
Class F | | | | | | | | | |
Actual | | $ | 1,000.00 | | $ | 1,103.00 | | $ | 4.22 |
Hypothetical (5% Return Before Expenses) | | $ | 1,000.00 | | $ | 1,021.06 | | $ | 4.05 |
| † | | For each class of the Fund, net expenses (including interest expense) are equal to the annualized expense ratio for such class (0.87% for Class A and 0.80% for Class F) multiplied by the average account value over the period, multiplied by 183/365 (to reflect one-half year period). |
Portfolio Holdings Presented by Credit Rating
September 30, 2009
| | | | | | | | |
| Credit Rating: | | | | | | Credit Rating: | | |
| S&P or Moody’s | | %* | | | | S&P or Moody’s | | %* |
AAA | | 33.75% | | | | BBB+ | | 5.28% |
AA+ | | 0.90% | | | | BBB | | 2.60% |
AA | | 20.55% | | | | BBB- | | 5.91% |
AA- | | 20.28% | | | | B+ | | 0.20% |
A+ | | 2.09% | | | | B | | 0.68% |
A | | 4.78% | | | | NR | | 2.21% |
A3 | | 0.77% | | | | Total | | 100.00% |
| * | | Represents percent of total investments. |
29
Missouri Tax Free Fund
| | | | | | | | | |
| | | Beginning
Account
Value | | Ending
Account
Value | | Expenses
Paid During
Period† |
| | | 4/1/09 | | 9/30/09 | | 4/1/09 -
9/30/09 |
Class A | | | | | | | | | |
Actual | | $ | 1,000.00 | | $ | 1,125.00 | | $ | 4.26 |
Hypothetical (5% Return Before Expenses) | | $ | 1,000.00 | | $ | 1,021.04 | | $ | 4.05 |
Class F | | | | | | | | | |
Actual | | $ | 1,000.00 | | $ | 1,125.60 | | $ | 3.73 |
Hypothetical (5% Return Before Expenses) | | $ | 1,000.00 | | $ | 1,021.54 | | $ | 3.55 |
| † | | For each class of the Fund, net expenses are equal to the annualized expense ratio for such class (0.80% for Class A and 0.70% for Class F) multiplied by the average account value over the period, multiplied by 183/365 (to reflect one-half year period). |
Portfolio Holdings Presented by Credit Rating
September 30, 2009
| | | | | | | | |
| Credit Rating: | | | | | | Credit Rating: | | |
| S&P or Moody’s(a) | | %* | | | | S&P or Moody’s(a) | | %* |
AAA | | 24.92% | | | | BBB+ | | 5.56% |
AA+ | | 7.83% | | | | BBB | | 3.17% |
AA | | 8.47% | | | | BBB- | | 3.85% |
AA- | | 11.81% | | | | B+ | | 0.20% |
A+ | | 2.81% | | | | NR | | 10.46% |
A | | 8.75% | | | | Total | | 100.00% |
A- | | 12.17% | | | | | | |
| (a) | | Certain investments have been rated by Fitch IBCA. |
| * | | Represents percent of total investments. |
30
New Jersey Tax Free Fund
| | | | | | | | | |
| | | Beginning
Account
Value | | Ending
Account
Value | | Expenses
Paid During
Period† |
| | | 4/1/09 | | 9/30/09 | | 4/1/09 -
9/30/09 |
Class A | | | | | | | | | |
Actual | | $ | 1,000.00 | | $ | 1,157.80 | | $ | 4.33 |
Hypothetical (5% Return Before Expenses) | | $ | 1,000.00 | | $ | 1,021.04 | | $ | 4.05 |
Class F | | | | | | | | | |
Actual | | $ | 1,000.00 | | $ | 1,158.50 | | $ | 3.79 |
Hypothetical (5% Return Before Expenses) | | $ | 1,000.00 | | $ | 1,021.54 | | $ | 3.55 |
| † | | For each class of the Fund, net expenses are equal to the annualized expense ratio for such class (0.80% for Class A and 0.70% for Class F) multiplied by the average account value over the period, multiplied by 183/365 (to reflect one-half year period). |
Portfolio Holdings Presented by Credit Rating
September 30, 2009
| | | | | | | | |
| Credit Rating: | | | | | | Credit Rating: | | |
| S&P or Moody’s(a) | | %* | | | | S&P or Moody’s(a) | | %* |
AAA | | 15.45% | | | | BBB- | | 6.54% |
AA+ | | 4.54% | | | | BB- | | 2.15% |
AA | | 6.22% | | | | B+ | | 0.12% |
AA- | | 19.71% | | | | B | | 0.71% |
A+ | | 7.15% | | | | B3 | | 0.17% |
A | | 11.79% | | | | NR | | 8.88% |
A- | | 4.66% | | | | Short-Term Investment | | 0.32% |
BBB+ | | 5.00% | | | | Total | | 100.00% |
BBB | | 6.59% | | | | | | |
| (a) | | Certain investments have been rated by Fitch IBCA. |
| * | | Represents percent of total investments. |
31
New York Tax Free Fund
| | | | | | | | | |
| | | Beginning
Account
Value | | Ending
Account
Value | | Expenses
Paid During
Period† |
| | | 4/1/09 | | 9/30/09 | | 4/1/09 -
9/30/09 |
Class A | | | | | | | | | |
Actual | | $ | 1,000.00 | | $ | 1,157.50 | | $ | 4.54 |
Hypothetical (5% Return Before Expenses) | | $ | 1,000.00 | | $ | 1,020.86 | | $ | 4.26 |
Class C | | | | | | | | | |
Actual | | $ | 1,000.00 | | $ | 1,153.40 | | $ | 8.42 |
Hypothetical (5% Return Before Expenses) | | $ | 1,000.00 | | $ | 1,017.23 | | $ | 7.89 |
Class F | | | | | | | | | |
Actual | | $ | 1,000.00 | | $ | 1,157.00 | | $ | 4.11 |
Hypothetical (5% Return Before Expenses) | | $ | 1,000.00 | | $ | 1,021.23 | | $ | 3.85 |
| † | | For each class of the Fund, net expenses (including interest expense) are equal to the annualized expense ratio for such class (0.84% for Class A, 1.56% for Class C and 0.76% for Class F) multiplied by the average account value over the period, multiplied by 183/365 (to reflect one-half year period). |
Portfolio Holdings Presented by Credit Rating
September 30, 2009
| | | | | | | | |
| Credit Rating: | | | | | | Credit Rating: | | |
| S&P or Moody’s(a) | | %* | | | | S&P or Moody’s(a) | | %* |
AAA | | 13.08% | | | | BBB- | | 5.27% |
AA+ | | 11.49% | | | | BB+ | | 2.68% |
AA | | 15.16% | | | | BB | | 1.14% |
AA- | | 17.67% | | | | B+ | | 0.11% |
A+ | | 12.89% | | | | B- | | 0.78% |
A | | 4.83% | | | | CCC+ | | 0.71% |
A- | | 2.96% | | | | NR | | 4.66% |
BBB+ | | 1.31% | | | | Short-Term Investment | | 0.22% |
BBB | | 5.04% | | | | Total | | 100.00% |
| (a) | | Certain investments have been rated by Fitch IBCA. |
| * | | Represents percent of total investments. |
32
Intermediate Tax Free Fund
| | | | | | | | | |
| | | Beginning
Account
Value | | Ending
Account
Value | | Expenses
Paid During
Period† |
| | | 4/1/09 | | 9/30/09 | | 4/1/09 -
9/30/09 |
Class A | | | | | | | | | |
Actual | | $ | 1,000.00 | | $ | 1,084.60 | | $ | 2.61 |
Hypothetical (5% Return Before Expenses) | | $ | 1,000.00 | | $ | 1,022.54 | | $ | 2.54 |
Class B | | | | | | | | | |
Actual | | $ | 1,000.00 | | $ | 1,080.30 | | $ | 6.78 |
Hypothetical (5% Return Before Expenses) | | $ | 1,000.00 | | $ | 1,018.54 | | $ | 6.58 |
Class C | | | | | | | | | |
Actual | | $ | 1,000.00 | | $ | 1,082.60 | | $ | 5.69 |
Hypothetical (5% Return Before Expenses) | | $ | 1,000.00 | | $ | 1,019.58 | | $ | 5.52 |
Class F | | | | | | | | | |
Actual | | $ | 1,000.00 | | $ | 1,086.40 | | $ | 1.99 |
Hypothetical (5% Return Before Expenses) | | $ | 1,000.00 | | $ | 1,023.14 | | $ | 1.93 |
Class P | | | | | | | | | |
Actual | | $ | 1,000.00 | | $ | 1,083.20 | | $ | 3.92 |
Hypothetical (5% Return Before Expenses) | | $ | 1,000.00 | | $ | 1,021.33 | | $ | 3.80 |
| † | | For each class of the Fund, net expenses (including interest expense) are equal to the annualized expense ratio for such class (0.50% for Class A, 1.30% for Class B, 1.09% for Class C, 0.38% for Class F and 0.75% for Class P) multiplied by the average account value over the period, a multiplied by 183/365 (to reflect one-half year period). |
Portfolio Holdings Presented by Credit Rating
September 30, 2009
| | | | | | | | |
| Credit Rating: | | | | | | Credit Rating: | | |
| S&P or Moody’s(a) | | %* | | | | S&P or Moody’s(a) | | %* |
AAA | | 23.14% | | | | BB+ | | 0.95% |
AA+ | | 9.51% | | | | BB | | 0.61% |
AA | | 9.51% | | | | Ba3 | | 0.26% |
AA- | | 17.15% | | | | B+ | | 0.19% |
A+ | | 8.96% | | | | B | | 0.27% |
A | | 9.03% | | | | B- | | 0.22% |
A- | | 4.12% | | | | CCC | | 0.29% |
BBB+ | | 3.78% | | | | NR | | 2.41% |
BBB | | 7.37% | | | | Short-Term Investment | | 0.50% |
BBB- | | 1.73% | | | | Total | | 100.00% |
| (a) | | Certain investments have been rated by Fitch IBCA. |
| * | | Represents percent of total investments. |
33
Short Duration Tax Free Fund
| | | | | | | | | |
| | | Beginning
Account
Value | | Ending
Account
Value | | Expenses
Paid During
Period† |
| | | 4/1/09 | | 9/30/09 | | 4/1/09 -
9/30/09 |
Class A | | | | | | | | | |
Actual | | $ | 1,000.00 | | $ | 1,032.70 | | $ | 2.24 |
Hypothetical (5% Return Before Expenses) | | $ | 1,000.00 | | $ | 1,022.85 | | $ | 2.23 |
Class C | | | | | | | | | |
Actual | | $ | 1,000.00 | | $ | 1,028.40 | | $ | 6.25 |
Hypothetical (5% Return Before Expenses) | | $ | 1,000.00 | | $ | 1,018.90 | | $ | 6.23 |
Class F | | | | | | | | | |
Actual | | $ | 1,000.00 | | $ | 1,033.30 | | $ | 1.73 |
Hypothetical (5% Return Before Expenses) | | $ | 1,000.00 | | $ | 1,023.34 | | $ | 1.72 |
Class I | | | | | | | | | |
Actual | | $ | 1,000.00 | | $ | 1,034.10 | | $ | 1.27 |
Hypothetical (5% Return Before Expenses) | | $ | 1,000.00 | | $ | 1,023.84 | | $ | 1.27 |
| † | | For each class of the Fund, net expenses are equal to the annualized expense ratio for such class (0.44% for Class A, 1.23% for Class C, 0.34% for Class F and 0.25% for Class I) multiplied by the average account value over the period, multiplied by 183/365 (to reflect one-half year period). |
Portfolio Holdings Presented by Credit Rating
September 30, 2009
| | | | | | | | |
| Credit Rating: | | | | | | Credit Rating: | | |
| S&P or Moody’s(a) | | %* | | | | S&P or Moody’s(a) | | %* |
AAA | | 8.30% | | | | BBB | | 4.44% |
AA+ | | 4.79% | | | | BBB- | | 1.18% |
AA | | 7.91% | | | | BB+ | | 0.85% |
AA- | | 16.93% | | | | Ba3 | | 1.82% |
A+ | | 11.50% | | | | NR | | 4.01% |
A | | 11.92% | | | | Short-Term Investments | | 2.05% |
A- | | 8.59% | | | | Total | | 100.00% |
BBB+ | | 15.71% | | | | | | |
| (a) | | Certain investments have been rated by Fitch IBCA. |
| * | | Represents percent of total investments. |
34
Georgia Tax Free Trust
| | | | | | | | | |
| | | Beginning
Account
Value | | Ending
Account
Value | | Expenses
Paid During
Period† |
| | | 4/1/09 | | 9/30/09 | | 4/1/09 -
9/30/09 |
Class A | | | | | | | | | |
Actual | | $ | 1,000.00 | | $ | 1,138.90 | | $ | 4.83 |
Hypothetical (5% Return Before Expenses) | | $ | 1,000.00 | | $ | 1,020.55 | | $ | 4.56 |
Class F | | | | | | | | | |
Actual | | $ | 1,000.00 | | $ | 1,139.10 | | $ | 4.50 |
Hypothetical (5% Return Before Expenses) | | $ | 1,000.00 | | $ | 1,020.87 | | $ | 4.26 |
| † | | For each class of the Fund, net expenses (including interest expense) are equal to the annualized expense ratio for such class (0.90% for Class A and 0.84% for Class F) multiplied by the average account value over the period, multiplied by 183/365 (to reflect one-half year period). |
Portfolio Holdings Presented by Credit Rating
September 30, 2009
| | | | | | | | |
| Credit Rating: | | | | | | Credit Rating: | | |
| S&P or Moody’s | | %* | | | | S&P or Moody’s | | %* |
AAA | | 24.01% | | | | BBB | | 6.24% |
AA+ | | 2.53% | | | | BBB- | | 3.88% |
AA | | 16.02% | | | | Ba3 | | 1.40% |
AA- | | 4.04% | | | | B+ | | 0.19% |
A+ | | 10.03% | | | | NR | | 6.47% |
A | | 16.61% | | | | Short-Term Investment | | 0.19% |
A3 | | 8.01% | | | | Total | | 100.00% |
Baa1 | | 0.38% | | | | | | |
| * | | Represents percent of total investments. |
35
High Yield Municipal Bond Fund
| | | | | | | | | |
| | | Beginning
Account
Value | | Ending
Account
Value | | Expenses
Paid During
Period† |
| | | 4/1/09 | | 9/30/09 | | 4/1/09 -
9/30/09 |
Class A | | | | | | | | | |
Actual | | $ | 1,000.00 | | $ | 1,262.60 | | $ | 5.39 |
Hypothetical (5% Return Before Expenses) | | $ | 1,000.00 | | $ | 1,020.33 | | $ | 4.81 |
Class B | | | | | | | | | |
Actual | | $ | 1,000.00 | | $ | 1,257.60 | | $ | 9.79 |
Hypothetical (5% Return Before Expenses) | | $ | 1,000.00 | | $ | 1,016.40 | | $ | 8.74 |
Class C | | | | | | | | | |
Actual | | $ | 1,000.00 | | $ | 1,258.80 | | $ | 9.12 |
Hypothetical (5% Return Before Expenses) | | $ | 1,000.00 | | $ | 1,017.01 | | $ | 8.14 |
Class F | | | | | | | | | |
Actual | | $ | 1,000.00 | | $ | 1,262.90 | | $ | 5.11 |
Hypothetical (5% Return Before Expenses) | | $ | 1,000.00 | | $ | 1,020.56 | | $ | 4.56 |
Class P | | | | | | | | | |
Actual | | $ | 1,000.00 | | $ | 1,260.90 | | $ | 6.63 |
Hypothetical (5% Return Before Expenses) | | $ | 1,000.00 | | $ | 1,019.18 | | $ | 5.92 |
| † | | For each class of the Fund, net expenses (including interest expense) are equal to the annualized expense ratio for such class (0.95% for Class A, 1.73% for Class B, 1.61% for Class C, 0.90% for Class F and 1.17% for Class P) multiplied by the average account value over the period, multiplied by 183/365 (to reflect one-half year period). |
Portfolio Holdings Presented by Credit Rating
September 30, 2009
| | | | | | | | |
| Credit Rating: | | | | | | Credit Rating: | | |
| S&P or Moody’s(a) | | %* | | | | S&P or Moody’s(a) | | %* |
AAA | | 4.15% | | | | BB | | 2.97% |
AA+ | | 3.29% | | | | BB- | | 1.47% |
AA | | 9.01% | | | | B+ | | 1.25% |
AA- | | 7.03% | | | | B | | 1.20% |
A+ | | 1.82% | | | | B- | | 2.46% |
A | | 7.87% | | | | CCC+ | | 1.65% |
A- | | 2.48% | | | | CCC | | 1.62% |
BBB+ | | 5.21% | | | | D | | 0.12% |
BBB | | 12.12% | | | | NR | | 25.64% |
BBB- | | 5.55% | | | | Short-Term Investments | | 0.38% |
BB+ | | 2.71% | | | | Total | | 100.00% |
| (a) | | Certain investments have been rated by Fitch IBCA. |
| * | | Represents percent of total investments. |
36
Pennsylvania Tax Free Trust
| | | | | | | | | |
| | | Beginning
Account
Value | | Ending
Account
Value | | Expenses
Paid During
Period† |
| | | 4/1/09 | | 9/30/09 | | 4/1/09 -
9/30/09 |
Class A | | | | | | | | | |
Actual | | $ | 1,000.00 | | $ | 1,119.00 | | $ | 4.46 |
Hypothetical (5% Return Before Expenses) | | $ | 1,000.00 | | $ | 1,020.86 | | $ | 4.26 |
Class F | | | | | | | | | |
Actual | | $ | 1,000.00 | | $ | 1,122.30 | | $ | 4.20 |
Hypothetical (5% Return Before Expenses) | | $ | 1,000.00 | | $ | 1,021.09 | | $ | 4.00 |
| † | | For each class of the Fund, net expenses are equal to the annualized expense ratio for such class (0.84% for Class A and 0.79% for Class F) multiplied by the average account value over the period, multiplied by 183/365 (to reflect one-half year period). |
Portfolio Holdings Presented by Credit Rating
September 30, 2009
| | | | | | | | | |
| Credit Rating: | | | | | | Credit Rating: | | | |
| S&P or Moody’s(a) | | %* | | | | S&P or Moody’s(a) | | %* | |
AAA | | 13.82% | | | | BBB | | 5.51% | |
AA+ | | 5.78% | | | | BBB- | | 14.35% | |
AA | | 3.86% | | | | BB | | 0.87% | |
AA- | | 15.67% | | | | B+ | | 1.08% | |
A+ | | 4.31% | | | | NR | | 7.41% | |
A | | 19.12% | | | | Short-Term Investment | | 0.00% | ** |
A- | | 3.33% | | | | Total | | 100.00% | |
BBB+ | | 4.89% | | | | | | | |
| (a) | | Certain investments have been rated by Fitch IBCA. |
| * | | Represents percent of total investments. |
| ** | | Amount is less than .01%. |
37
Schedule of Investments
NATIONAL TAX FREE FUND September 30, 2009
| | | | | | | | | | | | | |
| Investments | | Interest
Rate | | Maturity
Date | | Credit
Rating:
S&P or
Moody’s(a) | | | Principal
Amount
(000) | | Value |
| MUNICIPAL BONDS 106.73% | | | | | | | | | | | | | |
| | | | | |
| Corporate-Backed 6.86% | | | | | | | | | | | | | |
| Allegheny Cnty PA Indl Dev Auth Envr Impt | | 5.50% | | 11/1/2016 | | BB | | | $ | 2,500 | | $ | 2,411,950 |
| Allegheny Cnty PA Indl Dev Auth Resdl Res Inc Pj | | 5.10% | | 9/1/2026 | | BBB- | (c) | | | 980 | | | 837,753 |
| Alliance Arpt Auth Inc TX Spl Facs Amer Airlines Inc Pj AMT | | 5.25% | | 12/1/2029 | | CCC+ | | | | 4,500 | | | 2,957,670 |
| Bayonne NJ Redev Agy Royal Caribbean Pj Ser A AMT | | 5.375% | | 11/1/2035 | | BB- | | | | 750 | | | 424,620 |
| Cass Cnty TX Indl Dev Corp Intl Paper Co Pj Ser A AMT | | 6.00% | | 9/1/2025 | | BBB | | | | 1,000 | | | 989,740 |
| Clark Cnty NV Indl Dev Rev S W Gas Corp Ser C AMT (AMBAC) | | 5.95% | | 12/1/2038 | | A | | | | 3,320 | | | 3,328,068 |
| CT St Res Recovery Auth Rev Amer Fuel Co Pj Ser A AMT | | 6.45% | | 11/15/2022 | | BB+ | | | | 3,000 | | | 3,000,090 |
| Dallas-Fort Worth TX Intl Arpt Facs Impt Corp Amer Airlines Inc AMT | | 5.50% | | 11/1/2030 | | CCC+ | | | | 2,300 | | | 1,582,791 |
| Escambia Cnty FL Envr Impt Intl Paper Co Pjs Ser A AMT | | 5.00% | | 8/1/2026 | | BBB | | | | 500 | | | 454,190 |
| Georgetown Cnty SC Envr Intl Paper Co Pj Ser A AMT | | 5.00% | | 8/1/2030 | | BBB | | | | 1,000 | | | 911,070 |
| Houston TX Arpt Sys Rev Spl Facs Continental Airlines Ser E AMT | | 6.75% | | 7/1/2021 | | B3 | | | | 3,000 | | | 3,001,050 |
| IL Fin Auth Sports Fac Leafs Hockey Club Pj Ser A | | 6.00% | | 3/1/2037 | | NR | | | | 1,550 | | | 470,673 |
| IL Fin Auth Sports Fac Utd Sports Org of Barrington Ser A† | | 6.25% | | 10/1/2037 | | NR | | | | 2,000 | | | 1,270,780 |
| LA Loc Govt Envr Facs Cmnty Dev Auth Westlake Chemical Corp Pjs | | 6.75% | | 11/1/2032 | | BB | | | | 5,000 | | | 4,936,400 |
| Lee Cnty FL Indl Dev Auth Bonita Springs Utils Pj AMT (AMBAC) | | 5.125% | | 11/1/2019 | | A+ | | | | 750 | | | 761,820 |
| Liberty NY Dev Corp Rev Goldman Sachs Headquarters | | 5.25% | | 10/1/2035 | | A1 | | | | 5 | | | 5,129 |
| Long Beach CA Bd Fin Auth Natural Gas Ser A | | 5.25% | | 11/15/2020 | | A | | | | 1,505 | | | 1,549,638 |
| Matagorda Cnty TX Nav Dist No 1 Houston Ltg Rmkt AMT (AMBAC) | | 5.125% | | 11/1/2028 | | BBB+ | | | | 2,800 | | | 2,648,352 |
| MD St Indl Dev Fing Auth Synagro Baltimore Ser A AMT | | 5.25% | | 12/1/2013 | | BBB+ | (c) | | | 750 | | | 742,515 |
See Notes to Financial Statements.
38
Schedule of Investments (continued)
NATIONAL TAX FREE FUND September 30, 2009
| | | | | | | | | | | | | |
| Investments | | Interest
Rate | | Maturity
Date | | Credit
Rating:
S&P or
Moody’s(a) | | | Principal
Amount
(000) | | Value |
| Corporate-Backed (continued) | | | | | | | | | | | | | |
| MD St Indl Dev Fing Auth Synagro Baltimore Ser A AMT | | 5.50% | | 12/1/2015 | | BBB+ | (c) | | $ | 1,000 | | $ | 976,000 |
| New York City NY Indl Dev Agy Amer Airlines JFK Intl Arpt AMT | | 8.00% | | 8/1/2028 | | B- | | | | 2,000 | | | 2,086,120 |
| New York City NY Indl Dev Agy JetBlue Airways Corp Pj AMT | | 5.00% | | 5/15/2020 | | B- | | | | 2,865 | | | 2,405,655 |
| Nez Perce Cnty ID Pollutn Ctrl Potlatch Corp Pj | | 6.00% | | 10/1/2024 | | BB | | | | 2,200 | | | 2,089,582 |
| NJ Econ Dev Auth Kapkowski Rd Landfill Pj | | 6.50% | | 4/1/2028 | | Baa3 | | | | 2,325 | | | 2,122,516 |
| NJ Econ Dev Auth Spl Fac Continental Airlines Inc Pj AMT | | 5.50% | | 4/1/2028 | | B3 | | | | 1,215 | | | 821,389 |
| NJ Econ Dev Auth Spl Fac Continental Airlines Inc Pj AMT | | 6.25% | | 9/15/2029 | | B | | | | 1,500 | | | 1,360,560 |
| Onondaga Cnty NY Indl Dev Agy Bristol-Myers Squibb Co Pj AMT | | 5.75% | | 3/1/2024 | | A+ | | | | 2,000 | | | 2,237,980 |
| Port of Corpus Christi Auth of Nueces Cnty TX Celanese Pj Ser A | | 6.45% | | 11/1/2030 | | B+ | | | | 400 | | | 402,012 |
| Richmond Cnty GA Dev Auth Intl Paper Co Pj Ser A AMT | | 5.00% | | 8/1/2030 | | BBB | | | | 1,500 | | | 1,349,280 |
| Rockdale Cnty GA Dev Auth Visy Paper Pj Ser A AMT | | 6.125% | | 1/1/2034 | | NR | | | | 1,000 | | | 818,720 |
| Sabine River Auth TX Pollutn Ctrl TXU Elec Ser C Rmkt | | 5.20% | | 5/1/2028 | | CCC | | | | 3,000 | | | 1,801,710 |
| Seminole Indian Tribe FL Spl Oblig Ser A† | | 5.75% | | 10/1/2022 | | BBB | | | | 1,000 | | | 990,080 |
| Seneca NY Nation Indians Cap Impts Auth Ser A† | | 5.00% | | 12/1/2023 | | BB | | | | 1,000 | | | 832,340 |
| Seneca NY Nation Indians Cap Impts Auth Ser A† | | 5.25% | | 12/1/2016 | | BB | | | | 500 | | | 458,470 |
| St. John Baptist Parish LA Rev Marathon Oil Corp Ser A | | 5.125% | | 6/1/2037 | | BBB+ | | | | 7,500 | | | 7,205,025 |
| Texas City TX Indl Dev Corp Arco Pipe Line Co Pj | | 7.375% | | 10/1/2020 | | Aa1 | | | | 5,500 | | | 7,069,425 |
| Tulsa OK Arpts Impt Tr Rev Ser A Rmkt | | 7.75% | | 6/1/2035 | | B- | | | | 1,400 | | | 1,359,470 |
| Virgin Islands Pub Fin Auth Sr Secd Hovensa Refinery AMT | | 4.70% | | 7/1/2022 | | BBB | | | | 2,500 | | | 2,288,275 |
| WA Tob Sttlmnt Auth Asset Bkd | | 6.50% | | 6/1/2026 | | BBB | | | | 355 | | | 359,555 |
| Warren Cnty MS Gulf Opportunity Zone Intl Paper Co A | | 4.80% | | 8/1/2030 | | BBB | | | | 2,250 | | | 2,166,660 |
| | | | | | | | | | | | | |
| Total | | | | | | | | | | | | | 73,485,123 |
| | | | | | | | | | | | | |
See Notes to Financial Statements.
39
Schedule of Investments (continued)
NATIONAL TAX FREE FUND September 30, 2009
| | | | | | | | | | | | |
| Investments | | Interest
Rate | | Maturity
Date | | Credit
Rating:
S&P or
Moody’s(a) | | Principal
Amount
(000) | | Value |
| Education 8.29% | | | | | | | | | | | | |
| CA Edl Facs Auth Rev Santa Clara Univ | | 5.00% | | 4/1/2021 | | Aa3 | | $ | 1,000 | | $ | 1,112,440 |
| CA Edl Facs Auth Rev Univ La Verne Ser A | | 5.00% | | 6/1/2035 | | Baa2 | | | 1,000 | | | 841,160 |
| CA Muni Fin Auth Rev Biola Univ | | 5.80% | | 10/1/2028 | | Baa1 | | | 1,000 | | | 1,031,060 |
| CA Statewide Cmntys Dev Auth CHF Irvine LLC UCI East Campus | | 6.00% | | 5/15/2023 | | Baa2 | | | 5,000 | | | 5,313,700 |
| CA Statewide Cmntys Dev Auth Sonoma Country Day Sch COP | | 6.00% | | 1/1/2029 | | NR | | | 2,715 | | | 2,098,152 |
| CA Statewide Cmntys Dev Auth Thomas Jefferson Sch Law Ser A | | 7.25% | | 10/1/2032 | | BB+ | | | 2,500 | | | 2,547,825 |
| CO Edl & Cultural Facs Auth Indpt Sch Vail Christian High Sch† | | 5.50% | | 6/1/2037 | | NR | | | 1,500 | | | 847,185 |
| Dist of Columbia Rev James F Oyster Elem Sch Pilot (ACA) | | 6.25% | | 11/1/2021 | | NR | | | 450 | | | 434,471 |
| FL St Brd of Governors Univ Sys | | 5.50% | | 7/1/2020 | | AA | | | 2,075 | | | 2,429,410 |
| Grand Traverse Academy MI Pub Sch Academy Ref | | 5.00% | | 11/1/2036 | | BBB- | | | 1,840 | | | 1,254,954 |
| Grand Vly MI St Univ Rev (NPFGC)(FGIC) | | 5.50% | | 2/1/2018 | | A+ | | | 1,150 | | | 1,268,002 |
| Harrisburg PA Auth Univ Rev Harrisburg Univ of Science B | | 6.00% | | 9/1/2036 | | NR | | | 3,000 | | | 2,695,050 |
| Hillsborough Cnty FL Indl Dev Auth Terrace Cmnty Middle Sch Pj Ser A | | 5.125% | | 5/15/2037 | | BBB- | | | 1,070 | | | 757,442 |
| IL Fin Auth Rev Inst Tech | | 7.125% | | 2/1/2034 | | Baa2 | | | 1,000 | | | 1,082,290 |
| IL Fin Auth Rev Northwestern Mem Hosp Ser A(b)(d) | | 5.75% | | 8/15/2030 | | AA+ | | | 2,500 | | | 2,746,750 |
| IL Fin Auth Rev Univ of Chicago Ser B | | 5.75% | | 7/1/2033 | | Aa1 | | | 4,300 | | | 4,850,099 |
| Lee Cnty FL Indl Dev Auth Lee Charter Fndtn Ser A | | 5.25% | | 6/15/2027 | | BB | | | 2,500 | | | 1,852,900 |
| Louisville & Jefferson Cnty KY Metro Govt Bellarmine Univ Ser A | | 6.00% | | 5/1/2038 | | Baa2 | | | 2,500 | | | 2,511,500 |
| MA St Dev Fin Agy Wheelock College Ser C | | 5.25% | | 10/1/2037 | | BBB | | | 5,000 | | | 4,570,050 |
| MA St Hlth & Edl Facs Auth Harvard Univ Ser A | | 5.25% | | 11/15/2020 | | AAA | | | 2,000 | | | 2,411,220 |
| Marietta GA Dev Auth Rev Univ Facs Life Univ Inc Pj | | 7.00% | | 6/15/2030 | | Ba3 | | | 3,000 | | | 2,819,220 |
| Marietta GA Dev Auth Rev Univ Facs Life Univ Inc Pj | | 7.00% | | 6/15/2039 | | Ba3 | | | 2,000 | | | 1,841,500 |
| MD St Econ Dev Corp Univ MD College Pk Pjs | | 5.50% | | 6/1/2027 | | Baa2 | | | 2,295 | | | 2,316,848 |
See Notes to Financial Statements.
40
Schedule of Investments (continued)
NATIONAL TAX FREE FUND September 30, 2009
| | | | | | | | | | | | | |
| Investments | | Interest
Rate | | Maturity
Date | | Credit
Rating:
S&P or
Moody’s(a) | | | Principal
Amount
(000) | | Value |
| Education (continued) | | | | | | | | | | | | | |
| MI Higher Ed Facs Auth Rev Ltd Oblig Creative Studies | | 5.875% | | 12/1/2028 | | Baa3 | | | $ | 2,365 | | $ | 2,059,466 |
| MI Higher Ed Facs Auth Rev Ltd Oblig Creative Studies | | 6.125% | | 12/1/2033 | | Baa3 | | | | 3,080 | | | 2,696,725 |
| MI Pub Edl Facs Auth Rev Ltd Oblig Bradford Academy Pj | | 8.75% | | 9/1/2039 | | BBB- | | | | 2,250 | | | 2,384,190 |
| Miami-Dade Cnty FL Edl Facs Auth Univ of Miami Ser A | | 5.25% | | 4/1/2021 | | A2 | | | | 1,500 | | | 1,600,920 |
| Moorhead MN Edl Facs Rev Concordia College Corp Pj Ser A | | 5.00% | | 12/15/2022 | | A3 | | | | 1,125 | | | 1,193,726 |
| NC Cap Facs Fin Agy Meredith College | | 6.00% | | 6/1/2031 | | BBB | | | | 1,975 | | | 2,057,298 |
| NC Cap Facs Fin Agy Wake Forest Univ(b) | | 5.00% | | 1/1/2038 | | AA | | | | 10,540 | | | 11,357,640 |
| NY St Dorm Auth Rev Non St Supp Debt Fordham Univ Ser B (AG) | | 5.00% | | 7/1/2026 | | AAA | | | | 3,185 | | | 3,484,103 |
| NY St Dorm Auth Rev Non St Supp Debt Rochester Inst Tech Ser A | | 6.25% | | 7/1/2029 | | A1 | | | | 5,000 | | | 5,715,400 |
| Plymouth MI Edl Ctr Charter Sch | | 5.375% | | 11/1/2035 | | BBB- | | | | 405 | | | 294,783 |
| Tampa FL Rev Univ Tampa Pj (CIFG) | | 5.00% | | 4/1/2035 | | BBB | (c) | | | 1,000 | | | 934,480 |
| TX Tech Univ Rev Fing 12th Ser | | 5.00% | | 2/15/2021 | | AA | | | | 1,000 | | | 1,136,770 |
| WA St Univ Athletic Facs Rev (AMBAC) | | 5.00% | | 10/1/2022 | | A2 | | | | 1,000 | | | 1,092,550 |
| Wilkes-Barre PA Fin Auth Wilkes Univ Pj | | 5.00% | | 3/1/2037 | | BBB | | | | 1,370 | | | 1,262,647 |
| WV Univ Rev Univ Sys Pj Ser A (AMBAC) | | Zero Coupon | | 4/1/2024 | | A+ | | | | 2,880 | | | 1,450,570 |
| WV Univ Rev Univ Sys Pj Ser A (AMBAC) | | Zero Coupon | | 4/1/2026 | | A+ | | | | 800 | | | 357,216 |
| | | | | | | | | | | | | |
| Total | | | | | | | | | | | | | 88,711,712 |
| | | | | | | | | | | | | |
| | | | | |
| General Obligation 16.05% | | | | | | | | | | | | | |
| Alameda Cnty CA Oakland Unif Sch Dist Election 2006 Ser A | | 6.125% | | 8/1/2029 | | BBB+ | | | | 1,500 | | | 1,609,110 |
| Bessemer AL Sch Warrants (AMBAC) | | 5.60% | | 2/1/2030 | | NR | | | | 2,000 | | | 2,031,980 |
| CA St (AMBAC) | | 4.50% | | 8/1/2028 | | A | | | | 5,000 | | | 4,821,150 |
| CA St (CIFG) | | 4.50% | | 8/1/2028 | | A | | | | 5,000 | | | 4,821,150 |
| CA St Var Purp | | 6.50% | | 4/1/2033 | | A | | | | 10,000 | | | 11,606,200 |
| Crowley TX Indpt Sch Dist Sch Bldg PSF GTD | | 5.50% | | 8/1/2029 | | AAA | | | | 1,000 | | | 1,115,250 |
See Notes to Financial Statements.
41
Schedule of Investments (continued)
NATIONAL TAX FREE FUND September 30, 2009
| | | | | | | | | | | | |
| Investments | | Interest
Rate | | Maturity
Date | | Credit
Rating:
S&P or
Moody’s(a) | | Principal
Amount
(000) | | Value |
| General Obligation (continued) | | | | | | | | | | |
| Delaware Vly PA Regl Fin Auth Ser C (AMBAC) | | 7.75% | | 7/1/2027 | | Aa2 | | $ | 1,000 | | $ | 1,379,050 |
| El Paso Cnty TX Hosp Dist Ser A (AG) | | 5.00% | | 8/15/2028 | | AAA | | | 1,250 | | | 1,326,137 |
| El Paso Cnty TX Hosp Dist Ser A (AG)(b) | | 5.00% | | 8/15/2037 | | AAA | | | 7,500 | | | 7,707,863 |
| Foothill-De Anza CA Cmnty College Dist Cap Apprec (NPFGC) | | Zero Coupon | | 8/1/2030 | | Aa1 | | | 4,505 | | | 1,604,501 |
| Foothill-De Anza CA Cmnty College Dist Ser A (AMBAC) | | 4.50% | | 8/1/2031 | | Aa1 | | | 1,800 | | | 1,825,992 |
| Fort Bend TX Indpt Sch Dist Sch Bldg PSF GTD(b) | | 5.00% | | 8/15/2028 | | AAA | | | 4,000 | | | 4,375,660 |
| Fort Bend TX Indpt Sch Dist Sch Bldg PSF GTD(b) | | 5.00% | | 8/15/2029 | | AAA | | | 5,000 | | | 5,469,575 |
| Gwinnett Cnty GA Sch Dist(b) | | 5.00% | | 2/1/2028 | | AAA | | | 4,105 | | | 4,608,680 |
| Houston TX Indpt Sch Dist PSF GTD(b) | | 5.00% | | 2/15/2025 | | AAA | | | 15,000 | | | 16,622,850 |
| Humble TX Indpt Sch Dist Sch Bldg(d) | | 5.00% | | 2/15/2034 | | AA- | | | 5,375 | | | 5,747,649 |
| Lake Cnty IL Forest Preservation Dist Ltd Tax Land Acq Ser A | | 5.00% | | 12/15/2027 | | AAA | | | 6,210 | | | 6,868,446 |
| Los Angeles CA Cmnty College Dist 2001 Election Ser E-1 | | 5.00% | | 8/1/2033 | | AA | | | 3,500 | | | 3,691,240 |
| Los Angeles CA Cmnty College Dist 2003 Election Ser F-1 | | 5.00% | | 8/1/2028 | | AA | | | 2,000 | | | 2,156,580 |
| Los Angeles CA Unif Sch Dist 2004 Election Ser H (FSA)(b) | | 5.00% | | 7/1/2028 | | AAA | | | 7,000 | | | 7,510,895 |
| Los Angeles CA Unif Sch Dist 2002 Election Ser B (AMBAC) | | 4.50% | | 7/1/2031 | | AA- | | | 5,000 | | | 4,877,700 |
| Los Angeles CA Unif Sch Dist Ser A-1 (NPFGC) | | 4.50% | | 1/1/2028 | | AA- | | | 2,500 | | | 2,484,450 |
| Los Angeles CA Unif Sch Dist Ser I | | 5.00% | | 7/1/2029 | | AA- | | | 3,000 | | | 3,209,850 |
| Maricopa Cnty AZ Elem Sch Dist No 33 Buckeye Sch Impt Pj of 2005 Ser C | | 5.70% | | 7/1/2025 | | Baa1 | | | 2,385 | | | 2,566,522 |
| MI Muni Bd Auth Rev Loc Govt Ln Pg Ser A (AMBAC) | | 4.25% | | 5/1/2029 | | NR | | | 1,000 | | | 829,680 |
| MI St Strategic Fd Ltd Solid Wst Oblig Wst Mgmt AMT | | 4.50% | | 12/1/2013 | | BBB | | | 1,000 | | | 1,014,330 |
| Morris MN Indpt Sch Dist No 769 Bldg (NPFGC) | | 5.00% | | 2/1/2028 | | AAA | | | 1,000 | | | 1,103,740 |
| New York City NY Fiscal 2008 Sub Ser C1 (FSA) | | 5.00% | | 10/1/2024 | | AAA | | | 5,000 | | | 5,482,250 |
See Notes to Financial Statements.
42
Schedule of Investments (continued)
NATIONAL TAX FREE FUND September 30, 2009
| | | | | | | | | | | | | | |
| Investments | | Interest
Rate | | | Maturity
Date | | Credit
Rating:
S&P or
Moody’s(a) | | | Principal
Amount
(000) | | Value |
| General Obligation (continued) | | | | | | | | | | | | |
| New York City NY Ser E | | 5.00% | | | 8/1/2019 | | AA | | | $ | 5,000 | | $ | 5,629,300 |
| New York City NY Ser E-1 | | 6.25% | | | 10/15/2028 | | AA | | | | 5,000 | | | 6,030,600 |
| New York City NY Sub Ser I-1(b) | | 5.00% | | | 4/1/2025 | | AA | | | | 12,350 | | | 13,240,003 |
| NY St Urban Dev Corp Rev Pers Income Tax Ser A-1(b) | | 5.00% | | | 12/15/2025 | | AAA | | | | 1,980 | | | 2,196,230 |
| NY St Urban Dev Corp Rev Pers Income Tax Ser A-1(b) | | 5.00% | | | 12/15/2026 | | AAA | | | | 2,870 | | | 3,183,425 |
| NY St Urban Dev Corp Rev Pers Income Tax Ser A-1(b) | | 5.00% | | | 12/15/2027 | | AAA | | | | 1,150 | | | 1,275,588 |
| Pima Cnty AZ Unif Sch Dist No 10 Amphitheater Sch Impt Pj 2007 Ser A (AG) | | 5.00% | | | 7/1/2027 | | AAA | | | | 1,200 | | | 1,315,512 |
| Port of Houston Auth Ser A AMT | | 6.25% | | | 10/1/2029 | | AAA | | | | 1,000 | | | 1,144,910 |
| Richland Cnty SC Broad River Swr Sys Ser D | | 5.375% | | | 3/1/2030 | | AA+ | | | | 1,140 | | | 1,231,987 |
| Richland Cnty SC Broad River Swr Sys Ser D | | 5.375% | | | 3/1/2031 | | AA+ | | | | 1,195 | | | 1,284,195 |
| Richland Cnty SC Broad River Swr Sys Ser D | | 5.375% | | | 3/1/2032 | | AA+ | | | | 1,255 | | | 1,347,406 |
| Richland Cnty SC Broad River Swr Sys Ser D | | 5.375% | | | 3/1/2033 | | AA+ | | | | 1,320 | | | 1,415,423 |
| San Diego CA Unif Sch Dist Election 1998 Ser E-2 (FSA) | | 5.50% | | | 7/1/2025 | | AAA | | | | 5,000 | | | 6,032,750 |
| Santa Ana CA Unif Sch Dist Election 2008 Ser A | | 5.25% | | | 8/1/2026 | | A+ | | | | 4,800 | | | 5,249,520 |
| Territory of Guam Ser A | | 7.00% | | | 11/15/2039 | | B+ | | | | 1,035 | | | 1,134,733 |
| WI St Rev Ser A | | 5.00% | | | 5/1/2019 | | AA- | | | | 1,500 | | | 1,714,425 |
| | | | | | | | | | | | | | |
| Total | | | | | | | | | | | | | | 171,894,487 |
| | | | | | | | | | | | | | |
| | | | | |
| Healthcare 19.09% | | | | | | | | | | | | | | |
| Abag Fin Auth For Nonprofit Corp CA Oconnor Woods Oblig COP (ACA) | | 6.20% | | | 11/1/2029 | | BBB- | (c) | | | 1,000 | | | 833,670 |
| Alachua Cnty FL Indl Dev Rev North FL Ret Vlg | | 5.875% | | | 11/15/2036 | | NR | | | | 2,500 | | | 1,976,575 |
| Allegheny Cnty PA Hosp Dev Auth West PA Hlth Sys Ser A | | 5.00% | | | 11/15/2028 | | BB | | | | 5,000 | | | 3,990,400 |
| AZ Hlth Facs Auth Hlthcare Beatitudes Campus Pj | | 5.20% | | | 10/1/2037 | | NR | | | | 2,000 | | | 1,457,500 |
| AZ Hlth Facs Auth Rev Banner Hlth Ser B | | 1.21% | # | | 1/1/2037 | | A+ | | | | 10,000 | | | 6,730,900 |
See Notes to Financial Statements.
43
Schedule of Investments (continued)
NATIONAL TAX FREE FUND September 30, 2009
| | | | | | | | | | | | |
| Investments | | Interest
Rate | | Maturity
Date | | Credit
Rating:
S&P or
Moody’s(a) | | Principal
Amount
(000) | | Value |
| Healthcare (continued) | | | | | | | | | | | | |
| AZ Hlth Facs Auth Rev Hlthcare Pooled Fin C (NPFGC)(FGIC) | | 5.50% | | 6/1/2014 | | NR | | $ | 1,130 | | $ | 1,209,213 |
| AZ Univ Med Ctr Corp | | 6.25% | | 7/1/2029 | | BBB+ | | | 895 | | | 971,003 |
| AZ Univ Med Ctr Corp | | 6.50% | | 7/1/2039 | | BBB+ | | | 3,025 | | | 3,255,142 |
| Birmingham AL Spl Care Facs Fing Auth Childrens Hosp | | 6.125% | | 6/1/2034 | | A | | | 5,000 | | | 5,339,350 |
| Brazos Cnty TX Hlth Facs Dev Corp Oblig Grp | | 5.375% | | 1/1/2032 | | A- | | | 1,615 | | | 1,486,075 |
| Butler Cnty PA Hosp Auth Butler Hlth Sys Pj | | 7.125% | | 7/1/2029 | | Baa1 | | | 1,500 | | | 1,736,955 |
| Butler Cnty PA Hosp Auth Butler Hlth Sys Pj | | 7.25% | | 7/1/2039 | | Baa1 | | | 2,600 | | | 3,005,132 |
| CA Hlth Facs Fing Auth Catholic Hlthcare West Ser A | | 6.00% | | 7/1/2039 | | A | | | 4,250 | | | 4,506,828 |
| CA Hlth Facs Fing Auth Catholic Hlthcare West Ser G | | 5.50% | | 7/1/2025 | | A | | | 3,275 | | | 3,432,036 |
| CA Hlth Facs Fing Auth Providence Hlth & Svcs Ser C | | 6.25% | | 10/1/2024 | | AA | | | 2,000 | | | 2,293,040 |
| CA Muni Fin Auth Cmnty Hosps Cent CA COP(d) | | 5.50% | | 2/1/2039 | | Baa2 | | | 7,000 | | | 7,009,520 |
| CA Statewide Cmntys Dev Auth Front Porch Cmntys & Svcs Ser A† | | 5.125% | | 4/1/2037 | | BBB | | | 2,000 | | | 1,734,440 |
| CA Statewide Cmntys Dev Auth Kaiser Ser C Rmkt | | 5.25% | | 8/1/2031 | | A+ | | | 2,050 | | | 2,094,608 |
| CA Statewide Cmntys Dev Auth Vlycare Hlth Sys Ser A | | 5.00% | | 7/15/2022 | | NR | | | 1,000 | | | 845,480 |
| CA Statewide Cmntys Dev Auth Vlycare Hlth Sys Ser A | | 5.125% | | 7/15/2031 | | NR | | | 2,250 | | | 1,694,250 |
| CT St Dev Auth Hlth Facs Alzheimers Res Ctr Inc Pj | | 5.40% | | 8/15/2021 | | NR | | | 880 | | | 708,910 |
| Delaware Cnty IN Hosp Auth Cardinal Hlth Sys Oblig Corp | | 5.00% | | 8/1/2024 | | Baa3 | | | 2,000 | | | 1,666,880 |
| Delaware Cnty IN Hosp Auth Cardinal Hlth Sys Oblig Corp | | 5.25% | | 8/1/2036 | | Baa3 | | | 2,500 | | | 1,905,025 |
| Denver CO Hlth & Hosp Auth Ser A | | 4.75% | | 12/1/2036 | | BBB | | | 2,950 | | | 2,407,849 |
| Erie Cnty OH Hosp Facs Rev Firelands Regl Med Ctr Ser A | | 5.50% | | 8/15/2022 | | A | | | 400 | | | 400,936 |
| Fairfax Cnty VA Indl Dev Auth Hlthcare Inova Hlth Sys Ser A(b) | | 5.50% | | 5/15/2035 | | AA+ | | | 5,000 | | | 5,425,525 |
See Notes to Financial Statements.
44
Schedule of Investments (continued)
NATIONAL TAX FREE FUND September 30, 2009
| | | | | | | | | | | | |
| Investments | | Interest
Rate | | Maturity
Date | | Credit
Rating:
S&P or
Moody’s(a) | | Principal
Amount
(000) | | Value |
| Healthcare (continued) | | | | | | | | | | | | |
| Fargo ND Hlth Sys Rev Meritcare Oblig Grp A (NPFGC) | | 5.375% | | 6/1/2027 | | A | | $ | 1,000 | | $ | 1,000,390 |
| Glynn-Brunswick Mem Hosp Auth GA Antic Ctfs Southeast GA Hlth Ser A | | 5.50% | | 8/1/2028 | | A2 | | | 3,300 | | | 3,449,820 |
| Grant Cnty NM Dept Hlth Ft Bayard Pj | | 5.00% | | 7/1/2033 | | AA | | | 2,800 | | | 2,885,764 |
| Harris Cnty TX Hlth Facs Dev Corp Mem Hermann Hlthcare Sys Ser B | | 7.125% | | 12/1/2031 | | A | | | 3,000 | | | 3,397,470 |
| HFDC Cent TX Inc Ret Fac Ser A | | 5.75% | | 11/1/2036 | | NR | | | 2,700 | | | 2,013,579 |
| HI St Dept Bdgt & Fin Spl Purp Linked Ctfs | | 6.40% | | 7/1/2013 | | BBB+ | | | 2,680 | | | 2,820,405 |
| Hillsborough Cnty FL Indl Dev Auth Tampa Gen Hosp Pj(b) | | 5.25% | | 10/1/2041 | | A3 | | | 5,000 | | | 4,719,650 |
| Howard Cnty MD Ret Cmnty Vantage Hse Fac Ser A | | 5.25% | | 4/1/2027 | | NR | | | 1,525 | | | 1,279,826 |
| Howard Cnty MD Ret Cmnty Vantage Hse Fac Ser A | | 5.25% | | 4/1/2033 | | NR | | | 2,000 | | | 1,583,880 |
| Huntsville-Redstone Vlg AL Spl Care Facs Fing Auth Redstone Vlg Pj | | 5.50% | | 1/1/2028 | | NR | | | 1,500 | | | 1,214,445 |
| Huntsville-Redstone Vlg AL Spl Care Facs Fing Auth Redstone Vlg Pj | | 5.50% | | 1/1/2043 | | NR | | | 1,350 | | | 1,001,700 |
| IL Fin Auth Rev Monarch Landing Inc Fac Ser A | | 7.00% | | 12/1/2027 | | NR | | | 1,000 | | | 524,320 |
| IL Fin Auth Rev Monarch Landing Inc Fac Ser A | | 7.00% | | 12/1/2037 | | NR | | | 1,500 | | | 799,335 |
| IL Fin Auth Rev Rush Univ Med Ctr Oblig Grp Ser A | | 7.25% | | 11/1/2030 | | A- | | | 3,000 | | | 3,468,390 |
| IN Hlth & Edl Facs Fing Auth Cmnty Fndtn Northwest | | 5.50% | | 3/1/2037 | | BBB | | | 2,000 | | | 2,010,880 |
| Johnston NC Mem Hosp Auth (FSA FHA)(b) | | 5.25% | | 10/1/2024 | | AAA | | | 5,000 | | | 5,292,000 |
| Kalamazoo MI Hosp Fin Auth Reg Lkd Arcs & Levrrs ETM (FGIC) | | 5.244% | | 6/1/2011 | | AAA | | | 2,800 | | | 2,810,220 |
| Kent MI Hosp Fin Auth Rev Metro Hosp Pj Ser A | | 6.00% | | 7/1/2035 | | BB+ | | | 1,475 | | | 1,218,365 |
| Kerrville TX Hlth Facs Dev Corp Sid Peterson Mem Hosp Pj | | 5.375% | | 8/15/2035 | | BBB- | | | 4,000 | | | 3,888,680 |
| Knox Cnty TN Hlth Edl & Hsg Facs Brd Baptist Hlth Sys East TN | | 6.375% | | 4/15/2022 | | A1 | | | 1,000 | | | 1,051,780 |
| Knox Cnty TN Hlth Edl & Hsg Facs Brd Baptist Hlth Sys East TN | | 6.50% | | 4/15/2031 | | A1 | | | 750 | | | 783,375 |
See Notes to Financial Statements.
45
Schedule of Investments (continued)
NATIONAL TAX FREE FUND September 30, 2009
| | | | | | | | | | | | |
| Investments | | Interest
Rate | | Maturity
Date | | Credit
Rating:
S&P or
Moody’s(a) | | Principal
Amount
(000) | | Value |
| Healthcare (continued) | | | | | | | | | | | | |
| KY Econ Dev Fin Auth Norton Hlthcare Inc Ser B (NPFGC) | | Zero Coupon | | 10/1/2025 | | A | | $ | 3,690 | | $ | 1,460,871 |
| Lauderdale Cnty & Florence AL Hlthcare Auth Coffee Hlth Grp Ser A (NPFGC) | | 6.00% | | 7/1/2029 | | A | | | 640 | | | 548,275 |
| Lexington VA Indl Dev Auth Resdl Care Fac Mtg Kendal at Lexington Ser A | | 5.375% | | 1/1/2028 | | NR | | | 1,500 | | | 1,241,475 |
| Lexington VA Indl Dev Auth Resdl Care Fac Mtg Kendal at Lexington Ser A | | 5.50% | | 1/1/2037 | | NR | | | 1,500 | | | 1,185,360 |
| Louisville & Jefferson Cnty KY Metro Govt Norton Hlthcare Inc(b) | | 5.00% | | 10/1/2030 | | A- | | | 10,000 | | | 9,796,300 |
| Manhattan KS Hlthcare Fac Meadowlark Hills Ret Ser A | | 5.00% | | 5/15/2029 | | NR | | | 4,050 | | | 3,285,320 |
| MD St Hlth & Higher Edl Facs Auth Washington Cnty Hosp | | 5.75% | | 1/1/2033 | | BBB- | | | 1,000 | | | 1,023,600 |
| MD St Hlth & Higher Edl Facs Auth Washington Cnty Hosp | | 6.00% | | 1/1/2028 | | BBB- | | | 1,720 | | | 1,808,752 |
| MI St Hosp Fin Auth Rev Trinity Hlth Ser A TCRS (AMBAC) | | 6.00% | | 12/1/2027 | | AA | | | 1,000 | | | 1,011,970 |
| Minneapolis & St. Paul MN Hsg & Redev Auth Hlthpartners Oblig Grp Pj | | 5.875% | | 12/1/2029 | | Baa1 | | | 2,100 | | | 2,131,836 |
| MN Agric & Econ Dev Brd Unref Bal Hlthcare Sys A (NPFGC) | | 5.50% | | 11/15/2017 | | A | | | 45 | | | 45,080 |
| Nassau Cnty NY Indl Dev Agy Amsterdam At Harborside Ser A | | 5.875% | | 1/1/2018 | | NR | | | 2,150 | | | 2,021,989 |
| NC Med Care Commn First Mtg UTD Methodist C | | 5.50% | | 10/1/2032 | | NR | | | 1,500 | | | 1,356,960 |
| NH Hlth & Ed Facs Auth Dartmouth-Hitchcock Oblig (FSA) | | 5.50% | | 8/1/2027 | | AAA | | | 3,500 | | | 3,589,670 |
| NJ Econ Dev Auth First Mtg Seashore Gardens Pj | | 5.30% | | 11/1/2026 | | NR | | | 1,440 | | | 1,128,398 |
| NJ Econ Dev Auth First Mtg Seashore Gardens Pj | | 5.375% | | 11/1/2036 | | NR | | | 1,000 | | | 737,040 |
| NJ Hlthcare Facs Fing Auth Somerset Med Ctr | | 5.50% | | 7/1/2018 | | Ba2 | | | 2,000 | | | 1,795,220 |
| NM St Hosp Equip Ln Council Presbyterian Hlthcare(b) | | 5.00% | | 8/1/2039 | | AA- | | | 9,100 | | | 9,208,108 |
See Notes to Financial Statements.
46
Schedule of Investments (continued)
NATIONAL TAX FREE FUND September 30, 2009
| | | | | | | | | | | | |
| Investments | | Interest
Rate | | Maturity
Date | | Credit
Rating:
S&P or
Moody’s(a) | | Principal
Amount
(000) | | Value |
| Healthcare (continued) | | | | | | | | | | | | |
| North Cent TX Hlth Fac Dev Corp Children’s Med Ctr Dallas Pj(b) | | 5.75% | | 8/15/2039 | | Aa3 | | $ | 10,000 | | $ | 10,645,250 |
| Northampton Cnty PA Gen Purp Auth St. Luke’s Hosp Pj Ser A | | 5.25% | | 8/15/2024 | | BBB+ | | | 1,210 | | | 1,228,767 |
| NY St Dorm Auth Rev Non St Supp Debt Orange Regl Med Ctr | | 6.125% | | 12/1/2029 | | Ba1 | | | 3,250 | | | 3,010,865 |
| OH St Higher Edl Fac Commn Univ Hosp Hlth Sys Ser 2009-A | | 6.75% | | 1/15/2039 | | A | | | 5,000 | | | 5,298,800 |
| Orange Cnty FL Hlth Facs Auth Hosp Orlando Regl Hlthcare Ser B | | 4.75% | | 11/15/2036 | | A | | | 1,000 | | | 892,850 |
| Philadelphia PA Hosps & Higher Ed Facs Auth Temple Univ Hosp Sys Ser A | | 6.625% | | 11/15/2023 | | BBB | | | 4,000 | | | 4,002,240 |
| Puerto Rico Indl Tourist Edl Med & Envr Ctrl Facs Fing Auth Hosp de la Concepcion Ser A | | 6.125% | | 11/15/2025 | | Aa1 | | | 910 | | | 943,406 |
| RI St Hlth & Edl Bldg Corp Roger Williams Rlty (FHA) | | 6.50% | | 8/1/2029 | | A- | | | 1,240 | | | 1,249,213 |
| Sarasota Cnty FL Hlth Facs Auth Hlthcare Sarasota Manatee | | 5.75% | | 7/1/2037 | | NR | | | 1,000 | | | 802,660 |
| Sarasota Cnty FL Hlth Facs Auth Hlthcare Sarasota Manatee | | 5.75% | | 7/1/2045 | | NR | | | 1,100 | | | 859,452 |
| Sarasota Cnty FL Pub Hosp Brd Sarasota Mem Hosp Ser B (NPFGC) | | 5.50% | | 7/1/2028 | | A1 | | | 1,905 | | | 2,041,436 |
| Scottsdale AZ Indl Dev Auth Scottsdale Hlthcare A | | 5.00% | | 9/1/2022 | | A3 | | | 1,250 | | | 1,264,275 |
| Scottsdale AZ Indl Dev Auth Scottsdale Hlthcare A | | 5.00% | | 9/1/2023 | | A3 | | | 1,000 | | | 1,005,670 |
| St. Paul MN Hsg & Redev Auth Healthpartners Oblig Grp Pj | | 5.25% | | 5/15/2036 | | Baa1 | | | 2,000 | | | 1,908,940 |
| Sullivan Cnty TN Hlth Edl & Hsg Facs Brd Wellmont Hlth Sys Pj Ser C | | 5.25% | | 9/1/2036 | | BBB+ | | | 2,000 | | | 1,638,400 |
| Tarrant Cnty TX Cultural Ed Facs Fin Corp Buckner Ret Svcs Inc Pj | | 5.25% | | 11/15/2037 | | A- | | | 3,000 | | | 2,856,090 |
| Tarrant Cnty TX Cultural Ed Facs Fin Corp Christus Hlth Ser A (AG) | | 6.25% | | 7/1/2028 | | AAA | | | 1,500 | | | 1,709,910 |
| Vigo Cnty IN Hosp Auth Rev Union Hosp Inc† | | 5.75% | | 9/1/2042 | | NR | | | 3,000 | | | 2,432,370 |
| WV St Hosp Fin Auth Thomas Hlth Sys | | 6.25% | | 10/1/2023 | | NR | | | 2,000 | | | 1,949,120 |
| | | | | | | | | | | | |
| Total | | | | | | | | | | | | 204,447,454 |
| | | | | | | | | | | | |
See Notes to Financial Statements.
47
Schedule of Investments (continued)
NATIONAL TAX FREE FUND September 30, 2009
| | | | | | | | | | | | | |
| Investments | | Interest
Rate | | Maturity
Date | | Credit
Rating:
S&P or
Moody’s(a) | | | Principal
Amount
(000) | | Value |
| Housing 1.68% | | | | | | | | | | | | | |
| Dakota Cnty MN Cmnty Dev Agy Hsg & Redev Sing Fam Mtg Bkd Securities Pg Ser A AMT (GNMA/FNMA) | | 5.85% | | 10/1/2030 | | AAA | | | $ | 27 | | $ | 27,101 |
| Dakota Cnty MN Cmnty Dev Agy Sing Fam Mtg Bkd Securities Pg Ser B AMT (FHLMC/GNMA/FNMA) | | 5.15% | | 12/1/2038 | | AA- | | | | 455 | | | 464,691 |
| Gaithersburg MD Econ Dev Rev Asbury MD Oblig Grp A(b) | | 5.125% | | 1/1/2036 | | BBB- | (c) | | | 4,300 | | | 3,432,389 |
| ID Hsg & Fin Assoc Sing Fam Mtg Sr Ser F AMT (FHA/VA) | | 7.45% | | 7/1/2015 | | Aaa | | | | 25 | | | 25,001 |
| LA Hsg Fin Agy Multi Fam Hsg Ser B | | 8.00% | | 9/1/2039 | | BBB- | | | | 1,500 | | | 1,541,700 |
| LA Pub Facs Auth Rev Susla Facs Inc Pj Ser A† | | 5.75% | | 7/1/2039 | | NR | | | | 2,195 | | | 1,593,351 |
| LA St Citizens Ppty Ins Corp Ser B (AMBAC) | | 5.00% | | 6/1/2016 | | A- | | | | 2,700 | | | 2,786,157 |
| Los Angeles CA Hsg Auth Mtg Ppty Acq Ser A | | 6.25% | | 6/1/2034 | | A | | | | 4,220 | | | 4,380,613 |
| Middlesex Cnty NJ Impt Auth Sub Heldrich Ctr Hotel Ser B | | 6.125% | | 1/1/2025 | | NR | | | | 1,250 | | | 265,150 |
| Minneapolis & St. Paul MN Hsg Fin Brd Mtg Bkd City Living A4 AMT (FHLMC/GNMA/FNMA) | | 5.00% | | 11/1/2038 | | AAA | | | | 886 | | | 895,883 |
| Minneapolis & St. Paul MN Hsg Fin Brd Sing Fam Mtg Ser AB AMT (GNMA/FNMA) | | 6.25% | | 11/1/2030 | | AAA | | | | 105 | | | 106,838 |
| Minneapolis MN Multi Fam Hsg Coll Mtg Ln East Vlg South (GNMA) | | 6.10% | | 7/20/2020 | | Aaa | | | | 1,000 | | | 1,016,440 |
| MN St Hsg Fin Agy Sing Fam Mtg Ser E Rmkt | | 5.90% | | 7/1/2025 | | AA+ | | | | 120 | | | 120,366 |
| MN St Hsg Fin Agy Sing Fam Mtg Ser G-1 Rmkt AMT | | 5.60% | | 7/1/2022 | | AA+ | | | | 110 | | | 110,708 |
| MO St Hsg Dev Commn Mtg Cap Apprec Sing Fam Hsg Ser E-1 AMT (GNMA/FNMA) | | Zero Coupon | | 3/1/2029 | | AAA | | | | 210 | | | 71,228 |
| MO St Hsg Dev Commn Mtg Sing Fam Hmownr Ln Ser B-1 AMT (GNMA/FNMA) | | 6.25% | | 3/1/2031 | | AAA | | | | 70 | | | 70,275 |
| NC Hsg Fin Agy Sing Fam Rev Ser BB AMT | | 6.25% | | 3/1/2012 | | AA | | | | 185 | | | 185,242 |
| New Orleans LA Fin Auth Sing Fam Mtg Ser B-2 AMT (GNMA/FNMA) | | 6.00% | | 12/1/2018 | | A2 | | | | 85 | | | 86,840 |
See Notes to Financial Statements.
48
Schedule of Investments (continued)
NATIONAL TAX FREE FUND September 30, 2009
| | | | | | | | | | | | |
| Investments | | Interest
Rate | | Maturity
Date | | Credit
Rating:
S&P or
Moody’s(a) | | Principal
Amount
(000) | | Value |
| Housing (continued) | | | | | | | | | | | | |
| OK Hsg Fin Agy Sing Fam Cap Apprec Hmownr Ser D-1 (GNMA/FNMA) | | Zero Coupon | | 3/1/2029 | | Aaa | | $ | 1,630 | | $ | 591,185 |
| OK Hsg Fin Agy Sing Fam Cap Apprec Mtg Hmownr Ser D-2 AMT (GNMA/FNMA) | | Zero Coupon | | 9/1/2030 | | Aaa | | | 675 | | | 179,341 |
| OK Hsg Fin Agy Sing Fam Mtg Ser B-1 (GNMA/FNMA) | | 5.30% | | 9/1/2026 | | Aaa | | | 50 | | | 50,384 |
| | | | | | | | | | | | |
| Total | | | | | | | | | | | | 18,000,883 |
| | | | | | | | | | | | |
| | | | | |
| Lease Obligations 2.50% | | | | | | | | | | | | |
| AZ St Ser A COP (NPFGC) | | 5.00% | | 11/1/2020 | | AA- | | | 200 | | | 206,318 |
| CA St Pub Wrks Brd Regents Univ Ser E(b) | | 5.00% | | 4/1/2034 | | AA- | | | 1,590 | | | 1,641,929 |
| Goodyear AZ Pub Impt Corp | | 6.00% | | 7/1/2031 | | AA- | | | 2,350 | | | 2,727,433 |
| Gulf Coast Wst Disp Auth TX Swr & Solid Wst Disp Anheuser Busch Pj AMT | | 5.90% | | 4/1/2036 | | BBB+ | | | 1,505 | | | 1,518,816 |
| Hudson Yards NY Infrastr Corp Ser A | | 5.00% | | 2/15/2047 | | A | | | 5,000 | | | 4,949,550 |
| Lancaster SC Edl Assistance Pg Inc Sch Dist Lancaster Cnty Pj | | 5.00% | | 12/1/2029 | | A- | | | 1,030 | | | 1,045,821 |
| McLennan Cnty TX Pub Fac Corp | | 6.625% | | 6/1/2035 | | AA- | | | 2,500 | | | 2,776,975 |
| MO St Dev Fin Brd Infrastr Branson Landing Pj Ser A | | 5.625% | | 12/1/2028 | | A | | | 3,000 | | | 3,018,630 |
| PA St Indl Dev Auth Econ Dev | | 5.50% | | 7/1/2023 | | A- | | | 3,000 | | | 3,301,050 |
| Philadelphia PA Muni Auth Rev Lease | | 6.00% | | 4/1/2023 | | Baa1 | | | 870 | | | 928,995 |
| Philadelphia PA Muni Auth Rev Lease | | 6.10% | | 4/1/2024 | | Baa1 | | | 1,000 | | | 1,071,370 |
| Philadelphia PA Muni Auth Rev Lease | | 6.375% | | 4/1/2029 | | Baa1 | | | 1,000 | | | 1,064,770 |
| Spartanburg Cnty SC Sch Dist No 7 McCarthy Teszler Pj (XLCA) | | 5.00% | | 3/1/2022 | | NR | | | 1,000 | | | 1,007,910 |
| VA St Pub Sch Auth Sch Fing 1997 Resolution Ser B | | 5.25% | | 8/1/2020 | | AA+ | | | 1,300 | | | 1,550,757 |
| | | | | | | | | | | | |
| Total | | | | | | | | | | | | 26,810,324 |
| | | | | | | | | | | | |
| | | | | |
| Other Revenue 9.01% | | | | | | | | | | | | |
| Baker FL Correctional Dev Corp 1st Mtg Rev Detention Ctr Pj | | 7.50% | | 2/1/2030 | | NR | | | 3,500 | | | 3,179,085 |
| Baytown Twp MN Rev St. Croix Prep Academy Pj Ser A | | 6.75% | | 8/1/2028 | | NR | | | 1,455 | | | 1,317,241 |
| Bellevue WA Convtn Ctr Auth (NPFGC) | | Zero Coupon | | 2/1/2024 | | A | | | 1,400 | | | 782,866 |
See Notes to Financial Statements.
49
Schedule of Investments (continued)
NATIONAL TAX FREE FUND September 30, 2009
| | | | | | | | | | | | | |
| Investments | | Interest
Rate | | Maturity
Date | | Credit
Rating:
S&P or
Moody’s(a) | | | Principal
Amount
(000) | | Value |
| Other Revenue (continued) | | | | | | | | | | | | | |
| Brazos River Auth TX Pollutn Ctrl TXU Elec Co Pj Ser C AMT | | 5.75% | | 5/1/2036 | | CCC | | | $ | 3,805 | | $ | 3,262,635 |
| CA Muni Fin Auth High Tech High Chula Vista B† | | 6.125% | | 7/1/2038 | | BB+ | (c) | | | 750 | | | 589,792 |
| CA Muni Fin Auth High Tech High Media Arts A† | | 6.00% | | 7/1/2038 | | BB+ | (c) | | | 500 | | | 390,795 |
| CA Statewide Cmntys Dev Auth Huntington Pk Charter Sch Pj A | | 5.15% | | 7/1/2030 | | NR | | | | 1,000 | | | 724,780 |
| CA Statewide Cmntys Dev Auth Huntington Pk Charter Sch Pj A | | 5.25% | | 7/1/2042 | | NR | | | | 1,500 | | | 1,013,715 |
| CA Statewide Cmntys Dev Auth Windrush Sch | | 5.50% | | 7/1/2037 | | NR | | | | 1,000 | | | 766,860 |
| Chester Cnty PA Indl Dev Auth Avon Grove Charter Sch Pj A | | 6.25% | | 12/15/2027 | | BB+ | | | | 2,325 | | | 1,951,768 |
| Chula Vista CA Rev San Diego Gas Ser E Rmkt | | 5.875% | | 1/1/2034 | | Aa3 | | | | 2,125 | | | 2,260,851 |
| CO Edl & Cultural Facs Auth Charter Sch Cmnty Leadership | | 6.25% | | 7/1/2028 | | NR | | | | 1,000 | | | 857,250 |
| CO Edl & Cultural Facs Auth Charter Sch Flagstaff Ser A | | 6.75% | | 8/1/2028 | | NR | | | | 1,215 | | | 1,200,833 |
| CO Edl & Cultural Facs Auth Charter Sch North East Academy† | | 5.75% | | 5/15/2037 | | NR | | | | 845 | | | 653,574 |
| CO Edl & Cultural Facs Auth New Vision Charter Pj Sch† | | 6.75% | | 4/1/2040 | | NR | | | | 925 | | | 789,996 |
| Denver CO Convtn Ctr Hotel Auth Sr (XLCA) | | 5.00% | | 12/1/2035 | | BBB- | | | | 1,875 | | | 1,553,925 |
| Doctor Charles Drew Academy MI COP | | 5.70% | | 11/1/2036 | | NR | | | | 1,555 | | | 1,065,019 |
| FL Hurricane Catastrophe Fd Fin Corp Ser A | | 5.00% | | 7/1/2014 | | AA- | | | | 3,000 | | | 3,256,170 |
| George L Smith II GA World Congress Ctr Auth Domed Stadium Pj AMT (NPFGC) | | 5.50% | | 7/1/2020 | | A | | | | 635 | | | 647,897 |
| George L Smith II GA World Congress Ctr Auth Domed Stadium Pj AMT (NPFGC) | | 5.75% | | 7/1/2015 | | A | | | | 1,500 | | | 1,539,045 |
| Jacksonville FL Excise Taxes Ser C AMT (NPFGC) | | 5.25% | | 10/1/2020 | | Aa3 | | | | 270 | | | 275,243 |
| LA Loc Govt Envr Facs Cmnty Dev Auth Pkg Facs Corp Garage Pj Ser A (AMBAC) | | 5.375% | | 10/1/2026 | | NR | | | | 1,500 | | | 1,524,690 |
| La Vernia TX Higher Ed Fin Corp Amigos Por Vida Friends Life | | 6.25% | | 2/15/2026 | | NR | | | | 1,465 | | | 1,272,763 |
| Maverick Cnty TX Pub Fac Corp Ser A-1 | | 6.375% | | 2/1/2029 | | NR | | | | 2,580 | | | 2,215,756 |
See Notes to Financial Statements.
50
Schedule of Investments (continued)
NATIONAL TAX FREE FUND September 30, 2009
| | | | | | | | | | | | | |
| Investments | | Interest
Rate | | Maturity
Date | | Credit
Rating:
S&P or
Moody’s(a) | | | Principal
Amount
(000) | | Value |
| Other Revenue (continued) | | | | | | | | | | | | | |
| MD St Hlth & Higher Edl Facs Auth Washington Christian Academy | | 5.50% | | 7/1/2038 | | NR | | | $ | 2,200 | | $ | 1,086,976 |
| MI Pub Edl Facs Auth Rev Ltd Oblig David Ellis West Pj | | 5.875% | | 6/1/2037 | | NR | | | | 1,400 | | | 1,088,192 |
| Miami-Dade Cnty FL Spl Oblig Fltg Rate Cap Asset Acq Ser A (NPFGC)(FGIC) | | 4.675% | | 4/1/2014 | | A+ | | | | 4,800 | | | 4,450,224 |
| Miami-Dade Cnty FL Spl Oblig Sub Ser A (NPFGC) | | Zero Coupon | | 10/1/2024 | | A | | | | 3,000 | | | 1,309,050 |
| Middlesex Cnty NJ Impt Auth Sub Heldrich Ctr Hotel Ser B | | 6.25% | | 1/1/2037 | | NR | | | | 1,700 | | | 325,278 |
| Milwaukee WI Redev Auth Academy of Learning Ser A | | 5.50% | | 8/1/2022 | | NR | | | | 300 | | | 239,682 |
| Milwaukee WI Redev Auth Academy of Learning Ser A | | 5.65% | | 8/1/2037 | | NR | | | | 250 | | | 176,213 |
| MN St Ret Sys Bldg | | 6.00% | | 6/1/2030 | | AAA | | | | 250 | | | 252,960 |
| Mohave Cnty AZ Indl Dev Auth Mohave Prison LLC Expansion Pj | | 8.00% | | 5/1/2025 | | BBB+ | | | | 4,500 | | | 5,440,410 |
| NH St Business Fin Auth Pub Svc Ser D Rmkt TCRS AMT (AMBAC) | | 6.00% | | 5/1/2021 | | A3 | | | | 1,000 | | | 1,015,340 |
| NY St Dorm Auth Ser A | | 5.00% | | 3/15/2024 | | AAA | | | | 5,000 | | | 5,637,600 |
| NY St Urban Dev Corp Rev Pers Income Tax Ser B-1 | | 5.00% | | 3/15/2028 | | AAA | | | | 5,000 | | | 5,518,200 |
| OH St Air Quality Dev Auth First Enrg Generation Ser A | | 5.70% | | 8/1/2020 | | BBB | | | | 3,250 | | | 3,566,387 |
| OH St Wtr Dev Auth Pollutn Ctrl First Enrg Ser A | | 5.875% | | 6/1/2033 | | Baa1 | | | | 1,875 | | | 2,069,325 |
| Otero Cnty NM Jail Pj Rev | | 5.75% | | 4/1/2018 | | NR | | | | 825 | | | 749,009 |
| Otero Cnty NM Jail Pj Rev | | 6.00% | | 4/1/2028 | | NR | | | | 1,400 | | | 1,136,674 |
| Pima Cnty AZ Indl Dev Auth Amer Charter Schs Fndtn Ser A | | 5.50% | | 7/1/2026 | | BBB | (c) | | | 4,500 | | | 3,712,680 |
| Pima Cnty AZ Indl Dev Auth Amer Charter Schs Fndtn Ser A | | 5.625% | | 7/1/2038 | | BBB | (c) | | | 2,000 | | | 1,524,080 |
| Provo UT Charter Sch Rev Freedom Academy Fndtn | | 5.50% | | 6/15/2037 | | NR | | | | 1,000 | | | 740,430 |
| Salt Verde AZ Fin Corp Gas Rev Sr | | 5.25% | | 12/1/2023 | | A | | | | 1,000 | | | 1,016,940 |
| San Antonio TX Convtn Hotel Fin Corp Empowerment Zone Ser A AMT (AMBAC) | | 5.00% | | 7/15/2039 | | Baa2 | | | | 5,000 | | | 4,188,850 |
See Notes to Financial Statements.
51
Schedule of Investments (continued)
NATIONAL TAX FREE FUND September 30, 2009
| | | | | | | | | | | | |
| Investments | | Interest
Rate | | Maturity
Date | | Credit
Rating:
S&P or
Moody’s(a) | | Principal
Amount
(000) | | Value |
| Other Revenue (continued) | | | | | | | | | | | | |
| Santa Cruz CA Cnty Redev Agy Live Oak/Soquel Cmnty Impt Ser A | | 6.625% | | 9/1/2029 | | A | | $ | 500 | | $ | 551,325 |
| Santa Cruz CA Cnty Redev Agy Live Oak/Soquel Cmnty Impt Ser A | | 7.00% | | 9/1/2036 | | A | | | 500 | | | 559,500 |
| Spokane WA Pub Facs Dist (NPFGC) | | 5.75% | | 12/1/2028 | | A+ | | | 975 | | | 1,032,018 |
| St. Louis MO Indl Dev Auth Rev Confluence Academy Pj Ser A | | 5.00% | | 6/15/2020 | | NR | | | 700 | | | 595,280 |
| St. Louis MO Indl Dev Auth Rev Confluence Academy Pj Ser A | | 5.25% | | 6/15/2025 | | NR | | | 575 | | | 458,781 |
| St. Louis MO Indl Dev Auth Rev Confluence Academy Pj Ser A | | 5.35% | | 6/15/2032 | | NR | | | 1,000 | | | 747,220 |
| St. Paul MN Port Auth Lease Rev Regions Hosp Pkg Ramp Pj Ser 1 | | 5.00% | | 8/1/2036 | | NR | | | 750 | | | 566,573 |
| Sweetwater Cnty WY Solid Wst Disp FMC Corp Pj AMT | | 5.60% | | 12/1/2035 | | BBB | | | 5,000 | | | 4,762,550 |
| Tampa FL Sports Auth Rev Tampa Bay Arena Pj (NPFGC) | | 6.00% | | 10/1/2015 | | Baa1 | | | 450 | | | 476,033 |
| TX St Pub Fin Auth Charter Sch Ed Cosmos Fndtn Ser A | | 5.375% | | 2/15/2037 | | NR | | | 1,230 | | | 1,004,393 |
| TX St Pub Fin Auth Charter Sch Uplift Ed Ser A | | 5.875% | | 12/1/2036 | | BBB- | | | 1,145 | | | 909,439 |
| UT St Charter Sch Fin Auth Noah Webster Academy Ser A | | 6.50% | | 6/15/2038 | | NR | | | 1,000 | | | 839,860 |
| VA St Hsg Dev Auth Ser A-5 AMT | | 4.70% | | 7/1/2017 | | AAA | | | 2,000 | | | 2,048,100 |
| Valparaiso IN Econ Dev Rev Valparaiso Fam YMCA | | 5.875% | | 12/1/2027 | | NR | | | 1,000 | | | 856,000 |
| Valparaiso IN Econ Dev Rev Valparaiso Fam YMCA | | 6.125% | | 12/1/2042 | | NR | | | 650 | | | 539,097 |
| West Palm Beach FL Cmnty Redev Agy Northwood-Pleasant Cmnty Redev | | 5.00% | | 3/1/2029 | | A | | | 255 | | | 228,029 |
| West Vly City UT Charter Sch Monticello Academy† | | 6.375% | | 6/1/2037 | | NR | | | 1,800 | | | 1,462,410 |
| Willacy Cnty TX Loc Govt Corp Pj Ser A-2 | | 6.00% | | 9/1/2010 | | NR | | | 525 | | | 523,005 |
| | | | | | | | | | | | |
| Total | | | | | | | | | | | | 96,496,662 |
| | | | | | | | | | | | |
| | | | | |
| Pre-Refunded 5.47% | | | | | | | | | | | | |
| Adrian MI City Sch Dist (FSA) | | 5.00% | | 5/1/2034 | | AAA | | | 1,500 | | | 1,726,845 |
| CA St | | 5.25% | | 4/1/2034 | | AAA | | | 5,000 | | | 5,848,950 |
| Chaska MN Elec Rev Ser A | | 6.00% | | 10/1/2025 | | A3 | | | 250 | | | 263,495 |
See Notes to Financial Statements.
52
Schedule of Investments (continued)
NATIONAL TAX FREE FUND September 30, 2009
| | | | | | | | | | | | | |
| Investments | | Interest
Rate | | Maturity
Date | | Credit
Rating:
S&P or
Moody’s(a) | | | Principal
Amount
(000) | | Value |
| Pre-Refunded (continued) | | | | | | | | | | | | | |
| CO Hlth Facs Auth Rev Portercare Adventist Hlth | | 6.625% | | 11/15/2026 | | A2 | | | $ | 2,000 | | $ | 2,261,220 |
| Cobb Cnty GA Kennestone Hosp Auth Rev Ctfs Ser 86 A ETM (NPFGC) | | Zero Coupon | | 8/1/2015 | | A | | | | 630 | | | 467,857 |
| Fayette Cnty GA Pub Facs Auth Crim Justice Ctr Pj | | 6.00% | | 6/1/2030 | | AA | | | | 3,500 | | | 3,664,290 |
| IL Fin Auth Rev Northwestern Mem Hosp Ser A | | 5.25% | | 8/15/2034 | | NR | | | | 5,400 | | | 6,260,544 |
| MD St Hlth & Higher Edl Facs Auth Catholic Hlth Initiatives Ser A ETM | | 6.00% | | 12/1/2024 | | AA | | | | 100 | | | 103,744 |
| MD St Hlth & Higher Edl Facs Auth North Arundel Hosp | | 6.50% | | 7/1/2026 | | A3 | | | | 1,000 | | | 1,054,540 |
| MD St Hlth & Higher Edl Facs Auth Univ MD Med Sys | | 6.75% | | 7/1/2030 | | A | (c) | | | 1,950 | | | 2,058,420 |
| MI St COP ETM (AMBAC) | | Zero Coupon | | 6/1/2022 | | A2 | | | | 2,000 | | | 1,254,440 |
| Miami-Dade Cnty FL Expwy Auth (FGIC) | | 6.375% | | 7/1/2029 | | A3 | | | | 1,000 | | | 1,053,620 |
| Milledgeville-Baldwin Cnty GA Dev Auth College & St Univ Fndtn | | 6.00% | | 9/1/2033 | | AAA | | | | 3,000 | | | 3,646,500 |
| New York City NY Unref Bal Ser A | | 6.00% | | 5/15/2030 | | AA | | | | 20 | | | 20,554 |
| NY St Dorm Auth Rev St Fashion Inst Tech (FSA) | | 5.50% | | 7/1/2030 | | AAA | | | | 115 | | | 120,557 |
| Orange Cnty FL Hlth Facs Auth Hosp Orlando Regl Hlthcare | | 5.75% | | 12/1/2032 | | AAA | | | | 1,000 | | | 1,141,130 |
| Phoenix AZ Civic Impt Corp Jr Lien (FGIC) | | 6.00% | | 7/1/2024 | | AA+ | | | | 2,400 | | | 2,523,888 |
| Puerto Rico Pub Bldgs Auth Rev Govt Facs Ser I GTD | | 5.25% | | 7/1/2033 | | NR | | | | 95 | | | 108,843 |
| Puerto Rico Pub Bldgs Auth Rev Govt Facs Ser I GTD | | 5.375% | | 7/1/2034 | | BBB- | | | | 1,000 | | | 1,151,350 |
| RI St Econ Dev Corp Ser B (FGIC) | | 6.00% | | 7/1/2020 | | A2 | | | | 1,210 | | | 1,272,000 |
| RI St Econ Dev Corp Ser B (FGIC) | | 6.00% | | 7/1/2028 | | A2 | | | | 1,200 | | | 1,261,488 |
| RI St Hlth & Edl Bldg Corp Hosp Fing Lifespan Oblig Grp | | 6.50% | | 8/15/2032 | | A- | | | | 1,000 | | | 1,147,690 |
| SC Jobs Econ Dev Auth Impt Palmetto Hlth Alliance A | | 7.375% | | 12/15/2021 | | NR | | | | 2,000 | | | 2,170,500 |
| SC Jobs Econ Dev Auth Palmetto Hlth Ser C | | 6.375% | | 8/1/2034 | | BBB+ | | | | 1,780 | | | 2,082,315 |
| SC Jobs Econ Dev Auth Palmetto Hlth Ser C | | 6.375% | | 8/1/2034 | | BBB+ | | | | 240 | | | 280,762 |
See Notes to Financial Statements.
53
Schedule of Investments (continued)
NATIONAL TAX FREE FUND September 30, 2009
| | | | | | | | | | | | | |
| Investments | | Interest
Rate | | Maturity
Date | | Credit
Rating:
S&P or
Moody’s(a) | | | Principal
Amount
(000) | | Value |
| Pre-Refunded (continued) | | | | | | | | | | | | | |
| Sullivan Cnty TN Hlth Edl & Hsg Facs Brd Hosp Wellmont Hlth | | 6.25% | | 9/1/2022 | | NR | | | $ | 1,250 | | $ | 1,421,300 |
| Sullivan Cnty TN Hlth Edl & Hsg Facs Brd Hosp Wellmont Hlth | | 6.25% | | 9/1/2022 | | BBB+ | (c) | | | 750 | | | 852,780 |
| Tampa Bay FL Wtr Util Sys Rev (FGIC) | | 6.00% | | 10/1/2024 | | AAA | | | | 2,000 | | | 2,209,420 |
| Tyler TX Hlth Facs Dev Corp Mother Frances Hosp Regl Hlth | | 6.00% | | 7/1/2027 | | Baa1 | | | | 1,500 | | | 1,676,985 |
| Univ of Cent AR Rev Hsg Sys (FSA) | | 6.50% | | 1/1/2031 | | AAA | | | | 2,425 | | | 2,509,317 |
| Upper Trinity TX Regl Wtr Dist Regl Treated Wtr Supply Sys Ser A (FGIC) | | 6.00% | | 8/1/2026 | | A- | | | | 3,025 | | | 3,163,908 |
| WA St Higher Ed Facs Auth Gonzaga Univ Pj (NPFGC) | | 5.125% | | 4/1/2034 | | A | | | | 1,000 | | | 1,170,470 |
| Western WA Univ Rev Student Rec Fee (NPFGC) | | 5.00% | | 5/1/2033 | | AA- | | | | 20 | | | 22,037 |
| WV St Ser D (FGIC) | | 6.50% | | 11/1/2026 | | Aa3 | | | | 2,000 | | | 2,613,100 |
| | | | | | | | | | | | | |
| Total | | | | | | | | | | | | | 58,584,859 |
| | | | | | | | | | | | | |
| | | | | |
| Special Tax 1.61% | | | | | | | | | | | | | |
| Altoona IA Tax Alloc Annual Appropriation | | 6.00% | | 6/1/2034 | | BBB+ | | | | 1,000 | | | 1,067,320 |
| Annawan IL Tax Incr Rev Patriot Renewable Fuels LLC Pj | | 5.625% | | 1/1/2018 | | NR | | | | 1,000 | | | 826,790 |
| Apple Vly CA Redev Agy Veda Pj Area | | 4.75% | | 6/1/2037 | | BBB+ | | | | 1,000 | | | 861,040 |
| Aurora IL Tax Incr Rev East River Area No 6 Ser A | | 6.75% | | 12/30/2027 | | NR | | | | 1,000 | | | 983,410 |
| Baltimore MD Spl Oblig Ser A | | 7.00% | | 9/1/2038 | | NR | | | | 1,500 | | | 1,423,575 |
| Branson Hills MO Infrastr Facs Cmnty Impt Dist Ser A | | 5.50% | | 4/1/2022 | | NR | | | | 965 | | | 835,632 |
| Branson Hills MO Infrastr Facs Cmnty Impt Dist Ser A | | 5.50% | | 4/1/2027 | | NR | | | | 1,430 | | | 1,175,560 |
| CA St Unref Bal | | 5.25% | | 4/1/2034 | | A | | | | 5 | | | 5,106 |
| Clark Cnty NV Impt Dist Spl Loc Impt 128 Summerlin Ser A | | 5.05% | | 2/1/2031 | | NR | | | | 1,035 | | | 590,809 |
| Crosscreek Cmnty Dev Dist FL Ser A | | 5.60% | | 5/1/2039 | | NR | | | | 750 | | | 286,613 |
| Crosscreek Cmnty Dev Dist FL Ser B | | 5.50% | | 5/1/2017 | | NR | | | | 1,490 | | | 571,698 |
| Gramercy Farms Cmnty Dev Dist FL Ser A-1 | | 5.25% | | 5/1/2039 | | NR | | | | 2,445 | | | 1,320,716 |
| Lakeside Landings Cmnty Dev Dist FL Ser A | | 5.50% | | 5/1/2038 | | NR | | | | 675 | | | 346,646 |
| Mesquite NV Redev Agy Tax Alloc | | 6.625% | | 6/1/2017 | | A- | | | | 1,605 | | | 1,678,798 |
See Notes to Financial Statements.
54
Schedule of Investments (continued)
NATIONAL TAX FREE FUND September 30, 2009
| | | | | | | | | | | | |
| Investments | | Interest
Rate | | Maturity
Date | | Credit
Rating:
S&P or
Moody’s(a) | | Principal
Amount
(000) | | Value |
| Special Tax (continued) | | | | | | | | | | | | |
| Millsboro DE Spl Oblig Plantation Lakes Spl Dev Ser A | | 5.45% | | 7/1/2036 | | NR | | $ | 2,100 | | $ | 1,427,538 |
| Salida CA Area Pub Facs Fing Agy No 1998-1 (FSA) | | 5.25% | | 9/1/2028 | | AAA | | | 155 | | | 155,009 |
| San Diego CA Redev Agy Tax Alloc North Pk Redev Pj Sub Ser A | | 7.00% | | 11/1/2039 | | A- | | | 2,500 | | | 2,673,525 |
| San Juan Cnty NM Tax/Motor Rev (IBC)(NPFGC) | | 5.25% | | 5/15/2022 | | A1 | | | 165 | | | 175,864 |
| Stone Canyon Cmnty Impt Dist MO Pub Infrastr Impt Pj | | 5.70% | | 4/1/2022 | | NR | | | 1,000 | | | 849,190 |
| | | | | | | | | | | | |
| Total | | | | | | | | | | | | 17,254,839 |
| | | | | | | | | | | | |
| | | | | |
| Tax Revenue 4.80% | | | | | | | | | | | | |
| Dallas TX Area Rapid Transit Sr Lien(b) | | 5.00% | | 12/1/2022 | | AAA | | | 9,645 | | | 10,840,353 |
| Dallas TX Area Rapid Transit Sr Lien(b) | | 5.00% | | 12/1/2023 | | AAA | | | 6,135 | | | 6,895,341 |
| Dallas TX Area Rapid Transit Sr Lien(b) | | 5.00% | | 12/1/2024 | | AAA | | | 8,070 | | | 9,070,155 |
| Dallas TX Area Rapid Transit Sr Lien(b) | | 5.00% | | 12/1/2028 | | AAA | | | 7,160 | | | 8,047,374 |
| NJ Econ Dev Auth Cigarette Tax | | 5.75% | | 6/15/2029 | | BBB | | | 2,000 | | | 2,006,320 |
| Orange Cnty FL Tourist Dev Ser A (NPFGC) | | 5.00% | | 10/1/2021 | | A+ | | | 5,000 | | | 5,317,900 |
| Southwestern IL Dev Auth Rev Loc Govt Pg Collinsville Ltd | | 5.35% | | 3/1/2031 | | NR | | | 500 | | | 382,355 |
| UT Transit Auth Sales Tax Rev Ser A(b) | | 5.00% | | 6/15/2028 | | AAA | | | 5,000 | | | 5,506,375 |
| Virgin Islands Pub Fin Auth Rev Gross Rcpts Taxes Ln Nts (NPFGC)(FGIC) | | 5.00% | | 10/1/2025 | | A | | | 1,500 | | | 1,514,970 |
| Virgin Islands Pub Fin Auth Rev Matching Fd Ln Diago Ser A | | 6.75% | | 10/1/2037 | | BBB | | | 1,665 | | | 1,761,637 |
| | | | | | | | | | | | |
| Total | | | | | | | | | | | | 51,342,780 |
| | | | | | | | | | | | |
| | | | | |
| Tobacco 2.45% | | | | | | | | | | | | |
| Buckeye OH Tob Sttlmnt Fing Auth Asset Bkd Sr Turbo Ser A-2 | | 5.75% | | 6/1/2034 | | BBB | | | 2,940 | | | 2,756,103 |
| Buckeye OH Tob Sttlmnt Fing Auth Asset Bkd Sr Turbo Ser A-2 | | 5.875% | | 6/1/2030 | | BBB | | | 1,500 | | | 1,435,095 |
| Buckeye OH Tob Sttlmnt Fing Auth Asset Bkd Sr Turbo Ser A-2 | | 5.875% | | 6/1/2047 | | BBB | | | 4,970 | | | 4,037,876 |
| Buckeye OH Tob Sttlmnt Fing Auth Asset Bkd Sr Turbo Ser A-2 | | 6.50% | | 6/1/2047 | | BBB | | | 4,500 | | | 4,013,370 |
| Golden St Tob Securitization Corp CA Asset Bkd Sr Ser A-1 | | 5.125% | | 6/1/2047 | | BBB | | | 2,290 | | | 1,722,378 |
See Notes to Financial Statements.
55
Schedule of Investments (continued)
NATIONAL TAX FREE FUND September 30, 2009
| | | | | | | | | | | | |
| Investments | | Interest
Rate | | Maturity
Date | | Credit
Rating:
S&P or
Moody’s(a) | | Principal
Amount
(000) | | Value |
| Tobacco (continued) | | | | | | | | | | | | |
| Golden St Tob Securitization Corp CA Asset Bkd Sr Ser A-1 | | 5.75% | | 6/1/2047 | | BBB | | $ | 10,000 | | $ | 8,347,100 |
| NJ Tob Sttlmnt Fing Corp Ser 1A | | 5.00% | | 6/1/2041 | | BBB | | | 5,220 | | | 3,950,026 |
| | | | | | | | | | | | |
| Total | | | | | | | | | | | | 26,261,948 |
| | | | | | | | | | | | |
| | | | | |
| Transportation 8.85% | | | | | | | | | | | | |
| Alliance Arpt Auth Inc TX Spl Facs FedEx Corp Pj AMT | | 4.85% | | 4/1/2021 | | BBB | | | 3,000 | | | 2,840,400 |
| AZ St Transn Brd Ser A | | 5.00% | | 7/1/2030 | | AAA | | | 5,000 | | | 5,461,750 |
| Billings MT Arpt Rev AMT (NPFGC) | | 6.10% | | 7/1/2016 | | A | | | 190 | | | 196,228 |
| Billings MT Arpt Rev AMT (NPFGC) | | 6.20% | | 7/1/2020 | | A | | | 2,775 | | | 2,854,365 |
| Cent Puget Sound WA Regl Transn Auth Sales Tax (NPFGC)(FGIC) | | 5.25% | | 2/1/2021 | | AAA | | | 1,750 | | | 2,083,252 |
| Chicago IL O’Hare Intl Arpt Ser A (FSA) | | 5.00% | | 1/1/2033 | | AAA | | | 4,250 | | | 4,445,287 |
| Dallas-Fort Worth TX Intl Arpt Facs Impt Corp Jt Ser B AMT (FSA) | | 5.00% | | 11/1/2035 | | AAA | | | 1,330 | | | 1,308,999 |
| Dallas-Fort Worth TX Intl Arpt Facs Impt Corp Jt Ser B Rmkt AMT (NPFGC) | | 6.25% | | 11/1/2028 | | A+ | | | 1,000 | | | 1,000,940 |
| Greater Orlando FL Aviation Auth Spl Purp JetBlue Airways Corp AMT | | 6.50% | | 11/15/2036 | | NR | | | 645 | | | 545,496 |
| HI St Hwy Rev | | 5.00% | | 1/1/2019 | | AA+ | | | 1,000 | | | 1,176,180 |
| Houston TX Arpt Sys Rev Sub Lien Ser A AMT (NPFGC)(FGIC) | | 5.50% | | 7/1/2012 | | A1 | | | 370 | | | 386,025 |
| KY St Tpk Auth Econ Revitalization Pjs Ser A | | 5.00% | | 7/1/2027 | | AA+ | | | 5,000 | | | 5,522,900 |
| Los Angeles CA Dept of Arpts Los Angeles Intl Arpt Ser A AMT | | 5.50% | | 5/15/2021 | | AA | | | 2,375 | | | 2,523,699 |
| Metro Transn Auth NY Ser 2008 C | | 6.50% | | 11/15/2028 | | A | | | 7,500 | | | 8,769,600 |
| Metro WA DC Arpts Auth Ser A AMT(b) | | 5.00% | | 10/1/2022 | | AA- | | | 3,250 | | | 3,401,109 |
| Metro WA DC Arpts Auth Ser A AMT(b) | | 5.375% | | 10/1/2028 | | AA- | | | 2,500 | | | 2,616,237 |
| MI St Trunk Line (NPFGC)(FGIC) | | 5.00% | | 11/1/2021 | | AA+ | | | 2,000 | | | 2,147,560 |
| Miami-Dade Cnty FL Aviation Miami Intl Arpt Hub Ser B (NPFGC) | | 4.50% | | 10/1/2031 | | A | | | 520 | | | 501,691 |
| Miami-Dade Cnty FL Aviation Miami Intl Arpt Ser A AMT (XLCA) | | 5.00% | | 10/1/2037 | | A2 | | | 2,000 | | | 1,792,820 |
| New York City NY Indl Dev Agy Terminal One Grp Assoc Pj AMT | | 5.50% | | 1/1/2024 | | A3 | | | 3,470 | | | 3,475,135 |
| North TX Twy Auth Rev Sys 1st Tier Ser A | | 6.00% | | 1/1/2025 | | A2 | | | 5,000 | | | 5,554,750 |
| North TX Twy Auth Rev Toll 2nd Tier Ser F | | 5.75% | | 1/1/2033 | | A3 | | | 5,705 | | | 6,077,765 |
See Notes to Financial Statements.
56
Schedule of Investments (continued)
NATIONAL TAX FREE FUND September 30, 2009
| | | | | | | | | | | | |
| Investments | | Interest
Rate | | Maturity
Date | | Credit
Rating:
S&P or
Moody’s(a) | | Principal
Amount
(000) | | Value |
| Transportation (continued) | | | | | | | | | | | | |
| NY St Thwy Auth Hwy & Bridge Tr Fd Ser B | | 5.00% | | 4/1/2022 | | AA | | $ | 5,000 | | $ | 5,611,300 |
| NY St Thwy Auth Hwy & Bridge Tr Fd Ser B | | 5.00% | | 4/1/2025 | | AA | | | 9,500 | | | 10,590,885 |
| PA Tpk Commn Sub Ser B | | 5.25% | | 6/1/2039 | | A2 | | | 5,000 | | | 5,396,450 |
| Port of Seattle WA Spl Fac Rev Unref Bal Ser C AMT (NPFGC) | | 6.00% | | 9/1/2029 | | AA- | | | 1,085 | | | 1,088,689 |
| San Francisco CA City & Cnty Arpts Commn Spl Facs Lease SFO Fuel Ser A AMT (FSA) | | 6.125% | | 1/1/2027 | | AAA | | | 495 | | | 494,941 |
| Santa Rosa FL Bay Bridge Auth Rev Cap Apprec | | Zero Coupon | | 7/1/2017 | | B3 | | | 1,200 | | | 415,440 |
| St. Louis MO Arpt Rev Lambert Intl Arpt Ser A-1 | | 6.25% | | 7/1/2029 | | A | | | 2,020 | | | 2,132,857 |
| St. Paul MN Port Auth Ltd Tax Brownfields Redev 2 | | 5.00% | | 3/1/2037 | | AA+ | | | 895 | | | 948,897 |
| Susquehanna Area PA Regl Arpt Auth Ser A AMT | | 6.50% | | 1/1/2038 | | Baa3 | | | 3,440 | | | 3,348,565 |
| | | | | | | | | | | | |
| Total | | | | | | | | | | | | 94,710,212 |
| | | | | | | | | | | | |
| | | | | |
| Utilities 20.07% | | | | | | | | | | | | |
| Amer Muni Pwr OH Inc Prairie St Enrg Campus Pj A | | 5.25% | | 2/15/2027 | | A1 | | | 5,000 | | | 5,388,600 |
| AZ Salt River Pj Agric Impt & Pwr Dist Ser A(b) | | 5.00% | | 1/1/2032 | | Aa1 | | | 17,710 | | | 19,366,239 |
| Brazos River Auth TX Wtr Rev Supply Sys Ser A AMT (NPFGC) | | 5.00% | | 2/15/2028 | | AA | | | 1,000 | | | 1,004,800 |
| CA Pollutn Ctrl Fing Auth Republic Svcs Inc Pj Ser C AMT | | 5.25% | | 6/1/2023 | | BBB | | | 3,245 | | | 3,366,785 |
| CA St Dept of Wtr Res Pwr Supply Ser H (FSA) | | 5.00% | | 5/1/2022 | | AAA | | | 1,000 | | | 1,127,600 |
| Campbell Cnty WY Solid Wst Fac Basin Elec Pwr Coop Ser A | | 5.75% | | 7/15/2039 | | A+ | | | 4,000 | | | 4,296,680 |
| Cape Fear Pub Util Auth NC Wtr & Swr Sys | | 5.00% | | 8/1/2026 | | AA | | | 5,000 | | | 5,520,850 |
| CT St Dev Auth Lt & Pwr B AMT | | 5.95% | | 9/1/2028 | | Baa1 | | | 1,000 | | | 1,010,600 |
| CT St Dev Auth Solid Wst Disp PSEG Pwr LLC Pj Ser A AMT | | 5.75% | | 11/1/2037 | | Baa1 | | | 2,250 | | | 2,246,782 |
| Delaware Cnty PA Indl Dev Auth Res Recovery Fac Ser A | | 6.20% | | 7/1/2019 | | BB+ | | | 2,110 | | | 2,112,427 |
| Detroit MI Wtr Supply Sys 2nd Lien Ser B Rmkt (FSA) | | 7.00% | | 7/1/2036 | | AAA | | | 2,265 | | | 2,806,403 |
See Notes to Financial Statements.
57
Schedule of Investments (continued)
NATIONAL TAX FREE FUND September 30, 2009
| | | | | | | | | | | | |
| Investments | | Interest
Rate | | Maturity
Date | | Credit
Rating:
S&P or
Moody’s(a) | | Principal
Amount
(000) | | Value |
| Utilities (continued) | | | | | | | | | | | | |
| Detroit MI Wtr Supply Sys Sr Lien Ser A (NPFGC) | | 5.00% | | 7/1/2034 | | A+ | | $ | 950 | | $ | 958,303 |
| Emerald Coast FL Utils Auth Sys (NPFGC)(FGIC) | | 5.25% | | 1/1/2036 | | A | | | 1,000 | | | 1,038,130 |
| FL Muni Pwr Agy Rev Pwr Ser A | | 5.25% | | 10/1/2026 | | A1 | | | 1,235 | | | 1,342,000 |
| FL Muni Pwr Agy Rev Pwr Ser A | | 6.25% | | 10/1/2031 | | A1 | | | 2,000 | | | 2,344,160 |
| FL St Wtr Pollutn Ctrl Fing Corp Rev Ser A | | 5.00% | | 1/15/2029 | | AAA | | | 1,000 | | | 1,096,310 |
| Gautier MS Util Dist Util Sys (NPFGC)(FGIC) | | 5.125% | | 3/1/2019 | | NR | | | 425 | | | 445,396 |
| Gulf Coast Wst Disp Auth TX Wst Mgmt of TX Ser A AMT | | 5.20% | | 5/1/2028 | | BBB | | | 2,800 | | | 2,687,188 |
| HI St Dept Bdgt & Fin Hawaiian Elec Co & Subs | | 6.50% | | 7/1/2039 | | Baa1 | | | 1,600 | | | 1,745,712 |
| HI St Dept Bdgt & Fin Spl Purp Hawaiian Elec Co & Subs Pjs AMT (NPFGC) | | 5.45% | | 11/1/2023 | | AA | | | 3,235 | | | 3,235,356 |
| Houston TX Util Sys Rev 1st Lien Ser A (AG) | | 5.125% | | 11/15/2032 | | AAA | | | 4,000 | | | 4,326,120 |
| IN Muni Pwr Agy Ser B | | 5.75% | | 1/1/2034 | | A+ | | | 2,000 | | | 2,119,080 |
| Lewis Cnty WA Pub Util Dist No 1 Ser A (FSA) | | 5.00% | | 12/1/2027 | | Aa3 | | | 4,975 | | | 5,430,809 |
| Long Beach CA Bd Fin Auth Natural Gas Ser A | | 5.50% | | 11/15/2030 | | A | | | 215 | | | 212,080 |
| Long Island NY Pwr Auth Ser A | | 5.70% | | 4/1/2030 | | A- | | | 4,510 | | | 5,091,429 |
| Long Island NY Pwr Auth Ser A | | 6.25% | | 4/1/2033 | | A- | | | 1,000 | | | 1,176,210 |
| Los Angeles CA Dept of Wtr & Pwr Sys Sub Ser A2 (AMBAC) | | 5.00% | | 7/1/2028 | | AA- | | | 4,925 | | | 5,338,355 |
| Louisville & Jefferson Cnty KY Metro Swr Dist Ser B | | 5.00% | | 5/15/2021 | | AA- | | | 5,000 | | | 5,652,050 |
| Lower CO River Auth TX Rev | | 5.00% | | 5/15/2021 | | A1 | | | 1,260 | | | 1,387,134 |
| M-S-R Enrg Auth CA Ser C | | 6.50% | | 11/1/2039 | | A | | | 1,250 | | | 1,428,700 |
| M-S-R Enrg Auth CA Ser C | | 7.00% | | 11/1/2034 | | A | | | 10,000 | | | 12,199,200 |
| MA St Dev Fin Agy Dominion Enrg Brayton Point AMT | | 5.00% | | 2/1/2036 | | A- | | | 2,200 | | | 2,027,718 |
| Maricopa Cnty AZ Pollutn Ctrl Corp El Paso Elec Co Pj Ser A | | 7.25% | | 2/1/2040 | | BBB | | | 3,500 | | | 4,010,475 |
| MD St Econ Dev Corp Potomac Rmkt | | 6.20% | | 9/1/2022 | | A3 | | | 5,700 | | | 6,645,516 |
| Melbourne FL Wtr & Swr Rev Ref & Impt Ser A (NPFGC)(FGIC) | | 5.00% | | 10/1/2032 | | A | | | 975 | | | 999,170 |
See Notes to Financial Statements.
58
Schedule of Investments (continued)
NATIONAL TAX FREE FUND September 30, 2009
| | | | | | | | | | | | |
| Investments | | Interest
Rate | | Maturity
Date | | Credit
Rating:
S&P or
Moody’s(a) | | Principal
Amount
(000) | | Value |
| Utilities (continued) | | | | | | | | | | | | |
| MI St Strategic Fd Ltd Coll Detroit Fd Pollutn Ser BB (AMBAC) | | 7.00% | | 5/1/2021 | | A2 | | $ | 500 | | $ | 616,370 |
| MI St Strategic Fd Ltd Detroit Edison Pollutn Ctrl Ser C AMT | | 5.65% | | 9/1/2029 | | A2 | | | 1,360 | | | 1,363,318 |
| Midlothian TX Wtr Dist Cap Apprec (FSA) | | Zero Coupon | | 9/1/2022 | | AAA | | | 2,000 | | | 1,205,720 |
| MS Business Fin Corp Sys Enrg Res Inc Pj | | 5.875% | | 4/1/2022 | | BBB | | | 2,500 | | | 2,506,750 |
| MS Business Fin Corp Sys Enrg Res Inc Pj | | 5.90% | | 5/1/2022 | | BBB | | | 2,550 | | | 2,536,459 |
| NC Eastern Muni Pwr Agy Ser A (AG) | | 5.25% | | 1/1/2019 | | AAA | | | 5,000 | | | 5,575,850 |
| NC Eastern Muni Pwr Agy Ser B(d) | | 5.00% | | 1/1/2026 | | A- | | | 5,000 | | | 5,268,100 |
| NC Muni Pwr Agy No 1 Catawaba Ser A | | 5.25% | | 1/1/2020 | | A | | | 2,000 | | | 2,245,480 |
| NE St Muni Enrg Agy Ser A (BHAC) | | 5.125% | | 4/1/2029 | | AAA | | | 500 | | | 559,975 |
| NE St Muni Enrg Agy Ser A (BHAC) | | 5.375% | | 4/1/2039 | | AAA | | | 2,085 | | | 2,302,570 |
| Northern CA Pwr Agy Rev Geothermal Pj No 3 Ser A | | 5.00% | | 7/1/2023 | | A1 | | | 1,245 | | | 1,357,125 |
| Northern CA Pwr Agy Rev Geothermal Pj No 3 Ser A | | 5.50% | | 7/1/2021 | | A1 | | | 1,000 | | | 1,153,970 |
| Northern CA Pwr Agy Rev Geothermal Pj No 3 Ser A | | 5.50% | | 7/1/2022 | | A1 | | | 1,000 | | | 1,146,010 |
| OK St Muni Pwr Auth Ser A | | 5.875% | | 1/1/2028 | | A | | | 1,000 | | | 1,121,490 |
| Orlando FL Utils Commn Ser B | | 5.00% | | 10/1/2033 | | Aa1 | | | 2,500 | | | 2,677,425 |
| Palm Beach Cnty FL Solid Wst Auth Impt Ser B | | 5.50% | | 10/1/2028 | | AA | | | 3,000 | | | 3,282,420 |
| Phoenix AZ Civic Impt Corp Jr Lien Ser A(b) | | 5.00% | | 7/1/2039 | | AAA | | | 6,250 | | | 6,749,656 |
| Pima Cnty AZ Indl Dev Auth Global Wtr Res LLC Pj AMT | | 6.55% | | 12/1/2037 | | NR | | | 3,000 | | | 2,906,130 |
| Pinal Cnty AZ Elec Dist No 4 | | 6.00% | | 12/1/2028 | | BBB | | | 740 | | | 761,978 |
| Sabine River Auth TX Pollutn Ctrl Southwestern Elec Co (NPFGC) | | 4.95% | | 3/1/2018 | | A | | | 2,500 | | | 2,451,100 |
| Sabine River Auth TX Pollutn Ctrl TXU Elec Co Pj Ser B AMT | | 5.75% | | 5/1/2030 | | CCC | | | 1,375 | | | 1,179,008 |
| Sabine River Auth TX Pollutn Ctrl TXU Enrg Co Pj Ser A | | 5.80% | | 7/1/2022 | | CCC | | | 1,000 | | | 600,450 |
| Sacramento CA Muni Util Dist Ser U (FSA)(b) | | 5.00% | | 8/15/2023 | | AAA | | | 3,650 | | | 4,073,619 |
See Notes to Financial Statements.
59
Schedule of Investments (continued)
NATIONAL TAX FREE FUND September 30, 2009
| | | | | | | | | | | | | | |
| Investments | | Interest
Rate | | Maturity
Date | | Credit
Rating:
S&P or
Moody’s(a) | | | Principal
Amount
(000) | | Value | |
| Utilities (continued) | | | | | | | | | | | | | | |
| Sacramento CA Muni Util Dist Ser U (FSA)(b) | | 5.00% | | 8/15/2024 | | AAA | | | $ | 2,920 | | $ | 3,258,895 | |
| Sacramento CA Muni Util Dist Ser U (FSA)(b) | | 5.00% | | 8/15/2025 | | AAA | | | | 2,920 | | | 3,258,895 | |
| Salt Verde AZ Financial Corp Gas Rev Sr | | 5.00% | | 12/1/2037 | | A | | | | 2,500 | | | 2,328,625 | |
| San Diego CA Pub Facs Fing Auth Sr Ser A | | 5.25% | | 5/15/2039 | | A+ | | | | 2,500 | | | 2,691,375 | |
| Santa Margarita-Dana CA Point Auth Wtr Dist Impt Ser 2-3-4 A | | 5.25% | | 8/1/2032 | | AA | | | | 3,020 | | | 3,265,466 | |
| TN Enrg Acq Corp Jr Ser B | | 5.625% | | 9/1/2026 | | BBB | (c) | | | 4,781 | | | 4,716,648 | |
| TN Enrg Acq Corp Ser A | | 5.25% | | 9/1/2019 | | BB+ | | | | 1,050 | | | 1,066,979 | |
| TN Enrg Acq Corp Ser A | | 5.25% | | 9/1/2026 | | BB+ | | | | 5,900 | | | 5,828,138 | |
| TN Enrg Acq Corp Ser C | | 5.00% | | 2/1/2020 | | A | | | | 2,300 | | | 2,292,502 | |
| Tooele UT Hazardous Wst Union Pacific Pj A Rmkt AMT | | 5.70% | | 11/1/2026 | | BBB | | | | 5,000 | | | 5,042,400 | |
| TX Muni Gas Acq & Supply Corp I Sr Lien Ser A | | 5.25% | | 12/15/2026 | | A | | | | 1,250 | | | 1,208,688 | |
| TX Muni Gas Acq & Supply Corp I Sr Lien Ser D | | 6.25% | | 12/15/2026 | | A | | | | 3,810 | | | 4,102,684 | |
| UT Wtr Fin Agy Rev Pooled Ln Fing Pg Ser B (AMBAC) | | 5.125% | | 7/1/2023 | | NR | | | | 1,000 | | | 1,042,030 | |
| | | | | | | | | | | | | | |
| Total | | | | | | | | | | | | | 214,928,665 | |
| | | | | | | | | | | | | | |
| Total Municipal Bonds (cost $1,108,488,725) | | | | | | | | | | | 1,142,929,948 | |
| | | | | | | | | | | | | | |
| | | | | |
| | | | | | | | | | Shares
(000) | | | |
| SHORT-TERM INVESTMENTS 0.51% | | | | | | | | | | |
| | | |
| Money Market Mutual Funds 0.47% | | | | | | | | | | |
| Dreyfus Municipal Cash Management Plus | | | | 5,001 | | | 5,001,093 | |
| SSgA Tax Free Money Market Fund | | | | 5 | | | 4,501 | |
| | | | | | | | | | | | | | |
| Total | | | | | | | | | | | | | 5,005,594 | |
| | | | | | | | | | | | | | |
| | | | | |
| | | | | | | | | | Principal
Amount
(000) | | | |
| Variable Rate Demand Note 0.04% | | | | | | | | | | | | | | |
| CA St Floater Ser DCL 048 (FSA)(e) | | 0.60% | | 10/1/2009 | | AAA | | | $ | 500 | | | 500,000 | |
| | | | | | | | | | | | | | |
| Total Short-Term Investments (cost $5,505,594) | | | | | | | | | 5,505,594 | |
| | | | | | | | | | | | | | |
| Total Investments in Securities 107.24% (cost $1,113,994,319) | | | | | | | 1,148,435,542 | |
| | | | | | | | | | | | | | |
| Liabilities in Excess of Cash and Other Assets(f) (7.24%) | | | | | | | (77,516,669 | ) |
| | | | | | | | | | | | | | |
| Net Assets 100.00% | | | | | | | | | | | | $ | 1,070,918,873 | |
| | | | | | | | | | | | | | |
See Notes to Financial Statements.
60
Schedule of Investments (concluded)
NATIONAL TAX FREE FUND September 30, 2009
Open Futures Contracts at September 30, 2009:
| | | | | | | | | | | | |
| Type | | Expiration | | Contracts | | Position | | Market
Value | | Unrealized
Depreciation |
| U.S. 30-Year Treasury Bond | | December 2009 | | 953 | | Short | | $ | (115,670,375) | | $ | (1,954,176) |
See Notes to Financial Statements.
61
Schedule of Investments
CALIFORNIA TAX FREE FUND September 30, 2009
| | | | | | | | | | | | |
| Investments | | Interest
Rate | | Maturity
Date | | Credit
Rating:
S&P or
Moody’s(a) | | Principal
Amount
(000) | | Value |
| MUNICIPAL BONDS 102.82% | | | | | | | | | | | | |
| | | | | |
| Corporate-Backed 4.17% | | | | | | | | | | | | |
| CA Pollutn Ctrl Fing Auth Browning Ferris Indl Inc Ser A AMT | | 5.80% | | 12/1/2016 | | BBB | | $ | 1,080 | | $ | 1,080,518 |
| Golden St Tob Securitization Corp CA Enhanced Asset Bkd Ser A (FGIC) | | 5.00% | | 6/1/2035 | | A- | | | 2,620 | | | 2,520,938 |
| Long Beach CA Bd Fin Auth Natural Gas Ser A | | 5.25% | | 11/15/2020 | | A | | | 1,505 | | | 1,549,638 |
| San Jose CA Arpt Rev Ser A AMT (AMBAC) | | 5.00% | | 3/1/2037 | | A | | | 975 | | | 926,172 |
| Virgin Islands Pub Fin Auth Sr Secd Hovensa Refinery AMT | | 4.70% | | 7/1/2022 | | BBB | | | 2,250 | | | 2,059,448 |
| | | | | | | | | | | | |
| Total | | | | | | | | | | | | 8,136,714 |
| | | | | | | | | | | | |
| | | | | |
| Education 6.84% | | | | | | | | | | | | |
| Abag Fin Auth For Nonprofit Corp CA Sch of Mech Arts | | 5.25% | | 10/1/2026 | | A3 | | | 500 | | | 509,075 |
| CA Edl Facs Auth Rev CA Lutheran Univ | | 5.25% | | 10/1/2021 | | Baa1 | | | 1,500 | | | 1,521,450 |
| CA Edl Facs Auth Rev College & Univ Fing Pg | | 5.00% | | 2/1/2037 | | Ba1 | | | 1,000 | | | 701,490 |
| CA Edl Facs Auth Rev Univ La Verne Ser A | | 5.00% | | 6/1/2035 | | Baa2 | | | 1,000 | | | 841,160 |
| CA Edl Facs Auth Rev Univ Sthn CA Ser A | | 5.00% | | 10/1/2039 | | AA+ | | | 1,000 | | | 1,077,230 |
| CA Muni Fin Auth Ed Rev Amer Heritage Ed Fndtn Pj A | | 5.25% | | 6/1/2036 | | BBB- | | | 1,000 | | | 850,360 |
| CA Muni Fin Auth Rev Biola Univ | | 5.80% | | 10/1/2028 | | Baa1 | | | 1,085 | | | 1,118,700 |
| CA St Unref Bal | | 5.125% | | 6/1/2027 | | A | | | 5 | | | 5,060 |
| CA Statewide Cmntys Dev Auth Sonoma Country Day Sch COP | | 6.00% | | 1/1/2029 | | NR | | | 1,285 | | | 993,048 |
| CA Statewide Cmntys Dev Auth Thomas Jefferson Sch Law Ser A | | 7.25% | | 10/1/2032 | | BB+ | | | 1,000 | | | 1,019,130 |
| San Bernardino Cmnty College Dist CA Election 2002 Ser A | | 5.75% | | 8/1/2020 | | AA- | | | 750 | | | 906,210 |
| San Ysidro CA Sch Dist Cap Apprec Election 1997 Ser D (NPFGC)(FGIC) | | Zero Coupon | | 8/1/2028 | | A | | | 1,000 | | | 357,520 |
| Univ of CA Ser O(b) | | 5.75% | | 5/15/2031 | | AA | | | 3,000 | | | 3,454,875 |
| | | | | | | | | | | | |
| Total | | | | | | | | | | | | 13,355,308 |
| | | | | | | | | | | | |
See Notes to Financial Statements.
62
Schedule of Investments (continued)
CALIFORNIA TAX FREE FUND September 30, 2009
| | | | | | | | | | | | | |
| Investments | | Interest
Rate | | Maturity
Date | | Credit
Rating:
S&P or
Moody’s(a) | | | Principal
Amount
(000) | | Value |
| General Obligation 17.28% | | | | | | | | | | | | | |
| Alameda Cnty CA Oakland Unif Sch Dist Election 2006 Ser A | | 6.125% | | 8/1/2029 | | BBB+ | | | $ | 1,000 | | $ | 1,072,740 |
| Barstow CA Unif Sch Dist Ser A (NPFGC)(FGIC) | | 5.00% | | 8/1/2026 | | A3 | | | | 2,475 | | | 2,528,361 |
| Berkeley CA Measure I-Animal Shelter Pj (AG) | | 4.625% | | 9/1/2037 | | AAA | | | | 1,025 | | | 1,016,226 |
| CA St | | 5.00% | | 9/1/2028 | | A | | | | 1,000 | | | 1,023,990 |
| CA St (CIFG) | | 4.50% | | 8/1/2028 | | A | | | | 1,400 | | | 1,349,922 |
| CA St Unref Bal (AMBAC) | | 5.00% | | 4/1/2031 | | A | | | | 10 | | | 10,088 |
| CA St Var Purp | | 5.00% | | 4/1/2026 | | A | | | | 1,450 | | | 1,508,986 |
| CA St Var Purp | | 5.50% | | 4/1/2024 | | A | | | | 1,000 | | | 1,099,230 |
| CA St Var Purp | | 6.50% | | 4/1/2033 | | A | | | | 2,500 | | | 2,901,550 |
| Foothill-De Anza CA Cmnty College Dist Ser A (AMBAC) | | 4.50% | | 8/1/2031 | | Aa1 | | | | 1,800 | | | 1,825,992 |
| Los Angeles CA Cmnty College Dist 2003 Election Ser F-1 | | 5.00% | | 8/1/2033 | | AA | | | | 1,000 | | | 1,054,640 |
| Los Angeles CA Unif Sch Dist 2004 Election Ser H (FSA)(b) | | 5.00% | | 7/1/2028 | | AAA | | | | 3,000 | | | 3,218,955 |
| Los Angeles CA Unif Sch Dist Ser A-1 (NPFGC) | | 4.50% | | 1/1/2028 | | AA- | | | | 1,000 | | | 993,780 |
| Los Angeles CA Unif Sch Dist Ser I | | 5.00% | | 7/1/2029 | | AA- | | | | 2,225 | | | 2,380,639 |
| Mojave CA Unif Sch Dist Sch Facs Impt Dist No 001 (NPFGC)(FGIC) | | 5.00% | | 8/1/2024 | | A | | | | 1,060 | | | 1,089,108 |
| Montebello CA Unif Sch Dist Election of 2004 (FSA) | | 5.00% | | 8/1/2028 | | AAA | | | | 1,335 | | | 1,439,517 |
| Oak Vly CA Hosp Dist Election 2004 (NPFGC)(FGIC) | | 5.00% | | 7/1/2033 | | A3 | | | | 500 | | | 493,125 |
| Oxnard CA Union High Sch Dist Ser A (NPFGC) | | 6.00% | | 2/1/2020 | | A | | | | 650 | | | 733,837 |
| Pittsburg CA Redev Agy Los Medanos Cmnty Dev Pj (AMBAC) | | Zero Coupon | | 8/1/2026 | | A | (c) | | | 3,500 | | | 1,495,270 |
| Pomona CA Unif Sch Dist Ser A (NPFGC) | | 6.15% | | 8/1/2030 | | A | | | | 825 | | | 934,618 |
| Pomona CA Unif Sch Dist Ser A (NPFGC) | | 6.55% | | 8/1/2029 | | A | | | | 950 | | | 1,112,213 |
| Riverside CA Cmnty College Dist Unref Bal Ser A (NPFGC) | | 5.50% | | 8/1/2029 | | AA- | | | | 15 | | | 16,459 |
| Santa Ana CA Unif Sch Dist Election 2008 Ser A | | 5.25% | | 8/1/2025 | | A+ | | | | 1,650 | | | 1,808,383 |
| Santa Ana CA Unif Sch Dist Election 2008 Ser A | | 5.25% | | 8/1/2026 | | A+ | | | | 1,000 | | | 1,093,650 |
See Notes to Financial Statements.
63
Schedule of Investments (continued)
CALIFORNIA TAX FREE FUND September 30, 2009
| | | | | | | | | | | | | |
| Investments | | Interest
Rate | | Maturity
Date | | Credit
Rating:
S&P or
Moody’s(a) | | | Principal
Amount
(000) | | Value |
| General Obligation (continued) | | | | | | | | | | | | | |
| Territory of Guam Ser A | | 7.00% | | 11/15/2039 | | B+ | | | $ | 390 | | $ | 427,580 |
| West Contra Costa CA Unif Sch Dist Election of 2005 Ser B | | 6.00% | | 8/1/2027 | | A | | | | 1,000 | | | 1,115,710 |
| | | | | | | | | | | | | |
| Total | | | | | | | | | | | | | 33,744,569 |
| | | | | | | | | | | | | |
| | | | | |
| Healthcare 12.28% | | | | | | | | | | | | | |
| CA Hlth Facs Fing Auth Catholic Hlthcare West Ser A | | 6.00% | | 7/1/2039 | | A | | | | 2,000 | | | 2,120,860 |
| CA Hlth Facs Fing Auth Catholic Hlthcare West Ser G | | 5.50% | | 7/1/2025 | | A | | | | 2,500 | | | 2,619,875 |
| CA Hlth Facs Fing Auth Mtg Ins CA NV Methodist | | 5.00% | | 7/1/2036 | | A | | | | 1,000 | | | 994,080 |
| CA Hlth Facs Fing Auth Providence Hlth & Svcs Ser C | | 6.25% | | 10/1/2024 | | AA | | | | 1,000 | | | 1,146,520 |
| CA Infrastr & Econ Dev Bk Kaiser Hosp Ser A | | 5.55% | | 8/1/2031 | | A+ | | | | 650 | | | 662,928 |
| CA Infrastr & Econ Dev Bk Kaiser Hosp Ser B | | 5.50% | | 8/1/2031 | | A | | | | 1,225 | | | 1,236,650 |
| CA Infrastr & Econ Dev Bk Scripps Resh Inst Ser A | | 5.75% | | 7/1/2030 | | Aa3 | | | | 1,500 | | | 1,509,300 |
| CA Muni Fin Auth Cmnty Hosps Cent CA COP | | 5.25% | | 2/1/2037 | | Baa2 | | | | 1,000 | | | 960,690 |
| CA Muni Fin Auth Cmnty Hosps Cent CA COP(d) | | 5.50% | | 2/1/2039 | | Baa2 | | | | 1,000 | | | 1,001,360 |
| CA Sierra View Loc Hlthcare Dist | | 5.25% | | 7/1/2032 | | A | (c) | | | 1,000 | | | 931,610 |
| CA Statewide Cmntys Dev Auth CA Statewide Inland Regl Ctr Pj | | 5.00% | | 12/1/2017 | | Ba1 | | | | 1,000 | | | 902,000 |
| CA Statewide Cmntys Dev Auth Daughters of Charity Hlth Ser A | | 5.25% | | 7/1/2035 | | BBB | | | | 1,675 | | | 1,493,128 |
| CA Statewide Cmntys Dev Auth Front Porch Cmntys & Svcs Ser A† | | 5.125% | | 4/1/2037 | | BBB | | | | 2,000 | | | 1,734,440 |
| CA Statewide Cmntys Dev Auth Kaiser Ser C Rmkt | | 5.25% | | 8/1/2031 | | A+ | | | | 1,500 | | | 1,532,640 |
| CA Statewide Cmntys Dev Auth Sr Living Sthn CA | | 7.00% | | 11/15/2029 | | BBB | | | | 1,000 | | | 1,071,770 |
| CA Statewide Cmntys Dev Auth Vlycare Hlth Sys Ser A | | 5.125% | | 7/15/2031 | | NR | | | | 1,500 | | | 1,129,500 |
| Rancho Mirage CA Jt Pwrs Fing Auth Eisenhower Med Ctr Ser A | | 5.00% | | 7/1/2021 | | A3 | | | | 1,000 | | | 1,008,220 |
| Territory of Guam Oblig Rev Section 30 Ser A | | 5.75% | | 12/1/2034 | | BBB- | | | | 1,030 | | | 1,057,810 |
See Notes to Financial Statements.
64
Schedule of Investments (continued)
CALIFORNIA TAX FREE FUND September 30, 2009
| | | | | | | | | | | | |
| Investments | | Interest
Rate | | Maturity
Date | | Credit
Rating:
S&P or
Moody’s(a) | | Principal
Amount
(000) | | Value |
| Healthcare (continued) | | | | | | | | | | | | |
| Torrance CA Hosp Rev Torrance Mem Med Ctr Ser A | | 5.50% | | 6/1/2031 | | A+ | | $ | 345 | | $ | 349,130 |
| Torrance CA Hosp Rev Torrance Mem Med Ctr Ser A | | 6.00% | | 6/1/2022 | | A+ | | | 500 | | | 514,990 |
| | | | | | | | | | | | |
| Total | | | | | | | | | | | | 23,977,501 |
| | | | | | | | | | | | |
| | | | | |
| Housing 1.53% | | | | | | | | | | | | |
| CA Hsg Fin Agy Rev Hm Mtg Ser E AMT | | 4.80% | | 8/1/2037 | | AA- | | | 1,115 | | | 913,731 |
| Los Angeles CA Hsg Auth Mtg Ppty Acq Ser A | | 6.25% | | 6/1/2034 | | A | | | 2,000 | | | 2,076,120 |
| | | | | | | | | | | | |
| Total | | | | | | | | | | | | 2,989,851 |
| | | | | | | | | | | | |
| | | | | |
| Lease Obligations 10.90% | | | | | | | | | | | | |
| CA St Pub Wrks Brd Dept Forestry & Fire Ser E | | 5.00% | | 11/1/2024 | | A- | | | 1,550 | | | 1,578,799 |
| CA St Pub Wrks Brd Lease Dept Gen Svcs Teale Data Ctr Ser B (AMBAC) | | 5.25% | | 3/1/2020 | | A- | | | 1,000 | | | 1,021,680 |
| CA St Pub Wrks Brd Regents Univ Ser E(b) | | 5.00% | | 4/1/2034 | | AA- | | | 1,500 | | | 1,548,990 |
| Los Angeles CA Convtn & Exhibit Ctr Auth Ser A | | 5.00% | | 8/15/2020 | | AA- | | | 1,000 | | | 1,063,200 |
| Los Angeles CA Muni Impt Corp Cap Equip Ser A | | 5.00% | | 9/1/2025 | | AA- | | | 2,000 | | | 2,110,180 |
| Los Angeles CA Muni Impt Corp Cap Equip Ser A (AG) | | 5.25% | | 4/1/2019 | | AAA | | | 750 | | | 866,993 |
| Palm Springs CA Fing Auth Convtn Ctr Pj Ser A (NPFGC) | | 5.50% | | 11/1/2035 | | A | | | 1,000 | | | 1,009,860 |
| Puerto Rico Comwlth Infrastr Fing Auth Mepsi Campus Pj Ser A | | 6.50% | | 10/1/2037 | | NR | | | 1,000 | | | 884,690 |
| Puerto Rico Pub Bldgs Auth Rev Govt Facs Ser P GTD | | 6.50% | | 7/1/2030 | | BBB- | | | 1,000 | | | 1,072,180 |
| Rowland CA Wtr Dist Recycled Wtr Pj COP | | 6.50% | | 12/1/2035 | | AA- | | | 1,500 | | | 1,749,945 |
| San Buenaventura CA Ser C COP (AMBAC) | | 5.25% | | 2/1/2031 | | NR | | | 2,575 | | | 2,622,637 |
| San Mateo Cnty CA Jt Pwrs Fing Auth Youth Svcs Campus Ser A | | 5.00% | | 7/15/2024 | | AA+ | | | 1,410 | | | 1,534,108 |
| San Mateo Cnty CA Jt Pwrs Fing Auth Youth Svcs Campus Ser A | | 5.00% | | 7/15/2036 | | AA+ | | | 1,000 | | | 1,029,280 |
| Santa Ana CA Unif Sch Dist Cap Apprec Fing Pj COP (FSA) | | Zero Coupon | | 4/1/2019 | | AAA | | | 2,295 | | | 1,435,041 |
See Notes to Financial Statements.
65
Schedule of Investments (continued)
CALIFORNIA TAX FREE FUND September 30, 2009
| | | | | | | | | | | | | |
| Investments | | Interest
Rate | | Maturity
Date | | Credit
Rating:
S&P or
Moody’s(a) | | | Principal
Amount
(000) | | Value |
| Lease Obligations (continued) | | | | | | | | | | | | | |
| Turlock CA Hlth Fac Rev Emanuel Med Ctr Ser B | | 5.50% | | 10/15/2037 | | BBB | | | $ | 2,000 | | $ | 1,766,820 |
| | | | | | | | | | | | | |
| Total | | | | | | | | | | | | | 21,294,403 |
| | | | | | | | | | | | | |
| | | | | |
| Other Revenue 3.96% | | | | | | | | | | | | | |
| CA Muni Fin Auth High Tech High Chula Vista B† | | 6.00% | | 7/1/2028 | | BB+ | (c) | | | 850 | | | 706,299 |
| CA Muni Fin Auth OCEAA Pj Ser A | | 6.75% | | 10/1/2028 | | NR | | | | 1,445 | | | 1,310,500 |
| CA Statewide Cmntys Dev Auth Huntington Pk Charter Sch Pj A | | 5.15% | | 7/1/2030 | | NR | | | | 500 | | | 362,390 |
| CA Statewide Cmntys Dev Auth Huntington Pk Charter Sch Pj A | | 5.25% | | 7/1/2042 | | NR | | | | 1,225 | | | 827,867 |
| CA Statewide Cmntys Dev Auth Windrush Sch | | 5.50% | | 7/1/2037 | | NR | | | | 1,250 | | | 958,575 |
| Chula Vista CA Rev San Diego Gas Ser E Rmkt | | 5.875% | | 1/1/2034 | | Aa3 | | | | 1,000 | | | 1,063,930 |
| Fontana CA Pub Fin Auth Tax North Fontana Redev Pj Ser A (AMBAC) | | 5.50% | | 9/1/2032 | | A+ | | | | 1,000 | | | 1,002,600 |
| Oakland CA Jt Pwrs Fing Auth | | 5.50% | | 9/2/2024 | | A- | | | | 390 | | | 396,778 |
| Santa Cruz CA Cnty Redev Agy Live Oak/Soquel Cmnty Impt Ser A | | 6.625% | | 9/1/2029 | | A | | | | 500 | | | 551,325 |
| Santa Cruz CA Cnty Redev Agy Live Oak/Soquel Cmnty Impt Ser A | | 7.00% | | 9/1/2036 | | A | | | | 500 | | | 559,500 |
| | | | | | | | | | | | | |
| Total | | | | | | | | | | | | | 7,739,764 |
| | | | | | | | | | | | | |
| | | | | |
| Pre-Refunded 9.26% | | | | | | | | | | | | | |
| CA Edl Facs Auth Rev Pooled College & Univ Ser C ETM | | 6.50% | | 6/1/2020 | | Baa3 | | | | 3,000 | | | 3,120,240 |
| CA Edl Facs Auth Rev Scripps College | | 5.25% | | 8/1/2026 | | A1 | | | | 1,145 | | | 1,242,646 |
| CA St (AMBAC)(b) | | 5.00% | | 4/1/2031 | | A | | | | 9,990 | | | 11,560,728 |
| CA Statewide Cmntys Dev Auth CHF Irvine LLC UCI East Campus | | 5.00% | | 5/15/2038 | | Baa2 | | | | 1,000 | | | 875,050 |
| El Monte CA Sch Dist Ser A (FSA) | | 6.25% | | 5/1/2025 | | AAA | | | | 1,230 | | | 1,275,854 |
| | | | | | | | | | | | | |
| Total | | | | | | | | | | | | | 18,074,518 |
| | | | | | | | | | | | | |
| | | | | |
| Special Tax 8.29% | | | | | | | | | | | | | |
| Apple Vly CA Redev Agy Veda Pj Area | | 4.75% | | 6/1/2037 | | BBB+ | | | | 1,500 | | | 1,291,560 |
| Carpinteria CA Santn Dist Spl Assmnt Ltd Ser 2007-1-A | | 6.90% | | 9/2/2039 | | NR | | | | 495 | | | 511,855 |
| Dana Point CA Cmnty Facs Dist No 2006-1 | | 5.625% | | 9/1/2033 | | NR | | | | 550 | | | 459,619 |
See Notes to Financial Statements.
66
Schedule of Investments (continued)
CALIFORNIA TAX FREE FUND September 30, 2009
| | | | | | | | | | | | | |
| Investments | | Interest
Rate | | Maturity
Date | | Credit
Rating:
S&P or
Moody’s(a) | | | Principal
Amount
(000) | | Value |
| Special Tax (continued) | | | | | | | | | | | | | |
| Dana Point CA Cmnty Facs Dist No 2006-1 | | 5.625% | | 9/1/2037 | | NR | | | $ | 940 | | $ | 775,519 |
| Inglewood CA Redev Agy Tax Alloc Sub Lien Ser A-1 (AMBAC) | | 5.00% | | 5/1/2033 | | BBB+ | | | | 1,535 | | | 1,318,703 |
| Jurupa CA Cmnty Svcs Dist Spl Tax Cmnty Facs Dist 18 Eastvale Ser A | | 5.00% | | 9/1/2036 | | NR | | | | 1,710 | | | 1,333,868 |
| Lancaster CA Redev Agy Tax Alloc Comb Redev Pj Areas | | 6.875% | | 8/1/2034 | | A | | | | 1,000 | | | 1,081,090 |
| Los Angeles Cnty CA Pub Wrks Fing Auth Los Angeles Regl Pk Open Space (FSA) | | 5.25% | | 10/1/2018 | | AAA | | | | 1,000 | | | 1,183,910 |
| Redding CA Redev Agy Shastec Redev Pj | | 5.00% | | 9/1/2029 | | BBB+ | | | | 600 | | | 548,418 |
| RNR Sch Fing Auth CA Spl Tax Cmnty Facs Dist No 92-1 Ser A (AMBAC) | | 5.625% | | 9/1/2030 | | A | (c) | | | 3,860 | | | 3,862,316 |
| San Diego CA Redev Agy Tax Alloc North Pk Redev Pj Sub Ser A | | 7.00% | | 11/1/2039 | | A- | | | | 1,000 | | | 1,069,410 |
| San Diego CA Spl Tax Cmnty Facs Dist No 4 Ser A | | 6.00% | | 9/1/2037 | | NR | | | | 1,000 | | | 879,390 |
| San Francisco CA City & Cnty Redev Agy Mission Bay South Redev Ser D | | 6.625% | | 8/1/2039 | | BBB | | | | 1,500 | | | 1,584,615 |
| South Orange Cnty CA Pub Fing Auth Ladera Ranch Ser A (AMBAC) | | 4.625% | | 8/15/2026 | | BBB+ | | | | 310 | | | 279,155 |
| | | | | | | | | | | | | |
| Total | | | | | | | | | | | | | 16,179,428 |
| | | | | | | | | | | | | |
| | | | | |
| Tax Revenue 2.88% | | | | | | | | | | | | | |
| Los Angeles Cnty CA Metro Transn Auth Prop A-1st Tier Sr Ser B | | 5.00% | | 7/1/2031 | | AAA | | | | 1,635 | | | 1,744,545 |
| Los Angeles Cnty CA Metro Transn Auth Prop C 2nd Sr Ser A (FSA) | | 4.50% | | 7/1/2030 | | AAA | | | | 1,000 | | | 1,014,460 |
| Los Angeles Cnty CA Metro Transn Auth Ser A (AG) | | 5.00% | | 7/1/2022 | | AAA | | | | 2,000 | | | 2,272,460 |
| Virgin Islands Pub Fin Auth Rev Matching Fd Ln Diago Ser A | | 6.75% | | 10/1/2037 | | BBB | | | | 555 | | | 587,212 |
| | | | | | | | | | | | | |
| Total | | | | | | | | | | | | | 5,618,677 |
| | | | | | | | | | | | | |
| | | | | |
| Tobacco 1.66% | | | | | | | | | | | | | |
| Golden St Tob Securitization Corp CA Asset Bkd Sr Ser A-1 | | 5.75% | | 6/1/2047 | | BBB | | | | 1,245 | | | 1,039,214 |
| Golden St Tob Securitization Corp CA Asset Bkd Sr Ser A1 | | 5.125% | | 6/1/2047 | | BBB | | | | 1,200 | | | 902,556 |
| Golden St Tob Securitization Corp CA Enhanced Asset Bkd Ser A | | 5.00% | | 6/1/2045 | | A- | | | | 1,000 | | | 936,940 |
See Notes to Financial Statements.
67
Schedule of Investments (continued)
CALIFORNIA TAX FREE FUND September 30, 2009
| | | | | | | | | | | | | |
| Investments | | Interest
Rate | | Maturity
Date | | Credit
Rating:
S&P or
Moody’s(a) | | | Principal
Amount
(000) | | Value |
| Tobacco (continued) | | | | | | | | | | | | | |
| Silicon Vly CA Tob Securitization Auth Cap Apprec Turbo Santa Clara A | | Zero Coupon | | 6/1/2036 | | BBB | (c) | | $ | 3,500 | | $ | 361,585 |
| | | | | | | | | | | | | |
| Total | | | | | | | | | | | | | 3,240,295 |
| | | | | | | | | | | | | |
| | | | | |
| Transportation 2.78% | | | | | | | | | | | | | |
| Fresno CA Arpt Rev Ser A (FSA) | | 5.50% | | 7/1/2030 | | AAA | | | | 1,500 | | | 1,530,135 |
| Los Angeles CA Dept of Arpts Los Angeles Intl Arpt Ser A AMT | | 5.50% | | 5/15/2021 | | AA | | | | 2,350 | | | 2,497,134 |
| Palm Springs CA Arpt Sub Palm Springs Intl Arpt AMT | | 5.30% | | 7/1/2013 | | NR | | | | 200 | | | 186,644 |
| Palm Springs CA Arpt Sub Palm Springs Intl Arpt AMT | | 6.00% | | 7/1/2018 | | NR | | | | 250 | | | 225,350 |
| Palm Springs CA Arpt Sub Palm Springs Intl Arpt AMT | | 6.40% | | 7/1/2023 | | NR | | | | 300 | | | 261,051 |
| Palm Springs CA Arpt Sub Palm Springs Intl Arpt AMT | | 6.50% | | 7/1/2027 | | NR | | | | 260 | | | 219,866 |
| San Francisco CA City & Cnty Arpts Commn Spl Facs Lease SFO Fuel Ser A AMT (FSA) | | 5.75% | | 1/1/2014 | | AAA | | | | 500 | | | 501,510 |
| | | | | | | | | | | | | |
| Total | | | | | | | | | | | | | 5,421,690 |
| | | | | | | | | | | | | |
| | | | | |
| Utilities 20.99% | | | | | | | | | | | | | |
| CA Eastern Muni Wtr Dist Ser H | | 5.00% | | 7/1/2033 | | AA | | | | 2,500 | | | 2,635,525 |
| CA Pollutn Ctrl Fing Auth Republic Svcs Inc Pj Ser C AMT | | 5.25% | | 6/1/2023 | | BBB | | | | 810 | | | 840,399 |
| CA Pollutn Ctrl Fing Auth Solid Wst Mgmt Inc Pj Ser A2 AMT | | 5.40% | | 4/1/2025 | | BBB | | | | 1,000 | | | 1,003,250 |
| CA Pollutn Ctrl Fing Auth Solid Wst Mgmt Inc Pj Ser B AMT | | 5.00% | | 7/1/2027 | | BBB | | | | 1,000 | | | 938,340 |
| CA St Dept of Wtr Res Cent Vly Pj Ser AE | | 5.00% | | 12/1/2026 | | AAA | | | | 2,000 | | | 2,249,280 |
| Chino Basin Desalter Auth Ser A (AG) | | 5.00% | | 6/1/2027 | | AAA | | | | 2,000 | | | 2,151,060 |
| Fresno CA Swr Rev Ser A (AG) | | 5.00% | | 9/1/2025 | | AAA | | | | 1,530 | | | 1,685,785 |
| Imperial CA Wtr Fac COP (NPFGC)(FGIC) | | 5.00% | | 10/15/2020 | | A | | | | 3,250 | | | 3,352,668 |
| Long Beach CA Bd Fin Auth Natural Gas Ser A | | 5.50% | | 11/15/2037 | | A | | | | 1,000 | | | 965,290 |
| Los Angeles CA Dept of Wtr & Pwr Sys Sub Ser A-1 (FSA) | | 5.00% | | 7/1/2015 | | AAA | | | | 1,000 | | | 1,160,680 |
| M-S-R Enrg Auth CA Ser C | | 7.00% | | 11/1/2034 | | A | | | | 2,000 | | | 2,439,840 |
See Notes to Financial Statements.
68
Schedule of Investments (continued)
CALIFORNIA TAX FREE FUND September 30, 2009
| | | | | | | | | | | | | | |
| Investments | | Interest
Rate | | Maturity
Date | | Credit
Rating:
S&P or
Moody’s(a) | | Principal
Amount
(000) | | | Value | |
| Utilities (continued) | | | | | | | | | | | | | | |
| Northern CA Pwr Agy Rev Geothermal Pj No 3 Ser A | | 5.50% | | 7/1/2022 | | A1 | | $ | 1,985 | | | $ | 2,274,830 | |
| Northern CA Pwr Agy Rev Hydroelectronic No 1-C (AG) | | 5.00% | | 7/1/2024 | | AAA | | | 1,760 | | | | 1,937,707 | |
| Riverside CA Elec Rev Issue D (FSA) | | 5.00% | | 10/1/2027 | | AAA | | | 2,550 | | | | 2,779,118 | |
| Sacramento CA Muni Util Dist Ser U (FSA)(b) | | 5.00% | | 8/15/2023 | | AAA | | | 1,920 | | | | 2,142,835 | |
| Sacramento CA Muni Util Dist Ser U (FSA)(b) | | 5.00% | | 8/15/2024 | | AAA | | | 1,540 | | | | 1,718,732 | |
| Sacramento CA Muni Util Dist Ser U (FSA)(b) | | 5.00% | | 8/15/2025 | | AAA | | | 1,540 | | | | 1,718,732 | |
| Sacramento CA Regl Cnty Santn Dist Ser A (NPFGC)(FGIC) | | 5.25% | | 12/1/2023 | | AA | | | 1,500 | | | | 1,776,210 | |
| San Diego CA Pub Facs Fing Auth Sr Ser A | | 5.25% | | 5/15/2039 | | A+ | | | 1,500 | | | | 1,614,825 | |
| Santa Margarita-Dana CA Point Auth Wtr Dist Impt Ser 2-3-4 A | | 5.25% | | 8/1/2032 | | AA | | | 2,000 | | | | 2,162,560 | |
| Shasta CA Jt Pwrs Fing Auth Cnty Admin Bldg Pj Ser A (NPFCG) | | 5.25% | | 4/1/2023 | | A | | | 675 | | | | 701,548 | |
| Sthn CA Pub Pwr Auth Pj No 1 Ser A | | 5.00% | | 11/1/2033 | | A | | | 1,000 | | | | 1,002,750 | |
| Sthn CA Pub Pwr Auth Sub Sthn Transmission Ser A | | 5.00% | | 7/1/2020 | | Aa3 | | | 1,500 | | | | 1,722,165 | |
| | | | | | | | | | | | | | |
| Total | | | | | | | | | | | | | 40,974,129 | |
| | | | | | | | | | | | | | |
| Total Municipal Bonds (cost $195,067,570) | | | | | | | | | | | | | 200,746,847 | |
| | | | | | | | | | | | | | |
| | | | | |
| | | | | | | | | Shares
(000) | | | | |
| SHORT-TERM INVESTMENTS 0.26% | | | | | | | | | | | | | | |
| | | | | |
| Money Market Mutual Fund 0.00% | | | | | | | | | | | | | | |
| Dreyfus General CA Municipal Money Market Fund Class A | | | | | | | | | – | (g) | | | 26 | |
| | | | | | | | | | | | | | |
| | | | | |
| | | | | | | | | Principal
Amount
(000) | | | | |
| | | | | |
| Variable Rate Demand Note 0.26% | | | | | | | | | | | | | | |
| CA St Floater Ser DCL 048 (FSA)(e) | | 0.60% | | 10/1/2009 | | AAA | | $ | 500 | | | | 500,000 | |
| | | | | | | | | | | | | | |
| Total Short-Term Investments (cost $500,026) | | | | | | | | | 500,026 | |
| | | | | | | | | | | | | | |
| Total Investments in Securities 103.08% (cost $195,567,596) | | | | | | | | | 201,246,873 | |
| | | | | | | | | | | | | | |
| Liabilities in Excess of Cash and Other Assets(f) (3.08%) | | | | | | | | | (6,005,351 | ) |
| | | | | | | | | | | | | | |
| Net Assets 100.00% | | | | | | | | $ | 195,241,522 | |
| | | | | | | | | | | | | | |
See Notes to Financial Statements.
69
Schedule of Investments (concluded)
CALIFORNIA TAX FREE FUND September 30, 2009
Open Futures Contracts at September 30, 2009:
| | | | | | | | | | | | |
| Type | | Expiration | | Contracts | | Position | | Market
Value | | Unrealized
Depreciation |
| U.S. 30-Year Treasury Bond | | December 2009 | | 117 | | Short | | $ | (14,200,875) | | $ | (310,870) |
See Notes to Financial Statements.
70
Schedule of Investments
CONNECTICUT TAX FREE FUND September 30, 2009
| | | | | | | | | | | | |
| Investments | | Interest
Rate | | Maturity
Date | | Credit
Rating:
S&P or
Moody’s(a) | | Principal
Amount
(000) | | Value |
| MUNICIPAL BONDS 102.17% | | | | | | | | | | | | |
| | | | | |
| Corporate-Backed 3.93% | | | | | | | | | | | | |
| CT St Dev Auth Govt Lease (NPFGC) | | 6.60% | | 6/15/2014 | | A | | $ | 500 | | $ | 500,060 |
| New Haven CT Solid Wst Auth | | 5.375% | | 6/1/2028 | | A | | | 1,500 | | | 1,613,175 |
| Sprague CT Envr Impt Intl Paper Co Pj Ser A AMT | | 5.70% | | 10/1/2021 | | BBB | | | 900 | | | 900,117 |
| Virgin Islands Pub Fin Auth Sr Secd Hovensa Refinery AMT | | 4.70% | | 7/1/2022 | | BBB | | | 2,000 | | | 1,830,620 |
| | | | | | | | | | | | |
| Total | | | | | | | | | | | | 4,843,972 |
| | | | | | | | | | | | |
| | | | | |
| Education 27.95% | | | | | | | | | | | | |
| CT St Higher Ed Supplement Ln Auth Chesla Ln Pg Ser A | | 5.05% | | 11/15/2027 | | Aa3 | | | 800 | | | 849,152 |
| CT St Higher Ed Supplement Ln Auth Sr Fam Ed Ln Pg Ser A AMT (NPFGC) | | 4.80% | | 11/15/2022 | | Aa3 | | | 1,935 | | | 1,892,701 |
| CT St Hlth & Edl Facs Auth (RADIAN) | | 5.35% | | 7/1/2031 | | BBB- | | | 695 | | | 638,100 |
| CT St Hlth & Edl Facs Auth Chase Collegiate Sch Ser A (RADIAN) | | 4.00% | | 7/1/2019 | | BBB- | | | 100 | | | 87,969 |
| CT St Hlth & Edl Facs Auth Chase Collegiate Sch Ser A (RADIAN) | | 5.00% | | 7/1/2027 | | BBB- | | | 100 | | | 89,164 |
| CT St Hlth & Edl Facs Auth CT College Ser G (NPFGC) | | 4.50% | | 7/1/2037 | | A | | | 620 | | | 628,054 |
| CT St Hlth & Edl Facs Auth Fairfield Univ Ser M | | 5.00% | | 7/1/2026 | | A- | | | 450 | | | 479,466 |
| CT St Hlth & Edl Facs Auth Fairfield Univ Ser N | | 5.00% | | 7/1/2026 | | A- | | | 2,000 | | | 2,118,900 |
| CT St Hlth & Edl Facs Auth Fairfield Univ Ser N | | 5.00% | | 7/1/2029 | | A- | | | 2,000 | | | 2,108,420 |
| CT St Hlth & Edl Facs Auth Loomis Chaffee Sch Ser F (AMBAC) | | 4.00% | | 7/1/2022 | | A2 | | | 95 | | | 102,277 |
| CT St Hlth & Edl Facs Auth Norwich Free Academy Ser A (AMBAC) | | 5.00% | | 7/1/2034 | | A2 | | | 1,250 | | | 1,286,537 |
| CT St Hlth & Edl Facs Auth Quinnipiac Univ Ser H (AMBAC) | | 5.00% | | 7/1/2036 | | A2 | | | 1,015 | | | 1,041,187 |
| CT St Hlth & Edl Facs Auth Quinnipiac Univ Ser I (NPFGC) | | 5.00% | | 7/1/2026 | | A | | | 3,000 | | | 3,122,760 |
| CT St Hlth & Edl Facs Auth Quinnipiac Univ Ser I (NPFGC) | | 5.00% | | 7/1/2027 | | A | | | 1,000 | | | 1,038,930 |
| CT St Hlth & Edl Facs Auth Renbrook Sch Ser A (AMBAC) | | 5.00% | | 7/1/2030 | | NR | | | 465 | | | 495,341 |
See Notes to Financial Statements.
71
Schedule of Investments (continued)
CONNECTICUT TAX FREE FUND September 30, 2009
| | | | | | | | | | | | |
| Investments | | Interest
Rate | | Maturity
Date | | Credit
Rating:
S&P or
Moody’s(a) | | Principal
Amount
(000) | | Value |
| Education (continued) | | | | | | | | | | | | |
| CT St Hlth & Edl Facs Auth Renbrook Sch Ser A (AMBAC) | | 5.00% | | 7/1/2037 | | NR | | $ | 700 | | $ | 729,582 |
| CT St Hlth & Edl Facs Auth Salisbury Sch Ser C (AG)(b) | | 5.00% | | 7/1/2028 | | AAA | | | 4,050 | | | 4,351,462 |
| CT St Hlth & Edl Facs Auth Salisbury Sch Ser C (AG)(b) | | 5.00% | | 7/1/2033 | | AAA | | | 1,500 | | | 1,611,653 |
| CT St Hlth & Edl Facs Auth Salisbury Sch Ser C (AG)(b) | | 5.00% | | 7/1/2038 | | AAA | | | 4,610 | | | 4,953,145 |
| CT St Hlth & Edl Facs Auth Trinity College Ser J (NPFGC) | | 4.25% | | 7/1/2031 | | A1 | | | 1,000 | | | 1,006,510 |
| CT St Hlth & Edl Facs Auth Univ Hartford Ser E (RADIAN) | | 5.25% | | 7/1/2032 | | BBB- | | | 2,900 | | | 2,706,599 |
| CT St Hlth & Edl Facs Auth Unref Bal Sacred Hrt Ser C | | 6.50% | | 7/1/2016 | | BBB | | | 210 | | | 210,733 |
| CT St Hlth & Edl Facs Auth Yale Univ Ser Z-1 | | 5.00% | | 7/1/2042 | | AAA | | | 1,000 | | | 1,060,930 |
| Univ of CT Ser A | | 5.00% | | 4/1/2018 | | AA | | | 1,580 | | | 1,837,698 |
| | | | | | | | | | | | |
| Total | | | | | | | | | | | | 34,447,270 |
| | | | | | | | | | | | |
| | | | | |
| General Obligation 23.41% | | | | | | | | | | | | |
| Bridgeport CT Ser C (NPFGC)(FGIC) | | 4.75% | | 8/15/2021 | | A | | | 1,000 | | | 1,002,420 |
| CT St Regl Sch Dist No 5 | | 5.00% | | 8/15/2019 | | Aa2 | | | 555 | | | 645,704 |
| CT St Ser A | | 5.00% | | 2/15/2027 | | AA | | | 1,000 | | | 1,125,610 |
| CT St Ser A | | 5.00% | | 4/15/2028 | | AA | | | 2,555 | | | 2,837,430 |
| CT St Ser B | | 4.75% | | 5/1/2023 | | AA | | | 1,685 | | | 1,840,744 |
| CT St Ser B | | 4.75% | | 5/1/2024 | | AA | | | 2,000 | | | 2,168,820 |
| CT St Ser B | | 5.00% | | 5/1/2025 | | AA | | | 2,500 | | | 2,764,750 |
| CT St Ser B (AMBAC) | | 5.25% | | 6/1/2019 | | AA | | | 1,370 | | | 1,665,139 |
| Hartford CT Ser A (AG) | | 5.00% | | 8/15/2028 | | AAA | | | 1,740 | | | 1,919,342 |
| Hartford CT Ser A (AMBAC) | | 5.00% | | 8/15/2024 | | A | | | 1,470 | | | 1,607,651 |
| Hartford CT Ser A (AMBAC) | | 5.00% | | 8/15/2026 | | A | | | 1,000 | | | 1,085,800 |
| Montville CT | | 6.70% | | 6/15/2010 | | Aa3 | | | 575 | | | 600,133 |
| New Haven CT (AMBAC) | | 5.00% | | 11/1/2020 | | A- | | | 2,000 | | | 2,166,900 |
| New Haven CT Ser A (AG) | | 4.75% | | 3/1/2028 | | AAA | | | 1,145 | | | 1,212,463 |
| New Haven CT Unref Bal Ser B (NPFGC)(FGIC) | | 5.00% | | 11/1/2019 | | A- | | | 560 | | | 602,017 |
| Northern Mariana Islands Comwlth Ser A | | 5.00% | | 6/1/2030 | | NR | | | 2,485 | | | 2,044,757 |
| Puerto Rico Comwlth Cap Apprec Pub Impt | | Zero Coupon | | 7/1/2018 | | BBB- | | | 2,035 | | | 1,270,288 |
See Notes to Financial Statements.
72
Schedule of Investments (continued)
CONNECTICUT TAX FREE FUND September 30, 2009
| | | | | | | | | | | | |
| Investments | | Interest
Rate | | Maturity
Date | | Credit
Rating:
S&P or
Moody’s(a) | | Principal
Amount
(000) | | Value |
| General Obligation (continued) | | | | | | | | | | | | |
| Puerto Rico Comwlth Ser A | | 5.375% | | 7/1/2033 | | BBB- | | $ | 1,000 | | $ | 976,970 |
| Puerto Rico Comwlth Unref Bal Pub Impt (FSA) | | 5.125% | | 7/1/2030 | | AAA | | | 945 | | | 955,971 |
| Redding CT | | 6.60% | | 4/15/2010 | | Aaa | | | 100 | | | 103,309 |
| Territory of Guam Ser A | | 7.00% | | 11/15/2039 | | B+ | | | 235 | | | 257,645 |
| | | | | | | | | | | | |
| Total | | | | | | | | | | | | 28,853,863 |
| | | | | | | | | | | | |
| | | | | |
| Healthcare 10.74% | | | | | | | | | | | | |
| CT St Dev Auth Hlth Facs Alzheimers Res Ctr Inc Pj | | 5.50% | | 8/15/2027 | | NR | | | 1,380 | | | 1,049,476 |
| CT St Dev Auth Rev Duncaster Inc Pj (RADIAN) | | 5.125% | | 8/1/2022 | | BBB | | | 235 | | | 230,335 |
| CT St Hlth & Edl Facs Auth Bridgeport Hosp Ser A (NPFGC) | | 6.625% | | 7/1/2018 | | A | | | 1,250 | | | 1,250,213 |
| CT St Hlth & Edl Facs Auth Catholic Hlth East Ser F (NPFGC) | | 5.625% | | 11/15/2020 | | A1 | | | 325 | | | 328,390 |
| CT St Hlth & Edl Facs Auth Child Care Facs Pg Ser C (AMBAC) | | 5.625% | | 7/1/2029 | | NR | | | 970 | | | 982,309 |
| CT St Hlth & Edl Facs Auth CT College Ser E (NPFGC) | | 5.00% | | 7/1/2032 | | A | | | 1,050 | | | 1,090,226 |
| CT St Hlth & Edl Facs Auth Hosp for Spl Care Ser C (RADIAN) | | 5.25% | | 7/1/2037 | | BBB- | | | 1,345 | | | 1,189,585 |
| CT St Hlth & Edl Facs Auth William W Backus Hosp Ser G (FSA) | | 5.00% | | 7/1/2035 | | AAA | | | 1,000 | | | 1,016,880 |
| CT St Hlth & Edl Facs Auth Yale New Haven Hosp Ser J-1 (AMBAC) | | 5.00% | | 7/1/2024 | | A1 | | | 1,715 | | | 1,783,463 |
| CT St Hlth & Edl Facs Auth Yale New Haven Hosp Ser J-1 (AMBAC) | | 5.00% | | 7/1/2031 | | A1 | | | 3,500 | | | 3,571,960 |
| Territory of Guam Oblig Rev Section 30 Ser A | | 5.75% | | 12/1/2034 | | BBB- | | | 720 | | | 739,440 |
| | | | | | | | | | | | |
| Total | | | | | | | | | | | | 13,232,277 |
| | | | | | | | | | | | |
| | | | | |
| Housing 1.22% | | | | | | | | | | | | |
| CT St Hsg Fin Auth Hsg Mtg Fin Ser F Rmkt AMT (AMBAC) | | 4.90% | | 11/15/2035 | | AAA | | | 1,000 | | | 990,060 |
| CT St Hsg Fin Auth Spl Oblig Grp Home Mtg (AMBAC) | | 5.85% | | 6/15/2030 | | NR | | | 500 | | | 513,135 |
| | | | | | | | | | | | |
| Total | | | | | | | | | | | | 1,503,195 |
| | | | | | | | | | | | |
| | | | | |
| Lease Obligations 0.75% | | | | | | | | | | | | |
| Puerto Rico Comwlth Infrastr Fing Auth Mepsi Campus Pj Ser A | | 6.25% | | 10/1/2024 | | NR | | | 1,000 | | | 924,070 |
| | | | | | | | | | | | |
See Notes to Financial Statements.
73
Schedule of Investments (continued)
CONNECTICUT TAX FREE FUND September 30, 2009
| | | | | | | | | | | | |
| Investments | | Interest
Rate | | Maturity
Date | | Credit
Rating:
S&P or
Moody’s(a) | | Principal
Amount
(000) | | Value |
| Other Revenue 3.16% | | | | | | | | | | | | |
| CT St Hlth & Edl Facs Auth Child Care Facs Pg Ser F (AG) | | 5.00% | | 7/1/2031 | | AAA | | $ | 1,750 | | $ | 1,860,880 |
| CT St Hlth & Edl Facs Auth Trinity College Ser H (NPFGC) | | 4.75% | | 7/1/2023 | | A+ | | | 1,030 | | | 1,079,296 |
| Puerto Rico Pub Bldgs Auth Rev Unref Bal Govt Facs Ser D GTD | | 5.25% | | 7/1/2036 | | BBB- | | | 1,000 | | | 958,360 |
| | | | | | | | | | | | |
| Total | | | | | | | | | | | | 3,898,536 |
| | | | | | | | | | | | |
| | | | | |
| Pre-Refunded 9.85% | | | | | | | | | | | | |
| Bridgeport CT Ser C (FGIC) | | 5.00% | | 8/15/2020 | | A- | | | 500 | | | 537,840 |
| CT St Hlth & Edl Facs Auth CT St Univ Sys Ser E (FGIC) | | 5.00% | | 11/1/2033 | | AA | | | 750 | | | 839,812 |
| CT St Ser B | | 5.60% | | 6/15/2020 | | Aa3 | | | 250 | | | 258,468 |
| New Haven CT Ser A ETM (AMBAC) | | 5.00% | | 11/1/2021 | | A- | | | 30 | | | 31,584 |
| New Haven CT Ser C ETM (NPFGC) | | 5.00% | | 11/1/2021 | | A | | | 10 | | | 11,541 |
| New Haven CT Unref Bal Ser A (AMBAC) | | 5.00% | | 11/1/2021 | | A- | | | 970 | | | 1,066,486 |
| Puerto Rico Comwlth Hwy & Transn Auth Ser D (FSA) | | 5.00% | | 7/1/2032 | | AAA | | | 410 | | | 455,018 |
| Puerto Rico Elec Pwr Auth Ser II | | 5.25% | | 7/1/2031 | | A3 | | | 1,000 | | | 1,124,840 |
| Puerto Rico Elec Pwr Auth Ser II (FSA) | | 5.125% | | 7/1/2026 | | AAA | | | 1,925 | | | 2,156,038 |
| Puerto Rico Elec Pwr Auth Ser NN (NPFGC) | | 5.00% | | 7/1/2032 | | AAA | | | 1,500 | | | 1,707,180 |
| Puerto Rico Pub Fin Corp Comwlth Approp Ser E | | 5.50% | | 8/1/2029 | | Aaa | | | 750 | | | 824,903 |
| Univ of CT Rev Student Fee Ser A | | 6.00% | | 11/15/2021 | | AA- | | | 390 | | | 418,205 |
| Univ of CT Rev Student Fee Ser A (FGIC) | | 5.75% | | 11/15/2020 | | Aa3 | | | 205 | | | 219,258 |
| Waterbury CT Ser A (FSA) | | 5.125% | | 4/1/2022 | | AAA | | | 2,250 | | | 2,481,682 |
| | | | | | | | | | | | |
| Total | | | | | | | | | | | | 12,132,855 |
| | | | | | | | | | | | |
| | | | | |
| Special Tax 1.79% | | | | | | | | | | | | |
| CT St Spl Tax Oblig Transn Infrastr Ser A (AMBAC) | | 5.00% | | 8/1/2023 | | AA | | | 1,500 | | | 1,674,465 |
| Georgetown Spl Taxing Dist CT Ser A | | 5.125% | | 10/1/2036 | | NR | | | 985 | | | 526,187 |
| | | | | | | | | | | | |
| Total | | | | | | | | | | | | 2,200,652 |
| | | | | | | | | | | | |
| | | | | |
| Tax Revenue 3.32% | | | | | | | | | | | | |
| Puerto Rico Sales Tax Fing Corp 1st Sub Ser A | | 5.25% | | 8/1/2027 | | A+ | | | 1,000 | | | 1,072,910 |
| Puerto Rico Sales Tax Fing Corp Ser A | | 5.25% | | 8/1/2057 | | AA- | | | 1,000 | | | 1,035,580 |
| Virgin Islands Pub Fin Auth Rev Gross Rcpts Taxes Ln Nts (NPFGC)(FGIC) | | 5.00% | | 10/1/2025 | | A | | | 1,500 | | | 1,514,970 |
See Notes to Financial Statements.
74
Schedule of Investments (continued)
CONNECTICUT TAX FREE FUND September 30, 2009
| | | | | | | | | | | | |
| Investments | | Interest
Rate | | Maturity
Date | | Credit
Rating:
S&P or
Moody’s(a) | | Principal
Amount
(000) | | Value |
| Tax Revenue (continued) | | | | | | | | | | | | |
| Virgin Islands Pub Fin Auth Rev Matching Fd Ln Diago Ser A | | 6.75% | | 10/1/2037 | | BBB | | $ | 440 | | $ | 465,538 |
| | | | | | | | | | | | |
| Total | | | | | | | | | | | | 4,088,998 |
| | | | | | | | | | | | |
| | | | | |
| Transportation 0.48% | | | | | | | | | | | | |
| Puerto Rico Comwlth Hwy & Transn Auth Unref Bal Ser D (FSA) | | 5.00% | | 7/1/2032 | | AAA | | | 590 | | | 596,272 |
| | | | | | | | | | | | |
| | | | | |
| Utilities 15.57% | | | | | | | | | | | | |
| CT St Dev Auth Lt & Pwr B AMT | | 5.95% | | 9/1/2028 | | Baa1 | | | 2,550 | | | 2,577,030 |
| CT St Dev Auth Solid Wst Disp PSEG Pwr LLC Pj Ser A AMT | | 5.75% | | 11/1/2037 | | Baa1 | | | 1,500 | | | 1,497,855 |
| CT St Dev Auth Wtr Fac Aquarion Wtr Co of CT Pj AMT (XLCA) | | 4.70% | | 7/1/2036 | | NR | | | 2,000 | | | 1,691,080 |
| CT St Dev Auth Wtr Fac Aquarion Wtr Co of CT Pj AMT (XLCA) | | 5.00% | | 7/1/2038 | | NR | | | 3,700 | | | 3,268,062 |
| CT St Dev Auth Wtr Fac Bridgeport AMT TCRS (AMBAC) | | 6.15% | | 4/1/2035 | | A | | | 500 | | | 501,540 |
| CT St Dev Auth Wtr Fac Wtr Co of CT Pj Ser A AMT (NPFGC)(FGIC) | | 5.00% | | 10/1/2040 | | A | | | 500 | | | 453,855 |
| CT St Muni Elec Enrg Cooperative Ser A (AMBAC) | | 5.00% | | 1/1/2022 | | Aa3 | | | 1,650 | | | 1,837,093 |
| Naugatuck CT Incineration Facs Pj Ser A AMT COP (AMBAC) | | 5.00% | | 6/15/2022 | | A2 | | | 250 | | | 253,630 |
| Puerto Rico Elec Pwr Auth Ser TT | | 5.00% | | 7/1/2037 | | A3 | | | 1,500 | | | 1,497,645 |
| Puerto Rico Elec Pwr Auth Ser WW | | 5.00% | | 7/1/2028 | | A3 | | | 1,500 | | | 1,540,500 |
| South Cent CT Regl Wtr Auth 22nd Ser (FSA) | | 5.00% | | 8/1/2038 | | AAA | | | 2,000 | | | 2,116,820 |
| Stamford CT Wtr Pollutn Ctrl Ser A | | 5.00% | | 11/15/2032 | | AA+ | | | 1,000 | | | 1,046,790 |
| Virgin Islands Wtr & Pwr Auth Ser A | | 5.00% | | 7/1/2031 | | BBB- | | | 1,000 | | | 904,070 |
| | | | | | | | | | | | |
| Total | | | | | | | | | | | | 19,185,970 |
| | | | | | | | | | | | |
| Total Municipal Bonds (cost $124,321,298) | | | | | | | | 125,907,930 |
| | | | | | | | | | | | |
See Notes to Financial Statements.
75
Schedule of Investments (concluded)
CONNECTICUT TAX FREE FUND September 30, 2009
| | | | | | | | | | | | | |
| Investments | | | | | | | | Shares
(000) | | | Value | |
| SHORT-TERM INVESTMENT 0.00% | | | | | | | | | | | | | |
| | | | | |
| Money Market Mutual Fund | | | | | | | | | | | | | |
| Dreyfus CT Municipal Cash Management (cost $6) | | | | | | | | – | (g) | | $ | 6 | |
| | | | | | | | | | | | | |
| Total Investments in Securities 102.17% (cost $124,321,304) | | | | | | | | 125,907,936 | |
| | | | | | | | | | | | | |
| Liabilities in Excess of Cash and Other Assets(f) (2.17%) | | | | | | | | (2,671,971 | ) |
| | | | | | | | | | | | | |
| Net Assets 100.00% | | | | | | | $ | 123,235,965 | |
| | | | | | | | | | | | | |
Open Futures Contracts at September 30, 2009:
| | | | | | | | | | | | |
| Type | | Expiration | | Contracts | | Position | | Market
Value | | Unrealized
Depreciation |
| U.S. 30-Year Treasury Bond | | December 2009 | | 132 | | Short | | $ | (16,021,500) | | $ | (351,283) |
See Notes to Financial Statements.
76
Schedule of Investments
HAWAII TAX FREE FUND September 30, 2009
| | | | | | | | | | | | |
| Investments | | Interest
Rate | | Maturity
Date | | Credit
Rating:
S&P or
Moody’s(a) | | Principal
Amount
(000) | | Value |
| MUNICIPAL BONDS 100.46% | | | | | | | | | | | | |
| | | | | |
| Corporate-Backed 2.26% | | | | | | | | | | | | |
| HI St Dept Transn Spl Fac Rev Continental Airlines Inc AMT | | 7.00% | | 6/1/2020 | | B | | $ | 895 | | $ | 886,301 |
| Virgin Islands Pub Fin Auth Sr Secd Hovensa Refinery AMT | | 4.70% | | 7/1/2022 | | BBB | | | 2,250 | | | 2,059,447 |
| | | | | | | | | | | | |
| Total | | | | | | | | | | | | 2,945,748 |
| | | | | | | | | | | | |
| | | | | |
| Education 6.56% | | | | | | | | | | | | |
| HI St Dept Bdgt & Fin Chaminade Univ Honolulu (RADIAN) | | 4.75% | | 1/1/2036 | | BBB- | | | 1,000 | | | 798,950 |
| HI St Dept Bdgt & Fin Chaminade Univ Honolulu (RADIAN) | | 5.00% | | 1/1/2026 | | BBB- | | | 100 | | | 88,754 |
| HI St Dept Bdgt & Fin Mid Pacific Inst (RADIAN) | | 4.625% | | 1/1/2036 | | BBB- | | | 500 | | | 399,625 |
| HI St Dept Bdgt & Fin Mid Pacific Inst (RADIAN) | | 5.00% | | 1/1/2026 | | BBB- | | | 1,000 | | | 901,860 |
| Univ of HI Rev Ser A | | 5.25% | | 10/1/2034 | | Aa3 | | | 1,000 | | | 1,075,640 |
| Univ of HI Rev Ser A | | 6.00% | | 10/1/2038 | | Aa3 | | | 1,750 | | | 1,991,045 |
| Univ of HI Rev Ser A (NPFGC) | | 4.125% | | 10/1/2026 | | Aa3 | | | 1,670 | | | 1,676,546 |
| Univ of HI Rev Ser A CR (MBIA)(FSA) | | 5.00% | | 7/15/2024 | | AAA | | | 1,500 | | | 1,621,470 |
| | | | | | | | | | | | |
| Total | | | | | | | | | | | | 8,553,890 |
| | | | | | | | | | | | |
| | | | | |
| General Obligation 34.30% | | | | | | | | | | | | |
| HI Cnty HI Ser A | | 5.00% | | 7/15/2020 | | AA- | | | 1,150 | | | 1,277,500 |
| HI Cnty HI Ser A (NPFGC)(FGIC) | | 5.60% | | 5/1/2013 | | AA- | | | 1,780 | | | 2,020,247 |
| HI Cnty HI Ser A (FSA) | | 5.00% | | 7/15/2023 | | AAA | | | 1,000 | | | 1,060,600 |
| HI Cnty HI Ser A (NPFGC) | | 5.00% | | 7/15/2024 | | AA- | | | 900 | | | 959,283 |
| HI Cnty HI Ser A (NPFGC) | | 5.25% | | 7/15/2023 | | AA- | | | 595 | | | 642,314 |
| HI St Ser BZ ETM | | 6.00% | | 10/1/2010 | | AA | | | 500 | | | 527,505 |
| HI St Ser BZ ETM | | 6.00% | | 10/1/2012 | | AA | | | 405 | | | 464,741 |
| HI St Ser CA (NPFGC)(FGIC) | | 8.00% | | 1/1/2013 | | AA | | | 2,000 | | | 2,412,240 |
| HI St Ser CZ (FSA) | | 5.25% | | 7/1/2018 | | AAA | | | 1,000 | | | 1,083,660 |
| HI St Ser DE (NPFGC) | | 5.00% | | 10/1/2012 | | AA | | | 1,000 | | | 1,112,170 |
| HI St Ser DE (NPFGC) | | 5.00% | | 10/1/2024 | | AA | | | 1,000 | | | 1,079,040 |
| HI St Ser DG (AMBAC) | | 5.00% | | 7/1/2016 | | AA | | | 1,000 | | | 1,142,040 |
| HI St Ser DI (FSA) | | 5.00% | | 3/1/2020 | | AAA | | | 2,000 | | | 2,241,380 |
| HI St Ser DK | | 5.00% | | 5/1/2025 | | AA | | | 3,500 | | | 3,913,315 |
| HI St Ser DK | | 5.00% | | 5/1/2026 | | AA | | | 2,500 | | | 2,781,450 |
See Notes to Financial Statements.
77
Schedule of Investments (continued)
HAWAII TAX FREE FUND September 30, 2009
| | | | | | | | | | | | |
| Investments | | Interest
Rate | | Maturity
Date | | Credit
Rating:
S&P or
Moody’s(a) | | Principal
Amount
(000) | | Value |
| General Obligation (continued) | | | | | | | | | | | | |
| HI St Ser DK | | 5.00% | | 5/1/2027 | | AA | | $ | 2,500 | | $ | 2,765,825 |
| HI St Unref Bal Ser BZ | | 6.00% | | 10/1/2012 | | AA | | | 95 | | | 108,439 |
| Honolulu HI City & Cnty Ser A | | 5.00% | | 4/1/2026 | | AA | | | 1,000 | | | 1,121,940 |
| Honolulu HI City & Cnty Ser A (FSA) | | 5.00% | | 7/1/2021 | | AAA | | | 1,070 | | | 1,228,713 |
| Honolulu HI City & Cnty Ser A (FSA) | | 5.00% | | 7/1/2022 | | AAA | | | 1,525 | | | 1,739,827 |
| Honolulu HI City & Cnty Ser A (FSA) | | 5.00% | | 7/1/2028 | | AAA | | | 3,295 | | | 3,569,276 |
| Honolulu HI City & Cnty Ser B (FSA) | | 5.25% | | 7/1/2017 | | AAA | | | 1,500 | | | 1,767,750 |
| Honolulu HI City & Cnty Ser B (NPFGC) | | 5.00% | | 7/1/2018 | | AA | | | 1,000 | | | 1,133,420 |
| Honolulu HI City & Cnty Ser D (NPFGC) | | 5.00% | | 7/1/2023 | | AA | | | 2,000 | | | 2,227,200 |
| Kauai Cnty HI Ser A (NPFGC)(FGIC) | | 5.00% | | 8/1/2026 | | AA- | | | 250 | | | 264,720 |
| Kauai Cnty HI Ser A (NPFGC)(FGIC) | | 5.00% | | 8/1/2029 | | AA- | | | 1,000 | | | 1,047,190 |
| Kauai Cnty HI Unref Bal Ser A (NPFGC) | | 5.50% | | 8/1/2021 | | AA- | | | 1,630 | | | 1,716,814 |
| Maui Cnty HI (NPFGC) | | 5.00% | | 3/1/2025 | | AA | | | 1,000 | | | 1,078,880 |
| Maui Cnty HI Ser A (NPFGC) | | 5.00% | | 7/1/2023 | | AA | | | 1,040 | | | 1,140,724 |
| Northern Mariana Islands Comwlth Ser A | | 5.00% | | 6/1/2030 | | NR | | | 995 | | | 818,726 |
| Territory of Guam Ser A | | 7.00% | | 11/15/2039 | | B+ | | | 235 | | | 257,645 |
| | | | | | | | | | | | |
| Total | | | | | | | | | | | | 44,704,574 |
| | | | | | | | | | | | |
| | | | | |
| Healthcare 3.36% | | | | | | | | | | | | |
| HI St Dept Bdgt & Fin Kahala Nui Pj Ser A | | 6.75% | | 11/15/2009 | | NR | | | 500 | | | 501,795 |
| HI St Dept Bdgt & Fin Kahala Nui Pj Ser A | | 7.875% | | 11/15/2023 | | NR | | | 500 | | | 545,710 |
| HI St Dept Bdgt & Fin Kahala Nui Pj Ser A | | 8.00% | | 11/15/2033 | | NR | | | 100 | | | 109,018 |
| HI St Dept Bdgt & Fin Spl Purp Linked Ctfs | | 6.40% | | 7/1/2013 | | BBB+ | | | 1,240 | | | 1,304,964 |
| Kuakini HI Hlth Sys Spl Purp Ser A | | 6.30% | | 7/1/2022 | | BBB- | | | 1,000 | | | 1,010,620 |
| Puerto Rico Indl Tourist Edl Med & Envr Ctrl Facs Fing Auth Hosp Auxilio Mutuo Oblig Grp Ser A (NPFGC) | | 6.25% | | 7/1/2024 | | A | | | 150 | | | 150,021 |
| Territory of Guam Oblig Rev Section 30 Ser A | | 5.75% | | 12/1/2034 | | BBB- | | | 740 | | | 759,980 |
| | | | | | | | | | | | |
| Total | | | | | | | | | | | | 4,382,108 |
| | | | | | | | | | | | |
| | | | | |
| Housing 2.68% | | | | | | | | | | | | |
| HI St Hsg Fin & Dev Corp Rent Hsg Sys Ser B Rmkt (FSA) | | 6.50% | | 7/1/2033 | | Aa3 | | | 2,000 | | | 2,212,620 |
| HI St Hsg Fin & Dev Corp Sing Fam Mtg Ser B (FNMA) | | 5.30% | | 7/1/2028 | | AAA | | | 725 | | | 728,647 |
| HI St Hsg Fin & Dev Corp Sing Fam Mtg Ser B (FNMA) | | 5.45% | | 7/1/2017 | | AAA | | | 555 | | | 556,143 |
| | | | | | | | | | | | |
| Total | | | | | | | | | | | | 3,497,410 |
| | | | | | | | | | | | |
See Notes to Financial Statements.
78
Schedule of Investments (continued)
HAWAII TAX FREE FUND September 30, 2009
| | | | | | | | | | | | |
| Investments | | Interest
Rate | | Maturity
Date | | Credit
Rating:
S&P or
Moody’s(a) | | Principal
Amount
(000) | | Value |
| Lease Obligations 2.34% | | | | | | | | | | | | |
| HI St Dept Hawaiian Home Lands Kapolei Office Fac Ser A (FSA) | | 5.00% | | 11/1/2031 | | Aa3 | | $ | 1,000 | | $ | 1,054,110 |
| Puerto Rico Comwlth Infrastr Fing Auth Mepsi Campus Pj Ser A | | 6.25% | | 10/1/2024 | | NR | | | 1,000 | | | 924,070 |
| Puerto Rico Pub Bldgs Auth Rev Govt Facs Ser P GTD | | 6.50% | | 7/1/2030 | | BBB- | | | 1,000 | | | 1,072,180 |
| | | | | | | | | | | | |
| Total | | | | | | | | | | | | 3,050,360 |
| | | | | | | | | | | | |
| | | | | |
| Other Revenue 0.39% | | | | | | | | | | | | |
| HI St No 1 Cap Dist St Office COP (NPFGC) | | 5.50% | | 5/1/2020 | | A | | | 500 | | | 509,840 |
| | | | | | | | | | | | |
| | | | | |
| Pre-Refunded 14.48% | | | | | | | | | | | | |
| HI Cnty HI Ser A (FGIC) | | 5.50% | | 7/15/2017 | | A+ | | | 1,045 | | | 1,132,675 |
| HI St Arpts Sys Rev 2nd Ser CR AMT ETM (FSA) | | 6.90% | | 7/1/2012 | | A | | | 635 | | | 669,989 |
| Honolulu HI City & Cnty Brd Wtr Supply (FSA) | | 5.25% | | 7/1/2031 | | AAA | | | 100 | | | 108,049 |
| Honolulu HI City & Cnty Ser A (FSA) | | 5.125% | | 9/1/2021 | | AAA | | | 600 | | | 649,092 |
| Honolulu HI City & Cnty Wtr ETM TCRS (FGIC) | | 6.00% | | 12/1/2015 | | Aa2 | | | 1,000 | | | 1,240,370 |
| Kauai Cnty HI Ser A (FGIC) | | 6.125% | | 8/1/2024 | | AA- | | | 580 | | | 607,225 |
| Kauai Cnty HI Ser A (NPFGC) | | 5.50% | | 8/1/2021 | | AA- | | | 865 | | | 941,033 |
| Maui Cnty HI Ser A (FGIC) | | 6.10% | | 3/1/2020 | | AA | | | 500 | | | 516,735 |
| Maui Cnty HI Ser A (NPFGC) | | 5.00% | | 3/1/2022 | | AA | | | 750 | | | 823,388 |
| Puerto Rico Comwlth Hwy & Transn Auth Ser D | | 5.25% | | 7/1/2038 | | AAA | | | 1,000 | | | 1,110,790 |
| Puerto Rico Comwlth Hwy & Transn Auth Ser D | | 5.75% | | 7/1/2041 | | AAA | | | 3,000 | | | 3,372,690 |
| Puerto Rico Comwlth Hwy & Transn Auth Ser Y | | 5.50% | | 7/1/2036 | | Aaa | | | 1,000 | | | 1,221,010 |
| Puerto Rico Comwlth Hwy & Transn Auth Ser Y (IBC)(NPFGC) | | 5.50% | | 7/1/2036 | | A | | | 250 | | | 305,253 |
| Puerto Rico Comwlth Infrastr Fing Auth Ser A | | 5.375% | | 10/1/2024 | | AAA | | | 300 | | | 317,952 |
| Puerto Rico Comwlth Infrastr Fing Auth Ser A | | 5.50% | | 10/1/2032 | | AAA | | | 200 | | | 212,214 |
| Puerto Rico Pub Bldgs Auth Rev Govt Facs Ser D | | 5.25% | | 7/1/2036 | | BBB- | | | 1,465 | | | 1,614,752 |
| Univ of HI Univ Sys Rev Ser A (FGIC) | | 5.125% | | 7/15/2032 | | Aa3 | | | 1,100 | | | 1,223,024 |
See Notes to Financial Statements.
79
Schedule of Investments (continued)
HAWAII TAX FREE FUND September 30, 2009
| | | | | | | | | | | | |
| Investments | | Interest
Rate | | Maturity
Date | | Credit
Rating:
S&P or
Moody’s(a) | | Principal
Amount
(000) | | Value |
| Pre-Refunded (continued) | | | | | | | | | | | | |
| Univ of HI Univ Sys Rev Ser A (FGIC) | | 5.50% | | 7/15/2029 | | Aa3 | | $ | 2,500 | | $ | 2,805,200 |
| | | | | | | | | | | | |
| Total | | | | | | | | | | | | 18,871,441 |
| | | | | | | | | | | | |
| | | | | |
| Special Tax 4.28% | | | | | | | | | | | | |
| HI St Dept Hawaiian Home Lands | | 5.875% | | 4/1/2034 | | A2 | | | 3,000 | | | 3,177,780 |
| Puerto Rico Comwlth Infrastr Fing Auth Ser B | | 5.00% | | 7/1/2046 | | BBB+ | | | 1,000 | | | 902,570 |
| Puerto Rico Comwlth Infrastr Fing Auth Ser C (AMBAC) | | 5.50% | | 7/1/2028 | | BBB+ | | | 1,475 | | | 1,497,346 |
| | | | | | | | | | | | |
| Total | | | | | | | | | | | | 5,577,696 |
| | | | | | | | | | | | |
| | | | | |
| Tax Revenue 3.49% | | | | | | | | | | | | |
| Puerto Rico Sales Tax Fing Corp 1st Sub Ser A | | 5.25% | | 8/1/2027 | | A+ | | | 1,500 | | | 1,609,365 |
| Puerto Rico Sales Tax Fing Corp Ser A | | 5.25% | | 8/1/2057 | | AA- | | | 1,000 | | | 1,035,580 |
| Virgin Islands Pub Fin Auth Rev Gross Rcpts Taxes Ln Nts (NPFGC)(FGIC) | | 4.25% | | 10/1/2029 | | A | | | 500 | | | 432,170 |
| Virgin Islands Pub Fin Auth Rev Gross Rcpts Taxes Ln Nts (NPFGC)(FGIC) | | 5.00% | | 10/1/2025 | | A | | | 1,000 | | | 1,009,980 |
| Virgin Islands Pub Fin Auth Rev Matching Fd Ln Diago Ser A | | 6.75% | | 10/1/2037 | | BBB | | | 440 | | | 465,538 |
| | | | | | | | | | | | |
| Total | | | | | | | | | | | | 4,552,633 |
| | | | | | | | | | | | |
| | | | | |
| Transportation 8.46% | | | | | | | | | | | | |
| HI St Hrbr Sys Rev Ser A AMT (FSA) | | 5.00% | | 1/1/2031 | | AAA | | | 2,000 | | | 1,916,520 |
| HI St Hrbr Sys Rev Ser A AMT (FSA) | | 5.25% | | 1/1/2027 | | AAA | | | 1,450 | | | 1,468,328 |
| HI St Hwy Rev | | 5.00% | | 1/1/2019 | | AA+ | | | 1,000 | | | 1,176,180 |
| HI St Hwy Rev Ser A (FSA) | | 5.00% | | 7/1/2023 | | AAA | | | 2,000 | | | 2,151,420 |
| Puerto Rico Comwlth Hwy & Transn Auth (AG)(FSA) | | 5.50% | | 7/1/2025 | | AAA | | | 2,000 | | | 2,319,720 |
| Puerto Rico Comwlth Hwy & Transn Auth Ser CC (FSA) | | 5.25% | | 7/1/2033 | | AAA | | | 1,000 | | | 1,100,900 |
| Puerto Rico Comwlth Hwy & Transn Auth Ser M | | 5.00% | | 7/1/2046 | | BBB | | | 1,000 | | | 876,260 |
| Puerto Rico Comwlth Hwy & Transn Auth Sub St Infrastr Bk | | 5.00% | | 7/1/2022 | | BBB- | | | 20 | | | 20,066 |
| | | | | | | | | | | | |
| Total | | | | | | | | | | | | 11,029,394 |
| | | | | | | | | | | | |
| | | | | |
| Utilities 17.86% | | | | | | | | | | | | |
| HI St Dept Bdgt & Fin Elec Co & Subs Ser A AMT (FGIC) | | 4.80% | | 1/1/2025 | | Baa1 | | | 1,000 | | | 954,130 |
See Notes to Financial Statements.
80
Schedule of Investments (concluded)
HAWAII TAX FREE FUND September 30, 2009
| | | | | | | | | | | | | |
| Investments | | Interest
Rate | | Maturity
Date | | Credit
Rating:
S&P or
Moody’s(a) | | Principal
Amount
(000) | | Value | |
| Utilities (continued) | | | | | | | | | | | | | |
| HI St Dept Bdgt & Fin Hawaiian Elec Co Ser A AMT (FGIC) | | 4.65% | | 3/1/2037 | | Baa1 | | $ | 1,000 | | $ | 866,390 | |
| HI St Dept Bdgt & Fin Hawaiian Elec Co Ser B AMT (FGIC) | | 4.60% | | 5/1/2026 | | Baa1 | | | 1,500 | | | 1,388,205 | |
| Honolulu HI City & Cnty Brd Wtr Supply Ser B AMT (NPFGC) | | 5.25% | | 7/1/2021 | | AA | | | 1,335 | | | 1,325,655 | |
| Honolulu HI City & Cnty Wst Wtr 2nd Bd Resolution Jr Ser A (FSA)(b) | | 5.00% | | 7/1/2032 | | AAA | | | 10,000 | | | 10,574,900 | |
| Honolulu HI City & Cnty Wst Wtr Sr Ser A (NPFGC)(FGIC) | | 5.00% | | 7/1/2024 | | AA- | | | 2,745 | | | 2,957,271 | |
| Kauai Cnty HI Ser A (NPFGC)(FGIC) | | 5.00% | | 8/1/2028 | | AA- | | | 1,000 | | | 1,050,900 | |
| Puerto Rico Comwlth Aqueduct & Swr Auth Sr Lien Ser A (AG) | | 5.00% | | 7/1/2028 | | AAA | | | 1,000 | | | 1,060,200 | |
| Puerto Rico Comwlth Aqueduct & Swr Auth Sr Lien Ser A (AG) | | 5.125% | | 7/1/2047 | | AAA | | | 1,000 | | | 1,020,750 | |
| Puerto Rico Elec Pwr Auth Ser TT | | 5.00% | | 7/1/2032 | | A3 | | | 1,000 | | | 1,013,370 | |
| Virgin Islands Wtr & Pwr Auth Ser A | | 5.00% | | 7/1/2027 | | BBB- | | | 555 | | | 524,974 | |
| Virgin Islands Wtr & Pwr Auth Ser A | | 5.00% | | 7/1/2031 | | BBB- | | | 600 | | | 542,442 | |
| | | | | | | | | | | | | |
| Total | | | | | | | | | | | | 23,279,187 | |
| | | | | | | | | | | | | |
| Total Investments in Municipal Bonds 100.46% (cost $125,991,632) | | | 130,954,281 | |
| | | | | | | | | | | | | |
| Liabilities in Excess of Cash and Other Assets(f) (0.46%) | | | (593,443 | ) |
| | | | | | | | | | | | | |
| Net Assets 100.00% | | | | | | | | | | | $ | 130,360,838 | |
| | | | | | | | | | | | | |
Open Futures Contracts at September 30, 2009:
| | | | | | | | | | | | |
| Type | | Expiration | | Contracts | | Position | | Market
Value | | Unrealized
Depreciation |
| U.S. 30-Year Treasury Bond | | December 2009 | | 113 | | Short | | $ | (13,715,375) | | $ | (304,131) |
See Notes to Financial Statements.
81
Schedule of Investments
MISSOURI TAX FREE FUND September 30, 2009
| | | | | | | | | | | | |
| Investments | | Interest
Rate | | Maturity
Date | | Credit
Rating:
S&P or
Moody’s(a) | | Principal
Amount
(000) | | Value |
| MUNICIPAL BONDS 97.40% | | | | | | | | | | | | |
| | | | | |
| Corporate-Backed 2.35% | | | | | | | | | | | | |
| MO St Dev Fin Brd Solid Wst Disp Procter & Gamble Paper Prods AMT | | 5.20% | | 3/15/2029 | | AA- | | $ | 1,150 | | $ | 1,215,182 |
| MO St Envr Impt & Enrg Res Auth KC Pwr & Lt Co Pj AMT | | 4.90% | | 5/1/2038 | | Baa1 | | | 1,500 | | | 1,467,855 |
| Virgin Islands Pub Fin Auth Sr Secd Hovensa Refinery AMT | | 4.70% | | 7/1/2022 | | BBB | | | 1,500 | | | 1,372,965 |
| | | | | | | | | | | | |
| Total | | | | | | | | | | | | 4,056,002 |
| | | | | | | | | | | | |
| | | | | |
| Education 5.10% | | | | | | | | | | | | |
| Curators Univ MO Sys Facs Rev Ser A | | 5.00% | | 11/1/2017 | | AA | | | 400 | | | 470,764 |
| Curators Univ MO Sys Facs Rev Ser A | | 5.00% | | 11/1/2023 | | AA | | | 2,000 | | | 2,245,200 |
| Lincoln Univ MO Aux Sys (AG) | | 5.00% | | 6/1/2027 | | AAA | | | 500 | | | 542,965 |
| Lincoln Univ MO Aux Sys (AG) | | 5.125% | | 6/1/2037 | | AAA | | | 1,250 | | | 1,324,963 |
| MO St Hlth & Edl Facs Auth Washington Univ Ser A | | 5.00% | | 2/15/2022 | | AAA | | | 600 | | | 656,508 |
| MO St Hlth & Edl Facs Auth Washington Univ Ser A | | 5.00% | | 2/15/2033 | | AAA | | | 3,000 | | | 3,110,520 |
| MO St Hlth & Edl Facs Auth Washington Univ Ser A | | 5.25% | | 3/15/2018 | | AAA | | | 375 | | | 453,064 |
| | | | | | | | | | | | |
| Total | | | | | | | | | | | | 8,803,984 |
| | | | | | | | | | | | |
| | | | | |
| General Obligation 5.60% | | | | | | | | | | | | |
| Jackson Cnty MO Reorg Sch Dist No 7 Sch Bldg (NPFGC) | | 5.25% | | 3/1/2022 | | Aa2 | | | 1,000 | | | 1,132,700 |
| Northern Mariana Islands Comwlth Ser B | | 5.00% | | 10/1/2033 | | NR | | | 2,500 | | | 1,983,675 |
| Puerto Rico Comwlth Pub Impt Ser A (IBC)(NPFGC) | | 5.50% | | 7/1/2029 | | A | | | 1,000 | | | 1,013,170 |
| St. Louis Cnty MO Lindbergh Sch Dist No R-8 Cap Apprec (NPFGC) | | Zero Coupon | | 3/1/2018 | | AA | | | 2,080 | | | 1,598,126 |
| St. Louis Cnty MO Pkwy C-2 Sch Dist Ser A | | 5.00% | | 3/1/2024 | | AAA | | | 3,320 | | | 3,613,488 |
| Territory of Guam Ser A | | 7.00% | | 11/15/2039 | | B+ | | | 300 | | | 328,908 |
| | | | | | | | | | | | |
| Total | | | | | | | | | | | | 9,670,067 |
| | | | | | | | | | | | |
| | | | | |
| Healthcare 14.64% | | | | | | | | | | | | |
| Boone Cnty MO Boone Hosp Ctr Rev | | 5.75% | | 8/1/2028 | | A3 | | | 1,500 | | | 1,598,070 |
| Cape Girardeau Cnty MO Indl Dev Auth St. Francis Med Ctr | | 5.75% | | 6/1/2039 | | A+ | | | 1,000 | | | 1,070,260 |
See Notes to Financial Statements.
82
Schedule of Investments (continued)
MISSOURI TAX FREE FUND September 30, 2009
| | | | | | | | | | | | | |
| Investments | | Interest
Rate | | Maturity
Date | | Credit
Rating:
S&P or
Moody’s(a) | | | Principal
Amount
(000) | | Value |
| Healthcare (continued) | | | | | | | | | | | | | |
| Cape Girardeau Cnty MO Indl Dev Auth Unref Bal Southeast MO Hosp | | 5.75% | | 6/1/2032 | | BBB+ | (c) | | $ | 260 | | $ | 256,415 |
| Cass Cnty MO Hosp Rev | | 5.625% | | 5/1/2038 | | BBB- | (c) | | | 1,500 | | | 1,337,550 |
| Hannibal MO Indl Dev Auth Hlth Facs | | 5.00% | | 3/1/2022 | | BBB+ | | | | 835 | | | 794,887 |
| Joplin MO Indl Dev Auth Freeman Hlth Sys Pj | | 5.75% | | 2/15/2035 | | BBB+ | | | | 2,500 | | | 2,450,775 |
| MO St Hlth & Edl Facs Auth BJC Hlth Sys | | 5.25% | | 5/15/2032 | | AA | | | | 5,000 | | | 5,175,700 |
| MO St Hlth & Edl Facs Auth Cox Hlth | | 5.50% | | 11/15/2039 | | A2 | | | | 2,000 | | | 2,063,480 |
| MO St Hlth & Edl Facs Auth Sr Living Facs Lutheran Ser A | | 5.375% | | 2/1/2035 | | A- | (c) | | | 3,680 | | | 3,302,947 |
| MO St Hlth & Edl Facs Auth SSM Hlthcare Ser A | | 5.00% | | 6/1/2028 | | AA- | | | | 2,000 | | | 2,098,700 |
| MO St Hlth & Edl Facs Auth St. Luke’s Hlth Ser 2005A (FSA) | | 5.50% | | 11/15/2028 | | AAA | | | | 1,850 | | | 2,131,774 |
| St. Genevieve Cnty MO Hosp Rev Ser B | | 5.00% | | 3/1/2032 | | NR | | | | 1,510 | | | 1,112,372 |
| St. Louis Cnty MO Indl Dev Auth St. Andrew’s Res for Srs Ser A | | 6.375% | | 12/1/2041 | | NR | | | | 1,000 | | | 884,680 |
| Territory of Guam Oblig Rev Section 30 Ser A | | 5.75% | | 12/1/2034 | | BBB- | | | | 960 | | | 985,920 |
| | | | | | | | | | | | | |
| Total | | | | | | | | | | | | | 25,263,530 |
| | | | | | | | | | | | | |
| | | | | |
| Housing 4.03% | | | | | | | | | | | | | |
| MO St Hsg Dev Commn Mtg Cap Apprec Sing Fam Hsg Ser E-1 AMT (GNMA/FNMA) | | Zero Coupon | | 3/1/2029 | | AAA | | | | 420 | | | 142,456 |
| MO St Hsg Dev Commn Rev Multi Fam Hsg Ashley Pk 2 AMT (FHA) | | 4.875% | | 7/1/2037 | | AA | | | | 1,500 | | | 1,405,710 |
| MO St Hsg Dev Commn Rev Multi Fam Hsg Meadow Ridge 1 AMT (FHA) | | 4.875% | | 7/1/2030 | | AA | | | | 530 | | | 510,210 |
| MO St Hsg Dev Commn Rev Multi Fam Hsg Metro Vlg 5 AMT (FHA) | | 4.75% | | 7/1/2021 | | AA | | | | 615 | | | 613,862 |
| MO St Hsg Dev Commn Sing Fam Mtg Hmownrship Ln Pg A-1 AMT (GNMA/FNMA/FHLMC) | | 5.70% | | 9/1/2038 | | AAA | | | | 1,670 | | | 1,719,983 |
| MO St Hsg Dev Commn Sing Fam Mtg Hmownrship Ln Pg A-1 AMT (GNMA/FNMA) | | 5.90% | | 9/1/2035 | | AAA | | | | 515 | | | 528,622 |
| MO St Hsg Dev Commn Sing Fam Mtg Hmownrship Ln Pg B AMT (GNMA/FNMA) | | 4.70% | | 9/1/2026 | | AAA | | | | 1,615 | | | 1,576,272 |
See Notes to Financial Statements.
83
Schedule of Investments (continued)
MISSOURI TAX FREE FUND September 30, 2009
| | | | | | | | | | | | |
| Investments | | Interest
Rate | | Maturity
Date | | Credit
Rating:
S&P or
Moody’s(a) | | Principal
Amount
(000) | | Value |
| Housing (continued) | | | | | | | | | | | | |
| MO St Hsg Dev Commn Sing Fam Mtg Hmownrship Ln Pg B-1 AMT (GNMA/FNMA) | | 5.375% | | 9/1/2022 | | AAA | | $ | 460 | | $ | 456,964 |
| | | | | | | | | | | | |
| Total | | | | | | | | | | | | 6,954,079 |
| | | | | | | | | | | | |
| | | | | |
| Lease Obligations 13.76% | | | | | | | | | | | | |
| Cape Girardeau Cnty MO Bldg Corp Jackson R-II Sch Dist HS Pj (NPFGC) | | 5.25% | | 3/1/2026 | | A | | | 1,000 | | | 1,091,220 |
| Grandview MO COP (NPFGC)(FGIC) | | 5.00% | | 1/1/2027 | | A3 | | | 1,700 | | | 1,735,513 |
| Jackson Cnty MO Pub Bldg Corp Cap Impts Pj | | 5.00% | | 12/1/2029 | | Aa3 | | | 1,500 | | | 1,587,090 |
| Jackson Cnty MO Pub Bldg Corp Cap Impts Pj Ser A (NPFGC) | | 5.00% | | 12/1/2018 | | Aa3 | | | 1,385 | | | 1,551,712 |
| Jackson Cnty MO Pub Bldg Corp Cap Impts Pj Ser B | | 5.00% | | 12/1/2031 | | Aa3 | | | 1,000 | | | 1,064,840 |
| Jackson Cnty MO Spl Oblig Harry S. Truman Sports Complex (AMBAC) | | 5.00% | | 12/1/2021 | | AA- | | | 2,000 | | | 2,133,540 |
| Kansas City MO Metro Jr College Dist Lease COP | | 5.00% | | 7/1/2028 | | Aa3 | | | 3,500 | | | 3,714,025 |
| Kansas City MO Spl Fac Rev MCI Overhaul Base Pj Ser G AMT | | 4.50% | | 9/1/2026 | | AA- | | | 585 | | | 518,222 |
| MO St Dev Fin Brd Cultural Facs Nelson Gallery Fndtn Ser A (NPFGC) | | 5.00% | �� | 12/1/2030 | | AA- | | | 3,300 | | | 3,385,866 |
| MO St Dev Fin Brd Infrastr Branson Landing Pj Ser A | | 5.00% | | 6/1/2035 | | A | | | 1,220 | | | 1,111,627 |
| Puerto Rico Pub Bldgs Auth Rev Govt Facs Ser P GTD | | 6.50% | | 7/1/2030 | | BBB- | | | 1,000 | | | 1,072,180 |
| Puerto Rico Pub Bldgs Auth Rev Unref Bal Govt Facs I GTD | | 5.25% | | 7/1/2033 | | BBB- | | | 2,465 | | | 2,415,651 |
| Springfield MO Spl Oblig Heers Garage Pj Ser B | | 4.50% | | 11/1/2027 | | A1 | | | 500 | | | 507,085 |
| St. Louis MO Muni Fin Corp (FSA) | | 5.00% | | 2/15/2023 | | AAA | | | 1,675 | | | 1,855,699 |
| | | | | | | | | | | | |
| Total | | | | | | | | | | | | 23,744,270 |
| | | | | | | | | | | | |
| | | | | |
| Other Revenue 12.79% | | | | | | | | | | | | |
| Kansas City MO Muni Assistance Corp Leaseholder Ser A | | 5.125% | | 3/1/2019 | | A2 | | | 1,100 | | | 1,110,010 |
| Kansas City MO Spl Oblig East Vlg Pj Ser B (AG) | | 5.00% | | 4/15/2024 | | AAA | | | 1,000 | | | 1,113,660 |
| Kansas City MO Spl Oblig East Vlg Pj Ser B (AG) | | 5.00% | | 4/15/2025 | | AAA | | | 1,860 | | | 2,056,937 |
See Notes to Financial Statements.
84
Schedule of Investments (continued)
MISSOURI TAX FREE FUND September 30, 2009
| | | | | | | | | | | | |
| Investments | | Interest
Rate | | Maturity
Date | | Credit
Rating:
S&P or
Moody’s(a) | | Principal
Amount
(000) | | Value |
| Other Revenue (continued) | | | | | | | | | | | | |
| MO St Brd of Pub Bldgs Spl Ser A | | 5.00% | | 10/15/2027 | | AA+ | | $ | 7,500 | | $ | 7,950,975 |
| MO St Dev Fin Brd Cultural Facs Ser B | | 5.00% | | 6/1/2037 | | AAA | | | 3,000 | | | 3,171,660 |
| MO St Dev Fin Brd Infrastr Independence Crackerneck Creek | | 5.00% | | 3/1/2028 | | A+ | | | 1,000 | | | 1,007,030 |
| MO St Dev Fin Brd Midwest Resh Instl Pj | | 4.50% | | 11/1/2027 | | Baa2 | | | 1,000 | | | 794,530 |
| MO St Dev Fin Brd Midwest Resh Instl Pj | | 5.00% | | 11/1/2022 | | Baa2 | | | 1,000 | | | 902,670 |
| MO St Hlth & Edl Facs Auth SSM Hlth 2008 Ser B (AMBAC) | | 5.25% | | 6/1/2021 | | AA- | | | 235 | | | 254,317 |
| MO St Hlth & Edl Facs Auth Unref Bal SSM Hlth 2008 Ser B (AMBAC) | | 5.25% | | 6/1/2021 | | AA- | | | 1,470 | | | 1,516,187 |
| St. Louis MO Indl Dev Auth Rev Confluence Academy Pj Ser A | | 5.25% | | 6/15/2025 | | NR | | | 575 | | | 458,781 |
| St. Louis MO Indl Dev Auth Rev Confluence Academy Pj Ser A | | 5.35% | | 6/15/2032 | | NR | | | 1,000 | | | 747,220 |
| St. Louis MO Indl Dev Auth Rev Convtn Ctr Hotel (AMBAC) | | Zero Coupon | | 7/15/2020 | | NR | | | 2,000 | | | 987,540 |
| | | | | | | | | | | | |
| Total | | | | | | | | | | | | 22,071,517 |
| | | | | | | | | | | | |
| | | | | |
| Pre-Refunded 7.08% | | | | | | | | | | | | |
| Bowling Green MO Sch Dist No R-I (NPFGC) | | 5.85% | | 3/1/2020 | | NR | | | 1,000 | | | 1,022,270 |
| Cape Girardeau Cnty MO Indl Dev Auth Southeast MO Hosp | | 5.75% | | 6/1/2032 | | NR | | | 1,340 | | | 1,495,869 |
| MO St Hlth & Edl Facs Auth Washington Univ Ser A | | 6.00% | | 3/1/2030 | | Aaa | | | 850 | | | 877,931 |
| MO St Hlth & Edl Facs Auth Washington Univ Ser B | | 5.00% | | 3/1/2030 | | AAA | | | 1,800 | | | 1,835,424 |
| MO St Hlth & Edl Facs Auth Webster Univ (NPFGC) | | 5.25% | | 4/1/2021 | | Baa1 | | | 2,000 | | | 2,015,340 |
| Puerto Rico Comwlth Hwy & Transn Auth Ser D | | 5.75% | | 7/1/2041 | | AAA | | | 1,000 | | | 1,124,230 |
| Puerto Rico Pub Bldgs Auth Rev Govt Facs I GTD | | 5.25% | | 7/1/2033 | | NR | | | 35 | | | 40,100 |
| St. Louis MO Arpt Rev Dev Pg Ser A (NPFGC) | | 5.25% | | 7/1/2031 | | AAA | | | 2,000 | | | 2,153,720 |
| St. Louis MO Muni Fin Corp Lease Carnahan Courthouse Ser A (FGIC) | | 5.125% | | 2/15/2027 | | NR | | | 1,500 | | | 1,642,905 |
| | | | | | | | | | | | |
| Total | | | | | | | | | | | | 12,207,789 |
| | | | | | | | | | | | |
See Notes to Financial Statements.
85
Schedule of Investments (continued)
MISSOURI TAX FREE FUND September 30, 2009
| | | | | | | | | | | | |
| Investments | | Interest
Rate | | Maturity
Date | | Credit
Rating:
S&P or
Moody’s(a) | | Principal
Amount
(000) | | Value |
| Special Tax 3.00% | | | | | | | | | | | | |
| Branson Hills MO Infrastr Facs Cmnty Impt Dist Ser A | | 5.50% | | 4/1/2027 | | NR | | $ | 1,375 | | $ | 1,130,346 |
| Howard Bend MO Levee Dist Impt | | 4.40% | | 3/1/2026 | | BBB | | | 1,000 | | | 964,810 |
| Kansas City MO Tax Incr Maincor Pj Ser A | | 5.25% | | 3/1/2018 | | NR | | | 500 | | | 470,775 |
| Osage Beach MO Tax Incr Prewitts Pt Pj | | 5.00% | | 5/1/2023 | | NR | | | 1,000 | | | 782,860 |
| Riverside Quindaro Bend Levee Dist MO Ser L 385 Pj (RADIAN) | | 5.00% | | 3/1/2017 | | BBB | | | 795 | | | 802,306 |
| Stone Canyon Cmnty Impt Dist MO Pub Infrastr Impt Pj | | 5.75% | | 4/1/2027 | | NR | | | 1,300 | | | 1,021,969 |
| | | | | | | | | | | | |
| Total | | | | | | | | | | | | 5,173,066 |
| | | | | | | | | | | | |
| | | | | |
| Tax Revenue 4.20% | | | | | | | | | | | | |
| Puerto Rico Sales Tax Fing Corp 1st Sub Ser A | | 5.25% | | 8/1/2027 | | A+ | | | 2,000 | | | 2,145,820 |
| Puerto Rico Sales Tax Fing Corp Ser A | | 5.25% | | 8/1/2057 | | AA- | | | 775 | | | 802,574 |
| St. Louis MO Muni Fin Corp (AMBAC) | | 5.00% | | 2/15/2037 | | NR | | | 4,000 | | | 3,805,280 |
| Virgin Islands Pub Fin Auth Rev Matching Fd Ln Diago Ser A | | 6.75% | | 10/1/2037 | | BBB | | | 465 | | | 491,989 |
| | | | | | | | | | | | |
| Total | | | | | | | | | | | | 7,245,663 |
| | | | | | | | | | | | |
| | | | | |
| Transportation 5.76% | | | | | | | | | | | | |
| MO St Hwys & Transn Commn 1st Lien Ser B | | 5.00% | | 5/1/2022 | | AAA | | | 2,500 | | | 2,799,350 |
| MO St Hwys & Transn Commn 2nd Lien | | 5.25% | | 5/1/2021 | | AAA | | | 3,500 | | | 4,042,640 |
| St. Louis MO Arpt Rev Lambert Intl Arpt Ser A (FSA) | | 5.00% | | 7/1/2025 | | AAA | | | 2,000 | | | 2,041,000 |
| St. Louis MO Arpt Rev Lambert Intl Arpt Ser A-1 | | 6.25% | | 7/1/2029 | | A | | | 1,000 | | | 1,055,870 |
| | | | | | | | | | | | |
| Total | | | | | | | | | | | | 9,938,860 |
| | | | | | | | | | | | |
| | | | | |
| Utilities 19.09% | | | | | | | | | | | | |
| Carroll Cnty MO Pub Wtr Supply Dist No 1 | | 6.00% | | 3/1/2039 | | A | | | 1,000 | | | 1,108,400 |
| Kansas City MO Santn Swr Sys Rev Ser A | | 5.25% | | 1/1/2034 | | AA | | | 1,000 | | | 1,082,040 |
| Kansas City MO Wtr Rev Ser A | | 5.25% | | 12/1/2032 | | AA+ | | | 1,000 | | | 1,085,400 |
| Metro St. Louis MO Swr Dist Ser A | | 5.75% | | 5/1/2038 | | AA+ | | | 1,760 | | | 2,036,566 |
| Metro St. Louis MO Swr Dist Ser A (NPFGC) | | 5.00% | | 5/1/2034 | | AA+ | | | 2,000 | | | 2,081,900 |
| MO Jt Muni Elec Util Commn Iatan 2 Pj Ser A (AMBAC) | | 5.00% | | 1/1/2034 | | A3 | | | 1,000 | | | 988,840 |
| MO Jt Muni Elec Util Commn Iatan 2 Pj Ser A | | 6.00% | | 1/1/2039 | | A3 | | | 2,000 | | | 2,132,640 |
| MO Jt Muni Elec Util Commn Plum Point Pj (NPFGC) | | 5.00% | | 1/1/2034 | | A | | | 5,000 | | | 4,776,500 |
See Notes to Financial Statements.
86
Schedule of Investments (concluded)
MISSOURI TAX FREE FUND September 30, 2009
| | | | | | | | | | | | |
| Investments | | Interest
Rate | | Maturity
Date | | Credit
Rating:
S&P or
Moody’s(a) | | Principal
Amount
(000) | | Value |
| Utilities (continued) | | | | | | | | | | | | |
| MO Jt Muni Elec Util Commn Ser A (AMBAC) | | 5.00% | | 1/1/2023 | | A3 | | $ | 3,000 | | $ | 3,202,320 |
| MO St Envr Impt & Enrg Res Auth Amer Wtr Co Pj AMT (AMBAC) | | 4.60% | | 12/1/2036 | | Baa1 | | | 1,000 | | | 839,220 |
| MO St Envr Impt & Enrg Res Auth Union Elec Co Pj AMT | | 5.45% | | 10/1/2028 | | A3 | | | 2,475 | | | 2,389,860 |
| MO St Envr Impt & Enrg Res Auth Unref Bal St Revolving B | | 7.20% | | 7/1/2016 | | Aaa | | | 1,060 | | | 1,065,014 |
| MO St Envr Impt & Enrg Res Auth Unref Bal St Revolving D | | 5.90% | | 1/1/2019 | | Aaa | | | 240 | | | 240,847 |
| MO St Envr Impt & Enrg Res Auth Unref Bal St Revolving E | | 5.625% | | 7/1/2016 | | Aaa | | | 220 | | | 220,728 |
| Puerto Rico Comwlth Aqueduct & Swr Auth Sr Lien Ser A (AG) | | 5.125% | | 7/1/2047 | | AAA | | | 1,000 | | | 1,020,750 |
| Puerto Rico Elec Pwr Auth Ser RR (XLCA) | | 5.00% | | 7/1/2025 | | A3 | | | 1,000 | | | 1,036,230 |
| Puerto Rico Elec Pwr Auth Ser TT | | 5.00% | | 7/1/2032 | | A3 | | | 2,500 | | | 2,533,425 |
| Puerto Rico Elec Pwr Auth Ser WW | | 5.00% | | 7/1/2028 | | A3 | | | 1,500 | | | 1,540,500 |
| St. Charles Cnty MO Pub Wtr Dist No 2 Pj Ser A COP (NPFGC) | | 5.125% | | 12/1/2027 | | Baa1 | | | 1,500 | | | 1,516,200 |
| St. Joseph MO Indl Dev Auth Swr Sys Impts Pj | | 5.00% | | 4/1/2027 | | A | | | 1,325 | | | 1,384,705 |
| Virgin Islands Wtr & Pwr Auth Ser A | | 5.00% | | 7/1/2031 | | BBB- | | | 730 | | | 659,971 |
| | | | | | | | | | | | |
| Total | | | | | | | | | | | | 32,942,056 |
| | | | | | | | | | | | |
| Total Investments in Municipal Bonds 97.40% (cost $165,947,257) | | | | | | | | 168,070,883 |
| | | | | | | | |
| Cash and Other Assets in Excess of Liabilities(f) 2.60% | | | 4,478,065 |
| | | | | | | | | | | | |
| Net Assets 100.00% | | | | | | | | | | | $ | 172,548,948 |
| | | | | | | | | | | | |
Open Futures Contracts at September 30, 2009:
| | | | | | | | | | | | |
| Type | | Expiration | | Contracts | | Position | | Market
Value | | Unrealized
Depreciation |
| U.S. 30-Year Treasury Bond | | December 2009 | | 106 | | Short | | $ | (12,865,750) | | $ | (282,759) |
See Notes to Financial Statements.
87
Schedule of Investments
NEW JERSEY TAX FREE FUND September 30, 2009
| | | | | | | | | | | | |
| Investments | | Interest
Rate | | Maturity
Date | | Credit
Rating:
S&P or
Moody’s(a) | | Principal
Amount
(000) | | Value |
| MUNICIPAL BONDS 98.34% | | | | | | | | | | | | |
| | | | | |
| Corporate-Backed 6.05% | | | | | | | | | | | | |
| Bayonne NJ Redev Agy Royal Caribbean Pj Ser A AMT | | 5.375% | | 11/1/2035 | | BB- | | $ | 750 | | $ | 424,620 |
| NJ Econ Dev Auth Amer Wtr Co Inc Ser B AMT (NPFGC)FGIC) | | 5.375% | | 5/1/2032 | | NR | | | 5,000 | | | 4,776,550 |
| NJ Econ Dev Auth Kapkowski Rd Landfill Pj | | 6.50% | | 4/1/2028 | | Baa3 | | | 675 | | | 616,214 |
| NJ Econ Dev Auth Spl Fac Continental Airlines Inc Pj AMT | | 5.50% | | 4/1/2028 | | B3 | | | 320 | | | 216,333 |
| NJ Econ Dev Auth Spl Fac Continental Airlines Inc Pj AMT | | 6.25% | | 9/15/2029 | | B | | | 1,000 | | | 907,040 |
| Virgin Islands Pub Fin Auth Sr Secd Hovensa Refinery AMT | | 4.70% | | 7/1/2022 | | BBB | | | 1,000 | | | 915,310 |
| | | | | | | | | | | | |
| Total | | | | | | | | | | | | 7,856,067 |
| | | | | | | | | | | | |
| | | | | |
| Education 17.21% | | | | | | | | | | | | |
| NJ Econ Dev Auth Sch Facs Constr Ser O | | 5.25% | | 3/1/2025 | | AA- | | | 1,085 | | | 1,159,550 |
| NJ Econ Dev Auth Sch Facs Constr Ser P | | 5.25% | | 9/1/2026 | | AA- | | | 1,000 | | | 1,070,020 |
| NJ St Edl Facs Auth College of NJ Ser D (FSA) | �� | 5.00% | | 7/1/2028 | | AAA | | | 3,000 | | | 3,251,460 |
| NJ St Edl Facs Auth Georgian Court Univ Ser D | | 5.25% | | 7/1/2037 | | BBB+ | | | 750 | | | 763,298 |
| NJ St Edl Facs Auth Kean Univ Ser D (NPFGC)(FGIC) | | 5.00% | | 7/1/2032 | | A | | | 500 | | | 513,850 |
| NJ St Edl Facs Auth Montclair St Univ Ser J | | 5.00% | | 7/1/2029 | | A2 | | | 2,000 | | | 2,115,900 |
| NJ St Edl Facs Auth Rev William Paterson Univ Ser E (XLCA) | | 5.00% | | 7/1/2027 | | A2 | | | 2,500 | | | 2,571,300 |
| NJ St Edl Facs Auth Rider Univ Ser C (RADIAN) | | 4.70% | | 7/1/2027 | | Baa1 | | | 1,000 | | | 941,350 |
| NJ St Edl Facs Auth Rowan Univ Ser B (AG) | | 5.00% | | 7/1/2027 | | AAA | | | 1,725 | | | 1,862,948 |
| NJ St Edl Facs Auth Seton Hall Univ Ser E | | 6.00% | | 7/1/2028 | | A | | | 2,400 | | | 2,713,512 |
| NJ St Edl Facs Auth Stevens Inst Tech Ser A | | 5.00% | | 7/1/2034 | | BBB+ | | | 1,000 | | | 1,020,500 |
| NJ St Edl Facs Auth Univ Med & Dentistry Ser B | | 7.50% | | 12/1/2032 | | Baa2 | | | 1,000 | | | 1,143,340 |
| NJ St Higher Ed Student Assist Auth Ser A AMT (NPFGC) | | 6.15% | | 6/1/2019 | | A | | | 465 | | | 471,664 |
| Rutgers St Univ NJ Ser F | | 5.00% | | 5/1/2031 | | AA | | | 2,500 | | | 2,734,575 |
| | | | | | | | | | | | |
| Total | | | | | | | | | | | | 22,333,267 |
| | | | | | | | | | | | |
See Notes to Financial Statements.
88
Schedule of Investments (continued)
NEW JERSEY TAX FREE FUND September 30, 2009
| | | | | | | | | | | | |
| Investments | | Interest
Rate | | Maturity
Date | | Credit
Rating:
S&P or
Moody’s(a) | | Principal
Amount
(000) | | Value |
| General Obligation 12.82% | | | | | | | | | | | | |
| Essex Cnty NJ Impt Auth Pj Cons GTD (AMBAC) | | 5.25% | | 12/15/2018 | | A1 | | $ | 2,000 | | $ | 2,343,380 |
| Gloucester Cnty NJ Impt Auth Cnty Ln Cnty Cap Pg GTD | | 5.00% | | 4/1/2028 | | AA+ | | | 2,500 | | | 2,763,675 |
| Irvington Twp NJ Gen Impt | | 5.00% | | 1/1/2021 | | A1 | | | 1,410 | | | 1,602,310 |
| Millburn Twp NJ Brd Ed | | 5.35% | | 7/15/2018 | | Aa1 | | | 1,050 | | | 1,281,725 |
| Millburn Twp NJ Brd Ed | | 5.35% | | 7/15/2019 | | Aa1 | | | 250 | | | 307,555 |
| Montville Twp NJ Fire Dist No 2 | | 5.25% | | 7/15/2016 | | A3 | | | 410 | | | 459,598 |
| Newark NJ Hsg Auth Rev South Ward Police Fac (AG) | | 6.75% | | 12/1/2038 | | Aa2 | | | 750 | | | 855,390 |
| NJ St Equip Lease Purchase Ser A COP | | 5.25% | | 6/15/2029 | | AA- | | | 1,000 | | | 1,070,510 |
| Northern Mariana Islands Comwlth Ser B | | 5.00% | | 10/1/2033 | | NR | | | 2,500 | | | 1,983,675 |
| Paterson NJ (FSA) | | 5.00% | | 6/15/2020 | | Aa3 | | | 900 | | | 965,700 |
| Pohatcong Twp NJ Sch Dist (FSA) | | 5.25% | | 7/15/2026 | | AAA | | | 1,335 | | | 1,642,023 |
| Puerto Rico Comwlth Pub Impt CR (FSA) | | 4.50% | | 7/1/2023 | | AAA | | | 1,000 | | | 1,003,260 |
| Puerto Rico Comwlth Unref Bal Pub Impt Ser A | | 5.25% | | 7/1/2030 | | BBB- | | | 190 | | | 190,410 |
| Rahway NJ (FSA) | | 4.125% | | 12/15/2026 | | Aa3 | | | 5 | | | 5,210 |
| Territory of Guam Ser A | | 7.00% | | 11/15/2039 | | B+ | | | 140 | | | 153,490 |
| | | | | | | | | | | | |
| Total | | | | | | | | | | | | 16,627,911 |
| | | | | | | | | | | | |
| | | | | |
| Healthcare 26.29% | | | | | | | | | | | | |
| Burlington Cnty NJ Bridge Commn The Evergreens Pj | | 5.625% | | 1/1/2038 | | NR | | | 1,000 | | | 890,910 |
| Camden Cnty NJ Impt Auth Cooper Hlth Sys Oblig Grp A | | 5.00% | | 2/15/2035 | | BBB | | | 760 | | | 611,192 |
| NJ Econ Dev Auth First Mtg Seashore Gardens Pj | | 5.30% | | 11/1/2026 | | NR | | | 500 | | | 391,805 |
| NJ Econ Dev Auth First Mtg Seashore Gardens Pj | | 5.375% | | 11/1/2036 | | NR | | | 1,000 | | | 737,040 |
| NJ Econ Dev Auth Masonic Charity Fndtn Pj | | 6.00% | | 6/1/2025 | | A- | | | 1,000 | | | 1,040,880 |
| NJ Econ Dev Auth Seabrook Vlg Inc Fac | | 5.25% | �� | 11/15/2036 | | NR | | | 1,500 | | | 1,185,975 |
| NJ Hlthcare Facs Fing Auth AHS Hosp Corp Ser A | | 5.00% | | 7/1/2027 | | A1 | | | 2,000 | | | 2,039,580 |
| NJ Hlthcare Facs Fing Auth Atlanticare Regl Med Ctr | | 5.00% | | 7/1/2037 | | A+ | | | 1,000 | | | 1,003,740 |
| NJ Hlthcare Facs Fing Auth Cap Hlth Sys Oblig Grp Ser A | | 5.375% | | 7/1/2033 | | Baa1 | | | 2,000 | | | 2,260,460 |
| NJ Hlthcare Facs Fing Auth Hackensack Univ Med Ctr (AG) | | 5.25% | | 1/1/2031 | | Aa2 | | | 2,100 | | | 2,243,052 |
See Notes to Financial Statements.
89
Schedule of Investments (continued)
NEW JERSEY TAX FREE FUND September 30, 2009
| | | | | | | | | | | | | |
| Investments | | Interest
Rate | | Maturity
Date | | Credit
Rating:
S&P or
Moody’s(a) | | | Principal
Amount
(000) | | Value |
| Healthcare (continued) | | | | | | | | | | | | | |
| NJ Hlthcare Facs Fing Auth Holy Name Hosp | | 5.00% | | 7/1/2036 | | Baa2 | | | $ | 1,700 | | $ | 1,419,653 |
| NJ Hlthcare Facs Fing Auth Hosp Asset Transformation Pg Ser A | | 5.00% | | 10/1/2028 | | AA- | | | | 5,000 | | | 5,247,250 |
| NJ Hlthcare Facs Fing Auth Hosp Asset Transformation Pg Ser A | | 5.75% | | 10/1/2031 | | AA- | | | | 1,250 | | | 1,357,825 |
| NJ Hlthcare Facs Fing Auth Hunterdon Med Ctr Ser A | | 5.25% | | 7/1/2025 | | A- | | | | 600 | | | 614,304 |
| NJ Hlthcare Facs Fing Auth Robert Wood Johnson Univ Hosp | | 5.75% | | 7/1/2031 | | A2 | | | | 3,000 | | | 3,016,290 |
| NJ Hlthcare Facs Fing Auth Somerset Med Ctr | | 5.50% | | 7/1/2033 | | Ba2 | | | | 1,130 | | | 831,578 |
| NJ Hlthcare Facs Fing Auth St. Joseph’s Hlthcare Sys | | 6.625% | | 7/1/2038 | | BBB- | | | | 1,000 | | | 1,029,580 |
| NJ Hlthcare Facs Fing Auth St. Peter’s Univ Hosp Oblig | | 5.25% | | 7/1/2021 | | Baa2 | | | | 1,000 | | | 1,011,090 |
| NJ Hlthcare Facs Fing Auth Trinitas Hosp Oblig Grp Ser A | | 4.75% | | 7/1/2024 | | BBB- | | | | 1,000 | | | 866,370 |
| NJ Hlthcare Facs Fing Auth Trinitas Hosp Oblig Grp Ser A | | 5.25% | | 7/1/2030 | | BBB- | | | | 1,000 | | | 852,560 |
| NJ Hlthcare Facs Fing Auth Virtua Hlth | | 5.75% | | 7/1/2033 | | A | | | | 2,500 | | | 2,605,750 |
| Puerto Rico Indl Tourist Edl Med & Envr Ctrl Facs Fing Auth Hosp Auxilio Mutuo Oblig Grp Ser A (NPFGC) | | 6.25% | | 7/1/2024 | | A | | | | 1,000 | | | 1,000,140 |
| Puerto Rico Indl Tourist Edl Med & Envr Ctrl Facs Fing Auth Hosp de la Concepcion Ser A | | 6.125% | | 11/15/2025 | | Aa1 | | | | 415 | | | 430,235 |
| Puerto Rico Indl Tourist Edl Med & Envr Ctrl Facs Fing Auth Hosp de la Concepcion Ser A | | 6.125% | | 11/15/2030 | | Aa1 | | | | 1,000 | | | 1,034,940 |
| Territory of Guam Oblig Rev Section 30 Ser A | | 5.75% | | 12/1/2034 | | BBB- | | | | 375 | | | 385,125 |
| | | | | | | | | | | | | |
| Total | | | | | | | | | | | | | 34,107,324 |
| | | | | | | | | | | | | |
| | | | | |
| Housing 2.03% | | | | | | | | | | | | | |
| NJ Econ Dev Auth Cranes Mill Pj Ser A | | 5.00% | | 6/1/2015 | | BBB- | (c) | | | 715 | | | 679,765 |
| NJ St Hsg & Mtg Fin Agy Sing Fam Hsg Ser T AMT | | 4.625% | | 10/1/2027 | | AA | | | | 2,000 | | | 1,886,300 |
| Virgin Islands Hsg Fin Auth Sing Fam Mtg Bkd Secs Pg Ser A AMT (GNMA) | | 6.50% | | 3/1/2025 | | NR | | | | 65 | | | 65,395 |
| | | | | | | | | | | | | |
| Total | | | | | | | | | | | | | 2,631,460 |
| | | | | | | | | | | | | |
See Notes to Financial Statements.
90
Schedule of Investments (continued)
NEW JERSEY TAX FREE FUND September 30, 2009
| | | | | | | | | | | | |
| Investments | | Interest
Rate | | Maturity
Date | | Credit
Rating:
S&P or
Moody’s(a) | | Principal
Amount
(000) | | Value |
| Lease Obligations 5.12% | | | | | | | | | | | | |
| Morris-Union Jt Commn NJ COP (RADIAN) | | 5.00% | | 5/1/2027 | | Baa2 | | $ | 1,000 | | $ | 983,890 |
| NJ Econ Dev Auth Sch Facs Constr Ser AA | | 5.50% | | 12/15/2029 | | AA- | | | 1,250 | | | 1,439,525 |
| NJ Econ Dev Auth Sch Facs Constr Ser Y | | 5.00% | | 9/1/2033 | | AA- | | | 1,000 | | | 1,058,130 |
| Puerto Rico Comwlth Infrastr Fing Auth Mepsi Campus Pj Ser A | | 6.50% | | 10/1/2037 | | NR | | | 1,000 | | | 884,690 |
| Puerto Rico Pub Bldgs Auth Rev Govt Facs Ser P GTD | | 6.50% | | 7/1/2030 | | BBB- | | | 1,000 | | | 1,072,180 |
| Puerto Rico Pub Bldgs Auth Rev Unref Bal Govt Facs I GTD | | 5.25% | | 7/1/2033 | | BBB- | | | 1,230 | | | 1,205,376 |
| | | | | | | | | | | | |
| Total | | | | | | | | | | | | 6,643,791 |
| | | | | | | | | | | | |
| | | | | |
| Other Revenue 6.66% | | | | | | | | | | | | |
| Hudson Cnty NJ Impt Auth Hudson Regl Fire & Rescue Ser A (AMBAC) | | 5.625% | | 9/1/2019 | | NR | | | 100 | | | 101,180 |
| Middlesex Cnty NJ Impt Auth Sub Heldrich Ctr Hotel Ser B | | 6.25% | | 1/1/2037 | | NR | | | 1,300 | | | 248,742 |
| Monmouth Cnty NJ Impt Auth Rev Unref Bal Govt Ln (NPFGC) | | 6.40% | | 12/1/2009 | | AA | | | 195 | | | 195,027 |
| NJ Econ Dev Auth Motor Vehicle Surcharge Rev Ser A (NPFGC) | | 5.00% | | 7/1/2034 | | A | | | 75 | | | 76,163 |
| NJ Econ Dev Auth Muni Rehab Ser A (AMBAC) | | 5.00% | | 4/1/2028 | | AA- | | | 1,130 | | | 1,162,555 |
| NJ Envr Infrastr Tr Ser C | | 5.00% | | 9/1/2021 | | AAA | | | 3,000 | | | 3,654,030 |
| NJ St Edl Facs Auth Richard Stockton College Ser F (NPFCG) | | 5.00% | | 7/1/2031 | | A3 | | | 2,765 | | | 2,829,867 |
| Rahway NJ Sch Dist COP (NPFGC) | | 5.625% | | 2/15/2020 | | Baa1 | | | 365 | | | 372,862 |
| | | | | | | | | | | | |
| Total | | | | | | | | | | | | 8,640,426 |
| | | | | | | | | | | | |
| | | | | |
| Pre-Refunded 1.39% | | | | | | | | | | | | |
| Carteret NJ Brd Ed Ctfs (NPFGC) | | 5.75% | | 1/15/2030 | | NR | | | 80 | | | 81,997 |
| North Bergen Twp NJ Brd Ed COP (FSA) | | 6.125% | | 12/15/2022 | | Aa3 | | | 1,185 | | | 1,277,987 |
| Puerto Rico Comwlth Pub Impt Ser A | | 5.25% | | 7/1/2030 | | AAA | | | 310 | | | 373,646 |
| Puerto Rico Pub Bldgs Auth Rev Govt Facs I GTD | | 5.25% | | 7/1/2033 | | NR | | | 20 | | | 22,914 |
| South Brunswick Twp NJ Brd Of Ed (FGIC) | | 5.625% | | 12/1/2023 | | AA | | | 45 | | | 45,365 |
| | | | | | | | | | | | |
| Total | | | | | | | | | | | | 1,801,909 |
| | | | | | | | | | | | |
| | | | | |
| Special Tax 0.44% | | | | | | | | | | | | |
| NJ Econ Dev Auth Newark Downtown Dist Mgmt Corp | | 5.125% | | 6/15/2037 | | Baa3 | | | 700 | | | 565,628 |
| | | | | | | | | | | | |
See Notes to Financial Statements.
91
Schedule of Investments (continued)
NEW JERSEY TAX FREE FUND September 30, 2009
| | | | | | | | | | | | |
| Investments | | Interest
Rate | | Maturity
Date | | Credit
Rating:
S&P or
Moody’s(a) | | Principal
Amount
(000) | | Value |
| Tax Revenue 3.51% | | | | | | | | | | | | |
| NJ Econ Dev Auth Cigarette Tax | | 5.75% | | 6/15/2029 | | BBB | | $ | 1,000 | | $ | 1,003,160 |
| Puerto Rico Sales Tax Fing Corp 1st Sub Ser A | | 5.75% | | 8/1/2037 | | A+ | | | 2,000 | | | 2,160,280 |
| Puerto Rico Sales Tax Fing Corp Ser A | | 5.25% | | 8/1/2057 | | AA- | | | 775 | | | 802,575 |
| Virgin Islands Pub Fin Auth Rev Matching Fd Ln Diago Ser A | | 6.75% | | 10/1/2037 | | BBB | | | 555 | | | 587,212 |
| | | | | | | | | | | | |
| Total | | | | | | | | | | | | 4,553,227 |
| | | | | | | | | | | | |
| | | | | |
| Tobacco 1.74% | | | | | | | | | | | | |
| NJ Tob Sttlmnt Fing Corp Cap Apprec Bds Ser 1C | | Zero Coupon | | 6/1/2041 | | BB- | | | 25,000 | | | 1,494,500 |
| NJ Tob Sttlmnt Fing Corp Ser 1A | | 4.75% | | 6/1/2034 | | BBB | | | 1,000 | | | 766,190 |
| | | | | | | | | | | | |
| Total | | | | | | | | | | | | 2,260,690 |
| | | | | | | | | | | | |
| | | | | |
| Transportation 12.79% | | | | | | | | | | | | |
| Hudson Cnty NJ Impt Auth Harrison Pkg Fac Pj Ser C GTD (AG) | | 5.125% | | 1/1/2031 | | AAA | | | 2,500 | | | 2,737,550 |
| NJ St Transn Tr Fd Auth TCRS (AMBAC) | | 5.25% | | 12/15/2022 | | AA- | | | 1,500 | | | 1,723,965 |
| NJ St Transn Tr Fd Auth Transn Sys Ser A (NPFGC) | | 5.25% | | 12/15/2021 | | AA- | | | 5,000 | | | 5,776,100 |
| Port Auth NY & NJ Cons 125th Ser (FSA) | | 5.00% | | 10/15/2027 | | AAA | | | 5,000 | | | 5,244,300 |
| Port Auth NY & NJ Cons 152nd AMT | | 5.75% | | 11/1/2030 | | AA- | | | 1,000 | | | 1,114,390 |
| | | | | | | | | | | | |
| Total | | | | | | | | | | | | 16,596,305 |
| | | | | | | | | | | | |
| | | | | |
| Utilities 2.29% | | | | | | | | | | | | |
| North Hudson NJ Sewerage Auth Swr Rev Ser C (NPFGC) | | 5.00% | | 8/1/2022 | | Baa1 | | | 1,025 | | | 1,037,208 |
| Puerto Rico Elec Pwr Auth Ser WW | | 5.00% | | 7/1/2028 | | A3 | | | 1,000 | | | 1,027,000 |
| Virgin Islands Wtr & Pwr Auth Ser A | | 5.00% | | 7/1/2031 | | BBB- | | | 1,000 | | | 904,070 |
| | | | | | | | | | | | |
| Total | | | | | | | | | | | | 2,968,278 |
| | | | | | | | | | | | |
| Total Municipal Bonds (cost $127,522,083) | | | | | | 127,586,283 |
| | | | | | | | | | | | |
| | | | | |
| | | | | | | | | Shares
(000) | | |
| SHORT-TERM INVESTMENT 0.31% | | | | | | | | | | | | |
| | | | | |
| Money Market Mutual Fund | | | | | | | | | | | | |
| Dreyfus NJ Municipal Cash Management (cost $404,575) | | | | | 405 | | | 404,575 |
| | | | | | | | | | | | |
| Total Investments in Securities 98.65% (cost $127,926,658) | | | 127,990,858 |
| | | | | | | | | | | | |
| Cash and Other Assets in Excess of Liabilities(f) 1.35% | | | | | | 1,755,295 |
| | | | | | | | | | | | |
| Net Assets 100.00% | | | | | | | | | | | $ | 129,746,153 |
| | | | | | | | | | | | |
See Notes to Financial Statements.
92
Schedule of Investments (concluded)
NEW JERSEY TAX FREE FUND September 30, 2009
Open Futures Contracts at September 30, 2009:
| | | | | | | | | | | | |
| Type | | Expiration | | Contracts | | Position | | Market
Value | | Unrealized
Depreciation |
| U.S. 30-Year Treasury Bond | | December 2009 | | 125 | | Short | | $ | (15,171,875) | | $ | (332,160) |
See Notes to Financial Statements.
93
Schedule of Investments
NEW YORK TAX FREE FUND September 30, 2009
| | | | | | | | | | | | |
| Investments | | Interest
Rate | | Maturity
Date | | Credit
Rating:
S&P or
Moody’s(a) | | Principal
Amount
(000) | | Value |
| MUNICIPAL BONDS 104.66% | | | | | | | | | | | | |
| | | | | |
| Corporate-Backed 6.79% | | | | | | | | | | | | |
| Broome Cnty NY Indl Dev Agy Univ Plaza LLC Phase II Pj Ser B (ACA) | | 5.10% | | 8/1/2036 | | NR | | $ | 500 | | $ | 321,385 |
| Essex Cnty NY Indl Dev Agy Intl Paper Co Pjs Ser A AMT | | 4.60% | | 12/1/2030 | | BBB | | | 1,400 | | | 1,220,800 |
| Liberty NY Dev Corp Rev Goldman Sachs Headquarters | | 5.25% | | 10/1/2035 | | A1 | | | 5,000 | | | 5,129,150 |
| New York City NY Indl Dev Agy British Airways Plc Pj AMT | | 5.25% | | 12/1/2032 | | BB | | | 2,245 | | | 1,504,599 |
| New York City NY Indl Dev Agy JetBlue Airways Corp Pj AMT | | 5.125% | | 5/15/2030 | | B- | | | 3,000 | | | 2,226,510 |
| New York City NY Indl Dev Agy Pkg Fac Royal Charter NY Presbyterian (FSA) | | 5.75% | | 12/15/2029 | | AAA | | | 1,000 | | | 1,066,480 |
| New York City NY Indl Dev Agy Utd Jewish Appeal Fed Pj A | | 5.00% | | 7/1/2027 | | Aa1 | | | 1,250 | | | 1,321,637 |
| Seneca NY Nation Indians Cap Impts Auth Ser A† | | 5.00% | | 12/1/2023 | | BB | | | 1,000 | | | 832,340 |
| Seneca NY Nation Indians Cap Impts Auth Ser A† | | 5.25% | | 12/1/2016 | | BB | | | 1,000 | | | 916,940 |
| TSASC Inc NY Ser 1 | | 5.00% | | 6/1/2026 | | BBB | | | 1,750 | | | 1,655,220 |
| Virgin Islands Pub Fin Auth Sr Secd Hovensa Refinery AMT | | 4.70% | | 7/1/2022 | | BBB | | | 1,665 | | | 1,523,991 |
| Yonkers NY Indl Dev Agy Rev Sacred Hrt Assocs Pj Ser A AMT (SONYMA) | | 4.80% | | 10/1/2026 | | Aa1 | | | 750 | | | 746,550 |
| | | | | | | | | | | | |
| Total | | | | | | | | | | | | 18,465,602 |
| | | | | | | | | | | | |
| | | | | |
| Education 12.25% | | | | | | | | | | | | |
| Albany NY Indl Dev Agy Civic Fac Albany College Pharmacy Pj Ser A | | 5.625% | | 12/1/2034 | | BBB- | | | 700 | | | 602,966 |
| Albany NY Indl Dev Agy Civic Fac Albany Law Sch Univ Ser A | | 5.00% | | 7/1/2031 | | BBB | | | 1,000 | | | 913,300 |
| Cattaraugus Cnty NY Indl Dev Agy St. Bonaventure Univ Pj Ser A | | 5.00% | | 5/1/2023 | | BBB- | | | 500 | | | 451,415 |
| Cattaraugus Cnty NY Indl Dev Agy St. Bonaventure Univ Pj Ser A | | 5.10% | | 5/1/2031 | | BBB- | | | 1,075 | | | 913,804 |
| Hempstead Twn NY Indl Dev Agy Hofstra Univ Pj (NPFGC) | | 5.80% | | 7/1/2015 | | A | | | 750 | | | 750,150 |
| Nassau Cnty NY Indl Dev Agy Amsterdam At Harborside Ser A | | 6.50% | | 1/1/2027 | | NR | | | 1,000 | | | 903,100 |
See Notes to Financial Statements.
94
Schedule of Investments (continued)
NEW YORK TAX FREE FUND September 30, 2009
| | | | | | | | | | | | |
| Investments | | Interest
Rate | | Maturity
Date | | Credit
Rating:
S&P or
Moody’s(a) | | Principal
Amount
(000) | | Value |
| Education (continued) | | | | | | | | | | | | |
| New York City NY Indl Dev Agy NY Inst of Tech Pj (NPFGC) | | 5.25% | | 3/1/2023 | | A | | $ | 100 | | $ | 107,096 |
| New York City NY Indl Dev Agy Polytechnic Univ Pj (ACA) | | 5.25% | | 11/1/2037 | | BB+ | | | 1,450 | | | 1,347,615 |
| New York City NY Indl Dev Agy Vaughn College Aeronautics B | | 5.00% | | 12/1/2031 | | BB+ | | | 1,510 | | | 1,178,027 |
| NY St Dorm Auth Lease Rev Cap Apprec Court Facs | | Zero Coupon | | 8/1/2021 | | AA+ | | | 3,265 | | | 2,046,633 |
| NY St Dorm Auth Lease Rev Master Boces Pg Oneida | | 5.25% | | 8/15/2028 | | A+ | | | 3,375 | | | 3,596,197 |
| NY St Dorm Auth Rev 4201 Schs Pg | | 6.25% | | 7/1/2020 | | AA- | | | 1,685 | | | 1,738,583 |
| NY St Dorm Auth Rev Colgate Univ (NPFGC) | | 6.00% | | 7/1/2016 | | AA- | | | 1,000 | | | 1,158,400 |
| NY St Dorm Auth Rev Non St Supp Debt NYU Ser C | | 5.00% | | 7/1/2029 | | AA- | | | 5,000 | | | 5,384,500 |
| NY St Dorm Auth Rev Non St Supp Debt Rochester Inst Tech Ser A | | 6.25% | | 7/1/2029 | | A1 | | | 2,750 | | | 3,143,470 |
| NY St Dorm Auth Rev Non St Supp Debt Teachers College | | 5.375% | | 3/1/2029 | | A1 | | | 1,000 | | | 1,076,790 |
| NY St Dorm Auth Rev Non St Supp Debt Yeshiva Univ | | 5.00% | | 9/1/2034 | | AA | | | 1,500 | | | 1,590,120 |
| NY St Dorm Auth Rev Spl Act Sch Dist Pg (NPFGC) | | 6.00% | | 7/1/2016 | | A | | | 1,400 | | | 1,400,252 |
| NY St Dorm Auth Rev St City Univ Cons 5th Gen Res Ser B | | 5.00% | | 7/1/2027 | | AA- | | | 1,500 | | | 1,597,095 |
| Oneida Cnty NY Indl Dev Agy Hamilton College Civic Fac | | 5.00% | | 9/15/2027 | | Aa2 | | | 2,565 | | | 2,802,596 |
| Rensselaer Cnty NY Indl Dev Agy Polytech Inst Ser B TCRS (AMBAC) | | 5.50% | | 8/1/2022 | | A | | | 200 | | | 202,222 |
| Seneca Cnty NY Indl Dev Agy NY Chiropractic College | | 5.00% | | 10/1/2027 | | BBB | | | 500 | | | 443,420 |
| | | | | | | | | | | | |
| Total | | | | | | | | | | | | 33,347,751 |
| | | | | | | | | | | | |
| | | | | |
| General Obligation 12.19% | | | | | | | | | | | | |
| New York City NY Sub Ser I-1(b) | | 5.00% | | 4/1/2025 | | AA | | | 10,000 | | | 10,720,650 |
| Northern Mariana Islands Comwlth Ser B | | 5.00% | | 10/1/2033 | | NR | | | 4,000 | | | 3,173,880 |
| NY St Dorm Auth Rev Non St Supp Debt Sch Dist Fing Pg Ser C (FSA) | | 5.00% | | 10/1/2032 | | AAA | | | 1,425 | | | 1,523,624 |
| NY St Urban Dev Corp Rev St Pers Income Tax Ser A-1(b) | | 5.00% | | 12/15/2025 | | AAA | | | 3,290 | | | 3,653,036 |
See Notes to Financial Statements.
95
Schedule of Investments (continued)
NEW YORK TAX FREE FUND September 30, 2009
| | | | | | | | | | | | |
| Investments | | Interest
Rate | | Maturity
Date | | Credit
Rating:
S&P or
Moody’s(a) | | Principal
Amount
(000) | | Value |
| General Obligation (continued) | | | | | | | | | | | | |
| NY St Urban Dev Corp Rev St Pers Income Tax Ser A-1(b) | | 5.00% | | 12/15/2026 | | AAA | | $ | 4,790 | | $ | 5,318,554 |
| NY St Urban Dev Corp Rev St Pers Income Tax Ser A-1(b) | | 5.00% | | 12/15/2027 | | AAA | | | 1,920 | | | 2,131,863 |
| Puerto Rico Comwlth Pub Impt | | 5.25% | | 7/1/2018 | | BBB- | | | 2,000 | | | 2,096,940 |
| Puerto Rico Comwlth Pub Impt Ser A | | 5.25% | | 7/1/2024 | | BBB- | | | 1,500 | | | 1,522,740 |
| Puerto Rico Comwlth Unref Bal 07 Pub Impt (NPFGC)(IBC) | | 5.00% | | 7/1/2028 | | A | | | 355 | | | 355,050 |
| Puerto Rico Comwlth Unref Bal Pub Impt Ser A | | 5.25% | | 7/1/2030 | | BBB- | | | 190 | | | 190,410 |
| Puerto Rico Comwlth Unref Bal Pub Impt Ser A | | 5.375% | | 7/1/2028 | | BBB- | | | 1,090 | | | 1,099,886 |
| Syracuse NY Indl Dev Agy Syracuse City Sch Dist Ser A (FSA) | | 5.00% | | 5/1/2027 | | AAA | | | 1,000 | | | 1,093,190 |
| Territory of Guam Ser A | | 7.00% | | 11/15/2039 | | B+ | | | 280 | | | 306,981 |
| | | | | | | | | | | | |
| Total | | | | | | | | | | | | 33,186,804 |
| | | | | | | | | | | | |
| | | | | |
| Healthcare 11.23% | | | | | | | | | | | | |
| Albany NY Indl Dev Agy Civic Fac St. Peter’s Hosp Pj Ser A | | 5.25% | | 11/15/2027 | | BBB+ | | | 1,500 | | | 1,506,795 |
| Albany NY Indl Dev Agy Civic Fac St. Peter’s Hosp Pj Ser E | | 5.50% | | 11/15/2027 | | BBB+ | | | 1,000 | | | 1,020,910 |
| Cortland Cnty NY Indl Dev Agy Cortland Mem Hosp Pj (RADIAN) | | 5.625% | | 7/1/2024 | | BBB- | | | 1,750 | | | 1,782,550 |
| Genesee Cnty NY Indl Dev Agy Utd Mem Med Ctr Pj | | 5.00% | | 12/1/2032 | | NR | | | 1,000 | | | 730,630 |
| Madison Cnty NY Indl Dev Agy Civic Fac Oneida Hlth Sys Inc Pj | | 5.25% | | 2/1/2027 | | BBB- | | | 750 | | | 699,022 |
| Madison Cnty NY Indl Dev Agy Civic Fac Oneida Hlth Sys Inc Pj | | 5.50% | | 2/1/2032 | | BBB- | | | 750 | | | 694,590 |
| New York City NY Hlth & Hosp Corp Hlth Sys Ser A | | 5.50% | | 2/15/2023 | | A+ | | | 1,000 | | | 1,090,810 |
| New York City NY Indl Dev Agy Coll Mtg Eger Hrbr Pj A (GNMA) | | 5.875% | | 5/20/2044 | | AA+ | | | 595 | | | 641,160 |
| NY St Dorm Auth Rev Catholic Hlth Long Island Oblig Grp | | 5.00% | | 7/1/2027 | | BBB+ | | | 1,250 | | | 1,216,925 |
| NY St Dorm Auth Rev Lenox Hill Hosp Oblig Grp | | 5.375% | | 7/1/2020 | | Ba1 | | | 2,000 | | | 1,918,680 |
| NY St Dorm Auth Rev Lenox Hill Hosp Oblig Grp | | 5.50% | | 7/1/2030 | | Ba1 | | | 1,500 | | | 1,349,190 |
See Notes to Financial Statements.
96
Schedule of Investments (continued)
NEW YORK TAX FREE FUND September 30, 2009
| | | | | | | | | | | | |
| Investments | | Interest
Rate | | Maturity
Date | | Credit
Rating:
S&P or
Moody’s(a) | | Principal
Amount
(000) | | Value |
| Healthcare (continued) | | | | | | | | | | | | |
| NY St Dorm Auth Rev Mental Hlth Svcs Ser B (NPFGC)(IBC) | | 6.00% | | 8/15/2012 | | AA- | | $ | 1,460 | | $ | 1,634,558 |
| NY St Dorm Auth Rev Mtg Nursing Home (NPFGC) | | 5.40% | | 2/1/2031 | | A | | | 265 | | | 270,462 |
| NY St Dorm Auth Rev Mtg Nursing Home Ser A (NPFGC) | | 5.50% | | 8/1/2030 | | A | | | 1,000 | | | 1,006,280 |
| NY St Dorm Auth Rev Non St Supp Debt Mem Sloan Kettering Sub Ser A2 | | 5.00% | | 7/1/2026 | | AA | | | 2,500 | | | 2,698,000 |
| NY St Dorm Auth Rev Non St Supp Debt Muni Hlth Facs Lease Sub 2-4 | | 5.00% | | 1/15/2028 | | AA- | | | 1,000 | | | 1,048,970 |
| NY St Dorm Auth Rev Non St Supp Debt North Shore L I Jewish Ser A | | 5.25% | | 5/1/2030 | | A- | | | 2,520 | | | 2,571,206 |
| NY St Dorm Auth Rev Non St Supp Debt NYU Hosp Ctr Ser A | | 5.00% | | 7/1/2020 | | Baa2 | | | 1,935 | | | 1,952,473 |
| NY St Dorm Auth Rev Non St Supp Debt NYU Hosp Ctr Ser A | | 5.00% | | 7/1/2036 | | Baa2 | | | 1,265 | | | 1,160,309 |
| NY St Dorm Auth Rev Non St Supp Debt Orange Regl Med Ctr | | 6.125% | | 12/1/2029 | | Ba1 | | | 2,000 | | | 1,852,840 |
| NY St Dorm Auth Rev Utd Cerebral Palsy Aff No 1-A (AMBAC) | | 5.75% | | 7/1/2018 | | NR | | | 1,000 | | | 1,055,480 |
| Suffolk Cnty NY Indl Dev Agy Eastern Long Island Hosp Assoc† | | 5.375% | | 1/1/2027 | | NR | | | 1,280 | | | 1,083,661 |
| Suffolk Cnty NY Indl Dev Agy Eastern Long Island Hosp Assoc† | | 5.50% | | 1/1/2037 | | NR | | | 1,000 | | | 798,150 |
| Territory of Guam Oblig Rev Section 30 Ser A | | 5.75% | | 12/1/2034 | | BBB- | | | 755 | | | 775,385 |
| | | | | | | | | | | | |
| Total | | | | | | | | | | | | 30,559,036 |
| | | | | | | | | | | | |
| | | | | |
| Housing 4.33% | | | | | | | | | | | | |
| New York City NY Hsg Dev Corp Multi Fam Hsg Ser A AMT | | 5.50% | | 11/1/2034 | | AA | | | 1,500 | | | 1,512,720 |
| New York City NY Hsg Dev Corp Multi Fam Hsg Ser L AMT | | 4.85% | | 11/1/2025 | | AA | | | 3,205 | | | 3,228,332 |
| NY St Dorm Auth Rev Upstate Cmnty Colleges Ser B | | 5.25% | | 7/1/2021 | | AA- | | | 1,000 | | | 1,073,040 |
| NY St Hsg Fin Agy Multi Fam Hsg Division St Ser A AMT (SONYMA) | | 5.00% | | 2/15/2026 | | Aa1 | | | 615 | | | 617,085 |
| NY St Mtg Agy Hmownr Mtg Rev Ser 133 AMT | | 4.95% | | 10/1/2021 | | Aa1 | | | 2,000 | | | 2,029,720 |
| NY St Mtg Agy Hmownr Mtg Rev Ser 143 AMT | | 4.875% | | 10/1/2030 | | Aa1 | | | 2,255 | | | 2,214,861 |
See Notes to Financial Statements.
97
Schedule of Investments (continued)
NEW YORK TAX FREE FUND September 30, 2009
| | | | | | | | | | | | |
| Investments | | Interest
Rate | | Maturity
Date | | Credit
Rating:
S&P or
Moody’s(a) | | Principal
Amount
(000) | | Value |
| Housing (continued) | | | | | | | | | | | | |
| NY St Mtg Agy Hmownr Mtg Rev Ser 156 | | 5.20% | | 10/1/2028 | | Aa1 | | $ | 1,000 | | $ | 1,037,790 |
| NY St Mtg Agy Hmownr Mtg Rev Ser 70 | | 5.40% | | 4/1/2022 | | Aa2 | | | 70 | | | 70,200 |
| | | | | | | | | | | | |
| Total | | | | | | | | | | | | 11,783,748 |
| | | | | | | | | | | | |
| | | | | |
| Lease Obligations 13.24% | | | | | | | | | | | | |
| New York City NY Edl Constr Fd Ser A (NPFGC)(FGIC) | | 5.00% | | 4/1/2031 | | AA- | | | 10,215 | | | 10,648,729 |
| New York City NY Indl Dev Agy NY Stock Exchange Pj Ser A | | 4.75% | | 5/1/2029 | | AA- | | | 2,500 | | | 2,583,475 |
| New York City NY Indl Dev Agy Queens Baseball Stadium Pilot (AMBAC) | | 5.00% | | 1/1/2031 | | BBB | | | 1,000 | | | 973,130 |
| New York City NY Indl Dev Agy USTA Natl Tennis (FSA) | | 5.00% | | 11/15/2023 | | AAA | | | 1,830 | | | 2,031,318 |
| New York City NY Transnl Fin Auth Fiscal 2007 Ser S1 (NPFGC)(FGIC) | | 5.00% | | 7/15/2026 | | AA- | | | 6,150 | | | 6,623,181 |
| New York City NY Transnl Fin Auth Fiscal 2008 Ser S1 | | 5.00% | | 1/15/2028 | | AA- | | | 5,000 | | | 5,371,000 |
| NY St Urban Dev Corp Rev St Facs | | 5.70% | | 4/1/2020 | | AA- | | | 4,150 | | | 4,762,872 |
| Puerto Rico Comwlth Infrastr Fing Auth Mepsi Campus Pj Ser A | | 6.50% | | 10/1/2037 | | NR | | | 1,000 | | | 884,690 |
| Puerto Rico Pub Bldgs Auth Rev Govt Facs Ser P GTD | | 6.50% | | 7/1/2030 | | BBB- | | | 2,000 | | | 2,144,360 |
| | | | | | | | | | | | |
| Total | | | | | | | | | | | | 36,022,755 |
| | | | | | | | | | | | |
| | | | | |
| Other Revenue 9.92% | | | | | | | | | | | | |
| Broome Cnty NY Indl Dev Agy Univ Plaza LLC Phase I Pj Ser A (ACA) | | 5.20% | | 8/1/2030 | | NR | | | 750 | | | 515,700 |
| Broome Cnty NY Indl Dev Agy Univ Plaza LLC Phase I Pj Ser A (ACA) | | 5.20% | | 8/1/2036 | | NR | | | 1,000 | | | 653,270 |
| New York City NY Tr Cultural Res Lincoln Ctr Ser C | | 5.75% | | 12/1/2018 | | A+ | | | 2,500 | | | 2,950,150 |
| New York City NY Tr Cultural Res Museum Modern Art Ser 1A | | 5.00% | | 4/1/2031 | | Aa2 | | | 4,500 | | | 4,858,110 |
| New York City NY Transnl Fin Auth Future Tax Secd Ser A | | 5.00% | | 5/1/2034 | | AAA | | | 5,000 | | | 5,373,650 |
| NY St Urban Dev Corp Rev St Pers Income Tax Ser A-1 | | 5.00% | | 12/15/2028 | | AAA | | | 2,625 | | | 2,890,913 |
| NY St Urban Dev Corp Rev St Pers Income Tax Ser A-1(b) | | 5.00% | | 12/15/2028 | | AAA | | | 4,160 | | | 4,581,408 |
See Notes to Financial Statements.
98
Schedule of Investments (continued)
NEW YORK TAX FREE FUND September 30, 2009
| | | | | | | | | | | | |
| Investments | | Interest
Rate | | Maturity
Date | | Credit
Rating:
S&P or
Moody’s(a) | | Principal
Amount
(000) | | Value |
| Other Revenue (continued) | | | | | | | | | | | | |
| NY St Urban Dev Corp Rev St Pers Income Tax Ser B | | 5.00% | | 3/15/2032 | | AAA | | $ | 2,250 | | $ | 2,395,080 |
| Puerto Rico Pub Bldgs Auth Rev Unref Bal Govt Facs Ser D GTD | | 5.25% | | 7/1/2027 | | BBB- | | | 265 | | | 266,452 |
| Ulster Cnty NY Indl Dev Agy Ser A | | 6.00% | | 9/15/2027 | | NR | | | 3,000 | | | 2,526,150 |
| | | | | | | | | | | | |
| Total | | | | | | | | | | | | 27,010,883 |
| | | | | | | | | | | | |
| | | | | |
| Pre-Refunded 3.23% | | | | | | | | | | | | |
| Albany NY Muni Wtr Fin Auth Wtr & Swr Sys Ser A (FGIC) | | 6.375% | | 12/1/2017 | | NR | | | 650 | | | 662,525 |
| New York City NY Muni Wtr Fin Auth Unref Bal Ser B | | 6.00% | | 6/15/2033 | | AAA | | | 1,470 | | | 1,533,827 |
| NY St Dorm Auth Rev Mental Hlth Svcs Ser B (NPFGC) | | 6.00% | | 2/15/2025 | | AA- | | | 100 | | | 102,055 |
| NY St Dorm Auth Rev Mental Hlth Svcs Ser B (NPFGC) | | 6.00% | | 2/15/2030 | | AA | | | 100 | | | 102,055 |
| NY St Dorm Auth Rev Pace Univ (NPFGC) | | 6.00% | | 7/1/2029 | | A | | | 1,610 | | | 1,693,736 |
| NY St Dorm Auth Rev St 2007 Mental Hlth Ser B (NPFGC) | | 6.00% | | 2/15/2025 | | AA | | | 10 | | | 10,205 |
| NY St Dorm Auth Rev St 2007 Mental Hlth Ser B (NPFGC) | | 6.00% | | 2/15/2030 | | AA | | | 10 | | | 10,206 |
| NY St Dorm Auth Rev St Unref Bal 2007 Mental Hlth B (NPFGC) | | 6.00% | | 2/15/2025 | | AA | | | 5 | | | 5,103 |
| NY St Dorm Auth Rev St Unref Bal 2007 Mental Hlth B (NPFGC) | | 6.00% | | 2/15/2030 | | AA | | | 5 | | | 5,103 |
| Puerto Rico Comwlth Hwy & Transn Auth Ser D | | 5.25% | | 7/1/2038 | | AAA | | | 1,500 | | | 1,666,185 |
| Puerto Rico Comwlth Pub Impt Ser A | | 5.25% | | 7/1/2030 | | AAA | | | 310 | | | 373,646 |
| Puerto Rico Comwlth Pub Impt Ser A | | 5.375% | | 7/1/2028 | | AAA | | | 555 | | | 601,376 |
| Puerto Rico Pub Bldgs Auth Rev Govt Facs Ser D | | 5.25% | | 7/1/2027 | | BBB- | | | 735 | | | 810,132 |
| Puerto Rico Pub Fin Corp Comwlth Approp Ser E | | 5.50% | | 8/1/2029 | | Aaa | | | 1,000 | | | 1,099,870 |
| Tompkins Cnty NY Indl Dev Agy Civic Fac Cornell Univ Lake | | 5.625% | | 7/1/2020 | | Aa1 | | | 115 | | | 120,664 |
| | | | | | | | | | | | |
| Total | | | | | | | | | | | | 8,796,688 |
| | | | | | | | | | | | |
| | | | | |
| Tax Revenue 4.05% | | | | | | | | | | | | |
| New York City NY Transnl Fin Auth Fiscal 2009 Ser S1 | | 5.375% | | 7/15/2024 | | AA- | | | 5,000 | | | 5,678,700 |
See Notes to Financial Statements.
99
Schedule of Investments (continued)
NEW YORK TAX FREE FUND September 30, 2009
| | | | | | | | | | | | |
| Investments | | Interest
Rate | | Maturity
Date | | Credit
Rating:
S&P or
Moody’s(a) | | Principal
Amount
(000) | | Value |
| Tax Revenue (continued) | | | | | | | | | | | | |
| Puerto Rico Sales Tax Fing Corp 1st Sub Ser A | | 5.75% | | 8/1/2037 | | A+ | | $ | 3,000 | | $ | 3,240,420 |
| Puerto Rico Sales Tax Fing Corp Ser A | | 5.25% | | 8/1/2057 | | AA- | | | 1,000 | | | 1,035,580 |
| Virgin Islands Pub Fin Auth Rev Matching Fd Ln Diago Ser A | | 6.75% | | 10/1/2037 | | BBB | | | 1,000 | | | 1,058,040 |
| | | | | | | | | | | | |
| Total | | | | | | | | | | | | 11,012,740 |
| | | | | | | | | | | | |
| | | | | |
| Tobacco 0.72% | | | | | | | | | | | | |
| TSASC Inc NY Ser 1 | | 5.125% | | 6/1/2042 | | BBB | | | 2,445 | | | 1,963,922 |
| | | | | | | | | | | | |
| | | | | |
| Transportation 13.40% | | | | | | | | | | | | |
| Metro Transn Auth NY Ser A | | 5.00% | | 11/15/2031 | | A | | | 5,000 | | | 5,234,100 |
| Metro Transn Auth NY Ser B | | 5.00% | | 11/15/2034 | | AA | | | 2,000 | | | 2,113,740 |
| New York City NY Indl Dev Agy 1990 Amer Airlines Inc Pj AMT | | 5.40% | | 7/1/2019 | | CCC+ | | | 2,635 | | | 2,034,958 |
| New York City NY Indl Dev Agy Terminal One Grp Assoc Pj AMT | | 5.50% | | 1/1/2021 | | A3 | | | 1,250 | | | 1,267,000 |
| New York City NY Indl Dev Agy Terminal One Grp Assoc Pj AMT | | 5.50% | | 1/1/2024 | | A3 | | | 2,000 | | | 2,002,960 |
| Niagara NY Frontier Transn Auth Buffalo Niagara Intl Arpt Ser B (NPFGC) | | 5.50% | | 4/1/2019 | | A | | | 690 | | | 697,369 |
| NY St Thwy Auth Gen Rev Ser H (NPFGC)(FGIC) | | 5.00% | | 1/1/2030 | | A+ | | | 8,000 | | | 8,556,320 |
| NY St Thwy Auth Hwy & Bridge Tr Fd Ser B | | 5.00% | | 4/1/2028 | | AA | | | 2,000 | | | 2,190,860 |
| Puerto Rico Comwlth Hwy & Transn Auth Sub PR St Infrastr Bk | | 5.00% | | 7/1/2028 | | BBB- | | | 1,000 | | | 997,510 |
| Triborough NY Bridge & Tunnel Auth Gen Purp | | 4.75% | | 11/15/2030 | | Aa2 | | | 5,455 | | | 5,832,377 |
| Triborough NY Bridge & Tunnel Auth Ser C | | 5.00% | | 11/15/2029 | | Aa2 | | | 5,000 | | | 5,531,250 |
| | | | | | | | | | | | |
| Total | | | | | | | | | | | | 36,458,444 |
| | | | | | | | | | | | |
| | | | | |
| Utilities 13.31% | | | | | | | | | | | | |
| Long Island NY Pwr Auth Ser A | | 5.50% | | 4/1/2024 | | A- | | | 2,190 | | | 2,491,738 |
| New York City NY Muni Wtr Fin Auth Ser CC | | 5.00% | | 6/15/2029 | | AA+ | | | 1,545 | | | 1,690,678 |
| New York City NY Muni Wtr Fin Auth Ser CC(b) | | 5.00% | | 6/15/2029 | | AA+ | | | 3,500 | | | 3,825,570 |
| New York City NY Muni Wtr Fin Auth Ser CC(b) | | 5.125% | | 6/15/2030 | | AA+ | | | 6,500 | | | 7,104,630 |
See Notes to Financial Statements.
100
Schedule of Investments (concluded)
NEW YORK TAX FREE FUND September 30, 2009
| | | | | | | | | | | | | |
| Investments | | Interest
Rate | | Maturity
Date | | Credit
Rating:
S&P or
Moody’s(a) | | Principal
Amount
(000) | | Value | |
| Utilities (continued) | | | | | | | | | | | | | |
| New York City NY Muni Wtr Fin Auth Ser DD | | 5.00% | | 6/15/2032 | | AA+ | | $ | 1,000 | | $ | 1,080,400 | |
| NY St Enrg Resh & Dev Auth Reg Lnkd Savrs & RIBs Brooklyn AMT | | 6.952% | | 7/1/2026 | | A+ | | | 8,000 | | | 7,998,400 | |
| NY St Envr Facs Corp Ser A | | 5.00% | | 6/15/2029 | | AA+ | | | 2,795 | | | 3,083,807 | |
| NY St Envr Facs Corp Ser B | | 4.75% | | 6/15/2032 | | AA+ | | | 5,000 | | | 5,249,350 | |
| NY St Envr Facs Corp Wst Mgmt Pj Ser A AMT | | 4.55% | | 5/1/2012 | | BBB | | | 1,500 | | | 1,512,015 | |
| Puerto Rico Elec Pwr Auth Ser PP (NPFGC)(FGIC) | | 5.00% | | 7/1/2025 | | A | | | 2,000 | | | 2,065,380 | |
| Upper Mohawk Vly NY Regl Wtr Fin Auth Unref Bal (AMBAC) | | 5.75% | | 4/1/2020 | | A3 | | | 105 | | | 107,586 | |
| | | | | | | | | | | | | |
| Total | | | | | | | | | | | | 36,209,554 | |
| | | | | | | | | | | | | |
| Total Municipal Bonds (cost $277,960,219) | | | | | | | | | | | | 284,817,927 | |
| | | | | | | | | | | | | |
| | | | | |
| | | | | | | | | Shares
(000) | | | |
| SHORT-TERM INVESTMENT 0.23% | | | | | | | |
| | |
| Money Market Mutual Fund | | | | | | | |
| Dreyfus NY Municipal Cash Management (cost $637,528) | | | 638 | | | 637,528 | |
| | | | | | | | | | | | | |
| Total Investments in Securities 104.89% (cost $278,597,747) | | | | | | 285,455,455 | |
| | | | | | | | | | | | | |
| Liabilities in Excess of Cash and Other Assets(f) (4.89%) | | | | | | (13,306,824 | ) |
| | | | | | | | | | | | | |
| Net Assets 100.00% | | | | | $ | 272,148,631 | |
| | | | | | | | | | | | | |
Open Futures Contracts at September 30, 2009:
| | | | | | | | | | | | |
| Type | | Expiration | | Contracts | | Position | | Market
Value | | Unrealized
Depreciation |
| U.S. 30-Year Treasury Bond | | December 2009 | | 247 | | Short | | $ | (29,979,625) | | $ | (566,108) |
See Notes to Financial Statements.
101
Schedule of Investments
INTERMEDIATE TAX FREE FUND September 30, 2009
| | | | | | | | | | | | | | |
| Investments | | Interest
Rate | | | Maturity
Date | | Credit
Rating:
S&P or
Moody’s(a) | | | Principal
Amount
(000) | | Value |
| MUNICIPAL BONDS 99.12% | | | | | | | | | | | | | | |
| | | | | |
| Corporate-Backed 3.18% | | | | | | | | | | | | | | |
| Allegheny Cnty PA Indl Dev Auth Envr Impt | | 5.50% | | | 11/1/2016 | | BB | | | $ | 1,500 | | $ | 1,447,170 |
| Babylon NY Indl Dev Agy Res Rev Covanta Babylon Ser A | | 5.00% | | | 1/1/2019 | | AA | | | | 4,000 | | | 4,344,840 |
| CA Pollutn Ctrl Fing Auth Browning Ferris Indl Inc Ser A AMT | | 5.80% | | | 12/1/2016 | | BBB | | | | 1,600 | | | 1,600,768 |
| Chicago IL O’Hare Intl Arpt Ser B (FSA) | | 5.00% | | | 1/1/2020 | | AAA | | | | 3,500 | | | 3,854,130 |
| DeSoto Parish LA Envr Fac Intl Paper Co Ser A AMT | | 4.75% | | | 3/1/2019 | | BBB | | | | 2,500 | | | 2,373,825 |
| Jay ME Solid Wst Disp Rev Intl Paper Co Pj Ser A AMT | | 4.90% | | | 11/1/2017 | | BBB | | | | 2,890 | | | 2,700,069 |
| Long Beach CA Bd Fin Auth Natural Gas Ser A | | 5.25% | | | 11/15/2020 | | A | | | | 500 | | | 514,830 |
| MD St Indl Dev Fing Auth Synagro Baltimore Ser A AMT | | 5.25% | | | 12/1/2013 | | BBB+ | (c) | | | 750 | | | 742,515 |
| MD St Indl Dev Fing Auth Synagro Baltimore Ser A AMT | | 5.375% | | | 12/1/2014 | | BBB+ | (c) | | | 1,000 | | | 986,890 |
| MI St Strategic Fd Ltd Pollutn Ctrl Gen Motors Corp(h) | | 6.20% | | | 9/1/2020 | | NR | | | | 400 | | | 59,000 |
| Mission TX Econ Dev Corp Wst Mgmt Inc Pj AMT | | 6.00% | | | 8/1/2020 | | BBB | | | | 2,000 | | | 2,152,100 |
| Nez Perce Cnty ID Pollutn Ctrl Potlatch Corp Pj | | 6.00% | | | 10/1/2024 | | BB | | | | 1,000 | | | 949,810 |
| NJ Econ Dev Auth Bayonne IMTT Pj Ser C | | 0.60% | # | | 12/1/2027 | | A2 | | | | 1,600 | | | 1,600,000 |
| NJ Econ Dev Auth Spl Fac Continental Airlines Inc Pj AMT | | 6.25% | | | 9/15/2029 | | B | | | | 3,000 | | | 2,721,120 |
| OH St Wtr Dev Auth Solid Wst Allied Wst NA Inc Pj Ser A AMT | | 5.15% | | | 7/15/2015 | | BBB | | | | 250 | | | 250,108 |
| Port of Corpus Christi Auth of Nueces Cnty TX Union Pacific | | 5.65% | | | 12/1/2022 | | NR | | | | 2,000 | | | 2,052,900 |
| San Jose CA Arpt Rev Ser A AMT (AMBAC) | | 5.50% | | | 3/1/2018 | | A | | | | 500 | | | 536,820 |
| Seminole Indian Tribe FL Spl Oblig Ser A† | | 5.75% | | | 10/1/2022 | | BBB | | | | 150 | | | 148,512 |
| Seneca NY Nation Indians Cap Impts Auth Ser A† | | 5.25% | | | 12/1/2016 | | BB | | | | 250 | | | 229,235 |
| Tulsa OK Arpts Impt Tr Rev Ser A Rmkt AMT | | 7.75% | | | 6/1/2035 | | B- | | | | 2,500 | | | 2,427,625 |
| Virgin Islands Pub Fin Auth Sr Secd Hovensa Refinery AMT | | 4.70% | | | 7/1/2022 | | BBB | | | | 1,000 | | | 915,310 |
| Yavapai Cnty AZ Indl Dev Auth Wst Mgmt Inc Pj AMT | | 4.00% | | | 6/1/2027 | | BBB | | | | 2,000 | | | 2,008,040 |
| | | | | | | | | | | | | | |
| Total | | | | | | | | | | | | | | 34,615,617 |
| | | | | | | | | | | | | | |
See Notes to Financial Statements.
102
Schedule of Investments (continued)
INTERMEDIATE TAX FREE FUND September 30, 2009
| | | | | | | | | | | | | |
| Investments | | Interest
Rate | | | Maturity
Date | | Credit
Rating:
S&P or
Moody’s(a) | | Principal
Amount
(000) | | Value |
| Education 8.64% | | | | | | | | | | | | | |
| Albany NY Indl Dev Agy Civic Fac St. Peter’s Hosp Pj Ser A | | 5.00% | | | 11/15/2015 | | BBB+ | | $ | 250 | | $ | 262,733 |
| Allegheny Cnty PA Higher Ed Bldg Auth Duquesne Univ | | 5.00% | | | 3/1/2015 | | A2 | | | 1,100 | | | 1,220,582 |
| Allegheny Cnty PA Higher Ed Bldg Auth Duquesne Univ Ser A (NPFGC)(FGIC) | | 5.00% | | | 3/1/2013 | | A | | | 150 | | | 163,706 |
| Atlanta GA Dev Auth Edl Facs Science Pk LLC Pj | | 5.00% | | | 7/1/2021 | | A1 | | | 610 | | | 645,228 |
| AZ St Univ Enrg Mgmt LLC Tempe Campus II | | 5.00% | | | 7/1/2019 | | AA- | | | 2,090 | | | 2,296,011 |
| Bulloch Cnty GA Dev Auth GA Sthn Univ Hsg Fndtn Four (AG) | | 5.25% | | | 7/1/2018 | | Aa2 | | | 500 | | | 590,530 |
| CA Muni Fin Auth Rev Biola Univ | | 5.625% | | | 10/1/2023 | | Baa1 | | | 1,015 | | | 1,059,153 |
| CA Statewide Cmntys Dev Auth CHF Irvine LLC UCI East Campus | | 6.00% | | | 5/15/2023 | | Baa2 | | | 2,000 | | | 2,125,480 |
| CA Statewide Cmntys Dev Auth Thomas Jefferson Sch Law Ser A | | 7.25% | | | 10/1/2032 | | BB+ | | | 1,000 | | | 1,019,130 |
| Carrollton TX Fmrs Branch Indpt Sch Dist Sch Bldg PSF GTD | | 4.50% | | | 2/15/2019 | | AAA | | | 500 | | | 551,625 |
| Collierville TN Indl Dev Brd St. George’s High Sch Pj | | 1.60% | # | | 8/1/2031 | | Baa1 | | | 4,000 | | | 4,000,000 |
| CT St Hlth & Edl Facs Auth Fairfield Univ Facs Ser M | | 5.00% | | | 7/1/2016 | | A- | | | 1,000 | | | 1,101,280 |
| CT St Hlth & Edl Facs Auth Quinnipiac Univ Ser I (NPFGC) | | 5.00% | | | 7/1/2019 | | A | | | 500 | | | 544,420 |
| Cuyahoga OH Cmnty College Dist Ser C | | 5.00% | | | 8/1/2020 | | AA- | | | 1,800 | | | 2,045,502 |
| Delaware Cnty PA Auth Univ Rev Villanova Univ (NPFGC)(FGIC) | | 5.00% | | | 8/1/2010 | | A | | | 200 | | | 206,784 |
| Harris Cnty TX Cultural Ed Facs Fin Corp Baylor College Medicine Ser D | | 5.00% | | | 11/15/2019 | | A | | | 1,910 | | | 2,039,517 |
| IL Edl Facs Auth Rev Northwestern Univ | | 5.50% | | | 12/1/2013 | | AAA | | | 300 | | | 335,115 |
| IL Fin Auth Rev DePaul Univ | | 5.00% | | | 10/1/2013 | | A- | | | 1,225 | | | 1,343,016 |
| IL Fin Auth Rev Inst Tech | | 6.50% | | | 2/1/2023 | | Baa2 | | | 2,000 | | | 2,156,260 |
| IL Fin Auth Rev Inst Tech Ser A | | 5.00% | | | 4/1/2016 | | Baa2 | | | 1,000 | | | 1,013,260 |
| IL Fin Auth Rev Northwestern Mem Hosp Ser A(b) | | 5.75% | | | 8/15/2030 | | AA+ | | | 2,500 | | | 2,746,750 |
| IL Fin Auth Rev Univ of Chicago Ser B | | 5.50% | | | 7/1/2021 | | Aa1 | | | 5,000 | | | 5,783,700 |
| Louisville & Jefferson Cnty KY Metro Govt Student Hsg Univ of Louisville Hsg Ser A | | 1.60% | # | | 7/1/2032 | | Baa1 | | | 735 | | | 735,000 |
| MA St Hlth & Edl Facs Auth Harvard Univ Ser A | | 5.25% | | | 11/15/2019 | | AAA | | | 2,850 | | | 3,474,606 |
See Notes to Financial Statements.
103
Schedule of Investments (continued)
INTERMEDIATE TAX FREE FUND September 30, 2009
| | | | | | | | | | | | |
| Investments | | Interest
Rate | | Maturity
Date | | Credit
Rating:
S&P or
Moody’s(a) | | Principal
Amount
(000) | | Value |
| Education (continued) | | | | | | | | | | | | |
| Marietta GA Dev Auth Rev Univ Facs Life Univ Inc Pj | | 6.25% | | 6/15/2020 | | Ba3 | | $ | 3,000 | | $ | 2,793,780 |
| MI Higher Ed Facs Auth Rev Ltd Oblig Creative Studies | | 5.00% | | 12/1/2016 | | Baa3 | | | 1,235 | | | 1,140,868 |
| MI Higher Ed Facs Auth Rev Ltd Oblig Creative Studies | | 5.25% | | 12/1/2018 | | Baa3 | | | 1,120 | | | 1,021,541 |
| Miami-Dade Cnty FL Edl Facs Auth Univ of Miami Ser A | | 5.25% | | 4/1/2016 | | A2 | | | 1,000 | | | 1,114,920 |
| MO St Hlth & Edl Facs Auth Washington Univ Ser A | | 5.25% | | 3/15/2018 | | AAA | | | 625 | | | 755,106 |
| NC Cap Facs Fin Agy Meredith College | | 5.375% | | 6/1/2021 | | BBB | | | 500 | | | 521,215 |
| NH Hlth & Ed Facs Auth Univ Sys Ser A | | 5.50% | | 7/1/2020 | | A+ | | | 1,890 | | | 2,170,967 |
| NJ St Edl Facs Auth Univ Med & Dentistry Ser B | | 6.50% | | 12/1/2019 | | Baa2 | | | 5,595 | | | 6,249,279 |
| NY St Dorm Auth Rev Non St Supp Debt St Montefiore Med Ctr (NPFGC)(FGIC)(FHA) | | 5.00% | | 2/1/2022 | | A | | | 2,500 | | | 2,618,650 |
| OH St Higher Edl Fac Rev Case Western Reserve Ser C | | 5.00% | | 12/1/2015 | | AA- | | | 3,065 | | | 3,473,381 |
| PA St Higher Edl Facs Auth Edinboro Univ | | 5.00% | | 7/1/2018 | | BBB- | | | 250 | | | 244,445 |
| PA St Higher Edl Facs Auth Ser AG | | 5.25% | | 6/15/2018 | | Aa3 | | | 1,000 | | | 1,176,890 |
| PA St Higher Edl Facs Auth Ser AH | | 5.00% | | 6/15/2019 | | Aa3 | | | 2,455 | | | 2,787,972 |
| PA St Higher Edl Facs Auth Temple Univ (NPFGC) | | 5.00% | | 4/1/2010 | | A+ | | | 250 | | | 254,715 |
PA St Higher Edl Facs Auth Univ of PA
Ser A | | 5.00% | | 9/1/2019 | | AA+ | | | 3,450 | | | 4,122,301 |
| Pierce Cnty WA Sch Dist No 416 White River (FSA) | | 5.00% | | 12/1/2015 | | Aa1 | | | 250 | | | 291,810 |
| Troy NY Indl Dev Auth Civic Fac Rensselaer Polytechnic Ser E | | 4.05% | | 4/1/2037 | | A | | | 2,500 | | | 2,551,475 |
| TX St Univ Sys Fing Rev | | 5.25% | | 3/15/2019 | | AA- | | | 5,000 | | | 5,813,400 |
| TX Tech Univ Rev Fing 12th Ser | | 5.00% | | 2/15/2020 | | AA | | | 1,475 | | | 1,692,105 |
| Univ of AR Rev Fac Fayetteville Campus (AMBAC) | | 5.00% | | 11/1/2014 | | Aa3 | | | 350 | | | 395,710 |
| Univ of Co Entrprse Sys Ser A | | 5.00% | | 6/1/2018 | | AA- | | | 1,250 | | | 1,472,662 |
| Univ of MN Spl Purp Rev St Supp Stadium Debt | | 5.00% | | 8/1/2018 | | AA+ | | | 1,000 | | | 1,137,720 |
| Univ of Pittsburgh PA Cap Pj Ser B | | 5.00% | | 9/15/2019 | | AA | | | 2,000 | | | 2,362,900 |
| Univ of TX Rev Ser A | | 5.25% | | 8/15/2019 | | AAA | | | 5,000 | | | 5,998,650 |
| Univ of Western MI Rev (AG) | | 5.25% | | 11/15/2020 | | AAA | | | 3,980 | | | 4,443,511 |
| | | | | | | | | | | | |
| Total | | | | | | | | | | | | 94,065,361 |
| | | | | | | | | | | | |
See Notes to Financial Statements.
104
Schedule of Investments (continued)
INTERMEDIATE TAX FREE FUND September 30, 2009
| | | | | | | | | | | | |
| Investments | | Interest
Rate | | Maturity
Date | | Credit
Rating:
S&P or
Moody’s(a) | | Principal
Amount
(000) | | Value |
| General Obligation 17.71% | | | | | | | | | | | | |
| AL St Pub Sch & College Auth Cap Impt | | 5.00% | | 12/1/2022 | | AA | | $ | 500 | | $ | 546,480 |
| Alameda Cnty CA Oakland Unif Sch Dist Election 2006 Ser A | | 6.25% | | 8/1/2019 | | BBB+ | | | 650 | | | 741,117 |
| Alameda Cnty CA Oakland Unif Sch Dist Election 2006 Ser A | | 6.50% | | 8/1/2020 | | BBB+ | | | 730 | | | 836,084 |
| Arlington TX (FSA) | | 5.00% | | 8/15/2011 | | AAA | | | 325 | | | 348,784 |
| Atlantic Cnty NJ | | 5.00% | | 2/1/2018 | | AA | | | 885 | | | 1,044,450 |
| Bexar Cnty TX Ltd Tax Pass Thru | | 5.25% | | 6/15/2020 | | AA+ | | | 3,190 | | | 3,605,785 |
| Birmingham AL Cap Impt Ser A (AMBAC) | | 5.00% | | 12/1/2018 | | AA | | | 1,000 | | | 1,122,420 |
| Boone McHenry & DeKalb Cntys IL Comnty Unit Sch Dist No 100 Ser A (NPFGC) | | 5.00% | | 1/1/2018 | | A+ | | | 2,500 | | | 2,635,075 |
| Brevard Cnty FL Sch Brd COP Ser B (NPFGC)(FGIC) | | 5.00% | | 7/1/2019 | | A2 | | | 3,500 | | | 3,616,935 |
| Broward Cnty FL Pks & Land Preservation Pj | | 5.00% | | 1/1/2019 | | AA+ | | | 2,040 | | | 2,181,046 |
| CA St | | 5.00% | | 8/1/2018 | | A | | | 3,000 | | | 3,306,630 |
| CA St (FSA) | | 5.00% | | 8/1/2016 | | AAA | | | 2,000 | | | 2,233,660 |
| Chandler AZ | | 4.00% | | 7/1/2020 | | AAA | | | 3,375 | | | 3,673,249 |
| Chesterfield Cnty SC Sch Dist (FSA) | | 5.375% | | 3/1/2018 | | AAA | | | 2,050 | | | 2,206,148 |
| Chicago IL Pk Dist Ser F | | 5.50% | | 1/1/2022 | | AA+ | | | 1,750 | | | 2,033,150 |
| Cleveland OH Var Purp Ser A (AG) | | 5.25% | | 12/1/2020 | | AAA | | | 1,415 | | | 1,588,054 |
| Cook Cnty IL Cmnty Consolidated Sch Dist No 64 (FSA) | | 5.50% | | 12/1/2016 | | Aa3 | | | 1,580 | | | 1,863,800 |
| Cook Cnty IL Ser A | | 5.00% | | 11/15/2019 | | AA | | | 1,405 | | | 1,623,267 |
| Crawford Cent Sch Dist PA Ser C | | 5.00% | | 2/1/2019 | | A1 | | | 1,775 | | | 2,023,198 |
| Desert Sands CA Unif Sch Dist Election 2001 | | 5.75% | | 8/1/2019 | | AA- | | | 675 | | | 810,959 |
| Dist of Columbia Ser E (BHAC) | | 5.00% | | 6/1/2021 | | AAA | | | 3,500 | | | 4,018,490 |
| FL St Brd of Ed Lottery Rev Ser B (AMBAC) | | 5.00% | | 7/1/2016 | | AAA | | | 1,000 | | | 1,114,700 |
| Foothill-De Anza CA Cmnty College Dist Ser A (AMBAC) | | 5.00% | | 8/1/2017 | | Aa1 | | | 500 | | | 564,705 |
| Garland TX Indpt Sch Dist Sch Bldg Ser A | | 5.00% | | 2/15/2020 | | Aa1 | | | 2,000 | | | 2,327,840 |
| Gloucester Cnty NJ Impt Auth Cnty Ln Cnty Cap Pg GTD | | 5.00% | | 4/1/2017 | | AA+ | | | 1,000 | | | 1,170,520 |
| Hancock Cnty MS Sch Dist (AMBAC) | | 5.00% | | 4/15/2010 | | A3 | | | 160 | | | 163,077 |
| Hemet CA Unif Sch Dist 2002 Election Ser C (NPFGC) | | 5.00% | | 8/1/2011 | | A | | | 200 | | | 214,294 |
| HI St Ser DR | | 5.00% | | 6/1/2018 | | AA | | | 5,000 | | | 5,886,400 |
| Hoffman Estates Vlg IL Ser A | | 5.25% | | 12/1/2020 | | AA+ | | | 1,205 | | | 1,399,656 |
| Houston TX Pub Impt Ser A | | 5.00% | | 3/1/2022 | | AA | | | 7,285 | | | 8,336,225 |
See Notes to Financial Statements.
105
Schedule of Investments (continued)
INTERMEDIATE TAX FREE FUND September 30, 2009
| | | | | | | | | | | | |
| Investments | | Interest
Rate | | Maturity
Date | | Credit
Rating:
S&P or
Moody’s(a) | | Principal
Amount
(000) | | Value |
| General Obligation (continued) | | | | | | | | | | | | |
| Houston TX Pub Impt Ser A (AMBAC) | | 5.00% | | 3/1/2018 | | AA | | $ | 2,500 | | $ | 2,800,275 |
| IL St 1st Ser (NPFGC) | | 5.375% | | 4/1/2016 | | AA- | | | 4,465 | | | 5,171,542 |
| IL St 1st Ser (NPFGC) | | 5.50% | | 8/1/2016 | | AA- | | | 2,255 | | | 2,639,793 |
| Iron Cnty UT Sch Dist Sch Bldg UT Sch Bd Pg | | 5.00% | | 1/15/2021 | | Aaa | | | 1,210 | | | 1,358,527 |
| Jackson MS Pub Sch Dist (FSA) | | 5.00% | | 10/1/2018 | | Aa3 | | | 2,655 | | | 2,870,214 |
| Jersey City NJ Pub Impt Ser A (NPFGC) | | 5.25% | | 9/1/2015 | | A1 | | | 250 | | | 284,395 |
| Kane Cnty IL Sch Dist No 131 Aurora East Side Ser C (AG) | | 5.00% | | 6/1/2019 | | AAA | | | 2,730 | | | 3,027,979 |
| King Cnty WA Sch Dist No 414 Lake Washington | | 5.00% | | 12/1/2019 | | AA+ | | | 2,500 | | | 2,928,175 |
| King Cnty WA Sch Dist No 414 Lake Washington (FSA) | | 5.00% | | 12/1/2016 | | AAA | | | 4,125 | | | 4,849,886 |
| KY St Ppty & Bldgs Commn Pj No 89 (FSA) | | 5.00% | | 11/1/2014 | | AAA | | | 2,000 | | | 2,304,700 |
| Lancaster CA Sch Dist (AG) | | 5.00% | | 8/1/2017 | | AAA | | | 1,125 | | | 1,283,321 |
| Las Vegas-Clark Cnty NV Library Dist Medium Term | | 5.00% | | 1/1/2019 | | AA | | | 3,500 | | | 3,779,160 |
| Lexington-Fayette Urban Cnty KY Govt Ser A | | 4.00% | | 2/1/2018 | | AA+ | | | 1,165 | | | 1,291,834 |
| Los Angeles CA Unif Sch Dist Ser A (NPFGC) | | 5.00% | | 7/1/2018 | | AA- | | | 500 | | | 562,530 |
| Luzerne Cnty PA Ser B (FSA) | | 4.50% | | 12/15/2014 | | AAA | | | 1,045 | | | 1,161,256 |
| Luzerne Cnty PA Ser B (FSA) | | 4.50% | | 12/15/2015 | | AAA | | | 1,090 | | | 1,209,726 |
| MA St Ser C (FSA) | | 5.50% | | 12/1/2017 | | AAA | | | 1,600 | | | 1,956,064 |
| Maricopa Cnty AZ Sch Dist No 6 Washington Elem Sch Impt Pj of 2001 Ser B (FSA) | | 5.00% | | 7/1/2017 | | AAA | | | 400 | | | 462,036 |
| Maricopa Cnty AZ Unif Sch Dist No 41-Gilbert Sch Impt Ser A (NPFGC)(FGIC) | | 5.00% | | 7/1/2018 | | AA- | | | 2,400 | | | 2,649,888 |
| MD St Loc Facs Ln 2nd Ser A | | 5.00% | | 8/1/2015 | | AAA | | | 1,450 | | | 1,704,475 |
| Mecklenburg Cnty NC COP Ser A | | 5.00% | | 2/1/2020 | | AA+ | | | 3,565 | | | 4,056,970 |
| Memphis TN Gen Impt (NPFGC) | | 5.00% | | 10/1/2018 | | AA | | | 3,295 | | | 3,669,279 |
| Metro Govt Nashville & Davidson Cnty TN | | 5.00% | | 5/15/2020 | | AA | | | 5,225 | | | 6,023,380 |
| Miami-Dade Cnty FL Bldg Better Cmntys Pg Ser B | | 5.25% | | 7/1/2019 | | AA- | | | 3,225 | | | 3,636,220 |
| Middlesex Cnty NJ Impt Auth Cnty Open Space Tr Fd GTD | | 5.00% | | 9/15/2014 | | AAA | | | 1,005 | | | 1,166,292 |
| Mobile AL Ser B | | 5.00% | | 2/15/2018 | | AA- | | | 1,000 | | | 1,156,500 |
| MS Dev Bk Spl Oblig Harrison Cnty Pj Ser D (AG) | | 5.00% | | 10/1/2020 | | AAA | | | 1,495 | | | 1,675,970 |
See Notes to Financial Statements.
106
Schedule of Investments (continued)
INTERMEDIATE TAX FREE FUND September 30, 2009
| | | | | | | | | | | | |
| Investments | | Interest
Rate | | Maturity
Date | | Credit
Rating:
S&P or
Moody’s(a) | | Principal
Amount
(000) | | Value |
| General Obligation (continued) | | | | | | | | | | | | |
| MS Dev Bk Spl Oblig Jackson GTD | | 5.50% | | 1/1/2019 | | AA- | | $ | 1,120 | | $ | 1,274,594 |
| MS Dev Bk Spl Oblig Jackson Pub Sch Dist Bd Pj (FSA) | | 5.25% | | 4/1/2014 | | Aa3 | | | 2,605 | | | 2,906,216 |
| NC Infrastr Fin Corp Cap Impt Ser A (FSA) | | 5.00% | | 5/1/2017 | | AAA | | | 2,000 | | | 2,308,640 |
| New York City NY Ser G | | 5.00% | | 8/1/2015 | | AA | | | 1,000 | | | 1,140,460 |
| New York City NY Ser H-1 | | 5.00% | | 3/1/2015 | | AA | | | 1,665 | | | 1,887,710 |
| New York City NY Ser I | | 5.00% | | 8/1/2015 | | AA | | | 2,500 | | | 2,791,825 |
| NY St Dorm Auth Rev Non St Supp Debt Sch Dist Fing Pg Ser C (FSA) | | 5.00% | | 10/1/2020 | | AAA | | | 475 | | | 539,510 |
| NY St Urban Dev Corp Rev St Pers Income Tax Ser A-1(b) | | 5.00% | | 12/15/2025 | | AAA | | | 1,320 | | | 1,467,540 |
| NY St Urban Dev Corp Rev St Pers Income Tax Ser A-1(b) | | 5.00% | | 12/15/2026 | | AAA | | | 1,920 | | | 2,134,604 |
| NY St Urban Dev Corp Rev St Pers Income Tax Ser A-1(b) | | 5.00% | | 12/15/2027 | | AAA | | | 770 | | | 856,065 |
| Oak Ridge TN | | 4.00% | | 6/1/2018 | | AA | | | 2,120 | | | 2,334,841 |
| Octorara PA Area Sch Dist Ser B (FSA) | | 5.00% | | 6/1/2019 | | AAA | | | 2,890 | | | 3,337,227 |
| Onondaga Cnty NY Ser A | | 5.00% | | 3/1/2020 | | AA+ | | | 1,150 | | | 1,343,396 |
| Philadelphia PA (CIFG) | | 4.50% | | 8/1/2012 | | Baa1 | | | 250 | | | 257,195 |
| Philadelphia PA Ser A (FSA) | | 5.00% | | 12/15/2015 | | AAA | | | 1,315 | | | 1,438,478 |
| Phoenix AZ Ser B | | 5.00% | | 7/1/2019 | | AAA | | | 500 | | | 580,570 |
| Phoenix AZ Var Purp Ser A | | 5.00% | | 7/1/2016 | | AAA | | | 2,525 | | | 2,968,920 |
| Plainfield Vlg IL Ser A (NPFGC) | | 5.00% | | 12/15/2019 | | AA | | | 1,940 | | | 2,154,506 |
| Pocono Mountain PA Sch Dist Nts Ser A (FSA) | | 5.00% | | 9/1/2021 | | Aa3 | | | 1,440 | | | 1,582,747 |
| Puerto Rico Comwlth (FGIC) | | 5.50% | | 7/1/2012 | | BBB- | | | 1,500 | | | 1,602,720 |
| Puerto Rico Comwlth Pub Impt Ser A (FSA) | | 5.00% | | 7/1/2018 | | AAA | | | 3,000 | | | 3,202,890 |
| River Rouge MI Sch Dist (NPFGC)(FGIC) | | 5.00% | | 5/1/2011 | | AA- | | | 300 | | | 317,700 |
| San Bernardino Cmnty College Dist CA Election 2002 Ser A | | 6.00% | | 8/1/2021 | | AA- | | | 750 | | | 916,073 |
| Shelby Cnty TN | | 5.00% | | 4/1/2019 | | AA+ | | | 1,500 | | | 1,784,325 |
| Suffolk Cnty NY Pub Impt Ser B | | 5.00% | | 11/1/2019 | | AA | | | 2,450 | | | 2,855,646 |
| Territory of Guam Ser A | | 5.75% | | 11/15/2014 | | B+ | | | 2,000 | | | 2,085,100 |
| Three Rivers MI Cmnty Schs (FSA) | | 5.00% | | 5/1/2017 | | AAA | | | 500 | | | 587,620 |
| WA St Var Purp Ser A | | 5.00% | | 7/1/2016 | | AA+ | | | 3,100 | | | 3,628,085 |
| WA St Var Purp Ser D (AMBAC) | | 5.00% | | 1/1/2017 | | AA+ | | | 3,000 | | | 3,321,420 |
| Washoe Cnty NV Sch Dist Ser B (NPFGC) | | 5.00% | | 6/1/2014 | | AA | | | 300 | | | 334,296 |
| WI St Ser 1 (AMBAC) | | 5.00% | | 5/1/2015 | | AA | | | 4,000 | | | 4,600,120 |
See Notes to Financial Statements.
107
Schedule of Investments (continued)
INTERMEDIATE TAX FREE FUND September 30, 2009
| | | | | | | | | | | | |
| Investments | | Interest
Rate | | Maturity
Date | | Credit
Rating:
S&P or
Moody’s(a) | | Principal
Amount
(000) | | Value |
| General Obligation (continued) | | | | | | | | | | | | |
| WI St Ser 1 (NPFGC) | | 5.50% | | 5/1/2014 | | AA | | $ | 1,000 | | $ | 1,160,250 |
| Williamson Cnty TX (NPFGC) | | 5.25% | | 2/15/2018 | | AA+ | | | 500 | | | 585,310 |
| Worcester MA Muni Purp Ln Ser A (FSA) | | 5.25% | | 10/1/2019 | | AAA | | | 1,000 | | | 1,107,010 |
| Worcester MA Muni Purp Ln Ser A (FSA) | | 5.25% | | 10/1/2020 | | AAA | | | 1,195 | | | 1,309,684 |
| Yavapai Cnty AZ Unif Sch Dist No 22 Humboldt Sch Impt Pj of 2006 Ser B (AG) | | 5.00% | | 7/1/2018 | | Aa2 | | | 1,070 | | | 1,206,200 |
| | | | | | | | | | | | |
| Total | | | | | | | | | | | | 192,826,078 |
| | | | | | | | | | | | |
| | | | | |
| Healthcare 14.95% | | | | | | | | | | | | |
| Allegheny Cnty PA Hosp Dev Auth Hlth Sys West PA Ser A | | 5.00% | | 11/15/2017 | | BB | | | 250 | | | 235,645 |
| Allegheny Cnty PA Hosp Dev Auth Univ Pittsburgh Med Ctr Ser A | | 5.00% | | 9/1/2014 | | Aa3 | | | 750 | | | 835,305 |
| Allegheny Cnty PA Hosp Dev Auth Univ Pittsburgh Med Ctr Ser B | | 5.00% | | 6/15/2013 | | Aa3 | | | 1,000 | | | 1,098,050 |
| Alton IL Hosp Fac Rev St. Anthony’s Hlth Ctr | | 6.00% | | 9/1/2010 | | NR | | | 485 | | | 486,106 |
| AZ Univ Med Ctr Corp | | 6.00% | | 7/1/2024 | | BBB+ | | | 1,000 | | | 1,094,030 |
| CA Hlth Facs Fing Auth Catholic Hlthcare West Ser K | | 5.125% | | 7/1/2022 | | A | | | 2,000 | | | 2,070,640 |
| CA Hlth Facs Fing Auth Providence Hlth & Svcs Ser C | | 6.00% | | 10/1/2020 | | AA | | | 1,000 | | | 1,156,300 |
| CA Hlth Facs Fing Auth Scripps Hlth Ser A | | 5.50% | | 10/1/2020 | | A+ | | | 2,000 | | | 2,168,060 |
| CA Muni Fin Auth Cmnty Hosps Cent CA COP(d) | | 5.00% | | 2/1/2016 | | Baa2 | | | 2,000 | | | 2,058,800 |
| CA Muni Fin Auth Cmnty Hosps Cent CA COP(d) | | 5.00% | | 2/1/2017 | | Baa2 | | | 2,245 | | | 2,286,173 |
| CA Statewide Cmntys Dev Auth CA Statewide Inland Regl Ctr Pj | | 5.00% | | 12/1/2017 | | Ba1 | | | 250 | | | 225,500 |
| CA Statewide Cmntys Dev Auth Kaiser Permanente Ser A | | 5.00% | | 4/1/2019 | | A+ | | | 6,000 | | | 6,464,940 |
| CA Statewide Cmntys Dev Auth Sr Living Sthn CA | | 6.25% | | 11/15/2019 | | BBB | | | 1,600 | | | 1,716,400 |
| CA Statewide Cmntys Dev Auth Vlycare Hlth Sys Ser A | | 4.80% | | 7/15/2017 | | NR | | | 225 | | | 201,240 |
| Charlotte-Mecklenburg Hosp Auth NC Carolina Hlthcare Ser A | | 5.25% | | 1/15/2023 | | AA- | | | 2,895 | | | 3,168,317 |
| Charlotte-Mecklenburg Hosp Auth NC Carolina Ser A | | 5.00% | | 1/15/2019 | | AA- | | | 4,455 | | | 4,892,837 |
| Coffee Cnty GA Hosp Auth Rev Coffee Regl Med Ctr Inc Pj | | 5.00% | | 12/1/2019 | | BBB | | | 550 | | | 522,209 |
See Notes to Financial Statements.
108
Schedule of Investments (continued)
INTERMEDIATE TAX FREE FUND September 30, 2009
| | | | | | | | | | | | |
| Investments | | Interest
Rate | | Maturity
Date | | Credit
Rating:
S&P or
Moody’s(a) | | Principal
Amount
(000) | | Value |
| Healthcare (continued) | | | | | | | | | | | | |
| CT St Hlth & Edl Facs Auth Quinnipiac Univ Hlth & Ed K1 (NPFGC) | | 5.00% | | 7/1/2014 | | A | | $ | 1,500 | | $ | 1,652,445 |
| Delaware Cnty PA Auth Hosp Rev Crozer Keystone Oblig Grp Ser A | | 5.00% | | 12/15/2019 | | BBB- | | | 1,000 | | | 924,470 |
| Doylestown PA Hosp Auth Hosp Ser A (AG) | | 5.00% | | 7/1/2022 | | AAA | | | 1,000 | | | 1,012,640 |
| Fairfax Cnty VA Indl Dev Auth Hlthcare Inova Hlth Sys Ser A(b) | | 5.50% | | 5/15/2035 | | AA+ | | | 1,000 | | | 1,085,105 |
| Glynn-Brunswick Mem Hosp Auth GA Antic Ctfs Southeast GA Hlth Ser A | | 4.75% | | 8/1/2019 | | A2 | | | 3,840 | | | 3,925,901 |
| Harris Cnty TX Hlth Facs Dev Corp Mem Hermann Hlthcare Sys Ser A | | 5.25% | | 12/1/2014 | | A | | | 1,415 | | | 1,539,166 |
| HI St Dept Bdgt & Fin Ser C2 | | 6.40% | | 11/15/2014 | | NR | | | 1,100 | | | 1,121,373 |
| HI St Dept Bdgt & Fin Spl Purp Linked Ctfs | | 6.40% | | 7/1/2013 | | BBB+ | | | 205 | | | 215,740 |
| IA Fin Auth Hlth Facs Rev Ser A Rmkt (AG) | | 5.00% | | 8/15/2018 | | Aa2 | | | 2,070 | | | 2,311,403 |
| IL Fin Auth Rev Edward Hosp Ser A Rmkt (AMBAC) | | 6.00% | | 2/1/2028 | | A+ | | | 1,400 | | | 1,529,094 |
| IL Fin Auth Rev Hosp Sisters Svcs Inc Ser A | | 5.00% | | 3/15/2027 | | AA | | | 1,000 | | | 1,028,760 |
| IL Fin Auth Rev Rush Univ Med Ctr Oblig Grp Ser A | | 6.00% | | 11/1/2019 | | A- | | | 1,000 | | | 1,105,970 |
| IL Fin Auth Rev Sedgebrook Inc Fac Ser A | | 5.50% | | 11/15/2013 | | NR | | | 250 | | | 137,730 |
| IL Fin Auth Rev The Carle Fndtn Ser A (AG) | | 5.50% | | 2/15/2016 | | AAA | | | 2,000 | | | 2,195,160 |
| IL Fin Auth Rev The Carle Fndtn Ser A (AG) | | 5.50% | | 2/15/2017 | | AAA | | | 2,000 | | | 2,193,560 |
| IL Hlth Facs Auth Rev Loyola Univ Hlth Sys Ser A | | 5.75% | | 7/1/2011 | | Baa3 | | | 110 | | | 112,433 |
| IN Bd Bk Rev Spl Pg Hendricks Regl Hlth Ser A | | 5.00% | | 2/1/2019 | | AA | | | 1,765 | | | 1,970,976 |
| IN Hlth & Edl Facs Fing Auth St. Francis Ser E Rmkt (FSA) | | 5.25% | | 11/1/2022 | | Aa3 | | | 1,000 | | | 1,086,900 |
| IN Hlth Fac Fing Auth Rev Ascension Hlth Ser A2 Rmkt | | 3.75% | | 11/15/2036 | | Aa1 | | | 4,600 | | | 4,763,622 |
| IN Hlth Fac Fing Auth Rev Ascension Hlth Ser A3 Rmkt | | 5.00% | | 11/1/2027 | | Aa2 | | | 1,000 | | | 1,056,100 |
| Iron River MI Hosp Fin Auth Iron Cnty Cmnty Hosps | | 6.00% | | 5/15/2020 | | NR | | | 940 | | | 909,882 |
| Kalamazoo MI Hosp Fin Auth Bronson Hosp Ser A Rmkt (FSA) | | 5.25% | | 5/15/2014 | | AAA | | | 2,000 | | | 2,169,940 |
| Kenai Peninsula AK Cent Kenai Peninsula Hosp Svc Area (NPFGC)(FGIC) | | 5.00% | | 8/1/2016 | | A3 | | | 2,585 | | | 2,731,957 |
See Notes to Financial Statements.
109
Schedule of Investments (continued)
INTERMEDIATE TAX FREE FUND September 30, 2009
| | | | | | | | | | | | |
| Investments | | Interest
Rate | | Maturity
Date | | Credit
Rating:
S&P or
Moody’s(a) | | Principal
Amount
(000) | | Value |
| Healthcare (continued) | | | | | | | | | | | | |
| Knox Cnty TN Hlth Edl & Hsg Facs Brd Baptist Hlth Sys East TN | | 6.375% | | 4/15/2022 | | A1 | | $ | 250 | | $ | 262,945 |
| KS St Dev Fin Auth Hosp Rev Adventist Hlth | | 5.25% | | 11/15/2019 | | A+ | | | 1,580 | | | 1,753,958 |
| KS St Dev Fin Auth Hosp Rev Adventist Sunbelt Ser D(d) | | 5.00% | | 11/15/2020 | | A+ | | | 1,775 | | | 1,912,172 |
| LA Pub Facs Auth Rev Christus Hlth Ser A | | 5.25% | | 7/1/2020 | | A+ | | | 3,200 | | | 3,325,888 |
| MD St Hlth & Higher Edl Facs Auth Washington Cnty Hosp | | 5.75% | | 1/1/2033 | | BBB- | | | 250 | | | 255,900 |
| ME Hlth & Higher Edl Facs Auth Ser A (NPFGC) | | 5.375% | | 7/1/2018 | | Aa3 | | | 2,700 | | | 2,908,143 |
| NC Med Care Commn Univ Hlth Sys Ser E-1 | | 5.75% | | 12/1/2036 | | A+ | | | 3,500 | | | 3,710,140 |
| NJ Hlthcare Facs Fing Auth AHS Hosp Corp Ser A | | 5.125% | | 7/1/2019 | | A1 | | | 1,500 | | | 1,643,025 |
| NJ Hlthcare Facs Fing Auth Hosp Asset Transformation Pg Ser A | | 5.00% | | 10/1/2015 | | AA- | | | 1,500 | | | 1,699,350 |
| NJ Hlthcare Facs Fing Auth Hosp Asset Transformation Pg Ser A | | 5.00% | | 10/1/2016 | | AA- | | | 2,000 | | | 2,268,020 |
| NJ Hlthcare Facs Fing Auth Somerset Med Ctr | | 5.50% | | 7/1/2018 | | Ba2 | | | 1,950 | | | 1,750,340 |
| NJ Hlthcare Facs Fing Auth St. Joseph’s Hlthcare Sys | | 6.00% | | 7/1/2018 | | BBB- | | | 3,000 | | | 3,166,560 |
| NJ Hlthcare Facs Fing Auth Virtua Hlth (AG) | | 5.50% | | 7/1/2020 | | AAA | | | 5,455 | | | 6,081,343 |
| Northampton Cnty PA Gen Purp Auth St. Luke’s Hosp Pj Ser A | | 5.00% | | 8/15/2019 | | BBB+ | | | 2,000 | | | 2,050,260 |
| NY St Dorm Auth Rev Good Samaritan Hosp Med Ctr Ser A (NPFGC) | | 5.75% | | 7/1/2014 | | A | | | 1,500 | | | 1,521,150 |
| NY St Dorm Auth Rev Lenox Hill Hosp Oblig Grp | | 5.375% | | 7/1/2020 | | Ba1 | | | 1,000 | | | 959,340 |
| NY St Dorm Auth Rev Non St Supp Debt Mem Sloan Kettering Sub Ser A2 | | 5.00% | | 7/1/2014 | | AA | | | 2,000 | | | 2,206,060 |
| NY St Dorm Auth Rev Non St Supp Debt North Shore L I Jewish Ser E | | 5.00% | | 5/1/2019 | | A- | | | 4,000 | | | 4,276,000 |
| NY St Dorm Auth Rev Non St Supp Debt Orange Regl Med Ctr | | 6.50% | | 12/1/2021 | | Ba1 | | | 1,000 | | | 1,017,820 |
| OH St Higher Edl Fac Commn Hosp Cleveland Clinic Hlth Pj Ser A(i) | | 5.00% | | 1/1/2015 | | Aa2 | | | 1,000 | | | 1,122,530 |
| OH St Hosp Fac Rev Cleveland Clinic Hlth Ser B | | 5.00% | | 1/1/2022 | | Aa2 | | | 3,000 | | | 3,241,680 |
| Philadelphia PA Hosps & Higher Ed Facs Auth Temple Univ Hosp Sys Ser A | | 6.625% | | 11/15/2023 | | BBB | | | 2,000 | | | 2,001,120 |
See Notes to Financial Statements.
110
Schedule of Investments (continued)
INTERMEDIATE TAX FREE FUND September 30, 2009
| | | | | | | | | | | | | |
| Investments | | Interest
Rate | | | Maturity
Date | | Credit
Rating:
S&P or
Moody’s(a) | | Principal
Amount
(000) | | Value |
| Healthcare (continued) | | | | | | | | | | | | | |
| SC Jobs Econ Dev Auth Tuomey (CIFG) | | 5.00% | | | 11/1/2011 | | BBB+ | | $ | 250 | | $ | 255,968 |
| Scottsdale AZ Indl Dev Auth Scottsdale Hlthcare A | | 5.00% | | | 9/1/2017 | | A3 | | | 2,000 | | | 2,127,360 |
| South Broward FL Hosp Dist Rev Hosp (NPFGC) | | 5.00% | | | 5/1/2019 | | AA- | | | 5,130 | | | 5,475,711 |
| South Broward FL Hosp Dist Rev Hosp (NPFGC) | | 5.00% | | | 5/1/2022 | | AA- | | | 2,710 | | | 2,839,646 |
| Sullivan Cnty TN Hlth Edl & Hsg Facs Brd Wellmont Hlth Sys Pj Ser C | | 5.00% | | | 9/1/2022 | | BBB+ | | | 3,300 | | | 2,981,484 |
| Tarrant Cnty TX Cultural Ed Facs Fin Corp Buckner Ret Svcs Inc Pj | | 5.00% | | | 11/15/2011 | | A- | | | 250 | | | 258,865 |
| Tarrant Cnty TX Cultural Ed Facs Fin Corp Christus Hlth Ser A (AG) | | 5.75% | | | 7/1/2018 | | AAA | | | 3,500 | | | 3,964,310 |
| Territory of Guam Oblig Rev Section 30 Ser A | | 5.375% | | | 12/1/2024 | | BBB- | | | 1,000 | | | 1,053,950 |
| Territory of Guam Oblig Rev Section 30 Ser A | | 5.50% | | | 12/1/2019 | | BBB- | | | 1,000 | | | 1,082,430 |
| Univ of AL Ser A | | 5.00% | | | 9/1/2016 | | A+ | | | 2,320 | | | 2,534,739 |
| Univ of AL Ser A | | 5.25% | | | 9/1/2017 | | A+ | | | 1,180 | | | 1,306,036 |
| WI St Hlth & Edl Facs Auth Aurora Hlthcare Inc Ser B | | 4.75% | | | 8/15/2025 | | A3 | | | 2,000 | | | 2,051,360 |
| WI St Hlth & Edl Facs Auth Ministry Hlth Rmkt (FSA) | | 5.00% | | | 8/1/2016 | | AAA | | | 2,230 | | | 2,474,163 |
| WI St Hlth & Edl Facs Auth St. John’s Cmntys Inc Ser C-1(d) | | 6.40% | | | 9/15/2015 | | NR | | | 2,000 | | | 2,002,580 |
| WI St Hlth & Edl Facs Auth Synergy Hlth Inc | | 6.00% | | | 11/15/2023 | | AA- | | | 3,630 | | | 3,805,982 |
| WI St Hlth & Edl Facs Auth Wheaton Franciscan Hlthcare | | 5.25% | | | 8/15/2017 | | BBB+ | | | 8,160 | | | 8,328,994 |
| WI St Hlth & Edl Facs Auth Wheaton Franciscan Hlthcare | | 5.25% | | | 8/15/2018 | | BBB+ | | | 2,000 | | | 2,029,780 |
| WV St Hosp Fin Auth Thomas Hlth Sys | | 6.00% | | | 10/1/2020 | | NR | | | 1,600 | | | 1,561,088 |
| | | | | | | | | | | | | |
| Total | | | | | | | | | | | | | 162,729,069 |
| | | | | | | | | | | | | |
| | | | | |
| Housing 0.80% | | | | | | | | | | | | | |
| Garza Cnty TX Pub Fac Corp | | 5.50% | | | 10/1/2018 | | BBB | | | 1,000 | | | 949,660 |
| LA St Citizens Ppty Ins Corp Ser B (AMBAC) | | 5.00% | | | 6/1/2016 | | A- | | | 300 | | | 309,573 |
| WI Hsg & Econ Dev Auth Multi Fam Hsg Ser A AMT | | 6.25% | # | | 10/1/2040 | | Aa3 | | | 7,420 | | | 7,420,000 |
| | | | | | | | | | | | | |
| Total | | | | | | | | | | | | | 8,679,233 |
| | | | | | | | | | | | | |
See Notes to Financial Statements.
111
Schedule of Investments (continued)
INTERMEDIATE TAX FREE FUND September 30, 2009
| | | | | | | | | | | | | |
| Investments | | Interest
Rate | | | Maturity
Date | | Credit
Rating:
S&P or
Moody’s(a) | | Principal
Amount
(000) | | Value |
| Lease Obligations 8.52% | | | | | | | | | | | | | |
| Arkansas KS Pub Bldg Commn South Cent Regl Med Ctr | | 6.25% | | | 9/1/2024 | | Baa3 | | $ | 2,335 | | $ | 2,434,611 |
| Atlanta GA Downtown Dev Auth Rev Underground Atlanta Pj Ser A (AG) | | 5.00% | | | 7/1/2016 | | AAA | | | 4,500 | | | 4,990,185 |
| Blount Cnty TN Pub Bldg Auth Loc Govt Pub Impt D-3-A GTD | | 0.85% | # | | 6/1/2034 | | AA+ | | | 1,650 | | | 1,650,000 |
| CA St Pub Wrks Brd Dept Gen Svcs Bldgs 8 & 9 Ser A | | 5.00% | | | 4/1/2020 | | A- | | | 4,085 | | | 4,276,668 |
| CA St Pub Wrks Brd Dept Hlth Svcs Richmond Lab Ser B (XLCA) | | 5.00% | | | 11/1/2017 | | A- | | | 315 | | | 333,739 |
| Fulton Cnty GA Facs Corp Pub Purp Pj COP | | 5.00% | | | 11/1/2016 | | AA- | | | 2,200 | | | 2,466,552 |
| Goodyear AZ Pub Impt Corp | | 6.375% | | | 7/1/2019 | | AA- | | | 500 | | | 632,810 |
| Greenville Cnty SC Sch Dist Bldg Equity Sooner | | 5.50% | | | 12/1/2017 | | AA | | | 3,000 | | | 3,440,700 |
| Gwinnett Cnty GA Dev Auth Pub Schs Pj COP (NPFGC) | | 5.25% | | | 1/1/2020 | | AA+ | | | 5,000 | | | 5,789,250 |
| IN Fin Auth Lease Rev Ser A1 | | 5.00% | | | 11/1/2015 | | AA+ | | | 1,000 | | | 1,139,410 |
| KY St Ppty & Bldgs Commn | | 5.75% | | | 11/1/2019 | | Aa3 | | | 3,425 | | | 4,119,864 |
| KY St Ppty & Bldgs Commn Pj No 93 (AG) | | 5.00% | | | 2/1/2015 | | AAA | | | 1,315 | | | 1,503,913 |
| KY St Ppty & Bldgs Commn Pj No 93 (AG) | | 5.25% | | | 2/1/2020 | | AAA | | | 2,000 | | | 2,351,040 |
| Montgomery Cnty VA Indl Dev Auth Pub Pjs | | 5.00% | | | 2/1/2018 | | AA- | | | 1,000 | | | 1,098,350 |
| New York City NY Indl Dev Agy USTA Natl Tennis (FSA) | | 5.00% | | | 11/15/2018 | | AAA | | | 400 | | | 456,696 |
| NJ Econ Dev Auth Sch Facs Constr Ser AA | | 5.25% | | | 12/15/2020 | | AA- | | | 8,125 | | | 9,234,875 |
| NJ Econ Dev Auth Sch Facs Constr Ser W | | 5.00% | | | 3/1/2013 | | AA- | | | 1,500 | | | 1,653,660 |
| NJ Econ Dev Auth Transn Pj Sublease Ser A | | 5.00% | | | 5/1/2013 | | AA- | | | 3,500 | | | 3,875,515 |
| NJ Econ Dev Auth Transn Pj Sublease Ser A | | 5.00% | | | 5/1/2018 | | AA- | | | 1,425 | | | 1,617,076 |
| NJ Sports & Exposition Auth Ser B | | 5.00% | | | 9/1/2018 | | AA- | | | 5,000 | | | 5,634,650 |
| North Charleston SC Convtn Ctr COP | | 5.00% | | | 10/1/2016 | | AA- | | | 2,010 | | | 2,299,882 |
| North Charleston SC Convtn Ctr COP | | 5.00% | | | 10/1/2017 | | AA- | | | 2,535 | | | 2,904,400 |
| Northwest Allen IN Sch Bldg Corp First Mtg (FSA) | | 5.00% | | | 7/15/2020 | | AAA | | | 3,140 | | | 3,466,277 |
| NY St Dorm Auth Rev St Mental Hlth Svcs Facs Impt Ser A (FSA) | | 5.00% | | | 2/15/2016 | | AAA | | | 2,775 | | | 3,163,056 |
| PA St Indl Dev Auth Econ Dev | | 5.00% | | | 7/1/2013 | | A- | | | 2,000 | | | 2,159,500 |
| Puerto Rico Comwlth Infrastr Fing Auth Mepsi Campus Pj Ser A | | 5.60% | | | 10/1/2014 | | NR | | | 200 | | | 195,920 |
| Puerto Rico Pub Bldgs Auth Rev Govt Facs Ser P GTD | | 7.00% | | | 7/1/2021 | | BBB- | | | 5,000 | | | 5,559,200 |
See Notes to Financial Statements.
112
Schedule of Investments (continued)
INTERMEDIATE TAX FREE FUND September 30, 2009
| | | | | | | | | | | | | |
| Investments | | Interest
Rate | | | Maturity
Date | | Credit
Rating:
S&P or
Moody’s(a) | | Principal
Amount
(000) | | Value |
| Lease Obligations (continued) | | | | | | | | | | | | | |
| Sevier Cnty TN Pub Bldg Auth Loc Govt Pub Impt VI-B-1 | | 0.80% | # | | 6/1/2024 | | Aaa | | $ | 1,900 | | $ | 1,900,000 |
| VA College Bldg Auth Pub Higher Ed Fing Pg Ser A | | 5.00% | | | 9/1/2016 | | Aa1 | | | 5,475 | | | 6,444,349 |
| VA St Pub Bldg Auth Pub Fac Bldg Rev Bds Ser A | | 5.00% | | | 8/1/2014 | | AA+ | | | 3,000 | | | 3,459,420 |
| WI St Rev Ser A | | 5.25% | | | 5/1/2020 | | AA- | | | 2,175 | | | 2,507,123 |
| | | | | | | | | | | | | |
| Total | | | | | | | | | | | | | 92,758,691 |
| | | | | | | | | | | | | |
| | | | | |
| Other Revenue 12.86% | | | | | | | | | | | | | |
| Albemarle Cnty VA Indl Dev Auth Thomas Jefferson Fndtn Inc | | 0.85% | # | | 6/1/2037 | | A2 | | | 2,000 | | | 2,000,000 |
| Baker FL Correctional Dev Corp 1st Mtg Rev Detention Ctr Pj | | 7.50% | | | 2/1/2030 | | NR | | | 1,200 | | | 1,089,972 |
| Baytown Twp MN Rev St. Croix Prep Academy Pj Ser A | | 6.00% | | | 8/1/2018 | | NR | | | 1,900 | | | 1,796,564 |
| Brazos River Auth TX Pollutn Ctrl TXU Elec Co Pj Ser C AMT | | 5.75% | | | 5/1/2036 | | CCC | | | 2,050 | | | 1,757,793 |
| CA St Econ Recovery Ser A (NPFGC)(FGIC) | | 5.25% | | | 7/1/2014 | | A | | | 200 | | | 227,108 |
| CA St Pub Wrks Brd Dept Corrections & Rehab F (NPFGC)(FGIC) | | 5.25% | | | 11/1/2017 | | A | | | 250 | | | 271,550 |
| Cumberland Vly PA Sch Dist (FSA) | | 5.00% | | | 11/15/2019 | | Aa3 | | | 3,000 | | | 3,262,740 |
| Dallas TX Civic Ctr (AG) | | 5.00% | | | 8/15/2021 | | AAA | | | 3,800 | | | 4,224,802 |
| Dallas TX Convtn Ctr Hotel Dev Corp Ser A | | 5.25% | | | 1/1/2020 | | A+ | | | 4,000 | | | 4,296,400 |
| Dallas TX Convtn Ctr Hotel Dev Corp Ser A | | 5.25% | | | 1/1/2022 | | A+ | | | 2,405 | | | 2,543,672 |
| Denver CO City & Cnty Excise Ser A (AG) | | 6.00% | | | 9/1/2023 | | AAA | | | 3,000 | | | 3,418,110 |
| FL Hurricane Catastrophe Fd Fin Corp Ser A | | 5.00% | | | 7/1/2014 | | AA- | | | 5,000 | | | 5,426,950 |
| FL St Citizens Ppty Ins Corp Sr Secd High Risk Acct A (NPFGC) | | 5.00% | | | 3/1/2012 | | A+ | | | 350 | | | 362,327 |
| FL St Citizens Ppty Ins Corp Sr Secd High Risk Acct A-1 | | 6.00% | | | 6/1/2016 | | A+ | | | 10,000 | | | 10,931,900 |
| FL St Dept of Envr Protn FL Forever Ser B (NPFGC) | | 5.00% | | | 7/1/2012 | | AA- | | | 300 | | | 326,460 |
| Garza Cnty TX Pub Fac Corp | | 5.25% | | | 10/1/2017 | | BBB | | | 1,000 | | | 941,440 |
| Garza Cnty TX Pub Fac Corp | | 5.50% | | | 10/1/2019 | | BBB | | | 1,600 | | | 1,507,280 |
| Houston TX Util Sys Rev 1st Lien Ser A (NPFGC) | | 5.25% | | | 5/15/2017 | | AA | | | 2,400 | | | 2,782,632 |
| IL Fin Auth Rev Peoples Gas Lt & Coke Co AMT (AMBAC) | | 4.875% | | | 11/1/2038 | | A2 | | | 7,500 | | | 7,528,125 |
See Notes to Financial Statements.
113
Schedule of Investments (continued)
INTERMEDIATE TAX FREE FUND September 30, 2009
| | | | | | | | | | | | |
| Investments | | Interest
Rate | | Maturity
Date | | Credit
Rating:
S&P or
Moody’s(a) | | Principal
Amount
(000) | | Value |
| Other Revenue (continued) | | | | | | | | | | | | |
| LA Pub Facs Auth Rev Cleco Pwr LLC Pj | | 7.00% | | 12/1/2038 | | Baa1 | | $ | 3,500 | | $ | 3,745,980 |
| LA St Citizens Ppty Ins Corp Ser B (AMBAC) | | 5.00% | | 6/1/2021 | | A- | | | 3,500 | | | 3,517,465 |
| MA St Dev Fin Agy Dominion Enrg Brayton 1 | | 5.75% | | 12/1/2042 | | A- | | | 1,000 | | | 1,104,500 |
| Manatee Cnty FL Transn Rev (AMBAC) | | 5.00% | | 10/1/2019 | | AA- | | | 2,030 | | | 2,166,355 |
| MD St Hlth & Higher Edl Facs Auth Washington Christian Academy | | 5.25% | | 7/1/2018 | | NR | | | 250 | | | 169,350 |
| MI St (NPFGC)(IBC) | | 5.50% | | 12/1/2013 | | A | | | 100 | | | 114,188 |
| Miami-Dade Cnty FL Spl Oblig Fltg Rate Cap Asset Acq Ser A (NPFGC)(FGIC) | | 4.675% | | 4/1/2014 | | A+ | | | 200 | | | 185,426 |
| Mohave Cnty AZ Indl Dev Auth Mohave Prison LLC Expansion Pj | | 7.50% | | 5/1/2019 | | BBB+ | | | 3,000 | | | 3,628,530 |
| Navajo Cnty AZ Pollutn Ctrl Corp Ser C | | 5.50% | | 6/1/2034 | | Baa2 | | | 10,000 | | | 10,496,500 |
| New York City NY Tr Cultural Res Lincoln Ctr Ser C | | 5.75% | | 12/1/2018 | | A+ | | | 2,500 | | | 2,950,150 |
| NH St Business Fin Auth Pub Svc Ser D Rmkt TCRS AMT (AMBAC) | | 6.00% | | 5/1/2021 | | A3 | | | 1,000 | | | 1,015,340 |
| NJ Econ Dev Auth Cigarette Tax | | 5.625% | | 6/15/2019 | | BBB | | | 3,000 | | | 3,009,330 |
| NM Fin Auth Rev Sub Lien Pub Pj Revolving Fd Ser C (NPFGC) | | 5.00% | | 6/15/2015 | | AA- | | | 2,145 | | | 2,425,480 |
| NY St Dorm Auth Rev Non St Supp Debt Sch Dist Fing Pg Ser C (AG) | | 5.00% | | 10/1/2017 | | AAA | | | 5,000 | | | 5,679,050 |
| NY St Enrg Resh & Dev Auth Rochester Gas & Elec Corp C (NPFGC) | | 5.00% | | 8/1/2032 | | A | | | 5,000 | | | 5,241,800 |
| OH St Air Quality Dev Auth First Enrg Generation Ser A | | 5.70% | | 8/1/2020 | | BBB | | | 3,250 | | | 3,566,388 |
| OH St Air Quality Dev Auth First Enrg Nuclear Ser A | | 5.75% | | 6/1/2033 | | BBB | | | 3,000 | | | 3,289,260 |
| OH St Air Quality Dev Auth Pollutn Ctrl First Enrg Ser B | | 5.25% | | 3/1/2023 | | Baa1 | | | 2,000 | | | 2,063,380 |
| OH St Wtr Dev Auth Pollutn Ctrl First Enrg Ser A | | 5.875% | | 6/1/2033 | | Baa1 | | | 3,125 | | | 3,448,875 |
| OR St Dept Admin Svcs (FSA) | | 5.00% | | 9/1/2012 | | AAA | | | 100 | | | 111,182 |
| Orlando FL Cmnty Redev Agy Tax Alloc Downtown Dist Ser A | | 5.25% | | 9/1/2021 | | A | | | 6,415 | | | 6,780,078 |
| Philadelphia PA Auth Indl Dev First Philadelphia Charter Ser A | | 5.30% | | 8/15/2017 | | BBB- | | | 215 | | | 199,047 |
| Pub Gas Partners Inc GA Ser A(d) | | 5.00% | | 10/1/2019 | | A+ | | | 8,450 | | | 9,308,435 |
| Rockport IN Pollutn Ctrl Rev MI Pwr Co Pj Ser A | | 6.25% | | 6/1/2025 | | BBB | | | 2,500 | | | 2,717,925 |
See Notes to Financial Statements.
114
Schedule of Investments (continued)
INTERMEDIATE TAX FREE FUND September 30, 2009
| | | | | | | | | | | | | |
| Investments | | Interest
Rate | | | Maturity
Date | | Credit
Rating:
S&P or
Moody’s(a) | | Principal
Amount
(000) | | Value |
| Other Revenue (continued) | | | | | | | | | | | | | |
| Sabine River Auth TX Pollutn Ctrl TXU Elec Co Pj Ser A | | 5.50% | | | 5/1/2022 | | CCC | | $ | 1,620 | | $ | 1,389,101 |
| VA St Hsg Dev Auth Ser A-5 AMT | | 4.70% | | | 7/1/2017 | | AAA | | | 2,315 | | | 2,370,676 |
| Valparaiso IN Econ Dev Rev Valparaiso Fam YMCA | | 5.00% | | | 12/1/2012 | | NR | | | 250 | | | 242,333 |
| Western Generation Agy OR Wauna Cogeneration PJ B AMT | | 5.00% | | | 1/1/2012 | | NR | | | 4,315 | | | 4,300,588 |
| Willacy Cnty TX Loc Govt Corp Pj Ser A-2 | | 6.00% | | | 9/1/2010 | | NR | | | 105 | | | 104,601 |
| | | | | | | | | | | | | |
| Total | | | | | | | | | | | | | 140,037,138 |
| | | | | | | | | | | | | |
| | | | | |
| Pre-Refunded 0.71% | | | | | | | | | | | | | |
| IL St Toll Hwy Auth Ser A-1 (FSA) | | 5.00% | | | 1/1/2026 | | AAA | | | 5,000 | | | 5,930,750 |
| Metro Transn Auth NY Svc Contract Ser 8 (NPFGC)(IBC) | | 5.375% | | | 7/1/2021 | | AAA | | | 520 | | | 598,931 |
| Milledgeville-Baldwin Cnty GA Dev Auth College & St Univ Fndtn | | 5.50% | | | 9/1/2024 | | AAA | | | 1,000 | | | 1,192,010 |
| | | | | | | | | | | | | |
| Total | | | | | | | | | | | | | 7,721,691 |
| | | | | | | | | | | | | |
| | | | | |
| Special Tax 0.73% | | | | | | | | | | | | | |
| Goodyear AZ Pub Impt Corp Ser A (NPFGC) | | 5.00% | | | 7/1/2022 | | AA- | | | 500 | | | 540,570 |
| Kansas City MO Tax Incr Maincor Pj Ser A | | 5.25% | | | 3/1/2018 | | NR | | | 120 | | | 112,986 |
| Mesquite NV Redev Agy Tax Alloc | | 7.00% | | | 6/1/2019 | | A- | | | 1,700 | | | 1,778,489 |
| Miami-Dade Cnty FL Entitlement GTD (NPFGC)(FGIC) | | 5.00% | | | 8/1/2014 | | A+ | | | 1,000 | | | 1,095,720 |
| Orange Cnty FL Tourist Dev (AMBAC) | | 5.00% | | | 10/1/2013 | | A+ | | | 1,265 | | | 1,385,858 |
| Sparks NV Loc Impt Dist Ltd Oblig Dist No 3 | | 6.50% | | | 9/1/2020 | | NR | | | 500 | | | 493,065 |
| Sparks NV Tourism Impt Dist No 1 Sr Sales Tax Antic Ser A† | | 6.50% | | | 6/15/2020 | | Ba2 | | | 2,000 | | | 1,983,060 |
| Tempe AZ Pier Twn Lake Impt Dist | | 5.00% | | | 1/1/2018 | | Aa3 | | | 500 | | | 579,215 |
| | | | | | | | | | | | | |
| Total | | | | | | | | | | | | | 7,968,963 |
| | | | | | | | | | | | | |
| | | | | |
| Tax Revenue 4.85% | | | | | | | | | | | | | |
| AL St Pub Sch & College Auth Cap Impt | | 5.00% | | | 12/1/2016 | | AA | | | 3,500 | | | 4,025,420 |
| Bay Area Govt Assoc CA Infrastr Fing Auth St Acceleration Nts (NPFGC)(FGIC) | | 5.00% | | | 8/1/2017 | | A | | | 500 | | | 521,260 |
| CA St Econ Recovery Ser C-3 GTD | | 1.00% | # | | 7/1/2023 | | A | | | 6,300 | | | 6,300,000 |
| CA St Econ Recovery Ser C-4 GTD | | 1.00% | # | | 7/1/2023 | | A | | | 1,065 | | | 1,065,000 |
| Dallas TX Area Rapid Transit Sr Lien(b) | | 5.00% | | | 12/1/2022 | | AAA | | | 635 | | | 713,673 |
| Dallas TX Area Rapid Transit Sr Lien(b) | | 5.00% | | | 12/1/2023 | | AAA | | | 390 | | | 438,319 |
See Notes to Financial Statements.
115
Schedule of Investments (continued)
INTERMEDIATE TAX FREE FUND September 30, 2009
| | | | | | | | | | | | |
| Investments | | Interest
Rate | | Maturity
Date | | Credit
Rating:
S&P or
Moody’s(a) | | Principal
Amount
(000) | | Value |
| Tax Revenue (continued) | | | | | | | | | | | | |
| Dallas TX Area Rapid Transit Sr Lien(b) | | 5.00% | | 12/1/2024 | | AAA | | $ | 515 | | $ | 578,806 |
| Dallas TX Area Rapid Transit Sr Lien(b) | | 5.00% | | 12/1/2028 | | AAA | | | 460 | | | 516,992 |
| FL St Dept of Envr Protn FL Forever Ser A (NPFGC)(FGIC) | | 5.00% | | 7/1/2014 | | AA- | | | 4,000 | | | 4,385,120 |
| MI St Trunk Line (NPFGC)(FGIC) | | 5.00% | | 11/1/2012 | | AA+ | | | 350 | | | 382,554 |
| Nassau Cnty NY Interim Fin Auth Sales Tax Secd Ser A | | 5.00% | | 11/15/2021 | | AAA | | | 1,000 | | | 1,158,650 |
| New York City NY Transnl Fin Auth Fiscal 2009 Ser S1 | | 5.00% | | 7/15/2016 | | AA- | | | 3,055 | | | 3,497,608 |
| New York City NY Transnl Fin Auth Sub Future Tax Secd Ser B | | 5.00% | | 11/1/2016 | | AAA | | | 5,000 | | | 5,912,200 |
| NJ Econ Dev Auth Cigarette Tax | | 5.50% | | 6/15/2024 | | BBB | | | 5,325 | | | 5,287,459 |
| NY St Loc Govt Assistance Svcs Corp Ser C | | 5.00% | | 4/1/2016 | | AAA | | | 5,000 | | | 5,842,250 |
| Puerto Rico Sales Tax Fing Corp 1st Sub Ser A | | 5.25% | | 8/1/2019 | | A+ | | | 3,895 | | | 4,429,472 |
| TX St Transn Commn 1st Tier | | 5.00% | | 4/1/2017 | | AAA | | | 2,365 | | | 2,785,946 |
| Virgin Islands Pub Fin Auth Rev Gross Rcpts Taxes Ln Nts (NPFGC)(FGIC) | | 5.00% | | 10/1/2018 | | A | | | 1,000 | | | 1,035,150 |
| Virgin Islands Pub Fin Auth Rev Matching Fd Ln Diago Ser A | | 6.75% | | 10/1/2019 | | BBB | | | 2,500 | | | 2,855,500 |
| Volusia Cnty FL Sales Tax Rev Sub Lien Sales Tax (FSA) | | 5.00% | | 10/1/2015 | | Aa3 | | | 1,000 | | | 1,113,520 |
| | | | | | | | | | | | |
| Total | | | | | | | | | | | | 52,844,899 |
| | | | | | | | | | | | |
| | | | | |
| Tobacco 0.51% | | | | | | | | | | | | |
| Buckeye OH Tob Sttlmnt Fing Auth Asset Bkd Sr Turbo Ser A-2 | | 5.125% | | 6/1/2024 | | BBB | | | 445 | | | 419,773 |
| Golden St Tob Securitization Corp CA Asset Bkd Sr Ser A-1 | | 5.00% | | 6/1/2014 | | BBB | | | 2,500 | | | 2,610,500 |
| NY Tob Sttlmnt Fing Corp Asset Bkd Ser A1 | | 5.50% | | 6/1/2019 | | AA- | | | 1,000 | | | 1,074,420 |
| SC Tob Sttlmnt Rev Mgmt Auth | | 5.00% | | 6/1/2018 | | BBB | | | 1,450 | | | 1,453,117 |
| | | | | | | | | | | | |
| Total | | | | | | | | | | | | 5,557,810 |
| | | | | | | | | | | | |
| | | | | |
| Transportation 9.51% | | | | | | | | | | | | |
| Alliance Arpt Auth Inc TX Spl Facs FedEx Corp Pj AMT | | 4.85% | | 4/1/2021 | | BBB | | | 3,000 | | | 2,840,400 |
| Camino Real Regl Mobility Auth TX St Spur 601 | | 5.25% | | 8/15/2018 | | A | | | 500 | | | 529,075 |
See Notes to Financial Statements.
116
Schedule of Investments (continued)
INTERMEDIATE TAX FREE FUND September 30, 2009
| | | | | | | | | | | | |
| Investments | | Interest
Rate | | Maturity
Date | | Credit
Rating:
S&P or
Moody’s(a) | | Principal
Amount
(000) | | Value |
| Transportation (continued) | | | | | | | | | | | | |
| Clark Cnty NV Arpt Rev Sys Sub Lien Ser A (AMBAC) | | 5.00% | | 7/1/2016 | | Aa3 | | $ | 250 | | $ | 275,163 |
| Clark Cnty NV Arpt Rev Sys Sub Lien Ser C (FSA) | | 5.00% | | 7/1/2022 | | AAA | | | 3,905 | | | 4,253,365 |
| E-470 Pub Hwy Auth CO Rev Cap Apprec Sr Ser B (NPFGC) | | Zero Coupon | | 9/1/2018 | | A | | | 10,900 | | | 6,823,073 |
| E-470 Pub Hwy Auth CO Rev Ser D2 (NPFGC) | | 5.00% | | 9/1/2039 | | A | | | 2,000 | | | 2,021,800 |
| FL St Dept of Transn Tpk Auth Rev Ser A | | 5.00% | | 7/1/2020 | | AA- | | | 500 | | | 562,220 |
| GA St Rd & Twy Auth Rev Fed Hwy Grant Antic Bds Ser A | | 5.00% | | 6/1/2019 | | AA- | | | 3,575 | | | 4,167,127 |
| HI St Hwy Rev | | 5.00% | | 1/1/2016 | | AA+ | | | 1,150 | | | 1,331,631 |
| Jacksonville FL Transn Rev (NPFGC) | | 5.00% | | 10/1/2016 | | AA- | | | 1,370 | | | 1,564,773 |
| KY St Tpk Auth Econ Revitalization Pjs Ser A | | 5.00% | | 7/1/2019 | | AA+ | | | 4,040 | | | 4,646,848 |
| KY St Tpk Auth Econ Revitalization Pjs Ser A | | 5.00% | | 7/1/2022 | | AA+ | | | 1,415 | | | 1,607,581 |
| MA Bay Transn Auth Sr Ser B | | 5.25% | | 7/1/2019 | | AAA | | | 5,000 | | | 6,114,050 |
| ME St Tpk Auth Rev (FSA) | | 5.00% | | 7/1/2013 | | AAA | | | 1,000 | | | 1,112,110 |
| Metro Transn Auth NY Ser B | | 5.00% | | 11/15/2019 | | AA | | | 1,375 | | | 1,591,178 |
| Metro Transn Auth NY Ser B | | 5.00% | | 11/15/2021 | | A | | | 500 | | | 548,475 |
| Metro WA DC Arpts Auth Ser A AMT | | 5.50% | | 10/1/2014 | | AA- | | | 3,000 | | | 3,302,730 |
| MI St Grant Antic Bds (FSA) | | 5.25% | | 9/15/2018 | | AAA | | | 500 | | | 552,190 |
| MI St Trunk Line (FSA) | | 5.25% | | 11/1/2016 | | AAA | | | 3,000 | | | 3,454,020 |
| MO St Hwys & Transn Commn 2nd Lien | | 5.25% | | 5/1/2021 | | AAA | | | 2,500 | | | 2,887,600 |
| NJ Econ Dev Auth Spl Fac Continental Airlines Inc Pj AMT | | 6.625% | | 9/15/2012 | | B | | | 250 | | | 248,313 |
| NJ Econ Dev Auth Transn Pj Sublease Ser A | | 5.00% | | 5/1/2019 | | AA- | | | 3,000 | | | 3,358,080 |
| NJ St Transn Tr Fd Auth Grant Antic Bds Ser A (NPFGC)(FGIC) | | 5.00% | | 6/15/2017 | | A1 | | | 300 | | | 333,057 |
| NJ St Transn Tr Fd Auth Transn Sys Ser B (NPFGC)(FGIC) | | 5.50% | | 12/15/2020 | | AA- | | | 1,000 | | | 1,176,760 |
| North TX Twy Auth Rev Sys 1st Tier Ser A | | 5.00% | | 1/1/2012 | | A2 | | | 500 | | | 527,480 |
| North TX Twy Auth Rev Sys 1st Tier Ser A | | 6.25% | | 1/1/2024 | | A2 | | | 5,000 | | | 5,720,100 |
| North TX Twy Auth Rev Sys 1st Tier Ser G | | 5.00% | | 1/1/2038 | | A2 | | | 2,500 | | | 2,515,000 |
| North TX Twy Auth Rev Sys 1st Tier Ser H | | 5.00% | | 1/1/2043 | | A2 | | | 3,000 | | | 3,117,000 |
| OH St Major New St Infrastr Ser 2008-1 | | 5.50% | | 6/15/2020 | | AA | | | 4,500 | | | 5,309,865 |
| OH St Major New St Infrastr Ser 2008-1 | | 5.75% | | 6/15/2019 | | AA | | | 1,000 | | | 1,209,040 |
| Oklahoma City OK Arpt Tr Jr Lien 29th Ser B (AMBAC) | | 5.00% | | 7/1/2017 | | A+ | | | 350 | | | 387,555 |
See Notes to Financial Statements.
117
Schedule of Investments (continued)
INTERMEDIATE TAX FREE FUND September 30, 2009
| | | | | | | | | | | | |
| Investments | | Interest
Rate | | Maturity
Date | | Credit
Rating:
S&P or
Moody’s(a) | | Principal
Amount
(000) | | Value |
| Transportation (continued) | | | | | | | | | | | | |
| PA St Tpk Commn Ser A (FSA) | | 5.25% | | 7/15/2019 | | AAA | | $ | 1,270 | | $ | 1,482,395 |
| PA St Tpk Commn Sub Ser A (AG) | | 5.00% | | 6/1/2017 | | AAA | | | 3,500 | | | 4,040,190 |
| PA St Tpk Commn Sub Ser A (AG) | | 5.00% | | 6/1/2018 | | AAA | | | 2,500 | | | 2,890,950 |
| RI St Econ Dev Corp Grant Antic Dept Transn Ser A (AG) | | 5.25% | | 6/15/2020 | | AAA | | | 6,495 | | | 7,485,747 |
| RI St Econ Dev Corp Ser C (AG) | | 5.00% | | 7/1/2014 | | AAA | | | 1,985 | | | 2,194,179 |
| San Francisco CA City & Cnty Arpts Commn 2nd Ser A-4 AMT | | 6.50% | | 5/1/2019 | | A1 | | | 2,500 | | | 2,665,100 |
| St. Louis MO Arpt Rev Lambert Intl Arpt Ser A (FSA) | | 5.00% | | 7/1/2017 | | AAA | | | 1,650 | | | 1,762,183 |
| St. Louis MO Arpt Rev Lambert Intl Arpt Ser A-1 | | 5.125% | | 7/1/2016 | | A | | | 1,920 | | | 1,972,109 |
| Triborough NY Bridge & Tunnel Auth Sub Ser D | | 5.00% | | 11/15/2014 | | Aa3 | | | 1,000 | | | 1,157,160 |
| TX St Transn Commn 1st Tier | | 5.00% | | 8/15/2042 | | BBB+ | | | 1,500 | | | 1,522,590 |
| WI St Transn Rev Ser A | | 5.00% | | 7/1/2019 | | AA+ | | | 2,000 | | | 2,313,720 |
| | | | | | | | | | | | |
| Total | | | | | | | | | | | | 103,573,982 |
| | | | | | | | | | | | |
| | | | | |
| Utilities 16.15% | | | | | | | | | | | | |
| AZ Salt River Pj Agric Impt & Pwr Dist Rev Ser A | | 5.00% | | 1/1/2021 | | Aa1 | | | 1,000 | | | 1,161,170 |
| Burke Cnty GA Dev Auth Pollutn Ctrl GA Pwr Co Vogtle 5th Ser | | 4.375% | | 10/1/2032 | | A | | | 500 | | | 508,755 |
| CA St Dept of Wtr Res Pwr Supply Ser K | | 5.00% | | 5/1/2018 | | Aa3 | | | 4,050 | | | 4,687,996 |
| Cape Coral FL Wtr & Swr Rev Bd Antic Nts | | 6.00% | | 10/1/2011 | | NR | | | 7,500 | | | 7,711,725 |
| Cape Fear Pub Util Auth NC Wtr & Swr Sys | | 5.00% | | 8/1/2018 | | AA | | | 1,000 | | | 1,179,450 |
| Chicago IL Wst Wtr Transmission Rev Ser A (BHAC) | | 5.50% | | 1/1/2020 | | AAA | | | 1,250 | | | 1,542,275 |
| Chicago IL Wtr Rev 2nd Lien (FSA) | | 5.00% | | 11/1/2013 | | AAA | | | 1,000 | | | 1,125,510 |
| Dallas TX Wtrwrks & Swr Sys Rev (AMBAC) | | 5.00% | | 10/1/2014 | | AAA | | | 1,000 | | | 1,154,610 |
| Dist of Columbia Wtr & Swr Auth Sub Lien Ser A (AG) | | 5.00% | | 10/1/2018 | | AAA | | | 1,000 | | | 1,178,980 |
| Enrg Northwest WA Elec Rev Columbia Generating Ser C | | 5.00% | | 7/1/2024 | | Aaa | | | 1,000 | | | 1,120,840 |
| Enrg Northwest WA Elec Rev Pj 3 Ser D | | 5.00% | | 7/1/2016 | | Aaa | | | 2,500 | | | 2,910,575 |
| FL Muni Pwr Agy Rev Pwr Ser A | | 5.00% | | 10/1/2016 | | A1 | | | 2,170 | | | 2,427,275 |
| FL Muni Pwr Agy Rev Pwr Ser A | | 5.25% | | 10/1/2022 | | A1 | | | 3,115 | | | 3,493,005 |
| Fulton Cnty GA Wtr & Swr Rev (NPFGC)(FGIC) | | 5.00% | | 1/1/2018 | | AA- | | | 3,000 | | | 3,224,640 |
See Notes to Financial Statements.
118
Schedule of Investments (continued)
INTERMEDIATE TAX FREE FUND September 30, 2009
| | | | | | | | | | | | |
| Investments | | Interest
Rate | | Maturity
Date | | Credit
Rating:
S&P or
Moody’s(a) | | Principal
Amount
(000) | | Value |
| Utilities (continued) | | | | | | | | | | | | |
| Grand River Dam Auth OK Rev Ser A (BHAC) | | 5.00% | | 6/1/2016 | | AAA | | $ | 1,000 | | $ | 1,165,710 |
| Hamilton Cnty OH Swr Sys Rev Metro Swr Dist Ser A (NPFGC) | | 5.00% | | 12/1/2018 | | AA+ | | | 3,410 | | | 3,698,077 |
| Hampton Rds Santn Dist VA | | 5.00% | | 4/1/2022 | | AA+ | | | 5,000 | | | 5,712,300 |
| HI St Ser DG (AMBAC) | | 5.00% | | 7/1/2015 | | AA | | | 240 | | | 277,999 |
| IA Fin Auth Rev Revolving Fd | | 5.25% | | 8/1/2020 | | AAA | | | 2,500 | | | 2,916,200 |
| IL Fin Auth Rev Revolving Fd Master Tr | | 5.25% | | 9/1/2016 | | AAA | | | 5,000 | | | 5,762,250 |
| IN Fin Auth Pwr & Lt Co Ser C | | 4.90% | | 1/1/2016 | | A3 | | | 5,000 | | | 5,282,750 |
| IN Muni Pwr Agy Ser B (NPFGC) | | 5.25% | | 1/1/2020 | | A+ | | | 3,875 | | | 4,100,215 |
| Indianapolis IN Gas Util Rev Ser C (AG) | | 5.00% | | 6/1/2017 | | AAA | | | 3,140 | | | 3,467,094 |
| Indianapolis IN Loc Pub Impt Bd Bk Wtrwrks Pj Ser 2007 L (NPFGC) | | 5.00% | | 7/1/2019 | | AA- | | | 500 | | | 542,810 |
| Indianapolis IN Loc Pub Impt Bd Bk Wtrwrks Pj Ser A (NPFGC) | | 5.50% | | 7/1/2019 | | AA- | | | 2,580 | | | 2,938,594 |
| Intermountain Pwr Agy UT Ser A | | 5.25% | | 7/1/2020 | | A+ | | | 1,000 | | | 1,061,860 |
| Lansing MI Swr Disp Sys Rev (NPFGC)(FGIC) | | 5.00% | | 5/1/2014 | | AA- | | | 150 | | | 171,188 |
| Long Island NY Pwr Auth Ser A (NPFGC)(FGIC) | | 5.00% | | 12/1/2019 | | A | | | 3,000 | | | 3,298,620 |
| Louisville & Jefferson Cnty KY Metro Swr Dist Ser A | | 5.00% | | 5/15/2019 | | AA- | | | 4,705 | | | 5,363,182 |
| Lower CO River Auth TX Rev | | 5.50% | | 5/15/2014 | | A1 | | | 1,000 | | | 1,136,870 |
| Lower CO River Auth TX Rev | | 5.50% | | 5/15/2015 | | A1 | | | 1,200 | | | 1,370,472 |
| MA St Wtr Res Auth Ser B | | 4.00% | | 8/1/2016 | | AA+ | | | 1,170 | | | 1,306,633 |
| MD St Econ Dev Corp Potomac Rmkt | | 6.20% | | 9/1/2022 | | A3 | | | 1,650 | | | 1,923,702 |
| Metro Govt Nashville & Davidson Cnty TN Wtr & Swr Ser A (FSA) | | 5.25% | | 1/1/2019 | | AAA | | | 500 | | | 594,610 |
| Miami-Dade Cnty FL Wtr & Swr Sys Ser B (FSA) | | 5.25% | | 10/1/2018 | | AAA | | | 3,000 | | | 3,451,830 |
| MN St Muni Pwr Agy Elec | | 5.25% | | 10/1/2022 | | A3 | | | 250 | | | 270,655 |
| Monroe Cnty GA Dev Auth Pollutn Ctrl Oglethorpe Pwr Scherer B (AMBAC) | | 4.625% | | 1/1/2036 | | A3 | | | 1,500 | | | 1,524,450 |
| MS Business Fin Corp Sys Enrg Res Inc Pj | | 5.90% | | 5/1/2022 | | BBB | | | 2,500 | | | 2,486,725 |
| Muni Elec Auth GA Pj One Sub Ser A | | 5.00% | | 1/1/2014 | | A | | | 1,145 | | | 1,266,210 |
| NC Eastern Muni Pwr Agy Ser A (AG) | | 5.00% | | 1/1/2013 | | AAA | | | 1,500 | | | 1,617,855 |
| NC Eastern Muni Pwr Agy Ser B(d) | | 5.00% | | 1/1/2020 | | A- | | | 1,000 | | | 1,065,410 |
| NC Muni Pwr Agy No 1 Catawaba Ser A | | 5.25% | | 1/1/2015 | | A | | | 3,000 | | | 3,379,080 |
| NE Pub Pwr Dist Rev Ser B (FSA) | | 5.00% | | 1/1/2018 | | AAA | | | 3,000 | | | 3,380,580 |
| NJ Envr Infrastr Tr Ser A | | 5.00% | | 9/1/2016 | | AAA | | | 2,515 | | | 2,974,415 |
See Notes to Financial Statements.
119
Schedule of Investments (continued)
INTERMEDIATE TAX FREE FUND September 30, 2009
| | | | | | | | | | | | |
| Investments | | Interest
Rate | | Maturity
Date | | Credit
Rating:
S&P or
Moody’s(a) | | Principal
Amount
(000) | | Value |
| Utilities (continued) | | | | | | | | | | | | |
| Northern CA Pwr Agy Rev Geothermal Pj No 3 Ser A | | 5.00% | | 7/1/2017 | | A1 | | $ | 1,000 | | $ | 1,124,670 |
| Northern CA Pwr Agy Rev Geothermal Pj No 3 Ser A | | 5.00% | | 7/1/2018 | | A1 | | | 600 | | | 674,922 |
| Northwest IL Subn Muni Jt Action Wtr Agy | | 5.00% | | 5/1/2018 | | AA- | | | 500 | | | 586,635 |
| NY St Envr Facs Corp Revolving Fds Pooled Fing Pg Ser A | | 4.375% | | 10/15/2014 | | AAA | | | 1,000 | | | 1,085,080 |
| Onslow NC Wtr & Swr Auth Ser A (NPFGC) | | 5.00% | | 6/1/2019 | | A | | | 500 | | | 567,555 |
| Philadelphia PA Gas Wrks Rev 8th 1998 Gen Ordinance Ser A | | 5.00% | | 8/1/2016 | | Baa2 | | | 1,000 | | | 1,042,750 |
| Philadelphia PA Sch Dist Ser B (AMBAC) | | 5.00% | | 4/1/2013 | | Aa3 | | | 260 | | | 280,054 |
| Phoenix AZ Civic Impt Corp Sr Lien | | 5.50% | | 7/1/2019 | | AAA | | | 1,675 | | | 2,083,583 |
| Piedmont SC Muni Pwr Agy A3 | | 5.25% | | 1/1/2019 | | A- | | | 2,000 | | | 2,237,900 |
| Pima Cnty AZ Swr Rev (FSA) | | 5.00% | | 7/1/2014 | | AAA | | | 200 | | | 224,968 |
| Pinal Cnty AZ Elec Dist No 4 | | 6.00% | | 12/1/2023 | | BBB | | | 525 | | | 557,209 |
| Portland OR Swr Sys Rev 1st Lien Ser A (FSA) | | 5.00% | | 6/15/2014 | | AAA | | | 1,000 | | | 1,149,730 |
| Pub Pwr Generation Agy NE Whelan Enrg Ctr Unit 2-A | | 5.00% | | 1/1/2015 | | A2 | | | 2,475 | | | 2,657,309 |
| Puerto Rico Elec Pwr Auth Ser WW | | 5.25% | | 7/1/2014 | | A3 | | | 1,500 | | | 1,658,460 |
| Sabine River Auth TX Pollutn Ctrl Southwestern Elec Co (NPFGC) | | 4.95% | | 3/1/2018 | | A | | | 500 | | | 490,220 |
| Sacramento CA Muni Util Dist Ser U (FSA)(b) | | 5.00% | | 8/15/2023 | | AAA | | | 780 | | | 870,527 |
| Sacramento CA Muni Util Dist Ser U (FSA)(b) | | 5.00% | | 8/15/2024 | | AAA | | | 620 | | | 691,957 |
| Sacramento CA Muni Util Dist Ser U (FSA)(b) | | 5.00% | | 8/15/2025 | | AAA | | | 620 | | | 691,957 |
| San Antonio TX Elec & Gas Ser A | | 5.00% | | 2/1/2018 | | Aa1 | | | 1,000 | | | 1,171,180 |
| San Antonio TX Elec & Gas Ser A | | 5.25% | | 2/1/2020 | | Aa1 | | | 5,000 | | | 5,944,550 |
| San Antonio TX Elec & Gas Sys | | 5.00% | | 2/1/2018 | | Aa1 | | | 2,740 | | | 3,209,033 |
| San Diego CA Pub Facs Fing Auth Sr Ser B | | 5.00% | | 5/15/2020 | | A+ | | | 5,000 | | | 5,721,600 |
| SC St Pub Svc Auth Santee Cooper Ser A (NPFGC) | | 5.00% | | 1/1/2016 | | Aa2 | | | 4,295 | | | 4,930,273 |
| Snohomish Cnty WA Pub Util Dist No 1 (FSA) | | 5.00% | | 12/1/2020 | | AAA | | | 5,000 | | | 5,449,450 |
| TN Enrg Acq Corp Ser A | | 5.25% | | 9/1/2019 | | BB+ | | | 5,000 | | | 5,080,850 |
| TN Enrg Acq Corp Ser A | | 5.25% | | 9/1/2021 | | BB+ | | | 2,000 | | | 2,019,300 |
| Tuscon AZ Wtr Rev (NPFGC)(FGIC) | | 5.50% | | 7/1/2018 | | AA- | | | 4,100 | | | 4,448,623 |
| VA Res Auth Sub-Clean Wtr St Revolving Fd | | 5.00% | | 10/1/2017 | | AAA | | | 2,000 | | | 2,392,040 |
| VA Res Auth Sub-Clean Wtr St Revolving Fd | | 5.00% | | 10/1/2018 | | AAA | | | 2,150 | | | 2,533,646 |
See Notes to Financial Statements.
120
Schedule of Investments (concluded)
INTERMEDIATE TAX FREE FUND September 30, 2009
| | | | | | | | | | | | |
| Investments | | Interest
Rate | | Maturity
Date | | Credit
Rating:
S&P or
Moody’s(a) | | Principal
Amount
(000) | | Value |
| Utilities (continued) | | | | | | | | | | | | |
| Vernon CA Elec Sys Rev Ser A | | 5.50% | | 8/1/2015 | | A- | | $ | 1,000 | | $ | 1,120,120 |
| Western Generation Agy OR Wauna Cogeneration Pj B AMT | | 5.00% | | 1/1/2016 | | NR | | | 1,510 | | | 1,367,788 |
| WI Pub Pwr Inc Sys Ser A (FSA) | | 5.00% | | 7/1/2016 | | AAA | | | 2,795 | | | 3,223,893 |
| WV Econ Dev Auth Pollutn Ctrl Ser D | | 4.85% | | 5/1/2019 | | BBB | | | 1,000 | | | 1,101,600 |
| Yuma AZ Muni Ppty Corp Util Sys Sr Lien (XLCA) | | 5.00% | | 7/1/2024 | | A+ | | | 500 | | | 522,130 |
| | | | | | | | | | | | |
| Total | | | | | | | | | | | | 175,846,714 |
| | | | | | | | | | | | |
| Total Municipal Bonds (cost $1,019,628,319) | | | | | | | | | | 1,079,225,246 |
| | | | | | | | | | | | |
| | | | | |
| | | | | | | | | Shares
(000) | | |
| SHORT-TERM INVESTMENT 0.50% | | | | | | |
| | |
| Money Market Mutual Fund | | | | | | |
| Dreyfus Municipal Cash Management Plus (cost $5,400,705) | | | 5,401 | | | 5,400,705 |
| | | | | | | | | | | | |
| Total Investments in Securities 99.62% (cost $1,025,029,024) | | | | | | | | 1,084,625,951 |
| | | | | | | | | | | | |
| Cash and Other Assets in Excess of Liabilities(f) 0.38% | | | | | | | | 4,189,349 |
| | | | | | | | | | | | |
| Net Assets 100.00% | | | | | | | | | | | $ | 1,088,815,300 |
| | | | | | | | | | | | |
Open Futures Contracts at September 30, 2009:
| | | | | | | | | | | | |
| |
| Type | | Expiration | | Contracts | | Position | | Market
Value | | Unrealized
Depreciation |
| U.S. 30-Year Treasury Bond | | December 2009 | | 330 | | Short | | $ | (40,053,750) | | $ | (697,430) |
See Notes to Financial Statements.
121
Schedule of Investments
SHORT DURATION TAX FREE FUND September 30, 2009
| | | | | | | | | | | | | | |
| Investments | | Interest
Rate | | | Maturity
Date | | Credit
Rating:
S&P or
Moody’s(a) | | | Principal
Amount
(000) | | Value |
| LONG-TERM INVESTMENTS 96.80% | | | | | | | | | | | | | | |
| | | | | |
| MUNICIPAL BONDS 96.79% | | | | | | | | | | | | | | |
| | | | | |
| Corporate-Backed 2.36% | | | | | | | | | | | | | | |
| Albany NY Indl Dev Agy Civic Fac Albany Inst History Ser A | | 2.15% | # | | 6/1/2019 | | NR | | | $ | 2,075 | | $ | 2,075,000 |
| Babylon NY Indl Dev Agy Res Rev Covanta Babylon Ser A | | 5.00% | | | 1/1/2013 | | AA | | | | 2,010 | | | 2,174,458 |
| Collier Cnty FL Indl Dev Auth YMCA Collier Cnty Inc Pj | | 0.90% | # | | 9/1/2029 | | A- | | | | 4,635 | | | 4,635,000 |
| Metro Govt Nashville & Davidson Cnty TN Indl Dev Brd Ser A | | 2.00% | # | | 1/1/2014 | | NR | | | | 2,405 | | | 2,405,000 |
| MS Business Fin Corp JKW Real Estate LLC Pj | | 2.00% | # | | 5/1/2022 | | A- | | | | 1,990 | | | 1,990,000 |
| PA Econ Dev Fing Auth Wst Mgt Inc Pj | | 3.60% | | | 9/1/2013 | | BBB | | | | 500 | | | 500,175 |
| Tippecanoe Cnty IN Rev Faith Prop Inc Pj | | 2.00% | # | | 11/1/2030 | | A- | (c) | | | 6,100 | | | 6,100,000 |
| | | | | | | | | | | | | | |
| Total | | | | | | | | | | | | | | 19,879,633 |
| | | | | | | | | | | | | | |
| | | | | |
| Education 9.28% | | | | | | | | | | | | | | |
| Alachua Cnty FL Indl Dev Rev Oak Hall Private Sch | | 1.00% | # | | 7/1/2031 | | A2 | | | | 3,920 | | | 3,920,000 |
| AZ St Univ Enrg Mgmt LLC Tempe Campus II | | 5.00% | | | 7/1/2016 | | AA- | | | | 500 | | | 550,960 |
| Birmingham AL Edl Bldg Auth Miles College Pj Ser A | | 2.00% | # | | 2/1/2029 | | Baa1 | | | | 4,010 | | | 4,010,000 |
| Broward Cnty FL Edl Facs Auth Nova Southeastern A | | 1.00% | # | | 4/1/2022 | | A+ | | | | 1,645 | | | 1,645,000 |
| Collierville TN Indl Dev Brd St. George’s High Sch Pj | | 1.60% | # | | 8/1/2031 | | Baa1 | | | | 13,620 | | | 13,620,000 |
| Louisville & Jefferson Cnty KY Metro Govt Student Hsg Univ of Louisville Hsg Ser A | | 1.60% | # | | 7/1/2032 | | Baa1 | | | | 5,050 | | | 5,050,000 |
| MD St Hlth & Higher Edl Facs Auth Barnesville Sch Issue | | 1.00% | # | | 9/1/2024 | | A2 | | | | 2,065 | | | 2,065,000 |
| Metro Govt Nashville & Davidson Cnty TN Hlth & Edl Facs Brd Fisk Univ Pj | | 2.00% | # | | 12/1/2020 | | Baa1 | | | | 4,735 | | | 4,735,000 |
| Miami-Dade Cnty FL Indl Dev Auth Belen Jesuit Prep Sch Pj | | 0.95% | # | | 8/1/2019 | | A2 | | | | 4,955 | | | 4,955,000 |
| MN St Higher Ed Facs Auth Clg St Scholastica Ser 6-A | | 3.50% | # | | 12/1/2034 | | Aa1 | | | | 3,900 | | | 3,900,000 |
| Mobile AL Spring Hill College Edl Bldg Auth Spring Hill College Pj | | 1.86% | # | | 9/1/2037 | | Baa1 | | | | 14,500 | | | 14,500,000 |
| NC Cap Facs Fin Agy Hill Ctr Pj | | 0.90% | # | | 7/1/2028 | | A- | | | | 5,000 | | | 5,000,000 |
See Notes to Financial Statements.
122
Schedule of Investments (continued)
SHORT DURATION TAX FREE FUND September 30, 2009
| | | | | | | | | | | | | |
| Investments | | Interest
Rate | | | Maturity
Date | | Credit
Rating:
S&P or
Moody’s(a) | | Principal
Amount
(000) | | Value |
| Education (continued) | | | | | | | | | | | | | |
| ND St Brd of Higher Ed Univ Hsg & Aux Facs | | 4.00% | | | 4/1/2012 | | A+ | | $ | 1,000 | | $ | 1,036,710 |
| NJ St Edl Facs Auth Univ Med & Dentistry Ser B | | 5.50% | | | 12/1/2013 | | Baa2 | | | 1,000 | | | 1,064,330 |
| NY St Dorm Auth Rev Non St Supp Debt St. Lawrence | | 5.00% | | | 7/1/2014 | | A | | | 4,000 | | | 4,430,920 |
| Trinity TX Higher Edl Facs Corp Huston Tillotson Univ Pj A | | 2.90% | # | | 4/1/2038 | | Ba3 | | | 4,800 | | | 4,800,000 |
| Troy NY Indl Dev Auth Civic Fac Rensselaer Polytechnic Ser E | | 4.05% | | | 4/1/2037 | | A | | | 100 | | | 102,059 |
| Univ of TX Perm Univ Fd Ser A | | 5.00% | | | 7/1/2014 | | AAA | | | 1,400 | | | 1,619,828 |
| Univ of TX Rev Fing Sys Ser D | | 4.00% | | | 8/15/2014 | | AAA | | | 1,000 | | | 1,107,840 |
| | | | | | | | | | | | | |
| Total | | | | | | | | | | | | | 78,112,647 |
| | | | | | | | | | | | | |
| | | | | |
| General Obligation 15.71% | | | | | | | | | | | | | |
| AK Muni Bd Bk Auth Ser 1 | | 5.00% | | | 9/1/2015 | | A+ | | | 100 | | | 110,634 |
| Bedford Pk Vlg IL (AG) | | 5.00% | | | 12/1/2013 | | AAA | | | 1,275 | | | 1,426,763 |
| Boston MA Ser A | | 5.00% | | | 4/1/2014 | | AA+ | | | 1,500 | | | 1,723,560 |
| CA St Ser B Sub Ser B-5 | | 1.50% | # | | 5/1/2040 | | Aa3 | | | 17,375 | | | 17,375,000 |
| Centennial Auth NC Rev (AG) | | 5.00% | | | 9/1/2014 | | Aa2 | | | 3,460 | | | 3,933,985 |
| Chicago IL Brd of Ed Dedicated Revs Ser F | | 5.00% | | | 12/1/2014 | | AA- | | | 2,255 | | | 2,577,645 |
| Chicago IL Ctfs Ser ZC-1 (FGIC) | | 3.00% | # | | 1/1/2023 | | NR | | | 6,171 | | | 6,171,000 |
| CO Edl & Cultural Facs Auth First Academy Inc Pj Ser | | 1.00% | # | | 4/1/2037 | | BBB+ | | | 4,735 | | | 4,735,000 |
| Cook Cnty IL Cap Impt Ser E | | 3.38% | # | | 11/1/2033 | | AA | | | 10,000 | | | 10,000,000 |
| Cook Cnty IL Ser A (AMBAC) | | 5.00% | | | 11/15/2014 | | AA | | | 1,000 | | | 1,128,810 |
| Crawford Cent Sch Dist PA (AG) | | 3.50% | | | 2/15/2012 | | Aa2 | | | 250 | | | 263,345 |
| CT St Ser A | | 5.00% | | | 2/15/2013 | | AA | | | 3,835 | | | 4,304,174 |
| CT St Ser D | | 5.00% | | | 11/1/2014 | | AA | | | 500 | | | 579,325 |
| Cumberland Cnty NC Impt Pjs Ser B 1 COP | | 4.00% | | | 12/1/2014 | | AA | | | 3,500 | | | 3,810,730 |
| Detroit MI Sch Dist Floaters Ser DC 8032 (FSA) | | 0.60% | # | | 5/1/2029 | | AAA | | | 8,535 | | | 8,535,000 |
| Dist of Columbia Ser E (BHAC) | | 5.00% | | | 6/1/2014 | | AAA | | | 1,500 | | | 1,717,020 |
| Douglas Cnty WA Sch Dist No 206 Eastmont (NPFGC) | | 5.00% | | | 12/1/2014 | | Aa1 | | | 1,000 | | | 1,154,720 |
| Eagle Mountain & Saginaw TX Indpt Sch Dist Cap Apprec Ser A PSF GTD | | 5.25% | | | 8/15/2023 | | AAA | | | 1,695 | | | 1,949,064 |
| El Paso TX (FSA) | | 5.75% | | | 8/15/2012 | | AAA | | | 500 | | | 561,980 |
| Fairfax Cnty VA Pub Impt Ser A | | 5.25% | | | 4/1/2013 | | AAA | | | 1,500 | | | 1,708,620 |
See Notes to Financial Statements.
123
Schedule of Investments (continued)
SHORT DURATION TAX FREE FUND September 30, 2009
| | | | | | | | | | | | | |
| Investments | | Interest
Rate | | | Maturity
Date | | Credit
Rating:
S&P or
Moody’s(a) | | Principal
Amount
(000) | | Value |
| General Obligation (continued) | | | | | | | | | | | | | |
| FL St Brd of Ed Pub Ed Ser C | | 5.00% | | | 6/1/2014 | | AAA | | $ | 250 | | $ | 283,653 |
| Frisco TX Ctfs Oblig Ser A (FSA) | | 5.00% | | | 2/15/2012 | | AAA | | | 500 | | | 544,215 |
| Harris Cnty TX Ctfs Oblig | | 5.50% | | | 8/15/2020 | | AAA | | | 1,000 | | | 1,127,210 |
| Hartford CT | | 5.625% | | | 2/1/2013 | | A | | | 590 | | | 674,352 |
| Hartford CT (AG) | | 4.00% | | | 11/15/2012 | | AAA | | | 1,255 | | | 1,356,781 |
| Hartford CT (AG) | | 4.00% | | | 11/15/2013 | | AAA | | | 1,320 | | | 1,444,991 |
| HI St Ser DG (AMBAC) | | 5.00% | | | 7/1/2012 | | AA | | | 50 | | | 55,203 |
| HI St Ser DQ | | 5.00% | | | 6/1/2014 | | AA | | | 3,500 | | | 4,001,305 |
| Honolulu HI City & Cnty Ser B (NPFGC) | | 5.00% | | | 7/1/2014 | | AA | | | 2,475 | | | 2,827,093 |
| IL St | | 5.00% | | | 1/1/2013 | | AA- | | | 2,555 | | | 2,812,748 |
| IL St Ser B | | 3.00% | # | | 10/1/2033 | | AA- | | | 10,250 | | | 10,250,000 |
| King Cnty WA Ltd Tax Ser B | | 4.50% | | | 1/1/2013 | | AAA | | | 80 | | | 87,958 |
| Madison Cnty IL Cmnty Unit Sch Dist No 2-Triad (NPFGC) | | 5.25% | | | 1/1/2015 | | A+ | | | 2,035 | | | 2,308,117 |
| Madison Cnty IL Cmnty Unit Sch Dist No 7-Edwardsville Ser A (FSA) | | 5.00% | | | 12/1/2013 | | AAA | | | 500 | | | 564,845 |
| Maricopa Cnty AZ Unif Sch Dist No 11-Peoria (FSA) | | 5.00% | | | 7/1/2014 | | AAA | | | 500 | | | 578,265 |
| Mecklenburg Cnty NC COP Ser A | | 5.00% | | | 2/1/2012 | | AA+ | | | 250 | | | 270,908 |
| Metro Transn Auth NY Ser B (NPFGC) | | 5.50% | | | 1/1/2013 | | AA- | | | 75 | | | 83,540 |
| MN St Var Purp Ser F | | 4.00% | | | 8/1/2014 | | AAA | | | 6,000 | | | 6,662,700 |
| Monmouth Cnty NJ Impt Auth Rev Govt Ln GTD (AMBAC) | | 5.00% | | | 12/1/2013 | | NR | | | 1,745 | | | 1,917,563 |
| MS Dev Bk Spl Oblig Jackson GTD | | 5.00% | | | 1/1/2012 | | AA- | | | 75 | | | 79,612 |
| Natomas Unif Sch Dist CA Cap Pjs Ser B COP (AMBAC) | | 5.00% | | | 2/1/2035 | | A- | | | 685 | | | 685,706 |
| New York City NY Ser K (FSA) | | 5.00% | | | 8/1/2013 | | AAA | | | 1,500 | | | 1,678,260 |
| OH St Infrastr Impt | | 5.35% | | | 8/1/2014 | | AA+ | | | 1,000 | | | 1,160,230 |
| OH St Mental Hlth Cap Facs Ser II-A (AMBAC) | | 5.00% | | | 8/1/2012 | | AA | | | 500 | | | 553,000 |
| PA St 2nd Ser (NPFGC)(FGIC) | | 5.00% | | | 7/1/2013 | | AA | | | 2,900 | | | 3,277,812 |
| Puerto Rico Pub Fin Corp Comwlth Approp Ser A (FGIC) | | 5.25% | | | 8/1/2031 | | BBB- | | | 7,500 | | | 7,739,100 |
| RI St & Providence Plantation Cap Dev Ln Ser A | | 5.00% | | | 7/15/2012 | | AA | | | 475 | | | 523,336 |
| Socorro TX Indpt Sch Dist Ser A PSF GTD | | 5.00% | | | 8/15/2014 | | AAA | | | 1,000 | | | 1,150,800 |
| Waterbury CT (AG) | | 4.00% | | | 9/1/2013 | | AAA | | | 1,700 | | | 1,847,798 |
| Waterbury CT (AG) | | 4.00% | | | 9/1/2014 | | AAA | | | 1,700 | | | 1,853,935 |
| | | | | | | | | | | | | |
| Total | | | | | | | | | | | | | 132,167,411 |
| | | | | | | | | | | | | |
See Notes to Financial Statements.
124
Schedule of Investments (continued)
SHORT DURATION TAX FREE FUND September 30, 2009
| | | | | | | | | | | | | |
| Investments | | Interest
Rate | | | Maturity
Date | | Credit
Rating:
S&P or
Moody’s(a) | | Principal
Amount
(000) | | Value |
| Healthcare 19.75% | | | | | | | | | | | | | |
| AL Hlthcare Auth For Baptist Ser A | | 6.00% | | | 11/15/2036 | | A3 | | $ | 2,000 | | $ | 2,091,580 |
| Albany NY Indl Dev Agy Civic Fac Teresian Hse Ser A | | 1.60% | # | | 7/1/2016 | | A1 | | | 1,540 | | | 1,540,000 |
| Allegheny Cnty PA Hosp Dev Auth Hlthcare Dialysis Clinic | | 1.00% | # | | 9/1/2027 | | A2 | | | 6,100 | | | 6,100,000 |
| Allegheny Cnty PA Hosp Dev Auth Univ Pittsburgh Med Ctr Ser A | | 5.00% | | | 9/1/2014 | | Aa3 | | | 8,475 | | | 9,438,947 |
| AZ Hlth Facs Auth Rev Banner Hlth Ser D | | 5.00% | | | 1/1/2014 | | A+ | | | 2,000 | | | 2,175,460 |
| Bay Med Ctr FL Hosp Rev Bay Med Ctr Pj Ser B | | 3.00% | # | | 10/1/2037 | | A1 | | | 17,985 | | | 17,985,000 |
| Birmingham AL Med Clinic Brd Univ AL Hlth Svcs Fndtn | | 0.85% | # | | 9/1/2015 | | A2 | | | 10,000 | | | 10,000,000 |
| Broward Cnty FL Hlth Facs Auth Henderson Mental Hlth | | 0.90% | # | | 7/1/2029 | | A- | | | 5,100 | | | 5,100,000 |
| CA Hlth Facs Fing Auth Adventist Hlth Sys West Ser C | | 5.00% | | | 3/1/2014 | | A | | | 2,000 | | | 2,148,480 |
| CA Muni Fin Auth Cmnty Hosps Cent CA COP(d) | | 5.00% | | | 2/1/2012 | | Baa2 | | | 1,095 | | | 1,135,241 |
| CA Muni Fin Auth Cmnty Hosps Cent CA COP(d) | | 5.00% | | | 2/1/2013 | | Baa2 | | | 1,160 | | | 1,208,894 |
| CA Muni Fin Auth Cmnty Hosps Cent CA COP(d) | | 5.00% | | | 2/1/2014 | | Baa2 | | | 1,220 | | | 1,269,386 |
| CA Statewide Cmntys Dev Auth Kaiser Permanente Ser A | | 5.00% | | | 4/1/2013 | | A+ | | | 5,000 | | | 5,481,800 |
| CA Statewide Cmntys Dev Auth Kaiser Permanente Ser C | | 3.85% | | | 11/1/2029 | | A+ | | | 2,000 | | | 2,053,840 |
| CA Statewide Cmntys Dev Auth Sr Living Sthn CA | | 5.25% | | | 11/15/2014 | | BBB | | | 1,270 | | | 1,312,405 |
| Clackamas Cnty OR Hosp Fac Auth Legacy Hlth Sys Ser C | | 5.00% | | | 7/15/2037 | | A+ | | | 2,000 | | | 2,139,000 |
| CO Hlth Facs Auth Rev Evangelical Lutheran Ser B | | 5.00% | | | 6/1/2039 | | A- | | | 3,000 | | | 3,194,430 |
| DeKalb Cnty GA Dev Indl Auth AG Rhodes Home Inc Pj | | 1.15% | # | | 3/1/2021 | | A2 | | | 3,305 | | | 3,305,000 |
| Gwinnett Cnty GA Hosp Auth Rev Gwinnett Hosp Sys Pj Ser C (FSA) | | 2.10% | # | | 7/1/2042 | | Aa3 | | | 3,240 | | | 3,240,000 |
| Gwinnett Cnty GA Hosp Auth Rev Gwinnett Hosp Sys Pj Ser D (FSA) | | 2.10% | # | | 7/1/2041 | | Aa3 | | | 6,000 | | | 6,000,000 |
| Harris Cnty TX Cultural Ed Facs Fin Corp Methodist Hosp Sys | | 5.00% | | | 6/1/2014 | | AA | | | 3,500 | | | 3,979,500 |
See Notes to Financial Statements.
125
Schedule of Investments (continued)
SHORT DURATION TAX FREE FUND September 30, 2009
| | | | | | | | | | | | | |
| Investments | | Interest
Rate | | | Maturity
Date | | Credit
Rating:
S&P or
Moody’s(a) | | Principal
Amount
(000) | | Value |
| Healthcare (continued) | | | | | | | | | | | | | |
| Harris Cnty TX Cultural Ed Facs Fin Corp Methodist Hosp Sys Ser B | | 5.25% | | | 12/1/2013 | | AA | | $ | 3,000 | | $ | 3,329,880 |
| HFDC Cent TX Inc Ret Fac Ser A | | 5.25% | | | 11/1/2014 | | NR | | | 1,195 | | | 1,167,443 |
| HI St Dept Bdgt & Fin Ser C2 | | 6.40% | | | 11/15/2014 | | NR | | | 1,100 | | | 1,121,373 |
| IL Fin Auth Rev Advocate Hlthcare Ser A-3 | | 3.875% | # | | 11/1/2030 | | AA | | | 1,000 | | | 1,028,740 |
| IL Fin Auth Rev Luther Oaks Pj Ser C | | 1.00% | # | | 8/15/2039 | | BBB+ | | | 2,055 | | | 2,055,000 |
| IL Fin Auth Rev Rush Univ Med Ctr Oblig Grp Ser A | | 5.00% | | | 11/1/2014 | | A- | | | 100 | | | 107,105 |
| IL Fin Auth Rev The Carle Fndtn Ser A (AG) | | 5.00% | | | 2/15/2012 | | AAA | | | 500 | | | 526,355 |
| IL Hlth Facs Auth Rev Advocate Hlthcare Network Ser A | | 4.375% | # | | 11/15/2022 | | AA | | | 4,175 | | | 4,323,839 |
| IN Hlth Fac Fing Auth Rev Ascension Hlth Ser A2 Rmkt | | 3.75% | | | 11/15/2036 | | Aa1 | | | 400 | | | 414,228 |
| IN Hlth Fac Fing Auth Rev Henry Cnty Mem Hosp Pj | | 4.25% | # | | 4/1/2022 | | BBB+ | | | 115 | | | 115,000 |
| Kalamazoo MI Econ Dev Corp Friendship Vlg | | 1.00% | # | | 5/1/2027 | | BBB+ | | | 8,440 | | | 8,440,000 |
| King Cnty WA Pub Hosp Dist No 2 Evergreen Hlthcare (NPFGC) | | 5.00% | | | 12/1/2012 | | AA- | | | 2,000 | | | 2,179,340 |
| Knox Cnty TN Hlth Edl & Hsg Facs Brd Ser A-3 | | 3.00% | # | | 10/1/2010 | | Aa3 | | | 1,150 | | | 1,150,000 |
| KS St Dev Fin Auth Rev Adventist Hlth | | 4.00% | | | 11/15/2012 | | A+ | | | 1,000 | | | 1,064,380 |
| LA Pub Facs Auth Rev Blood Ctr Pj | | 2.00% | # | | 10/1/2030 | | Baa1 | | | 3,375 | | | 3,375,000 |
| LA Pub Facs Auth Rev Christus Hlth Ser A | | 5.00% | | | 7/1/2014 | | A+ | | | 3,000 | | | 3,225,990 |
| Lee Cnty AL Indl Dev Auth Rev Lifesouth Cmnty Blood Ctr | | 0.90% | # | | 12/1/2019 | | A2 | | | 1,790 | | | 1,790,000 |
| Lexington Cnty SC Hlth Svcs Dist Inc | | 5.50% | | | 5/1/2032 | | A+ | | | 400 | | | 466,396 |
| MA St Hlth & Edl Facs Auth Cap Assets Pg Ser D (NPFGC) | | 6.00% | # | | 1/1/2035 | | Baa1 | | | 80 | | | 80,000 |
| MI St Hosp Fin Auth Rev Hlthcare Equip Ln Pg Ser C | | 2.10% | # | | 12/1/2032 | | BBB+ | | | 10,000 | | | 10,000,000 |
| Middleburg Heights OH Hosp Rev Impt Southwest Gen Hlth | | 1.60% | # | | 8/15/2022 | | BBB+ | | | 4,155 | | | 4,155,000 |
| Mobile AL Second Med Clinic Brd Bridge Inc Pj | | 3.25% | # | | 3/1/2016 | | NR | | | 875 | | | 875,000 |
| NC Med Care Commn Univ Hlth Sys Ser E-1 | | 5.75% | | | 12/1/2036 | | A+ | | | 1,000 | | | 1,060,040 |
| Newport Beach CA Rev Hoag Mem Hosp Presb Ser D | | 5.00% | | | 12/1/2038 | | AA | | | 3,000 | | | 3,248,730 |
| NJ Hlthcare Facs Fing Auth Somerset Med Ctr | | 5.50% | | | 7/1/2018 | | Ba2 | | | 50 | | | 44,881 |
See Notes to Financial Statements.
126
Schedule of Investments (continued)
SHORT DURATION TAX FREE FUND September 30, 2009
| | | | | | | | | | | | | |
| Investments | | Interest
Rate | | | Maturity
Date | | Credit
Rating:
S&P or
Moody’s(a) | | Principal
Amount
(000) | | Value |
| Healthcare (continued) | | | | | | | | | | | | | |
| NY St Dorm Auth Rev North Shore Univ Hosp (NPFGC) | | 5.50% | | | 11/1/2012 | | A | | $ | 2,035 | | $ | 2,147,047 |
| Rockford IL Rev Wesley Willows Oblig Grp | | 1.75% | # | | 4/1/2037 | | BBB | | | 1,100 | | | 1,100,000 |
| SC Jobs Econ Dev Auth Tuomey (CIFG) | | 5.00% | | | 11/1/2013 | | BBB+ | | | 1,685 | | | 1,729,214 |
| SC Jobs Econ Dev Auth Tuomey (CIFG) | | 5.00% | | | 11/1/2014 | | BBB+ | | | 1,035 | | | 1,056,321 |
| WI St Hlth & Edl Facs Auth Aurora Hlthcare Inc Ser B | | 4.75% | | | 8/15/2025 | | A3 | | | 3,000 | | | 3,077,040 |
| WI St Hlth & Edl Facs Auth Mercy Alliance Inc | | 2.00% | # | | 6/1/2022 | | A2 | | | 1,925 | | | 1,925,000 |
| WI St Hlth & Edl Facs Auth St. John’s Cmntys Inc Ser C-2(d) | | 5.40% | | | 9/15/2014 | | NR | | | 3,750 | | | 3,754,650 |
| WI St Hlth & Edl Facs Auth Wheaton Franciscan Hlthcare | | 5.00% | | | 8/15/2013 | | BBB+ | | | 5,000 | | | 5,169,750 |
| | | | | | | | | | | | | |
| Total | | | | | | | | | | | | | 166,201,705 |
| | | | | | | | | | | | | |
| | | | | |
| Housing 2.49% | | | | | | | | | | | | | |
| CA Hsg Fin Agy Rev Multi Fam Hsg Ser D | | 1.30% | # | | 2/1/2031 | | AA- | | | 1,445 | | | 1,445,000 |
| Saratoga Cnty NY Indl Dev Agy Amer Hsg Fndtn Ser A | | 1.60% | # | | 12/1/2036 | | A1 | | | 3,915 | | | 3,915,000 |
| WI Hsg & Econ Dev Auth Multi Fam Hsg Ser A | | 5.00% | # | | 10/1/2036 | | Aa3 | | | 5,085 | | | 5,085,000 |
| WI Hsg & Econ Dev Auth Multi Fam Hsg Ser A | | 5.00% | # | | 4/1/2046 | | Aa3 | | | 8,810 | | | 8,810,000 |
| WI Hsg & Econ Dev Auth Multi Fam Hsg Ser B | | 5.00% | # | | 10/1/2036 | | Aa3 | | | 1,700 | | | 1,700,000 |
| | | | | | | | | | | | | |
| Total | | | | | | | | | | | | | 20,955,000 |
| | | | | | | | | | | | | |
| | | | | |
| Lease Obligations 10.92% | | | | | | | | | | | | | |
| Anaheim CA Pub Fing Auth Pub Impts Pj Sub Ser C (FSA) | | 6.00% | | | 9/1/2014 | | AAA | | | 1,500 | | | 1,739,415 |
| Atlanta GA Downtown Dev Auth Rev Underground Atlanta Pj Ser A (AG) | | 5.00% | | | 7/1/2014 | | AAA | | | 3,500 | | | 3,854,060 |
| Blount Cnty TN Pub Bldg Auth Loc Govt Pub Impt D-3-A GTD | | 0.85% | # | | 6/1/2034 | | AA+ | | | 26,000 | | | 26,000,000 |
| Decatur Twp IN Multi Sch Bldg Corp 1st Mtg ETM (FGIC) | | 4.00% | | | 7/15/2013 | | AA+ | | | 1,670 | | | 1,835,029 |
| Fulton Cnty GA Facs Corp Pub Purp Pj COP | | 5.00% | | | 11/1/2012 | | AA- | | | 1,250 | | | 1,360,788 |
| Greenville Cnty SC Sch Dist Bldg Equity Sooner | | 5.00% | | | 12/1/2013 | | AA | | | 1,700 | | | 1,883,719 |
See Notes to Financial Statements.
127
Schedule of Investments (continued)
SHORT DURATION TAX FREE FUND September 30, 2009
| | | | | | | | | | | | | |
| Investments | | Interest
Rate | | | Maturity
Date | | Credit
Rating:
S&P or
Moody’s(a) | | Principal
Amount
(000) | | Value |
| Lease Obligations (continued) | | | | | | | | | | | | | |
| LA Loc Govt Envr Facs & Cmnty Dev Auth LCTCS Facs Corp Pj Ser A(d) | | 4.00% | | | 10/1/2013 | | A | | $ | 1,500 | | $ | 1,604,940 |
| Maricopa Cnty AZ Pub Fin Corp Ser B (AMBAC) | | 5.00% | | | 7/1/2014 | | AA+ | | | 3,000 | | | 3,331,680 |
| Memphis-Shelby Cnty TN Indl Dev Brd Boys & Girls Club Ser A | | 0.90% | # | | 1/1/2028 | | A2 | | | 5,340 | | | 5,340,000 |
| MI Muni Bd Auth Rev Loc Govt Ln Pg Sch Pg Ser C | | 5.00% | | | 5/1/2013 | | A+ | | | 1,495 | | | 1,611,849 |
| MI Muni Bd Auth Rev Loc Govt Ln Pg Ser C | | 5.00% | | | 5/1/2013 | | AA- | | | 1,650 | | | 1,796,586 |
| MI Muni Bd Auth Rev Loc Govt Ln Pg Ser C | | 5.00% | | | 5/1/2014 | | AA- | | | 4,050 | | | 4,393,562 |
| MI St Bldg Auth Rev Facs Pg Ser I | | 5.00% | | | 10/15/2014 | | A+ | | | 2,000 | | | 2,156,320 |
| MI St Bldg Auth Rev Facs Pg Ser I | | 5.00% | | | 10/15/2015 | | A+ | | | 75 | | | 80,854 |
| Miami-Dade Cnty FL Spl Rev Youth Fair & Exposition Pj | | 0.95% | # | | 8/1/2015 | | A2 | | | 5,205 | | | 5,205,000 |
| New York City NY Transnl Fin Auth Ser S-2 (FSA) | | 5.00% | | | 1/15/2014 | | AAA | | | 3,000 | | | 3,357,990 |
| NJ Econ Dev Auth Sch Facs Constr Ser O | | 5.25% | | | 3/1/2014 | | AA- | | | 2,625 | | | 2,966,434 |
| NJ Econ Dev Auth Sch Facs Constr Ser W | | 5.00% | | | 9/1/2012 | | AA- | | | 350 | | | 383,544 |
| NJ St Equip Lease Purchase Ser A COP | | 5.00% | | | 6/15/2012 | | AA- | | | 2,500 | | | 2,700,500 |
| NY St Dorm Auth Rev Cons Svc Contract Ser A | | 4.00% | | | 7/1/2014 | | AA- | | | 1,425 | | | 1,528,498 |
| NY St Dorm Auth Rev Mental Hlth Svcs Facs Impt | | 5.00% | | | 2/15/2014 | | AA- | | | 4,000 | | | 4,442,080 |
| OH St Bldg Auth Facs Adult Correction Ser C (NPFGC) | | 5.00% | | | 10/1/2013 | | AA | | | 425 | | | 477,296 |
| Puerto Rico Pub Bldgs Auth Rev Govt Facs Ser J GTD (AMBAC) | | 5.00% | | | 7/1/2036 | | BBB- | | | 2,000 | | | 2,069,660 |
| Southwest Allen IN Multi Sch Bldg Corp 1st Mtg Ser A (NPFGC) | | 5.00% | | | 1/15/2014 | | A1 | | | 2,705 | | | 3,013,695 |
| Toledo OH City Svcs Spl Assmt Nts Spl Oblig | | 4.00% | | | 12/1/2011 | | NR | | | 5,315 | | | 5,408,278 |
| Weber Cnty UT Muni Bldg Auth | | 4.00% | | | 12/15/2013 | | AA- | | | 1,770 | | | 1,890,342 |
| WV St Sch Bldg Auth Cap Impt (NPFGC) | | 5.25% | | | 1/1/2012 | | AAA | | | 1,305 | | | 1,410,509 |
| | | | | | | | | | | | | |
| Total | | | | | | | | | | | | | 91,842,628 |
| | | | | | | | | | | | | |
| | | | | |
| Other Revenue 14.65% | | | | | | | | | | | | | |
| Albemarle Cnty VA Indl Dev Auth Thomas Jefferson Fndtn Inc | | 0.85% | # | | 6/1/2037 | | A2 | | | 3,000 | | | 3,000,000 |
| Allegheny Cnty PA Indl Dev Auth Envr Impt USX Pj | | 4.75% | | | 12/1/2032 | | BBB+ | | | 2,225 | | | 2,344,149 |
See Notes to Financial Statements.
128
Schedule of Investments (continued)
SHORT DURATION TAX FREE FUND September 30, 2009
| | | | | | | | | | | | | |
| Investments | | Interest
Rate | | | Maturity
Date | | Credit
Rating:
S&P or
Moody’s(a) | | Principal
Amount
(000) | | Value |
| Other Revenue (continued) | | | | | | | | | | | | | |
| CA Muni Fin Auth Rev Pacific Inst Ser A | | 3.40% | # | | 8/1/2037 | | Ba3 | | $ | 10,305 | | $ | 10,305,000 |
| CA Muni Fin Auth Rev Solid Wst Mgmt Inc Pj Ser A | | 4.90% | | | 2/1/2039 | | BBB | | | 500 | | | 504,640 |
| Chatom AL Indl Dev Brd Rev Elec Ser A Rmkt | | 4.00% | # | | 8/1/2037 | | A | | | 5,000 | | | 5,002,100 |
| Dallas TX Civic Ctr (AG) | | 5.00% | | | 8/15/2014 | | AAA | | | 300 | | | 331,947 |
| Fairfax Cnty VA Econ Dev Auth Nish Pj Ser 501 C 3 | | 1.00% | # | | 8/1/2032 | | A2 | | | 1,500 | | | 1,500,000 |
| FL Dev Fin Corp Indl Dev Entrprse Bd Cent FL Ser A1 | | 0.95% | # | | 6/1/2023 | | NR | | | 1,645 | | | 1,645,000 |
| FL Hurricane Catastrophe Fd Fin Corp Ser A | | 5.25% | | | 7/1/2012 | | AA- | | | 2,000 | | | 2,145,200 |
| FL St Citizens Ppty Ins Corp Sr Secd High Risk Acct A (NPFGC) | | 5.00% | | | 3/1/2010 | | A+ | | | 900 | | | 914,634 |
| FL St Citizens Ppty Ins Corp Sr Secd High Risk Acct A (NPFGC) | | 5.00% | | | 3/1/2012 | | A+ | | | 100 | | | 103,522 |
| FL St Citizens Ppty Ins Corp Sr Secd High Risk Acct A-1 | | 5.50% | | | 6/1/2014 | | A+ | | | 5,000 | | | 5,317,600 |
| Hamilton Cnty OH Convtn Facs Auth 1st Lien (NPFGC)(FGIC) | | 5.00% | | | 12/1/2013 | | A+ | | | 1,635 | | | 1,798,042 |
| Hillsborough Cnty FL Indl Dev Auth Tampa Elec Co Pj | | 5.10% | | | 10/1/2013 | | Baa1 | | | 5,000 | | | 5,308,300 |
| LA Loc Govt Envr Facs & Cmnty Dev Auth Shreveport Cnvtn | | 1.60% | # | | 4/1/2035 | | A- | | | 19,500 | | | 19,500,000 |
| LA Pub Facs Auth Rev Cenikor Fndtn Pj | | 2.00% | # | | 4/1/2021 | | Baa1 | | | 2,535 | | | 2,535,000 |
| Lewisburg TN Indl Dev Brd Wst Mgmt Inc Pj | | 5.00% | | | 7/1/2012 | | BBB | | | 4,000 | | | 4,006,400 |
| Maricopa Cnty AZ Pollutn Ctrl Corp Pub Svc Co Ser B | | 5.50% | | | 5/1/2029 | | Baa2 | | | 2,500 | | | 2,606,250 |
| Mohave Cnty AZ Indl Dev Auth Mohave Prison LLC Expansion Pj | | 7.00% | | | 5/1/2013 | | BBB+ | | | 5,000 | | | 5,547,200 |
| Morehouse Parish LA Pollutn Ctrl Intl Paper Co Pj Ser A | | 5.25% | | | 11/15/2013 | | BBB | | | 2,500 | | | 2,673,975 |
| MS Business Fin Corp Renaissance Colony Pk LLC | | 1.60% | # | | 5/1/2035 | | Baa1 | | | 10,000 | | | 10,000,000 |
| Navajo Cnty AZ Pollutn Ctrl Corp Ser C | | 5.50% | | | 6/1/2034 | | Baa2 | | | 5,000 | | | 5,248,250 |
| New York City NY Tr Cultural Res Lincoln Ctr Ser C | | 5.75% | | | 12/1/2016 | | A+ | | | 75 | | | 87,926 |
| NJ Econ Dev Auth Cigarette Tax | | 5.375% | | | 6/15/2014 | | BBB | | | 2,560 | | | 2,664,653 |
| NJ Econ Dev Auth Cigarette Tax (FGIC) | | 5.00% | | | 6/15/2013 | | BBB | | | 75 | | | 77,731 |
| NY St Dorm Auth Rev Non St Supp Debt Sch Dist Fing Pg Ser C | | 4.00% | | | 10/1/2012 | | A+ | | | 2,940 | | | 3,141,566 |
See Notes to Financial Statements.
129
Schedule of Investments (continued)
SHORT DURATION TAX FREE FUND September 30, 2009
| | | | | | | | | | | | | |
| Investments | | Interest
Rate | | | Maturity
Date | | Credit
Rating:
S&P or
Moody’s(a) | | Principal
Amount
(000) | | Value |
| Other Revenue (continued) | | | | | | | | | | | | | |
| NY St Dorm Auth Rev St Pers Income Tax Ser A | | 5.00% | | | 3/15/2014 | | AAA | | $ | 250 | | $ | 283,220 |
| OH St Air Quality Dev Auth Columbus Sthn Pwr Ser A | | 3.875% | | | 12/1/2038 | | A3 | | | 3,500 | | | 3,635,135 |
| OH St Air Quality Dev Auth First Enrg Nuclear Ser A | | 5.75% | | | 6/1/2033 | | BBB | | | 1,500 | | | 1,644,630 |
| OH St Air Quality Dev Auth Pollutn Ctrl First Enrg Ser B | | 5.25% | | | 3/1/2023 | | Baa1 | | | 500 | | | 515,845 |
| OH St Air Quality Dev Auth Pollutn Ctrl First Enrg Ser D | | 4.75% | | | 8/1/2029 | | Baa1 | | | 7,500 | | | 7,794,525 |
| Orlando FL Cmnty Redev Agy Tax Alloc Downtown Dist Ser B | | 5.00% | | | 9/1/2014 | | A | | | 3,775 | | | 4,100,783 |
| Pub Gas Partners Inc GA Ser A(d) | | 5.00% | | | 10/1/2014 | | A+ | | | 3,000 | | | 3,312,660 |
| Rockport IN Pollutn Ctrl Rev MI Pwr Co Pj Ser A | | 6.25% | | | 6/1/2025 | | BBB | | | 1,000 | | | 1,087,170 |
| WV Sch Bldg Auth | | 5.00% | | | 7/1/2014 | | AAA | | | 2,290 | | | 2,580,280 |
| | | | | | | | | | | | | |
| Total | | | | | | | | | | | | | 123,263,333 |
| | | | | | | | | | | | | |
| | | | | |
| Pre-Refunded 0.03% | | | | | | | | | | | | | |
| UT Transit Auth Sales Tax Rev Ser B (FSA) | | 4.50% | | | 6/15/2033 | | AAA | | | 90 | | | 104,181 |
| Weslaco TX Hlth Facs Dev Corp Knapp Med Ctr Pj | | 6.25% | | | 6/1/2032 | | NR | | | 100 | | | 111,431 |
| | | | | | | | | | | | | |
| Total | | | | | | | | | | | | | 215,612 |
| | | | | | | | | | | | | |
| | | | | |
| Special Tax 2.23% | | | | | | | | | | | | | |
| Branson Creek MO Cmnty Impt Dist | | 1.86% | # | | 3/1/2022 | | Baa1 | | | 10,950 | | | 10,950,000 |
| Miami-Dade Cnty FL Entitlement GTD (NPFGC)(FGIC) | | 5.00% | | | 8/1/2014 | | A+ | | | 5,665 | | | 6,207,254 |
| PA Intergovernmental Cooperative Auth Philadelphia Fdg Pg | | 5.00% | | | 6/15/2012 | | AA | | | 1,500 | | | 1,637,265 |
| | | | | | | | | | | | | |
| Total | | | | | | | | | | | | | 18,794,519 |
| | | | | | | | | | | | | |
| | | | | |
| Tax Revenue 2.21% | | | | | | | | | | | | | |
| Bartow Cnty GA Sales Tax (NPFGC) | | 5.00% | | | 8/1/2012 | | A+ | | | 5,000 | | | 5,477,350 |
| CA St Econ Recovery Ser A | | 5.25% | | | 7/1/2014 | | A | | | 5,000 | | | 5,677,700 |
| CA St Econ Recovery Ser C-1 GTD | | 1.00% | # | | 7/1/2023 | | A | | | 1,000 | | | 1,000,000 |
| CA St Econ Recovery Ser C-3 GTD | | 1.00% | # | | 7/1/2023 | | A | | | 1,000 | | | 1,000,000 |
| IL St Sales Tax Rev | | 5.25% | | | 6/15/2012 | | AAA | | | 200 | | | 217,952 |
| Puerto Rico Sales Tax Fing Corp 1st Sub Ser A | | 5.00% | | | 8/1/2039 | | A+ | | | 5,000 | | | 5,212,050 |
| | | | | | | | | | | | | |
| Total | | | | | | | | | | | | | 18,585,052 |
| | | | | | | | | | | | | |
See Notes to Financial Statements.
130
Schedule of Investments (continued)
SHORT DURATION TAX FREE FUND September 30, 2009
| | | | | | | | | | | | |
| Investments | | Interest
Rate | | Maturity
Date | | Credit
Rating:
S&P or
Moody’s(a) | | Principal
Amount
(000) | | Value |
| Tobacco 0.67% | | | | | | | | | | | | |
| Buckeye OH Tob Sttlmnt Fing Auth Asset Bkd Sr Ser A-1 | | 5.00% | | 6/1/2014 | | BBB | | $ | 5,500 | | $ | 5,625,620 |
| | | | | | | | | | | | |
| | | | | |
| Transportation 5.42% | | | | | | | | | | | | |
| Dallas-Fort Worth TX Intl Arpt Facs Impt Corp Jt Ser A | | 4.00% | | 11/1/2014 | | A+ | | | 2,500 | | | 2,683,725 |
| DuPage Cnty IL Transn Rev (FSA) | | 5.00% | | 1/1/2012 | | AAA | | | 75 | | | 81,050 |
| FL St Dept of Transn Tpk Auth Rev Ser A | | 5.00% | | 7/1/2012 | | AA- | | | 75 | | | 82,229 |
| GA St Rd & Twy Auth Rev Fed Hwy Grant Antic Bds (NPFGC) | | 5.00% | | 6/1/2014 | | AA- | | | 1,000 | | | 1,144,680 |
| MA Bay Transn Auth Sr Ser C | | 5.25% | | 7/1/2013 | | AAA | | | 75 | | | 85,334 |
| Metro Transn Auth NY Ser B | | 5.00% | | 11/15/2014 | | AA | | | 1,000 | | | 1,136,190 |
| Metro Transn Auth NY Ser B Mand Tend | | 5.00% | | 11/15/2023 | | A | | | 600 | | | 658,212 |
| Metro Transn Auth NY Ser B Mand Tend | | 5.00% | | 11/15/2027 | | A | | | 6,000 | | | 6,691,800 |
| NJ St Transn Tr Fd Auth Transn Sys Ser A (NPFGC) | | 5.25% | | 12/15/2014 | | AA- | | | 5,000 | | | 5,702,350 |
| NJ St Transn Tr Fd Auth Unref Bal Transn Sys Ser C (FSA) | | 5.75% | | 12/15/2014 | | AAA | | | 1,265 | | | 1,474,117 |
| North TX Twy Auth Rev Sys 1st Tier Ser L-1 | | 5.50% | | 1/1/2038 | | A2 | | | 6,000 | | | 6,270,600 |
| PA St Tpk Commn Ser T (NPFGC)(FGIC) | | 5.50% | | 12/1/2013 | | Aa3 | | | 75 | | | 85,544 |
| PA St Tpk Commn Sub Ser B | | 5.00% | | 6/1/2014 | | A2 | | | 3,250 | | | 3,627,618 |
| Puerto Rico Comwlth Hwy & Transn Auth Ser E (FSA) | | 5.50% | | 7/1/2014 | | AAA | | | 5,000 | | | 5,571,500 |
| SC Transn Infrastr Bk Ser B (AMBAC) | | 5.25% | | 10/1/2012 | | A1 | | | 3,465 | | | 3,848,783 |
| South Jersey NJ Transn Auth Ser A-1 | | 4.00% | | 11/1/2013 | | A- | | | 4,000 | | | 4,245,240 |
| St. Louis MO Arpt Rev Lambert Intl Arpt Ser A-2 | | 4.25% | | 7/1/2012 | | A | | | 1,390 | | | 1,410,669 |
| TX St Transn Commn 1st Tier | | 5.00% | | 4/1/2013 | | AAA | | | 210 | | | 235,807 |
| TX St Transn Commn 1st Tier | | 5.00% | | 8/15/2042 | | BBB+ | | | 500 | | | 507,530 |
| WI St Transn Rev Ser B (AMBAC) | | 5.00% | | 7/1/2013 | | AA+ | | | 75 | | | 84,479 |
| | | | | | | | | | | | |
| Total | | | | | | | | | | | | 45,627,457 |
| | | | | | | | | | | | |
| | | | | |
| Utilities 11.07% | | | | | | | | | | | | |
| Austin TX Elec Util Sys Rev (FSA) | | 5.00% | | 5/15/2014 | | AAA | | | 1,875 | | | 2,133,075 |
| Buncombe Cnty NC Metro Sewerage Dist Ser B(d) | | 4.00% | | 7/1/2013 | | AA | | | 2,850 | | | 3,112,428 |
| Cape Coral FL Wtr & Swr Rev Bd Antic Nts | | 6.00% | | 10/1/2011 | | NR | | | 6,500 | | | 6,683,495 |
| Cent Plains NE Enrg Pj No 1 Ser A | | 5.00% | | 12/1/2014 | | BB+ | | | 3,050 | | | 3,221,227 |
See Notes to Financial Statements.
131
Schedule of Investments (continued)
SHORT DURATION TAX FREE FUND September 30, 2009
| | | | | | | | | | | | | |
| Investments | | Interest
Rate | | | Maturity
Date | | Credit
Rating:
S&P or
Moody’s(a) | | Principal
Amount
(000) | | Value |
| Utilities (continued) | | | | | | | | | | | | | |
| Chelan Cnty WA Pub Util Dist No 1 Sys Nts Sub Ser A | | 5.00% | | | 7/1/2013 | | AA | | $ | 1,000 | | $ | 1,112,880 |
| Chicago IL Wtr Rev 2nd Lien (FSA) | | 5.00% | | | 11/1/2013 | | AAA | | | 2,500 | | | 2,813,775 |
| Cowlitz Cnty WA Pub Util Dist No 1 Dist Sys (NPFGC)(FGIC) | | 5.00% | | | 9/1/2013 | | A3 | | | 2,225 | | | 2,442,872 |
| Enrg Northwest WA Elec Rev Pj 1 Ser A (NPFGC) | | 5.25% | | | 7/1/2013 | | Aaa | | | 180 | | | 204,379 |
| FL St Dept of Envr Protn FL Forever Ser A (NPFGC) | | 5.00% | | | 7/1/2014 | | AA- | | | 5,180 | | | 5,745,345 |
| Franklin TN Pub Bldg Auth Loc Govt Pub Impt 101-A-1 | | 0.80% | # | | 6/1/2037 | | Aaa | | | 3,800 | | | 3,800,000 |
| GA Muni Elec Auth Pwr Rev Unref Bal 2005 Ser Y (AMBAC) | | 6.40% | | | 1/1/2013 | | A+ | | | 75 | | | 82,067 |
| Hillsborough Cnty FL Indl Dev Auth Tampa Elec Ser B Rmkt | | 5.15% | | | 9/1/2025 | | Baa1 | | | 2,100 | | | 2,270,814 |
| IL Muni Elec Agy Pwr Supply Ser C (NPFGC)(FGIC) | | 5.00% | | | 2/1/2014 | | A+ | | | 1,000 | | | 1,103,510 |
| Indianapolis IN Util Dist Ser B (NPFGC)(FGIC) | | 4.00% | | | 6/1/2014 | | AA- | | | 3,535 | | | 3,834,591 |
| Intermountain Pwr Agy UT Ser A | | 5.00% | | | 7/1/2012 | | A+ | | | 3,015 | | | 3,275,014 |
| Jacksonville FL Elec Sys Rev Ser C | | 5.00% | | | 10/1/2013 | | Aa3 | | | 3,750 | | | 4,142,850 |
| Jacksonville FL St. John’s River Pwr Pk Sys Issue 2-17th Ser | | 5.25% | | | 10/1/2013 | | Aa2 | | | 50 | | | 53,722 |
| Kissimmee FL Util Auth Elec Sys (FSA) | | 5.25% | | | 10/1/2014 | | Aa3 | | | 1,000 | | | 1,133,250 |
| Louisville & Jefferson Cnty KY Metro Swr Dist Ser A | | 5.00% | | | 5/15/2013 | | AA- | | | 4,925 | | | 5,420,898 |
| Louisville & Jefferson Cnty KY Metro Swr Dist Ser B | | 4.00% | | | 5/15/2013 | | AA- | | | 5,000 | | | 5,361,100 |
| Louisville & Jefferson Cnty KY Metro Swr Dist Ser B | | 5.00% | | | 5/15/2014 | | AA- | | | 9,505 | | | 10,643,604 |
| MI Muni Bd Auth Rev Clean Wtr Rev Fd | | 5.50% | | | 10/1/2013 | | AAA | | | 340 | | | 390,473 |
| Mobile AL Brd of Wtr & Swr Commnrs (NPFGC)(FGIC) | | 5.25% | | | 1/1/2012 | | AA- | | | 1,000 | | | 1,073,970 |
| NC Eastern Muni Pwr Agy Ser B(d) | | 5.00% | | | 1/1/2015 | | A- | | | 1,000 | | | 1,088,660 |
| NC Eastern Muni Pwr Agy Ser F | | 5.375% | | | 1/1/2013 | | A- | | | 50 | | | 55,017 |
| Philadelphia PA Gas Wrks Rev 8th 1998 Gen Ordinance Ser A | | 5.00% | | | 8/1/2014 | | Baa2 | | | 3,000 | | | 3,157,110 |
| Pub Pwr Generation Agy NE Whelan Enrg Ctr Unit 2-A | | 5.00% | | | 1/1/2013 | | A2 | | | 2,260 | | | 2,406,335 |
| Riverside CA Swr Rev | | 4.00% | | | 8/1/2013 | | AA | | | 1,750 | | | 1,884,155 |
See Notes to Financial Statements.
132
Schedule of Investments (concluded)
SHORT DURATION TAX FREE FUND September 30, 2009
| | | | | | | | | | | | |
| Investments | | Interest
Rate | | Maturity
Date | | Credit
Rating:
S&P or
Moody’s(a) | | Principal
Amount
(000) | | Value |
| Utilities (continued) | | | | | | | | | | | | |
| Seattle WA Muni Lt & Pwr Rev | | 5.00% | | 4/1/2013 | | Aa2 | | $ | 1,000 | | $ | 1,113,840 |
| Sthn CA Pub Pwr Auth Pj No 1 Ser A | | 5.00% | | 11/1/2012 | | A | | | 1,000 | | | 1,054,050 |
| TN Enrg Acq Corp Ser A | | 5.00% | | 9/1/2013 | | BB+ | | | 3,615 | | | 3,832,912 |
| Vernon CA Elec Sys Rev Ser A | | 3.75% | | 8/1/2013 | | A- | | | 5,000 | | | 5,224,500 |
| Vernon CA Elec Sys Rev Ser A | | 5.25% | | 8/1/2014 | | A- | | | 1,000 | | | 1,108,800 |
| York Cnty VA Econ Dev Auth Elec & Pwr Ser A | | 4.05% | | 5/1/2033 | | A- | | | 2,000 | | | 2,126,000 |
| | | | | | | | | | | | |
| Total | | | | | | | | | | | | 93,106,718 |
| | | | | | | | | | | | |
| Total Municipal Bonds (cost $805,457,002) | | | | | | | | | | 814,377,335 |
| | | | | | | | | | | | |
| | | | | |
| WARRANT 0.01% | | | | | | | | | | | | |
| | | | | |
| General Obligation | | | | | | | | | | | | |
| Mobile AL (AMBAC) (cost $50,732) | | 4.10% | | 2/15/2011 | | AA- | | | 50 | | | 52,090 |
| | | | | | | | | | | | |
| Total Long-Term Investments (cost $805,507,734) | | | | | | | | | | 814,429,425 |
| | | | | | | | | | | | |
| | | | | |
| | | | | | | | | Shares
(000) | | |
| SHORT-TERM INVESTMENTS 2.03% | | | | | | |
| | | | | |
| Money Market Mutual Fund 0.33% | | | | | | | | | | | | |
| Dreyfus Municipal Cash Management Plus | | | | | | | | | 2,735 | | | 2,734,973 |
| | | | | | | | | | | | |
| | | | | |
| | | | | | | | | Principal
Amount
(000) | | |
| | | | | |
| Variable Rate Demand Notes(e) 1.70% | | | | | | | | | | | | |
| CA Infrastr & Econ Dev Bk Asian Art Museum Fndtn (NPFGC) | | 1.15% | | 10/1/2009 | | AA- | | $ | 12,900 | | | 12,900,000 |
| CA St Floater Ser DCL 048 (FSA) | | 0.60% | | 10/1/2009 | | AAA | | | 1,400 | | | 1,400,000 |
| | | | | | | | | | | | |
| Total | | | | | | | | | | | | 14,300,000 |
| | | | | | | | | | | | |
| Total Short-Term Investments (cost $17,034,973) | | | | | | | | | | 17,034,973 |
| | | | | | | | | | | | |
| Total Investments in Securities 98.83% (cost $822,542,707) | | | | | | | | 831,464,398 |
| | | | | | | | | | | | |
| Cash and Other Assets in Excess of Liabilities 1.17% | | | | | | 9,853,480 |
| | | | | | | | | | | | |
| Net Assets 100.00% | | | | | $ | 841,317,878 |
| | | | | | | | | | | | |
See Notes to Financial Statements.
133
Schedule of Investments
GEORGIA TAX FREE TRUST September 30, 2009
| | | | | | | | | | | | |
| Investments | | Interest
Rate | | Maturity
Date | | Credit
Rating:
S&P or
Moody’s(a) | | Principal
Amount
(000) | | Value |
| MUNICIPAL BONDS 102.74% | | | | | | | | | | | | |
| | | | | |
| Corporate-Backed 4.10% | | | | | | | | | | | | |
| Albany-Dougherty GA Payroll Dev Auth Procter & Gamble Paper Prods AMT | | 5.20% | | 5/15/2028 | | AA- | | $ | 1,035 | | $ | 1,072,570 |
| Fulton Cnty GA Dev Auth Loc Dist Cooling Fac Sr Maxon Atlantic Station A AMT | | 5.125% | | 3/1/2026 | | BBB | | | 1,500 | | | 1,526,280 |
| Richmond Cnty GA Dev Auth Intl Paper Co Pj Ser A AMT | | 5.00% | | 8/1/2030 | | BBB | | | 1,000 | | | 899,520 |
| Virgin Islands Pub Fin Auth Sr Secd Hovensa Refinery AMT | | 4.70% | | 7/1/2022 | | BBB | | | 2,000 | | | 1,830,620 |
| | | | | | | | | | | | |
| Total | | | | | | | | | | | | 5,328,990 |
| | | | | | | | | | | | |
| | | | | |
| Education 23.15% | | | | | | | | | | | | |
| Americus-Sumter GA Payroll Dev Auth GSW Fndtn Student Hsg Pj (CIFG) | | 5.00% | | 6/1/2036 | | A2 | | | 1,980 | | | 2,006,710 |
| Athens GA Hsg Auth Student Hsg Univ of GA East Campus (AMBAC) | | 5.00% | | 12/1/2027 | | Aa2 | | | 2,000 | | | 2,034,300 |
| Athens-Clarke Cnty GA Unif Govt Dev Auth Univ of GA Cent Precint LLC | | 5.00% | | 6/15/2031 | | Aa2 | | | 2,500 | | | 2,687,625 |
| Athens-Clarke Cnty GA Unif Govt Dev Auth Univ of GA O’Malleys Bldg LLC Pj | | 5.00% | | 6/15/2028 | | Aa2 | | | 2,000 | | | 2,184,520 |
| Atlanta GA Dev Auth Edl Facs Science Pk LLC Pj | | 4.75% | | 7/1/2027 | | A1 | | | 3,080 | | | 3,135,686 |
| Atlanta GA Dev Auth Edl Facs Science Pk LLC Pj | | 5.25% | | 7/1/2027 | | A1 | | | 2,000 | | | 2,107,660 |
| Bulloch Cnty GA Dev Auth GA Sthn Univ Hsg Fndtn Four (AG) | | 5.25% | | 7/1/2028 | | Aa2 | | | 2,465 | | | 2,716,972 |
| Bulloch Cnty GA Dev Auth GA Sthn Univ Pj (AMBAC) | | 5.00% | | 8/1/2021 | | A1 | | | 400 | | | 418,272 |
| Carrollton GA Payroll Dev Auth Univ of West GA Evergreen Complex | | 5.25% | | 7/1/2029 | | A2 | | | 1,175 | | | 1,238,885 |
| Dahlonega GA Downtown Dev Auth North GA Pkg & Rec Ctr LLC A (CIFG) | | 5.00% | | 7/1/2032 | | A+ | | | 1,000 | | | 1,021,160 |
| Fulton Cnty GA Dev Auth Rev GA Tech Athletic Assoc (AMBAC) | | 5.50% | | 10/1/2017 | | NR | | | 1,000 | | | 1,058,290 |
| Fulton Cnty GA Dev Auth Rev GA Tech Fndtn Inc Ser A | | 5.00% | | 11/1/2028 | | AA+ | | | 1,000 | | | 1,115,580 |
| Fulton Cnty GA Dev Auth Rev GA Tech Fndtn Sac II Pj Ser A | | 5.125% | | 11/1/2021 | | AA+ | | | 750 | | | 793,403 |
| Fulton Cnty GA Dev Auth Rev Tuff Morehouse Pj Ser A (AMBAC) | | 5.50% | | 2/1/2022 | | A2 | | | 1,000 | | | 1,059,100 |
See Notes to Financial Statements.
134
Schedule of Investments (continued)
GEORGIA TAX FREE TRUST September 30, 2009
| | | | | | | | | | | | |
| Investments | | Interest
Rate | | Maturity
Date | | Credit
Rating:
S&P or
Moody’s(a) | | Principal
Amount
(000) | | Value |
| Education (continued) | | | | | | | | | | | | |
| GA Private Colleges & Univs Auth Spelman College | | 5.25% | | 6/1/2021 | | Aa3 | | $ | 1,340 | | $ | 1,443,113 |
| Marietta GA Dev Auth Rev Student Hsg SPSU Student Hsg I | | 5.125% | | 9/15/2023 | | A2 | | | 1,000 | | | 1,012,840 |
| Marietta GA Dev Auth Rev Univ Facs Life Univ Inc Pj | | 7.00% | | 6/15/2030 | | Ba3 | | | 2,000 | | | 1,879,480 |
| Peach Cnty GA Dev Auth Student Fort Vly St Univ Fndtn Ppty LLC (AMBAC) | | 5.00% | | 6/1/2023 | | A3 | | | 1,115 | | | 1,190,274 |
| Peach Cnty GA Dev Auth Student Fort Vly St Univ Fndtn Ppty LLC (AMBAC) | | 5.00% | | 6/1/2034 | | A3 | | | 1,000 | | | 1,017,490 |
| | | | | | | | | | | | |
| Total | | | | | | | | | | | | 30,121,360 |
| | | | | | | | | | | | |
| | | | | |
| General Obligation 13.23% | | | | | | | | | | | | |
| Atlanta GA (AG) | | 5.25% | | 12/1/2023 | | AAA | | | 1,265 | | | 1,427,388 |
| Barnesville-Lamar Cnty GA Indl Dev Auth Student Hsg Gordon College Pptys A | | 5.00% | | 8/1/2030 | | A3 | | | 145 | | | 147,787 |
| Gwinnett Cnty GA Sch Dist(b) | | 5.00% | | 2/1/2028 | | AAA | | | 10,000 | | | 11,225,500 |
| Northern Mariana Islands Comwlth Ser A | | 5.00% | | 6/1/2030 | | NR | | | 2,485 | | | 2,044,757 |
| Paulding Cnty GA Sch Dist | | 4.75% | | 2/1/2027 | | AA+ | | | 1,000 | | | 1,057,560 |
| Puerto Rico Comwlth Unref Bal Pub Impt Ser A | | 5.125% | | 7/1/2031 | | BBB- | | | 665 | | | 665,219 |
| Puerto Rico Comwlth Unref Bal Pub Impt Ser A | | 5.25% | | 7/1/2030 | | BBB- | | | 380 | | | 380,821 |
| Territory of Guam Ser A | | 7.00% | | 11/15/2039 | | B+ | | | 235 | | | 257,645 |
| | | | | | | | | | | | |
| Total | | | | | | | | | | | | 17,206,677 |
| | | | | | | | | | | | |
| | | | | |
| Healthcare 17.79% | | | | | | | | | | | | |
| Clarke Cnty GA Hosp Auth Rev Athens Regl Med Ctr Pj (NPFGC) | | 5.125% | | 1/1/2032 | | AA | | | 500 | | | 517,345 |
| Cobb Cnty GA Hosp Auth Rev Antic Ctfs (AMBAC) | | 5.25% | | 4/1/2024 | | AA- | | | 1,000 | | | 1,055,370 |
| Coffee Cnty GA Hosp Auth Rev Coffee Regl Med Ctr Inc Pj | | 5.00% | | 12/1/2026 | | BBB | | | 1,010 | | | 884,952 |
| Coffee Cnty GA Hosp Auth Rev Coffee Regl Med Ctr Inc Pj | | 5.25% | | 12/1/2022 | | BBB | | | 1,000 | | | 941,020 |
| Fulton Cnty GA Resdl Care Facs First Mtg Lenbrook Pj Ser A | | 5.00% | | 7/1/2027 | | NR | | | 1,500 | | | 1,085,085 |
| Glynn-Brunswick Mem Hosp Auth GA Antic Ctfs Southeast GA Hlth Ser A | | 5.50% | | 8/1/2028 | | A2 | | | 1,840 | | | 1,923,536 |
See Notes to Financial Statements.
135
Schedule of Investments (continued)
GEORGIA TAX FREE TRUST September 30, 2009
| | | | | | | | | | | | | | |
| Investments | | Interest
Rate | | | Maturity
Date | | | Credit
Rating:
S&P or
Moody’s(a) | | Principal
Amount
(000) | | Value |
| Healthcare (continued) | | | | | | | | | | | | | | |
| Glynn-Brunswick Mem Hosp Auth GA Unref Bal 2005 Antic Ctfs (NPFGC) | | 6.00% | | | 8/1/2016 | | | AA | | $ | 100 | | $ | 100,362 |
| Houston Cnty GA Hosp Auth Rev Antic Ctfs Houston Hlthcare Pj | | 5.00% | | | 10/1/2038 | | | A2 | | | 1,500 | | | 1,444,455 |
| Houston Cnty GA Hosp Auth Rev Antic Ctfs Houston Hlthcare Pj | | 5.25% | | | 10/1/2035 | | | A2 | | | 1,420 | | | 1,423,664 |
| Macon-Bibb Cnty GA Hosp Auth Rev Antic Ctfs Macon Hosp Med Ctr(b) | | 4.625%
5.00% | –
| | 8/1/2029
8/1/2035 | –
| | AA | | | 10,000 | | | 10,134,450 |
| Med Ctr Hosp Auth GA Rev Spring Hrbr Green Isl Pj | | 5.25% | | | 7/1/2037 | | | NR | | | 1,300 | | | 1,025,687 |
| Puerto Rico Indl Tourist Edl Med & Envr Ctrl Facs Fing Auth Hosp de la Concepcion Ser A | | 6.50% | | | 11/15/2020 | | | Aa1 | | | 410 | | | 427,171 |
| Territory of Guam Oblig Rev Section 30 Ser A | | 5.75% | | | 12/1/2034 | | | BBB- | | | 735 | | | 754,845 |
| Ware Cnty GA Hosp Auth Rev Antic Ctfs GTD (NPFGC) | | 5.50% | | | 3/1/2021 | | | Baa1 | | | 500 | | | 504,910 |
| Wayne Cnty GA Hosp Auth Rev GTD (XLCA) | | 5.00% | | | 3/1/2023 | | | NR | | | 1,000 | | | 924,210 |
| | | | | | | | | | | | | | |
| Total | | | | | | | | | | | | | | 23,147,062 |
| | | | | | | | | | | | | | |
| | | | | |
| Housing 7.86% | | | | | | | | | | | | | | |
| Albany-Dougherty GA Inner City Auth Albany St Univ Student Hsg Ser A (XLCA) | | 5.00% | | | 7/1/2031 | | | NR | | | 1,000 | | | 877,230 |
| DeKalb Newton & Gwinnett Cntys GA Joint Dev Auth Rev GGC Fndtn LLC Pj | | 6.00% | | | 7/1/2034 | | | A+ | | | 1,500 | | | 1,654,560 |
| East Point GA Hsg Auth Multi Fam Hsg Laurel Ridge WA Rd Apts AMT (FNMA) | | 5.00% | | | 10/1/2032 | | | AAA | | | 3,475 | | | 3,483,896 |
| GA St Hsg & Fin Auth Rev Sing Fam Mtg Ser B AMT | | 5.05% | | | 12/1/2031 | | | AAA | | | 1,000 | | | 970,100 |
| GA St Hsg & Fin Auth Rev Sing Fam Mtg Sub Ser A-2 AMT | | 4.85% | | | 12/1/2037 | | | AAA | | | 100 | | | 89,979 |
| GA St Hsg & Fin Auth Rev Sing Fam Mtg Sub Ser A-2 AMT | | 4.875% | | | 12/1/2024 | | | AAA | | | 100 | | | 100,228 |
| Richmond Cnty GA Dev Auth ASU Jaguar Student Hsg LLC Ser A | | 5.25% | | | 2/1/2030 | | | A3 | | | 2,000 | | | 1,860,500 |
| Savannah GA Econ Dev Auth Multi Fam Hsg Snap Apt A AMT (GNMA) | | 5.15% | | | 11/20/2022 | | | AAA | | | 500 | | | 512,860 |
| Tift Cnty GA Dev Auth Student Hsg 2nd ABAC LLC Pj (CIFG) | | 5.00% | | | 8/1/2037 | | | A3 | | | 665 | | | 671,843 |
| | | | | | | | | | | | | | |
| Total | | | | | | | | | | | | | | 10,221,196 |
| | | | | | | | | | | | | | |
See Notes to Financial Statements.
136
Schedule of Investments (continued)
GEORGIA TAX FREE TRUST September 30, 2009
| | | | | | | | | | | | |
| Investments | | Interest
Rate | | Maturity
Date | | Credit
Rating:
S&P or
Moody’s(a) | | Principal
Amount
(000) | | Value |
| Lease Obligations 5.57% | | | | | | | | | | | | |
| Assoc Cnty GA Commnrs Unref Bal Pub Purp Pj (AMBAC) | | 5.625% | | 7/1/2020 | | A1 | | $ | 10 | | $ | 10,291 |
| Atlanta GA Dev Auth Rev Tuff ATDC Pj Ser A | | 5.00% | | 1/1/2035 | | A3 | | | 1,275 | | | 1,284,830 |
| Atlanta GA Dev Auth Rev Tuff ATDC Pj Ser C | | 4.625% | | 1/1/2035 | | A3 | | | 1,170 | | | 1,135,146 |
| Fayette Cnty GA Pub Facs Auth Crim Justice Ctr Pj | | 5.00% | | 6/1/2026 | | AA | | | 1,040 | | | 1,076,525 |
| GA Muni Assoc Inc Ctfs City Court Atlanta Pj (AMBAC) | | 5.25% | | 12/1/2026 | | NR | | | 750 | | | 760,642 |
| GA Sch Brds Assoc Inc DeKalb Cnty Pub Schs Pj COP (NPFGC) | | 5.00% | | 12/1/2023 | | A | | | 1,000 | | | 1,027,110 |
| Puerto Rico Comwlth Infrastr Fing Auth Mepsi Campus Pj Ser A | | 6.50% | | 10/1/2037 | | NR | | | 1,000 | | | 884,690 |
| Puerto Rico Pub Bldgs Auth Rev Govt Facs Ser P GTD | | 6.50% | | 7/1/2030 | | BBB- | | | 1,000 | | | 1,072,180 |
| | | | | | | | | | | | |
| Total | | | | | | | | | | | | 7,251,414 |
| | | | | | | | | | | | |
| | | | | |
| Other Revenue 2.81% | | | | | | | | | | | | |
| Cobb-Marietta GA Coliseum & Exhibit Hall Auth Rev (NPFGC) | | 5.625% | | 10/1/2026 | | A | | | 1,000 | | | 1,121,610 |
| GA St Higher Ed Facs Auth USG Real Estate Fndtn I LLC Pj (AG) | | 5.25% | | 6/15/2019 | | AAA | | | 1,735 | | | 2,015,879 |
| George L Smith II GA World Congress Ctr Auth Domed Stadium Pj AMT (NPFGC) | | 5.75% | | 7/1/2015 | | A | | | 500 | | | 513,015 |
| | | | | | | | | | | | |
| Total | | | | | | | | | | | | 3,650,504 |
| | | | | | | | | | | | |
| | | | | |
| Pre-Refunded 5.69% | | | | | | | | | | | | |
| Assoc Cnty GA Commnrs Pub Purp Pj (AMBAC) | | 5.625% | | 7/1/2020 | | A1 | | | 15 | | | 15,733 |
| Athens-Clarke Cnty GA Unif Govt Dev Auth Catholic Hlth East Issue | | 5.50% | | 11/15/2032 | | A1 | | | 1,000 | | | 1,136,500 |
| Atlanta GA ETM | | 5.60% | | 12/1/2015 | | A1 | | | 95 | | | 106,700 |
| Cobb Cnty GA Kennestone Hosp Auth Rev Ctfs Ser 86 A ETM (NPFGC) | | Zero Coupon | | 8/1/2015 | | A | | | 255 | | | 189,371 |
| GA Private Colleges & Univs Auth Mercer Univ Pj | | 5.75% | | 10/1/2031 | | Baa2 | | | 500 | | | 558,155 |
| Puerto Rico Comwlth Pub Impt (NPFGC) | | 5.75% | | 7/1/2026 | | A | | | 1,240 | | | 1,282,383 |
See Notes to Financial Statements.
137
Schedule of Investments (continued)
GEORGIA TAX FREE TRUST September 30, 2009
| | | | | | | | | | | | |
| Investments | | Interest
Rate | | Maturity
Date | | Credit
Rating:
S&P or
Moody’s(a) | | Principal
Amount
(000) | | Value |
| Pre-Refunded (continued) | | | | | | | | | | | | |
| Puerto Rico Comwlth Pub Impt Ser A | | 5.00% | | 7/1/2027 | | AAA | | $ | 370 | | $ | 410,626 |
| Puerto Rico Comwlth Pub Impt Ser A | | 5.25% | | 7/1/2030 | | AAA | | | 620 | | | 747,292 |
| Puerto Rico Pub Bldgs Auth Rev Govt Facs Ser D | | 5.25% | | 7/1/2036 | | BBB- | | | 915 | | | 1,008,531 |
| Puerto Rico Pub Bldgs Auth Rev Govt Facs Ser D | | 5.375% | | 7/1/2033 | | BBB- | | | 1,185 | | | 1,310,100 |
| Savannah GA Econ Dev Auth Sub Ser C Rmkt ETM | | Zero Coupon | | 12/1/2021 | | Aaa | | | 1,000 | | | 638,120 |
| | | | | | | | | | | | |
| Total | | | | | | | | | | | | 7,403,511 |
| | | | | | | | | | | | |
| | | | | |
| Special Tax 0.93% | | | | | | | | | | | | |
| Atlanta GA Dev Auth Rev Opportunity Pj (AMBAC) | | 5.00% | | 12/1/2018 | | A | | | 1,105 | | | 1,212,052 |
| | | | | | | | | | | | |
| | | | | |
| Tax Revenue 3.02% | | | | | | | | | | | | |
| Metro Atlanta GA Rapid Transit Auth Ser N (NPFGC)(IBC) | | 6.25% | | 7/1/2018 | | AAA | | | 465 | | | 541,125 |
| Puerto Rico Sales Tax Fing Corp 1st Sub Ser A | | 5.25% | | 8/1/2027 | | A+ | | | 2,000 | | | 2,145,820 |
| Puerto Rico Sales Tax Fing Corp Ser A | | 5.25% | | 8/1/2057 | | AA- | | | 750 | | | 776,685 |
| Virgin Islands Pub Fin Auth Rev Matching Fd Ln Diago Ser A | | 6.75% | | 10/1/2037 | | BBB | | | 440 | | | 465,538 |
| | | | | | | | | | | | |
| Total | | | | | | | | | | | | 3,929,168 |
| | | | | | | | | | | | |
| | | | | |
| Transportation 3.62% | | | | | | | | | | | | |
| Atlanta GA Arpt Facs Rev AMT (NPFGC) | | Zero Coupon | | 1/1/2010 | | A+ | | | 170 | | | 169,317 |
| Atlanta GA Arpt Facs Rev Ser A AMT (FSA) | | 5.125% | | 1/1/2030 | | AAA | | | 100 | | | 99,805 |
| Augusta GA Arpt Rev Gen Passenger Fac Charge A | | 5.15% | | 1/1/2035 | | Baa2 | | | 1,020 | | | 793,815 |
| College Pk GA Business & Indl Dev Auth Rev Civic Ctr Pj (AMBAC) | | 5.25% | | 9/1/2026 | | AA- | | | 1,000 | | | 1,054,980 |
| Macon-Bibb Cnty GA Indl Auth Atlantic Southeast Airlines AMT (AMBAC) | | 5.00% | | 4/1/2018 | | A | | | 430 | | | 435,814 |
| Metro Atlanta GA Rapid Transit Auth 3rd Indenture Ser B (FSA) | | 5.00% | | 7/1/2029 | | AAA | | | 2,000 | | | 2,151,160 |
| | | | | | | | | | | | |
| Total | | | | | | | | | | | | 4,704,891 |
| | | | | | | | | | | | |
See Notes to Financial Statements.
138
Schedule of Investments (concluded)
GEORGIA TAX FREE TRUST September 30, 2009
| | | | | | | | | | | | | |
| Investments | | Interest
Rate | | Maturity
Date | | Credit
Rating:
S&P or
Moody’s(a) | | Principal
Amount
(000) | | Value | |
| Utilities 14.97% | | | | | | | | | | | | | |
| Appling Cnty GA Dev Auth Pollutn Ctrl GA Pwr Co Plant Hatch Pj (AMBAC) | | 4.40% | | 7/1/2016 | | A | | $ | 1,000 | | $ | 1,016,020 | |
| Atlanta GA Wtr & Wst Wtr Rev Ser A | | 6.00% | | 11/1/2022 | | A | | | 1,000 | | | 1,094,080 | |
| Atlanta GA Wtr & Wst Wtr Rev Ser A Unref Bal (NPFGC)(FGIC) | | 5.00% | | 11/1/2029 | | A | | | 2,090 | | | 2,093,051 | |
| Augusta GA Wtr & Swr Rev (FSA) | | 5.00% | | 10/1/2024 | | AAA | | | 2,000 | | | 2,222,660 | |
| Carroll Cnty GA Wtr Auth Wtr & Swr (AMBAC) | | 5.25% | | 7/1/2021 | | A3 | | | 500 | | | 532,185 | |
| Cherokee Cnty GA Wtr & Swr Auth Ser 2006 (FSA) | | 5.00% | | 8/1/2031 | | AAA | | | 3,000 | | | 3,218,700 | |
| Cobb Cnty GA Dev Auth Solid Wst Disp GA Wst Mgt Pj Ser A AMT | | 5.00% | | 4/1/2033 | | BBB | | | 500 | | | 453,795 | |
| Elberton GA Combined Util Sys (AMBAC) | | 5.50% | | 1/1/2019 | | A3 | | | 550 | | | 583,462 | |
| Forsyth Cnty GA Wtr & Swr Auth (FSA) | | 5.00% | | 4/1/2019 | | AAA | | | 500 | | | 565,550 | |
| Glynn Cnty GA Wtr & Swr Rev (AMBAC) | | 5.00% | | 4/1/2023 | | A3 | | | 750 | | | 781,883 | |
| Main St Nat Gas Inc GA Gas Pj Ser B | | 5.00% | | 3/15/2019 | | A | | | 1,000 | | | 999,970 | |
| Monroe Cnty GA Dev Auth Pollutn Ctrl Oglethorpe Pwr Scherer B (AMBAC) | | 4.625% | | 1/1/2036 | | A3 | | | 1,500 | | | 1,524,450 | |
| Muni Elec Auth GA Combustion Turbine Pj Ser A (NPFGC) | | 5.25% | | 11/1/2022 | | A1 | | | 1,445 | | | 1,505,170 | |
| Muni Elec Auth GA Gen Resolution Pjs Sub Ser A | | 5.25% | | 1/1/2021 | | A | | | 1,000 | | | 1,151,350 | |
| Walton Cnty GA Wtr & Swr Auth Walton Hard Labor Creek Pj GTD (FSA) | | 5.00% | | 2/1/2033 | | AAA | | | 1,650 | | | 1,738,258 | |
| | | | | | | | | | | | | |
| Total | | | | | | | | | | | | 19,480,584 | |
| | | | | | | | | | | | | |
| Total Municipal Bonds (cost $130,505,750) | | | | | | | | | | | | 133,657,409 | |
| | | | | | | | | | | | | |
| | | | | |
| SHORT-TERM INVESTMENT 0.20% | | | | | | | | | | | | | |
| | | | | |
| Variable Rate Demand Note | | | | | | | | | | | | | |
Gainesville & Hall Cnty GA Hosp Auth Northeast GA Hlth Sys Ser A(e)
(cost $260,000) | | 0.32% | | 10/1/2009 | | AAA | | | 260 | | | 260,000 | |
| | | | | | | | | | | | | |
| Total Investments in Securities 102.94% (cost $130,765,750) | | | | | | | | 133,917,409 | |
| | | | | | | | | | | | | |
| Liabilities in Excess of Cash and Other Assets(f) (2.94%) | | | | | | | | (3,830,004 | ) |
| | | | | | | | | | | | | |
| Net Assets 100.00% | | | | | | | $ | 130,087,405 | |
| | | | | | | | | | | | | |
Open Futures Contracts at September 30, 2009:
| | | | | | | | | | | | |
| Type | | Expiration | | Contracts | | Position | | Market
Value | | Unrealized
Depreciation |
| U.S. 30-Year Treasury Bond | | December 2009 | | 130 | | Short | | $ | (15,778,750) | | $ | (346,628) |
See Notes to Financial Statements.
139
Schedule of Investments
HIGH YIELD MUNICIPAL BOND FUND September 30, 2009
| | | | | | | | | | | | |
| Investments | | Interest
Rate | | Maturity
Date | | Credit
Rating:
S&P or
Moody’s(a) | | Principal
Amount
(000) | | Value |
| MUNICIPAL BONDS 109.05% | | | | | | | | | | | | |
| | | | | |
| Corporate-Backed 10.03% | | | | | | | | | | | | |
| Aleutians East Borough AK Aleutian Pribilof Islands Inc (ACA) | | 5.50% | | 6/1/2036 | | NR | | $ | 2,140 | | $ | 1,728,307 |
| Alliance Arpt Auth Inc TX Spl Facs Amer Airlines Inc Pj AMT | | 5.25% | | 12/1/2029 | | CCC+ | | | 29,000 | | | 19,060,540 |
| Ascension Parish LA Pollutn Ctrl Borden Inc Pj | | 10.00% | | 12/1/2009 | | CCC | | | 16,500 | | | 11,340,780 |
| Brazos River TX Hrbr Nav Dist Dow Chemical Co Pj Ser A-3 AMT | | 5.125% | | 5/15/2033 | | BBB- | | | 2,000 | | | 1,792,020 |
| Brazos TX Hrbr Indl Dev Corp Dow Chemical Co Pj AMT | | 5.90% | | 5/1/2038 | | BBB- | | | 1,580 | | | 1,595,784 |
| Coshocton Cnty OH Envr Rev Smurfit Stone Container†(h) | | 5.125% | | 8/1/2013 | | D | | | 3,100 | | | 2,061,500 |
| Courtland AL Indl Dev Brd Solid Wst Disp Intl Paper Co Pjs A AMT | | 5.20% | | 6/1/2025 | | BBB | | | 9,545 | | | 8,916,462 |
| CT St Res Recovery Auth Rev Amer Fuel Co Pj Ser A AMT | | 6.45% | | 11/15/2022 | | BB+ | | | 3,530 | | | 3,530,106 |
| Gulf Coast Wst Disp Auth TX Ser A AMT | | 6.10% | | 8/1/2024 | | BBB | | | 1,000 | | | 1,000,300 |
| Houston TX Arpt Sys Rev Spl Facs Continental Airlines Ser C AMT | | 6.125% | | 7/15/2027 | | B3 | | | 3,120 | | | 2,669,410 |
| IL Fin Auth Sports Fac Leafs Hockey Club Pj Ser A | | 5.875% | | 3/1/2027 | | NR | | | 1,500 | | | 456,390 |
| IL Fin Auth Sports Fac Leafs Hockey Club Pj Ser A | | 6.00% | | 3/1/2037 | | NR | | | 1,450 | | | 440,307 |
| IL Fin Auth Sports Fac Utd Sports Org of Barrington Ser A† | | 6.125% | | 10/1/2027 | | NR | | | 1,475 | | | 986,804 |
| IL Fin Auth Sports Fac Utd Sports Org of Barrington Ser A† | | 6.25% | | 10/1/2037 | | NR | | | 6,525 | | | 4,145,920 |
| Jay ME Solid Wst Disp Rev Intl Paper Co Pj Ser A AMT | | 4.90% | | 11/1/2017 | | BBB | | | 2,890 | | | 2,700,069 |
| LA Loc Govt Envr Facs Cmnty Dev Auth Westlake Chemical Corp Pjs | | 6.75% | | 11/1/2032 | | BB | | | 12,500 | | | 12,341,000 |
| MI St Strategic Fd Ltd Pollutn Ctrl Gen Motors Corp(h) | | 6.20% | | 9/1/2020 | | NR | | | 5,000 | | | 737,500 |
| New York City NY Indl Dev Agy Amer Airlines JFK Intl Arpt AMT | | 7.625% | | 8/1/2025 | | B- | | | 23,300 | | | 23,737,108 |
| New York City NY Indl Dev Agy Amer Airlines JFK Intl Arpt AMT | | 8.00% | | 8/1/2028 | | B- | | | 2,000 | | | 2,086,120 |
| New York City NY Indl Dev Agy British Airways Plc Pj AMT | | 5.25% | | 12/1/2032 | | BB | | | 3,560 | | | 2,385,912 |
See Notes to Financial Statements.
140
Schedule of Investments (continued)
HIGH YIELD MUNICIPAL BOND FUND September 30, 2009
| | | | | | | | | | | | |
| Investments | | Interest
Rate | | Maturity
Date | | Credit
Rating:
S&P or
Moody’s(a) | | Principal
Amount
(000) | | Value |
| Corporate-Backed (continued) | | | | | | | | | | | | |
| New York City NY Indl Dev Agy JetBlue Airways Corp Pj AMT | | 5.00% | | 5/15/2020 | | B- | | $ | 2,900 | | $ | 2,435,043 |
| Nez Perce Cnty ID Pollutn Ctrl Potlatch Corp Pj | | 6.00% | | 10/1/2024 | | BB | | | 5,000 | | | 4,749,050 |
| NJ Econ Dev Auth Glimcher Pptys LP Pj AMT | | 6.00% | | 11/1/2028 | | NR | | | 5,035 | | | 3,572,886 |
| NJ Econ Dev Auth Spl Fac Continental Airlines Inc Pj AMT | | 5.50% | | 4/1/2028 | | B3 | | | 3,955 | | | 2,673,738 |
| NJ Econ Dev Auth Spl Fac Continental Airlines Inc Pj AMT | | 6.25% | | 9/15/2019 | | B | | | 5,325 | | | 5,049,325 |
| NJ Econ Dev Auth Spl Fac Continental Airlines Inc Pj AMT | | 6.25% | | 9/15/2029 | | B | | | 6,000 | | | 5,442,240 |
| NJ Econ Dev Auth Spl Fac Continental Airlines Inc Pj AMT | | 6.40% | | 9/15/2023 | | B | | | 4,060 | | | 3,817,618 |
| NJ Econ Dev Auth Spl Fac Continental Airlines Inc Pj AMT | | 7.20% | | 11/15/2030 | | B | | | 755 | | | 755,936 |
| OR St Econ Dev Rev GA Pacific Corp Pj Ser 183 AMT | | 5.70% | | 12/1/2025 | | B2 | | | 1,815 | | | 1,635,678 |
| Port of Bay City Auth TX Matagorda Hoechst Celanese Corp Pj AMT | | 6.50% | | 5/1/2026 | | B+ | | | 3,340 | | | 3,143,241 |
| Port of Corpus Christi Auth of Nueces Cnty TX Celanese Pj Ser A | | 6.45% | | 11/1/2030 | | B+ | | | 6,700 | | | 6,733,701 |
| Port of Corpus Christi Auth of Nueces Cnty TX Celanese Pj Ser B AMT | | 6.70% | | 11/1/2030 | | B+ | | | 1,500 | | | 1,400,760 |
| Richmond Cnty GA Dev Auth Intl Paper Co Pj Ser A AMT | | 5.00% | | 8/1/2030 | | BBB | | | 3,000 | | | 2,698,560 |
| Rockdale Cnty GA Dev Auth Visy Paper Pj Ser A AMT | | 6.125% | | 1/1/2034 | | NR | | | 2,500 | | | 2,046,800 |
| Rumford ME Solid Wst Disp Boise Cascade Corp Pj AMT | | 6.875% | | 10/1/2026 | | B2 | | | 1,500 | | | 807,630 |
| St. John Baptist Parish LA Rev Marathon Oil Corp Ser A | | 5.125% | | 6/1/2037 | | BBB+ | | | 4,400 | | | 4,226,948 |
| | | | | | | | | | | | |
| Total | | | | | | | | | | | | 154,901,493 |
| | | | | | | | | | | | |
| | | | | |
| Education 5.31% | | | | | | | | | | | | |
| CA Statewide Cmntys Dev Auth Sonoma Country Day Sch COP | | 6.00% | | 1/1/2029 | | NR | | | 6,550 | | | 5,061,840 |
| CA Statewide Cmntys Dev Auth Thomas Jefferson Sch Law Ser A | | 7.25% | | 10/1/2032 | | BB+ | | | 3,500 | | | 3,566,955 |
| Charyl Stockwell Academy MI COP | | 5.90% | | 10/1/2035 | | NR | | | 3,000 | | | 2,267,880 |
See Notes to Financial Statements.
141
Schedule of Investments (continued)
HIGH YIELD MUNICIPAL BOND FUND September 30, 2009
| | | | | | | | | | | | |
| Investments | | Interest
Rate | | Maturity
Date | | Credit
Rating:
S&P or
Moody’s(a) | | Principal
Amount
(000) | | Value |
| Education (continued) | | | | | | | | | | | | |
| CO Edl & Cultural Facs Auth Indpt Sch Vail Christian High Sch† | | 5.50% | | 6/1/2037 | | NR | | $ | 3,500 | | $ | 1,976,765 |
| Harrisburg PA Auth Univ Rev Harrisburg Univ of Science B | | 6.00% | | 9/1/2036 | | NR | | | 12,725 | | | 11,431,504 |
| IA Higher Ed Ln Auth Rev Private College Grand View | | 5.00% | | 10/1/2031 | | NR | | | 1,500 | | | 1,351,950 |
| IA Higher Ed Ln Auth Rev Private College Waldorf Ser A | | 5.00% | | 10/1/2034 | | NR | | | 1,000 | | | 510,000 |
| IL Fin Auth Rev IL Inst Tech | | 7.125% | | 2/1/2034 | | Baa2 | | | 2,500 | | | 2,705,725 |
| IL Fin Auth Rev IL Inst Tech Ser A | | 5.00% | | 4/1/2025 | | Baa2 | | | 2,500 | | | 2,355,875 |
| IL Fin Auth Rev IL Inst Tech Ser A | | 5.00% | | 4/1/2026 | | Baa2 | | | 2,000 | | | 1,863,740 |
| IL Fin Auth Rev IL Inst Tech Ser A | | 5.00% | | 4/1/2036 | | Baa2 | | | 3,000 | | | 2,593,770 |
| IL Fin Auth Rev Northwestern Mem Hosp Ser A(b) | | 5.75% | | 8/15/2030 | | AA+ | | | 5,000 | | | 5,493,500 |
| Lee Cnty FL Indl Dev Auth Lee Charter Fndtn Ser A | | 5.25% | | 6/15/2027 | | BB | | | 3,500 | | | 2,594,060 |
| MA St Dev Fin Agy Boston Architectural College (ACA) | | 5.00% | | 1/1/2037 | | NR | | | 2,710 | | | 1,862,420 |
| Marietta GA Dev Auth Rev Univ Facs Life Univ Inc Pj | | 7.00% | | 6/15/2030 | | Ba3 | | | 5,000 | | | 4,698,700 |
| Marietta GA Dev Auth Rev Univ Facs Life Univ Inc Pj | | 7.00% | | 6/15/2039 | | Ba3 | | | 3,000 | | | 2,762,250 |
| MI Higher Ed Facs Auth Rev Ltd Oblig Creative Studies | | 5.875% | | 12/1/2028 | | Baa3 | | | 2,360 | | | 2,055,112 |
| MI Higher Ed Facs Auth Rev Ltd Oblig Creative Studies | | 6.125% | | 12/1/2033 | | Baa3 | | | 3,075 | | | 2,692,347 |
| MI Pub Edl Facs Auth Rev Ltd Oblig Bradford Academy Pj | | 8.75% | | 9/1/2039 | | BBB- | | | 2,250 | | | 2,384,190 |
| New York City NY Indl Dev Agy Polytechnic Univ Pj (ACA) | | 5.25% | | 11/1/2037 | | BB+ | | | 2,000 | | | 1,858,780 |
| New York City NY Indl Dev Agy Vaughn College Aeronautics B | | 5.00% | | 12/1/2031 | | BB+ | | | 1,510 | | | 1,178,026 |
| New York City NY Indl Dev Agy Vaughn College Aeronautics B | | 5.25% | | 12/1/2036 | | BB+ | | | 3,640 | | | 2,866,464 |
| NJ St Edl Facs Auth Univ Med & Dentistry Ser B | | 7.125% | | 12/1/2023 | | Baa2 | | | 4,000 | | | 4,575,080 |
| NJ St Edl Facs Auth Univ Med & Dentistry Ser B | | 7.50% | | 12/1/2032 | | Baa2 | | | 2,000 | | | 2,286,680 |
| TX St Pub Fin Auth Charter Sch Ed Cosmos Fndtn Ser A | | 5.00% | | 2/15/2018 | | NR | | | 1,000 | | | 941,200 |
See Notes to Financial Statements.
142
Schedule of Investments (continued)
HIGH YIELD MUNICIPAL BOND FUND September 30, 2009
| | | | | | | | | | | | |
| Investments | | Interest
Rate | | Maturity
Date | | Credit
Rating:
S&P or
Moody’s(a) | | Principal
Amount
(000) | | Value |
| Education (continued) | | | | | | | | | | | | |
| Univ of CA Ser O(b) | | 5.75% | | 5/15/2031 | | AA | | $ | 7,000 | | $ | 8,061,375 |
| | | | | | | | | | | | |
| Total | | | | | | | | | | | | 81,996,188 |
| | | | | | | | | | | | |
| | | | | |
| General Obligation 6.94% | | | | | | | | | | | | |
| Alameda Cnty CA Oakland Unif Sch Dist Election 2006 Ser A | | 6.125% | | 8/1/2029 | | BBB+ | | | 1,500 | | | 1,609,110 |
| CA St Var Purp | | 5.00% | | 11/1/2032 | | A | | | 5,000 | | | 5,039,450 |
| CA St Var Purp | | 6.50% | | 4/1/2033 | | A | | | 15,000 | | | 17,409,300 |
| Los Angeles CA Cmnty College Dist 2001 Election Ser A (NPFGC)(FGIC)(b) | | 5.00% | | 8/1/2032 | | AA | | | 10,580 | | | 11,217,127 |
| Los Angeles CA Unif Sch Dist 2004 Election Ser H (FSA)(b) | | 5.00% | | 7/1/2032 | | AAA | | | 10,000 | | | 10,562,800 |
| Los Angeles CA Unif Sch Dist Ser D(b) | | 5.00% | | 1/1/2034 | | AA- | | | 10,460 | | | 10,942,101 |
| Los Angeles CA Unif Sch Dist Ser F(b) | | 5.00% | | 7/1/2029 | | AA- | | | 2,000 | | | 2,092,180 |
| New York City NY Ser H-1(b) | | 5.125% | | 3/1/2026 | | AA | | | 10,000 | | | 11,081,350 |
| New York City NY Sub Ser J-1(b) | | 5.00% | | 5/15/2029 | | AA | | | 9,000 | | | 9,680,895 |
| New York City NY Sub Ser J-1(b) | | 5.00% | | 5/15/2031 | | AA | | | 7,000 | | | 7,529,585 |
| New York City NY Sub Ser J-1(b) | | 5.00% | | 5/15/2036 | | AA | | | 1,000 | | | 1,075,655 |
| NY St Urban Dev Corp Rev St Pers Income Tax Ser A-1(b) | | 5.00% | | 12/15/2025 | | AAA | | | 3,730 | | | 4,139,677 |
| NY St Urban Dev Corp Rev St Pers Income Tax Ser A-1(b) | | 5.00% | | 12/15/2026 | | AAA | | | 5,420 | | | 6,015,294 |
| NY St Urban Dev Corp Rev St Pers Income Tax Ser A-1(b) | | 5.00% | | 12/15/2027 | | AAA | | | 2,160 | | | 2,397,239 |
| Territory of Guam Ser A | | 6.75% | | 11/15/2029 | | B+ | | | 3,690 | | | 4,031,842 |
| Territory of Guam Ser A | | 7.00% | | 11/15/2039 | | B+ | | | 2,175 | | | 2,384,583 |
| | | | | | | | | | | | |
| Total | | | | | | | | | | | | 107,208,188 |
| | | | | | | | | | | | |
| | | | | |
| Healthcare 28.91% | | | | | | | | | | | | |
| Allegheny Cnty PA Hosp Dev Auth Hlth Sys West PA Ser A | | 5.375% | | 11/15/2040 | | BB | | | 5,000 | | | 3,938,900 |
| Allegheny Cnty PA Hosp Dev Auth West PA Hlth Sys Ser A | | 5.00% | | 11/15/2028 | | BB | | | 9,000 | | | 7,182,720 |
| Alton IL Hosp Fac Rev St. Anthony’s Hlth Ctr | | 6.00% | | 9/1/2010 | | NR | | | 355 | | | 355,809 |
| Alton IL Hosp Fac Rev St. Anthony’s Hlth Ctr | | 6.00% | | 9/1/2014 | | NR | | | 1,620 | | | 1,620,486 |
| Arkansas KS Pub Bldg Commn South Cent Regl Med Ctr | | 6.75% | | 9/1/2038 | | Baa3 | | | 6,360 | | | 6,625,085 |
See Notes to Financial Statements.
143
Schedule of Investments (continued)
HIGH YIELD MUNICIPAL BOND FUND September 30, 2009
| | | | | | | | | | | | |
| Investments | | Interest
Rate | | Maturity
Date | | Credit
Rating:
S&P or
Moody’s(a) | | Principal
Amount
(000) | | Value |
| Healthcare (continued) | | | | | | | | | | | | |
| AZ Hlth Facs Auth Hlthcare Beatitudes Campus Pj | | 5.20% | | 10/1/2037 | | NR | | $ | 8,000 | | $ | 5,830,000 |
| AZ Univ Med Ctr Corp | | 6.25% | | 7/1/2029 | | BBB+ | | | 250 | | | 271,230 |
| AZ Univ Med Ctr Corp | | 6.50% | | 7/1/2039 | | BBB+ | | | 625 | | | 672,550 |
| Bremer Cnty IA Ret Bartels Lutheran Ser A | | 5.00% | | 11/15/2017 | | NR | | | 1,140 | | | 1,087,252 |
| Bucks Cnty PA Indl Dev Auth Ret Cmnty Ann’s Choice Inc Fac Ser A | | 6.125% | | 1/1/2025 | | NR | | | 3,500 | | | 3,299,660 |
| CA Hlth Facs Fing Auth Cedars Sinai Med Ctr | | 5.00% | | 11/15/2034 | | A2 | | | 3,400 | | | 3,307,146 |
| CA Muni Fin Auth Cmnty Hosps Cent CA COP(d) | | 5.50% | | 2/1/2039 | | Baa2 | | | 7,000 | | | 7,009,520 |
| CA Statewide Cmntys Dev Auth Daughters of Charity Hlth Ser A | | 5.25% | | 7/1/2030 | | BBB | | | 3,020 | | | 2,739,684 |
| CA Statewide Cmntys Dev Auth Daughters of Charity Hlth Ser A | | 5.25% | | 7/1/2035 | | BBB | | | 3,575 | | | 3,186,826 |
| CA Statewide Cmntys Dev Auth Henry Mayo Newhall Mem Hosp | | 5.00% | | 10/1/2037 | | A | | | 1,000 | | | 977,880 |
| CA Statewide Cmntys Dev Auth Sr Living Sthn CA | | 7.00% | | 11/15/2029 | | BBB | | | 1,000 | | | 1,071,770 |
| CA Statewide Cmntys Dev Auth Sr Living Sthn CA | | 7.25% | | 11/15/2041 | | BBB | | | 2,500 | | | 2,696,750 |
| CA Statewide Cmntys Dev Auth Vlycare Hlth Sys Ser A | | 5.00% | | 7/15/2022 | | NR | | | 2,270 | | | 1,919,240 |
| CO Hlth Facs Auth Rev Christian Living Cmntys Pj A | | 5.75% | | 1/1/2026 | | NR | | | 1,000 | | | 877,090 |
| CO Hlth Facs Auth Rev Christian Living Cmntys Pj A | | 5.75% | | 1/1/2037 | | NR | | | 2,055 | | | 1,663,892 |
| CO Hlth Facs Auth Rev Evangelical Lutheran Ser A | | 6.125% | | 6/1/2038 | | A- | | | 1,000 | | | 1,030,650 |
| CO Hlth Facs Auth Rev Hlth & Resdl Care Facs Volunteers of America Care A | | 5.30% | | 7/1/2037 | | NR | | | 1,500 | | | 999,225 |
| Cottage Grove MN Sr Hsg Rev PHS/Cottage Grove Inc Pj B | | 6.00% | | 12/1/2046 | | NR | | | 2,325 | | | 2,074,016 |
| CT St Hlth & Edl Facs Auth Hosp for Spl Care Ser C (RADIAN) | | 5.25% | | 7/1/2022 | | BBB- | | | 1,215 | | | 1,186,241 |
| Cuyahoga Cnty OH Hlthcare & Indpt Living Fac Eliza Jennings Sr Care Ser A | | 6.00% | | 5/15/2037 | | NR | | | 4,300 | | | 3,423,187 |
| Cuyahoga Cnty OH Hlthcare & Indpt Living Fac Eliza Jennings Sr Care Ser A | | 6.00% | | 5/15/2042 | | NR | | | 2,500 | | | 1,932,450 |
See Notes to Financial Statements.
144
Schedule of Investments (continued)
HIGH YIELD MUNICIPAL BOND FUND September 30, 2009
| | | | | | | | | | | | |
| Investments | | Interest
Rate | | Maturity
Date | | Credit
Rating:
S&P or
Moody’s(a) | | Principal
Amount
(000) | | Value |
| Healthcare (continued) | | | | | | | | | | | | |
| Director St NV Dept Business & Industry Las Ventanas Ret Pj A | | 7.00% | | 11/15/2034 | | NR | | $ | 6,000 | | $ | 3,583,020 |
| Director St NV Dept Business & Industry Las Ventanas Ret Pj B | | 6.00% | | 11/15/2014 | | NR | | | 4,105 | | | 2,736,516 |
| Director St NV Dept Business & Industry Las Ventanas Ret Pj B | | 6.75% | | 11/15/2023 | | NR | | | 4,700 | | | 2,912,402 |
| East Rochester NY Hsg Auth Rev Sr Living Woodland Vlg Pj | | 5.50% | | 8/1/2033 | | NR | | | 1,700 | | | 1,343,799 |
| Fairfax Cnty VA Indl Dev Auth Hlthcare Inova Hlth Sys Ser A(b) | | 5.50% | | 5/15/2035 | | AA+ | | | 5,000 | | | 5,425,525 |
| Fulton Cnty GA Resdl Care Facs First Mtg Lenbrook Pj Ser A | | 5.125% | | 7/1/2042 | | NR | | | 8,000 | | | 5,208,640 |
| Fulton Cnty PA Indl Dev Auth Hosp Fulton Cnty Med Ctr Pj | | 5.875% | | 7/1/2031 | | NR | | | 1,500 | | | 1,284,540 |
| Greenwood Cnty SC Hosp Rev Self Regl Hlthcare | | 5.375% | | 10/1/2039 | | A | | | 2,000 | | | 2,061,560 |
| Harris Cnty TX Cultural Ed Facs Fin Corp Childrens Hosp Pj(b) | | 5.00% | | 10/1/2024 | | AA | | | 6,000 | | | 6,365,970 |
| Harris Cnty TX Cultural Ed Facs Fin Corp Childrens Hosp Pj(b) | | 5.25% | | 10/1/2029 | | AA | | | 4,000 | | | 4,243,980 |
| HFDC Cent TX Inc Ret Fac Ser A | | 5.625% | | 11/1/2026 | | NR | | | 1,850 | | | 1,476,670 |
| HFDC Cent TX Inc Ret Fac Ser A | | 5.75% | | 11/1/2036 | | NR | | | 3,750 | | | 2,796,638 |
| Hillsborough Cnty FL Indl Dev Auth Tampa Gen Hosp Pj(b) | | 5.25% | | 10/1/2041 | | A3 | | | 5,000 | | | 4,719,650 |
| Hillsdale MI Hosp Fin Auth Hosp Hillsdale Cmnty Hlth Ctr | | 5.75% | | 5/15/2018 | | BB+ | | | 2,360 | | | 2,389,901 |
| Holmes Cnty FL Hosp Corp Doctors Mem Hosp | | 5.75% | | 11/1/2026 | | NR | | | 6,615 | | | 5,919,300 |
| Holmes Cnty FL Hosp Corp Doctors Mem Hosp | | 6.00% | | 11/1/2038 | | NR | | | 7,115 | | | 6,110,931 |
| Howard Cnty MD Ret Cmnty Vantage Hse Fac Ser A | | 5.25% | | 4/1/2027 | | NR | | | 1,500 | | | 1,258,845 |
| Huntsville-Redstone Vlg AL Spl Care Facs Fing Auth Redstone Vlg Pj | | 5.50% | | 1/1/2028 | | NR | | | 4,500 | | | 3,643,335 |
| IA Fin Auth Hlth Facs Rev Ser A Remk (AG)(b) | | 5.25% | | 8/15/2029 | | Aa2 | | | 3,000 | | | 3,262,260 |
| IA Fin Auth Hlth Facs Rev Ser A Remk (AG)(b) | | 5.625% | | 8/15/2037 | | Aa2 | | | 7,000 | | | 7,611,940 |
| IA Fin Auth Sr Hsg Rev Bethany Life Cmntys Pj Ser A | | 5.55% | | 11/1/2041 | | NR | | | 1,000 | | | 711,500 |
See Notes to Financial Statements.
145
Schedule of Investments (continued)
HIGH YIELD MUNICIPAL BOND FUND September 30, 2009
| | | | | | | | | | | | | |
| Investments | | Interest
Rate | | Maturity
Date | | Credit
Rating:
S&P or
Moody’s(a) | | | Principal
Amount
(000) | | Value |
| Healthcare (continued) | | | | | | | | | | | | | |
| IL Fin Auth Rev Clare at Wtr Tower Pj Ser A | | 5.20% | | 5/15/2012 | | NR | | | $ | 1,000 | | $ | 554,010 |
| IL Fin Auth Rev Clare at Wtr Tower Pj Ser A | | 5.30% | | 5/15/2013 | | NR | | | | 1,000 | | | 553,340 |
| IL Fin Auth Rev Clare at Wtr Tower Pj Ser A | | 6.00% | | 5/15/2025 | | NR | | | | 4,000 | | | 2,213,240 |
| IL Fin Auth Rev Clare at Wtr Tower Pj Ser A | | 6.125% | | 5/15/2038 | | NR | | | | 5,000 | | | 2,767,850 |
| IL Fin Auth Rev Clare at Wtr Tower Pj Ser C | | 5.125% | | 5/15/2012 | | NR | | | | 5,000 | | | 2,770,100 |
| IL Fin Auth Rev Clare Oaks Pj Ser A | | 6.00% | | 11/15/2027 | | NR | | | | 8,000 | | | 6,278,080 |
| IL Fin Auth Rev Edward Hosp Ser A Rmkt (AMBAC) | | 6.25% | | 2/1/2033 | | A+ | | | | 500 | | | 550,660 |
| IL Fin Auth Rev Friendship Vlg Schaumburg Ser A | | 5.375% | | 2/15/2025 | | BB- | (c) | | | 4,000 | | | 3,295,440 |
| IL Fin Auth Rev Friendship Vlg Schaumburg Ser A | | 5.625% | | 2/15/2037 | | BB- | (c) | | | 4,000 | | | 3,050,720 |
| IL Fin Auth Rev Kewanee Hosp Pj | | 5.10% | | 8/15/2031 | | NR | | | | 1,175 | | | 927,945 |
| IL Fin Auth Rev Landing at Plymouth Place Pj Ser A | | 6.00% | | 5/15/2025 | | NR | | | | 3,000 | | | 2,650,080 |
| IL Fin Auth Rev Montgomery Place Pj Ser A | | 5.50% | | 5/15/2026 | | NR | | | | 2,400 | | | 1,917,192 |
| IL Fin Auth Rev Rush Univ Med Ctr Oblig Grp Ser A | | 7.25% | | 11/1/2030 | | A- | | | | 3,000 | | | 3,468,390 |
| IL Fin Auth Rev Smith Vlg Pj Ser A | | 5.25% | | 11/15/2016 | | NR | | | | 4,290 | | | 3,903,814 |
| IL Fin Auth Rev Three Crowns Pk Plaza Ser A | | 5.875% | | 2/15/2038 | | NR | | | | 4,500 | | | 3,811,275 |
| IN Hlth & Edl Facs Fing Auth Cmnty Fndtn Northwest | | 5.50% | | 3/1/2037 | | BBB | | | | 5,000 | | | 5,027,200 |
| Iron River MI Hosp Fin Auth Iron Cnty Cmnty Hosps | | 6.50% | | 5/15/2033 | | NR | | | | 3,000 | | | 2,778,900 |
| Jacksonville FL Hlth Facs Auth Brooks Hlth Sys | | 5.25% | | 11/1/2038 | | A | | | | 3,675 | | | 3,638,213 |
| Johnson TN Hlth & Edl Facs Brd 1st Mtg Mtn Sts Hlth Ser A | | 5.50% | | 7/1/2036 | | BBB+ | | | | 2,800 | | | 2,788,072 |
| Johnston NC Mem Hosp Auth (FSA FHA)(b) | | 5.25% | | 10/1/2036 | | AAA | | | | 7,000 | | | 7,408,800 |
| Knox Cnty TN Hlth Edl & Hsg Facs Brd Baptist Hlth Sys East TN | | 6.375% | | 4/15/2022 | | A1 | | | | 4,215 | | | 4,433,253 |
| Knox Cnty TN Hlth Edl & Hsg Facs Brd Baptist Hlth Sys East TN | | 6.50% | | 4/15/2031 | | A1 | | | | 5,955 | | | 6,219,997 |
| Kuakini HI Hlth Sys Spl Fac Ser A | | 6.375% | | 7/1/2032 | | BBB- | | | | 5,930 | | | 5,876,571 |
| Lehigh Cnty PA Gen Purp Auth Good Shepherd Grp Ser A | | 5.625% | | 11/1/2034 | | A | | | | 4,000 | | | 4,058,760 |
| Lexington VA Indl Dev Auth Resdl Care Fac Mtg Kendal at Lexington Ser A | | 5.50% | | 1/1/2037 | | NR | | | | 1,750 | | | 1,382,920 |
See Notes to Financial Statements.
146
Schedule of Investments (continued)
HIGH YIELD MUNICIPAL BOND FUND September 30, 2009
| | | | | | | | | | | | | |
| Investments | | Interest
Rate | | Maturity
Date | | Credit
Rating:
S&P or
Moody’s(a) | | | Principal
Amount
(000) | | Value |
| Healthcare (continued) | | | | | | | | | | | | | |
| Louisville & Jefferson Cnty KY Metro Govt Norton Hlthcare Inc(b) | | 5.25% | | 10/1/2036 | | A- | | | $ | 23,750 | | $ | 23,614,150 |
| Lubbock TX Hlth Facs Dev Corp 1st Mtg Carillon Pj A | | 6.30% | | 7/1/2019 | | NR | | | | 4,010 | | | 3,846,352 |
| MA St Hlth & Edl Facs Auth UMass Mem Issue Ser D | | 5.25% | | 7/1/2025 | | BBB+ | | | | 8,560 | | | 8,614,014 |
| MD St Hlth & Higher Edl Facs Auth Washington Cnty Hosp | | 5.75% | | 1/1/2033 | | BBB- | | | | 1,035 | | | 1,059,426 |
| MD St Hlth & Higher Edl Facs Auth Washington Cnty Hosp | | 6.00% | | 1/1/2028 | | BBB- | | | | 1,280 | | | 1,346,048 |
| Mesquite TX Hlth Facs Dev Corp Ret Fac Christian Care | | 5.50% | | 2/15/2025 | | BBB- | | | | 3,250 | | | 2,963,383 |
| Mesquite TX Hlth Facs Dev Corp Ret Fac Christian Care | | 5.625% | | 2/15/2035 | | BBB- | | | | 1,650 | | | 1,415,271 |
| MI St Hosp Fin Auth Rev Presbyterian Vlg | | 5.25% | | 11/15/2025 | | BB+ | (c) | | | 3,800 | | | 2,972,056 |
| MI St Hosp Fin Auth Rev Presbyterian Vlg | | 5.50% | | 11/15/2035 | | BB+ | (c) | | | 1,000 | | | 744,140 |
| NH Hlth & Ed Facs Auth Havenwood Heritage Heights A | | 5.35% | | 1/1/2026 | | NR | | | | 1,380 | | | 1,234,838 |
| NH Hlth & Ed Facs Auth Havenwood Heritage Heights A | | 5.40% | | 1/1/2030 | | NR | | | | 1,500 | | | 1,288,440 |
| NJ Econ Dev Auth First Mtg Seashore Gardens Pj | | 5.30% | | 11/1/2026 | | NR | | | | 1,250 | | | 979,513 |
| NJ Econ Dev Auth First Mtg Seashore Gardens Pj | | 5.375% | | 11/1/2036 | | NR | | | | 2,605 | | | 1,919,989 |
| NJ Hlthcare Facs Fing Auth Holy Name Hosp | | 5.25% | | 7/1/2030 | | Baa2 | | | | 16,885 | | | 14,989,321 |
| NJ Hlthcare Facs Fing Auth St. Joseph’s Hlthcare Sys | | 6.625% | | 7/1/2038 | | BBB- | | | | 3,500 | | | 3,603,530 |
| NM St Hosp Equip Ln Council Presbyterian Hlthcare(b) | | 5.00% | | 8/1/2039 | | AA- | | | | 9,100 | | | 9,208,108 |
| North Cent TX Hlth Fac Dev Corp Children’s Med Ctr Dallas Pj(b) | | 5.75% | | 8/15/2039 | | Aa3 | | | | 10,000 | | | 10,645,250 |
| Northampton Cnty PA Gen Purp Auth St. Luke’s Hosp Pj Ser A | | 5.25% | | 8/15/2024 | | BBB+ | | | | 1,210 | | | 1,228,767 |
| Northampton Cnty PA Gen Purp Auth St. Luke’s Hosp Pj Ser A | | 5.375% | | 8/15/2028 | | BBB+ | | | | 1,675 | | | 1,682,504 |
| NY St Dorm Auth Rev Non St Supp Debt Orange Regl Med Ctr | | 6.125% | | 12/1/2029 | | Ba1 | | | | 4,250 | | | 3,937,285 |
| OH St Higher Edl Fac Commn Univ Hosp Hlth Sys Ser 2009-A | | 6.75% | | 1/15/2039 | | A | | | | 5,000 | | | 5,298,800 |
See Notes to Financial Statements.
147
Schedule of Investments (continued)
HIGH YIELD MUNICIPAL BOND FUND September 30, 2009
| | | | | | | | | | | | |
| Investments | | Interest
Rate | | Maturity
Date | | Credit
Rating:
S&P or
Moody’s(a) | | Principal
Amount
(000) | | Value |
| Healthcare (continued) | | | | | | | | | | | | |
| OH St Hosp Fac Rev Cleveland Clinic Hlth B(b) | | 5.50% | | 1/1/2034 | | AA- | | $ | 13,500 | | $ | 13,955,625 |
| Orange Cnty FL Hlth Facs Auth Hlthcare Orlando Lutheran | | 5.375% | | 7/1/2020 | | NR | | | 1,100 | | | 952,985 |
| Orange Cnty FL Hlth Facs Auth Hlthcare Orlando Lutheran | | 5.70% | | 7/1/2026 | | NR | | | 1,920 | | | 1,577,472 |
| Philadelphia PA Hosps & Higher Ed Facs Auth Temple Univ Hlth Sys Ser B | | 5.50% | | 7/1/2026 | | BBB | | | 3,000 | | | 2,791,710 |
| Philadelphia PA Hosps & Higher Ed Facs Auth Temple Univ Hosp Sys Ser A | | 6.625% | | 11/15/2023 | | BBB | | | 9,000 | | | 9,005,040 |
| RI St Hlth & Edl Bldg Corp Hosp Fing St. Joseph Hlth Svcs | | 5.50% | | 10/1/2029 | | BB- | | | 15,270 | | | 11,767,978 |
| Sarasota Cnty FL Hlth Facs Auth Hlthcare Sarasota Manatee | | 5.75% | | 7/1/2037 | | NR | | | 2,565 | | | 2,058,823 |
| Sarasota Cnty FL Hlth Facs Auth Hlthcare Sarasota Manatee | | 5.75% | | 7/1/2045 | | NR | | | 6,435 | | | 5,027,794 |
| Sayre OK Mem Hosp Auth | | 6.00% | | 7/1/2037 | | NR | | | 4,000 | | | 3,347,600 |
| SC Jobs Econ Dev Auth First Mtg Wesley Commons | | 5.125% | | 10/1/2026 | | NR | | | 1,400 | | | 1,092,560 |
| SC Jobs Econ Dev Auth Hampton Regl Med | | 5.25% | | 11/1/2028 | | NR | | | 12,000 | | | 9,487,920 |
| St. Joseph Cnty IN Econ Dev Rev Holy Cross Vlg Notre Dame Pj A | | 5.70% | | 5/15/2028 | | NR | | | 265 | | | 212,125 |
| St. Joseph Cnty IN Econ Dev Rev Holy Cross Vlg Notre Dame Pj A | | 6.00% | | 5/15/2026 | | NR | | | 250 | | | 211,030 |
| St. Joseph Cnty IN Econ Dev Rev Holy Cross Vlg Notre Dame Pj A | | 6.00% | | 5/15/2038 | | NR | | | 475 | | | 380,328 |
| St. Paul MN Port Auth Lease Rev Healtheast Midway Campus 03 A | | 5.75% | | 5/1/2025 | | BB | | | 1,520 | | | 1,405,103 |
| Sullivan Cnty TN Hlth Edl & Hsg Facs Brd Wellmont Hlth Sys Pj Ser C | | 5.25% | | 9/1/2036 | | BBB+ | | | 8,750 | | | 7,168,000 |
| Sylacauga AL Hlthcare Auth Coosa Vly Med Ctr Ser A | | 6.00% | | 8/1/2025 | | NR | | | 3,000 | | | 2,594,250 |
| Sylacauga AL Hlthcare Auth Coosa Vly Med Ctr Ser A | | 6.00% | | 8/1/2035 | | NR | | | 3,000 | | | 2,383,890 |
| Vigo Cnty IN Hosp Auth Rev Union Hosp Inc† | | 5.70% | | 9/1/2037 | | NR | | | 8,000 | | | 6,507,280 |
| Vigo Cnty IN Hosp Auth Rev Union Hosp Inc† | | 5.75% | | 9/1/2042 | | NR | | | 2,000 | | | 1,621,580 |
| Western IL Econ Dev Auth Carthage Mem Hosp Pj Ser B | | 7.00% | | 6/1/2033 | | NR | | | 2,890 | | | 2,863,268 |
See Notes to Financial Statements.
148
Schedule of Investments (continued)
HIGH YIELD MUNICIPAL BOND FUND September 30, 2009
| | | | | | | | | | | | | | |
| Investments | | Interest
Rate | | | Maturity
Date | | Credit
Rating:
S&P or
Moody’s(a) | | | Principal
Amount
(000) | | Value |
| Healthcare (continued) | | | | | | | | | | | | | | |
| Westmoreland Cnty PA Indl Dev Auth Ret Cmnty Redstone Ser A | | 5.75% | | | 1/1/2026 | | NR | | | $ | 900 | | $ | 774,558 |
| WI St Hlth & Edl Facs Auth St. John’s Cmntys Inc Ser A(d) | | 7.25% | | | 9/15/2029 | | NR | | | | 1,000 | | | 1,004,850 |
| WI St Hlth & Edl Facs Auth St. John’s Cmntys Inc Ser A(d) | | 7.625% | | | 9/15/2039 | | NR | | | | 2,000 | | | 2,067,960 |
| WI St Hlth & Edl Facs Auth Wheaton Hlthcare Ser B | | 5.125% | | | 8/15/2030 | | BBB+ | | | | 21,150 | | | 19,149,210 |
| Wilson Cnty KS Hosp Rev | | 5.60% | | | 9/1/2036 | | NR | | | | 3,530 | | | 2,938,301 |
| WV St Hosp Fin Auth Thomas Hlth Sys | | 6.50% | | | 10/1/2028 | | NR | | | | 7,425 | | | 7,143,518 |
| | | | | | | | | | | | | | |
| Total | | | | | | | | | | | | | | 446,452,946 |
| | | | | | | | | | | | | | |
| | | | | |
| Housing 3.78% | | | | | | | | | | | | | | |
| CA Hsg Fin Agy Rev Ser J AMT | | 4.95% | | | 8/1/2022 | | AA- | | | | 2,000 | | | 1,880,460 |
| El Paso Cnty TX Hsg Fin Corp Multi Fam Hsg Rev Las Lomas Apts Ser A | | 5.60% | | | 12/1/2009 | | B3 | | | | 55 | | | 55,023 |
| El Paso Cnty TX Hsg Fin Corp Multi Fam Hsg Rev Las Lomas Apts Ser A | | 6.375% | | | 12/1/2029 | | B3 | | | | 3,280 | | | 2,497,425 |
| El Paso Cnty TX Hsg Fin Corp Multi Fam Hsg Rev Las Lomas Apts Ser A | | 6.45% | | | 12/1/2019 | | B3 | | | | 1,515 | | | 1,315,581 |
| Gaithersburg MD Econ Dev Rev Asbury MD Oblig Grp A(b) | | 5.125% | | | 1/1/2036 | | BBB- | (c) | | | 10,700 | | | 8,541,061 |
| Harrisonburg VA Redev & Hsg Auth Multi Fam Hsg Brooke Ridge Apts Pj Ser E AMT | | 6.475% | | | 12/1/2038 | | NR | | | | 12,100 | | | 10,561,485 |
| LA Hsg Fin Agy Multi Fam Hsg Ser B | | 8.00% | | | 9/1/2039 | | BBB- | | | | 3,500 | | | 3,597,300 |
| LA Pub Facs Auth Rev Susla Facs Inc Pj Ser A† | | 5.75% | | | 7/1/2039 | | NR | | | | 5,100 | | | 3,702,090 |
| LA St Gas & Fuels Tax Rev Ser A (NPFGC)(FGIC)(b) | | 5.00% | | | 5/1/2041 | | AA | | | | 13,500 | | | 13,933,012 |
| Metro Govt Nashville & Davidson Cnty TN Hlth & Edl Facs Brd Multi Fam Hsg Prestige A | | 7.50% | | | 12/20/2040 | | NR | | | | 3,930 | | | 2,664,422 |
| Middlesex Cnty NJ Impt Auth Sub Heldrich Ctr Hotel Ser B | | 6.125% | | | 1/1/2025 | | NR | | | | 2,790 | | | 591,815 |
| MuniMae TE Bd Subs LLC†(i) | | 5.30% | | | 9/30/2015 | | Baa2 | | | | 2,000 | | | 1,392,000 |
| MuniMae TE Bd Subs LLC†(i) | | 5.90% | | | 9/30/2015 | | Ba1 | | | | 2,000 | | | 1,041,820 |
| Stillwater MN Multi Fam Rev Hsg Orleans Homes LP Pj AMT | | 5.50% | | | 2/1/2042 | | NR | | | | 500 | | | 360,900 |
| WI Hsg & Econ Dev Auth Ser C AMT | | 6.25% | # | | 10/1/2048 | | Aa3 | | | | 6,315 | | | 6,315,000 |
| | | | | | | | | | | | | | |
| Total | | | | | | | | | | | | | | 58,449,394 |
| | | | | | | | | | | | | | |
See Notes to Financial Statements.
149
Schedule of Investments (continued)
HIGH YIELD MUNICIPAL BOND FUND September 30, 2009
| | | | | | | | | | | | | |
| Investments | | Interest
Rate | | Maturity
Date | | Credit
Rating:
S&P or
Moody’s(a) | | | Principal
Amount
(000) | | Value |
| Lease Obligations 2.34% | | | | | | | | | | | | | |
| CA St Pub Wrks Brd Regents Univ Ser E(b) | | 5.00% | | 4/1/2034 | | AA- | | | $ | 7,495 | | $ | 7,739,950 |
| Charlotte NC COP Ser E(b) | | 5.00% | | 6/1/2034 | | AA+ | | | | 3,000 | | | 3,207,255 |
| Charlotte NC COP Ser E(b) | | 5.00% | | 6/1/2039 | | AA+ | | | | 8,500 | | | 9,087,223 |
| McLennan Cnty TX Pub Fac Corp | | 6.625% | | 6/1/2035 | | AA- | | | | 5,000 | | | 5,553,950 |
| Philadelphia PA Muni Auth Rev Lease | | 6.10% | | 4/1/2024 | | Baa1 | | | | 1,780 | | | 1,907,039 |
| Philadelphia PA Muni Auth Rev Lease | | 6.375% | | 4/1/2029 | | Baa1 | | | | 2,000 | | | 2,129,540 |
| Puerto Rico Pub Bldgs Auth Rev Govt Facs Ser P GTD | | 6.50% | | 7/1/2030 | | BBB- | | | | 6,000 | | | 6,433,080 |
| | | | | | | | | | | | | |
| Total | | | | | | | | | | | | | 36,058,037 |
| | | | | | | | | | | | | |
| | | | | |
| Other Revenue 13.44% | | | | | | | | | | | | | |
| AK Indl Dev & Export Auth Sports Facs Rev Anchorage Sportsplex Pj Ser A | | 6.15% | | 8/1/2031 | | NR | | | | 3,285 | | | 2,024,020 |
| Baker FL Correctional Dev Corp 1st Mtg Rev Detention Ctr Pj | | 7.50% | | 2/1/2030 | | NR | | | | 8,300 | | | 7,538,973 |
| Baltimore MD Cnvtn Ctr Sr Ser A (XLCA) | | 5.00% | | 9/1/2032 | | Baa3 | | | | 500 | | | 433,680 |
| Baltimore MD Cnvtn Ctr Sr Ser A (XLCA) | | 5.25% | | 9/1/2039 | | Baa3 | | | | 2,000 | | | 1,755,020 |
| Baltimore MD Convtn Ctr Sub Ser B | | 5.875% | | 9/1/2039 | | Ba1 | | | | 8,345 | | | 7,083,236 |
| Baytown Twp MN Rev St. Croix Prep Academy Pj Ser A | | 6.75% | | 8/1/2028 | | NR | | | | 1,000 | | | 905,320 |
| Baytown Twp MN Rev St. Croix Prep Academy Pj Ser A | | 7.00% | | 8/1/2038 | | NR | | | | 1,500 | | | 1,342,560 |
| Beauregard Parish LA Rev Boise Cascade Corp Pj | | 6.80% | | 2/1/2027 | | Ba3 | | | | 4,750 | | | 2,612,595 |
| Brazos River Auth TX Pollutn Ctrl TXU Elec Co Pj Ser C AMT | | 5.75% | | 5/1/2036 | | CCC | | | | 2,215 | | | 1,899,274 |
| Brazos River Auth TX Pollutn Ctrl TXU Enrg Co LLC Pj Ser A AMT | | 6.75% | | 4/1/2038 | | CCC | | | | 1,790 | | | 1,295,656 |
| Brazos River Auth TX Pollutn Ctrl TXU Enrg Co LLC Pj Ser B AMT | | 6.30% | | 7/1/2032 | | CCC | | | | 2,000 | | | 1,000,780 |
| CA Muni Fin Auth High Tech High Chula Vista B† | | 6.125% | | 7/1/2038 | | BB+ | (c) | | | 1,250 | | | 982,987 |
| CA Statewide Cmntys Dev Auth Huntington Pk Charter Sch Pj A | | 5.15% | | 7/1/2030 | | NR | | | | 1,640 | | | 1,188,639 |
| CA Statewide Cmntys Dev Auth Huntington Pk Charter Sch Pj A | | 5.25% | | 7/1/2042 | | NR | | | | 1,500 | | | 1,013,715 |
| CA Statewide Cmntys Dev Auth Windrush Sch | | 5.50% | | 7/1/2037 | | NR | | | | 1,000 | | | 766,860 |
| Charyl Stockwell Academy MI COP | | 5.75% | | 10/1/2025 | | NR | | | | 4,130 | | | 3,344,474 |
See Notes to Financial Statements.
150
Schedule of Investments (continued)
HIGH YIELD MUNICIPAL BOND FUND September 30, 2009
| | | | | | | | | | | | |
| Investments | | Interest
Rate | | Maturity
Date | | Credit
Rating:
S&P or
Moody’s(a) | | Principal
Amount
(000) | | Value |
| Other Revenue (continued) | | | | | | | | | | | | |
| Chester Cnty PA Indl Dev Auth Renaissance Academy Pj A | | 5.625% | | 10/1/2015 | | NR | | $ | 1,870 | | $ | 1,768,609 |
| Chula Vista CA Rev San Diego Gas Ser E Rmkt | | 5.875% | | 1/1/2034 | | Aa3 | | | 2,125 | | | 2,260,851 |
| CO Edl & Cultural Facs Auth Charter Sch Cmnty Leadership | | 6.50% | | 7/1/2038 | | NR | | | 1,065 | | | 902,769 |
| CO Edl & Cultural Facs Auth New Vision Charter Pj Sch† | | 6.75% | | 4/1/2040 | | NR | | | 930 | | | 794,267 |
| Conner Creek Academy East MI Pub Sch | | 5.25% | | 11/1/2036 | | BB+ | | | 1,000 | | | 729,090 |
| Denver CO Convtn Ctr Hotel Auth Sr (XLCA) | | 5.00% | | 12/1/2035 | | BBB- | | | 3,300 | | | 2,734,908 |
| Denver CO Convtn Ctr Hotel Auth Sr (XLCA) | | 5.125% | | 12/1/2026 | | BBB- | | | 3,390 | | | 3,074,662 |
| Detroit MI Cmnty High Sch Pub Sch Academy | | 5.65% | | 11/1/2025 | | BB | | | 1,000 | | | 785,650 |
| Detroit MI Cmnty High Sch Pub Sch Academy | | 5.75% | | 11/1/2030 | | BB | | | 1,255 | | | 943,835 |
| Doctor Charles Drew Academy MI COP | | 5.70% | | 11/1/2036 | | NR | | | 1,665 | | | 1,140,359 |
| FL Dev Fin Corp Rev Palm Bay Academy Inc Pj A | | 6.00% | | 5/15/2036 | | BB- | | | 2,000 | | | 1,563,600 |
| FL Dev Fin Corp Rev Palm Bay Academy Inc Pj A | | 6.125% | | 5/15/2037 | | BB- | | | 1,855 | | | 1,485,354 |
| IA Fin Auth Child Svcs | | 5.375% | | 6/1/2026 | | NR | | | 1,795 | | | 1,406,795 |
| IAH TX Pub Fac Corp Pj Rev | | 6.00% | | 5/1/2016 | | NR | | | 965 | | | 907,544 |
| IAH TX Pub Fac Corp Pj Rev | | 6.00% | | 5/1/2021 | | NR | | | 2,000 | | | 1,753,620 |
| IAH TX Pub Fac Corp Pj Rev | | 6.125% | | 5/1/2026 | | NR | | | 1,635 | | | 1,362,658 |
| Kansas City MO Indl Dev Auth Allen Vlg Sch Pj Ser A† | | 6.125% | | 8/1/2026 | | NR | | | 1,550 | | | 1,334,751 |
| Kansas City MO Indl Dev Auth Allen Vlg Sch Pj Ser A† | | 6.25% | | 8/1/2036 | | NR | | | 2,815 | | | 2,313,592 |
| Kansas City MO Indl Dev Auth Derrick Thomas Ser A† | | 5.875% | | 1/1/2037 | | NR | | | 6,570 | | | 5,204,557 |
| La Vernia TX Higher Ed Fin Corp Amigos Por Vida Friends Life | | 6.25% | | 2/15/2026 | | NR | | | 1,000 | | | 868,780 |
| La Vernia TX Higher Ed Fin Corp Amigos Por Vida Friends Life | | 6.375% | | 2/15/2037 | | NR | | | 1,220 | | | 1,017,321 |
| La Vernia TX Higher Ed Fin Corp Ser A | | 7.125% | | 2/15/2038 | | NR | | | 6,515 | | | 6,605,233 |
| Lee Cnty FL Indl Dev Auth Lee Charter Fndtn Ser A | | 5.375% | | 6/15/2037 | | BB | | | 3,500 | | | 2,449,790 |
| Lombard IL Pub Facs Corp 1st Tier Ser A-1 | | 7.125% | | 1/1/2036 | | NR | | | 8,500 | | | 7,421,435 |
See Notes to Financial Statements.
151
Schedule of Investments (continued)
HIGH YIELD MUNICIPAL BOND FUND September 30, 2009
| | | | | | | | | | | | |
| Investments | | Interest
Rate | | Maturity
Date | | Credit
Rating:
S&P or
Moody’s(a) | | Principal
Amount
(000) | | Value |
| Other Revenue (continued) | | | | | | | | | | | | |
| Madison Cnty FL Rev 1st Mtg Twin Oaks Pj Ser A | | 6.00% | | 7/1/2025 | | NR | | $ | 1,150 | | $ | 915,481 |
| Maverick Cnty TX Pub Fac Corp Ser A-1 | | 6.25% | | 2/1/2024 | | NR | | | 4,810 | | | 4,298,601 |
| Maverick Cnty TX Pub Fac Corp Ser A-1 | | 6.375% | | 2/1/2029 | | NR | | | 1,560 | | | 1,339,759 |
| MD St Econ Dev Corp Sr Lien Pj Chesapeake Bay Ser A | | 5.00% | | 12/1/2031 | | NR | | | 10,000 | | | 6,064,900 |
| MD St Econ Dev Corp Sr Lien Pj Chesapeake Bay Ser B | | 5.25% | | 12/1/2031 | | NR | | | 1,000 | | | 607,290 |
| MD St Hlth & Higher Edl Facs Auth Washington Christian Academy | | 5.25% | | 7/1/2018 | | NR | | | 250 | | | 169,350 |
| MD St Hlth & Higher Edl Facs Auth Washington Christian Academy | | 5.50% | | 7/1/2038 | | NR | | | 2,300 | | | 1,136,384 |
| MI Pub Edl Facs Auth Rev Ltd Oblig Bradford Academy Pj† | | 6.50% | | 9/1/2037 | | BBB- | | | 5,000 | | | 4,235,000 |
| MI Pub Edl Facs Auth Rev Ltd Oblig Crescent | | 7.00% | | 10/1/2036 | | NR | | | 742 | | | 670,626 |
| MI Pub Edl Facs Auth Rev Ltd Oblig David Ellis West Pj | | 5.875% | | 6/1/2037 | | NR | | | 3,390 | | | 2,634,979 |
| MI Pub Edl Facs Auth Rev Ltd Oblig Old Redford Pj Ser A | | 5.875% | | 12/1/2030 | | BBB- | | | 3,720 | | | 2,986,639 |
| Middlesex Cnty NJ Impt Auth Sub Heldrich Ctr Hotel Ser B | | 6.25% | | 1/1/2037 | | NR | | | 5,755 | | | 1,101,162 |
| Milwaukee WI Redev Auth Academy of Learning Ser A | | 5.65% | | 8/1/2037 | | NR | | | 1,000 | | | 704,850 |
| Mohave Cnty AZ Indl Dev Auth Mohave Prison LLC Expansion Pj | | 8.00% | | 5/1/2025 | | BBB+ | | | 8,000 | | | 9,671,840 |
| NH St Business Fin Auth Pub Svc Ser D Rmkt TCRS AMT (AMBAC) | | 6.00% | | 5/1/2021 | | A3 | | | 1,000 | | | 1,015,340 |
| NJ Econ Dev Auth Cigarette Tax | | 5.625% | | 6/15/2019 | | BBB | | | 4,150 | | | 4,162,906 |
| NY St Urban Dev Corp Rev St Pers Income Tax Ser A-1(b) | | 5.00% | | 12/15/2028 | | AAA | | | 6,000 | | | 6,607,800 |
| OH St Air Quality Dev Auth First Enrg Generation Ser A | | 5.70% | | 8/1/2020 | | BBB | | | 7,340 | | | 8,054,549 |
| Otero Cnty NM Jail Pj Rev | | 5.75% | | 4/1/2018 | | NR | | | 1,925 | | | 1,747,688 |
| Otero Cnty NM Jail Pj Rev | | 6.00% | | 4/1/2023 | | NR | | | 1,350 | | | 1,166,616 |
| Otero Cnty NM Jail Pj Rev | | 6.00% | | 4/1/2028 | | NR | | | 1,900 | | | 1,542,629 |
| Palm Bay FL Edl Facs Rev Patriot Charter Sch Pj Ser A(h) | | 6.75% | | 7/1/2022 | | NR | | | 1,460 | | | 729,985 |
| Palm Bay FL Edl Facs Rev Patriot Charter Sch Pj Ser A(h) | | 7.00% | | 7/1/2036 | | NR | | | 5,000 | | | 2,500,000 |
See Notes to Financial Statements.
152
Schedule of Investments (continued)
HIGH YIELD MUNICIPAL BOND FUND September 30, 2009
| | | | | | | | | | | | | |
| Investments | | Interest
Rate | | Maturity
Date | | Credit
Rating:
S&P or
Moody’s(a) | | | Principal
Amount
(000) | | Value |
| Other Revenue (continued) | | | | | | | | | | | | | |
| Palm Beach Cnty FL Rev G Star Sch of Arts Ser A | | 6.75% | | 5/15/2035 | | BB | | | $ | 2,455 | | $ | 2,205,621 |
| Pima Cnty AZ Indl Dev Auth Amer Charter Schs Fndtn Ser A | | 5.50% | | 7/1/2026 | | BBB | (c) | | | 5,000 | | | 4,125,200 |
| Pima Cnty AZ Indl Dev Auth Amer Charter Schs Fndtn Ser A | | 5.625% | | 7/1/2038 | | BBB | (c) | | | 9,000 | | | 6,858,360 |
| Pima Cnty AZ Indl Dev Auth Horizon Cmnty Learning Ctr | | 5.25% | | 6/1/2035 | | BBB | | | | 10,000 | | | 7,608,900 |
| Pima Cnty AZ Indl Dev Auth Paradise Ed Ctr Pj | | 5.875% | | 6/1/2022 | | BB | | | | 250 | | | 217,323 |
| Pima Cnty AZ Indl Dev Auth Paradise Ed Ctr Pj | | 6.00% | | 6/1/2036 | | BB | | | | 1,800 | | | 1,421,748 |
| Plymouth MI Edl Ctr Charter Sch | | 5.375% | | 11/1/2030 | | BBB- | | | | 1,500 | | | 1,127,805 |
| Provo UT Charter Sch Rev Freedom Academy Fndtn | | 5.50% | | 6/15/2037 | | NR | | | | 4,000 | | | 2,961,720 |
| Red River Auth TX Pollutn Ctrl Celanese Pj Ser A | | 6.45% | | 11/1/2030 | | B+ | | | | 2,495 | | | 2,505,080 |
| Sabine River Auth TX Pollutn Ctrl TXU Elec Co Pj Ser A | | 5.50% | | 5/1/2022 | | CCC | | | | 1,620 | | | 1,389,101 |
| Sabine River Auth TX Pollutn Ctrl TXU Elec Co Pj Ser A AMT | | 6.45% | | 6/1/2021 | | CCC | | | | 2,000 | | | 1,200,820 |
| San Antonio TX Convtn Hotel Fin Corp Empowerment Zone Ser A AMT (AMBAC) | | 5.00% | | 7/15/2039 | | Baa2 | | | | 5,000 | | | 4,188,850 |
| San Luis AZ Fac Dev Corp Rev Sr Lien Pj Regl Detention Ctr | | 7.00% | | 5/1/2020 | | NR | | | | 1,000 | | | 1,022,870 |
| San Luis AZ Fac Dev Corp Rev Sr Lien Pj Regl Detention Ctr | | 7.25% | | 5/1/2027 | | NR | | | | 1,200 | | | 1,104,120 |
| Spanish Fork UT Charter Sch Rev Amer Leadership Academy† | | 5.55% | | 11/15/2021 | | NR | | | | 1,160 | | | 1,060,321 |
| Spanish Fork UT Charter Sch Rev Amer Leadership Academy† | | 5.55% | | 11/15/2026 | | NR | | | | 800 | | | 691,720 |
| Spanish Fork UT Charter Sch Rev Amer Leadership Academy† | | 5.70% | | 11/15/2036 | | NR | | | | 1,750 | | | 1,433,512 |
| Star Intl Academy MI COP | | 6.125% | | 3/1/2037 | | BBB | | | | 1,460 | | | 1,164,277 |
| Summit Academy MI Pub Sch | | 6.375% | | 11/1/2035 | | BB+ | | | | 3,795 | | | 2,941,315 |
| Sweetwater Cnty WY Solid Wst Disp FMC Corp Pj AMT | | 5.60% | | 12/1/2035 | | BBB | | | | 3,500 | | | 3,333,785 |
| Two Rivers MT Auth Inc Pj Sr Lien(h) | | 7.375% | | 11/1/2027 | | NR | | | | 2,615 | | | 527,367 |
| TX St Pub Fin Auth Charter Sch Ed Cosmos Fndtn Ser A | | 5.375% | | 2/15/2037 | | NR | | | | 2,870 | | | 2,343,585 |
See Notes to Financial Statements.
153
Schedule of Investments (continued)
HIGH YIELD MUNICIPAL BOND FUND September 30, 2009
| | | | | | | | | | | | |
| Investments | | Interest
Rate | | Maturity
Date | | Credit
Rating:
S&P or
Moody’s(a) | | Principal
Amount
(000) | | Value |
| Other Revenue (continued) | | | | | | | | | | | | |
| UT St Charter Sch Fin Auth Noah Webster Academy Ser A | | 6.50% | | 6/15/2038 | | NR | | $ | 500 | | $ | 419,930 |
| Utah Cnty UT Charter Sch Rev Lakeview Academy Ser A | | 5.625% | | 7/15/2037 | | NR | | | 1,000 | | | 779,350 |
| Utah Cnty UT Charter Sch Rev Lakeview Academy Ser A† | | 5.875% | | 6/15/2037 | | NR | | | 1,750 | | | 1,409,677 |
| West Vly City UT Charter Sch Monticello Academy† | | 6.375% | | 6/1/2037 | | NR | | | 4,200 | | | 3,412,290 |
| | | | | | | | | | | | |
| Total | | | | | | | | | | | | 207,536,840 |
| | | | | | | | | | | | |
| | | | | |
| Special Tax 5.33% | | | | | | | | | | | | |
| Allegheny Cnty PA Redev Auth Pittsburgh Mills Pj | | 5.60% | | 7/1/2023 | | NR | | | 500 | | | 432,835 |
| Altoona IA Tax Alloc Annual Appropriation | | 5.75% | | 6/1/2031 | | BBB+ | | | 1,000 | | | 1,053,540 |
| Amelia Walk Cmnty Dev Dist FL Ser A | | 5.50% | | 5/1/2037 | | NR | | | 980 | | | 483,748 |
| Arborwood Cmnty Dev Dist FL Centex Homes Pj Ser A 1 | | 5.50% | | 5/1/2036 | | NR | | | 2,825 | | | 1,498,578 |
| Arborwood Cmnty Dev Dist FL Master Infrastr Pjs Ser A | | 5.35% | | 5/1/2036 | | NR | | | 6,780 | | | 3,894,432 |
| Atlanta GA Tax Alloc Eastside Pj Ser A AMT | | 5.625% | | 1/1/2016 | | NR | | | 1,335 | | | 1,334,039 |
| Atlanta GA Tax Alloc Princeton Lakes Pj | | 5.50% | | 1/1/2031 | | NR | | | 1,045 | | | 875,919 |
| Aurora IL Tax Incr Rev East River Area No 6 Ser A | | 6.75% | | 12/30/2027 | | NR | | | 1,650 | | | 1,622,626 |
| Aurora IL Tax Incr Rev River City No 3 Ser B | | 6.50% | | 12/30/2023 | | NR | | | 3,000 | | | 2,955,900 |
| Baltimore MD Spl Oblig Ser A | | 7.00% | | 9/1/2038 | | NR | | | 7,000 | | | 6,643,350 |
| Branson MO Indl Dev Auth Tax Rev Branson Landing Retail Pj | | 5.50% | | 6/1/2029 | | NR | | | 6,220 | | | 4,540,476 |
| Cap Reg Cmnty Dev Dist FL Cap Impt Ser A | | 7.00% | | 5/1/2039 | | NR | | | 1,500 | | | 1,161,375 |
| Crosscreek Cmnty Dev Dist FL Ser A | | 5.60% | | 5/1/2039 | | NR | | | 1,750 | | | 668,762 |
| Crosscreek Cmnty Dev Dist FL Ser B | | 5.50% | | 5/1/2017 | | NR | | | 1,490 | | | 571,698 |
| Dardenne Twn Square Transn Dev Dist MO Ser A | | 5.00% | | 5/1/2036 | | NR | | | 3,110 | | | 1,531,146 |
| Durbin Crossing Cmnty Dev Dist FL Ser A | | 5.50% | | 5/1/2037 | | NR | | | 5,800 | | | 3,390,796 |
| FL Cypress Creek Hillsborough Cnty Cmnty Dev Dist | | 5.35% | | 5/1/2037 | | NR | | | 6,800 | | | 3,522,604 |
See Notes to Financial Statements.
154
Schedule of Investments (continued)
HIGH YIELD MUNICIPAL BOND FUND September 30, 2009
| | | | | | | | | | | | |
| Investments | | Interest
Rate | | Maturity
Date | | Credit
Rating:
S&P or
Moody’s(a) | | Principal
Amount
(000) | | Value |
| Special Tax (continued) | | | | | | | | | | | | |
| Grandview MO Indl Dev Auth Tax Inc Grandview Crossing Pj 1 | | 5.75% | | 12/1/2028 | | NR | | $ | 1,000 | | $ | 473,780 |
| Henderson NV Loc Impt Dists No T18 | | 5.25% | | 9/1/2026 | | NR | | | 8,155 | | | 3,682,635 |
| Henderson NV Loc Impt Dists No T18 | | 5.30% | | 9/1/2035 | | NR | | | 2,500 | | | 1,128,925 |
| IA Fin Auth Child Svcs | | 5.50% | | 6/1/2031 | | NR | | | 4,260 | | | 3,228,484 |
| Inglewood CA Redev Agy Tax Alloc Sub Lien Ser A-1 (AMBAC) | | 5.00% | | 5/1/2033 | | BBB+ | | | 12,000 | | | 10,309,080 |
| Lancaster CA Redev Agy Tax Alloc Comb Redev Pj Areas | | 6.875% | | 8/1/2034 | | A | | | 1,000 | | | 1,081,090 |
| Magnolia FL West Cmnty Dev Dist | | 5.35% | | 5/1/2037 | | NR | | | 3,890 | | | 2,331,822 |
| Mariposa NM East Pub Impt Dist | | 5.75% | | 9/1/2021 | | NR | | | 350 | | | 303,289 |
| Mariposa NM East Pub Impt Dist | | 6.00% | | 9/1/2032 | | NR | | | 1,000 | | | 782,710 |
| Mediterranea Cmnty Dev Dist FL Spl Assmnt Ser A | | 5.60% | | 5/1/2037 | | NR | | | 1,460 | | | 861,940 |
| Mesquite NV Redev Agy Tax Alloc | | 7.125% | | 6/1/2021 | | A- | | | 1,000 | | | 1,041,300 |
| Mesquite NV Redev Agy Tax Alloc | | 7.375% | | 6/1/2024 | | A- | | | 1,655 | | | 1,724,957 |
| Millsboro DE Spl Oblig Plantation Lakes Spl Dev Ser A | | 5.45% | | 7/1/2036 | | NR | | | 5,000 | | | 3,398,900 |
| Orange Grove LA Cmnty Dev Dist | | 5.30% | | 11/1/2021 | | NR | | | 1,760 | | | 1,364,317 |
| Panther Trace II FL Cmnty Dev Dist Spl Assmnt Ser A | | 5.60% | | 5/1/2035 | | NR | | | 1,730 | | | 1,227,677 |
| Shingle Creek FL Cmnty Dev Dist | | 6.10% | | 5/1/2025 | | NR | | | 4,990 | | | 2,303,933 |
| Sparks NV Loc Impt Dist Ltd Oblig Dist No 3 | | 6.75% | | 9/1/2027 | | NR | | | 1,000 | | | 971,640 |
| Stone Canyon Cmnty Impt Dist MO Pub Infrastr Impt Pj | | 5.70% | | 4/1/2022 | | NR | | | 1,485 | | | 1,261,047 |
| Tern Bay Cmnty Dev Dist FL Ser A(h) | | 5.375% | | 5/1/2037 | | NR | | | 13,145 | | | 4,600,881 |
| Tracy CA Cmnty Facs Dist No 1 NEI Phase II | | 5.70% | | 9/1/2026 | | NR | | | 920 | | | 806,601 |
| Whispering Spring LA Dev Dist Spl Assmnt | | 5.20% | | 10/1/2021 | | NR | | | 2,290 | | | 1,551,498 |
| Whiting IN Redev Dist Standard Ave Pj | | 5.35% | | 1/15/2027 | | NR | | | 1,995 | | | 1,671,271 |
| | | | | | | | | | | | |
| Total | | | | | | | | | | | | 82,289,601 |
| | | | | | | | | | | | |
| | | | | |
| Tax Revenue 4.91% | | | | | | | | | | | | |
| Cooperative Dist of Fort Spanish AL Rev Pub Impt | | 9.00% | | 2/1/2029 | | NR | | | 3,600 | | | 4,040,100 |
| Metro Atlanta GA Rapid Transit Tax 3rd Ser (FSA)(b) | | 5.00% | | 7/1/2039 | | AA+ | | | 18,000 | | | 19,361,070 |
| NJ Econ Dev Auth Cigarette Tax | | 5.50% | | 6/15/2024 | | BBB | | | 7,185 | | | 7,134,346 |
| NJ Econ Dev Auth Cigarette Tax | | 5.75% | | 6/15/2029 | | BBB | | | 9,115 | | | 9,143,803 |
See Notes to Financial Statements.
155
Schedule of Investments (continued)
HIGH YIELD MUNICIPAL BOND FUND September 30, 2009
| | | | | | | | | | | | |
| Investments | | Interest
Rate | | Maturity
Date | | Credit
Rating:
S&P or
Moody’s(a) | | Principal
Amount
(000) | | Value |
| Tax Revenue (continued) | | | | | | | | | | | | |
| Puerto Rico Sales Tax Fing Corp 1st Sub Ser A | | 5.75% | | 8/1/2037 | | A+ | | $ | 10,000 | | $ | 10,801,400 |
| Southwestern IL Dev Auth Rev Loc Govt Pg Collinsville Ltd | | 5.35% | | 3/1/2031 | | NR | | | 1,000 | | | 764,710 |
| Sparks NV Tourism Impt Dist No 1 Sr Sales Tax Antic Ser A† | | 6.75% | | 6/15/2028 | | Ba2 | | | 7,000 | | | 6,715,520 |
| UT Transit Auth Sales Tax Rev Ser A(b) | | 5.00% | | 6/15/2028 | | AAA | | | 16,235 | | | 17,880,919 |
| | | | | | | | | | | | |
| Total | | | | | | | | | | | | 75,841,868 |
| | | | | | | | | | | | |
| | | | | |
| Tobacco 3.84% | | | | | | | | | | | | |
| Buckeye OH Tob Sttlmnt Fing Auth Asset Bkd Sr Turbo Ser A-2 | | 5.875% | | 6/1/2030 | | BBB | | | 4,190 | | | 4,008,699 |
| Buckeye OH Tob Sttlmnt Fing Auth Asset Bkd Sr Turbo Ser A-2 | | 5.875% | | 6/1/2047 | | BBB | | | 19,195 | | | 15,594,978 |
| Buckeye OH Tob Sttlmnt Fing Auth Asset Bkd Sr Turbo Ser A-2 | | 6.50% | | 6/1/2047 | | BBB | | | 5,800 | | | 5,172,788 |
| Golden St Tob Securitization Corp CA Asset Bkd Sr Ser A-1 | | 5.125% | | 6/1/2047 | | BBB | | | 20,635 | | | 15,520,202 |
| Golden St Tob Securitization Corp CA Asset Bkd Sr Ser A-1 | | 5.75% | | 6/1/2047 | | BBB | | | 13,780 | | | 11,502,304 |
| MI Tob Sttlmnt Fin Auth Sr Ser A | | 6.00% | | 6/1/2048 | | BBB | | | 5,000 | | | 4,110,500 |
| NJ Tob Sttlmnt Fing Corp Ser 1A | | 5.00% | | 6/1/2041 | | BBB | | | 4,385 | | | 3,318,173 |
| | | | | | | | | | | | |
| Total | | | | | | | | | | | | 59,227,644 |
| | | | | | | | | | | | |
| | | | | |
| Transportation 8.75% | | | | | | | | | | | | |
| Augusta GA Arpt Rev Gen Arpt Passenger B AMT | | 5.35% | | 1/1/2028 | | Baa2 | | | 350 | | | 295,435 |
| Augusta GA Arpt Rev Gen Ser C AMT | | 5.45% | | 1/1/2031 | | Baa2 | | | 2,410 | | | 2,006,807 |
Bay Area Toll Auth CA San Francisco Bay Area F-1(b) | | 5.00% | | 4/1/2034 | | AA | | | 12,000 | | | 12,887,040 |
| Dallas-Fort Worth TX Intl Arpt Facs Impt Corp A Sub Ser 2 Rmkt AMT | | 9.00% | | 5/1/2029 | | CCC+ | | | 7,500 | | | 7,355,400 |
| Dallas-Fort Worth TX Intl Arpt Facs Impt Corp A Sub Ser 3 Rmkt AMT | | 9.125% | | 5/1/2029 | | CCC+ | | | 1,500 | | | 1,456,680 |
| Director St NV Dept Business & Industry Las Vegas Monorail Pj 2nd Tier(j) | | 7.25% | | 1/1/2023 | | NR | | | 5,000 | | | 250,000 |
| Director St NV Dept Business & Industry Las Vegas Monorail Pj 2nd Tier(j) | | 7.375% | | 1/1/2030 | | NR | | | 5,000 | | | 250,000 |
See Notes to Financial Statements.
156
Schedule of Investments (continued)
HIGH YIELD MUNICIPAL BOND FUND September 30, 2009
| | | | | | | | | | | | |
| Investments | | Interest
Rate | | Maturity
Date | | Credit
Rating:
S&P or
Moody’s(a) | | Principal
Amount
(000) | | Value |
| Transportation (continued) | | | | | | | | | | | | |
| E-470 Pub Hwy Auth CO Rev Cap Apprec Sr Ser A (NPFGC) | | Zero Coupon | | 9/1/2034 | | A | | $ | 5,885 | | $ | 1,138,218 |
| E-470 Pub Hwy Auth CO Rev Cap Apprec Sr Ser B (NPFGC) | | Zero Coupon | | 9/1/2031 | | A | | | 25,000 | | | 6,105,500 |
| E-470 Pub Hwy Auth CO Rev Cap Apprec Sr Ser B (NPFGC) | | Zero Coupon | | 9/1/2037 | | A | | | 9,925 | | | 1,537,978 |
| Foothill Eastern Transn Corridor Agy CA | | 5.75% | | 1/15/2040 | | BBB- | | | 2,030 | | | 1,992,668 |
| Foothill Eastern Transn Corridor Agy CA Cap Apprec | | Zero Coupon | | 1/15/2030 | | BBB- | | | 20,000 | | | 5,053,800 |
| Foothill Eastern Transn Corridor Agy CA Cap Apprec | | Zero Coupon | | 1/15/2033 | | BBB- | | | 5,000 | | | 1,030,800 |
| Foothill Eastern Transn Corridor Agy CA Cap Apprec | | Zero Coupon | | 1/15/2034 | | BBB- | | | 25,535 | | | 4,919,062 |
| Foothill Eastern Transn Corridor Agy CA Cap Apprec | | Zero Coupon | | 1/15/2035 | | BBB- | | | 3,445 | | | 620,134 |
| Foothill Eastern Transn Corridor Agy CA Cap Apprec | | Zero Coupon | | 1/15/2037 | | BBB- | | | 4,985 | | | 783,492 |
| Foothill Eastern Transn Corridor Agy CA Cap Apprec | | Zero Coupon | | 1/15/2038 | | BBB- | | | 1,000 | | | 146,860 |
| Foothill Eastern Transn Corridor Agy CA Cap Apprec | | 5.875% | | 1/15/2026 | | BBB- | | | 2,000 | | | 2,039,160 |
| Greater Orlando FL Aviation Auth Spl Purp JetBlue Airways Corp AMT | | 6.375% | | 11/15/2026 | | NR | | | 2,305 | | | 1,997,744 |
| Greater Orlando FL Aviation Auth Spl Purp JetBlue Airways Corp AMT | | 6.50% | | 11/15/2036 | | NR | | | 5,000 | | | 4,228,650 |
| Metro Transn Auth NY Ser B | | 5.00% | | 11/15/2034 | | AA | | | 3,750 | | | 3,963,263 |
| Metro WA DC Arpts Auth Ser A AMT(b) | | 5.00% | | 10/1/2022 | | AA- | | | 3,250 | | | 3,401,109 |
| Metro WA DC Arpts Auth Ser A AMT(b) | | 5.25% | | 10/1/2027 | | AA- | | | 4,540 | | | 4,751,087 |
| Metro WA DC Arpts Auth Ser A AMT(b) | | 5.375% | | 10/1/2028 | | AA- | | | 2,500 | | | 2,616,238 |
| NJ Econ Dev Auth Spl Fac Continental Airlines Inc Pj AMT | | 6.625% | | 9/15/2012 | | B | | | 2,760 | | | 2,741,370 |
| North TX Twy Auth Rev 1st Tier Ser A | | 6.00% | | 1/1/2028 | | A2 | | | 5,000 | | | 5,553,450 |
| North TX Twy Auth Rev 1st Tier Ser A | | 6.25% | | 1/1/2039 | | A2 | | | 5,000 | | | 5,578,950 |
| North TX Twy Auth Rev Toll 2nd Tier Ser F | | 5.75% | | 1/1/2038 | | A3 | | | 5,000 | | | 5,291,800 |
See Notes to Financial Statements.
157
Schedule of Investments (continued)
HIGH YIELD MUNICIPAL BOND FUND September 30, 2009
| | | | | | | | | | | | |
| Investments | | Interest
Rate | | Maturity
Date | | Credit
Rating:
S&P or
Moody’s(a) | | Principal
Amount
(000) | | Value |
| Transportation (continued) | | | | | | | | | | | | |
| Phoenix AZ Indl Dev Auth Amer West Airlines Inc Pj AMT | | 6.25% | | 6/1/2019 | | Caa3 | | $ | 1,955 | | $ | 1,528,380 |
| Port Auth NY & NJ Cons 160th(b) | | 4.00% | | 9/15/2031 | | AA- | | | 25,000 | | | 25,050,250 |
| San Jose CA Arpt Rev Ser A AMT (AMBAC) | | 5.50% | | 3/1/2032 | | A | | | 1,750 | | | 1,777,545 |
| Santa Rosa FL Bay Bridge Auth Rev | | 6.25% | | 7/1/2028 | | B3 | | | 4,860 | | | 3,098,104 |
| Santa Rosa FL Bay Bridge Auth Rev Cap Apprec | | Zero Coupon | | 7/1/2017 | | B3 | | | 2,800 | | | 969,360 |
| St. Louis MO Arpt Rev Lambert Intl Arpt Ser A-1 | | 6.25% | | 7/1/2029 | | A | | | 4,025 | | | 4,249,877 |
| St. Paul MN Port Auth Lease Rev Healtheast Midway Campus 03 A | | 5.875% | | 5/1/2030 | | BB | | | 1,000 | | | 890,190 |
| Susquehanna Area PA Regl Arpt Auth Ser A AMT | | 6.50% | | 1/1/2038 | | Baa3 | | | 7,835 | | | 7,626,746 |
| | | | | | | | | | | | |
| Total | | | | | | | | | | | | 135,183,147 |
| | | | | | | | | | | | |
| | | | | |
| Utilities 15.47% | | | | | | | | | | | | |
| Atlanta GA Wtr & Wst Wtr Rev Ser A | | 6.00% | | 11/1/2028 | | A | | | 3,000 | | | 3,225,180 |
| Atlanta GA Wtr & Wst Wtr Rev Ser A | | 6.00% | | 11/1/2029 | | A | | | 4,500 | | | 4,830,390 |
| AZ Salt River Pj Agric Impt & Pwr Dist Ser A(b) | | 5.00% | | 1/1/2032 | | AA | | | 17,700 | | | 19,355,304 |
| Brazos River Auth TX Pollutn Ctrl TXU Enrg Co LLC Pj AMT | | 5.00% | | 3/1/2041 | | CCC | | | 6,000 | | | 3,423,840 |
| CA Infrastr & Econ Dev Bk Indpt Sys Operator Ser A | | 5.50% | | 2/1/2030 | | A | | | 5,500 | | | 5,717,800 |
| Campbell Cnty WY Solid Wst Fac Basin Elec Pwr Coop Ser A | | 5.75% | | 7/15/2039 | | A+ | | | 4,000 | | | 4,296,680 |
| Clark Cnty NV Indl Dev Rev Pwr Co Pj Ser C | | 5.50% | | 10/1/2030 | | BB+ | | | 4,215 | | | 4,217,445 |
| CT St Dev Auth Lt & Pwr B AMT | | 5.95% | | 9/1/2028 | | Baa1 | | | 2,190 | | | 2,213,214 |
| CT St Dev Auth Solid Wst Disp PSEG Pwr LLC Pj Ser A AMT | | 5.75% | | 11/1/2037 | | Baa1 | | | 2,250 | | | 2,246,782 |
| Detroit MI Wtr Supply Sys 2nd Lien Ser B Rmkt (FSA) | | 7.00% | | 7/1/2036 | | AAA | | | 4,535 | | | 5,619,001 |
| FL Muni Pwr Agy Rev Pwr Ser A | | 6.25% | | 10/1/2031 | | A1 | | | 2,000 | | | 2,344,160 |
| HI St Dept Bdgt & Fin Elec Co & Subs Ser A AMT (FGIC) | | 4.80% | | 1/1/2025 | | Baa1 | | | 2,000 | | | 1,908,260 |
| HI St Dept Bdgt & Fin Hawaiian Elec Co & Subs | | 6.50% | | 7/1/2039 | | Baa1 | | | 4,400 | | | 4,800,708 |
See Notes to Financial Statements.
158
Schedule of Investments (continued)
HIGH YIELD MUNICIPAL BOND FUND September 30, 2009
| | | | | | | | | | | | |
| Investments | | Interest
Rate | | Maturity
Date | | Credit
Rating:
S&P or
Moody’s(a) | | Principal
Amount
(000) | | Value |
| Utilities (continued) | | | | | | | | | | | | |
| HI St Dept Bdgt & Fin Hawaiian Elec Co Ser A AMT (NPFGC) | | 5.65% | | 10/1/2027 | | A | | $ | 6,890 | | $ | 6,973,162 |
| HI St Dept Bdgt & Fin Hawaiian Elec Co Ser B AMT (FGIC) | | 4.60% | | 5/1/2026 | | Baa1 | | | 2,000 | | | 1,850,940 |
| HI St Dept Bdgt & Fin Spl Purp Hawaiian Elec Co & Subs Pjs AMT (NPFGC) | | 5.45% | | 11/1/2023 | | AA | | | 3,300 | | | 3,300,363 |
| IA Fin Auth Child Svcs | | 5.55% | | 6/1/2036 | | NR | | | 5,960 | | | 4,385,249 |
| IN Muni Pwr Agy Ser B | | 5.75% | | 1/1/2034 | | A+ | | | 2,000 | | | 2,119,080 |
| Lathrop CA Fing Auth Rev Wtr Supply Pj | | 5.90% | | 6/1/2027 | | NR | | | 3,000 | | | 2,836,350 |
| Lathrop CA Fing Auth Rev Wtr Supply Pj | | 6.00% | | 6/1/2035 | | NR | | | 4,140 | | | 3,892,635 |
| M-S-R Enrg Auth CA Ser C | | 6.50% | | 11/1/2039 | | A | | | 6,250 | | | 7,143,500 |
| M-S-R Enrg Auth CA Ser C | | 7.00% | | 11/1/2034 | | A | | | 12,370 | | | 15,090,410 |
| Maricopa Cnty AZ Pollutn Ctrl Corp El Paso Elec Co Pj Ser A | | 7.25% | | 2/1/2040 | | BBB | | | 3,500 | | | 4,010,475 |
| Moraine OH Solid Wst Disp Gen Motors Corp Pj AMT(h) | | 6.75% | | 7/1/2014 | | NR | | | 525 | | | 77,438 |
| MS Business Fin Corp Sys Enrg Res Inc Pj | | 5.90% | | 5/1/2022 | | BBB | | | 100 | | | 99,469 |
| New York City NY Muni Wtr Fin Auth Ser CC(b) | | 5.00% | | 6/15/2029 | | AA+ | | | 11,000 | | | 12,023,220 |
| New York City NY Muni Wtr Fin Auth Ser CC(b) | | 5.125% | | 6/15/2030 | | AA+ | | | 1,000 | | | 1,093,020 |
| Niagara Cnty NY Indl Dev Agy Ser B AMT | | 5.55% | | 11/15/2024 | | Baa2 | | | 750 | | | 746,693 |
| OH St Pollutn Ctrl Rev Gen Motors Corp Pj(h) | | 5.625% | | 3/1/2015 | | NR | | | 2,965 | | | 437,338 |
| Owen Cnty KY Wtrwks Sys Rev Amer Wtr Co Ser B | | 5.625% | | 9/1/2039 | | BBB+ | | | 2,500 | | | 2,583,275 |
| Padre Dam CA Muni Wtr Dist Pj Ser A(b) | | 5.25% | | 10/1/2034 | | AA- | | | 11,600 | | | 12,446,046 |
| Phoenix AZ Civic Impt Corp Jr Lien Ser A(b) | | 5.00% | | 7/1/2039 | | AAA | | | 8,750 | | | 9,449,519 |
| Pima Cnty AZ Indl Dev Auth Global Wtr Res LLC Pj AMT | | 5.60% | | 12/1/2022 | | NR | | | 2,000 | | | 1,782,120 |
| Pima Cnty AZ Indl Dev Auth Global Wtr Res LLC Pj AMT | | 5.75% | | 12/1/2032 | | NR | | | 5,000 | | | 4,313,650 |
| Pima Cnty AZ Indl Dev Auth Global Wtr Res LLC Pj AMT | | 6.55% | | 12/1/2037 | | NR | | | 7,000 | | | 6,780,970 |
| Pima Cnty AZ Indl Dev Auth Global Wtr Res LLC Pj AMT | | 7.50% | | 12/1/2038 | | NR | | | 2,235 | | | 2,312,353 |
| Pinal Cnty AZ Elec Dist No 4 | | 6.00% | | 12/1/2038 | | BBB | | | 1,150 | | | 1,161,983 |
| Sabine River Auth TX Pollutn Ctrl TXU Elec Co Pj Ser B AMT | | 5.75% | | 5/1/2030 | | CCC | | | 5,040 | | | 4,321,598 |
See Notes to Financial Statements.
159
Schedule of Investments (concluded)
HIGH YIELD MUNICIPAL BOND FUND September 30, 2009
| | | | | | | | | | | | | |
| Investments | | Interest
Rate | | Maturity
Date | | Credit
Rating:
S&P or
Moody’s(a) | | Principal
Amount
(000) | | Value | |
| Utilities (continued) | | | | | | | | | | | | | |
| Salt Verde AZ Financial Corp Gas Rev Sr | | 5.00% | | 12/1/2037 | | A | | $ | 2,500 | | $ | 2,328,625 | |
| San Antonio TX Elec & Gas Ser A(b) | | 5.25% | | 2/1/2029 | | AA | | | 19,375 | | | 21,716,731 | |
| San Antonio TX Elec & Gas Ser A(b) | | 5.25% | | 2/1/2031 | | AA | | | 6,270 | | | 7,027,815 | |
| TN Enrg Acq Corp Jr Ser B | | 5.625% | | 9/1/2026 | | NR | | | 4,781 | | | 4,716,648 | |
| TN Enrg Acq Corp Ser A | | 5.25% | | 9/1/2026 | | BB+ | | | 6,775 | | | 6,692,480 | |
| TN Enrg Acq Corp Ser C | | 5.00% | | 2/1/2025 | | A | | | 5,030 | | | 4,882,923 | |
| TX Muni Gas Acq & Supply Corp I Sr Lien Ser D | | 6.25% | | 12/15/2026 | | A | | | 13,085 | | | 14,090,190 | |
| Western Generation Agy OR Wauna Cogeneration Pj B AMT | | 5.00% | | 1/1/2016 | | NR | | | 1,500 | | | 1,358,730 | |
| Western Generation Agy OR Wauna Cogeneration Pj Sub Lien C | | 5.00% | | 1/1/2021 | | NR | | | 790 | | | 714,002 | |
| | | | | | | | | | | | | |
| Total | | | | | | | | | | | | 238,957,764 | |
| | | | | | | | | | | | | |
| Total Municipal Bonds (cost $1,803,817,202) | | | | | | | | | | 1,684,103,110 | |
| | | | | | | | | | | | | |
| | | | | |
| | | | | | | | | Shares
(000) | | | |
| SHORT-TERM INVESTMENTS 0.42% | | | | | | | | | | | | | |
| | | | | |
| Money Market Mutual Funds 0.22% | | | | | | | | | | | | | |
| Dreyfus Municipal Cash Management Plus | | | | | | | | | 3,415 | | | 3,414,908 | |
| SSgA Tax Free Money Market Fund | | | | | | | | | 3 | | | 2,890 | |
| | | | | | | | | | | | | |
| Total | | | | | | | | | | | | 3,417,798 | |
| | | | | | | | | | | | | |
| | | | | |
| | | | | | | | | Principal
Amount
(000) | | | |
| | | | | |
| Variable Rate Demand Note 0.20% | | | | | | | | | | | | | |
| CA St Floater Ser DCL 048 (FSA)(e) | | 0.60% | | 10/1/2009 | | AAA | | $ | 3,000 | | | 3,000,000 | |
| | | | | | | | | | | | | |
| Total Short-Term Investments (cost $6,417,798) | | | | | | | | | | 6,417,798 | |
| | | | | | | | | | | | | |
| Total Investments in Securities 109.47% (cost $1,810,235,000) | | | | | | 1,690,520,908 | |
| | | | | | | |
| Liabilities in Excess of Cash and Other Assets(f) (9.47%) | | | | | | | | (146,251,559 | ) |
| | | | | | | | | | | | | |
| Net Assets 100.00% | | | | | | | | | | | $ | 1,544,269,349 | |
| | | | | | | | | | | | | |
Open Futures Contracts at September 30, 2009:
| | | | | | | | | | | | |
| Type | | Expiration | | Contracts | | Position | | Market
Value | | Unrealized
Depreciation |
| U.S. 30-Year Treasury Bond | | December 2009 | | 2,028 | | Short | | $ | (246,148,500) | | $ | (4,984,661) |
See Notes to Financial Statements.
160
Schedule of Investments
PENNSYLVANIA TAX FREE TRUST September 30, 2009
| | | | | | | | | | | | |
| Investments | | Interest
Rate | | Maturity
Date | | Credit
Rating:
S&P or
Moody’s(a) | | Principal
Amount
(000) | | Value |
| MUNICIPAL BONDS 96.67% | | | | | | | | | | | | |
| | | | | |
| Corporate-Backed 3.41% | | | | | | | | | | | | |
| Allegheny Cnty PA Indl Dev Auth Envr Impt USX Pj | | 6.10% | | 7/15/2020 | | BBB+ | | $ | 1,000 | | $ | 1,003,860 |
| PA Econ Dev Fing Auth USG Corp Pj AMT | | 6.00% | | 6/1/2031 | | B+ | | | 1,000 | | | 770,380 |
| York Cnty PA Indl Dev Auth Pollutn Ctrl Rev Pub Svc Elec & Gas Ser A (NPFGC) | | 6.45% | | 10/1/2019 | | A | | | 1,475 | | | 1,475,501 |
| | | | | | | | | | | | |
| Total | | | | | | | | | | | | 3,249,741 |
| | | | | | | | | | | | |
| | | | | |
| Education 19.63% | | | | | | | | | | | | |
| Allegheny Cnty PA Higher Ed Bldg Auth Duquesne Univ | | 5.00% | | 3/1/2028 | | A2 | | | 1,515 | | | 1,581,478 |
| Allegheny Cnty PA Higher Ed Bldg Auth Duquesne Univ | | 5.00% | | 3/1/2033 | | A2 | | | 1,000 | | | 1,029,690 |
| Harrisburg PA Auth Univ Rev Harrisburg Univ of Science B | | 6.00% | | 9/1/2036 | | NR | | | 1,000 | | | 898,350 |
| Lehigh Cnty PA Gen Purp Auth Desales Univ Pj (RADIAN) | | 5.125% | | 12/15/2023 | | BBB- | | | 1,000 | | | 934,310 |
| New Wilmington PA Muni Auth Rev Westminster College Pj GG4 (RADIAN) | | 5.125% | | 5/1/2033 | | BBB- | | | 1,000 | | | 853,400 |
| PA St Higher Edl Facs Auth Assoc Indpt Colleges & Univ GG5 (RADIAN) | | 5.125% | | 5/1/2032 | | BBB- | | | 1,020 | | | 893,265 |
| PA St Higher Edl Facs Auth Drexel Univ Ser A | | 5.20% | | 5/1/2032 | | A+ | | | 600 | | | 608,982 |
| PA St Higher Edl Facs Auth Edinboro Univ | | 5.75% | | 7/1/2028 | | BBB- | | | 1,000 | | | 971,990 |
| PA St Higher Edl Facs Auth Moravian College Pj (RADIAN) | | 5.375% | | 7/1/2031 | | BBB- | | | 1,000 | | | 1,003,450 |
| PA St Higher Edl Facs Auth Philadelphia Univ | | 5.00% | | 6/1/2030 | | BBB | | | 1,530 | | | 1,319,242 |
| PA St Higher Edl Facs Auth Univ of the Arts (RADIAN) | | 5.625% | | 3/15/2025 | | BBB- | | | 1,000 | | | 962,540 |
| PA St Higher Edl Facs Auth Univ of the Arts (RADIAN) | | 5.75% | | 3/15/2030 | | BBB- | | | 500 | | | 471,345 |
| PA St Higher Edl Facs Auth York College PA Pj Ser EE 1 (XLCA) | | 5.00% | | 11/1/2033 | | A | | | 1,000 | | | 1,026,280 |
| PA St Pub Sch Bldg Auth Cap Apprec Butler Cnty D-II (AMBAC) | | Zero Coupon | | 7/15/2014 | | NR | | | 295 | | | 251,467 |
| PA St Pub Sch Bldg Auth Cap Apprec Butler Cnty D-II (AMBAC) | | Zero Coupon | | 7/15/2015 | | NR | | | 295 | | | 239,230 |
See Notes to Financial Statements.
161
Schedule of Investments (continued)
PENNSYLVANIA TAX FREE TRUST September 30, 2009
| | | | | | | | | | | | |
| Investments | | Interest
Rate | | Maturity
Date | | Credit
Rating:
S&P or
Moody’s(a) | | Principal
Amount
(000) | | Value |
| Education (continued) | | | | | | | | | | | | |
| PA St Pub Sch Bldg Auth Cap Apprec Butler Cnty D-II (AMBAC) | | Zero Coupon | | 7/15/2016 | | NR | | $ | 295 | | $ | 226,451 |
| PA St Pub Sch Bldg Auth Delaware Cnty Cmnty College Pj (FSA) | | 5.00% | | 10/1/2029 | | Aa3 | | | 675 | | | 730,249 |
| PA St Pub Sch Bldg Auth Jefferson Cnty Dubois Tech Sch (NPFGC)(FGIC) | | 5.00% | | 2/1/2029 | | A | | | 1,000 | | | 1,045,190 |
| PA St Univ Ser A | | 5.00% | | 8/15/2029 | | AA | | | 1,000 | | | 1,088,960 |
| Philadelphia PA Auth Indl Dev Edl Cmnty Fgn Med Grads (NPFGC) | | 5.00% | | 6/1/2015 | | A | | | 250 | | | 250,048 |
| Snyder Cnty PA Higher Ed Auth Susquehanna Univ Pj | | 5.00% | | 1/1/2029 | | A2 | | | 1,300 | | | 1,370,473 |
| Wilkes-Barre PA Fin Auth Wilkes Univ Pj | | 5.00% | | 3/1/2037 | | BBB | | | 1,000 | | | 921,640 |
| | | | | | | | | | | | |
| Total | | | | | | | | | | | | 18,678,030 |
| | | | | | | | | | | | |
| | | | | |
| General Obligation 19.18% | | | | | | | | | | | | |
| Allentown PA Sch Dist Ser A | | 5.00% | | 2/15/2023 | | A | | | 1,000 | | | 1,103,300 |
| Bucks Cnty PA | | 5.25% | | 5/1/2023 | | AA+ | | | 1,000 | | | 1,188,010 |
| Delaware Vly PA Regl Fin Auth Ser C (AMBAC) | | 7.75% | | 7/1/2027 | | Aa2 | | | 1,000 | | | 1,379,050 |
| Downingtown PA Area Sch Dist Ser AA | | 5.00% | | 11/1/2029 | | AA+ | | | 1,000 | | | 1,109,070 |
| Gateway PA Sch Dist Allegheny Cnty (FSA) | | 5.00% | | 7/15/2027 | | Aa3 | | | 4,280 | | | 4,652,831 |
| Luzerne Cnty PA Ser B (FSA) | | 5.00% | | 12/15/2027 | | AAA | | | 1,500 | | | 1,609,260 |
| Northern Mariana Islands Comwlth Ser B | | 5.00% | | 10/1/2033 | | NR | | | 1,690 | | | 1,340,964 |
| PA Centennial Sch Dist Bucks Cnty Ser B (FSA) | | 5.25% | | 12/15/2027 | | AAA | | | 1,180 | | | 1,306,838 |
| Philadelphia PA Ser A (FSA) | | 5.25% | | 12/15/2027 | | AAA | | | 2,500 | | | 2,661,050 |
| Territory of Guam Ser A | | 7.00% | | 11/15/2039 | | B+ | | | 200 | | | 219,272 |
| West Mifflin PA Area Sch Dist (FSA) | | 5.375% | | 4/1/2028 | | AAA | | | 1,500 | | | 1,680,900 |
| | | | | | | | | | | | |
| Total | | | | | | | | | | | | 18,250,545 |
| | | | | | | | | | | | |
| | | | | |
| Healthcare 18.92% | | | | | | | | | | | | |
| Allegheny Cnty PA Hosp Dev Auth Catholic Hlth East Issue | | 5.50% | | 11/15/2032 | | A1 | | | 1,500 | | | 1,504,995 |
| Allegheny Cnty PA Hosp Dev Auth OH Vly Gen Hosp Pj A | | 5.125% | | 4/1/2035 | | Baa2 | | | 500 | | | 420,930 |
| Allegheny Cnty PA Hosp Dev Auth Univ Pittsburgh Med Ctr | | 5.625% | | 8/15/2039 | | Aa3 | | | 1,500 | | | 1,603,515 |
See Notes to Financial Statements.
162
Schedule of Investments (continued)
PENNSYLVANIA TAX FREE TRUST September 30, 2009
| | | | | | | | | | | | |
| Investments | | Interest
Rate | | Maturity
Date | | Credit
Rating:
S&P or
Moody’s(a) | | Principal
Amount
(000) | | Value |
| Healthcare (continued) | | | | | | | | | | | | |
| Allegheny Cnty PA Hosp Dev Auth Univ Pittsburgh Med Ctr Ser A | | 5.00% | | 9/1/2018 | | Aa3 | | $ | 1,000 | | $ | 1,108,240 |
| Allegheny Cnty PA Hosp Dev Auth West PA Hlth Sys Ser A | | 5.00% | | 11/15/2028 | | BB | | | 1,000 | | | 798,080 |
| Bucks Cnty PA Indl Dev Auth Lutheran Cmnty Telford Ctr | | 5.75% | | 1/1/2037 | | NR | | | 1,000 | | | 771,570 |
| Butler Cnty PA Hosp Auth Butler Hlth Sys Pj | | 7.25% | | 7/1/2039 | | Baa1 | | | 1,000 | | | 1,155,820 |
| Delaware Cnty PA Auth Hosp Rev Crozer Chester Med Ctr (ACA)(CBI) | | 5.375% | | 12/1/2018 | | BBB- | | | 1,000 | | | 965,930 |
| Lancaster Cnty PA Hosp Auth Rev Brethren Vlg Pj Ser A | | 6.25% | | 7/1/2026 | | NR | | | 1,000 | | | 963,750 |
| Lehigh Cnty PA Gen Purp Auth Good Shepherd Grp Ser A | | 5.625% | | 11/1/2034 | | A | | | 1,000 | | | 1,014,690 |
| Lehigh Cnty PA Gen Purp Hosp Lehigh Vly Hlth Network Ser A (FSA) | | 5.00% | | 7/1/2025 | | AAA | | | 1,000 | | | 1,029,900 |
| Monroe Cnty PA Hosp Auth Rev Pocono Med Ctr | | 5.125% | | 1/1/2037 | | A- | | | 1,000 | | | 932,610 |
| Northampton Cnty PA Gen Purp Auth St. Luke’s Hosp Pj Ser A | | 5.25% | | 8/15/2023 | | BBB+ | | | 1,250 | | | 1,275,662 |
| PA Econ Dev Fing Auth Albert Einstein Hlthcare Ser A | | 6.25% | | 10/15/2023 | | A3 | | | 1,000 | | | 1,057,200 |
| Philadelphia PA Hosps & Higher Ed Facs Auth Temple Univ Hlth Sys Ser A | | 5.50% | | 7/1/2030 | | BBB | | | 1,000 | | | 892,090 |
| Puerto Rico Indl Tourist Edl Med & Envr Ctrl Facs Fing Auth Hosp Auxilio Mutuo Oblig Grp Ser A (NPFGC) | | 6.25% | | 7/1/2024 | | A | | | 850 | | | 850,119 |
| Southcentral PA Gen Auth Rev Wellspan Hlth Oblig Grp Ser A | | 6.00% | | 6/1/2029 | | Aa3 | | | 1,000 | | | 1,106,730 |
| Territory of Guam Oblig Rev Section 30 Ser A | | 5.75% | | 12/1/2034 | | BBB- | | | 535 | | | 549,445 |
| | | | | | | | | | | | |
| Total | | | | | | | | | | | | 18,001,276 |
| | | | | | | | | | | | |
| | | | | |
| Housing 4.17% | | | | | | | | | | | | |
| Allegheny Cnty PA Resdl Fin Auth Sing Fam Mtg Ser VV AMT (GNMA/FNMA) | | 4.95% | | 11/1/2037 | | Aaa | | | 980 | | | 948,209 |
| PA Hsg Fin Agy Sing Fam Mtg Ser 93 A AMT | | 4.85% | | 10/1/2021 | | AA+ | | | 3,000 | | | 3,022,980 |
| | | | | | | | | | | | |
| Total | | | | | | | | | | | | 3,971,189 |
| | | | | | | | | | | | |
| | | | | |
| Lease Obligations 3.35% | | | | | | | | | | | | |
| Philadelphia PA Muni Auth Rev Lease | | 6.375% | | 4/1/2029 | | Baa1 | | | 1,000 | | | 1,064,770 |
See Notes to Financial Statements.
163
Schedule of Investments (continued)
PENNSYLVANIA TAX FREE TRUST September 30, 2009
| | | | | | | | | | | | | |
| Investments | | Interest
Rate | | Maturity
Date | | Credit
Rating:
S&P or
Moody’s(a) | | | Principal
Amount
(000) | | Value |
| Lease Obligations (continued) | | | | | | | | | | | | | |
| Puerto Rico Comwlth Infrastr Fing Auth Mepsi Campus Pj Ser A | | 5.60% | | 10/1/2014 | | NR | | | $ | 595 | | $ | 582,862 |
| York PA Gen Auth Rev York City Recreation Corp (AMBAC) | | 5.50% | | 5/1/2018 | | NR | | | | 1,475 | | | 1,542,304 |
| | | | | | | | | | | | | |
| Total | | | | | | | | | | | | | 3,189,936 |
| | | | | | | | | | | | | |
| | | | | |
| Other Revenue 4.67% | | | | | | | | | | | | | |
| PA Econ Dev Fing Auth Allegheny Enrg Supply Co | | 7.00% | | 7/15/2039 | | BBB- | | | | 1,000 | | | 1,082,270 |
| Philadelphia PA Auth Indl Dev First Philadelphia Charter Ser A | | 5.85% | | 8/15/2037 | | BBB- | | | | 1,000 | | | 789,850 |
| Philadelphia PA Auth Indl Dev Please Touch Museum Pj | | 5.25% | | 9/1/2036 | | BBB- | | | | 1,000 | | | 821,330 |
| Philadelphia PA Auth Indl Dev Russell Byers Charter Sch Ser A | | 5.25% | | 5/1/2037 | | BBB- | | | | 1,000 | | | 722,260 |
| Philadelphia PA Auth Indl Dev Ser A | | 5.50% | | 9/15/2037 | | BBB- | | | | 1,370 | | | 1,027,144 |
| | | | | | | | | | | | | |
| Total | | | | | | | | | | | | | 4,442,854 |
| | | | | | | | | | | | | |
| | | | | |
| Pre-Refunded 10.92% | | | | | | | | | | | | | |
| Allegheny Cnty PA Redev Auth Wtrfrnt Pj Ser A | | 6.30% | | 12/15/2018 | | A- | (c) | | | 1,000 | | | 1,078,030 |
| PA Conv Ctr Auth Ser A ETM (FGIC) | | 6.70% | | 9/1/2016 | | AAA | | | | 770 | | | 894,486 |
| Philadelphia PA Auth Indl Dev Ser B (FSA) | | 5.125% | | 10/1/2026 | | AAA | | | | 1,000 | | | 1,094,170 |
| Philadelphia PA Gas Wrks Rev 12th Ser B ETM (NPFGC) | | 7.00% | | 5/15/2020 | | A | | | | 1,830 | | | 2,243,617 |
| Philadelphia PA Sch Dist Ser A (FSA) | | 5.75% | | 2/1/2019 | | AAA | | | | 450 | | | 479,911 |
| Philadelphia PA Sch Dist Ser B (FGIC) | | 5.625% | | 8/1/2022 | | Aa3 | | | | 1,000 | | | 1,127,470 |
| Philadelphia PA Sch Dist Ser D (FGIC) | | 5.25% | | 6/1/2034 | | Aa3 | | | | 2,000 | | | 2,325,220 |
| Puerto Rico Pub Bldgs Auth Rev Govt Facs Ser I GTD | | 5.375% | | 7/1/2034 | | BBB- | | | | 1,000 | | | 1,151,350 |
| | | | | | | | | | | | | |
| Total | | | | | | | | | | | | | 10,394,254 |
| | | | | | | | | | | | | |
| | | | | |
| Tax Revenue 2.43% | | | | | | | | | | | | | |
| Puerto Rico Sales Tax Fing Corp 1st Sub Ser A | | 5.25% | | 8/1/2027 | | A+ | | | | 1,000 | | | 1,072,910 |
| Puerto Rico Sales Tax Fing Corp Ser A | | 5.25% | | 8/1/2057 | | AA- | | | | 750 | | | 776,685 |
| Virgin Islands Pub Fin Auth Rev Matching Fd Ln Diago Ser A | | 6.75% | | 10/1/2037 | | BBB | | | | 440 | | | 465,538 |
| | | | | | | | | | | | | |
| Total | | | | | | | | | | | | | 2,315,133 |
| | | | | | | | | | | | | |
See Notes to Financial Statements.
164
Schedule of Investments (concluded)
PENNSYLVANIA TAX FREE TRUST September 30, 2009
| | | | | | | | | | | | | |
| Investments | | Interest
Rate | | Maturity
Date | | Credit
Rating:
S&P or
Moody’s(a) | | Principal
Amount
(000) | | | Value |
| Transportation 6.07% | | | | | | | | | | | | | |
| Delaware River Port Auth PA & NJ (FSA) | | 6.00% | | 1/1/2019 | | AAA | | $ | 1,000 | | | $ | 1,008,050 |
| PA St Tpk Commn Oil 2003 Tpk Ser C Rmkt (NPFGC) | | 5.00% | | 12/1/2029 | | AA | | | 1,000 | | | | 1,079,960 |
| PA St Tpk Commn Sub Ser B-1 | | 5.625% | | 6/1/2029 | | A2 | | | 3,310 | | | | 3,687,241 |
| | | | | | | | | | | | | |
| Total | | | | | | | | | | | | | 5,775,251 |
| | | | | | | | | | | | | |
| | | | | |
| Utilities 3.92% | | | | | | | | | | | | | |
| Delaware Cnty PA Indl Dev Auth Wtr Facs Aqua PA Inc Pj Ser B AMT (NPFGC)(FGIC) | | 5.00% | | 11/1/2036 | | AA- | | | 1,000 | | | | 986,810 |
| Luzerne Cnty PA Indl Dev Auth Amer Wtr Co Ser A AMT (AMBAC) | | 5.10% | | 9/1/2034 | | A | | | 1,000 | | | | 916,920 |
| North Huntingdon Twp PA Muni Auth GTD (AMBAC) | | 5.25% | | 4/1/2019 | | A+ | | | 760 | | | | 774,037 |
| Philadelphia PA Gas Wrks Rev 8th 1998 Gen Ordinance Ser A | | 5.25% | | 8/1/2017 | | Baa2 | | | 1,000 | | | | 1,052,300 |
| | | | | | | | | | | | | |
| Total | | | | | | | | | | | | | 3,730,067 |
| | | | | | | | | | | | | |
| Total Municipal Bonds (cost $90,418,708) | | | | | | | | | | | | | 91,998,276 |
| | | | | | | | | | | | | |
| | | | | |
| | | | | | | | | Shares
(000) | | | |
| SHORT-TERM INVESTMENT 0.00% | | | | | | | | | | | | | |
| | |
| Money Market Mutual Fund | | | | | | | |
| Dreyfus PA Municipal Money Market Fund (cost $91) | | | – | (g) | | | 91 |
| | | | | | | | | | | | | |
| Total Investments in Securities 96.67% (cost $90,418,799) | | | | | | | 91,998,367 |
| | | | | | | | | | | | | |
| Cash and Other Assets in Excess of Liabilities(f) 3.33% | | | | | | | 3,167,218 |
| | | | | | | | | | | | | |
| Net Assets 100.00% | | | | | | $ | 95,165,585 |
| | | | | | | | | | | | | |
Open Futures Contracts at September 30, 2009:
| | | | | | | | | | | | |
| Type | | Expiration | | Contracts | | Position | | Market
Value | | Unrealized
Depreciation |
| U.S. 30-Year Treasury Bond | | December 2009 | | 37 | | Short | | $ | (4,490,875) | | $ | (97,971) |
See Notes to Financial Statements.
165
Schedule of Investments
September 30, 2009
| | |
AMT | | Income from this security may be subject to Alternative Minimum Tax. |
COP | | Certificates of Participation. |
CR | | Custodial Receipt. |
ETM | | Escrow to Maturity. |
GTD | | Guaranteed. |
NR | | Not Rated. |
Pre-Refunded Bonds A second bond has been issued in order to pay off the first bond issue. Proceeds from the sale of the |
| | second bond are held in an “escrow fund” consisting of U.S. Government debt until the first bond issue reaches maturity. |
PSF | | Permanent School Fund. |
RIBs | | Residual Interest Bonds. The interest rate is subject to change periodically and inversely to the prevailing market rate. The interest rate shown is the rate in effect at September 30, 2009. |
TCRS | | Transferable Custodial Receipts. |
† | | Security was purchased pursuant to Rule 144A under the Securities Act of 1933 and, unless registered under the Act or exempted from registration, may only be resold to qualified institutional investors. Unless otherwise noted, 144A securities are deemed to be liquid. |
# | | Variable Rate Security. The interest rate represents the rate at September 30, 2009. |
(a) | | Unaudited. |
(b) | | Municipal Bonds Held in Trust—Securities represent underlying bonds transferred to a separate securitization trust established in a tender option bond transaction in which the Fund acquired the residual interest certificates. These securities serve as collateral in a financing transaction. See Note 2(h) for details of Municipal Bonds Held in Trust. |
(c) | | This investment has been rated by Fitch IBCA. |
(d) | | Securities purchased on a when-issued basis (See Note 2(g)). |
(e) | | The interest rate shown represents the rate at September 30, 2009. The date shown represents the next interest reset date. |
(f) | | Cash and Other Assets in Excess of Liabilities (Liabilities in Excess of Cash and Other Assets) include net unrealized appreciation (depreciation) on futures contracts. |
(g) | | Amount represents less than 1,000 shares. |
(h) | | Defaulted security. |
(i) | | Effective Maturity date. Average life of sinking fund due to mandatory or expected principal payments prior to maturity. |
(j) | | Fund received partial payment from Issuer. |
| | |
Insured or guaranteed by the indicated municipal bond insurance corporation or Federal agency: |
ACA | | American Capital Access Holding Ltd. |
AMBAC | | AMBAC Assurance Corporation |
AG | | Assured Guaranty |
BHAC | | Berkshire Hathaway Assurance Corporation |
CBI | | Certified Bond Insurance |
CIFG | | CIFG Guaranty |
FHLMC | | Federal Home Loan Mortgage Corporation |
FHA | | Federal Housing Administration |
FNMA | | Federal National Mortgage Association |
FGIC | | Financial Guaranty Insurance Company |
FSA | | Financial Security Assurance, Inc. |
GNMA | | Government National Mortgage Association |
IBC | | Insurance Bond Certificate |
MBIA | | Municipal Bond Investors Assurance |
NPFGC | | National Public Finance Guarantee Corporation |
RADIAN | | Radian Asset Assurance, Inc. |
SONYMA | | State of New York Mortgage Agency |
VA | | Department of Veterans Affairs |
XLCA | | XL Capital Assurance, Inc. |
See Notes to Financial Statements.
166
This page is intentionally left blank.
167
Statements of Assets and Liabilities
September 30, 2009
| | | | | | | | |
| | | National | | | California | |
ASSETS: | | | | | | | | |
Investments in securities, at cost | | $ | 1,113,994,319 | | | $ | 195,567,596 | |
Investments in securities, at value | | $ | 1,148,435,542 | | | $ | 201,246,873 | |
Cash | | | 1,454,271 | | | | 390,566 | |
Deposits with broker for futures collateral | | | 3,049,600 | | | | 374,400 | |
Receivables: | | | | | | | | |
Interest | | | 17,520,283 | | | | 2,919,446 | |
Investment securities sold | | | 23,038,143 | | | | 4,056,219 | |
Capital shares sold | | | 5,058,529 | | | | 630,612 | |
Variation margin | | | 225,447 | | | | 29,250 | |
Prepaid expenses and other assets | | | 64,518 | | | | 16,394 | |
Total assets | | | 1,198,846,333 | | | | 209,663,760 | |
LIABILITIES: | | | | | | | | |
Payables: | | | | | | | | |
Investment securities purchased | | | 21,121,383 | | | | 2,005,895 | |
Trust certificates (See Note 2(h)) | | | 99,615,000 | | | | 11,245,000 | |
Capital shares reacquired | | | 2,014,623 | | | | 189,032 | |
Management fee | | | 372,510 | | | | 68,762 | |
12b-1 distribution fees | | | 340,987 | | | | 55,367 | |
Interest expense and fees (See Note 2(h)) | | | 287,322 | | | | 36,516 | |
Fund administration | | | 35,223 | | | | 6,589 | |
Directors’ fees | | | 355,439 | | | | 140,484 | |
Distributions payable | | | 3,601,345 | | | | 603,966 | |
Accrued expenses and other liabilities | | | 183,628 | | | | 70,627 | |
Total liabilities | | | 127,927,460 | | | | 14,422,238 | |
NET ASSETS | | $ | 1,070,918,873 | | | $ | 195,241,522 | |
COMPOSITION OF NET ASSETS: | | | | | | | | |
Paid-in capital | | $ | 1,080,956,095 | | | $ | 198,238,994 | |
Distributions in excess of net investment income | | | (502,361 | ) | | | (599,807 | ) |
Accumulated net realized loss on investments and futures contracts | | | (42,021,908 | ) | | | (7,766,072 | ) |
Net unrealized appreciation (depreciation) on investments and futures contracts | | | 32,487,047 | | | | 5,368,407 | |
Net Assets | | $ | 1,070,918,873 | | | $ | 195,241,522 | |
Net assets by class: | | | | | | | | |
Class A Shares | | $ | 889,665,178 | | | $ | 159,767,937 | |
Class B Shares | | $ | 18,540,290 | | | | – | |
Class C Shares | | $ | 133,922,130 | | | $ | 28,895,920 | |
Class F Shares | | $ | 28,791,275 | | | $ | 6,577,665 | |
Outstanding shares by class*: | | | | | | | | |
Class A Shares | | | 83,759,723 | | | | 15,712,863 | |
Class B Shares | | | 1,736,584 | | | | – | |
Class C Shares | | | 12,592,713 | | | | 2,840,179 | |
Class F Shares | | | 2,712,722 | | | | 646,970 | |
Net asset value, offering and redemption price per share
(Net assets divided by outstanding shares): | | | | | | | | |
Class A Shares–Net asset value | | | $10.62 | | | | $10.17 | |
Class A Shares–Maximum offering price
(Net asset value plus sales charge of 3.25%) | | | $10.98 | | | | $10.51 | |
Class B Shares–Net asset value | | | $10.68 | | | | – | |
Class C Shares–Net asset value | | | $10.63 | | | | $10.17 | |
Class F Shares–Net asset value | | | $10.61 | | | | $10.17 | |
| * | Lord Abbett Municipal Income Fund, Inc. has 1,020,000,000 authorized shares of capital stock (par value $.001) of which 935,000,000 are issued and allocated as follows: 215,000,000 to National, 140,000,000 to each of California, New Jersey and New York, and 100,000,000 to each of Connecticut, Hawaii and Missouri. Lord Abbett Municipal Income Trust has an unlimited number of shares of beneficial interest authorized. | |
See Notes to Financial Statements.
168
| | | | | | | | | | | | | | |
| Connecticut | | | Hawaii | | | Missouri | | | New Jersey | |
| | | | | | | | | | | | | | |
| $ | 124,321,304 | | | $ | 125,991,632 | | | $ | 165,947,257 | | | $ | 127,926,658 | |
| $ | 125,907,936 | | | $ | 130,954,281 | | | $ | 168,070,883 | | | $ | 127,990,858 | |
| | 815,304 | | | | 1,895,596 | | | | 2,112,947 | | | | 205,774 | |
| | 422,400 | | | | 361,600 | | | | 339,200 | | | | 400,000 | |
| | | | | | | | | | | | | | |
| | 1,752,738 | | | | 1,871,341 | | | | 2,397,164 | | | | 2,024,871 | |
| | 15,000 | | | | 582,788 | | | | – | | | | – | |
| | 134,267 | | | | 173,175 | | | | 357,882 | | | | 410,402 | |
| | 33,002 | | | | 28,250 | | | | 26,503 | | | | 31,252 | |
| | 13,630 | | | | 12,324 | | | | 16,553 | | | | 12,620 | |
| | 129,094,277 | | | | 135,879,355 | | | | 173,321,132 | | | | 131,075,777 | |
| | | | | | | | | | | | | | |
| | | | | | | | | | | | | | |
| | – | | | | – | | | | – | | | | – | |
| | 5,080,000 | | | | 5,000,000 | | | | – | | | | – | |
| | 270,062 | | | | 7,953 | | | | 97,335 | | | | 761,130 | |
| | 44,268 | | | | 46,648 | | | | 61,860 | | | | 47,154 | |
| | 33,074 | | | | 39,801 | | | | 33,932 | | | | 38,156 | |
| | 18,567 | | | | 19,530 | | | | – | | | | – | |
| | 3,727 | | | | 4,289 | | | | 5,843 | | | | 4,531 | |
| | 27,702 | | | | 22,127 | | | | 34,637 | | | | 41,623 | |
| | 328,461 | | | | 328,272 | | | | 479,608 | | | | 378,761 | |
| | 52,451 | | | | 49,897 | | | | 58,969 | | | | 58,269 | |
| | 5,858,312 | | | | 5,518,517 | | | | 772,184 | | | | 1,329,624 | |
| $ | 123,235,965 | | | $ | 130,360,838 | | | $ | 172,548,948 | | | $ | 129,746,153 | |
| | | | | | | | | | | | | | |
| $ | 125,570,036 | | | $ | 129,355,842 | | | $ | 172,706,487 | | | $ | 135,850,472 | |
| | (337,690 | ) | | | (333,497 | ) | | | (461,320 | ) | | | (338,726 | ) |
| | (3,231,730 | ) | | | (3,320,025 | ) | | | (1,537,086 | ) | | | (5,497,633 | ) |
| 1,235,349 | | | | 4,658,518 | | | | 1,840,867 | | | | (267,960 | ) |
| $ | 123,235,965 | | | $ | 130,360,838 | | | $ | 172,548,948 | | | $ | 129,746,153 | |
| | | | | | | | | | | | | | |
| $ | 117,583,194 | | | $ | 127,321,503 | | | $ | 171,962,614 | | | $ | 128,777,597 | |
| | – | | | | – | | | | – | | | | – | |
| | – | | | | – | | | | – | | | | – | |
| $ | 5,652,771 | | | $ | 3,039,335 | | | $ | 586,334 | | | $ | 968,556 | |
| | | | | | | | | | | | | | |
| | 11,567,834 | | | | 25,875,671 | | | | 33,865,824 | | | | 26,956,499 | |
| | – | | | | – | | | | – | | | | – | |
| | – | | | | – | | | | – | | | | – | |
| | 557,439 | | | | 617,530 | | | | 115,466 | | | | 202,677 | |
| | | | | | | | | | | | | | |
| | $10.16 | | | | $4.92 | | | | $5.08 | | | | $4.78 | |
| $10.50 | | | | $5.09 | | | | $5.25 | | | | $4.94 | |
| | – | | | | – | | | | – | | | | – | |
| | – | | | | – | | | | – | | | | – | |
| | $10.14 | | | | $4.92 | | | | $5.08 | | | | $4.78 | |
See Notes to Financial Statements.
169
Statements of Assets and Liabilities (concluded)
September 30, 2009
| | | | | | | | |
| | | New York | | | Intermediate | |
ASSETS: | | | | | | | | |
Investments in securities, at cost | | $ | 278,597,747 | | | $ | 1,025,029,024 | |
Investments in securities, at value | | $ | 285,455,455 | | | $ | 1,084,625,951 | |
Cash | | | 207,621 | | | | 202,723 | |
Deposits with broker for futures collateral | | | 790,400 | | | | 1,056,000 | |
Receivables: | | | | | | | | |
Interest | | | 4,392,385 | | | | 13,690,320 | |
Investment securities sold | | | – | | | | 30,000 | |
Capital shares sold | | | 306,740 | | | | 18,289,142 | |
From advisor (See Note 3) | | | – | | | | 238,315 | |
Variation margin | | | 61,752 | | | | 82,500 | |
Prepaid expenses and other assets | | | 17,919 | | | | 108,914 | |
Total assets | | | 291,232,272 | | | | 1,118,323,865 | |
LIABILITIES: | | | | | | | | |
Payables: | | | | | | | | |
Investment securities purchased | | | 425,781 | | | | 18,841,761 | |
Trust certificates (See Note 2(h)) | | | 17,070,000 | | | | 5,735,000 | |
Capital shares reacquired | | | 315,154 | | | | 2,935,493 | |
Management fee | | | 97,155 | | | | 322,708 | |
12b-1 distribution fees | | | 93,211 | | | | 283,817 | |
Interest expense and fees (See Note 2(h)) | | | 50,310 | | | | 14,072 | |
Fund administration | | | 9,216 | | | | 32,272 | |
Directors’/Trustees’ fees | | | 124,041 | | | | 23,842 | |
Distributions payable | | | 824,819 | | | | 1,184,631 | |
Accrued expenses and other liabilities | | | 73,954 | | | | 134,969 | |
Total liabilities | | | 19,083,641 | | | | 29,508,565 | |
NET ASSETS | | $ | 272,148,631 | | | $ | 1,088,815,300 | |
COMPOSITION OF NET ASSETS: | | | | | | | | |
Paid-in capital | | $ | 274,211,712 | | | $ | 1,031,313,672 | |
Undistributed (distributions in excess of) net investment income | | | (859,550 | ) | | | (5,000 | ) |
Accumulated net realized loss on investments and futures contracts | | | (7,495,131 | ) | | | (1,392,869 | ) |
Net unrealized appreciation (depreciation) on investments and futures contracts | | | 6,291,600 | | | | 58,899,497 | |
Net Assets | | $ | 272,148,631 | | | $ | 1,088,815,300 | |
Net assets by class: | | | | | | | | |
Class A Shares | | $ | 231,451,848 | | | $ | 798,343,611 | |
Class B Shares | | | – | | | $ | 6,315,409 | |
Class C Shares | | $ | 37,554,127 | | | $ | 180,270,222 | |
Class F Shares | | $ | 3,142,656 | | | $ | 103,873,445 | |
Class I Shares | | | – | | | | – | |
Class P Shares | | | – | | | $ | 12,613 | |
Outstanding shares by class*: | | | | | | | | |
Class A Shares | | | 21,477,021 | | | | 77,672,824 | |
Class B Shares | | | – | | | | 614,979 | |
Class C Shares | | | 3,489,370 | | | | 17,561,142 | |
Class F Shares | | | 291,474 | | | | 10,108,044 | |
Class I Shares | | | – | | | | – | |
Class P Shares | | | – | | | | 1,227 | |
Net asset value, offering and redemption price per share
(Net assets divided by outstanding shares): | | | | | | | | |
Class A Shares-Net asset value | | | $10.78 | | | | $10.28 | |
Class A Shares-Maximum offering price
(Net asset value plus sales charge of 3.25%)** | | | $11.14 | | | | $10.52 | |
Class B Shares-Net asset value | | | – | | | | $10.27 | |
Class C Shares-Net asset value | | | $10.76 | | | | $10.27 | |
Class F Shares-Net asset value | | | $10.78 | | | | $10.28 | |
Class I Shares-Net asset value | | | – | | | | – | |
Class P Shares-Net asset value | | | – | | | $ | 10.28 | |
| * | Lord Abbett Municipal Income Fund, Inc. has 1,020,000,000 authorized shares of capital stock (par value $.001) of which 935,000,000 are issued and allocated as follows: 215,000,000 to National, 140,000,000 to each of California, New Jersey, and New York and 100,000,000 to each of Connecticut, Hawaii and Missouri. Lord Abbett Municipal Income Trust has an unlimited number of shares of beneficial interest authorized. | |
| ** | The maximum sales charge on Class A purchases of Intermediate Fund and Short Duration Fund is 2.25%. | |
See Notes to Financial Statements.
170
| | | | | | | | | | | | | |
| Short Duration | | Georgia | | | High Yield | | | Pennsylvania | |
| | | | | | | | | | | | | |
| $ | 822,542,707 | | $ | 130,765,750 | | | $ | 1,810,235,000 | | | $ | 90,418,799 | |
| $ | 831,464,398 | | $ | 133,917,409 | | | $ | 1,690,520,908 | | | $ | 91,998,367 | |
| | 3,140,400 | | | 4,080,169 | | | | 1,873,953 | | | | 1,588,477 | |
| | – | | | 416,000 | | | | 6,489,600 | | | | 118,400 | |
| | | | | | | | | | | | | |
| | 5,675,721 | | | 1,776,615 | | | | 29,731,444 | | | | 1,419,909 | |
| | 7,701,777 | | | 25,000 | | | | 67,783,728 | | | | 90,000 | |
| | 37,379,090 | | | 888,284 | | | | 24,463,525 | | | | 391,707 | |
| | 164,447 | | | – | | | | – | | | | – | |
| | – | | | 32,501 | | | | 507,015 | | | | 9,250 | |
| | 106,495 | | | 13,295 | | | | 102,098 | | | | 13,375 | |
| | 885,632,328 | | | 141,149,273 | | | | 1,821,472,271 | | | | 95,629,485 | |
| | | | | | | | | | | | | |
| | | | | | | | | | | | | |
| | 40,737,811 | | | – | | | | 75,295,697 | | | | – | |
| | – | | | 10,000,000 | | | | 191,572,226 | | | | – | |
| | 2,405,441 | | | 509,914 | | | | 2,523,661 | | | | 18,785 | |
| | 226,610 | | | 45,674 | | | | 517,269 | | | | 34,120 | |
| | 207,734 | | | 46,575 | | | | 116,008 | | | | 42,470 | |
| | – | | | 10,001 | | | | 459,708 | | | | – | |
| | 22,661 | | | 4,266 | | | | 42,726 | | | | 3,251 | |
| | 5,402 | | | 11,680 | | | | 70,711 | | | | 22,597 | |
| | 633,858 | | | 382,775 | | | | 6,369,777 | | | | 292,717 | |
| | 74,933 | | | 50,983 | | | | 235,139 | | | | 49,960 | |
| | 44,314,450 | | | 11,061,868 | | | | 277,202,922 | | | | 463,900 | |
| $ | 841,317,878 | | $ | 130,087,405 | | | $ | 1,544,269,349 | | | $ | 95,165,585 | |
| | | | | | | | | | | | | |
| $ | 832,344,241 | | $ | 131,615,524 | | | $ | 1,887,672,508 | | | $ | 95,260,134 | |
| | 51,946 | | | (84,643 | ) | | | (1,872,177 | ) | | | (233,629 | ) |
| | – | | | (4,248,507 | ) | | | (216,832,229 | ) | | | (1,342,517 | ) |
| | | |
| | 8,921,691 | | | 2,805,031 | | | | (124,698,753 | ) | | | 1,481,597 | |
| $ | 841,317,878 | | $ | 130,087,405 | | | $ | 1,544,269,349 | | | $ | 95,165,585 | |
| | | | | | | | | | | | | |
| $ | 609,072,003 | | $ | 124,745,705 | | | $ | 976,707,544 | | | $ | 94,781,995 | |
| | – | | | – | | | $ | 9,858 | | | | – | |
| $ | 128,116,413 | | | – | | | $ | 455,041,615 | | | | – | |
| $ | 100,722,906 | | $ | 5,341,700 | | | $ | 112,500,295 | | | $ | 383,590 | |
| $ | 3,406,556 | | | – | | | | – | | | | – | |
| | – | | | – | | | $ | 10,037 | | | | – | |
| | | | | | | | | | | | | |
| | 39,049,239 | | | 22,858,636 | | | | 85,001,180 | | | | 18,913,547 | |
| | – | | | – | | | | 856.771 | | | | – | |
| | 8,213,511 | | | – | | | | 39,585,901 | | | | – | |
| | 6,457,222 | | | 974,996 | | | | 9,784,145 | | | | 76,617 | |
| | 218,410 | | | – | | | | – | | | | – | |
| | – | | | – | | | | 873 | | | | – | |
| | | | | | | | | | | | | |
| | $15.60 | | | $5.46 | | | | $11.49 | | | | $5.01 | |
|
$15.96 | | | $5.64 | | | | $11.88 | | | | $5.18 | |
| | – | | | – | | | | $11.51 | | | | – | |
| | $15.60 | | | – | | | | $11.50 | | | | – | |
| | $15.60 | | | $5.48 | | | | $11.50 | | | | $5.01 | |
| | $15.60 | | | – | | | | – | | | | – | |
| | – | | | – | | | | $11.50 | | | | – | |
See Notes to Financial Statements.
171
Statements of Operations
For the Year Ended September 30, 2009
| | | | | | | | |
| | | National | | | California | |
Investment income: | | | | | | | | |
Interest and other | | $ | 56,324,684 | | | $ | 9,447,202 | |
Dividends | | | 111,648 | | | | 7,505 | |
Total investment income | | | 56,436,332 | | | | 9,454,707 | |
Expenses: | | | | | | | | |
Management fee | | | 3,959,209 | | | | 736,799 | |
12b-1 distribution plan-Class A | | | 1,505,745 | | | | 278,880 | |
12b-1 distribution plan-Class B | | | 168,804 | | | | – | |
12b-1 distribution plan-Class C | | | 838,120 | | | | 191,911 | |
12b-1 distribution plan-Class F | | | 14,719 | | | | 2,925 | |
Interest expense and fees (See Note 2(h)) | | | 1,288,383 | | | | 202,019 | |
Shareholder servicing | | | 393,890 | | | | 45,189 | |
Professional | | | 60,205 | | | | 43,445 | |
Reports to shareholders | | | 87,411 | | | | 9,886 | |
Fund administration | | | 352,043 | | | | 65,493 | |
Custody | | | 17,257 | | | | 5,502 | |
Directors’ fees | | | 39,722 | | | | 7,360 | |
Registration | | | 132,661 | | | | 37,139 | |
Other | | | 17,586 | | | | 4,285 | |
Gross expenses | | | 8,875,755 | | | | 1,630,833 | |
Expense reductions (See Note 7) | | | (7,405 | ) | | | (1,975 | ) |
Expenses reimbursed by advisor (See Note 3) | | | – | | | | – | |
Net expenses | | | 8,868,350 | | | | 1,628,858 | |
Net investment income | | | 47,567,982 | | | | 7,825,849 | |
Net realized and unrealized gain (loss): | | | | | | | | |
Net realized loss on investments and futures contracts | | | (30,088,584 | ) | | | (5,125,601 | ) |
Net change in unrealized appreciation/depreciation on investments and futures contracts | | | 123,455,920 | | | | 20,129,988 | |
Net realized and unrealized gain | | | 93,367,336 | | | | 15,004,387 | |
Net Increase in Net Assets Resulting From Operations | | $ | 140,935,318 | | | $ | 22,830,236 | |
See Notes to Financial Statements.
172
| | | | | | | | | | | | | | |
| Connecticut | | | Hawaii | | | Missouri | | | New Jersey | |
| | | | | | | | | | | | | | |
| $ | 6,276,929 | | | $ | 5,911,055 | | | $ | 8,054,435 | | | $ | 6,499,338 | |
| | 5,400 | | | | – | | | | – | | | | 10,574 | |
| | 6,282,329 | | | | 5,911,055 | | | | 8,054,435 | | | | 6,509,912 | |
| | | | | | | | | | | | | | |
| | 529,500 | | | | 534,481 | | | | 696,308 | | | | 524,607 | |
| | 229,731 | | | | 234,411 | | | | 308,678 | | | | 232,098 | |
| | – | | | | – | | | | – | | | | – | |
| | – | | | | – | | | | – | | | | – | |
| | 2,801 | | | | 1,562 | | | | 396 | | | | 530 | |
| | 106,030 | | | | 121,992 | | | | – | | | | – | |
| | 51,810 | | | | 44,164 | | | | 85,327 | | | | 50,399 | |
| | 41,633 | | | | 41,024 | | | | 40,618 | | | | 40,294 | |
| | 8,969 | | | | 10,933 | | | | 10,202 | | | | 7,887 | |
| | 47,067 | | | | 47,509 | | | | 61,894 | | | | 46,632 | |
| | 5,121 | | | | 3,820 | | | | 3,621 | | | | 3,625 | |
| | 5,332 | | | | 5,350 | | | | 6,984 | | | | 5,279 | |
| | 25,841 | | | | 26,363 | | | | 33,083 | | | | 26,989 | |
| | 3,792 | | | | 3,524 | | | | 3,857 | | | | 3,037 | |
| | 1,057,627 | | | | 1,075,133 | | | | 1,250,968 | | | | 941,377 | |
| | (649 | ) | | | (1,470 | ) | | | (1,667 | ) | | | (692 | ) |
| | (18,682 | ) | | | (11,316 | ) | | | (3,892 | ) | | | – | |
| | 1,038,296 | | | | 1,062,347 | | | | 1,245,409 | | | | 940,685 | |
| | 5,244,033 | | | | 4,848,708 | | | | 6,809,026 | | | | 5,569,227 | |
| | | | | | | | | | | | | | |
| | (1,539,692 | ) | | | (972,378 | ) | | | (934,873 | ) | | | (3,471,023 | ) |
| 11,950,874 | | | | 11,276,879 | | | | 15,227,219 | | | | 12,909,435 | |
| | 10,411,182 | | | | 10,304,501 | | | | 14,292,346 | | | | 9,438,412 | |
| $ | 15,655,215 | | | $ | 15,153,209 | | | $ | 21,101,372 | | | $ | 15,007,639 | |
See Notes to Financial Statements.
173
Statements of Operations (concluded)
For the Year Ended September 30, 2009
| | | | | | | | |
| | | New York | | | Intermediate | |
Investment income: | | | | | | | | |
Interest and other | | $ | 13,962,958 | | | $ | 29,670,837 | |
Dividends | | | 29,528 | | | | 133,701 | |
Total investment income | | | 13,992,486 | | | | 29,804,538 | |
Expenses: | | | | | | | | |
Management fee | | | 1,091,400 | | | | 2,742,857 | |
12b-1 distribution plan-Class A | | | 417,913 | | | | 1,075,137 | |
12b-1 distribution plan-Class B | | | – | | | | 43,353 | |
12b-1 distribution plan-Class C | | | 280,729 | | | | 936,535 | |
12b-1 distribution plan-Class F | | | 1,482 | | | | 45,239 | |
12b-1 distribution plan-Class P | | | – | | | | 53 | |
Interest expense and fees (See Note 2(h)) | | | 217,224 | | | | 55,106 | |
Shareholder servicing | | | 109,720 | | | | 221,789 | |
Professional | | | 45,071 | | | | 53,150 | |
Offering costs | | | – | | | | – | |
Reports to shareholders | | | 14,807 | | | | 77,622 | |
Fund administration | | | 97,013 | | | | 274,286 | |
Custody | | | 3,582 | | | | 13,116 | |
Directors’/Trustees’ fees | | | 10,955 | | | | 30,502 | |
Registration | | | 39,458 | | | | 144,817 | |
Other | | | 6,788 | | | | 10,824 | |
Gross expenses | | | 2,336,142 | | | | 5,724,386 | |
Expense reductions (See Note 7) | | | (1,363 | ) | | | (4,980 | ) |
Expenses reimbursed by advisor (See Note 3) | | | – | | | | (1,998,935 | ) |
Net expenses | | | 2,334,779 | | | | 3,720,471 | |
Net investment income | | | 11,657,707 | | | | 26,084,067 | |
Net realized and unrealized gain (loss): | | | | | | | | |
Net realized loss on investments and futures contracts | | | (5,999,809 | ) | | | (564,741 | ) |
Net change in unrealized appreciation/depreciation on investments and futures contracts | | | 31,563,563 | | | | 71,877,518 | |
Net realized and unrealized gain | | | 25,563,754 | | | | 71,312,777 | |
Net Increase in Net Assets Resulting From Operations | | $ | 37,221,461 | | | $ | 97,396,844 | |
| * | For the period December 12, 2008 (commencement of investment operations) to September 30, 2009. | |
See Notes to Financial Statements.
174
| | | | | | | | | | | | | | |
| Short Duration* | | | Georgia | | | High Yield | | | Pennsylvania | |
| | | | | | | | | | | | | | |
| $ | 5,988,550 | | | $ | 6,554,426 | | | $ | 77,429,150 | | | $ | 4,840,558 | |
| | 13,973 | | | | – | | | | 92,589 | | | | 9,841 | |
| | 6,002,523 | | | | 6,554,426 | | | | 77,521,739 | | | | 4,850,399 | |
| | | | | | | | | | | | | | |
| | 752,466 | | | | 532,331 | | | | 4,720,966 | | | | 387,988 | |
| | 269,261 | | | | 230,724 | | | | 1,188,399 | | | | 172,073 | |
| | – | | | | – | | | | 84 | | | | – | |
| | 292,047 | | | | – | | | | 2,674,254 | | | | – | |
| | 23,743 | | | | 2,934 | | | | 38,307 | | | | 177 | |
| | – | | | | – | | | | 38 | | | | – | |
| | – | | | | 152,296 | | | | 1,712,007 | | | | 56,639 | |
| | 42,601 | | | | 66,225 | | | | 574,009 | | | | 46,681 | |
| | 37,742 | | | | 41,821 | | | | 124,607 | | | | 40,705 | |
| | 46,641 | | | | – | | | | – | | | | – | |
| | 29,693 | | | | 10,659 | | | | 100,945 | | | | 7,117 | |
| | 75,246 | | | | 47,318 | | | | 379,624 | | | | 34,488 | |
| | 5,688 | | | | 3,864 | | | | 17,078 | | | | 4,102 | |
| | 7,206 | | | | 5,349 | | | | 42,092 | | | | 3,892 | |
| | 45,330 | | | | 26,738 | | | | 149,903 | | | | 24,962 | |
| | 4,032 | | | | 4,210 | | | | 33,876 | | | | 3,418 | |
| | 1,631,696 | | | | 1,124,469 | | | | 11,756,189 | | | | 782,242 | |
| | (314 | ) | | | (1,413 | ) | | | (8,770 | ) | | | (647 | ) |
| | (576,040 | ) | | | (1,637 | ) | | | (44,369 | ) | | | – | |
| | 1,055,342 | | | | 1,121,419 | | | | 11,703,050 | | | | 781,595 | |
| | 4,947,181 | | | | 5,433,007 | | | | 65,818,689 | | | | 4,068,804 | |
| | | | | | | | | | | | | | |
| | – | | | | (2,541,856 | ) | | | (116,922,838 | ) | | | (1,152,401 | ) |
| 8,921,691 | | | | 14,577,455 | | | | 124,885,305 | | | | 8,350,002 | |
| | 8,921,691 | | | | 12,035,599 | | | | 7,962,467 | | | | 7,197,601 | |
| $ | 13,868,872 | | | $ | 17,468,606 | | | $ | 73,781,156 | | | $ | 11,266,405 | |
See Notes to Financial Statements.
175
Statements of Changes in Net Assets
| | | | | | | | |
| | | National | |
| INCREASE (DECREASE) IN NET ASSETS | | For the
Year Ended
September 30, 2009 | | | For the
Year Ended
September 30, 2008 | |
Operations: | | | | | | | | |
Net investment income | | $ | 47,567,982 | | | $ | 39,931,675 | |
Net realized loss on investments and futures contracts | | | (30,088,584 | ) | | | (2,378,882 | ) |
Net change in unrealized appreciation/depreciation on investments and futures contracts | | | 123,455,920 | | | | (111,917,713 | ) |
Net increase (decrease) in net assets resulting from operations | | | 140,935,318 | | | | (74,364,920 | ) |
Distributions to shareholders from: | | | | | | | | |
Net investment income | | | | | | | | |
Class A | | | (40,520,796 | ) | | | (36,017,548 | ) |
Class B | | | (764,822 | ) | | | (827,352 | ) |
Class C | | | (4,550,689 | ) | | | (3,051,442 | ) |
Class F | | | (796,151 | ) | | | (32,167 | ) |
Total distributions to shareholders | | | (46,632,458 | ) | | | (39,928,509 | ) |
Capital share transactions (Net of share conversions) (See Note 11): | |
Net proceeds from sales of shares | | | 319,576,158 | | | | 271,142,139 | |
Net proceeds from reorganizations (See Note 13) | | | — | | | | 272,039,008 | |
Reinvestment of distributions | | | 31,401,261 | | | | 26,059,036 | |
Cost of shares reacquired | | | (215,201,981 | ) | | | (214,374,558 | ) |
Net increase (decrease) in net assets
resulting from capital share transactions | | | 135,775,438 | | | | 354,865,625 | |
Net increase (decrease) in net assets | | | 230,078,298 | | | | 240,572,196 | |
NET ASSETS: | | | | | | | | |
Beginning of year | | $ | 840,840,575 | | | $ | 600,268,379 | |
End of year | | $ | 1,070,918,873 | | | $ | 840,840,575 | |
Distributions in excess of net investment income | | $ | (502,361 | ) | | $ | (1,433,638 | ) |
See Notes to Financial Statements.
176
| | | | | | | | | | | | | | |
| California | | | Connecticut | |
For the
Year Ended
September 30, 2009 | | | For the
Year Ended
September 30, 2008 | | | For the
Year Ended
September 30, 2009 | | | For the
Year Ended
September 30, 2008 | |
| | | | | | | | | | | | | | |
| $ | 7,825,849 | | | $ | 7,200,828 | | | $ | 5,244,033 | | | $ | 5,622,830 | |
| | (5,125,601 | ) | | | (1,367,721 | ) | | | (1,539,692 | ) | | | (566,575 | ) |
| 20,129,988 | | | | (18,510,181 | ) | | | 11,950,874 | | | | (13,529,733 | ) |
| | 22,830,236 | | | | (12,677,074 | ) | | | 15,655,215 | | | | (8,473,478 | ) |
| | | | | | | | | | | | | | |
| | | | | | | | | | | | | | |
| | (6,913,354 | ) | | | (6,687,528 | ) | | | (5,028,340 | ) | | | (5,716,113 | ) |
| | — | | | | — | | | | — | | | | — | |
| | (928,561 | ) | | | (642,468 | ) | | | — | | | | — | |
| | (145,527 | ) | | | (3,339 | ) | | | (122,079 | ) | | | (4,316 | ) |
| | (7,987,442 | ) | | | (7,333,335 | ) | | | (5,150,419 | ) | | | (5,720,429 | ) |
| | | | | | | | | | | | | | |
| | 51,777,224 | | | | 42,418,367 | | | | 21,624,214 | | | | 46,125,664 | |
| | — | | | | — | | | | — | | | | — | |
| | 5,121,440 | | | | 4,656,181 | | | | 3,275,760 | | | | 3,524,732 | |
| | (39,743,263 | ) | | | (26,969,184 | ) | | | (40,758,215 | ) | | | (43,200,827 | ) |
|
17,155,401 |
| | | 20,105,364 | | | | (15,858,241 | ) | | | 6,449,569 | |
| | 31,998,195 | | | | 94,955 | | | | (5,353,445 | ) | | | (7,744,338 | ) |
| | | | | | | | | | | | | | |
| $ | 163,243,327 | | | $ | 163,148,372 | | | $ | 128,589,410 | | | $ | 136,333,748 | |
| $ | 195,241,522 | | | $ | 163,243,327 | | | $ | 123,235,965 | | | $ | 128,589,410 | |
| $ | (599,807 | ) | | $ | (434,770 | ) | | $ | (337,690 | ) | | $ | (478,340 | ) |
See Notes to Financial Statements.
177
Statements of Changes in Net Assets (continued)
| | | | | | | | |
| | | Hawaii | |
| INCREASE (DECREASE) IN NET ASSETS | | For the
Year Ended
September 30, 2009 | | | For the
Year Ended
September 30, 2008 | |
Operations: | | | | | | | | |
Net investment income | | $ | 4,848,708 | | | $ | 4,591,113 | |
Net realized gain (loss) on investments and futures contracts | | | (972,378 | ) | | | (629,400 | ) |
Net change in unrealized appreciation/depreciation on investments and futures contracts | | | 11,276,879 | | | | (8,960,399 | ) |
Net increase (decrease) in net assets resulting from operations | | | 15,153,209 | | | | (4,998,686 | ) |
Distributions to shareholders from: | | | | | | | | |
Net investment income | | | | | | | | |
Class A | | | (4,814,323 | ) | | | (4,759,615 | ) |
Class F | | | (63,791 | ) | | | (593 | ) |
Total distributions to shareholders | | | (4,878,114 | ) | | | (4,760,208 | ) |
Capital share transactions (See Note 11): | | | | | | | | |
Net proceeds from sales of shares | | | 23,857,618 | | | | 27,469,605 | |
Reinvestment of distributions | | | 3,260,949 | | | | 3,129,218 | |
Cost of shares reacquired | | | (22,199,499 | ) | | | (9,672,012 | ) |
Net increase in net assets resulting from
capital share transactions | | | 4,919,068 | | | | 20,926,811 | |
Net increase (decrease) in net assets | | | 15,194,163 | | | | 11,167,917 | |
NET ASSETS: | | | | | | | | |
Beginning of year | | $ | 115,166,675 | | | $ | 103,998,758 | |
End of year | | $ | 130,360,838 | | | $ | 115,166,675 | |
Distributions in excess of net investment income | | $ | (333,497 | ) | | $ | (393,646 | ) |
See Notes to Financial Statements.
178
| | | | | | | | | | | | | | |
| Missouri | | | New Jersey | |
For the
Year Ended
September 30, 2009 | | | For the
Year Ended
September 30, 2008 | | | For the
Year Ended
September 30, 2009 | | | For the
Year Ended
September 30, 2008 | |
| | | | | | | | | | | | | | |
| $ | 6,809,026 | | | $ | 6,678,376 | | | $ | 5,569,227 | | | $ | 5,455,509 | |
| | (934,873 | ) | | | 25,538 | | | | (3,471,023 | ) | | | 791,140 | |
| 15,227,219 | | | | (17,210,647 | ) | | | 12,909,435 | | | | (15,724,006 | ) |
| | 21,101,372 | | | | (10,506,733 | ) | | | 15,007,639 | | | | (9,477,357 | ) |
| | | | | | | | | | | | | | |
| | | | | | | | | | | | | | |
| | (6,822,983 | ) | | | (6,851,445 | ) | | | (5,504,244 | ) | | | (5,578,056 | ) |
| | (17,442 | ) | | | (1,238 | ) | | | (24,708 | ) | | | (1,057 | ) |
| | (6,840,425 | ) | | | (6,852,683 | ) | | | (5,528,952 | ) | | | (5,579,113 | ) |
| | | | | | | | | | | | | | |
| | 26,814,334 | | | | 25,053,207 | | | | 19,267,520 | | | | 21,332,752 | |
| | 5,892,401 | | | | 5,759,335 | | | | 3,541,640 | | | | 3,367,855 | |
| | (24,103,013 | ) | | | (22,756,012 | ) | | | (17,293,676 | ) | | | (24,008,559 | ) |
| 8,603,722 | | | | 8,056,530 | | | | 5,515,484 | | | | 692,048 | |
| | 22,864,669 | | | | (9,302,886 | ) | | | 14,994,171 | | | | (14,364,422 | ) |
| | | | | | | | | | | | | | |
| $ | 149,684,279 | | | $ | 158,987,165 | | | $ | 114,751,982 | | | $ | 129,116,404 | |
| $ | 172,548,948 | | | $ | 149,684,279 | | | $ | 129,746,153 | | | $ | 114,751,982 | |
| $ | (461,320 | ) | | $ | (532,053 | ) | | $ | (338,726 | ) | | $ | (402,345 | ) |
See Notes to Financial Statements.
179
Statements of Changes in Net Assets (continued)
| | | | | | | | |
| | | New York | |
| | | For the
Year Ended
September 30, 2009 | | | For the
Year Ended
September 30, 2008 | |
| INCREASE (DECREASE) IN NET ASSETS | | |
Operations: | | | | | | | | |
Net investment income | | $ | 11,657,707 | | | $ | 11,539,635 | |
Net realized loss on investments and futures contracts | | | (5,999,809 | ) | | | (720,160 | ) |
Net change in unrealized appreciation/depreciation on investments and futures contracts | | | 31,563,563 | | | | (31,180,494 | ) |
Net increase (decrease) in net assets resulting from operations | | | 37,221,461 | | | | (20,361,019 | ) |
Distributions to shareholders from: | | | | | | | | |
Net investment income | | | | | | | | |
Class A | | | (10,096,525 | ) | | | (10,553,686 | ) |
Class B | | | – | | | | – | |
Class C | | | (1,353,603 | ) | | | (1,199,725 | ) |
Class F | | | (72,062 | ) | | | (450 | ) |
Class I | | | – | | | | – | |
Class P | | | – | | | | – | |
Total distributions to shareholders | | | (11,522,190 | ) | | | (11,753,861 | ) |
Capital share transactions (Net of share conversions) (See Note 11): | |
Net proceeds from sales of shares | | | 38,088,512 | | | | 72,729,237 | |
Reinvestment of distributions | | | 6,706,659 | | | | 6,637,415 | |
Cost of shares reacquired | | | (50,674,441 | ) | | | (63,771,702 | ) |
Net increase (decrease) in net assets
resulting from capital share transactions | | | (5,879,270 | ) | | | 15,594,950 | |
Net increase (decrease) in net assets | | | 19,820,001 | | | | (16,519,930 | ) |
NET ASSETS: | | | | | | | | |
Beginning of period | | $ | 252,328,630 | | | $ | 268,848,560 | |
End of period | | $ | 272,148,631 | | | $ | 252,328,630 | |
Undistributed (distributions in excess of) net investment income | | $ | (859,550 | ) | | $ | (1,013,960 | ) |
| * | For the period December 12, 2008 (commencement of investment operations) to September 30, 2009. | |
See Notes to Financial Statements.
180
| | | | | | | | | | |
| Intermediate | | | Short Duration | |
For the
Year Ended
September 30, 2009 | | | For the
Year Ended
September 30, 2008 | | | For the Period
December 12, 2008 to
September 30, 2009* | |
| | | | | | | | | | |
| $ | 26,084,067 | | | $ | 4,539,787 | | | $ | 4,947,181 | |
| | (564,741 | ) | | | (514,744 | ) | | | – | |
| 71,877,518 | | | | (13,202,699 | ) | | | 8,921,691 | |
| | 97,396,844 | | | | (9,177,656 | ) | | | 13,868,872 | |
| | | | | | | | | | |
| | | | | | | | | | |
| | (20,982,436 | ) | | | (3,925,358 | ) | | | (3,677,199 | ) |
| | (134,977 | ) | | | (38,815 | ) | | | – | |
| | (3,188,658 | ) | | | (562,575 | ) | | | (558,944 | ) |
| | (1,778,492 | ) | | | (12,157 | ) | | | (696,190 | ) |
| | – | | | | – | | | | (14,830 | ) |
| | (435 | ) | | | (422 | ) | | | – | |
| | (26,084,998 | ) | | | (4,539,327 | ) | | | (4,947,163 | ) |
| | | | | | | | | | |
| | 912,002,268 | | | | 443,992,535 | | | | 882,089,897 | |
| | 15,229,127 | | | | 2,455,571 | | | | 2,277,818 | |
| | (295,966,280 | ) | | | (68,610,436 | ) | | | (51,971,546 | ) |
|
631,265,115 |
| | | 377,837,670 | | | | 832,396,169 | |
| | 702,576,961 | | | | 364,120,687 | | | | 841,317,878 | |
| | | | | | | | | | |
| $ | 386,238,339 | | | $ | 22,117,652 | | | $ | – | |
| $ | 1,088,815,300 | | | $ | 386,238,339 | | | $ | 841,317,878 | |
| $ | (5,000 | ) | | $ | 2,669 | | | $ | 51,946 | |
See Notes to Financial Statements.
181
Statements of Changes in Net Assets (concluded)
| | | | | | | | |
| | | Georgia | |
| INCREASE (DECREASE) IN NET ASSETS | | For the
Year Ended
September 30, 2009 | | | For the
Year Ended
September 30, 2008 | |
Operations: | | | | | | | | |
Net investment income | | $ | 5,433,007 | | | $ | 5,453,071 | |
Net realized gain (loss) on investments and futures contracts | | | (2,541,856 | ) | | | (761,978 | ) |
Net change in unrealized appreciation/depreciation on
investments and futures contracts | | | 14,577,455 | | | | (13,577,713 | ) |
Net increase (decrease) in net assets resulting from operations | | | 17,468,606 | | | | (8,886,620 | ) |
Distributions to shareholders from: | | | | | | | | |
Net investment income | | | | | | | | |
Class A | | | (5,276,669 | ) | | | (5,530,699 | ) |
Class B | | | – | | | | – | |
Class C | | | – | | | | – | |
Class F | | | (135,444 | ) | | | (2,393 | ) |
Class P | | | – | | | | – | |
Total distributions to shareholders | | | (5,412,113 | ) | | | (5,533,092 | ) |
Capital share transactions (See Note 11): | | | | | | | | |
Net proceeds from sales of shares | | | 29,162,560 | | | | 27,835,905 | |
Reinvestment of distributions | | | 4,214,153 | | | | 4,204,886 | |
Cost of shares reacquired | �� | | (39,634,219 | ) | | | (26,941,193 | ) |
Net increase (decrease) in net assets
resulting from capital share transactions | | | (6,257,506 | ) | | | 5,099,598 | |
Net increase (decrease) in net assets | | | 5,798,987 | | | | (9,320,114 | ) |
NET ASSETS: | | | | | | | | |
Beginning of year | | $ | 124,288,418 | | | $ | 133,608,532 | |
End of year | | $ | 130,087,405 | | | $ | 124,288,418 | |
Undistributed (distributions in excess of) net investment income | | $ | (84,643 | ) | | $ | (109,622 | ) |
See Notes to Financial Statements.
182
| | | | | | | | | | | | | | |
| High Yield | | | Pennsylvania | |
For the
Year Ended
September 30, 2009 | | | For the
Year Ended
September 30, 2008 | | | For the
Year Ended
September 30, 2009 | | | For the
Year Ended
September 30, 2008 | |
| | | | | | | | | | | | | | |
| $ | 65,818,689 | | | $ | 67,109,142 | | | $ | 4,068,804 | | | $ | 4,042,240 | |
| | (116,922,838 | ) | | | (79,017,884 | ) | | | (1,152,401 | ) | | | 524,287 | |
|
124,885,305 |
| | | (212,898,586 | ) | | | 8,350,002 | | | | (10,069,048 | ) |
| | 73,781,156 | | | | (224,807,328 | ) | | | 11,266,405 | | | | (5,502,521 | ) |
| | | | | | | | | | | | | | |
| | | | | | | | | | | | | | |
| | (43,828,188 | ) | | | (44,351,346 | ) | | | (4,078,231 | ) | | | (4,053,944 | ) |
| | (560 | ) | | | (539 | ) | | | – | | | | – | |
| | (21,416,626 | ) | | | (22,886,895 | ) | | | – | | | | – | |
| | (2,811,714 | ) | | | (104,811 | ) | | | (8,767 | ) | | | (447 | ) |
| | (610 | ) | | | (594 | ) | | | – | | | | – | |
| | (68,057,698 | ) | | | (67,344,185 | ) | | | (4,086,998 | ) | | | (4,054,391 | ) |
| | | | | | | | | | | | | | |
| | 759,223,871 | | | | 523,404,854 | | | | 11,948,577 | | | | 8,760,886 | |
| | 41,071,979 | | | | 39,074,666 | | | | 2,500,029 | | | | 2,389,327 | |
| | (354,365,850 | ) | | | (675,334,052 | ) | | | (13,380,287 | ) | | | (8,823,444 | ) |
|
445,930,000 |
| | | (112,854,532 | ) | | | 1,068,319 | | | | 2,326,769 | |
| | 451,653,458 | | | | (405,006,045 | ) | | | 8,247,726 | | | | (7,230,143 | ) |
| | | | | | | | | | | | | | |
| $ | 1,092,615,891 | | | $ | 1,497,621,936 | | | $ | 86,917,859 | | | $ | 94,148,002 | |
| $ | 1,544,269,349 | | | $ | 1,092,615,891 | | | $ | 95,165,585 | | | $ | 86,917,859 | |
| $ | (1,872,177 | ) | | $ | 290,123 | | | $ | (233,629 | ) | | $ | (214,474 | ) |
See Notes to Financial Statements.
183
Financial Highlights
NATIONAL TAX FREE FUND
| | | | | | | | | | | | | | | |
| | | Class A Shares | |
| | | Year Ended 9/30 | |
| | | 2009 | | | 2008 | | | 2007 | | | 2006 | | | 2005 | |
Per Share Operating Performance | | | | | | | | | | |
Net asset value, beginning of year | | $ 9.71 | | | $11.12 | | | $11.52 | | | $11.55 | | | $11.49 | |
| | | | | | | | | | | | | | | |
| | | | | |
Investment operations: | | | | | | | | | | | | | | | |
| | | | | |
Net investment income(a) | | .52 | | | .51 | | | .49 | | | .46 | | | .47 | |
| | | | | |
Net realized and unrealized gain (loss) | | .90 | | | (1.41 | ) | | (.40 | ) | | (.02 | ) | | .05 | |
| | | | | | | | | | | | | | | |
| | | | | |
Total from investment operations | | 1.42 | | | (.90 | ) | | .09 | | | .44 | | | .52 | |
| | | | | | | | | | | | | | | |
| | | | | |
Distributions to shareholders from: | | | | | | | | | | | | | | | |
| | | | | |
Net investment income | | (.51 | ) | | (.51 | ) | | (.49 | ) | | (.47 | ) | | (.46 | ) |
| | | | | | | | | | | | | | | |
Net asset value, end of year | | $10.62 | | | $ 9.71 | | | $11.12 | | | $11.52 | | | $11.55 | |
| | | | | | | | | | | | | | | |
| | | | | |
Total Return(b) | | 15.40 | % | | (8.41 | )% | | .79 | % | | 3.94 | % | | 4.53 | % |
| | | | | |
Ratios to Average Net Assets: | | | | | | | | | | | | | | | |
| | | | | |
Expenses, excluding expense reductions and including expenses reimbursed | | .92 | % | | 1.05 | % | | 1.18 | % | | 1.20 | % | | 1.13 | % |
| | | | | |
Expenses, excluding interest expense, including expense reductions and expenses reimbursed(c) | | .77 | % | | .79 | % | | .77 | % | | .92 | % | | .93 | % |
| | | | | |
Expenses, excluding expense reductions and expenses reimbursed | | .92 | % | | 1.06 | % | | 1.27 | % | | 1.20 | % | | 1.14 | % |
| | | | | |
Net investment income | | 5.49 | % | | 4.77 | % | | 4.34 | % | | 4.04 | % | | 4.03 | % |
| | | | | |
| Supplemental Data: | | | | | | | | | | | | | | | |
Net assets, end of year (000) | | $889,665 | | | $740,198 | | | $525,513 | | | $499,778 | | | $497,310 | |
| | | | | |
Portfolio turnover rate | | 45.22 | % | | 88.15 | % | | 49.43 | % | | 72.24 | % | | 118.31 | % |
| (a) | | Calculated using average shares outstanding during the year. |
| (b) | | Total return does not consider the effects of sales loads and assumes the reinvestment of all distributions. |
| (c) | | Interest expense relates to the liability for floating rate notes issued in conjunction with tender option bond trusts. |
See Notes to Financial Statements.
184
Financial Highlights (continued)
NATIONAL TAX FREE FUND
| | | | | | | | | | | | | | | |
| | | Class B Shares | |
| | | Year Ended 9/30 | |
| | | 2009 | | | 2008 | | | 2007 | | | 2006 | | | 2005 | |
Per Share Operating Performance | | | | | | | | | | | | | | | |
Net asset value, beginning of year | | $ 9.75 | | | $11.16 | | | $11.56 | | | $11.58 | | | $11.52 | |
| | | | | | | | | | | | | | | |
| | | | | |
Investment operations: | | | | | | | | | | | | | | | |
| | | | | |
Net investment income(a) | | .45 | | | .42 | | | .41 | | | .39 | | | .39 | |
| | | | | |
Net realized and unrealized gain (loss) | | .91 | | | (1.41 | ) | | (.40 | ) | | (.02 | ) | | .05 | |
| | | | | | | | | | | | | | | |
| | | | | |
Total from investment operations | | 1.36 | | | (.99 | ) | | .01 | | | .37 | | | .44 | |
| | | | | | | | | | | | | | | |
| | | | | |
Distributions to shareholders from: | | | | | | | | | | | | | | | |
| | | | | |
Net investment income | | (.43 | ) | | (.42 | ) | | (.41 | ) | | (.39 | ) | | (.38 | ) |
| | | | | | | | | | | | | | | |
Net asset value, end of year | | $10.68 | | | $ 9.75 | | | $11.16 | | | $11.56 | | | $11.58 | |
| | | | | | | | | | | | | | | |
| | | | | |
Total Return(b) | | 14.48 | % | | (9.08 | )% | | .08 | % | | 3.32 | % | | 3.83 | % |
| | | | | |
Ratios to Average Net Assets: | | | | | | | | | | | | | | | |
| | | | | |
Expenses, excluding expense reductions and including expenses reimbursed | | 1.72 | % | | 1.85 | % | | 1.90 | % | | 1.86 | % | | 1.78 | % |
| | | | | |
Expenses, excluding interest expense, including expense reductions and expenses reimbursed(c) | | 1.57 | % | | 1.58 | % | | 1.49 | % | | 1.58 | % | | 1.58 | % |
| | | | | |
Expenses, excluding expense reductions and expenses reimbursed | | 1.72 | % | | 1.86 | % | | 1.99 | % | | 1.86 | % | | 1.79 | % |
| | | | | |
Net investment income | | 4.70 | % | | 3.94 | % | | 3.61 | % | | 3.39 | % | | 3.38 | % |
| | | | | |
| Supplemental Data: | | | | | | | | | | | | | | | |
Net assets, end of year (000) | | $18,540 | | | $18,032 | | | $23,502 | | | $27,871 | | | $31,209 | |
| | | | | |
Portfolio turnover rate | | 45.22 | % | | 88.15 | % | | 49.43 | % | | 72.24 | % | | 118.31 | % |
| (a) | | Calculated using average shares outstanding during the year. |
| (b) | | Total return does not consider the effects of sales loads and assumes the reinvestment of all distributions. |
| (c) | | Interest expense relates to the liability for floating rate notes issued in conjunction with tender option bond trusts. |
See Notes to Financial Statements.
185
Financial Highlights (continued)
NATIONAL TAX FREE FUND
| | | | | | | | | | | | | | | |
| | | Class C Shares | |
| | | Year Ended 9/30 | |
| | | 2009 | | | 2008 | | | 2007 | | | 2006 | | | 2005 | |
Per Share Operating Performance | | | | | | | | | | | | | |
Net asset value, beginning of year | | $ 9.73 | | | $11.15 | | | $11.54 | | | $11.57 | | | $11.50 | |
| | | | | | | | | | | | | | | |
| | | | | |
Investment operations: | | | | | | | | | | | | | | | |
| | | | | |
Net investment income(a) | | .46 | | | .44 | | | .42 | | | .39 | | | .39 | |
| | | | | |
Net realized and unrealized gain (loss) | | .89 | | | (1.41 | ) | | (.39 | ) | | (.02 | ) | | .06 | |
| | | | | | | | | | | | | | | |
| | | | | |
Total from investment operations | | 1.35 | | | (.97 | ) | | .03 | | | .37 | | | .45 | |
| | | | | | | | | | | | | | | |
| | | | | |
Distributions to shareholders from: | | | | | | | | | | | | | | | |
| | | | | |
Net investment income | | (.45 | ) | | (.45 | ) | | (.42 | ) | | (.40 | ) | | (.38 | ) |
| | | | | | | | | | | | | | | |
Net asset value, end of year | | $10.63 | | | $ 9.73 | | | $11.15 | | | $11.54 | | | $11.57 | |
| | | | | | | | | | | | | | | |
| | | | | |
Total Return(b) | | 14.58 | % | | (9.01 | )% | | .23 | % | | 3.26 | % | | 3.93 | % |
| | | | | |
Ratios to Average Net Assets: | | | | | | | | | | | | | | | |
| | | | | |
Expenses, excluding expense reductions and including expenses reimbursed | | 1.59 | % | | 1.67 | % | | 1.82 | % | | 1.86 | % | | 1.78 | % |
| | | | | |
Expenses, excluding interest expense, including expense reductions and expenses reimbursed(c) | | 1.45 | % | | 1.41 | % | | 1.41 | % | | 1.58 | % | | 1.58 | % |
| | | | | |
Expenses, excluding expense reductions and expenses reimbursed | | 1.59 | % | | 1.68 | % | | 1.91 | % | | 1.86 | % | | 1.79 | % |
| | | | | |
Net investment income | | 4.78 | % | | 4.13 | % | | 3.70 | % | | 3.39 | % | | 3.38 | % |
| | | | | |
| Supplemental Data: | | | | | | | | | | | | | | | |
Net assets, end of year (000) | | $133,922 | | | $80,301 | | | $51,244 | | | $44,450 | | | $41,322 | |
| | | | | |
Portfolio turnover rate | | 45.22 | % | | 88.15 | % | | 49.43 | % | | 72.24 | % | | 118.31 | % |
| (a) | | Calculated using average shares outstanding during the year. |
| (b) | | Total return does not consider the effects of sales loads and assumes the reinvestment of all distributions. |
| (c) | | Interest expense relates to the liability for floating rate notes issued in conjunction with tender option bond trusts. |
See Notes to Financial Statements.
186
Financial Highlights (concluded)
NATIONAL TAX FREE FUND
| | | | | | | | | |
| | | Class F Shares | |
| | | Year Ended 9/30 | | | 9/28/2007(a)
to
9/30/2007 | |
| | | 2009 | | | 2008 | | |
Per Share Operating Performance | | | | | | | | | |
Net asset value, beginning of period | | $ 9.71 | | | $11.12 | | | $11.12 | |
| | | | | | | | | |
| | | |
Investment operations: | | | | | | | | | |
| | | |
Net investment income(b) | | .53 | | | .52 | | | – | (c) |
| | | |
Net realized and unrealized gain (loss) | | .89 | | | (1.41 | ) | | – | (c) |
| | | | | | | | | |
| | | |
Total from investment operations | | 1.42 | | | (.89 | ) | | – | (c) |
| | | | | | | | | |
| | | |
Distributions to shareholders from: | | | | | | | | | |
| | | |
Net investment income | | (.52 | ) | | (.52 | ) | | – | |
| | | | | | | | | |
Net asset value, end of period | | $10.61 | | | $ 9.71 | | | $11.12 | |
| | | | | | | | | |
| | | |
Total Return(d) | | 15.44 | % | | (8.32 | )% | | .00 | % |
| | | |
Ratios to Average Net Assets: | | | | | | | | | |
| | | |
Expenses, excluding expense reductions and including expenses reimbursed | | .81 | % | | .95 | % | | .00 | %(e)(f) |
| | | |
Expenses, excluding interest expense, including expense reductions and expenses reimbursed(g) | | .67 | % | | .69 | % | | .00 | %(e)(f) |
| | | |
Expenses, excluding expense reductions and expenses reimbursed | | .81 | % | | .97 | % | | .00 | %(e)(f) |
| | | |
Net investment income | | 5.45 | % | | 5.00 | % | | .00 | %(e)(f) |
| | | |
| Supplemental Data: | | | | | | | | | |
Net assets, end of period (000) | | $28,791 | | | $2,310 | | | $10 | |
| | | |
Portfolio turnover rate | | 45.22 | % | | 88.15 | % | | 49.43 | % |
| (a) | | Commencement of investment operations was 9/28/2007, SEC effective date was 9/14/2007 and date shares first became available to the public was 10/1/2007. |
| (b) | | Calculated using average shares outstanding during the period. |
| (c) | | Amount is less than $.01. |
| (d) | | Total return assumes the reinvestment of all distributions. |
| (f) | | Amount is less than .01%. |
| (g) | | Interest expense relates to the liability for floating rate notes issued in conjunction with tender option bond trusts. |
See Notes to Financial Statements.
187
Financial Highlights
CALIFORNIA TAX FREE FUND
| | | | | | | | | | | | | | | |
| | | Class A Shares | |
| | | Year Ended 9/30 | |
| | | 2009 | | | 2008 | | | 2007 | | | 2006 | | | 2005 | |
Per Share Operating Performance | | | | | | | | | | | | | | | |
Net asset value, beginning of year | | $ 9.38 | | | $10.57 | | | $10.91 | | | $10.96 | | | $10.86 | |
| | | | | | | | | | | | | | | |
| | | | | |
Investment operations: | | | | | | | | | | | | | | | |
| | | | | |
Net investment income(a) | | .45 | | | .45 | | | .44 | | | .41 | | | .44 | |
| | | | | |
Net realized and unrealized gain (loss) | | .80 | | | (1.18 | ) | | (.34 | ) | | (.03 | ) | | .08 | |
| | | | | | | | | | | | | | | |
| | | | | |
Total from investment operations | | 1.25 | | | (.73 | ) | | .10 | | | .38 | | | .52 | |
| | | | | | | | | | | | | | | |
| | | | | |
Distributions to shareholders from: | | | | | | | | | | | | | | | |
| | | | | |
Net investment income | | (.46 | ) | | (.46 | ) | | (.44 | ) | | (.43 | ) | | (.42 | ) |
| | | | | | | | | | | | | | | |
Net asset value, end of year | | $10.17 | | | $ 9.38 | | | $10.57 | | | $10.91 | | | $10.96 | |
| | | | | | | | | | | | | | | |
| | | | | |
Total Return(b) | | 13.92 | % | | (7.16 | )% | | .87 | % | | 3.52 | % | | 4.88 | % |
| | | | | |
Ratios to Average Net Assets: | | | | | | | | | | | | | | | |
| | | | | |
Expenses, excluding expense reductions and including expenses reimbursed | | .91 | % | | 1.18 | % | | 1.29 | % | | 1.07 | % | | 1.01 | % |
| | | | | |
Expenses, excluding interest expense, including expense reductions and expenses reimbursed(c) | | .78 | % | | .80 | % | | .87 | % | | .93 | % | | .94 | % |
| | | | | |
Expenses, excluding expense reductions and expenses reimbursed | | .91 | % | | 1.18 | % | | 1.30 | % | | 1.07 | % | | 1.01 | % |
| | | | | |
Net investment income | | 4.87 | % | | 4.41 | % | | 4.03 | % | | 3.79 | % | | 4.01 | % |
| | | | | |
| Supplemental Data: | | | | | | | | | | | | | | | |
Net assets, end of year (000) | | $159,768 | | | $144,165 | | | $147,893 | | | $160,416 | | | $166,227 | |
| | | | | |
Portfolio turnover rate | | 34.04 | % | | 49.17 | % | | 50.77 | % | | 47.86 | % | | 42.23 | % |
| (a) | | Calculated using average shares outstanding during the year. |
| (b) | | Total return does not consider the effects of sales loads and assumes the reinvestment of all distributions. |
| (c) | | Interest expense relates to the liability for floating rate notes issued in conjunction with tender option bond trusts. |
See Notes to Financial Statements.
188
Financial Highlights (continued)
CALIFORNIA TAX FREE FUND
| | | | | | | | | | | | | | | |
| | | Class C Shares | |
| | | Year Ended 9/30 | |
| | | 2009 | | | 2008 | | | 2007 | | | 2006 | | | 2005 | |
Per Share Operating Performance | | | | | | | | | | | | | | | |
Net asset value, beginning of year | | $ 9.39 | | | $10.58 | | | $10.92 | | | $10.97 | | | $10.87 | |
| | | | | | | | | | | | | | | |
| | | | | |
Investment operations: | | | | | | | | | | | | | | | |
| | | | | |
Net investment income(a) | | .38 | | | .39 | | | .37 | | | .34 | | | .37 | |
| | | | | |
Net realized and unrealized gain (loss) | | .80 | | | (1.18 | ) | | (.34 | ) | | (.03 | ) | | .08 | |
| | | | | | | | | | | | | | | |
| | | | | |
Total from investment operations | | 1.18 | | | (.79 | ) | | .03 | | | .31 | | | .45 | |
| | | | | | | | | | | | | | | |
| | | | | |
Distributions to shareholders from: | | | | | | | | | | | | | | | |
| | | | | |
Net investment income | | (.40 | ) | | (.40 | ) | | (.37 | ) | | (.36 | ) | | (.35 | ) |
| | | | | | | | | | | | | | | |
Net asset value, end of year | | $10.17 | | | $ 9.39 | | | $10.58 | | | $10.92 | | | $10.97 | |
| | | | | | | | | | | | | | | |
| | | | | |
Total Return(b) | | 13.13 | % | | (7.73 | )% | | .23 | % | | 2.87 | % | | 4.20 | % |
| | | | | |
Ratios to Average Net Assets: | | | | | | | | | | | | | | | |
| | | | | |
Expenses, excluding expense reductions and including expenses reimbursed | | 1.60 | % | | 1.79 | % | | 1.92 | % | | 1.72 | % | | 1.65 | % |
| | | | | |
Expenses, excluding interest expense, including expense reductions and expenses reimbursed(c) | | 1.48 | % | | 1.41 | % | | 1.50 | % | | 1.58 | % | | 1.58 | % |
| | | | | |
Expenses, excluding expense reductions and expenses reimbursed | | 1.60 | % | | 1.79 | % | | 1.92 | % | | 1.72 | % | | 1.65 | % |
| | | | | |
Net investment income | | 4.14 | % | | 3.79 | % | | 3.40 | % | | 3.14 | % | | 3.37 | % |
| | | | | |
| Supplemental Data: | | | | | | | | | | | | | | | |
Net assets, end of year (000) | | $28,896 | | | $18,793 | | | $15,245 | | | $15,052 | | | $13,953 | |
| | | | | |
Portfolio turnover rate | | 34.04 | % | | 49.17 | % | | 50.77 | % | | 47.86 | % | | 42.23 | % |
| (a) | | Calculated using average shares outstanding during the year. |
| (b) | | Total return does not consider the effects of sales loads and assumes the reinvestment of all distributions. |
| (c) | | Interest expense relates to the liability for floating rate notes issued in conjunction with tender option bond trusts. |
See Notes to Financial Statements.
189
Financial Highlights (concluded)
CALIFORNIA TAX FREE FUND
| | | | | | | | | |
| | | Class F Shares | |
| | | Year Ended 9/30 | | | 9/28/2007(a)
to
9/30/2007 | |
| | | 2009 | | | 2008 | | |
Per Share Operating Performance | | | | | | | | | |
Net asset value, beginning of period | | $ 9.38 | | | $10.57 | | | $10.57 | |
| | | | | | | | | |
| | | |
Investment operations: | | | | | | | | | |
| | | |
Net investment income(b) | | .46 | | | .45 | | | – | (c) |
| | | |
Net realized and unrealized gain (loss) | | .80 | | | (1.17 | ) | | – | (c) |
| | | | | | | | | |
| | | |
Total from investment operations | | 1.26 | | | (.72 | ) | | – | (c) |
| | | | | | | | | |
| | | |
Distributions to shareholders from: | | | | | | | | | |
| | | |
Net investment income | | (.47 | ) | | (.47 | ) | | – | |
| | | | | | | | | |
Net asset value, end of period | | $10.17 | | | $ 9.38 | | | $10.57 | |
| | | | | | | | | |
| | | |
Total Return(d) | | 14.06 | % | | (7.07 | )% | | .00 | % |
| | | |
Ratios to Average Net Assets: | | | | | | | | | |
| | | |
Expenses, excluding expense reductions and including expenses reimbursed | | .79 | % | | 1.05 | % | | .00 | %(e)(f) |
| | | |
Expenses, excluding interest expense, including expense reductions and expenses reimbursed(g) | | .67 | % | | .67 | % | | .00 | %(e)(f) |
| | | |
Expenses, excluding expense reductions and expenses reimbursed | | .79 | % | | 1.07 | % | | .00 | %(e)(f) |
| | | |
Net investment income | | 4.84 | % | | 4.48 | % | | .00 | %(e)(f) |
| | | |
| Supplemental Data: | | | | | | | | | |
Net assets, end of period (000) | | $6,578 | | | $285 | | | $10 | |
| | | |
Portfolio turnover rate | | 34.04 | % | | 49.17 | % | | 50.77 | % |
| (a) | | Commencement of investment operations was 9/28/2007, SEC effective date was 9/14/2007 and date shares first became available to the public was 10/1/2007. |
| (b) | | Calculated using average shares outstanding during the period. |
| (c) | | Amount is less than $.01. |
| (d) | | Total return assumes the reinvestment of all distributions. |
| (f) | | Amount is less than .01%. |
| (g) | | Interest expense relates to the liability for floating rate notes issued in conjunction with tender option bond trusts. |
See Notes to Financial Statements.
190
Financial Highlights
CONNECTICUT TAX FREE FUND
| | | | | | | | | | | | | | | |
| | | Class A Shares | |
| | | Year Ended 9/30 | |
| | | 2009 | | | 2008 | | | 2007 | | | 2006 | | | 2005 | |
Per Share Operating Performance | | | | | | | | | | | | | | | |
Net asset value, beginning of year | | $ 9.26 | | | $10.26 | | | $10.51 | | | $10.56 | | | $10.61 | |
| | | | | | | | | | | | | | | |
| | | | | |
Investment operations: | | | | | | | | | | | | | | | |
| | | | | |
Net investment income(a) | | .42 | | | .42 | | | .44 | | | .45 | | | .44 | |
| | | | | |
Net realized and unrealized gain (loss) | | .89 | | | (.99 | ) | | (.24 | ) | | (.04 | ) | | (.05 | ) |
| | | | | | | | | | | | | | | |
| | | | | |
Total from investment operations | | 1.31 | | | (.57 | ) | | .20 | | | .41 | | | .39 | |
| | | | | | | | | | | | | | | |
| | | | | |
Distributions to shareholders from: | | | | | | | | | | | | | | | |
| | | | | |
Net investment income | | (.41 | ) | | (.43 | ) | | (.45 | ) | | (.46 | ) | | (.44 | ) |
| | | | | | | | | | | | | | | |
Net asset value, end of year | | $10.16 | | | $ 9.26 | | | $10.26 | | | $10.51 | | | $10.56 | |
| | | | | | | | | | | | | | | |
| | | | | |
Total Return(b) | | 14.60 | % | | (5.77 | )% | | 1.93 | % | | 3.96 | % | | 3.74 | % |
| | | | | |
Ratios to Average Net Assets: | | | | | | | | | | | | | | | |
| | | | | |
Expenses, excluding expense reductions and including expenses reimbursed | | .89 | % | | .78 | % | | .91 | % | | .76 | % | | .92 | % |
| | | | | |
Expenses, excluding interest expense, including expense reductions and expenses reimbursed(c) | | .79 | % | | .64 | % | | .59 | % | | .52 | % | | .79 | % |
| | | | | |
Expenses, excluding expense reductions and expenses reimbursed | | .90 | % | | .94 | % | | 1.20 | % | | 1.20 | % | | 1.09 | % |
| | | | | |
Net investment income | | 4.46 | % | | 4.22 | % | | 4.20 | % | | 4.34 | % | | 4.11 | % |
| | | | | |
| Supplemental Data: | | | | | | | | | | | | | | | |
Net assets, end of year (000) | | $117,583 | | | $128,252 | | | $136,324 | | | $96,530 | | | $91,078 | |
| | | | | |
Portfolio turnover rate | | 9.44 | % | | 34.10 | % | | 9.97 | % | | 31.96 | % | | 9.72 | % |
| (a) | | Calculated using average shares outstanding during the year. |
| (b) | | Total return does not consider the effects of sales loads and assumes the reinvestment of all distributions. |
| (c) | | Interest expense relates to the liability for floating rate notes issued in conjunction with tender option bond trusts. |
See Notes to Financial Statements.
191
Financial Highlights (concluded)
CONNECTICUT TAX FREE FUND
| | | | | | | | | |
| | | Class F Shares | |
| | | Year Ended 9/30 | | | 9/28/2007(a)
to
9/30/2007 | |
| | | 2009 | | | 2008 | | |
Per Share Operating Performance | | | | | | | | | |
Net asset value, beginning of period | | $ 9.24 | | | $10.26 | | | $10.26 | |
| | | | | | | | | |
| | | |
Investment operations: | | | | | | | | | |
| | | |
Net investment income(b) | | .42 | | | .44 | | | – | (c) |
| | | |
Net realized and unrealized gain (loss) | | .90 | | | (1.02 | ) | | – | (c) |
| | | | | | | | | |
| | | |
Total from investment operations | | 1.32 | | | (.58 | ) | | – | (c) |
| | | | | | | | | |
| | | |
Distributions to shareholders from: | | | | | | | | | |
| | | |
Net investment income | | (.42 | ) | | (.44 | ) | | – | |
| | | | | | | | | |
Net asset value, end of period | | $10.14 | | | $ 9.24 | | | $10.26 | |
| | | | | | | | | |
| | | |
Total Return(d) | | 14.65 | % | | (5.77 | )% | | .00 | % |
| | | |
Ratios to Average Net Assets: | | | | | | | | | |
| | | |
Expenses, excluding expense reductions and including expenses reimbursed | | .80 | % | | .62 | % | | .00 | %(e)(f) |
| | | |
Expenses, excluding interest expense, including expense reductions and expenses reimbursed(g) | | .71 | % | | .49 | % | | .00 | %(e)(f) |
| | | |
Expenses, excluding expense reductions and expenses reimbursed | | .80 | % | | .83 | % | | .00 | %(e)(f) |
| | | |
Net investment income | | 4.37 | % | | 4.43 | % | | .00 | %(e)(f) |
| | | |
| Supplemental Data: | | | | | | | | | |
Net assets, end of period (000) | | $5,653 | | | $337 | | | $10 | |
| | | |
Portfolio turnover rate | | 9.44 | % | | 34.10 | % | | 9.97 | % |
| (a) | | Commencement of investment operations was 9/28/2007, SEC effective date was 9/14/2007 and date shares first became available to the public was 10/1/2007. |
| (b) | | Calculated using average shares outstanding during the period. |
| (c) | | Amount is less than $.01. |
| (d) | | Total return assumes the reinvestment of all distributions. |
| (f) | | Amount is less than .01%. |
| (g) | | Interest expense relates to the liability for floating rate notes issued in conjunction with tender option bond trusts. |
See Notes to Financial Statements.
192
Financial Highlights
HAWAII TAX FREE FUND
| | | | | | | | | | | | | | | |
| | | Class A Shares | |
| | | Year Ended 9/30 | |
| | | 2009 | | | 2008 | | | 2007 | | | 2006 | | | 2005 | |
Per Share Operating Performance | | | | | | | | | | | | | | | |
Net asset value, beginning of year | | $4.53 | | | $4.92 | | | $5.01 | | | $5.04 | | | $5.08 | |
| | | | | | | | | | | | | | | |
| | | | | |
Investment operations: | | | | | | | | | | | | | | | |
| | | | | |
Net investment income(a) | | .19 | | | .20 | | | .20 | | | .20 | | | .20 | |
| | | | | |
Net realized and unrealized gain (loss) | | .39 | | | (.39 | ) | | (.09 | ) | | (.02 | ) | | (.04 | ) |
| | | | | | | | | | | | | | | |
| | | | | |
Total from investment operations | | .58 | | | (.19 | ) | | .11 | | | .18 | | | .16 | |
| | | | | | | | | | | | | | | |
| | | | | |
Distributions to shareholders from: | | | | | | | | | | | | | | | |
| | | | | |
Net investment income | | (.19 | ) | | (.20 | ) | | (.20 | ) | | (.21 | ) | | (.20 | ) |
| | | | | | | | | | | | | | | |
Net asset value, end of year | | $4.92 | | | $4.53 | | | $4.92 | | | $5.01 | | | $5.04 | |
| | | | | | | | | | | | | | | |
| | | | | |
Total Return(b) | | 13.15 | % | | (3.99 | )% | | 2.31 | % | | 3.60 | % | | 3.28 | % |
| | | | | |
Ratios to Average Net Assets: | | | | | | | | | | | | | | | |
| | | | | |
Expenses, excluding expense reductions and including expenses reimbursed | | .90 | % | | .83 | % | | .95 | % | | .90 | % | | 1.05 | % |
| | | | | |
Expenses, excluding interest expense, including expense reductions and expenses reimbursed(c) | | .79 | % | | .66 | % | | .65 | % | | .71 | % | | .95 | % |
| | | | | |
Expenses, excluding expense reductions and expenses reimbursed | | .91 | % | | .97 | % | | 1.19 | % | | 1.14 | % | | 1.05 | % |
| | | | | |
Net investment income | | 4.08 | % | | 4.03 | % | | 4.02 | % | | 4.01 | % | | 3.98 | % |
| | | | | |
| Supplemental Data: | | | | | | | | | | | | | | | |
Net assets, end of year (000) | | $127,322 | | | $115,157 | | | $103,989 | | | $91,357 | | | $78,217 | |
| | | | | |
Portfolio turnover rate | | 17.45 | % | | 20.85 | % | | 10.01 | % | | 38.26 | % | | 18.22 | % |
| (a) | | Calculated using average shares outstanding during the year. |
| (b) | | Total return does not consider the effects of sales loads and assumes the reinvestment of all distributions. |
| (c) | | Interest expense relates to the liability for floating rate notes issued in conjunction with tender option bond trusts. |
See Notes to Financial Statements.
193
Financial Highlights (concluded)
HAWAII TAX FREE FUND
| | | | | | | | | |
| | | Class F Shares | |
| | | Year Ended 9/30 | | | 9/28/2007(a)
to
9/30/2007 | |
| | | 2009 | | | 2008 | | |
Per Share Operating Performance | | | | | | | | | |
Net asset value, beginning of period | | $4.53 | | | $4.92 | | | $4.92 | |
| | | | | | | | | |
| | | |
Investment operations: | | | | | | | | | |
| | | |
Net investment income(b) | | .19 | | | .20 | | | – | (c) |
| | | |
Net realized and unrealized gain (loss) | | .39 | | | (.38 | ) | | – | (c) |
| | | | | | | | | |
| | | |
Total from investment operations | | .58 | | | (.18 | ) | | – | (c) |
| | | | | | | | | |
| | | |
Distributions to shareholders from: | | | | | | | | | |
| | | |
Net investment income | | (.19 | ) | | (.21 | ) | | – | |
| | | | | | | | | |
Net asset value, end of period | | $4.92 | | | $4.53 | | | $4.92 | |
| | | | | | | | | |
| | | |
Total Return(d) | | 13.28 | % | | (3.89 | )% | | .00 | % |
| | | |
Ratios to Average Net Assets: | | | | | | | | | |
| | | |
Expenses, excluding expense reductions and including expenses reimbursed | | .81 | % | | .66 | % | | .00 | %(e)(f) |
| | | |
Expenses, excluding interest expense, including expense reductions and expenses reimbursed(g) | | .70 | % | | .50 | % | | .00 | %(e)(f) |
| | | |
Expenses, excluding expense reductions and expenses reimbursed | | .81 | % | | .80 | % | | .00 | %(e)(f) |
| | | |
Net investment income | | 4.05 | % | | 4.06 | % | | .00 | %(e)(f) |
| | | |
| Supplemental Data: | | | | | | | | | |
Net assets, end of period (000) | | $3,039 | | | $10 | | | $10 | |
| | | |
Portfolio turnover rate | | 17.45 | % | | 20.85 | % | | 10.01 | % |
| (a) | | Commencement of investment operations was 9/28/2007, SEC effective date was 9/14/2007 and date shares first became available to the public was 10/1/2007. |
| (b) | | Calculated using average shares outstanding during the period. |
| (c) | | Amount is less than $.01. |
| (d) | | Total return assumes the reinvestment of all distributions. |
| (f) | | Amount is less than .01%. |
| (g) | | Interest expense relates to the liability for floating rate notes issued in conjunction with tender option bond trusts. |
See Notes to Financial Statements.
194
Financial Highlights
MISSOURI TAX FREE FUND
| | | | | | | | | | | | | | | |
| | | Class A Shares | |
| | | Year Ended 9/30 | |
| | | 2009 | | | 2008 | | | 2007 | | | 2006 | | | 2005 | |
Per Share Operating Performance | | | | | | | | | | | | | | | |
Net asset value, beginning of year | | $4.66 | | | $5.20 | | | $5.33 | | | $5.35 | | | $5.34 | |
| | | | | | | | | | | | | | | |
| | | | | |
Investment operations: | | | | | | | | | | | | | | | |
| | | | | |
Net investment income(a) | | .21 | | | .21 | | | .21 | | | .22 | | | .22 | |
| | | | | |
Net realized and unrealized gain (loss) | | .42 | | | (.53 | ) | | (.12 | ) | | (.02 | ) | | – | (b) |
| | | | | | | | | | | | | | | |
| | | | | |
Total from investment operations | | .63 | | | (.32 | ) | | .09 | | | .20 | | | .22 | |
| | | | | | | | | | | | | | | |
| | | | | |
Distributions to shareholders from: | | | | | | | | | | | | | | | |
| | | | | |
Net investment income | | (.21 | ) | | (.22 | ) | | (.22 | ) | | (.21 | ) | | (.21 | ) |
| | | | | |
Net realized gain | | – | | | – | | | – | | | (.01 | ) | | – | |
| | | | | | | | | | | | | | | |
| | | | | |
Total distributions | | (.21 | ) | | (.22 | ) | | (.22 | ) | | (.22 | ) | | (.21 | ) |
| | | | | | | | | | | | | | | |
Net asset value, end of year | | $5.08 | | | $4.66 | | | $5.20 | | | $5.33 | | | $5.35 | |
| | | | | | | | | | | | | | | |
| | | | | |
Total Return(c) | | 13.93 | % | | (6.45 | )% | | 1.64 | % | | 3.92 | % | | 4.26 | % |
| | | | | |
Ratios to Average Net Assets: | | | | | | | | | | | | | | | |
| | | | | |
Expenses, excluding expense reductions and including expenses reimbursed | | .81 | % | | .88 | % | | 1.12 | % | | .78 | % | | .81 | % |
| | | | | |
Expenses, excluding interest expense, including expense reductions and expenses reimbursed | | .80 | % | | .76 | %(d) | | .77 | %(d) | | .57 | %(d) | | .67 | %(d) |
| | | | | |
Expenses, excluding expense reductions and expenses reimbursed | | .81 | % | | .93 | % | | 1.24 | % | | 1.16 | % | | 1.09 | % |
| | | | | |
Net investment income | | 4.40 | % | | 4.17 | % | | 4.06 | % | | 4.14 | % | | 4.02 | % |
| | | | | |
| Supplemental Data: | | | | | | | | | | | | | | | |
Net assets, end of year (000) | | $171,963 | | | $149,609 | | | $158,977 | | | $159,530 | | | $161,624 | |
| | | | | |
Portfolio turnover rate | | 15.78 | % | | 28.12 | % | | 21.48 | % | | 27.30 | % | | 25.49 | % |
| (a) | | Calculated using average shares outstanding during the year. |
| (b) | | Amount is less than $.01. |
| (c) | | Total return does not consider the effects of sales loads and assumes the reinvestment of all distributions. |
| (d) | | Interest expense relates to the liability for floating rate notes issued in conjunction with tender option bond trusts. |
See Notes to Financial Statements.
195
Financial Highlights (concluded)
MISSOURI TAX FREE FUND
| | | | | | | | | |
| | | Class F Shares | |
| | | Year Ended 9/30 | | | 9/28/2007(a)
to
9/30/2007 | |
| | | 2009 | | | 2008 | | |
Per Share Operating Performance | | | | | | | | | |
Net asset value, beginning of period | | $4.66 | | | $5.20 | | | $5.20 | |
| | | | | | | | | |
| | | |
Investment operations: | | | | | | | | | |
| | | |
Net investment income(b) | | .21 | | | .22 | | | – | (c) |
| | | |
Net realized and unrealized gain (loss) | | .42 | | | (.54 | ) | | – | (c) |
| | | | | | | | | |
| | | |
Total from investment operations | | .63 | | | (.32 | ) | | – | (c) |
| | | | | | | | | |
| | | |
Distributions to shareholders from: | | | | | | | | | |
| | | |
Net investment income | | (.21 | ) | | (.22 | ) | | – | |
| | | | | | | | | |
Net asset value, end of period | | $5.08 | | | $4.66 | | | $5.20 | |
| | | | | | | | | |
| | | |
Total Return(d) | | 14.05 | % | | (6.36 | )% | | .00 | % |
| | | |
Ratios to Average Net Assets: | | | | | | | | | |
| | | |
Expenses, excluding expense reductions and including expenses reimbursed | | .70 | % | | .75 | % | | .00 | %(e)(f) |
| | | |
Expenses, excluding interest expense, including expense reductions and expenses reimbursed | | .70 | % | | .63 | %(g) | | .00 | %(e)(f)(g) |
| | | |
Expenses, excluding expense reductions and expenses reimbursed | | .70 | % | | .81 | % | | .00 | %(e)(f) |
| | | |
Net investment income | | 4.39 | % | | 4.34 | % | | .00 | %(e)(f) |
| | | |
| Supplemental Data: | | | | | | | | | |
Net assets, end of period (000) | | $586 | | | $75 | | | $10 | |
| | | |
Portfolio turnover rate | | 15.78 | % | | 28.12 | % | | 21.48 | % |
| (a) | | Commencement of investment operations was 9/28/2007, SEC effective date was 9/14/2007 and date shares first became available to the public was 10/1/2007. |
| (b) | | Calculated using average shares outstanding during the period. |
| (c) | | Amount is less than $.01. |
| (d) | | Total return assumes the reinvestment of all distributions. |
| (f) | | Amount is less than .01%. |
| (g) | | Interest expense relates to the liability for floating rate notes issued in conjunction with tender option bond trusts. |
See Notes to Financial Statements.
196
Financial Highlights
NEW JERSEY TAX FREE FUND
| | | | | | | | | | | | | | | |
| | | Class A Shares | |
| | | Year Ended 9/30 | |
| | | 2009 | | | 2008 | | | 2007 | | | 2006 | | | 2005 | |
Per Share Operating Performance | | | | | | | | | | | | | | | |
Net asset value, beginning of year | | $4.43 | | | $5.00 | | | $5.17 | | | $5.20 | | | $5.18 | |
| | | | | | | | | | | | | | | |
| | | | | |
Investment operations: | | | | | | | | | | | | | | | |
| | | | | |
Net investment income(a) | | .21 | | | .21 | | | .21 | | | .21 | | | .21 | |
| | | | | |
Net realized and unrealized gain (loss) | | .35 | | | (.56 | ) | | (.17 | ) | | (.03 | ) | | .02 | |
| | | | | | | | | | | | | | | |
| | | | | |
Total from investment operations | | .56 | | | (.35 | ) | | .04 | | | .18 | | | .23 | |
| | | | | | | | | | | | | | | |
| | | | | |
Distributions to shareholders from: | | | | | | | | | | | | | | | |
| | | | | |
Net investment income | | (.21 | ) | | (.22 | ) | | (.21 | ) | | (.21 | ) | | (.21 | ) |
| | | | | | | | | | | | | | | |
Net asset value, end of year | | $4.78 | | | $4.43 | | | $5.00 | | | $5.17 | | | $5.20 | |
| | | | | | | | | | | | | | | |
| | | | | |
Total Return(b) | | 13.13 | % | | (7.36 | )% | | .78 | % | | 3.51 | % | | 4.42 | % |
| | | | | |
Ratios to Average Net Assets: | | | | | | | | | | | | | | | |
| | | | | |
Expenses, excluding expense reductions and including expenses reimbursed | | .81 | % | | .90 | % | | 1.14 | % | | 1.10 | % | | 1.10 | % |
| | | | | |
Expenses, excluding interest expense, including expense reductions and expenses reimbursed | | .81 | % | | .82 | %(c) | | .81 | %(c) | | .86 | %(c) | | .95 | %(c) |
| | | | | |
Expenses, excluding expense reductions and expenses reimbursed | | .81 | % | | .90 | % | | 1.21 | % | | 1.22 | % | | 1.10 | % |
| | | | | |
Net investment income | | 4.78 | % | | 4.34 | % | | 4.11 | % | | 4.03 | % | | 4.02 | % |
| | | | | |
| Supplemental Data: | | | | | | | | | | | | | | | |
Net assets, end of year (000) | | $128,778 | | | $114,704 | | | $129,106 | | | $130,742 | | | $137,319 | |
| | | | | |
Portfolio turnover rate | | 20.68 | % | | 32.16 | % | | 37.64 | % | | 28.99 | % | | 28.46 | % |
| (a) | | Calculated using average shares outstanding during the year. |
| (b) | | Total return does not consider the effects of sales loads and assumes the reinvestment of all distributions. |
| (c) | | Interest expense relates to the liability for floating rate notes issued in conjunction with tender option bond trusts. |
See Notes to Financial Statements.
197
Financial Highlights (concluded)
NEW JERSEY TAX FREE FUND
| | | | | | | | | |
| | | Class F Shares | |
| | | Year Ended 9/30 | | | 9/28/2007(a)
to
9/30/2007 | |
| | | 2009 | | | 2008 | | |
Per Share Operating Performance | | | | | | | | | |
Net asset value, beginning of period | | $4.43 | | | $5.00 | | | $5.00 | |
| | | | | | | | | |
| | | |
Investment operations: | | | | | | | | | |
| | | |
Net investment income(b) | | .21 | | | .21 | | | – | (c) |
| | | |
Net realized and unrealized gain (loss) | | .35 | | | (.56 | ) | | – | (c) |
| | | | | | | | | |
| | | |
Total from investment operations | | .56 | | | (.35 | ) | | – | (c) |
| | | | | | | | | |
| | | |
Distributions to shareholders from: | | | | | | | | | |
| | | |
Net investment income | | (.21 | ) | | (.22 | ) | | – | |
| | | | | | | | | |
Net asset value, end of period | | $4.78 | | | $4.43 | | | $5.00 | |
| | | | | | | | | |
| | | |
Total Return(d) | | 13.26 | % | | (7.27 | )% | | .00 | % |
| | | |
Ratios to Average Net Assets: | | | | | | | | | |
| | | |
Expenses, excluding expense reductions and including expenses reimbursed | | .70 | % | | .74 | % | | .00 | %(e)(f) |
| | | |
Expenses, excluding interest expense, including expense reductions and expenses reimbursed | | .70 | % | | .66 | %(g) | | .00 | %(e)(f)(g) |
| | | |
Expenses, excluding expense reductions and expenses reimbursed | | .70 | % | | .77 | % | | .00 | %(e)(f) |
| | | |
Net investment income | | 4.73 | % | | 4.41 | % | | .00 | %(e)(f) |
| | | |
| Supplemental Data: | | | | | | | | | |
Net assets, end of period (000) | | $969 | | | $48 | | | $10 | |
| | | |
Portfolio turnover rate | | 20.68 | % | | 32.16 | % | | 37.64 | % |
| (a) | | Commencement of investment operations was 9/28/2007, SEC effective date was 9/14/2007 and date shares first became available to the public was 10/1/2007. |
| (b) | | Calculated using average shares outstanding during the period. |
| (c) | | Amount is less than $.01. |
| (d) | | Total return assumes the reinvestment of all distributions. |
| (f) | | Amount is less than .01%. |
| (g) | | Interest expense relates to the liability for floating rate notes issued in conjunction with tender option bond trusts. |
See Notes to Financial Statements.
198
Financial Highlights
NEW YORK TAX FREE FUND
| | | | | | | | | | | | | | | |
| | | Class A Shares | |
| | | Year Ended 9/30 | |
| | | 2009 | | | 2008 | | | 2007 | | | 2006 | | | 2005 | |
Per Share Operating Performance | | | | | | | | | | | | | |
Net asset value, beginning of year | | $ 9.71 | | | $10.96 | | | $11.27 | | | $11.32 | | | $11.41 | |
| | | | | | | | | | | | | | | |
| | | | | |
Investment operations: | | | | | | | | | | | | | | | |
| | | | | |
Net investment income(a) | | .48 | | | .46 | | | .47 | | | .48 | | | .48 | |
| | | | | |
Net realized and unrealized gain (loss) | | 1.06 | | | (1.24 | ) | | (.31 | ) | | (.05 | ) | | (.09 | ) |
| | | | | | | | | | | | | | | |
| | | | | |
Total from investment operations | | 1.54 | | | (.78 | ) | | .16 | | | .43 | | | .39 | |
| | | | | | | | | | | | | | | |
| | | | | |
Distributions to shareholders from: | | | | | | | | | | | | | | | |
| | | | | |
Net investment income | | (.47 | ) | | (.47 | ) | | (.47 | ) | | (.48 | ) | | (.48 | ) |
| | | | | | | | | | | | | | | |
Net asset value, end of year | | $10.78 | | | $ 9.71 | | | $10.96 | | | $11.27 | | | $11.32 | |
| | | | | | | | | | | | | | | |
| | | | | |
Total Return(b) | | 16.49 | % | | (7.37 | )% | | 1.47 | % | | 3.92 | % | | 3.43 | % |
| | | | | |
Ratios to Average Net Assets: | | | | | | | | | | | | | | | |
| | | | | |
Expenses, excluding expense reductions and including expenses reimbursed | | .87 | % | | .99 | % | | 1.01 | % | | .80 | % | | .86 | % |
| | | | | |
Expenses, excluding interest expense, including expense reductions and expenses
reimbursed(c) | | .78 | % | | .78 | % | | .70 | % | | .62 | % | | .76 | % |
| | | | | |
Expenses, excluding expense reductions and expenses reimbursed | | .87 | % | | 1.00 | % | | 1.16 | % | | 1.11 | % | | 1.04 | % |
| | | | | |
Net investment income | | 4.90 | % | | 4.36 | % | | 4.20 | % | | 4.27 | % | | 4.16 | % |
| | | | | |
| Supplemental Data: | | | | | | | | | | | | | | | |
Net assets, end of year (000) | | $231,452 | | | $221,057 | | | $243,416 | | | $233,101 | | | $229,598 | |
| | | | | |
Portfolio turnover rate | | 22.34 | % | | 44.67 | % | | 25.38 | % | | 69.19 | % | | 57.03 | % |
| (a) | | Calculated using average shares outstanding during the year. |
| (b) | | Total return does not consider the effects of sales loads and assumes the reinvestment of all distributions. |
| (c) | | Interest expense relates to the liability for floating rate notes issued in conjunction with tender option bond trusts. |
See Notes to Financial Statements.
199
Financial Highlights (continued)
NEW YORK TAX FREE FUND
| | | | | | | | | | | | | | | |
| | | Class C Shares | |
| | | Year Ended 9/30 | |
| | | 2009 | | | 2008 | | | 2007 | | | 2006 | | | 2005 | |
Per Share Operating Performance | | | | | | | | | | | | | | | |
Net asset value, beginning of year | | $ 9.70 | | | $10.96 | | | $11.27 | | | $11.32 | | | $11.40 | |
| | | | | | | | | | | | | | | |
| | | | | |
Investment operations: | | | | | | | | | | | | | | | |
| | | | | |
Net investment income(a) | | .41 | | | .40 | | | .39 | | | .40 | | | .40 | |
| | | | | |
Net realized and unrealized gain (loss) | | 1.06 | | | (1.25 | ) | | (.30 | ) | | (.04 | ) | | (.08 | ) |
| | | | | | | | | | | | | | | |
| | | | | |
Total from investment operations | | 1.47 | | | (.85 | ) | | .09 | | | .36 | | | .32 | |
| | | | | | | | | | | | | | | |
| | | | | |
Distributions to shareholders from: | | | | | | | | | | | | | | | |
| | | | | |
Net investment income | | (.41 | ) | | (.41 | ) | | (.40 | ) | | (.41 | ) | | (.40 | ) |
| | | | | | | | | | | | | | | |
Net asset value, end of year | | $10.76 | | | $ 9.70 | | | $10.96 | | | $11.27 | | | $11.32 | |
| | | | | | | | | | | | | | | |
| | | | | |
Total Return(b) | | 15.69 | % | | (8.02 | )% | | .84 | % | | 3.25 | % | | 2.87 | % |
| | | | | |
Ratios to Average Net Assets: | | | | | | | | | | | | | | | |
| | | | | |
Expenses, excluding expense reductions and including expenses reimbursed | | 1.55 | % | | 1.63 | % | | 1.67 | % | | 1.46 | % | | 1.51 | % |
| | | | | |
Expenses, excluding interest expense, including expense reductions and expenses reimbursed(c) | | 1.46 | % | | 1.41 | % | | 1.36 | % | | 1.28 | % | | 1.41 | % |
| | | | | |
Expenses, excluding expense reductions and expenses reimbursed | | 1.55 | % | | 1.63 | % | | 1.81 | % | | 1.77 | % | | 1.69 | % |
| | | | | |
Net investment income | | 4.21 | % | | 3.72 | % | | 3.53 | % | | 3.61 | % | | 3.51 | % |
| | | | | |
| Supplemental Data: | | | | | | | | | | | | | | | |
Net assets, end of year (000) | | $37,554 | | | $31,262 | | | $25,423 | | | $16,622 | | | $14,502 | |
| | | | | |
Portfolio turnover rate | | 22.34 | % | | 44.67 | % | | 25.38 | % | | 69.19 | % | | 57.03 | % |
| (a) | | Calculated using average shares outstanding during the year. |
| (b) | | Total return does not consider the effects of sales loads and assumes the reinvestment of all distributions. |
| (c) | | Interest expense relate to the liability for floating rate notes issued in conjunction with tender option bond trusts. |
See Notes to Financial Statements.
200
Financial Highlights (concluded)
NEW YORK TAX FREE FUND
| | | | | | | | | |
| | | Class F Shares | |
| | | Year Ended 9/30 | | | 9/28/2007(a)
to
9/30/2007 | |
| | | 2009 | | | 2008 | | |
Per Share Operating Performance | | | | | | | | | |
Net asset value, beginning of period | | $ 9.72 | | | $10.96 | | | $10.96 | |
| | | | | | | | | |
| | | |
Investment operations: | | | | | | | | | |
| | | |
Net investment income(b) | | .48 | | | .48 | | | – | (c) |
| | | |
Net realized and unrealized gain (loss) | | 1.06 | | | (1.24 | ) | | – | (c) |
| | | | | | | | | |
| | | |
Total from investment operations | | 1.54 | | | (.76 | ) | | – | (c) |
| | | | | | | | | |
| | | |
Distributions to shareholders from: | | | | | | | | | |
| | | |
Net investment income | | (.48 | ) | | (.48 | ) | | – | |
| | | | | | | | | |
Net asset value, end of period | | $10.78 | | | $ 9.72 | | | $10.96 | |
| | | | | | | | | |
| | | |
Total Return(d) | | 16.51 | % | | (7.18 | )% | | .00 | % |
| | | |
Ratios to Average Net Assets: | | | | | | | | | |
| | | |
Expenses, excluding expense reductions and including expenses reimbursed | | .77 | % | | .82 | % | | .00 | %(e)(f) |
| | | |
Expenses, excluding interest expense, including expense reductions and expenses reimbursed(g) | | .68 | % | | .61 | % | | .00 | %(e)(f) |
| | | |
Expenses, excluding expense reductions and expenses reimbursed | | .77 | % | | .83 | % | | .00 | %(e)(f) |
| | | |
Net investment income | | 4.81 | % | | 4.43 | % | | .00 | %(e)(f) |
| | | |
| Supplemental Data: | | | | | | | | | |
Net assets, end of period (000) | | $3,143 | | | $9 | | | $10 | |
| | | |
Portfolio turnover rate | | 22.34 | % | | 44.67 | % | | 25.38 | % |
| (a) | | Commencement of investment operations was 9/28/2007, SEC effective date was 9/14/2007 and date shares first became available to the public was 10/1/2007. |
| (b) | | Calculated using average shares outstanding during the period. |
| (c) | | Amount is less than $.01. |
| (d) | | Total return assumes the reinvestment of all distributions. |
| (f) | | Amount is less than .01%. |
| (g) | | Interest expense relates to the liability for floating rate notes issued in conjunction with tender option bond trusts. |
See Notes to Financial Statements.
201
Financial Highlights
INTERMEDIATE TAX FREE FUND
| | | | | | | | | | | | | | | |
| | | Class A Shares | |
| | | Year Ended 9/30 | |
| | | 2009 | | | 2008 | | | 2007 | | | 2006 | | | 2005 | |
Per Share Operating Performance | | | | | | | | | | | | | | | |
Net asset value, beginning of year | | $ 9.42 | | | $9.75 | | | $9.81 | | | $9.80 | | | $9.95 | |
| | | | | | | | | | | | | | | |
| | | | | |
Investment operations: | | | | | | | | | | | | | | | |
| | | | | |
Net investment income(a) | | .38 | | | .37 | | | .36 | | | .32 | | | .30 | |
| | | | | |
Net realized and unrealized gain (loss) | | .86 | | | (.32 | ) | | (.06 | ) | | .03 | | | (.17 | ) |
| | | | | | | | | | | | | | | |
| | | | | |
Total from investment operations | | 1.24 | | | .05 | | | .30 | | | .35 | | | .13 | |
| | | | | | | | | | | | | | | |
| | | | | |
Distributions to shareholders from: | | | | | | | | | | | | | | | |
| | | | | |
Net investment income | | (.38 | ) | | (.38 | ) | | (.36 | ) | | (.34 | ) | | (.28 | ) |
| | | | | | | | | | | | | | | |
Net asset value, end of year | | $10.28 | | | $9.42 | | | $9.75 | | | $9.81 | | | $9.80 | |
| | | | | | | | | | | | | | | |
| | | | | |
Total Return(b) | | 13.50 | % | | .43 | % | | 3.11 | % | | 3.67 | % | | 1.36 | % |
| | | | | |
Ratios to Average Net Assets: | | | | | | | | | | | | | | | |
| | | | | |
Expenses, excluding expense reductions and including expenses reimbursed | | .44 | % | | .27 | % | | .27 | % | | .27 | % | | .27 | % |
| | | | | |
Expenses, excluding interest expense, including expense reductions and expenses reimbursed(c) | | .44 | % | | .24 | % | | .25 | % | | .25 | % | | .25 | % |
| | | | | |
Expenses, excluding expense reductions and expenses reimbursed | | .72 | % | | .79 | % | | 1.37 | % | | 1.66 | % | | 1.42 | % |
| | | | | |
Net investment income | | 3.89 | % | | 3.80 | % | | 3.68 | % | | 3.34 | % | | 3.01 | % |
| | | | | |
| Supplemental Data: | | | | | | | | | | | | | | | |
Net assets, end of year (000) | | $798,344 | | | $338,400 | | | $17,046 | | | $7,234 | | | $7,941 | |
| | | | | |
Portfolio turnover rate | | 15.70 | % | | 29.73 | % | | 30.70 | % | | 100.82 | % | | 42.10 | % |
| (a) | | Calculated using average shares outstanding during the year. |
| (b) | | Total return does not consider the effects of sales loads and assumes the reinvestment of all distributions. |
| (c) | | Interest expense relates to the liability for floating rate notes issued in conjunction with tender option bond trusts. |
See Notes to Financial Statements.
202
Financial Highlights (continued)
INTERMEDIATE TAX FREE FUND
| | | | | | | | | | | | | | | |
| | | Class B Shares | |
| | | Year Ended 9/30 | |
| | | 2009 | | | 2008 | | | 2007 | | | 2006 | | | 2005 | |
Per Share Operating Performance | | | | | | | | | | | | | | | |
Net asset value, beginning of year | | $ 9.41 | | | $9.74 | | | $9.80 | | | $9.79 | | | $9.94 | |
| | | | | | | | | | | | | | | |
| | | | | |
Investment operations: | | | | | | | | | | | | | | | |
| | | | | |
Net investment income(a) | | .30 | | | .31 | | | .29 | | | .26 | | | .21 | |
| | | | | |
Net realized and unrealized gain (loss) | | .87 | | | (.33 | ) | | (.06 | ) | | .02 | | | (.16 | ) |
| | | | | | | | | | | | | | | |
| | | | | |
Total from investment operations | | 1.17 | | | (.02 | ) | | .23 | | | .28 | | | .05 | |
| | | | | | | | | | | | | | | |
| | | | | |
Distributions to shareholders from: | | | | | | | | | | | | | | | |
| | | | | |
Net investment income | | (.31 | ) | | (.31 | ) | | (.29 | ) | | (.27 | ) | | (.20 | ) |
| | | | | | | | | | | | | | | |
Net asset value, end of year | | $10.27 | | | $9.41 | | | $9.74 | | | $9.80 | | | $9.79 | |
| | | | | | | | | | | | | | | |
| | | | | |
Total Return(b) | | 12.65 | % | | (.29 | )% | | 2.35 | % | | 2.92 | % | | .55 | % |
| | | | | |
Ratios to Average Net Assets: | | | | | | | | | | | | | | | |
| | | | | |
Expenses, excluding expense reductions and including expenses reimbursed | | 1.24 | % | | 1.02 | % | | 1.02 | % | | 1.02 | % | | 1.02 | % |
| | | | | |
Expenses, excluding interest expense, including expense reductions and expenses reimbursed(c) | | 1.23 | % | | 1.00 | % | | 1.00 | % | | 1.00 | % | | 1.00 | % |
| | | | | |
Expenses, excluding expense reductions and expenses reimbursed | | 1.52 | % | | 1.67 | % | | 2.12 | % | | 2.32 | % | | 2.11 | % |
| | | | | |
Net investment income | | 3.10 | % | | 3.15 | % | | 2.95 | % | | 2.67 | % | | 2.15 | % |
| | | | | |
| Supplemental Data: | | | | | | | | | | | | | | | |
Net assets, end of year (000) | | $6,315 | | | $1,966 | | | $802 | | | $848 | | | $775 | |
| | | | | |
Portfolio turnover rate | | 15.70 | % | | 29.73 | % | | 30.70 | % | | 100.82 | % | | 42.10 | % |
| (a) | | Calculated using average shares outstanding during the year. |
| (b) | | Total return does not consider the effects of sales loads and assumes the reinvestment of all distributions. |
| (c) | | Interest expense relates to the liability for floating rate notes issued in conjunction with tender option bond trusts. |
See Notes to Financial Statements.
203
Financial Highlights (continued)
INTERMEDIATE TAX FREE FUND
| | | | | | | | | | | | | | | |
| | | Class C Shares | |
| | | Year Ended 9/30 | |
| | | 2009 | | | 2008 | | | 2007 | | | 2006 | | | 2005 | |
Per Share Operating Performance | | | | | | | | | | | | | | | |
Net asset value, beginning of year | | $ 9.41 | | | $9.74 | | | $9.80 | | | $9.79 | | | $9.94 | |
| | | | | | | | | | | | | | | |
| | | | | |
Investment operations: | | | | | | | | | | | | | | | |
| | | | | |
Net investment income(a) | | .31 | | | .30 | | | .29 | | | .25 | | | .23 | |
| | | | | |
Net realized and unrealized gain (loss) | | .87 | | | (.32 | ) | | (.06 | ) | | .03 | | | (.17 | ) |
| | | | | | | | | | | | | | | |
| | | | | |
Total from investment operations | | 1.18 | | | (.02 | ) | | .23 | | | .28 | | | .06 | |
| | | | | | | | | | | | | | | |
| | | | | |
Distributions to shareholders from: | | | | | | | | | | | | | | | |
| | | | | |
Net investment income | | (.32 | ) | | (.31 | ) | | (.29 | ) | | (.27 | ) | | (.21 | ) |
| | | | | | | | | | | | | | | |
Net asset value, end of year | | $10.27 | | | $9.41 | | | $9.74 | | | $9.80 | | | $9.79 | |
| | | | | | | | | | | | | | | |
| | | | | |
Total Return(b) | | 12.76 | % | | (.31 | )% | | 2.35 | % | | 2.90 | % | | .61 | % |
| | | | | |
Ratios to Average Net Assets: | | | | | | | | | | | | | | | |
| | | | | |
Expenses, excluding expense reductions and including expenses reimbursed | | 1.10 | % | | 1.02 | % | | 1.02 | % | | 1.02 | % | | 1.02 | % |
| | | | | |
Expenses, excluding interest expense, including expense reductions and expenses reimbursed(c) | | 1.09 | % | | 0.98 | % | | 1.00 | % | | 1.00 | % | | 1.00 | % |
| | | | | |
Expenses, excluding expense reductions and expenses reimbursed | | 1.47 | % | | 1.45 | % | | 2.02 | % | | 2.31 | % | | 2.06 | % |
| | | | | |
Net investment income | | 3.22 | % | | 3.11 | % | | 2.95 | % | | 2.59 | % | | 2.28 | % |
| | | | | |
| Supplemental Data: | | | | | | | | | | | | | | | |
Net assets, end of year (000) | | $180,270 | | | $44,402 | | | $4,249 | | | $2,784 | | | $3,775 | |
| | | | | |
Portfolio turnover rate | | 15.70 | % | | 29.73 | % | | 30.70 | % | | 100.82 | % | | 42.10 | % |
| (a) | | Calculated using average shares outstanding during the year. |
| (b) | | Total return does not consider the effects of sales loads and assumes the reinvestment of all distributions. |
| (c) | | Interest expense relates to the liability for floating rate notes issued in conjunction with tender option bond trusts. |
See Notes to Financial Statements.
204
Financial Highlights (continued)
INTERMEDIATE TAX FREE FUND
| | | | | | | | | |
| | | Class F Shares | |
| | | Year Ended 9/30 | | | 9/28/2007(a)
to
9/30/2007 | |
| | | 2009 | | | 2008 | | |
Per Share Operating Performance | | | | | | | | | |
Net asset value, beginning of period | | $ 9.42 | | | $9.75 | | | $9.75 | |
| | | | | | | | | |
| | | |
Investment operations: | | | | | | | | | |
| | | |
Net investment income(b) | | .38 | | | .39 | | | – | (c) |
| | | |
Net realized and unrealized gain (loss) | | .87 | | | (.33 | ) | | – | (c) |
| | | | | | | | | |
| | | |
Total from investment operations | | 1.25 | | | .06 | | | – | (c) |
| | | | | | | | | |
| | | |
Distributions to shareholders from: | | | | | | | | | |
| | | |
Net investment income | | (.39 | ) | | (.39 | ) | | – | |
| | | | | | | | | |
Net asset value, end of period | | $10.28 | | | $9.42 | | | $9.75 | |
| | | | | | | | | |
| | | |
Total Return(d) | | 13.61 | % | | .57 | % | | .00 | % |
| | | |
Ratios to Average Net Assets: | | | | | | | | | |
| | | |
Expenses, excluding expense reductions and including expenses reimbursed | | .40 | % | | .13 | % | | .00 | %(e)(f) |
| | | |
Expenses, excluding interest expense, including expense reductions and expenses reimbursed(g) | | .39 | % | | .10 | % | | .00 | %(e)(f) |
| | | |
Expenses, excluding expense reductions and expenses reimbursed | | .64 | % | | .67 | % | | .00 | %(e)(f) |
| | | |
Net investment income | | 3.90 | % | | 3.97 | % | | .00 | %(e)(f) |
| | | |
| Supplemental Data: | | | | | | | | | |
Net assets, end of period (000) | | $103,873 | | | $1,460 | | | $10 | |
| | | |
Portfolio turnover rate | | 15.70 | % | | 29.73 | % | | 30.70 | % |
| (a) | | Commencement of investment operations was 9/28/2007, SEC effective date was 9/14/2007 and date shares first became available to the public was 10/1/2007. |
| (b) | | Calculated using average shares outstanding during the period. |
| (c) | | Amount is less than $.01. |
| (d) | | Total return assumes the reinvestment of all distributions. |
| (f) | | Amount is less than .01%. |
| (g) | | Interest expense relates to the liability for floating rate notes issued in conjunction with tender option bond trusts. |
See Notes to Financial Statements.
205
Financial Highlights (concluded)
INTERMEDIATE TAX FREE FUND
| | | | | | | | | | | | | | | |
| | | Class P Shares | |
| | | Year Ended 9/30 | |
| | | 2009 | | | 2008 | | | 2007 | | | 2006 | | | 2005 | |
Per Share Operating Performance | | | | | | | | | | | | | | | |
Net asset value, beginning of year | | $ 9.42 | | | $9.75 | | | $9.81 | | | $9.80 | | | $9.95 | |
| | | | | | | | | | | | | | | |
| | | | | |
Investment operations: | | | | | | | | | | | | | | | |
| | | | | |
Net investment income(a) | | .36 | | | .36 | | | .34 | | | .31 | | | .28 | |
| | | | | |
Net realized and unrealized gain (loss) | | .86 | | | (.33 | ) | | (.06 | ) | | .02 | | | (.17 | ) |
| | | | | | | | | | | | | | | |
| | | | | |
Total from investment operations | | 1.22 | | | .03 | | | .28 | | | .33 | | | .11 | |
| | | | | | | | | | | | | | | |
| | | | | |
Distributions to shareholders from: | | | | | | | | | | | | | | | |
| | | | | |
Net investment income | | (.36 | ) | | (.36 | ) | | (.34 | ) | | (.32 | ) | | (.26 | ) |
| | | | | | | | | | | | | | | |
Net asset value, end of year | | $10.28 | | | $9.42 | | | $9.75 | | | $9.81 | | | $9.80 | |
| | | | | | | | | | | | | | | |
| | | | | |
Total Return(b) | | 13.27 | % | | .29 | % | | 2.91 | % | | 3.46 | % | | 1.16 | % |
| | | | | |
Ratios to Average Net Assets: | | | | | | | | | | | | | | | |
| | | | | |
Expenses, excluding expense reductions and including expenses reimbursed | | .65 | % | | .46 | % | | .47 | % | | .47 | % | | .47 | % |
| | | | | |
Expenses, excluding interest expense, including expense reductions and expenses reimbursed(c) | | .64 | % | | .43 | % | | .45 | % | | .45 | % | | .45 | % |
| | | | | |
Expenses, excluding expense reductions and expenses reimbursed | | .96 | % | | 1.13 | % | | 1.57 | % | | 1.77 | % | | 1.50 | % |
| | | | | |
Net investment income | | 3.73 | % | | 3.73 | % | | 3.49 | % | | 3.15 | % | | 2.83 | % |
| | | | | |
| Supplemental Data: | | | | | | | | | | | | | | | |
Net assets, end of year (000) | | $13 | | | $11 | | | $11 | | | $11 | | | $10 | |
| | | | | |
Portfolio turnover rate | | 15.70 | % | | 29.73 | % | | 30.70 | % | | 100.82 | % | | 42.10 | % |
| (a) | | Calculated using average shares outstanding during the year. |
| (b) | | Total return assumes the reinvestment of all distributions. |
| (c) | | Interest expense relates to the liability for floating rate notes issued in conjunction with tender option bond trusts. |
See Notes to Financial Statements.
206
Financial Highlights
SHORT DURATION TAX FREE FUND
| | | |
| | | Class A Shares | |
| | | 12/12/2008(a)
to
9/30/2009 | |
Per Share Operating Performance | | | |
Net asset value, beginning of period | | $15.00 | |
| | | |
| |
Investment operations: | | | |
| |
Net investment income(b) | | .33 | |
| |
Net realized and unrealized gain | | .68 | |
| | | |
| |
Total from investment operations | | 1.01 | |
| | | |
| |
Distributions to shareholders from: | | | |
| |
Net investment income | | (.41 | ) |
| | | |
Net asset value, end of period | | $15.60 | |
| | | |
| |
Total Return(c) | | 6.82 | %(d) |
| |
Ratios to Average Net Assets: | | | |
| |
Expenses, excluding expense reductions and including expenses reimbursed | | .44 | %(e) |
| |
Expenses, including expense reductions and expenses reimbursed | | .44 | %(e) |
| |
Expenses, excluding expense reductions and expenses reimbursed | | .75 | %(e) |
| |
Net investment income | | 2.68 | %(e) |
| |
| Supplemental Data: | | | |
Net assets, end of period (000) | | $609,072 | |
| |
Portfolio turnover rate | | 64.00 | % |
| (a) | | Commencement of investment operations was 12/12/2008, SEC effective date was 12/10/2008 and date shares first became available to the public was 1/2/2009. |
| (b) | | Calculated using average shares outstanding during the period. |
| (c) | | Total return does not consider the effects of sales loads and assumes the reinvestment of all distributions. |
See Notes to Financial Statements.
207
Financial Highlights (continued)
SHORT DURATION TAX FREE FUND
| | | |
| | | Class C Shares | |
| | | 12/12/2008(a)
to
9/30/2009 | |
Per Share Operating Performance | | | |
Net asset value, beginning of period | | $15.00 | |
| | | |
| |
Investment operations: | | | |
| |
Net investment income(b) | | .23 | |
| |
Net realized and unrealized gain | | .68 | |
| | | |
| |
Total from investment operations | | .91 | |
| | | |
| |
Distributions to shareholders from: | | | |
| |
Net investment income | | (.31 | ) |
| | | |
Net asset value, end of period | | $15.60 | |
| | | |
| |
Total Return(c) | | 6.10 | %(d) |
| |
Ratios to Average Net Assets: | | | |
| |
Expenses, excluding expense reductions and including expenses reimbursed | | 1.23 | %(e) |
| |
Expenses, including expense reductions and expenses reimbursed | | 1.23 | %(e) |
| |
Expenses, excluding expense reductions and expenses reimbursed | | 1.51 | %(e) |
| |
Net investment income | | 1.88 | %(e) |
| |
| Supplemental Data: | | | |
Net assets, end of period (000) | | $128,116 | |
| |
Portfolio turnover rate | | 64.00 | % |
| (a) | | Commencement of investment operations was 12/12/2008, SEC effective date was 12/10/2008 and date shares first became available to the public was 1/2/2009. |
| (b) | | Calculated using average shares outstanding during the period. |
| (c) | | Total return does not consider the effects of sales loads and assumes the reinvestment of all distributions. |
See Notes to Financial Statements.
208
Financial Highlights (continued)
SHORT DURATION TAX FREE FUND
| | | |
| | | Class F Shares | |
| | | 12/12/2008(a)
to
9/30/2009 | |
Per Share Operating Performance | | | |
Net asset value, beginning of period | | $15.00 | |
| | | |
| |
Investment operations: | | | |
| |
Net investment income(b) | | .36 | |
| |
Net realized and unrealized gain | | .66 | |
| | | |
| |
Total from investment operations | | 1.02 | |
| | | |
| |
Distributions to shareholders from: | | | |
| |
Net investment income | | (.42 | ) |
| | | |
Net asset value, end of period | | $15.60 | |
| | | |
| |
Total Return(c) | | 6.90 | %(d) |
| |
Ratios to Average Net Assets: | | | |
| |
Expenses, excluding expense reductions and including expenses reimbursed | | .34 | %(e) |
| |
Expenses, including expense reductions and expenses reimbursed | | .34 | %(e) |
| |
Expenses, excluding expense reductions and expenses reimbursed | | .64 | %(e) |
| |
Net investment income | | 2.88 | %(e) |
| |
| Supplemental Data: | | | |
Net assets, end of period (000) | | $100,723 | |
| |
Portfolio turnover rate | | 64.00 | % |
| (a) | | Commencement of investment operations was 12/12/2008, SEC effective date was 12/10/2008 and date shares first became available to the public was 1/2/2009. |
| (b) | | Calculated using average shares outstanding during the period. |
| (c) | | Total return assumes the reinvestment of all distributions. |
See Notes to Financial Statements.
209
Financial Highlights (concluded)
SHORT DURATION TAX FREE FUND
| | | |
| | | Class I Shares | |
| | | 12/12/2008(a)
to
9/30/2009 | |
Per Share Operating Performance | | | |
Net asset value, beginning of period | | $15.00 | |
| | | |
| |
Investment operations: | | | |
| |
Net investment income(b) | | .34 | |
| |
Net realized and unrealized gain | | .70 | |
| | | |
| |
Total from investment operations | | 1.04 | |
| | | |
| |
Distributions to shareholders from: | | | |
| |
Net investment income | | (.44 | ) |
| | | |
Net asset value, end of period | | $15.60 | |
| | | |
| |
Total Return(c) | | 7.04 | %(d) |
| |
Ratios to Average Net Assets: | | | |
| |
Expenses, excluding expense reductions and including expenses reimbursed | | .25 | %(e) |
| |
Expenses, including expense reductions and expenses reimbursed | | .25 | %(e) |
| |
Expenses, excluding expense reductions and expenses reimbursed | | .57 | %(e) |
| |
Net investment income | | 2.71 | %(e) |
| |
| Supplemental Data: | | | |
Net assets, end of period (000) | | $3,407 | |
| |
Portfolio turnover rate | | 64.00 | % |
| (a) | | Commencement of investment operations was 12/12/2008, SEC effective date was 12/10/2008 and date shares first became available to the public was 1/2/2009. |
| (b) | | Calculated using average shares outstanding during the period. |
| (c) | | Total return assumes the reinvestment of all distributions. |
See Notes to Financial Statements.
210
Financial Highlights
GEORGIA TAX FREE TRUST
| | | | | | | | | | | | | | | |
| | | Class A Shares | |
| | | Year Ended 9/30 | |
| | | 2009 | | | 2008 | | | 2007 | | | 2006 | | | 2005 | |
Per Share Operating Performance | | | | | | | | | | | | | | | |
Net asset value, beginning of year | | $4.93 | | | $5.51 | | | $5.64 | | | $5.66 | | | $5.65 | |
| | | | | | | | | | | | | | | |
| | | | | |
Investment operations: | | | | | | | | | | | | | | | |
| | | | | |
Net investment income(a) | | .23 | | | .23 | | | .23 | | | .22 | | | .23 | |
| | | | | |
Net realized and unrealized gain (loss) | | .53 | | | (.58 | ) | | (.13 | ) | | (.01 | ) | | .01 | |
| | | | | | | | | | | | | | | |
| | | | | |
Total from investment operations | | .76 | | | (.35 | ) | | .10 | | | .21 | | | .24 | |
| | | | | | | | | | | | | | | |
| | | | | |
Distributions to shareholders from: | | | | | | | | | | | | | | | |
| | | | | |
Net investment income | | (.23 | ) | | (.23 | ) | | (.23 | ) | | (.23 | ) | | (.23 | ) |
| | | | | | | | | | | | | | | |
Net asset value, end of year | | $5.46 | | | $4.93 | | | $5.51 | | | $5.64 | | | $5.66 | |
| | | | | | | | | | | | | | | |
| | | | | |
Total Return(b) | | 15.91 | % | | (6.62 | )% | | 1.76 | % | | 3.77 | % | | 4.24 | % |
| | | | | |
Ratios to Average Net Assets: | | | | | | | | | | | | | | | |
| | | | | |
Expenses, excluding expense reductions and including expenses reimbursed | | .95 | % | | .88 | % | | .88 | % | | .63 | % | | .72 | % |
| | | | | |
Expenses, excluding interest expense, including expense reductions and expenses reimbursed(c) | | .82 | % | | .69 | % | | .60 | % | | .44 | % | | .61 | % |
| | | | | |
Expenses, excluding expense reductions and expenses reimbursed | | .95 | % | | 1.00 | % | | 1.13 | % | | 1.08 | % | | .72 | % |
| | | | | |
Net investment income | | 4.59 | % | | 4.19 | % | | 4.04 | % | | 3.99 | % | | 3.98 | % |
| | | | | |
| Supplemental Data: | | | | | | | | | | | | | | | |
Net assets, end of year (000) | | $124,746 | | | $124,126 | | | $133,599 | | | $118,819 | | | $103,887 | |
| | | | | |
Portfolio turnover rate | | 18.16 | % | | 37.84 | % | | 13.29 | % | | 36.93 | % | | 24.38 | % |
| (a) | | Calculated using average shares outstanding during the year. |
| (b) | | Total return does not consider the effects of sales loads and assumes the reinvestment of all distributions. |
| (c) | | Interest expense relates to the liability for floating rate notes issued in conjunction with tender option bond trusts. |
See Notes to Financial Statements.
211
Financial Highlights (concluded)
GEORGIA TAX FREE TRUST
| | | | | | | | | |
| | | Class F Shares | |
| | | Year Ended 9/30 | | | 9/28/2007(a)
to 9/30/2007 | |
| | | 2009 | | | 2008 | | |
Per Share Operating Performance | | | | | | | | | |
Net asset value, beginning of period | | $4.93 | | | $5.51 | | | $5.51 | |
| | | | | | | | | |
| | | |
Investment operations: | | | | | | | | | |
| | | |
Net investment income(b) | | .23 | | | .23 | | | – | (c) |
| | | |
Net realized and unrealized gain (loss) | | .55 | | | (.58 | ) | | – | (c) |
| | | | | | | | | |
| | | |
Total from investment operations | | .78 | | | (.35 | ) | | – | (c) |
| | | | | | | | | |
| | | |
Distributions to shareholders from: | | | | | | | | | |
| | | |
Net investment income | | (.23 | ) | | (.23 | ) | | – | |
| | | | | | | | | |
Net asset value, end of period | | $5.48 | | | $4.93 | | | $5.51 | |
| | | | | | | | | |
| | | |
Total Return(d) | | 16.47 | % | | (6.53 | )% | | .00 | % |
| | | |
Ratios to Average Net Assets: | | | | | | | | | |
| | | |
Expenses, excluding expense reductions and including expenses reimbursed | | .85 | % | | .81 | % | | .00 | %(e)(f) |
| | | |
Expenses, excluding interest expense, including expense reductions and expenses reimbursed(g) | | .72 | % | | .63 | % | | .00 | %(e)(f) |
| | | |
Expenses, excluding expense reductions and expenses reimbursed | | .85 | % | | .89 | % | | .00 | %(e)(f) |
| | | |
Net investment income | | 4.52 | % | | 4.39 | % | | .00 | %(e)(f) |
| | | |
| Supplemental Data: | | | | | | | | | |
Net assets, end of period (000) | | $5,342 | | | $163 | | | $10 | |
| | | |
Portfolio turnover rate | | 18.16 | % | | 37.84 | % | | 13.29 | % |
| (a) | | Commencement of investment operations was 9/28/2007, SEC effective date was 9/14/2007 and date shares first became available to the public was 10/1/2007. |
| (b) | | Calculated using average shares outstanding during the period. |
| (c) | | Amount is less than $.01. |
| (d) | | Total return assumes the reinvestment of all distributions. |
| (f) | | Amount is less than .01%. |
| (g) | | Interest expense relates to the liability for floating rate notes issued in conjunction with tender option bond trusts. |
See Notes to Financial Statements.
212
Financial Highlights
HIGH YIELD MUNICIPAL BOND FUND
| | | | | | | | | | | | | | | |
| | | Class A Shares | |
| | | Year Ended 9/30 | | | 12/1/2004(a)
to
9/30/2005 | |
| | | 2009 | | | 2008 | | | 2007 | | | 2006 | | |
Per Share Operating Performance | | | | | | | | | | | | | | | |
Net asset value, beginning of period | | $11.89 | | | $15.03 | | | $15.81 | | | $15.41 | | | $15.00 | |
| | | | | | | | | | | | | | | |
| | | | | |
Investment operations: | | | | | | | | | | | | | | | |
| | | | | |
Net investment income(b) | | | | | | | | | | | | | | .03 | |
| | | | | |
Net realized and unrealized gain | | | | | | | | | | | | | | .17 | |
| | | | | | | | | | | | | | | |
| | | | | |
Total from investment operations | | | | | | | | | | | | | | .20 | |
| | | | | | | | | | | | | | | |
| | | | | |
Distributions to shareholders from: | | | | | | | | | | | | | | | |
| | | | | |
Net investment income | | | | | | | | | | | | | | (.03 | ) |
| | | | | | | | | | | | | | | |
Net asset value on SEC Effective Date, December 30, 2004 | | | | | | | | | | | | | | $15.17 | |
| | | | | | | | | | | | | | | |
| | | | | |
Investment operations: | | | | | | | | | | | | | | | |
| | | | | |
Net investment income(b) | | .72 | | | .75 | | | .75 | | | .82 | | | .56 | |
| | | | | |
Net realized and unrealized gain (loss) | | (.37 | )(c) | | (3.13 | ) | | (.77 | ) | | .37 | | | .31 | |
| | | | | | | | | | | | | | | |
| | | | | |
Total from investment operations | | .35 | | | (2.38 | ) | | (.02 | ) | | 1.19 | | | .87 | |
| | | | | | | | | | | | | | | |
| | | | | |
Distributions to shareholders from: | | | | | | | | | | | | | | | |
| | | | | |
Net investment income | | (.75 | ) | | (.76 | ) | | (.76 | ) | | (.79 | ) | | (.63 | ) |
| | | | | | | | | | | | | | | |
Net asset value, end of period | | $11.49 | | | $11.89 | | | $15.03 | | | $15.81 | | | $15.41 | |
| | | | | | | | | | | | | | | |
| | | | | |
Total Return(d) | | | | | | | | | | | | | | 1.36 | %(e)(f) |
| | | | | |
Total Return(d) | | 4.14 | % | | (16.33 | )% | | (.23 | )% | | 7.97 | % | | 5.79 | %(e)(g) |
| | | | | |
Ratios to Average Net Assets: | | | | | | | | | | | | | | | |
| | | | | |
Expenses, excluding expense reductions and including expenses reimbursed | | 1.03 | % | | 1.27 | % | | 1.31 | % | | .49 | % | | .15 | %(e) |
| | | | | |
Expenses, excluding interest expense, including expense reductions and expenses reimbursed(h) | | .84 | % | | .79 | % | | .67 | % | | .16 | % | | .00 | %(e)(i) |
| | | | | |
Expenses, excluding expense reductions and expenses reimbursed | | 1.03 | % | | 1.30 | % | | 1.52 | % | | 1.34 | % | | 1.00 | %(j) |
| | | | | |
Net investment income | | 7.13 | % | | 5.50 | % | | 4.75 | % | | 5.28 | % | | 4.80 | %(j) |
| | | | | |
| Supplemental Data: | | | | | | | | | | | | | | | |
Net assets, end of period (000) | | $976,708 | | | $695,723 | | | $959,170 | | | $731,726 | | | $312,948 | |
| | | | | |
Portfolio turnover rate | | 32.88 | % | | 47.95 | % | | 24.92 | % | | 62.27 | % | | 70.93 | % |
| (a) | | Commencement of investment operations was 12/1/2004, SEC effective date was 12/30/2004 and date shares first became available to the public was 1/3/2005. |
| (b) | | Calculated using average shares outstanding during the period. |
| (c) | | The per share amount does not represent the net realized and unrealized gain (loss) as presented on the Statement of Operations for the period due to the timing of sales of Fund shares and the amount of per share realized and unrealized gains and losses at such time. |
| (d) | | Total return does not consider the effects of sales loads and assumes the reinvestment of all distributions. |
| (f) | | Total return for the period 12/1/2004 through 12/30/2004. |
| (g) | | Total return for the period 12/30/2004 through 9/30/2005. |
| (h) | | Interest expense relates to the liability for floating rate notes issued in conjunction with tender option bond trusts. |
| (i) | | Amount is less than .01%. |
See Notes to Financial Statements.
213
Financial Highlights (continued)
HIGH YIELD MUNICIPAL BOND FUND
| | | | | | | | | | | | | | | |
| | | Class B Shares | |
| | | Year Ended 9/30 | | | 12/1/2004(a)
to
9/30/2005 | |
| | | 2009 | | | 2008 | | | 2007 | | | 2006 | | |
Per Share Operating Performance | | | | | | | | | | | | | |
Net asset value, beginning of period | | $11.91 | | | $15.03 | | | $15.81 | | | $15.41 | | | $15.00 | |
| | | | | | | | | | | | | | | |
| | | | | |
Investment operations: | | | | | | | | | | | | | | | |
| | | | | |
Net investment income(b) | | | | | | | | | | | | | | .02 | |
| | | | | |
Net realized and unrealized gain | | | | | | | | | | | | | | .17 | |
| | | | | | | | | | | | | | | |
| | | | | |
Total from investment operations | | | | | | | | | | | | | | .19 | |
| | | | | | | | | | | | | | | |
| | | | | |
Distributions to shareholders from: | | | | | | | | | | | | | | | |
| | | | | |
Net investment income | | | | | | | | | | | | | | (.02 | ) |
| | | | | | | | | | | | | | | |
Net asset value on SEC Effective Date, December 30, 2004 | | | | | | | | | | | | | | $15.17 | |
| | | | | | | | | | | | | | | |
| | | | | |
Investment operations: | | | | | | | | | | | | | | | |
| | | | | |
Net investment income(b) | | .66 | | | .70 | | | .68 | | | .77 | | | .58 | |
| | | | | |
Net realized and unrealized gain (loss) | | (.39 | )(c) | | (3.14 | ) | | (.78 | ) | | .37 | | | .29 | |
| | | | | | | | | | | | | | | |
| | | | | |
Total from investment operations | | .27 | | | (2.44 | ) | | (.10 | ) | | 1.14 | | | .87 | |
| | | | | | | | | | | | | | | |
| | | | | |
Distributions to shareholders from: | | | | | | | | | | | | | | | |
| | | | | |
Net investment income | | (.67 | ) | | (.68 | ) | | (.68 | ) | | (.74 | ) | | (.63 | ) |
| | | | | | | | | | | | | | | |
Net asset value, end of period | | $11.51 | | | $11.91 | | | $15.03 | | | $15.81 | | | $15.41 | |
| | | | | | | | | | | | | | | |
| | | | | |
Total Return(d) | | | | | | | | | | | | | | 1.29 | %(e)(f) |
| | | | | |
Total Return(d) | | 3.46 | % | | (16.70 | )% | | (.74 | )% | | 7.62 | % | | 5.80 | %(e)(g) |
| | | | | |
Ratios to Average Net Assets: | | | | | | | | | | | | | | | |
| | | | | |
Expenses, excluding expense reductions and including expenses reimbursed | | 1.78 | % | | 1.74 | % | | 1.77 | % | | .80 | % | | .22 | %(e) |
| | | | | |
Expenses, excluding interest expense, including expense reductions and expenses reimbursed(h) | | 1.60 | % | | 1.26 | % | | 1.13 | % | | .47 | % | | .07 | %(e) |
| | | | | |
Expenses, excluding expense reductions and expenses reimbursed | | 1.81 | % | | 2.07 | % | | 2.24 | % | | 1.96 | % | | 1.85 | %(i) |
| | | | | |
Net investment income | | 6.52 | % | | 5.10 | % | | 4.29 | % | | 4.99 | % | | 4.74 | %(i) |
| | | | | |
| Supplemental Data: | | | | | | | | | | | | | | | |
Net assets, end of period (000) | | $10 | | | $10 | | | $11 | | | $11 | | | $10 | |
| | | | | |
Portfolio turnover rate | | 32.88 | % | | 47.95 | % | | 24.92 | % | | 62.27 | % | | 70.93 | % |
| (a) | | Commencement of investment operations was 12/1/2004, SEC effective date was 12/30/2004 and date shares first became available to the public was 1/3/2005. |
| (b) | | Calculated using average shares outstanding during the period. |
| (c) | | The per share amount does not represent the net realized and unrealized gain (loss) as presented on the Statement of Operations for the period due to the timing of sales of Fund shares and the amount of per share realized and unrealized gains and losses at such time. |
| (d) | | Total return does not consider the effects of sales loads and assumes the reinvestment of all distributions. |
| (f) | | Total return for the period 12/1/2004 through 12/30/2004. |
| (g) | | Total return for the period 12/30/2004 through 9/30/2005. |
| (h) | | Interest expense relates to the liability for floating rate notes issued in conjunction with tender option bond trusts. |
See Notes to Financial Statements.
214
Financial Highlights (continued)
HIGH YIELD MUNICIPAL BOND FUND
| | | | | | | | | | | | | | | |
| | | Class C Shares | |
| | | Year Ended 9/30 | | | 12/1/2004(a)
to
9/30/2005 | |
| | | 2009 | | | 2008 | | | 2007 | | | 2006 | | |
Per Share Operating Performance | | | | | | | | | | | | | |
Net asset value, beginning of period | | $11.89 | | | $15.03 | | | $15.81 | | | $15.41 | | | $15.00 | |
| | | | | | | | | | | | | | | |
| | | | | |
Investment operations: | | | | | | | | | | | | | | | |
| | | | | |
Net investment income(b) | | | | | | | | | | | | | | .02 | |
| | | | | |
Net realized and unrealized gain | | | | | | | | | | | | | | .17 | |
| | | | | | | | | | | | | | | |
| | | | | |
Total from investment operations | | | | | | | | | | | | | | .19 | |
| | | | | | | | | | | | | | | |
| | | | | |
Distributions to shareholders from: | | | | | | | | | | | | | | | |
| | | | | |
Net investment income | | | | | | | | | | | | | | (.02 | ) |
| | | | | | | | | | | | | | | |
Net asset value on SEC Effective Date, December 30, 2004 | | | | | | | | | | | | | | $15.17 | |
| | | | | | | | | | | | | | | |
| | | | | |
Investment operations: | | | | | | | | | | | | | | | |
| | | | | |
Net investment income(b) | | .66 | | | .68 | | | .67 | | | .76 | | | .56 | |
| | | | | |
Net realized and unrealized gain (loss) | | (.37 | )(c) | | (3.14 | ) | | (.77 | ) | | .38 | | | .31 | |
| | | | | | | | | | | | | | | |
| | | | | |
Total from investment operations | | .29 | | | (2.46 | ) | | (.10 | ) | | 1.14 | | | .87 | |
| | | | | | | | | | | | | | | |
| | | | | |
Distributions to shareholders from: | | | | | | | | | | | | | | | |
| | | | | |
Net investment income | | (.68 | ) | | (.68 | ) | | (.68 | ) | | (.74 | ) | | (.63 | ) |
| | | | | | | | | | | | | | | |
Net asset value, end of period | | $11.50 | | | $11.89 | | | $15.03 | | | $15.81 | | | $15.41 | |
| | | | | | | | | | | | | | | |
| | | | | |
Total Return(d) | | | | | | | | | | | | | | 1.29 | %(e)(f) |
| | | | | |
Total Return(d) | | 3.57 | % | | (16.77 | )% | | (.74 | )% | | 7.62 | % | | 5.79 | %(e)(g) |
| | | | | |
Ratios to Average Net Assets: | | | | | | | | | | | | | | | |
| | | | | |
Expenses, excluding expense reductions and including expenses reimbursed | | 1.66 | % | | 1.78 | % | | 1.81 | % | | .88 | % | | .15 | %(e) |
| | | | | |
Expenses, excluding interest expense, including expense reductions and expenses reimbursed(h) | | 1.48 | % | | 1.30 | % | | 1.17 | % | | .54 | % | | .00 | %(e)(i) |
| | | | | |
Expenses, excluding expense reductions and expenses reimbursed | | 1.67 | % | | 1.93 | % | | 2.17 | % | | 1.98 | % | | 1.78 | %(j) |
| | | | | |
Net investment income | | 6.55 | % | | 5.00 | % | | 4.25 | % | | 4.98 | % | | 4.79 | %(j) |
| | | | | |
| Supplemental Data: | | | | | | | | | | | | | | | |
Net assets, end of period (000) | | $455,042 | | | $392,360 | | | $538,419 | | | $349,911 | | | $125,319 | |
| | | | | |
Portfolio turnover rate | | 32.88 | % | | 47.95 | % | | 24.92 | % | | 62.27 | % | | 70.93 | % |
| (a) | | Commencement of investment operations was 12/1/2004, SEC effective date was 12/30/2004 and date shares first became available to the public was 1/3/2005. |
| (b) | | Calculated using average shares outstanding during the period. |
| (c) | | The per share amount does not represent the net realized and unrealized gain (loss) as presented on the Statement of Operations for the period due to the timing of sales of Fund shares and the amount of per share realized and unrealized gains and losses at such time. |
| (d) | | Total return does not consider the effects of sales loads and assumes the reinvestment of all distributions. |
| (f) | | Total return for the period 12/1/2004 through 12/30/2004. |
| (g) | | Total return for the period 12/30/2004 through 9/30/2005. |
| (h) | | Interest expense relates to the liability for floating rate notes issued in conjunction with tender option bond trusts. |
| (i) | | Amount is less than .01%. |
See Notes to Financial Statements.
215
Financial Highlights (continued)
HIGH YIELD MUNICIPAL BOND FUND
| | | | | | | | | |
| | | Class F Shares | |
| | | Year Ended 9/30 | | | 9/28/2007(a)
to 9/30/2007 | |
| | | 2009 | | | 2008 | | |
Per Share Operating Performance | | | | | | | | | |
Net asset value, beginning of period | | $11.90 | | | $15.03 | | | $15.03 | |
| | | | | | | | | |
| | | |
Investment operations: | | | | | | | | | |
| | | |
Net investment income(b) | | .70 | | | .76 | | | – | (c) |
| | | |
Net realized and unrealized gain (loss) | | (.34 | )(d) | | (3.13 | ) | | – | (c) |
| | | | | | | | | |
| | | |
Total from investment operations | | .36 | | | (2.37 | ) | | – | (c) |
| | | | | | | | | |
| | | |
Distributions to shareholders from: | | | | | | | | | |
| | | |
Net investment income | | (.76 | ) | | (.76 | ) | | – | |
| | | | | | | | | |
Net asset value, end of period | | $11.50 | | | $11.90 | | | $15.03 | |
| | | | | | | | | |
| | | |
Total Return(e) | | 4.25 | % | | (16.19 | )% | | .00 | % |
| | | |
Ratios to Average Net Assets: | | | | | | | | | |
| | | |
Expenses, excluding expense reductions and including expenses reimbursed | | .91 | % | | 1.20 | % | | .00 | %(f)(g) |
| | | |
Expenses, excluding interest expense, including expense reductions and expenses reimbursed(h) | | .73 | % | | .72 | % | | .00 | %(f)(g) |
| | | |
Expenses, excluding expense reductions and expenses reimbursed | | .91 | % | | 1.20 | % | | .00 | %(f)(g) |
| | | |
Net investment income | | 6.83 | % | | 5.90 | % | | .00 | %(f)(g) |
| | | |
| Supplemental Data: | | | | | | | | | |
Net assets, end of period (000) | | $112,500 | | | $4,513 | | | $10 | |
| | | |
Portfolio turnover rate | | 32.88 | % | | 47.95 | % | | 24.92 | % |
| (a) | | Commencement of investment operations was 9/28/2007, SEC effective date was 9/14/2007 and date shares first became available to the public was 10/1/2007. |
| (b) | | Calculated using average shares outstanding during the period. |
| (c) | | Amount is less than $.01. |
| (d) | | The per share amount does not represent the net realized and unrealized gain (loss) as presented on the Statement of Operations for the period due to the timing of sales of Fund shares and the amount of per share realized and unrealized gains and losses at such time. |
| (e) | | Total return assumes the reinvestment of all distributions. |
| (g) | | Amount is less than .01%. |
| (h) | | Interest expense relates to the liability for floating rate notes issued in conjunction with tender option bond trusts. |
See Notes to Financial Statements.
216
Financial Highlights (concluded)
HIGH YIELD MUNICIPAL BOND FUND
| | | | | | | | | | | | | | | |
| | | Class P Shares | |
| | | Year Ended 9/30 | | | 12/1/2004(a)
to 9/30/2005 | |
| | | 2009 | | | 2008 | | | 2007 | | | 2006 | | |
Per Share Operating Performance | | | | | | | | | | | | | | | |
Net asset value, beginning of period | | $11.90 | | | $15.04 | | | $15.82 | | | $15.42 | | | $15.00 | |
| | | | | | | | | | | | | | | |
| | | | | |
Investment operations: | | | | | | | | | | | | | | | |
| | | | | |
Net investment income(b) | | | | | | | | | | | | | | .03 | |
| | | | | |
Net realized and unrealized gain | | | | | | | | | | | | | | .17 | |
| | | | | | | | | | | | | | | |
| | | | | |
Total from investment operations | | | | | | | | | | | | | | .20 | |
| | | | | | | | | | | | | | | |
| | | | | |
Distributions to shareholders from: | | | | | | | | | | | | | | | |
| | | | | |
Net investment income | | | | | | | | | | | | | | (.03 | ) |
| | | | | | | | | | | | | | | |
Net asset value on SEC Effective Date, December 30, 2004 | | | | | | | | | | | | | | $15.17 | |
| | | | | | | | | | | | | | | |
| | | | | |
Investment operations: | | | | | | | | | | | | | | | |
| | | | | |
Net investment income(b) | | .71 | | | .74 | | | .75 | | | .83 | | | .58 | |
| | | | | |
Net realized and unrealized gain (loss) | | (.39 | )(c) | | (3.13 | ) | | (.77 | ) | | .36 | | | .30 | |
| | | | | | | | | | | | | | | |
| | | | | |
Total from investment operations | | .32 | | | (2.39 | ) | | (.02 | ) | | 1.19 | | | .88 | |
| | | | | | | | | | | | | | | |
| | | | | |
Distributions to shareholders from: | | | | | | | | | | | | | | | |
| | | | | |
Net investment income | | (.72 | ) | | (.75 | ) | | (.76 | ) | | (.79 | ) | | (.63 | ) |
| | | | | | | | | | | | | | | |
Net asset value, end of period | | $11.50 | | | $11.90 | | | $15.04 | | | $15.82 | | | $15.42 | |
| | | | | | | | | | | | | | | |
| | | | | |
Total Return(d) | | | | | | | | | | | | | | 1.34 | %(e)(f) |
| | | | | |
Total Return(d) | | 3.87 | % | | (16.34 | )% | | (.25 | )% | | 7.94 | % | | 5.86 | %(e)(g) |
| | | | | |
Ratios to Average Net Assets: | | | | | | | | | | | | | | | |
| | | | | |
Expenses, excluding expense reductions and including expenses reimbursed | | 1.26 | % | | 1.35 | % | | 1.32 | % | | .47 | % | | .18 | %(e) |
| | | | | |
Expenses, excluding interest expense, including expense reductions and expenses reimbursed(h) | | 1.08 | % | | .87 | % | | .66 | % | | .13 | % | | .03 | %(e) |
| | | | | |
Expenses, excluding expense reductions and expenses reimbursed | | 1.26 | % | | 1.51 | % | | 1.73 | % | | 1.45 | % | | 1.34 | %(i) |
| | | | | |
Net investment income | | 7.04 | % | | 5.46 | % | | 4.77 | % | | 5.41 | % | | 4.80 | %(i) |
| | | | | |
| Supplemental Data: | | | | | | | | | | | | | | | |
Net assets, end of period (000) | | $10 | | | $10 | | | $12 | | | $12 | | | $11 | |
| | | | | |
Portfolio turnover rate | | 32.88 | % | | 47.95 | % | | 24.92 | % | | 62.27 | % | | 70.93 | % |
| (a) | | Commencement of investment operations was 12/1/2004, SEC effective date was 12/30/2004 and date shares first became available to the public was 1/3/2005. |
| (b) | | Calculated using average shares outstanding during the period. |
| (c) | | The per share amount does not represent the net realized and unrealized gain (loss) as presented on the Statement of Operations for the period due to the timing of sales of Fund shares and the amount of per share realized and unrealized gains and losses at such time. |
| (d) | | Total return assumes the reinvestment of all distributions. |
| (f) | | Total return for the period 12/1/2004 through 12/30/2004. |
| (g) | | Total return for the period 12/30/2004 through 9/30/2005. |
| (h) | | Interest expense relates to the liability for floating rate notes issued in conjunction with tender option bond trusts. |
See Notes to Financial Statements.
217
Financial Highlights
PENNSYLVANIA TAX FREE TRUST
| | | | | | | | | | | | | | | |
| | | Class A Shares | |
| | | Year Ended 9/30 | |
| | | 2009 | | | 2008 | | | 2007 | | | 2006 | | | 2005 | |
Per Share Operating Performance | | | | | | | | | | | | | | | |
Net asset value, beginning of year | | $4.62 | | | $5.13 | | | $5.24 | | | $5.30 | | | $5.28 | |
| | | | | | | | | | | | | | | |
| | | | | |
Investment operations: | | | | | | | | | | | | | | | |
| | | | | |
Net investment income(a) | | .22 | | | .22 | | | .22 | | | .22 | | | .22 | |
| | | | | |
Net realized and unrealized gain (loss) | | .39 | | | (.51 | ) | | (.11 | ) | | (.06 | ) | | .02 | |
| | | | | | | | | | | | | | | |
| | | | | |
Total from investment operations | | .61 | | | (.29 | ) | | .11 | | | .16 | | | .24 | |
| | | | | | | | | | | | | | | |
| | | | | |
Distributions to shareholders from: | | | | | | | | | | | | | | | |
| | | | | |
Net investment income | | (.22 | ) | | (.22 | ) | | (.22 | ) | | (.22 | ) | | (.22 | ) |
| | | | | | | | | | | | | | | |
Net asset value, end of year | | $5.01 | | | $4.62 | | | $5.13 | | | $5.24 | | | $5.30 | |
| | | | | | | | | | | | | | | |
| | | | | |
Total Return(b) | | 13.69 | % | | (5.90 | )% | | 2.10 | % | | 3.10 | % | | 4.57 | % |
| | | | | |
Ratios to Average Net Assets: | | | | | | | | | | | | | | | |
| | | | | |
Expenses, excluding expense reductions and including expenses reimbursed | | .91 | % | | 1.02 | % | | 1.11 | % | | .86 | % | | .96 | % |
| | | | | |
Expenses, excluding interest expense, including expense reductions and expenses reimbursed(c) | | .84 | % | | .84 | % | | .77 | % | | .67 | % | | .88 | % |
| | | | | |
Expenses, excluding expense reductions and expenses reimbursed | | .91 | % | | 1.02 | % | | 1.24 | % | | 1.12 | % | | 1.00 | % |
| | | | | |
Net investment income | | 4.72 | % | | 4.35 | % | | 4.23 | % | | 4.19 | % | | 4.06 | % |
| | | | | |
| Supplemental Data: | | | | | | | | | | | | | | | |
Net assets, end of year (000) | | $94,782 | | | $86,908 | | | $94,138 | | | $93,770 | | | $97,069 | |
| | | | | |
Portfolio turnover rate | | 19.15 | % | | 44.84 | % | | 32.18 | % | | 42.20 | % | | 20.59 | % |
| (a) | | Calculated using average shares outstanding during the year. |
| (b) | | Total return does not consider the effects of sales loads and assumes the reinvestment of all distributions. |
| (c) | | Interest expense relates to the liability for floating rate notes issued in conjunction with tender option bond trusts. |
See Notes to Financial Statements.
218
Financial Highlights (concluded)
PENNSYLVANIA TAX FREE TRUST
| | | | | | | | | |
| | | Class F Shares | |
| | | Year Ended 9/30 | | | 9/28/2007(a)
to
9/30/2007 | |
| | | 2009 | | | 2008 | | |
Per Share Operating Performance | | | | | | | | | |
Net asset value, beginning of period | | $4.62 | | | $5.13 | | | $5.13 | |
| | | | | | | | | |
| | | |
Investment operations: | | | | | | | | | |
| | | |
Net investment income(b) | | .22 | | | .23 | | | – | (c) |
| | | |
Net realized and unrealized gain (loss) | | .40 | | | (.52 | ) | | – | (c) |
| | | | | | | | | |
| | | |
Total from investment operations | | .62 | | | (.29 | ) | | – | (c) |
| | | | | | | | | |
| | | |
Distributions to shareholders from: | | | | | | | | | |
| | | |
Net investment income | | (.23 | ) | | (.22 | ) | | – | |
| | | | | | | | | |
Net asset value, end of period | | $5.01 | | | $4.62 | | | $5.13 | |
| | | | | | | | | |
| | | |
Total Return(d) | | 13.83 | % | | (5.81 | )% | | .00 | % |
| | | |
Ratios to Average Net Assets: | | | | | | | �� | | |
| | | |
Expenses, excluding expense reductions and including expenses reimbursed | | .80 | % | | .80 | % | | .00 | %(e)(f) |
| | | |
Expenses, excluding interest expense, including expense reductions and expenses reimbursed(g) | | .73 | % | | .61 | % | | .00 | %(e)(f) |
| | | |
Expenses, excluding expense reductions and expenses reimbursed | | .80 | % | | .83 | % | | .00 | %(e)(f) |
| | | |
Net investment income | | 4.67 | % | | 4.57 | % | | .00 | %(e)(f) |
| | | |
| Supplemental Data: | | | | | | | | | |
Net assets, end of period (000) | | $384 | | | $9 | | | $10 | |
| | | |
Portfolio turnover rate | | 19.15 | % | | 44.84 | % | | 32.18 | % |
| (a) | | Commencement of investment operations was 9/28/2007, SEC effective date was 9/14/2007 and date shares first became available to the public was 10/1/2007. |
| (b) | | Calculated using average shares outstanding during the period. |
| (c) | | Amount is less than $.01. |
| (d) | | Total return assumes the reinvestment of all distributions. |
| (f) | | Amount is less than .01%. |
| (g) | | Interest expense relates to the liability for floating rate notes issued in conjunction with tender option bond trusts. |
See Notes to Financial Statements.
219
Notes to Financial Statements
1. ORGANIZATION
Lord Abbett Municipal Income Fund, Inc. (the “Company”) and Lord Abbett Municipal Income Trust (the “Trust”) are registered under the Investment Company Act of 1940, as amended (the “Act”), as open-end management investment companies. The Company was organized as a Maryland corporation on December 27, 1983. The Trust was organized as a Massachusetts business trust on September 11, 1991 and was reorganized as a Delaware statutory trust on July 22, 2002.
The Company consists of the following seven portfolios (separately, a “Fund” and collectively, the “Funds”) and their respective classes:
| | |
| Funds | | Classes |
Lord Abbett National Tax-Free Income Fund (“National”) | | A, B, C, F, I and P |
Lord Abbett California Tax-Free Income Fund (“California”) | | A, C, F and P |
Lord Abbett Connecticut Tax-Free Income Fund (“Connecticut”) | | A, F and P |
Lord Abbett Hawaii Tax-Free Income Fund (“Hawaii”) | | A, F and P |
Lord Abbett Missouri Tax-Free Income Fund (“Missouri”) | | A, F and P |
Lord Abbett New Jersey Tax-Free Income Fund (“New Jersey”) | | A, F and P |
Lord Abbett New York Tax-Free Income Fund (“New York”) | | A, C, F and P |
The Trust consists of the following five portfolios (separately, a “Fund” and collectively, the “Funds”) and their respective classes:
| | |
| Funds | | Classes |
Lord Abbett Intermediate Tax-Free Fund (“Intermediate”) | | A, B, C, F and P |
Lord Abbett Short Duration Tax Free Fund (“Short Duration”)* | | A, B, C, F and I |
Georgia Series (“Georgia”) | | A, F and P |
Lord Abbett High Yield Municipal Bond Fund (“High Yield”) | | A, B, C, F, I and P |
Pennsylvania Series (“Pennsylvania”) | | A, F and P |
| * | Commencement of investment operations was December 12, 2008, SEC effective date was December 10, 2008 and date shares first became available to the public was January 2, 2009. |
Each Fund is non-diversified as defined in the Act, except for National, Intermediate and Short Duration. As of the date of this report, Short Duration has not issued Class B shares and is the only fund to have issued Class I shares, National and High Yield have been authorized to issue but have not issued Class I shares and only Intermediate and High Yield have issued Class P shares.
The investment objective of each Fund (except for High Yield) is to seek the maximum amount of interest income exempt from federal income tax as is consistent with reasonable risk. Each Fund (except for National, Intermediate, Short Duration and High Yield) also seeks as high a level of interest income exempt from the personal income tax of its corresponding state as is consistent with reasonable risk. The investment objective of High Yield is to seek a high level of income exempt from federal income tax. New York also seeks as high a level of interest income exempt from New York City personal income tax as is consistent with reasonable risk.
Each class has different expenses and dividends. A front-end sales charge is normally added to the net asset value (“NAV”) for Class A shares. There is no front-end sales charge in the case of Class B, C, F, I and P shares, although there may be a contingent deferred sales charge (“CDSC”) for certain cases as follows: Class A shares purchased without a sales charge and redeemed before the first day of the month in which the one-year anniversary of the purchase falls (subject to certain exceptions); Class B shares redeemed before the sixth anniversary of purchase; and Class C shares redeemed before the first anniversary of purchase. Class B shares will automatically convert to
220
Notes to Financial Statements (continued)
Class A shares on the 25th day of the month (or, if the 25th is not a business day, the next business day thereafter) following the eighth anniversary of the day on which the purchase order was accepted. The Funds’ Class P shares are closed to substantially all new retirement and benefit plans and fee-based programs, with certain exceptions as set forth in each Fund’s prospectus.
The preparation of financial statements in conformity with accounting principles generally accepted in the United States of America requires management to make certain estimates and assumptions that affect the reported amounts of assets and liabilities and disclosure of contingent assets and liabilities at the date of the financial statements and the reported amounts of increases and decreases in net assets from operations during the reporting period. Actual results could differ from those estimates.
2. SIGNIFICANT ACCOUNTING POLICIES
| (a) | | Investment Valuation–Securities are valued at the mean between the bid and asked prices on the basis of prices supplied by independent pricing services, which reflect broker/dealer supplied valuations and the independent pricing services’ own electronic data processing techniques. Exchange traded options and futures contracts are valued at the last sale price in the market where they are principally traded. Securities for which market quotations are not readily available are valued at fair value as determined by management and approved in good faith by the Board of Directors/Trustees. Investments in open-end money market mutual funds are valued at their NAV as of the close of each business day. Short-term securities with 60 days or less remaining to maturity are valued using the amortized cost method, which approximates current market value. |
| (b) | | Security Transactions–Security transactions are recorded as of the date that the securities are purchased or sold (trade date). Realized gains and losses on sales of portfolio securities are calculated using the identified-cost method. Realized and unrealized gains (losses) are allocated to each class of shares based upon the relative proportion of net assets at the beginning of the day. |
| (c) | | Investment Income–Dividend income is recorded on the ex-dividend date. Interest income is recorded on the accrual basis as earned. Discounts are accreted and premiums are amortized using the effective interest method. Investment income is allocated to each class of shares based upon the relative proportion of net assets at the beginning of the day. |
| (d) | | Income Taxes–It is the policy of each Fund to meet the requirements of Subchapter M of the Internal Revenue Code applicable to regulated investment companies and to distribute substantially all taxable income and capital gains to its shareholders. Therefore, no income tax provision is required. |
Each Fund files U.S. federal and various state and local tax returns. No income tax returns are currently under examination. The statute of limitations on the Funds’ U.S. federal tax returns remains open for the fiscal years ended September 30, 2006 through September 30, 2009. The statutes of limitations on the Company’s and Trust’s state and local tax returns may remain open for an additional year depending upon the jurisdiction.
| (e) | | Expenses–Expenses incurred by the Company and Trust that do not specifically relate to an individual fund are generally allocated to the Funds within the Company and Trust on a pro rata basis by relative net assets. Expenses, excluding class-specific expenses, are allocated to each class of shares based upon the relative proportion of net assets at the beginning of the |
221
Notes to Financial Statements (continued)
| | day. Class A, B, C, F and P shares bear their class-specific share of all expenses and fees relating to the Funds’ 12b-1 Distribution Plan. |
| (f) | | Futures Contracts–Each Fund may purchase and sell futures contracts for bona fide hedging purposes including hedging against changes in interest rates and securities prices. At the time of entering into a futures transaction, an investor is required to deposit and maintain a specified amount of cash or eligible securities called “initial margin”. Subsequent payments made or received by a Fund called “variation margin” are made on a daily basis as the market price of the futures contract fluctuates. Each Fund will record an unrealized gain (loss) based on the amount of variation margin. When a contract is closed, a realized gain (loss) is recorded equal to the difference between the opening and closing value of the contract. Generally, open futures contracts are marked to market for federal income tax purposes at fiscal year-end. As of September 30, 2009, each Fund, except Short Duration, had open futures contracts. |
| (g) | | When-Issued Municipal Bonds–Each Fund may purchase new issues of municipal bonds, which are generally offered on a when-issued basis, with delivery and payment normally taking place approximately one month after the purchase date. |
| (h) | | Municipal Bonds Held in Trust–Each Fund may invest in leveraged residual certificates (“TOB Residuals”) issued by tender option bond trusts (“TOBs”). A TOB is established by a third party sponsor forming a special purpose entity into which a Fund, or an agent on behalf of the Fund, transfers municipal securities. A TOB typically issues two classes of beneficial interests: short-term floating rate certificates (trust certificates), which are sold to third party investors, and residual certificates, which are generally issued to a Fund which made the transfer or to affiliates of the Fund. Each Fund’s transfer of the municipal securities to a TOB is accounted for as a secured borrowing, therefore the municipal securities deposited into a TOB are presented as investments in a Fund’s Schedule of Investments and the proceeds from the transactions are reported as a liability for trust certificates on the Statement of Assets and Liabilities. Similarly, proceeds from residual certificates issued to affiliates, if any, from the transaction are included in the liability for trust certificates. Interest income from the underlying security is recorded by a Fund on an accrual basis. Interest expense incurred on the secured borrowing and other expenses related to remarketing, administration and trustee services to a TOB are reported as expenses of a Fund. The floating rate certificates have interest rates that generally reset weekly and their holders have the option to tender certificates to the TOB for redemption at par at each reset date. The residual interests held by a Fund include the right of the Fund (1) to cause the holders of a proportional share of floating rate certificates to tender their certificates at par and (2) to transfer a corresponding share of the municipal securities from the TOB to the Fund. The TOB may also be terminated without the consent of the Fund upon the occurrence of certain events as defined in the TOB agreements. Such termination events may include the bankruptcy or default of the municipal bond, a substantial downgrade in credit quality of the municipal bond, the inability of the TOB to obtain quarterly or annual renewal of the liquidity support agreement, a substantial decline in market value of the municipal bond or the inability to remarket the short-term floating rate certificates to third party investors. |
222
Notes to Financial Statements (continued)
The following is a summary of each Fund’s liability for trust certificates, range of interest rates for such certificates and the aggregate value of the underlying municipal securities transferred to TOB’s as of September 30, 2009, as well as the average trust certificates outstanding for the fiscal year then ended:
| | | | | | | | | | | |
| Fund | | Liability for Trust Certificates | | Interest Rate or Range of Interest Rates | | Underlying Municipal Bonds Transferred to TOBs | | Average
Trust Certificates
Outstanding |
National | | $ | 99,615,000 | | .31% - .60% | | $ | 213,540,560 | | $ | 86,248,600 |
California | | | 11,245,000 | | .30% - .43% | | | 25,363,847 | | | 12,529,000 |
Connecticut | | | 5,080,000 | | .75% | | | 10,916,260 | | | 5,080,000 |
Hawaii | | | 5,000,000 | | .85% | | | 10,574,900 | | | 5,000,000 |
New York | | | 17,070,000 | | .30% - .36% | | | 37,335,711 | | | 17,238,286 |
Intermediate | | | 5,735,000 | | .31% - .43% | | | 12,792,295 | | | 4,935,000 |
Georgia | | | 10,000,000 | | .33% | | | 21,359,950 | | | 11,016,000 |
High Yield | | | 191,572,226 | | .27% - .60% | | | 404,925,705 | | | 115,716,626 |
Pennsylvania | | | – | | – | | | – | | | 1,138,000 |
Financial transactions executed through TOBs generally will underperform the market for fixed rate municipal bonds in a rising interest rate environment, but tend to outperform the market for fixed rate municipal bonds when interest rates decline or remain relatively stable. Should short-term interest rates rise, a Fund’s investment in TOB Residuals likely will adversely affect a Fund’s net investment income and distributions to shareholders. Fluctuations in the market value of municipal securities deposited into the TOB may adversely affect a Fund’s NAV per share.
While the Funds’ investment policies and restrictions expressly permit investments in inverse floating rate securities such as TOB Residuals, they generally do not allow the Funds to borrow money for purposes of making investments. The Funds’ management believes that the Funds’ restrictions on borrowings do not apply to the secured borrowings for TOB transactions.
| (i) | | Fair Value Measurements–Each Fund adopted Financial Accounting Standards Board (“FASB”) ASC Topic 820, Fair Value Measurements and Disclosures (formerly SFAS 157), effective October 1, 2008. In accordance with ASC 820, fair value is defined as the price that each Fund would receive upon selling an investment in an orderly transaction to an independent buyer in the principal or most advantageous market of the investment. ASC 820 established a three-tier hierarchy to maximize the use of observable market data and minimize the use of unobservable inputs and to establish classification of fair value measurements for disclosure purposes. Inputs refer broadly to the assumptions that market participants would use in pricing the asset or liability, including assumptions about risk – for example, the risk inherent in a particular valuation technique used to measure fair value (such as a pricing model) and/or the risk inherent in the inputs to the valuation technique. Inputs may be observable or unobservable. Observable inputs reflect the assumptions market participants would use in pricing the asset or liability. Observable inputs are based on market data obtained from sources independent of the reporting entity. Unobservable inputs reflect the reporting entity’s own assumptions about the assumptions market participants would use in pricing the asset or liability. Unobservable inputs are based on the best information available in the |
223
Notes to Financial Statements (continued)
| | circumstances. The three-tier hierarchy of inputs is summarized in the three broad Levels listed below: |
| | • | | Level 1 – quoted prices in active markets for identical investments; |
| | • | | Level 2 – other significant observable inputs (including quoted prices for similar investments, interest rates, prepayment speeds, credit risk, etc.); and |
| | • | | Level 3 – significant unobservable inputs (including each Fund’s own assumptions in determining the fair value of investments). |
The inputs or methodology used for valuing securities are not necessarily an indication of the risk associated with investing in those securities.
The following is a summary of the inputs used as of September 30, 2009 in valuing each Fund’s investments carried at value:
| | | | | | | | | | | | | | | | | | | | | | |
| | | National | | | California | |
| Investment Type* | | Level 1 | | | Level 2 | | Total | | | Level 1 | | | Level 2 | | Total | |
Municipal Bonds | | $ | – | | | $ | 1,142,929,948 | | $ | 1,142,929,948 | | | $ | – | | | $ | 200,746,847 | | $ | 200,746,847 | |
Money Market Mutual Funds | | | 5,005,594 | | | | – | | | 5,005,594 | | | | 26 | | | | – | | | 26 | |
Variable Rate Demand Note | | | – | | | | 500,000 | | | 500,000 | | | | – | | | | 500,000 | | | 500,000 | |
Total | | $ | 5,005,594 | | | $ | 1,143,429,948 | | $ | 1,148,435,542 | | | $ | 26 | | | $ | 201,246,847 | | $ | 201,246,873 | |
| | | | | | |
Other Financial
Instruments | | | | | | | | | | | | | | | | |
Futures | | $ | (1,954,176 | ) | | $ | – | | $ | (1,954,176 | ) | | $ | (310,870 | ) | | $ | – | | $ | (310,870 | ) |
Total | | $ | (1,954,176 | ) | | $ | – | | $ | (1,954,176 | ) | | $ | (310,870 | ) | | $ | – | | $ | (310,870 | ) |
| | | | | | |
| | | | | | | | Connecticut | | | | | | | | Hawaii | |
| Investment Type* | | Level 1 | | | Level 2 | | Total | | | Level 1 | | | Level 2 | | Total | |
Municipal Bonds | | $ | – | | | $ | 125,907,930 | | $ | 125,907,930 | | | $ | – | | | $ | 130,954,281 | | $ | 130,954,281 | |
Money Market Mutual Fund | | | 6 | | | | – | | | 6 | | | | – | | | | – | | | – | |
Total | | $ | 6 | | | $ | 125,907,930 | | $ | 125,907,936 | | | $ | – | | | $ | 130,954,281 | | $ | 130,954,281 | |
| | | | | | |
Other Financial
Instruments | | | | | | | | | | | | | | | | |
Futures | | $ | (351,283 | ) | | $ | – | | $ | (351,283 | ) | | $ | (304,131 | ) | | $ | – | | $ | (304,131 | ) |
Total | | $ | (351,283 | ) | | $ | – | | $ | (351,283 | ) | | $ | (304,131 | ) | | $ | – | | $ | (304,131 | ) |
| | | | | | |
| | | | | | | | Missouri | | | | | | | | New Jersey | |
| Investment Type* | | Level 1 | | | Level 2 | | Total | | | Level 1 | | | Level 2 | | Total | |
Municipal Bonds | | $ | – | | | $ | 168,070,883 | | $ | 168,070,883 | | | $ | – | | | $ | 127,586,283 | | $ | 127,586,283 | |
Money Market Mutual Fund | | | – | | | | – | | | – | | | | 404,575 | | | | – | | | 404,575 | |
Total | | $ | – | | | $ | 168,070,883 | | $ | 168,070,883 | | | $ | 404,575 | | | $ | 127,586,283 | | $ | 127,990,858 | |
| | | | | | |
Other Financial
Instruments | | | | | | | | | | | | | | | | |
Futures | | $ | (282,759 | ) | | $ | – | | $ | (282,759 | ) | | $ | (332,160 | ) | | $ | – | | $ | (332,160 | ) |
Total | | $ | (282,759 | ) | | $ | – | | $ | (282,759 | ) | | $ | (332,160 | ) | | $ | – | | $ | (332,160 | ) |
224
Notes to Financial Statements (continued)
| | | | | | | | | | | | | | | | | | | | | | |
| | | | | | | | New York | | | | | | | | Intermediate | |
| Investment Type* | | Level 1 | | | Level 2 | | Total | | | Level 1 | | | Level 2 | | Total | |
Municipal Bonds | | $ | – | | | $ | 284,817,927 | | $ | 284,817,927 | | | $ | – | | | $ | 1,079,225,246 | | $ | 1,079,225,246 | |
Money Market Mutual Fund | | | 637,528 | | | | – | | | 637,528 | | | | 5,400,705 | | | | – | | | 5,400,705 | |
Total | | $ | 637,528 | | | $ | 284,817,927 | | $ | 285,455,455 | | | $ | 5,400,705 | | | $ | 1,079,225,246 | | $ | 1,084,625,951 | |
| | | | | | |
Other Financial
Instruments | | | | | | | | | | | | | | | | |
Futures | | $ | (566,108 | ) | | $ | – | | $ | (566,108 | ) | | $ | (697,430 | ) | | $ | – | | $ | (697,430 | ) |
Total | | $ | (566,108 | ) | | $ | – | | $ | (566,108 | ) | | $ | (697,430 | ) | | $ | – | | $ | (697,430 | ) |
| | |
| | | Short Duration | | | Georgia | |
| Investment Type* | | Level 1 | | | Level 2 | | Total | | | Level 1 | | | Level 2 | | Total | |
Municipal Bonds | | $ | – | | | $ | 814,377,335 | | $ | 814,377,335 | | | $ | – | | | $ | 133,657,409 | | $ | 133,657,409 | |
Warrant | | | – | | | | 52,090 | | | 52,090 | | | | – | | | | – | | | – | |
Money Market Mutual Fund | | | 2,734,973 | | | | – | | | 2,734,973 | | | | – | | | | – | | | – | |
Variable Rate Demand Notes | | | – | | | | 14,300,000 | | | 14,300,000 | | | | – | | | | 260,000 | | | 260,000 | |
Total | | $ | 2,734,973 | | | $ | 828,729,425 | | $ | 831,464,398 | | | $ | – | | | $ | 133,917,409 | | $ | 133,917,409 | |
| | | | | | |
Other Financial
Instruments | | | | | | | | | | | | | | | | |
Futures | | $ | – | | | $ | – | | $ | – | | | $ | (346,628 | ) | | $ | – | | $ | (346,628 | ) |
Total | | $ | – | | | $ | – | | $ | – | | | $ | (346,628 | ) | | $ | – | | $ | (346,628 | ) |
| | | | | | |
| | | | | | | | High Yield | | | | | | | | Pennsylvania | |
| Investment Type* | | Level 1 | | | Level 2 | | Total | | | Level 1 | | | Level 2 | | Total | |
Municipal Bonds | | $ | – | | | $ | 1,684,103,110 | | $ | 1,684,103,110 | | | $ | – | | | $ | 91,998,276 | | $ | 91,998,276 | |
Money Market Mutual Funds | | | 3,417,798 | | | | – | | | 3,417,798 | | | | 91 | | | | – | | | 91 | |
Variable Rate Demand Note | | | – | | | | 3,000,000 | | | 3,000,000 | | | | – | | | | – | | | – | |
Total | | $ | 3,417,798 | | | $ | 1,687,103,110 | | $ | 1,690,520,908 | | | $ | 91 | | | $ | 91,998,276 | | $ | 91,998,367 | |
| | | | | | |
Other Financial
Instruments | | | | | | | | | | | | | | | | |
Futures | | $ | (4,984,661 | ) | | $ | – | | $ | (4,984,661 | ) | | $ | (97,971 | ) | | $ | – | | $ | (97,971 | ) |
Total | | $ | (4,984,661 | ) | | $ | – | | $ | (4,984,661 | ) | | $ | (97,971 | ) | | $ | – | | $ | (97,971 | ) |
| * | See Schedule of Investments for values in each industry. |
| (j) | | Disclosures about Derivative Instruments and Hedging Activities–Each Fund adopted ASC Topic 815, Derivatives and Hedging (formerly SFAS 161), for the fiscal year ended September 30, 2009. |
Each Fund, except Short Duration, entered into U.S. Treasury futures contracts during the fiscal year ended September 30, 2009 (as described in note 2(f)) to hedge against changes in interest rates. The Funds bear the risk of interest rates moving unexpectedly, in which case the Funds may not achieve the anticipated benefits of the futures contracts and realize a loss. There is minimal counterparty credit risk to the Funds since futures are exchange traded and the exchange’s clearinghouse, as counterparty to all exchange traded futures, guarantees futures against default.
225
Notes to Financial Statements (continued)
As of September 30, 2009, the Funds had interest rate futures contracts with cumulative unrealized depreciation which are included in the Schedule of Investments. Only the current day’s variation margin is included in the Statement of Assets and Liabilities. The net realized gain/(loss) and change in unrealized appreciation/depreciation on futures contracts are included in the Statement of Operations under the captions Net realized loss on investments and futures contracts and Net change in unrealized appreciation/depreciation on investments and futures contracts, respectively.
The following is a summary of U.S. Treasury futures contracts as of and for the fiscal year ended September 30, 2009:
| | | | | | | | | | | | | | |
| | | Unrealized
Depreciation as of
September 30, 2009 | | | Net Realized Gain/(Loss) | | | Change in
Unrealized
Appreciation/
Depreciation | | | Average
Number of
Contracts* |
National | | $ | (1,954,176 | ) | | $ | 2,109,150 | | | $ | (1,852,468 | ) | | 452 |
California | | | (310,870 | ) | | | (804,766 | ) | | | (275,523 | ) | | 119 |
Connecticut | | | (351,283 | ) | | | (1,111,876 | ) | | | (309,095 | ) | | 141 |
Hawaii | | | (304,131 | ) | | | (264,066 | ) | | | (282,541 | ) | | 95 |
Missouri | | | (282,759 | ) | | | (165,252 | ) | | | (254,144 | ) | | 92 |
New Jersey | | | (332,160 | ) | | | (1,166,051 | ) | | | (292,925 | ) | | 128 |
New York | | | (566,108 | ) | | | (1,599,476 | ) | | | (501,869 | ) | | 200 |
Intermediate | | | (697,430 | ) | | | 184,618 | | | | (1,052,549 | ) | | 217 |
Georgia | | | (346,628 | ) | | | (1,021,167 | ) | | | (300,527 | ) | | 152 |
High Yield | | | (4,984,661 | ) | | | (519,149 | ) | | | (4,673,873 | ) | | 1,055 |
Pennsylvania | | | (97,971 | ) | | | (102,006 | ) | | | (90,113 | ) | | 29 |
| * | Calculated based on the number of contracts for the fiscal year ended September 30, 2009. |
3. MANAGEMENT FEE AND OTHER TRANSACTIONS WITH AFFILIATES
Management Fee
The Company and Trust each have a management agreement with Lord, Abbett & Co. LLC (“Lord Abbett”), pursuant to which Lord Abbett supplies each Fund with investment management services and executive and other personnel, pays the remuneration of officers, provides office space and pays for ordinary and necessary office and clerical expenses relating to research and statistical work and supervision of each Fund’s investment portfolio.
The management fee is based on each Fund’s average daily net assets at the following annual rate, for all Funds, other than Intermediate, Short Duration and High Yield:
| | | |
First $1 billion | | .45 | % |
Next $1 billion | | .40 | % |
Over $2 billion | | .35 | % |
The management fee for Intermediate and Short Duration is based on each Fund’s average daily net assets at the following annual rate:
| | | |
First $2 billion | | .40 | % |
Next $3 billion | | .375 | % |
Over $5 billion | | .35 | % |
226
Notes to Financial Statements (continued)
The management fee for High Yield is based on the Fund’s average daily net assets at the following annual rate:
| | | |
First $1 billion | | .50 | % |
Next $1 billion | | .45 | % |
Over $2 billion | | .40 | % |
For the fiscal year ended September 30, 2009, the effective management fee paid to Lord Abbett was at the following annualized rate of each Fund’s average daily net assets:
| | |
| | | Effective Management Fee |
National | | .45% |
California | | .45% |
Connecticut | | .45% |
Hawaii | | .45% |
Missouri | | .45% |
New Jersey | | .45% |
New York | | .45% |
Intermediate | | .40% |
Short Duration | | .40% |
Georgia | | .45% |
High Yield | | .50% |
Pennsylvania | | .45% |
Lord Abbett provides certain administrative services to each Fund pursuant to an Administrative Services Agreement at an annual rate of .04% of each Fund’s average daily net assets.
For the period from October 1, 2008 through January 31, 2009, Lord Abbett had contractually agreed to reimburse expenses for each Fund, other than Intermediate, Short Duration and High Yield, to the extent necessary so that each class’ total annual operating expenses (excluding interest expense) did not exceed the following annual rates:
| | |
| Class | | % of Average Daily Net Assets |
A | | .95% |
B | | 1.60% |
C | | 1.60% |
F | | .70% |
I | | .75% |
P | | 1.05% |
Effective February 1, 2009, the contractual reimbursements for all classes of the Funds ended.
For the fiscal year ended September 30, 2009, Lord Abbett voluntarily reimbursed approximately an additional $19,000, $11,000, $4,000, and $2,000, of expenses for Connecticut, Hawaii, Missouri, and Georgia, respectively. Lord Abbett has discontinued the voluntary reimbursements.
227
Notes to Financial Statements (continued)
Effective February 1, 2009, Lord Abbett is voluntarily reimbursing a portion of Intermediate Fund’s expenses to the extent necessary so that each class’ total annual operating expenses (excluding interest expense) do not exceed the following annual rates:
| | |
| Class | | % of Average Daily Net Assets(1)(2) |
A | | .50% |
B | | 1.30% |
C | | 1.12% |
F | | .40% |
P | | .75% |
Lord Abbett may discontinue the voluntary reimbursement or change the level of its reimbursement at any time.
| (1) | For the period from October 1, 2008 through January 31, 2009, Lord Abbett had contractually agreed to reimburse expenses for Intermediate, to the extent necessary, so that each class’ total annual operating expenses (excluding interest expense) did not exceed an annual rate of .25% of average daily net assets for Class A shares, 1.00% of average daily net assets for Class B and C shares, .10% of average daily net assets for Class F shares, and .45% of average daily net assets for Class P shares. |
| (2) | Effective October 1, 2009, Lord Abbett is voluntarily reimbursing a portion of Intermediate Fund’s expenses, to the extent necessary, so that each class’ total annual operating expenses (excluding interest expense) do not exceed an annual rate of .63% of average daily net assets for Class A shares, 1.43% of average daily net assets for Class B shares, 1.35% of average daily net assets for Class C Shares, .53% of average daily net assets for Class F shares and .88% of average daily net assets for Class P shares. |
For the period from December 12, 2008 through January 31, 2010, Lord Abbett has contractually agreed to reimburse expenses for Short Duration to the extent necessary so that each class’ total annual operating expenses (excluding interest expense) do not exceed the following annual rates:
| | |
| Class | | % of Average Daily Net Assets(1) |
A | | .50% |
B | | 1.30% |
C | | 1.30% |
F | | .40% |
I | | .30% |
| (1) | Lord Abbett is also voluntarily reimbursing a portion of the Fund’s expenses, to the extent necessary, so that each class’ total annual operating expenses (excluding interest expense) do not exceed an annualized rate of .45% of average daily net assets for Class A shares, 1.25% of average daily net assets for Class B and C shares, .35% of average daily net assets for Class F shares and .25% of average daily net assets for Class I shares. Effective October 1, 2009, Lord Abbett has discontinued its voluntary reimbursement. |
For the period April 15, 2008 through November 3, 2008, Lord Abbett voluntarily agreed to reimburse expenses for High Yield to the extent necessary so that Class B and Class C’s total annual operating expenses (excluding interest expense) did not exceed 1.33% of average daily net assets. Effective November 4, 2008, Lord Abbett is no longer voluntarily reimbursing expenses for any Class of shares of High Yield.
12b-1 Distribution Plan
Each Fund has adopted a distribution plan with respect to Class A, B, C, F and P shares pursuant to Rule 12b-1 under the Act, which provides for the payment of ongoing distribution and service fees to Lord Abbett Distributor LLC (the “Distributor”), an affiliate of Lord Abbett. The fees are accrued daily at annual rates based upon average daily net assets as follows:
| | | | | | | | | | |
| Fees | | Class A | | Class B | | Class C(1) | | Class F | | Class P |
Service | | .15% | | .25% | | .25% | | – | | .20% |
Distribution | | .05% | | .75% | | 75% | | .10% | | .25% |
| (1) | The Rule 12b-1 fee each Fund pays on Class C shares is at a blended rate calculated based on 1.00% of each Fund’s average daily net assets attributable to Class C shares held for less than one year and .80% of each Fund’s average daily net assets attributable to Class C shares held for one year or more. All Class C shareholders of a Fund will bear Rule 12b-1 fees at the same rate. |
Class I does not have a distribution plan.
228
Notes to Financial Statements (continued)
Commissions
Distributor received the following commissions on sales of shares of the Funds, after concessions were paid to authorized dealers, for the fiscal year ended September 30, 2009:
| | | | | | |
| | | Distributor
Commissions | | Dealers’
Concessions |
National | | $ | 310,716 | | $ | 1,442,126 |
California | | | 37,220 | | | 176,700 |
Connecticut | | | 30,983 | | | 145,611 |
Hawaii | | | 46,028 | | | 219,355 |
Missouri | | | 72,938 | | | 348,134 |
New Jersey | | | 14,465 | | | 69,388 |
New York | | | 34,753 | | | 156,871 |
Intermediate | | | 196,634 | | | 1,208,081 |
Short Duration* | | | 153,600 | | | 938,463 |
Georgia | | | 58,759 | | | 279,385 |
High Yield | | | 628,450 | | | 2,978,710 |
Pennsylvania | | | 27,417 | | | 134,183 |
| * | For the period December 12, 2008 (commencement of investment operations) to September 30, 2009. |
Distributor received the following amount of CDSCs for the fiscal year ended September 30, 2009:
| | | | | | |
| | | Class A | | Class C |
National | | $ | 9,448 | | $ | 31,300 |
California | | | 7 | | | 16,961 |
Connecticut | | | 10,000 | | | – |
Hawaii | | | 4,410 | | | – |
New Jersey | | | 9,070 | | | – |
New York | | | 19,983 | | | 6,479 |
Intermediate | | | 358,343 | | | 72,714 |
Short Duration* | | | 31,502 | | | 33,389 |
Georgia | | | 13,068 | | | – |
High Yield | | | 63,209 | | | 98,479 |
| * | For the period December 12, 2008 (commencement of investment operations) to September 30, 2009. |
Two Directors/Trustees and certain of the Company’s and Trust’s officers have an interest in Lord Abbett.
4. DISTRIBUTIONS AND CAPITAL LOSS CARRYFORWARDS
Dividends from net investment income, if any, are declared daily and paid monthly. Taxable net realized gains from investment transactions, reduced by allowable capital loss carryforwards, if any, are declared and distributed to shareholders at least annually. The capital loss carryforward amount, if any, is available to offset future net capital gains. Dividends and distributions to shareholders are recorded on the ex-dividend date. The amounts of dividends and distributions from net investment income and net realized capital gains are determined in accordance with federal income tax regulations which may differ from accounting principles generally accepted in the United States of America. These book/tax differences are either considered temporary or permanent in nature. To the extent these differences are permanent in nature, such amounts are reclassified within the components of net assets based on their federal tax basis treatment; temporary differences do not require reclassification. Dividends and distributions, which exceed earnings and profits for tax purposes, are reported as a tax return of capital.
229
Notes to Financial Statements (continued)
The tax character of distributions paid during the fiscal years ended September 30, 2009 and 2008 was as follows:
| | | | | | | | | | | | |
| | | National | | | | California |
| | | 9/30/2009 | | 9/30/2008 | | 9/30/2009 | | 9/30/2008 |
Distributions paid from: | | | | | | | | | | | | |
Tax exempt income | | $ | 46,632,458 | | $ | 39,554,659 | | $ | 7,987,442 | | $ | 7,333,335 |
Ordinary income | | | – | | | 373,850 | | | – | | | – |
Total distributions paid | | $ | 46,632,458 | | $ | 39,928,509 | | $ | 7,987,442 | | $ | 7,333,335 |
| | |
| | | Connecticut | | Hawaii |
| | | 9/30/2009 | | 9/30/2008 | | 9/30/2009 | | 9/30/2008 |
Distributions paid from: | | | | | | | | | | | | |
Tax exempt income | | $ | 5,150,419 | | $ | 5,720,429 | | $ | 4,878,114 | | $ | 4,760,208 |
Total distributions paid | | $ | 5,150,419 | | $ | 5,720,429 | | $ | 4,878,114 | | $ | 4,760,208 |
| | |
| | | Missouri | | New Jersey |
| | | 9/30/2009 | | 9/30/2008 | | 9/30/2009 | | 9/30/2008 |
Distributions paid from: | | | | | | | | | | | | |
Tax exempt income | | $ | 6,840,425 | | $ | 6,852,683 | | $ | 5,528,952 | | $ | 5,579,113 |
Total distributions paid | | $ | 6,840,425 | | $ | 6,852,683 | | $ | 5,528,952 | | $ | 5,579,113 |
| | |
| | | New York | | Intermediate |
| | | 9/30/2009 | | 9/30/2008 | | 9/30/2009 | | 9/30/2008 |
Distributions paid from: | | | | | | | | | | | | |
Tax exempt income | | $ | 11,522,190 | | $ | 11,753,861 | | $ | 26,084,998 | | $ | 4,539,327 |
Total distributions paid | | $ | 11,522,190 | | $ | 11,753,861 | | $ | 26,084,998 | | $ | 4,539,327 |
| | |
| | | Short Duration | | Georgia |
| | | Period Ended
9/30/2009* | | | | 9/30/2009 | | 9/30/2008 |
Distributions paid from: | | | | | | | | | | | | |
Tax exempt income | | $ | 4,947,163 | | | | | $ | 5,412,113 | | $ | 5,533,092 |
Total distributions paid | | $ | 4,947,163 | | | | | $ | 5,412,113 | | $ | 5,533,092 |
| * | For the period December 12, 2008 (commencement of investment operations) to September 30, 2009. |
| | | | | | | | | | | | |
| | | High Yield | | Pennsylvania |
| | | 9/30/2009 | | 9/30/2008 | | 9/30/2009 | | 9/30/2008 |
Distributions paid from: | | | | | | | | | | | | |
Tax exempt income | | $ | 68,057,698 | | $ | 67,344,185 | | $ | 4,080,972 | | $ | 4,054,391 |
Net long-term capital gains | | | – | | | – | | | 6,026 | | | – |
Total distributions paid | | $ | 68,057,698 | | $ | 67,344,185 | | $ | 4,086,998 | | $ | 4,054,391 |
230
Notes to Financial Statements (continued)
As of September 30, 2009, the components of accumulated gains/losses on a tax-basis were as follows:
| | | | | | | | |
| | | National | | | California | |
Capital loss carryforwards* | | $ | (25,784,309 | ) | | $ | (2,650,798 | ) |
Temporary differences | | | (18,999,918 | ) | | | (5,896,702 | ) |
Unrealized gains – net | | | 34,747,005 | | | | 5,550,028 | |
Total accumulated losses – net | | $ | (10,037,222 | ) | | $ | (2,997,472 | ) |
| | |
| | | Connecticut | | | Hawaii | |
Capital loss carryforwards* | | $ | (1,326,115 | ) | | $ | (2,038,544 | ) |
Temporary differences | | | (2,625,939 | ) | | | (1,893,647 | ) |
Unrealized gains – net | | | 1,617,983 | | | | 4,937,187 | |
Total accumulated gains/losses – net | | $ | (2,334,071 | ) | | $ | 1,004,996 | |
| | |
| | | Missouri | | | New Jersey | |
Capital loss carryforwards* | | $ | (207,596 | ) | | $ | (1,461,193 | ) |
Temporary differences | | | (1,945,887 | ) | | | (4,788,985 | ) |
Unrealized gains – net | | | 1,995,944 | | | | 145,859 | |
Total accumulated losses – net | | $ | (157,539 | ) | | $ | (6,104,319 | ) |
| | |
| | | New York | | | Intermediate | |
Capital loss carryforwards* | | $ | (1,842,705 | ) | | $ | (272,138 | ) |
Temporary differences | | | (7,167,404 | ) | | | (2,054,372 | ) |
Unrealized gains – net | | | 6,947,028 | | | | 59,828,138 | |
Total accumulated gains/losses – net | | $ | (2,063,081 | ) | | $ | 57,501,628 | |
| | |
| | | Short Duration | | | Georgia | |
Undistributed ordinary income – net | | $ | 41,629 | | | $ | – | |
Total undistributed earnings | | $ | 41,629 | | | $ | – | |
Capital loss carryforwards* | | | – | | | | (804,025 | ) |
Temporary differences | | | (5,402 | ) | | | (3,913,877 | ) |
Unrealized gains – net | | | 8,937,410 | | | | 3,189,783 | |
Total accumulated gains/losses – net | | $ | 8,973,637 | | | $ | (1,528,119 | ) |
| | |
| | | High Yield | | | Pennsylvania | |
Capital loss carryforwards* | | $ | (140,364,234 | ) | | $ | – | |
Temporary differences | | | (84,729,844 | ) | | | (1,688,690 | ) |
Unrealized gains/losses – net | | | (118,309,081 | ) | | | 1,594,141 | |
Total accumulated losses – net | | $ | (343,403,159 | ) | | $ | (94,549 | ) |
| * | As of September 30, 2009, the capital loss carryforwards, along with the related expiration dates, were as follows: |
| | | | | | | | | | | | | | | | | | | | | | | | | | | |
| | | 2010 | | 2011 | | 2012 | | 2013 | | 2014 | | 2015 | | 2016 | | 2017 | | Total |
National | | $ | 806,580 | | $ | 1,807,613 | | $ | 4,214,676 | | $ | 112,599 | | $ | 1,000,976 | | $ | 1,179,825 | | $ | 1,176,030 | | $ | 15,486,010 | | $ | 25,784,309 |
California | | | – | | | 34,990 | | | 777,657 | | | – | | | – | | | 429,137 | | | 3,345 | | | 1,405,669 | | | 2,650,798 |
Connecticut | | | – | | | – | | | 457,625 | | | – | | | 99,211 | | | 349,983 | | | 215,644 | | | 203,652 | | | 1,326,115 |
Hawaii | | | – | | | – | | | 1,593,681 | | | – | | | – | | | 49,609 | | | – | | | 395,254 | | | 2,038,544 |
Missouri | | | – | | | – | | | – | | | – | | | – | | | 207,596 | | | – | | | – | | | 207,596 |
New Jersey | | | – | | | – | | | 1,373,781 | | | – | | | 87,412 | | | – | | | – | | | – | | | 1,461,193 |
New York | | | – | | | – | | | – | | | – | | | 562,562 | | | – | | | – | | | 1,280,143 | | | 1,842,705 |
Intermediate | | | – | | | – | | | 26,684 | | | 63,298 | | | 16,132 | | | 140,520 | | | 25,504 | | | – | | | 272,138 |
Georgia | | | – | | | – | | | – | | | – | | | – | | | 567,621 | | | 236,404 | | | – | | | 804,025 |
High Yield | | | – | | | – | | | – | | | – | | | 1,759,893 | | | 9,152,078 | | | 16,838,530 | | | 112,613,733 | | | 140,364,234 |
231
Notes to Financial Statements (continued)
Certain losses incurred after October 31 (“Post-October losses”), within the taxable year are deemed to arise on the first business day of the Fund’s next taxable year. The following Funds incurred and will elect to defer net capital losses during fiscal 2009 as follows:
| | | |
| | | Post-October Losses |
National | | $ | 17,809,648 |
California | | | 5,258,236 |
Connecticut | | | 2,269,777 |
Hawaii | | | 1,543,249 |
Missouri | | | 1,431,643 |
New Jersey | | | 4,368,599 |
New York | | | 6,218,545 |
Intermediate | | | 1,807,693 |
Georgia | | | 3,783,895 |
High Yield | | | 81,470,156 |
Pennsylvania | | | 1,440,488 |
As of September 30, 2009, the aggregate unrealized security gains and losses based on cost for U.S. federal income tax purposes are as follows:
| | | | | | | | | | | | | | |
| | | Tax Cost | | Gross
Unrealized
Gain | | Gross Unrealized Loss | | | Net Unrealized Gain/(Loss) | |
National | | $ | 1,014,073,537 | | $ | 75,232,195 | | $ | (40,485,190 | ) | | $ | 34,747,005 | |
California | | | 184,451,845 | | | 11,165,270 | | | (5,615,242 | ) | | | 5,550,028 | |
Connecticut | | | 119,209,953 | | | 4,762,249 | | | (3,144,266 | ) | | | 1,617,983 | |
Hawaii | | | 121,017,094 | | | 6,856,197 | | | (1,919,010 | ) | | | 4,937,187 | |
Missouri | | | 166,074,939 | | | 6,512,699 | | | (4,516,755 | ) | | | 1,995,944 | |
New Jersey | | | 127,844,999 | | | 7,604,809 | | | (7,458,950 | ) | | | 145,859 | |
New York | | | 261,438,427 | | | 13,915,757 | | | (6,968,729 | ) | | | 6,947,028 | |
Intermediate | | | 1,019,062,813 | | | 61,581,058 | | | (1,752,920 | ) | | | 59,828,138 | |
Short Duration | | | 822,526,988 | | | 9,018,194 | | | (80,784 | ) | | | 8,937,410 | |
Georgia | | | 120,727,626 | | | 5,577,978 | | | (2,388,195 | ) | | | 3,189,783 | |
High Yield | | | 1,617,257,763 | | | 83,209,637 | | | (201,518,718 | ) | | | (118,309,081 | ) |
Pennsylvania | | | 90,404,226 | | | 4,686,973 | | | (3,092,832 | ) | | | 1,594,141 | |
The difference between book-basis and tax-basis unrealized gains (losses) is attributable to tax treatment of accretion on market discount, tender option bond trusts and other temporary adjustments.
Permanent items identified during the fiscal year ended September 30, 2009 have been reclassified among the components of net assets based on their tax basis treatment as follows:
| | | | | | | | | | | |
| | | Undistributed/
(Distributions in Excess of) Net Investment Income | | | Accumulated Net Realized Loss | | Paid-in Capital | |
National | | $ | (4,247 | ) | | $ | 220,951 | | $ | (216,704 | ) |
California | | | (3,444 | ) | | | 3,444 | | | – | |
Connecticut | | | 47,036 | | | | 523,150 | | | (570,186 | ) |
Hawaii | | | 89,555 | | | | 267,165 | | | (356,720 | ) |
Missouri | | | 102,132 | | | | 6,117 | | | (108,249 | ) |
New Jersey | | | 23,344 | | | | 4,024 | | | (27,368 | ) |
232
Notes to Financial Statements (continued)
| | | | | | | | | | | | |
| | | Undistributed/
(Distributions in Excess of) Net Investment Income | | | Accumulated Net Realized Loss | | | Paid-in Capital | |
New York | | $ | 18,893 | | | $ | (12,352 | ) | | $ | (6,541 | ) |
Intermediate | | | (6,738 | ) | | | 6,738 | | | | – | |
Short Duration* | | | 51,928 | | | | – | | | | (51,928 | ) |
Georgia | | | 4,085 | | | | (4,085 | ) | | | – | |
High Yield | | | 76,709 | | | | (76,709 | ) | | | – | |
Pennsylvania | | | (961 | ) | | | 961 | | | | – | |
| * | For the period December 12, 2008 (commencement of investment operations) to September 30, 2009. |
The permanent difference is attributable to the tax treatment of accretion on market discount, certain expenses, certain distributions, and the expiration of capital loss carryforwards.
5. PORTFOLIO SECURITIES TRANSACTIONS
Purchases and sales of investment securities (excluding short-term investments) for the fiscal year ended September 30, 2009 were as follows:
| | | | | | |
| | | Purchases | | Sales |
National | | $ | 590,325,435 | | $ | 430,973,292 |
California | | | 69,330,300 | | | 58,996,625 |
Connecticut | | | 11,376,811 | | | 27,865,393 |
Hawaii | | | 25,866,041 | | | 21,033,535 |
Missouri | | | 33,535,680 | | | 23,915,601 |
New Jersey | | | 28,284,618 | | | 23,587,805 |
New York | | | 57,179,858 | | | 64,587,436 |
Intermediate | | | 748,258,184 | | | 107,438,784 |
Short Duration* | | | 973,221,321 | | | 166,565,000 |
Georgia | | | 22,918,459 | | | 32,493,732 |
High Yield | | | 859,727,975 | | | 352,943,902 |
Pennsylvania | | | 16,455,061 | | | 21,914,517 |
| * | For the period December 12, 2008 (commencement of investment operations) to September 30, 2009. |
There were no purchases or sales of U.S. Government securities for the fiscal year ended September 30, 2009.
6. DIRECTORS’/TRUSTEES’ REMUNERATION
The Company’s and Trust’s officers and the two Directors/Trustees who are associated with Lord Abbett do not receive any compensation from the Company or Trust for serving in such capacities. Outside Directors’/Trustees’ fees are allocated among all Lord Abbett-sponsored funds based on the net assets of each fund. There is an equity-based plan available to all outside Directors/Trustees under which outside Directors/Trustees must defer receipt of a portion of, and may elect to defer receipt of an additional portion of, Directors’/Trustees’ fees. The deferred amounts are treated as though equivalent dollar amounts had been invested in the funds. Such amounts and earnings accrued thereon are included in Directors’/Trustees’ fees on the Statements of Operations and in Directors’/Trustees’ fees payable on the Statements of Assets and Liabilities and are not deductible for U.S. federal income tax purposes until such amounts are paid.
233
Notes to Financial Statements (continued)
7. EXPENSE REDUCTIONS
The Company and Trust have entered into arrangements with each Fund’s transfer agent and custodian, whereby credits realized as a result of uninvested cash balances are used to reduce a portion of each Fund’s expenses.
8. LINE OF CREDIT
High Yield, Short Duration and certain other funds managed by Lord Abbett have available an unsecured revolving credit facility (“Facility”) from State Street Bank and Trust Company (“SSB”), to be used for temporary or emergency purposes as an additional source of liquidity to fund redemptions of investor shares. The Facility is renewed annually under terms that depend on market conditions at the time of the renewal. Accordingly, effective December 5, 2008, the amount available under the Facility was changed from $250,000,000 to $200,000,000 and the annual fee to maintain the Facility (of which each participating fund pays its pro rata share based on the net assets of each participating fund) was changed from .08% of the amount available under the Facility to .125%. This amount is included in Other Expenses on the Fund’s Statement of Operations. Any borrowings under this Facility will bear interest at current market rates as set forth in the credit agreement. As of September 30, 2009, there were no loans outstanding pursuant to this Facility nor was the Facility utilized at any time during the fiscal year ended September 30, 2009.
9. CUSTODIAN AND ACCOUNTING AGENT
SSB is the Company’s and Trust’s custodian and accounting agent. SSB performs custodial, accounting and recordkeeping functions relating to portfolio transactions and calculating each Fund’s NAV.
10. INVESTMENT RISKS
Each Fund’s performance and the value of its investments will vary in response to changes in interest rates and other market factors. As interest rates rise, a Fund’s investments typically will lose value. This risk is usually greater for long-term bonds and particularly for inverse floaters than for shorter-term bonds. As a result, each Fund, to the extent it invests in long-term bonds and inverse floaters, is subject to such greater market risk.
Additional risks that could reduce each Fund’s performance or increase volatility include call risk, governmental risk, legislative risk, management risk, reclassification risk, sector risk and credit risk. Credit risk varies among states based upon the economic and fiscal conditions of each state and the municipalities within the state.
There is the risk that an issuer of a municipal bond may fail to make timely payments of principal or interest to a Fund, a risk that is greater with municipal bonds rated below investment grade (sometimes called “lower rated bonds” or “junk bonds”). High Yield invests a significant portion of its assets in such bonds. The National Fund may invest up to 35% and all other Funds may invest up to 20% in such bonds. Some issuers, particularly of junk bonds, may default as to principal and/or interest payments after a Fund purchases their securities. A default, or concerns in the market about an increase in risk of default or the deterioration in the creditworthiness of an issuer, may result in losses to the Fund. Junk bonds are considered predominantly speculative by traditional investment standards. In addition, the market for lower rated municipal bonds generally is less
234
Notes to Financial Statements (continued)
liquid than the market for higher rated bonds, subjecting them to greater price fluctuations which could result in losses.
Each Fund (except National, Intermediate and Short Duration) is non-diversified, which means that it may invest a greater portion of its assets in a single issuer than a diversified fund. Thus, it may be exposed to greater risk.
Because each Fund other than National, Intermediate, Short Duration and High Yield focuses on a particular state or territory, each Fund’s performance may be more affected by local, state and regional factors than a fund that invests in municipal bonds issued in many states. These factors may include, for example, economic or political developments, erosion of the tax base and the possibility of credit problems. In addition, downturns or developments in the U.S. economy or in foreign economies or significant world events may harm the performance of any of the Funds (including National, Intermediate, Short Duration and High Yield), and may do so disproportionately as a result of the corresponding disproportionate impact of such occurrences on particular state, territory, or local economies.
Each Fund (except High Yield) may invest up to 20% of its net assets in private activity bonds (sometimes called “AMT paper”). High Yield may invest up to 100% of its net assets in AMT paper. The credit quality of such bonds usually is directly related to the credit standing of the private user of the facilities.
Each Fund may invest no more than 20% of its net assets in TOB Residuals, except High Yield, which may invest up to 100% in TOB Residuals. A TOB Residual, sometimes referred to as an inverse floater or a residual interest bond (“RIB”), is a type of “derivative” debt instrument with a floating or variable interest rate that moves in the opposite direction of the interest rate on another specific fixed-rate security (“specific fixed-rate security”). Changes in the interest rate on the specific fixed-rate security inversely affect the residual interest paid on the TOB Residual, with the result that when interest rates rise, TOB Residuals’ interest payments are lowered and their value falls faster than securities similar to the specific fixed-rate security. When interest rates fall, not only do TOB Residuals generally provide interest payments that are higher than securities similar to the specific fixed-rate security, but their values generally also rise faster than such similar securities.
In addition, loss may result from a Fund’s investments in certain derivative transactions such as futures contracts, swap transactions, interest rate caps, inverse floaters and similar transactions. These instruments may be leveraged so that small changes may produce disproportionate and substantial losses to the Fund. They also may increase a Fund’s interest rate risk.
Each Fund may purchase securities on a forward commitment or when-issued basis. Delivery and payment for such securities can take place a month or more after the transaction date. During this period such securities are subject to market fluctuations.
235
Notes to Financial Statements (continued)
11. SUMMARY OF CAPITAL TRANSACTIONS
Transactions in shares of capital stock or of beneficial interest were as follows:
| | | | | | | | | | | | | | |
| National | | Year Ended
September 30, 2009 | | | Year Ended
September 30, 2008 | |
| Class A Shares | | Shares | | | Amount | | | Shares | | | Amount | |
Shares sold | | 23,157,461 | | | $ | 217,590,447 | | | 19,487,991 | | | $ | 210,159,471 | |
Converted from Class B* | | 390,479 | | | | 3,690,226 | | | 174,389 | | | | 1,852,365 | |
Reinvestment of distributions | | 3,071,956 | | | | 28,956,674 | | | 2,278,434 | | | | 24,407,450 | |
Shares reacquired | | (19,092,419 | ) | | | (178,341,158 | ) | | (17,432,758 | ) | | | (187,167,156 | ) |
Shares issued in reorganizations (See Note 13) | | – | | | | – | | | 24,469,961 | | | | 266,120,610 | |
Increase | | 7,527,477 | | | $ | 71,896,189 | | | 28,978,017 | | | $ | 315,372,740 | |
| | | | |
| Class B Shares | | | | | | | | | | | | |
Shares sold | | 647,795 | | | $ | 6,134,869 | | | 388,572 | | | $ | 4,182,160 | |
Reinvestment of distributions | | 49,393 | | | | 467,821 | | | 42,993 | | | | 464,097 | |
Shares reacquired | | (420,660 | ) | | | (3,989,298 | ) | | (514,652 | ) | | | (5,530,861 | ) |
Converted to Class A* | | (388,516 | ) | | | (3,690,226 | ) | | (173,684 | ) | | | (1,852,365 | ) |
Decrease | | (111,988 | ) | | $ | (1,076,834 | ) | | (256,771 | ) | | $ | (2,736,969 | ) |
| | | | |
| Class C Shares | | | | | | | | | | | | |
Shares sold | | 6,932,638 | | | $ | 66,039,404 | | | 5,018,011 | | | $ | 54,283,446 | |
Reinvestment of distributions | | 191,370 | | | | 1,815,991 | | | 109,539 | | | | 1,176,085 | |
Shares reacquired | | (2,785,738 | ) | | | (25,995,776 | ) | | (2,013,447 | ) | | | (21,623,338 | ) |
Shares issued in reorganizations
(See Note 13) | | – | | | | – | | | 542,967 | | | | 5,918,398 | |
Increase | | 4,338,270 | | | $ | 41,859,619 | | | 3,657,070 | | | $ | 39,754,591 | |
| | | | |
| Class F Shares | | | | | | | | | | | | |
Shares sold | | 3,160,213 | | | $ | 29,811,438 | | | 241,107 | | | $ | 2,517,062 | |
Reinvestment of distributions | | 16,750 | | | | 160,775 | | | 1,088 | | | | 11,404 | |
Shares reacquired | | (702,231 | ) | | | (6,875,749 | ) | | (5,104 | ) | | | (53,203 | ) |
Increase | | 2,474,732 | | | $ | 23,096,464 | | | 237,091 | | | $ | 2,475,263 | |
| | |
| California | | Year Ended
September 30, 2009 | | | Year Ended
September 30, 2008 | |
| Class A Shares | | Shares | | | Amount | | | Shares | | | Amount | |
Shares sold | | 3,566,189 | | | $ | 32,780,250 | | | 3,178,432 | | | $ | 32,527,728 | |
Reinvestment of distributions | | 500,369 | | | | 4,580,769 | | | 427,316 | | | | 4,388,744 | |
Shares reacquired | | (3,726,025 | ) | | | (33,739,137 | ) | | (2,226,767 | ) | | | (22,812,202 | ) |
Increase | | 340,533 | | | $ | 3,621,882 | | | 1,378,981 | | | $ | 14,104,270 | |
| | | | |
| Class C Shares | | | | | | | | | | | | |
Shares sold | | 1,346,856 | | | $ | 12,507,679 | | | 940,205 | | | $ | 9,598,220 | |
Reinvestment of distributions | | 57,701 | | | | 530,324 | | | 25,972 | | | | 266,449 | |
Shares reacquired | | (565,735 | ) | | | (5,179,687 | ) | | (405,588 | ) | | | (4,156,982 | ) |
Increase | | 838,822 | | | $ | 7,858,316 | | | 560,589 | | | $ | 5,707,687 | |
236
Notes to Financial Statements (continued)
| | | | | | | | | | | | | | |
| California | | Year Ended
September 30, 2009 | | | Year Ended
September 30, 2008 | |
| Class F Shares | | Shares | | | Amount | | | Shares | | | Amount | |
Shares sold | | 702,198 | | | $ | 6,489,295 | | | 29,394 | | | $ | 292,419 | |
Reinvestment of distributions | | 1,119 | | | | 10,347 | | | 98 | | | | 988 | |
Shares reacquired | | (86,785 | ) | | | (824,439 | ) | | – | | | | – | |
Increase | | 616,532 | | | $ | 5,675,203 | | | 29,492 | | | $ | 293,407 | |
| | |
| Connecticut | | Year Ended
September 30, 2009 | | | Year Ended
September 30, 2008 | |
| Class A Shares | | Shares | | | Amount | | | Shares | | | Amount | |
Shares sold | | 1,765,258 | | | $ | 16,399,919 | | | 4,562,253 | | | $ | 45,778,685 | |
Reinvestment of distributions | | 351,724 | | | | 3,258,512 | | | 350,219 | | | | 3,522,571 | |
Shares reacquired | | (4,406,645 | ) | | | (40,323,314 | ) | | (4,341,227 | ) | | | (43,200,827 | ) |
Increase (decrease) | | (2,289,663 | ) | | $ | (20,664,883 | ) | | 571,245 | | | $ | 6,100,429 | |
| | | | |
| Class F Shares | | | | | | | | | | | | |
Shares sold | | 564,725 | | | $ | 5,224,295 | | | 35,299 | | | $ | 346,979 | |
Reinvestment of distributions | | 1,835 | | | | 17,248 | | | 218 | | | | 2,161 | |
Shares reacquired | | (45,613 | ) | | | (434,901 | ) | | – | | | | – | |
Increase | | 520,947 | | | $ | 4,806,642 | | | 35,517 | | | $ | 349,140 | |
| | |
| Hawaii | | Year Ended
September 30, 2009 | | | Year Ended
September 30, 2008 | |
| Class A Shares | | Shares | | | Amount | | | Shares | | | Amount | |
Shares sold | | 4,500,010 | | | $ | 20,599,105 | | | 5,632,268 | | | $ | 27,429,595 | |
Reinvestment of distributions | | 712,175 | | | | 3,260,523 | | | 644,272 | | | | 3,128,697 | |
Shares reacquired | | (4,764,703 | ) | | | (21,747,211 | ) | | (1,992,651 | ) | | | (9,633,169 | ) |
Increase | | 447,482 | | | $ | 2,112,417 | | | 4,283,889 | | | $ | 20,925,123 | |
| | | | |
| Class F Shares | | | | | | | | | | | | |
Shares sold | | 712,293 | | | $ | 3,258,513 | | | 8,067 | | | $ | 40,010 | |
Reinvestment of distributions | | 93 | | | | 426 | | | 108 | | | | 521 | |
Shares reacquired | | (96,972 | ) | | | (452,288 | ) | | (8,091 | ) | | | (38,843 | ) |
Increase | | 615,414 | | | $ | 2,806,651 | | | 84 | | | $ | 1,688 | |
| | |
| Missouri | | Year Ended
September 30, 2009 | | | Year Ended
September 30, 2008 | |
| Class A Shares | | Shares | | | Amount | | | Shares | | | Amount | |
Shares sold | | 5,626,960 | | | $ | 26,162,439 | | | 4,902,746 | | | $ | 24,983,520 | |
Reinvestment of distributions | | 1,264,443 | | | | 5,888,868 | | | 1,133,162 | | | | 5,758,679 | |
Shares reacquired | | (5,129,779 | ) | | | (23,901,927 | ) | | (4,499,601 | ) | | | (22,756,012 | ) |
Increase | | 1,761,624 | | | $ | 8,149,380 | | | 1,536,307 | | | $ | 7,986,187 | |
| | | | |
| Class F Shares | | | | | | | | | | | | |
Shares sold | | 140,624 | | | $ | 651,895 | | | 13,996 | | | $ | 69,687 | |
Reinvestment of distributions | | 749 | | | | 3,533 | | | 130 | | | | 656 | |
Shares reacquired | | (41,956 | ) | | | (201,086 | ) | | – | | | | – | |
Increase | | 99,417 | | | $ | 454,342 | | | 14,126 | | | $ | 70,343 | |
237
Notes to Financial Statements (continued)
| | | | | | | | | | | | | | |
| New Jersey | | Year Ended
September 30, 2009 | | | Year Ended
September 30, 2008 | |
| Class A Shares | | Shares | | | Amount | | | Shares | | | Amount | |
Shares sold | | 4,249,135 | | | $ | 18,353,863 | | | 4,356,945 | | | $ | 21,290,725 | |
Reinvestment of distributions | | 822,628 | | | | 3,541,186 | | | 691,213 | | | | 3,367,440 | |
Shares reacquired | | (4,027,786 | ) | | | (17,189,603 | ) | | (4,946,493 | ) | | | (24,008,559 | ) |
Increase | | 1,043,977 | | | $ | 4,705,446 | | | 101,665 | | | $ | 649,606 | |
| | | | |
| Class F Shares | | | | | | | | | | | | |
Shares sold | | 214,759 | | | $ | 913,657 | | | 8,742 | | | $ | 42,027 | |
Reinvestment of distributions | | 106 | | | | 454 | | | 85 | | | | 415 | |
Shares reacquired | | (23,015 | ) | | | (104,073 | ) | | – | | | | – | |
Increase | | 191,850 | | | $ | 810,038 | | | 8,827 | | | $ | 42,442 | |
| | |
| New York | | Year Ended
September 30, 2009 | | | Year Ended
September 30, 2008 | |
| Class A Shares | | Shares | | | Amount | | | Shares | | | Amount | |
Shares sold | | 2,674,973 | | | $ | 25,797,930 | | | 5,228,053 | | | $ | 55,945,433 | |
Reinvestment of distributions | | 629,197 | | | | 6,070,602 | | | 574,998 | | | | 6,145,012 | |
Shares reacquired | | (4,601,147 | ) | | | (43,205,779 | ) | | (5,239,735 | ) | | | (56,196,282 | ) |
Increase (decrease) | | (1,296,977 | ) | | $ | (11,337,247 | ) | | 563,316 | | | $ | 5,894,163 | |
| | | | |
| Class C Shares | | | | | | | | | | | | |
Shares sold | | 953,934 | | | $ | 9,246,459 | | | 1,569,460 | | | $ | 16,783,782 | |
Reinvestment of distributions | | 65,722 | | | | 635,248 | | | 46,157 | | | | 491,989 | |
Shares reacquired | | (753,089 | ) | | | (7,228,211 | ) | | (713,188 | ) | | | (7,575,420 | ) |
Increase | | 266,567 | | | $ | 2,653,496 | | | 902,429 | | | $ | 9,700,351 | |
| | | | |
| Class F Shares | | | | | | | | | | | | |
Shares sold | | 314,514 | | | $ | 3,044,123 | | | 2 | | | $ | 22 | |
Reinvestment of distributions | | 82 | | | | 809 | | | 39 | | | | 414 | |
Shares reacquired | | (24,075 | ) | | | (240,451 | ) | | – | | | | – | |
Increase | | 290,521 | | | $ | 2,804,481 | | | 41 | | | $ | 436 | |
| | |
| Intermediate | | Year Ended
September 30, 2009 | | | Year Ended
September 30, 2008 | |
| Class A Shares | | Shares | | | Amount | | | Shares | | | Amount | |
Shares sold | | 66,706,908 | | | $ | 646,411,514 | | | 40,195,207 | | | $ | 392,148,963 | |
Converted from Class B* | | 28,876 | | | | 267,448 | | | 11,598 | | | | 112,817 | |
Reinvestment of distributions | | 1,352,449 | | | | 13,218,996 | | | 229,991 | | | | 2,222,027 | |
Shares reacquired | | (26,336,246 | ) | | | (254,397,711 | ) | | (6,264,088 | ) | | | (61,068,096 | ) |
Increase | | 41,751,987 | | | $ | 405,500,247 | | | 34,172,708 | | | $ | 333,415,711 | |
| | | | |
| Class B Shares | | | | | | | | | | | | |
Shares sold | | 517,482 | | | $ | 4,992,352 | | | 178,271 | | | $ | 1,736,644 | |
Reinvestment of distributions | | 8,161 | | | | 79,995 | | | 1,832 | | | | 17,783 | |
Shares reacquired | | (90,607 | ) | | | (897,535 | ) | | (41,961 | ) | | | (412,071 | ) |
Converted to Class A* | | (28,905 | ) | | | (267,448 | ) | | (11,612 | ) | | | (112,817 | ) |
Increase | | 406,131 | | | $ | 3,907,364 | | | 126,530 | | | $ | 1,229,539 | |
238
Notes to Financial Statements (continued)
| | | | | | | | | | | | | | |
| Intermediate | | Year Ended
September 30, 2009 | | | Year Ended
September 30, 2008 | |
| Class C Shares | | Shares | | | Amount | | | Shares | | | Amount | |
Shares sold | | 14,891,117 | | | $ | 144,975,365 | | | 4,981,219 | | | $ | 48,535,052 | |
Reinvestment of distributions | | 147,194 | | | | 1,444,843 | | | 21,203 | | | | 205,123 | |
Shares reacquired | | (2,195,936 | ) | | | (21,321,863 | ) | | (719,844 | ) | | | (7,038,416 | ) |
Increase | | 12,842,375 | | | $ | 125,098,345 | | | 4,282,578 | | | $ | 41,701,759 | |
| | | | |
| Class F Shares | | | | | | | | | | | | |
Shares sold | | 11,877,313 | | | $ | 115,623,037 | | | 162,412 | | | $ | 1,571,876 | |
Reinvestment of distributions | | 48,907 | | | | 484,860 | | | 1,053 | | | | 10,185 | |
Shares reacquired | | (1,973,165 | ) | | | (19,349,171 | ) | | (9,502 | ) | | | (91,853 | ) |
Increase | | 9,953,055 | | | $ | 96,758,726 | | | 153,963 | | | $ | 1,490,208 | |
| | | | |
| Class P Shares | | | | | | | | | | | | |
Reinvestment of distributions | | 44 | | | $ | 433 | | | 47 | | | $ | 453 | |
Increase | | 44 | | | $ | 433 | | | 47 | | | $ | 453 | |
| | | | | | | |
| Short Duration | | Period Ended
September 30, 2009† | |
| Class A Shares | | Shares | | | Amount | |
Shares sold | | 41,040,571 | | | $ | 633,480,788 | |
Reinvestment of distributions | | 126,913 | | | | 1,963,540 | |
Shares reacquired | | (2,118,245 | ) | | | (32,774,911 | ) |
Increase | | 39,049,239 | | | $ | 602,669,417 | |
| | |
| Class C Shares | | | | | | |
Shares sold | | 8,452,035 | | | $ | 130,419,770 | |
Reinvestment of distributions | | 14,723 | | | | 227,932 | |
Shares reacquired | | (253,247 | ) | | | (3,922,534 | ) |
Increase | | 8,213,511 | | | $ | 126,725,168 | |
| | |
| Class F Shares | | | | | | |
Shares sold | | 7,413,121 | | | $ | 114,387,782 | |
Reinvestment of distributions | | 4,587 | | | | 71,169 | |
Shares reacquired | | (960,486 | ) | | | (14,835,510 | ) |
Increase | | 6,457,222 | | | $ | 99,623,441 | |
| | |
| Class I Shares | | | | | | |
Shares sold | | 245,771 | | | $ | 3,801,557 | |
Reinvestment of distributions | | 978 | | | | 15,177 | |
Shares reacquired | | (28,339 | ) | | | (438,591 | ) |
Increase | | 218,410 | | | $ | 3,378,143 | |
| | | | | | | | | | | | | | |
| Georgia | | Year Ended
September 30, 2009 | | | Year Ended
September 30, 2008 | |
| Class A Shares | | Shares | | | Amount | | | Shares | | | Amount | |
Shares sold | | 4,773,516 | | | $ | 23,724,452 | | | 5,156,781 | | | $ | 27,672,041 | |
Reinvestment of distributions | | 842,110 | | | | 4,170,413 | | | 778,143 | | | | 4,203,091 | |
Shares reacquired | | (7,930,738 | ) | | | (38,740,599 | ) | | (4,986,583 | ) | | | (26,940,704 | ) |
Increase (decrease) | | (2,315,112 | ) | | $ | (10,845,734 | ) | | 948,341 | | | $ | 4,934,428 | |
239
Notes to Financial Statements (continued)
| | | | | | | | | | | | | | |
| Georgia | | Year Ended
September 30, 2009 | | | Year Ended
September 30, 2008 | |
| Class F Shares | | Shares | | | Amount | | | Shares | | | Amount | |
Shares sold | | 1,105,422 | | | $ | 5,438,108 | | | 30,959 | | | $ | 163,864 | |
Reinvestment of distributions | | 8,643 | | | | 43,740 | | | 338 | | | | 1,795 | |
Shares reacquired | | (172,088 | ) | | | (893,620 | ) | | (93 | ) | | | (489 | ) |
Increase | | 941,977 | | | $ | 4,588,228 | | | 31,204 | | | $ | 165,170 | |
| | |
| High Yield | | Year Ended
September 30, 2009 | | | Year Ended
September 30, 2008 | |
| Class A Shares | | Shares | | | Amount | | | Shares | | | Amount | |
Shares sold | | 47,939,592 | | | $ | 494,437,621 | | | 25,601,338 | | | $ | 351,719,516 | |
Reinvestment of distributions | | 2,998,772 | | | | 30,103,453 | | | 2,095,556 | | | | 28,683,721 | |
Shares reacquired | | (24,437,507 | ) | | | (244,096,286 | ) | | (32,996,018 | ) | | | (457,973,062 | ) |
Increase (decrease) | | 26,500,857 | | | $ | 280,444,788 | | | (5,299,124 | ) | | $ | (77,569,825 | ) |
| | | | |
| Class B Shares | | | | | | | | | | | | |
Shares sold | | – | | | $ | – | | | 7.919 | | | $ | 129 | |
Reinvestment of distributions | | 56.040 | | | | 560 | | | 38.577 | | | | 527 | |
Shares reacquired | | (8.000 | ) | | | (83 | ) | | – | | | | – | |
Increase | | 48.040 | | | $ | 477 | | | 46.496 | | | $ | 656 | |
| | | | |
| Class C Shares | | | | | | | | | | | | |
Shares sold | | 15,478,952 | | | $ | 160,511,592 | | | 11,975,251 | | | $ | 164,961,402 | |
Reinvestment of distributions | | 1,065,562 | | | | 10,697,327 | | | 756,289 | | | | 10,345,476 | |
Shares reacquired | | (9,943,939 | ) | | | (100,166,990 | ) | | (15,565,412 | ) | | | (215,601,930 | ) |
Increase (decrease) | | 6,600,575 | | | $ | 71,041,929 | | | (2,833,872 | ) | | $ | (40,295,052 | ) |
| | | | |
| Class F Shares | | | | | | | | | | | | |
Shares sold | | 10,379,446 | | | $ | 104,274,658 | | | 510,281 | | | $ | 6,723,803 | |
Reinvestment of distributions | | 26,674 | | | | 270,032 | | | 3,425 | | | | 44,354 | |
Shares reacquired | | (1,001,211 | ) | | | (10,102,491 | ) | | (135,135 | ) | | | (1,759,060 | ) |
Increase | | 9,404,909 | | | $ | 94,442,199 | | | 378,571 | | | $ | 5,009,097 | |
| | | | |
| Class P Shares | | | | | | | | | | | | |
Shares sold | | – | | | $ | – | | | – | (a) | | $ | 4 | |
Reinvestment of distributions | | 61 | | | | 607 | | | 43 | | | | 588 | |
Increase | | 61 | | | $ | 607 | | | 43 | | | $ | 592 | |
| | | | | | | | | | | | | | |
| Pennsylvania | | Year Ended
September 30, 2009 | | | Year Ended
September 30, 2008 | |
| Class A Shares | | Shares | | | Amount | | | Shares | | | Amount | |
Shares sold | | 2,483,114 | | | $ | 11,555,353 | | | 1,741,319 | | | $ | 8,760,876 | |
Reinvestment of distributions | | 542,106 | | | | 2,497,509 | | | 473,523 | | | | 2,388,915 | |
Shares reacquired | | (2,910,502 | ) | | | (13,328,797 | ) | | (1,752,804 | ) | | | (8,823,444 | ) |
Increase | | 114,718 | | | $ | 724,065 | | | 462,038 | | | $ | 2,326,347 | |
240
Notes to Financial Statements (continued)
| | | | | | | | | | | | |
| Pennsylvania | | Year Ended
September 30, 2009 | | | Year Ended
September 30, 2008 |
| Class F Shares | | Shares | | | Amount | | | Shares | | Amount |
Shares sold | | 84,892.000 | | | $ | 393,224 | | | 2.000 | | $ | 10 |
Reinvestment of distributions | | 531.226 | | | | 2,520 | | | 81.774 | | | 412 |
Shares reacquired | | (10,840.000 | ) | | | (51,490 | ) | | – | | | – |
Increase | | 74,583.226 | | | $ | 344,254 | | | 83.774 | | $ | 422 |
| * | Automatic conversion of Class B shares occurs on the 25th day of the month (or, if the 25th is not a business day, the next business day thereafter) following the eighth anniversary of the day on which the purchase order was accepted. |
| † | For the period December 12, 2008 (commencement of investment operations) to September 30, 2009. |
| (a) | Value is less than 1 share. |
12. RECENT ACCOUNTING PRONOUNCEMENTS
In June 2009, FASB issued amended guidance for transfers of financial assets. This guidance is intended to improve the relevance, representational faithfulness and comparability of the information that a reporting entity provides in its financial statements about a transfer of financial assets; the effects of a transfer on its financial position, financial performance, and cash flows; and a transferor’s continuing involvement, if any, in transferred financial assets. The amended guidance is effective for financial statements issued for fiscal years and interim periods beginning after November 15, 2009. Earlier application is prohibited. The recognition and measurement provisions of this guidance must be applied to transfers occurring on or after the effective date. Additionally, the enhanced disclosure provisions of the amended guidance should be applied to transfers that occurred both before and after the effective date of this guidance. The impact of this guidance on the Funds’ financial statement disclosures, if any, is currently being assessed.
13. REORGANIZATIONS
On December 14, 2007, National acquired the net assets of Florida, Michigan, Minnesota, Texas and Washington, pursuant to a plan of reorganization approved by each Acquired Fund’s shareholders on December 7, 2007. The acquisition was accomplished by a tax-free exchange of 25,012,928 shares (valued at $272,039,008) of National and 48,464,295 shares of the Acquired Funds outstanding on December 14, 2007. The Acquired Funds’ net assets at the date of the acquisition, including $9,763,815 of unrealized appreciation, $71,879 of undistributed (distributions in excess of) net investment income, and $6,172,997 of accumulated net realized losses, were combined with those of National. Net unrealized appreciation, undistributed (distributions in excess) of net investment income and accumulated net realized losses were as follows:
| | | | | | | | | | |
| Acquired Fund | | Net
Unrealized
Appreciation | | Undistributed
(Distributions
in excess of)
Net Investment
Income | | | Accumulated Net Realized Loss |
Florida | | $ | 2,215,977 | | $ | 5,294 | | | $ | 1,222,409 |
Michigan | | | 2,543,473 | | | 36,665 | | | | 705,755 |
Minnesota | | | 96,548 | | | 4,182 | | | | 1,171,794 |
Texas | | | 2,955,039 | | | (9,352 | ) | | | 1,519,516 |
Washington | | | 1,952,778 | | | 35,090 | | | | 1,553,523 |
241
Notes to Financial Statements (concluded)
The shares issued by National and total net assets of the Acquired Funds were as follows:
| | | | | | | |
| Acquired Fund | | Shares
Issued by National | | Shares Exchanged | | Total Net Assets of the Acquired Funds |
Florida – Class A | | 4,603,214 | | 10,928,209 | | $ | 50,061,794 |
Florida – Class C | | 542,967 | | 1,289,781 | | | 5,918,398 |
Michigan – Class A | | 5,868,887 | | 12,391,978 | | | 63,826,490 |
Minnesota – Class A | | 4,248,857 | | 9,290,026 | | | 46,208,019 |
Texas – Class A | | 6,254,984 | | 6,985,424 | | | 68,025,455 |
Washington – Class A | | 3,494,019 | | 7,578,877 | | | 37,998,852 |
The total net assets of National immediately before the transfer were $631,591,891. Total net assets of the Acquired Funds immediately before the transfer were $272,039,008. Total net assets of National immediately after the transfer were $903,630,899.
14. SUBSEQUENT EVENTS
In accordance with the provisions set forth in ASC Topic 855 (formerly SFAS 165), Subsequent Events, adopted by the Funds as of September 30, 2009, management has evaluated subsequent events existing in the Funds’ financial statements through November 30, 2009. Management has determined that there were no material subsequent events that would require recognition or disclosure in the Funds’ financial statements through this date.
242
Report of Independent Registered Public Accounting Firm
To the Shareholders and Board of Directors of Lord Abbett Municipal Income Fund, Inc.:
We have audited the accompanying statements of assets and liabilities, including the schedules of investments, of Lord Abbett Municipal Income Fund, Inc. (the "Funds") comprising Lord Abbett National Tax-Free Income Fund, Lord Abbett California Tax-Free Income Fund, Lord Abbett Connecticut Tax-Free Income Fund, Lord Abbett Hawaii Tax-Free Income Fund, Lord Abbett Missouri Tax-Free Income Fund, Lord Abbett New Jersey Tax-Free Income Fund, and Lord Abbett New York Tax-Free Income Fund as of September 30, 2009, and the related statements of operations for the year then ended, the statements of changes in net assets for each of the two years in the period then ended, and the financial highlights for each of the periods presented. These financial statements and financial highlights are the responsibility of the Funds' management. Our responsibility is to express an opinion on these financial statements and financial highlights based on our audits.
We conducted our audits in accordance with the standards of the Public Company Accounting Oversight Board (United States). Those standards require that we plan and perform the audit to obtain reasonable assurance about whether the financial statements and financial highlights are free of material misstatement. The Funds are not required to have, nor were we engaged to perform, an audit of their internal control over financial reporting. Our audits included consideration of internal control over financial reporting as a basis for designing audit procedures that are appropriate in the circumstances, but not for the purpose of expressing an opinion on the effectiveness of the Funds' internal control over financial reporting. Accordingly, we express no such opinion. An audit also includes examining, on a test basis, evidence supporting the amounts and disclosures in the financial statements, assessing the accounting principles used and significant estimates made by management, as well as evaluating the overall financial statement presentation. Our procedures included confirmation of securities owned as of September 30, 2009, by correspondence with the custodian and brokers; where replies were not received from brokers, we performed other auditing procedures. We believe that our audits provide a reasonable basis for our opinion.
In our opinion, the financial statements and financial highlights referred to above present fairly, in all material respects, the financial position of each of the portfolios constituting the Lord Abbett Municipal Income Fund, Inc. as of September 30, 2009, the results of their operations for the year then ended, the changes in their net assets for each of the two years in the period then ended, and the financial highlights for each of the periods presented, in conformity with accounting principles generally accepted in the United States of America.
DELOITTE & TOUCHE LLP
New York, New York
November 30, 2009
243
Report of Independent Registered Public Accounting Firm
To the Shareholders and Board of Trustees of Lord Abbett Municipal Income Trust:
We have audited the accompanying statements of assets and liabilities, including the schedules of investments, of Lord Abbett Municipal Income Trust (the "Funds") comprising Lord Abbett Intermediate Tax-Free Fund, Lord Abbett Short Duration Tax Free Fund, Georgia Series, Lord Abbett High Yield Municipal Bond Fund, and Pennsylvania Series as of September 30, 2009, and the related statements of operations, the statements of changes in net assets, and the financial highlights for each of the periods presented. These financial statements and financial highlights are the responsibility of the Funds' management. Our responsibility is to express an opinion on these financial statements and financial highlights based on our audits.
We conducted our audits in accordance with the standards of the Public Company Accounting Oversight Board (United States). Those standards require that we plan and perform the audit to obtain reasonable assurance about whether the financial statements and financial highlights are free of material misstatement. The Funds are not required to have, nor were we engaged to perform, an audit of their internal control over financial reporting. Our audits included consideration of internal control over financial reporting as a basis for designing audit procedures that are appropriate in the circumstances, but not for the purpose of expressing an opinion on the effectiveness of the Funds' internal control over financial reporting. Accordingly, we express no such opinion. An audit also includes examining, on a test basis, evidence supporting the amounts and disclosures in the financial statements, assessing the accounting principles used and significant estimates made by management, as well as evaluating the overall financial statement presentation. Our procedures included confirmation of securities owned as of September 30, 2009, by correspondence with the custodian and brokers; where replies were not received from brokers, we performed other auditing procedures. We believe that our audits provide a reasonable basis for our opinion.
In our opinion, the financial statements and financial highlights referred to above present fairly, in all material respects, the financial position of each of the portfolios constituting the Lord Abbett Municipal Income Trust as of September 30, 2009, the results of their operations, changes in their net assets, and the financial highlights for each of the periods presented, in conformity with accounting principles generally accepted in the United States of America.
DELOITTE & TOUCHE LLP
New York, New York
November 30, 2009
244
Basic Information About Management
The Company’s Board of Directors and the Trust’s Board of Trustees (the “Board”) are responsible for the management of the business and affairs of the Company and the Trust in accordance with the laws of the State of Maryland and Delaware, respectively. Each Board appoints officers who are responsible for the day-to-day operations of the Company and the Trust and who execute policies authorized by the Board. Each Board also approves an investment adviser to the Company and the Trust and continues to monitor the cost and quality of the services provided by the investment adviser, and annually considers whether to renew the contract with the adviser. Generally, each Director and Trustee holds office until his/her successor is elected and qualified or until his/her earlier resignation or removal, as provided in the Company’s and the Trust’s organizational documents.
Lord, Abbett & Co. LLC (“Lord Abbett”), a Delaware limited liability company, is the Company’s and the Trust’s investment adviser.
Interested Directors and Trustees
The following Directors and Trustees are partners of Lord Abbett and are "interested persons" of the Company and the Trust as defined in the Act. Mr. Dow and Ms. Foster are officers, directors, or trustees of each of the 14 Lord Abbett-sponsored funds, which consist of 53 portfolios or series.
| | | | | | |
Name, Address and
Year of Birth | | Current Position and
Length of Service with
Company and Trust | | Principal Occupation
During Past Five Years | | Other Directorships |
| | | |
Robert S. Dow Lord, Abbett & Co. LLC 90 Hudson Street Jersey City, NJ 07302 (1945) | | Director since 1989, Trustee since 1991 and Chairman since 1996 | | Senior Partner (since 2007), Chief Executive Officer (since 1996) and prior thereto Managing Partner (1996 - 2007), joined Lord Abbett in 1972. | | N/A |
| | | |
Daria L. Foster Lord, Abbett & Co. LLC 90 Hudson Street Jersey City, NJ 07302 (1954) | | Director/Trustee since 2006 | | Managing Partner (since 2007), and prior thereto Director of Marketing and Client Service, joined Lord Abbett in 1990. | | N/A |
Independent Directors and Trustees
The following independent or outside Directors and Trustees (“Independent Trustees/Directors”) are also directors or trustees of each of the 14 Lord Abbett-sponsored funds, which consist of 53 portfolios or series.
| | | | | | |
Name, Address and
Year of Birth | | Current Position and
Length of Service with
Company and Trust | | Principal Occupation
During Past Five Years | | Other
Directorships |
| | | |
E. Thayer Bigelow Lord, Abbett & Co. LLC c/o Legal Dept. 90 Hudson Street Jersey City, NJ 07302 (1941) | | Director/Trustee since 1994 | | Managing General Partner, Bigelow Media, LLC (since 2000); Senior Adviser, Time Warner Inc. (1998 - 2000). | | Currently serves as director of Crane Co. (since 1984), Huttig Building Products Inc. (since 1998) and R.H. Donnelley Inc. (since 2009). |
245
Basic Information About Management (continued)
| | | | | | |
Name, Address and
Year of Birth | | Current Position and
Length of Service with
Company and Trust | | Principal Occupation
During Past Five Years | | Other
Directorships |
| | | |
William H.T. Bush Lord, Abbett & Co. LLC c/o Legal Dept. 90 Hudson Street Jersey City, NJ 07302 (1938) | | Director/Trustee since 1998 | | Co-founder and Chairman of the Board of the financial advisory firm of Bush–O'Donnell & Company (since 1986). | | Currently serves as director of WellPoint, Inc., a health benefits company (since 2002). |
| | | |
Robert B. Calhoun, Jr. Lord, Abbett & Co. LLC c/o Legal Dept. 90 Hudson Street Jersey City, NJ 07302 (1942) | | Director/Trustee since 1998 | | Senior Advisor of Monitor Clipper Partners, a private equity investment fund (since 1997); President of Clipper Asset Management Corp. (1991 - 2009). | | N/A |
| | | |
Julie A. Hill Lord, Abbett & Co. LLC c/o Legal Dept. 90 Hudson Street Jersey City, NJ 07302 (1946) | | Director/Trustee since 2004 | | Owner and CEO of The Hill Company, a business consulting firm (since 1998). | | Currently serves as director of WellPoint, Inc., a health benefits company (since 1994) and Lend Lease Corporation Limited (since 2005). |
| | | |
Franklin W. Hobbs Lord, Abbett & Co. LLC c/o Legal Dept. 90 Hudson Street Jersey City, NJ 07302 (1947) | | Director/Trustee since 2000 | | Advisor of One Equity Partners, a private equity firm (since 2004). | | Currently serves as a director and Chairman of the Board of GMAC Inc., a financial services firm (since 2009) and as a director of Molson Coors Brewing Company (since 2002). |
| | | |
Thomas J. Neff Lord, Abbett & Co. LLC c/o Legal Dept. 90 Hudson Street Jersey City, NJ 07302 (1937) | | Director since 1982 and Trustee since 1991 | | Chairman of Spencer Stuart (U.S.), an executive search consulting firm (since 1996). | | Currently serves as director of Ace, Ltd. (since 1997) and Hewitt Associates, Inc. (since 2004). |
| | | |
James L.L. Tullis Lord, Abbett & Co. LLC c/o Legal Dept. 90 Hudson Street Jersey City, NJ 07302 (1947) | | Director/Trustee since 2006 | | CEO of Tullis-Dickerson and Co. Inc., a venture capital management firm (since 1990). | | Currently serves as director of Crane Co. (since 1998). |
246
Basic Information About Management (continued)
Officers
None of the officers listed below have received compensation from the Company or the Trust. All of the officers of the Company or the Trust may also be officers of the other Lord Abbett-sponsored funds and maintain offices at 90 Hudson Street, Jersey City, NJ 07302. Unless otherwise indicated, the titles and positions listed under the “Principal Occupation” column indicate the officer’s position(s) and title(s) with Lord Abbett.
| | | | | | |
Name and
Year of Birth | | Current Position with
Company and Trust | | Length of Service
of Current Position | | Principal Occupation
During Past Five Years |
| | | |
Robert S. Dow (1945) | | Chief Executive Officer and Chairman | | Elected in 1996 | | Senior Partner since 2007, Chief Executive Officer (since 1996) and prior thereto Managing Partner (1996 - 2007), joined Lord Abbett in 1972. |
| | | |
Daria L. Foster (1954) | | President | | Elected in 2006 | | Managing Partner (since 2007), and prior thereto Director of Marketing and Client Service, joined Lord Abbett in 1990. |
| | | |
Robert I. Gerber (1954) | | Executive Vice President | | Elected in 2006 | | Partner and Chief Investment Officer (since 2007) and prior thereto Director of Taxable Fixed Income Management, joined Lord Abbett in 1997. |
| | | |
Daniel S. Solender (1965) | | Executive Vice President | | Elected in 2006 | | Partner and Director, joined Lord Abbett in 2006; formerly a Vice President and Portfolio Manager at Nuveen Investments
(2003 - 2006). |
| | | |
James W. Bernaiche (1956) | | Chief Compliance Officer | | Elected in 2004 | | Partner and Chief Compliance Officer, joined Lord Abbett in 2001. |
| | | |
Joan A. Binstock (1954) | | Chief Financial Officer and Vice President | | Elected in 1999 | | Partner and Chief Operations Officer, joined Lord Abbett in 1999. |
| | | |
John K. Forst (1960) | | Vice President and Assistant Secretary | | Elected in 2005 | | Deputy General Counsel, joined Lord Abbett in 2004. |
| | | |
Lawrence H. Kaplan (1957) | | Vice President and Secretary | | Elected in 1997 | | Partner and General Counsel, joined Lord Abbett in 1997. |
| | | |
A. Edward Oberhaus, III (1959) | | Vice President | | Elected in 1996 | | Partner and Director, joined Lord Abbett in 1983. |
247
Basic Information About Management (concluded)
| | | | | | |
Name and
Year of Birth | | Current Position with
Company and Trust | | Length of Service
of Current Position | | Principal Occupation
During Past Five Years |
| | | |
Thomas R. Phillips (1960) | | Vice President and Assistant Secretary | | Elected in 2008 | | Deputy General Counsel, joined Lord Abbett in 2006; formerly attorney at Morgan, Lewis & Bockius LLP (2005 - 2006) and Stradley Ronon Stevens & Young, LLP (2000 - 2005). |
| | | |
Peter Scott Smith (1966) | | Vice President | | Elected in 2000 | | Portfolio Manager, joined Lord Abbett in 1992. |
| | | |
Lawrence B. Stoller (1963) | | Vice President and Assistant Secretary | | Elected in 2007 | | Senior Deputy General Counsel, joined Lord Abbett in 2007; formerly Executive Vice President and General Counsel at Cohen & Steers Capital Management, Inc. (1999 -2007). |
| | | |
Daniel T. Vande Velde (1967) | | Vice President | | Elected in 2008 | | Portfolio Manager, joined Lord Abbett in 2007; formerly a Portfolio Manager at McDonnell Investment Management (1997 - 2007). |
| | | |
Bernard J. Grzelak (1971) | | Treasurer | | Elected in 2003 | | Partner and Director of Fund Administration, joined Lord Abbett in 2003. |
Please call 888-522-2388 for a copy of the statement of additional information (SAI), which contains further information about the Company’s Directors and the Trust’s Trustees. It is available free upon request.
248
Householding
The Company and Trust have adopted a policy that allows them to send only one copy of each Fund’s prospectus, proxy material, annual report and semiannual report to certain shareholders residing at the same “household.” This reduces Fund expenses, which benefits you and other shareholders. If you need additional copies or do not want your mailings to be “householded,” please call Lord Abbett at 888-522-2388 or send a written request with your name, the name of your Fund or Funds and your account number or numbers to Lord Abbett Family of Funds, P.O. Box 219336, Kansas City, MO 64121.
Proxy Voting Policies, Procedures and Records
A description of the policies and procedures that Lord Abbett uses to vote proxies related to each Fund’s portfolio securities, and information on how Lord Abbett voted each Fund’s proxies during the 12-month period ended June 30 are available without charge, upon request, (i) by calling 888-522-2388; (ii) on Lord Abbett’s Website at www.lordabbett.com; and (iii) on the Securities and Exchange Commission’s ("SEC") Website at www.sec.gov.
Shareholder Reports and Quarterly Portfolio Disclosure
The Funds are required to file their complete schedule of portfolio holdings with the SEC for their first and third fiscal quarters on Form N-Q. Copies of the filings are available without charge, upon request on the SEC’s Website at www.sec.gov and may be available by calling Lord Abbett at 888-522-2388. You can also obtain copies of Form N-Q by (i) visiting the SEC’s Public Reference Room in Washington, DC (information on the operation of the Public Reference Room may be obtained by calling 800-SEC-0330); (ii) sending your request and duplicating fee to the SEC’s Public Reference Section, Washington, DC 20549-1520; or (iii) sending your request electronically, after paying a duplicating fee, to publicinfo@sec.gov.
Tax Information
100% of the income distributions paid by each Fund during the fiscal year ended September 30, 2009 is tax-exempt dividend income.
Additionally, of the distributions paid by the Pennsylvania Fund, $6,026 represent long-term capital gains.
249

Lord Abbett Municipal Income Fund, Inc.
Lord Abbett National Tax-Free Income Fund
Lord Abbett California Tax-Free Income Fund
Lord Abbett Connecticut Tax-Free Income Fund
Lord Abbett Hawaii Tax-Free Income Fund
Lord Abbett Missouri Tax-Free Income Fund
Lord Abbett New Jersey Tax-Free Income Fund
Lord Abbett New York Tax-Free Income Fund
Lord Abbett Municipal Income Trust
Lord Abbett Intermediate Tax-Free Fund
Lord Abbett Short Duration Tax Free Fund
Georgia Series
Lord Abbett High Yield Municipal Bond Fund
Pennsylvania Series

This report, when not used for the general information of shareholders of the Fund, is to be distributed only if preceded or accompanied by a current fund prospectus.
Lord Abbett mutual fund shares are distributed by LORD ABBETT DISTRIBUTOR LLC.
LATFI-2-0909
(11/09)
| | (a) | In accordance with applicable requirements, the Registrant adopted a Sarbanes-Oxley Code of Ethics on June 19, 2003 that applies to the principal executive officer and senior financial officers of the Registrant (“Code of Ethics”). The Code of Ethics was in effect during the fiscal year ended September 30, 2009 (the “Period”). |
| | (c) | The Registrant has not amended the Code of Ethics as described in Form N-CSR during the Period. |
| | (d) | The Registrant has not granted any waiver, including an implicit waiver, from a provision of the Code of Ethics as described in Form N-CSR during the Period. |
| | (f) | See Item 12(a)(1) concerning the filing of the Code of Ethics. The Registrant will provide a copy of the Code of Ethics to any person without charge, upon request. To obtain a copy, please call Lord Abbett at 888-522-2388. |
| Item 3: | Audit Committee Financial Expert. |
The Registrant’s board of directors has determined that each of the following independent directors who are members of the audit committee is an audit committee financial expert: E. Thayer Bigelow, Robert B. Calhoun Jr., Franklin W. Hobbs, and James L.L. Tullis. Each of these persons is independent within the meaning of the Form N-CSR.
| Item 4: | Principal Accountant Fees and Services. |
In response to sections (a), (b), (c) and (d) of Item 4, the aggregate fees billed to the Registrant for the fiscal years ended September 30, 2009 and 2008 by the Registrant’s principal accounting firm, Deloitte & Touche LLP, the member firms of Deloitte Touche Tohmatsu and their respective affiliates (collectively, “Deloitte”) were as follows:
| | | | | | | | | | |
| | | | | | | Fiscal year ended: | | | | |
| | | | | 2009 | | | | 2008 | | |
| Audit Fees {a} | | | | $228,000 | | | | $228,000 | | |
| Audit-Related Fees | | | | - 0 - | | | | - 0 - | | |
| | |
| Total audit and audit-related fees | | | | 228,000 | | | | 228,000 | | |
| | |
| | | | | |
| Tax Fees {b} | | | | 50,803 | | | | 70,518 | | |
| All Other Fees | | | | - 0- | | | | - 0 - | | |
| | |
| | | | | |
Total Fees | | | | $278,803 | | | | $298,518 | | |
| | |
{a} Consists of fees for audits of the Registrant’s annual financial statements.
{b} Fees for the fiscal year ended September 30, 2009 and 2008 consist of fees for preparing the U.S. Income Tax Return for Regulated Investment Companies, New Jersey Corporation Business Tax Return, New Jersey Annual Report Form, U.S. Return of Excise Tax on Undistributed Income of Investment Companies, IRS Forms 1099-MISC and 1096 Annual Summary and Transmittal of U.S. Information Returns.
(e) (1) Pursuant to Rule 2-01(c) (7) of Regulation S-X, the Registrant’s Audit Committee has adopted pre-approval policies and procedures. Such policies and procedures generally provide that the Audit Committee must pre-approve:
| | — | | any audit, audit-related, tax, and other services to be provided to the Lord Abbett Funds, including the Registrant, and |
| | — | | any audit-related, tax, and other services to be provided to the Registrant’s investment adviser and any entity controlling, controlled by or under common control with the investment adviser that provides ongoing services to one or more Funds comprising the Registrant if the engagement relates directly to operations and financial reporting of a Fund, by the independent auditor to assure that the provision of such services does not impair the auditor’s independence. |
The Audit Committee has delegated pre-approval authority to its Chairman, subject to a fee limit of $10,000 per event, and not to exceed $25,000 annually. The Chairman will report any pre-approval decisions to the Audit Committee at its next scheduled meeting. Unless a type of service to be provided by the independent auditor has received general pre-approval, it must be pre-approved by the Audit Committee. Any proposed services exceeding pre-approved cost levels will require specific pre-approval by the Audit Committee.
(e) (2) The Registrant’s Audit Committee has approved 100% of the services described in this Item 4 (b) through (d).
(f) Not applicable.
(g) The aggregate non-audit fees billed by Deloitte for services rendered to the Registrant are shown above in the response to Item 4 (a), (b), (c) and (d) as “All Other Fees”.
The aggregate non-audit fees billed by Deloitte for services rendered to the Registrant’s investment adviser, Lord, Abbett & Co. LLC (“Lord Abbett”), for the fiscal years ended September 30, 2009 and 2008 were:
| | | | | | | | | | |
| | | | | | | Fiscal year ended: | | | | |
| | | | | 2009 | | | | 2008 | | |
| All Other Fees {a} | | | | $237,324 | | | | $120,000 | | |
{a} Consist of fees for Independent Services Auditors’ Report on Controls Placed in Operation and Tests of Operating Effectiveness related to Lord Abbett’s Asset Management Services (“SAS 70 Report”).
The aggregate non-audit fees billed by Deloitte for services rendered to entities under the common control of Lord Abbett for the fiscal years ended September 30, 2009 and 2008 were:
| | | | | | | | | | |
| | | | | | | Fiscal year ended: | | | | |
| | | | | 2009 | | | | 2008 | | |
| All Other Fees {a} | | | | $ - 0 - | | | | $ - 0 - | | |
(h) The Registrant’s Audit Committee has considered the provision of non-audit services that were rendered to the Registrant’s investment adviser, and any entity controlling, controlled by or under common control with the investment adviser that provides ongoing services to the Registrant, that were not pre-approved pursuant to Rule 2-01 (c)(7)(ii) of Regulation S-X and has determined that the provision of such services is compatible with maintaining Deloitte’s independence.
| Item 5: | Audit Committee of Listed Registrants. |
Not applicable.
Not applicable.
| Item 7: | Disclosure of Proxy Voting Policies and Procedures for Closed-End Management Investment Companies. |
Not applicable.
| Item 8: | Portfolio Managers of Closed-End Management Investment Companies. |
Not applicable.
| Item 9: | Purchases of Equity Securities by Closed-End Management Investment Company and Affiliated Purchasers. |
Not applicable.
| Item 10: | Submission of Matters to a Vote of Security Holders. |
Not applicable.
| Item 11: | Controls and Procedures. |
| | (a) | Based on their evaluation of the Registrant’s disclosure controls and procedures (as defined in Rule 30a-3(c) under the Investment Company Act of 1940) as of a date within 90 days prior to the filing date of this report, the Chief Executive Officer and Chief Financial Officer of the Registrant have concluded that such disclosure controls and procedures are reasonably designed and effective to ensure that material information relating to the Registrant, including its consolidated subsidiaries, is made known to them by others within those entities. |
| | (b) | There were no changes in the Registrant’s internal control over financial reporting (as defined in Rule 30a-3(d) under the Investment Company Act of 1940) that occurred during the second fiscal quarter of the period covered by this report that have materially affected, or are reasonably likely to materially affect, the Registrant’s internal control over financial reporting. |
| | (a)(1) | Amendments to Code of Ethics – Not applicable. |
| | (a)(2) | Certification of each principal executive officer and principal financial officer of the Registrant as required by Rule 30a-2 under the Investment Company Act of 1940 is attached hereto as a part of EX-99.CERT. |
| | (b) | Certification of each principal executive officer and principal financial officer of the Registrant as required by Section 906 of the Sarbanes-Oxley Act of 2002 is provided as a part of EX-99.906CERT. |
SIGNATURES
Pursuant to the requirements of the Securities Exchange Act of 1934 and the Investment Company Act of 1940, the Registrant has duly caused this report to be signed on its behalf by the undersigned, thereunto duly authorized.
| | | | | | |
| | LORD ABBETT MUNICIPAL INCOME FUND, INC. |
| | | |
| | | | By: | | /s/ Robert S. Dow |
| | | | | | Robert S. Dow |
| | | | | | Chief Executive Officer and Chairman |
| | | |
| Date: November 23, 2009 | | | | | | |
| | | |
| | | | By: | | /s/ Joan A. Binstock |
| | | | | | Joan A. Binstock |
| | | | | | Chief Financial Officer and Vice President |
Date: November 23, 2009
Pursuant to the requirements of the Securities Exchange Act of 1934 and the Investment Company Act of 1940, this report has been signed below by the following persons on behalf of the Registrant and in the capacities and on the dates indicated.
| | | | |
| | By: | | /s/ Robert S. Dow |
| | | | Robert S. Dow |
| | | | Chief Executive Officer and Chairman |
| | |
| Date: November 23, 2009 | | | | |
| | |
| | By: | | /s/ Joan A. Binstock |
| | | | Joan A. Binstock |
| | | | Chief Financial Officer and Vice President |
Date: November 23, 2009