UNITED STATES
SECURITIES AND EXCHANGE COMMISSION
Washington, D.C. 20549
FORM N-CSR
CERTIFIED SHAREHOLDER REPORT OF REGISTERED
MANAGEMENT INVESTMENT COMPANIES
Investment Company Act File Number: 811 – 03942
LORD ABBETT MUNICIPAL INCOME FUND, INC.
(Exact name of Registrant as specified in charter)
90 Hudson Street, Jersey City, NJ 07302
(Address of principal executive offices) (Zip code)
Thomas R. Phillips, Esq., Vice President & Assistant Secretary
90 Hudson Street, Jersey City, NJ 07302
(Name and address of agent for service)
Registrant’s telephone number, including area code: (800) 201-6984
Date of fiscal year end: 9/30
Date of reporting period: 9/30/2011
| Item 1: | Report to Shareholders. |
2011
LORD ABBETT
ANNUAL
REPORT 
Lord Abbett
Municipal Income Fund
Short Duration Tax Free Fund Intermediate Tax Free Fund AMT Free Municipal Bond Fund National Tax Free Income Fund | High Yield Municipal Bond Fund California Tax Free Income Fund New Jersey Tax Free Income Fund New York Tax Free Income Fund |
For the fiscal year ended September 30, 2011

Lord Abbett Municipal Income Fund
Annual Report
For the fiscal year ended September 30, 2011

From left to right: Robert S. Dow, Director and Chairman of the Lord Abbett Funds; E. Thayer Bigelow, Independent Lead Director of the Lord Abbett Funds; and Daria L. Foster, Director and President of the Lord Abbett Funds.
Dear Shareholders: We are pleased to provide you with this overview of the performance of the Lord Abbett Municipal Income Fund for the fiscal year ended September 30, 2011. On this page and the following pages, we discuss the major factors that influenced fiscal year performance. For detailed and more timely information about the Funds, please visit our Website at www.lordabbett.com, where you also can access the quarterly commentaries that provide updates on each Fund’s performance and other portfolio related updates.
Thank you for investing in Lord Abbett mutual funds. We value the trust that you place in us and look forward to serving your investment needs in the years to come.
Best Regards,

Robert S. Dow
Chairman
Municipal Bond Market Review
Both the municipal and Treasury market yield curves maintained relatively steep slopes for the 12-month period, as the Federal Reserve kept the Fed funds rate near 0%, which has anchored the front end of both yield curves at very low interest rate levels. Treasury yields fluctuated considerably throughout the period as investor sentiment alternated between fears of a double-dip recession and concern that passive monetary stimulus might spark inflation. During the period, securities with higher credit ratings and intermediate maturities outperformed those with lower credit ratings and longer maturities.
Municipal bond issuance for the calendar year-to-date period ended September 30, 2011, decreased, from $299 billion to $193 billion-a 35% decrease over the prior calendar year-to-date period. Although the calendar year began with some of the largest outflows from municipal funds on record, demand
1
returned mid-year as investor fears of municipal market credit issues failed to materialize and high-quality municipals became an attractive alternative to Treasuries.
A surge in issuance of Build America Bonds (BABs) before the end of 2010, as municipalities rushed to issue BABs before the program expired, had a significant effect on the municipal bond market. The BAB program allowed municipalities to issue taxable bonds that offered investors higher yields than comparably rated corporate bonds. A tax credit is offered by the Federal government in one of two ways: the issuing municipality either receives a federal subsidy of 35% of the interest it pays on the BABs or bondholders receive a refundable tax credit of 35% of interest payable by the municipality. As of the fourth quarter of 2010, about 42% of municipal issuance for the calendar year consisted of taxable bonds. By the start of 2011, however, with the expiration of the BAB program, supply of tax-exempt bonds decreased drastically. In the first half of 2011, tax-exempt supply was 38% lower than historical averages seen in the first half of the year. Because yields had risen significantly during the fourth quarter of 2010, the combination of reduced supply and higher interest rates created an attractive environment for the asset class bringing in demand from institutional buyers.
In August 2011, Standard & Poor’s (“S&P”) downgraded the United States’ credit rating for the first time in history, citing uncertainty in the U.S. government’s ability to manage its finances, and said lawmakers failed to reduce spending enough in their bipartisan agreement to raise the debt ceiling. Within days, S&P also downgraded thousands of municipal bonds that were directly tied to the credit of the federal government. Despite initial concerns, the change had relatively little market impact. The week following the downgrade saw continued strong demand from investors, as many felt municipal credit was still a relatively safe haven for investment.
The national unemployment rate remained at 9.1% as of August 2011, versus 9.6% a year earlier. Since August 2010, 44 states posted decreases in their nonfarm unemployment rates and six states posted increases. State net tax-supported debt increased by 8.7% between 2009 and 2010. Much of the issuance growth was tied to states capitalizing on the BAB program before it expired on December 31, 2010. The low interest rate environment also attributed to the increase in debt issuance prior to the 2010 calendar year end. After the start of 2011, however, supply of municipal bonds decreased significantly after the BAB program failed to be extended.
Although concerns remain that municipalities might struggle to meet their long-term obligations, states have endeavored to find ways to decrease spending in order to close their budget gaps. During fiscal 2011, 23 states have
2
made $7.8 billion in cuts. However, state tax revenue has trended positively over the past seven quarters, as of the third quarter 2011 and some states even ended fiscal 2011 with surpluses. There were states however, that despite surpluses, saw tax revenue below forecasts for the start of the fiscal first quarter. So far, throughout the economic slowdown, at least a dozen states have been able to make the changes necessary to balance their budgets.
The table below shows each Fund’s performance relative to its benchmark for the year ended September 30, 2011.
| Class A Shares @ NAV 9/30/11 12-Mo. Return | Lipper Funds Average1 | BC Muni Bond Index2 | BC Muni Bond Index: 7 Yr (6-8)3 | BC HY Muni Bond Index4 | BC Muni Bond Index: 1 Year (1-2)5 | |||||||||||||||||||
Short Duration Tax Free Fund | 2.30 | % | 1.42 | % | — | — | — | 1.34 | % | |||||||||||||||
Intermediate Tax Free Fund | 3.55 | 3.17 | — | 4.65 | % | — | — | |||||||||||||||||
AMT Free Municipal Bond Fund | 4.90 | * | 3.10 | ** | 4.17 | %* | — | — | — | |||||||||||||||
National Tax Free Fund | 2.15 | 2.78 | 3.88 | — | — | — | ||||||||||||||||||
High Yield Municipal Bond Fund | -0.46 | 2.30 | — | — | 4.17 | % | — | |||||||||||||||||
California Tax Free Fund | 1.56 | 2.94 | 3.88 | — | — | — | ||||||||||||||||||
New Jersey Tax Free Fund | 1.23 | 2.49 | 3.88 | — | — | — | ||||||||||||||||||
New York Tax Free Fund | 1.85 | 2.41 | 3.88 | — | — | — | ||||||||||||||||||
| * | Return is from inception of Fund 10/29/10 |
| ** | Return is from 10/31/10 |
Short Duration Tax Free Fund
The Short Duration Tax Free Fund outperformed the Barclays Capital Municipal Bond Index: 1 Year,5 during the 12-month period ended September 30, 2011. The Fund’s barbell posture remained in place, utilizing a blend of money market securities and bonds in the three- to five-year range. Money market securities provided price stability and some yield to the Fund. The Fund’s allocation to bonds in the 3- to 6-year maturity range, in combination with the money markets, allowed the Fund to outperform the more bulleted structure of the Index. The Fund’s overweight to securities with ‘A’ and ‘BBB’ credit ratings contributed to performance. Bonds in the local general obligation and utility sectors were among the better Fund performers while state general obligations and transportation bonds contributed the least to the Fund’s outperformance. There was a slight allocation to bonds with maturities between eight and 10 years that also detracted from performance.
3
Intermediate Tax Free Fund
The Intermediate Tax Free Fund underperformed the Barclays Capital Municipal Bond Index: 7 Year,3 during the 12-month period ended September 30, 2011. The primary driver of underperformance was the Fund’s overweight to ‘BBB’ and lower-rated securities. Conversely, the Fund’s holdings of bonds with maturities in the longer end of the intermediate range contributed positively to performance. The Fund’s exposure to transportation detracted from performance; however, weightings in health care and state supported sectors contributed to Fund performance.
AMT Free Municipal Bond Fund
The AMT Free Municipal Bond Fund outperformed the Barclays Capital Municipal Bond Index,2 during the period since inception, October 29, 2010 and ending on September 30, 2011. The Fund’s positioning in the 16- to 25-year maturity range, following a more bulleted structure, and its overweight to bonds in the lower investment grade range contributed to Fund performance. Within sectors, overweights to health care, lease appropriations, private education and transportation bonds helped Fund performance, while holdings in tobacco and toll roads detracted from Fund performance.
National Tax Free Fund
The National Tax Free Fund underperformed the Barclays Capital Municipal Bond Index3, during the 12-month period ended September 30, 2011. The Fund’s overweight within the ‘BBB’ rated and below investment-grade categories was a detractor from Fund performance, as lower-rated bonds underperformed higher-rated bonds on the longer end of the curve, with investors being less willing to embrace credit risk. The municipal bond yield curve remained steep, although it was steeper during the year before flattening out toward the end. The Fund’s exposure to maturities 16 to 25 years provided the strongest return among the maturity ranges while bonds with maturities between 25-35 years negatively affected Fund performance. Within sectors, holdings of charter schools and toll roads detracted from Fund performance; however, weightings in local general obligation and electric revenue bonds helped performance.
High Yield Municipal Bond Fund
The High Yield Municipal Bond Fund underperformed the Barclays Capital High Yield Municipal Bond Index,4 during the 12-month period ended September 30, 2011. The Fund’s biggest detractor from performance was its positioning along the yield curve with significant weightings in longer maturities of lower rated bonds. In particular, ‘BBB’ bonds with longer
4
maturities had significant negative performance over the first half of the period, as the industry handled large outflows from high-yield funds. Within sectors, hotel, industrial development and tobacco bonds detracted most from Fund performance; however, a significant underweight to the tobacco sector helped lessen its negative impact on Fund performance. The Fund did benefit from its overweight position to the health care sector.
California Tax Free Fund
The Fund underperformed the Barclays Capital Municipal Bond Index,2 during the 12-month period ended September 30, 2011. Underperformance was primarily due to the Fund’s underweight to credits rated ‘AAA’ and ‘AA’ as higher-rated credits performed best. Underperformance was also due to the Fund’s weighting in credits rated ‘BBB’. The Fund did, however, benefit from its yield curve positioning, particularly from its weighting in bonds with maturities of 14 to 25 years. The Fund’s holdings in special tax district and airport revenue bonds added positively to performance, while weightings in tobacco bonds had a negative impact.
General obligation debt issued by the State of California was rated ‘A1’ by Moody’s and ‘A-’ by S&P, as of September 30, 2011. According to both agencies, the outlook for California’s ratings remained designated as “stable”. These credit ratings are based on a large, diverse, and wealthy economy, along with a relatively well-funded pension obligation and a moderate debt burden. With a gross state product of $1.8 trillion, the state is responsible for 13% of the U.S. gross domestic product.
The state’s economy boasts a well-educated work force, access to venture capital, and growing biotechnology and alternative energy industries. However, California’s seasonally adjusted unemployment rate, at 12.1% (as of August 2011), is among the highest in the nation; the national rate is 9.1% (as of August 2011). According to Moody’s 2010 State Debt Medians Report, California has the largest total net tax-supported debt of the 50 states. Net tax-supported debt per capita for California is $2,542 (in 2011), or 6% of 2009 personal income.
New Jersey Tax Free Fund
The Fund underperformed the Barclays Capital Municipal Bond Index,2 during the 12-month period ended September 30, 2011. The Fund’s overweight to credits rated ‘BBB’ and lower, selected due to their attractive long-term total return characteristics, detracted from Fund performance. In addition, the Fund’s holdings of bonds with maturities of 15-16 years together with longest dated bonds hampered performance, with the strongest returns coming from maturities between 16- and 25-years. In terms of sector allocation, while an overweight in tobacco
5
bonds had a negative impact, the Fund’s overweight to health care and senior living aided performance.
General obligation debt issued by the State of New Jersey was rated ‘AA-’ by S&P and ‘Aa3’ by Moody’s, as of September 30, 2011. These ratings were lowered during 2011, from ‘AA’ by S&P in February and from ‘Aa2’ by Moody’s in April, amid concerns about the state’s retirement funding obligations and depleted financial reserves. The still-high investment-grade ratings do, however, reflect New Jersey’s diverse economic base, high wealth and income levels, and ongoing improvement in balancing resources to meet needs.
New Jersey ended its fiscal year on June 30, 2011 with a budget gap of $10.7 billion. The budget gap decreased slightly, from 40% of the state’s general fund in 2010 to 38.2% in 2011. Aggregate personal income levels have also been growing since mid-2009. To mitigate the budget gap further, the state has taken action by reducing school aid, converting the homeowner’s rebates to a tax credit, and reducing the inflationary increases for rebates.
The state’s seasonally adjusted unemployment rate increased slightly, from 9.3% in August 2010 to 9.4% in August 2011, slightly higher than the national rate of 9.1% (as of August 2011). The construction, manufacturing, and hospitality services sectors experienced job losses, while the professional and business services sectors increased employment during the state’s fiscal year.
In 2009, New Jersey’s per capita personal income, at $49,980, ranked second among the 50 states and is still 126% of the national average. S&P considers New Jersey’s net tax-supported debt burden per capita high, at $3,946 (as of June 30, 2010), compared with the national median of $1,066, according to Moody’s 2011 State Debt Medians Report. As a percentage of 2010 state gross domestic product, New Jersey’s 2011 net tax-supported debt ranks fourth among the states, at 7.19%.
New York Tax Free Fund
The Fund underperformed the Barclays Capital Municipal Bond Index,2 during the 12-month period ended September 30, 2011. The Fund’s overweight to lower-quality credits, selected due to their attractive long-term total return characteristics, detracted from Fund performance. In addition, the Fund’s longest dated bonds hampered performance, with strongest returns coming from maturities between 16- and 25-years. In terms of sector allocation, while holdings in industrial revenue bonds had a negative impact, the Fund’s weightings in higher education and state supported bonds aided performance.
General obligation debt issued by the State of New York was rated ‘Aa2’ by Moody’s and ‘AA’ by S&P, as of September 30, 2011. These ratings are
6
based on the state’s mature and wealthy economy, broad flexibility to raise revenue and adjust spending, history of closing annual budget gaps, and ample budget reserves. Dependence on income taxes, above-average tax-supported debt burden, and polarized state politics are among some of the challenges the state continues to face. In addition, general reliance on the New York City-based financial services industry continues to hamper the state’s economic growth owing to the cyclical nature of this sector.
New York reported unaudited net assets of $27 billion for its fiscal year ended March 31, 2011, resulting from $135.9 billion in total assets less its $108.9 billion in total liabilities. The general fund reported a surplus of $1.5 billion for fiscal year 2011, decreasing the accumulated fund deficit to $2 billion.
As of August 2011, New York’s seasonally adjusted unemployment rate stood at 8.0%, down 0.4% from the previous year and lower than the national rate of 9.1% (as of August 2011). Financial activities account for 7.9% of state employment and 20.4% of state wage income, thus making the industry still a critical component for tax revenue. Personal income has remained strong with per capita personal income at 117% of the national average, or $46,459 at the end of fiscal year 2011. New York’s net tax-supported debt burden per capita was high at $3,149, compared with the national median of $1,066, ranking fifth in the nation, according to Moody’s 2011 State Debt Medians Report.
Each Fund’s portfolio is actively managed and, therefore, its holdings and the weightings of a particular issuer or particular sector as a percentage of portfolio assets are subject to change. Sectors may include many industries.
1 The Lipper Funds Average: Lipper, Inc. is a nationally recognized organization that reports on mutual fund total return performance and calculates fund rankings. Peer averages are based on universes of funds with similar investment objectives. Per group averages include reinvested dividends and capital gains, if any, and exclude sales charges.
2 The Barclays Capital Municipal Bond Index is a broad measure of the municipal bond market with maturities of at least one year. To be included in this index, bonds must have a minimum credit rating of Baa, an outstanding par value of at least $3 million, and be issued as part of a transaction of at least $50 million. Includes zero coupon bonds subject to the alternative minimum tax.
3 The Barclays Capital Municipal Bond Index: 7 Yr (6-8) is an unmanaged total return performance benchmark for the investment-grade, geographically unrestricted seven-year tax-exempt bond market, consisting of municipal bonds with maturities of 6-8 years.
4 The Barclays Capital High Yield Municipal Bond Index is an unmanaged index made up of bonds that are non-investment grade, unrated, or rated below Ba1 by Moody’s Investor Service with a remaining maturity of at least one year.
5 The Barclays Capital Municipal Bond Index 1 Year (1-2) is an unmanaged index composed of national municipal bond issues with a maturity range of 1-2 years.
Unless otherwise specified, indexes reflect total return, with all dividends reinvested. Indexes are unmanaged, do not reflect the deduction of fees or expenses, and are not available for direct investment.
7
Important Performance and Other Information
Performance data quoted in the following pages reflect past performance and are no guarantee of future results. Current performance may be higher or lower than the performance quoted. The investment return and principal value of an investment in the Fund will fluctuate so that shares, on any given day or when redeemed, may be worth more or less than their original cost. You can obtain performance data current to the most recent month end by calling Lord Abbett at 888-522-2388 or referring to www.lordabbett.com.
Except where noted, comparative Fund performance does not account for the deduction of sales charges and would be different if sales charges were included. Each Fund offers several classes of shares with distinct pricing options. For a full description of the differences in pricing alternatives, please see each Fund’s prospectus.
During certain periods shown, expense waivers and reimbursements were in place. Without such expense waivers and/or reimbursements, the Funds’ returns would have been lower.
The annual commentary above discusses the views of the Funds’ management and various portfolio holdings of the Funds as of September 30, 2011. These views and portfolio holdings may have changed after this date. Information provided in the commentary is not a recommendation to buy or sell securities. Because the Funds’ portfolios are actively managed and may change significantly, the Funds may no longer own the securities described above or may have otherwise changed their positions in the securities. For more recent information about the Funds’ portfolio holdings, please visit www.lordabbett.com.
A Note about Risk: See Notes to Financial Statements for a discussion of investment risks. For a more detailed discussion of the risks associated with each Fund, please see each Fund’s prospectus.
Mutual funds are not insured by the FDIC, are not deposits or other obligations of, or guaranteed by, banks, and are subject to investment risks including possible loss of principal amount invested.
8
Short Duration Tax Free Fund
Investment Comparison
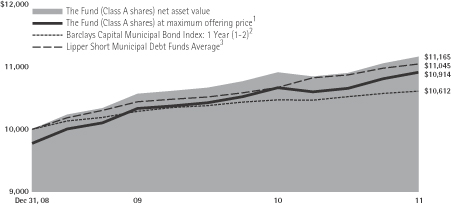
Below is a comparison of a $10,000 investment in Class A shares to the same investment in the Barclays Capital Municipal Bond Index: 1 Year (1-2) and the Lipper Short Municipal Debt Funds Average assuming reinvestment of all dividends and distributions. The performance of other classes will be greater than or less than the performance shown in the graph below due to different sales loads and expenses applicable to such classes. The graph and performance table below do not reflect the deduction of taxes that a shareholder would pay on Fund distributions or the redemption of Fund shares. During certain periods, expenses of the Fund have been waived or reimbursed by Lord Abbett; without such waiver or reimbursement of expenses, the Fund’s returns would have been lower. Past performance is no guarantee of future results.
Average Annual Total Returns at Maximum Applicable
Sales Charge for the Periods Ended September 30, 2011
| 1 Year | Life of Class | |||||||
Class A4 | 0.02% | 3.23% | ||||||
Class C5 | 1.56% | 3.27% | ||||||
Class F6 | 2.40% | 4.19% | ||||||
Class I7 | 2.48% | 4.30% | ||||||
Standardized Yield for the Period Ended September 30, 2011
| Class A | Class C | Class F | Class I | |||||||||||
| 1.58% | 0.95% | 1.71% | 1.81% | |||||||||||
1 Reflects the deduction of the maximum initial sales charge of 2.25%.
2 Performance for the unmanaged index does not reflect any fees or expenses. The performance of the index is not necessarily representative of the Fund’s performance.
3 Source: Lipper Inc. The performance of the average is not necessarily representative of the Fund’s performance.
4 Total return, which is the percent change in value, after deduction of the maximum initial sales charge of 2.25% applicable to Class A shares, with all dividends and distributions reinvested for period shown ended September 30, 2011, is calculated using the SEC required uniform method to compute such return. Class A shares commenced operations on December 12, 2008. Performance for the Class began December 31, 2008.
5 Class C shares commenced operations on December 12, 2008. The 1% CDSC for Class C shares normally applies before the first anniversary of the purchase date. Performance for the Class began December 31, 2008. Performance is at net asset value.
6 Class F shares commenced operations on December 12, 2008. Performance for the Class began December 31, 2008. Performance is at net asset value.
7 Class I shares commenced operations on December 12, 2008. Performance for the Class began December 31, 2008. Performance is at net asset value.
9
Intermediate Tax Free Fund
Investment Comparison
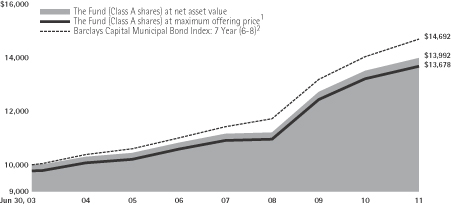
Below is a comparison of a $10,000 investment in Class A shares to the same investment in the Barclays Capital Municipal Bond Index: 7 Year (6-8) assuming reinvestment of all dividends and distributions. The performance of other classes will be greater than or less than the performance shown in the graph below due to different sales loads and expenses applicable to such classes. The graph and performance table below do not reflect the deduction of taxes that a shareholder would pay on Fund distributions or the redemption of Fund shares. During certain periods, expenses of the Fund have been waived or reimbursed by Lord Abbett; without such waiver or reimbursement of expenses, the Fund’s returns would have been lower. Past performance is no guarantee of future results.
Average Annual Total Returns at Maximum Applicable
Sales Charge for the Periods Ended September 30, 2011
1 Year | 5 Years | Life of Class | ||||||||||
Class A3 | 1.24% | 4.78% | 3.87% | |||||||||
Class B4 | -1.26% | 4.30% | 3.40% | |||||||||
Class C5 | 2.81% | 4.52% | 3.40% | |||||||||
Class F6 | 3.66% | – | 5.93% | |||||||||
Class I7 | – | – | 12.71% | * | ||||||||
Class P8 | 3.41% | 5.08% | 3.96% | |||||||||
Standardized Yield for the Period Ended September 30, 2011
| Class A | Class B | Class C | Class F | Class I | Class P | |||||||||||||||||
| 3.12% | 2.40% | 2.50% | 3.30% | 3.40% | 2.95% | |||||||||||||||||
1 Reflects the deduction of the maximum initial sales charge of 2.25%.
2 Performance for the unmanaged index does not reflect any fees or expenses. The performance of the index is not necessarily representative of the Fund’s performance.
3 Total return, which is the percent change in value, after deduction of the maximum initial sales charge of 2.25% applicable to Class A shares, with all dividends and distributions reinvested for periods shown ended September 30, 2011, is calculated using the SEC required uniform method to compute such return. The Class A share inception date is June 30, 2003.
4 Class B shares were first offered on June 30, 2003. Performance reflects the deduction of a CDSC of 4% for 1 year, 1% for 5 years and 0% for the life of the Class. Class B shares automatically convert to Class A shares after approximately 8 years. (There is no initial sales charge for automatic conversions.)
5 Class C shares were first offered on June 30, 2003. The 1% CDSC for Class C shares normally applies before the first anniversary of the purchase date. Performance is at net asset value.
6 Class F shares commenced operations and performance for the Class began on September 28, 2007. Performance is at net asset value.
7 Class I shares commenced operations and performance for the Class began on January 31, 2011. Performance is at net asset value.
8 Class P shares were first offered on June 30, 2003. Performance is at net asset value.
* Because Class I shares have existed for less than one year, average annual returns are not provided.
10
AMT Free Municipal Bond Fund
Investment Comparison
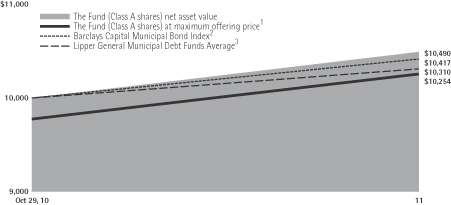
Below is a comparison of a $10,000 investment in Class A shares to the same investment in the Barclays Capital Municipal Bond Index and the Lipper General Municipal Debt Funds Average assuming reinvestment of all dividends and distributions. The performance of other classes will be greater than or less than the performance shown in the graph below due to different sales loads and expenses applicable to such classes. The graph and performance table below do not reflect the deduction of taxes that a shareholder would pay on Fund distributions or the redemption of Fund shares. During certain periods, expenses of the Fund have been waived or reimbursed by Lord Abbett; without such waiver or reimbursement of expenses, the Fund’s returns would have been lower. Past performance is no guarantee of future results.
Average Annual Total Returns at Maximum Applicable
Sales Charge for the Period Ended September 30, 2011
| Life of Class* | ||
Class A4 | 2.51% | |
Class C5 | 3.03% | |
Class F6 | 5.04% | |
Class I7 | 5.13% |
Standardized Yield for the Period Ended September 30, 2011
| Class A | Class C | Class F | Class I | |||||||||||
| 4.23% | 3.62% | 4.52% | 4.65% | |||||||||||
1 Reflects the deduction of the maximum initial sales charge of 2.25%.
2 Performance for the unmanaged index does not reflect any fees or expenses. The performance of the index is not necessarily representative of the Fund’s performance.
3 Source: Lipper Inc. The performance of the average is not necessarily representative of the Fund’s performance.
4 Total return, which is the percent change in value, after deduction of the maximum initial sales charge of 2.25% applicable to Class A shares, with all dividends and distributions reinvested for period shown ended September 30, 2011, is calculated using the SEC required uniform method to compute such return. Class A shares commenced operations on October 26, 2010. Performance for the Class began October 29, 2010.
5 Class C shares commenced operations on October 26, 2010. The 1% CDSC for Class C shares normally applies before the first anniversary of the purchase date. Performance for the Class began October 29, 2010. Performance is at net asset value.
6 Class F shares commenced operations on October 26, 2010. Performance for the Class began October 29, 2010. Performance is at net asset value.
7 Class I shares commenced operations on October 26, 2010. Performance for the Class began October 29, 2010. Performance is at net asset value.
* Because Class A, C, F and I shares have existed for less than one year, average annual returns are not provided.
11
National Tax Free Fund
Investment Comparison
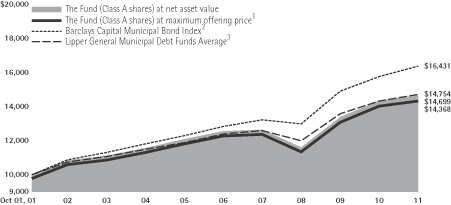
Below is a comparison of a $10,000 investment in Class A shares to the same investment in the Barclays Capital Municipal Bond Index and the Lipper General Municipal Debt Funds Average, assuming reinvestment of all dividends and distributions. The performance of other classes will be greater than or less than the performance shown in the graph below due to different sales loads and expenses applicable to such classes. The graph and performance table below do not reflect the deduction of taxes that a shareholder would pay on Fund distributions or the redemption of Fund shares. During certain periods, expenses of the Fund have been waived or reimbursed by Lord Abbett; without such waiver or reimbursement of expenses, the Fund’s returns would have been lower. Past performance is no guarantee of future results.
Average Annual Total Returns at Maximum Applicable
Sales Charge for the Periods Ended September 30, 2011
1 Year | 5 Years | 10 Years | Life of Class | |||||||||||||
Class A4 | -0.15% | 2.68% | 3.69% | – | ||||||||||||
Class B5 | -2.62% | 2.18% | 3.36% | – | ||||||||||||
Class C6 | 1.38% | 2.48% | 3.25% | – | ||||||||||||
Class F7 | 2.24% | – | – | 3.83% | ||||||||||||
Class I8 | 2.40% | – | – | 4.88% | ||||||||||||
Standardized Yield for the Period Ended September 30, 2011
| Class A | Class B | Class C | Class F | Class I | ||||||||||||||
| 4.64% | 3.95% | 4.09% | 4.85% | 4.98% | ||||||||||||||
1 Reflects the deduction of the maximum initial sales charge of 2.25%.
2 Performance for the unmanaged index does not reflect any fees or expenses. The performance of the index is not necessarily representative of the Fund’s performance.
3 Source: Lipper Inc. The performance of the average is not necessarily representative of the Fund’s performance.
4 Total return, which is the percent change in value, after deduction of the maximum initial sales charge of 2.25% applicable to Class A shares, with all dividends and distributions reinvested for periods shown ended September 30, 2011, is calculated using the SEC required uniform method to compute such return.
5 Performance reflects the deduction of a CDSC of 4% for 1 year, 1% for 5 years and 0% for 10 years. Class B shares automatically convert to Class A shares after approximately 8 years. (There is no initial sales charge for automatic conversions.) All returns for periods greater than 8 years reflect this conversion.
6 The 1% CDSC for Class C shares normally applies before the first anniversary of the purchase date. Performance is at net asset value.
7 Class F shares commenced operations and performance for the Class began on September 28, 2007. Performance is at net asset value.
8 Class I shares commenced operations and performance for the Class began on July 26, 2010. Performance is at net asset value.
12
High Yield Municipal Bond Fund
Investment Comparison
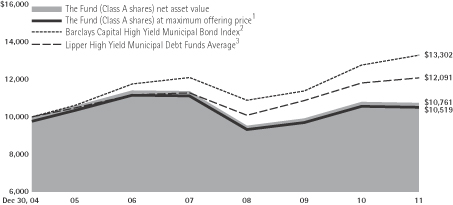
Below is a comparison of a $10,000 investment in Class A shares to the same investment in the Barclays Capital High Yield Municipal Bond Index, and the Lipper High Yield Municipal Debt Funds Average, assuming reinvestment of all dividends and distributions. The performance of other classes will be greater than or less than the performance shown in the graph below due to different sales loads and expenses applicable to such classes. The graph and performance table below do not reflect the deduction of taxes that a shareholder would pay on Fund distributions or the redemption of Fund shares. During certain periods, expenses of the Fund have been waived or reimbursed by Lord Abbett; without such waiver or reimbursement of expenses, the Fund’s returns would have been lower. Past performance is no guarantee of future results.
Average Annual Total Returns at Maximum Applicable
Sales Charge for the Periods Ended September 30, 2011
1 Year | 5 Years | Life of Class | ||||||||||
Class A4 | -2.68% | -1.63% | 0.60% | |||||||||
Class B5 | -4.94% | -1.96% | 0.57% | |||||||||
Class C6 | -1.11% | -1.79% | 0.59% | |||||||||
Class F7 | -0.35% | – | -1.30% | |||||||||
Class I8 | -0.28% | – | 2.33% | |||||||||
Class P9 | -0.65% | -1.31% | 1.00% | |||||||||
Standardized Yield for the Period Ended September 30, 2011
| Class A | Class B | Class C | Class F | Class I | Class P | |||||||||||||||||
| 5.88% | 5.23% | 5.39% | 6.13% | 6.24% | 5.81% | |||||||||||||||||
1 Reflects the deduction of the maximum initial sales charge of 2.25%.
2 Performance for the unmanaged indexes does not reflect any fees or expenses. The performance of the indexes is not necessarily representative of the Fund’s performance. Indexes and average are calculated from December 31, 2004 to September 30, 2011.
3 Source: Lipper Inc. The performance of the average is not necessarily representative of the Fund’s performance.
4 Total return, which is the percent change in value, after deduction of the maximum initial sales charge of 2.25% applicable to Class A shares, with all dividends and distributions reinvested for periods shown ended September 30, 2011, is calculated using SEC required uniform method to compute such return. The Class A inception date is December 30, 2004.
5 Class B shares were first offered on December 30, 2004. Performance reflects the deduction of a CDSC of 4% for 1 year, 1% for five years and 0% for the life of the Class. Class B shares automatically convert to Class A shares after approximately 8 years. (There is no initial sales charge for automatic conversions.)
6 Class C shares were first offered on December 30, 2004. The 1% CDSC for Class C shares normally applies before the first anniversary of the purchase date. Performance is at net asset value.
7 Class F shares commenced operations and performance for the Class began on September 28, 2007. Performance is at net asset value.
8 Class I shares commenced operations and performance for the Class began on July 26, 2010. Performance is at net asset value.
9 Class P shares were first offered on December 30, 2004. Performance is at net asset value.
13
California Tax Free Fund
Investment Comparison
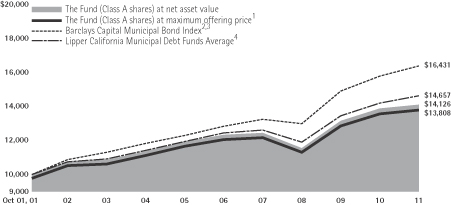
Below is a comparison of a $10,000 investment in Class A shares to the same investment in the Barclays Capital Municipal Bond Index and the Lipper California Municipal Debt Funds Average, assuming reinvestment of all dividends and distributions. The performance of the other classes will be greater than or less than the performance shown in the graph below due to different sales loads and expenses applicable to such classes. The graph and performance table below do not reflect the deduction of taxes that a shareholder would pay on Fund distributions or the redemption of Fund shares. During certain periods, expenses of the Fund have been waived or reimbursed by Lord Abbett; without such waiver or reimbursement of expenses, the Fund’s returns would have been lower. Past performance is no guarantee of future results.
Average Annual Total Returns at Maximum Applicable
Sales Charge for the Periods Ended September 30, 2011
| 1 Year | 5 Years | 10 Years | Life of Class | |||||||||||||
Class A5 | -0.77% | 2.25% | 3.28% | – | ||||||||||||
Class C6 | 0.80% | 2.04% | 2.85% | – | ||||||||||||
Class F7 | 1.65% | – | – | 3.28% | ||||||||||||
Class I8 | – | – | – | 16.86% | * | |||||||||||
Standardized Yield for the Period Ended September 30, 2011
| Class A | Class C | Class F | Class I | |||||||||||
| 4.44% | 3.91% | 4.65% | 4.75% | |||||||||||
1 Reflects the deduction of the maximum initial sales charge of 2.25%.
2 Performance for the unmanaged index does not reflect any fees or expenses. The performance of the index is not necessarily representative of the Fund’s performance.
3 The Index is composed of municipal bonds from many states while the Fund is a single-state municipal bond portfolio.
4 Source: Lipper Inc. The performance of the average is not necessarily representative of the Fund’s performance.
5 Total return, which is the percent change in value, after deduction of the maximum initial sales charge of 2.25% applicable to Class A shares, with all dividends and distributions reinvested for periods shown ended September 30, 2011, is calculated using the SEC required uniform method to compute such return.
6 The 1% CDSC for Class C shares normally applies before the first anniversary of the purchase date. Performance is at net asset value.
7 Class F shares commenced operations and performance for the Class began on September 28, 2007. Performance is at net asset value.
8 Class I shares commenced operations and performance for the Class began on January 31, 2011. Performance is at net asset value.
* Because Class I shares have existed for less than one year, average annual returns are not provided.
14
New Jersey Tax Free Fund
Investment Comparison
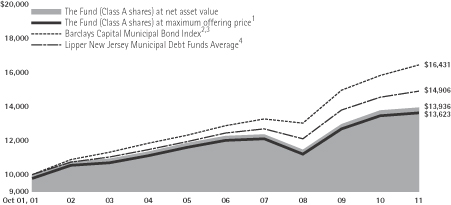
Below is a comparison of a $10,000 investment in Class A shares to the same investment in the Barclays Capital Municipal Bond Index and the Lipper New Jersey Municipal Debt Funds Average, assuming reinvestment of all dividends and distributions. The performance of the other class will be greater than or less than the performance shown in the graph below due to different sales loads and expenses applicable to such class. The graph and performance table below do not reflect the deduction of taxes that a shareholder would pay on Fund distributions or the redemption of Fund shares. During certain periods, expenses of the Fund have been waived or reimbursed by Lord Abbett; without such waiver or reimbursement of expenses, the Fund’s returns would have been lower. Past performance is no guarantee of future results.
Average Annual Total Returns at Maximum Applicable
Sales Charge for the Periods Ended September 30, 2011
| 1 Year | 5 Years | 10 Years | Life of Class | |||||||||||||
Class A5 | -1.01% | 2.09% | 3.14% | – | ||||||||||||
Class F6 | 1.33% | – | – | 3.11% | ||||||||||||
Class I7 | – | – | – | 15.13% | * | |||||||||||
Standardized Yield for the Period Ended September 30, 2011
| Class A | Class F | Class I | ||||||||
| 4.16% | 4.35% | 4.47% | ||||||||
1 Reflects the deduction of the maximum initial sales charge of 2.25%.
2 Performance for the unmanaged index does not reflect any fees or expenses. The performance of the index is not necessarily representative of the Fund’s performance.
3 The Index is composed of municipal bonds from many states while the Fund is a single-state municipal bond portfolio.
4 Source: Lipper Inc. The performance of the average is not necessarily representative of the Fund’s performance.
5 Total return, which is the percent change in value, after deduction of the maximum initial sales charge of 2.25% applicable to Class A shares, with all dividends and distributions reinvested for periods shown ended September 30, 2011, is calculated using the SEC required uniform method to compute such return.
6 Class F shares commenced operations and performance for the Class began on September 28, 2007. Performance is at net asset value.
7 Class I shares commenced operations and performance for the Class began on January 31, 2011. Performance is at net asset value.
* Because Class I shares have existed for less than one year, average annual returns are not provided.
15
New York Tax Free Fund
Investment Comparison
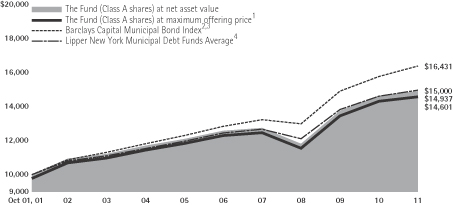
Below is a comparison of a $10,000 investment in Class A shares to the same investment in the Barclays Capital Municipal Bond Index and the Lipper New York Municipal Debt Funds Average, assuming reinvestment of all dividends and distributions. The performance of the other classes will be greater than or less than the performance shown in the graph below due to different sales loads and expenses applicable to such classes. The graph and performance table below do not reflect the deduction of taxes that a shareholder would pay on Fund distributions or the redemption of Fund shares. During certain periods, expenses of the Fund have been waived or reimbursed by Lord Abbett; without such waiver or reimbursement of expenses, the Fund’s returns would have been lower. Past performance is no guarantee of future results.
Average Annual Total Returns at Maximum Applicable
Sales Charge for the Periods Ended September 30, 2011
1 Year | 5 Years | 10 Years | Life of Class | |||||||||||||
Class A5 | -0.42% | 3.00% | 3.85% | – | ||||||||||||
Class C6 | 1.19% | 2.80% | 3.43% | – | ||||||||||||
Class F7 | 1.95% | – | – | 4.10% | ||||||||||||
Class I8 | – | – | – | 14.07% | * | |||||||||||
Standardized Yield for the Period Ended September 30, 2011
| Class A | Class C | Class F | Class I | |||||||||||
| 4.09% | 3.54% | 4.28% | 4.39% | |||||||||||
1 Reflects the deduction of the maximum initial sales charge of 2.25%.
2 Performance for the unmanaged index does not reflect any fees or expenses. The performance of the index is not necessarily representative of the Fund’s performance.
3 The Index is composed of municipal bonds from many states while the Fund is a single-state municipal bond portfolio.
4 Source: Lipper Inc. The performance of the average is not necessarily representative of the Fund’s performance.
5 Total return, which is the percent change in value, after deduction of the maximum initial sales charge of 2.25% applicable to Class A shares, with all dividends and distributions reinvested for periods shown ended September 30, 2011, is calculated using the SEC required uniform method to compute such return.
6 The 1% CDSC for Class C shares normally applies before the first anniversary of the purchase date. Performance is at net asset value.
7 Class F shares commenced operations and performance for the Class began on September 28, 2007. Performance is at net asset value.
8 Class I shares commenced operations and performance for the Class began on January 31, 2011. Performance is at net asset value.
* Because Class I shares have existed for less than one year, average annual returns are not provided.
16
Expense Example
As a shareholder of a Fund, you incur two types of costs: (1) transaction costs, including sales charges (loads) on purchase payments (these charges vary among the share classes); and (2) ongoing costs, including management fees; distribution and service (12b-1) fees (these charges vary among the share classes); and other Fund expenses. This Example is intended to help you understand your ongoing costs (in dollars) of investing in the Fund and to compare these costs with the ongoing costs of investing in other mutual funds.
The Example is based on an investment of $1,000 invested at the beginning of the period and held for the entire period (April 1, 2011 through September 30, 2011).
Actual Expenses
For each class of each Fund, the first line of the table on the following page provides information about actual account values and actual expenses. You may use the information in this line, together with the amount you invested, to estimate the expenses that you paid over the period. Simply divide your account value by $1,000 (for example, an $8,600 account value divided by $1,000 = 8.6), then multiply the result by the number in the first line under the heading titled “Expenses Paid During Period 4/1/11 – 9/30/11” to estimate the expenses you paid on your account during this period.
Hypothetical Example for Comparison Purposes
For each class of each Fund, the second line of the table on the following page provides information about hypothetical account values and hypothetical expenses based on the Fund’s actual expense ratio and an assumed rate of return of 5% per year before expenses, which is not the Fund’s actual return. The hypothetical account values and expenses may not be used to estimate the actual ending account balance or expenses you paid for the period. You may use this information to compare the ongoing costs of investing in the Fund and other funds. To do so, compare this 5% hypothetical example with the 5% hypothetical examples that appear in the shareholder reports of the other funds.
17
Short Duration Tax Free Fund
Please note that the expenses shown in the table are meant to highlight your ongoing costs only and do not reflect any transactional costs, such as sales charges. Therefore, the second line of the table is useful in comparing ongoing costs only, and will not help you determine the relative total costs of owning different funds. In addition, if these transactional costs were included, your costs would have been higher.
| Beginning Account Value | Ending Account Value | Expenses Paid During Period† | ||||||||||
| 4/1/11 | 9/30/11 | 4/1/11 - 9/30/11 | ||||||||||
Class A | ||||||||||||
Actual | $ | 1,000.00 | $ | 1,024.00 | $ | 2.99 | ||||||
Hypothetical (5% Return Before Expenses) | $ | 1,000.00 | $ | 1,022.10 | $ | 2.99 | ||||||
Class C | ||||||||||||
Actual | $ | 1,000.00 | $ | 1,019.90 | $ | 6.43 | ||||||
Hypothetical (5% Return Before Expenses) | $ | 1,000.00 | $ | 1,018.68 | $ | 6.43 | ||||||
Class F | ||||||||||||
Actual | $ | 1,000.00 | $ | 1,023.90 | $ | 2.49 | ||||||
Hypothetical (5% Return Before Expenses) | $ | 1,000.00 | $ | 1,022.60 | $ | 2.48 | ||||||
Class I | ||||||||||||
Actual | $ | 1,000.00 | $ | 1,024.90 | $ | 1.98 | ||||||
Hypothetical (5% Return Before Expenses) | $ | 1,000.00 | $ | 1,023.10 | $ | 1.98 | ||||||
| † | For each class of the Fund, net expenses (including interest expense) are equal to the annualized expense ratio for such class (0.59% for Class A, 1.27% for Class C, 0.49% for Class F and 0.39% for Class I) multiplied by the average account value over the period, multiplied by 183/365 (to reflect one-half year period). |
Portfolio Holdings Presented by Credit Rating
September 30, 2011
| Credit Rating: | Credit Rating: | |||||||||||
| S&P or Moody’s(a) | %* | S&P or Moody’s(a) | %* | |||||||||
AAA | 3.62% | BB+ | 0.25% | |||||||||
AA+ | 17.21% | BB | 4.12% | |||||||||
AA | 11.98% | Ba3 | 2.16% | |||||||||
AA- | 11.89% | B+ | 0.62% | |||||||||
A+ | 13.48% | B- | 0.44% | |||||||||
A | 8.64% | CC | 0.22% | |||||||||
A- | 7.09% | CCC+ | 0.19% | |||||||||
BBB+ | 4.97% | NR | 2.49% | |||||||||
BBB | 6.46% | Total | 100.00% | |||||||||
BBB- | 4.17% | |||||||||||
| (a) | Certain investments have been rated by Fitch IBCA. |
| * | Represents percent of total investments. |
18
Intermediate Tax Free Fund
Please note that the expenses shown in the table are meant to highlight your ongoing costs only and do not reflect any transactional costs, such as sales charges. Therefore, the second line of the table is useful in comparing ongoing costs only, and will not help you determine the relative total costs of owning different funds. In addition, if these transactional costs were included, your costs would have been higher.
| Beginning Account Value | Ending Account Value | Expenses Paid During Period† | ||||||||||
| 4/1/11 | 9/30/11 | 4/1/11 - 9/30/11 | ||||||||||
Class A | ||||||||||||
Actual | $ | 1,000.00 | $ | 1,068.80 | $ | 3.37 | ||||||
Hypothetical (5% Return Before Expenses) | $ | 1,000.00 | $ | 1,021.80 | $ | 3.29 | ||||||
Class B | ||||||||||||
Actual | $ | 1,000.00 | $ | 1,064.60 | $ | 7.50 | ||||||
Hypothetical (5% Return Before Expenses) | $ | 1,000.00 | $ | 1,017.78 | $ | 7.33 | ||||||
Class C | ||||||||||||
Actual | $ | 1,000.00 | $ | 1,065.10 | $ | 6.99 | ||||||
Hypothetical (5% Return Before Expenses) | $ | 1,000.00 | $ | 1,018.28 | $ | 6.83 | ||||||
Class F | ||||||||||||
Actual | $ | 1,000.00 | $ | 1,069.30 | $ | 2.85 | ||||||
Hypothetical (5% Return Before Expenses) | $ | 1,000.00 | $ | 1,022.29 | $ | 2.79 | ||||||
Class I | ||||||||||||
Actual | $ | 1,000.00 | $ | 1,070.80 | $ | 2.34 | ||||||
Hypothetical (5% Return Before Expenses) | $ | 1,000.00 | $ | 1,022.79 | $ | 2.28 | ||||||
Class P | ||||||||||||
Actual | $ | 1,000.00 | $ | 1,068.50 | $ | 4.67 | ||||||
Hypothetical (5% Return Before Expenses) | $ | 1,000.00 | $ | 1,020.54 | $ | 4.56 | ||||||
| † | For each class of the Fund, net expenses (including interest expense) are equal to the annualized expense ratio for such class (0.65% for Class A, 1.45% for Class B, 1.35% for Class C, 0.55% for Class F, 0.45% for Class I and 0.90% for Class P) multiplied by the average account value over the period, multiplied by 183/365 (to reflect one-half year period). |
Portfolio Holdings Presented by Credit Rating
September 30, 2011
| Credit Rating: | Credit Rating: | |||||||||||
| S&P or Moody’s(a) | %* | S&P or Moody’s(a) | %* | |||||||||
AAA | 6.79% | BB | 1.13% | |||||||||
AA+ | 16.82% | BB- | 1.41% | |||||||||
AA | 11.22% | B+ | 0.44% | |||||||||
AA- | 11.71% | B | 0.79% | |||||||||
A+ | 12.32% | B- | 0.15% | |||||||||
A | 8.23% | CC | 0.21% | |||||||||
A- | 6.30% | CCC+ | 0.55% | |||||||||
BBB+ | 3.70% | Caa2 | 0.11% | |||||||||
BBB | 4.92% | NR | 3.97% | |||||||||
BBB- | 7.80% | Money Market Mutual Fund | 0.00% | ** | ||||||||
BB+ | 1.43% | Total | 100.00% | |||||||||
| (a) | Certain investments have been rated by Fitch IBCA. |
| * | Represents percent of total investments. |
| ** | Amount is less than 0.01%. |
19
AMT Free Municipal Bond Fund
Please note that the expenses shown in the table are meant to highlight your ongoing costs only and do not reflect any transactional costs, such as sales charges. Therefore, the second line of the table is useful in comparing ongoing costs only, and will not help you determine the relative total costs of owning different funds. In addition, if these transactional costs were included, your costs would have been higher.
| Beginning Account Value | Ending Account Value | Expenses Paid During Period† | ||||||||||
| 4/1/11 | 9/30/11 | 4/1/11 - 9/30/11 | ||||||||||
Class A | ||||||||||||
Actual | $ | 1,000.00 | $ | 1,098.40 | $ | 2.63 | ||||||
Hypothetical (5% Return Before Expenses) | $ | 1,000.00 | $ | 1,022.57 | $ | 2.54 | ||||||
Class C | ||||||||||||
Actual | $ | 1,000.00 | $ | 1,093.30 | $ | 6.77 | ||||||
Hypothetical (5% Return Before Expenses) | $ | 1,000.00 | $ | 1,018.60 | $ | 6.53 | ||||||
Class F | ||||||||||||
Actual | $ | 1,000.00 | $ | 1,099.60 | $ | 2.11 | ||||||
Hypothetical (5% Return Before Expenses) | $ | 1,000.00 | $ | 1,023.08 | $ | 2.03 | ||||||
Class I | ||||||||||||
Actual | $ | 1,000.00 | $ | 1,099.80 | $ | 1.47 | ||||||
Hypothetical (5% Return Before Expenses) | $ | 1,000.00 | $ | 1,023.66 | $ | 1.42 | ||||||
| † | For each class of the Fund, net expenses (including interest expense) are equal to the annualized expense ratio for such class (0.50% for Class A, 1.29% for Class C, 0.40% for Class F and 0.28% for Class I) multiplied by the average account value over the period, multiplied by 183/365 (to reflect one-half year period). |
Portfolio Holdings Presented by Credit Rating
September 30, 2011
| Credit Rating: | Credit Rating: | |||||||||||
| S&P or Moody’s(a) | %* | S&P or Moody’s(a) | %* | |||||||||
AAA | 0.97% | BBB- | 5.38% | |||||||||
AA+ | 9.94% | BB+ | 2.81% | |||||||||
AA | 9.49% | BB | 2.15% | |||||||||
AA- | 15.03% | BB- | 2.89% | |||||||||
A+ | 15.76% | B+ | 0.72% | |||||||||
A | 16.61% | CCC+ | 0.35% | |||||||||
A- | 4.23% | Caa2 | 0.11% | |||||||||
BBB+ | 5.02% | NR | 4.95% | |||||||||
BBB | 3.59% | Total | 100.00% | |||||||||
| (a) | Certain investments have been rated by Fitch IBCA. |
| * | Represents percent of total investments. |
20
National Tax Free Fund
Please note that the expenses shown in the table are meant to highlight your ongoing costs only and do not reflect any transactional costs, such as sales charges. Therefore, the second line of the table is useful in comparing ongoing costs only, and will not help you determine the relative total costs of owning different funds. In addition, if these transactional costs were included, your costs would have been higher.
| Beginning Account Value | Ending Account Value | Expenses Paid During Period† | ||||||||||
| 4/1/11 | 9/30/11 | 4/1/11 - 9/30/11 | ||||||||||
Class A | ||||||||||||
Actual | $ | 1,000.00 | $ | 1,086.10 | $ | 4.29 | ||||||
Hypothetical (5% Return Before Expenses) | $ | 1,000.00 | $ | 1,020.97 | $ | 4.15 | ||||||
Class B | ||||||||||||
Actual | $ | 1,000.00 | $ | 1,081.50 | $ | 8.45 | ||||||
Hypothetical (5% Return Before Expenses) | $ | 1,000.00 | $ | 1,016.97 | $ | 8.19 | ||||||
Class C | ||||||||||||
Actual | $ | 1,000.00 | $ | 1,082.50 | $ | 7.73 | ||||||
Hypothetical (5% Return Before Expenses) | $ | 1,000.00 | $ | 1,017.67 | $ | 7.49 | ||||||
Class F | ||||||||||||
Actual | $ | 1,000.00 | $ | 1,086.70 | $ | 3.77 | ||||||
Hypothetical (5% Return Before Expenses) | $ | 1,000.00 | $ | 1,021.47 | $ | 3.65 | ||||||
Class I | ||||||||||||
Actual | $ | 1,000.00 | $ | 1,088.50 | $ | 3.09 | ||||||
Hypothetical (5% Return Before Expenses) | $ | 1,000.00 | $ | 1,022.10 | $ | 2.99 | ||||||
| † | For each class of the Fund, net expenses (including interest expense) are equal to the annualized expense ratio for such class (0.82% for Class A, 1.62% for Class B, 1.48% for Class C, 0.72% for Class F and 0.59% for Class I) multiplied by the average account value over the period, multiplied by 183/365 (to reflect one-half year period. |
Portfolio Holdings Presented by Credit Rating
September 30, 2011
| Credit Rating: | Credit Rating: | |||||||||||
| S&P or Moody’s(a) | %* | S&P or Moody’s(a) | %* | |||||||||
AAA | 3.82% | BB | 2.66% | |||||||||
AA+ | 13.76% | BB- | 2.52% | |||||||||
AA | 11.00% | B+ | 0.89% | |||||||||
AA- | 8.85% | B2 | 0.37% | |||||||||
A+ | 9.35% | B- | 0.32% | |||||||||
A | 9.63% | CCC+ | 0.91% | |||||||||
A- | 4.60% | CC | 0.32% | |||||||||
BBB+ | 4.06% | NR | 9.82% | |||||||||
BBB | 5.29% | Money Market Mutual Funds | 0.00% | ** | ||||||||
BBB- | 7.50% | Total | 100.00% | |||||||||
BB+ | 4.33% | |||||||||||
| (a) | Certain investments have been rated by Fitch IBCA. |
| * | Represents percent of total investments. |
| ** | Amount is less than 0.01%. |
21
High Yield Municipal Bond Fund
Please note that the expenses shown in the table are meant to highlight your ongoing costs only and do not reflect any transactional costs, such as sales charges. Therefore, the second line of the table is useful in comparing ongoing costs only, and will not help you determine the relative total costs of owning different funds. In addition, if these transactional costs were included, your costs would have been higher.
| Beginning Account Value | Ending Account Value | Expenses Paid During Period† | ||||||||||
| 4/1/11 | 9/30/11 | 4/1/11 - 9/30/11 | ||||||||||
Class A | ||||||||||||
Actual | $ | 1,000.00 | $ | 1,069.70 | $ | 4.67 | ||||||
Hypothetical (5% Return Before Expenses) | $ | 1,000.00 | $ | 1,020.56 | $ | 4.56 | ||||||
Class B | ||||||||||||
Actual | $ | 1,000.00 | $ | 1,065.70 | $ | 8.60 | ||||||
Hypothetical (5% Return Before Expenses) | $ | 1,000.00 | $ | 1,016.73 | $ | 8.39 | ||||||
Class C | ||||||||||||
Actual | $ | 1,000.00 | $ | 1,065.30 | $ | 8.02 | ||||||
Hypothetical (5% Return Before Expenses) | $ | 1,000.00 | $ | 1,017.30 | $ | 7.84 | ||||||
Class F | ||||||||||||
Actual | $ | 1,000.00 | $ | 1,070.20 | $ | 4.15 | ||||||
Hypothetical (5% Return Before Expenses) | $ | 1,000.00 | $ | 1,021.06 | $ | 4.05 | ||||||
Class I | ||||||||||||
Actual | $ | 1,000.00 | $ | 1,069.50 | $ | 3.63 | ||||||
Hypothetical (5% Return Before Expenses) | $ | 1,000.00 | $ | 1,021.57 | $ | 3.55 | ||||||
Class P | ||||||||||||
Actual | $ | 1,000.00 | $ | 1,068.60 | $ | 5.76 | ||||||
Hypothetical (5% Return Before Expenses) | $ | 1,000.00 | $ | 1,019.52 | $ | 5.62 | ||||||
| † | For each class of the Fund, net expenses (including interest expense) are equal to the annualized expense ratio for such class (0.90% for Class A, 1.66% for Class B, 1.55% for Class C, 0.80% for Class F, 0.70% for Class I and 1.11% for Class P) multiplied by the average account value over the period, multiplied by 183/365 (to reflect one-half year period). |
Portfolio Holdings Presented by Credit Rating
September 30, 2011
| Credit Rating: | Credit Rating: | |||||||||||
| S&P or Moody’s(a) | %* | S&P or Moody’s(a) | %* | |||||||||
AAA | 1.61% | BB | 3.37% | |||||||||
AA+ | 4.83% | BB- | 5.54% | |||||||||
AA | 6.74% | B+ | 2.40% | |||||||||
AA- | 4.84% | B | 2.22% | |||||||||
A+ | 0.95% | B- | 2.87% | |||||||||
A | 0.95% | CCC+ | 3.47% | |||||||||
A- | 1.70% | Caa3 | 0.30% | |||||||||
BBB+ | 3.89% | CC | 0.86% | |||||||||
BBB | 5.01% | NR | 35.14% | |||||||||
BBB- | 6.34% | Money Market Mutual Funds | 0.00% | ** | ||||||||
BB+ | 6.97% | Total | 100.00% | |||||||||
| (a) | Certain investments have been rated by Fitch IBCA. |
| * | Represents percent of total investments. |
| ** | Amount is less than 0.01%. |
22
California Tax Free Fund
Please note that the expenses shown in the table are meant to highlight your ongoing costs only and do not reflect any transactional costs, such as sales charges. Therefore, the second line of the table is useful in comparing ongoing costs only, and will not help you determine the relative total costs of owning different funds. In addition, if these transactional costs were included, your costs would have been higher.
| Beginning Account Value | Ending Account Value | Expenses Paid During Period† | ||||||||||
| 4/1/11 | 9/30/11 | 4/1/11 - 9/30/11 | ||||||||||
Class A | ||||||||||||
Actual | $ | 1,000.00 | $ | 1,090.80 | $ | 4.46 | ||||||
Hypothetical (5% Return Before Expenses) | $ | 1,000.00 | $ | 1,020.79 | $ | 4.31 | ||||||
Class C | ||||||||||||
Actual | $ | 1,000.00 | $ | 1,087.30 | $ | 7.85 | ||||||
Hypothetical (5% Return Before Expenses) | $ | 1,000.00 | $ | 1,017.57 | $ | 7.59 | ||||||
Class F | ||||||||||||
Actual | $ | 1,000.00 | $ | 1,091.30 | $ | 3.93 | ||||||
Hypothetical (5% Return Before Expenses) | $ | 1,000.00 | $ | 1,021.29 | $ | 3.80 | ||||||
Class I | ||||||||||||
Actual | $ | 1,000.00 | $ | 1,093.10 | $ | 3.52 | ||||||
Hypothetical (5% Return Before Expenses) | $ | 1,000.00 | $ | 1,021.72 | $ | 3.40 | ||||||
| † | For each class of the Fund, net expenses (including interest expense) are equal to the annualized expense ratio for such class (0.85% for Class A, 1.50% for Class C, 0.75% for Class F and 0.67% for Class I) multiplied by the average account value over the period, multiplied by 183/365 (to reflect one-half year period. |
Portfolio Holdings Presented by Credit Rating
September 30, 2011
| Credit Rating: | Credit Rating: | |||||||||||
| S&P or Moody’s(a) | %* | S&P or Moody’s(a) | %* | |||||||||
AAA | 1.10% | BBB | 4.83% | |||||||||
AA+ | 13.15% | BBB- | 2.85% | |||||||||
AA | 15.33% | BB+ | 2.25% | |||||||||
AA- | 6.94% | BB | 1.99% | |||||||||
A+ | 14.17% | B+ | 0.94% | |||||||||
A | 17.90% | NR | 7.61% | |||||||||
A- | 5.50% | Money Market Mutual Fund | 0.00% | ** | ||||||||
BBB+ | 5.44% | Total | 100.00% | |||||||||
| (a) | Certain investments have been rated by Fitch IBCA. |
| * | Represents percent of total investments. |
| ** | Amount is less than 0.01%. |
23
New Jersey Tax Free Fund
Please note that the expenses shown in the table are meant to highlight your ongoing costs only and do not reflect any transactional costs, such as sales charges. Therefore, the second line of the table is useful in comparing ongoing costs only, and will not help you determine the relative total costs of owning different funds. In addition, if these transactional costs were included, your costs would have been higher.
| Beginning Account Value | Ending Account Value | Expenses Paid During Period† | ||||||||||
| 4/1/11 | 9/30/11 | 4/1/11 - 9/30/11 | ||||||||||
Class A | ||||||||||||
Actual | $ | 1,000.00 | $ | 1,085.10 | $ | 4.50 | ||||||
Hypothetical (5% Return Before Expenses) | $ | 1,000.00 | $ | 1,020.74 | $ | 4.36 | ||||||
Class F | ||||||||||||
Actual | $ | 1,000.00 | $ | 1,085.60 | $ | 3.97 | ||||||
Hypothetical (5% Return Before Expenses) | $ | 1,000.00 | $ | 1,021.25 | $ | 3.85 | ||||||
Class I | ||||||||||||
Actual | $ | 1,000.00 | $ | 1,088.80 | $ | 3.30 | ||||||
Hypothetical (5% Return Before Expenses) | $ | 1,000.00 | $ | 1,021.90 | $ | 3.19 | ||||||
| † | For each class of the Fund, net expenses (including interest expense) are equal to the annualized expense ratio for such class (0.86% for Class A, 0.76% for Class F and 0.63% for Class I) multiplied by the average account value over the period, multiplied by 183/365 (to reflect one-half year period.) |
Portfolio Holdings Presented by Credit Rating
September 30, 2011
| Credit Rating: | Credit Rating: | |||||||||||
| S&P or Moody’s(a) | %* | S&P or Moody’s(a) | %* | |||||||||
AAA | 2.88% | BB+ | 1.63% | |||||||||
AA+ | 9.51% | BB | 3.05% | |||||||||
AA | 15.30% | B+ | 0.12% | |||||||||
AA- | 6.11% | B | 0.79% | |||||||||
A+ | 21.45% | B3 | 0.23% | |||||||||
A | 6.59% | CCC+ | 0.69% | |||||||||
A- | 4.02% | NR | 6.53% | |||||||||
BBB+ | 7.36% | Money Market Mutual Fund | 0.00% | ** | ||||||||
BBB | 4.23% | Total | 100.00% | |||||||||
BBB- | 9.51% | |||||||||||
| (a) | Certain investments have been rated by Fitch IBCA. |
| * | Represents percent of total investments. |
| ** | Amount is less than 0.01%. |
24
New York Tax Free Fund
Please note that the expenses shown in the table are meant to highlight your ongoing costs only and do not reflect any transactional costs, such as sales charges. Therefore, the second line of the table is useful in comparing ongoing costs only, and will not help you determine the relative total costs of owning different funds. In addition, if these transactional costs were included, your costs would have been higher.
| Beginning Account Value | Ending Account Value | Expenses Paid During Period† | ||||||||||
| 4/1/11 | 9/30/11 | 4/1/11 - 9/30/11 | ||||||||||
Class A | ||||||||||||
Actual | $ | 1,000.00 | $ | 1,072.30 | $ | 4.47 | ||||||
Hypothetical (5% Return Before Expenses) | $ | 1,000.00 | $ | 1,020.78 | $ | 4.36 | ||||||
Class C | ||||||||||||
Actual | $ | 1,000.00 | $ | 1,068.90 | $ | 7.78 | ||||||
Hypothetical (5% Return Before Expenses) | $ | 1,000.00 | $ | 1,017.56 | $ | 7.59 | ||||||
Class F | ||||||||||||
Actual | $ | 1,000.00 | $ | 1,072.80 | $ | 3.95 | ||||||
Hypothetical (5% Return Before Expenses) | $ | 1,000.00 | $ | 1,021.28 | $ | 3.85 | ||||||
Class I | ||||||||||||
Actual | $ | 1,000.00 | $ | 1,074.60 | $ | 3.33 | ||||||
Hypothetical (5% Return Before Expenses) | $ | 1,000.00 | $ | 1,021.87 | $ | 3.24 | ||||||
| † | For each class of the Fund, net expenses (including interest expense) are equal to the annualized expense ratio for such class (0.86% for Class A, 1.50% for Class C, 0.76% for Class F and 0.64% for Class I) multiplied by the average account value over the period, multiplied by 183/365 (to reflect one-half year period). |
Portfolio Holdings Presented by Credit Rating
September 30, 2011
| Credit Rating: | Credit Rating: | |||||||||||
| S&P or Moody’s(a) | %* | S&P or Moody’s(a) | %* | |||||||||
AAA | 10.11% | BB+ | 3.59% | |||||||||
AA+ | 8.29% | BB | 0.83% | |||||||||
AA | 10.19% | BB- | 0.67% | |||||||||
AA- | 18.52% | B+ | 0.11% | |||||||||
A+ | 8.38% | B- | 0.99% | |||||||||
A | 7.07% | CCC+ | 0.80% | |||||||||
A- | 9.41% | NR | 7.23% | |||||||||
BBB+ | 4.28% | Money Market Mutual Fund | 0.00% | ** | ||||||||
BBB | 1.92% | Total | 100.00% | |||||||||
BBB- | 7.61% | |||||||||||
| (a) | Certain investments have been rated by Fitch IBCA. |
| * | Represents percent of total investments. |
| ** | Amount is less than 0.01%. |
25
Schedule of Investments
SHORT DURATION TAX FREE FUND September 30, 2011
| Investments | Interest Rate | Maturity Date | Credit Rating: S&P or Moody’s(a) | Principal Amount (000) | Fair Value | |||||||||||||||
| MUNICIPAL BONDS 74.88% | ||||||||||||||||||||
| Corporate-Backed 3.56% | ||||||||||||||||||||
| Allegheny Cnty PA Indl Dev Auth Envr Impt USX Pj | 4.75% | 12/1/2032 | BBB | $ | 2,225 | $ | 2,263,448 | |||||||||||||
| Burke Cnty GA Dev Auth Pollutn Ctrl Vogtle Pj 5th Rmkt | 2.30% | 10/1/2032 | A | 10,000 | 10,229,500 | |||||||||||||||
| CA St Muni Fin Auth Wst Mgmt Inc Pj Ser A | 2.00% | 2/1/2019 | BBB | 4,000 | 4,018,000 | |||||||||||||||
| Coconino Cnty AZ Pollutn Ctrl Corp Ser A | 5.50% | 6/1/2034 | BBB | 2,000 | 2,181,740 | |||||||||||||||
| Dallas-Fort Worth TX Intl Arpt Facs Impt Corp Amer Airlines Inc | 6.00% | 11/1/2014 | CCC+ | 3,750 | 3,531,525 | |||||||||||||||
| Farmington NM Pollutn Ctrl Rev Sthn CA Edison Ser A | 2.875% | 4/1/2029 | A1 | 7,500 | 7,748,250 | |||||||||||||||
| FL St Citizens Ppty Ins Corp Sr Secd High Risk Acct A-1 | 4.25% | 6/1/2017 | A+ | 2,590 | 2,718,619 | |||||||||||||||
| FL St Citizens Ppty Ins Corp Sr Secd High Risk Acct A-1 | 5.00% | 6/1/2015 | A+ | 5,275 | 5,742,418 | |||||||||||||||
| FL St Citizens Ppty Ins Corp Sr Secd High Risk Acct A-1 | 5.50% | 6/1/2017 | A+ | 2,850 | 3,175,613 | |||||||||||||||
| FL St Citizens Ppty Ins Corp Sr Secd High Risk Acct A-3 | 1.91% | # | 6/1/2013 | A+ | 5,000 | 5,020,300 | ||||||||||||||
| Gloucester Cnty NJ Impt Auth Wst Mgmt Inc Pj Ser A | 2.625% | 12/1/2029 | BBB | 4,000 | 4,071,560 | |||||||||||||||
| PA Econ Dev Fing Auth Wst Mgt Inc Pj | 2.75% | 9/1/2013 | BBB | 4,250 | 4,379,412 | |||||||||||||||
| Valdez AK Marine Terminal Rev BP Pipelines Inc Pj Rmkt | 5.00% | 1/1/2018 | A2 | 10,000 | 11,367,400 | |||||||||||||||
|
| |||||||||||||||||||
| Total | 66,447,785 | |||||||||||||||||||
|
| |||||||||||||||||||
| Education 3.84% | ||||||||||||||||||||
| CA St Univ Rev Systemwide Ser A | 5.00% | 11/1/2020 | Aa2 | 5,000 | 5,906,550 | |||||||||||||||
| Delaware Cnty PA Auth Univ Rev Villanova Univ | 4.00% | 12/1/2014 | A+ | 700 | 756,658 | |||||||||||||||
| Delaware Cnty PA Auth Univ Rev Villanova Univ | 5.00% | 12/1/2013 | A+ | 550 | 594,457 | |||||||||||||||
| Grand Rapids MI Econ Dev Corp Ferris St Univ Pj Ser B | 1.80% | 4/1/2013 | NR | 4,250 | 4,252,890 | |||||||||||||||
| IL Edl Facs Auth Rev Univ of Chicago Ser B-2 | 1.875% | 7/1/2036 | Aa1 | 5,250 | 5,395,792 | |||||||||||||||
| MA St Dev Fin Agy Boston Univ Ser V-2 | 2.875% | 10/1/2014 | A | 1,595 | 1,651,750 | |||||||||||||||
See Notes to Financial Statements.
26
Schedule of Investments (continued)
SHORT DURATION TAX FREE FUND September 30, 2011
| Investments | Interest Rate | Maturity Date | Credit Rating: S&P or Moody’s(a) | Principal Amount (000) | Fair Value | |||||||||||||||
| Education (continued) | ||||||||||||||||||||
| New York City NY Tr Cultural Res Julliard Sch(b) | 2.10% | 4/1/2036 | AA | $ | 14,000 | $ | 14,402,710 | |||||||||||||
| NJ St Edl Facs Auth Univ Med & Dentistry Ser B | 5.50% | 12/1/2013 | Baa1 | 1,000 | 1,086,960 | |||||||||||||||
| NY St Dorm Auth Rev Non St Supp Debt St. Lawrence | 5.00% | 7/1/2014 | A2 | 4,000 | 4,344,960 | |||||||||||||||
| NY St Dorm Auth Rev St City Univ Sys Cons 5th Gen Ser A (NPFGC)(FGIC) | 5.00% | 7/1/2015 | AA- | 1,565 | 1,779,311 | |||||||||||||||
| NY St Dorm Auth Rev St. John’s Univ Ser A (NPFGC) | 5.00% | 7/1/2014 | A- | 2,000 | 2,183,720 | |||||||||||||||
| SC Edl Facs Auth Furman Univ | 4.00% | 10/1/2015 | A1 | 1,000 | 1,098,080 | |||||||||||||||
| Univ of CA Rev Ser AB | 5.00% | 5/15/2020 | Aa1 | 7,160 | 8,551,116 | |||||||||||||||
Univ of TX Perm Univ Fd Ser A | 5.00% | 7/1/2014 | AAA | 1,400 | 1,565,858 | |||||||||||||||
| Univ of TX Rev Fing Sys Ser D | 4.00% | 8/15/2014 | AAA | 1,000 | 1,098,700 | |||||||||||||||
| Virginia College Bldg Auth VA 21st Century College & Equip Ser A | 5.00% | 2/1/2019 | AA+ | 10,415 | 12,525,183 | |||||||||||||||
| Wayne St Univ MI Rev Ser A | 5.00% | 11/15/2015 | Aa2 | 3,975 | 4,429,979 | |||||||||||||||
|
| |||||||||||||||||||
| Total | 71,624,674 | |||||||||||||||||||
|
| |||||||||||||||||||
| General Obligation 11.18% | ||||||||||||||||||||
| AK Muni Bd Bk Auth Ser A1 | 3.00% | 3/1/2014 | Aa2 | 1,000 | 1,050,840 | |||||||||||||||
| Allegheny Cnty PA Ser C 55 (NPFGC) | 5.375% | 11/1/2013 | A+ | 7,210 | 7,794,803 | |||||||||||||||
| Bedford Pk Vlg IL (AG) | 5.00% | 12/1/2013 | AA+ | 1,275 | 1,371,543 | |||||||||||||||
| Boston MA Ser A | 5.00% | 4/1/2014 | Aaa | 1,500 | 1,663,590 | |||||||||||||||
| CA St | 5.00% | 9/1/2018 | A1 | 7,500 | 8,733,975 | |||||||||||||||
| CA St Var Purp | 5.00% | 9/1/2018 | A1 | 3,750 | 4,346,288 | |||||||||||||||
| Centennial Auth NC Rev (AG) | 5.00% | 9/1/2014 | Aa2 | 3,460 | 3,794,720 | |||||||||||||||
| Chicago IL Brd of Ed Dedicated Revs Ser F | 5.00% | 12/1/2014 | Aa2 | 2,255 | 2,481,177 | |||||||||||||||
| Clark Cnty NV Sch Dist Ltd Tax Ser A | 5.00% | 6/15/2016 | AA | 7,500 | 8,550,150 | |||||||||||||||
| Clark Cnty NV Sch Dist Ser A (AGM) | 5.50% | 6/15/2016 | AA+ | 7,370 | 7,965,349 | |||||||||||||||
| Cook Cnty IL Sch Dist No 99-Cicero Ser C (AGM) | 5.00% | 12/1/2014 | Aa3 | 1,690 | 1,850,770 | |||||||||||||||
| Cook Cnty IL Ser A (AMBAC) | 5.00% | 11/15/2014 | AA | 1,000 | 1,110,920 | |||||||||||||||
| Cook Cnty IL Ser C | 5.00% | 11/15/2021 | AA | 5,900 | 6,537,613 | |||||||||||||||
| CT St Ser A SIFMA | 1.08% | # | 5/15/2018 | AA | 4,000 | 4,009,640 | ||||||||||||||
| CT St Ser D | 5.00% | 11/1/2014 | AA | 500 | 566,050 | |||||||||||||||
| Cumberland Cnty NC Impt Pjs Ser B 1 COP | 4.00% | 12/1/2014 | AA | 3,500 | 3,805,935 | |||||||||||||||
| Detroit MI Dist St Aid | 5.00% | 11/1/2015 | AA | 6,775 | 7,582,919 | |||||||||||||||
See Notes to Financial Statements.
27
Schedule of Investments (continued)
SHORT DURATION TAX FREE FUND September 30, 2011
| Investments | Interest Rate | Maturity Date | Credit Rating: S&P or Moody’s(a) | Principal Amount (000) | Fair Value | |||||||||||||||
| General Obligation (continued) | ||||||||||||||||||||
| Dist of Columbia Ser E ETM (BHAC) | 5.00% | 6/1/2014 | AA+ | $ | 1,500 | $ | 1,678,260 | |||||||||||||
| Douglas Cnty WA Sch Dist No 206 Eastmont (NPFGC) | 5.00% | 12/1/2014 | Aa1 | 1,000 | 1,127,260 | |||||||||||||||
| Eagle Mountain & Saginaw TX Indpt Sch Dist Cap Apprec Ser A PSF GTD | 5.25% | 8/15/2023 | Aaa | 1,695 | 1,849,601 | |||||||||||||||
| FL St Brd of Ed Pub Ed Ser C GTD | 5.00% | 6/1/2014 | AAA | 250 | 279,850 | |||||||||||||||
| Harris Cnty TX Ser A(c) | 5.00% | 10/1/2019 | AAA | 4,600 | 5,572,624 | |||||||||||||||
| Harris Cnty TX Ser A(c) | 5.00% | 10/1/2020 | AAA | 4,800 | 5,816,640 | |||||||||||||||
| Hartford CT | 5.625% | �� | 2/1/2013 | A1 | 590 | 631,754 | ||||||||||||||
| Hartford CT (AG) | 4.00% | 11/15/2013 | AA+ | 1,320 | 1,403,371 | |||||||||||||||
| Hawaii Cnty HI Ser A (AMBAC) | 5.00% | 7/15/2014 | Aa2 | 1,750 | 1,950,988 | |||||||||||||||
| HI St Ser DG (AMBAC) | 5.00% | 7/1/2012 | AA | 50 | 51,729 | |||||||||||||||
| Honolulu HI City & Cnty Ser B (NPFGC) | 5.00% | 7/1/2014 | Aa1 | 2,475 | 2,762,471 | |||||||||||||||
| IL St 1st Ser (AGM) | 5.50% | 5/1/2016 | AA+ | 7,000 | 8,002,750 | |||||||||||||||
| IL St Ser A | 5.00% | 10/1/2017 | A+ | 5,675 | 5,984,798 | |||||||||||||||
| Kane Cook & DuPage Cntys IL Sch Dist No U-46 Elgin | 4.00% | 1/1/2015 | AA- | 9,450 | 10,175,287 | |||||||||||||||
| King Cnty WA Ltd Tax Ser B | 4.50% | 1/1/2013 | AAA | 80 | 84,162 | |||||||||||||||
| Madison Cnty IL Cmnty Unit Sch Dist No 2 Triad (NPFGC) | 5.25% | 1/1/2015 | A+ | 2,035 | 2,168,089 | |||||||||||||||
| Madison Cnty IL Cmnty Unit Sch Dist No 7-Edwardsville Ser A (AGM) | 5.00% | 12/1/2013 | AA+ | 500 | 527,135 | |||||||||||||||
| Maricopa Cnty AZ Unif Sch Dist No 11 Peoria (AGM) | 5.00% | 7/1/2014 | AA+ | 500 | 553,750 | |||||||||||||||
| Mecklenburg Cnty NC COP Ser A | 5.00% | 2/1/2012 | AA+ | 250 | 253,705 | |||||||||||||||
| Metro Transn Auth NY Ser B (NPFGC) | 5.50% | 1/1/2013 | AA- | 75 | 79,654 | |||||||||||||||
| Miami-Dade Cnty FL Seaport Ser C | 4.25% | 10/1/2017 | Aa2 | 6,320 | 7,043,261 | |||||||||||||||
| MN St Hwy & Var Purp | 5.00% | 8/1/2014 | AA+ | 1,200 | 1,351,128 | |||||||||||||||
| MS Dev Bk Spl Oblig Jackson GTD ETM | 5.00% | 1/1/2012 | Aa2 | 75 | 75,861 | |||||||||||||||
| New York City NY Ser K (AGM) | 5.00% | 8/1/2013 | AA+ | 1,500 | 1,623,990 | |||||||||||||||
| New York City NY Sub Ser H-5 | 0.50% | # | 3/1/2034 | A | 2,000 | 2,000,000 | ||||||||||||||
| OH St Common Sch Ser C | 5.00% | 9/15/2014 | AA+ | 8,525 | 9,602,048 | |||||||||||||||
| OH St Infrastr Impt | 5.35% | 8/1/2014 | AA+ | 1,000 | 1,131,210 | |||||||||||||||
| PA St 2nd Ser | 5.00% | 2/15/2015 | Aa1 | 11,400 | 13,000,902 | |||||||||||||||
| Portsmouth VA Nts Ser C | 3.00% | 7/15/2014 | Aa2 | 7,500 | 7,827,300 | |||||||||||||||
| Puerto Rico Comwlth Pub Impt Ser A (FGIC) | 5.50% | 7/1/2014 | Baa1 | 4,025 | 4,353,681 | |||||||||||||||
See Notes to Financial Statements.
28
Schedule of Investments (continued)
SHORT DURATION TAX FREE FUND September 30, 2011
| Investments | Interest Rate | Maturity Date | Credit Rating: S&P or Moody’s(a) | Principal Amount (000) | Fair Value | |||||||||||||||
| General Obligation (continued) | ||||||||||||||||||||
| Puerto Rico Pub Fin Corp Comwlth Approp Ser A (FGIC) | 5.25% | 8/1/2031 | Baa2 | $ | 7,500 | $ | 7,590,075 | |||||||||||||
| Rangely CO Hosp Dist | 4.50% | 11/1/2021 | Baa1 | 5,500 | 5,403,695 | |||||||||||||||
| RI St & Providence Plantation Cap Dev Ln Ser A | 5.00% | 7/15/2012 | AA | 475 | 492,290 | |||||||||||||||
| Socorro TX Indpt Sch Dist Ser A PSF GTD | 5.00% | 8/15/2014 | AAA | 1,000 | 1,123,410 | |||||||||||||||
| Strafford Cnty NH Tax Antic Nts | 6.50% | 12/30/2011 | NR | 5,600 | 5,613,944 | |||||||||||||||
| Territory of Guam Ser A | 5.75% | 11/15/2014 | B+ | 3,300 | 3,389,694 | |||||||||||||||
| Virgin Islands Pub Fin Auth Sr Lien Ser B | 5.00% | 10/1/2014 | BBB | 2,750 | 2,967,415 | |||||||||||||||
| Washoe Cnty NV Reno Sparks Convtn(c)(m) | 5.00% | 7/1/2022 | AA | 2,000 | 2,254,480 | |||||||||||||||
| Waterbury CT (AG) | 4.00% | 9/1/2013 | AA+ | 1,700 | 1,792,038 | |||||||||||||||
| Waterbury CT (AG) | 4.00% | 9/1/2014 | AA+ | 1,700 | 1,818,371 | |||||||||||||||
| Woonsocket RI | 7.125% | 6/15/2016 | Ba1 | 4,000 | 4,076,280 | |||||||||||||||
|
| |||||||||||||||||||
| Total | 208,701,233 | |||||||||||||||||||
|
| |||||||||||||||||||
| Health Care 14.35% | ||||||||||||||||||||
| AL Hlthcare Auth For Baptist Ser A | 6.00% | 11/15/2036 | A3 | 2,000 | 2,043,980 | |||||||||||||||
| Allegheny Cnty PA Hosp Dev Auth Hlth Sys West PA Ser A | 5.00% | 11/15/2013 | B+ | 2,000 | 2,025,860 | |||||||||||||||
| Allegheny Cnty PA Hosp Dev Auth Hlth Sys West PA Ser A | 5.00% | 11/15/2012 | B+ | 5,815 | 5,871,057 | |||||||||||||||
| Allegheny Cnty PA Hosp Dev Auth Univ Pittsburgh Med Ctr Ser A | 5.00% | 9/1/2014 | Aa3 | 9,440 | 10,441,206 | |||||||||||||||
| Allegheny Cnty PA Hosp Dev Auth Univ Pittsburgh Med Ctr Ser F | 1.21% | # | 5/15/2038 | Aa3 | 4,000 | 4,002,640 | ||||||||||||||
| AZ Hlth Facs Auth Rev Banner Hlth Ser D | 5.00% | 1/1/2014 | AA- | 2,000 | 2,156,720 | |||||||||||||||
| Birmingham-Baptist AL Med Ctr Spl Care Facs Fing Auth Baptist Hlth Sys Ser A | 5.30% | 11/15/2012 | Baa2 | 2,150 | 2,178,359 | |||||||||||||||
| CA Hlth Facs Fing Auth Adventist Hlth Sys West Ser C | 5.00% | 3/1/2014 | A | 2,000 | 2,147,520 | |||||||||||||||
| CA Hlth Facs Fing Auth Catholic Hlthcare West Ser F | 5.00% | 7/1/2027 | A | 3,500 | 3,813,635 | |||||||||||||||
| CA Hlth Facs Fing Auth Sutter Hlth Ser A | 5.00% | 8/15/2014 | AA- | 1,205 | 1,323,367 | |||||||||||||||
| CA Muni Fin Auth Cmnty Hosps Cent CA COP | 5.00% | 2/1/2012 | Baa2 | 1,095 | 1,106,782 | |||||||||||||||
| CA Muni Fin Auth Cmnty Hosps Cent CA COP | 5.00% | 2/1/2013 | Baa2 | 1,160 | 1,202,839 | |||||||||||||||
| CA Muni Fin Auth Cmnty Hosps Cent CA COP | 5.00% | 2/1/2014 | Baa2 | 1,220 | 1,285,526 | |||||||||||||||
See Notes to Financial Statements.
29
Schedule of Investments (continued)
SHORT DURATION TAX FREE FUND September 30, 2011
| Investments | Interest Rate | Maturity Date | Credit Rating: S&P or Moody’s(a) | Principal Amount (000) | Fair Value | |||||||||||||||
| Health Care (continued) | ||||||||||||||||||||
| CA Statewide Cmntys Dev Auth Daughters of Charity Hlth Ser G | 5.25% | 7/1/2012 | BBB | $ | 1,200 | $ | 1,230,756 | |||||||||||||
| CA Statewide Cmntys Dev Auth Daughters of Charity Hlth Ser G | 5.25% | 7/1/2013 | BBB | 1,075 | 1,115,076 | |||||||||||||||
| CA Statewide Cmntys Dev Auth Kaiser Permanente Ser A | 5.00% | 4/1/2013 | A+ | 13,150 | 13,992,126 | |||||||||||||||
| CA Statewide Cmntys Dev Auth Kaiser Permanente Ser C | 3.85% | 11/1/2029 | A+ | 2,025 | 2,071,494 | |||||||||||||||
| CA Statewide Cmntys Dev Auth Sr Living Sthn CA | 5.25% | 11/15/2014 | BBB | 1,060 | 1,148,690 | |||||||||||||||
| Charlotte-Mecklenburg Hosp Auth NC Carolinas Hlthcare Ser A (IBC)(NPFGC) | 5.00% | 1/15/2015 | AA- | 2,275 | 2,522,520 | |||||||||||||||
| Clackamas Cnty OR Hosp Fac Auth Legacy Hlth Sys Ser C | 5.00% | 7/15/2037 | A+ | 2,000 | 2,164,100 | |||||||||||||||
| CO Hlth Facs Auth Rev Catholic Hlth Ser B | 5.00% | 7/1/2039 | AA | 5,500 | 6,135,855 | |||||||||||||||
| CO Hlth Facs Auth Rev Evangelical Lutheran Ser B | 5.00% | 6/1/2039 | A- | 4,900 | 5,394,655 | |||||||||||||||
| CO Hlth Facs Auth Rev Total Longterm Care Natl Ser A | 4.25% | 11/15/2015 | BBB- | (d) | 1,440 | 1,459,469 | ||||||||||||||
| CT St Hlth & Edl Fac Auth Lawrence & Mem Hosp Ser F | 5.00% | 7/1/2018 | A+ | 2,705 | 3,071,609 | |||||||||||||||
| CT St Hlth & Edl Fac Auth Lawrence & Mem Hosp Ser F | 5.00% | 7/1/2019 | A+ | 2,835 | 3,198,816 | |||||||||||||||
| CT St Hlth & Edl Facs Auth Stamford Hosp Ser I | 5.00% | 7/1/2015 | A | 1,980 | 2,195,167 | |||||||||||||||
| CT St Hlth & Edl Facs Auth Stamford Hosp Ser I | 5.00% | 7/1/2014 | A | 2,050 | 2,233,700 | |||||||||||||||
| Escambia Cnty FL Hlth Facs Auth Ascension Hlth Credit Ser A | 5.25% | 11/15/2014 | AA+ | 7,625 | 8,605,117 | |||||||||||||||
| Gaithersburg MD Econ Dev Rev Asbury MD Oblig Ser B | 5.00% | 1/1/2012 | BBB- | (d) | 2,640 | 2,658,797 | ||||||||||||||
| Gaithersburg MD Econ Dev Rev Asbury MD Oblig Ser B | 5.00% | 1/1/2014 | BBB- | (d) | 2,965 | 3,110,107 | ||||||||||||||
| Gaithersburg MD Econ Dev Rev Asbury MD Oblig Ser B | 5.00% | 1/1/2015 | BBB- | (d) | 2,950 | 3,123,194 | ||||||||||||||
| Harris Cnty TX Cultural Ed Facs Fin Corp Methodist Hosp Sys | 5.00% | 6/1/2013 | AA | 4,250 | 4,521,830 | |||||||||||||||
| Harris Cnty TX Cultural Ed Facs Fin Corp Methodist Hosp Sys | 5.00% | 6/1/2014 | AA | 3,500 | 3,840,760 | |||||||||||||||
See Notes to Financial Statements.
30
Schedule of Investments (continued)
SHORT DURATION TAX FREE FUND September 30, 2011
| Investments | Interest Rate | Maturity Date | Credit Rating: S&P or Moody’s(a) | Principal Amount (000) | Fair Value | |||||||||||||||
| Health Care (continued) | ||||||||||||||||||||
| Harris Cnty TX Cultural Ed Facs Fin Corp Methodist Hosp Sys Ser B | 5.25% | 12/1/2013 | AA | $ | 3,000 | $ | 3,252,360 | |||||||||||||
| HFDC Cent TX Inc Ret Fac Ser A | 5.25% | 11/1/2014 | NR | 1,195 | 1,185,285 | |||||||||||||||
| HI St Dept Bdgt & Fin Ser C2 | 6.40% | 11/15/2014 | NR | 1,100 | 1,101,155 | |||||||||||||||
| IA Fin Auth Hlthcare Facs Genesis Hlth Sys | 5.00% | 7/1/2014 | A1 | 1,065 | 1,151,190 | |||||||||||||||
| IL Fin Auth Rev Advocate Hlthcare Ser A-3 | 3.875% | 11/1/2030 | AA | 1,000 | 1,019,260 | |||||||||||||||
| IL Fin Auth Rev Provena Hlth Ser A | 5.00% | 5/1/2012 | BBB+ | 2,000 | 2,034,160 | |||||||||||||||
| IL Fin Auth Rev Provena Hlth Ser A | 5.25% | 5/1/2015 | BBB+ | 2,000 | 2,145,700 | |||||||||||||||
| IL Fin Auth Rev Rush Univ Med Ctr Oblig Grp Ser A | 5.00% | 11/1/2014 | A2 | 100 | 107,286 | |||||||||||||||
| IL Fin Auth Rev The Carle Fndtn Ser A (AG) | 5.00% | 2/15/2012 | AA+ | 500 | 505,315 | |||||||||||||||
| IL Hlth Facs Auth Rev Advocate Hlthcare Network Ser A | 4.375% | 11/15/2022 | AA | 3,650 | 3,937,656 | |||||||||||||||
| IN Hlth Fac Fing Auth Rev Ascension Hlth Sub Credit A-6 | 5.00% | 10/1/2027 | AA | 10,900 | 12,048,751 | |||||||||||||||
| Jackson Cnty MI Hosp Fin Auth Allegiance Hlth Ser A | 4.00% | 6/1/2014 | A- | 3,680 | 3,809,352 | |||||||||||||||
| Jackson Cnty MI Hosp Fin Auth Allegiance Hlth Ser A | 4.00% | 6/1/2015 | A- | 3,600 | 3,745,188 | |||||||||||||||
| Jackson Cnty MI Hosp Fin Auth Allegiance Hlth Ser A | 4.00% | 6/1/2016 | A- | 2,855 | 2,949,215 | |||||||||||||||
| Kent MI Hosp Fin Auth Rev Spectrum Hlth Ser A | 4.25% | 1/15/2047 | AA | 10,000 | 10,701,800 | |||||||||||||||
| King Cnty WA Pub Hosp Dist No 2 Evergreen Hlthcare (NPFGC) | 5.00% | 12/1/2012 | Aa2 | 2,000 | 2,096,400 | |||||||||||||||
| Kirkwood MO Indl Dev Auth Aberdeen Heights Ser 50-C-3 | 6.50% | 5/15/2015 | NR | 1,000 | 1,001,860 | |||||||||||||||
| Kirkwood MO Indl Dev Auth Aberdeen Heights Ser 65-C-2 | 7.00% | 11/15/2015 | NR | 4,700 | 4,729,610 | |||||||||||||||
| KS St Dev Fin Auth Hosp Rev Adventist Hlth | 4.00% | 11/15/2012 | AA- | 1,000 | 1,038,050 | |||||||||||||||
| Kuakini HI Hlth Sys Spl Purp Ser A | 5.50% | 7/1/2012 | BB+ | 575 | 578,341 | |||||||||||||||
| LA Pub Facs Auth Rev Christus Hlth Ser A | 5.00% | 7/1/2014 | A+ | 3,000 | 3,251,160 | |||||||||||||||
| Lancaster Cnty PA Hosp Auth Rev Brethren Vlg Pj Ser A | 5.20% | 7/1/2012 | NR | 1,750 | 1,760,833 | |||||||||||||||
| Lee Cnty FL Indl Dev Auth Shell PT/Alliance Cmnty Pj | 5.00% | 11/15/2012 | BB | 3,000 | 3,083,940 | |||||||||||||||
| Lexington Cnty SC Hlth Svcs Dist Inc | 5.50% | 5/1/2032 | AA- | 400 | 450,940 | |||||||||||||||
See Notes to Financial Statements.
31
Schedule of Investments (continued)
SHORT DURATION TAX FREE FUND September 30, 2011
| Investments | Interest Rate | Maturity Date | Credit Rating: S&P or Moody’s(a) | Principal Amount (000) | Fair Value | |||||||||||||||
| Health Care (continued) | ||||||||||||||||||||
| MA Dev Fin Agy Ser B2 | 6.25% | 6/1/2014 | NR | $ | 3,660 | $ | 3,660,146 | |||||||||||||
| MN Agric & Econ Dev Brd Hlthcare Essential Ser C-1 Rmkt (AG) | 5.00% | 2/15/2015 | AA+ | 1,335 | 1,478,299 | |||||||||||||||
| MN Agric & Econ Dev Brd Hlthcare Essential Ser C-1 Rmkt (AG) | 5.00% | 2/15/2016 | AA+ | 565 | 633,427 | |||||||||||||||
| MO St Hlth & Edl Facs Auth St. Luke’s Hlth Sys Inc Ser A | 5.00% | 11/15/2013 | A+ | 2,130 | 2,278,333 | |||||||||||||||
| MO St Hlth & Edl Facs Auth St. Luke’s Hlth Sys Inc Ser A | 5.00% | 11/15/2014 | A+ | 2,140 | 2,335,382 | |||||||||||||||
| MS St Med Ctr Ed Bldg Corp Univ MS Med Ctr Facs | 4.00% | 6/1/2014 | Aa2 | 1,000 | 1,069,430 | |||||||||||||||
| NC Med Care Commn Univ Hlth Sys Ser E-1 | 5.75% | 12/1/2036 | A+ | 995 | 1,063,715 | |||||||||||||||
| Newport Beach CA Rev Hoag Mem Hosp Presbyterian Ser D | 5.00% | 12/1/2038 | AA | 3,000 | 3,164,130 | |||||||||||||||
| NJ Hlthcare Facs Fing Auth St. Peter’s Univ Hosp | 5.00% | 7/1/2016 | BBB- | 3,160 | 3,372,289 | |||||||||||||||
| NJ Hlthcare Facs Fing Auth St. Peter’s Univ Hosp | 5.00% | 7/1/2017 | BBB- | 3,850 | 4,065,677 | |||||||||||||||
| NY St Dorm Auth Rev Mental Hlth Svcs Facs Impt Ser D (NPFGC)(FGIC) | 5.00% | 8/15/2015 | AA- | 4,670 | 5,246,231 | |||||||||||||||
| NY St Dorm Auth Rev North Shore Univ Hosp (NPFGC) | 5.50% | 11/1/2012 | A3 | 2,035 | 2,114,345 | |||||||||||||||
| OR St Facs Auth Rev Legacy Hlth Pj Ser A | 5.00% | 5/1/2017 | A+ | 4,040 | 4,522,093 | |||||||||||||||
| OR St Facs Auth Rev Legacy Hlth Sys Ser A | 5.00% | 3/15/2013 | A+ | 1,000 | 1,054,250 | |||||||||||||||
| OR St Facs Auth Rev Legacy Hlth Sys Ser A | 5.00% | 3/15/2014 | A+ | 400 | 432,472 | |||||||||||||||
| PA St Higher Edl Facs Auth Univ of Pittsburgh Med Ctr Ser E | 5.00% | 5/15/2014 | Aa3 | 3,965 | 4,343,618 | |||||||||||||||
| Palm Beach Cnty FL Hlth Facs Auth Bethesda Hlthcare Sys Pj Ser A (AGM) | 5.00% | 7/1/2014 | AA+ | 2,420 | 2,613,842 | |||||||||||||||
| Puerto Rico Indl Tourist Edl Med & Envr Ctrl Facs Fing Auth Hosp Auxilio Mutuo Ser A | 5.00% | 7/1/2016 | A- | 3,385 | 3,604,788 | |||||||||||||||
| Puerto Rico Indl Tourist Edl Med & Envr Ctrl Facs Fing Auth Hosp Auxilio Mutuo Ser A | 5.00% | 7/1/2017 | A- | 2,555 | 2,707,559 | |||||||||||||||
| Rochester MN Hlthcare Fac Mayo Clinic Ser B | 4.00% | 11/15/2038 | AA | 5,000 | 5,558,050 | |||||||||||||||
| San Buenaventura CA Cmnty Mem Hlth Sys | 5.00% | 12/1/2016 | BB | 1,750 | 1,796,235 | |||||||||||||||
See Notes to Financial Statements.
32
Schedule of Investments (continued)
SHORT DURATION TAX FREE FUND September 30, 2011
| Investments | Interest Rate | Maturity Date | Credit Rating: S&P or Moody’s(a) | Principal Amount (000) | Fair Value | |||||||||||||||
| Health Care (continued) | ||||||||||||||||||||
| San Buenaventura CA Cmnty Mem Hlth Sys | 5.25% | 12/1/2017 | BB | $ | 1,750 | $ | 1,793,295 | |||||||||||||
| San Buenaventura CA Cmnty Mem Hlth Sys | 5.75% | 12/1/2018 | BB | 1,800 | 1,862,730 | |||||||||||||||
| SC Jobs Econ Dev Auth Tuomey (CIFG) | 5.00% | 11/1/2013 | BBB | 1,685 | 1,714,774 | |||||||||||||||
| SC Jobs Econ Dev Auth Tuomey (CIFG) | 5.00% | 11/1/2014 | BBB | 1,035 | 1,054,116 | |||||||||||||||
| SD St Hlth & Edl Facs Auth Regl Hlth | 5.00% | 9/1/2014 | A1 | 1,000 | 1,096,140 | |||||||||||||||
| Shelby Cnty TN Hlth Edl & Hsg Facs Brd Baptist Mem Hlth Ser 2004A | 5.00% | 9/1/2014 | AA | 1,500 | 1,655,460 | |||||||||||||||
| St. Paul MN Hsg & Redev Auth Gillette Children’s Specialty | 3.00% | 2/1/2012 | A- | 1,250 | 1,258,988 | |||||||||||||||
| Westchester Cnty NY Hlthcare Corp Sr Lien Ser B | 5.00% | 11/1/2015 | A3 | 3,215 | 3,477,633 | |||||||||||||||
| WI St Hlth & Edl Facs Auth Aurora Hlthcare Inc Ser B | 4.75% | 8/15/2025 | A3 | 3,000 | 3,225,630 | |||||||||||||||
| WI St Hlth & Edl Facs Auth Froedtert & Cmnty Hlth | 4.00% | 4/1/2014 | AA- | 1,300 | 1,386,346 | |||||||||||||||
| WI St Hlth & Edl Facs Auth St. John’s Cmntys Inc Ser C-2 | 5.40% | 9/15/2014 | NR | 5,750 | 5,750,230 | |||||||||||||||
| WI St Hlth & Edl Facs Auth Wheaton Franciscan Hlthcare | 5.00% | 8/15/2013 | BBB+ | 5,000 | 5,254,750 | |||||||||||||||
|
| |||||||||||||||||||
| Total | 267,722,539 | |||||||||||||||||||
|
| |||||||||||||||||||
| Housing 0.44% | ||||||||||||||||||||
| CA Hsg Fin Agy Rev Belovida Apts Pj Ser A | 2.375% | 8/1/2014 | Aa1 | 3,220 | 3,235,875 | |||||||||||||||
| Minneapolis MN Multi Fam Hsg Riverside Plaza Ser B | 6.00% | 11/1/2013 | NR | 5,000 | 5,000,250 | |||||||||||||||
|
| |||||||||||||||||||
| Total | 8,236,125 | |||||||||||||||||||
|
| |||||||||||||||||||
| Lease Obligations 10.57% | ||||||||||||||||||||
| Anaheim CA Pub Fing Auth Pub Impts Pj Sub Ser C (AGM) | 6.00% | 9/1/2014 | AA+ | 1,500 | 1,683,885 | |||||||||||||||
| Atlanta GA Downtown Dev Auth Rev Underground Atlanta Pj Ser A (AG) | 5.00% | 7/1/2014 | AA+ | 3,500 | 3,769,640 | |||||||||||||||
| CA St Pub Wrks Brd Var Cap Pj Ser G-1 | 5.00% | 10/1/2013 | A2 | 3,945 | 4,225,805 | |||||||||||||||
| CA St Pub Wrks Brd Var Cap Pj Ser G-1 | 5.00% | 10/1/2014 | A2 | 14,175 | 15,536,934 | |||||||||||||||
| Cleveland OH Cleveland Stadium Pj Ser A COP | 5.00% | 11/15/2014 | A | 5,320 | 5,770,444 | |||||||||||||||
| Cleveland OH Cleveland Stadium Pj Ser A COP | 5.00% | 11/15/2015 | A | 5,420 | 5,979,615 | |||||||||||||||
See Notes to Financial Statements.
33
Schedule of Investments (continued)
SHORT DURATION TAX FREE FUND September 30, 2011
| Investments | Interest Rate | Maturity Date | Credit Rating: S&P or Moody’s(a) | Principal Amount (000) | Fair Value | |||||||||||||||
| Lease Obligations (continued) | ||||||||||||||||||||
| Greenville Cnty SC Sch Dist Bldg Equity Sooner | 5.00% | 12/1/2013 | AA | $ | 1,700 | $ | 1,843,480 | |||||||||||||
| IN St Office Bldg Commn New Castle Correctional Ser B (NPFGC)(FGIC) | 5.25% | 7/1/2016 | Aa1 | 1,785 | 2,041,647 | |||||||||||||||
| Indianapolis IN Loc Pub Impt Bd Bk Ser 2005 E (AMBAC) | 5.00% | 1/1/2014 | Aa2 | 4,205 | 4,610,867 | |||||||||||||||
| Indianapolis IN Loc Pub Impt Bd Bk Ser A (AGM) | 6.50% | 1/1/2013 | AA+ | 2,500 | 2,629,625 | |||||||||||||||
| KY St Ppty & Bldgs Commn Pj No 82 (AGM) | 5.25% | 10/1/2014 | AA+ | 5,500 | 6,179,690 | |||||||||||||||
| KY St Ppty & Bldgs Commn Pj No 83 (AMBAC) | 5.00% | 10/1/2015 | Aa3 | 6,085 | 6,970,185 | |||||||||||||||
| KY St Ppty & Bldgs Commn Pj No 88 (NPFGC)(FGIC) | 5.00% | 11/1/2014 | Aa3 | 2,815 | 3,152,096 | |||||||||||||||
| LA Loc Govt Envr Facs & Cmnty Dev Auth LCTCS Facs Corp Pj Ser A | 4.00% | 10/1/2013 | AA- | 1,500 | 1,567,785 | |||||||||||||||
| Lee Cnty FL Sch Brd Ser A COP | 4.00% | 8/1/2013 | Aa3 | 4,425 | 4,617,355 | |||||||||||||||
| Los Angeles CA Unif Sch Dist Multiple Pptys Ser A COP | 4.00% | 12/1/2013 | A+ | 4,055 | 4,239,178 | |||||||||||||||
| Los Angeles CA Unif Sch Dist Multiple Pptys Ser A COP | 4.00% | 12/1/2014 | A+ | 6,360 | 6,744,971 | |||||||||||||||
| MA St Ser A | 0.82% | # | 2/1/2015 | AA+ | 2,500 | 2,502,200 | ||||||||||||||
| Maricopa Cnty AZ Pub Fin Corp Ser B (AMBAC) | 5.00% | 7/1/2014 | AA+ | 3,000 | 3,295,110 | |||||||||||||||
| MI Muni Bd Auth Rev Loc Govt Ln Pg Sch Pg Ser C | 5.00% | 5/1/2013 | A+ | 1,495 | 1,561,916 | |||||||||||||||
| MI Muni Bd Auth Rev Loc Govt Ln Pg Ser C | 5.00% | 5/1/2013 | AA- | 1,650 | 1,735,685 | |||||||||||||||
| MI Muni Bd Auth Rev Loc Govt Ln Pg Ser C | 5.00% | 5/1/2014 | Aa2 | 4,050 | 4,407,372 | |||||||||||||||
| MI St Bldg Auth Rev Facs Pg Ser I | 5.00% | 10/15/2014 | Aa3 | 2,000 | 2,200,200 | |||||||||||||||
| MI St Bldg Auth Rev Facs Pg Ser I | 5.00% | 10/15/2015 | Aa3 | 75 | 84,036 | |||||||||||||||
| Miami-Dade Cnty FL Entitlement GTD (NPFGC)(FGIC) | 5.00% | 8/1/2014 | Aa3 | 5,665 | 6,181,138 | |||||||||||||||
| Miami-Dade Cnty FL Spl Oblig Cap Asset Acq Ser A-1 (AMBAC) | 5.00% | 4/1/2013 | Aa3 | 5,860 | 6,204,627 | |||||||||||||||
| New York City NY Transnl Fin Auth Ser S-2 (AGM) | 5.00% | 1/15/2014 | AA+ | 3,000 | 3,257,460 | |||||||||||||||
| NJ Econ Dev Auth Sch Facs Constr Ser J-5 Rmkt (AGM) | 5.00% | 9/1/2029 | AA+ | 5,000 | 5,529,000 | |||||||||||||||
See Notes to Financial Statements.
34
Schedule of Investments (continued)
SHORT DURATION TAX FREE FUND September 30, 2011
| Investments | Interest Rate | Maturity Date | Credit Rating: S&P or Moody’s(a) | Principal Amount (000) | Fair Value | |||||||||||||||
| Lease Obligations (continued) | ||||||||||||||||||||
| NJ Econ Dev Auth Sch Facs Constr Ser O | 5.25% | 3/1/2014 | A+ | $ | 2,625 | $ | 2,880,911 | |||||||||||||
| NJ Econ Dev Auth Sch Facs Constr Ser T-3 Rmkt (AGM) | 5.00% | 9/1/2020 | AA+ | 1,830 | 1,998,287 | |||||||||||||||
| NJ St Edl Facs Auth Higher Ed Cap Impt Ser A (AGM) | 5.00% | 9/1/2014 | AA+ | 2,975 | 3,295,943 | |||||||||||||||
| NJ St Equip Lease Purchase Ser A COP | 5.00% | 6/15/2015 | A+ | 3,150 | 3,387,982 | |||||||||||||||
| NJ St Transn Tr Fd Auth Transn Sys Ser B (NPFGC) | 5.50% | 12/15/2016 | A+ | 1,225 | 1,429,575 | |||||||||||||||
| NJ St Transn Tr Fd Auth Unref Bal Transn Sys Ser C (AGM) | 5.75% | 12/15/2014 | AA+ | 2,910 | 3,318,768 | |||||||||||||||
| NY St Dorm Auth Rev Cons Svc Contract Ser A | 4.00% | 7/1/2014 | AA- | 1,425 | 1,527,771 | |||||||||||||||
| NY St Dorm Auth Rev Mental Hlth Svcs Facs Impt | 5.00% | 2/15/2014 | AA- | 7,075 | 7,723,211 | |||||||||||||||
| NY St Dorm Auth Rev Ser B | 5.25% | 11/15/2023 | AA- | 10,000 | 10,280,000 | |||||||||||||||
| OH St Bldg Auth Facs Adult Correction Ser C (NPFGC) | 5.00% | 10/1/2013 | AA | 425 | 460,415 | |||||||||||||||
| Palm Beach Cnty FL Sch Brd Ser A Term Rate COP | 5.00% | 8/1/2032 | Aa3 | 2,500 | 2,789,400 | |||||||||||||||
| Puerto Rico Pub Bldgs Auth Rev Govt Facs Ser J GTD (AMBAC) | 5.00% | 7/1/2036 | Baa1 | 4,945 | 5,071,938 | |||||||||||||||
| Puerto Rico Pub Bldgs Auth Rev Ser M GTD | 5.75% | 7/1/2016 | Baa1 | 4,145 | 4,577,323 | |||||||||||||||
| Puerto Rico Pub Fin Corp Comwlth Approp Ser A | 5.75% | 8/1/2027 | Baa2 | 7,500 | 7,602,075 | |||||||||||||||
| Sacramento CA Unif Sch Dist Ser A Rmkt COP (AGM) | 3.16% | # | 3/1/2040 | A2 | 3,570 | 3,570,000 | ||||||||||||||
| Salt Lake Cnty UT Muni Bldg Auth Ser A | 4.00% | 12/1/2014 | AA+ | 1,000 | 1,099,840 | |||||||||||||||
| Santa Clara Cnty CA Fing Auth Multi Facs Pj | 5.00% | 11/15/2014 | AA | 2,670 | 2,976,276 | |||||||||||||||
| Scago SC Edl Facs Corp for Pickens Sch Dist Pickens Cnty Pj (AGM) | 5.00% | 12/1/2013 | AA+ | 1,000 | 1,078,820 | |||||||||||||||
| Southwest Allen IN Multi Sch Bldg Corp 1st Mtg Ser A (NPFGC) | 5.00% | 1/15/2014 | Aa2 | 2,705 | 2,932,031 | |||||||||||||||
| Toledo OH City Svcs Spl Assmt Nts Spl Oblig | 4.00% | 12/1/2011 | NR | 5,315 | 5,334,347 | |||||||||||||||
| VA Biotechnology Resh Partnership Auth Cons Laboratories Pj | 4.00% | 9/1/2014 | AA+ | 3,270 | 3,540,429 | |||||||||||||||
| Weber UT Muni Bldg Auth | 4.00% | 12/15/2013 | AA- | 1,770 | 1,875,404 | |||||||||||||||
|
| |||||||||||||||||||
| Total | 197,272,692 | |||||||||||||||||||
|
| |||||||||||||||||||
See Notes to Financial Statements.
35
Schedule of Investments (continued)
SHORT DURATION TAX FREE FUND September 30, 2011
| Investments | Interest Rate | Maturity Date | Credit Rating: S&P or Moody’s(a) | Principal Amount (000) | Fair Value | |||||||||||||||
| Other Revenue 6.42% | ||||||||||||||||||||
| Austin TX Convtn Entrprse Inc 2nd Tier Ser B† | 6.00% | 1/1/2015 | Ba2 | $ | 1,580 | $ | 1,645,728 | |||||||||||||
| CA Statewide Cmntys Dev Auth Prop 1A Receivables Pg | 5.00% | 6/15/2013 | A1 | 5,000 | 5,339,500 | |||||||||||||||
| Dallas TX Civic Ctr (AG) | 5.00% | 8/15/2014 | AA+ | 300 | 327,792 | |||||||||||||||
| FL St Brd of Ed Lottery Rev Ser A (AMBAC) | 5.00% | 7/1/2015 | AAA | 3,200 | 3,643,232 | |||||||||||||||
| FL St Brd of Ed Lottery Rev Ser B | 5.00% | 7/1/2014 | AAA | 5,000 | 5,541,800 | |||||||||||||||
| Hamilton Cnty OH Convtn Facs Auth 1st Lien (NPFGC)(FGIC) | 5.00% | 12/1/2013 | A+ | 1,635 | 1,763,511 | |||||||||||||||
| IL Fin Auth Prairie Pwr Ser A Rmkt | 3.00% | 7/1/2042 | A | 10,000 | 10,347,800 | |||||||||||||||
| IN Bd Bk Rev Common Sch Fd Adv Pur Fdg Ser B (NPFGC) | 4.75% | 2/1/2014 | Baa1 | 4,000 | 4,230,520 | |||||||||||||||
| Indianapolis IN Loc Pub Impt Bd Bk Ser K(c) | 5.00% | 6/1/2022 | A1 | 4,040 | 4,428,567 | |||||||||||||||
| Maricopa Cnty AZ Pollutn Ctrl Corp Pub Svc Co Ser A | 4.00% | 6/1/2043 | BBB- | 10,000 | 10,060,500 | |||||||||||||||
| MI Fin Auth Detroit Sch Ser A-2 | 6.65% | 3/20/2012 | NR | 4,500 | 4,590,990 | |||||||||||||||
| MI St Strategic Fd Ltd Solid Wst Oblig Wst Mgmt | 2.80% | 12/1/2013 | BBB | 3,000 | 3,043,350 | |||||||||||||||
| Miami-Dade Cnty FL Indl Dev Auth Wst Mgmt Inc Rmkt | 1.25% | 9/1/2027 | BBB | 3,000 | 3,000,420 | |||||||||||||||
| Minneapolis MN Rev National Marrow Donor Pg | 4.00% | 8/1/2014 | BBB | 4,060 | 4,256,545 | |||||||||||||||
| Minneapolis MN Rev National Marrow Donor Pg | 4.00% | 8/1/2015 | BBB | 4,535 | 4,745,923 | |||||||||||||||
| Mohave Cnty AZ Indl Dev Auth Mohave Prison LLC Expansion Pj | 7.00% | 5/1/2013 | BBB+ | 5,000 | 5,331,850 | |||||||||||||||
| New York City NY Tr Cultural Res Lincoln Ctr Ser C | 5.75% | 12/1/2016 | A+ | 75 | 88,630 | |||||||||||||||
| New York City NY Tr Cultural Res Whitney Museum of Amer Art | 5.00% | 7/1/2017 | A | 6,175 | 7,080,687 | |||||||||||||||
| NJ Econ Dev Auth Cigarette Tax (FGIC) | 5.00% | 6/15/2013 | BBB | 75 | 77,709 | |||||||||||||||
| OH St Air Quality Dev Auth Envr Impt USX Pj | 5.00% | 11/1/2015 | BBB | 1,000 | 1,002,480 | |||||||||||||||
| PA Econ Dev Fing Auth PPL Enrg Supply LLC Pj | 3.00% | 12/1/2038 | BBB | 3,000 | 3,085,920 | |||||||||||||||
| PA Econ Dev Fing Auth PPL Enrg Supply LLC Pj Ser C Rmkt | 3.00% | 12/1/2037 | BBB | 12,000 | 12,343,680 | |||||||||||||||
| Pub Gas Partners Inc GA Ser A | 5.00% | 10/1/2014 | A+ | 3,000 | 3,204,870 | |||||||||||||||
| Puerto Rico Comwlth Govt Dev Bk Rmkt GTD (NPFGC) | 4.75% | 12/1/2015 | BBB | 10,000 | 10,407,700 | |||||||||||||||
See Notes to Financial Statements.
36
Schedule of Investments (continued)
SHORT DURATION TAX FREE FUND September 30, 2011
| Investments | Interest Rate | Maturity Date | Credit Rating: S&P or Moody’s(a) | Principal Amount (000) | Fair Value | |||||||||||||||
| Other Revenue (continued) | ||||||||||||||||||||
| Wise Cnty VA Indl Dev Auth VA Elec & Pwr Co Ser A | 2.375% | 11/1/2040 | A- | $ | 10,000 | $ | 10,212,900 | |||||||||||||
|
| |||||||||||||||||||
| Total | 119,802,604 | |||||||||||||||||||
|
| |||||||||||||||||||
| Pre-Refunded 0.01% | ||||||||||||||||||||
| Weslaco TX Hlth Facs Dev Corp Knapp Med Ctr Pj | 6.25% | 6/1/2032 | NR | 100 | 103,866 | |||||||||||||||
|
| |||||||||||||||||||
| Special Tax 0.29% | ||||||||||||||||||||
| Denver CO Urban Renewal Auth Stapleton Sr Sub Ser B-1 | 4.00% | 12/1/2014 | Aa3 | 5,045 | 5,406,373 | |||||||||||||||
|
| |||||||||||||||||||
| Tax Revenue 3.06% | ||||||||||||||||||||
| AL St Pub Sch & College Auth Cap Impt & Econ Dev (NPFGC)(FGIC) | 5.00% | 12/1/2014 | Aa1 | 3,540 | 3,884,301 | |||||||||||||||
| AL St Pub Sch & College Auth Ser A | 5.00% | 5/1/2015 | Aa1 | 2,800 | 3,197,348 | |||||||||||||||
| CA St Econ Recovery Ser A (NPFGC)(FGIC) | 5.25% | 7/1/2014 | Aa3 | 1,610 | 1,799,030 | |||||||||||||||
| CA St Econ Recovery Ser A ETM | 5.25% | 7/1/2014 | Aaa | 1,130 | 1,277,804 | |||||||||||||||
| CA St Econ Recovery Unrefunded Bal Ser A | 5.25% | 7/1/2014 | Aa3 | 3,870 | 4,324,377 | |||||||||||||||
| Des Moines IA Indpt Cmnty Sch Dist | 5.00% | 6/1/2015 | A+ | 2,810 | 3,138,320 | |||||||||||||||
| FL Hurricane Catastrophe Fd Fin Corp Ser A | 5.00% | 7/1/2013 | AA- | 10,050 | 10,674,507 | |||||||||||||||
| FL Hurricane Catastrophe Fd Fin Corp Ser A | 5.25% | 7/1/2012 | AA- | 2,000 | 2,071,020 | |||||||||||||||
| MA St Spl Oblig Rev Fed Hwy Grant Antic Ser A (AGM) | 5.00% | 12/15/2014 | AAA | 7,000 | 7,944,370 | |||||||||||||||
| NJ Econ Dev Auth Cigarette Tax | 5.375% | 6/15/2014 | BBB | 2,560 | 2,706,586 | |||||||||||||||
| NY St Dorm Auth Rev St Pers Income Tax Ser A | 5.00% | 3/15/2014 | AAA | 250 | 273,960 | |||||||||||||||
| NY St Loc Govt Assistance Corp Sr Lien Ser A | 5.00% | 4/1/2015 | AAA | 2,475 | 2,832,860 | |||||||||||||||
| Orlando FL Cmnty Redev Agy Tax Alloc Downtown Dist Ser B | 5.00% | 9/1/2014 | A1 | 2,940 | 3,179,051 | |||||||||||||||
| Regl Transit Auth LA Sales Tax (AGM) | 3.00% | 12/1/2013 | AA+ | 750 | 778,470 | |||||||||||||||
| Tallahassee FL Blueprint 2000 Intergovtl Agy (NPFGC) | 5.00% | 10/1/2013 | Aa2 | 2,100 | 2,236,227 | |||||||||||||||
| Volusia Cnty FL Sch Brd (NPFGC) | 5.00% | 10/1/2013 | BBB+ | 4,150 | 4,266,159 | |||||||||||||||
| WV Sch Bldg Auth | 5.00% | 7/1/2014 | AAA | 2,290 | 2,523,740 | |||||||||||||||
|
| |||||||||||||||||||
| Total | 57,108,130 | |||||||||||||||||||
|
| |||||||||||||||||||
See Notes to Financial Statements.
37
Schedule of Investments (continued)
SHORT DURATION TAX FREE FUND September 30, 2011
| Investments | Interest Rate | Maturity Date | Credit Rating: S&P or Moody’s(a) | Principal Amount (000) | Fair Value | |||||||||||||||
| Tobacco 0.78% | ||||||||||||||||||||
| Buckeye OH Tob Sttlmnt Fing Auth Asset Bkd Sr Ser A-1 | 5.00% | 6/1/2014 | A1 | $ | 5,500 | $ | 5,621,660 | |||||||||||||
| Railsplitter IL Tob Sttlmnt Auth | 5.00% | 6/1/2015 | A | 8,000 | 8,916,640 | |||||||||||||||
|
| |||||||||||||||||||
| Total | 14,538,300 | |||||||||||||||||||
|
| |||||||||||||||||||
| Transportation 5.80% | ||||||||||||||||||||
| Chicago IL Midway Arpt Rev 2nd Lien Ser B | 5.00% | 1/1/2034 | A- | 2,725 | 2,971,994 | |||||||||||||||
| CT St Spl Tax Oblig Transn Infrastr Ser B | 5.00% | 12/1/2014 | AA | 10,000 | 11,276,000 | |||||||||||||||
| Dallas-Fort Worth TX Intl Arpt Facs Impt Corp Jt Ser A | 4.00% | 11/1/2014 | A+ | 2,500 | 2,717,625 | |||||||||||||||
| Delaware River PA Jt Toll Bridge Commn Ser A (NPFGC) | 5.50% | 7/1/2014 | A2 | 2,455 | 2,709,117 | |||||||||||||||
| Denver CO City & County Arpt Rev Ser E (NPFGC) | 6.00% | 11/15/2013 | A+ | 4,100 | 4,541,734 | |||||||||||||||
| DuPage Cnty IL Transn Rev (AGM) | 5.00% | 1/1/2012 | AA+ | 75 | 75,770 | |||||||||||||||
| E-470 Pub Hwy Auth CO Rev Ser C2 (NPFGC) | 5.00% | 9/1/2039 | Baa1 | 3,450 | 3,585,412 | |||||||||||||||
| E-470 Pub Hwy Auth CO Rev Ser D2 (NPFGC) | 5.00% | 9/1/2039 | Baa1 | 6,550 | 6,807,087 | |||||||||||||||
| Fairfax Cnty VA Econ Dev Auth Spl Tax Silver Line Phase I Pj | 5.00% | 4/1/2017 | AA | 2,000 | 2,368,660 | |||||||||||||||
| FL St Dept of Transn Tpk Auth Rev Ser A | 5.00% | 7/1/2012 | AA- | 75 | 77,548 | |||||||||||||||
| GA St Rd & Twy Auth Rev Fed Hwy Grant Antic Bds (NPFGC) | 5.00% | 6/1/2014 | Aa2 | 1,000 | 1,109,010 | |||||||||||||||
| Houston TX Arpt Sys Rev Sub Lien Ser B | 5.00% | 7/1/2017 | A | 1,500 | 1,713,915 | |||||||||||||||
| LA St Offshore Terminal Auth Loop LLC Pj Ser B-1 | 1.875% | 10/1/2040 | A | 3,750 | 3,756,937 | |||||||||||||||
| LA St Offshore Terminal Auth Loop LLC Pj Ser B-2 | 2.10% | 10/1/2040 | A | 3,500 | 3,497,970 | |||||||||||||||
| MA Bay Transn Auth Sr Ser C | 5.25% | 7/1/2013 | AAA | 75 | 81,256 | |||||||||||||||
| Metro Transn Auth NY Ser B | 5.00% | 11/15/2014 | AA | 1,000 | 1,125,170 | |||||||||||||||
| Metro Transn Auth NY Ser B | 5.00% | 11/15/2027 | A | 6,000 | 6,488,220 | |||||||||||||||
| NJ St Transn Tr Fd Auth Grant Antic Bds Ser A (NPFGC)(FGIC) | 5.00% | 6/15/2015 | Aa3 | 2,950 | 3,301,581 | |||||||||||||||
| NJ St Transn Tr Fd Auth Transn Sys Ser A (NPFGC) | 5.25% | 12/15/2014 | A+ | 5,000 | 5,624,300 | |||||||||||||||
| NJ St Transn Tr Fd Auth Transn Sys Ser B (NPFGC)(FGIC) | 5.25% | 12/15/2018 | A+ | 5,000 | 5,597,000 | |||||||||||||||
| NY St Twy Auth Secd Ser A-1 | 5.00% | 4/1/2018 | AA | 3,405 | 4,037,377 | |||||||||||||||
See Notes to Financial Statements.
38
Schedule of Investments (continued)
SHORT DURATION TAX FREE FUND September 30, 2011
| Investments | Interest Rate | Maturity Date | Credit Rating: S&P or Moody’s(a) | Principal Amount (000) | Fair Value | |||||||||||||||
| Transportation (continued) | ||||||||||||||||||||
| OH St Major New St Infrastr Ser 2008-1 | 5.50% | 6/15/2014 | Aa1 | $ | 1,460 | $ | 1,641,697 | |||||||||||||
| PA St Tpk Commn Ser T (NPFGC)(FGIC) | 5.50% | 12/1/2013 | Aa3 | 825 | 903,218 | |||||||||||||||
| PA St Tpk Commn Sub Ser B | 5.00% | 6/1/2014 | A- | 3,250 | 3,516,663 | |||||||||||||||
| Puerto Rico Comwlth Hwy & Transn Auth Ser E (AGM) | 5.50% | 7/1/2014 | AA+ | 5,000 | 5,493,500 | |||||||||||||||
| South Jersey NJ Transn Auth Ser A-1 | 4.00% | 11/1/2013 | A- | 4,000 | 4,179,840 | |||||||||||||||
| Southeastern PA Transn Auth Cap Grant Rcpts | 5.00% | 6/1/2017 | A+ | 1,225 | 1,406,435 | |||||||||||||||
| Southeastern PA Transn Auth Cap Grant Rcpts | 5.00% | 6/1/2018 | A+ | 1,280 | 1,476,736 | |||||||||||||||
| Triborough Bridge & Tunnel Auth (NPFGC) | 5.50% | 11/15/2021 | Aa3 | 6,345 | 7,769,072 | |||||||||||||||
| Tulsa OK Arpts Impt Tr Rev Amer Airlines Corp | 7.35% | 12/1/2011 | B- | 8,100 | 8,102,916 | |||||||||||||||
| TX St Transn Commn 1st Tier | 5.00% | 4/1/2013 | AAA | 210 | 224,391 | |||||||||||||||
| WI St Transn Rev Ser B (AMBAC) | 5.00% | 7/1/2013 | AA+ | 75 | 80,972 | |||||||||||||||
|
| |||||||||||||||||||
| Total | 108,259,123 | |||||||||||||||||||
|
| |||||||||||||||||||
| Utilities 14.58% | ||||||||||||||||||||
| Austin TX Elec Util Sys Rev (AGM) | 5.00% | 5/15/2014 | AA+ | 1,875 | 2,078,081 | |||||||||||||||
| AZ Salt River Pj Agric Impt & Pwr Dist Ser B | 4.00% | 1/1/2015 | Aa1 | 2,550 | 2,809,488 | |||||||||||||||
| Butler Cnty OH Swr Sys Rev (AGM) | 5.00% | 12/1/2013 | Aa3 | 1,225 | 1,315,858 | |||||||||||||||
| Cent Plains NE Enrg Pj No 1 Ser A | 5.00% | 12/1/2014 | Ba3 | 3,050 | 3,204,056 | |||||||||||||||
| Chelan Cnty WA Pub Util Dist No 1 Sys Nts Sub Ser A | 5.00% | 7/1/2013 | AA | 1,000 | 1,077,080 | |||||||||||||||
| Chicago IL Wtr Rev 2nd Lien (AGM) | 5.00% | 11/1/2013 | AA+ | 2,500 | 2,683,700 | |||||||||||||||
| Cowlitz Cnty WA Pub Util Dist No 1 Dist Sys (NPFGC)(FGIC) | 5.00% | 9/1/2013 | A1 | 2,225 | 2,381,596 | |||||||||||||||
| Enrg Northwest WA Elec Rev Pj 1 Ser A (NPFGC) | 5.25% | 7/1/2013 | Aa1 | 180 | 195,079 | |||||||||||||||
| FL St Citizens Ppty Ins Corp Sr Secd High Risk Acct A-1 | 5.50% | 6/1/2014 | A+ | 5,000 | 5,423,200 | |||||||||||||||
| FL St Dept of Envr Protn FL Forever Ser A (NPFGC) | 5.00% | 7/1/2014 | AA- | 5,180 | 5,680,699 | |||||||||||||||
| GA Muni Elec Auth Pwr Rev Unref Bal 2005 Ser Y (AMBAC) | 6.40% | 1/1/2013 | A+ | 50 | 51,703 | |||||||||||||||
| Hillsborough Cnty FL Indl Dev Auth Tampa Elec Co Pj | 5.10% | 10/1/2013 | BBB+ | 5,000 | 5,166,500 | |||||||||||||||
| Hillsborough Cnty FL Indl Dev Auth Tampa Elec Ser B Rmkt | 5.15% | 9/1/2025 | BBB+ | 2,100 | 2,235,660 | |||||||||||||||
See Notes to Financial Statements.
39
Schedule of Investments (continued)
SHORT DURATION TAX FREE FUND September 30, 2011
| Investments | Interest Rate | Maturity Date | Credit Rating: S&P or Moody’s(a) | Principal Amount (000) | Fair Value | |||||||||||||||
| Utilities (continued) | ||||||||||||||||||||
| IL Fin Auth Gas Supply Peoples Gas Lt & Coke | 2.125% | 3/1/2030 | A1 | $ | 12,750 | $ | 12,815,917 | |||||||||||||
| IL Fin Auth Gas Supply Peoples Gas Lt & Coke Ser B | 2.625% | 2/1/2033 | A1 | 4,000 | 4,116,840 | |||||||||||||||
| IL Muni Elec Agy Pwr Supply Ser C (NPFGC)(FGIC) | 5.00% | 2/1/2014 | A+ | 1,000 | 1,077,660 | |||||||||||||||
| IN Fin Auth Pwr & Lt Co Ser C | 4.90% | 1/1/2016 | A3 | 10,000 | 11,001,500 | |||||||||||||||
| Indianapolis IN Util Dist Ser B (NPFGC)(FGIC) | 4.00% | 6/1/2014 | AA- | 3,535 | 3,764,174 | |||||||||||||||
| Intermountain Pwr Agy UT Ser A | 5.50% | 7/1/2014 | A+ | 3,900 | 4,208,061 | |||||||||||||||
| Jacksonville FL Elec Sys Rev Ser C | 5.00% | 10/1/2013 | Aa3 | 3,750 | 4,058,587 | |||||||||||||||
| Jacksonville FL St. John’s River Pwr Pk Sys Issue 2-17th Ser | 5.25% | 10/1/2013 | Aa2 | 50 | 50,206 | |||||||||||||||
| Kissimmee FL Util Auth Elec Sys (AGM) | 5.25% | 10/1/2014 | Aa3 | 1,000 | 1,116,050 | |||||||||||||||
| Las Vegas Vly NV Wtr Dist Adj Wtr Impt Ser C | 2.50% | # | 6/1/2036 | AA+ | 1,000 | 1,000,000 | ||||||||||||||
| Long Island NY Pwr Auth Ser 2010A | 5.00% | 5/1/2014 | A- | 2,500 | 2,745,925 | |||||||||||||||
| Long Island NY Pwr Auth Ser A | 4.00% | 5/1/2018 | A- | 3,940 | 4,336,246 | |||||||||||||||
| Los Alamos Cnty NM Inc Util Ser A (AGM) | 5.00% | 7/1/2014 | AA+ | 4,410 | 4,673,056 | |||||||||||||||
| Louisville & Jefferson Cnty KY Metro Swr Dist Ser A | 5.00% | 5/15/2013 | AA- | 4,925 | 5,274,379 | |||||||||||||||
| Louisville & Jefferson Cnty KY Metro Swr Dist Ser B | 4.00% | 5/15/2013 | AA- | 5,000 | 5,274,650 | |||||||||||||||
| Louisville & Jefferson Cnty KY Metro Swr Dist Ser B | 5.00% | 5/15/2014 | AA- | 9,505 | 10,490,193 | |||||||||||||||
| Maricopa Cnty AZ Pollutn Ctrl Corp Pub Svc Co Ser B | 5.50% | 5/1/2029 | BBB | 2,500 | 2,564,450 | |||||||||||||||
| MI Muni Bd Auth Rev Clean Wtr Rev Fd | 5.50% | 10/1/2013 | AAA | 340 | 372,960 | |||||||||||||||
| Morehouse Parish LA Pollutn Ctrl Intl Paper Co Pj Ser A | 5.25% | 11/15/2013 | BBB | 2,855 | 3,053,166 | |||||||||||||||
| Muni Elec Auth GA Pj One Sub Ser A | 5.00% | 1/1/2021 | A | 7,000 | 8,085,420 | |||||||||||||||
| Muni Elec Auth GA Pj One Sub Ser A | 5.00% | 1/1/2018 | A | 3,145 | 3,623,952 | |||||||||||||||
| Navajo Cnty AZ Pollutn Ctrl Corp Ser C | 5.50% | 6/1/2034 | BBB | 5,000 | 5,454,350 | |||||||||||||||
| NC Eastern Muni Pwr Agy Ser B | 5.00% | 1/1/2015 | A- | 1,000 | 1,119,670 | |||||||||||||||
| NC Eastern Muni Pwr Agy Ser F | 5.375% | 1/1/2013 | A- | 50 | 52,603 | |||||||||||||||
| NC Eastern Muni Pwr Agy Ser F | 5.50% | 1/1/2014 | A- | 5,000 | 5,499,200 | |||||||||||||||
| NY St Enrg Resh & Dev Auth Pollutn Ctrl Rev Ser C | 2.25% | 12/1/2015 | BBB+ | 10,000 | 10,007,800 | |||||||||||||||
| OH St Air Quality Dev Auth Columbus Sthn Pwr Ser A | 3.875% | 12/1/2038 | A3 | 3,500 | 3,671,605 | |||||||||||||||
See Notes to Financial Statements.
40
Schedule of Investments (continued)
SHORT DURATION TAX FREE FUND September 30, 2011
| Investments | Interest Rate | Maturity Date | Credit Rating: S&P or Moody’s(a) | Principal Amount (000) | Fair Value | |||||||||||||||
| Utilities (continued) | ||||||||||||||||||||
| OH St Air Quality Dev Auth First Enrg Nuclear Ser A | 5.75% | 6/1/2033 | BBB- | $ | 1,500 | $ | 1,717,200 | |||||||||||||
| OH St Air Quality Dev Auth Pollutn Ctrl First Enrg Ser D | 4.75% | 8/1/2029 | Baa2 | 5,000 | 5,142,600 | |||||||||||||||
| OH St Air Quality Dev Auth Pwr Co Ser A | 3.25% | 6/1/2041 | Baa1 | 4,000 | 4,166,800 | |||||||||||||||
| PA Econ Dev Fing Auth Philadelphia BioSolids Fac | 5.00% | 1/1/2014 | Baa3 | 1,000 | 1,017,720 | |||||||||||||||
| Peninsula VA Ports Auth Dominion Term Assoc Pj | 5.00% | 10/1/2033 | A- | 5,000 | 5,000,000 | |||||||||||||||
| Philadelphia PA Gas Wrks Rev 8th 1998 Gen Ordinance Ser A | 5.00% | 8/1/2014 | BBB+ | 3,000 | 3,286,410 | |||||||||||||||
| Pub Pwr Generation Agy NE Whelan Enrg Ctr Unit 2-A | 5.00% | 1/1/2013 | A2 | 2,260 | 2,365,248 | |||||||||||||||
| Riverside CA Swr Rev | 4.00% | 8/1/2013 | AA | 1,750 | 1,854,703 | |||||||||||||||
| Rockport IN Pollutn Ctrl Rev MI Pwr Co Pj Ser A | 6.25% | 6/1/2025 | BBB | 1,000 | 1,106,990 | |||||||||||||||
| SA Enrg Acq Pub Fac Corp TX Gas Supply Rev | 5.00% | 8/1/2012 | A | 10,000 | 10,288,100 | |||||||||||||||
| Sabine River Auth TX Pollutn Ctrl TXU Elec Co Pj Ser A | 5.50% | 5/1/2022 | CC | 4,120 | 4,111,224 | |||||||||||||||
| SC St Pub Svc Auth Santee Cooper Ser B | 4.00% | 12/1/2019 | AA- | 7,500 | 8,502,675 | |||||||||||||||
| Seattle WA Muni Lt & Pwr Rev | 5.00% | 4/1/2013 | Aa2 | 1,000 | 1,068,840 | |||||||||||||||
| Sthn CA Pub Pwr Auth Pj No 1 Ser A | 5.00% | 11/1/2012 | Baa1 | 1,000 | 1,032,190 | |||||||||||||||
| Sthn CA Pub Pwr Auth Rev Windy Point/Windy Flat Pj-1 | 5.00% | 7/1/2022 | AA- | 7,225 | 8,280,428 | |||||||||||||||
| Sthn MN Muni Pwr Agy Ser A (AMBAC) | 5.25% | 1/1/2015 | A+ | 5,000 | 5,660,100 | |||||||||||||||
| TN Enrg Acq Corp Ser A | 5.00% | 9/1/2013 | Ba3 | 3,615 | 3,784,146 | |||||||||||||||
| TN Enrg Acq Corp Ser A | 5.25% | 9/1/2018 | Ba3 | 5,755 | 5,851,281 | |||||||||||||||
| TN Enrg Acq Corp Ser A | 5.25% | 9/1/2020 | Ba3 | 10,445 | 10,496,076 | |||||||||||||||
| Truckee Meadows NV Wtr Auth | 5.00% | 7/1/2014 | Aa2 | 10,420 | 11,436,158 | |||||||||||||||
| Truckee Meadows NV Wtr Auth | 5.00% | 7/1/2015 | Aa2 | 5,000 | 5,626,100 | |||||||||||||||
| Vernon CA Elec Sys Rev Ser A | 3.75% | 8/1/2013 | A- | 8,800 | 9,083,624 | |||||||||||||||
| Vernon CA Elec Sys Rev Ser A | 5.25% | 8/1/2014 | A- | 1,000 | 1,066,560 | |||||||||||||||
| WI Pub Pwr Inc Sys Ser A (NPFGC) | 5.25% | 7/1/2013 | A1 | 4,000 | 4,308,880 | |||||||||||||||
| York Cnty VA Econ Dev Auth Elec & Pwr Ser A | 4.05% | 5/1/2033 | A- | 2,000 | 2,120,380 | |||||||||||||||
|
| |||||||||||||||||||
| Total | 272,185,753 | |||||||||||||||||||
|
| |||||||||||||||||||
| Total Municipal Bonds (cost $1,366,533,722) | 1,397,409,197 | |||||||||||||||||||
|
| |||||||||||||||||||
See Notes to Financial Statements.
41
Schedule of Investments (continued)
SHORT DURATION TAX FREE FUND September 30, 2011
| Investments | Interest Rate# | Interest Rate Reset Date(e) | Final Maturity Date | Credit Rating: S&P or Moody’s(a) | Principal Amount (000) | Fair Value | ||||||||||||||||||
| SHORT-TERM INVESTMENTS 23.35% | ||||||||||||||||||||||||
| Variable Rate Demand Notes | ||||||||||||||||||||||||
| Corporate-Backed 0.74% | ||||||||||||||||||||||||
| Metro Govt Nashville & Davidson Cnty TN Indl Dev Brd Ser A | 1.32% | 10/6/2011 | 1/1/2014 | NR | $ | 1,480 | $ | 1,480,000 | ||||||||||||||||
| MS Business Fin Corp Grand Alliance LLC Pj | 1.02% | 10/6/2011 | 1/1/2033 | BBB- | 12,275 | 12,275,000 | ||||||||||||||||||
|
| |||||||||||||||||||||||
| Total | 13,755,000 | |||||||||||||||||||||||
|
| |||||||||||||||||||||||
| Education 3.01% | ||||||||||||||||||||||||
| Baltimore Cnty MD Econ Dev Rev Garrison Forest Sch Inc Pj | 0.26% | 10/3/2011 | 10/1/2031 | A3 | 1,000 | 1,000,000 | ||||||||||||||||||
| Birmingham AL Edl Bldg Auth Miles College Pj Ser A | 1.22% | 10/6/2011 | 2/1/2029 | Ba2 | 1,680 | 1,680,000 | ||||||||||||||||||
| CA Infrastr & Econ Dev Bk Westside Waldorf Sch Pj | 0.91% | 10/6/2011 | 10/1/2028 | BBB- | (d) | 3,000 | 3,000,000 | |||||||||||||||||
| Clark Cnty NV Econ Dev Rev Bishop Gorman High Sch Pj | 3.96% | 10/6/2011 | 2/1/2036 | Ba3 | 9,320 | 9,320,000 | ||||||||||||||||||
| Metro Govt Nashville & Davidson Cnty TN Hlth & Edl Facs Brd Fisk Univ Pj | 1.12% | 10/6/2011 | 12/1/2020 | Ba2 | 4,735 | 4,735,000 | ||||||||||||||||||
| NE Edl Fin Auth Rev Creighton Univ Pj Ser B | 0.22% | 10/3/2011 | 12/15/2012 | A3 | 6,840 | 6,840,000 | ||||||||||||||||||
| NH Hlth & Edl Facs Auth Univ Sys NH Ser B | 0.20% | 10/3/2011 | 7/1/2033 | Aa3 | 24,220 | 24,220,000 | ||||||||||||||||||
| OH St Higher Edl Fac Rev Univ Dayton Pj Ser B | 1.41% | 10/6/2011 | 7/1/2016 | A | 5,000 | 5,000,050 | ||||||||||||||||||
| Wilmore KY Indl Bldg Rev Asbury Theological Pj | 1.02% | 10/6/2011 | 8/1/2031 | Ba2 | 485 | 485,000 | ||||||||||||||||||
|
| |||||||||||||||||||||||
| Total | 56,280,050 | |||||||||||||||||||||||
|
| |||||||||||||||||||||||
| General Obligation 1.45% | ||||||||||||||||||||||||
| IL St Ser B | 3.25% | 10/5/2011 | 10/1/2033 | A+ | 17,900 | 17,900,000 | ||||||||||||||||||
| New York City NY Sub Ser H-2 | 1.15% | 10/3/2011 | 1/1/2036 | A | 9,250 | 9,250,000 | ||||||||||||||||||
|
| |||||||||||||||||||||||
| Total | 27,150,000 | |||||||||||||||||||||||
|
| |||||||||||||||||||||||
| Health Care 5.39% | ||||||||||||||||||||||||
| Albany-Dougherty Cnty GA Hosp Auth Ser B | 0.92% | 10/3/2011 | 9/1/2032 | BBB- | 27,360 | 27,360,000 | ||||||||||||||||||
See Notes to Financial Statements.
42
Schedule of Investments (continued)
SHORT DURATION TAX FREE FUND September 30, 2011
| Investments | Interest Rate# | Interest Rate Reset Date(e) | Final Maturity Date | Credit Rating: S&P or Moody’s(a) | Principal Amount (000) | Fair Value | ||||||||||||||||||
| Health Care (continued) | ||||||||||||||||||||||||
| Allegheny Cnty PA Indl Dev Auth Longwood Oakmont Ser A | 4.59% | 10/3/2011 | 7/1/2038 | BB | $ | 3,625 | $ | 3,625,000 | ||||||||||||||||
| Gulf Shores AL Med Clinic Brd Colonial Pinnacle Mob Pj | 1.02% | 10/6/2011 | 7/1/2034 | Ba2 | 4,200 | 4,200,000 | ||||||||||||||||||
| Marion Cnty OH Hlthcare Fac Church Homes Inc Pj | 4.50% | 10/5/2011 | 9/1/2027 | BB | 16,265 | 16,265,000 | ||||||||||||||||||
| Oakbend Med Ctr TX Hosp Rev | 0.97% | 10/3/2011 | 12/1/2038 | Ba2 | 17,535 | 17,535,000 | ||||||||||||||||||
| Pinellas Cnty FL Hlth Facs Auth Hosp Facs Bayfront Hosp Ser A | 0.26% | 10/3/2011 | 7/1/2036 | A3 | 17,575 | 17,575,000 | ||||||||||||||||||
| WI St Hlth & Edl Facs Auth Oakwood Vlg | 0.12% | 10/6/2011 | 3/1/2035 | A1 | 12,540 | 12,540,000 | ||||||||||||||||||
| WI St Hlth & Edl Facs Auth Pooled Ln Fing Pg Ser E | 2.00% | 10/5/2011 | 2/1/2022 | A3 | 1,455 | 1,455,000 | ||||||||||||||||||
|
| |||||||||||||||||||||||
| Total | 100,555,000 | |||||||||||||||||||||||
|
| |||||||||||||||||||||||
| Housing 0.17% | ||||||||||||||||||||||||
| Northport AL Multi Fam Hsg Rev Northbrook Ser I-A | 1.22% | 10/6/2011 | 7/1/2018 | BBB- | 3,140 | 3,140,000 | ||||||||||||||||||
|
| |||||||||||||||||||||||
| Lease Obligations 5.40% | ||||||||||||||||||||||||
| Blount Cnty TN Pub Bldg Auth Loc Govt Pub Impt A-4-A | 0.77% | 10/3/2011 | 6/1/2032 | Aa1 | 29,200 | 29,200,000 | ||||||||||||||||||
| Blount Cnty TN Pub Bldg Auth Loc Govt Pub Impt D-3-A GTD | 1.02% | 10/3/2011 | 6/1/2034 | AA+ | 34,010 | 34,010,000 | ||||||||||||||||||
| Sevier Cnty TN Pub Bldg Auth Loc Govt Pub Impt VI-K-1 | 1.02% | 10/3/2011 | 6/1/2034 | AA+ | 37,525 | 37,525,000 | ||||||||||||||||||
|
| |||||||||||||||||||||||
| Total | 100,735,000 | |||||||||||||||||||||||
|
| |||||||||||||||||||||||
| Other Revenue 2.92% | ||||||||||||||||||||||||
| CA Statewide Cmntys Dev Auth YMCA East Bay Pj | 5.40% | 10/5/2011 | 6/1/2027 | Ba3 | 7,020 | 7,020,000 | ||||||||||||||||||
| LA Pub Facs Auth Rev Spicy Girls Avery Island | 1.02% | 10/6/2011 | 2/1/2033 | Ba2 | 7,140 | 7,140,000 | ||||||||||||||||||
| MS Business Fin Corp Vly Svcs Inc Ser A | 1.02% | 10/6/2011 | 7/1/2023 | Ba2 | 9,745 | 9,745,000 | ||||||||||||||||||
| New York City NY Indl Dev Agy Amer Society Technion Pj | 5.40% | 10/5/2011 | 10/1/2033 | Baa1 | 11,150 | 11,150,000 | ||||||||||||||||||
| New York City NY Sub Ser A-5 | 0.22% | 10/3/2011 | 8/1/2015 | A1 | 10,015 | 10,015,000 | ||||||||||||||||||
See Notes to Financial Statements.
43
Schedule of Investments (concluded)
SHORT DURATION TAX FREE FUND September 30, 2011
| Investments | Interest Rate# | Interest Rate Reset Date(e) | Final Maturity Date | Credit Rating: S&P or Moody’s(a) | Principal Amount (000) | Fair Value | ||||||||||||||||||
| Other Revenue (continued) | ||||||||||||||||||||||||
| WI St Hlth & Edl Facs Auth Maranatha Baptist | 2.00% | 10/6/2011 | 8/1/2026 | BBB | $ | 9,400 | $ | 9,400,000 | ||||||||||||||||
|
| |||||||||||||||||||||||
| Total | 54,470,000 | |||||||||||||||||||||||
|
| |||||||||||||||||||||||
| Tax Revenue 0.80% | ||||||||||||||||||||||||
| New York City NY Transnl Fin Auth Future Tax Secd Sub Ser B-3 | 0.14% | 10/5/2011 | 11/1/2028 | AAA | 15,000 | 15,000,000 | ||||||||||||||||||
|
| |||||||||||||||||||||||
| Transportation 1.23% | ||||||||||||||||||||||||
| Orlando & Orange Cnty FL Expwy Auth Ser C-3 (AGM) | 1.00% | 10/6/2011 | 7/1/2025 | AA+ | 12,000 | 12,000,000 | ||||||||||||||||||
| Triborough Bridge & Tunnel Auth Sub Ser B-2 | 1.50% | 10/6/2011 | 1/1/2032 | Aa2 | 11,000 | 11,000,000 | ||||||||||||||||||
|
| |||||||||||||||||||||||
| Total | 23,000,000 | |||||||||||||||||||||||
|
| |||||||||||||||||||||||
| Utilities 2.24% | ||||||||||||||||||||||||
| FL St Muni Pwr Agy All Requirements Pwr Ser E | 0.24% | 10/3/2011 | 10/1/2030 | Aa2 | 5,190 | 5,190,000 | ||||||||||||||||||
| Las Vegas Vly NV Wtr Dist Wtr Impt Ser B | 2.50% | 10/3/2011 | 6/1/2036 | AA+ | 29,105 | 29,105,000 | ||||||||||||||||||
| New York City NY Muni Wtr Fin Auth Ser F-1 | 0.50% | 10/3/2011 | 6/15/2033 | AAA | 7,500 | 7,500,000 | ||||||||||||||||||
|
| |||||||||||||||||||||||
| Total | 41,795,000 | |||||||||||||||||||||||
|
| |||||||||||||||||||||||
| Total Short-Term Investments (cost $435,880,000) | 435,880,050 | |||||||||||||||||||||||
|
| |||||||||||||||||||||||
| Total Investments in Securities 98.23% (cost $1,802,413,722) | 1,833,289,247 | |||||||||||||||||||||||
|
| |||||||||||||||||||||||
| Cash and Other Assets in Excess of Liabilities 1.77% | 32,947,417 | |||||||||||||||||||||||
|
| |||||||||||||||||||||||
| Net Assets 100.00% | $ | 1,866,236,664 | ||||||||||||||||||||||
|
| |||||||||||||||||||||||
See Notes to Financial Statements.
44
Schedule of Investments
INTERMEDIATE TAX FREE FUND September 30, 2011
| Investments | Interest Rate | Maturity Date | Credit Rating: S&P or Moody’s(a) | Principal Amount (000) | Fair Value | |||||||||||||||
| MUNICIPAL BONDS 97.57% | ||||||||||||||||||||
| Corporate-Backed 7.04% | ||||||||||||||||||||
| AL St Indl Dev Auth Solid Pine City Fiber Co Rmkt AMT | 6.45% | 12/1/2023 | B2 | $ | 4,300 | $ | 3,796,513 | |||||||||||||
| Allegheny Cnty PA Indl Dev Auth Envr Impt | 5.50% | 11/1/2016 | BB | 1,500 | 1,570,755 | |||||||||||||||
| Allegheny Cnty PA Indl Dev Auth Envr Impt | 6.50% | 5/1/2017 | BB | 3,315 | 3,579,139 | |||||||||||||||
| Allegheny Cnty PA Indl Dev Auth Envr Impt | 6.75% | 11/1/2024 | BB | 3,800 | 4,055,094 | |||||||||||||||
| Alliance Arpt Auth Inc TX Spl Facs FedEx Corp Pj AMT | 4.85% | 4/1/2021 | BBB | 1,000 | 1,044,210 | |||||||||||||||
| Babylon NY Indl Dev Agy Res Rev Covanta Babylon Ser A | 5.00% | 1/1/2019 | AA | 4,000 | 4,423,640 | |||||||||||||||
| Chicago IL O’Hare Intl Arpt Delta Airlines Inc Term | 6.45% | 5/1/2018 | NR | 1,790 | 1,789,821 | |||||||||||||||
| Clayton Cnty GA Dev Auth Delta Airlines Ser B AMT | 9.00% | 6/1/2035 | CCC+ | 3,300 | 3,563,010 | |||||||||||||||
| Dallas-Fort Worth TX Intl Arpt Facs Impt Corp Amer Airlines Inc | 6.00% | 11/1/2014 | CCC+ | 1,900 | 1,789,306 | |||||||||||||||
| Dallas-Fort Worth TX Intl Arpt Facs Impt Corp Sub Ser 2 Rmkt AMT | 9.00% | 5/1/2029 | CCC+ | 7,980 | 7,801,966 | |||||||||||||||
| DeSoto Parish LA Envr Fac Intl Paper Co Ser A AMT | 4.75% | 3/1/2019 | BBB | 6,480 | 6,534,432 | |||||||||||||||
| Effingham Cnty GA Dev Auth Solid Wst Disp Fort James Pj AMT | 5.625% | 7/1/2018 | BBB- | 8,000 | 8,001,280 | |||||||||||||||
| Farmington NM Pollutn Ctrl Rev Pub Svc NM San Juan Ser B | 4.75% | 6/1/2040 | BBB- | 10,000 | 10,113,100 | |||||||||||||||
| FL St Citizens Ppty Ins Corp Sr Secd High Risk Acct A-1 | 5.25% | 6/1/2017 | A+ | 7,000 | 7,729,050 | |||||||||||||||
| FL St Citizens Ppty Ins Corp Sr Secd High Risk Acct A-1 | 6.00% | 6/1/2016 | A+ | 12,600 | 14,183,820 | |||||||||||||||
| IL Fin Auth Rev Navistar Intl Recovery Zone | 6.50% | 10/15/2040 | BB- | 3,600 | 3,744,324 | |||||||||||||||
| IN St Fin Auth Impt US Steel Corp | 6.00% | 12/1/2026 | BB | 1,000 | 1,017,450 | |||||||||||||||
| Intl Falls MN Pollutn Ctrl Boise Cascade Corp Pj | 5.65% | 12/1/2022 | B- | 1,000 | 867,860 | |||||||||||||||
| Jay ME Solid Wst Disp Rev Intl Paper Co Pj Ser A AMT | 4.90% | 11/1/2017 | BBB | 2,890 | 2,974,532 | |||||||||||||||
| LA Loc Govt Envr Facs & Cmnty Dev Auth Westlake Chem Corp Ser A Rmkt | 6.50% | 8/1/2029 | BBB- | 6,605 | 6,966,690 | |||||||||||||||
See Notes to Financial Statements.
45
Schedule of Investments (continued)
INTERMEDIATE TAX FREE FUND September 30, 2011
| Investments | Interest Rate | Maturity Date | Credit Rating: S&P or Moody’s(a) | Principal Amount (000) | Fair Value | |||||||||||||||
| Corporate-Backed (continued) | ||||||||||||||||||||
| LA St Citizens Ppty Ins Corp Ser B (AMBAC) | 5.00% | 6/1/2021 | A- | $ | 3,500 | $ | 3,644,130 | |||||||||||||
| MA St Port Auth Spl Delta Airlines Inc Pj Ser A AMT (AMBAC) | 5.50% | 1/1/2022 | NR | 1,500 | 1,268,955 | |||||||||||||||
| MD St Econ Dev Corp Sr Lien Pj Chesapeake Bay Ser A | 5.00% | 12/1/2016 | NR | 3,000 | 2,532,780 | |||||||||||||||
| MD St Indl Dev Fing Auth Synagro Baltimore Ser A AMT | 5.25% | 12/1/2013 | BBB+ | (d) | 750 | 781,425 | ||||||||||||||
| MD St Indl Dev Fing Auth Synagro Baltimore Ser A AMT | 5.375% | 12/1/2014 | BBB+ | (d) | 1,000 | 1,048,800 | ||||||||||||||
| Mission TX Econ Dev Corp Wst Mgmt Inc Pj AMT | 6.00% | 8/1/2020 | BBB | 2,000 | 2,156,620 | |||||||||||||||
| New York City NY Cap Res Corp Arthur Mgmt Corp Pj | 7.00% | 8/1/2025 | NR | 5,000 | 5,098,050 | |||||||||||||||
| New York City NY Indl Dev Agy JetBlue Airways Corp Pj AMT | 5.00% | 5/15/2020 | B- | 3,000 | 2,706,570 | |||||||||||||||
| Nez Perce Cnty ID Pollutn Ctrl Potlatch Corp Pj | 6.00% | 10/1/2024 | BB | 1,000 | 1,000,140 | |||||||||||||||
| NH St Business Fin Auth UTD Illuminating Ser A AMT | 4.50% | 7/1/2027 | BBB | 5,000 | 5,299,550 | |||||||||||||||
| NJ Econ Dev Auth Spl Fac Continental Airlines Inc Pj AMT | 6.25% | 9/15/2019 | B | 6,045 | 5,959,403 | |||||||||||||||
| NJ Econ Dev Auth Spl Fac Continental Airlines Inc Pj AMT | 6.25% | 9/15/2029 | B | 3,000 | 2,845,140 | |||||||||||||||
| OR St Econ Dev Rev GA Pacific Corp Ser CLVII AMT | 6.35% | 8/1/2025 | BBB- | 4,940 | 4,940,543 | |||||||||||||||
| Port of Corpus Christi Auth of Nueces Cnty TX Union Pacific | 5.65% | 12/1/2022 | NR | 2,400 | 2,436,936 | |||||||||||||||
| Seminole Indian Tribe FL Ser 2010A Gaming Div† | 5.125% | �� | 10/1/2017 | BBB- | 2,450 | 2,473,055 | ||||||||||||||
| Seneca NY Nation Indians Cap Impts Auth Ser A† | 5.25% | 12/1/2016 | BB | 250 | 235,950 | |||||||||||||||
| Tulsa OK Arpts Impt Tr Rev Ser A Rmkt AMT | 7.75% | 6/1/2035 | Caa2 | 2,500 | 2,562,550 | |||||||||||||||
| Valdez AK Marine Terminal Rev BP Pipelines Pj Ser B | 5.00% | 1/1/2021 | A | 2,000 | 2,279,020 | |||||||||||||||
| Valdez AK Marine Terminal Rev BP Pipelines Pj Ser C | 5.00% | 1/1/2021 | A | 10,000 | 11,360,800 | |||||||||||||||
| Virgin Islands Pub Fin Auth Sr Secd Hovensa Refinery AMT | 4.70% | 7/1/2022 | Ba2 | 1,000 | 841,680 | |||||||||||||||
| West Pace Cooperative Dist AL Rev | 9.125% | 5/1/2039 | NR | 5,000 | 4,604,100 | |||||||||||||||
See Notes to Financial Statements.
46
Schedule of Investments (continued)
INTERMEDIATE TAX FREE FUND September 30, 2011
| Investments | Interest Rate | Maturity Date | Credit Rating: S&P or Moody’s(a) | Principal Amount (000) | Fair Value | |||||||||||||||
| Corporate-Backed (continued) | ||||||||||||||||||||
| Whiting IN Envr Facs BP Prods North Amer Rmkt | 5.25% | 1/1/2021 | A | $ | 6,000 | $ | 6,955,980 | |||||||||||||
|
| |||||||||||||||||||
| Total | 168,578,169 | |||||||||||||||||||
|
| |||||||||||||||||||
| Education 5.52% | ||||||||||||||||||||
| Adams Cnty PA Indl Dev Auth Gettysburg College | 5.00% | 8/15/2020 | A | 1,760 | 1,995,418 | |||||||||||||||
| Allegheny Cnty PA Higher Ed Bldg Auth Duquesne Univ | 5.00% | 3/1/2015 | A2 | 1,100 | 1,221,528 | |||||||||||||||
| Allegheny Cnty PA Higher Ed Bldg Auth Duquesne Univ Ser A (NPFGC)(FGIC) | 5.00% | 3/1/2013 | A- | 100 | 105,107 | |||||||||||||||
| AZ St Univ Brd Regents COP (NPFGC) | 5.00% | 7/1/2022 | AA- | 3,465 | 3,779,795 | |||||||||||||||
| AZ St Univ Enrg Mgmt LLC Tempe Campus II | 5.00% | 7/1/2019 | AA- | 2,090 | 2,318,751 | |||||||||||||||
| Bulloch Cnty GA Dev Auth GA Sthn Univ Hsg Fndtn Four (AG) | 5.25% | 7/1/2018 | Aa3 | 500 | 587,140 | |||||||||||||||
| CA Muni Fin Auth Rev Biola Univ | 5.625% | 10/1/2023 | Baa1 | 1,015 | 1,090,445 | |||||||||||||||
| CA St Univ Rev Systemwide Ser A | 5.00% | 11/1/2024 | Aa2 | 15,000 | 16,922,850 | |||||||||||||||
| CA Statewide Cmntys Dev Auth Thomas Jefferson Sch Law Ser A† | 7.25% | 10/1/2032 | BB+ | 1,000 | 1,024,140 | |||||||||||||||
| CT St Hlth & Edl Facs Auth Fairfield Univ Facs Ser M | 5.00% | 7/1/2016 | A- | 1,000 | 1,115,770 | |||||||||||||||
| CT St Hlth & Edl Facs Auth Quinnipiac Univ Ser I (NPFGC) | 5.00% | 7/1/2019 | A- | 500 | 551,785 | |||||||||||||||
| Cuyahoga OH Cmnty College Dist Ser C | 5.00% | 8/1/2020 | Aa2 | 1,800 | 2,081,970 | |||||||||||||||
| Dist of Columbia Univ Rev Georgetown Univ | 5.00% | 4/1/2030 | A- | 5,000 | 5,596,800 | |||||||||||||||
| Harris Cnty TX Cultural Ed Facs Fin Corp Baylor College Medicine Ser D | 5.00% | 11/15/2019 | A- | 1,910 | 1,985,159 | |||||||||||||||
| IL Fin Auth Rev IL Inst Tech | 6.50% | 2/1/2023 | Baa3 | 2,000 | 1,911,920 | |||||||||||||||
| IL Fin Auth Rev IL Inst Tech Ser A | 5.00% | 4/1/2016 | Baa3 | 2,500 | 2,361,550 | |||||||||||||||
| IL Fin Auth Rev IL Inst Tech Ser A | 5.00% | 4/1/2020 | Baa3 | 1,000 | 877,690 | |||||||||||||||
| IL Fin Auth Rev Univ of Chicago Ser B | 5.50% | 7/1/2021 | Aa1 | 5,000 | 5,887,450 | |||||||||||||||
| MA St Hlth & Edl Facs Auth Harvard Univ Ser A | 5.25% | 11/15/2019 | AAA | 2,850 | 3,484,324 | |||||||||||||||
| Marietta GA Dev Auth Rev Univ Facs Life Univ Inc Pj | 6.25% | 6/15/2020 | Ba3 | 2,700 | 2,650,131 | |||||||||||||||
| MD St Hlth & Higher Edl Facs Auth Washington Christian Academy(f) | 5.25% | 7/1/2018 | NR | 250 | 100,000 | |||||||||||||||
See Notes to Financial Statements.
47
Schedule of Investments (continued)
INTERMEDIATE TAX FREE FUND September 30, 2011
| Investments | Interest Rate | Maturity Date | Credit Rating: S&P or Moody’s(a) | Principal Amount (000) | Fair Value | |||||||||||||||
| Education (continued) | ||||||||||||||||||||
| MI Higher Ed Facs Auth Rev Ltd Oblig Creative Studies | 5.00% | 12/1/2016 | Baa3 | $ | 1,235 | $ | 1,322,796 | |||||||||||||
| MI Higher Ed Facs Auth Rev Ltd Oblig Creative Studies | 5.25% | 12/1/2018 | Baa3 | 1,120 | 1,178,744 | |||||||||||||||
| Miami-Dade Cnty FL Edl Facs Auth Univ of Miami Ser A | 5.25% | 4/1/2016 | A- | 1,000 | 1,132,430 | |||||||||||||||
| MO St Hlth & Edl Facs Auth Washington Univ Ser A | 5.25% | 3/15/2018 | AAA | 625 | 768,025 | |||||||||||||||
| NC Cap Facs Fin Agy Meredith College | 5.375% | 6/1/2021 | BBB | 500 | 524,890 | |||||||||||||||
| NH Hlth & Ed Facs Auth Univ Sys Ser A | 5.50% | 7/1/2020 | Aa3 | 1,890 | 2,241,313 | |||||||||||||||
| NJ St Edl Facs Auth Higher Ed Cap Impt Fd Ser A (AGM) | 5.00% | 9/1/2019 | AA+ | 4,270 | 4,474,234 | |||||||||||||||
| NJ St Edl Facs Auth Univ Med & Dentistry Ser B | 6.50% | 12/1/2019 | Baa1 | 5,595 | 6,618,493 | |||||||||||||||
| NJ St Higher Ed Assist Auth Ser A | 5.00% | 6/1/2018 | AA | 2,805 | 3,084,378 | |||||||||||||||
| NY St Dorm Auth Rev Non St Supp Debt Montefiore Med Ctr (NPFGC)(FGIC)(FHA) | 5.00% | 2/1/2022 | BBB | 2,500 | 2,628,550 | |||||||||||||||
| NY St Dorm Auth Rev Non St Supp Debt Rochester Inst Tech | 5.00% | 7/1/2018 | A1 | 1,000 | 1,158,150 | |||||||||||||||
| OH St Higher Edl Fac Rev Case Western Reserve Ser C | 5.00% | 12/1/2015 | AA- | 3,065 | 3,469,090 | |||||||||||||||
| OH St Higher Edl Fac Rev Commn Ashland Univ Pj | 6.25% | 9/1/2024 | Ba1 | 4,115 | 4,210,509 | |||||||||||||||
| PA St Higher Edl Facs Auth Ser AG | 5.25% | 6/15/2018 | Aa2 | 1,000 | 1,197,810 | |||||||||||||||
| PA St Higher Edl Facs Auth Ser AH | 5.00% | 6/15/2019 | Aa2 | 2,455 | 2,868,987 | |||||||||||||||
| PA St Higher Edl Facs Auth Univ of PA Ser A | 5.00% | 9/1/2019 | AA+ | 3,450 | 4,169,635 | |||||||||||||||
| RI St Hlth & Edl Bldg Corp Pub Sch Fing Pg Ser A (AGM) | 5.00% | 5/15/2018 | Aa3 | 1,855 | 2,121,341 | |||||||||||||||
| TX St Univ Sys Fing Rev | 5.25% | 3/15/2019 | Aa2 | 5,000 | 5,941,300 | |||||||||||||||
| TX Tech Univ Rev Fing 12th Ser | 5.00% | 2/15/2020 | AA | 1,475 | 1,742,137 | |||||||||||||||
| Univ of MN Spl Purp Rev St Supp Stadium Debt | 5.00% | 8/1/2018 | Aa1 | 1,000 | 1,164,240 | |||||||||||||||
| Univ of North TX Rev Fing Sys | 4.00% | 4/15/2020 | Aa2 | 4,680 | 5,235,188 | |||||||||||||||
| Univ of Pittsburgh PA Cap Pj Ser B | 5.00% | 9/15/2019 | Aa1 | 2,030 | 2,446,150 | |||||||||||||||
| Univ of Toledo OH | 5.00% | 6/1/2018 | A+ | 1,145 | 1,305,907 | |||||||||||||||
| Univ of Toledo OH | 5.00% | 6/1/2019 | A+ | 2,800 | 3,184,496 | |||||||||||||||
| Univ of TX Rev Ser A | 5.25% | 8/15/2019 | AAA | 5,000 | 6,015,550 | |||||||||||||||
| Univ of Western MI Rev (AG) | 5.25% | 11/15/2020 | AA+ | 3,980 | 4,473,560 | |||||||||||||||
|
| |||||||||||||||||||
| Total | 132,327,626 | |||||||||||||||||||
|
| |||||||||||||||||||
See Notes to Financial Statements.
48
Schedule of Investments (continued)
INTERMEDIATE TAX FREE FUND September 30, 2011
| Investments | Interest Rate | Maturity Date | Credit Rating: S&P or Moody’s(a) | Principal Amount (000) | Fair Value | |||||||||||||||
| General Obligation 17.01% | ||||||||||||||||||||
| Alameda Cnty CA Oakland Unif Sch Dist Election 2006 Ser A | 6.25% | 8/1/2019 | A2 | $ | 875 | $ | 1,020,119 | |||||||||||||
| Alameda Cnty CA Oakland Unif Sch Dist Election 2006 Ser A | 6.50% | 8/1/2020 | A2 | 730 | 847,238 | |||||||||||||||
| Arkansas City KS Pub Bldg Commn South Cent Regl Med Ctr | 6.25% | 9/1/2024 | A3 | 2,335 | 2,490,581 | |||||||||||||||
| Atlantic Cnty NJ | 5.00% | 2/1/2018 | AA | 885 | 1,043,645 | |||||||||||||||
| Bexar Cnty TX Ltd Tax Pass Thru | 5.25% | 6/15/2020 | Aaa | 3,190 | 3,540,517 | |||||||||||||||
| Birmingham AL Cap Impt Ser A (AMBAC) | 5.00% | 12/1/2018 | AA | 1,000 | 1,128,970 | |||||||||||||||
| Boone McHenry & DeKalb Cntys IL Cmnty Unit Sch Dist No 100 Ser A (NPFGC) | 5.00% | 1/1/2018 | Aa3 | 2,500 | 2,698,050 | |||||||||||||||
| Broward Cnty FL Pks & Land Preservation Pj | 5.00% | 1/1/2019 | Aaa | 2,040 | 2,205,974 | |||||||||||||||
| CA St | 5.00% | 8/1/2018 | A1 | 3,000 | 3,389,040 | |||||||||||||||
| CA St | 5.25% | 9/1/2024 | A1 | 10,000 | 11,134,900 | |||||||||||||||
| CA St (AGM) | 5.00% | 8/1/2016 | AA+ | 2,000 | 2,243,200 | |||||||||||||||
| CA St Var Purp | 5.25% | 10/1/2020 | A1 | 10,000 | 11,618,600 | |||||||||||||||
| CA St Var Purp | 5.25% | 3/1/2022 | A1 | 6,320 | 7,278,112 | |||||||||||||||
| Carrollton TX Fmrs Branch Indpt Sch Dist Sch Bldg PSF GTD | 4.50% | 2/15/2019 | AAA | 500 | 561,610 | |||||||||||||||
| Chicago IL Brd of Ed Ser F | 5.00% | 12/1/2017 | Aa2 | 1,500 | 1,681,740 | |||||||||||||||
| Chicago IL Pjs Ser A (AGM) | 5.00% | 1/1/2027 | AA+ | 10,000 | 10,410,200 | |||||||||||||||
| Chicago IL Pk Dist Ser C(c) | 5.00% | 1/1/2024 | AA+ | 4,190 | 4,765,371 | |||||||||||||||
| Chicago IL Pk Dist Ser F | 5.50% | 1/1/2022 | AA+ | 1,750 | 2,062,603 | |||||||||||||||
| Clark Cnty NV Sch Dist Ltd Tax Ser A | 5.00% | 6/15/2016 | AA | 7,595 | 8,658,452 | |||||||||||||||
| Cleveland OH Var Purp Ser A (AG) | 5.25% | 12/1/2020 | AA+ | 1,415 | 1,595,115 | |||||||||||||||
| Cook Cnty IL Cmnty Consolidated Sch Dist No 64 (AGM) | 5.50% | 12/1/2016 | Aa2 | 1,580 | 1,833,606 | |||||||||||||||
| Cook Cnty IL Ser A | 5.00% | 11/15/2019 | AA | 1,405 | 1,596,192 | |||||||||||||||
| Crawford Cent Sch Dist PA Ser C | 5.00% | 2/1/2019 | Aa3 | 1,775 | 2,033,706 | |||||||||||||||
| Cumberland Vly PA Sch Dist (AGM) | 5.00% | 11/15/2019 | Aa3 | 3,000 | 3,324,630 | |||||||||||||||
| Delaware Vly PA Regl Fin Auth Ser B (AMBAC) | 5.60% | 7/1/2017 | A2 | 3,140 | 3,523,331 | |||||||||||||||
| Denver City & Cnty Sch Dist No 1 Ser C | 5.00% | 12/1/2021 | Aa2 | 10,000 | 12,209,600 | |||||||||||||||
| Detroit MI Dist St Aid | 5.00% | 11/1/2018 | AA | 3,320 | 3,762,855 | |||||||||||||||
| Dist of Columbia Ser E (BHAC) | 5.00% | 6/1/2021 | AA+ | 3,500 | 3,955,420 | |||||||||||||||
| Essex Cnty NJ Impt Auth Pj Cons GTD (AMBAC) | 5.25% | 12/15/2020 | Aa2 | 15,000 | 17,444,850 | |||||||||||||||
See Notes to Financial Statements.
49
Schedule of Investments (continued)
INTERMEDIATE TAX FREE FUND September 30, 2011
| Investments | Interest Rate | Maturity Date | Credit Rating: S&P or Moody’s(a) | Principal Amount (000) | Fair Value | |||||||||||||||
| General Obligation (continued) | ||||||||||||||||||||
| FL St Brd of Ed Cap Outlay 2008 Ser G | 5.00% | 6/1/2024 | AAA | $ | 10,000 | $ | 11,720,300 | |||||||||||||
| Fontana CA Unif Sch Dist Ser A (AGM) | 5.25% | 8/1/2025 | AA+ | 3,125 | 3,233,156 | |||||||||||||||
| Foothill-De Anza CA Cmnty College Dist Ser A (AMBAC) | 5.00% | 8/1/2017 | Aaa | 500 | 559,470 | |||||||||||||||
| Fresno CA Unif Sch Dist Ser B (NPFGC) | 5.25% | 2/1/2024 | A+ | 3,285 | 3,677,820 | |||||||||||||||
| Garland TX Indpt Sch Dist Sch Bldg Ser A | 5.00% | 2/15/2020 | Aaa | 2,000 | 2,375,620 | |||||||||||||||
| Gwinnett Cnty GA Dev Auth Pub Schs Pj COP (NPFGC) | 5.25% | 1/1/2020 | AA+ | 5,000 | 5,960,400 | |||||||||||||||
| Harris TX Road Ser B | 5.00% | 8/15/2024 | AA- | 5,000 | 5,550,300 | |||||||||||||||
| Harris TX Ser A(c) | 5.00% | 10/1/2024 | AAA | 6,950 | 8,096,402 | |||||||||||||||
| Henry Cnty GA Sch Dist | 4.50% | 8/1/2022 | AA+ | 5,000 | 5,901,300 | |||||||||||||||
| HI St Ser DG (AMBAC) | 5.00% | 7/1/2015 | AA | 40 | 46,144 | |||||||||||||||
| Hoffman Estates Vlg IL Ser A | 5.25% | 12/1/2020 | AA+ | 1,205 | 1,382,557 | |||||||||||||||
| Houston TX Pub Impt Ser A (AMBAC) | 5.00% | 3/1/2018 | AA | 2,500 | 2,832,725 | |||||||||||||||
| IL St 1st Ser (NPFGC) | 5.375% | 4/1/2016 | A+ | 4,465 | 5,069,829 | |||||||||||||||
| IL St 1st Ser (NPFGC) | 5.50% | 8/1/2016 | A+ | 2,255 | 2,586,959 | |||||||||||||||
| IL St Ser A | 5.00% | 10/1/2017 | A+ | 5,000 | 5,272,950 | |||||||||||||||
| Iron Cnty UT Sch Dist Sch Bldg UT Sch Bd Pg | 5.00% | 1/15/2021 | Aaa | 1,210 | 1,337,655 | |||||||||||||||
| Jackson MS Pub Sch Dist (AGM) | 5.00% | 10/1/2018 | Aa3 | 2,655 | 2,893,074 | |||||||||||||||
| Jersey City NJ Pub Impt Ser A (NPFGC) | 5.25% | 9/1/2015 | A2 | 100 | 109,098 | |||||||||||||||
| Kane Cnty IL Sch Dist No 131 Aurora East Side Ser C (AG) | 5.00% | 6/1/2019 | AA+ | 2,730 | 3,036,415 | |||||||||||||||
| Kane McHenry Cook & De Kalb Cntys IL Unit Sch Dist No 300 (AG)(AMBAC) | 5.00% | 1/1/2023 | AA+ | 9,520 | 10,136,610 | |||||||||||||||
| Kenai Peninsula AK Cent Kenai Peninsula Hosp Svc Area (NPFGC)(FGIC) | 5.00% | 8/1/2016 | A1 | 2,585 | 2,731,621 | |||||||||||||||
| King Cnty WA Sch Dist No 414 Lake Washington | 5.00% | 12/1/2019 | AA+ | 2,500 | 2,986,625 | |||||||||||||||
| King Cnty WA Sch Dist No 414 Lake Washington (AGM) | 5.00% | 12/1/2016 | Aaa | 4,125 | 4,861,065 | |||||||||||||||
| LA St Ser A | 5.00% | 9/1/2022 | Aa2 | 5,120 | 6,068,787 | |||||||||||||||
| Lancaster CA Sch Dist (AG) | 5.00% | 8/1/2017 | AA+ | 1,125 | 1,269,315 | |||||||||||||||
| Las Vegas-Clark Cnty NV Library Dist Medium Term | 5.00% | 1/1/2019 | AA | 3,500 | 3,998,750 | |||||||||||||||
| Los Angeles CA Unif Sch Dist Ser A (NPFGC) | 5.00% | 7/1/2018 | Aa2 | 500 | 563,380 | |||||||||||||||
| MA St Ser C (AGM) | 5.50% | 12/1/2017 | AA+ | 1,600 | 1,978,128 | |||||||||||||||
See Notes to Financial Statements.
50
Schedule of Investments (continued)
INTERMEDIATE TAX FREE FUND September 30, 2011
| Investments | Interest Rate | Maturity Date | Credit Rating: S&P or Moody’s(a) | Principal Amount (000) | Fair Value | |||||||||||||||
| General Obligation (continued) | ||||||||||||||||||||
| Maricopa Cnty AZ Unif Sch Dist No 41-Gilbert Sch Impt Ser A (NPFGC)(FGIC) | 5.00% | 7/1/2018 | Aa2 | $ | 2,400 | $ | 2,659,896 | |||||||||||||
| Memphis TN Gen Impt (NPFGC) | 5.00% | 10/1/2018 | AA | 3,295 | 3,645,127 | |||||||||||||||
| Metro Govt Nashville & Davidson Cnty TN | 5.00% | 1/1/2018 | Aa1 | 8,325 | 9,971,768 | |||||||||||||||
| Metro Govt Nashville & Davidson Cnty TN | 5.00% | 5/15/2020 | Aa1 | 5,225 | 6,034,980 | |||||||||||||||
| Miami-Dade Cnty FL Bldg Better Cmntys Pg Ser B | 5.25% | 7/1/2019 | Aa2 | 3,225 | 3,758,705 | |||||||||||||||
| Milwaukee WI Corp Purp Ser B4 | 5.00% | 5/15/2024 | Aa1 | 5,510 | 6,444,110 | |||||||||||||||
| Mobile AL Ser B | 5.00% | 2/15/2018 | Aa2 | 1,000 | 1,163,400 | |||||||||||||||
| MS Dev Bk Spl Oblig Jackson GTD | 5.50% | 1/1/2019 | Aa2 | 1,120 | 1,311,251 | |||||||||||||||
| NC St Ser C | 5.00% | 5/1/2021 | AAA | 10,955 | 13,589,458 | |||||||||||||||
| New York City NY Ser B | 5.00% | 8/1/2022 | AA | 10,000 | 11,783,300 | |||||||||||||||
| New York City NY Sub Ser A-4 | 5.00% | 8/1/2023 | AA | 11,850 | 13,830,846 | |||||||||||||||
| New York City NY Sub Ser H-5 | 0.50% | # | 3/1/2034 | A | 3,640 | 3,640,000 | ||||||||||||||
| NY St Dorm Auth Rev Non St Supp Debt Sch Dist Fing Pg Ser C (AGM) | 5.00% | 10/1/2020 | AA+ | 475 | 534,480 | |||||||||||||||
| OH St Major New St Infrastr Ser 2008-1 | 5.50% | 6/15/2020 | Aa1 | 4,500 | 5,290,830 | |||||||||||||||
| Onondaga Cnty NY Ser A | 5.00% | 3/1/2020 | AA+ | 1,150 | 1,362,014 | |||||||||||||||
| Otsego MI Pub Sch Dist (AGM) | 4.00% | 5/1/2021 | AA+ | 2,245 | 2,338,280 | |||||||||||||||
| Philadelphia PA Ser A (AGM) | 5.00% | 12/15/2015 | AA+ | 1,315 | 1,456,152 | |||||||||||||||
| Phoenix AZ Ser B | 5.00% | 7/1/2019 | AAA | 500 | 584,475 | |||||||||||||||
| Phoenix AZ Var Purp Ser A | 5.00% | 7/1/2016 | AAA | 2,525 | 2,964,401 | |||||||||||||||
| Plainfield Vlg IL Ser A (NPFGC) | 5.00% | 12/15/2019 | AA | 1,940 | 2,080,980 | |||||||||||||||
| Pocono Mountain PA Sch Dist Nts Ser A (AGM) | 5.00% | 9/1/2021 | Aa3 | 1,440 | 1,571,414 | |||||||||||||||
| Puerto Rico Comwlth Pub Impt Ser A (AGM) | 5.00% | 7/1/2018 | AA+ | 3,000 | 3,122,760 | |||||||||||||||
| Puerto Rico Comwlth Pub Impt Ser A (XLCA) | 5.50% | 7/1/2017 | Baa1 | 2,705 | 3,001,739 | |||||||||||||||
| Puerto Rico Comwlth Pub Impt Ser E | 5.375% | 7/1/2030 | Baa1 | 10,000 | 10,146,800 | |||||||||||||||
| San Bernardino CA Cmnty College Dist Election 2002 Ser A | 6.00% | 8/1/2021 | Aa2 | 750 | 891,915 | |||||||||||||||
| San Jose CA Unif Sch Dist Election of 2002 Ser C (NPFGC)(FGIC) | 4.50% | 8/1/2023 | AA | 2,825 | 3,050,718 | |||||||||||||||
| Shelby Cnty TN | 5.00% | 4/1/2019 | AA+ | 1,500 | 1,809,210 | |||||||||||||||
| Suffolk Cnty NY Pub Impt Ser B | 5.00% | 11/1/2019 | AA | 2,450 | 2,900,506 | |||||||||||||||
| Territory of Guam Ser A | 5.75% | 11/15/2014 | B+ | 1,645 | 1,689,711 | |||||||||||||||
| Three Rivers MI Cmnty Schs (AGM) | 5.00% | 5/1/2017 | AA+ | 500 | 572,750 | |||||||||||||||
See Notes to Financial Statements.
51
Schedule of Investments (continued)
INTERMEDIATE TAX FREE FUND September 30, 2011
| Investments | Interest Rate | Maturity Date | Credit Rating: S&P or Moody’s(a) | Principal Amount (000) | Fair Value | |||||||||||||||
| General Obligation (continued) | ||||||||||||||||||||
| UT St Ser A | 5.00% | 7/1/2024 | AAA | $ | 5,000 | $ | 5,993,050 | |||||||||||||
| WA St Gen Oblig Unltd Var Purp-Ser A | 5.00% | 8/1/2022 | AA+ | 14,245 | 17,301,407 | |||||||||||||||
| WA St Var Purp Ser D (AMBAC) | 5.00% | 1/1/2017 | AA+ | 3,000 | 3,274,800 | |||||||||||||||
| Washoe Cnty NV Reno Sparks Convtn(c)(m) | 5.00% | 7/1/2024 | AA | 6,050 | 6,620,576 | |||||||||||||||
| WI St Ser 2(c) | 5.00% | 11/1/2020 | AA | 5,000 | 6,058,600 | |||||||||||||||
| Williamson Cnty TX (NPFGC) | 5.25% | 2/15/2018 | AAA | 500 | 594,245 | |||||||||||||||
| Woonsocket RI | 7.125% | 6/15/2016 | Ba1 | 4,500 | 4,585,815 | |||||||||||||||
| Worcester MA Muni Purp Ln Ser A (AGM) | 5.25% | 10/1/2019 | AA+ | 1,000 | 1,117,280 | |||||||||||||||
| Worcester MA Muni Purp Ln Ser A (AGM) | 5.25% | 10/1/2020 | AA+ | 1,195 | 1,323,976 | |||||||||||||||
| Yavapai Cnty AZ Unif Sch Dist No 22 Humboldt Sch Impt Pj of 2006 Ser B (AG) | 5.00% | 7/1/2018 | Aa3 | 1,070 | 1,232,052 | |||||||||||||||
|
| |||||||||||||||||||
| Total | 407,598,459 | |||||||||||||||||||
|
| |||||||||||||||||||
| Health Care 17.09% | ||||||||||||||||||||
| Alachua Cnty FL Indl Dev Rev North FL Ret Vlg | 5.625% | 11/15/2022 | NR | 2,000 | 1,805,620 | |||||||||||||||
| Alachua Cnty FL Indl Dev Rev North FL Ret Vlg | 5.75% | 11/15/2026 | NR | 3,000 | 2,598,060 | |||||||||||||||
| Albany NY Indl Dev Agy Civic Fac St. Peter’s Hosp Pj Ser A | 5.00% | 11/15/2015 | BBB+ | 200 | 215,758 | |||||||||||||||
| Allegheny Cnty PA Hosp Dev Auth Hlth Sys West PA Ser A | 5.00% | 11/15/2017 | B+ | 3,250 | 3,158,220 | |||||||||||||||
| Allegheny Cnty PA Hosp Dev Auth Univ Pittsburgh Med Ctr Ser A | 5.00% | 9/1/2014 | Aa3 | 750 | 829,545 | |||||||||||||||
| AZ Univ Med Ctr Corp | 6.00% | 7/1/2024 | BBB+ | 1,000 | 1,045,810 | |||||||||||||||
| Birmingham-Baptist AL Med Ctr Spl Care Facs Fing Auth Baptist Hlth Sys Ser A | 5.25% | 11/15/2016 | Baa2 | 2,605 | 2,783,182 | |||||||||||||||
| Blount Cnty TN Hlth & Edl Facs Brd Asbury Inc Ser A | 5.125% | 4/1/2023 | NR | 5,200 | 4,689,880 | |||||||||||||||
| CA Hlth Facs Fing Auth Catholic Hlthcare West Ser K | 5.125% | 7/1/2022 | A | 1,750 | 1,870,278 | |||||||||||||||
| CA Hlth Facs Fing Auth Episcopal Home Ser B | 5.50% | 2/1/2024 | A- | 2,000 | 2,130,280 | |||||||||||||||
| CA Hlth Facs Fing Auth Providence Hlth & Svcs Ser C | 6.00% | 10/1/2020 | AA | 1,000 | 1,198,330 | |||||||||||||||
| CA Hlth Facs Fing Auth Scripps Hlth Ser A | 5.50% | 10/1/2020 | AA- | 2,000 | 2,321,340 | |||||||||||||||
| CA Hlth Facs Fing Auth Stanford Hosp & Clinics Ser A | 5.00% | 11/15/2023 | Aa3 | 3,000 | 3,186,360 | |||||||||||||||
| CA Hlth Facs Fing Auth Sutter Hlth Ser B | 5.00% | 8/15/2019 | AA- | 2,000 | 2,285,720 | |||||||||||||||
See Notes to Financial Statements.
52
Schedule of Investments (continued)
INTERMEDIATE TAX FREE FUND September 30, 2011
| Investments | Interest Rate | Maturity Date | Credit Rating: S&P or Moody’s(a) | Principal Amount (000) | Fair Value | |||||||||||||||
| Health Care (continued) | ||||||||||||||||||||
| CA Hlth Facs Fing Auth Sutter Hlth Ser B | 5.50% | 8/15/2020 | AA- | $ | 1,150 | $ | 1,354,574 | |||||||||||||
| CA Muni Fin Auth Cmnty Hosps Cent CA COP | 5.00% | 2/1/2016 | Baa2 | 2,000 | 2,116,800 | |||||||||||||||
| CA Muni Fin Auth Cmnty Hosps Cent CA COP | 5.00% | 2/1/2017 | Baa2 | 2,245 | 2,339,515 | |||||||||||||||
| CA Statewide Cmntys Dev Auth Sr Living Sthn CA | 6.25% | 11/15/2019 | BBB | 1,600 | 1,738,576 | |||||||||||||||
| CA Statewide Cmntys Dev Auth Vlycare Hlth Sys Ser A | 4.80% | 7/15/2017 | NR | 175 | 174,116 | |||||||||||||||
| Charlotte-Mecklenburg Hosp Auth NC Carolinas Hlthcare Ser A | 5.00% | 1/15/2019 | AA- | 4,455 | 4,951,064 | |||||||||||||||
| Charlotte-Mecklenburg Hosp Auth NC Carolinas Hlthcare Ser A | 5.25% | 1/15/2023 | AA- | 2,895 | 3,235,597 | |||||||||||||||
| CO Hlth Facs Auth Rev Amer Baptist Ser A | 7.00% | 8/1/2019 | NR | 1,500 | 1,544,310 | |||||||||||||||
| CO Hlth Facs Auth Rev Sisters Leavenworth Ser B | 5.00% | 1/1/2019 | AA | 6,000 | 6,821,340 | |||||||||||||||
| CO Hlth Facs Auth Rev Sisters Leavenworth Ser B | 5.00% | 1/1/2020 | AA | 1,925 | 2,174,114 | |||||||||||||||
| CO Hlth Facs Auth Rev Sisters Leavenworth Ser B | 5.00% | 1/1/2021 | AA | 6,535 | 7,300,379 | |||||||||||||||
| Coffee Cnty GA Hosp Auth Rev Coffee Regl Med Ctr Inc Pj | 5.00% | 12/1/2019 | BBB- | 550 | 558,619 | |||||||||||||||
| Delaware Cnty PA Auth Hosp Rev Crozer Keystone Oblig Grp Ser A | 5.00% | 12/15/2019 | BBB- | 1,000 | 986,060 | |||||||||||||||
| Doylestown PA Hosp Auth Hosp Ser A (AG) | 5.00% | 7/1/2022 | AA+ | 1,000 | 1,041,110 | |||||||||||||||
| Eden Twp CA Hlthcare Dist COP | 5.375% | 6/1/2023 | BBB | (d) | 3,085 | 3,080,804 | ||||||||||||||
| Fairfax Cnty VA Indl Dev Auth Hlthcare Inova Hlth Sys Ser A(b) | 5.50% | 5/15/2035 | AA+ | 1,000 | 1,064,270 | |||||||||||||||
| Flint MI Hosp Bldg Auth Rent Hurley Med Ctr | 6.00% | 7/1/2020 | Ba1 | 5,055 | 5,065,969 | |||||||||||||||
| Florence Cnty SC Hosp Rev McLeod Regl Med Ctr Ser A | 5.00% | 11/1/2018 | AA- | 1,845 | 2,102,488 | |||||||||||||||
| Gaithersburg MD Econ Dev Rev Asbury MD Oblig Ser B | 5.50% | 1/1/2018 | BBB- | (d) | 3,535 | 3,808,786 | ||||||||||||||
| Gaithersburg MD Econ Dev Rev Asbury MD Oblig Ser B | 5.65% | 1/1/2019 | BBB- | (d) | 2,000 | 2,155,960 | ||||||||||||||
| Glynn-Brunswick Mem Hosp Auth GA Antic Ctfs Southeast GA Hlth Ser A | 4.75% | 8/1/2019 | A2 | 3,840 | 4,031,309 | |||||||||||||||
| HI St Dept Bdgt & Fin Ser C2 | 6.40% | 11/15/2014 | NR | 1,100 | 1,101,155 | |||||||||||||||
See Notes to Financial Statements.
53
Schedule of Investments (continued)
INTERMEDIATE TAX FREE FUND September 30, 2011
| Investments | Interest Rate | Maturity Date | Credit Rating: S&P or Moody’s(a) | Principal Amount (000) | Fair Value | |||||||||||||||
| Health Care (continued) | ||||||||||||||||||||
| Howard Cnty MD Ret Cmnty Vantage Hse Fac Ser A | 5.25% | 4/1/2027 | NR | $ | 2,000 | $ | 1,588,680 | |||||||||||||
| IA Fin Auth Hlthcare Facs Genesis Hlth Sys | 5.00% | 7/1/2019 | A1 | 4,075 | 4,402,793 | |||||||||||||||
| IL Fin Auth Rev Edward Hosp Ser A Rmkt (AMBAC) | 6.00% | 2/1/2028 | A+ | 1,400 | 1,472,646 | |||||||||||||||
| IL Fin Auth Rev Hosp Sisters Svcs Inc Ser A | 5.00% | 3/15/2027 | AA | 1,000 | 1,014,240 | |||||||||||||||
| IL Fin Auth Rev Northwestern Mem Hosp Ser A(b) | 5.75% | 8/15/2030 | AA+ | 2,500 | 2,708,300 | |||||||||||||||
| IL Fin Auth Rev Provena Hlth Ser A | 5.75% | 5/1/2018 | BBB+ | 1,000 | 1,101,440 | |||||||||||||||
| IL Fin Auth Rev Provena Hlth Ser A | 5.75% | 5/1/2019 | BBB+ | 3,000 | 3,282,570 | |||||||||||||||
| IL Fin Auth Rev Provena Hlth Ser A | 6.00% | 5/1/2020 | BBB+ | 4,000 | 4,416,720 | |||||||||||||||
| IL Fin Auth Rev Rush Univ Med Ctr Oblig Grp Ser A | 6.00% | 11/1/2019 | A2 | 1,000 | 1,105,250 | |||||||||||||||
| IL Fin Auth Rev Sedgebrook Inc Fac Ser A(f) | 5.50% | 11/15/2013 | NR | 176 | 2 | |||||||||||||||
| IL Fin Auth Rev The Carle Fndtn Ser A (AG) | 5.50% | 2/15/2016 | AA+ | 2,000 | 2,216,700 | |||||||||||||||
| IL Fin Auth Rev The Carle Fndtn Ser A (AG) | 5.50% | 2/15/2017 | AA+ | 2,000 | 2,234,280 | |||||||||||||||
| IN Bd Bk Rev Spl Pg Hendricks Regl Hlth Ser A | 5.00% | 2/1/2019 | AA | 1,765 | 1,990,496 | |||||||||||||||
| IN Hlth & Edl Facs Fing Auth St. Francis Ser E Rmkt (AGM) | 5.25% | 11/1/2022 | Aa3 | 1,000 | 1,091,500 | |||||||||||||||
| Iron River MI Hosp Fin Auth Iron Cnty Cmnty Hosps | 6.00% | 5/15/2020 | NR | 785 | 783,375 | |||||||||||||||
| Jackson Cnty MI Hosp Fin Auth Ser C Rmkt (AG) | 5.00% | 6/1/2018 | AA+ | 4,350 | 4,958,434 | |||||||||||||||
| Jackson Cnty MI Hosp Fin Auth Ser C Rmkt (AG) | 5.00% | 6/1/2019 | AA+ | 4,400 | 5,007,464 | |||||||||||||||
| Kalamazoo MI Hosp Fin Auth Bronson Hosp Ser A Rmkt (AGM) | 5.25% | 5/15/2014 | AA+ | 2,000 | 2,162,920 | |||||||||||||||
| Kansas City MO Indl Dev Auth First Mtg Bishop Spencer Ser A | 6.25% | 1/1/2024 | NR | 1,000 | 990,620 | |||||||||||||||
| Kansas City MO Indl Dev Auth First Mtg Bishop Spencer Ser A | 6.50% | 1/1/2035 | NR | 2,500 | 2,381,925 | |||||||||||||||
| Kent MI Hosp Fin Auth Rev Metro Hosp Pj Ser A | 5.50% | 7/1/2020 | BB+ | 3,275 | 3,304,377 | |||||||||||||||
| Kirkwood MO Indl Dev Auth Aberdeen Heights Ser 50-C-3 | 6.50% | 5/15/2015 | NR | 1,000 | 1,001,860 | |||||||||||||||
| Kirkwood MO Indl Dev Auth Aberdeen Heights Ser 65-C-2 | 7.00% | 11/15/2015 | NR | 4,700 | 4,729,610 | |||||||||||||||
See Notes to Financial Statements.
54
Schedule of Investments (continued)
INTERMEDIATE TAX FREE FUND September 30, 2011
| Investments | Interest Rate | Maturity Date | Credit Rating: S&P or Moody’s(a) | Principal Amount (000) | Fair Value | |||||||||||||||
| Health Care (continued) | ||||||||||||||||||||
| KS St Dev Fin Auth Hosp Rev Adventist Hlth | 5.25% | 11/15/2019 | AA- | $ | 1,580 | $ | 1,836,687 | |||||||||||||
| KS St Dev Fin Auth Hosp Rev Adventist Sunbelt Ser D | 5.00% | 11/15/2020 | AA- | 1,775 | 2,027,476 | |||||||||||||||
| LA Pub Facs Auth Rev Christus Hlth Ser A | 5.25% | 7/1/2020 | A+ | 3,200 | 3,530,944 | |||||||||||||||
| Lufkin TX Hlth Facs Dev Corp Mem Hlth Sys of East TX | 6.00% | 2/15/2024 | BBB- | 7,500 | 7,673,775 | |||||||||||||||
| MA Dev Fin Agy Ser B1 | 7.25% | 6/1/2016 | NR | 5,000 | 5,000,950 | |||||||||||||||
| MD St Hlth & Higher Edl Facs Auth Univ MD Med Sys | 5.00% | 7/1/2020 | A | 4,905 | 5,382,355 | |||||||||||||||
| MD St Hlth & Higher Edl Facs Auth Univ MD Med Sys | 5.00% | 7/1/2021 | A | 5,550 | 6,031,407 | |||||||||||||||
| ME Hlth & Higher Edl Facs Auth Gen Med Ctr | 6.00% | 7/1/2026 | Baa3 | 7,755 | 7,879,855 | |||||||||||||||
| ME Hlth & Higher Edl Facs Auth Ser A (NPFGC) | 5.375% | 7/1/2018 | A1 | 2,700 | 2,894,508 | |||||||||||||||
| ME Hlth & Higher Edl Facs Auth Ser B | 4.50% | 7/1/2018 | A1 | 2,640 | 2,901,862 | |||||||||||||||
| Med Ctr Hosp Auth GA Rev Columbus Regl Hlthcare Ser A (AGM) | 4.00% | 8/1/2022 | AA+ | 1,000 | 1,029,200 | |||||||||||||||
| Med Ctr Hosp Auth GA Rev Columbus Regl Hlthcare Ser A (AGM) | 4.00% | 8/1/2023 | AA+ | 1,635 | 1,662,926 | |||||||||||||||
| Med Ctr Hosp Auth GA Rev Columbus Regl Hlthcare Ser A (AGM) | 5.00% | 8/1/2017 | AA+ | 2,630 | 2,882,454 | |||||||||||||||
| Med Ctr Hosp Auth GA Rev Columbus Regl Hlthcare Ser A (AGM) | 5.00% | 8/1/2021 | AA+ | 2,115 | 2,353,910 | |||||||||||||||
| Mesquite TX Hlth Facs Dev Corp Ret Fac Christian Care | 5.50% | 2/15/2025 | BBB- | 3,250 | 3,093,220 | |||||||||||||||
| Miami Beach FL Hlth Facs Auth Mt Sinai Med Ctr | 6.75% | 11/15/2021 | Baa3 | 3,000 | 3,124,770 | |||||||||||||||
| MN Agric & Econ Dev Brd Hlthcare Essential Ser C-1 Rmkt (AG) | 5.50% | 2/15/2025 | AA+ | 4,500 | 5,050,215 | |||||||||||||||
| Montgomery Cnty PA Indl Dev Auth New Regl Med (FHA) | 5.00% | 8/1/2018 | AA | 1,605 | 1,856,279 | |||||||||||||||
| Montgomery Cnty PA Indl Dev Auth New Regl Med (FHA) | 5.00% | 8/1/2019 | AA | 1,790 | 2,056,710 | |||||||||||||||
| Montgomery Cnty PA Indl Dev Auth New Regl Med (FHA) | 5.00% | 8/1/2020 | AA | 1,000 | 1,149,800 | |||||||||||||||
| MS Hosp Equip & Facs Auth Baptist Hlth Sys Inc A | 5.00% | 8/15/2016 | A- | 2,000 | 2,169,240 | |||||||||||||||
See Notes to Financial Statements.
55
Schedule of Investments (continued)
INTERMEDIATE TAX FREE FUND September 30, 2011
| Investments | Interest Rate | Maturity Date | Credit Rating: S&P or Moody’s(a) | Principal Amount (000) | Fair Value | |||||||||||||||
| Health Care (continued) | ||||||||||||||||||||
| MS Hosp Equip & Facs Auth Baptist Hlth Sys Inc A | 5.00% | 8/15/2017 | A- | $ | 2,500 | $ | 2,708,075 | |||||||||||||
| MS Hosp Equip & Facs Auth Baptist Hlth Sys Inc A | 5.00% | 8/15/2018 | A- | 3,000 | 3,220,020 | |||||||||||||||
| MS Hosp Equip & Facs Auth North MS Hlth Svcs Ser 1 | 5.00% | 10/1/2017 | AA | 2,500 | 2,851,600 | |||||||||||||||
| NC Med Care Commn Hsg Fndtn Inc (ACA) | 6.625% | 8/15/2030 | NR | 2,900 | 2,819,235 | |||||||||||||||
| NC Med Care Commn Univ Hlth Sys Ser E-1 | 5.75% | 12/1/2036 | A+ | 3,475 | 3,714,984 | |||||||||||||||
| NJ Hlthcare Facs Fing Auth AHS Hosp Corp Ser A | 5.125% | 7/1/2019 | A1 | 1,500 | 1,646,070 | |||||||||||||||
| NJ Hlthcare Facs Fing Auth Hosp Asset Transformation Pg Ser A | 5.00% | 10/1/2016 | A+ | 2,000 | 2,251,140 | |||||||||||||||
| NJ Hlthcare Facs Fing Auth St. Joseph’s Hlthcare Sys | 6.00% | 7/1/2018 | BBB- | 6,590 | 7,012,880 | |||||||||||||||
| NJ Hlthcare Facs Fing Auth St. Peter’s Univ Hosp | 6.00% | 7/1/2026 | BBB- | 5,500 | 5,600,870 | |||||||||||||||
| NJ Hlthcare Facs Fing Auth St. Peter’s Univ Hosp Oblig | 5.25% | 7/1/2021 | BBB- | 2,045 | 2,070,276 | |||||||||||||||
| NJ Hlthcare Facs Fing Auth Trinitas Hosp Oblig Ser B | 5.25% | 7/1/2023 | BBB- | 5,000 | 5,026,600 | |||||||||||||||
| NJ Hlthcare Facs Fing Auth Virtua Hlth (AG) | 5.50% | 7/1/2020 | AA+ | 5,455 | 6,196,662 | |||||||||||||||
| Northampton Cnty PA Gen Purp Auth St. Luke’s Hosp Pj Ser A | 5.00% | 8/15/2019 | A3 | 2,000 | 2,078,700 | |||||||||||||||
| NY St Dorm Auth Rev Lenox Hill Hosp Oblig Grp | 5.375% | 7/1/2020 | Baa3 | 1,000 | 1,012,300 | |||||||||||||||
| NY St Dorm Auth Rev Non St Supp Debt North Shore L I Jewish Ser E | 5.00% | 5/1/2019 | A- | 4,000 | 4,483,560 | |||||||||||||||
| NY St Dorm Auth Rev Non St Supp Debt NYU Hosps Ctr Ser A | 5.00% | 7/1/2016 | BBB+ | 1,600 | 1,805,888 | |||||||||||||||
| NY St Dorm Auth Rev Non St Supp Debt NYU Hosps Ctr Ser A | 5.00% | 7/1/2019 | BBB+ | 2,000 | 2,262,520 | |||||||||||||||
| NY St Dorm Auth Rev Non St Supp Debt NYU Hosps Ctr Ser A | 5.00% | 7/1/2020 | BBB+ | 2,000 | 2,136,160 | |||||||||||||||
| NY St Dorm Auth Rev Non St Supp Debt Orange Regl Med Ctr | 6.50% | 12/1/2021 | Ba1 | 1,000 | 1,059,620 | |||||||||||||||
| OH St Hosp Fac Rev Cleveland Clinic Hlth Ser B | 5.00% | 1/1/2022 | Aa2 | 3,000 | 3,319,770 | |||||||||||||||
| Orange Cnty FL Hlth Facs Auth Orlando Hlth Inc | 5.25% | 10/1/2020 | A | 5,000 | 5,539,050 | |||||||||||||||
See Notes to Financial Statements.
56
Schedule of Investments (continued)
INTERMEDIATE TAX FREE FUND September 30, 2011
| Investments | Interest Rate | Maturity Date | Credit Rating: S&P or Moody’s(a) | Principal Amount (000) | Fair Value | |||||||||||||||
| Health Care (continued) | ||||||||||||||||||||
| PA St Higher Edl Facs Auth Univ of Pittsburgh Med Ctr Ser E | 5.00% | 5/15/2020 | Aa3 | $ | 8,000 | $ | 9,114,880 | |||||||||||||
| Palomar CA Pomerado Hlthcare COP | 5.25% | 11/1/2021 | Baa3 | 5,000 | 5,186,100 | |||||||||||||||
| Philadelphia PA Hosps & Higher Ed Facs Auth Temple Univ Hosp Sys Ser A | 6.625% | 11/15/2023 | BBB | 2,000 | 2,001,580 | |||||||||||||||
| Roanoke VA Econ Dev Auth Carilion Clinic Oblig | 5.00% | 7/1/2025 | A+ | 10,000 | 10,542,100 | |||||||||||||||
| San Buenaventura CA Cmnty Mem Hlth Sys | 8.00% | 12/1/2026 | BB | 10,000 | 11,077,600 | |||||||||||||||
| SC Jobs Econ Dev Auth Tuomey (CIFG) | 5.00% | 11/1/2019 | BBB | 3,620 | 3,542,315 | |||||||||||||||
| SC Jobs Econ Dev Auth Tuomey Hlthcare Sys (AMBAC) | 5.00% | 11/1/2018 | NR | 2,400 | 2,312,688 | |||||||||||||||
| Scottsdale AZ Indl Dev Auth Scottsdale Hlthcare A | 5.00% | 9/1/2017 | A- | 2,000 | 2,172,080 | |||||||||||||||
| Shelby Cnty TN Hlth Edl & Hsg Facs Brd Baptist Mem Hlth Ser 2004A | 5.00% | 9/1/2017 | AA | 4,000 | 4,569,360 | |||||||||||||||
| South Broward FL Hosp Dist Rev Hosp (NPFGC) | 5.00% | 5/1/2019 | AA- | 5,130 | 5,601,857 | |||||||||||||||
| South Broward FL Hosp Dist Rev Hosp (NPFGC) | 5.00% | 5/1/2022 | AA- | 2,710 | 2,895,662 | |||||||||||||||
| St. Paul MN Hsg & Redev Auth Hosp Rev Hltheast Pj | 5.00% | 11/15/2017 | BB+ | 2,900 | 2,947,212 | |||||||||||||||
| Sullivan Cnty TN Hlth Edl & Hsg Facs Brd Wellmont Hlth Sys Pj Ser C | 5.00% | 9/1/2022 | BBB+ | 3,300 | 3,318,381 | |||||||||||||||
| Sylacauga AL Hlthcare Auth Coosa Vly Med Ctr Ser A | 5.375% | 8/1/2015 | NR | 1,910 | 1,936,492 | |||||||||||||||
| Sylacauga AL Hlthcare Auth Coosa Vly Med Ctr Ser A | 6.00% | 8/1/2025 | NR | 3,525 | 3,250,720 | |||||||||||||||
| Tarrant Cnty TX Cultural Ed Facs Fin Corp Christus Hlth Ser A (AG) | 5.75% | 7/1/2018 | AA+ | 3,280 | 3,611,838 | |||||||||||||||
| Thomasville GA Hosp Auth Rev Antic Ctfs John D Archbold | 4.75% | 11/1/2025 | A | 6,150 | 6,231,241 | |||||||||||||||
| Univ of AL Ser A | 5.00% | 9/1/2016 | A+ | 2,320 | 2,561,326 | |||||||||||||||
| Univ of AL Ser A | 5.25% | 9/1/2017 | A+ | 1,180 | 1,317,269 | |||||||||||||||
| Westchester Cnty NY Hlthcare Corp Sr Lien Ser B | 5.00% | 11/1/2019 | A3 | 4,000 | 4,299,200 | |||||||||||||||
| Westchester Cnty NY Hlthcare Corp Sr Lien Ser B | 5.125% | 11/1/2020 | A3 | 5,500 | 5,919,045 | |||||||||||||||
| WI St Hlth & Edl Facs Ascension Hlth Sr Ctr Grp(b) | 5.00% | 11/15/2030 | AA+ | 1,170 | 1,219,432 | |||||||||||||||
See Notes to Financial Statements.
57
Schedule of Investments (continued)
INTERMEDIATE TAX FREE FUND September 30, 2011
| Investments | Interest Rate | Maturity Date | Credit Rating: S&P or Moody’s(a) | Principal Amount (000) | Fair Value | |||||||||||||||
| Health Care (continued) | ||||||||||||||||||||
| WI St Hlth & Edl Facs Ascension Hlth Sr Ctr Grp(b) | 5.00% | 11/15/2033 | AA+ | $ | 7,000 | $ | 7,167,125 | |||||||||||||
| WI St Hlth & Edl Facs Auth Froedtert & Cmnty Hlth | 5.00% | 4/1/2019 | AA- | 1,110 | 1,261,093 | |||||||||||||||
| WI St Hlth & Edl Facs Auth Ministry Hlth Rmkt (AGM) | 5.00% | 8/1/2016 | AA+ | 2,230 | 2,461,429 | |||||||||||||||
| WI St Hlth & Edl Facs Auth St. John’s Cmntys Inc Ser C-1 | 6.40% | 9/15/2015 | NR | 3,750 | 3,750,263 | |||||||||||||||
| WI St Hlth & Edl Facs Auth Synergy Hlth Inc | 6.00% | 11/15/2023 | AA- | 3,340 | 3,454,863 | |||||||||||||||
| WI St Hlth & Edl Facs Auth Wheaton Franciscan Hlthcare | 5.25% | 8/15/2017 | BBB+ | 8,160 | 8,740,094 | |||||||||||||||
| WI St Hlth & Edl Facs Auth Wheaton Franciscan Hlthcare | 5.25% | 8/15/2018 | BBB+ | 2,000 | 2,114,780 | |||||||||||||||
| WV St Hosp Fin Auth Thomas Hlth Sys | 6.00% | 10/1/2020 | NR | 1,600 | 1,606,320 | |||||||||||||||
|
| |||||||||||||||||||
| Total | 409,400,368 | |||||||||||||||||||
|
| |||||||||||||||||||
| Housing 0.65% | ||||||||||||||||||||
| Athens GA Hsg Auth Rev Univ GA East Campus | 4.00% | 12/1/2019 | Aa2 | 2,045 | 2,297,272 | |||||||||||||||
| Athens GA Hsg Auth Rev Univ GA East Campus ETM | 4.00% | 12/1/2019 | NR | 240 | 276,732 | |||||||||||||||
| CA Statewide Cmntys Dev Auth CHF Irvine LLC UCI East Campus | 6.00% | 5/15/2023 | Baa2 | 2,000 | 2,113,600 | |||||||||||||||
| Minneapolis MN Multi Fam Hsg Riverside Plaza Ser B | 6.00% | 11/1/2013 | NR | 5,000 | 5,000,250 | |||||||||||||||
| NJ Econ Dev Auth MSU Student Hsg Pj | 5.00% | 6/1/2018 | Baa3 | 1,390 | 1,492,276 | |||||||||||||||
| NJ Econ Dev Auth MSU Student Hsg Pj | 5.25% | 6/1/2019 | Baa3 | 1,610 | 1,733,793 | |||||||||||||||
| PA St Higher Edl Facs Auth Edinboro Univ Fndtn | 5.00% | 7/1/2018 | BBB- | 245 | 263,980 | |||||||||||||||
| VA St Hsg Dev Auth Ser A-5 AMT | 4.70% | 7/1/2017 | AAA | 2,315 | 2,477,073 | |||||||||||||||
|
| |||||||||||||||||||
| Total | 15,654,976 | |||||||||||||||||||
|
| |||||||||||||||||||
| Lease Obligations 9.62% | ||||||||||||||||||||
| Atlanta GA Dev Auth Edl Facs Science Pk LLC Pj | 5.00% | 7/1/2021 | Aa3 | 610 | 662,783 | |||||||||||||||
| Atlanta GA Downtown Dev Auth Rev Underground Atlanta Pj Ser A (AG) | 5.00% | 7/1/2016 | AA+ | 4,500 | 4,986,900 | |||||||||||||||
| AZ Sch Facs Brd Ctfs Ser A-3 (NPFGC)(FGIC) | 5.00% | 9/1/2019 | A+ | 4,850 | 5,144,201 | |||||||||||||||
See Notes to Financial Statements.
58
Schedule of Investments (continued)
INTERMEDIATE TAX FREE FUND September 30, 2011
| Investments | Interest Rate | Maturity Date | Credit Rating: S&P or Moody’s(a) | Principal Amount (000) | Fair Value | |||||||||||||||
| Lease Obligations (continued) | ||||||||||||||||||||
| Brevard Cnty FL Sch Brd COP Ser B (NPFGC)(FGIC) | 5.00% | 7/1/2019 | Aa3 | $ | 3,500 | $ | 3,706,605 | |||||||||||||
| Broward Cnty FL Sch Brd COP (NPFGC) | 5.00% | 7/1/2021 | Aa3 | 2,930 | 3,075,269 | |||||||||||||||
| CA St Pub Wrks Brd Dept Corrections & Rehab Ser F (NPFGC)(FGIC) | 5.25% | 11/1/2017 | A2 | 250 | 279,683 | |||||||||||||||
| CA St Pub Wrks Brd Dept Gen Svcs Bldgs 8 & 9 Ser A | 5.00% | 4/1/2020 | A2 | 4,085 | 4,410,166 | |||||||||||||||
| CA St Pub Wrks Brd Var Cap Pj Ser G-1 | 5.25% | 10/1/2019 | A2 | 11,370 | 12,898,810 | |||||||||||||||
| CA St Pub Wrks Brd Var Cap Pjs Sub Ser A-1 | 5.00% | 3/1/2018 | A2 | 7,490 | 8,407,899 | |||||||||||||||
| Cleveland OH Cleveland Stadium Pj Ser A COP | 4.75% | 11/15/2020 | A | 3,000 | 3,253,710 | |||||||||||||||
| Cleveland OH Cleveland Stadium Pj Ser A COP | 5.00% | 11/15/2019 | A | 2,450 | 2,729,447 | |||||||||||||||
| Dallas TX Civic Ctr (AG) | 5.00% | 8/15/2021 | AA+ | 3,800 | 4,320,030 | |||||||||||||||
| Dallas TX Convtn Ctr Hotel Dev Corp Ser A | 5.25% | 1/1/2020 | A+ | 4,000 | 4,539,760 | |||||||||||||||
| Dallas TX Convtn Ctr Hotel Dev Corp Ser A | 5.25% | 1/1/2022 | A+ | 6,405 | 7,137,604 | |||||||||||||||
| Erie Cnty NY Indl Dev Agy Sch Dist Buffalo Pj Ser B | 5.00% | 5/1/2024 | AA- | 5,930 | 6,735,887 | |||||||||||||||
| FL Dept of Children & Fam Svcs FL Civil Commitment Ctr COP (NPFGC) | 5.00% | 10/1/2022 | AA+ | 2,870 | 3,118,858 | |||||||||||||||
| Fulton Cnty GA Facs Corp Pub Purp Pj COP | 5.00% | 11/1/2016 | AA- | 2,200 | 2,512,246 | |||||||||||||||
| Gloucester Cnty NJ Impt Auth Cnty Ln Cnty Cap Pg GTD | 5.00% | 4/1/2017 | AA+ | 1,000 | 1,183,170 | |||||||||||||||
| Goodyear AZ Pub Impt Corp | 6.375% | 7/1/2019 | AA- | 500 | 608,025 | |||||||||||||||
| Goodyear AZ Pub Impt Corp Ser A (NPFGC) | 5.00% | 7/1/2022 | AA- | 500 | 531,975 | |||||||||||||||
| Greenville Cnty SC Sch Dist Bldg Equity Sooner | 5.50% | 12/1/2017 | AA | 3,000 | 3,593,670 | |||||||||||||||
| Houston Cnty AL Cooperative Dist Rev Country Crossing Pj | 15.00% | 5/27/2012 | NR | 1,768 | 534,590 | |||||||||||||||
| IN Fin Auth Lease Rev Ser A1 | 5.00% | 11/1/2015 | AA+ | 1,000 | 1,141,580 | |||||||||||||||
| Kane McHenry Cook & De Kalb Cntys IL Unit Sch Dist No 300 (AG)(AMBAC) | 5.00% | 1/1/2022 | AA+ | 2,300 | 2,462,564 | |||||||||||||||
| Kansas City MO Indl Dev Auth Downtown Redev Dist Ser A | 5.00% | 9/1/2022 | AA- | 8,445 | 9,363,056 | |||||||||||||||
| KY St Ppty & Bldgs Commn | 5.75% | 11/1/2019 | Aa3 | 3,425 | 4,125,139 | |||||||||||||||
| KY St Ppty & Bldgs Commn Pj No 93 (AG) | 5.25% | 2/1/2020 | AA+ | 2,000 | 2,315,120 | |||||||||||||||
See Notes to Financial Statements.
59
Schedule of Investments (continued)
INTERMEDIATE TAX FREE FUND September 30, 2011
| Investments | Interest Rate | Maturity Date | Credit Rating: S&P or Moody’s(a) | Principal Amount (000) | Fair Value | |||||||||||||||
| Lease Obligations (continued) | ||||||||||||||||||||
| LA Pub Facs Auth Hurricane Recovery Pg (AG) | 5.00% | 6/1/2020 | AA+ | $ | 5,000 | $ | 5,363,000 | |||||||||||||
| Lexington Fayette Urban Cnty Govt Pub Facs Corp Lease Eastern St Hosp Ser A | 5.00% | 6/1/2024 | Aa3 | 6,800 | 7,442,532 | |||||||||||||||
| Manatee Cnty FL Transn Rev (AMBAC) | 5.00% | 10/1/2019 | Aa2 | 2,030 | 2,202,144 | |||||||||||||||
| Mecklenburg Cnty NC COP Ser A | 5.00% | 2/1/2020 | AA+ | 3,565 | 4,101,212 | |||||||||||||||
| Mecklenburg Cnty NC Pub Facs Annual Apprec Ltd Ser O | 5.00% | 3/1/2020 | AA+ | 2,525 | 2,990,509 | |||||||||||||||
| MI St Strategic Fd Ltd Cadillac Place Office Bldg Pj | 5.25% | 10/15/2023 | A+ | 3,865 | 4,328,645 | |||||||||||||||
| MI St Strategic Fd Ltd Cadillac Place Office Bldg Pj | 5.25% | 10/15/2024 | A+ | 6,915 | 7,647,298 | |||||||||||||||
| Miami-Dade Cnty FL Entitlement GTD (NPFGC)(FGIC) | 5.00% | 8/1/2014 | Aa3 | 1,000 | 1,091,110 | |||||||||||||||
| Miami-Dade Cnty FL Sch Brd COP Ser B | 5.00% | 5/1/2032 | A1 | 5,000 | 5,500,450 | |||||||||||||||
| Miami-Dade Cnty FL Sch Brd Ctfs Ser A (NPFGC)(FGIC) | 5.00% | 5/1/2022 | A1 | 13,050 | 13,951,102 | |||||||||||||||
| Miami-Dade Cnty FL Spl Oblig Fltg Rate Cap Asset Acq Ser A (NPFGC)(FGIC) | 5.862% | # | 4/1/2014 | Aa3 | 200 | 197,712 | ||||||||||||||
| Montgomery Cnty VA Indl Dev Auth Pub Pjs | 5.00% | 2/1/2018 | AA- | 1,000 | 1,163,110 | |||||||||||||||
| NC Infrastr Fin Corp Cap Impt Ser A (AGM) | 5.00% | 5/1/2017 | AA+ | 2,000 | 2,352,940 | |||||||||||||||
| New York City NY Indl Dev Agy USTA Natl Tennis (AGM) | 5.00% | 11/15/2018 | AA+ | 400 | 454,732 | |||||||||||||||
| NJ Econ Dev Auth Sch Facs Constr Ser AA | 5.25% | 12/15/2020 | A+ | 8,125 | 9,134,775 | |||||||||||||||
| NJ Econ Dev Auth Sch Facs Ser GG | 5.25% | 9/1/2025 | A+ | 5,075 | 5,572,198 | |||||||||||||||
| NJ Econ Dev Auth Transn Pj Sublease Ser A | 5.00% | 5/1/2018 | A+ | 1,425 | 1,622,975 | |||||||||||||||
| NJ Econ Dev Auth Transn Pj Sublease Ser A | 5.00% | 5/1/2019 | A+ | 3,000 | 3,414,540 | |||||||||||||||
| NJ Sports & Exposition Auth Ser B | 5.00% | 9/1/2018 | A+ | 4,950 | 5,632,655 | |||||||||||||||
| NJ Sports & Exposition Auth Ser B ETM | 5.00% | 9/1/2018 | A2 | 50 | 61,218 | |||||||||||||||
| NJ St Transn Tr Fd Auth Transn Sys Ser B (NPFGC)(FGIC) | 5.50% | 12/15/2020 | A+ | 1,000 | 1,169,740 | |||||||||||||||
| North Charleston SC Convtn Ctr COP | 5.00% | 10/1/2016 | AA- | 2,010 | 2,295,983 | |||||||||||||||
| Northwest Allen IN Sch Bldg Corp First Mtg (AGM) | 5.00% | 7/15/2020 | AA+ | 3,140 | 3,483,485 | |||||||||||||||
| NY St Dorm Auth Rev Non St Supp Debt Sch Dists Fing Pg Ser A (AGM) | 5.00% | 10/1/2023 | AA+ | 8,000 | 9,037,120 | |||||||||||||||
See Notes to Financial Statements.
60
Schedule of Investments (continued)
INTERMEDIATE TAX FREE FUND September 30, 2011
| Investments | Interest Rate | Maturity Date | Credit Rating: S&P or Moody’s(a) | Principal Amount (000) | Fair Value | |||||||||||||||
| Lease Obligations (continued) | ||||||||||||||||||||
| NY St Dorm Auth Rev St Mental Hlth Svcs Facs Impt Ser A (AGM) | 5.00% | 2/15/2016 | AA+ | $ | 2,775 | $ | 3,168,356 | |||||||||||||
| NY St Urban Dev Corp Rev St Pers Income Tax Ser A-1(b) | 5.00% | 12/15/2025 | AAA | 1,320 | 1,465,417 | |||||||||||||||
| NY St Urban Dev Corp Rev St Pers Income Tax Ser A-1(b) | 5.00% | 12/15/2026 | AAA | 1,920 | 2,131,515 | |||||||||||||||
| NY St Urban Dev Corp Rev St Pers Income Tax Ser A-1(b) | 5.00% | 12/15/2027 | AAA | 770 | 854,826 | |||||||||||||||
| NY St Urban Dev Corp Rev Svc Contract Ser A-2 | 5.00% | 1/1/2022 | AA- | 3,705 | 4,227,664 | |||||||||||||||
| Puerto Rico Comwlth Infrastr Fing Auth Mepsi Campus Pj Ser A | 5.60% | 10/1/2014 | NR | 140 | 143,161 | |||||||||||||||
| Puerto Rico Pub Bldgs Auth Rev Govt Facs Ser P GTD | 7.00% | 7/1/2021 | Baa1 | 5,000 | 5,440,600 | |||||||||||||||
| VA College Bldg Auth Pub Higher Ed Fing Pg Ser A | 5.00% | 9/1/2016 | Aa1 | 5,475 | 6,434,658 | |||||||||||||||
| WI St Rev Ser A | 5.25% | 5/1/2020 | AA- | 2,175 | 2,570,459 | |||||||||||||||
|
| |||||||||||||||||||
| Total | 230,426,588 | |||||||||||||||||||
|
| |||||||||||||||||||
| Other Revenue 3.93% | ||||||||||||||||||||
| Austin TX Convtn Entrprse Inc 2nd Tier Ser B† | 6.00% | 1/1/2017 | Ba2 | 1,935 | 1,991,618 | |||||||||||||||
| Baker FL Correctional Dev Corp 1st Mtg Rev Detention Ctr Pj | 7.50% | 2/1/2030 | NR | 1,200 | 1,063,056 | |||||||||||||||
| Baytown Twp MN Rev St. Croix Prep Academy Pj Ser A | 6.00% | 8/1/2018 | NR | 1,900 | 1,869,619 | |||||||||||||||
| Brooklyn NY Arena Loc Dev Corp Barclays Ctr Pj | 5.75% | 7/15/2018 | BBB- | 1,400 | 1,555,512 | |||||||||||||||
| Brooklyn NY Arena Loc Dev Corp Barclays Ctr Pj | 5.75% | 7/15/2019 | BBB- | 2,715 | 3,006,754 | |||||||||||||||
| CA Infrastr & Econ Dev Bk Broad Museum Pj Ser A | 5.00% | 6/1/2021 | Aa1 | 5,425 | 6,438,553 | |||||||||||||||
| Clifton TX Higher Ed Fin Corp Uplift Ed Ser A | 5.70% | 12/1/2025 | BBB- | 5,110 | 5,241,429 | |||||||||||||||
| FL St Brd of Ed Lottery Rev Ser B (AMBAC) | 5.00% | 7/1/2016 | AAA | 1,000 | 1,154,550 | |||||||||||||||
| FL St Brd of Ed Lottery Rev Ser E | 5.00% | 7/1/2020 | AAA | 7,645 | 8,966,362 | |||||||||||||||
| FL St Dev Fin Corp Edl Fac Renaissance Charter Sch Ser A | 7.50% | 6/15/2033 | BB+ | (d) | 4,650 | 4,810,936 | ||||||||||||||
| Garza Cnty TX Pub Fac Corp | 5.25% | 10/1/2017 | BBB | 1,000 | 1,022,650 | |||||||||||||||
| Garza Cnty TX Pub Fac Corp | 5.50% | 10/1/2018 | BBB | 1,000 | 1,017,320 | |||||||||||||||
See Notes to Financial Statements.
61
Schedule of Investments (continued)
INTERMEDIATE TAX FREE FUND September 30, 2011
| Investments | Interest Rate | Maturity Date | Credit Rating: S&P or Moody’s(a) | Principal Amount (000) | Fair Value | |||||||||||||||
| Other Revenue (continued) | ||||||||||||||||||||
| Garza Cnty TX Pub Fac Corp | 5.50% | 10/1/2019 | BBB | $ | 1,600 | $ | 1,611,328 | |||||||||||||
| ID Hsg & Fin Assoc Ser A | 5.00% | 7/15/2029 | Aa2 | 5,000 | 5,334,300 | |||||||||||||||
| Indianapolis IN Loc Pub Impt Bd Bk Ser K(c) | 5.00% | 6/1/2024 | A1 | 4,000 | 4,271,280 | |||||||||||||||
| La Vernia TX Higher Ed Fin Corp Lifeschs of Dallas Ser A | 7.00% | 8/15/2026 | BBB- | 4,455 | 4,651,154 | |||||||||||||||
| MD St Econ Dev Corp Sr Lien Pj Chesapeake Bay Ser B | 5.00% | 12/1/2016 | NR | 1,000 | 844,260 | |||||||||||||||
| MI Fin Auth Detroit Sch Ser A-2 | 6.65% | 3/20/2012 | NR | 4,500 | 4,590,990 | |||||||||||||||
| MI St Strategic Fd Ltd Pollutn Ctrl Gen Motors Corp(g) | – | – | (h) | NR | 400 | 3,000 | ||||||||||||||
| Minneapolis MN Rev National Marrow Donor Pg | 4.875% | 8/1/2025 | BBB | 5,000 | 4,908,450 | |||||||||||||||
| Mohave Cnty AZ Indl Dev Auth Mohave Prison LLC Expansion Pj | 7.50% | 5/1/2019 | BBB+ | 3,225 | 3,607,195 | |||||||||||||||
| Mohave Cnty AZ Indl Dev Auth Mohave Prison LLC Expansion Pj | 8.00% | 5/1/2025 | BBB+ | 2,000 | 2,243,020 | |||||||||||||||
| New York City NY Tr Cultural Res Lincoln Ctr Ser C | 5.75% | 12/1/2018 | A+ | 2,500 | 3,031,075 | |||||||||||||||
| New York City NY Tr Cultural Res Whitney Museum of Amer Art | 5.00% | 7/1/2021 | A | 5,000 | 5,706,100 | |||||||||||||||
| Puerto Rico Comwlth Govt Dev Bk Rmkt GTD (NPFGC) | 4.75% | 12/1/2015 | BBB | 5,000 | 5,203,850 | |||||||||||||||
| Seminole Indian Tribe FL Spl Oblig Ser A† | 5.50% | 10/1/2024 | BBB- | 2,400 | 2,280,336 | |||||||||||||||
| Valparaiso IN Econ Dev Rev Valparaiso Fam YMCA | 5.00% | 12/1/2012 | NR | 250 | 247,282 | |||||||||||||||
| WA St Econ Dev Fin Auth Wst Mgmt Rmkt | 2.00% | 6/1/2020 | BBB | 7,500 | 7,533,750 | |||||||||||||||
|
| |||||||||||||||||||
| Total | 94,205,729 | |||||||||||||||||||
|
| |||||||||||||||||||
| Special Tax 1.73% | ||||||||||||||||||||
| Atlanta GA Tax Alloc Beltline Pj Ser B Rmkt | 6.75% | 1/1/2020 | NR | 3,000 | 3,168,000 | |||||||||||||||
| FL St Vlg Cmnty Dev Dist No 9 | 5.75% | 5/1/2021 | NR | 5,000 | 5,278,400 | |||||||||||||||
| FL St Vlg Cmnty Dev Dist No 9 | 6.75% | 5/1/2031 | NR | 3,000 | 3,159,630 | |||||||||||||||
| Glendale CA Redev Agy Tax Alloc Cent Glendale Redev Pj | 5.50% | 12/1/2024 | A | 6,000 | 6,067,860 | |||||||||||||||
| Houston Cnty AL Cooperative Dist Rev Country Crossing Pj | 10.00% | 5/1/2039 | NR | 5,000 | 3,111,850 | |||||||||||||||
| Mesquite NV Redev Agy Tax Alloc | 7.00% | 6/1/2019 | A- | 1,700 | 1,753,584 | |||||||||||||||
| Orlando FL Cmnty Redev Agy Tax Alloc Downtown Dist Ser A | 5.25% | 9/1/2021 | A1 | 6,415 | 7,017,305 | |||||||||||||||
See Notes to Financial Statements.
62
Schedule of Investments (continued)
INTERMEDIATE TAX FREE FUND September 30, 2011
| Investments | Interest Rate | Maturity Date | Credit Rating: S&P or Moody’s(a) | Principal Amount (000) | Fair Value | |||||||||||||||
| Special Tax (continued) | ||||||||||||||||||||
| Sparks NV Loc Impt Dist Ltd Oblig Dist No 3 | 6.50% | 9/1/2020 | NR | $ | 435 | $ | 428,627 | |||||||||||||
| Sparks NV Redev Agy Tax Redev Area No 1 | 4.50% | 1/15/2018 | A- | 1,210 | 1,204,688 | |||||||||||||||
| Sparks NV Redev Agy Tax Redev Area No 1 | 4.75% | 1/15/2019 | A- | 1,540 | 1,537,074 | |||||||||||||||
| Sparks NV Redev Agy Tax Redev Area No 1 | 5.375% | 1/15/2020 | A- | 1,675 | 1,721,582 | |||||||||||||||
| Sparks NV Tourism Impt Dist No 1 Sr Sales Tax Antic Ser A† | 6.50% | 6/15/2020 | B2 | 6,595 | 6,291,366 | |||||||||||||||
| Tempe AZ Pier Twn Lake Impt Dist | 5.00% | 1/1/2018 | Aa3 | 500 | 578,655 | |||||||||||||||
|
| |||||||||||||||||||
| Total | 41,318,621 | |||||||||||||||||||
|
| |||||||||||||||||||
| Tax Revenue 4.06% | ||||||||||||||||||||
| AL St Pub Sch & College Auth Cap Impt | 5.00% | 12/1/2016 | Aa1 | 3,500 | 4,149,460 | |||||||||||||||
| AL St Pub Sch & College Auth Cap Impt | 5.00% | 12/1/2022 | Aa1 | 500 | 561,785 | |||||||||||||||
| Denver CO City & Cnty Excise Ser A (AG) | 6.00% | 9/1/2023 | AA+ | 3,000 | 3,566,400 | |||||||||||||||
| IL St Build IL | 5.00% | 6/15/2019 | AAA | 5,000 | 5,831,750 | |||||||||||||||
| Martin Cnty TX Hosp Dist Ser A | 7.00% | 4/1/2031 | BBB+ | (d) | 3,250 | 3,330,438 | ||||||||||||||
| Metro Govt Nashville & Davidson Cnty TN Convtn Ctr Auth Ser A-1 | 5.00% | 7/1/2022 | A1 | 3,245 | 3,611,166 | |||||||||||||||
| Nassau Cnty NY Interim Fin Auth Sales Tax Secd Ser A | 5.00% | 11/15/2021 | AAA | 1,000 | 1,165,480 | |||||||||||||||
| New York City NY Transnl Fin Auth Fiscal 2009 Ser S1 | 5.00% | 7/15/2016 | AA- | 3,055 | 3,532,405 | |||||||||||||||
| New York City NY Transnl Fin Auth Sub Future Tax Secd Ser B | 5.00% | 11/1/2016 | AAA | 5,000 | 5,940,350 | |||||||||||||||
| NJ Econ Dev Auth Cigarette Tax | 5.50% | 6/15/2024 | BBB | 5,325 | 5,305,297 | |||||||||||||||
| NJ Econ Dev Auth Cigarette Tax | 5.625% | 6/15/2019 | BBB | 1,195 | 1,195,442 | |||||||||||||||
| NY St Dorm Auth Rev Non St Supp Debt Sch Dists Fing Pg Ser C (AG) | 5.00% | 10/1/2017 | AA+ | 5,000 | 5,712,150 | |||||||||||||||
| NY St Dorm Auth Rev St Pers Gen Purp Ser A | 5.00% | 3/15/2024 | AAA | 15,585 | 18,201,566 | |||||||||||||||
| Oneida Tribe of Indians WI† | 5.50% | 2/1/2021 | AA- | 3,000 | 3,261,900 | |||||||||||||||
| Orange Cnty FL Tourist Dev Ser A (NPFGC) | 5.00% | 10/1/2018 | A+ | 1,680 | 1,900,282 | |||||||||||||||
| Polk Cnty FL Transn Rev | 5.00% | 12/1/2021 | A1 | 2,825 | 3,192,165 | |||||||||||||||
| Puerto Rico Sales Tax Fing Corp 1st Sub Ser A | 5.25% | 8/1/2019 | A+ | 3,895 | 4,492,999 | |||||||||||||||
| Regl Transit Auth LA Sales Tax (AGM) | 5.00% | 12/1/2018 | AA+ | 1,000 | 1,157,870 | |||||||||||||||
| Regl Transit Auth LA Sales Tax (AGM) | 5.00% | 12/1/2019 | AA+ | 1,000 | 1,157,010 | |||||||||||||||
See Notes to Financial Statements.
63
Schedule of Investments (continued)
INTERMEDIATE TAX FREE FUND September 30, 2011
| Investments | Interest Rate | Maturity Date | Credit Rating: S&P or Moody’s(a) | Principal Amount (000) | Fair Value | |||||||||||||||
| Tax Revenue (continued) | ||||||||||||||||||||
| RI St Econ Dev Corp Grant Antic Dept Transn Ser A (AG) | 5.25% | 6/15/2020 | AA+ | $ | 6,495 | $ | 7,511,467 | |||||||||||||
| San Mateo Cnty CA Transn Auth Dist Ser A (NPFGC) | 4.50% | 6/1/2022 | AA | 1,830 | 1,931,455 | |||||||||||||||
| Territory of Guam Oblig Rev Section 30 Ser A | 5.375% | 12/1/2024 | BBB- | 1,000 | 1,026,820 | |||||||||||||||
| Territory of Guam Oblig Rev Section 30 Ser A | 5.50% | 12/1/2019 | BBB- | 1,000 | 1,086,050 | |||||||||||||||
| Virgin Islands Pub Fin Auth Rev Gross Rcpts Taxes Ln Nts (NPFGC)(FGIC) | 5.00% | 10/1/2018 | BBB+ | 1,000 | 1,070,480 | |||||||||||||||
| Virgin Islands Pub Fin Auth Rev Matching Fd Ln Diago Ser A | 6.75% | 10/1/2019 | Baa3 | 2,500 | 2,816,450 | |||||||||||||||
| Virgin Islands Pub Fin Auth Sr Lien Ser B | 5.00% | 10/1/2019 | BBB | 3,000 | 3,311,250 | |||||||||||||||
| Volusia Cnty FL Sales Tax Rev Sub Lien Sales Tax (AGM) | 5.00% | 10/1/2015 | Aa3 | 1,000 | 1,110,410 | |||||||||||||||
|
| |||||||||||||||||||
| Total | 97,130,297 | |||||||||||||||||||
|
| |||||||||||||||||||
| Tobacco 1.95% | ||||||||||||||||||||
| Buckeye OH Tob Sttlmnt Fing Auth Asset Bkd Sr Turbo Ser A-2 | 5.125% | 6/1/2024 | BB- | 8,495 | 6,471,661 | |||||||||||||||
| Buckeye OH Tob Sttlmnt Fing Auth Asset Bkd Sr Turbo Ser A-2 | 5.75% | 6/1/2034 | BB- | 1,360 | 976,017 | |||||||||||||||
| Buckeye OH Tob Sttlmnt Fing Auth Asset Bkd Sr Turbo Ser A-2 | 5.875% | 6/1/2030 | BB- | 9,500 | 7,128,515 | |||||||||||||||
| Golden St Tob Securitization Corp CA Asset Bkd Sr Ser A-1 | 5.00% | 6/1/2014 | A1 | 2,500 | 2,571,800 | |||||||||||||||
| Golden St Tob Securitization Corp CA Asset Bkd Sr Ser A-1 | 5.00% | 6/1/2033 | BB+ | 10,000 | 7,013,700 | |||||||||||||||
| Inland Empire Tob Securitization Auth CA Ser A | 4.625% | 6/1/2021 | B+ | (d) | 2,970 | 2,381,643 | ||||||||||||||
| Inland Empire Tob Securitization Auth CA Ser A | 5.00% | 6/1/2021 | B+ | (d) | 3,925 | 3,247,074 | ||||||||||||||
| MI Tob Sttlmnt Fin Auth Sr Ser A | 5.25% | 6/1/2022 | BBB | 6,180 | 5,236,005 | |||||||||||||||
| NY Tob Sttlmnt Fing Corp Asset Bkd Ser A1 | 5.50% | 6/1/2019 | AA- | 1,000 | 1,080,070 | |||||||||||||||
| Railsplitter IL Tob Sttlmnt Auth | 6.25% | 6/1/2024 | A- | 8,500 | 8,885,560 | |||||||||||||||
| SC Tob Sttlmnt Rev Mgmt Auth | 5.00% | 6/1/2018 | Aa3 | 1,820 | 1,821,984 | |||||||||||||||
|
| |||||||||||||||||||
| Total | 46,814,029 | |||||||||||||||||||
|
| |||||||||||||||||||
See Notes to Financial Statements.
64
Schedule of Investments (continued)
INTERMEDIATE TAX FREE FUND September 30, 2011
| Investments | Interest Rate | Maturity Date | Credit Rating: S&P or Moody’s(a) | Principal Amount (000) | Fair Value | |||||||||||||||
| Transportation 10.07% | ||||||||||||||||||||
| Atlanta GA Arpt Rev Ser C | 5.50% | 1/1/2021 | A1 | $ | 3,000 | $ | 3,555,870 | |||||||||||||
| CA Foothill Eastern Transn Corridor Agy Cap Apprec | 5.80% | 1/15/2020 | BBB- | 7,000 | 7,110,390 | |||||||||||||||
| CA Foothill Eastern Transn Corridor Agy Cap Apprec (NPFGC)(IBC) | 5.80% | 1/15/2020 | Baa1 | 3,495 | 3,550,116 | |||||||||||||||
| Camino Real Regl Mobility Auth TX St Spur 601 | 5.25% | 8/15/2018 | A1 | 500 | 560,995 | |||||||||||||||
| Cent TX Regl Mobility Auth Sr Lien | 5.75% | 1/1/2019 | BBB- | 750 | 833,730 | |||||||||||||||
| Cent TX Regl Mobility Auth Sr Lien | 5.75% | 1/1/2020 | BBB- | 1,000 | 1,106,210 | |||||||||||||||
| Cent TX Regl Mobility Auth Sr Lien | 5.75% | 1/1/2031 | BBB- | 2,000 | 2,032,740 | |||||||||||||||
| Chicago IL O’Hare Intl Arpt 3rd Lien Ser B | 5.00% | 1/1/2022 | A1 | 2,250 | 2,495,587 | |||||||||||||||
| Chicago IL O’Hare Intl Arpt Ser B (AGM) | 5.00% | 1/1/2020 | AA+ | 3,500 | 3,776,955 | |||||||||||||||
| Chicago IL Transit Auth Cap Grant Federal Transit Admin Section 5307-A (AG) | 5.25% | 6/1/2022 | AA+ | 2,800 | 2,989,112 | |||||||||||||||
| Clark Cnty NV Arpt Rev Sys Sub Lien Ser A (AMBAC) | 5.00% | 7/1/2016 | Aa3 | 250 | 279,538 | |||||||||||||||
| Clark Cnty NV Arpt Rev Sys Sub Lien Ser C (AGM) | 5.00% | 7/1/2022 | AA+ | 3,905 | 4,282,262 | |||||||||||||||
| Dallas TX Area Rapid Transit Sr Lien(b) | 5.00% | 12/1/2022 | AA+ | 635 | 723,287 | |||||||||||||||
| Dallas TX Area Rapid Transit Sr Lien(b) | 5.00% | 12/1/2023 | AA+ | 390 | 444,224 | |||||||||||||||
| Dallas TX Area Rapid Transit Sr Lien(b) | 5.00% | 12/1/2024 | AA+ | 515 | 586,603 | |||||||||||||||
| Dallas TX Area Rapid Transit Sr Lien(b) | 5.00% | 12/1/2028 | AA+ | 460 | 523,956 | |||||||||||||||
| E-470 Pub Hwy Auth CO Rev Cap Apprec Sr Ser B (NPFGC) | Zero Coupon | 9/1/2018 | Baa1 | 10,900 | 7,478,817 | |||||||||||||||
| E-470 Pub Hwy Auth CO Rev Ser D2 (NPFGC) | 5.00% | 9/1/2039 | Baa1 | 2,000 | 2,078,500 | |||||||||||||||
| Fairfax Cnty VA Econ Dev Auth Spl Tax Silver Line Phase I Pj | 5.00% | 4/1/2022 | AA | 4,790 | 5,644,632 | |||||||||||||||
| Fairfax Cnty VA Econ Dev Auth Spl Tax Silver Line Phase I Pj | 5.00% | 4/1/2023 | AA | 7,260 | 8,453,326 | |||||||||||||||
| FL St Dept of Transn Tpk Auth Rev Ser A | 5.00% | 7/1/2019 | AA- | 10,000 | 11,826,000 | |||||||||||||||
| FL St Dept of Transn Tpk Auth Rev Ser A | 5.00% | 7/1/2020 | AA- | 500 | 567,595 | |||||||||||||||
| GA St Rd & Twy Auth Rev Fed Hwy Grant Antic Bds Ser A | 5.00% | 6/1/2019 | Aa2 | 3,575 | 4,392,495 | |||||||||||||||
See Notes to Financial Statements.
65
Schedule of Investments (continued)
INTERMEDIATE TAX FREE FUND September 30, 2011
| Investments | Interest Rate | Maturity Date | Credit Rating: S&P or Moody’s(a) | Principal Amount (000) | Fair Value | |||||||||||||||
| Transportation (continued) | ||||||||||||||||||||
| HI St Arpts Sys Rev Ser B AMT | 5.00% | 7/1/2017 | A | $ | 10,000 | $ | 11,209,100 | |||||||||||||
| HI St Hwy Rev | 5.00% | 1/1/2016 | AA+ | 1,150 | 1,328,515 | |||||||||||||||
| IL Regl Transn Auth Ser A (NPFGC)(FGIC) | 5.50% | 7/1/2021 | AA | 1,000 | 1,186,490 | |||||||||||||||
| Jacksonville FL Transn Rev (NPFGC) | 5.00% | 10/1/2016 | Aa2 | 1,370 | 1,559,334 | |||||||||||||||
| KY St Tpk Auth Econ Revitalization Pjs Ser A | 5.00% | 7/1/2019 | AA+ | 4,040 | 4,753,060 | |||||||||||||||
| KY St Tpk Auth Econ Revitalization Pjs Ser A | 5.00% | 7/1/2022 | AA+ | 1,415 | 1,646,225 | |||||||||||||||
| Los Angeles CA Hrbr Dept Rev Ser B | 5.00% | 8/1/2024 | AA | 1,500 | 1,730,070 | |||||||||||||||
| MA Bay Transn Auth Sr Ser B | 5.25% | 7/1/2019 | AAA | 5,000 | 6,159,550 | |||||||||||||||
| MD St Econ Dev Corp Cnx Marine Terminals Inc | 5.75% | 9/1/2025 | BB | 1,500 | 1,500,945 | |||||||||||||||
| MD St Econ Dev Corp Term Pj Ser B | 5.125% | 6/1/2020 | Baa3 | 1,000 | 1,021,310 | |||||||||||||||
| MD St Econ Dev Corp Transn Facs Pj Ser A | 5.125% | 6/1/2020 | Baa3 | 2,590 | 2,645,193 | |||||||||||||||
| Metro Transn Auth NY Ser B | 5.00% | 11/15/2019 | AA | 1,375 | 1,633,693 | |||||||||||||||
| Metro Transn Auth NY Ser B | 5.00% | 11/15/2021 | A | 500 | 551,915 | |||||||||||||||
| MI St Grant Antic Bds (AGM) | 5.25% | 9/15/2018 | AA+ | 500 | 572,240 | |||||||||||||||
| MI St Trunk Line (AGM) | 5.25% | 11/1/2016 | AA+ | 3,000 | 3,532,980 | |||||||||||||||
| MI St Trunk Line (NPFGC)(FGIC) | 5.00% | 11/1/2012 | AA+ | 350 | 366,975 | |||||||||||||||
| Minneapolis & St. Paul MI Metro Arpt Commn Ser A (AMBAC) | 5.00% | 1/1/2024 | AA- | 10,000 | 10,821,300 | |||||||||||||||
| Minneapolis & St. Paul MI Metro Arpt Commn Ser B | 5.00% | 1/1/2020 | AA- | 2,190 | 2,563,285 | |||||||||||||||
| Montgomery Cnty TX Pass Thru | 4.00% | 3/1/2019 | AA | 2,435 | 2,738,279 | |||||||||||||||
| NJ St Transn Tr Fd Auth Transn Sys Ser B (NPFGC)(FGIC) | 5.25% | 12/15/2018 | A+ | 5,000 | 5,597,000 | |||||||||||||||
| North TX Twy Auth Rev Sys 1st Tier Ser A | 5.00% | 1/1/2012 | A2 | 500 | 504,690 | |||||||||||||||
| North TX Twy Auth Rev Sys 1st Tier Ser A | 6.25% | 1/1/2024 | A2 | 5,000 | 5,751,500 | |||||||||||||||
| NY St Thwy Auth Ser A-1 | 5.00% | 4/1/2024 | AA | 5,000 | 5,784,700 | |||||||||||||||
| OH St Major New St Infrastr Ser 2008-1 | 5.75% | 6/15/2019 | Aa1 | 1,000 | 1,208,060 | |||||||||||||||
| PA St Tpk Commn Ser A | 5.00% | 12/1/2022 | Aa3 | 3,500 | 4,090,590 | |||||||||||||||
| PA St Tpk Commn Ser A (AGM) | 5.25% | 7/15/2019 | AA+ | 1,270 | 1,497,724 | |||||||||||||||
| PA St Tpk Commn Ser B | 5.00% | 12/1/2017 | Aa3 | 13,940 | 16,218,772 | |||||||||||||||
| PA St Tpk Commn Sub Ser A (AG) | 5.00% | 6/1/2017 | AA+ | 3,500 | 3,998,365 | |||||||||||||||
| PA St Tpk Commn Sub Ser A (AG) | 5.00% | 6/1/2018 | AA+ | 2,500 | 2,859,500 | |||||||||||||||
| Phoenix AZ Civic Impt Corp Jr Lien Ser A | 5.00% | 7/1/2023 | A+ | 7,000 | 7,745,430 | |||||||||||||||
| Port Auth NY & NJ Spl Oblig JFK Intl Air Terminal Pj | 5.00% | 12/1/2020 | BBB- | 6,000 | 6,195,420 | |||||||||||||||
See Notes to Financial Statements.
66
Schedule of Investments (continued)
INTERMEDIATE TAX FREE FUND September 30, 2011
| Investments | Interest Rate | Maturity Date | Credit Rating: S&P or Moody’s(a) | Principal Amount (000) | Fair Value | |||||||||||||||
| Transportation (continued) | ||||||||||||||||||||
| Port of Seattle WA Passenger Ser A | 5.00% | 12/1/2020 | A+ | $ | 6,500 | $ | 7,483,190 | |||||||||||||
| Regl Transn Dist CO Denver Trans Partners | 5.00% | 7/15/2021 | Baa3 | 3,460 | 3,496,503 | |||||||||||||||
| Regl Transn Dist CO Denver Trans Partners | 5.00% | 1/15/2022 | Baa3 | 2,800 | 2,801,764 | |||||||||||||||
| Regl Transn Dist CO Denver Trans Partners | 5.125% | 1/15/2023 | Baa3 | 2,835 | 2,839,734 | |||||||||||||||
| Regl Transn Dist CO Denver Trans Partners | 5.125% | 7/15/2023 | Baa3 | 5,670 | 5,679,469 | |||||||||||||||
| San Jose CA Arpt Rev Ser A AMT (AMBAC) | 5.50% | 3/1/2018 | A | 500 | 560,880 | |||||||||||||||
| Southeastern PA Transn Auth Cap Grant Rcpts | 5.00% | 6/1/2023 | A+ | 2,500 | 2,802,725 | |||||||||||||||
| St. Louis MO Arpt Rev Lambert Intl Arpt Ser A (AGM) | 5.00% | 7/1/2017 | AA+ | 1,650 | 1,838,364 | |||||||||||||||
| St. Louis MO Arpt Rev Lambert Intl Arpt Ser A-1 | 5.125% | 7/1/2016 | A- | 1,920 | 2,148,403 | |||||||||||||||
| Triborough Bridge & Tunnel Auth (NPFGC) | 5.50% | 11/15/2021 | Aa3 | 10,000 | 12,244,400 | |||||||||||||||
| TX St Transn Commn 1st Tier | 5.00% | 4/1/2017 | AAA | 2,365 | 2,824,354 | |||||||||||||||
| WI St Transn Rev Ser A | 5.00% | 7/1/2019 | AA+ | 2,000 | 2,358,500 | |||||||||||||||
|
| |||||||||||||||||||
| Total | 241,343,436 | |||||||||||||||||||
|
| |||||||||||||||||||
| Utilities 18.90% | ||||||||||||||||||||
| Amer Muni Pwr OH Inc Hydroelec Pjs Ser C | 5.00% | 2/15/2017 | A | 1,550 | 1,718,609 | |||||||||||||||
| AZ Salt River Pj Agric Impt & Pwr Dist Rev Ser A | 5.00% | 1/1/2021 | Aa1 | 1,000 | 1,163,130 | |||||||||||||||
| Brazos River Auth TX Pollutn Ctrl TXU Elec Co Pj Ser C AMT | 5.75% | 5/1/2036 | CC | 3,350 | 3,338,644 | |||||||||||||||
| Brownsville TX Util Sys Rev CR (AGM)(AMBAC) | 5.00% | 9/1/2020 | AA+ | 4,800 | 5,191,680 | |||||||||||||||
| CA St Dept of Wtr Res Pwr Ser K | 5.00% | 5/1/2019 | AA- | 12,805 | 15,214,517 | |||||||||||||||
| CA St Dept of Wtr Res Pwr Supply Ser K | 5.00% | 5/1/2018 | AA- | 4,050 | 4,813,952 | |||||||||||||||
| Cape Fear Pub Util Auth NC Wtr & Swr Sys | 5.00% | 8/1/2018 | AA | 1,000 | 1,208,830 | |||||||||||||||
| Chicago IL Wst Wtr Transmission Rev Ser A (BHAC) | 5.50% | 1/1/2020 | AA+ | 1,250 | 1,411,363 | |||||||||||||||
| Dist of Columbia Wtr & Swr Auth Sub Lien Ser A (AG) | 5.00% | 10/1/2018 | AA+ | 1,000 | 1,189,740 | |||||||||||||||
| Enrg Northwest WA Elec Rev Columbia Generating Ser C | 5.00% | 7/1/2024 | Aa1 | 1,000 | 1,125,710 | |||||||||||||||
| Enrg Northwest WA Elec Rev Pj 3 Ser D | 5.00% | 7/1/2016 | Aa1 | 2,500 | 2,930,025 | |||||||||||||||
| Farmington NM Pollutn Ctrl Rev AZ Pub Svc Co Ser A | 4.70% | 5/1/2024 | BBB | 5,265 | 5,303,540 | |||||||||||||||
See Notes to Financial Statements.
67
Schedule of Investments (continued)
INTERMEDIATE TAX FREE FUND September 30, 2011
| Investments | Interest Rate | Maturity Date | Credit Rating: S&P or Moody’s(a) | Principal Amount (000) | Fair Value | |||||||||||||||
| Utilities (continued) | ||||||||||||||||||||
| Farmington NM Pollutn Ctrl Rev AZ Pub Svc Co Ser B | 4.70% | 9/1/2024 | BBB | $ | 6,000 | $ | 6,043,920 | |||||||||||||
| FL St Muni Pwr Agy Rev Pwr Ser A | 5.00% | 10/1/2016 | A2 | 2,170 | 2,477,641 | |||||||||||||||
| FL St Muni Pwr Agy Rev Pwr Ser A | 5.25% | 10/1/2022 | A2 | 3,115 | 3,552,595 | |||||||||||||||
| FL St Muni Pwr Agy Rev St. Lucie Pj Ser A | 5.00% | 10/1/2021 | A2 | 3,650 | 4,134,647 | |||||||||||||||
| Fulton Cnty GA Wtr & Swr Rev (NPFGC)(FGIC) | 5.00% | 1/1/2018 | AA- | 3,000 | 3,303,000 | |||||||||||||||
| GA St Envr Ln Acq Corp Loc GA Wtr Auth Ln | 4.00% | 3/15/2021 | Aaa | 7,500 | 8,177,175 | |||||||||||||||
| Grand River Dam Auth OK Rev Ser A (BHAC) | 5.00% | 6/1/2016 | AA+ | 1,000 | 1,159,730 | |||||||||||||||
| Hampton Rds Santn Dist VA | 5.00% | 4/1/2022 | AAA | 5,000 | 5,747,650 | |||||||||||||||
| Houston TX Util Sys Rev 1st Lien Ser A (NPFGC) | 5.25% | 5/15/2017 | AA | 2,400 | 2,871,120 | |||||||||||||||
| IA Fin Auth Rev Revolving Fd | 5.25% | 8/1/2020 | AAA | 2,500 | 2,964,850 | |||||||||||||||
| IL Fin Auth Gas Supply Peoples Gas Lt & Coke Co AMT (AMBAC) | 4.875% | 11/1/2038 | A1 | 7,500 | 7,763,325 | |||||||||||||||
| IL Fin Auth Rev Revolving Fd Master Tr | 5.25% | 9/1/2016 | AAA | 5,000 | 5,640,650 | |||||||||||||||
| IN Fin Auth IN Wstwtr 2nd Lien CWA Auth Ser B | 5.00% | 10/1/2020 | AA- | 5,000 | 5,685,650 | |||||||||||||||
| IN Fin Auth Pwr & Lt Co Ser C | 4.90% | 1/1/2016 | A3 | 10,000 | 11,001,500 | |||||||||||||||
| IN Muni Pwr Agy Ser B (NPFGC) | 5.25% | 1/1/2020 | A+ | 3,875 | 4,015,624 | |||||||||||||||
| Indianapolis IN Gas Util Rev Ser C (AG) | 5.00% | 6/1/2017 | AA+ | 3,140 | 3,502,356 | |||||||||||||||
| Indianapolis IN Loc Pub Impt Bd Bk Wtrwrks Pj Ser 2007 L (NPFGC) | 5.00% | 7/1/2019 | A+ | 500 | 561,025 | |||||||||||||||
| LA Pub Facs Auth Rev Cleco Pwr LLC Pj | 7.00% | 12/1/2038 | BBB | 3,500 | 3,529,295 | |||||||||||||||
| LA Pub Facs Auth Rev Enrg Gulf Sts Ser B | 2.875% | 11/1/2015 | A3 | 2,500 | 2,560,450 | |||||||||||||||
| Lakeland FL Enrg Sys Rev Ser B (AGM) | 5.00% | 10/1/2018 | AA+ | 3,975 | 4,594,822 | |||||||||||||||
| Lakeland FL Enrg Sys Rev Ser B (AGM) | 5.00% | 10/1/2019 | AA+ | 8,615 | 9,969,967 | |||||||||||||||
| Lansing MI Swr Disp Sys Rev (NPFGC)(FGIC) | 5.00% | 5/1/2014 | Aa2 | 90 | 98,564 | |||||||||||||||
| Las Vegas Vly NV Wtr Dist Wtr Impt Ser C | 2.50% | # | 6/1/2036 | AA+ | 3,500 | 3,500,000 | ||||||||||||||
| Long Beach CA Bd Fin Auth Natural Gas Ser A | 5.25% | 11/15/2020 | A | 500 | 508,665 | |||||||||||||||
| Long Island NY Pwr Auth Ser A | 5.00% | 5/1/2019 | A- | 1,000 | 1,161,740 | |||||||||||||||
| Long Island NY Pwr Auth Ser A | 5.00% | 5/1/2020 | A- | 2,930 | 3,398,800 | |||||||||||||||
| Long Island NY Pwr Auth Ser A (NPFGC)(FGIC) | 5.00% | 12/1/2019 | A- | 3,000 | 3,330,360 | |||||||||||||||
See Notes to Financial Statements.
68
Schedule of Investments (continued)
INTERMEDIATE TAX FREE FUND September 30, 2011
| Investments | Interest Rate | Maturity Date | Credit Rating: S&P or Moody’s(a) | Principal Amount (000) | Fair Value | |||||||||||||||
| Utilities (continued) | ||||||||||||||||||||
| Los Angeles CA Dept of Wtr & Pwr Sys Ser A | 5.00% | 7/1/2020 | AA- | $ | 10,000 | $ | 11,916,600 | |||||||||||||
| Los Angeles CA Dept of Wtr & Pwr Sys Ser A | 5.00% | 7/1/2022 | AA- | 4,250 | 5,061,962 | |||||||||||||||
| Los Angeles CA Solid Wst Ser A | 5.00% | 2/1/2020 | AA | 2,000 | 2,341,340 | |||||||||||||||
| Louisville & Jefferson Cnty KY Metro Swr Dist Ser A | 5.00% | 5/15/2019 | AA- | 4,705 | 5,529,786 | |||||||||||||||
| Louisville & Jefferson Cnty KY Metro Swr Dist Ser A | 5.00% | 5/15/2024 | AA- | 10,770 | 12,312,910 | |||||||||||||||
| Lower CO River Auth TX Rev Ser A | 5.00% | 5/15/2020 | A1 | 3,130 | 3,677,124 | |||||||||||||||
| Lower CO River Auth TX Rev Ser B | 5.00% | 5/15/2020 | A1 | 3,930 | 4,616,964 | |||||||||||||||
| MA St Dev Fin Agy Dominion Enrg Brayton 1 | 5.75% | 12/1/2042 | A- | 1,000 | 1,100,980 | |||||||||||||||
| Main St Natural Gas Inc GA Gas Pj Ser B | 5.00% | 3/15/2021 | A | 2,500 | 2,466,650 | |||||||||||||||
| MD St Econ Dev Corp Potomac Rmkt | 6.20% | 9/1/2022 | A | 1,650 | 1,960,860 | |||||||||||||||
| Metro Govt Nashville & Davidson Cnty TN Wtr & Swr Ser A (AGM) | 5.25% | 1/1/2019 | AA+ | 500 | 609,745 | |||||||||||||||
| Miami-Dade Cnty FL Wtr & Swr Sys Ser B (AGM) | 5.25% | 10/1/2018 | AA+ | 3,000 | 3,568,350 | |||||||||||||||
| MS Business Fin Corp Sys Enrg Res Inc Pj | 5.90% | 5/1/2022 | BBB | 5,250 | 5,266,957 | |||||||||||||||
| Muni Elec Auth GA Pj One Sub Ser A | 5.00% | 1/1/2014 | A | 1,145 | 1,248,806 | |||||||||||||||
| Muni Elec Auth GA Pj One Sub Ser A | 5.00% | 1/1/2021 | A | 4,000 | 4,620,240 | |||||||||||||||
| Muni Elec Auth GA Ser B | 5.00% | 1/1/2020 | A | 6,190 | 7,136,327 | |||||||||||||||
| Navajo Cnty AZ Pollutn Ctrl Corp Ser C | 5.50% | 6/1/2034 | BBB | 10,000 | 10,908,700 | |||||||||||||||
| NC Eastern Muni Pwr Agy Ser A | 5.00% | 1/1/2019 | A- | 2,245 | 2,601,573 | |||||||||||||||
| NC Eastern Muni Pwr Agy Ser B | 5.00% | 1/1/2020 | A- | 1,000 | 1,135,490 | |||||||||||||||
| NE Pub Pwr Dist Rev Ser B (AGM) | 5.00% | 1/1/2018 | AA+ | 3,000 | 3,512,190 | |||||||||||||||
| NJ Envr Infrastr Tr Ser A | 5.00% | 9/1/2016 | AAA | 2,515 | 2,992,749 | |||||||||||||||
| Northern CA Gas Auth No 1 | 0.885% | # | 7/1/2027 | A | 4,265 | 2,866,464 | ||||||||||||||
| Northern CA Pwr Agy Rev Geothermal Pj No 3 Ser A | 5.00% | 7/1/2017 | A1 | 1,000 | 1,174,900 | |||||||||||||||
| Northern CA Pwr Agy Rev Geothermal Pj No 3 Ser A | 5.00% | 7/1/2018 | A1 | 600 | 711,270 | |||||||||||||||
| Northwest IL Subn Muni Jt Action Wtr Agy | 5.00% | 5/1/2018 | Aa2 | 500 | 575,970 | |||||||||||||||
| NY St Enrg Resh & Dev Auth Rochester Gas & Elec Corp C (NPFGC) | 5.00% | 8/1/2032 | Baa1 | 5,000 | 5,237,150 | |||||||||||||||
| OH St Air Quality Dev Auth First Enrg Generation Ser A | 5.70% | 8/1/2020 | BBB- | 3,250 | 3,631,485 | |||||||||||||||
See Notes to Financial Statements.
69
Schedule of Investments (continued)
INTERMEDIATE TAX FREE FUND September 30, 2011
| Investments | Interest Rate | Maturity Date | Credit Rating: S&P or Moody’s(a) | Principal Amount (000) | Fair Value | |||||||||||||||
| Utilities (continued) | ||||||||||||||||||||
| OH St Air Quality Dev Auth First Enrg Nuclear Ser A | 5.75% | 6/1/2033 | BBB- | $ | 3,000 | $ | 3,434,400 | |||||||||||||
| OH St Air Quality Dev Auth OH Vly Elec Corp Ser E | 5.625% | 10/1/2019 | BBB- | 8,000 | 8,676,480 | |||||||||||||||
| Onslow NC Wtr & Swr Auth Ser A (NPFGC) | 5.00% | 6/1/2019 | A+ | 500 | 562,795 | |||||||||||||||
| PA Econ Dev Fing Auth Elec Utils Corp Rmkt | 4.00% | 10/1/2023 | A- | 20,000 | 19,607,600 | |||||||||||||||
| PA Econ Dev Fing Auth Philadelphia BioSolids Fac | 5.25% | 1/1/2016 | Baa3 | 2,225 | 2,267,943 | |||||||||||||||
| PA Econ Dev Fing Auth Philadelphia BioSolids Fac | 5.50% | 1/1/2018 | Baa3 | 1,030 | 1,044,008 | |||||||||||||||
| Philadelphia PA Gas Wrks Rev 8th 1998 Gen Ordinance Ser A | 5.00% | 8/1/2016 | BBB+ | 1,000 | 1,124,970 | |||||||||||||||
| Philadelphia PA Wtr & Wstwtr Ser A (AGM) | 5.00% | 6/15/2019 | AA+ | 2,500 | 2,872,650 | |||||||||||||||
| Phoenix AZ Civic Impt Corp Sr Lien | 5.50% | 7/1/2019 | AAA | 1,675 | 2,033,417 | |||||||||||||||
| Piedmont SC Muni Pwr Agy Ser A-2 | 5.00% | 1/1/2022 | A- | 4,750 | 5,384,267 | |||||||||||||||
| Piedmont SC Muni Pwr Agy Ser A-3 | 5.00% | 1/1/2019 | A- | 1,250 | 1,441,400 | |||||||||||||||
| Piedmont SC Muni Pwr Agy Ser A-3 | 5.00% | 1/1/2024 | A- | 7,920 | 8,771,321 | |||||||||||||||
| Piedmont SC Muni Pwr Agy Ser A-3 | 5.25% | 1/1/2019 | A- | 2,000 | 2,295,900 | |||||||||||||||
| Pima Cnty AZ Indl Dev Auth Tucson Elec Pwr Co San Juan Ser A | 4.95% | 10/1/2020 | BBB- | 10,200 | 10,682,154 | |||||||||||||||
| Pinal Cnty AZ Elec Dist No 4 | 6.00% | 12/1/2023 | A- | 525 | 562,737 | |||||||||||||||
| Pub Gas Partners Inc GA Ser A | 5.00% | 10/1/2019 | A+ | 5,950 | 6,328,301 | |||||||||||||||
| Puerto Rico Elec Pwr Auth Ser ZZ | 5.25% | 7/1/2019 | A3 | 2,000 | 2,222,480 | |||||||||||||||
| Rockport IN Pollutn Ctrl Rev MI Pwr Co Pj Ser A | 6.25% | 6/1/2025 | BBB | 2,500 | 2,767,475 | |||||||||||||||
| Sabine River Auth TX Pollutn Ctrl TXU Elec Co Pj Ser A | 5.50% | 5/1/2022 | CC | 1,620 | 1,616,549 | |||||||||||||||
| Sacramento CA Muni Util Dist Ser U (AGM)(b) | 5.00% | 8/15/2023 | AA+ | 780 | 854,977 | |||||||||||||||
| Sacramento CA Muni Util Dist Ser U (AGM)(b) | 5.00% | 8/15/2024 | AA+ | 620 | 679,598 | |||||||||||||||
| Sacramento CA Muni Util Dist Ser U (AGM)(b) | 5.00% | 8/15/2025 | AA+ | 620 | 679,598 | |||||||||||||||
| San Antonio TX Elec & Gas Ser A | 5.00% | 2/1/2018 | Aa1 | 1,000 | 1,198,990 | |||||||||||||||
| San Antonio TX Elec & Gas Ser A | 5.25% | 2/1/2020 | Aa1 | 5,000 | 6,014,750 | |||||||||||||||
| San Diego CA Pub Facs Fing Auth Sr Ser B | 5.00% | 5/15/2020 | Aa3 | 5,000 | 5,764,000 | |||||||||||||||
| SC St Pub Svc Auth Santee Cooper Ser A (NPFGC) | 5.00% | 1/1/2016 | AA- | 4,295 | 4,959,780 | |||||||||||||||
See Notes to Financial Statements.
70
Schedule of Investments (continued)
INTERMEDIATE TAX FREE FUND September 30, 2011
| Investments | Interest Rate | Maturity Date | Credit Rating: S&P or Moody’s(a) | Principal Amount (000) | Fair Value | |||||||||||||||
| Utilities (continued) | ||||||||||||||||||||
| Snohomish Cnty WA Pub Util Dist No 1 (AGM) | 5.00% | 12/1/2020 | AA+ | $ | 5,000 | $ | 5,473,750 | |||||||||||||
| TN Enrg Acq Corp Ser A | 5.25% | 9/1/2019 | Ba3 | 5,000 | 5,031,900 | �� | ||||||||||||||
| TN Enrg Acq Corp Ser A | 5.25% | 9/1/2020 | Ba3 | 2,630 | 2,642,861 | |||||||||||||||
| TN Enrg Acq Corp Ser C | 5.00% | 2/1/2017 | BBB | 5,000 | 5,138,300 | |||||||||||||||
| TN Enrg Acq Corp Ser C | 5.00% | 2/1/2018 | BBB | 1,055 | 1,069,759 | |||||||||||||||
| Tuscon AZ Wtr Rev (NPFGC)(FGIC) | 5.50% | 7/1/2018 | Aa2 | 4,100 | 4,316,480 | |||||||||||||||
| TX Muni Gas Acq & Supply Corp I Sr Lien Ser A | 5.25% | 12/15/2021 | A | 4,685 | 4,615,662 | |||||||||||||||
| TX Muni Gas Acq & Supply Corp I Sr Lien Ser A | 5.25% | 12/15/2023 | A | 2,925 | 2,773,719 | |||||||||||||||
| TX Muni Gas Acq & Supply Corp I Sr Lien Ser D | 5.625% | 12/15/2017 | A | 8,880 | 9,399,480 | |||||||||||||||
| TX Muni Pwr Agy Rev Sub Lien Transmission | 4.00% | 9/1/2017 | A+ | 2,000 | 2,209,980 | |||||||||||||||
| TX Muni Pwr Agy Rev Sub Lien Transmission | 4.00% | 9/1/2018 | A+ | 2,675 | 2,960,182 | |||||||||||||||
| VA Res Auth Sub-Clean Wtr St Revolving Fd | 5.00% | 10/1/2017 | AAA | 2,000 | 2,413,500 | |||||||||||||||
| VA Res Auth Sub-Clean Wtr St Revolving Fd | 5.00% | 10/1/2018 | AAA | 2,150 | 2,569,938 | |||||||||||||||
| Vernon CA Elec Sys Rev Ser A | 5.125% | 8/1/2021 | A- | 19,900 | 19,604,485 | |||||||||||||||
| Vernon CA Elec Sys Rev Ser A | 5.50% | 8/1/2015 | A- | 1,000 | 1,093,380 | |||||||||||||||
| Western Generation Agy OR Wauna Cogeneration Pj B AMT | 5.00% | 1/1/2012 | NR | 1,545 | 1,549,280 | |||||||||||||||
| Western Generation Agy OR Wauna Cogeneration Pj B AMT | 5.00% | 1/1/2016 | NR | 1,510 | 1,502,480 | |||||||||||||||
| WI Pub Pwr Inc Sys Ser A (AGM) | 5.00% | 7/1/2016 | AA+ | 2,795 | 3,191,247 | |||||||||||||||
| Wyandotte Cnty Kansas City KS Unif Govt Impt Brd Pub Utils Ser A | 5.00% | 9/1/2021 | A+ | 3,105 | 3,627,882 | |||||||||||||||
| Yuma AZ Muni Ppty Corp Util Sys Sr Lien (XLCA) | 5.00% | 7/1/2015 | A+ | 2,220 | 2,465,488 | |||||||||||||||
| Yuma AZ Muni Ppty Corp Util Sys Sr Lien (XLCA) | 5.00% | 7/1/2024 | A+ | 500 | 528,535 | |||||||||||||||
|
| |||||||||||||||||||
| Total | 452,675,231 | |||||||||||||||||||
|
| |||||||||||||||||||
| Total Municipal Bonds (cost $2,229,909,766) | 2,337,473,529 | |||||||||||||||||||
|
| |||||||||||||||||||
See Notes to Financial Statements.
71
Schedule of Investments (continued)
INTERMEDIATE TAX FREE FUND September 30, 2011
| Investments | Interest Rate | Maturity Date | Credit Rating: S&P or Moody’s(a) | Shares (000) | Fair Value | |||||||||||||||||||
| SHORT-TERM INVESTMENTS 1.97% | ||||||||||||||||||||||||
| Money Market Mutual Fund 0.00% | ||||||||||||||||||||||||
| Dreyfus Municipal Cash Management Plus (cost $1,775) | 2 | $ | 1,775 | |||||||||||||||||||||
|
| |||||||||||||||||||||||
| Interest Rate# | Interest Rate Reset Date(e) | Final Maturity Date | Principal | |||||||||||||||||||||
| Variable Rate Demand Notes 1.97% | ||||||||||||||||||||||||
| Corporate-Backed 0.09% | ||||||||||||||||||||||||
| Forsyth MT Pollutn Ctrl Rev Pacificorp Pj | 0.29% | 10/3/2011 | 1/1/2018 | AA | $ | 2,140 | 2,140,000 | |||||||||||||||||
|
| |||||||||||||||||||||||
| Education 0.34% | ||||||||||||||||||||||||
| Clark Cnty NV Econ Dev Rev Bishop Gorman High Sch Pj | 3.96% | 10/6/2011 | 2/1/2036 | Ba3 | 5,000 | 5,000,000 | ||||||||||||||||||
| NH Hlth & Edl Facs Auth Univ Sys Ser B | 0.20% | 10/3/2011 | 7/1/2033 | Aa3 | 3,000 | 3,000,000 | ||||||||||||||||||
|
| |||||||||||||||||||||||
| Total | 8,000,000 | |||||||||||||||||||||||
|
| |||||||||||||||||||||||
| General Obligation 1.01% | ||||||||||||||||||||||||
| New York City NY Sub Ser H-2 | 1.15% | 10/3/2011 | 1/1/2036 | A | 21,250 | 21,250,000 | ||||||||||||||||||
| New York City NY Sub Ser L-5 | 1.20% | 10/3/2011 | 4/1/2035 | AA | 3,000 | 3,000,000 | ||||||||||||||||||
|
| |||||||||||||||||||||||
| Total | 24,250,000 | |||||||||||||||||||||||
|
| |||||||||||||||||||||||
| Other Revenue 0.24% | ||||||||||||||||||||||||
| OR St Veterans Welfare Ser 85 | 0.50% | 10/3/2011 | 6/1/2041 | AA+ | 5,740 | 5,740,000 | ||||||||||||||||||
|
| |||||||||||||||||||||||
| Utilities 0.29% | ||||||||||||||||||||||||
| Las Vegas Vly NV Wtr Dist Wtr Impt Ser B | 2.50% | 10/3/2011 | 6/1/2036 | AA+ | 4,000 | 4,000,000 | ||||||||||||||||||
| New York City NY Muni Wtr Fin Auth Ser F-1 | 0.50% | 10/3/2011 | 6/15/2033 | AAA | 3,000 | 3,000,000 | ||||||||||||||||||
|
| |||||||||||||||||||||||
| Total | 7,000,000 | |||||||||||||||||||||||
|
| |||||||||||||||||||||||
| Total Variable Rate Demand Notes (cost $47,130,000) | 47,130,000 | |||||||||||||||||||||||
|
| |||||||||||||||||||||||
| Total Short-Term Investments (cost $47,131,775) | 47,131,775 | |||||||||||||||||||||||
|
| |||||||||||||||||||||||
| Total Investments in Securities 99.54% (cost $2,277,041,541) | 2,384,605,304 | |||||||||||||||||||||||
|
| |||||||||||||||||||||||
| Cash and Other Assets in Excess of Liabilities(i) 0.46% | 11,016,212 | |||||||||||||||||||||||
|
| |||||||||||||||||||||||
| Net Assets 100.00% | $ | 2,395,621,516 | ||||||||||||||||||||||
|
| |||||||||||||||||||||||
See Notes to Financial Statements.
72
Schedule of Investments (concluded)
INTERMEDIATE TAX FREE FUND September 30, 2011
Open Futures Contracts at September 30, 2011:
| Type | Expiration | Contracts | Position | Market Value | Unrealized Depreciation | |||||||||||
| U.S. 10-Year Treasury Note | December 2011 | 550 | Short | $ | (71,551,563) | $ | (404,858) | |||||||||
| U.S. 30-Year Treasury Bond | December 2011 | 246 | Short | (35,085,750) | (1,739,472) | |||||||||||
| Ultra Long U.S. Treasury Bond | December 2011 | 26 | Short | (4,124,250) | (419,498) | |||||||||||
|
|
|
| |||||||||||||
| Totals | $ | (110,761,563) | $ | (2,563,828) | ||||||||||||
|
|
|
| |||||||||||||
See Notes to Financial Statements.
73
Schedule of Investments
AMT FREE MUNICIPAL BOND FUND September 30, 2011
| Investments | Interest Rate | Maturity Date | Credit Rating: S&P or Moody’s(a) | Principal Amount (000) | Fair Value | |||||||||||||||
| MUNICIPAL BONDS 94.62% | ||||||||||||||||||||
| Corporate-Backed 6.92% | ||||||||||||||||||||
| Aleutians East Borough AK Aleutian Pribilof Islands Inc (ACA) | 5.50% | 6/1/2025 | NR | $ | 375 | $ | 326,606 | |||||||||||||
| CA Statewide Cmntys Dev Auth Sthn CA Ed Ser A | 4.50% | 9/1/2029 | A1 | 200 | 201,160 | |||||||||||||||
| Chicago IL O’Hare Intl Arpt Amer Airlines | 5.50% | 12/1/2030 | Caa2 | 100 | 76,254 | |||||||||||||||
| Dallas-Fort Worth TX Intl Arpt Facs Impt Corp Amer Airlines Inc | 6.00% | 11/1/2014 | CCC+ | 250 | 235,435 | |||||||||||||||
| FL St Citizens Ppty Ins Corp Sr Secd Coastal Ser A-1 | 5.00% | 6/1/2020 | A+ | 500 | 534,365 | |||||||||||||||
| IN St Fin Auth Impt US Steel Corp | 6.00% | 12/1/2026 | BB | 100 | 101,745 | |||||||||||||||
| LA Loc Govt Envr Facs & Cmnty Dev Auth Westlake Chem Corp Pjs | 6.75% | 11/1/2032 | BBB- | 250 | 262,647 | |||||||||||||||
| LA Loc Govt Envr Facs & Cmnty Dev Auth Westlake Chem Corp Ser A-1 | 6.50% | 11/1/2035 | BBB- | 150 | 157,103 | |||||||||||||||
| LA St Citizens Ppty Ins Corp Ser B (AMBAC) | 5.00% | 6/1/2021 | A- | 200 | 208,236 | |||||||||||||||
| Lorain Cnty OH Port Auth US Steel Corp Pj | 6.75% | 12/1/2040 | BB | 150 | 156,641 | |||||||||||||||
| Los Angeles CA Regl Arpts Impt Corp Facs Sublease Intl Arpt | 6.35% | 11/1/2025 | NR | 250 | 251,110 | |||||||||||||||
| Love Field TX Arpt Modernization Corp Southwest Airlines Co Pj | 5.25% | 11/1/2040 | BBB- | 500 | 482,645 | |||||||||||||||
| McIntosh AL Indl Dev Brd Ser C | 5.375% | 6/1/2028 | A+ | 580 | 581,688 | |||||||||||||||
| New York City NY Cap Res Corp Arthur Mgmt Corp Pj | 7.00% | 8/1/2025 | NR | 150 | 152,942 | |||||||||||||||
| Nez Perce Cnty ID Pollutn Ctrl Potlatch Corp Pj | 6.00% | 10/1/2024 | BB | 100 | 100,014 | |||||||||||||||
| OH St Air Quality Dev Auth Pwr Co Ser C (AMBAC) | 5.15% | 5/1/2026 | Baa1 | 100 | 100,051 | |||||||||||||||
| Port of Corpus Christi Auth of Nueces Cnty TX Celanese Pj Ser A | 6.45% | 11/1/2030 | B+ | 400 | 402,460 | |||||||||||||||
| Seminole Indian Tribe FL Ser 2010A Gaming Div† | 5.125% | 10/1/2017 | BBB- | 100 | 100,941 | |||||||||||||||
| Warren Cnty MS Gulf Intl Paper Ser A | 6.50% | 9/1/2032 | BBB | 285 | 311,077 | |||||||||||||||
|
| |||||||||||||||||||
| Total | 4,743,120 | |||||||||||||||||||
|
| |||||||||||||||||||
| Education 12.20% | ||||||||||||||||||||
| Allegheny Cnty PA Higher Ed Bldg Auth Duquesne Univ Ser A | 5.50% | 3/1/2029 | A2 | 130 | 141,959 | |||||||||||||||
| Brevard Cnty FL Indl Dev Rev Tuff FL Tech Pj | 6.50% | 11/1/2029 | BBB- | 200 | 208,258 | |||||||||||||||
See Notes to Financial Statements.
74
Schedule of Investments (continued)
AMT FREE MUNICIPAL BOND FUND September 30, 2011
| Investments | Interest Rate | Maturity Date | Credit Rating: S&P or Moody’s(a) | Principal Amount (000) | Fair Value | |||||||||||||||
| Education (continued) | ||||||||||||||||||||
| CA Edl Facs Auth Claremont McKenna College | 5.00% | 1/1/2032 | Aa2 | $ | 225 | $ | 238,066 | |||||||||||||
| CA Edl Facs Auth Rev Occidental College Ser A (NPFGC) | 5.00% | 10/1/2033 | Aa3 | 150 | 154,143 | |||||||||||||||
| CA Edl Facs Auth Rev Santa Clara Univ | 4.75% | 2/1/2032 | Aa3 | 100 | 102,833 | |||||||||||||||
| CA Edl Facs Auth Rev Santa Clara Univ | 5.50% | 4/1/2033 | Aa3 | 265 | 284,544 | |||||||||||||||
| CA St Pub Wrks Brd Regents Univ Ser E | 5.00% | 4/1/2034 | Aa2 | 100 | 102,446 | |||||||||||||||
| Dutchess Cnty NY Loc Dev Corp Anderson Ctr Svcs Inc Pj | 6.00% | 10/1/2030 | BB+ | 100 | 97,459 | |||||||||||||||
| Fulton Cnty GA Dev Auth Rev Spelman College | 5.00% | 6/1/2026 | A1 | 175 | 182,509 | |||||||||||||||
| Gainesville GA Redev Auth Edl Riverside Military Academy | 5.125% | 3/1/2027 | BBB- | (d) | 300 | 250,947 | ||||||||||||||
| Gainesville GA Redev Auth Edl Riverside Military Academy | 5.125% | 3/1/2037 | BBB- | (d) | 80 | 61,292 | ||||||||||||||
| Hempstead Twn NY Loc Dev Corp Adelphi Univ Pj | 4.625% | 6/1/2029 | A | 500 | 512,305 | |||||||||||||||
| IL Fin Auth Rev DePaul Univ Ser A | 6.00% | 10/1/2032 | A- | 260 | 284,593 | |||||||||||||||
| IL Fin Auth Rev IL Inst Tech Ser A | 5.00% | 4/1/2020 | Baa3 | 100 | 87,769 | |||||||||||||||
| IL Fin Auth Rev IL Inst Tech Ser A | 5.00% | 4/1/2031 | Baa3 | 500 | 381,410 | |||||||||||||||
| IL Univ Aux Sys Facs Ser A (AMBAC) | 5.00% | 4/1/2030 | Aa2 | 100 | 100,033 | |||||||||||||||
| LA St Univ & Agric & Mech College Aux Ser A | 5.00% | 7/1/2032 | A1 | 300 | 323,991 | |||||||||||||||
| MA St Dev Fin Agy Mount Holyoke College Ser B | 4.625% | 7/1/2036 | AA- | 560 | 568,350 | |||||||||||||||
| MA St Hlth & Edl Facs Auth Northeastern Univ Ser A | 4.875% | 10/1/2035 | A2 | 250 | 258,362 | |||||||||||||||
| McAllister Acade]mic Vlg LLC AZ St Univ Hassayampa | 5.25% | 7/1/2030 | AA- | 105 | 111,090 | |||||||||||||||
| NJ St Edl Facs Auth Kean Univ Ser A | 5.00% | 9/1/2024 | A2 | 100 | 108,267 | |||||||||||||||
| NJ St Edl Facs Auth Kean Univ Ser A | 5.25% | 9/1/2029 | A2 | 110 | 118,079 | |||||||||||||||
| NJ St Edl Facs Auth NJ Institute of Tech Ser H | 5.00% | 7/1/2031 | A+ | 500 | 516,770 | |||||||||||||||
| NY St Dorm Auth Rev Non St Supp Debt Cornell Univ Ser A | 5.00% | 7/1/2034 | Aa1 | 250 | 271,332 | |||||||||||||||
| NY St Dorm Auth Rev Non St Supp Debt Skidmore College Ser A | 5.25% | 7/1/2031 | A1 | 200 | 217,130 | |||||||||||||||
| NY St Dorm Auth Rev Non St Supp Debt The New Sch | 5.50% | 7/1/2040 | A- | 400 | 428,908 | |||||||||||||||
| NY St Dorm Auth Rev Non St Supp Debt The New Sch CR (AGM) | 5.00% | 7/1/2020 | AA+ | 115 | 131,704 | |||||||||||||||
See Notes to Financial Statements.
75
Schedule of Investments (continued)
AMT FREE MUNICIPAL BOND FUND September 30, 2011
| Investments | Interest Rate | Maturity Date | Credit Rating: S&P or Moody’s(a) | Principal Amount (000) | Fair Value | |||||||||||||||
| Education (continued) | ||||||||||||||||||||
| NY St Dorm Auth Rev Non St Supp Debt Yeshiva Univ Ser A | 5.00% | 11/1/2031 | AA- | $ | 500 | $ | 516,775 | |||||||||||||
| NY St Dorm Auth Rochester Inst Tech | 4.25% | 7/1/2032 | A1 | 430 | 427,631 | |||||||||||||||
| OH St Univ Gen Rcpts Ser A | 5.00% | 12/1/2028 | Aa1 | 415 | 453,259 | |||||||||||||||
| Pinellas Cnty FL Edl Facs Auth Eckerd College Pj (ACA) | 5.25% | 10/1/2029 | NR | 100 | 95,193 | |||||||||||||||
| Troy NY Indl Dev Auth Civic Fac Rensselaer Polytechnic | 5.00% | 9/1/2031 | A- | 120 | 122,058 | |||||||||||||||
| Troy NY Rensselaer Polytechnic Ser A | 5.00% | 9/1/2030 | A- | 500 | 510,425 | |||||||||||||||
|
| |||||||||||||||||||
| Total | 8,369,890 | |||||||||||||||||||
|
| |||||||||||||||||||
| General Obligation 11.37% | ||||||||||||||||||||
| Alameda Cnty CA Oakland Unif Sch Dist (NPFGC)(FGIC) | 5.00% | 8/1/2026 | A2 | 125 | 126,288 | |||||||||||||||
| Atlantic City NJ Brd Ed (AGM) | 6.00% | 4/1/2034 | AA+ | 550 | 628,210 | |||||||||||||||
| CA St (CIFG) | 4.50% | 8/1/2028 | A1 | 200 | 197,432 | |||||||||||||||
| CA St Var Purp | 5.00% | 4/1/2025 | A1 | 100 | 107,021 | |||||||||||||||
| CA St Var Purp | 5.00% | 9/1/2041 | A1 | 500 | 512,545 | |||||||||||||||
| CA St Var Purp | 6.50% | 4/1/2033 | A1 | 300 | 351,297 | |||||||||||||||
| CA St Var Purp CR (AGM) | 4.50% | 3/1/2033 | AA+ | 150 | 142,475 | |||||||||||||||
| Chicago IL Pk Dist Ser A(c) | 4.20% | 1/1/2031 | AA+ | 500 | 489,625 | |||||||||||||||
| Chicago IL Ser A | 5.25% | 1/1/2027 | Aa3 | 250 | 264,120 | |||||||||||||||
| Fraser MI Pub Sch Dist Bldg & Site Ser A | 5.75% | 5/1/2033 | AA- | 400 | 440,488 | |||||||||||||||
| Hudson Cnty NJ Impt Auth Ser A GTD | 5.75% | 1/1/2035 | Aa3 | 225 | 251,053 | |||||||||||||||
| IL St 1st Ser (NPFGC)(FGIC) | 5.125% | 2/1/2027 | A+ | 100 | 100,230 | |||||||||||||||
| Kendall Kane & Will Cntys IL Cmnty Unit Sch Dist No 308 Ser A(b)(c) | 5.00% | 2/1/2029 | Aa2 | 1,000 | 1,046,950 | |||||||||||||||
| Los Alamitos CA Unif Sch Dist Sch Facs Impt Dist No 1 | 5.50% | 8/1/2033 | Aa2 | 150 | 162,960 | |||||||||||||||
| Los Angeles CA Unif Sch Dist Election 2004 Ser F (FGIC) | 5.00% | 7/1/2030 | Aa2 | 450 | 467,649 | |||||||||||||||
| Los Rios CA Cmnty College Dist Election 2002 Ser D | 5.00% | 8/1/2029 | AA- | 100 | 107,279 | |||||||||||||||
| Nassau Cnty NY Ser A Rmkt | 5.00% | 12/1/2017 | A+ | 250 | 289,930 | |||||||||||||||
| Newport Mesa CA Unif Sch Dist Cap Apprec Election 2005 | Zero Coupon | 8/1/2035 | Aa1 | 500 | 125,430 | |||||||||||||||
| Newport Mesa CA Unif Sch Dist Cap Apprec Election 2005 | Zero Coupon | 8/1/2037 | Aa1 | 1,000 | 221,130 | |||||||||||||||
| Puerto Rico Comwlth Pub Impt | 5.00% | 7/1/2031 | Baa1 | 100 | 97,542 | |||||||||||||||
See Notes to Financial Statements.
76
Schedule of Investments (continued)
AMT FREE MUNICIPAL BOND FUND September 30, 2011
| Investments | Interest Rate | Maturity Date | Credit Rating: S&P or Moody’s(a) | Principal Amount (000) | Fair Value | |||||||||||||||
| General Obligation (continued) | ||||||||||||||||||||
| Puerto Rico Comwlth Pub Impt Ser A | 5.50% | 7/1/2032 | Baa1 | $ | 400 | $ | 400,856 | |||||||||||||
| Puerto Rico Comwlth Pub Impt Ser E | 5.50% | 7/1/2031 | Baa1 | 250 | 251,852 | |||||||||||||||
| Puerto Rico Comwlth Unref Bal Pub Impt Ser A | 5.25% | 7/1/2030 | Baa1 | 190 | 191,330 | |||||||||||||||
| Puerto Rico Pub Bldgs Auth Rev Govt Facs Ser P GTD | 6.25% | 7/1/2026 | Baa1 | 290 | 320,438 | |||||||||||||||
| Puerto Rico Pub Bldgs Auth Rev Govt Facs Ser P GTD | 6.75% | 7/1/2036 | Baa1 | 300 | 334,338 | |||||||||||||||
| San Bernardino CA Cmnty College Dist Election 2002 Ser A | 6.25% | 8/1/2033 | Aa2 | 150 | 168,160 | |||||||||||||||
|
| |||||||||||||||||||
| Total | 7,796,628 | |||||||||||||||||||
|
| |||||||||||||||||||
| Health Care 16.15% | ||||||||||||||||||||
| Alachua Cnty FL Indl Dev Rev North FL Ret Vlg | 5.875% | 11/15/2042 | NR | 250 | 196,853 | |||||||||||||||
| Allegheny Cnty PA Hosp Dev Auth Catholic Hlth East Issue | 5.375% | 11/15/2022 | A2 | 100 | 101,847 | |||||||||||||||
| Allegheny Cnty PA Hosp Dev Auth Hlth Sys West PA Ser A | 5.375% | 11/15/2040 | B+ | 100 | 83,341 | |||||||||||||||
| AZ Hlth Facs Auth Rev Banner Hlth Ser D | 5.50% | 1/1/2038 | AA- | 580 | 608,629 | |||||||||||||||
| Burlington Cnty NJ Bridge Commn The Evergreens Pj | 5.625% | 1/1/2038 | NR | 100 | 87,122 | |||||||||||||||
| Butler Cnty OH Hosp Facs Kettering Hlth Network Oblig | 5.00% | 4/1/2025 | A | 500 | 511,760 | |||||||||||||||
| Butler Cnty OH Hosp Facs Rev UC Hlth | 5.50% | 11/1/2040 | BBB+ | 100 | 97,587 | |||||||||||||||
| CA Hlth Facs Fing Auth Cedars Sinai Med Ctr | 5.00% | 8/15/2034 | A2 | 120 | 119,993 | |||||||||||||||
| CA Hlth Facs Fing Auth Cedars Sinai Med Ctr | 5.00% | 11/15/2034 | A2 | 190 | 189,991 | |||||||||||||||
| CA Hlth Facs Fing Auth Sutter Hlth Ser B | 5.50% | 8/15/2026 | AA- | 250 | 270,940 | |||||||||||||||
| CA Statewide Cmntys Dev Auth Catholic Hlthcare West Ser C | 5.625% | 7/1/2035 | A | 105 | 108,828 | |||||||||||||||
| CA Statewide Cmntys Dev Auth Catholic Hlthcare West Ser E | 5.50% | 7/1/2031 | A | 100 | 102,209 | |||||||||||||||
| CA Statewide Cmntys Dev Auth Daughters of Charity Hlth Ser A | 5.25% | 7/1/2030 | BBB | 100 | 86,559 | |||||||||||||||
| CA Statewide Cmntys Dev Auth Kaiser Permanente Ser A | 5.00% | 4/1/2031 | A+ | 110 | 110,628 | |||||||||||||||
| CA Statewide Cmntys Dev Auth Sr Living Sthn CA | 6.625% | 11/15/2024 | BBB | 110 | 120,410 | |||||||||||||||
| CO Hlth Facs Auth Rev Catholic Hlth Initiatives Ser D | 6.125% | 10/1/2028 | AA | 130 | 146,868 | |||||||||||||||
See Notes to Financial Statements.
77
Schedule of Investments (continued)
AMT FREE MUNICIPAL BOND FUND September 30, 2011
| Investments | Interest Rate | Maturity Date | Credit Rating: S&P or Moody’s(a) | Principal Amount (000) | Fair Value | |||||||||||||||
| Health Care (continued) | ||||||||||||||||||||
| CT St Hlth & Edl Facs Auth Hartford Hlthcare Ser A | 5.00% | 7/1/2032 | A | $ | 600 | $ | 605,946 | |||||||||||||
| CT St Hlth & Edl Facs Auth Yale New Haven Hosp Ser M | 5.75% | 7/1/2034 | Aa3 | 250 | 271,790 | |||||||||||||||
| Cumberland Cnty PA Muni Auth Asbury PA Oblig Grp | 5.25% | 1/1/2021 | NR | 140 | 138,275 | |||||||||||||||
| Cumberland Cnty PA Muni Auth Asbury PA Oblig Grp | 5.40% | 1/1/2022 | NR | 150 | 143,949 | |||||||||||||||
| Cumberland Cnty PA Muni Auth Diakon Lutheran | 6.25% | 1/1/2024 | BBB+ | (d) | 130 | 137,973 | ||||||||||||||
| Cumberland Cnty PA Muni Auth Diakon Lutheran Ministries Pj | 5.00% | 1/1/2036 | BBB+ | (d) | 100 | 87,984 | ||||||||||||||
| DeKalb GA Private Hosp Auth Children’s Hlthcare | 5.00% | 11/15/2029 | AA | 500 | 523,035 | |||||||||||||||
| Denver CO Hlth & Hosp Auth Ser A | 4.75% | 12/1/2036 | BBB | 350 | 293,937 | |||||||||||||||
| East Rochester NY Hsg Auth Rev Sr Living Woodland Vlg Pj | 5.50% | 8/1/2033 | NR | 160 | 135,542 | |||||||||||||||
| Howard Cnty MD Ret Cmnty Vantage Hse Fac Ser B | 5.25% | 4/1/2037 | NR | 100 | 72,558 | |||||||||||||||
| IL Fin Auth Rev Friendship Vlg Schaumburg | 7.125% | 2/15/2039 | BB- | (d) | 210 | 209,597 | ||||||||||||||
| IL Fin Auth Rev Northwestern Mem Hosp Ser A | 5.75% | 8/15/2030 | AA+ | 100 | 108,469 | |||||||||||||||
| IL Fin Auth Rev Rush Univ Med Ctr Ser B (NPFGC) | 5.25% | 11/1/2035 | A2 | 105 | 105,735 | |||||||||||||||
| IL Fin Auth Rev Rush Univ Med Ctr Ser C | 6.375% | 11/1/2029 | A2 | 100 | 107,661 | |||||||||||||||
| IL Fin Auth Rev Rush Univ Med Ctr Ser D | 6.375% | 11/1/2027 | A2 | 215 | 234,141 | |||||||||||||||
| IL Fin Auth Rev Univ of Chicago Med Ctr Ser C | 5.50% | 8/15/2036 | AA- | 30 | 31,702 | |||||||||||||||
| Lucas Cnty OH Hosp Rev ProMedica Hlthcare Ser A | 5.75% | 11/15/2031 | AA- | 300 | 322,851 | |||||||||||||||
| MA St Hlth & Edl Facs Auth Catholic Hlth East | 6.25% | 11/15/2032 | A | 500 | 557,300 | |||||||||||||||
| MA St Hlth & Edl Facs Auth Emerson Hosp Ser E (RADIAN) | 5.00% | 8/15/2035 | NR | 380 | 301,659 | |||||||||||||||
| Martin Cnty TX Hosp Dist Ser A | 7.25% | 4/1/2036 | BBB+ | (d) | 250 | 256,120 | ||||||||||||||
| MD St Hlth & Higher Edl Facs Auth Mercy Med Ctr | 6.25% | 7/1/2031 | BBB | 275 | 295,515 | |||||||||||||||
| ME Hlth & Higher Edl Facs Auth Gen Med Ctr | 6.75% | 7/1/2036 | Baa3 | 250 | 257,147 | |||||||||||||||
| MO St Hlth & Edl Facs Auth Cox Hlth | 5.50% | 11/15/2033 | A2 | 100 | 104,231 | |||||||||||||||
See Notes to Financial Statements.
78
Schedule of Investments (continued)
AMT FREE MUNICIPAL BOND FUND September 30, 2011
| Investments | Interest Rate | Maturity Date | Credit Rating: S&P or Moody’s(a) | Principal Amount (000) | Fair Value | |||||||||||||||
| Health Care (continued) | ||||||||||||||||||||
| Montgomery Cnty PA Higher Ed & Hlth Auth Catholic Hlth East | 6.25% | 11/15/2034 | A | $ | 105 | $ | 115,194 | |||||||||||||
| Montgomery Cnty PA Indl Dev Auth Rev Mtg Whitemarsh Continuing Care | 6.125% | 2/1/2028 | NR | 350 | 311,101 | |||||||||||||||
| New York City NY Hlth & Hosp Corp Hlth Sys Ser A | 5.00% | 2/15/2025 | Aa3 | 250 | 271,120 | |||||||||||||||
| NJ Econ Dev Auth First Mtg Seashore Gardens Pj | 5.375% | 11/1/2036 | NR | 250 | 191,710 | |||||||||||||||
| NY St Dorm Auth Rev Non St Supp Debt NYU Hosps Ctr Ser A | 5.75% | 7/1/2031 | BBB+ | 250 | 265,485 | |||||||||||||||
| San Buenaventura CA Cmnty Mem Hlth Sys | 8.00% | 12/1/2026 | BB | 500 | 553,880 | |||||||||||||||
| Sarasota Cnty FL Hlth Facs Auth Hlthcare Sarasota Manatee | 5.75% | 7/1/2045 | NR | 55 | 44,760 | |||||||||||||||
| Tulsa Cnty OK Indl Auth Sr Montereau Inc Pj Ser A | 6.875% | 11/1/2023 | NR | 300 | 312,804 | |||||||||||||||
| Westchester Cnty NY Hlthcare Corp Sr Lien Ser B | 6.00% | 11/1/2030 | A3 | 150 | 160,713 | |||||||||||||||
| WI St Hlth & Edl Facs Auth St. John’s Cmntys Inc Ser C-1 | 6.40% | 9/15/2015 | NR | 250 | 250,017 | |||||||||||||||
| WI St Hlth & Edl Facs Auth Wheaton Franciscan Hlthcare | 5.25% | 8/15/2023 | BBB+ | 350 | 355,824 | |||||||||||||||
|
| |||||||||||||||||||
| Total | 11,079,290 | |||||||||||||||||||
|
| |||||||||||||||||||
| Housing 0.36% | ||||||||||||||||||||
| Minneapolis MN Multi Fam Hsg Riverside Plaza Ser B | 6.00% | 11/1/2013 | NR | 250 | 250,012 | |||||||||||||||
|
| |||||||||||||||||||
| Lease Obligations 10.18% | ||||||||||||||||||||
| CA St Pub Wrks Brd CA Cmnty College Ser E (NPFGC)(FGIC) | 4.50% | 10/1/2027 | A2 | 100 | 97,769 | |||||||||||||||
| CA St Pub Wrks Brd Dept Forestry & Fire Ser E | 5.00% | 11/1/2032 | A2 | 350 | 338,047 | |||||||||||||||
| CA St Pub Wrks Brd Dept Gen Svcs Ser A | 5.00% | 4/1/2030 | A2 | 130 | 125,438 | |||||||||||||||
| CA St Pub Wrks Brd Var Cap Pjs Sub Ser A-1 | 5.75% | 3/1/2030 | A2 | 200 | 210,042 | |||||||||||||||
| Carrollton GA Payroll Dev Auth Antic Ctfs Athletic Pj | 6.25% | 6/15/2034 | A1 | 265 | 300,195 | |||||||||||||||
| Corona-Norco CA Unif Sch Dist COP Ser A (AGM) | 5.00% | 4/15/2031 | AA+ | 150 | 154,940 | |||||||||||||||
See Notes to Financial Statements.
79
Schedule of Investments (continued)
AMT FREE MUNICIPAL BOND FUND September 30, 2011
| Investments | Interest Rate | Maturity Date | Credit Rating: S&P or Moody’s(a) | Principal Amount (000) | Fair Value | |||||||||||||||
| Lease Obligations (continued) | ||||||||||||||||||||
| Dallas TX Civic Ctr Convtn Ref & Impt (AG) | 5.25% | 8/15/2038 | AA+ | $ | 450 | $ | 479,781 | |||||||||||||
| Delano-Earlimart Irrigation Dist COP Ser A | 5.00% | 2/1/2028 | AA- | 475 | 500,066 | |||||||||||||||
| Erie Cnty NY Indl Dev Agy Buffalo City Sch Dist Ser A | 5.00% | 5/1/2031 | AA- | 240 | 255,055 | |||||||||||||||
| Essex Cnty NJ Impt Auth Lease Newark Pj Ser A | 6.25% | 11/1/2030 | Baa1 | 250 | 268,222 | |||||||||||||||
| GA St Higher Ed Facs Auth USG Real Estate Fndtn I LLC Pj | 6.00% | 6/15/2028 | A2 | 125 | 136,026 | |||||||||||||||
| McLennan Cnty TX Pub Fac Corp | 6.625% | 6/1/2035 | AA- | 575 | 619,833 | |||||||||||||||
| MI St Bldg Auth Facs Pg Ser II A | 5.00% | 10/15/2025 | Aa3 | 400 | 435,876 | |||||||||||||||
| MI St Strategic Fd Ltd Cadillac Place Office Bldg Pj | 5.25% | 10/15/2031 | A+ | 250 | 261,910 | |||||||||||||||
| NJ Econ Dev Auth Sch Facs Constr Ser EE | 5.00% | 9/1/2022 | A+ | 400 | 446,024 | |||||||||||||||
| NJ Econ Dev Auth Sch Facs Constr Ser Z | 5.875% | 12/15/2034 | A+ | 100 | 111,351 | |||||||||||||||
| NJ Hlthcare Facs Fing Auth Hosp Asset Transformation Pg Ser A | 5.00% | 10/1/2028 | A+ | 120 | 123,926 | |||||||||||||||
| Pima Cnty AZ Indl Dev Auth Metro Police Fac Pj Ser A | 6.00% | 7/1/2041 | AA | 600 | 646,434 | |||||||||||||||
| RI St Econ Dev Corp Grant Antic Dept Transn Ser A (AG) | 5.25% | 6/15/2019 | AA+ | 250 | 293,825 | |||||||||||||||
| San Diego CA Pub Facs Fing Auth Master Ref Pj Ser A | 5.125% | 9/1/2030 | A2 | 250 | 253,828 | |||||||||||||||
| San Mateo Cnty CA Jt Pwrs Fing Auth Youth Svcs Campus Ser A | 5.00% | 7/15/2033 | AA+ | 275 | 283,099 | |||||||||||||||
| Univ of CT Ser A | 4.75% | 2/15/2029 | AA | 100 | 108,046 | |||||||||||||||
| VA Comwlth Transn Brd Tr Cap Pjs | 4.75% | 5/15/2035 | AA+ | 500 | 531,710 | |||||||||||||||
|
| |||||||||||||||||||
| Total | 6,981,443 | |||||||||||||||||||
|
| |||||||||||||||||||
| Other Revenue 5.28% | ||||||||||||||||||||
| Arlington TX Higher Ed Fin Corp Arlington Classics Academy | 7.65% | 8/15/2040 | BB+ | 155 | 157,666 | |||||||||||||||
| Austin TX Convtn Entrprse Inc 1st Tier Ser A CR (BHAC)(XLCA) | 5.00% | 1/1/2034 | AA+ | 200 | 205,546 | |||||||||||||||
| Austin TX Convtn Entrprse Inc 2nd Tier Ser B† | 5.75% | 1/1/2034 | Ba2 | 250 | 226,450 | |||||||||||||||
| Baltimore MD Cnvtn Ctr Sr Ser A (XLCA) | 5.25% | 9/1/2025 | BB+ | 100 | 92,810 | |||||||||||||||
| Baltimore MD Cnvtn Ctr Sub Ser B | 5.875% | 9/1/2039 | Ba2 | 250 | 229,080 | |||||||||||||||
| Dist of Columbia Rev Brookings Institution | 5.75% | 10/1/2039 | Aa3 | 125 | 137,170 | |||||||||||||||
| La Vernia TX Higher Ed Fin Corp Lifeschools of Dallas Ser A | 7.25% | 8/15/2031 | BBB- | 250 | 260,902 | |||||||||||||||
See Notes to Financial Statements.
80
Schedule of Investments (continued)
AMT FREE MUNICIPAL BOND FUND September 30, 2011
| Investments | Interest Rate | Maturity Date | Credit Rating: S&P or Moody’s(a) | Principal Amount (000) | Fair Value | |||||||||||||||
| Other Revenue (continued) | ||||||||||||||||||||
| MA St Dev Fin Agy Broad Institute Ser A | 5.25% | 4/1/2037 | AA- | $ | 400 | $ | 420,120 | |||||||||||||
| MD St Econ Dev Corp Sr Lien Pj Chesapeake Bay Ser A | 5.00% | 12/1/2031 | NR | 100 | 67,627 | |||||||||||||||
| New York City NY Indl Dev Agy Queens Baseball Stadium Pilot (AMBAC) | 5.00% | 1/1/2036 | BB+ | 465 | 405,950 | |||||||||||||||
| New York City NY Indl Dev Agy Queens Baseball Stadium Pilot (AMBAC) | 5.00% | 1/1/2039 | BB+ | 180 | 153,841 | |||||||||||||||
| New York City NY Tr Cultural Res Museum Modern Art Ser 1A | 5.00% | 4/1/2031 | Aa2 | 120 | 129,683 | |||||||||||||||
| New York City NY Tr Cultural Res Whitney Museum of Amer Art | 5.25% | 7/1/2026 | A | 500 | 539,430 | |||||||||||||||
| Philadelphia PA Auth Indl Dev Please Touch Museum Pj | 5.25% | 9/1/2036 | BBB- | 500 | 405,505 | |||||||||||||||
| WA DC Convtn & Sports Auth Sr Lien Convtn Ctr | 4.50% | 10/1/2030 | A1 | 100 | 94,619 | |||||||||||||||
| Yonkers NY Econ Dev Corp Charter Sch Edl Excellence Ser A | 6.25% | 10/15/2040 | BB+ | 100 | 95,129 | |||||||||||||||
|
| |||||||||||||||||||
| Total | 3,621,528 | |||||||||||||||||||
|
| |||||||||||||||||||
| Special Tax 1.28% | ||||||||||||||||||||
| Frederick Cnty MD Spl Oblig Urbana Cmnty Dev Auth Ser A | 5.00% | 7/1/2030 | A- | 100 | 101,764 | |||||||||||||||
| Hesperia CA Pub Fing Auth Redev & Hsg Pjs Ser A (XLCA) | 5.00% | 9/1/2031 | Ba1 | 200 | 142,898 | |||||||||||||||
| Hesperia CA Pub Fing Auth Redev & Hsg Pjs Ser A (XLCA) | 5.00% | 9/1/2037 | Ba1 | 165 | 110,433 | |||||||||||||||
| Lancaster CA Redev Agy Tax Alloc Comb Redev Pj Areas | 6.00% | 8/1/2024 | BBB+ | 150 | 152,415 | |||||||||||||||
| San Jose CA Spl Hotel Tax Convtn Ctr Expansion | 5.50% | 5/1/2024 | A2 | 350 | 373,597 | |||||||||||||||
|
| |||||||||||||||||||
| Total | 881,107 | |||||||||||||||||||
|
| |||||||||||||||||||
| Tax Revenue 3.72% | ||||||||||||||||||||
| Dist of Columbia Deeds Tax Ser B | 5.00% | 6/1/2023 | A1 | 110 | 120,055 | |||||||||||||||
| IL Regl Transn Auth Ser A (NPFGC)(FGIC) | 5.50% | 7/1/2022 | AA | 130 | 154,124 | |||||||||||||||
| IL St Sales Tax Rev 1st Ser (NPFGC)(FGIC) | 6.00% | 6/15/2024 | AAA | 125 | 151,358 | |||||||||||||||
| La Paz Cnty AZ Excise Tax Judgement Ser A (AGM) | 4.75% | 7/1/2036 | AA+ | 250 | 243,940 | |||||||||||||||
| Metro Transn Auth NY Ser A | 5.50% | 11/15/2039 | AA | 200 | 217,496 | |||||||||||||||
See Notes to Financial Statements.
81
Schedule of Investments (continued)
AMT FREE MUNICIPAL BOND FUND September 30, 2011
| Investments | Interest Rate | Maturity Date | Credit Rating: S&P or Moody’s(a) | Principal Amount (000) | Fair Value | |||||||||||||||
| Tax Revenue (continued) | ||||||||||||||||||||
| New York City NY Transnl Fin Auth Fiscal 2008 Ser S1 | 4.50% | 1/15/2038 | AA- | $ | 500 | $ | 504,600 | |||||||||||||
| NJ Econ Dev Auth Cigarette Tax | 5.50% | 6/15/2031 | BBB | 255 | 239,238 | |||||||||||||||
| NJ Econ Dev Auth Cigarette Tax | 5.75% | 6/15/2029 | BBB | 200 | 196,928 | |||||||||||||||
| Puerto Rico Sales Tax Fing Corp 1st Sub Ser A | 5.25% | 8/1/2027 | A+ | 200 | 214,970 | |||||||||||||||
| Puerto Rico Sales Tax Fing Corp 1st Sub Ser A | 5.375% | 8/1/2039 | A+ | 235 | 245,147 | |||||||||||||||
| Yorba Linda CA Redev Agy Tax Alloc Sub Lien Redev Pj Ser A | 6.50% | 9/1/2032 | A- | 250 | 262,453 | |||||||||||||||
|
| |||||||||||||||||||
| Total | 2,550,309 | |||||||||||||||||||
|
| |||||||||||||||||||
| Tobacco 5.00% | ||||||||||||||||||||
| Buckeye OH Tob Sttlmnt Fing Auth Asset Bkd Sr Turbo Ser A-2 | 5.75% | 6/1/2034 | BB- | 650 | 466,479 | |||||||||||||||
| Buckeye OH Tob Sttlmnt Fing Auth Asset Bkd Sr Turbo Ser A-2 | 5.875% | 6/1/2030 | BB- | 760 | 570,281 | |||||||||||||||
| Buckeye OH Tob Sttlmnt Fing Auth Asset Bkd Sr Turbo Ser A-2 | 6.50% | 6/1/2047 | BB- | 100 | 76,692 | |||||||||||||||
| Golden St Tob Securitization Corp CA Asset Bkd Sr Ser A-1 | 5.75% | 6/1/2047 | BB+ | 900 | 635,562 | |||||||||||||||
| Golden St Tob Securitization Corp CA Enhanced Asset Bkd Ser A (FGIC) | 5.00% | 6/1/2035 | A2 | 535 | 535,851 | |||||||||||||||
| Golden St Tob Securitization Corp CA Enhanced Asset Bkd Ser A (FGIC) | 5.00% | 6/1/2038 | A2 | 375 | 371,704 | |||||||||||||||
| IA Tob Sttlmnt Auth Asset Bkd Ser C | 5.625% | 6/1/2046 | BBB | 100 | 72,615 | |||||||||||||||
| MI Tob Sttlmnt Fin Auth Sr Ser A | 6.00% | 6/1/2048 | BB | 115 | 80,868 | |||||||||||||||
| NJ Tob Sttlmnt Fing Corp Ser 1A | 5.00% | 6/1/2041 | BB- | 100 | 64,643 | |||||||||||||||
| VA Tob Sttlmnt Fing Corp Sr Ser B1 | 5.00% | 6/1/2047 | BB- | 920 | 557,207 | |||||||||||||||
|
| |||||||||||||||||||
| Total | 3,431,902 | |||||||||||||||||||
|
| |||||||||||||||||||
| Transportation 11.95% | ||||||||||||||||||||
| Atlanta GA Arpt Rev Ser C | 5.00% | 1/1/2025 | A1 | 500 | 546,350 | |||||||||||||||
| Atlanta GA Arpt Rev Ser C | 5.25% | 1/1/2030 | A1 | 250 | 267,737 | |||||||||||||||
| Bay Area Toll Auth CA San Francisco Bay Area | 5.00% | 10/1/2033 | A+ | 200 | 209,738 | |||||||||||||||
| CA Foothill Eastern Transn Corridor Agy | 5.75% | 1/15/2040 | BBB- | 500 | 458,930 | |||||||||||||||
| Chicago IL O’Hare Intl Arpt 3rd Lien Ser A (AMBAC) | 5.00% | 1/1/2022 | A1 | 350 | 371,206 | |||||||||||||||
| Chicago IL O’Hare Intl Arpt 3rd Lien Ser A (NPFGC) | 5.00% | 1/1/2029 | A1 | 100 | 101,605 | |||||||||||||||
See Notes to Financial Statements.
82
Schedule of Investments (continued)
AMT FREE MUNICIPAL BOND FUND September 30, 2011
| Investments | Interest Rate | Maturity Date | Credit Rating: S&P or Moody’s(a) | Principal Amount (000) | Fair Value | |||||||||||||||
| Transportation (continued) | ||||||||||||||||||||
| Chicago IL O’Hare Intl Arpt 3rd Lien Ser A (NPFGC) | 5.00% | 1/1/2030 | A1 | $ | 100 | $ | 101,304 | |||||||||||||
| Chicago IL O’Hare Intl Arpt 3rd Lien Ser A1 (XLCA) | 5.25% | 1/1/2034 | A1 | 200 | 202,466 | |||||||||||||||
| Chicago IL O’Hare Intl Arpt 3rd Lien Ser F | 5.00% | 1/1/2035 | A1 | 110 | 111,700 | |||||||||||||||
| E-470 Pub Hwy Auth CO Rev Cap Apprec Sr Ser B (NPFGC) | Zero Coupon | 9/1/2027 | Baa1 | 100 | 35,382 | |||||||||||||||
| FL St Dept of Transn Tpk Auth Rev Ser A | 5.00% | 7/1/2034 | AA- | 500 | 539,555 | |||||||||||||||
| HI St Arpts Sys Rev Ser A | 5.25% | 7/1/2020 | A | 100 | 115,268 | |||||||||||||||
| IL St Toll Hwy Auth Sr Ser A1 | 5.00% | 1/1/2031 | AA- | 95 | 98,830 | |||||||||||||||
| Long Beach CA Arpt Sr Rev Ser B | 5.00% | 6/1/2040 | A2 | 150 | 153,161 | |||||||||||||||
| MA St Dept of Transn Ser B | 5.00% | 1/1/2032 | A | 180 | 188,653 | |||||||||||||||
| MA St Dept of Transn Ser B | 5.00% | 1/1/2037 | A | 150 | 156,365 | |||||||||||||||
| Metro Transn Auth NY Ser B | 4.75% | 11/15/2031 | A | 245 | 250,789 | |||||||||||||||
| Metro Transn Auth NY Ser B | 5.25% | 11/15/2029 | AA | 525 | 577,306 | |||||||||||||||
| Metro Transn Auth NY Ser G | 5.00% | 11/15/2021 | A | 130 | 149,249 | |||||||||||||||
| Metro WA DC Arpts Auth Ser A | 5.00% | 10/1/2030 | AA- | 400 | 428,080 | |||||||||||||||
| Metro WA DC Arpts Auth Ser A | 5.00% | 10/1/2035 | AA- | 205 | 217,331 | |||||||||||||||
| NJ St Transn Tr Fd Auth Transn Sys Ser A | 5.75% | 12/15/2031 | A+ | 250 | 278,755 | |||||||||||||||
| NJ St Transn Tr Fd Auth Transn Sys Ser A | 6.00% | 6/15/2035 | A+ | 150 | 173,902 | |||||||||||||||
| NJ St Transn Tr Fd Auth Transn Sys Ser B (NPFGC) | 5.50% | 12/15/2021 | A+ | 100 | 117,959 | |||||||||||||||
| North TX Twy Auth Rev Toll 2nd Tier Ser F | 5.75% | 1/1/2033 | A3 | 100 | 103,373 | |||||||||||||||
| Orlando & Orange Cnty FL Expwy Auth Ser C | 5.00% | 7/1/2030 | A | 435 | 462,501 | |||||||||||||||
| PA St Tpk Commn Spl Motor License Fd Ser A1 | 4.50% | 12/1/2038 | Aa3 | 130 | 132,483 | |||||||||||||||
| PA St Tpk Commn Sub Ser B-1 | 5.50% | 6/1/2033 | A- | 135 | 142,444 | |||||||||||||||
| Port of Seattle WA Passenger Facs Ser A | 5.00% | 12/1/2021 | A+ | 150 | 170,892 | |||||||||||||||
| Puerto Rico Comwlth Hwy & Transn Auth Ser E (AGM) | 5.50% | 7/1/2022 | AA+ | 100 | 112,241 | |||||||||||||||
| Regl Transn Dist CO Denver Trans Partners | 6.00% | 1/15/2034 | Baa3 | 185 | 190,835 | |||||||||||||||
| Regl Transn Dist CO Ser A COP | 5.375% | 6/1/2031 | Aa3 | 250 | 268,302 | |||||||||||||||
| San Antonio TX Arpt Sys Rev Impt Ser A (AGM) | 5.00% | 7/1/2026 | AA+ | 495 | 538,407 | |||||||||||||||
| San Francisco CA City & Cnty Arpts Commn Ser E | 5.25% | 5/1/2032 | A+ | 185 | 194,540 | |||||||||||||||
See Notes to Financial Statements.
83
Schedule of Investments (continued)
AMT FREE MUNICIPAL BOND FUND September 30, 2011
| Investments | Interest Rate | Maturity Date | Credit Rating: S&P or Moody’s(a) | Principal Amount (000) | Fair Value | |||||||||||||||
| Transportation (continued) | ||||||||||||||||||||
| TX St Tpk Auth Cent TX Tpk Cap Apprec (AMBAC) | Zero Coupon | 8/15/2032 | BBB+ | $ | 100 | $ | 27,142 | |||||||||||||
|
| |||||||||||||||||||
| Total | 8,194,781 | |||||||||||||||||||
|
| |||||||||||||||||||
| Utilities 10.21% | ||||||||||||||||||||
| Atlanta GA Wtr & Wst Wtr Rev Ser A | 6.00% | 11/1/2029 | A1 | 500 | 565,075 | |||||||||||||||
| CA St Dept of Wtr Res Pwr Ser L | 5.00% | 5/1/2021 | AA- | 300 | 353,235 | |||||||||||||||
| Chicago IL Wtr Rev 2nd Lien (AGM) | 5.00% | 11/1/2025 | AA+ | 100 | 107,186 | |||||||||||||||
| Colorado Springs CO Utils Ser D-1 | 5.25% | 11/15/2033 | AA | 150 | 166,368 | |||||||||||||||
| CT St Dev Auth Pollutn Ctrl Lt & Pwr Co Pj Ser A(c) | 4.375% | 9/1/2028 | A2 | 750 | 750,270 | |||||||||||||||
| Detroit MI Swr Disp Rev 2nd Lien Ser B (NPFGC)(FGIC) | 5.50% | 7/1/2029 | A | 530 | 569,973 | |||||||||||||||
| Detroit MI Wtr Supply Sys Sr Lien Ser A (NPFGC) | 5.00% | 7/1/2034 | A+ | 335 | 335,968 | |||||||||||||||
| Detroit MI Wtr Supply Sys Sr Lien Ser A (NPFGC)(FGIC) | 4.50% | 7/1/2031 | A+ | 100 | 98,196 | |||||||||||||||
| FL St Muni Pwr Agy Rev All Requirements Pwr Ser A | 5.25% | 10/1/2019 | A2 | 150 | 176,967 | |||||||||||||||
| Gainesville FL Utils Sys Rev Ser C | 5.25% | 10/1/2034 | AA | 150 | 162,509 | |||||||||||||||
| IL Fin Auth Gas Supply Peoples Gas Lt & Coke (AMBAC) | 5.00% | 2/1/2033 | A1 | 190 | 191,632 | |||||||||||||||
| JEA FL Wtr & Swr Sys Rev Ser E | 4.50% | 10/1/2039 | Aa2 | 100 | 101,196 | |||||||||||||||
| Long Island NY Pwr Auth Ser A | 5.00% | 5/1/2038 | A- | 500 | 520,835 | |||||||||||||||
| Lower CO River Auth TX Impt LCRA Transn Svcs | 5.00% | 5/15/2030 | A | 100 | 106,023 | |||||||||||||||
| M-S-R Enrg Auth CA Gas Rev Ser C | 6.50% | 11/1/2039 | A | 400 | 440,336 | |||||||||||||||
| MS Business Fin Corp Sys Enrg Res Inc Pj | 5.90% | 5/1/2022 | BBB | 350 | 351,130 | |||||||||||||||
| New York City NY Muni Wtr Fin Auth 2nd Gen Resolution Ser GG-1 | 5.25% | 6/15/2032 | AA+ | 100 | 110,432 | |||||||||||||||
| North Sumter Cnty FL Util Dependent Dist | 5.375% | 10/1/2030 | BBB | 200 | 195,234 | |||||||||||||||
| NY St Envr Facs Corp Ser A | 5.125% | 6/15/2038 | AA+ | 500 | 542,770 | |||||||||||||||
| PA Econ Dev Fing Auth Philadelphia BioSolids Fac | 6.25% | 1/1/2032 | Baa3 | 55 | 57,884 | |||||||||||||||
| Palm Beach Cnty FL Solid Wst Auth Impt | 5.25% | 10/1/2021 | AA+ | 100 | 116,186 | |||||||||||||||
| Rowland CA Wtr Dist Recycled Wtr Pj COP | 6.50% | 12/1/2035 | AA- | 100 | 113,289 | |||||||||||||||
See Notes to Financial Statements.
84
Schedule of Investments (continued)
AMT FREE MUNICIPAL BOND FUND September 30, 2011
| Investments | Interest Rate | Maturity Date | Credit Rating: S&P or Moody’s(a) | Principal Amount (000) | Fair Value | |||||||||||||||||||
| Utilities (continued) | ||||||||||||||||||||||||
| SA Enrg Acq Pub Fac Corp TX Gas Supply Rev | 5.50% | 8/1/2020 | A | $ | 100 | $ | 103,452 | |||||||||||||||||
| San Francisco CA City & Cnty Pub Util Commn Sub Ser A | 4.50% | 11/1/2038 | AA- | 510 | 516,584 | |||||||||||||||||||
| TN Enrg Acq Corp Ser C | 5.00% | 2/1/2025 | BBB | 255 | 250,364 | |||||||||||||||||||
|
| |||||||||||||||||||||||
| Total | 7,003,094 | |||||||||||||||||||||||
|
| |||||||||||||||||||||||
| Total Municipal Bonds (cost $61,752,460) | 64,903,104 | |||||||||||||||||||||||
|
| |||||||||||||||||||||||
Interest | Interest Rate Reset Date(e) | Final Maturity Date | ||||||||||||||||||||||
| SHORT-TERM INVESTMENTS 3.53% | ||||||||||||||||||||||||
| Variable Rate Demand Notes | ||||||||||||||||||||||||
| Corporate-Backed 0.73% | ||||||||||||||||||||||||
| Forsyth MT Pollutn Ctrl Rev Pacificorp Pj | 0.29% | 10/3/2011 | 1/1/2018 | AA | 500 | 500,000 | ||||||||||||||||||
|
| |||||||||||||||||||||||
| General Obligation 0.73% | ||||||||||||||||||||||||
| New York City NY Sub Ser A-4 | 0.23% | 10/3/2011 | 8/1/2022 | Aaa | 500 | 500,000 | ||||||||||||||||||
|
| |||||||||||||||||||||||
| Other Revenue 0.51% | ||||||||||||||||||||||||
| MA St Hlth & Edl Facs Auth Cap Asset Pg Ser E | 0.17% | 10/3/2011 | 1/1/2035 | A2 | 350 | 350,000 | ||||||||||||||||||
|
| |||||||||||||||||||||||
| Utilities 1.56% | ||||||||||||||||||||||||
| FL St Muni Pwr Agy All Requirements Pwr Ser E | 0.24% | 10/3/2011 | 10/1/2030 | Aa2 | 100 | 100,000 | ||||||||||||||||||
| Gainesville FL Utils Sys Rev Ser A | 0.20% | 10/3/2011 | 10/1/2026 | AA | 570 | 570,000 | ||||||||||||||||||
| Las Vegas Vly NV Wtr Dist Wtr Impt Ser B | 2.50% | 10/3/2011 | 6/1/2036 | AA+ | 400 | 400,000 | ||||||||||||||||||
|
| |||||||||||||||||||||||
| Total | 1,070,000 | |||||||||||||||||||||||
|
| |||||||||||||||||||||||
| Total Short-Term Investments (cost $2,420,000) | 2,420,000 | |||||||||||||||||||||||
|
| |||||||||||||||||||||||
| Total Investments in Securities 98.15% (cost $64,172,460) | 67,323,104 | |||||||||||||||||||||||
|
| |||||||||||||||||||||||
| Cash and Other Assets in Excess of Liabilities(i) 1.85% | 1,268,236 | |||||||||||||||||||||||
|
| |||||||||||||||||||||||
| Net Assets 100.00% | $ | 68,591,340 | ||||||||||||||||||||||
|
| |||||||||||||||||||||||
See Notes to Financial Statements.
85
Schedule of Investments (concluded)
AMT FREE MUNICIPAL BOND FUND September 30, 2011
Open Futures Contracts at September 30, 2011:
| Type | Expiration | Contracts | Position | Market Value | Unrealized Depreciation | |||||||||||
| U.S. 30-Year Treasury Bond | December 2011 | 29 | Short | $ | (4,136,125) | $ | (183,910) | |||||||||
See Notes to Financial Statements.
86
Schedule of Investments
NATIONAL TAX FREE FUND September 30, 2011
| Investments | Interest Rate | Maturity Date | Credit Rating: S&P or Moody’s(a) | Principal Amount (000) | Fair Value | |||||||||||||||
| MUNICIPAL BONDS 109.35% | ||||||||||||||||||||
| Corporate-Backed 6.58% | ||||||||||||||||||||
| AL St Indl Dev Auth Solid Pine City Fiber Co Rmkt AMT | 6.45% | 12/1/2023 | B2 | $ | 2,915 | $ | 2,573,683 | |||||||||||||
| Allegheny Cnty PA Indl Dev Auth Envr Impt | 6.875% | 5/1/2030 | BB | 5,000 | 5,296,050 | |||||||||||||||
| Allegheny Cnty PA Indl Dev Auth Resdl Res Inc Pj | 5.10% | 9/1/2026 | BBB- | (d) | 880 | 793,003 | ||||||||||||||
| Alliance Arpt Auth Inc TX Spl Facs Amer Airlines Inc Pj AMT | 5.25% | 12/1/2029 | CCC+ | 4,300 | 2,794,570 | |||||||||||||||
| Bayonne NJ Redev Agy Royal Caribbean Pj Ser A AMT | 5.375% | 11/1/2035 | BB | 1,100 | 937,376 | |||||||||||||||
| Chicago IL O’Hare Intl Arpt Delta Airlines Inc Term | 6.45% | 5/1/2018 | NR | 2,335 | 2,334,767 | |||||||||||||||
| Clayton Cnty GA Dev Auth Delta Airlines Ser B AMT | 9.00% | 6/1/2035 | CCC+ | 3,575 | 3,859,927 | |||||||||||||||
| Cleveland OH Arpt Spl Rev Continental Airlines Inc Pj AMT | 5.375% | 9/15/2027 | B3 | 1,015 | 864,932 | |||||||||||||||
| Columbus Cnty NC Indl Facs & Pollutn Ctrl Fing Auth Intl Paper | 5.70% | 5/1/2034 | BBB | 2,000 | 2,028,320 | |||||||||||||||
| Dallas-Fort Worth TX Intl Arpt Facs Impt Corp Sub Ser 2 Rmkt AMT | 9.00% | 5/1/2029 | CCC+ | 2,000 | 1,955,380 | |||||||||||||||
| Greater Orlando FL Aviation Auth Spl Purp JetBlue Airways Corp AMT | 6.375% | 11/15/2026 | NR | 3,750 | 3,638,400 | |||||||||||||||
| Greater Orlando FL Aviation Auth Spl Purp JetBlue Airways Corp AMT | 6.50% | 11/15/2036 | NR | 655 | 628,394 | |||||||||||||||
| Gulf Coast Wst Disp Auth TX Wst Mgmt of TX Ser A AMT | 5.20% | 5/1/2028 | BBB | 3,195 | 3,214,298 | |||||||||||||||
| IL Fin Auth Sports Fac Leafs Hockey Club Pj Ser A(f) | 6.00% | 3/1/2037 | NR | 1,550 | 389,949 | |||||||||||||||
| IL Fin Auth Sports Fac Utd Sports Org of Barrington Ser A† | 6.25% | 10/1/2037 | NR | 2,000 | 500,000 | |||||||||||||||
| Intl Falls MN Pollutn Ctrl Boise Cascade Corp Pj | 5.65% | 12/1/2022 | B- | 1,000 | 867,860 | |||||||||||||||
| LA Loc Govt Envr Facs & Cmnty Dev Auth Westlake Chem Corp Pjs | 6.75% | 11/1/2032 | BBB- | 11,000 | 11,556,490 | |||||||||||||||
| LA St Citizens Ppty Ins Corp Ser B (AMBAC) | 5.00% | 6/1/2021 | A- | 3,380 | 3,519,188 | |||||||||||||||
| Little River Cnty AR Rev GA Pacific Corp Pj AMT | 5.60% | 10/1/2026 | Baa3 | 8,500 | 8,331,190 | |||||||||||||||
See Notes to Financial Statements.
87
Schedule of Investments (continued)
NATIONAL TAX FREE FUND September 30, 2011
| Investments | Interest Rate | Maturity Date | Credit Rating: S&P or Moody’s(a) | Principal Amount (000) | Fair Value | |||||||||||||||
| Corporate-Backed (continued) | ||||||||||||||||||||
| Lorain Cnty OH Port Auth US Steel Corp Pj | 6.75% | 12/1/2040 | BB | $ | 4,850 | $ | 5,064,709 | |||||||||||||
| Los Angeles CA Regl Arpts Impt Corp Facs Sublease Intl Arpt | 6.35% | 11/1/2025 | NR | 1,750 | 1,757,770 | |||||||||||||||
| MA St Port Auth Spl Delta Airlines Inc Pj Ser A AMT (AMBAC) | 5.50% | 1/1/2019 | NR | 1,495 | 1,335,484 | |||||||||||||||
| MD St Econ Dev Corp Sr Lien Pj Chesapeake Bay Ser A | 5.00% | 12/1/2016 | NR | 1,000 | 844,260 | |||||||||||||||
| New Haven CT Solid Wst Auth | 5.375% | 6/1/2028 | A | 1,500 | 1,623,030 | |||||||||||||||
| New York City NY Cap Res Corp Arthur Mgmt Corp Pj | 7.00% | 8/1/2025 | NR | 9,150 | 9,329,431 | |||||||||||||||
| New York City NY Indl Dev Agy British Airways Plc Pj AMT | 5.25% | 12/1/2032 | BB- | 775 | 648,040 | |||||||||||||||
| New York City NY Indl Dev Agy JetBlue Airways Corp Pj AMT | 5.00% | 5/15/2020 | B- | 1,745 | 1,574,322 | |||||||||||||||
| NJ Econ Dev Auth Glimcher Pptys LP Pj AMT | 6.00% | 11/1/2028 | NR | 1,480 | 1,335,152 | |||||||||||||||
| NJ Econ Dev Auth Spl Fac Continental Airlines Inc Pj AMT | 5.50% | 4/1/2028 | B3 | 1,215 | 1,066,381 | |||||||||||||||
| Onondaga Cnty NY Indl Dev Agy Bristol-Myers Squibb Co Pj AMT | 5.75% | 3/1/2024 | A+ | 2,000 | 2,253,880 | |||||||||||||||
| PA Econ Dev Fing Auth US Airways Grp Ser A | 7.50% | 5/1/2020 | CCC+ | 1,500 | 1,511,160 | |||||||||||||||
| PA Econ Dev Fing Auth US Airways Grp Ser B | 8.00% | 5/1/2029 | CCC+ | 1,500 | 1,550,490 | |||||||||||||||
| Port of St. Helen’s OR Pollutn Ctrl Boise Cascade Corp Pj | 5.65% | 12/1/2027 | B- | 1,730 | 1,410,625 | |||||||||||||||
| Puerto Rico Ports Auth Rev Spl Facs Amer Airlines Ser A AMT | 6.25% | 6/1/2026 | CCC+ | 5,715 | 4,760,938 | |||||||||||||||
| Selma AL Indl Dev Brd Rev Gulf Opportunity Zone Ser A | 6.25% | 11/1/2033 | BBB | 2,500 | 2,637,425 | |||||||||||||||
| Seneca NY Nation Indians Cap Impts Auth Ser A† | 5.25% | 12/1/2016 | BB | 500 | 471,900 | |||||||||||||||
| Virgin Islands Pub Fin Auth Sr Secd Hovensa Refinery AMT | 4.70% | 7/1/2022 | Ba2 | 10,250 | 8,627,220 | |||||||||||||||
| West Pace Cooperative Dist AL Rev | 9.125% | 5/1/2039 | NR | 5,000 | 4,604,100 | |||||||||||||||
|
| |||||||||||||||||||
| Total | 108,490,094 | |||||||||||||||||||
|
| |||||||||||||||||||
See Notes to Financial Statements.
88
Schedule of Investments (continued)
NATIONAL TAX FREE FUND September 30, 2011
| Investments | Interest Rate | Maturity Date | Credit Rating: S&P or Moody’s(a) | Principal Amount (000) | Fair Value | |||||||||||||||
| Education 9.12% | ||||||||||||||||||||
| Acalanes CA Union High Sch Dist Cap Apprec Election 2008 Ser B (6.55% after 8/1/2024)~ | Zero Coupon | 8/1/2039 | Aa1 | $ | 17,615 | $ | 8,793,056 | |||||||||||||
| Allegheny Cnty PA Higher Ed Bldg Auth Duquesne Univ | 5.00% | 3/1/2028 | A2 | 1,515 | 1,590,205 | |||||||||||||||
| Allegheny Cnty PA Higher Ed Bldg Auth Duquesne Univ | 5.00% | 3/1/2033 | A2 | 1,000 | 1,034,260 | |||||||||||||||
| Athens-Clarke Cnty GA Unif Govt Dev Auth Univ of GA Cent Precinct LLC | 5.00% | 6/15/2031 | Aa2 | 2,500 | 2,648,425 | |||||||||||||||
| Athens-Clarke Cnty GA Unif Govt Dev Auth Univ of GA O’Malleys Bldg LLC Pj | 5.00% | 6/15/2028 | Aa2 | 2,000 | 2,168,440 | |||||||||||||||
| Brevard Cnty FL Indl Dev Rev Tuff FL Tech Pj | 6.50% | 11/1/2029 | BBB- | 2,500 | 2,603,225 | |||||||||||||||
| Buffalo & Erie Cnty NY Indl Land Dev Corp Buffalo St College Fndtn Hsg | 5.375% | 10/1/2041 | A+ | 2,040 | 2,149,222 | |||||||||||||||
| Bulloch Cnty GA Dev Auth GA Sthn Univ Hsg Fndtn Four (AG) | 5.25% | 7/1/2028 | Aa3 | 2,465 | 2,701,689 | |||||||||||||||
| CA Muni Fin Auth Rev Biola Univ | 5.80% | 10/1/2028 | Baa1 | 1,000 | 1,039,930 | |||||||||||||||
| CA Statewide Cmntys Dev Auth Windrush Sch(f) | 5.50% | 7/1/2037 | NR | 1,000 | 690,660 | |||||||||||||||
| Carrollton GA Payroll Dev Auth Univ of West GA Evergreen Complex | 5.25% | 7/1/2029 | A1 | 1,175 | 1,240,330 | |||||||||||||||
| CT St Higher Ed Supplement Ln Auth Chesla Ln Pg Ser A | 5.05% | 11/15/2027 | Aa2 | 710 | 750,094 | |||||||||||||||
| CT St Hlth & Edl Facs Auth Fairfield Univ Ser N | 5.00% | 7/1/2029 | A- | 2,000 | 2,086,960 | |||||||||||||||
| CT St Hlth & Edl Facs Auth Quinnipiac Univ Ser I (NPFGC) | 5.00% | 7/1/2026 | A- | 3,000 | 3,160,170 | |||||||||||||||
| CT St Hlth & Edl Facs Auth Salisbury Sch Ser C (AG) | 5.00% | 7/1/2028 | AA+ | 4,050 | 4,326,372 | |||||||||||||||
| CT St Hlth & Edl Facs Auth Salisbury Sch Ser C (AG) | 5.00% | 7/1/2033 | AA+ | 1,500 | 1,572,390 | |||||||||||||||
| CT St Hlth & Edl Facs Auth Salisbury Sch Ser C (AG) | 5.00% | 7/1/2038 | AA+ | 4,610 | 4,832,479 | |||||||||||||||
| Curators Univ MO Sys Facs Rev Ser A | 5.00% | 11/1/2023 | AA+ | 2,000 | 2,267,980 | |||||||||||||||
| Dutchess Cnty NY Loc Dev Corp Anderson Ctr Svcs Inc Pj | 6.00% | 10/1/2030 | BB+ | 1,000 | 974,590 | |||||||||||||||
| FL St Brd of Governors Univ Sys | 5.50% | 7/1/2020 | AA | 2,075 | 2,453,646 | |||||||||||||||
See Notes to Financial Statements.
89
Schedule of Investments (continued)
NATIONAL TAX FREE FUND September 30, 2011
| Investments | Interest Rate | Maturity Date | Credit Rating: S&P or Moody’s(a) | Principal Amount (000) | Fair Value | |||||||||||||||
| Education (continued) | ||||||||||||||||||||
| GA Private Colleges & Univs Auth Emory Univ Ser B | 5.00% | 9/1/2032 | AA | $ | 2,250 | $ | 2,439,202 | |||||||||||||
| GA Private Colleges & Univs Auth Spelman College | 5.25% | 6/1/2021 | A1 | 1,340 | 1,398,464 | |||||||||||||||
| Gainesville GA Redev Auth Edl Riverside Military Academy | 5.125% | 3/1/2037 | BBB- | (d) | 1,300 | 995,995 | ||||||||||||||
| Grand Vly MI St Univ Rev (NPFGC)(FGIC) | 5.50% | 2/1/2018 | A+ | 1,150 | 1,263,919 | |||||||||||||||
| Hale Ctr TX Ed Facs Corp Wayland Baptist | 5.00% | 3/1/2035 | A- | 7,350 | 7,399,024 | |||||||||||||||
| Harrisburg PA Auth Univ Rev Harrisburg Univ of Science B | 6.00% | 9/1/2036 | NR | 4,000 | 3,626,960 | |||||||||||||||
| HI St Dept Bdgt & Fin Mid Pacific Inst (RADIAN) | 5.00% | 1/1/2026 | NR | 1,000 | 1,015,560 | |||||||||||||||
| IL Fin Auth Rev IL Inst Tech | 7.125% | 2/1/2034 | Baa3 | 1,000 | 994,880 | |||||||||||||||
| IL Fin Auth Rev IL Inst Tech Ser A | 5.00% | 4/1/2020 | Baa3 | 1,900 | 1,667,611 | |||||||||||||||
| IL Fin Auth Rev Univ of Chicago Ser B | 5.75% | 7/1/2033 | Aa1 | 4,300 | 4,804,949 | |||||||||||||||
| Louisville & Jefferson Cnty KY Metro Govt Bellarmine Univ Ser A | 6.00% | 5/1/2038 | Baa3 | 2,500 | 2,569,425 | |||||||||||||||
| MA St Dev Fin Agy Wheelock College Ser C | 5.25% | 10/1/2037 | BBB | 5,000 | 4,868,600 | |||||||||||||||
| Marietta GA Dev Auth Rev Univ Facs Life Univ Inc Pj | 7.00% | 6/15/2030 | Ba3 | 5,000 | 5,004,550 | |||||||||||||||
| Marietta GA Dev Auth Rev Univ Facs Life Univ Inc Pj | 7.00% | 6/15/2039 | Ba3 | 2,000 | 1,980,400 | |||||||||||||||
| MD St Hlth & Higher Edl Facs Auth Washington Christian Academy(f) | 5.50% | 7/1/2038 | NR | 2,200 | 880,000 | |||||||||||||||
| MI Higher Ed Facs Auth Rev Ltd Oblig Creative Studies | 5.875% | 12/1/2028 | Baa3 | 2,365 | 2,399,978 | |||||||||||||||
| MI Higher Ed Facs Auth Rev Ltd Oblig Creative Studies | 6.125% | 12/1/2033 | Baa3 | 3,080 | 3,116,221 | |||||||||||||||
| Montgomery Cnty PA Higher Ed & Hlth Auth Arcadia Univ | 5.25% | 4/1/2030 | BBB+ | 1,530 | 1,545,637 | |||||||||||||||
| NC Cap Facs Fin Agy Meredith College | 6.00% | 6/1/2031 | BBB | 1,975 | 2,029,253 | |||||||||||||||
| NY St Dorm Auth Lease Rev St Univ Dorm Facs Ser A | 5.00% | 7/1/2035 | Aa2 | 2,100 | 2,246,895 | |||||||||||||||
| NY St Dorm Auth Lease Rev St Univ Dorm Facs Ser A(b) | 5.00% | 7/1/2041 | Aa2 | 20,000 | 21,337,300 | |||||||||||||||
| NY St Dorm Auth Rev Non St Supp Debt Rochester Inst Tech Ser A | 6.25% | 7/1/2029 | A1 | 5,000 | 5,652,150 | |||||||||||||||
| OH St Higher Edl Fac Rev Commn Ashland Univ Pj | 6.25% | 9/1/2024 | Ba1 | 4,115 | 4,210,509 | |||||||||||||||
See Notes to Financial Statements.
90
Schedule of Investments (continued)
NATIONAL TAX FREE FUND September 30, 2011
| Investments | Interest Rate | Maturity Date | Credit Rating: S&P or Moody’s(a) | Principal Amount (000) | Fair Value | |||||||||||||||
| Education (continued) | ||||||||||||||||||||
| PA St Higher Edl Facs Auth Assoc Indpt Colleges & Univ FF2 (RADIAN) | 5.00% | 12/15/2024 | BBB+ | $ | 1,580 | $ | 1,615,471 | |||||||||||||
| PA St Higher Edl Facs Auth Drexel Univ Ser A | 5.00% | 5/1/2031 | A | 4,645 | 4,834,887 | |||||||||||||||
| PA St Higher Edl Facs Auth Philadelphia Univ | 5.00% | 6/1/2030 | BBB | 1,530 | 1,448,176 | |||||||||||||||
| Peach Cnty GA Dev Auth Student Fort Vly St Univ Fndtn Ppty LLC (AMBAC) | 5.00% | 6/1/2023 | A3 | 1,115 | 1,185,245 | |||||||||||||||
| Pinellas Cnty FL Edl Facs Auth Eckerd College Pj (ACA) | 5.25% | 10/1/2029 | NR | 2,475 | 2,356,027 | |||||||||||||||
| Univ of HI Rev Ser A | 6.00% | 10/1/2038 | Aa2 | 1,750 | 2,036,702 | |||||||||||||||
| Univ of Western MI Rev | 5.25% | 11/15/2040 | A1 | 2,500 | 2,661,300 | |||||||||||||||
| WV Univ Rev Univ Sys Pj Ser A (AMBAC) | Zero Coupon | 4/1/2024 | Aa3 | 2,880 | 1,686,730 | |||||||||||||||
|
| |||||||||||||||||||
| Total | 150,356,143 | |||||||||||||||||||
|
| |||||||||||||||||||
| General Obligation 11.58% | ||||||||||||||||||||
| Bellevue WA Convtn Ctr Auth (NPFGC) | Zero Coupon | 2/1/2024 | Baa1 | 1,400 | 860,412 | |||||||||||||||
| CA St | 5.25% | 9/1/2024 | A1 | 15,000 | 16,702,350 | |||||||||||||||
| CA St Var Purp | 5.60% | 3/1/2036 | A1 | 7,330 | 7,931,426 | |||||||||||||||
| CA St Var Purp | 6.50% | 4/1/2033 | A1 | 13,400 | 15,691,266 | |||||||||||||||
| Chicago IL Ser A | 5.00% | 12/1/2019 | Aa3 | 5,000 | 5,738,000 | |||||||||||||||
| Chicago IL Ser A | 5.25% | 1/1/2027 | Aa3 | 5,000 | 5,282,400 | |||||||||||||||
| Delaware Vly PA Regl Fin Auth Ser C (AMBAC) | 7.75% | 7/1/2027 | A2 | 1,500 | 1,972,890 | |||||||||||||||
| Foothill-De Anza CA Cmnty College Dist Cap Apprec (NPFGC) | Zero Coupon | 8/1/2030 | Aaa | 4,505 | 1,679,960 | |||||||||||||||
| Fort Bend TX Indpt Sch Dist Sch Bldg PSF GTD(b) | 5.00% | 8/15/2028 | AAA | 4,000 | 4,419,140 | |||||||||||||||
| Fort Bend TX Indpt Sch Dist Sch Bldg PSF GTD(b) | 5.00% | 8/15/2029 | AAA | 5,000 | 5,523,925 | |||||||||||||||
| Hartford CT Ser A (AMBAC) | 5.00% | 8/15/2024 | A1 | 1,470 | 1,616,927 | |||||||||||||||
| Hartford CT Ser A (AMBAC) | 5.00% | 8/15/2026 | A1 | 1,000 | 1,087,110 | |||||||||||||||
| HI St Ser DK | 5.00% | 5/1/2025 | AA | 3,500 | 3,999,870 | |||||||||||||||
| HI St Ser DK | 5.00% | �� | 5/1/2026 | AA | 2,500 | 2,836,050 | ||||||||||||||
| Honolulu HI City & Cnty Ser A | 5.00% | 4/1/2026 | Aa1 | 1,000 | 1,121,140 | |||||||||||||||
| Honolulu HI City & Cnty Ser A | 5.25% | 4/1/2031 | Aa1 | 5,000 | 5,551,200 | |||||||||||||||
See Notes to Financial Statements.
91
Schedule of Investments (continued)
NATIONAL TAX FREE FUND September 30, 2011
| Investments | Interest Rate | Maturity Date | Credit Rating: S&P or Moody’s(a) | Principal Amount (000) | Fair Value | |||||||||||||||
| General Obligation (continued) | ||||||||||||||||||||
| Honolulu HI City & Cnty Ser A (AGM) | 5.00% | 7/1/2028 | AA+ | $ | 3,295 | $ | 3,576,558 | |||||||||||||
| Hudsonville MI Pub Schs Bldg & Site | 5.25% | 5/1/2041 | Aa2 | 5,000 | 5,328,950 | |||||||||||||||
| Huntington Beach CA Union High Sch Dist Cap Apprec 2004 Election (NPFGC)(FGIC) | Zero Coupon | 8/1/2033 | Aa2 | 2,500 | 623,425 | |||||||||||||||
| Los Angeles CA Unif Sch Dist Election 2004 Ser F (FGIC) | 5.00% | 7/1/2030 | Aa2 | 7,750 | 8,053,955 | |||||||||||||||
| Los Angeles CA Unif Sch Dist Election 2004 Ser H (AGM)(b) | 5.00% | 7/1/2028 | AA+ | 7,000 | 7,407,575 | |||||||||||||||
| Maricopa Cnty AZ Elem Sch Dist No 33 Buckeye Sch Impt Pj of 2005 Ser C | 5.70% | 7/1/2025 | A1 | 2,385 | 2,589,991 | |||||||||||||||
| Midlothian TX Wtr Dist Cap Apprec (AGM) | Zero Coupon | 9/1/2022 | AA+ | 2,000 | 1,330,880 | |||||||||||||||
| New Haven CT Ser A (AG) | 4.75% | 3/1/2028 | AA+ | 1,145 | 1,211,628 | |||||||||||||||
| New York City NY Ser E | 5.00% | 8/1/2023 | AA | 4,000 | 4,609,200 | |||||||||||||||
| New York City NY Ser E-1 | 6.25% | 10/15/2028 | AA | 5,000 | 5,863,650 | |||||||||||||||
| New York City NY Sub Ser D-1(b)(c) | 5.00% | 10/1/2026 | AA | 26,860 | 30,207,427 | |||||||||||||||
| Northern Mariana Islands Comwlth Ser A | 5.00% | 6/1/2030 | NR | 5,735 | 4,774,330 | |||||||||||||||
| Northern Mariana Islands Comwlth Ser B | 5.00% | 10/1/2033 | NR | 4,170 | 3,368,484 | |||||||||||||||
| Philadelphia PA Ser A (AGM) | 5.25% | 12/15/2027 | AA+ | 2,500 | 2,628,100 | |||||||||||||||
| Port of Houston Auth Ser A AMT | 6.25% | 10/1/2029 | AAA | 1,000 | 1,152,450 | |||||||||||||||
| Poway CA Unif Sch Dist Cap Apprec Sch Facs Impt | Zero Coupon | 8/1/2033 | Aa2 | 1,500 | 418,155 | |||||||||||||||
| Poway CA Unif Sch Dist Cap Apprec Sch Facs Impt | Zero Coupon | 8/1/2034 | Aa2 | 8,130 | 2,128,109 | |||||||||||||||
| San Bernardino CA Cmnty College Dist Election 2002 Ser A | 6.25% | 8/1/2033 | Aa2 | 1,950 | 2,186,086 | |||||||||||||||
| San Diego CA Unif Sch Dist Premium Cap Apprec Ser C | Zero Coupon | 7/1/2046 | Aa1 | 13,500 | 1,674,135 | |||||||||||||||
| San Francisco CA Cmnty College Dist Ser B (AGM) | 5.00% | 6/15/2031 | AA+ | 1,735 | 1,785,055 | |||||||||||||||
| San Mateo CA Union High Sch Dist Cap Apprec Election 2006 Ser A (7.00% after 9/1/2034)~ | Zero Coupon | 7/1/2051 | Aa1 | 30,375 | 7,538,771 | |||||||||||||||
| Territory of Guam Ser A | 7.00% | 11/15/2039 | B+ | 2,240 | 2,342,525 | |||||||||||||||
| Washoe Cnty NV Reno Sparks Convtn(c)(m) | 5.25% | 7/1/2028 | AA | 7,445 | 8,088,918 | |||||||||||||||
|
| |||||||||||||||||||
| Total | 190,902,423 | |||||||||||||||||||
|
| |||||||||||||||||||
See Notes to Financial Statements.
92
Schedule of Investments (continued)
NATIONAL TAX FREE FUND September 30, 2011
| Investments | Interest Rate | Maturity Date | Credit Rating: S&P or Moody’s(a) | Principal Amount (000) | Fair Value | |||||||||||||||
| Health Care 18.02% | ||||||||||||||||||||
| Abag Fin Auth For Nonprofit Corp CA O’Connor Woods Oblig COP (ACA) | 6.20% | 11/1/2029 | BBB- | (d) | $ | 1,000 | $ | 971,410 | ||||||||||||
| Alachua Cnty FL Indl Dev Rev North FL Ret Vlg | 5.875% | 11/15/2036 | NR | 2,500 | 2,024,250 | |||||||||||||||
| Alachua Cnty FL Indl Dev Rev North FL Ret Vlg | 5.875% | 11/15/2042 | NR | 3,250 | 2,559,082 | |||||||||||||||
| Allegheny Cnty PA Hosp Dev Auth Hlth Sys West PA Ser A | 5.00% | 11/15/2017 | B+ | 3,000 | 2,915,280 | |||||||||||||||
| Allegheny Cnty PA Hosp Dev Auth Hlth Sys West PA Ser A | 5.00% | 11/15/2028 | B+ | 6,000 | 5,117,040 | |||||||||||||||
| AZ Hlth Facs Auth Hlthcare Beatitudes Campus Pj | 5.20% | 10/1/2037 | NR | 2,000 | 1,523,300 | |||||||||||||||
| AZ Hlth Facs Auth Rev Hlthcare Pooled Fin C (NPFGC)(FGIC) | 5.50% | 6/1/2014 | NR | 1,130 | 1,195,020 | |||||||||||||||
| AZ Univ Med Ctr Corp | 6.25% | 7/1/2029 | BBB+ | 895 | 932,178 | |||||||||||||||
| AZ Univ Med Ctr Corp | 6.50% | 7/1/2039 | BBB+ | 3,025 | 3,162,849 | |||||||||||||||
| Brevard Cnty FL Hlth Facs Auth Hlth First Inc Pj | 7.00% | 4/1/2033 | A- | 1,000 | 1,119,680 | |||||||||||||||
| Burlington Cnty NJ Bridge Commn The Evergreens Pj | 5.625% | 1/1/2038 | NR | 4,050 | 3,528,441 | |||||||||||||||
| Butler Cnty PA Hosp Auth Butler Hlth Sys Pj | 7.125% | 7/1/2029 | Baa1 | 1,500 | 1,692,060 | |||||||||||||||
| Butler Cnty PA Hosp Auth Butler Hlth Sys Pj | 7.25% | 7/1/2039 | Baa1 | 3,600 | 4,052,664 | |||||||||||||||
| CA Hlth Facs Fing Auth Providence Hlth & Svcs Ser C | 6.25% | 10/1/2024 | AA | 2,000 | 2,334,320 | |||||||||||||||
| CA Hlth Facs Fing Auth Sutter Hlth Ser B | 5.50% | 8/15/2026 | AA- | 4,750 | 5,147,860 | |||||||||||||||
| CA Statewide Cmntys Dev Auth Front Porch Cmntys & Svcs Ser A† | 5.125% | 4/1/2037 | BBB | 2,000 | 1,668,420 | |||||||||||||||
| CA Statewide Cmntys Dev Auth Vlycare Hlth Sys Ser A | 5.00% | 7/15/2022 | NR | 1,000 | 910,990 | |||||||||||||||
| Cass Cnty ND Hlth Facs Rev Essentia Hlth Ser A Rmkt (AG) | 5.125% | 2/15/2037 | AA+ | 7,000 | 7,262,150 | |||||||||||||||
| Chautauqua Cnty NY Cap Res Corp Womans Christian Assoc Pj Ser A | 8.00% | 11/15/2030 | NR | 7,000 | 7,341,460 | |||||||||||||||
| Chautauqua Cnty NY Cap Res Corp Womans Christian Assoc Pj Ser A | 8.00% | 11/15/2035 | NR | 1,625 | 1,690,097 | |||||||||||||||
| Coffee Cnty GA Hosp Auth Rev Coffee Regl Med Ctr Inc Pj | 5.00% | 12/1/2026 | BBB- | 1,010 | 958,460 | |||||||||||||||
See Notes to Financial Statements.
93
Schedule of Investments (continued)
NATIONAL TAX FREE FUND September 30, 2011
| Investments | Interest Rate | Maturity Date | Credit Rating: S&P or Moody’s(a) | Principal Amount (000) | Fair Value | |||||||||||||||
| Health Care (continued) | ||||||||||||||||||||
| Coffee Cnty GA Hosp Auth Rev Coffee Regl Med Ctr Inc Pj | 5.25% | 12/1/2022 | BBB- | $ | 1,000 | $ | 1,011,510 | |||||||||||||
| CT St Hlth & Edl Fac Auth Hartford Hlthcare Ser A | 5.00% | 7/1/2041 | A | 6,000 | 6,031,740 | |||||||||||||||
| CT St Hlth & Edl Facs Auth Child Care Facs Pg Ser F (AG) | 5.00% | 7/1/2031 | AA+ | 1,750 | 1,841,735 | |||||||||||||||
| CT St Hlth & Edl Facs Auth Yale New Haven Hosp Ser J-1 (AMBAC) | 5.00% | 7/1/2024 | Aa3 | 1,715 | 1,824,040 | |||||||||||||||
| Cumberland Cnty PA Muni Auth Diakon Lutheran | 6.125% | 1/1/2029 | BBB+ | (d) | 1,000 | 1,027,800 | ||||||||||||||
| Cumberland Cnty PA Muni Auth Diakon Lutheran Ministries Pj | 5.00% | 1/1/2036 | BBB+ | (d) | 500 | 439,920 | ||||||||||||||
| DeKalb Cnty GA Hosp Auth Rev DeKalb Med Ctr Inc Pj | 6.00% | 9/1/2030 | BBB | (d) | 1,000 | 1,029,810 | ||||||||||||||
| Delaware Cnty IN Hosp Auth Cardinal Hlth Sys Oblig Corp | 5.00% | 8/1/2024 | Baa3 | 2,000 | 1,983,060 | |||||||||||||||
| Delaware Cnty IN Hosp Auth Cardinal Hlth Sys Oblig Corp | 5.25% | 8/1/2036 | Baa3 | 4,500 | 4,024,170 | |||||||||||||||
| Fairfax Cnty VA Indl Dev Auth Hlthcare Inova Hlth Sys Ser A(b) | 5.50% | 5/15/2035 | AA+ | 5,000 | 5,321,350 | |||||||||||||||
| Flint MI Hosp Bldg Auth Rent Hurley Med Ctr | 7.00% | 7/1/2030 | Ba1 | 1,510 | 1,553,458 | |||||||||||||||
| Flint MI Hosp Bldg Auth Rent Hurley Med Ctr | 7.50% | 7/1/2039 | Ba1 | 3,000 | 3,112,200 | |||||||||||||||
| Gainesville & Hall Cnty GA Hosp Auth Northeast GA Hlthcare Ser A | 5.00% | 2/15/2030 | A- | 2,000 | 1,992,740 | |||||||||||||||
| Gaithersburg MD Econ Dev Rev Asbury MD Oblig Grp A | 5.125% | 1/1/2036 | BBB- | (d) | 4,300 | 3,812,122 | ||||||||||||||
| Glynn-Brunswick Mem Hosp Auth GA Antic Ctfs Southeast GA Hlth Ser A | 5.50% | 8/1/2028 | A2 | 5,140 | 5,250,870 | |||||||||||||||
| Harris Cnty TX Hlth Facs Dev Corp Mem Hermann Hlthcare Sys Ser B | 7.125% | 12/1/2031 | A+ | 3,000 | 3,362,040 | |||||||||||||||
| HFDC Cent TX Inc Ret Fac Ser A | 5.75% | 11/1/2036 | NR | 2,700 | 2,218,860 | |||||||||||||||
| Houston Cnty GA Hosp Auth Rev Antic Ctfs Houston Hlthcare Pj | 5.00% | 10/1/2038 | A2 | 1,500 | 1,473,810 | |||||||||||||||
| Houston Cnty GA Hosp Auth Rev Antic Ctfs Houston Hlthcare Pj | 5.25% | 10/1/2035 | A2 | 1,420 | 1,431,587 | |||||||||||||||
| Howard Cnty MD Ret Cmnty Vantage Hse Fac Ser A | 5.25% | 4/1/2027 | NR | 1,525 | 1,211,369 | |||||||||||||||
See Notes to Financial Statements.
94
Schedule of Investments (continued)
NATIONAL TAX FREE FUND September 30, 2011
| Investments | Interest Rate | Maturity Date | Credit Rating: S&P or Moody’s(a) | Principal Amount (000) | Fair Value | |||||||||||||||
| Health Care (continued) | ||||||||||||||||||||
| Howard Cnty MD Ret Cmnty Vantage Hse Fac Ser A | 5.25% | 4/1/2033 | NR | $ | 2,000 | $ | 1,494,160 | |||||||||||||
| Huntsville-Redstone Vlg AL Spl Care Facs Fing Auth Redstone Vlg Pj | 5.50% | 1/1/2028 | NR | 1,500 | 1,334,190 | |||||||||||||||
| Huntsville-Redstone Vlg AL Spl Care Facs Fing Auth Redstone Vlg Pj | 5.50% | 1/1/2043 | NR | 1,350 | 1,028,525 | |||||||||||||||
| IL Fin Auth Rev Friendship Vlg Schaumburg | 7.125% | 2/15/2039 | BB- | (d) | 1,500 | 1,497,120 | ||||||||||||||
| IL Fin Auth Rev Friendship Vlg Schaumburg | 7.25% | 2/15/2045 | BB- | (d) | 1,500 | 1,504,455 | ||||||||||||||
| IL Fin Auth Rev Monarch Landing Inc Fac Ser A(f) | 7.00% | 12/1/2027 | NR | 843 | 3,374 | |||||||||||||||
| IL Fin Auth Rev Monarch Landing Inc Fac Ser A(f) | 7.00% | 12/1/2037 | NR | 1,265 | 5,061 | |||||||||||||||
| IL Fin Auth Rev Northwestern Mem Hosp Ser A(b) | 5.75% | 8/15/2030 | AA+ | 2,500 | 2,708,300 | |||||||||||||||
| IL Fin Auth Rev Rush Univ Med Ctr Oblig Grp Ser A | 7.25% | 11/1/2030 | A2 | 3,000 | 3,418,860 | |||||||||||||||
| Johnston NC Mem Hosp Auth (AGM)(FHA)(b) | 5.25% | 10/1/2024 | AA+ | 5,000 | 5,363,475 | |||||||||||||||
| Kent MI Hosp Fin Auth Rev Metro Hosp Pj Ser A | 6.00% | 7/1/2035 | BB+ | 1,475 | 1,394,716 | |||||||||||||||
| Kirkwood MO Indl Dev Auth Aberdeen Heights Ser A | 8.00% | 5/15/2021 | NR | 1,000 | 1,071,480 | |||||||||||||||
| Kirkwood MO Indl Dev Auth Aberdeen Heights Ser A | 8.00% | 5/15/2029 | NR | 3,820 | 4,010,656 | |||||||||||||||
| KY Econ Dev Fin Auth Norton Hlthcare Inc Ser B (NPFGC) | Zero Coupon | 10/1/2025 | Baa1 | 3,690 | 1,647,105 | |||||||||||||||
| KY Econ Dev Fin Auth Owensboro Med Hlth Sys Ser A | 6.375% | 6/1/2040 | Baa2 | 3,500 | 3,671,500 | |||||||||||||||
| Louisiana Pub Facs Auth Ochsner Clinic Fdtn Pj | 6.25% | 5/15/2031 | Baa1 | 8,000 | 8,578,480 | |||||||||||||||
| Lucas Cnty OH Hosp Rev ProMedica Hlthcare Ser A | 5.75% | 11/15/2031 | AA- | 3,700 | 3,981,829 | |||||||||||||||
| MA Dev Fin Agy Ser B1 | 7.25% | 6/1/2016 | NR | 3,000 | 3,000,570 | |||||||||||||||
| Macon-Bibb Cnty GA Hosp Auth Rev Antic Ctfs Macon Hosp Med Ctr | 4.625% | 8/1/2029 | AA | 5,500 | 5,537,345 | |||||||||||||||
| Macon-Bibb Cnty GA Hosp Auth Rev Antic Ctfs Macon Hosp Med Ctr | 5.00% | 8/1/2032 | AA | 1,500 | 1,518,300 | |||||||||||||||
See Notes to Financial Statements.
95
Schedule of Investments (continued)
NATIONAL TAX FREE FUND September 30, 2011
| Investments | Interest Rate | Maturity Date | Credit Rating: S&P or Moody’s(a) | Principal Amount (000) | Fair Value | |||||||||||||||
| Health Care (continued) | ||||||||||||||||||||
| Manhattan KS Hlthcare Fac Meadowlark Hills Ret Ser A | 5.00% | 5/15/2029 | NR | $ | 2,050 | $ | 1,762,877 | |||||||||||||
| Martin Cnty TX Hosp Dist Ser A | 7.25% | 4/1/2036 | BBB+ | (d) | 3,000 | 3,073,440 | ||||||||||||||
| MD St Hlth & Higher Edl Facs Auth Mercy Med Ctr | 6.25% | 7/1/2031 | BBB | 11,190 | 12,024,774 | |||||||||||||||
| ME St Hlth & Higher Edl Facs Auth Gen Med Ctr | 7.50% | 7/1/2032 | Baa3 | 11,000 | 11,973,500 | |||||||||||||||
| Med Ctr Hosp Auth GA Rev Spring Hrbr Green Isl Pj | 5.25% | 7/1/2037 | NR | 1,300 | 1,055,197 | |||||||||||||||
| MO St Hlth & Edl Facs Auth Sr Living Facs Lutheran Ser A | 5.375% | 2/1/2035 | BBB+ | (d) | 3,680 | 3,405,914 | ||||||||||||||
| MO St Hlth & Edl Facs Auth St. Luke’s Hlth Ser 2005A (AGM) | 5.50% | 11/15/2028 | AA+ | 1,850 | 2,018,997 | |||||||||||||||
| Montgomery Cnty PA Indl Dev Auth Rev Mtg Whitemarsh Continuing Care | 6.25% | 2/1/2035 | NR | 2,675 | 2,293,251 | |||||||||||||||
| Nassau Cnty NY Indl Dev Agy Amsterdam At Harborside Ser A | 5.875% | 1/1/2018 | NR | 2,150 | 2,240,214 | |||||||||||||||
| New York City NY Hlth & Hosp Corp Hlth Sys Ser A | 5.00% | 2/15/2025 | Aa3 | 2,400 | 2,602,752 | |||||||||||||||
| New York City NY Hlth & Hosp Corp Hlth Sys Ser A | 5.00% | 2/15/2030 | Aa3 | 5,535 | 5,808,374 | |||||||||||||||
| NJ Econ Dev Auth First Mtg Seashore Gardens Pj | 5.30% | 11/1/2026 | NR | 1,440 | 1,224,922 | |||||||||||||||
| NJ Econ Dev Auth First Mtg Seashore Gardens Pj | 5.375% | 11/1/2036 | NR | 1,000 | 766,840 | |||||||||||||||
| NJ Hlthcare Facs Fing Auth St. Joseph’s Hlthcare Sys | 6.625% | 7/1/2038 | BBB- | 5,500 | 5,503,685 | |||||||||||||||
| Northampton Cnty PA Gen Purp Auth St. Luke’s Hosp Pj Ser A | 5.25% | 8/15/2023 | A3 | 1,250 | 1,285,412 | |||||||||||||||
| NY St Dorm Auth Rev Non St Supp Debt NYU Hosps Ctr Ser A | 5.75% | 7/1/2031 | BBB+ | 1,985 | 2,107,951 | |||||||||||||||
| NY St Dorm Auth Rev Non St Supp Debt Orange Regl Med Ctr | 6.125% | 12/1/2029 | Ba1 | 3,250 | 3,278,665 | |||||||||||||||
| Orange Cnty FL Hlth Facs Auth First Mtg Orlando Lutheran Tower | 5.50% | 7/1/2032 | NR | 7,200 | 6,173,784 | |||||||||||||||
| Palomar CA Pomerado Hlthcare COP | 6.00% | 11/1/2030 | Baa3 | 3,500 | 3,514,385 | |||||||||||||||
| San Buenaventura CA Cmnty Mem Hlth Sys | 7.50% | 12/1/2041 | BB | 16,750 | 17,141,615 | |||||||||||||||
| Sarasota Cnty FL Hlth Facs Auth Hlthcare Sarasota Manatee | 5.75% | 7/1/2037 | NR | 1,000 | 835,150 | |||||||||||||||
See Notes to Financial Statements.
96
Schedule of Investments (continued)
NATIONAL TAX FREE FUND September 30, 2011
| Investments | Interest Rate | Maturity Date | Credit Rating: S&P or Moody’s(a) | Principal Amount (000) | Fair Value | |||||||||||||||
| Health Care (continued) | ||||||||||||||||||||
| Sarasota Cnty FL Hlth Facs Auth Hlthcare Sarasota Manatee | 5.75% | 7/1/2045 | NR | $ | 1,100 | $ | 895,191 | |||||||||||||
| Southcentral PA Gen Auth Rev Wellspan Hlth Oblig Grp Ser A(c) | 6.00% | 6/1/2029 | Aa3 | 1,000 | 1,102,400 | |||||||||||||||
| St. Paul MN Hsg & Redev Auth Hltheast Pj | 6.00% | 11/15/2030 | BB+ | 4,000 | 4,001,120 | |||||||||||||||
| Sullivan Cnty TN Hlth Edl & Hsg Facs Brd Wellmont Hlth Sys Pj Ser C | 5.25% | 9/1/2036 | BBB+ | 2,000 | 1,795,360 | |||||||||||||||
| Tarrant Cnty TX Cultural Ed Facs Fin Corp Buckner Ret Svcs Inc Pj | 5.25% | 11/15/2037 | A- | 2,000 | 1,860,440 | |||||||||||||||
| Tarrant Cnty TX Cultural Ed Facs Fin Corp Christus Hlth Ser A (AG) | 6.25% | 7/1/2028 | AA+ | 1,500 | 1,706,160 | |||||||||||||||
| Thomasville GA Hosp Auth Rev Antic Ctfs John D Archbold | 5.125% | 11/1/2030 | A | 2,500 | 2,524,300 | |||||||||||||||
| Tulsa Cnty OK Indl Auth Sr Montereau Inc Pj Ser A | 6.875% | 11/1/2023 | NR | 1,000 | 1,042,680 | |||||||||||||||
| Tulsa Cnty OK Indl Auth Sr Montereau Inc Pj Ser A | 7.25% | 11/1/2045 | NR | 3,000 | 3,113,970 | |||||||||||||||
| Upland CA San Antonio Cmnty Hosp COP | 6.375% | 1/1/2032 | A | 5,000 | 5,388,150 | |||||||||||||||
| Vigo Cnty IN Hosp Auth Rev Union Hosp Inc† | 5.75% | 9/1/2042 | NR | 3,000 | 2,727,390 | |||||||||||||||
| WI St Hlth & Edl Facs Ascension Hlth Sr Ctr Grp(b) | 5.00% | 11/15/2030 | AA+ | 1,170 | 1,219,432 | |||||||||||||||
| WI St Hlth & Edl Facs Ascension Hlth Sr Ctr Grp(b) | 5.00% | 11/15/2033 | AA+ | 7,000 | 7,167,125 | |||||||||||||||
| WI St Hlth & Edl Facs Auth Wheaton Franciscan Hlthcare | 5.25% | 8/15/2023 | BBB+ | 9,350 | 9,505,584 | |||||||||||||||
| WV St Hosp Fin Auth Thomas Hlth Sys | 6.25% | 10/1/2023 | NR | 2,000 | 2,010,080 | |||||||||||||||
|
| |||||||||||||||||||
| Total | 296,981,784 | |||||||||||||||||||
|
| |||||||||||||||||||
| Housing 1.46% | ||||||||||||||||||||
| Athens GA Hsg Auth Student Hsg (AMBAC) | 5.00% | 12/1/2027 | Aa2 | 1,785 | 1,805,474 | |||||||||||||||
| CA Statewide Cmntys Dev Auth CHF Irvine LLC UCI East Campus | 6.00% | 5/15/2023 | Baa2 | 5,000 | 5,284,000 | |||||||||||||||
| Dakota Cnty MN Cmnty Dev Agy Sing Fam Mtg Bkd Securities Pg Ser B AMT (FHLMC/GNMA/FNMA) | 5.15% | 12/1/2038 | AA+ | 277 | 280,154 | |||||||||||||||
| DeKalb Newton & Gwinnett Cntys GA Joint Dev Auth Rev GGC Fndtn LLC Pj | 6.00% | 7/1/2034 | A+ | 1,500 | 1,638,375 | |||||||||||||||
See Notes to Financial Statements.
97
Schedule of Investments (continued)
NATIONAL TAX FREE FUND September 30, 2011
| Investments | Interest Rate | Maturity Date | Credit Rating: S&P or Moody’s(a) | Principal Amount (000) | Fair Value | |||||||||||||||
| Housing (continued) | ||||||||||||||||||||
| East Point GA Hsg Auth Multi Fam Hsg Laurel Ridge WA Rd Apts AMT (FNMA) | 5.00% | 10/1/2032 | AA+ | $ | 2,475 | $ | 2,531,034 | |||||||||||||
| HI St Hsg Fin & Dev Corp Rent Hsg Sys Ser B Rmkt (AGM) | 6.50% | 7/1/2033 | Aa3 | 2,000 | 2,175,660 | |||||||||||||||
| ID Hsg & Fin Assoc Sing Fam Mtg Sr Ser F AMT (FHA)(VA) | 7.45% | 7/1/2015 | Aaa | 10 | 10,001 | |||||||||||||||
| LA Hsg Fin Agy Multi Fam Hsg Ser B | 8.00% | 9/1/2039 | BB- | 1,475 | 1,511,698 | |||||||||||||||
| Los Angeles CA Hsg Auth Mtg Ppty Acq Ser A | 6.25% | 6/1/2034 | A | 4,220 | 4,380,529 | |||||||||||||||
| Minneapolis & St. Paul MN Hsg Fin Brd Mtg Bkd City Living A4 AMT (FHLMC/GNMA/FNMA) | 5.00% | 11/1/2038 | AA+ | 555 | 552,189 | |||||||||||||||
| MO St Hsg Dev Commn Rev Multi Fam Hsg Meadow Ridge 1 AMT (FHA) | 4.875% | 7/1/2030 | AA | 530 | 513,814 | |||||||||||||||
| MO St Hsg Dev Commn Sing Fam Mtg Hmownrship Ln Pg A-1 AMT (FHLMC/GNMA/FNMA) | 5.70% | 9/1/2038 | AA+ | 1,035 | 1,096,562 | |||||||||||||||
| MO St Hsg Dev Commn Sing Fam Mtg Hmownrship Ln Pg A-1 AMT (GNMA/FNMA) | 5.90% | 9/1/2035 | Aaa | 250 | 259,407 | |||||||||||||||
| PA St Higher Edl Facs Auth Edinboro Univ Fndtn | 5.75% | 7/1/2028 | BBB- | 1,000 | 1,019,460 | |||||||||||||||
| PA St Higher Edl Facs Auth Edinboro Univ Fndtn | 5.80% | 7/1/2030 | BBB- | 1,000 | 1,016,340 | |||||||||||||||
|
| |||||||||||||||||||
| Total | 24,074,697 | |||||||||||||||||||
|
| |||||||||||||||||||
| Lease Obligations 6.78% | ||||||||||||||||||||
| Atlanta GA Dev Auth Edl Facs Science Pk LLC Pj | 4.75% | 7/1/2027 | Aa3 | 3,080 | 3,178,098 | |||||||||||||||
| Atlanta GA Dev Auth Edl Facs Science Pk LLC Pj | 5.25% | 7/1/2027 | Aa3 | 2,000 | 2,114,340 | |||||||||||||||
| Atlanta GA Dev Auth Rev Tuff ATDC Pj Ser C | 4.625% | 1/1/2035 | A3 | 1,170 | 1,171,147 | |||||||||||||||
| Bessemer AL Sch Warrants (AMBAC) | 5.60% | 2/1/2030 | NR | 1,950 | 1,927,829 | |||||||||||||||
| CA St Pub Wrks Brd Var Cap Pjs Sub Ser I-1 | 5.375% | 11/1/2022 | A2 | 5,000 | 5,423,450 | |||||||||||||||
| Cape Girardeau Cnty MO Bldg Corp Jackson R-II Sch Dist HS Pj (NPFGC) | 5.25% | 3/1/2026 | A | 1,000 | 1,090,020 | |||||||||||||||
| Erie Cnty NY Indl Dev Agy Sch Dist Buffalo Pj A | 5.25% | 5/1/2028 | AA- | 7,000 | 7,801,990 | |||||||||||||||
See Notes to Financial Statements.
98
Schedule of Investments (continued)
NATIONAL TAX FREE FUND September 30, 2011
| Investments | Interest Rate | Maturity Date | Credit Rating: S&P or Moody’s(a) | Principal Amount (000) | Fair Value | |||||||||||||||
| Lease Obligations (continued) | ||||||||||||||||||||
| GA Muni Assoc Inc Ctfs City Court Atlanta Pj (AMBAC) | 5.25% | 12/1/2026 | NR | $ | 750 | $ | 757,995 | |||||||||||||
| GA Sch Brds Assoc Inc DeKalb Cnty Pub Schs Pj COP (NPFGC) | 5.00% | 12/1/2023 | Aa3 | 1,000 | 1,032,860 | |||||||||||||||
| Goodyear AZ Pub Impt Corp | 6.00% | 7/1/2031 | AA- | 2,350 | 2,581,405 | |||||||||||||||
| HI St Dept Hawaiian Home Lands Kapolei Office Fac Ser A (AGM) | 5.00% | 11/1/2031 | Aa3 | 1,805 | 1,904,022 | |||||||||||||||
| Houston Cnty AL Cooperative Dist Rev Country Crossing Pj | 15.00% | 5/27/2012 | NR | 1,768 | 534,590 | |||||||||||||||
| Indianapolis IN Loc Pub Impt Bd Bk Midwestern Disaster Ser A(b) | 5.50% | 2/1/2033 | AA | 12,000 | 13,258,380 | |||||||||||||||
| Jackson Cnty MO Pub Bldg Corp Cap Impts Pj | 5.00% | 12/1/2029 | Aa3 | 1,500 | 1,578,060 | |||||||||||||||
| Jackson Cnty MO Spl Oblig Harry S. Truman Sports Complex (AMBAC) | 5.00% | 12/1/2021 | Aa3 | 2,000 | 2,169,760 | |||||||||||||||
| Jackson Cnty MO Spl Oblig Harry S. Truman Sports Complex (AMBAC) | 5.00% | 12/1/2024 | Aa3 | 2,000 | 2,120,920 | |||||||||||||||
| Kansas City MO Metro Jr College Dist Lease COP | 5.00% | 7/1/2028 | Aa2 | 3,500 | 3,759,350 | |||||||||||||||
| Kansas City MO Spl Oblig East Vlg Pj Ser B (AG) | 5.00% | 4/15/2024 | AA+ | 1,000 | 1,127,230 | |||||||||||||||
| Kansas City MO Spl Oblig East Vlg Pj Ser B (AG) | 5.00% | 4/15/2025 | AA+ | 1,860 | 2,075,537 | |||||||||||||||
| LA Pub Facs Auth Rev Susla Facs Inc Pj Ser A† | 5.75% | 7/1/2039 | NR | 2,195 | 1,647,413 | |||||||||||||||
| McLennan Cnty TX Pub Fac Corp | 6.625% | 6/1/2035 | AA- | 7,385 | 7,960,808 | |||||||||||||||
| Miami-Dade Cnty FL Spl Oblig Fltg Rate Cap Asset Acq Ser A (NPFGC)(FGIC) | 5.862% | # | 4/1/2014 | Aa3 | 3,300 | 3,262,248 | ||||||||||||||
| MO St Dev Fin Brd Infrastr Branson Landing Pj Ser A | 5.625% | 12/1/2028 | A | 3,000 | 3,042,900 | |||||||||||||||
| NY St Urban Dev Corp Rev St Pers Income Tax Ser A-1(b) | 5.00% | 12/15/2025 | AAA | 1,980 | 2,193,118 | |||||||||||||||
| NY St Urban Dev Corp Rev St Pers Income Tax Ser A-1(b) | 5.00% | 12/15/2026 | AAA | 2,870 | 3,178,914 | |||||||||||||||
| NY St Urban Dev Corp Rev St Pers Income Tax Ser A-1(b) | 5.00% | 12/15/2027 | AAA | 1,150 | 1,273,781 | |||||||||||||||
| PA St Indl Dev Auth Econ Dev | 5.50% | 7/1/2023 | A1 | 3,000 | 3,345,810 | |||||||||||||||
| Philadelphia PA Muni Auth Rev Lease | 6.375% | 4/1/2029 | A2 | 2,000 | 2,122,580 | |||||||||||||||
| Puerto Rico Comwlth Infrastr Fing Auth Mepsi Campus Pj Ser A | 5.60% | 10/1/2014 | NR | 420 | 429,484 | |||||||||||||||
See Notes to Financial Statements.
99
Schedule of Investments (continued)
NATIONAL TAX FREE FUND September 30, 2011
| Investments | Interest Rate | Maturity Date | Credit Rating: S&P or Moody’s(a) | Principal Amount (000) | Fair Value | |||||||||||||||
| Lease Obligations (continued) | ||||||||||||||||||||
| Puerto Rico Comwlth Infrastr Fing Auth Mepsi Campus Pj Ser A | 6.25% | 10/1/2024 | NR | $ | 2,000 | $ | 1,985,960 | |||||||||||||
| Puerto Rico Comwlth Infrastr Fing Auth Mepsi Campus Pj Ser A | 6.50% | 10/1/2037 | NR | 1,000 | 958,940 | |||||||||||||||
| Puerto Rico Pub Bldgs Auth Rev Govt Facs Ser P GTD | 6.50% | 7/1/2030 | Baa1 | 9,000 | 9,929,520 | |||||||||||||||
| Richmond CA Jt Pwrs Fing Auth Lease Civic Ctr Pj (AG) | 5.75% | 8/1/2029 | AA+ | 1,000 | 1,104,470 | |||||||||||||||
| Sacramento CA City Fing Auth Master Lease Pg Facs Ser E (AMBAC) | 5.25% | 12/1/2023 | Aa3 | 3,150 | 3,535,654 | |||||||||||||||
| San Diego CA Pub Facs Fing Auth Master Ref Pj Ser A | 5.25% | 9/1/2035 | A2 | 5,000 | 5,081,500 | |||||||||||||||
| San Diego CA Pub Facs Fing Auth Master Ref Pj Ser A | 5.25% | 3/1/2040 | A2 | 5,000 | 5,074,350 | |||||||||||||||
|
| |||||||||||||||||||
| Total | 111,734,433 | |||||||||||||||||||
|
| |||||||||||||||||||
| Other Revenue 9.74% | ||||||||||||||||||||
| Arlington TX Higher Ed Fin Corp Arlington Classics Academy | 7.65% | 8/15/2040 | BB+ | 5,750 | 5,848,900 | |||||||||||||||
| Austin TX Convtn Entrprse Inc 1st Tier Ser A CR (BHAC)(XLCA) | 5.00% | 1/1/2034 | AA+ | 2,400 | 2,466,552 | |||||||||||||||
| Austin TX Convtn Entrprse Inc 2nd Tier Ser B† | 5.75% | 1/1/2034 | Ba2 | 5,000 | 4,529,000 | |||||||||||||||
| Austin TX Convtn Entrprse Inc 2nd Tier Ser B† | 6.00% | 1/1/2018 | Ba2 | 1,125 | 1,150,189 | |||||||||||||||
| Baker FL Correctional Dev Corp 1st Mtg Rev Detention Ctr Pj | 7.50% | 2/1/2030 | NR | 3,500 | 3,100,580 | |||||||||||||||
| Baltimore MD Cnvtn Ctr Sr Ser A (XLCA) | 5.00% | 9/1/2032 | BB+ | 2,250 | 1,940,625 | |||||||||||||||
| Baltimore MD Cnvtn Ctr Sr Ser A (XLCA) | 5.25% | 9/1/2039 | BB+ | 1,000 | 862,790 | |||||||||||||||
| Baltimore MD Cnvtn Ctr Sub Ser B | 5.875% | 9/1/2039 | Ba2 | 2,500 | 2,290,800 | |||||||||||||||
| Baytown Twp MN Rev St. Croix Prep Academy Pj Ser A | 6.75% | 8/1/2028 | NR | 1,455 | 1,455,597 | |||||||||||||||
| CA Muni Fin Auth High Tech High Chula Vista B† | 6.125% | 7/1/2038 | BB+ | (d) | 750 | 653,228 | ||||||||||||||
| CA Muni Fin Auth High Tech High Media Arts A† | 6.00% | 7/1/2038 | BB+ | (d) | 500 | 428,125 | ||||||||||||||
| CA Statewide Cmntys Dev Auth Huntington Pk Charter Sch Pj A | 5.15% | 7/1/2030 | NR | 1,000 | 816,500 | |||||||||||||||
| CA Statewide Cmntys Dev Auth Huntington Pk Charter Sch Pj A | 5.25% | 7/1/2042 | NR | 1,500 | 1,153,245 | |||||||||||||||
See Notes to Financial Statements.
100
Schedule of Investments (continued)
NATIONAL TAX FREE FUND September 30, 2011
| Investments | Interest Rate | Maturity Date | Credit Rating: S&P or Moody’s(a) | Principal Amount (000) | Fair Value | |||||||||||||||
| Other Revenue (continued) | ||||||||||||||||||||
| Chester Cnty PA Indl Dev Auth Avon Grove Charter Sch Pj A | 6.25% | 12/15/2027 | BB+ | $ | 2,325 | $ | 2,198,148 | |||||||||||||
| Clifton TX Higher Ed Fin Corp Uplift Ed Ser A | 5.70% | 12/1/2025 | BBB- | 2,000 | 2,051,440 | |||||||||||||||
| Clifton TX Higher Ed Fin Corp Uplift Ed Ser A | 6.00% | 12/1/2030 | BBB- | 1,000 | 1,016,800 | |||||||||||||||
| CO Edl & Cultural Facs Auth Charter Sch Cmnty Leadership | 6.25% | 7/1/2028 | NR | 1,000 | 961,790 | |||||||||||||||
| CO Edl & Cultural Facs Auth Charter Sch Flagstaff Ser A | 6.75% | 8/1/2028 | NR | 1,215 | 1,208,816 | |||||||||||||||
| CO Edl & Cultural Facs Auth Charter Sch North East Academy† | 5.75% | 5/15/2037 | NR | 815 | 636,841 | |||||||||||||||
| CO Edl & Cultural Facs Auth New Vision Charter Pj Sch† | 6.75% | 4/1/2040 | NR | 925 | 794,103 | |||||||||||||||
| Doctor Charles Drew Academy MI COP | 5.70% | 11/1/2036 | NR | 1,535 | 1,064,645 | |||||||||||||||
| FL St Dev Fin Corp Edl Fac Renaissance Charter Sch Ser A | 7.625% | 6/15/2041 | BB+ | (d) | 9,000 | 9,205,560 | ||||||||||||||
| Grand Traverse Academy MI Pub Sch Academy Ref | 5.00% | 11/1/2036 | BBB- | 1,840 | 1,369,714 | |||||||||||||||
| Hammond IN Loc Pub Impt Bd Bk Ser A | 6.75% | 8/15/2035 | BBB- | 1,000 | 1,013,060 | |||||||||||||||
| Hillsborough Cnty FL Indl Dev Auth Terrace Cmnty Middle Sch Pj Ser A | 5.125% | 5/15/2037 | BBB- | 1,070 | 858,279 | |||||||||||||||
| IN Fin Auth Rev Drexel Fndtn Edl Facs Pj Ser A | 6.625% | 10/1/2029 | BBB- | 750 | 752,528 | |||||||||||||||
| IN Fin Auth Rev Drexel Fndtn Edl Facs Pj Ser A | 7.00% | 10/1/2039 | BBB- | 1,250 | 1,256,037 | |||||||||||||||
| Kansas City MO Indl Dev Auth Derrick Thomas Ser A† | 5.875% | 1/1/2037 | NR | 1,850 | 1,544,065 | |||||||||||||||
| La Vernia TX Higher Ed Fin Corp Amigos Por Vida Friends Life | 6.25% | 2/15/2026 | NR | 1,465 | 1,363,812 | |||||||||||||||
| Lansing MI Brd Wtr & Lt Util Ser A(b) | 5.00% | 7/1/2029 | AA- | 9,030 | 9,776,465 | |||||||||||||||
| Lansing MI Brd Wtr & Lt Util Ser A(b) | 5.00% | 7/1/2030 | AA- | 9,485 | 10,189,459 | |||||||||||||||
| MA St Dev Fin Agy Broad Institute Ser A | 5.25% | 4/1/2037 | AA- | 6,850 | 7,194,555 | |||||||||||||||
| Maverick Cnty TX Pub Fac Corp Ser A-1 | 6.375% | 2/1/2029 | NR | 2,580 | 2,248,960 | |||||||||||||||
| Metro Boston Transit Parking Corp | 5.25% | 7/1/2033 | A+ | 11,000 | 11,706,420 | |||||||||||||||
| MI Pub Edl Facs Auth Rev Ltd Oblig Bradford Academy Pj | 8.75% | 9/1/2039 | BBB- | 2,250 | 2,453,152 | |||||||||||||||
| MI Pub Edl Facs Auth Rev Ltd Oblig David Ellis West Pj | 5.875% | 6/1/2037 | NR | 1,375 | 1,057,196 | |||||||||||||||
See Notes to Financial Statements.
101
Schedule of Investments (continued)
NATIONAL TAX FREE FUND September 30, 2011
| Investments | Interest Rate | Maturity Date | Credit Rating: S&P or Moody’s(a) | Principal Amount (000) | Fair Value | |||||||||||||||
| Other Revenue (continued) | ||||||||||||||||||||
| MI Pub Edl Facs Auth Rev Ltd Oblig Landmark Academy | 6.625% | 6/1/2030 | BBB- | $ | 2,000 | $ | 1,956,880 | |||||||||||||
| Middlesex Cnty NJ Impt Auth Sub Heldrich Ctr Hotel Ser B(j) | 6.125% | 1/1/2025 | NR | 1,250 | 125,000 | |||||||||||||||
| Middlesex Cnty NJ Impt Auth Sub Heldrich Ctr Hotel Ser B(j) | 6.25% | 1/1/2037 | NR | 1,700 | 170,000 | |||||||||||||||
| Milwaukee WI Redev Auth Academy of Learning Ser A | 5.50% | 8/1/2022 | NR | 300 | 106,851 | |||||||||||||||
| Milwaukee WI Redev Auth Academy of Learning Ser A | 5.65% | 8/1/2037 | NR | 250 | 88,198 | |||||||||||||||
| Mohave Cnty AZ Indl Dev Auth Mohave Prison LLC Expansion Pj | 8.00% | 5/1/2025 | BBB+ | 6,500 | 7,289,815 | |||||||||||||||
| New York City NY Muni Wtr Fin Auth Ser HH(b) | 5.00% | �� | 6/15/2031 | AA+ | 20,000 | 22,036,700 | ||||||||||||||
| Otero Cnty NM Jail Pj Rev | 5.75% | 4/1/2018 | NR | 825 | 773,165 | |||||||||||||||
| Otero Cnty NM Jail Pj Rev | 6.00% | 4/1/2028 | NR | 1,400 | 1,184,428 | |||||||||||||||
| Philadelphia PA Auth Indl Dev First Philadelphia Charter Ser A | 5.85% | 8/15/2037 | BBB- | 1,000 | 857,000 | |||||||||||||||
| Philadelphia PA Auth Indl Dev Please Touch Museum Pj | 5.25% | 9/1/2036 | BBB- | 7,700 | 6,244,777 | |||||||||||||||
| Philadelphia PA Auth Indl Dev Russell Byers Charter Sch Ser A | 5.25% | 5/1/2037 | BBB- | 1,500 | 1,245,000 | |||||||||||||||
| Philadelphia PA Auth Indl Dev Ser A | 5.50% | 9/15/2037 | BBB- | 1,370 | 1,177,926 | |||||||||||||||
| Pima Cnty AZ Indl Dev Auth Amer Charter Schs Fndtn Ser A | 5.50% | 7/1/2026 | BBB | (d) | 4,500 | 4,116,735 | ||||||||||||||
| Pima Cnty AZ Indl Dev Auth Amer Charter Schs Fndtn Ser A | 5.625% | 7/1/2038 | BBB | (d) | 2,000 | 1,626,840 | ||||||||||||||
| Plymouth MI Edl Ctr Charter Sch | 5.375% | 11/1/2035 | BBB- | 405 | 330,111 | |||||||||||||||
| Provo UT Charter Sch Rev Freedom Academy Fndtn | 5.50% | 6/15/2037 | NR | 965 | 721,019 | |||||||||||||||
| San Antonio TX Convtn Hotel Fin Corp Empowerment Zone Ser A AMT (AMBAC) | 5.00% | 7/15/2039 | BBB | 5,000 | 4,215,050 | |||||||||||||||
| St. Louis MO Indl Dev Auth Rev Confluence Academy Pj Ser A | 5.00% | 6/15/2020 | NR | 700 | 650,804 | |||||||||||||||
| St. Louis MO Indl Dev Auth Rev Confluence Academy Pj Ser A | 5.25% | 6/15/2025 | NR | 1,150 | 1,011,322 | |||||||||||||||
| TX St Pub Fin Auth Charter Sch Ed Cosmos Fndtn Ser A | 5.375% | 2/15/2037 | BBB | 1,230 | 1,165,597 | |||||||||||||||
| TX St Pub Fin Auth Charter Sch Uplift Ed Ser A | 5.875% | 12/1/2036 | BBB- | 1,145 | 1,106,265 | |||||||||||||||
See Notes to Financial Statements.
102
Schedule of Investments (continued)
NATIONAL TAX FREE FUND September 30, 2011
| Investments | Interest Rate | Maturity Date | Credit Rating: S&P or Moody’s(a) | Principal Amount (000) | Fair Value | |||||||||||||||
| Other Revenue (continued) | ||||||||||||||||||||
| UT St Charter Sch Fin Auth Noah Webster Academy Ser A | 6.50% | 6/15/2038 | NR | $ | 1,000 | $ | 893,600 | |||||||||||||
| Valparaiso IN Econ Dev Rev Valparaiso Fam YMCA | 5.875% | 12/1/2027 | NR | 1,000 | 857,510 | |||||||||||||||
| Valparaiso IN Econ Dev Rev Valparaiso Fam YMCA | 6.125% | 12/1/2042 | NR | 650 | 544,122 | |||||||||||||||
| West Vly City UT Charter Sch Monticello Academy† | 6.375% | 6/1/2037 | NR | 1,750 | 1,432,095 | |||||||||||||||
|
| |||||||||||||||||||
| Total | 160,544,786 | |||||||||||||||||||
|
| |||||||||||||||||||
| Pre-Refunded 0.29% | ||||||||||||||||||||
| Philadelphia PA Gas Wrks Rev 12th Ser B ETM (NPFGC) | 7.00% | 5/15/2020 | BBB | 1,590 | 1,965,463 | |||||||||||||||
| Sullivan Cnty TN Hlth Edl & Hsg Facs Brd Hosp Wellmont Hlth | 6.25% | 9/1/2022 | NR | 1,250 | 1,329,787 | |||||||||||||||
| Tyler TX Hlth Facs Dev Corp Mother Frances Hosp Regl Hlth | 6.00% | 7/1/2027 | Baa1 | 1,500 | 1,560,870 | |||||||||||||||
|
| |||||||||||||||||||
| Total | 4,856,120 | |||||||||||||||||||
|
| |||||||||||||||||||
| Special Tax 4.11% | ||||||||||||||||||||
| Altoona IA Tax Alloc Annual Appropriation | 6.00% | 6/1/2034 | BBB+ | 1,000 | 1,008,630 | |||||||||||||||
| Annawan IL Tax Incr Rev Patriot Renewable Fuels LLC Pj | 5.625% | 1/1/2018 | NR | 905 | 774,861 | |||||||||||||||
| Atlanta GA Tax Alloc Beltline Pj Ser B | 7.375% | 1/1/2031 | NR | 1,000 | 1,023,700 | |||||||||||||||
| Aurora IL Tax Incr Rev East River Area No 6 Ser A | 6.75% | 12/30/2027 | NR | 970 | 966,081 | |||||||||||||||
| Baltimore MD Spl Oblig Ser A | 7.00% | 9/1/2038 | NR | 1,500 | 1,516,185 | |||||||||||||||
| Branson Hills MO Infrastr Facs Cmnty Impt Dist Ser A | 5.50% | 4/1/2022 | NR | 965 | 822,778 | |||||||||||||||
| Branson Hills MO Infrastr Facs Cmnty Impt Dist Ser A | 5.50% | 4/1/2027 | NR | 2,805 | 2,228,573 | |||||||||||||||
| Clark Cnty NV Impt Dist Spl Loc Impt 128 Summerlin Ser A | 5.05% | 2/1/2031 | NR | 1,035 | 746,670 | |||||||||||||||
| Fontana CA Pub Fin Auth Tax Alloc Sub Lien North Fontana Redev Auth (AMBAC) | 5.00% | 10/1/2032 | A | 7,575 | 7,097,851 | |||||||||||||||
| Fontana CA Pub Fin Auth Tax North Fontana Redev Pj Ser A (AMBAC) | 5.50% | 9/1/2032 | A+ | 7,000 | 7,000,210 | |||||||||||||||
See Notes to Financial Statements.
103
Schedule of Investments (continued)
NATIONAL TAX FREE FUND September 30, 2011
| Investments | Interest Rate | Maturity Date | Credit Rating: S&P or Moody’s(a) | Principal Amount (000) | Fair Value | |||||||||||||||
| Special Tax (continued) | ||||||||||||||||||||
| Gramercy Farms FL Cmnty Dev Dist Cap Apprec~ | Zero Coupon | 5/1/2039 | NR | $ | 5,240 | $ | 786,000 | |||||||||||||
| Gramercy Farms FL Cmnty Dev Dist Ser A-1(f) | 5.25% | 5/1/2039 | NR | 1,340 | 13 | |||||||||||||||
| HI St Dept Hawaiian Home Lands Rev | 5.875% | 4/1/2034 | A1 | 3,000 | 3,191,160 | |||||||||||||||
| Houston Cnty AL Cooperative Dist Rev Country Crossing Pj | 10.00% | 5/1/2039 | NR | 5,000 | 3,111,850 | |||||||||||||||
| Lakeside Landings Cmnty Dev Dist FL Ser A(f) | 5.50% | 5/1/2038 | NR | 675 | 270,000 | |||||||||||||||
| Mesquite NV Redev Agy Tax Alloc | 6.625% | 6/1/2017 | A- | 1,605 | 1,657,692 | |||||||||||||||
| Millsboro DE Spl Oblig Plantation Lakes Spl Dev Ser A | 5.45% | 7/1/2036 | NR | 2,083 | 1,498,531 | |||||||||||||||
| New York City NY Indl Dev Agy Queens Baseball Stadium Pilot (AMBAC) | 5.00% | 1/1/2031 | BB+ | 2,000 | 1,837,520 | |||||||||||||||
| NJ Econ Dev Auth Kapkowski Rd Landfill Pj | 6.50% | 4/1/2028 | Ba2 | 2,325 | 2,463,454 | |||||||||||||||
| Osage Beach MO Tax Incr Prewitts Pt Pj | 5.00% | 5/1/2023 | NR | 1,000 | 824,350 | |||||||||||||||
| Puerto Rico Comwlth Infrastr Fing Auth Ser C (AMBAC) | 5.50% | 7/1/2028 | BBB+ | 1,475 | 1,554,414 | |||||||||||||||
| Riverside Cnty CA Redev Agy Cap Apprec Hsg Ser A (8.50% after 10/1/2021)~ | Zero Coupon | 10/1/2041 | A- | 11,195 | 6,031,194 | |||||||||||||||
| Riverside Cnty CA Redev Agy Interstate 215 Corridor Ser E | 6.00% | 10/1/2025 | A- | 1,395 | 1,415,297 | |||||||||||||||
| Riverside Cnty CA Redev Agy Interstate 215 Corridor Ser E | 6.50% | 10/1/2040 | A- | 2,000 | 2,078,540 | |||||||||||||||
| San Diego CA Redev Agy Tax Alloc North Pk Redev Pj Sub Ser A | 7.00% | 11/1/2039 | A- | 2,500 | 2,679,425 | |||||||||||||||
| San Francisco CA City & Cnty Redev Agy Mission Bay South Redev Ser D | 7.00% | 8/1/2033 | BBB | 1,000 | 1,055,880 | |||||||||||||||
| San Francisco CA City & Cnty Redev Agy Mission Bay South Redev Ser D | 7.00% | 8/1/2041 | BBB | 1,400 | 1,468,138 | |||||||||||||||
| Sparks NV Tourism Impt Dist No 1 Sr Sales Tax Antic Ser A† | 6.50% | 6/15/2020 | B2 | 1,935 | 1,845,913 | |||||||||||||||
| Sparks NV Tourism Impt Dist No 1 Sr Sales Tax Antic Ser A† | 6.75% | 6/15/2028 | B2 | 2,500 | 2,255,375 | |||||||||||||||
| Stone Canyon Cmnty Impt Dist MO Pub Infrastr Impt Pj | 5.70% | 4/1/2022 | NR | 1,000 | 828,190 | |||||||||||||||
See Notes to Financial Statements.
104
Schedule of Investments (continued)
NATIONAL TAX FREE FUND September 30, 2011
| Investments | Interest Rate | Maturity Date | Credit Rating: S&P or Moody’s(a) | Principal Amount (000) | Fair Value | |||||||||||||||
| Special Tax (continued) | ||||||||||||||||||||
| Stone Canyon Cmnty Impt Dist MO Pub Infrastr Impt Pj | 5.75% | 4/1/2027 | NR | $ | 1,300 | $ | 1,004,523 | |||||||||||||
| Vlg Cmnty Dev FL Dist No 8 Phase III | 6.125% | 5/1/2040 | NR | 4,995 | 5,016,179 | |||||||||||||||
| Yuba City CA Redev Agy Tax Pj | 6.00% | 9/1/2031 | NR | 1,965 | 1,776,930 | |||||||||||||||
|
| |||||||||||||||||||
| Total | 67,836,107 | |||||||||||||||||||
|
| |||||||||||||||||||
| Tax Revenue 8.31% | ||||||||||||||||||||
| Bi-State Dev Agy of the MO-IL Metro Dist St. Clair Cnty Metrolink Pj (AGM) | 5.25% | 7/1/2024 | AA+ | 2,330 | 2,756,623 | |||||||||||||||
| Metro Atlanta GA Rapid Transit Auth Ser A (NPFGC)(FGIC) | 5.25% | 7/1/2028 | AA+ | 1,500 | 1,729,080 | |||||||||||||||
| Metro Govt Nashville & Davidson Cnty TN Convtn Ctr Auth Ser A-1 | 5.00% | 7/1/2021 | A1 | 3,050 | 3,425,913 | |||||||||||||||
| Metro Transn Auth NY Ser A | 5.00% | 11/15/2046 | A | 10,410 | 10,785,801 | |||||||||||||||
| Miami-Dade Cnty FL Spl Oblig Sub Ser A (NPFGC) | Zero Coupon | 10/1/2024 | A2 | 3,000 | 1,413,240 | |||||||||||||||
| New York City NY Transnl Fin Auth Future Tax Secd Fiscal 2011 Ser D(b) | 5.00% | 2/1/2027 | AAA | 12,000 | 13,571,160 | |||||||||||||||
| New York City NY Transnl Fin Auth Future Tax Secd Fiscal 2011 Ser D(b) | 5.00% | 2/1/2028 | AAA | 4,000 | 4,523,720 | |||||||||||||||
| NY St Dorm Auth Ser C | 5.00% | 3/15/2025 | AAA | 5,510 | 6,361,405 | |||||||||||||||
| NY St Dorm Auth Ser C | 5.00% | 3/15/2026 | AAA | 2,580 | 2,953,636 | |||||||||||||||
| NY St Dorm Auth Ser C(b) | 5.00% | 3/15/2034 | AAA | 10,000 | 10,929,650 | |||||||||||||||
| NY St Urban Dev Corp Rev St Pers Income Tax Ser B-1 | 5.00% | 3/15/2028 | AAA | 5,000 | 5,518,700 | |||||||||||||||
| Orange Cnty FL Tourist Dev | 5.00% | 10/1/2022 | A+ | 6,000 | 6,897,900 | |||||||||||||||
| Orange Cnty FL Tourist Dev Ser A (NPFGC) | 5.00% | 10/1/2021 | A+ | 5,000 | 5,544,450 | |||||||||||||||
| Puerto Rico Sales Tax Fing Corp 1st Sub Ser A | 5.25% | 8/1/2027 | A+ | 7,500 | 8,061,375 | |||||||||||||||
| San Joaquin Cnty CA Transn Auth Ser A(b) | 5.50% | 3/1/2041 | AA | 20,000 | 22,215,600 | |||||||||||||||
| San Jose CA Spl Hotel Tax Convtn Ctr Expansion | 6.125% | 5/1/2031 | A2 | 4,190 | 4,446,721 | |||||||||||||||
| Southwestern IL Dev Auth Rev Loc Govt Pg Collinsville Ltd | 5.35% | 3/1/2031 | NR | 500 | 368,710 | |||||||||||||||
| St. Louis MO Muni Fin Corp (AMBAC) | 5.00% | 2/15/2037 | NR | 4,000 | 4,020,280 | |||||||||||||||
| Territory of Guam Oblig Rev Section 30 Ser A | 5.75% | 12/1/2034 | BBB- | 3,690 | 3,773,984 | |||||||||||||||
See Notes to Financial Statements.
105
Schedule of Investments (continued)
NATIONAL TAX FREE FUND September 30, 2011
| Investments | Interest Rate | Maturity Date | Credit Rating: S&P or Moody’s(a) | Principal Amount (000) | Fair Value | |||||||||||||||
| Tax Revenue (continued) | ||||||||||||||||||||
| Virgin Islands Pub Fin Auth Rev Gross Rcpts Taxes Ln Nts (NPFGC)(FGIC) | 5.00% | 10/1/2025 | BBB+ | $ | 2,500 | $ | 2,539,650 | |||||||||||||
| Virgin Islands Pub Fin Auth Rev Matching Fd Ln Sr Lien Ser A | 5.00% | 10/1/2029 | BBB | 5,850 | 5,795,185 | |||||||||||||||
| Virgin Islands Pub Fin Auth Rev Matching Fd Ln Sub Lien Ser B | 5.25% | 10/1/2029 | Baa2 | 4,500 | 4,554,630 | |||||||||||||||
| Yorba Linda CA Redev Agy Tax Alloc Sub Lien Redev Pj Ser A | 6.00% | 9/1/2026 | A- | 1,145 | 1,193,537 | |||||||||||||||
| Yorba Linda CA Redev Agy Tax Alloc Sub Lien Redev Pj Ser A | 6.50% | 9/1/2032 | A- | 2,000 | 2,099,620 | |||||||||||||||
| York PA Gen Auth Rev York City Recreation Corp (AMBAC) | 5.50% | 5/1/2018 | NR | 1,475 | 1,478,658 | |||||||||||||||
|
| |||||||||||||||||||
| Total | 136,959,228 | |||||||||||||||||||
|
| |||||||||||||||||||
| Tobacco 5.16% | ||||||||||||||||||||
| Buckeye OH Tob Sttlmnt Fing Auth Asset Bkd Sr Turbo Ser A-2 | 5.75% | 6/1/2034 | BB- | 11,665 | 8,371,504 | |||||||||||||||
| Buckeye OH Tob Sttlmnt Fing Auth Asset Bkd Sr Turbo Ser A-2 | 5.875% | 6/1/2030 | BB- | 8,300 | 6,228,071 | |||||||||||||||
| Buckeye OH Tob Sttlmnt Fing Auth Asset Bkd Sr Turbo Ser A-2 | 5.875% | 6/1/2047 | BB- | 10,000 | 7,028,100 | |||||||||||||||
| Golden St Tob Securitization Corp CA Asset Bkd Sr Ser A-1 | 5.00% | 6/1/2033 | BB+ | 2,000 | 1,402,740 | |||||||||||||||
| Golden St Tob Securitization Corp CA Asset Bkd Sr Ser A-1 | 5.125% | 6/1/2047 | BB+ | 10,650 | 6,782,665 | |||||||||||||||
| Golden St Tob Securitization Corp CA Asset Bkd Sr Ser A-2 (5.30% after 12/1/2012)~ | Zero Coupon | 6/1/2037 | BB+ | 13,200 | 8,442,852 | |||||||||||||||
| IA Tob Sttlmnt Auth Asset Bkd Ser C | 5.625% | 6/1/2046 | BBB | 1,960 | 1,423,254 | |||||||||||||||
| IA Tob Sttlmnt Auth Cap Apprec Asset Bkd Ser B | 5.60% | 6/1/2034 | BBB | 4,750 | 3,821,233 | |||||||||||||||
| Inland Empire Tob Securitization Auth CA Ser A | 4.625% | 6/1/2021 | B+ | (d) | 5,310 | 4,258,089 | ||||||||||||||
| Inland Empire Tob Securitization Auth CA Ser A | 5.00% | 6/1/2021 | B+ | (d) | 1,710 | 1,414,649 | ||||||||||||||
| NJ Tob Sttlmnt Fing Corp Ser 1A | 4.625% | 6/1/2026 | BBB | 10,500 | 8,220,030 | |||||||||||||||
| NJ Tob Sttlmnt Fing Corp Ser 1A | 4.75% | 6/1/2034 | BB+ | 30,755 | 20,067,637 | |||||||||||||||
| VA Tob Sttlmnt Fing Corp Sr Ser B1 | 5.00% | 6/1/2047 | BB- | 12,580 | 7,619,203 | |||||||||||||||
|
| |||||||||||||||||||
| Total | 85,080,027 | |||||||||||||||||||
|
| |||||||||||||||||||
See Notes to Financial Statements.
106
Schedule of Investments (continued)
NATIONAL TAX FREE FUND September 30, 2011
| Investments | Interest Rate | Maturity Date | Credit Rating: S&P or Moody’s(a) | Principal Amount (000) | Fair Value | |||||||||||||||
| Transportation 12.32% | ||||||||||||||||||||
| CA Foothill Eastern Transn Corridor Agy Cap Apprec | Zero Coupon | 1/15/2035 | BBB- | $ | 10,000 | $ | 2,089,700 | |||||||||||||
| Cent TX Regl Mobility Auth Sr Lien | 6.00% | 1/1/2041 | BBB- | 10,000 | 10,140,400 | |||||||||||||||
| Dallas TX Area Rapid Transit Sr Lien(b) | 5.00% | 12/1/2022 | AA+ | 9,645 | 10,986,577 | |||||||||||||||
| Dallas TX Area Rapid Transit Sr Lien(b) | 5.00% | 12/1/2023 | AA+ | 6,135 | 6,988,352 | |||||||||||||||
| Dallas TX Area Rapid Transit Sr Lien(b) | 5.00% | 12/1/2028 | AA+ | 7,160 | 8,155,924 | |||||||||||||||
| E-470 Pub Hwy Auth CO Rev Cap Apprec | Zero Coupon | 9/1/2035 | Baa2 | 18,000 | 3,499,200 | |||||||||||||||
| E-470 Pub Hwy Auth CO Rev Cap Apprec | Zero Coupon | 9/1/2039 | Baa2 | 7,500 | 1,087,800 | |||||||||||||||
| HI St Arpts Sys Rev Ser A | 5.00% | 7/1/2034 | A | 3,000 | 3,105,000 | |||||||||||||||
| KY St Tpk Auth Econ Revitalization Pjs Ser A | 5.00% | 7/1/2027 | AA+ | 5,000 | 5,547,250 | |||||||||||||||
| Lee Cnty FL Ser A AMT | 5.375% | 10/1/2032 | A2 | 3,500 | 3,527,755 | |||||||||||||||
| Los Angeles CA Dept of Arpts Los Angeles Intl Arpt Ser A(b) | 5.00% | 5/15/2035 | AA | 10,000 | 10,618,450 | |||||||||||||||
| Metro Atlanta GA Rapid Transit Auth 3rd Indenture Ser B (AGM) | 5.00% | 7/1/2029 | AA+ | 2,000 | 2,092,140 | |||||||||||||||
| Metro Transn Auth NY Ser 2008 C | 6.50% | 11/15/2028 | A | 7,500 | 8,900,100 | |||||||||||||||
| Metro WA DC Arpts Auth Ser A AMT(b) | 5.00% | 10/1/2022 | AA- | 3,250 | 3,472,089 | |||||||||||||||
| Metro WA DC Arpts Auth Ser A AMT(b) | 5.375% | 10/1/2028 | AA- | 2,500 | 2,670,837 | |||||||||||||||
| Miami-Dade Cnty FL Aviation Miami Intl Arpt Ser A | 5.375% | 10/1/2035 | A2 | 6,975 | 7,254,628 | |||||||||||||||
| Mid-Bay Bridge Auth FL Springing Ser A | 7.25% | 10/1/2034 | BBB- | 7,500 | 7,970,775 | |||||||||||||||
| NJ St Transn Tr Fd Auth Transn Sys Ser A | 6.00% | 6/15/2035 | A+ | 4,500 | 5,217,075 | |||||||||||||||
| NJ St Transn Tr Fd Auth Transn Sys Ser B (NPFGC) | 5.50% | 12/15/2021 | A+ | 10,000 | 11,795,900 | |||||||||||||||
| North TX Twy Auth Rev Sys 1st Tier Ser A | 6.00% | 1/1/2025 | A2 | 5,000 | 5,587,900 | |||||||||||||||
| North TX Twy Auth Rev Toll 2nd Tier Ser F | 5.75% | 1/1/2033 | A3 | 5,705 | 5,897,430 | |||||||||||||||
| NY St Thwy Auth Hwy & Bridge Tr Fd Ser B | 5.00% | 4/1/2022 | AA | 5,000 | 5,646,750 | |||||||||||||||
| NY St Thwy Auth Hwy & Bridge Tr Fd Ser B | 5.00% | 4/1/2025 | AA | 5,000 | 5,559,600 | |||||||||||||||
See Notes to Financial Statements.
107
Schedule of Investments (continued)
NATIONAL TAX FREE FUND September 30, 2011
| Investments | Interest Rate | Maturity Date | Credit Rating: S&P or Moody’s(a) | Principal Amount (000) | Fair Value | |||||||||||||||
| Transportation (continued) | ||||||||||||||||||||
| Orlando & Orange Cnty FL Expwy Auth Ser A | 5.00% | 7/1/2030 | A1 | $ | 1,500 | $ | 1,599,360 | |||||||||||||
| PA St Tpk Commn Cap Apprec Sub Ser B2 (6.00% after 12/1/2015)~ | Zero Coupon | 12/1/2034 | A- | 12,000 | 9,990,600 | |||||||||||||||
| PA St Tpk Commn Oil 2003 Tpk Ser C Rmkt (NPFGC) | 5.00% | 12/1/2029 | AA | 1,000 | 1,074,520 | |||||||||||||||
| PA St Tpk Commn Sub Ser B-1 | 5.625% | 6/1/2029 | A- | 3,310 | 3,561,295 | |||||||||||||||
| Port of Oakland CA Inter Lien Ser A AMT (NPFGC) | 5.00% | 11/1/2026 | A- | 2,285 | 2,272,958 | |||||||||||||||
| Port of Oakland CA Ser O AMT | 5.00% | 5/1/2027 | A | 3,000 | 3,011,220 | |||||||||||||||
| Port of Oakland CA Ser O AMT | 5.00% | 5/1/2028 | A | 2,275 | 2,262,237 | |||||||||||||||
| Puerto Rico Comwlth Hwy & Transn Auth (AG)(AGM) | 5.50% | 7/1/2025 | AA+ | 2,000 | 2,235,860 | |||||||||||||||
| Regl Transn Dist CO Denver Trans Partners | 6.00% | 1/15/2034 | Baa3 | 1,800 | 1,856,772 | |||||||||||||||
| Regl Transn Dist CO Ser A COP | 5.375% | 6/1/2031 | Aa3 | 5,200 | 5,580,692 | |||||||||||||||
| San Francisco CA City & Cnty Arpts Commn 2nd Tier Ser F AMT | 5.00% | 5/1/2025 | A+ | 15,000 | 15,530,400 | |||||||||||||||
| San Jose CA Arpt Rev Ser A-1 AMT | 6.25% | 3/1/2034 | A | 5,000 | 5,440,650 | |||||||||||||||
| St. Louis MO Arpt Rev Lambert Intl Arpt Ser A (AGM) | 5.00% | 7/1/2025 | AA+ | 2,000 | 2,059,120 | |||||||||||||||
| St. Louis MO Arpt Rev Lambert Intl Arpt Ser A-1 | 6.25% | 7/1/2029 | A- | 3,020 | 3,269,603 | |||||||||||||||
| UT Transit Auth Sales Tax Rev Ser A(b) | 5.00% | 6/15/2028 | AAA | 5,002 | 5,485,601 | |||||||||||||||
|
| |||||||||||||||||||
| Total | 203,042,520 | |||||||||||||||||||
|
| |||||||||||||||||||
| Utilities 15.88% | ||||||||||||||||||||
| Amer Muni Pwr OH Inc Prairie St Enrg Campus Pj A | 5.25% | 2/15/2027 | A1 | 5,000 | 5,359,300 | |||||||||||||||
| Atlanta GA Wtr & Wst Wtr Rev Ser A | 6.00% | 11/1/2028 | A1 | 3,000 | 3,405,900 | |||||||||||||||
| Atlanta GA Wtr & Wst Wtr Rev Ser A | 6.00% | 11/1/2029 | A1 | 4,000 | 4,520,600 | |||||||||||||||
| AZ Salt River Pj Agric Impt & Pwr Dist Ser A(b) | 5.00% | 12/1/2026 | Aa1 | 20,000 | 22,986,700 | |||||||||||||||
| AZ Salt River Pj Agric Impt & Pwr Dist Ser A(b) | 5.00% | 1/1/2032 | Aa1 | 5,440 | 5,870,848 | |||||||||||||||
| Birmingham AL Wtrwrks Brd Rev | 4.75% | 1/1/2036 | Aa2 | 5,000 | 5,142,850 | |||||||||||||||
| Brazos River Auth TX Pollutn Ctrl TXU Elec Co Pj Ser C AMT | 5.75% | 5/1/2036 | CC | 4,170 | 4,155,864 | |||||||||||||||
| Cape Fear Pub Util Auth NC Wtr & Swr Sys | 5.00% | 8/1/2026 | AA | 5,000 | 5,579,900 | |||||||||||||||
See Notes to Financial Statements.
108
Schedule of Investments (continued)
NATIONAL TAX FREE FUND September 30, 2011
| Investments | Interest Rate | Maturity Date | Credit Rating: S&P or Moody’s(a) | Principal Amount (000) | Fair Value | |||||||||||||||
| Utilities (continued) | ||||||||||||||||||||
| Cent Plains NE Enrg Pj No 1 | 0.782% | # | 12/1/2017 | Ba3 | $ | 5,000 | $ | 4,105,100 | ||||||||||||
| Chula Vista CA Rev San Diego Gas Ser E Rmkt | 5.875% | 1/1/2034 | Aa3 | 2,125 | 2,358,771 | |||||||||||||||
| Compton CA Wtr Rev | 6.00% | 8/1/2039 | A | 5,500 | 5,739,855 | |||||||||||||||
| CT St Muni Elec Enrg Cooperative Ser A (AMBAC) | 5.00% | 1/1/2022 | Aa3 | 1,650 | 1,835,872 | |||||||||||||||
| Detroit MI Wtr Supply Sys Sr Lien Ser A (NPFGC) | 5.00% | 7/1/2034 | A+ | 5,000 | 5,014,450 | |||||||||||||||
| FL St Muni Pwr Agy Rev Pwr Ser A | 6.25% | 10/1/2031 | A2 | 4,000 | 4,508,240 | |||||||||||||||
| Honolulu HI City & Cnty Wst Wtr 2nd Bd Resolution Jr Ser A (AGM)(b) | 5.00% | 7/1/2032 | AA+ | 10,000 | 10,627,800 | |||||||||||||||
| Houston TX Util Sys Rev 1st Lien Ser A | 5.125% | 11/15/2028 | NR | 4,000 | 4,311,640 | |||||||||||||||
| Lansing MI Brd Wtr & Lt Util Ser A | 5.00% | 7/1/2037 | AA- | 2,000 | 2,138,240 | |||||||||||||||
| Las Vegas Vly NV Wtr Dist Wtr Impt Ser C | 2.50% | 6/1/2036 | AA+ | 2,500 | 2,500,000 | |||||||||||||||
| Lewis Cnty WA Pub Util Dist No 1 Ser A (AGM) | 5.00% | 12/1/2027 | Aa3 | 4,975 | 5,411,357 | |||||||||||||||
| Long Beach CA Bd Fin Auth Natural Gas Ser A | 5.25% | 11/15/2020 | A | 1,505 | 1,531,082 | |||||||||||||||
| Long Island NY Pwr Auth Ser A | 5.00% | 5/1/2038 | A- | 7,250 | 7,552,107 | |||||||||||||||
| Long Island NY Pwr Auth Ser A | 6.25% | 4/1/2033 | A- | 1,000 | 1,145,060 | |||||||||||||||
| Los Angeles CA Dept of Wtr & Pwr Sys Sub Ser A2 (AMBAC) | 5.00% | 7/1/2028 | AA- | 4,925 | 5,263,544 | |||||||||||||||
| Louisville & Jefferson Cnty KY Metro Swr Dist Ser A(b) | 5.00% | 5/15/2028 | AA- | 19,460 | 21,421,568 | |||||||||||||||
| M-S-R Enrg Auth CA Gas Rev Ser C | 7.00% | 11/1/2034 | A | 2,000 | 2,325,600 | |||||||||||||||
| Main St Natural Gas Inc GA Gas Pj Ser A | 5.00% | 3/15/2022 | Aa3 | 5,000 | 5,206,400 | |||||||||||||||
| Main St Natural Gas Inc GA Gas Pj Ser B | 5.00% | 3/15/2019 | A | 1,000 | 1,001,200 | |||||||||||||||
| Main St Natural Gas Inc GA Gas Pj Ser B | 5.00% | 3/15/2021 | A | 3,500 | 3,453,310 | |||||||||||||||
| Maricopa Cnty AZ Pollutn Ctrl Corp El Paso Elec Co Pj Ser A | 7.25% | 2/1/2040 | BBB | 3,500 | 3,878,070 | |||||||||||||||
| Metro Atlanta GA Rapid Transit Auth 3rd Indenture Ser B (AGM) | 5.00% | 7/1/2034 | AA+ | 10,000 | 10,310,900 | |||||||||||||||
| Metro St. Louis MO Swr Dist Ser A | 5.75% | 5/1/2038 | AA+ | 1,760 | 1,972,080 | |||||||||||||||
| MO Jt Muni Elec Util Commn Ser A (AMBAC) | 5.00% | 1/1/2023 | A3 | 3,000 | 3,216,510 | |||||||||||||||
| North Sumter Cnty FL Util Dependent Dist | 5.375% | 10/1/2030 | BBB | 5,000 | 4,880,850 | |||||||||||||||
| Northern CA Gas Auth No 1 | 0.885% | # | 7/1/2027 | A | 5,000 | 3,360,450 | ||||||||||||||
| NY St Envr Facs Corp Ser B | 4.75% | 6/15/2032 | AA+ | 5,000 | 5,230,500 | |||||||||||||||
See Notes to Financial Statements.
109
Schedule of Investments (continued)
NATIONAL TAX FREE FUND September 30, 2011
| Investments | Interest Rate | Maturity Date | Credit Rating: S&P or Moody’s(a) | Principal Amount (000) | Fair Value | |||||||||||||||
| Utilities (continued) | ||||||||||||||||||||
| OH St Air Quality Dev Auth First Enrg Generation Ser A | 5.70% | 8/1/2020 | BBB- | $ | 3,250 | $ | 3,631,485 | |||||||||||||
| OH St Air Quality Dev Auth OH Vly Elec Corp Ser E | 5.625% | 10/1/2019 | BBB- | 4,500 | 4,880,520 | |||||||||||||||
| OK St Muni Pwr Auth Ser A | 5.875% | 1/1/2028 | A | 1,000 | 1,125,460 | |||||||||||||||
| Orlando FL Utils Commn Ser B | 5.00% | 10/1/2033 | Aa1 | 2,500 | 2,687,175 | |||||||||||||||
| PA Econ Dev Fing Auth Allegheny Enrg Supply Co | 7.00% | 7/15/2039 | BBB- | 1,000 | 1,095,760 | |||||||||||||||
| PA Econ Dev Fing Auth Philadelphia BioSolids Fac | 6.25% | 1/1/2032 | Baa3 | 2,500 | 2,631,075 | |||||||||||||||
| Palm Beach Cnty FL Solid Wst Auth Impt Ser B | 5.50% | 10/1/2028 | AA+ | 3,000 | 3,339,630 | |||||||||||||||
| Pima Cnty AZ Indl Dev Auth Global Wtr Res LLC Pj AMT | 6.55% | 12/1/2037 | NR | 3,000 | 2,825,010 | |||||||||||||||
| Pinal Cnty AZ Elec Dist No 4 | 6.00% | 12/1/2028 | A- | 740 | 774,935 | |||||||||||||||
| Puerto Rico Elec Pwr Auth Ser RR (XLCA) | 5.00% | 7/1/2025 | A3 | 1,000 | 1,018,680 | |||||||||||||||
| Puerto Rico Elec Pwr Auth Ser UU | 0.865% | # | 7/1/2031 | A3 | 4,000 | 2,525,640 | ||||||||||||||
| SA Enrg Acq Pub Fac Corp TX Gas Supply Rev | 5.50% | 8/1/2021 | A | 5,000 | 5,168,250 | |||||||||||||||
| Sabine River Auth TX Pollutn Ctrl TXU Elec Co Pj Ser B AMT | 5.75% | 5/1/2030 | CC | 1,375 | 1,370,339 | |||||||||||||||
| Sabine River Auth TX Pollutn Ctrl TXU Enrg Co Pj Ser A | 5.80% | 7/1/2022 | CC | 1,000 | 295,740 | |||||||||||||||
| Sacramento CA Muni Util Dist Ser U (AGM)(b) | 5.00% | 8/15/2023 | AA+ | 3,650 | 4,000,856 | |||||||||||||||
| Sacramento CA Muni Util Dist Ser U (AGM)(b) | 5.00% | 8/15/2024 | AA+ | 2,920 | 3,200,685 | |||||||||||||||
| Sacramento CA Muni Util Dist Ser U (AGM)(b) | 5.00% | 8/15/2025 | AA+ | 2,920 | 3,200,685 | |||||||||||||||
| Salt Verde AZ Financial Corp Gas Rev Ser A | 5.00% | 12/1/2037 | A | 8,000 | 7,165,120 | |||||||||||||||
| Sthn CA Pub Pwr Auth Pj No 1 Ser A | 1.64% | # | 11/1/2038 | Baa1 | 5,000 | 3,004,400 | ||||||||||||||
| TN Enrg Acq Corp Jr Ser B | 5.625% | 9/1/2026 | BBB | (d) | 3,000 | 2,861,430 | ||||||||||||||
| TX Muni Gas Acq & Supply Corp I Sr Lien Ser A | 5.25% | 12/15/2026 | A | 1,250 | 1,159,525 | |||||||||||||||
| TX Muni Gas Acq & Supply Corp I Sr Lien Ser D | 6.25% | 12/15/2026 | A | 11,575 | 11,894,586 | |||||||||||||||
| Virgin Islands Wtr & Pwr Auth Ser A | 5.00% | 7/1/2027 | BBB- | 555 | 560,750 | |||||||||||||||
| Virgin Islands Wtr & Pwr Auth Ser A | 5.00% | 7/1/2031 | BBB- | 2,330 | 2,272,729 | |||||||||||||||
See Notes to Financial Statements.
110
Schedule of Investments (concluded)
NATIONAL TAX FREE FUND September 30, 2011
| Investments | Interest Rate | Maturity Date | Credit Rating: S&P or Moody’s(a) | Principal Amount (000) | Fair Value | |||||||||||||||||||
| Utilities (continued) | ||||||||||||||||||||||||
| Walton Cnty GA Wtr & Swr Auth Walton Hard Labor Creek Pj GTD (AGM) | 5.00% | 2/1/2033 | AA+ | $ | 1,650 | $ | 1,762,184 | |||||||||||||||||
|
| |||||||||||||||||||||||
| Total | 261,775,167 | |||||||||||||||||||||||
|
| |||||||||||||||||||||||
| Total Municipal Bonds (cost $1,761,391,686) | 1,802,633,529 | |||||||||||||||||||||||
|
| |||||||||||||||||||||||
Shares | ||||||||||||||||||||||||
| SHORT-TERM INVESTMENTS 0.23% | ||||||||||||||||||||||||
| Money Market Mutual Funds 0.00% | ||||||||||||||||||||||||
| Dreyfus Municipal Cash Management Plus | – | (k) | 908 | |||||||||||||||||||||
| SSgA Tax Free Money Market Fund | 5 | 4,501 | ||||||||||||||||||||||
|
| |||||||||||||||||||||||
| Total Money Market Mutual Funds (cost $5,409) | 5,409 | |||||||||||||||||||||||
|
| |||||||||||||||||||||||
| Interest Rate# | Interest Rate Reset Date(e) | Final Maturity Date | Principal Amount (000) | |||||||||||||||||||||
| Variable Rate Demand Notes 0.23% | ||||||||||||||||||||||||
| General Obligation | ||||||||||||||||||||||||
| New York City NY Fiscal 2008 Sub Ser J-5 | 1.20% | 10/3/2011 | 8/1/2028 | AA | $ | 1,800 | 1,800,000 | |||||||||||||||||
| New York City NY Sub Ser L-5 | 1.20% | 10/3/2011 | 4/1/2035 | AA | 2,000 | 2,000,000 | ||||||||||||||||||
|
| |||||||||||||||||||||||
| Total Variable Rate Demand Notes (cost $3,800,000) | 3,800,000 | |||||||||||||||||||||||
|
| |||||||||||||||||||||||
| Total Short-Term Investments (cost $3,805,409) | 3,805,409 | |||||||||||||||||||||||
|
| |||||||||||||||||||||||
| Total Investments in Securities 109.58% (cost $1,765,197,095) | 1,806,438,938 | |||||||||||||||||||||||
|
| |||||||||||||||||||||||
| Liabilities in Excess of Cash and Other Assets(i) (9.58%) | (157,962,360 | ) | ||||||||||||||||||||||
|
| |||||||||||||||||||||||
| Net Assets 100.00% | $ | 1,648,476,578 | ||||||||||||||||||||||
|
| |||||||||||||||||||||||
Open Futures Contracts at September 30, 2011:
| Type | Expiration | Contracts | Position | Market Value | Unrealized Depreciation | |||||||||||
| U.S. 10-Year Treasury Note | December 2011 | 461 | Short | $ | (59,973,219) | $ | (420,633) | |||||||||
| U.S. 30-Year Treasury Bond | December 2011 | 580 | Short | (82,722,500) | (3,242,175) | |||||||||||
| Ultra Long U.S. Treasury Bond | December 2011 | 167 | Short | (26,490,375) | (2,101,453) | |||||||||||
|
|
|
| |||||||||||||
| Totals | $ | (169,186,094) | $ | (5,764,261) | ||||||||||||
|
|
|
| |||||||||||||
See Notes to Financial Statements.
111
Schedule of Investments
HIGH YIELD MUNICIPAL BOND FUND September 30, 2011
| Investments | Interest Rate | Maturity Date | Credit Rating: S&P or Moody’s(a) | Principal Amount (000) | Fair Value | |||||||||||||||
| MUNICIPAL BONDS 107.10% | ||||||||||||||||||||
| Corporate-Backed 13.61% | ||||||||||||||||||||
| AK Indl Dev & Export Auth Sports Facs Rev Anchorage Sportsplex Pj Ser A | 6.15% | 8/1/2031 | NR | $ | 3,285 | $ | 1,314,000 | |||||||||||||
| AL St Indl Dev Auth Solid Pine City Fiber Co Rmkt AMT | 6.45% | 12/1/2023 | B2 | 6,000 | 5,297,460 | |||||||||||||||
| Aleutians East Borough AK Aleutian Pribilof Islands Inc (ACA) | 5.50% | 6/1/2025 | NR | 1,375 | 1,197,556 | |||||||||||||||
| Aleutians East Borough AK Aleutian Pribilof Islands Inc (ACA) | 5.50% | 6/1/2036 | NR | 3,210 | 2,544,085 | |||||||||||||||
| Allegheny Cnty PA Indl Dev Auth Envr Impt | 6.75% | 11/1/2024 | BB | 1,025 | 1,093,808 | |||||||||||||||
| Allegheny Cnty PA Indl Dev Auth Envr Impt | 6.875% | 5/1/2030 | BB | 8,050 | 8,526,640 | |||||||||||||||
| Alliance Arpt Auth Inc TX Spl Facs Amer Airlines Inc Pj AMT | 5.25% | 12/1/2029 | CCC+ | 17,000 | 11,048,300 | |||||||||||||||
| Beauregard Parish LA Rev Boise Cascade Corp Pj | 6.80% | 2/1/2027 | B2 | 6,250 | 5,769,187 | |||||||||||||||
| Brazos River Auth TX Pollutn Ctrl TXU Co Ser A Rmkt AMT | 7.70% | 4/1/2033 | CC | 2,000 | 660,540 | |||||||||||||||
| Brazos River Auth TX Pollutn Ctrl TXU Co Ser D-1 Rmkt AMT† | 8.25% | 5/1/2033 | Ca | 2,000 | 720,660 | |||||||||||||||
| Calhoun Cnty AR Solid Wst GA Pacific Corp Pj AMT | 6.375% | 11/1/2026 | Baa3 | 2,075 | 2,087,118 | |||||||||||||||
| Chicago IL O’Hare Intl Arpt Delta Airlines Inc Term | 6.45% | 5/1/2018 | NR | 2,345 | 2,344,766 | |||||||||||||||
| Clayton Cnty GA Dev Auth Delta Airlines Ser B AMT | 9.00% | 6/1/2035 | CCC+ | 7,640 | 8,248,908 | |||||||||||||||
| Cleveland OH Arpt Spl Rev Continental Airlines Inc Pj AMT | 5.375% | 9/15/2027 | B3 | 12,560 | 10,703,004 | |||||||||||||||
| Courtland AL Indl Dev Brd Solid Wst Disp Intl Paper Co Pjs A AMT | 5.20% | 6/1/2025 | BBB | 9,545 | 9,227,342 | |||||||||||||||
| Dallas-Fort Worth TX Intl Arpt Facs Impt Corp Amer Airlines Inc | 6.00% | 11/1/2014 | CCC+ | 7,500 | 7,063,050 | |||||||||||||||
| Dallas-Fort Worth TX Intl Arpt Facs Impt Corp Amer Airlines Inc AMT | 5.50% | 11/1/2030 | CCC+ | 2,000 | 1,330,920 | |||||||||||||||
| Dallas-Fort Worth TX Intl Arpt Facs Impt Corp Sub Ser 2 Rmkt AMT | 9.00% | 5/1/2029 | CCC+ | 7,500 | 7,332,675 | |||||||||||||||
| Dallas-Fort Worth TX Intl Arpt Facs Impt Corp Sub Ser 3 Rmkt AMT | 9.125% | 5/1/2029 | CCC+ | 13,500 | 13,445,730 | |||||||||||||||
See Notes to Financial Statements.
112
Schedule of Investments (continued)
HIGH YIELD MUNICIPAL BOND FUND September 30, 2011
| Investments | Interest Rate | Maturity Date | Credit Rating: S&P or Moody’s(a) | Principal Amount (000) | Fair Value | |||||||||||||||
| Corporate-Backed (continued) | ||||||||||||||||||||
| Greater Orlando FL Aviation Auth Spl Purp JetBlue Airways Corp AMT | 6.375% | 11/15/2026 | NR | $ | 5,060 | $ | 4,909,414 | |||||||||||||
| IL Fin Auth Sports Fac Leafs Hockey Club Pj Ser A(f) | 5.875% | 3/1/2027 | NR | 1,500 | 385,875 | |||||||||||||||
| IL Fin Auth Sports Fac Leafs Hockey Club Pj Ser A(f) | 6.00% | 3/1/2037 | NR | 1,450 | 364,791 | |||||||||||||||
| IL Fin Auth Sports Fac Utd Sports Org of Barrington Ser A† | 6.125% | 10/1/2027 | NR | 1,475 | 368,750 | |||||||||||||||
| IL Fin Auth Sports Fac Utd Sports Org of Barrington Ser A† | 6.25% | 10/1/2037 | NR | 6,525 | 1,631,250 | |||||||||||||||
| Intl Falls MN Pollutn Ctrl Boise Cascade Corp Pj | 5.65% | 12/1/2022 | B- | 1,085 | 941,628 | |||||||||||||||
| Little River Cnty AR Rev GA Pacific Corp Pj AMT | 5.60% | 10/1/2026 | Baa3 | 2,945 | 2,886,512 | |||||||||||||||
| MA St Port Auth Spl Delta Airlines Inc Pj Ser A AMT (AMBAC) | 5.50% | 1/1/2016 | NR | 1,830 | 1,717,839 | |||||||||||||||
| MA St Port Auth Spl Delta Airlines Inc Pj Ser A AMT (AMBAC) | 5.50% | 1/1/2022 | NR | 10,000 | 8,459,700 | |||||||||||||||
| MD St Econ Dev Corp Sr Lien Pj Chesapeake Bay Ser A | 5.00% | 12/1/2016 | NR | 4,000 | 3,377,040 | |||||||||||||||
| New York City NY Indl Dev Agy Amer Airlines JFK Intl Arpt AMT | 7.625% | 8/1/2025 | B- | 9,515 | 9,453,343 | |||||||||||||||
| New York City NY Indl Dev Agy British Airways Plc Pj AMT | 5.25% | 12/1/2032 | BB- | 4,010 | 3,353,082 | |||||||||||||||
| New York City NY Indl Dev Agy JetBlue Airways Corp Pj AMT | 5.00% | 5/15/2020 | B- | 2,900 | 2,616,351 | |||||||||||||||
| New York City NY Indl Dev Agy JetBlue Airways Corp Pj AMT | 5.125% | 5/15/2030 | B- | 1,000 | 834,730 | |||||||||||||||
| Nez Perce Cnty ID Pollutn Ctrl Potlatch Corp Pj | 6.00% | 10/1/2024 | BB | 5,000 | 5,000,700 | |||||||||||||||
| NJ Econ Dev Auth Amer Airlines Inc Pj AMT | 7.10% | 11/1/2031 | CCC+ | 1,980 | 1,668,467 | |||||||||||||||
| NJ Econ Dev Auth Glimcher Pptys LP Pj AMT | 6.00% | 11/1/2028 | NR | 6,190 | 5,584,185 | |||||||||||||||
| NJ Econ Dev Auth Spl Fac Continental Airlines Inc Pj AMT | 5.50% | 4/1/2028 | B3 | 5,935 | 5,209,031 | |||||||||||||||
| NJ Econ Dev Auth Spl Fac Continental Airlines Inc Pj AMT | 6.25% | 9/15/2019 | B | 5,625 | 5,545,350 | |||||||||||||||
| NJ Econ Dev Auth Spl Fac Continental Airlines Inc Pj AMT | 6.25% | 9/15/2029 | B | 3,000 | 2,845,140 | |||||||||||||||
See Notes to Financial Statements.
113
Schedule of Investments (continued)
HIGH YIELD MUNICIPAL BOND FUND September 30, 2011
| Investments | Interest Rate | Maturity Date | Credit Rating: S&P or Moody’s(a) | Principal Amount (000) | Fair Value | |||||||||||||||
| Corporate-Backed (continued) | ||||||||||||||||||||
| NJ Econ Dev Auth Spl Fac Continental Airlines Inc Pj AMT | 7.20% | 11/15/2030 | B | $ | 755 | $ | 755,227 | |||||||||||||
| OR St Econ Dev Rev GA Pacific Corp Ser CLVII AMT | 6.35% | 8/1/2025 | BBB- | 2,325 | 2,325,256 | |||||||||||||||
| PA Econ Dev Fing Auth US Airways Grp Ser B | 8.00% | 5/1/2029 | CCC+ | 2,500 | 2,584,150 | |||||||||||||||
| Phoenix AZ Indl Dev Auth Amer West Airlines Inc Pj AMT | 6.25% | 6/1/2019 | Caa3 | 1,955 | 1,800,477 | |||||||||||||||
| Phoenix AZ Indl Dev Auth Amer West Airlines Inc Pj AMT | 6.30% | 4/1/2023 | Caa3 | 3,685 | 3,222,385 | |||||||||||||||
| Port of Bay City Auth TX Matagorda Hoechst Celanese Corp Pj AMT | 6.50% | 5/1/2026 | B+ | 6,120 | 5,990,134 | |||||||||||||||
| Port of Corpus Christi Auth of Nueces Cnty TX Celanese Pj Ser A | 6.45% | 11/1/2030 | B+ | 5,100 | 5,131,365 | |||||||||||||||
| Port of St. Helen’s OR Pollutn Ctrl Boise Cascade Corp Pj | 5.65% | 12/1/2027 | B- | 1,730 | 1,410,625 | |||||||||||||||
| Rockdale Cnty GA Dev Auth Visy Paper Pj Ser A AMT | 6.125% | 1/1/2034 | NR | 6,000 | 5,988,480 | |||||||||||||||
| Rumford ME Solid Wst Disp Boise Cascade Corp Pj AMT | 6.875% | 10/1/2026 | B2 | 1,500 | 1,338,555 | |||||||||||||||
| West Pace Cooperative Dist AL Rev | 9.125% | 5/1/2039 | NR | 14,050 | 12,937,521 | |||||||||||||||
|
| |||||||||||||||||||
| Total | 210,593,102 | |||||||||||||||||||
|
| |||||||||||||||||||
| Education 5.79% | ||||||||||||||||||||
| Brevard Cnty FL Indl Dev Rev Tuff FL Tech Pj | 6.50% | 11/1/2029 | BBB- | 2,500 | 2,603,225 | |||||||||||||||
| CA St Pub Wrks Brd Regents Univ Ser E(b) | 5.00% | 4/1/2034 | Aa2 | 7,495 | 7,677,850 | |||||||||||||||
| CA Statewide Cmntys Dev Auth Thomas Jefferson Sch Law Ser A† | 7.25% | 10/1/2032 | BB+ | 3,500 | 3,584,490 | |||||||||||||||
| CA Statewide Cmntys Dev Auth Windrush Sch(f) | 5.50% | 7/1/2037 | NR | 7,225 | 4,990,018 | |||||||||||||||
| Dutchess Cnty NY Loc Dev Corp Anderson Ctr Svcs Inc Pj | 6.00% | 10/1/2030 | BB+ | 1,720 | 1,676,295 | |||||||||||||||
| Gainesville GA Redev Auth Edl Riverside Military Academy | 5.125% | 3/1/2027 | BBB- | (d) | 1,375 | 1,150,174 | ||||||||||||||
| Gainesville GA Redev Auth Edl Riverside Military Academy | 5.125% | 3/1/2037 | BBB- | (d) | 7,460 | 5,715,479 | ||||||||||||||
| Harrisburg PA Auth Univ Rev Harrisburg Univ of Science B | 6.00% | 9/1/2036 | NR | 12,725 | 11,538,266 | |||||||||||||||
See Notes to Financial Statements.
114
Schedule of Investments (continued)
HIGH YIELD MUNICIPAL BOND FUND September 30, 2011
| Investments | Interest Rate | Maturity Date | Credit Rating: S&P or Moody’s(a) | Principal Amount (000) | Fair Value | |||||||||||||||
| Education (continued) | ||||||||||||||||||||
| IL Fin Auth Rev IL Inst Tech | 7.125% | 2/1/2034 | Baa3 | $ | 2,500 | $ | 2,487,200 | |||||||||||||
| IL Fin Auth Rev IL Inst Tech Ser A | 5.00% | 4/1/2025 | Baa3 | 2,500 | 2,030,300 | |||||||||||||||
| IL Fin Auth Rev IL Inst Tech Ser A | 5.00% | 4/1/2026 | Baa3 | 2,000 | 1,608,160 | |||||||||||||||
| IL Fin Auth Rev IL Inst Tech Ser A | 5.00% | 4/1/2031 | Baa3 | 2,000 | 1,525,640 | |||||||||||||||
| MA St Dev Fin Agy Boston Architectural College (ACA) | 5.00% | 1/1/2037 | NR | 2,710 | 2,028,110 | |||||||||||||||
| Marietta GA Dev Auth Rev Univ Facs Life Univ Inc Pj | 7.00% | 6/15/2030 | Ba3 | 5,000 | 5,004,550 | |||||||||||||||
| MD St Hlth & Higher Edl Facs Auth Washington Christian Academy(f) | 5.25% | 7/1/2018 | NR | 250 | 100,000 | |||||||||||||||
| MD St Hlth & Higher Edl Facs Auth Washington Christian Academy(f) | 5.50% | 7/1/2038 | NR | 2,300 | 920,000 | |||||||||||||||
| MI Higher Ed Facs Auth Rev Ltd Oblig Creative Studies | 5.875% | 12/1/2028 | Baa3 | 2,360 | 2,394,904 | |||||||||||||||
| MI Higher Ed Facs Auth Rev Ltd Oblig Creative Studies | 6.125% | 12/1/2033 | Baa3 | 3,075 | 3,111,162 | |||||||||||||||
| New York City NY Indl Dev Agy Vaughn College Aeronautics B | 5.00% | 12/1/2031 | BB+ | 1,510 | 1,284,482 | |||||||||||||||
| New York City NY Indl Dev Agy Vaughn College Aeronautics B | 5.25% | 12/1/2036 | BB+ | 3,640 | 3,152,240 | |||||||||||||||
| NJ St Edl Facs Auth Univ Med & Dentistry Ser B | 7.125% | 12/1/2023 | Baa1 | 4,000 | 4,747,400 | |||||||||||||||
| NJ St Edl Facs Auth Univ Med & Dentistry Ser B | 7.50% | 12/1/2032 | Baa1 | 2,000 | 2,320,140 | |||||||||||||||
| OH St Higher Edl Fac Rev Commn Ashland Univ Pj | 6.25% | 9/1/2024 | Ba1 | 7,020 | 7,182,934 | |||||||||||||||
| Pima Cnty AZ Indl Dev Auth Paradise Ed Ctr Pj | 6.10% | 6/1/2045 | BBB- | 1,000 | 865,710 | |||||||||||||||
| Stockton CA Unif Sch Dist Cap Apprec Election 2008 Ser D (AGM) | Zero Coupon | 8/1/2033 | AA+ | 8,135 | 2,070,439 | |||||||||||||||
| Univ of CA Ser O(b) | 5.75% | 5/15/2031 | Aa1 | 7,000 | 7,895,545 | |||||||||||||||
|
| |||||||||||||||||||
| Total | 89,664,713 | |||||||||||||||||||
|
| |||||||||||||||||||
| General Obligation 8.44% | ||||||||||||||||||||
| Alameda Cnty CA Oakland Unif Sch Dist Election 2006 Ser A | 6.125% | 8/1/2029 | A2 | 1,500 | 1,624,155 | |||||||||||||||
| Arkansas City KS Pub Bldg Commn South Cent Regl Med Ctr | 6.75% | 9/1/2038 | A3 | 6,360 | 6,867,973 | |||||||||||||||
| CA St Var Purp | 5.00% | 9/1/2041 | A1 | 7,500 | 7,688,175 | |||||||||||||||
See Notes to Financial Statements.
115
Schedule of Investments (continued)
HIGH YIELD MUNICIPAL BOND FUND September 30, 2011
| Investments | Interest Rate | Maturity Date | Credit Rating: S&P or Moody’s(a) | Principal Amount (000) | Fair Value | |||||||||||||||
| General Obligation (continued) | ||||||||||||||||||||
| Ceres CA Unif Sch Dist Cap Apprec 2008 Election Ser A | Zero Coupon | 8/1/2037 | A+ | $ | 4,150 | $ | 684,418 | |||||||||||||
| Ceres CA Unif Sch Dist Cap Apprec 2008 Election Ser A | Zero Coupon | 8/1/2041 | A+ | 6,500 | 789,750 | |||||||||||||||
| Ceres CA Unif Sch Dist Cap Apprec 2008 Election Ser A | Zero Coupon | 8/1/2042 | A+ | 6,900 | 777,423 | |||||||||||||||
| Ceres CA Unif Sch Dist Cap Apprec 2008 Election Ser A | Zero Coupon | 8/1/2043 | A+ | 6,900 | 720,774 | �� | ||||||||||||||
| Ceres CA Unif Sch Dist Cap Apprec 2008 Election Ser A | Zero Coupon | 8/1/2044 | A+ | 7,200 | 697,176 | |||||||||||||||
| Ceres CA Unif Sch Dist Cap Apprec 2008 Election Ser A | Zero Coupon | 8/1/2047 | A+ | 8,000 | 617,360 | |||||||||||||||
| Ceres CA Unif Sch Dist Cap Apprec 2008 Election Ser A | Zero Coupon | 8/1/2048 | A+ | 8,000 | 571,840 | |||||||||||||||
| Huntington Beach CA Union High Sch Dist Cap Apprec 2004 Election (NPFGC)(FGIC) | Zero Coupon | 8/1/2033 | Aa2 | 5,000 | 1,246,850 | |||||||||||||||
| Kendall Kane & Will Cntys IL Cmnty Unit Sch Dist No 308 Ser A(b)(c) | 5.00% | 2/1/2029 | Aa2 | 19,000 | 19,892,050 | |||||||||||||||
| Los Angeles CA Cmnty College Dist 2001 Election Ser A (NPFGC)(FGIC)(b) | 5.00% | 8/1/2032 | Aa1 | 10,580 | 11,100,377 | |||||||||||||||
| Los Angeles CA Unif Sch Dist 2004 Election Ser H (AGM)(b) | 5.00% | 7/1/2032 | AA+ | 10,000 | 10,382,700 | |||||||||||||||
| Los Angeles CA Unif Sch Dist Ser D(b) | 5.00% | 1/1/2034 | AA- | 10,460 | 10,913,546 | |||||||||||||||
| Los Angeles CA Unif Sch Dist Ser F(b) | 5.00% | 7/1/2029 | AA- | 2,000 | 2,086,720 | |||||||||||||||
| Maverick Cnty TX Ctfs Oblig | 8.75% | 3/1/2034 | NR | 2,500 | 2,596,200 | |||||||||||||||
| Maverick Cnty TX Ctfs Oblig | 8.75% | 3/1/2034 | NR | 5,500 | 5,711,640 | |||||||||||||||
| New York City NY Ser H-1(b) | 5.125% | 3/1/2026 | AA | 10,000 | 11,063,250 | |||||||||||||||
| New York City NY Sub Ser J-1(b) | 5.00% | 5/15/2029 | AA | 9,000 | 9,641,295 | |||||||||||||||
| New York City NY Sub Ser J-1(b) | 5.00% | 5/15/2031 | AA | 7,000 | 7,498,785 | |||||||||||||||
| New York City NY Sub Ser J-1(b) | 5.00% | 5/15/2036 | AA | 1,000 | 1,071,255 | |||||||||||||||
| Newport Mesa CA Unif Sch Dist Cap Apprec Election 2005 | Zero Coupon | 8/1/2035 | Aa1 | 19,135 | 4,800,206 | |||||||||||||||
| Newport Mesa CA Unif Sch Dist Cap Apprec Election 2005 | Zero Coupon | 8/1/2037 | Aa1 | 10,645 | 2,353,929 | |||||||||||||||
| Territory of Guam Ser A | 6.75% | 11/15/2029 | B+ | 3,690 | 3,846,161 | |||||||||||||||
| Territory of Guam Ser A | 7.00% | 11/15/2039 | B+ | 2,175 | 2,274,550 | |||||||||||||||
| Woonsocket RI | 7.125% | 6/15/2016 | Ba1 | 3,000 | 3,057,210 | |||||||||||||||
|
| |||||||||||||||||||
| Total | 130,575,768 | |||||||||||||||||||
|
| |||||||||||||||||||
See Notes to Financial Statements.
116
Schedule of Investments (continued)
HIGH YIELD MUNICIPAL BOND FUND September 30, 2011
| Investments | Interest Rate | Maturity Date | Credit Rating: S&P or Moody’s(a) | Principal Amount (000) | Fair Value | |||||||||||||||
| Health Care 28.84% | ||||||||||||||||||||
| Alachua Cnty FL Indl Dev Rev North FL Ret Vlg | 5.875% | 11/15/2036 | NR | $ | 10,000 | $ | 8,097,000 | |||||||||||||
| Alachua Cnty FL Indl Dev Rev North FL Ret Vlg | 5.875% | 11/15/2042 | NR | 4,500 | 3,543,345 | |||||||||||||||
| Allegheny Cnty PA Hosp Dev Auth Hlth Sys West PA Ser A | 5.00% | 11/15/2028 | B+ | 15,365 | 13,103,887 | |||||||||||||||
| Allegheny Cnty PA Hosp Dev Auth Hlth Sys West PA Ser A | 5.375% | 11/15/2040 | B+ | 2,425 | 2,021,019 | |||||||||||||||
| AZ Hlth Facs Auth Hlthcare Beatitudes Campus Pj | 5.20% | 10/1/2037 | NR | 9,710 | 7,395,621 | |||||||||||||||
| Bucks Cnty PA Indl Dev Auth Ret Cmnty Ann’s Choice Inc Fac Ser A | 6.125% | 1/1/2025 | NR | 3,500 | 3,463,670 | |||||||||||||||
| CA Statewide Cmntys Dev Auth Daughters of Charity Hlth Ser A | 5.25% | 7/1/2030 | BBB | 3,020 | 2,614,082 | |||||||||||||||
| CA Statewide Cmntys Dev Auth Sr Living Sthn CA | 7.00% | 11/15/2029 | BBB | 1,000 | 1,086,790 | |||||||||||||||
| CA Statewide Cmntys Dev Auth Sr Living Sthn CA | 7.25% | 11/15/2041 | BBB | 2,500 | 2,693,175 | |||||||||||||||
| CA Statewide Cmntys Dev Auth Vlycare Hlth Sys Ser A | 5.00% | 7/15/2022 | NR | 2,270 | 2,067,947 | |||||||||||||||
| CO Hlth Facs Auth Rev Amer Baptist Ser A | 7.75% | 8/1/2029 | NR | 5,770 | 6,026,419 | |||||||||||||||
| CO Hlth Facs Auth Rev Amer Baptist Ser A | 7.75% | 8/1/2039 | NR | 5,045 | 5,226,267 | |||||||||||||||
| Cottage Grove MN Sr Hsg Rev PHS/Cottage Grove Inc Pj B | 6.00% | 12/1/2046 | NR | 2,325 | 2,126,143 | |||||||||||||||
| Cumberland Cnty PA Muni Auth Asbury PA Oblig Grp | 5.40% | 1/1/2022 | NR | 585 | 561,401 | |||||||||||||||
| Cumberland Cnty PA Muni Auth Asbury PA Oblig Grp | 6.00% | 1/1/2030 | NR | 5,500 | 5,298,865 | |||||||||||||||
| Cumberland Cnty PA Muni Auth Asbury PA Oblig Grp | 6.00% | 1/1/2040 | NR | 3,425 | 3,200,217 | |||||||||||||||
| Cuyahoga Cnty OH Hlthcare & Indpt Living Fac Eliza Jennings Sr Care Ser A | 6.00% | 5/15/2037 | NR | 4,300 | 3,933,468 | |||||||||||||||
| Cuyahoga Cnty OH Hlthcare & Indpt Living Fac Eliza Jennings Sr Care Ser A | 6.00% | 5/15/2042 | NR | 2,500 | 2,258,400 | |||||||||||||||
| Director St NV Dept Business & Industry Las Ventanas Ret Pj A(f) | 7.00% | 11/15/2034 | NR | 6,000 | 3,138,480 | |||||||||||||||
| Director St NV Dept Business & Industry Las Ventanas Ret Pj B(f) | 6.00% | 11/15/2014 | NR | 4,105 | 2,147,531 | |||||||||||||||
| Director St NV Dept Business & Industry Las Ventanas Ret Pj B(f) | 6.75% | 11/15/2023 | NR | 4,700 | 2,461,484 | |||||||||||||||
See Notes to Financial Statements.
117
Schedule of Investments (continued)
HIGH YIELD MUNICIPAL BOND FUND September 30, 2011
| Investments | Interest Rate | Maturity Date | Credit Rating: S&P or Moody’s(a) | Principal Amount (000) | Fair Value | |||||||||||||||
| Health Care (continued) | ||||||||||||||||||||
| Fairfax Cnty VA Indl Dev Auth Hlthcare Inova Hlth Sys Ser A(b) | 5.50% | 5/15/2035 | AA+ | $ | 5,000 | $ | 5,321,350 | |||||||||||||
| Flint MI Hosp Bldg Auth Rent Hurley Med Ctr | 7.00% | 7/1/2030 | Ba1 | 4,225 | 4,346,596 | |||||||||||||||
| Flint MI Hosp Bldg Auth Rent Hurley Med Ctr | 7.375% | 7/1/2035 | Ba1 | 2,620 | 2,735,175 | |||||||||||||||
| Flint MI Hosp Bldg Auth Rent Hurley Med Ctr | 7.50% | 7/1/2039 | Ba1 | 800 | 829,920 | |||||||||||||||
| Gaithersburg MD Econ Dev Rev Asbury MD Oblig Grp A | 5.125% | 1/1/2036 | BBB- | (d) | 6,700 | 5,939,818 | ||||||||||||||
| Gaithersburg MD Econ Dev Rev Asbury MD Oblig Ser B | 6.00% | 1/1/2023 | BBB- | (d) | 3,385 | 3,568,907 | ||||||||||||||
| Harris Cnty TX Cultural Ed Facs Fin Corp Children’s Hosp Pj(b) | 5.00% | 10/1/2024 | AA | 6,000 | 6,481,290 | |||||||||||||||
| Harris Cnty TX Cultural Ed Facs Fin Corp Children’s Hosp Pj(b) | 5.25% | 10/1/2029 | AA | 4,000 | 4,320,860 | |||||||||||||||
| HFDC Cent TX Inc Ret Fac Ser A | 5.625% | 11/1/2026 | NR | 1,850 | 1,613,774 | |||||||||||||||
| HFDC Cent TX Inc Ret Fac Ser A | 5.75% | 11/1/2036 | NR | 5,500 | 4,519,900 | |||||||||||||||
| Holmes Cnty FL Hosp Corp Doctors Mem Hosp | 5.75% | 11/1/2026 | NR | 6,165 | 5,544,061 | |||||||||||||||
| Holmes Cnty FL Hosp Corp Doctors Mem Hosp | 6.00% | 11/1/2038 | NR | 7,115 | 6,110,931 | |||||||||||||||
| Howard Cnty MD Ret Cmnty Vantage Hse Fac Ser A | 5.25% | 4/1/2027 | NR | 1,200 | 953,208 | |||||||||||||||
| Howard Cnty MD Ret Cmnty Vantage Hse Fac Ser A | 5.25% | 4/1/2033 | NR | 2,990 | 2,233,769 | |||||||||||||||
| Howard Cnty MD Ret Cmnty Vantage Hse Fac Ser B | 5.25% | 4/1/2037 | NR | 6,270 | 4,549,387 | |||||||||||||||
| Huntsville-Redstone Vlg AL Spl Care Facs Fing Auth Redstone Vlg Pj | 5.50% | 1/1/2028 | NR | 4,500 | 4,002,570 | |||||||||||||||
| IL Fin Auth Rev Admiral at Lake Pj Ser A | 8.00% | 5/15/2040 | NR | 3,000 | 3,061,170 | |||||||||||||||
| IL Fin Auth Rev Clare Oaks Pj Ser A | 6.00% | 11/15/2027 | NR | 9,000 | 5,486,580 | |||||||||||||||
| IL Fin Auth Rev Clare Wtr Twr Cap Apprec Ser B | Zero Coupon | 5/15/2050 | NR | 4,800 | 25,200 | |||||||||||||||
| IL Fin Auth Rev Clare Wtr Twr Ser A-2 | 5.20% | 5/15/2015 | NR | 700 | 210,000 | |||||||||||||||
| IL Fin Auth Rev Clare Wtr Twr Ser A-3 | 5.30% | 5/15/2016 | NR | 700 | 210,000 | |||||||||||||||
| IL Fin Auth Rev Clare Wtr Twr Ser A-6 | 6.00% | 5/15/2028 | NR | 2,800 | 840,000 | |||||||||||||||
| IL Fin Auth Rev Clare Wtr Twr Ser A-7 | 6.125% | 5/15/2041 | NR | 3,500 | 1,050,000 | |||||||||||||||
See Notes to Financial Statements.
118
Schedule of Investments (continued)
HIGH YIELD MUNICIPAL BOND FUND September 30, 2011
| Investments | Interest Rate | Maturity Date | Credit Rating: S&P or Moody’s(a) | Principal Amount (000) | Fair Value | |||||||||||||||
| Health Care (continued) | ||||||||||||||||||||
| IL Fin Auth Rev Clare Wtr Twr Ser A-10 | 5.125% | 5/15/2018 | NR | $ | 3,500 | $ | 1,050,000 | |||||||||||||
| IL Fin Auth Rev Friendship Vlg Schaumburg | 7.25% | 2/15/2045 | BB- | (d) | 3,500 | 3,510,395 | ||||||||||||||
| IL Fin Auth Rev Friendship Vlg Schaumburg Ser A | 5.375% | 2/15/2025 | BB- | (d) | 4,000 | 3,549,480 | ||||||||||||||
| IL Fin Auth Rev Friendship Vlg Schaumburg Ser A | 5.625% | 2/15/2037 | BB- | (d) | 10,975 | 9,071,386 | ||||||||||||||
| IL Fin Auth Rev Landing at Plymouth Place Pj Ser A | 6.00% | 5/15/2025 | NR | 3,000 | 2,690,640 | |||||||||||||||
| IL Fin Auth Rev Northwestern Mem Hosp Ser A(b) | 5.75% | 8/15/2030 | AA+ | 5,000 | 5,416,600 | |||||||||||||||
| IL Fin Auth Rev Rush Univ Med Ctr Oblig Grp Ser A | 7.25% | 11/1/2030 | A2 | 3,000 | 3,418,860 | |||||||||||||||
| IL Fin Auth Rev Smith Vlg Pj Ser A | 5.25% | 11/15/2016 | NR | 4,290 | 4,248,130 | |||||||||||||||
| IL Fin Auth Rev Three Crowns Pk Plaza Ser A | 5.875% | 2/15/2038 | NR | 4,500 | 4,131,180 | |||||||||||||||
| Iron River MI Hosp Fin Auth Iron Cnty Cmnty Hosps | 6.50% | 5/15/2033 | NR | 5,000 | 4,680,950 | |||||||||||||||
| Johnston NC Mem Hosp Auth (AGM)(FHA)(b) | 5.25% | 10/1/2036 | AAA | 7,000 | 7,508,865 | |||||||||||||||
| Kansas City MO Indl Dev Auth First Mtg Bishop Spencer Ser A | 6.50% | 1/1/2035 | NR | 6,500 | 6,193,005 | |||||||||||||||
| Kent MI Hosp Fin Auth Rev Metro Hosp Pj Ser A | 5.75% | 7/1/2025 | BB+ | 8,825 | 8,668,091 | |||||||||||||||
| Kent MI Hosp Fin Auth Rev Metro Hosp Pj Ser A | 6.00% | 7/1/2035 | BB+ | 4,350 | 4,113,230 | |||||||||||||||
| Kirkwood MO Indl Dev Auth Aberdeen Heights Ser A | 8.00% | 5/15/2021 | NR | 1,000 | 1,071,480 | |||||||||||||||
| Kirkwood MO Indl Dev Auth Aberdeen Heights Ser A | 8.00% | 5/15/2029 | NR | 2,820 | 2,960,746 | |||||||||||||||
| Kirkwood MO Indl Dev Auth Aberdeen Heights Ser A | 8.25% | 5/15/2039 | NR | 6,695 | 7,051,843 | |||||||||||||||
| LA Pub Facs Auth Hosp Rev Lake Charles Mem Hosp† | 6.375% | 12/1/2034 | NR | 6,340 | 6,077,080 | |||||||||||||||
| LA Pub Facs Auth Ochsner Clinic Fndtn Pj | 6.50% | 5/15/2037 | Baa1 | 8,250 | 8,897,212 | |||||||||||||||
| Lubbock TX Hlth Facs Dev Corp 1st Mtg Carillon Pj A | 6.30% | 7/1/2019 | NR | 4,010 | 4,059,483 | |||||||||||||||
| MA Dev Fin Agy Groves Lincoln Ser A | 7.50% | 6/1/2029 | NR | 4,000 | 4,106,920 | |||||||||||||||
| MA Dev Fin Agy Groves Lincoln Ser A | 7.75% | 6/1/2039 | NR | 2,000 | 2,062,400 | |||||||||||||||
See Notes to Financial Statements.
119
Schedule of Investments (continued)
HIGH YIELD MUNICIPAL BOND FUND September 30, 2011
| Investments | Interest Rate | Maturity Date | Credit Rating: S&P or Moody’s(a) | Principal Amount (000) | Fair Value | |||||||||||||||
| Health Care (continued) | ||||||||||||||||||||
| MA St Hlth & Edl Facs Auth Emerson Hosp Ser E (RADIAN) | 5.00% | 8/15/2025 | NR | $ | 6,840 | $ | 6,048,612 | |||||||||||||
| Martin Cnty TX Hosp Dist Ser A | 7.25% | 4/1/2036 | BBB+ | (d) | 3,450 | 3,534,456 | ||||||||||||||
| MI St Hosp Fin Auth Rev Presbyterian Vlg | 5.25% | 11/15/2025 | BB+ | (d) | 3,800 | 3,355,666 | ||||||||||||||
| MI St Hosp Fin Auth Rev Presbyterian Vlg | 5.50% | 11/15/2035 | BB+ | (d) | 1,750 | 1,485,680 | ||||||||||||||
| Montgomery Cnty PA Indl Dev Auth Rev Mtg Whitemarsh Continuing Care | 6.125% | 2/1/2028 | NR | 6,045 | 5,373,159 | |||||||||||||||
| Montgomery Cnty PA Indl Dev Auth Rev Mtg Whitemarsh Continuing Care | 6.25% | 2/1/2035 | NR | 11,975 | 10,266,048 | |||||||||||||||
| NC Med Care Commn Hsg Fndtn Inc (ACA) | 6.625% | 8/15/2030 | NR | 2,915 | 2,833,817 | |||||||||||||||
| NH Hlth & Ed Facs Auth Havenwood Heritage Heights A | 5.35% | 1/1/2026 | NR | 2,415 | 2,290,241 | |||||||||||||||
| NH Hlth & Ed Facs Auth Havenwood Heritage Heights A | 5.40% | 1/1/2030 | NR | 750 | 690,300 | |||||||||||||||
| NJ Econ Dev Auth First Mtg Seashore Gardens Pj | 5.30% | 11/1/2026 | NR | 1,250 | 1,063,300 | |||||||||||||||
| NJ Econ Dev Auth First Mtg Seashore Gardens Pj | 5.375% | 11/1/2036 | NR | 4,705 | 3,607,982 | |||||||||||||||
| NY St Dorm Auth Rev Non St Supp Debt Orange Regl Med Ctr | 6.125% | 12/1/2029 | Ba1 | 4,250 | 4,287,485 | |||||||||||||||
| OH St Hosp Fac Rev Cleveland Clinic Hlth Ser B(b) | 5.50% | 1/1/2034 | Aa2 | 13,500 | 14,450,265 | |||||||||||||||
| Orange Cnty FL Hlth Facs Auth First Mtg Orlando Lutheran Tower | 5.50% | 7/1/2038 | NR | 6,550 | 5,402,571 | |||||||||||||||
| Orange Cnty FL Hlth Facs Auth Hlthcare Orlando Lutheran | 5.375% | 7/1/2020 | NR | 1,100 | 1,049,345 | |||||||||||||||
| Orange Cnty FL Hlth Facs Auth Hlthcare Orlando Lutheran | 5.70% | 7/1/2026 | NR | 2,920 | 2,666,690 | |||||||||||||||
| Philadelphia PA Hosps & Higher Ed Facs Auth Temple Univ Hlth Sys Ser A | 5.00% | 7/1/2034 | BBB | 7,275 | 6,047,635 | |||||||||||||||
| Philadelphia PA Hosps & Higher Ed Facs Auth Temple Univ Hlth Sys Ser B | 5.50% | 7/1/2026 | BBB | 1,800 | 1,743,336 | |||||||||||||||
| RI St Hlth & Edl Bldg Corp Hosp Fing St. Joseph Hlth Svcs | 5.50% | 10/1/2029 | B- | 15,270 | 12,567,821 | |||||||||||||||
| Rochester MN Hlthcare Samaritan Bethany Ser A | 6.875% | 12/1/2029 | NR | 1,945 | 2,021,536 | |||||||||||||||
| Rochester MN Hlthcare Samaritan Bethany Ser A | 7.375% | 12/1/2041 | NR | 6,000 | 6,227,700 | |||||||||||||||
| San Buenaventura CA Cmnty Mem Hlth Sys | 8.00% | 12/1/2026 | BB | 10,000 | 11,077,600 | |||||||||||||||
See Notes to Financial Statements.
120
Schedule of Investments (continued)
HIGH YIELD MUNICIPAL BOND FUND September 30, 2011
| Investments | Interest Rate | Maturity Date | Credit Rating: S&P or Moody’s(a) | Principal Amount (000) | Fair Value | |||||||||||||||
| Health Care (continued) | ||||||||||||||||||||
| Sarasota Cnty FL Hlth Facs Auth Hlthcare Sarasota Manatee | 5.75% | 7/1/2037 | NR | $ | 2,565 | $ | 2,142,160 | |||||||||||||
| Sarasota Cnty FL Hlth Facs Auth Hlthcare Sarasota Manatee | 5.75% | 7/1/2045 | NR | 6,435 | 5,236,867 | |||||||||||||||
| Sayre OK Mem Hosp Auth | 6.00% | 7/1/2037 | NR | 4,000 | 3,100,240 | |||||||||||||||
| SC Jobs Econ Dev Auth First Mtg Wesley Commons | 5.125% | 10/1/2026 | NR | 900 | 753,705 | |||||||||||||||
| SC Jobs Econ Dev Auth Hampton Regl Med | 5.25% | 11/1/2028 | NR | 12,000 | 10,477,200 | |||||||||||||||
| St. Paul MN Port Auth Lease Rev Healtheast Midway Campus 03 A | 5.75% | 5/1/2025 | BB | 1,520 | 1,522,842 | |||||||||||||||
| St. Paul MN Port Auth Lease Rev Healtheast Midway Campus 03 A | 5.875% | 5/1/2030 | BB | 1,000 | 987,160 | |||||||||||||||
| Sylacauga AL Hlthcare Auth Coosa Vly Med Ctr Ser A | 5.375% | 8/1/2015 | NR | 1,915 | 1,941,561 | |||||||||||||||
| Sylacauga AL Hlthcare Auth Coosa Vly Med Ctr Ser A | 6.00% | 8/1/2025 | NR | 3,000 | 2,766,570 | |||||||||||||||
| Sylacauga AL Hlthcare Auth Coosa Vly Med Ctr Ser A | 6.00% | 8/1/2035 | NR | 3,000 | 2,610,690 | |||||||||||||||
| Tulsa Cnty OK Indl Auth Sr Montereau Inc Pj Ser A | 6.875% | 11/1/2023 | NR | 1,300 | 1,355,484 | |||||||||||||||
| Tulsa Cnty OK Indl Auth Sr Montereau Inc Pj Ser A | 7.125% | 11/1/2030 | NR | 2,000 | 2,110,580 | |||||||||||||||
| Upper IL River Vly Dev Auth Pleasant View Luther Home | 7.25% | 11/15/2040 | NR | 1,200 | 1,186,956 | |||||||||||||||
| Upper IL River Vly Dev Auth Pleasant View Luther Home | 7.375% | 11/15/2045 | NR | 1,550 | 1,535,508 | |||||||||||||||
| Vigo Cnty IN Hosp Auth Rev Union Hosp Inc† | 5.70% | 9/1/2037 | NR | 9,250 | 8,446,360 | |||||||||||||||
| Vigo Cnty IN Hosp Auth Rev Union Hosp Inc† | 5.75% | 9/1/2042 | NR | 2,000 | 1,818,260 | |||||||||||||||
| Vigo Cnty IN Hosp Auth Rev Union Hosp Inc | 8.00% | 9/1/2041 | NR | 2,955 | 3,220,625 | |||||||||||||||
| Western IL Econ Dev Auth Carthage Mem Hosp Pj Ser B | 7.00% | 6/1/2033 | NR | 2,890 | 2,700,994 | |||||||||||||||
| WI St Hlth & Edl Facs Ascension Hlth Sr Ctr Grp(b) | 5.00% | 11/15/2030 | AA+ | 1,170 | 1,219,433 | |||||||||||||||
| WI St Hlth & Edl Facs Ascension Hlth Sr Ctr Grp(b) | 5.00% | 11/15/2033 | Aa1 | 7,000 | 7,167,125 | |||||||||||||||
| WI St Hlth & Edl Facs Auth Wheaton Hlthcare Ser B | 5.125% | 8/15/2030 | BBB+ | 5,000 | 4,637,300 | |||||||||||||||
See Notes to Financial Statements.
121
Schedule of Investments (continued)
HIGH YIELD MUNICIPAL BOND FUND September 30, 2011
| Investments | Interest Rate | Maturity Date | Credit Rating: S&P or Moody’s(a) | Principal Amount (000) | Fair Value | |||||||||||||||
| Health Care (continued) | ||||||||||||||||||||
| Wilson Cnty KS Hosp Rev | 5.60% | 9/1/2036 | NR | $ | 3,530 | $ | 2,942,326 | |||||||||||||
| WV St Hosp Fin Auth Thomas Hlth Sys | 6.50% | 10/1/2028 | NR | 7,425 | 7,437,251 | |||||||||||||||
|
| |||||||||||||||||||
| Total | 446,366,095 | |||||||||||||||||||
|
| |||||||||||||||||||
| Housing 1.40% | ||||||||||||||||||||
| El Paso Cnty TX Hsg Fin Corp Multi Fam Hsg Rev Las Lomas Apts Ser A | 6.375% | 12/1/2029 | B3 | 3,280 | 2,567,387 | |||||||||||||||
| El Paso Cnty TX Hsg Fin Corp Multi Fam Hsg Rev Las Lomas Apts Ser A | 6.45% | 12/1/2019 | B3 | 1,350 | 1,209,074 | |||||||||||||||
| Harrisonburg VA Redev & Hsg Auth Multi Fam Hsg Brooke Ridge Apts Pj Ser E AMT | 6.475% | 12/1/2038 | NR | 12,100 | 7,847,939 | |||||||||||||||
| LA Hsg Fin Agy Multi Fam Hsg Chateau Ser A | 6.875% | 9/1/2029 | BBB- | 1,805 | 1,865,305 | |||||||||||||||
| LA Hsg Fin Agy Multi Fam Hsg Ser B | 8.00% | 9/1/2039 | BB- | 3,440 | 3,525,587 | |||||||||||||||
| Metro Govt Nashville & Davidson Cnty TN Hlth & Edl Facs Brd Multi Fam Hsg Prestige A(f) | 7.50% | 12/20/2040 | NR | 3,930 | 2,286,395 | |||||||||||||||
| MuniMae TE Bd Subs LLC†(l) | 5.30% | 11/29/2049 | Ba2 | 2,000 | 1,362,680 | |||||||||||||||
| MuniMae TE Bd Subs LLC†(l) | 5.90% | 11/29/2049 | B1 | 2,000 | 1,022,700 | |||||||||||||||
|
| |||||||||||||||||||
| Total | 21,687,067 | |||||||||||||||||||
|
| |||||||||||||||||||
| Lease Obligations 1.28% | ||||||||||||||||||||
| Houston Cnty AL Cooperative Dist Rev Country Crossing Pj | 15.00% | 5/27/2012 | NR | 4,199 | 1,269,652 | |||||||||||||||
| LA Pub Facs Auth Rev Susla Facs Inc Pj Ser A† | 5.75% | 7/1/2039 | NR | 5,100 | 3,827,703 | |||||||||||||||
| NY St Urban Dev Corp Rev St Pers Income Tax Ser A-1(b) | 5.00% | 12/15/2025 | AAA | 3,730 | 4,133,780 | |||||||||||||||
| NY St Urban Dev Corp Rev St Pers Income Tax Ser A-1(b) | 5.00% | 12/15/2026 | AAA | 5,420 | 6,006,726 | |||||||||||||||
| NY St Urban Dev Corp Rev St Pers Income Tax Ser A-1(b) | 5.00% | 12/15/2027 | AAA | 2,160 | 2,393,825 | |||||||||||||||
| Philadelphia PA Muni Auth Rev Lease | 6.375% | 4/1/2029 | A2 | 2,000 | 2,122,580 | |||||||||||||||
|
| |||||||||||||||||||
| Total | 19,754,266 | |||||||||||||||||||
|
| |||||||||||||||||||
| Other Revenue 13.84% | ||||||||||||||||||||
| Baker FL Correctional Dev Corp 1st Mtg Rev Detention Ctr Pj | 7.50% | 2/1/2030 | NR | 8,300 | 7,352,804 | |||||||||||||||
| Baltimore MD Cnvtn Ctr Sr Ser A (XLCA) | 5.00% | 9/1/2032 | BB+ | 2,250 | 1,940,625 | |||||||||||||||
See Notes to Financial Statements.
122
Schedule of Investments (continued)
HIGH YIELD MUNICIPAL BOND FUND September 30, 2011
| Investments | Interest Rate | Maturity Date | Credit Rating: S&P or Moody’s(a) | Principal Amount (000) | Fair Value | |||||||||||||||
| Other Revenue (continued) | ||||||||||||||||||||
| Baltimore MD Cnvtn Ctr Sr Ser A (XLCA) | 5.25% | 9/1/2039 | BB+ | $ | 2,975 | $ | 2,566,800 | |||||||||||||
| Baltimore MD Cnvtn Ctr Sub Ser B | 5.875% | 9/1/2039 | Ba2 | 10,845 | 9,937,490 | |||||||||||||||
| Baytown Twp MN Rev St. Croix Prep Academy Pj Ser A | 6.75% | 8/1/2028 | NR | 3,450 | 3,451,415 | |||||||||||||||
| Baytown Twp MN Rev St. Croix Prep Academy Pj Ser A | 7.00% | 8/1/2038 | NR | 3,000 | 2,992,380 | |||||||||||||||
| CA Muni Fin Auth High Tech High Chula Vista B† | 6.125% | 7/1/2038 | BB+ | (d) | 1,250 | 1,088,713 | ||||||||||||||
| CA Statewide Cmntys Dev Auth Huntington Pk Charter Sch Pj A | 5.15% | 7/1/2030 | NR | 2,340 | 1,910,610 | |||||||||||||||
| CA Statewide Cmntys Dev Auth Huntington Pk Charter Sch Pj A | 5.25% | 7/1/2042 | NR | 1,500 | 1,153,245 | |||||||||||||||
| Charyl Stockwell Academy MI COP | 5.75% | 10/1/2025 | NR | 4,130 | 3,535,899 | |||||||||||||||
| Charyl Stockwell Academy MI COP | 5.90% | 10/1/2035 | NR | 3,000 | 2,418,690 | |||||||||||||||
| CO Edl & Cultural Facs Auth Charter Sch Cmnty Leadership | 6.50% | 7/1/2038 | NR | 1,065 | 1,003,305 | |||||||||||||||
| CO Edl & Cultural Facs Auth New Vision Charter Pj Sch† | 6.75% | 4/1/2040 | NR | 930 | 798,396 | |||||||||||||||
| Detroit MI Cmnty High Sch Pub Sch Academy | 5.65% | 11/1/2025 | BB+ | 1,000 | 846,880 | |||||||||||||||
| Detroit MI Cmnty High Sch Pub Sch Academy | 5.75% | 11/1/2030 | BB+ | 1,255 | 1,011,254 | |||||||||||||||
| Doctor Charles Drew Academy MI COP | 5.70% | 11/1/2036 | NR | 1,640 | 1,137,471 | |||||||||||||||
| FL Dev Fin Corp Rev Palm Bay Academy Inc Pj A | 6.00% | 5/15/2036 | NR | 2,000 | 1,601,140 | |||||||||||||||
| FL Dev Fin Corp Rev Palm Bay Academy Inc Pj A | 6.125% | 5/15/2037 | NR | 1,855 | 1,544,492 | |||||||||||||||
| FL St Dev Fin Corp Edl Fac Renaissance Charter Sch Ser A | 7.50% | 6/15/2033 | BB+ | (d) | 9,350 | 9,673,603 | ||||||||||||||
| IA Fin Auth Child Svcs | 5.375% | 6/1/2026 | NR | 1,795 | 1,564,360 | |||||||||||||||
| IA Fin Auth Child Svcs | 5.50% | 6/1/2031 | NR | 4,260 | 3,531,412 | |||||||||||||||
| IA Fin Auth Child Svcs | 5.55% | 6/1/2036 | NR | 5,960 | 4,774,496 | |||||||||||||||
| IAH TX Pub Fac Corp Pj Rev | 6.00% | 5/1/2016 | NR | 730 | 713,750 | |||||||||||||||
| IAH TX Pub Fac Corp Pj Rev | 6.00% | 5/1/2021 | NR | 2,000 | 1,833,320 | |||||||||||||||
| IAH TX Pub Fac Corp Pj Rev | 6.125% | 5/1/2026 | NR | 1,635 | 1,410,384 | |||||||||||||||
| IN Fin Auth Rev Drexel Fndtn Edl Facs Pj Ser A | 6.625% | 10/1/2029 | BBB- | 750 | 752,528 | |||||||||||||||
| IN Fin Auth Rev Drexel Fndtn Edl Facs Pj Ser A | 7.00% | 10/1/2039 | BBB- | 1,250 | 1,256,038 | |||||||||||||||
See Notes to Financial Statements.
123
Schedule of Investments (continued)
HIGH YIELD MUNICIPAL BOND FUND September 30, 2011
| Investments | Interest Rate | Maturity Date | Credit Rating: S&P or Moody’s(a) | Principal Amount (000) | Fair Value | |||||||||||||||
| Other Revenue (continued) | ||||||||||||||||||||
| Kansas City MO Indl Dev Auth Allen Vlg Sch Pj Ser A† | 6.125% | 8/1/2026 | NR | $ | 1,550 | $ | 1,489,364 | |||||||||||||
| Kansas City MO Indl Dev Auth Allen Vlg Sch Pj Ser A† | 6.25% | 8/1/2036 | NR | 2,815 | 2,546,365 | |||||||||||||||
| Kansas City MO Indl Dev Auth Derrick Thomas Ser A† | 5.875% | 1/1/2037 | NR | 6,570 | 5,483,519 | |||||||||||||||
| La Vernia TX Higher Ed Fin Corp Amigos Por Vida Friends Life | 6.25% | 2/15/2026 | NR | 1,000 | 930,930 | |||||||||||||||
| La Vernia TX Higher Ed Fin Corp Amigos Por Vida Friends Life | 6.375% | 2/15/2037 | NR | 1,220 | 1,087,801 | |||||||||||||||
| La Vernia TX Higher Ed Fin Corp Lifeschools of Dallas Ser A | 7.25% | 8/15/2031 | BBB- | 4,750 | 4,957,147 | |||||||||||||||
| La Vernia TX Higher Ed Fin Corp Ser A | 7.125% | 2/15/2038 | BBB | 6,515 | 6,913,392 | |||||||||||||||
| Lombard IL Pub Facs Corp 1st Tier Ser A-1 | 7.125% | 1/1/2036 | NR | 8,500 | 5,943,795 | |||||||||||||||
| Maverick Cnty TX Pub Fac Corp Ser A-1 | 6.25% | 2/1/2024 | NR | 4,965 | 4,441,490 | |||||||||||||||
| Maverick Cnty TX Pub Fac Corp Ser A-1 | 6.375% | 2/1/2029 | NR | 1,560 | 1,359,836 | |||||||||||||||
| MD St Econ Dev Corp Sr Lien Pj Chesapeake Bay Ser A | 5.00% | 12/1/2031 | NR | 15,200 | 10,279,304 | |||||||||||||||
| MD St Econ Dev Corp Sr Lien Pj Chesapeake Bay Ser B | 5.25% | 12/1/2031 | NR | 3,000 | 2,026,320 | |||||||||||||||
| MI Fin Auth Detroit Sch Ser A-2 | 6.65% | 3/20/2012 | NR | 4,500 | 4,590,990 | |||||||||||||||
| MI Pub Edl Facs Auth Rev Ltd Oblig Bradford Academy Pj† | 6.50% | 9/1/2037 | BBB- | 5,000 | 4,558,650 | |||||||||||||||
| MI Pub Edl Facs Auth Rev Ltd Oblig Bradford Academy Pj | 8.75% | 9/1/2039 | BBB- | 2,250 | 2,453,153 | |||||||||||||||
| MI Pub Edl Facs Auth Rev Ltd Oblig Crescent | 7.00% | 10/1/2036 | NR | 722 | 656,406 | |||||||||||||||
| MI Pub Edl Facs Auth Rev Ltd Oblig David Ellis West Pj | 5.875% | 6/1/2037 | NR | 3,325 | 2,556,493 | |||||||||||||||
| MI Pub Edl Facs Auth Rev Ltd Oblig Landmark Academy | 6.625% | 6/1/2030 | BBB- | 1,955 | 1,912,850 | |||||||||||||||
| MI Pub Edl Facs Auth Rev Ltd Oblig Landmark Academy | 7.00% | 12/1/2039 | BBB- | 3,000 | 2,913,570 | |||||||||||||||
| MI Pub Edl Facs Auth Rev Ltd Oblig Old Redford Pj Ser A | 5.875% | 12/1/2030 | BBB | 3,720 | 3,394,909 | |||||||||||||||
| MI St Strategic Fd Ltd Pollutn Ctrl Gen Motors Corp(g) | – | – | (h) | NR | 5,000 | 37,500 | ||||||||||||||
| Middlesex Cnty NJ Impt Auth Sub Heldrich Ctr Hotel Ser B(j) | 6.125% | 1/1/2025 | NR | 2,790 | 279,000 | |||||||||||||||
See Notes to Financial Statements.
124
Schedule of Investments (continued)
HIGH YIELD MUNICIPAL BOND FUND September 30, 2011
| Investments | Interest Rate | Maturity Date | Credit Rating: S&P or Moody’s(a) | Principal Amount (000) | Fair Value | |||||||||||||||
| Other Revenue (continued) | ||||||||||||||||||||
| Middlesex Cnty NJ Impt Auth Sub Heldrich Ctr Hotel Ser B(j) | 6.25% | 1/1/2037 | NR | $ | 5,755 | $ | 575,500 | |||||||||||||
| Milwaukee WI Redev Auth Academy of Learning Ser A | 5.65% | 8/1/2037 | NR | 3,340 | 1,178,319 | |||||||||||||||
| Mohave Cnty AZ Indl Dev Auth Mohave Prison LLC Expansion Pj | 8.00% | 5/1/2025 | BBB+ | 10,250 | 11,495,477 | |||||||||||||||
| New York City NY Indl Dev Agy Queens Baseball Stadium Pilot (AMBAC) | 5.00% | 1/1/2036 | BB+ | 345 | 301,188 | |||||||||||||||
| New York City NY Indl Dev Agy Queens Baseball Stadium Pilot (AMBAC) | 5.00% | 1/1/2039 | BB+ | 210 | 179,481 | |||||||||||||||
| OH St Pollutn Ctrl Rev Gen Motors Corp Pj | 5.625% | 3/1/2015 | NR | 2,965 | 22,238 | |||||||||||||||
| Otero Cnty NM Jail Pj Rev | 5.75% | 4/1/2018 | NR | 1,925 | 1,804,052 | |||||||||||||||
| Otero Cnty NM Jail Pj Rev | 6.00% | 4/1/2023 | NR | 1,350 | 1,201,581 | |||||||||||||||
| Otero Cnty NM Jail Pj Rev | 6.00% | 4/1/2028 | NR | 1,900 | 1,607,438 | |||||||||||||||
| Palm Bay FL Edl Facs Rev Patriot Charter Sch Pj Ser A(f) | 6.75% | 7/1/2022 | NR | 1,460 | 365,000 | |||||||||||||||
| Palm Bay FL Edl Facs Rev Patriot Charter Sch Pj Ser A(f) | 7.00% | 7/1/2036 | NR | 5,000 | 1,250,000 | |||||||||||||||
| Palm Beach Cnty FL Rev G Star Sch of Arts Ser A | 6.75% | 5/15/2035 | BB | 2,455 | 2,229,827 | |||||||||||||||
| Pima Cnty AZ Indl Dev Auth Amer Charter Schs Fndtn Ser A | 5.50% | 7/1/2026 | BBB | (d) | 5,000 | 4,574,150 | ||||||||||||||
| Pima Cnty AZ Indl Dev Auth Amer Charter Schs Fndtn Ser A | 5.625% | 7/1/2038 | BBB | (d) | 11,115 | 9,041,163 | ||||||||||||||
| Pima Cnty AZ Indl Dev Auth Horizon Cmnty Learning Ctr | 5.25% | 6/1/2035 | BBB | 10,000 | 8,414,800 | |||||||||||||||
| Pima Cnty AZ Indl Dev Auth Paradise Ed Ctr Pj | 5.875% | 6/1/2022 | BBB- | 250 | 246,770 | |||||||||||||||
| Pima Cnty AZ Indl Dev Auth Paradise Ed Ctr Pj | 6.00% | 6/1/2036 | BBB- | 1,800 | 1,609,110 | |||||||||||||||
| Plymouth MI Edl Ctr Charter Sch | 5.375% | 11/1/2030 | BBB- | 1,500 | 1,263,510 | |||||||||||||||
| Provo UT Charter Sch Rev Freedom Academy Fndtn | 5.50% | 6/15/2037 | NR | 3,865 | 2,887,812 | |||||||||||||||
| San Antonio TX Convtn Hotel Fin Corp Empowerment Zone Ser A AMT (AMBAC) | 5.00% | 7/15/2034 | BBB | 2,510 | 2,166,783 | |||||||||||||||
| San Antonio TX Convtn Hotel Fin Corp Empowerment Zone Ser A AMT (AMBAC) | 5.00% | 7/15/2039 | BBB | 7,540 | 6,356,295 | |||||||||||||||
| Summit Academy MI Pub Sch | 6.375% | 11/1/2035 | BB+ | 3,795 | 3,318,424 | |||||||||||||||
| Two Rivers MT Auth Inc Pj Sr Lien(f) | 7.375% | 11/1/2027 | NR | 2,615 | 392,250 | |||||||||||||||
See Notes to Financial Statements.
125
Schedule of Investments (continued)
HIGH YIELD MUNICIPAL BOND FUND September 30, 2011
| Investments | Interest Rate | Maturity Date | Credit Rating: S&P or Moody’s(a) | Principal Amount (000) | Fair Value | |||||||||||||||
| Other Revenue (continued) | ||||||||||||||||||||
| TX St Pub Fin Auth Charter Sch Ed Cosmos Fndtn Ser A | 5.375% | 2/15/2037 | BBB | $ | 2,870 | $ | 2,719,727 | |||||||||||||
| UT St Charter Sch Fin Auth Noah Webster Academy Ser A | 6.50% | 6/15/2038 | NR | 500 | 446,800 | |||||||||||||||
| Utah Cnty UT Charter Sch Rev Lincoln Academy Ser A† | 5.875% | 6/15/2037 | NR | 1,750 | 1,439,725 | |||||||||||||||
| West Vly City UT Charter Sch Monticello Academy† | 6.375% | 6/1/2037 | NR | 4,075 | 3,334,736 | |||||||||||||||
| Yonkers NY Econ Dev Corp Charter Sch Edl Excellence Ser A | 6.00% | 10/15/2030 | BB+ | 1,300 | 1,247,363 | |||||||||||||||
|
| |||||||||||||||||||
| Total | 214,283,803 | |||||||||||||||||||
|
| |||||||||||||||||||
| Special Tax 8.16% | ||||||||||||||||||||
| Anne Arundel Cnty MD Spl Oblig National Business Pk North Pj | 5.625% | 7/1/2025 | NR | 1,000 | 997,540 | |||||||||||||||
| Anne Arundel Cnty MD Spl Oblig National Business Pk North Pj | 6.10% | 7/1/2040 | NR | 2,250 | 2,240,663 | |||||||||||||||
| Arborwood Cmnty Dev Dist FL Centex Homes Pj Ser A-1(f) | 5.50% | 5/1/2036 | NR | 1,235 | 209,950 | |||||||||||||||
| Arborwood Cmnty Dev Dist FL Master Infrastr Pjs Ser A | 5.35% | 5/1/2036 | NR | 6,545 | 4,523,446 | |||||||||||||||
| Atlanta GA Tax Alloc Beltline Pj Ser B | 7.375% | 1/1/2031 | NR | 1,310 | 1,341,047 | |||||||||||||||
| Atlanta GA Tax Alloc Beltline Pj Ser B Rmkt | 7.375% | 1/1/2031 | NR | 4,000 | 4,220,200 | |||||||||||||||
| Atlanta GA Tax Alloc Princeton Lakes Pj | 5.50% | 1/1/2031 | BBB- | 1,045 | 1,011,194 | |||||||||||||||
| Aurora IL Tax Incr Rev East River Area No 6 Ser A | 6.75% | 12/30/2027 | NR | 1,600 | 1,593,536 | |||||||||||||||
| Aurora IL Tax Incr Rev River City No 3 Ser B | 6.50% | 12/30/2023 | NR | 2,860 | 2,850,105 | |||||||||||||||
| Baltimore MD Spl Oblig Ser A | 7.00% | 9/1/2038 | NR | 7,000 | 7,075,530 | |||||||||||||||
| Cap Reg Cmnty Dev Dist FL Cap Impt Ser A | 7.00% | 5/1/2039 | NR | 4,515 | 3,800,592 | |||||||||||||||
| Durbin Crossing Cmnty Dev Dist FL Ser A | 5.50% | 5/1/2037 | NR | 5,700 | 4,480,599 | |||||||||||||||
| FL Cypress Creek Hillsborough Cnty Cmnty Dev Dist | 5.35% | 5/1/2037 | NR | 6,500 | 3,565,185 | |||||||||||||||
| Frederick Cnty MD Urbana Cmnty Dev Auth Ser B | 5.50% | 7/1/2040 | NR | 5,500 | 5,203,220 | |||||||||||||||
| Grandview MO Indl Dev Auth Tax Inc Grandview Crossing Pj 1 | 5.75% | 12/1/2028 | NR | 1,000 | 260,000 | |||||||||||||||
| Henderson NV Loc Impt Dists No T18 | 5.25% | 9/1/2026 | NR | 8,130 | 4,089,715 | |||||||||||||||
See Notes to Financial Statements.
126
Schedule of Investments (continued)
HIGH YIELD MUNICIPAL BOND FUND September 30, 2011
| Investments | Interest Rate | Maturity Date | Credit Rating: S&P or Moody’s(a) | Principal Amount (000) | Fair Value | |||||||||||||||
| Special Tax (continued) | ||||||||||||||||||||
| Henderson NV Loc Impt Dists No T18 | 5.30% | 9/1/2035 | NR | $ | 2,495 | $ | 1,228,887 | |||||||||||||
| Hesperia CA Pub Fing Auth Redev & Hsg Pjs Ser A (XLCA) | 5.00% | 9/1/2031 | Ba1 | 6,370 | 4,551,301 | |||||||||||||||
| Houston Cnty AL Cooperative Dist Rev Country Crossing Pj | 10.00% | 5/1/2039 | NR | 11,325 | 7,048,340 | |||||||||||||||
| Inglewood CA Redev Agy Tax Alloc Sub Lien Ser A-1 (AMBAC) | 5.00% | 5/1/2033 | BBB+ | 12,000 | 10,235,640 | |||||||||||||||
| Lancaster CA Redev Agy Tax Alloc Comb Redev Pj Areas | 6.875% | 8/1/2034 | BBB+ | 1,000 | 1,029,990 | |||||||||||||||
| Lancaster CA Redev Agy Tax Alloc Comb Redev Pj Areas | 6.875% | 8/1/2039 | BBB+ | 1,000 | 1,016,470 | |||||||||||||||
| Magnolia FL West Cmnty Dev Dist | 5.35% | 5/1/2037 | NR | 3,830 | 1,991,753 | |||||||||||||||
| Mariposa NM East Pub Impt Dist | 5.75% | 9/1/2021 | NR | 350 | 304,367 | |||||||||||||||
| Mariposa NM East Pub Impt Dist | 6.00% | 9/1/2032 | NR | 1,000 | 779,880 | |||||||||||||||
| Mesquite NV Redev Agy Tax Alloc | 7.125% | 6/1/2021 | A- | 1,000 | 1,028,860 | |||||||||||||||
| Mesquite NV Redev Agy Tax Alloc | 7.375% | 6/1/2024 | A- | 1,655 | 1,702,565 | |||||||||||||||
| Millsboro DE Spl Oblig Plantation Lakes Spl Dev Ser A | 5.45% | 7/1/2036 | NR | 5,454 | 3,923,662 | |||||||||||||||
| New York City NY Indl Dev Agy Queens Baseball Stadium Pilot (AMBAC) | 5.00% | 1/1/2031 | BB+ | 2,520 | 2,315,275 | |||||||||||||||
| Orange Grove LA Cmnty Dev Dist(f) | 5.30% | 11/1/2021 | NR | 1,760 | 819,632 | |||||||||||||||
| Panther Trace II FL Cmnty Dev Dist Spl Assmnt Ser A | 5.60% | 5/1/2035 | NR | 1,630 | 1,291,270 | |||||||||||||||
| Rancho Cucamonga Cmnty Facs Dist Spl Tax No 2004-1 Etiwanda | 5.375% | 9/1/2036 | NR | 3,550 | 2,931,839 | |||||||||||||||
| Riverside Cnty CA Pub Fing Auth Jurupa Vy Desert & Inst 215 (NPFGC) | 4.75% | 10/1/2035 | A3 | 9,000 | 7,352,640 | |||||||||||||||
| Riverside Cnty CA Redev Agy Interstate 215 Corridor Ser E | 6.00% | 10/1/2025 | A- | 1,500 | 1,521,825 | |||||||||||||||
| Riverside Cnty CA Redev Agy Interstate 215 Corridor Ser E | 6.50% | 10/1/2040 | A- | 2,000 | 2,078,540 | |||||||||||||||
| Shingle Creek FL Cmnty Dev Dist(f) | 6.10% | 5/1/2025 | NR | 4,990 | 1,983,525 | |||||||||||||||
| Sparks NV Loc Impt Dist Ltd Oblig Dist No 3 | 6.75% | 9/1/2027 | NR | 1,000 | 954,970 | |||||||||||||||
| Sparks NV Tourism Impt Dist No 1 Sr Sales Tax Antic Ser A† | 6.75% | 6/15/2028 | B2 | 17,000 | 15,336,550 | |||||||||||||||
| Stone Canyon Cmnty Impt Dist MO Pub Infrastr Impt Pj | 5.70% | 4/1/2022 | NR | 1,485 | 1,229,862 | |||||||||||||||
| Tern Bay Cmnty Dev Dist FL Ser A(f) | 5.375% | 5/1/2037 | NR | 13,145 | 3,286,250 | |||||||||||||||
See Notes to Financial Statements.
127
Schedule of Investments (continued)
HIGH YIELD MUNICIPAL BOND FUND September 30, 2011
| Investments | Interest Rate | Maturity Date | Credit Rating: S&P or Moody’s(a) | Principal Amount (000) | Fair Value | |||||||||||||||
| Special Tax (continued) | ||||||||||||||||||||
| Westside CA Union Sch Dist Cmnty Facs Dist No 2005-3 | 5.00% | 9/1/2036 | NR | $ | 2,810 | $ | 2,290,234 | |||||||||||||
| Whispering Spring LA Dev Dist Spl Assmnt(f) | 5.20% | 10/1/2021 | NR | 2,290 | 645,780 | |||||||||||||||
|
| |||||||||||||||||||
| Total | 126,342,429 | |||||||||||||||||||
|
| |||||||||||||||||||
| Tax Revenue 0.71% | ||||||||||||||||||||
| Cooperative Dist of Fort Spanish AL Rev Pub Impt | 9.00% | 2/1/2029 | NR | 3,240 | 3,679,862 | |||||||||||||||
| NY St Urban Dev Corp Rev St Pers Income Tax Ser A-1(b) | 5.00% | 12/15/2028 | AAA | 6,000 | 6,603,780 | |||||||||||||||
| Southwestern IL Dev Auth Rev Loc Govt Pg Collinsville Ltd | 5.35% | 3/1/2031 | NR | 1,000 | 737,420 | |||||||||||||||
|
| |||||||||||||||||||
| Total | 11,021,062 | |||||||||||||||||||
|
| |||||||||||||||||||
| Tobacco 8.14% | ||||||||||||||||||||
| Buckeye OH Tob Sttlmnt Fing Auth Asset Bkd Sr Turbo Ser A-2 | 5.125% | 6/1/2024 | BB- | 16,485 | 12,558,603 | |||||||||||||||
| Buckeye OH Tob Sttlmnt Fing Auth Asset Bkd Sr Turbo Ser A-2 | 5.75% | 6/1/2034 | BB- | 8,320 | 5,970,931 | |||||||||||||||
| Buckeye OH Tob Sttlmnt Fing Auth Asset Bkd Sr Turbo Ser A-2 | 5.875% | 6/1/2030 | BB- | 12,945 | 9,713,540 | |||||||||||||||
| Buckeye OH Tob Sttlmnt Fing Auth Asset Bkd Sr Turbo Ser A-2 | 5.875% | 6/1/2047 | BB- | 15,195 | 10,679,198 | |||||||||||||||
| Buckeye OH Tob Sttlmnt Fing Auth Asset Bkd Sr Turbo Ser A-2 | 6.50% | 6/1/2047 | BB- | 725 | 556,017 | |||||||||||||||
| Buckeye OH Tob Sttlmnt Fing Auth Cap Apprec Asset Sr Conv A-3 | Zero Coupon | 6/1/2037 | BB- | 5,000 | 3,479,050 | |||||||||||||||
| Golden St Tob Securitization Corp CA Asset Bkd Sr Ser A-1 | 5.00% | 6/1/2033 | BB+ | 18,900 | 13,255,893 | |||||||||||||||
| Golden St Tob Securitization Corp CA Asset Bkd Sr Ser A-1 | 5.125% | 6/1/2047 | BB+ | 12,995 | 8,276,126 | |||||||||||||||
| Golden St Tob Securitization Corp CA Asset Bkd Sr Ser A-1 | 5.75% | 6/1/2047 | BB+ | 18,110 | 12,788,920 | |||||||||||||||
| Inland Empire Tob Securitization Auth CA Ser A | 4.625% | 6/1/2021 | B+ | (d) | 5,365 | 4,302,193 | ||||||||||||||
| Inland Empire Tob Securitization Auth CA Ser A | 5.00% | 6/1/2021 | B+ | (d) | 2,635 | 2,179,883 | ||||||||||||||
| MI Tob Sttlmnt Fin Auth Sr Ser A | 5.25% | 6/1/2022 | BBB | 5,000 | 4,236,250 | |||||||||||||||
| MI Tob Sttlmnt Fin Auth Sr Ser A | 6.00% | 6/1/2034 | BB | 6,000 | 4,502,160 | |||||||||||||||
See Notes to Financial Statements.
128
Schedule of Investments (continued)
HIGH YIELD MUNICIPAL BOND FUND September 30, 2011
| Investments | Interest Rate | Maturity Date | Credit Rating: S&P or Moody’s(a) | Principal Amount (000) | Fair Value | |||||||||||||||
| Tobacco (continued) | ||||||||||||||||||||
| MI Tob Sttlmnt Fin Auth Sr Ser A | 6.00% | 6/1/2048 | BB | $ | 10,100 | $ | 7,102,320 | |||||||||||||
| NJ Tob Sttlmnt Fing Corp Ser 1A | 4.75% | 6/1/2034 | BB+ | 3,605 | 2,352,262 | |||||||||||||||
| NJ Tob Sttlmnt Fing Corp Ser 1A | 5.00% | 6/1/2029 | BBB- | 4,250 | 3,083,460 | |||||||||||||||
| NJ Tob Sttlmnt Fing Corp Ser 1A | 5.00% | 6/1/2041 | BB- | 8,000 | 5,171,440 | |||||||||||||||
| VA Tob Sttlmnt Fing Corp Sr Ser B1 | 5.00% | 6/1/2047 | BB- | 26,050 | 15,777,443 | |||||||||||||||
|
| |||||||||||||||||||
| Total | 125,985,689 | |||||||||||||||||||
|
| |||||||||||||||||||
| Transportation 7.89% | ||||||||||||||||||||
| Augusta GA Arpt Rev Gen Arpt Passenger B AMT | 5.35% | 1/1/2028 | Baa2 | 350 | 318,115 | |||||||||||||||
| Augusta GA Arpt Rev Gen Ser C AMT | 5.45% | 1/1/2031 | Baa2 | 2,410 | 2,146,274 | |||||||||||||||
| CA Foothill Eastern Transn Corridor Agy Cap Apprec | Zero Coupon | 1/15/2030 | BBB- | 35,000 | 10,891,300 | |||||||||||||||
| CA Foothill Eastern Transn Corridor Agy Cap Apprec | Zero Coupon | 1/15/2033 | BBB- | 5,000 | 1,232,750 | |||||||||||||||
| CA Foothill Eastern Transn Corridor Agy Cap Apprec | Zero Coupon | 1/15/2034 | BBB- | 25,535 | 5,769,122 | |||||||||||||||
| CA Foothill Eastern Transn Corridor Agy Cap Apprec | Zero Coupon | 1/15/2035 | BBB- | 3,445 | 719,902 | |||||||||||||||
| CA Foothill Eastern Transn Corridor Agy Cap Apprec | Zero Coupon | 1/15/2037 | BBB- | 4,985 | 877,809 | |||||||||||||||
| CA Foothill Eastern Transn Corridor Agy Cap Apprec | Zero Coupon | 1/15/2038 | BBB- | 1,000 | 160,280 | |||||||||||||||
| Dallas-Fort Worth TX Intl Arpt Facs Impt Corp Amer Airlines Inc AMT | 6.375% | 5/1/2035 | CCC+ | 6,630 | 4,803,435 | |||||||||||||||
| Dardenne Twn Square Transn Dev Dist MO Ser A | 5.00% | 5/1/2036 | NR | 3,110 | 1,492,800 | |||||||||||||||
| Director St NV Dept Business & Industry Las Vegas Monorail Pj 2nd Tier(f) | 7.25% | 1/1/2023 | NR | 5,000 | 50 | |||||||||||||||
| Director St NV Dept Business & Industry Las Vegas Monorail Pj 2nd Tier(f) | 7.375% | 1/1/2030 | NR | 5,000 | 50 | |||||||||||||||
| E-470 Pub Hwy Auth CO Rev Cap Apprec | Zero Coupon | 9/1/2037 | Baa2 | 5,000 | 841,200 | |||||||||||||||
| E-470 Pub Hwy Auth CO Rev Cap Apprec Sr Ser A (NPFGC) | Zero Coupon | 9/1/2034 | Baa1 | 5,885 | 1,230,612 | |||||||||||||||
| E-470 Pub Hwy Auth CO Rev Cap Apprec Sr Ser B (NPFGC) | Zero Coupon | 9/1/2031 | Baa1 | 25,000 | 6,479,000 | |||||||||||||||
See Notes to Financial Statements.
129
Schedule of Investments (continued)
HIGH YIELD MUNICIPAL BOND FUND September 30, 2011
| Investments | Interest Rate | Maturity Date | Credit Rating: S&P or Moody’s(a) | Principal Amount (000) | Fair Value | |||||||||||||||
| Transportation (continued) | ||||||||||||||||||||
| E-470 Pub Hwy Auth CO Rev Cap Apprec Sr Ser B (NPFGC) | Zero Coupon | 9/1/2037 | Baa1 | $ | 9,925 | $ | 1,669,782 | |||||||||||||
| Los Angeles CA Intl Dept of Arpts Los Angeles Intl Sub Ser B(b) | 5.00% | 5/15/2025 | AA- | 1,025 | 1,084,735 | |||||||||||||||
| Los Angeles CA Intl Dept of Arpts Los Angeles Intl Sub Ser B(b) | 5.00% | 5/15/2026 | AA- | 3,440 | 3,640,478 | |||||||||||||||
| Los Angeles CA Intl Dept of Arpts Los Angeles Intl Sub Ser B(b) | 5.00% | 5/15/2027 | AA- | 3,895 | 4,121,995 | |||||||||||||||
| Los Angeles CA Intl Dept of Arpts Los Angeles Intl Sub Ser B(b) | 5.00% | 5/15/2028 | AA- | 3,430 | 3,629,895 | |||||||||||||||
| Los Angeles CA Intl Dept of Arpts Los Angeles Intl Sub Ser B(b) | 5.00% | 5/15/2032 | AA- | 8,210 | 8,688,467 | |||||||||||||||
| Los Angeles CA Intl Dept of Arpts Los Angeles Intl Sub Ser B(b) | 5.00% | 5/15/2033 | AA- | 2,675 | 2,830,895 | |||||||||||||||
| MD St Econ Dev Corp Cnx Marine Terminals Inc | 5.75% | 9/1/2025 | BB | 2,500 | 2,501,575 | |||||||||||||||
| Metro WA DC Arpts Auth Ser A AMT(b) | 5.00% | 10/1/2022 | AA- | 3,250 | 3,472,089 | |||||||||||||||
| Metro WA DC Arpts Auth Ser A AMT(b) | 5.25% | 10/1/2027 | AA- | 4,540 | 4,850,241 | |||||||||||||||
| Metro WA DC Arpts Auth Ser A AMT(b) | 5.375% | 10/1/2028 | AA- | 2,500 | 2,670,837 | |||||||||||||||
| Mid-Bay Bridge Auth FL Springing Ser A | 7.25% | 10/1/2034 | BBB- | 7,500 | 7,970,775 | |||||||||||||||
| NJ St Transn Tr Fd Auth Transn Sys Ser A | 6.00% | 6/15/2035 | A+ | 2,700 | 3,130,245 | |||||||||||||||
| Port Auth NY & NJ Cons 160th(b) | 4.00% | 9/15/2031 | AA- | 20,000 | 19,911,700 | |||||||||||||||
| Susquehanna Area PA Regl Arpt Auth Ser A AMT | 6.50% | 1/1/2038 | Baa3 | 7,835 | 7,734,007 | |||||||||||||||
| TX St Tpk Auth Cent TX Tpk Cap Apprec (AMBAC) | Zero Coupon | 8/15/2031 | BBB+ | 24,500 | 7,202,510 | |||||||||||||||
|
| |||||||||||||||||||
| Total | 122,072,925 | |||||||||||||||||||
|
| |||||||||||||||||||
| Utilities 9.00% | ||||||||||||||||||||
| Adelanto CA Pub Util Auth Util Sys Pj Ser A | 6.625% | 7/1/2031 | NR | 11,000 | 11,586,190 | |||||||||||||||
| Arborwood Cmnty Dev Dist FL Centex Homes Pj Ser A-3 | 5.50% | 5/1/2036 | NR | 645 | 563,356 | |||||||||||||||
| AZ Salt River Pj Agric Impt & Pwr Dist Ser A(b) | 5.00% | 1/1/2032 | Aa1 | 5,430 | 5,860,056 | |||||||||||||||
| Brazos River Auth TX Pollutn Ctrl TXU Elec Co Pj Ser C AMT | 5.75% | 5/1/2036 | CC | 2,465 | 2,456,644 | |||||||||||||||
See Notes to Financial Statements.
130
Schedule of Investments (continued)
HIGH YIELD MUNICIPAL BOND FUND September 30, 2011
| Investments | Interest Rate | Maturity Date | Credit Rating: S&P or Moody’s(a) | Principal Amount (000) | Fair Value | |||||||||||||||
| Utilities (continued) | ||||||||||||||||||||
| Brazos River Auth TX Pollutn Ctrl TXU Enrg Co LLC Pj AMT | 5.00% | 3/1/2041 | CC | $ | 6,000 | $ | 1,590,660 | |||||||||||||
| Brazos River Auth TX Pollutn Ctrl TXU Enrg Co LLC Pj Ser B AMT | 6.30% | 7/1/2032 | CC | 2,000 | 620,500 | |||||||||||||||
| Las Vegas Vly NV Wtr Dist Wtr Impt Ser C | 2.50% | # | 6/1/2036 | AA+ | 3,500 | 3,500,000 | ||||||||||||||
| Lathrop CA Fing Auth Rev Wtr Supply Pj | 5.90% | 6/1/2027 | NR | 4,440 | 4,445,816 | |||||||||||||||
| Lathrop CA Fing Auth Rev Wtr Supply Pj | 6.00% | 6/1/2035 | NR | 5,940 | 5,807,419 | |||||||||||||||
| Long Island NY Pwr Auth Ser A | 5.00% | 5/1/2038 | A- | 7,250 | 7,552,107 | |||||||||||||||
| M-S-R Enrg Auth CA Gas Rev Ser B | 6.50% | 11/1/2039 | A | 5,350 | 5,889,494 | |||||||||||||||
| Maricopa Cnty AZ Pollutn Ctrl Corp El Paso Elec Co Pj Ser A | 7.25% | 2/1/2040 | BBB | 3,500 | 3,878,070 | |||||||||||||||
| Moraine OH Solid Wst Disp Gen Motors Corp Pj AMT | 6.75% | 7/1/2014 | NR | 525 | 3,938 | |||||||||||||||
| New York City NY Muni Wtr Fin Auth Ser CC(b) | 5.00% | 6/15/2029 | AA+ | 11,000 | 11,918,665 | |||||||||||||||
| New York City NY Muni Wtr Fin Auth Ser CC(b) | 5.125% | 6/15/2030 | AA+ | 1,000 | 1,083,515 | |||||||||||||||
| PA Econ Dev Fing Auth Philadelphia BioSolids Fac | 6.25% | 1/1/2032 | Baa3 | 1,500 | 1,578,645 | |||||||||||||||
| Padre Dam CA Muni Wtr Dist Pj Ser A(b) | 5.25% | 10/1/2034 | AA- | 11,600 | 12,280,572 | |||||||||||||||
| Pima Cnty AZ Indl Dev Auth Global Wtr Res LLC Pj AMT | 5.60% | 12/1/2022 | NR | 2,000 | 1,972,140 | |||||||||||||||
| Pima Cnty AZ Indl Dev Auth Global Wtr Res LLC Pj AMT | 5.75% | 12/1/2032 | NR | 5,000 | 4,379,600 | |||||||||||||||
| Pima Cnty AZ Indl Dev Auth Global Wtr Res LLC Pj AMT | 6.55% | 12/1/2037 | NR | 7,000 | 6,591,690 | |||||||||||||||
| Sabine River Auth TX Pollutn Ctrl TXU Elec Co Pj Ser A | 5.50% | 5/1/2022 | CC | 1,620 | 1,616,549 | |||||||||||||||
| Sabine River Auth TX Pollutn Ctrl TXU Elec Co Pj Ser A AMT | 6.45% | 6/1/2021 | CC | 2,000 | 560,000 | |||||||||||||||
| Sabine River Auth TX Pollutn Ctrl TXU Elec Co Pj Ser B AMT | 5.75% | 5/1/2030 | CC | 6,040 | 6,019,524 | |||||||||||||||
| Salt Verde AZ Financial Corp Gas Rev Ser A | 5.00% | 12/1/2037 | A | 2,990 | 2,677,964 | |||||||||||||||
| San Antonio TX Elec & Gas Ser A(b) | 5.25% | 2/1/2029 | AA | 19,375 | 21,494,263 | |||||||||||||||
| San Antonio TX Elec & Gas Ser A(b) | 5.25% | 2/1/2031 | AA | 6,270 | 6,955,821 | |||||||||||||||
| TN Enrg Acq Corp Jr Ser B | 5.625% | 9/1/2026 | BBB | (d) | 4,781 | 4,560,166 | ||||||||||||||
| Western Generation Agy OR Wauna Cogeneration Pj B AMT | 5.00% | 1/1/2016 | NR | 1,500 | 1,492,530 | |||||||||||||||
See Notes to Financial Statements.
131
Schedule of Investments (concluded)
HIGH YIELD MUNICIPAL BOND FUND September 30, 2011
| Investments | Interest Rate | Maturity Date | Credit Rating: S&P or Moody’s(a) | Principal Amount (000) | Fair Value | |||||||||||||||
| Utilities (continued) | ||||||||||||||||||||
| Western Generation Agy OR Wauna Cogeneration Pj Sub Lien C | 5.00% | 1/1/2021 | NR | $ | 485 | $ | 449,964 | |||||||||||||
|
| |||||||||||||||||||
| Total | 139,385,858 | |||||||||||||||||||
|
| |||||||||||||||||||
| Total Municipal Bonds (cost $1,775,384,163) | 1,657,732,777 | |||||||||||||||||||
|
| |||||||||||||||||||
Shares | ||||||||||||||||||||
| SHORT-TERM INVESTMENTS 0.00% | ||||||||||||||||||||
| Money Market Mutual Funds | ||||||||||||||||||||
| Dreyfus Municipal Cash Management Plus | – | (k) | 796 | |||||||||||||||||
| SSgA Tax Free Money Market Fund | 3 | 2,890 | ||||||||||||||||||
|
| |||||||||||||||||||
| Total Short-Term Investments (cost $3,686) | 3,686 | |||||||||||||||||||
|
| |||||||||||||||||||
| Total Investments in Securities 107.10% (cost $1,775,387,849) | 1,657,736,463 | |||||||||||||||||||
|
| |||||||||||||||||||
| Liabilities in Excess of Cash and Other Assets(i) (7.10%) | (109,844,534 | ) | ||||||||||||||||||
|
| |||||||||||||||||||
| Net Assets 100.00% | $ | 1,547,891,929 | ||||||||||||||||||
|
| |||||||||||||||||||
Open Futures Contracts at September 30, 2011:
| Type | Expiration | Contracts | Position | Market Value | Unrealized Depreciation | |||||||||||
| U.S. 30-Year Treasury Bond | December 2011 | 904 | Short | $ | (128,933,000) | $ | (6,392,079) | |||||||||
| Ultra Long U.S. Treasury Bond | December 2011 | 184 | Short | (29,187,000) | (2,968,756) | |||||||||||
|
|
|
| |||||||||||||
| Totals | $ | (158,120,000) | $ | (9,360,835) | ||||||||||||
|
|
|
| |||||||||||||
See Notes to Financial Statements.
132
Schedule of Investments
CALIFORNIA TAX FREE FUND September 30, 2011
| Investments | Interest Rate | Maturity Date | Credit Rating: S&P or Moody’s(a) | Principal Amount (000) | Fair Value | |||||||||||||||
| MUNICIPAL BONDS 105.28% | ||||||||||||||||||||
| Corporate-Backed 2.54% | ||||||||||||||||||||
| CA Statewide Cmntys Dev Auth Sthn CA Ed Ser A | 4.50% | 9/1/2029 | A1 | $ | 1,000 | $ | 1,005,800 | |||||||||||||
| Los Angeles CA Regl Arpts Impt Corp Facs Sublease Intl Arpt | 6.35% | 11/1/2025 | NR | 2,000 | 2,008,880 | |||||||||||||||
| Virgin Islands Pub Fin Auth Sr Secd Hovensa Refinery AMT | 4.70% | 7/1/2022 | Ba2 | 2,250 | 1,893,780 | |||||||||||||||
|
| |||||||||||||||||||
| Total | 4,908,460 | |||||||||||||||||||
|
| |||||||||||||||||||
| Education 6.53% | ||||||||||||||||||||
| Abag Fin Auth For Nonprofit Corp CA Sch of Mech Arts | 5.25% | 10/1/2026 | A3 | 500 | 504,550 | |||||||||||||||
| CA Edl Facs Auth Rev CA Lutheran Univ | 5.25% | 10/1/2021 | Baa1 | 1,500 | 1,579,680 | |||||||||||||||
| CA Edl Facs Auth Rev College & Univ Fing Pg | 5.00% | 2/1/2037 | Ba1 | 1,000 | 804,310 | |||||||||||||||
| CA Infrastr & Econ Dev Bk Pepperdine Univ | 5.00% | 11/1/2028 | Aa3 | 1,000 | 1,085,620 | |||||||||||||||
| CA Muni Fin Auth Rev Biola Univ | 5.80% | 10/1/2028 | Baa1 | 1,085 | 1,128,324 | |||||||||||||||
| CA St Pub Wrks Brd Regents Univ Ser E(b) | 5.00% | 4/1/2034 | Aa2 | 1,500 | 1,536,570 | |||||||||||||||
| CA Statewide Cmntys Dev Auth Windrush Sch(f) | 5.50% | 7/1/2037 | NR | 1,250 | 863,325 | |||||||||||||||
| Tustin CA Unif Sch Dist 2008 Election Ser B | 6.00% | 8/1/2036 | AA | 1,500 | 1,728,435 | |||||||||||||||
| Univ of CA Ser O(b) | 5.75% | 5/15/2031 | Aa1 | 3,000 | 3,383,805 | |||||||||||||||
|
| |||||||||||||||||||
| Total | 12,614,619 | |||||||||||||||||||
|
| |||||||||||||||||||
| General Obligation 21.03% | ||||||||||||||||||||
| Alameda Cnty CA Oakland Unif Sch Dist Election 2006 Ser A | 6.125% | 8/1/2029 | A2 | 1,000 | 1,082,770 | |||||||||||||||
| Barstow CA Unif Sch Dist Ser A (NPFGC)(FGIC) | 5.00% | 8/1/2026 | A1 | 1,475 | 1,489,116 | |||||||||||||||
| CA St | 5.25% | 9/1/2024 | A1 | 5,000 | 5,567,450 | |||||||||||||||
| CA St | 5.50% | 11/1/2034 | A1 | 175 | 187,831 | |||||||||||||||
| CA St (CIFG) | 4.50% | 8/1/2028 | A1 | 1,515 | 1,495,548 | |||||||||||||||
| CA St Var Purp | 5.25% | 10/1/2029 | A1 | 1,500 | 1,598,610 | |||||||||||||||
| CA St Var Purp | 6.50% | 4/1/2033 | A1 | 3,500 | 4,098,465 | |||||||||||||||
| Ceres CA Unif Sch Dist Cap Apprec 2008 Election Ser A | Zero Coupon | 8/1/2046 | A+ | 8,000 | 665,840 | |||||||||||||||
See Notes to Financial Statements.
133
Schedule of Investments (continued)
CALIFORNIA TAX FREE FUND September 30, 2011
| Investments | Interest Rate | Maturity Date | Credit Rating: S&P or Moody’s(a) | Principal Amount (000) | Fair Value | |||||||||||||||
| General Obligation (continued) | ||||||||||||||||||||
| Los Angeles CA Unif Sch Dist Election 2004 Ser F (FGIC) | 5.00% | 7/1/2030 | Aa2 | $ | 2,000 | $ | 2,078,440 | |||||||||||||
| Los Angeles CA Unif Sch Dist Election 2004 Ser H (AGM)(b) | 5.00% | 7/1/2028 | AA+ | 3,000 | 3,174,675 | |||||||||||||||
| Los Angeles CA Unif Sch Dist Ser I | 5.00% | 7/1/2029 | Aa2 | 2,225 | 2,379,348 | |||||||||||||||
| Montebello CA Unif Sch Dist Election 2004 (AGM) | 5.00% | 8/1/2028 | AA+ | 1,335 | 1,428,757 | |||||||||||||||
| Newport Mesa CA Unif Sch Dist Cap Apprec Election 2005 | Zero Coupon | 8/1/2037 | Aa1 | 5,000 | 1,105,650 | |||||||||||||||
| Piedmont CA Unif Sch Dist Election 2006 Ser C(b) | 5.00% | 8/1/2032 | AA | 1,910 | 1,995,224 | |||||||||||||||
| Piedmont CA Unif Sch Dist Election 2006 Ser C(b) | 5.00% | 8/1/2033 | AA | 2,145 | 2,232,258 | |||||||||||||||
| Piedmont CA Unif Sch Dist Election 2006 Ser C(b) | 5.00% | 8/1/2034 | AA | 2,400 | 2,494,188 | |||||||||||||||
| Puerto Rico Comwlth Pub Impt Ser E | 5.50% | 7/1/2031 | Baa1 | 3,000 | 3,022,230 | |||||||||||||||
| San Bernardino CA Cmnty College Dist Election 2002 Ser A | 5.75% | 8/1/2020 | Aa2 | 750 | 884,970 | |||||||||||||||
| San Bernardino CA Cmnty College Dist Election 2002 Ser A | 6.25% | 8/1/2033 | Aa2 | 1,500 | 1,681,605 | |||||||||||||||
| San Ysidro CA Sch Dist Cap Apprec Election 1997 Ser D (NPFGC)(FGIC) | Zero Coupon | 8/1/2028 | A+ | 1,000 | 361,150 | |||||||||||||||
| Territory of Guam Ser A | 7.00% | 11/15/2039 | B+ | 390 | 407,850 | |||||||||||||||
| West Contra Costa CA Unif Sch Dist Election of 2005 Ser B | 6.00% | 8/1/2027 | Aa3 | 1,000 | 1,167,170 | |||||||||||||||
|
| |||||||||||||||||||
| Total | 40,599,145 | |||||||||||||||||||
|
| |||||||||||||||||||
| Health Care 12.92% | ||||||||||||||||||||
| CA Hlth Facs Fing Auth Catholic Hlthcare West Ser G | 5.50% | 7/1/2025 | A | 2,500 | 2,688,850 | |||||||||||||||
| CA Hlth Facs Fing Auth Cedars Sinai Med Ctr | 5.00% | 8/15/2039 | A2 | 1,500 | 1,493,205 | |||||||||||||||
| CA Hlth Facs Fing Auth Providence Hlth & Svcs Ser C | 6.25% | 10/1/2024 | AA | 1,000 | 1,167,160 | |||||||||||||||
| CA Hlth Facs Fing Auth Sutter Hlth Ser B | 5.50% | 8/15/2026 | AA- | 2,000 | 2,167,520 | |||||||||||||||
| CA Sierra View Loc Hlthcare Dist | 5.25% | 7/1/2032 | A | (d) | 1,000 | 994,910 | ||||||||||||||
| CA Statewide Cmntys Dev Auth Amer Baptist Homes West | 6.25% | 10/1/2039 | BBB | 1,500 | 1,502,790 | |||||||||||||||
See Notes to Financial Statements.
134
Schedule of Investments (continued)
CALIFORNIA TAX FREE FUND September 30, 2011
| Investments | Interest Rate | Maturity Date | Credit Rating: S&P or Moody’s(a) | Principal Amount (000) | Fair Value | |||||||||||||||
| Health Care (continued) | ||||||||||||||||||||
| CA Statewide Cmntys Dev Auth Daughters of Charity Hlth Ser A | 5.25% | 7/1/2035 | BBB | $ | 1,675 | $ | 1,374,471 | |||||||||||||
| CA Statewide Cmntys Dev Auth Front Porch Cmntys & Svcs Ser A† | 5.125% | 4/1/2037 | BBB | 2,000 | 1,668,420 | |||||||||||||||
| CA Statewide Cmntys Dev Auth Sr Living Sthn CA | 7.00% | 11/15/2029 | BBB | 1,000 | 1,086,790 | |||||||||||||||
| Newport Beach CA Rev Hoag Mem Hosp Presbyterian | 5.875% | 12/1/2030 | AA | 500 | 548,250 | |||||||||||||||
| Northern Inyo Cnty CA Loc Hosp Dist | 6.00% | 12/1/2021 | BBB- | 1,000 | 1,026,820 | |||||||||||||||
| Puerto Rico Indl Tourist Edl Med & Envr Ctrl Facs Fing Auth Hosp Auxilio Mutuo Ser A | 6.00% | 7/1/2033 | A- | 2,000 | 2,105,240 | |||||||||||||||
| San Buenaventura CA Cmnty Mem Hlth Sys | 8.00% | 12/1/2031 | BB | 2,000 | 2,156,940 | |||||||||||||||
| Turlock CA Hlth Fac Rev Emanuel Med Ctr Ser B | 5.50% | 10/15/2037 | BBB | 2,000 | 1,759,540 | |||||||||||||||
| Upland CA San Antonio Cmnty Hosp COP | 6.00% | 1/1/2026 | A | 2,000 | 2,160,180 | |||||||||||||||
| Whittier CA Hlth Fac Rev Presbyterian Intercmnty Hosp | 5.75% | 6/1/2029 | A+ | 1,000 | 1,032,820 | |||||||||||||||
|
| |||||||||||||||||||
| Total | 24,933,906 | |||||||||||||||||||
|
| |||||||||||||||||||
| Housing 1.52% | ||||||||||||||||||||
| CA Statewide Cmntys Dev Auth CHF Irvine LLC UCI East Campus | 5.00% | 5/15/2038 | Baa2 | 1,000 | 864,270 | |||||||||||||||
| Los Angeles CA Hsg Auth Mtg Ppty Acq Ser A | 6.25% | 6/1/2034 | A | 2,000 | 2,076,080 | |||||||||||||||
|
| |||||||||||||||||||
| Total | 2,940,350 | |||||||||||||||||||
|
| |||||||||||||||||||
| Lease Obligations 9.94% | ||||||||||||||||||||
| CA Infrastr & Econ Dev Bk King City Jt Union High Sch | 5.75% | 8/15/2029 | A- | 750 | 776,603 | |||||||||||||||
| CA St Pub Wrks Brd Dept Forestry & Fire Ser E | 5.00% | 11/1/2024 | A2 | 1,550 | 1,607,396 | |||||||||||||||
| CA St Pub Wrks Brd Var Cap Pjs Sub Ser I-1 | 5.375% | 11/1/2022 | A2 | 1,000 | 1,084,690 | |||||||||||||||
| CA St Pub Wrks Brd Var Cap Pjs Sub Ser I-1 | 6.375% | 11/1/2034 | A2 | 2,000 | 2,186,280 | |||||||||||||||
| Puerto Rico Comwlth Infrastr Fing Auth Mepsi Campus Pj Ser A | 6.50% | 10/1/2037 | NR | 1,000 | 958,940 | |||||||||||||||
| Puerto Rico Pub Bldgs Auth Rev Govt Facs Ser P GTD | 6.50% | 7/1/2030 | Baa1 | 1,000 | 1,103,280 | |||||||||||||||
| Richmond CA Jt Pwrs Fing Auth Lease Civic Ctr Pj (AG) | 5.75% | 8/1/2029 | AA+ | 1,000 | 1,104,470 | |||||||||||||||
See Notes to Financial Statements.
135
Schedule of Investments (continued)
CALIFORNIA TAX FREE FUND September 30, 2011
| Investments | Interest Rate | Maturity Date | Credit Rating: S&P or Moody’s(a) | Principal Amount (000) | Fair Value | |||||||||||||||
| Lease Obligations (continued) | ||||||||||||||||||||
| Sacramento CA City Fing Auth Master Lease Pg Facs Ser E (AMBAC) | 5.25% | 12/1/2023 | Aa3 | $ | 1,500 | $ | 1,683,645 | |||||||||||||
| San Buenaventura CA Ser C COP (AMBAC) | 5.25% | 2/1/2031 | NR | 2,575 | 2,584,579 | |||||||||||||||
| San Diego CA Pub Facs Fing Auth Master Ref Pj Ser A | 5.25% | 9/1/2035 | A2 | 1,220 | 1,239,886 | |||||||||||||||
| San Mateo Cnty CA Jt Pwrs Fing Auth Ref Cap Pj Ser A | 5.25% | 7/15/2026 | AA+ | 3,000 | 3,235,530 | |||||||||||||||
| Santa Ana CA Unif Sch Dist Cap Apprec Fing Pj COP (AGM) | Zero Coupon | 4/1/2019 | AA+ | 2,295 | 1,617,103 | |||||||||||||||
|
| |||||||||||||||||||
| Total | 19,182,402 | |||||||||||||||||||
|
| |||||||||||||||||||
| Other Revenue 2.66% | ||||||||||||||||||||
| CA Muni Fin Auth Ed Rev Amer Heritage Ed Fndtn Pj A | 5.25% | 6/1/2036 | BBB- | 1,000 | 819,900 | |||||||||||||||
| CA Muni Fin Auth High Tech High Chula Vista B† | 6.00% | 7/1/2028 | BB+ | (d) | 850 | 793,798 | ||||||||||||||
| CA Muni Fin Auth OCEAA Pj Ser A | 6.75% | 10/1/2028 | NR | 1,445 | 1,325,022 | |||||||||||||||
| CA Statewide Cmntys Dev Auth Huntington Pk Charter Sch Pj A | 5.15% | 7/1/2030 | NR | 500 | 408,250 | |||||||||||||||
| CA Statewide Cmntys Dev Auth Huntington Pk Charter Sch Pj A | 5.25% | 7/1/2042 | NR | 1,225 | 941,817 | |||||||||||||||
| Northern Inyo Cnty CA Loc Hosp Dist | 6.375% | 12/1/2025 | BBB- | 835 | 854,956 | |||||||||||||||
|
| |||||||||||||||||||
| Total | 5,143,743 | |||||||||||||||||||
|
| |||||||||||||||||||
| Special Tax 12.32% | ||||||||||||||||||||
| Chula Vista CA Cmnty Facs Dist No 07-1 Otay Ranch Vlg Eleven | 5.125% | 9/1/2036 | NR | 945 | 822,282 | |||||||||||||||
| Dana Point CA Cmnty Facs Dist No 2006-1 | 5.625% | 9/1/2033 | NR | 545 | 511,406 | |||||||||||||||
| Dana Point CA Cmnty Facs Dist No 2006-1 | 5.625% | 9/1/2037 | NR | 925 | 846,800 | |||||||||||||||
| Fontana CA Pub Fin Auth Tax North Fontana Redev Pj Ser A (AMBAC) | 5.50% | 9/1/2032 | A+ | 2,000 | 2,000,060 | |||||||||||||||
| Imperial Beach CA Redev Agy Palm Ave Coml Redev Pj | 5.00% | 6/1/2030 | A | 2,000 | 1,904,280 | |||||||||||||||
| Inglewood CA Redev Agy Tax Alloc Sub Lien Ser A-1 (AMBAC) | 5.00% | 5/1/2033 | BBB+ | 1,535 | 1,309,309 | |||||||||||||||
| Lancaster CA Redev Agy Tax Alloc Comb Redev Pj Areas | 6.875% | 8/1/2034 | BBB+ | 1,000 | 1,029,990 | |||||||||||||||
See Notes to Financial Statements.
136
Schedule of Investments (continued)
CALIFORNIA TAX FREE FUND September 30, 2011
| Investments | Interest Rate | Maturity Date | Credit Rating: S&P or Moody’s(a) | Principal Amount (000) | Fair Value | |||||||||||||||
| Special Tax (continued) | ||||||||||||||||||||
| Norco CA Redev Agy Tax Alloc Redev Pj Area No 1 | 6.00% | 3/1/2036 | A | $ | 1,120 | $ | 1,136,890 | |||||||||||||
| Pittsburg CA Redev Agy Los Medanos Cmnty Dev Pj (AMBAC) | Zero Coupon | 8/1/2026 | A+ | 3,500 | 1,344,525 | |||||||||||||||
| Riverside Cnty CA Redev Agy Desert Cmnty Pj Area D | 6.00% | 10/1/2037 | A3 | 5,000 | 5,093,750 | |||||||||||||||
| San Diego CA Redev Agy Tax Alloc North Pk Redev Pj Sub Ser A | 7.00% | 11/1/2039 | A- | 1,000 | 1,071,770 | |||||||||||||||
| San Francisco CA City & Cnty Redev Agy Mission Bay North Redev Ser C | 6.75% | 8/1/2033 | A- | 500 | 544,680 | |||||||||||||||
| San Francisco CA City & Cnty Redev Agy Mission Bay North Redev Ser C | 6.75% | 8/1/2041 | A- | 1,000 | 1,084,040 | |||||||||||||||
| San Francisco CA City & Cnty Redev Agy Mission Bay South Redev Ser D | 6.625% | 8/1/2039 | BBB | 1,500 | 1,559,580 | |||||||||||||||
| Santa Cruz CA Cnty Redev Agy Live Oak/Soquel Cmnty Impt Ser A | 6.625% | 9/1/2029 | A1 | 500 | 547,030 | |||||||||||||||
| Santa Cruz CA Cnty Redev Agy Live Oak/Soquel Cmnty Impt Ser A | 7.00% | 9/1/2036 | A1 | 500 | 554,115 | |||||||||||||||
| Union City CA Cmnty Redev Agy Sub Lien Cmnty Redev Pj | 6.875% | 12/1/2033 | A | 1,500 | 1,624,695 | |||||||||||||||
| Westside CA Union Sch Dist Cmnty Facs Dist No 2005-3 | 5.00% | 9/1/2036 | NR | 985 | 802,805 | |||||||||||||||
|
| |||||||||||||||||||
| Total | 23,788,007 | |||||||||||||||||||
|
| |||||||||||||||||||
| Tax Revenue 1.10% | ||||||||||||||||||||
| San Jose CA Spl Hotel Tax Convtn Ctr Expansion | 6.125% | 5/1/2031 | A2 | 1,000 | 1,061,270 | |||||||||||||||
| Territory of Guam Oblig Rev Section 30 Ser A | 5.75% | 12/1/2034 | BBB- | 1,030 | 1,053,443 | |||||||||||||||
|
| |||||||||||||||||||
| Total | 2,114,713 | |||||||||||||||||||
|
| |||||||||||||||||||
| Tobacco 4.59% | ||||||||||||||||||||
| Golden St Tob Securitization Corp CA Asset Bkd Sr Ser A-1 | 5.00% | 6/1/2033 | BB+ | 1,000 | 701,370 | |||||||||||||||
| Golden St Tob Securitization Corp CA Asset Bkd Sr Ser A-1 | 5.125% | 6/1/2047 | BB+ | 2,200 | 1,401,114 | |||||||||||||||
| Golden St Tob Securitization Corp CA Asset Bkd Sr Ser A-1 | 5.75% | 6/1/2047 | BB+ | 1,245 | 879,194 | |||||||||||||||
| Golden St Tob Securitization Corp CA Enhanced Asset Bkd Ser A (FGIC) | 5.00% | 6/1/2035 | A2 | 4,365 | 4,371,940 | |||||||||||||||
See Notes to Financial Statements.
137
Schedule of Investments (continued)
CALIFORNIA TAX FREE FUND September 30, 2011
| Investments | Interest Rate | Maturity Date | Credit Rating: S&P or Moody’s(a) | Principal Amount (000) | Fair Value | |||||||||||||||
| Tobacco (continued) | ||||||||||||||||||||
| Inland Empire Tob Securitization Auth CA Ser A | 4.625% | 6/1/2021 | B+ | (d) | $ | 875 | $ | 701,662 | ||||||||||||
| Inland Empire Tob Securitization Auth CA Ser A | 5.00% | 6/1/2021 | B+ | (d) | 970 | 802,462 | ||||||||||||||
|
| |||||||||||||||||||
| Total | 8,857,742 | |||||||||||||||||||
|
| |||||||||||||||||||
| Transportation 11.05% | ||||||||||||||||||||
| Bay Area Toll Auth CA San Francisco Bay Area | 5.00% | 10/1/2033 | A+ | 2,905 | 3,046,445 | |||||||||||||||
| CA Foothill Eastern Transn Corridor Agy Cap Apprec | 5.80% | 1/15/2020 | BBB- | 2,000 | 2,031,540 | |||||||||||||||
| Los Angeles CA Dept of Arpts Los Angeles Intl Arpt Ser A(b) | 5.00% | 5/15/2035 | AA | 10,000 | 10,618,450 | |||||||||||||||
| Los Angeles Cnty CA Metro Transn Auth Prop C 2nd Sr Ser A (AGM) | 4.50% | 7/1/2030 | AA+ | 1,000 | 1,030,480 | |||||||||||||||
| Palm Springs CA Arpt Sub Palm Springs Intl Arpt AMT | 6.40% | 7/1/2023 | NR | 300 | 297,525 | |||||||||||||||
| Port of Oakland CA Ser O AMT | 5.125% | 5/1/2031 | A | 1,250 | 1,220,525 | |||||||||||||||
| San Francisco CA City & Cnty Arpts Commn 2nd Ser F AMT | 5.00% | 5/1/2027 | A+ | 1,430 | 1,457,184 | |||||||||||||||
| San Jose CA Arpt Rev Ser A-1 AMT | 6.25% | 3/1/2034 | A | 1,500 | 1,632,195 | |||||||||||||||
|
| |||||||||||||||||||
| Total | 21,334,344 | |||||||||||||||||||
|
| |||||||||||||||||||
| Utilities 19.08% | ||||||||||||||||||||
| Adelanto CA Pub Util Auth Util Sys Pj Ser A | 6.625% | 7/1/2031 | NR | 1,000 | 1,053,290 | |||||||||||||||
| Burbank CA Wtr & Pwr Elec Sys Rev Ser A | 5.00% | 6/1/2023 | AA- | 2,000 | 2,278,320 | |||||||||||||||
| CA St Dept of Wtr Res Cent Vly Pj Ser AE | 5.00% | 12/1/2026 | AAA | 2,000 | 2,230,680 | |||||||||||||||
| Chino Basin Desalter Auth Ser A (AG) | 5.00% | 6/1/2027 | AA+ | 2,000 | 2,141,080 | |||||||||||||||
| Chula Vista CA Rev San Diego Gas Ser E Rmkt | 5.875% | 1/1/2034 | Aa3 | 1,000 | 1,110,010 | |||||||||||||||
| Dublin-San Ramon Svcs Dist CA | 5.25% | 8/1/2029 | A | 1,250 | 1,333,412 | |||||||||||||||
| Lathrop CA Fing Auth Rev Wtr Supply Pj | 6.00% | 6/1/2035 | NR | 2,075 | 2,028,686 | |||||||||||||||
| Long Beach CA Bd Fin Auth Natural Gas Ser A | 5.25% | 11/15/2020 | A | 1,505 | 1,531,082 | |||||||||||||||
| Long Beach CA Bd Fin Auth Natural Gas Ser A | 5.50% | 11/15/2037 | A | 1,000 | 959,830 | |||||||||||||||
| Los Angeles CA Wst Wtr Sys Ser A | 5.00% | 6/1/2021 | AA- | 1,000 | 1,170,540 | |||||||||||||||
| M-S-R Enrg Auth CA Gas Rev Ser C | 7.00% | 11/1/2034 | A | 2,000 | 2,325,600 | |||||||||||||||
| Northern CA Gas Auth No 1 | 0.885% | # | 7/1/2027 | A | 1,000 | 672,090 | ||||||||||||||
See Notes to Financial Statements.
138
Schedule of Investments (concluded)
CALIFORNIA TAX FREE FUND September 30, 2011
| Investments | Interest Rate | Maturity Date | Credit Rating: S&P or Moody’s(a) | Principal Amount (000) | Fair Value | |||||||||||||||
| Utilities (continued) | ||||||||||||||||||||
| Northern CA Pwr Agy Rev Geothermal Pj No 3 Ser A | 5.50% | 7/1/2022 | A1 | $ | 1,985 | $ | 2,349,426 | |||||||||||||
| Northern CA Pwr Agy Rev Hydroelectronic No 1-C (AG) | 5.00% | 7/1/2024 | AA+ | 1,760 | 1,953,970 | |||||||||||||||
| Riverside CA Elec Rev Issue D (AGM) | 5.00% | 10/1/2027 | AA+ | 1,000 | 1,080,050 | |||||||||||||||
| Rowland CA Wtr Dist Recycled Wtr Pj COP | 6.50% | 12/1/2035 | AA- | 1,500 | 1,699,335 | |||||||||||||||
| Sacramento CA Muni Util Dist Ser U (AGM)(b) | 5.00% | 8/15/2023 | AA+ | 1,920 | 2,104,560 | |||||||||||||||
| Sacramento CA Muni Util Dist Ser U (AGM)(b) | 5.00% | 8/15/2024 | AA+ | 1,540 | 1,688,032 | |||||||||||||||
| Sacramento CA Muni Util Dist Ser U (AGM)(b) | 5.00% | 8/15/2025 | AA+ | 1,540 | 1,688,033 | |||||||||||||||
| Sacramento CA Regl Cnty Santn Dist Ser A (NPFGC)(FGIC) | 5.25% | 12/1/2023 | AA | 1,500 | 1,809,270 | |||||||||||||||
| Sthn CA Pub Pwr Auth Pj No 1 Ser A | 5.00% | 11/1/2033 | Baa1 | 2,000 | 1,890,080 | |||||||||||||||
| Sthn CA Pub Pwr Auth Sub Sthn Transmission Ser A | 5.00% | 7/1/2020 | AA- | 1,500 | 1,731,810 | |||||||||||||||
|
| |||||||||||||||||||
| Total | 36,829,186 | |||||||||||||||||||
|
| |||||||||||||||||||
| Total Municipal Bonds (cost $196,694,251) | 203,246,617 | |||||||||||||||||||
|
| |||||||||||||||||||
Shares | ||||||||||||||||||||
| SHORT-TERM INVESTMENT 0.00% | ||||||||||||||||||||
| Money Market Mutual Fund | ||||||||||||||||||||
| Dreyfus General CA Municipal Money Market Fund Class A (cost $26) | – | (k) | 26 | |||||||||||||||||
|
| |||||||||||||||||||
| Total Investments in Securities 105.28% (cost $196,694,277) | 203,246,643 | |||||||||||||||||||
|
| |||||||||||||||||||
| Liabilities in Excess of Cash and Other Assets(i) (5.28%) | (10,184,631 | ) | ||||||||||||||||||
|
| |||||||||||||||||||
| Net Assets 100.00% | $ | 193,062,012 | ||||||||||||||||||
|
| |||||||||||||||||||
Open Futures Contracts at September 30, 2011:
| Type | Expiration | Contracts | Position | Market Value | Unrealized Depreciation | |||||||||||
| U.S. 30-Year Treasury Bond | December 2011 | 107 | Short | $ | (15,260,875) | $ | (756,599) | |||||||||
| Ultra Long U.S. Treasury Bond | December 2011 | 48 | Short | (7,614,000) | (774,458) | |||||||||||
|
|
|
| |||||||||||||
| Totals | $ | (22,874,875) | $ | (1,531,057) | ||||||||||||
|
|
|
| |||||||||||||
See Notes to Financial Statements.
139
Schedule of Investments
NEW JERSEY TAX FREE FUND September 30, 2011
| Investments | Interest Rate | Maturity Date | Credit Rating: S&P or Moody’s(a) | Principal Amount (000) | Fair Value | |||||||||||||||
| MUNICIPAL BONDS 102.15% | ||||||||||||||||||||
| Corporate-Backed 4.23% | ||||||||||||||||||||
| Bayonne NJ Redev Agy Royal Caribbean Pj Ser A AMT | 5.375% | 11/1/2035 | BB | $ | 1,290 | $ | 1,099,286 | |||||||||||||
| NJ Econ Dev Auth Glimcher Pptys LP Pj AMT | 6.00% | 11/1/2028 | NR | 1,085 | 978,811 | |||||||||||||||
| NJ Econ Dev Auth Spl Fac Continental Airlines Inc Pj AMT | 5.50% | 4/1/2028 | B3 | 320 | 280,858 | |||||||||||||||
| NJ Econ Dev Auth Spl Fac Continental Airlines Inc Pj AMT | 6.25% | 9/15/2029 | B | 1,000 | 948,380 | |||||||||||||||
| Puerto Rico Ports Auth Rev Spl Facs Amer Airlines Ser A AMT | 6.25% | 6/1/2026 | CCC+ | 1,000 | 833,060 | |||||||||||||||
| Virgin Islands Pub Fin Auth Sr Secd Hovensa Refinery AMT | 4.70% | 7/1/2022 | Ba2 | 1,000 | 841,680 | |||||||||||||||
|
| |||||||||||||||||||
| Total | 4,982,075 | |||||||||||||||||||
|
| |||||||||||||||||||
| Education 12.54% | ||||||||||||||||||||
| NJ St Edl Facs Auth College of NJ Ser D (AGM) | 5.00% | 7/1/2028 | AA+ | 3,000 | 3,130,440 | |||||||||||||||
| NJ St Edl Facs Auth Georgian Court Univ Ser D | 5.25% | 7/1/2037 | BBB+ | 750 | 742,620 | |||||||||||||||
| NJ St Edl Facs Auth Montclair St Univ Ser J | 5.00% | 7/1/2029 | A1 | 2,000 | 2,107,340 | |||||||||||||||
| NJ St Edl Facs Auth Rowan Univ Ser B (AG) | 5.00% | 7/1/2027 | AA+ | 1,150 | 1,235,548 | |||||||||||||||
| NJ St Edl Facs Auth Seton Hall Univ Ser E | 6.00% | 7/1/2028 | A | 2,400 | 2,706,384 | |||||||||||||||
| NJ St Edl Facs Auth Stevens Inst Tech Ser A | 5.00% | 7/1/2034 | BBB+ | 1,000 | 963,100 | |||||||||||||||
| NJ St Edl Facs Auth Univ Med & Dentistry Ser B | 7.50% | 12/1/2032 | Baa1 | 1,000 | 1,160,070 | |||||||||||||||
| Rutgers St Univ NJ Ser F | 5.00% | 5/1/2031 | AA | 2,500 | 2,721,475 | |||||||||||||||
|
| |||||||||||||||||||
| Total | 14,766,977 | |||||||||||||||||||
|
| |||||||||||||||||||
| General Obligation 13.17% | ||||||||||||||||||||
| Atlantic City NJ Brd Ed (AGM) | 5.00% | 4/1/2022 | AA+ | 1,150 | 1,288,253 | |||||||||||||||
| Essex Cnty NJ Impt Auth Pj Cons GTD (AMBAC) | 5.25% | 12/15/2018 | Aa2 | 1,000 | 1,175,690 | |||||||||||||||
| Hudson Cnty NJ Impt Auth Ser A GTD | 5.75% | 1/1/2035 | Aa3 | 1,840 | 2,053,054 | |||||||||||||||
| Irvington Twp NJ Gen Impt | 5.00% | 1/1/2021 | A1 | 1,410 | 1,612,405 | |||||||||||||||
| Millburn Twp NJ Brd Ed | 5.35% | 7/15/2018 | Aaa | 1,050 | 1,286,061 | |||||||||||||||
| New Brunswick NJ | 5.00% | 10/1/2023 | AA- | 1,000 | 1,155,700 | |||||||||||||||
| NJ St Ser Q | 5.00% | 8/15/2020 | AA- | 1,000 | 1,196,700 | |||||||||||||||
| Northern Mariana Islands Comwlth Ser B | 5.00% | 10/1/2033 | NR | 2,490 | 2,011,397 | |||||||||||||||
See Notes to Financial Statements.
140
Schedule of Investments (continued)
NEW JERSEY TAX FREE FUND September 30, 2011
| Investments | Interest Rate | Maturity Date | Credit Rating: S&P or Moody’s(a) | Principal Amount (000) | Fair Value | |||||||||||||||
| General Obligation (continued) | ||||||||||||||||||||
| Paterson NJ (AGM) | 5.00% | 6/15/2020 | Aa3 | $ | 900 | $ | 987,147 | |||||||||||||
| Puerto Rico Comwlth Pub Impt Ser E | 5.375% | 7/1/2030 | Baa1 | 1,500 | 1,522,020 | |||||||||||||||
| Rahway NJ (AGM) | 4.125% | 12/15/2026 | Aa3 | 5 | 5,186 | |||||||||||||||
| Territory of Guam Ser A | 7.00% | 11/15/2039 | B+ | 140 | 146,408 | |||||||||||||||
| Woodbridge Twp NJ Swr Util | 4.00% | 7/1/2024 | AA- | 1,020 | 1,070,337 | |||||||||||||||
|
| |||||||||||||||||||
| Total | 15,510,358 | |||||||||||||||||||
|
| |||||||||||||||||||
| Health Care 17.70% | ||||||||||||||||||||
| Burlington Cnty NJ Bridge Commn The Evergreens Pj | 5.625% | 1/1/2038 | NR | 1,500 | 1,306,830 | |||||||||||||||
| Camden Cnty NJ Impt Auth Cooper Hlth Sys Oblig Grp A | 5.00% | 2/15/2035 | BBB | 760 | 659,961 | |||||||||||||||
| NJ Econ Dev Auth Cranes Mill Pj Ser A | 5.00% | 6/1/2015 | BBB- | (d) | 500 | 522,185 | ||||||||||||||
| NJ Econ Dev Auth First Mtg Seashore Gardens Pj | 5.30% | 11/1/2026 | NR | 500 | 425,320 | |||||||||||||||
| NJ Econ Dev Auth First Mtg Seashore Gardens Pj | 5.375% | 11/1/2036 | NR | 1,000 | 766,840 | |||||||||||||||
| NJ Econ Dev Auth Seabrook Vlg Inc Fac | 5.25% | 11/15/2036 | NR | 1,500 | 1,272,570 | |||||||||||||||
| NJ Hlthcare Facs Fing Auth AHS Hosp Corp | 6.00% | 7/1/2037 | A1 | 650 | 710,586 | |||||||||||||||
| NJ Hlthcare Facs Fing Auth AHS Hosp Corp Ser A | 5.00% | 7/1/2027 | A1 | 2,000 | 2,051,600 | |||||||||||||||
| NJ Hlthcare Facs Fing Auth Chilton Mem Hosp | 5.75% | 7/1/2039 | BBB+ | 2,000 | 2,019,300 | |||||||||||||||
| NJ Hlthcare Facs Fing Auth Holy Name Hosp | 5.00% | 7/1/2036 | Baa2 | 1,700 | 1,484,117 | |||||||||||||||
| NJ Hlthcare Facs Fing Auth Hunterdon Med Ctr Ser A | 5.25% | 7/1/2025 | A- | 650 | 664,151 | |||||||||||||||
| NJ Hlthcare Facs Fing Auth St. Joseph’s Hlthcare Sys | 6.625% | 7/1/2038 | BBB- | 2,000 | 2,001,340 | |||||||||||||||
| NJ Hlthcare Facs Fing Auth St. Peter’s Univ Hosp Oblig | 5.25% | 7/1/2021 | BBB- | 1,000 | 1,012,360 | |||||||||||||||
| NJ Hlthcare Facs Fing Auth Trinitas Hosp Oblig Grp Ser A | 4.75% | 7/1/2024 | BBB- | 1,000 | 946,780 | |||||||||||||||
| NJ Hlthcare Facs Fing Auth Trinitas Hosp Oblig Grp Ser A | 5.25% | 7/1/2030 | BBB- | 1,000 | 922,530 | |||||||||||||||
| NJ Hlthcare Facs Fing Auth Virtua Hlth | 5.75% | 7/1/2033 | A | 2,500 | 2,655,125 | |||||||||||||||
| Puerto Rico Indl Tourist Edl Med & Envr Ctrl Facs Fing Auth Hosp de la Concepcion Ser A | 6.125% | 11/15/2025 | AA+ | 415 | 416,984 | |||||||||||||||
| Puerto Rico Indl Tourist Edl Med & Envr Ctrl Facs Fing Auth Hosp de la Concepcion Ser A | 6.125% | 11/15/2030 | AA+ | 1,000 | 1,004,650 | |||||||||||||||
|
| |||||||||||||||||||
| Total | 20,843,229 | |||||||||||||||||||
|
| |||||||||||||||||||
See Notes to Financial Statements.
141
Schedule of Investments (continued)
NEW JERSEY TAX FREE FUND September 30, 2011
| Investments | Interest Rate | Maturity Date | Credit Rating: S&P or Moody’s(a) | Principal Amount (000) | Fair Value | |||||||||||||||
| Housing 2.62% | ||||||||||||||||||||
| NJ Econ Dev Auth MSU Student Hsg Pj | 5.75% | 6/1/2031 | Baa3 | $ | 1,500 | $ | 1,545,210 | |||||||||||||
| NJ Econ Dev Auth MSU Student Hsg Pj | 5.875% | 6/1/2042 | Baa3 | 1,520 | 1,541,994 | |||||||||||||||
|
| |||||||||||||||||||
| Total | 3,087,204 | |||||||||||||||||||
|
| |||||||||||||||||||
| Lease Obligations 19.04% | ||||||||||||||||||||
| Essex Cnty NJ Impt Auth Lease Newark Pj Ser A | 6.25% | 11/1/2030 | Baa1 | 1,250 | 1,341,112 | |||||||||||||||
| Gloucester Cnty NJ Impt Auth Cnty Ln Cnty Cap Pg GTD | 5.00% | 4/1/2028 | AA+ | 2,500 | 2,749,475 | |||||||||||||||
| Morris-Union Jt Commn NJ COP (RADIAN) | 5.00% | 5/1/2027 | Baa3 | 1,000 | 947,100 | |||||||||||||||
| Newark NJ Hsg Auth Rev South Ward Police Fac (AG) | 6.75% | 12/1/2038 | Aa3 | 750 | 878,603 | |||||||||||||||
| NJ Econ Dev Auth Sch Facs Constr Ser AA | 5.50% | 12/15/2029 | A+ | 1,250 | 1,365,262 | |||||||||||||||
| NJ Econ Dev Auth Sch Facs Constr Ser Y | 5.00% | 9/1/2033 | A+ | 1,000 | 1,035,960 | |||||||||||||||
| NJ Hlthcare Facs Fing Auth Hosp Asset Transformation Pg Ser A | 5.00% | 10/1/2028 | A+ | 5,025 | 5,189,418 | |||||||||||||||
| NJ Hlthcare Facs Fing Auth Hosp Asset Transformation Pg Ser A | 5.75% | 10/1/2031 | A+ | 1,400 | 1,498,882 | |||||||||||||||
| NJ St Equip Lease Purchase Ser A COP | 5.25% | 6/15/2029 | A+ | 1,000 | 1,067,010 | |||||||||||||||
| NJ St Transn Tr Fd Auth Cap Apprec Transn Sys Ser A | Zero Coupon | 12/15/2031 | A+ | 5,000 | 1,566,650 | |||||||||||||||
| NJ St Transn Tr Fd Auth Cap Apprec Transn Sys Ser A | Zero Coupon | 12/15/2038 | A+ | 5,000 | 986,050 | |||||||||||||||
| NJ St Transn Tr Fd Auth TCRS Ser A (AMBAC) | 5.25% | 12/15/2022 | A+ | 1,500 | 1,732,290 | |||||||||||||||
| Puerto Rico Comwlth Infrastr Fing Auth Mepsi Campus Pj Ser A | 6.50% | 10/1/2037 | NR | 1,000 | 958,940 | |||||||||||||||
| Puerto Rico Pub Bldgs Auth Rev Govt Facs Ser P GTD | 6.50% | 7/1/2030 | Baa1 | 1,000 | 1,103,280 | |||||||||||||||
|
| |||||||||||||||||||
| Total | 22,420,032 | |||||||||||||||||||
|
| |||||||||||||||||||
| Other Revenue 0.11% | ||||||||||||||||||||
| Middlesex Cnty NJ Impt Auth Sub Heldrich Ctr Hotel Ser B(j) | 6.25% | 1/1/2037 | NR | 1,300 | 130,000 | |||||||||||||||
|
| |||||||||||||||||||
| Special Tax 2.02% | ||||||||||||||||||||
| NJ Econ Dev Auth Kapkowski Rd Landfill Pj | 5.75% | 10/1/2021 | Ba2 | 1,000 | 1,016,700 | |||||||||||||||
See Notes to Financial Statements.
142
Schedule of Investments (continued)
NEW JERSEY TAX FREE FUND September 30, 2011
| Investments | Interest Rate | Maturity Date | Credit Rating: S&P or Moody’s(a) | Principal Amount (000) | Fair Value | |||||||||||||||
| Special Tax (continued) | ||||||||||||||||||||
| NJ Econ Dev Auth Kapkowski Rd Landfill Pj | 6.50% | 4/1/2028 | Ba2 | $ | 675 | $ | 715,196 | |||||||||||||
| NJ Econ Dev Auth Newark Downtown Dist Mgmt Corp | 5.125% | 6/15/2037 | Baa3 | 700 | 641,585 | |||||||||||||||
|
| |||||||||||||||||||
| Total | 2,373,481 | |||||||||||||||||||
|
| |||||||||||||||||||
| Tax Revenue 4.31% | ||||||||||||||||||||
| NJ Econ Dev Auth Cigarette Tax | 5.75% | 6/15/2029 | BBB | 1,000 | 984,640 | |||||||||||||||
| Puerto Rico Sales Tax Fing Corp 1st Sub Ser C | 5.00% | 8/1/2035 | A+ | 2,500 | 2,558,925 | |||||||||||||||
| Territory of Guam Oblig Rev Section 30 Ser A | 5.75% | 12/1/2034 | BBB- | 375 | 383,535 | |||||||||||||||
| Virgin Islands Pub Fin Auth Rev Matching Fd Ln Sr Lien Ser A | 5.00% | 10/1/2029 | BBB | 650 | 643,910 | |||||||||||||||
| Virgin Islands Pub Fin Auth Rev Matching Fd Ln Sub Lien Ser B | 5.25% | 10/1/2029 | Baa2 | 500 | 506,070 | |||||||||||||||
|
| |||||||||||||||||||
| Total | 5,077,080 | |||||||||||||||||||
|
| |||||||||||||||||||
| Tobacco 2.35% | ||||||||||||||||||||
| NJ Tob Sttlmnt Fing Corp Ser 1A | 4.625% | 6/1/2026 | BBB | 1,025 | 802,432 | |||||||||||||||
| NJ Tob Sttlmnt Fing Corp Ser 1A | 4.75% | 6/1/2034 | BB+ | 3,000 | 1,957,500 | |||||||||||||||
|
| |||||||||||||||||||
| Total | 2,759,932 | |||||||||||||||||||
|
| |||||||||||||||||||
| Transportation 15.66% | ||||||||||||||||||||
| Hudson Cnty NJ Impt Auth Harrison Pkg Fac Pj Ser C GTD (AG) | 5.125% | 1/1/2031 | AA+ | 1,500 | 1,606,035 | |||||||||||||||
| NJ St Transn Tr Fd Auth Transn Sys Ser A | 6.00% | 6/15/2035 | A+ | 2,000 | 2,318,700 | |||||||||||||||
| Port Auth NY & NJ Cons 152nd AMT | 5.75% | 11/1/2030 | Aa2 | 1,000 | 1,102,660 | |||||||||||||||
| Port Auth NY & NJ Cons 156th Ser(b) | 4.75% | 11/1/2036 | Aa2 | 10,625 | 11,051,582 | |||||||||||||||
| Port Auth NY & NJ Cons 161st | 5.00% | 10/15/2031 | Aa2 | 1,165 | 1,262,615 | |||||||||||||||
| Puerto Rico Comwlth Hwy & Transn Auth Ser AA (NPFGC) | 5.50% | 7/1/2020 | A3 | 1,000 | 1,091,140 | |||||||||||||||
|
| |||||||||||||||||||
| Total | 18,432,732 | |||||||||||||||||||
|
| |||||||||||||||||||
| Utilities 8.40% | ||||||||||||||||||||
| Essex Cnty NJ Utils Auth (AG) | 5.00% | 4/1/2020 | Aa2 | 1,000 | 1,086,400 | |||||||||||||||
| NJ Envr Infrastr Tr Ser C | 5.00% | 9/1/2021 | AAA | 1,750 | 2,175,145 | |||||||||||||||
| Passaic Vly NJ Sewage Commnrs Swr Sys Ser F (NPFGC)(FGIC) | 2.50% | 12/1/2032 | A2 | 525 | 346,453 | |||||||||||||||
| Puerto Rico Elec Pwr Auth Ser WW | 5.00% | 7/1/2028 | A3 | 1,000 | 1,017,080 | |||||||||||||||
See Notes to Financial Statements.
143
Schedule of Investments (concluded)
NEW JERSEY TAX FREE FUND September 30, 2011
| Investments | Interest Rate | Maturity Date | Credit Rating: S&P or Moody’s(a) | Principal Amount (000) | Fair Value | |||||||||||||||
| Utilities (continued) | ||||||||||||||||||||
| Puerto Rico Elec Pwr Auth Ser XX | 5.25% | 7/1/2040 | A3 | $ | 1,000 | $ | 1,014,620 | |||||||||||||
| Puerto Rico Elec Pwr Auth Ser XX | 5.75% | 7/1/2036 | A3 | 1,000 | 1,051,040 | |||||||||||||||
| Salem Cnty NJ Utils Auth Pollutn Ctrl Atlantic City Elec Ser A | 4.875% | 6/1/2029 | A | 2,100 | 2,222,598 | |||||||||||||||
| Virgin Islands Wtr & Pwr Auth Ser A | 5.00% | 7/1/2031 | BBB- | 1,000 | 975,420 | |||||||||||||||
|
| |||||||||||||||||||
| Total | 9,888,756 | |||||||||||||||||||
|
| |||||||||||||||||||
| Total Municipal Bonds (cost $117,688,804) | 120,271,856 | |||||||||||||||||||
|
| |||||||||||||||||||
Shares | ||||||||||||||||||||
| SHORT-TERM INVESTMENT 0.00% | ||||||||||||||||||||
| Money Market Mutual Fund | ||||||||||||||||||||
| Dreyfus NJ Municipal Cash Management (cost $5) | – | (k) | 5 | |||||||||||||||||
|
| |||||||||||||||||||
| Total Investments in Securities 102.15% (cost $117,688,809) | 120,271,861 | |||||||||||||||||||
|
| |||||||||||||||||||
| Liabilities in Excess of Cash and Other Assets(i) (2.15%) | (2,528,833 | ) | ||||||||||||||||||
|
| |||||||||||||||||||
| Net Assets 100.00% | $ | 117,743,028 | ||||||||||||||||||
|
| |||||||||||||||||||
Open Futures Contracts at September 30, 2011:
| Type | Expiration | Contracts | Position | Market Value | Unrealized Depreciation | |||||||||||
| U.S. 30-Year Treasury Bond | December 2011 | 72 | Short | $ | (10,269,000) | $ | (509,117) | |||||||||
| Ultra Long U.S. Treasury Bond | December 2011 | 10 | Short | (1,586,250) | (161,345) | |||||||||||
|
|
|
| |||||||||||||
| Totals | $ | (11,855,250) | $ | (670,462) | ||||||||||||
|
|
|
| |||||||||||||
See Notes to Financial Statements.
144
Schedule of Investments
NEW YORK TAX FREE FUND September 30, 2011
| Investments | Interest Rate | Maturity Date | Credit Rating: S&P or Moody’s(a) | Principal Amount (000) | Fair Value | |||||||||||||||
| MUNICIPAL BONDS 107.16% | ||||||||||||||||||||
| Corporate-Backed 8.94% | ||||||||||||||||||||
| Broome Cnty NY Indl Dev Agy Univ Plaza LLC Phase I Pj Ser A (ACA) | 5.20% | 8/1/2030 | NR | $ | 750 | $ | 646,387 | |||||||||||||
| Broome Cnty NY Indl Dev Agy Univ Plaza LLC Phase I Pj Ser A (ACA) | 5.20% | 8/1/2036 | NR | 1,000 | 835,420 | |||||||||||||||
| Broome Cnty NY Indl Dev Agy Univ Plaza LLC Phase II Pj Ser B (ACA) | 5.10% | 8/1/2036 | NR | 500 | 411,620 | |||||||||||||||
| Essex Cnty NY Indl Dev Agy Intl Paper Co Pjs Ser A AMT | 4.60% | 12/1/2030 | BBB | 1,400 | 1,182,734 | |||||||||||||||
| Liberty NY Dev Corp Rev Goldman Sachs Headquarters | 5.25% | 10/1/2035 | A1 | 2,500 | 2,548,050 | |||||||||||||||
| New York City NY Cap Res Corp Arthur Mgmt Corp Pj | 7.00% | 8/1/2025 | NR | 1,500 | 1,529,415 | |||||||||||||||
| New York City NY Indl Dev Agy 1990 Amer Airlines Inc Pj AMT | 5.40% | 7/1/2019 | CCC+ | 2,635 | 2,255,876 | |||||||||||||||
| New York City NY Indl Dev Agy British Airways Plc Pj AMT | 5.25% | 12/1/2032 | BB- | 2,265 | 1,893,948 | |||||||||||||||
| New York City NY Indl Dev Agy JetBlue Airways Corp Pj AMT | 5.125% | 5/15/2030 | B- | 3,350 | 2,796,346 | |||||||||||||||
| New York City NY Indl Dev Agy Liberty IAC/Interactive Corp | 5.00% | 9/1/2035 | BB+ | 1,315 | 1,164,761 | |||||||||||||||
| NY Liberty Dev Corp 2nd Priority Bk Amer | 5.625% | 7/15/2047 | A | 1,600 | 1,648,384 | |||||||||||||||
| Seneca NY Nation Indians Cap Impts Auth Ser A† | 5.25% | 12/1/2016 | BB | 1,000 | 943,800 | |||||||||||||||
| Syracuse NY Indl Dev Agy Pilot Carousel Ctr Pj Ser A AMT (XLCA) | 5.00% | 1/1/2036 | BBB- | 5,000 | 4,224,500 | |||||||||||||||
| Virgin Islands Pub Fin Auth Sr Secd Hovensa Refinery AMT | 4.70% | 7/1/2022 | Ba2 | 1,665 | 1,401,397 | |||||||||||||||
|
| |||||||||||||||||||
| Total | 23,482,638 | |||||||||||||||||||
|
| |||||||||||||||||||
| Education 21.50% | ||||||||||||||||||||
| Albany NY Indl Dev Agy Civic Fac Albany College Pharmacy Pj Ser A | 5.625% | 12/1/2034 | BBB- | 700 | 703,654 | |||||||||||||||
| Albany NY Indl Dev Agy Civic Fac Albany Law Sch Univ Ser A | 5.00% | 7/1/2031 | BBB | 1,000 | 1,003,880 | |||||||||||||||
| Buffalo & Erie Cnty NY Indl Land Dev Corp Buffalo St College Fndtn Hsg | 5.75% | 10/1/2026 | A+ | 1,350 | 1,533,870 | |||||||||||||||
| Cattaraugus Cnty NY Indl Dev Agy St. Bonaventure Univ Pj Ser A | 5.00% | 5/1/2023 | BBB- | 500 | 507,940 | |||||||||||||||
See Notes to Financial Statements.
145
Schedule of Investments (continued)
NEW YORK TAX FREE FUND September 30, 2011
| Investments | Interest Rate | Maturity Date | Credit Rating: S&P or Moody’s(a) | Principal Amount (000) | Fair Value | |||||||||||||||
| Education (continued) | ||||||||||||||||||||
| Cattaraugus Cnty NY Indl Dev Agy St. Bonaventure Univ Pj Ser A | 5.10% | 5/1/2031 | BBB- | $ | 1,075 | $ | 1,074,957 | |||||||||||||
| Dutchess Cnty NY Loc Dev Corp Anderson Ctr Svcs Inc Pj | 6.00% | 10/1/2030 | BB+ | 1,000 | 974,590 | |||||||||||||||
| Hempstead Twn NY Loc Dev Corp Adelphi Univ Pj | 5.00% | 6/1/2031 | A | 350 | 364,119 | |||||||||||||||
| Monroe Cnty NY Indl Dev Corp Ser A | 5.00% | 7/1/2036 | Aa3 | 3,500 | 3,687,355 | |||||||||||||||
| New York City NY Indl Dev Agy Polytechnic Univ Pj (ACA) | 5.25% | 11/1/2037 | BBB- | 4,295 | 4,246,724 | |||||||||||||||
| New York City NY Indl Dev Agy Vaughn College Aeronautics B | 5.00% | 12/1/2031 | BB+ | 1,510 | 1,284,482 | |||||||||||||||
| NY St Dorm Auth Lease Rev St Univ Dorm Facs Ser A | 5.00% | 7/1/2035 | Aa2 | 1,750 | 1,872,412 | |||||||||||||||
| NY St Dorm Auth Rev Non St Supp Debt Fordham Univ Ser A | 5.25% | 7/1/2031 | A | 2,275 | 2,449,083 | |||||||||||||||
| NY St Dorm Auth Rev Non St Supp Debt NYU Ser A(b) | 5.25% | 7/1/2034 | AA- | 20,000 | 22,037,500 | |||||||||||||||
| NY St Dorm Auth Rev Non St Supp Debt Rochester Inst Tech Ser A | 6.25% | 7/1/2029 | A1 | 2,750 | 3,108,682 | |||||||||||||||
| NY St Dorm Auth Rev Non St Supp Debt Teachers College | 5.375% | 3/1/2029 | A1 | 1,025 | 1,113,160 | |||||||||||||||
| NY St Dorm Auth Rev Non St Supp Debt Yeshiva Univ Ser A | 5.00% | 11/1/2040 | AA- | 1,000 | 1,024,620 | |||||||||||||||
| NY St Dorm Auth Rev St City Univ Cons 5th Gen Res Ser B | 5.00% | 7/1/2027 | AA- | 1,500 | 1,614,360 | |||||||||||||||
| NY St Dorm Auth Rochester Inst Tech | 4.25% | 7/1/2032 | A1 | 3,775 | 3,754,200 | |||||||||||||||
| Seneca Cnty NY Indl Dev Agy NY Chiropractic College | 5.00% | 10/1/2027 | BBB | 500 | 507,750 | |||||||||||||||
| St. Lawrence Cnty Indl Dev Agy Clarkson Univ Pj | 6.00% | 9/1/2034 | A3 | 1,375 | 1,514,054 | |||||||||||||||
| Troy NY Rensselaer Polytechnic Ser A | 5.00% | 9/1/2030 | A- | 1,000 | 1,020,850 | |||||||||||||||
| Yonkers NY Indl Dev Agy Civic Ctr Sarah Lawrence College Pj Ser A | 6.00% | 6/1/2029 | BBB | 1,000 | 1,082,710 | |||||||||||||||
|
| |||||||||||||||||||
| Total | 56,480,952 | |||||||||||||||||||
|
| |||||||||||||||||||
| General Obligation 10.70% | ||||||||||||||||||||
| Nassau Cnty NY Ser B Rmkt | 5.00% | 12/1/2017 | A+ | 2,010 | 2,331,037 | |||||||||||||||
| New York City NY Ser E | 5.00% | 8/1/2019 | AA | 1,000 | 1,189,890 | |||||||||||||||
| New York City NY Ser E | 5.00% | 8/1/2021 | AA | 1,040 | 1,224,839 | |||||||||||||||
| New York City NY Ser E | 5.00% | 8/1/2023 | AA | 1,895 | 2,183,609 | |||||||||||||||
See Notes to Financial Statements.
146
Schedule of Investments (continued)
NEW YORK TAX FREE FUND September 30, 2011
| Investments | Interest Rate | Maturity Date | Credit Rating: S&P or Moody’s(a) | Principal Amount (000) | Fair Value | |||||||||||||||
| General Obligation (continued) | ||||||||||||||||||||
| New York City NY Sub Ser H-5 | 0.50% | # | 3/1/2034 | A | $ | 1,320 | $ | 1,320,000 | ||||||||||||
| New York City NY Subser D-1(c) | 5.00% | 10/1/2024 | AA | 1,500 | 1,718,235 | |||||||||||||||
| Northern Mariana Islands Comwlth Ser B | 5.00% | 10/1/2033 | NR | 3,985 | 3,219,043 | |||||||||||||||
| NY St Urban Dev Corp Rev St Pers Income Tax Ser A-1(b) | 5.00% | 12/15/2025 | AAA | 3,290 | 3,647,811 | |||||||||||||||
| NY St Urban Dev Corp Rev St Pers Income Tax Ser A-1(b) | 5.00% | 12/15/2026 | AAA | 4,790 | 5,310,946 | |||||||||||||||
| NY St Urban Dev Corp Rev St Pers Income Tax Ser A-1(b) | 5.00% | 12/15/2027 | AAA | 1,920 | 2,128,814 | |||||||||||||||
| Puerto Rico Comwlth Pub Impt Ser E | 5.375% | 7/1/2030 | Baa1 | 3,500 | 3,551,380 | |||||||||||||||
| Territory of Guam Ser A | 7.00% | 11/15/2039 | B+ | 280 | 292,816 | |||||||||||||||
|
| |||||||||||||||||||
| Total | 28,118,420 | |||||||||||||||||||
|
| |||||||||||||||||||
| Health Care 13.96% | ||||||||||||||||||||
| Albany NY Indl Dev Agy Civic Fac St. Peter’s Hosp Pj Ser A | 5.25% | 11/15/2027 | BBB+ | 1,500 | 1,457,055 | |||||||||||||||
| Albany NY Indl Dev Agy Civic Fac St. Peter’s Hosp Pj Ser E | 5.50% | 11/15/2027 | BBB+ | 1,000 | 997,820 | |||||||||||||||
| Chautauqua Cnty NY Cap Res Corp Womans Christian Assoc Pj Ser A | 8.00% | 11/15/2030 | NR | 1,000 | 1,048,780 | |||||||||||||||
| Cortland Cnty NY Indl Dev Agy Cortland Mem Hosp Pj (RADIAN) | 5.625% | 7/1/2024 | NR | 1,750 | 1,777,177 | |||||||||||||||
| Dutchess Cnty NY Loc Dev Corp Hlth Quest Sys Inc Ser A | 5.75% | 7/1/2030 | A- | 500 | 518,360 | |||||||||||||||
| East Rochester NY Hsg Auth Rev Sr Living Woodland Vlg Pj | 5.50% | 8/1/2033 | NR | 1,700 | 1,440,138 | |||||||||||||||
| Genesee Cnty NY Indl Dev Agy Utd Mem Med Ctr Pj | 5.00% | 12/1/2032 | NR | 1,000 | 825,780 | |||||||||||||||
| Madison Cnty NY Indl Dev Agy Civic Fac Oneida Hlth Sys Inc Pj | 5.25% | 2/1/2027 | BBB- | 750 | 694,080 | |||||||||||||||
| Madison Cnty NY Indl Dev Agy Civic Fac Oneida Hlth Sys Inc Pj | 5.50% | 2/1/2032 | BBB- | 750 | 692,175 | |||||||||||||||
| Nassau Cnty NY Indl Dev Agy Amsterdam At Harborside Ser A | 6.50% | 1/1/2027 | NR | 1,000 | 972,590 | |||||||||||||||
| New York City NY Hlth & Hosp Corp Hlth Sys Ser A | 5.00% | 2/15/2025 | Aa3 | 1,500 | 1,626,720 | |||||||||||||||
| New York City NY Hlth & Hosp Corp Hlth Sys Ser A | 5.50% | 2/15/2023 | Aa3 | 1,000 | 1,114,940 | |||||||||||||||
| NY St Dorm Auth Rev Catholic Hlth Long Island Oblig Grp | 5.00% | 7/1/2027 | A- | 1,250 | 1,250,538 | |||||||||||||||
See Notes to Financial Statements.
147
Schedule of Investments (continued)
NEW YORK TAX FREE FUND September 30, 2011
| Investments | Interest Rate | Maturity Date | Credit Rating: S&P or Moody’s(a) | Principal Amount (000) | Fair Value | |||||||||||||||
| Health Care (continued) | ||||||||||||||||||||
| NY St Dorm Auth Rev Lenox Hill Hosp Oblig Grp | 5.375% | 7/1/2020 | Baa3 | $ | 2,000 | $ | 2,024,600 | |||||||||||||
| NY St Dorm Auth Rev Non St Supp Debt Mt Sinai Hosp Ser A | 5.00% | 7/1/2026 | A2 | 5,525 | 5,754,840 | |||||||||||||||
| NY St Dorm Auth Rev Non St Supp Debt North Shore-Long Island Jewish Ser A(c) | 5.25% | 5/1/2034 | A- | 1,000 | 1,035,730 | |||||||||||||||
| NY St Dorm Auth Rev Non St Supp Debt NYU Hosps Ctr Ser A | 5.00% | 7/1/2036 | BBB+ | 2,265 | 2,242,622 | |||||||||||||||
| NY St Dorm Auth Rev Non St Supp Debt NYU Hosps Ctr Ser A | 5.75% | 7/1/2031 | BBB+ | 1,500 | 1,592,910 | |||||||||||||||
| NY St Dorm Auth Rev Non St Supp Debt Orange Regl Med Ctr | 6.125% | 12/1/2029 | Ba1 | 2,000 | 2,017,640 | |||||||||||||||
| NY St Dorm Auth Rev Utd Cerebral Palsy Aff No 1-A (AMBAC) | 5.75% | 7/1/2018 | NR | 1,000 | 1,004,140 | |||||||||||||||
| St. Lawrence Cnty Indl Dev Agy Edwards John Noble Hosp | 6.25% | 10/1/2040 | NR | 1,500 | 1,449,435 | |||||||||||||||
| Suffolk Cnty NY Indl Dev Agy Eastern Long Island Hosp Assoc† | 5.375% | 1/1/2027 | NR | 1,180 | 993,147 | |||||||||||||||
| Suffolk Cnty NY Indl Dev Agy Eastern Long Island Hosp Assoc† | 5.50% | 1/1/2037 | NR | 1,000 | 786,030 | |||||||||||||||
| Ulster Cnty NY Indl Dev Agy Ser A | 6.00% | 9/15/2027 | NR | 3,000 | 2,443,650 | |||||||||||||||
| Westchester Cnty NY Hlthcare Corp Sr Lien Ser B | 6.00% | 11/1/2030 | A3 | 850 | 910,707 | |||||||||||||||
|
| |||||||||||||||||||
| Total | 36,671,604 | |||||||||||||||||||
|
| |||||||||||||||||||
| Housing 1.41% | ||||||||||||||||||||
| New York City NY Indl Dev Agy Coll Mtg Eger Hrbr Pj Ser A (GNMA) | 5.875% | 5/20/2044 | AA+ | 415 | 441,668 | |||||||||||||||
| NY St Mtg Agy Hmownr Mtg Rev Ser 143 AMT | 4.875% | 10/1/2030 | Aa1 | 2,255 | 2,234,321 | |||||||||||||||
| NY St Mtg Agy Hmownr Mtg Rev Ser 156 | 5.20% | 10/1/2028 | Aa1 | 1,000 | 1,033,700 | |||||||||||||||
|
| |||||||||||||||||||
| Total | 3,709,689 | |||||||||||||||||||
|
| |||||||||||||||||||
| Lease Obligations 9.95% | ||||||||||||||||||||
| Erie Cnty NY Indl Dev Agy Sch Dist Buffalo Pj A | 5.25% | 5/1/2030 | AA- | 2,000 | 2,203,840 | |||||||||||||||
| Erie Cnty NY Indl Dev Agy Sch Dist Buffalo Pj A | 5.25% | 5/1/2032 | AA- | 1,000 | 1,091,090 | |||||||||||||||
| Erie Cnty NY Indl Dev Agy Sch Dist Buffalo Pj B | 5.00% | 5/1/2023 | AA- | 1,000 | 1,150,050 | |||||||||||||||
See Notes to Financial Statements.
148
Schedule of Investments (continued)
NEW YORK TAX FREE FUND September 30, 2011
| Investments | Interest Rate | Maturity Date | Credit Rating: S&P or Moody’s(a) | Principal Amount (000) | Fair Value | |||||||||||||||
| Lease Obligations (continued) | ||||||||||||||||||||
| New York City NY Indl Dev Agy NY Stock Exchange Pj Ser A | 4.75% | 5/1/2029 | AA- | $ | 2,500 | $ | 2,611,425 | |||||||||||||
| New York City NY Indl Dev Agy USTA Natl Tennis (AGM) | 5.00% | 11/15/2023 | AA+ | 1,830 | 2,026,634 | |||||||||||||||
| NY St Dorm Auth Lease Rev Cap Apprec Court Facs | Zero Coupon | 8/1/2021 | AA+ | 3,265 | 2,477,482 | |||||||||||||||
| NY St Dorm Auth Lease Rev Master Boces Pg Oneida | 5.25% | 8/15/2028 | Aa3 | 3,375 | 3,621,611 | |||||||||||||||
| NY St Dorm Auth Rev Non St Supp Debt Master Boces Pg Lease | 5.50% | 8/15/2026 | Aa3 | 1,560 | 1,795,732 | |||||||||||||||
| NY St Dorm Auth Rev Non St Supp Debt Secd Hosp NY Downtown | 5.00% | 2/15/2022 | AA- | 1,000 | 1,112,060 | |||||||||||||||
| NY St Urban Dev Corp Rev St Facs | 5.70% | 4/1/2020 | AA- | 4,150 | 4,869,153 | |||||||||||||||
| Puerto Rico Comwlth Infrastr Fing Auth Mepsi Campus Pj Ser A | 6.50% | 10/1/2037 | NR | 1,000 | 958,940 | |||||||||||||||
| Puerto Rico Pub Bldgs Auth Rev Govt Facs Ser P GTD | 6.50% | 7/1/2030 | Baa1 | 2,000 | 2,206,560 | |||||||||||||||
|
| |||||||||||||||||||
| Total | 26,124,577 | |||||||||||||||||||
|
| |||||||||||||||||||
| Other Revenue 6.51% | ||||||||||||||||||||
| Brooklyn NY Arena Loc Dev Corp Barclays Ctr Pj | 6.25% | 7/15/2040 | BBB- | 3,000 | 3,139,590 | |||||||||||||||
| Brooklyn NY Arena Loc Dev Corp Barclays Ctr Pj | 6.50% | 7/15/2030 | BBB- | 1,500 | 1,614,000 | |||||||||||||||
| New York City NY Tr Cultural Res Lincoln Ctr Ser C | 5.75% | 12/1/2018 | A+ | 1,500 | 1,818,645 | |||||||||||||||
| New York City NY Tr Cultural Res Museum Modern Art Ser 1A | 5.00% | 4/1/2031 | Aa2 | 4,500 | 4,863,105 | |||||||||||||||
| New York City NY Tr Cultural Res Whitney Museum of Amer Art | 5.00% | 7/1/2031 | A | 2,000 | 2,047,420 | |||||||||||||||
| NY St Dorm Auth Rev Non St Supp Debt NYSARC Inc Ser A | 5.125% | 7/1/2030 | Aa3 | 2,385 | 2,570,147 | |||||||||||||||
| Yonkers NY Econ Dev Corp Charter Sch Edl Excellence Ser A | 6.25% | 10/15/2040 | BB+ | 1,100 | 1,046,419 | |||||||||||||||
|
| |||||||||||||||||||
| Total | 17,099,326 | |||||||||||||||||||
|
| |||||||||||||||||||
| Special Tax 0.73% | ||||||||||||||||||||
| New York City NY Indl Dev Agy Queens Baseball Stadium Pilot (AMBAC) | 5.00% | 1/1/2031 | BB+ | 2,075 | 1,906,427 | |||||||||||||||
|
| |||||||||||||||||||
See Notes to Financial Statements.
149
Schedule of Investments (continued)
NEW YORK TAX FREE FUND September 30, 2011
| Investments | Interest Rate | Maturity Date | Credit Rating: S&P or Moody’s(a) | Principal Amount (000) | Fair Value | |||||||||||||||
| Tax Revenue 8.58% | ||||||||||||||||||||
| Metro Transn Auth NY Ser B | 5.00% | 11/15/2034 | AA | $ | 2,125 | $ | 2,260,277 | |||||||||||||
| New York City NY Transnl Fin Auth Future Tax Secd Fiscal 2011 Ser D(b) | 5.00% | 2/1/2027 | AAA | 3,000 | 3,392,790 | |||||||||||||||
| New York City NY Transnl Fin Auth Future Tax Secd Fiscal 2011 Ser D(b) | 5.00% | 2/1/2028 | AAA | 1,000 | 1,130,930 | |||||||||||||||
| New York City NY Transnl Fin Auth Future Tax Secd Ser A | 5.00% | 5/1/2034 | AAA | 5,000 | 5,388,050 | |||||||||||||||
| NY St Urban Dev Corp Rev St Pers Income Tax Ser A-1(b) | 5.00% | 12/15/2028 | AAA | 4,160 | 4,578,621 | |||||||||||||||
| NY St Urban Dev Corp Rev St Pers Income Tax Ser A-1 | 5.00% | 12/15/2028 | AAA | 2,625 | 2,889,154 | |||||||||||||||
| Puerto Rico Sales Tax Fing Corp 1st Sub Ser A | 5.75% | 8/1/2037 | A+ | 2,000 | 2,138,680 | |||||||||||||||
| Territory of Guam Oblig Rev Section 30 Ser A | 5.75% | 12/1/2034 | BBB- | 755 | 772,184 | |||||||||||||||
|
| |||||||||||||||||||
| Total | 22,550,686 | |||||||||||||||||||
|
| |||||||||||||||||||
| Tobacco 1.92% | ||||||||||||||||||||
| Suffolk Cnty NY Tob Asset Securitization Corp Turbo Ser B | 6.00% | 6/1/2048 | BB+ | (d) | 2,350 | 1,709,131 | ||||||||||||||
| TSASC Inc NY Ser 1 | 5.00% | 6/1/2026 | BBB | 1,750 | 1,625,978 | |||||||||||||||
| TSASC Inc NY Ser 1 | 5.125% | 6/1/2042 | BBB- | 2,455 | 1,714,744 | |||||||||||||||
|
| |||||||||||||||||||
| Total | 5,049,853 | |||||||||||||||||||
|
| |||||||||||||||||||
| Transportation 10.79% | ||||||||||||||||||||
| Metro Transn Auth NY Ser A | 5.00% | 11/15/2031 | A | 5,000 | 5,175,100 | |||||||||||||||
| Metro Transn Auth NY Ser G | 5.00% | 11/15/2021 | A | 1,000 | 1,148,070 | |||||||||||||||
| New York City NY Indl Dev Agy Terminal One Grp Assoc Pj AMT | 5.50% | 1/1/2021 | A3 | 1,250 | 1,321,363 | |||||||||||||||
| New York City NY Indl Dev Agy Terminal One Grp Assoc Pj AMT | 5.50% | 1/1/2024 | A3 | 2,000 | 2,081,740 | |||||||||||||||
| NY St Thwy Auth Gen Rev Ser H (NPFGC)(FGIC) | 5.00% | 1/1/2030 | A+ | 5,000 | 5,242,400 | |||||||||||||||
| NY St Thwy Auth Hwy & Bridge Tr Fd Ser B | 5.00% | 4/1/2028 | AA | 2,000 | 2,176,800 | |||||||||||||||
| Triborough NY Bridge & Tunnel Auth Gen Purp | 4.75% | 11/15/2030 | Aa2 | 5,455 | 5,751,970 | |||||||||||||||
| Triborough NY Bridge & Tunnel Auth Ser C | 5.00% | 11/15/2029 | Aa2 | 5,000 | 5,432,300 | |||||||||||||||
|
| |||||||||||||||||||
| Total | 28,329,743 | |||||||||||||||||||
|
| |||||||||||||||||||
See Notes to Financial Statements.
150
Schedule of Investments (concluded)
NEW YORK TAX FREE FUND September 30, 2011
| Investments | Interest Rate | Maturity Date | Credit Rating: S&P or Moody’s(a) | Principal Amount (000) | Fair Value | |||||||||||||||
| Utilities 12.17% | ||||||||||||||||||||
| Long Island NY Pwr Auth Ser A | 5.00% | 5/1/2038 | A- | $ | 1,500 | $ | 1,562,505 | |||||||||||||
| Long Island NY Pwr Auth Ser A | 5.50% | 4/1/2024 | A- | 2,190 | 2,479,431 | |||||||||||||||
| New York City NY Muni Wtr Fin Auth Ser CC(b) | 5.00% | 6/15/2029 | AA+ | 3,500 | 3,792,303 | |||||||||||||||
| New York City NY Muni Wtr Fin Auth Ser CC | 5.00% | 6/15/2029 | AA+ | 1,545 | 1,676,402 | |||||||||||||||
| NY St Enrg Resh & Dev Auth Reg Lnkd Savrs & RIBs Brooklyn AMT | 6.952% | 7/1/2026 | A3 | 8,000 | 8,056,640 | |||||||||||||||
| NY St Envr Facs Corp Muni Wtr | 5.00% | 6/15/2036 | AA+ | 1,250 | 1,368,500 | |||||||||||||||
| NY St Envr Facs Corp Ser A | 5.00% | 6/15/2029 | AA+ | 2,795 | 3,063,683 | |||||||||||||||
| NY St Envr Facs Corp Ser B | 4.75% | 6/15/2032 | AA+ | 5,000 | 5,230,500 | |||||||||||||||
| Puerto Rico Elec Pwr Auth Ser XX | 5.75% | 7/1/2036 | A3 | 4,500 | 4,729,680 | |||||||||||||||
|
| |||||||||||||||||||
| Total | 31,959,644 | |||||||||||||||||||
|
| |||||||||||||||||||
| Total Municipal Bonds (cost $273,715,426) | 281,483,559 | |||||||||||||||||||
|
| |||||||||||||||||||
Shares | ||||||||||||||||||||
| SHORT-TERM INVESTMENT 0.00% | ||||||||||||||||||||
| Money Market Mutual Fund | ||||||||||||||||||||
| Dreyfus NY Municipal Cash Management (cost $331) | – | (k) | 331 | |||||||||||||||||
|
| |||||||||||||||||||
| Total Investments in Securities 107.16% (cost $273,715,757) | 281,483,890 | |||||||||||||||||||
|
| |||||||||||||||||||
| Liabilities in Excess of Cash and Other Assets(i) (7.16%) | (18,813,963 | ) | ||||||||||||||||||
|
| |||||||||||||||||||
| Net Assets 100.00% | $ | 262,669,927 | ||||||||||||||||||
|
| |||||||||||||||||||
Open Futures Contracts at September 30, 2011:
| Type | Expiration | Contracts | Position | Market Value | Unrealized Depreciation | |||||||||||
| U.S. 30-Year Treasury Bond | December 2011 | 193 | Short | $ | (27,526,625) | $ | (1,364,709) | |||||||||
| Ultra Long U.S. Treasury Bond | December 2011 | 28 | Short | (4,441,500) | (451,767) | |||||||||||
|
|
|
| |||||||||||||
| Totals | $ | (31,968,125) | $ | (1,816,476) | ||||||||||||
|
|
|
| |||||||||||||
See Notes to Financial Statements.
151
Schedule of Investments
September 30, 2011
| AMT | Income from this security may be subject to Alternative Minimum Tax. | |
| COP | Certificates of Participation. | |
| CR | Custodial Receipt. | |
| ETM | Escrow to Maturity. | |
| GTD | Guaranteed. | |
| NR | Not Rated. | |
Pre-Refunded Bonds A second bond has been issued in order to pay off the first bond issue. Proceeds from the sale of the | ||
| second bond are held in an “escrow fund” consisting of U.S. Government debt until the first bond issue reaches maturity. | ||
| PSF | Permanent School Fund. | |
| RIBs | Residual Interest Bonds. The interest rate is subject to change periodically and inversely to the prevailing market rate. The interest rate shown is the rate in effect at September 30, 2011. | |
| TCRS | Transferable Custodial Receipts. | |
| † | Security was purchased pursuant to Rule 144A under the Securities Act of 1933 and, unless registered under the Act or exempted from registration, may only be resold to qualified institutional investors. Unless otherwise noted, 144A securities are deemed to be liquid. | |
| # | Variable Rate Security. The interest rate represents the rate in effect at September 30, 2011. | |
| ~ | Deferred interest debentures pay no interest for a stipulated number of years, after which they pay a predetermined interest rate. | |
| (a) | Unaudited. | |
| (b) | Municipal Bonds Held in Trust–Securities represent underlying bonds transferred to a separate securitization trust established in a tender option bond transaction in which the Fund acquired the residual interest certificates. These securities serve as collateral in a financing transaction. See Note 2(h) for details of Municipal Bonds Held in Trust. | |
| (c) | Securities purchased on a when-issued basis (See Note 2(g)). | |
| (d) | This investment has been rated by Fitch IBCA. | |
| (e) | The interest rate reset date shown represents the date in which the Fund has the right to sell a Variable Rate Demand Note back to the issuer for Principal Amount. | |
| (f) | Defaulted security. | |
| (g) | Stub Rights issued in connection with a plan of reorganization. | |
| (h) | Security is perpetual and has no stated maturity date. | |
| (i) | Cash and Other Assets in Excess of Liabilities (Liabilities in Excess of Cash and Other Assets) include net unrealized appreciation (depreciation) on futures contracts. | |
| (j) | Fund received partial payment from issuer. | |
| (k) | Amount represents less than 1,000 shares. | |
| (l) | Effective Maturity date. Average life of sinking fund due to mandatory or expected principal payments prior to maturity. The interest represents the rate at September 30, 2011. The date shown represents the next interest reset date. | |
| (m) | Subsequent to September 30, 2011, the underwriter exercised its right to terminate its obligation to accept delivery and pay for the bonds. Accordingly, the when-issued transaction was cancelled. | |
Insured or guaranteed by the indicated municipal bond insurance corporation or Federal agency: | ||
| ACA | American Capital Access Holding Ltd. | |
| AMBAC | AMBAC Assurance Corporation | |
| AG | Assured Guaranty | |
| AGM | Assured Guaranty Municipal Corporation | |
| BHAC | Berkshire Hathaway Assurance Corporation | |
| CIFG | CIFG Guaranty | |
| FHLMC | Federal Home Loan Mortgage Corporation | |
| FHA | Federal Housing Administration | |
| FNMA | Federal National Mortgage Association | |
| FGIC | Financial Guaranty Insurance Company | |
| GNMA | Government National Mortgage Association | |
| IBC | Insurance Bond Certificate | |
| NPFGC | National Public Finance Guarantee Corporation | |
| RADIAN | Radian Asset Assurance, Inc. | |
| VA | Department of Veterans Affairs | |
| XLCA | XL Capital Assurance, Inc. | |
See Notes to Financial Statements.
152
This page is intentionally left blank.
153
Statements of Assets and Liabilities
September 30, 2011
| Short Duration | Intermediate | AMT Free | ||||||||||
ASSETS: | ||||||||||||
Investments in securities, at cost | $ | 1,802,413,722 | $ | 2,277,041,541 | $ | 64,172,460 | ||||||
Investments in securities, at fair value | $ | 1,833,289,247 | $ | 2,384,605,304 | $ | 67,323,104 | ||||||
Cash | 2,657,078 | 1,672,515 | 1,493,838 | |||||||||
Deposits with brokers for futures collateral | – | 1,723,400 | 84,100 | |||||||||
Receivables: | ||||||||||||
Interest | 17,451,789 | 31,499,829 | 963,698 | |||||||||
Investment securities sold | 31,073,822 | 159,282 | 1,045,518 | |||||||||
Capital shares sold | 20,453,701 | 28,712,337 | 1,554,098 | |||||||||
From advisor (See Note 3) | 153,342 | 170,615 | 18,051 | |||||||||
Prepaid expenses and other assets | 62,863 | 153,582 | 31,185 | |||||||||
Total assets | 1,905,141,842 | 2,448,696,864 | 72,513,592 | |||||||||
LIABILITIES: | ||||||||||||
Payables: | ||||||||||||
Investment securities purchased | 23,178,294 | 25,152,708 | 3,048,614 | |||||||||
Trust certificates (See Note 2(h)) | 7,000,000 | 9,820,000 | 500,000 | |||||||||
Capital shares reacquired | 4,192,890 | 9,141,610 | 33,367 | |||||||||
Management fee | 602,282 | 760,856 | 24,167 | |||||||||
12b-1 distribution fees | 565,465 | 731,056 | 14,137 | |||||||||
Interest expense and fees (See Note 2(h)) | 11,783 | 27,958 | 80 | |||||||||
Directors’ fees | 56,244 | 74,206 | 137 | |||||||||
Fund administration | 60,228 | 76,774 | 1,933 | |||||||||
Variation margin | – | 242,004 | 15,406 | |||||||||
Distributions payable | 3,066,057 | 6,759,393 | 222,582 | |||||||||
Accrued expenses and other liabilities | 171,935 | 288,783 | 61,829 | |||||||||
Total liabilities | 38,905,178 | 53,075,348 | 3,922,252 | |||||||||
NET ASSETS | $ | 1,866,236,664 | $ | 2,395,621,516 | $ | 68,591,340 | ||||||
COMPOSITION OF NET ASSETS: | ||||||||||||
Paid-in capital | $ | 1,833,929,236 | $ | 2,301,506,230 | $ | 65,933,426 | ||||||
Undistributed (distributions in excess of) net investment income | 209,503 | 1,667,040 | 63,938 | |||||||||
Accumulated net realized gain (loss) on investments and futures contracts | 1,222,400 | (12,551,689 | ) | (372,758 | ) | |||||||
Net unrealized appreciation (depreciation) on investments and futures contracts | 30,875,525 | 104,999,935 | 2,966,734 | |||||||||
Net Assets | $ | 1,866,236,664 | $ | 2,395,621,516 | $ | 68,591,340 | ||||||
See Notes to Financial Statements.
154
| National | High Yield | California | New Jersey | New York | ||||||||||||||
| $ | 1,765,197,095 | $ | 1,775,387,849 | $ | 196,694,277 | $ | 117,688,809 | $ | 273,715,757 | |||||||||
| $ | 1,806,438,938 | $ | 1,657,736,463 | $ | 203,246,643 | $ | 120,271,861 | $ | 281,483,890 | |||||||||
| 1,629,830 | 2,012,901 | 215,999 | 966,010 | 615,010 | ||||||||||||||
| 3,254,600 | 3,541,600 | 550,300 | 258,800 | 699,700 | ||||||||||||||
| 26,581,600 | 31,025,130 | 3,127,773 | 2,020,608 | 4,011,256 | ||||||||||||||
| 150,786,469 | 23,025,640 | 2,730,165 | 10,000 | 15,000 | ||||||||||||||
| 8,995,222 | 13,135,408 | 913,850 | 391,789 | 1,164,161 | ||||||||||||||
| – | – | – | – | – | ||||||||||||||
| 58,895 | 57,403 | 17,679 | 13,653 | 18,095 | ||||||||||||||
| 1,997,745,554 | 1,730,534,545 | 210,802,409 | 123,932,721 | 288,007,112 | ||||||||||||||
| 188,460,792 | 33,825,048 | 1,687,518 | – | 2,745,905 | ||||||||||||||
| 147,087,226 | 133,580,000 | 14,475,000 | 5,310,000 | 20,820,000 | ||||||||||||||
| 4,302,219 | 4,493,748 | 323,429 | 194,799 | 225,002 | ||||||||||||||
| 579,868 | 602,182 | 71,507 | 43,224 | 96,590 | ||||||||||||||
| 567,941 | 509,614 | 63,110 | 33,106 | 100,614 | ||||||||||||||
| 190,497 | 276,103 | 31,755 | 16,938 | 38,551 | ||||||||||||||
| 460,919 | 120,540 | 128,108 | 38,702 | 115,263 | ||||||||||||||
| 53,877 | 49,874 | 6,356 | 3,842 | 8,586 | ||||||||||||||
| 513,307 | 842,271 | 151,316 | 57,925 | 157,627 | ||||||||||||||
| 6,715,594 | 8,026,686 | 734,558 | 431,086 | 949,522 | ||||||||||||||
| 336,736 | 316,550 | 67,740 | 60,071 | 79,525 | ||||||||||||||
| 349,268,976 | 182,642,616 | 17,740,397 | 6,189,693 | 25,337,185 | ||||||||||||||
| $ | 1,648,476,578 | $ | 1,547,891,929 | $ | 193,062,012 | $ | 117,743,028 | $ | 262,669,927 | |||||||||
| $ | 1,684,985,708 | $ | 1,966,186,836 | $ | 201,997,540 | $ | 126,455,906 | $ | 268,801,768 | |||||||||
| 1,809,958 |
| 3,017,899 | (396,323 | ) | (248,089 | ) | (747,845 | ) | |||||||||
| (73,796,670 | ) | (294,300,585 | ) | (13,560,514 | ) | (10,377,379 | ) | (11,335,653 | ) | ||||||||
| 35,477,582 |
| (127,012,221 | ) | 5,021,309 | 1,912,590 | 5,951,657 | |||||||||||
| $ | 1,648,476,578 | $ | 1,547,891,929 | $ | 193,062,012 | $ | 117,743,028 | $ | 262,669,927 | |||||||||
See Notes to Financial Statements.
155
Statements of Assets and Liabilities (concluded)
September 30, 2011
| Short Duration | Intermediate | AMT Free | ||||||||||
Net assets by class: | ||||||||||||
Class A Shares | $ | 1,249,340,636 | $ | 1,385,337,016 | $ | 62,280,219 | ||||||
Class B Shares | – | $ | 6,526,369 | – | ||||||||
Class C Shares | $ | 244,872,136 | $ | 453,519,616 | $ | 2,531,744 | ||||||
Class F Shares | $ | 365,693,501 | $ | 547,652,214 | $ | 3,768,807 | ||||||
Class I Shares | $ | 6,330,391 | $ | 2,572,483 | $ | 10,570 | ||||||
Class P Shares | – | $ | 13,818 | – | ||||||||
Outstanding shares by class*: | ||||||||||||
Class A Shares | 78,916,031 | 132,014,601 | 4,129,881 | |||||||||
Class B Shares | – | 622,477 | – | |||||||||
Class C Shares | 15,466,872 | 43,270,712 | 167,958 | |||||||||
Class F Shares | 23,103,727 | 52,194,276 | 249,831 | |||||||||
Class I Shares | 399,961 | 244,944 | 701 | |||||||||
Class P Shares | – | 1,316.581 | – | |||||||||
Net asset value, offering and redemption price per share (Net assets divided by outstanding shares): | ||||||||||||
Class A Shares-Net asset value | $15.83 | $10.49 | $15.08 | |||||||||
Class A Shares-Maximum offering price | $16.19 | $10.73 | $15.43 | |||||||||
Class B Shares-Net asset value | – | $10.48 | – | |||||||||
Class C Shares-Net asset value | $15.83 | $10.48 | $15.07 | |||||||||
Class F Shares-Net asset value | $15.83 | $10.49 | $15.09 | |||||||||
Class I Shares-Net asset value | $15.83 | $10.50 | $15.08 | |||||||||
Class P Shares-Net asset value | – | $10.50 | – | |||||||||
| * | Lord Abbett Municipal Income Fund, Inc. has 4,400,001,000 authorized shares of capital stock (par value $.001), of which 4,080,001,000 are designated as follows: 900,001,000 to Short Duration, 930,000,000 to Intermediate, 140,000,000 to AMT Free, 465,000,000 to National, 925,000,000 to High Yield and 240,000,000 to each of California, New Jersey and New York. |
See Notes to Financial Statements.
156
| National | High Yield | California | New Jersey | New York | ||||||||||||||
| $ | 1,406,579,145 | $ | 919,757,789 | $ | 150,422,762 | $ | 113,782,572 | $ | 216,125,551 | |||||||||
| $ | 9,189,976 | $ | 10,561 | – | – | – | ||||||||||||
| $ | 158,713,545 | $ | 450,802,483 | $ | 28,023,068 | – | $ | 38,626,668 | ||||||||||
| $ | 73,983,292 | $ | 175,052,481 | $ | 14,605,049 | $ | 3,949,438 | $ | 7,906,754 | |||||||||
| $ | 10,620 | $ | 2,257,741 | $ | 11,133 | $ | 11,018 | $ | 10,954 | |||||||||
| – | $ | 10,874 | – | – | – | |||||||||||||
| 133,587,198 | 83,181,839 | 15,196,217 | 24,250,202 | 20,265,284 | ||||||||||||||
| 868,502 | 954.335 | – | – | – | ||||||||||||||
| 15,056,549 | 40,755,314 | 2,829,743 | – | 3,626,874 | ||||||||||||||
| 7,032,101 | 15,820,181 | 1,475,550 | 841,326 | 740,702 | ||||||||||||||
| 1,009 | 204,065 | 1,125 | 2,347 | 1,027 | ||||||||||||||
| – | 982.635 | – | – | – | ||||||||||||||
| $10.53 | $11.06 | $9.90 | $4.69 | $10.66 | ||||||||||||||
| | $10.77 | | $11.31 | $10.13 | $4.80 | $10.91 | ||||||||||||
| $10.58 | $11.07 | – | – | – | ||||||||||||||
| $10.54 | $11.06 | $9.90 | – | $10.65 | ||||||||||||||
| $10.52 | $11.07 | $9.90 | $4.69 | $10.67 | ||||||||||||||
| $10.53 | $11.06 | $9.90 | $4.69 | $10.67 | ||||||||||||||
| – | $11.07 | – | – | – | ||||||||||||||
See Notes to Financial Statements.
157
Statements of Operations
For the Year Ended September 30, 2011
| Short Duration | Intermediate | AMT Free* | ||||||||||
Investment income: | ||||||||||||
Interest and other | $ | 48,339,041 | $ | 92,993,577 | $ | 1,704,482 | ||||||
Dividends | 26 | 933 | – | |||||||||
Total investment income | 48,339,067 | 92,994,510 | 1,704,482 | |||||||||
Expenses: | ||||||||||||
Management fee | 7,247,394 | 8,299,632 | 159,220 | |||||||||
12b-1 distribution plan-Class A | 2,485,644 | 2,499,827 | 59,810 | |||||||||
12b-1 distribution plan-Class B | – | 68,863 | – | |||||||||
12b-1 distribution plan-Class C | 2,192,355 | 3,684,281 | 9,639 | |||||||||
12b-1 distribution plan-Class F | 323,001 | 417,681 | 961 | |||||||||
12b-1 distribution plan-Class P | – | 60 | – | |||||||||
Interest expense and fees (See Note 2(h)) | 52,208 | 129,203 | 508 | |||||||||
Shareholder servicing | 462,408 | 855,631 | 21,326 | |||||||||
Professional | 57,718 | 60,578 | 39,251 | |||||||||
Reports to shareholders | 87,166 | 143,604 | 7,806 | |||||||||
Fund administration | 724,739 | 832,293 | 12,738 | |||||||||
Custody | 30,300 | 32,958 | 4,456 | |||||||||
Directors’ fees | 53,530 | 57,891 | 524 | |||||||||
Registration | 163,837 | 310,880 | 6,081 | |||||||||
Offering costs | – | – | 38,711 | |||||||||
Other | 106,789 | 129,802 | 6,877 | |||||||||
Gross expenses | 13,987,089 | 17,523,184 | 367,908 | |||||||||
Expense reductions (See Note 7) | (2,410 | ) | (2,699 | ) | (35 | ) | ||||||
Management fee waived and expenses reimbursed (See Note 3) | (1,946,198 | ) | (1,461,583 | ) | (201,422 | ) | ||||||
Net expenses | 12,038,481 | 16,058,902 | 166,451 | |||||||||
Net investment income | 36,300,586 | 76,935,608 | 1,538,031 | |||||||||
Net realized and unrealized gain (loss): | ||||||||||||
Net realized gain (loss) on investments and futures contracts | 1,517,869 | (6,661,023 | ) | (373,323 | ) | |||||||
Net change in unrealized appreciation/depreciation on investments and futures contracts | (576,306 | ) | (1,808,811 | ) | 2,966,734 | |||||||
Net realized and unrealized gain (loss) | 941,563 | (8,469,834 | ) | 2,593,411 | ||||||||
Increase (Decrease) in Net Assets Resulting From Operations | $ | 37,242,149 | $ | 68,465,774 | $ | 4,131,442 | ||||||
| * | For the period October 26, 2010 (commencement of operations) to September 30, 2011. |
See Notes to Financial Statements.
158
| National | High Yield | California | New Jersey | New York | ||||||||||||||
| $ | 93,869,207 | $ | 117,444,467 | $ | 10,990,660 | $ | 6,412,861 | $ | 14,439,067 | |||||||||
| 83 | 185 | – | – | 101 | ||||||||||||||
| 93,869,290 | 117,444,652 | 10,990,660 | 6,412,861 | 14,439,168 | ||||||||||||||
| 6,809,689 | 7,907,579 | 851,098 | 527,489 | 1,183,890 | ||||||||||||||
| 2,671,914 | 1,906,275 | 293,753 | 227,746 | 432,396 | ||||||||||||||
| 118,708 | 102 | – | – | – | ||||||||||||||
| 1,389,820 | 4,188,987 | 240,858 | – | 327,844 | ||||||||||||||
| 68,337 | 206,560 | 13,909 | 3,340 | 7,689 | ||||||||||||||
| – | 48 | – | – | – | ||||||||||||||
| 1,066,088 | 1,222,642 | 114,134 | 40,200 | 187,171 | ||||||||||||||
| 749,366 | 853,790 | 71,470 | 57,214 | 116,047 | ||||||||||||||
| 98,047 | 194,624 | 43,356 | 39,115 | 44,055 | ||||||||||||||
| 114,255 | 119,068 | 7,592 | 8,336 | 15,838 | ||||||||||||||
| 630,969 | 658,772 | 75,653 | 46,888 | 105,235 | ||||||||||||||
| 27,254 | 41,277 | 5,429 | 4,068 | 6,116 | ||||||||||||||
| 45,820 | 51,748 | 5,709 | 3,537 | 7,922 | ||||||||||||||
| 225,003 | 170,565 | 43,774 | 34,000 | 47,105 | ||||||||||||||
| – | – | – | – | – | ||||||||||||||
| 195,062 | 197,590 | 7,189 | 5,149 | 8,972 | ||||||||||||||
| 14,210,332 | 17,719,627 | 1,773,924 | 997,082 | 2,490,280 | ||||||||||||||
| (2,102 | ) | (2,218 | ) | (249 | ) | (155 | ) | (349 | ) | |||||||||
| | – | | – | – | – | – | ||||||||||||
| 14,208,230 | 17,717,409 | 1,773,675 | 996,927 | 2,489,931 | ||||||||||||||
| 79,661,060 | 99,727,243 | 9,216,985 | 5,415,934 | 11,949,237 | ||||||||||||||
| (15,494,713 | ) | (27,952,291 | ) | (4,280,442 | ) | (2,940,278 | ) | 324,906 | ||||||||||
| (19,273,169 | ) | (104,202,161 | ) | (3,559,731 | ) | (1,423,932 | ) | (9,217,131 | ) | |||||||||
| (34,767,882 | ) | (132,154,452 | ) | (7,840,173 | ) | (4,364,210 | ) | (8,892,225 | ) | |||||||||
| $ | 44,893,178 | $ | (32,427,209 | ) | $ | 1,376,812 | $ | 1,051,724 | $ | 3,057,012 | ||||||||
See Notes to Financial Statements.
159
Statements of Changes in Net Assets
| Short Duration | ||||||||
| INCREASE IN NET ASSETS | For the Year Ended September 30, 2011 | For the Year Ended September 30, 2010 | ||||||
Operations: | ||||||||
Net investment income | $ | 36,300,586 | $ | 27,173,511 | ||||
Net realized gain (loss) on investments and futures contracts | 1,517,869 | (296,245 | ) | |||||
Net change in unrealized appreciation/depreciation on investments and futures contracts | (576,306 | ) | 22,530,140 | |||||
Net increase in net assets resulting from operations | 37,242,149 | 49,407,406 | ||||||
Distributions to shareholders from: | ||||||||
Net investment income | ||||||||
Class A | (25,854,639 | ) | (20,597,104 | ) | ||||
Class B | – | – | ||||||
Class C | (3,269,932 | ) | (2,286,086 | ) | ||||
Class F | (7,026,813 | ) | (4,226,029 | ) | ||||
Class I | (103,400 | ) | (31,686 | ) | ||||
Class P | – | – | ||||||
Total distributions to shareholders | (36,254,784 | ) | (27,140,905 | ) | ||||
Capital share transactions (Net of share conversions) (See Note 11): |
| |||||||
Net proceeds from sales of shares | 1,019,642,150 | 1,617,023,721 | ||||||
Reinvestment of distributions | 20,630,502 | 15,688,753 | ||||||
Cost of shares reacquired | (1,039,433,779 | ) | (631,886,427 | ) | ||||
Net increase in net assets | 838,873 | 1,000,826,047 | ||||||
Net increase in net assets | 1,826,238 | 1,023,092,548 | ||||||
NET ASSETS: | ||||||||
Beginning of year | $ | 1,864,410,426 | $ | 841,317,878 | ||||
End of year | $ | 1,866,236,664 | $ | 1,864,410,426 | ||||
Undistributed net investment income | $ | 209,503 | $ | 111,769 | ||||
See Notes to Financial Statements.
160
| Intermediate | AMT Free | |||||||||
| For the Year Ended September 30, 2011 | For the Year Ended September 30, 2010 | For the Period October 26, 2010 to September 30, 2011* | ||||||||
| $ | 76,935,608 | $ | 51,977,458 | $ | 1,538,031 | |||||
| (6,661,023 | ) | (4,503,634 | ) | (373,323 | ) | |||||
| (1,808,811 | ) | 47,909,249 | 2,966,734 | ||||||
| 68,465,774 | 95,383,073 | 4,131,442 | ||||||||
| (47,210,859 | ) | (36,638,320 | ) | (1,422,417 | ) | |||||
| (205,346 | ) | (212,010 | ) | – | ||||||
| (12,341,114 | ) | (7,863,735 | ) | (37,727 | ) | |||||
| (16,196,238 | ) | (6,656,253 | ) | (46,425 | ) | |||||
| (22,154 | ) | – | (444 | ) | ||||||
| (469 | ) | (449 | ) | – | ||||||
| (75,976,180 | ) | (51,370,767 | ) | (1,507,013 | ) | |||||
| 1,288,655,754 | 1,294,401,155 | 73,241,755 | ||||||||
| 43,702,459 | 32,503,678 | 512,567 | ||||||||
| (955,643,486 | ) | (433,315,244 | ) | (7,787,411 | ) | |||||
| 376,714,727 |
| 893,589,589 | 65,966,911 | ||||||
| 369,204,321 | 937,601,895 | 68,591,340 | ||||||||
| $ | 2,026,417,195 | $ | 1,088,815,300 | $ | – | |||||
| $ | 2,395,621,516 | $ | 2,026,417,195 | $ | 68,591,340 | |||||
| $ | 1,667,040 | $ | 665,410 | $ | 63,938 | |||||
| * | For the period October 26, 2010 (commencement of operations) to September 30, 2011. |
See Notes to Financial Statements.
161
Statements of Changes in Net Assets (continued)
| National | ||||||||
| INCREASE (DECREASE) IN NET ASSETS | For the Year Ended September 30, 2011 | For the Year Ended September 30, 2010 | ||||||
Operations: | ||||||||
Net investment income | $ | 79,661,060 | $ | 56,703,047 | ||||
Net realized loss on investments and futures contracts | (15,494,713 | ) | (922,444 | ) | ||||
Net change in unrealized appreciation/depreciation on investments and futures contracts | (19,273,169 | ) | 26,620,469 | |||||
Net increase (decrease) in net assets resulting from operations | 44,893,178 | 82,401,072 | ||||||
Distributions to shareholders from: | ||||||||
Net investment income | ||||||||
Class A | (67,412,561 | ) | (46,362,662 | ) | ||||
Class B | (501,706 | ) | (726,626 | ) | ||||
Class C | (7,004,717 | ) | (6,591,845 | ) | ||||
Class F | (3,501,921 | ) | (2,135,718 | ) | ||||
Class I | (531 | ) | (95 | ) | ||||
Class P | – | – | ||||||
Total distributions to shareholders | (78,421,436 | ) | (55,816,946 | ) | ||||
Capital share transactions (Net of share conversions) (See Note 11): |
| |||||||
Net proceeds from sales of shares | 268,002,652 | 337,382,127 | ||||||
Net proceeds from reorganizations (See Note 12) | 590,280,917 | – | ||||||
Reinvestment of distributions | 57,133,477 | 42,078,706 | ||||||
Cost of shares reacquired | (500,098,086 | ) | (210,277,956 | ) | ||||
Net increase (decrease) in net assets | 415,318,960 | 169,182,877 | ||||||
Net increase (decrease) in net assets | 381,790,702 | 195,767,003 | ||||||
NET ASSETS: | ||||||||
Beginning of year | $ | 1,266,685,876 | $ | 1,070,918,873 | ||||
End of year | $ | 1,648,476,578 | $ | 1,266,685,876 | ||||
Undistributed (distributions in excess of) net investment income | $ | 1,809,958 | $ | 769,488 | ||||
See Notes to Financial Statements.
162
| High Yield | California | |||||||||||||
| For the Year Ended September 30, 2011 | For the Year Ended September 30, 2010 | For the Year Ended September 30, 2011 | For the Year Ended September 30, 2010 | |||||||||||
| $ | 99,727,243 | $ | 99,821,458 | $ | 9,216,985 | $ | 9,212,797 | |||||||
| (27,952,291 | ) | (49,677,740 | ) | (4,280,442 | ) | (1,527,348 | ) | |||||||
| (104,202,161 | ) | 101,888,693 | (3,559,731 | ) | 3,212,633 | ||||||||
| (32,427,209 | ) | 152,032,411 | 1,376,812 | 10,898,082 | ||||||||||
| (57,860,768 | ) | (62,203,493 | ) | (7,212,209 | ) | (7,512,748 | ) | |||||||
| (548 | ) | (507 | ) | – | – | |||||||||
| (26,351,246 | ) | (26,001,995 | ) | (1,207,435 | ) | (1,224,490 | ) | |||||||
| (12,763,398 | ) | (9,390,859 | ) | (697,777 | ) | (392,917 | ) | |||||||
| (93,614 | ) | (788 | ) | (364 | ) | – | ||||||||
| (621 | ) | (576 | ) | – | – | |||||||||
| (97,070,195 | ) | (97,598,218 | ) | (9,117,785 | ) | (9,130,155 | ) | |||||||
| 548,114,486 | 904,630,848 | 37,080,282 | 48,246,198 | |||||||||||
| – | – | – | – | |||||||||||
| 65,689,552 | 68,720,738 | 5,901,341 | 6,594,880 | |||||||||||
| (974,031,202 | ) | (534,438,631 | ) | (54,388,032 | ) | (39,641,133 | ) | |||||||
| (360,227,164 | ) | 438,912,955 | (11,406,409 | ) | 15,199,945 | ||||||||
| (489,724,568 | ) | 493,347,148 | (19,147,382 | ) | 16,967,872 | |||||||||
| $ | 2,037,616,497 | $ | 1,544,269,349 | $ | 212,209,394 | $ | 195,241,522 | |||||||
| $ | 1,547,891,929 | $ | 2,037,616,497 | $ | 193,062,012 | $ | 212,209,394 | |||||||
| $ | 3,017,899 | $ | 620,609 | $ | (396,323 | ) | $ | (493,928 | ) | |||||
See Notes to Financial Statements.
163
Statements of Changes in Net Assets (concluded)
| New Jersey | ||||||||
| INCREASE (DECREASE) IN NET ASSETS | For the Year Ended September 30, 2011 | For the Year Ended September 30, 2010 | ||||||
Operations: | ||||||||
Net investment income | $ | 5,415,934 | $ | 5,701,896 | ||||
Net realized gain (loss) on investments and futures contracts | (2,940,278 | ) | (1,921,821 | ) | ||||
Net change in unrealized appreciation/depreciation on investments and futures contracts | (1,423,932 | ) | 3,604,482 | |||||
Net increase in net assets resulting from operations | 1,051,724 | 7,384,557 | ||||||
Distributions to shareholders from: | ||||||||
Net investment income | ||||||||
Class A | (5,221,120 | ) | (5,603,976 | ) | ||||
Class C | – | – | ||||||
Class F | (155,697 | ) | (63,710 | ) | ||||
Class I | (337 | ) | – | |||||
Total distributions to shareholders | (5,377,154 | ) | (5,667,686 | ) | ||||
Capital share transactions (Net of share conversions) (See Note 11): |
| |||||||
Net proceeds from sales of shares | 18,310,956 | 12,571,365 | ||||||
Reinvestment of distributions | 3,854,132 | 4,184,204 | ||||||
Cost of shares reacquired | (28,594,043 | ) | (19,721,180 | ) | ||||
Net increase (decrease) in net assets | (6,428,955 | ) | (2,965,611 | ) | ||||
Net increase (decrease) in net assets | (10,754,385 | ) | (1,248,740 | ) | ||||
NET ASSETS: | ||||||||
Beginning of year | $ | 128,497,413 | $ | 129,746,153 | ||||
End of year | $ | 117,743,028 | $ | 128,497,413 | ||||
Distributions in excess of net investment income | $ | (248,089 | ) | $ | (295,694 | ) | ||
See Notes to Financial Statements.
164
| New York | ||||||
| For the Year Ended September 30, 2011 | For the Year Ended September 30, 2010 | |||||
| $ | 11,949,237 | $ | 12,075,593 | |||
| 324,906 | (4,198,191 | ) | ||||
| (9,217,131 | ) | 8,877,188 | |||
| 3,057,012 | 16,754,590 | |||||
| (9,984,773 | ) | (10,256,225 | ) | |||
| (1,527,487 | ) | (1,502,128 | ) | |||
| (361,245 | ) | (248,163 | ) | |||
| (341 | ) | – | ||||
| (11,873,846 | ) | (12,006,516 | ) | |||
| 43,088,887 | 51,041,947 | |||||
| 7,403,914 | 8,315,058 | |||||
| (67,292,870 | ) | (47,966,880 | ) | |||
| (16,800,069 | ) | 11,390,125 | |||
| (25,616,903 | ) | 16,138,199 | ||||
| $ | 288,286,830 | $ | 272,148,631 | |||
| $ | 262,669,927 | $ | 288,286,830 | |||
| $ | (747,845 | ) | $ | (818,353 | ) | |
See Notes to Financial Statements.
165
Financial Highlights
SHORT DURATION TAX FREE FUND
| Class A Shares | ||||||||||||
| Year Ended 9/30 | 12/12/2008(a) to 9/30/2009 | |||||||||||
| 2011 | 2010 | |||||||||||
Per Share Operating Performance | ||||||||||||
Net asset value, beginning of period | $15.80 | $15.60 | $15.00 | |||||||||
|
|
|
|
|
| |||||||
Investment operations: | ||||||||||||
Net investment income(b) | .33 | .30 | .33 | |||||||||
Net realized and unrealized gain | .03 | .20 | .68 | |||||||||
|
|
|
|
|
| |||||||
Total from investment operations | .36 | .50 | 1.01 | |||||||||
|
|
|
|
|
| |||||||
Distributions to shareholders from: | ||||||||||||
Net investment income | (.33 | ) | (.30 | ) | (.41 | ) | ||||||
|
|
|
|
|
| |||||||
Net asset value, end of period | $15.83 | $15.80 | $15.60 | |||||||||
|
|
|
|
|
| |||||||
Total Return(c) | 2.30 | % | 3.24 | % | 6.82 | %(d) | ||||||
Ratios to Average Net Assets: | ||||||||||||
Expenses, excluding expense reductions and including management fee waived and expenses reimbursed | .59 | % | .55 | % | .44 | %(e) | ||||||
Expenses, excluding interest expense, including expense reductions, management fee waived and expenses reimbursed | .58 | %(f) | .55 | %(f) | .44 | %(e) | ||||||
Expenses, excluding expense reductions, management fee waived and expenses reimbursed | .70 | % | .70 | % | .75 | %(e) | ||||||
Net investment income | 2.08 | % | 1.91 | % | 2.68 | %(e) | ||||||
| Supplemental Data: | ||||||||||||
Net assets, end of period (000) | $1,249,341 | $1,326,511 | $609,072 | |||||||||
Portfolio turnover rate | 52.51 | % | 36.21 | % | 64.00 | % | ||||||
| (a) | Commencement of operations was 12/12/2008, SEC effective date was 12/10/2008 and date shares became available to the public was 1/2/2009. |
| (b) | Calculated using average shares outstanding during the period. |
| (c) | Total return does not consider the effects of sales loads and assumes the reinvestment of all distributions. |
| (d) | Not annualized. |
| (e) | Annualized. |
| (f) | Interest expense relates to the liability for floating rate notes issued in conjunction with tender option bond trusts. |
See Notes to Financial Statements.
166
Financial Highlights (continued)
SHORT DURATION TAX FREE FUND
| Class C Shares | ||||||||||||
| Year Ended 9/30 | 12/12/2008(a) 9/30/2009 | |||||||||||
| 2011 | 2010 | |||||||||||
Per Share Operating Performance | ||||||||||||
Net asset value, beginning of period | $15.80 | $15.60 | $15.00 | |||||||||
|
|
|
|
|
| |||||||
Investment operations: | ||||||||||||
Net investment income(b) | .21 | .18 | .23 | |||||||||
Net realized and unrealized gain | .03 | .19 | .68 | |||||||||
|
|
|
|
|
| |||||||
Total from investment operations | .24 | .37 | .91 | |||||||||
|
|
|
|
|
| |||||||
Distributions to shareholders from: | ||||||||||||
Net investment income | (.21 | ) | (.17 | ) | (.31 | ) | ||||||
|
|
|
|
|
| |||||||
Net asset value, end of period | $15.83 | $15.80 | $15.60 | |||||||||
|
|
|
|
|
| |||||||
Total Return(c) | 1.56 | % | 2.42 | % | 6.10 | %(d) | ||||||
Ratios to Average Net Assets: | ||||||||||||
Expenses, excluding expense reductions and including management fee waived and expenses reimbursed | 1.31 | % | 1.35 | % | 1.23 | %(e) | ||||||
Expenses, excluding interest expense, including expense reductions, management fee waived and expenses reimbursed | 1.31 | %(f) | 1.35 | %(f) | 1.23 | %(e) | ||||||
Expenses, excluding expense reductions, management fee waived and expenses reimbursed | 1.41 | % | 1.50 | % | 1.51 | %(e) | ||||||
Net investment income | 1.36 | % | 1.12 | % | 1.88 | %(e) | ||||||
| Supplemental Data: | ||||||||||||
Net assets, end of period (000) | $244,872 | $251,390 | $128,116 | |||||||||
Portfolio turnover rate | 52.51 | % | 36.21 | % | 64.00 | % | ||||||
| (a) | Commencement of operations was 12/12/2008, SEC effective date was 12/10/2008 and date shares first became available to the public was 1/2/2009. |
| (b) | Calculated using average shares outstanding during the period. |
| (c) | Total return does not consider the effects of sales loads and assumes the reinvestment of all distributions. |
| (d) | Not annualized. |
| (e) | Annualized. |
| (f) | Interest expense relates to the liability for floating rate notes issued in conjunction with tender option bond trusts. |
See Notes to Financial Statements.
167
Financial Highlights (continued)
SHORT DURATION TAX FREE FUND
| Class F Shares | ||||||||||||
| Year Ended 9/30 | 12/12/2008(a) 9/30/2009 | |||||||||||
| 2011 | 2010 | |||||||||||
Per Share Operating Performance | ||||||||||||
Net asset value, beginning of period | $15.80 | $15.60 | $15.00 | |||||||||
|
|
|
|
|
| |||||||
Investment operations: | ||||||||||||
Net investment income(b) | .34 | .32 | .36 | |||||||||
Net realized and unrealized gain | .03 | .20 | .66 | |||||||||
|
|
|
|
|
| |||||||
Total from investment operations | .37 | .52 | 1.02 | |||||||||
|
|
|
|
|
| |||||||
Distributions to shareholders from: | ||||||||||||
Net investment income | (.34 | ) | (.32 | ) | (.42 | ) | ||||||
|
|
|
|
|
| |||||||
Net asset value, end of period | $15.83 | $15.80 | $15.60 | |||||||||
|
|
|
|
|
| |||||||
Total Return(c) | 2.40 | % | 3.34 | % | 6.90 | %(d) | ||||||
Ratios to Average Net Assets: | ||||||||||||
Expenses, excluding expense reductions and including management fee waived and expenses reimbursed | .49 | % | .45 | % | .34 | %(e) | ||||||
Expenses, excluding interest expense, including expense reductions, management fee waived and expenses reimbursed | .48 | %(f) | .45 | %(f) | .34 | %(e) | ||||||
Expenses, excluding expense reductions, management fee waived and expenses reimbursed | .60 | % | .61 | % | .64 | %(e) | ||||||
Net investment income | 2.18 | % | 2.02 | % | 2.88 | %(e) | ||||||
| Supplemental Data: | ||||||||||||
Net assets, end of period (000) | $365,694 | $284,289 | $100,723 | |||||||||
Portfolio turnover rate | 52.51 | % | 36.21 | % | 64.00 | % | ||||||
| (a) | Commencement of operations was 12/12/2008, SEC effective date was 12/10/2008 and date shares became available to the public was 1/2/2009. |
| (b) | Calculated using average shares outstanding during the period. |
| (c) | Total return assumes the reinvestment of all distributions. |
| (d) | Not annualized. |
| (e) | Annualized. |
| (f) | Interest expense relates to the liability for floating rate notes issued in conjunction with tender option bond trusts. |
See Notes to Financial Statements.
168
Financial Highlights (concluded)
SHORT DURATION TAX FREE FUND
| Class I Shares | ||||||||||||
| Year Ended 9/30 | 12/12/2008(a) 9/30/2009 | |||||||||||
| 2011 | 2010 | |||||||||||
Per Share Operating Performance | ||||||||||||
Net asset value, beginning of period | $15.80 | $15.60 | $15.00 | |||||||||
|
|
|
|
|
| |||||||
Investment operations: | ||||||||||||
Net investment income(b) | .35 | .33 | .34 | |||||||||
Net realized and unrealized gain | .04 | .20 | .70 | |||||||||
|
|
|
|
|
| |||||||
Total from investment operations | .39 | .53 | 1.04 | |||||||||
|
|
|
|
|
| |||||||
Distributions to shareholders from: | ||||||||||||
Net investment income | (.36 | ) | (.33 | ) | (.44 | ) | ||||||
|
|
|
|
|
| |||||||
Net asset value, end of period | $15.83 | $15.80 | $15.60 | |||||||||
|
|
|
|
|
| |||||||
Total Return(c) | 2.48 | % | 3.43 | % | 7.04 | %(d) | ||||||
Ratios to Average Net Assets: | ||||||||||||
Expenses, excluding expense reductions and including management fee waived and expenses reimbursed | .39 | % | .35 | % | .25 | %(e) | ||||||
Expenses, excluding interest expense, including expense reductions, management fee waived and expenses reimbursed | .39 | %(f) | .34 | %(f) | .25 | %(e) | ||||||
Expenses, excluding expense reductions, management fee waived and expenses reimbursed | .49 | % | .50 | % | .57 | %(e) | ||||||
Net investment income | 2.22 | % | 2.11 | % | 2.71 | %(e) | ||||||
| Supplemental Data: | ||||||||||||
Net assets, end of period (000) | $6,330 | $2,221 | $3,407 | |||||||||
Portfolio turnover rate | 52.51 | % | 36.21 | % | 64.00 | % | ||||||
| (a) | Commencement of operations was 12/12/2008, SEC effective date was 12/10/2008 and date shares became available to the public was 1/2/2009. |
| (b) | Calculated using average shares outstanding during the period. |
| (c) | Total return assumes the reinvestment of all distributions. |
| (d) | Not annualized. |
| (e) | Annualized. |
| (f) | Interest expense relates to the liability for floating rate notes issued in conjunction with tender option bond trusts. |
See Notes to Financial Statements.
169
Financial Highlights
INTERMEDIATE TAX FREE FUND
| Class A Shares | ||||||||||||||||||||
| Year Ended 9/30 | ||||||||||||||||||||
| 2011 | 2010 | 2009 | 2008 | 2007 | ||||||||||||||||
Per Share Operating Performance | ||||||||||||||||||||
Net asset value, beginning of year | $10.52 | $10.28 | $ 9.42 | $9.75 | $9.81 | |||||||||||||||
|
|
|
|
|
|
|
|
|
| |||||||||||
Investment operations: | ||||||||||||||||||||
Net investment income(a) | .39 | .39 | .38 | .37 | .36 | |||||||||||||||
Net realized and unrealized gain (loss) | (.03 | ) | .23 | .86 | (.32 | ) | (.06 | ) | ||||||||||||
|
|
|
|
|
|
|
|
|
| |||||||||||
Total from investment operations | .36 | .62 | 1.24 | .05 | .30 | |||||||||||||||
|
|
|
|
|
|
|
|
|
| |||||||||||
Distributions to shareholders from: | ||||||||||||||||||||
Net investment income | (.39 | ) | (.38 | ) | (.38 | ) | (.38 | ) | (.36 | ) | ||||||||||
|
|
|
|
|
|
|
|
|
| |||||||||||
Net asset value, end of year | $10.49 | $10.52 | $10.28 | $9.42 | $9.75 | |||||||||||||||
|
|
|
|
|
|
|
|
|
| |||||||||||
Total Return(b) | 3.55 | % | 6.22 | % | 13.50 | % | .43 | % | 3.11 | % | ||||||||||
Ratios to Average Net Assets: | ||||||||||||||||||||
Expenses, excluding expense reductions and including management fee waived and expenses reimbursed | .65 | % | .63 | % | .44 | % | .27 | % | .27 | % | ||||||||||
Expenses, excluding interest expense, including expense reductions, management fee waived and expenses reimbursed(c) | .64 | % | .63 | % | .44 | % | .24 | % | .25 | % | ||||||||||
Expenses, excluding expense reductions, management fee waived and expenses reimbursed | .72 | % | .71 | % | .72 | % | .79 | % | 1.37 | % | ||||||||||
Net investment income | 3.82 | % | 3.76 | % | 3.89 | % | 3.80 | % | 3.68 | % | ||||||||||
| Supplemental Data: | ||||||||||||||||||||
Net assets, end of year (000) | $1,385,337 | $1,320,285 | $798,344 | $338,400 | $17,046 | |||||||||||||||
Portfolio turnover rate | 38.81 | % | 30.23 | % | 15.70 | % | 29.73 | % | 30.70 | % | ||||||||||
| (a) | Calculated using average shares outstanding during the year. |
| (b) | Total return does not consider the effects of sales loads and assumes the reinvestment of all distributions. |
| (c) | Interest expense relates to the liability for floating rate notes issued in conjunction with tender option bond trusts. |
See Notes to Financial Statements.
170
Financial Highlights (continued)
INTERMEDIATE TAX FREE FUND
| Class B Shares | ||||||||||||||||||||
| Year Ended 9/30 | ||||||||||||||||||||
| 2011 | 2010 | 2009 | 2008 | 2007 | ||||||||||||||||
Per Share Operating Performance | ||||||||||||||||||||
Net asset value, beginning of year | $10.51 | $10.27 | $ 9.41 | $9.74 | $9.80 | |||||||||||||||
|
|
|
|
|
|
|
|
|
| |||||||||||
Investment operations: | ||||||||||||||||||||
Net investment income(a) | .31 | .31 | .30 | .31 | .29 | |||||||||||||||
Net realized and unrealized gain | (.04 | ) | .23 | .87 | (.33 | ) | (.06 | ) | ||||||||||||
|
|
|
|
|
|
|
|
|
| |||||||||||
Total from investment operations | .27 | .54 | 1.17 | (.02 | ) | .23 | ||||||||||||||
|
|
|
|
|
|
|
|
|
| |||||||||||
Distributions to shareholders from: | ||||||||||||||||||||
Net investment income | (.30 | ) | (.30 | ) | (.31 | ) | (.31 | ) | (.29 | ) | ||||||||||
|
|
|
|
|
|
|
|
|
| |||||||||||
Net asset value, end of year | $10.48 | $10.51 | $10.27 | $9.41 | $9.74 | |||||||||||||||
|
|
|
|
|
|
|
|
|
| |||||||||||
Total Return(b) | 2.73 | % | 5.38 | % | 12.65 | % | (.29 | )% | 2.35 | % | ||||||||||
Ratios to Average Net Assets: | ||||||||||||||||||||
Expenses, excluding expense reductions and including management fee waived and expenses reimbursed | 1.45 | % | 1.43 | % | 1.24 | % | 1.02 | % | 1.02 | % | ||||||||||
Expenses, excluding interest expense, including expense reductions, management fee waived and expenses reimbursed(c) | 1.44 | % | 1.43 | % | 1.23 | % | 1.00 | % | 1.00 | % | ||||||||||
Expenses, excluding expense reductions, management fee waived and expenses reimbursed | 1.52 | % | 1.51 | % | 1.52 | % | 1.67 | % | 2.12 | % | ||||||||||
Net investment income | 3.03 | % | 2.98 | % | 3.10 | % | 3.15 | % | 2.95 | % | ||||||||||
| Supplemental Data: | ||||||||||||||||||||
Net assets, end of year (000) | $6,526 | $7,725 | $6,315 | $1,966 | $802 | |||||||||||||||
Portfolio turnover rate | 38.81 | % | 30.23 | % | 15.70 | % | 29.73 | % | 30.70 | % | ||||||||||
| (a) | Calculated using average shares outstanding during the year. |
| (b) | Total return does not consider the effects of sales loads and assumes the reinvestment of all distributions. |
| (c) | Interest expense relates to the liability for floating rate notes issued in conjunction with tender option bond trusts. |
See Notes to Financial Statements.
171
Financial Highlights (continued)
INTERMEDIATE TAX FREE FUND
| Class C Shares | ||||||||||||||||||||
| Year Ended 9/30 | ||||||||||||||||||||
| 2011 | 2010 | 2009 | 2008 | 2007 | ||||||||||||||||
Per Share Operating Performance | ||||||||||||||||||||
Net asset value, beginning of year | $10.51 | $10.27 | $ 9.41 | $9.74 | $9.80 | |||||||||||||||
|
|
|
|
|
|
|
|
|
| |||||||||||
Investment operations: | ||||||||||||||||||||
Net investment income(a) | .32 | .31 | .31 | .30 | .29 | |||||||||||||||
Net realized and unrealized gain | (.04 | ) | .24 | .87 | (.32 | ) | (.06 | ) | ||||||||||||
|
|
|
|
|
|
|
|
|
| |||||||||||
Total from investment operations | .28 | .55 | 1.18 | (.02 | ) | .23 | ||||||||||||||
|
|
|
|
|
|
|
|
|
| |||||||||||
Distributions to shareholders from: | ||||||||||||||||||||
Net investment income | (.31 | ) | (.31 | ) | (.32 | ) | (.31 | ) | (.29 | ) | ||||||||||
|
|
|
|
|
|
|
|
|
| |||||||||||
Net asset value, end of year | $10.48 | $10.51 | $10.27 | $9.41 | $9.74 | |||||||||||||||
|
|
|
|
|
|
|
|
|
| |||||||||||
Total Return(b) | 2.81 | % | 5.44 | % | 12.76 | % | (.31 | )% | 2.35 | % | ||||||||||
Ratios to Average Net Assets: | ||||||||||||||||||||
Expenses, excluding expense reductions and including management fee waived and expenses reimbursed | 1.37 | % | 1.37 | % | 1.10 | % | 1.02 | % | 1.02 | % | ||||||||||
Expenses, excluding interest expense, including expense reductions, management fee waived and expenses reimbursed(c) | 1.36 | % | 1.37 | % | 1.09 | % | .98 | % | 1.00 | % | ||||||||||
Expenses, excluding expense reductions, management fee waived and expenses reimbursed | 1.43 | % | 1.46 | % | 1.47 | % | 1.45 | % | 2.02 | % | ||||||||||
Net investment income | 3.10 | % | 3.01 | % | 3.22 | % | 3.11 | % | 2.95 | % | ||||||||||
| Supplemental Data: | ||||||||||||||||||||
Net assets, end of year (000) | $453,520 | $391,138 | $180,270 | $44,402 | $4,249 | |||||||||||||||
Portfolio turnover rate | 38.81 | % | 30.23 | % | 15.70 | % | 29.73 | % | 30.70 | % | ||||||||||
| (a) | Calculated using average shares outstanding during the year. |
| (b) | Total return does not consider the effects of sales loads and assumes the reinvestment of all distributions. |
| (c) | Interest expense relates to the liability for floating rate notes issued in conjunction with tender option bond trusts. |
See Notes to Financial Statements.
172
Financial Highlights (continued)
INTERMEDIATE TAX FREE FUND
| Class F Shares | ||||||||||||||||||||
| Year Ended 9/30 | 9/28/2007(a) 9/30/2007 | |||||||||||||||||||
| 2011 | 2010 | 2009 | 2008 | |||||||||||||||||
Per Share Operating Performance | ||||||||||||||||||||
Net asset value, beginning of period | $10.52 | $10.28 | $ 9.42 | $9.75 | $9.75 | |||||||||||||||
|
|
|
|
|
|
|
|
|
| |||||||||||
Investment operations: | ||||||||||||||||||||
Net investment income(b) | .40 | .40 | .38 | .39 | – | (c) | ||||||||||||||
Net realized and unrealized gain | (.03 | ) | .23 | .87 | (.33 | ) | – | (c) | ||||||||||||
|
|
|
|
|
|
|
|
|
| |||||||||||
Total from investment operations | .37 | .63 | 1.25 | .06 | – | (c) | ||||||||||||||
|
|
|
|
|
|
|
|
|
| |||||||||||
Distributions to shareholders from: | ||||||||||||||||||||
Net investment income | (.40 | ) | (.39 | ) | (.39 | ) | (.39 | ) | – | |||||||||||
|
|
|
|
|
|
|
|
|
| |||||||||||
Net asset value, end of period | $10.49 | $10.52 | $10.28 | $9.42 | $9.75 | |||||||||||||||
|
|
|
|
|
|
|
|
|
| |||||||||||
Total Return(d) | 3.66 | % | 6.33 | % | 13.61 | % | .57 | % | .00 | % | ||||||||||
Ratios to Average Net Assets: | ||||||||||||||||||||
Expenses, excluding expense reductions and including management fee waived and expenses reimbursed | .55 | % | .53 | % | .40 | % | .13 | % | .00 | %(e)(f) | ||||||||||
Expenses, excluding interest expense, including expense reductions, management fee waived and expenses reimbursed(g) | .54 | % | .53 | % | .39 | % | .10 | % | .00 | %(e)(f) | ||||||||||
Expenses, excluding expense reductions, management fee waived and expenses reimbursed | .62 | % | .61 | % | .64 | % | .67 | % | .00 | %(e)(f) | ||||||||||
Net investment income | 3.92 | % | 3.86 | % | 3.90 | % | 3.97 | % | .00 | %(e)(f) | ||||||||||
| Supplemental Data: | ||||||||||||||||||||
Net assets, end of period (000) | $547,652 | $307,256 | $103,873 | $1,460 | $10 | |||||||||||||||
Portfolio turnover rate | 38.81 | % | 30.23 | % | 15.70 | % | 29.73 | % | 30.70 | % | ||||||||||
| (a) | Commencement of operations was 9/28/2007, SEC effective date was 9/14/2007 and date shares first became available to the public was 10/1/2007. |
| (b) | Calculated using average shares outstanding during the period. |
| (c) | Amount is less than $.01. |
| (d) | Total return assumes the reinvestment of all distributions. |
| (e) | Not annualized. |
| (f) | Amount is less than .01%. |
| (g) | Interest expense relates to the liability for floating rate notes issued in conjunction with tender option bond trusts. |
See Notes to Financial Statements.
173
Financial Highlights (continued)
INTERMEDIATE TAX FREE FUND
| Class I Shares | ||||
| 1/31/2011(a) to 9/30/2011 | ||||
Per Share Operating Performance | ||||
Net asset value, beginning of period | $9.96 | |||
|
| |||
Investment operations: | ||||
Net investment income(b) | – | (c) | ||
Net realized and unrealized loss | (.01 | ) | ||
|
| |||
Total from investment operations | (.01 | ) | ||
|
| |||
Net asset value on SEC Effective Date, 2/1/2011 | $9.95 | |||
|
| |||
Investment operations: | ||||
Net investment income(b) | .27 | |||
Net realized and unrealized gain | .55 | (d) | ||
|
| |||
Total from investment operations | .82 | |||
|
| |||
Distributions to shareholders from: | ||||
Net investment income | (.27 | ) | ||
|
| |||
Net asset value, end of period | $10.50 | |||
|
| |||
Total Return(e) | 8.26 | %(f)(g) | ||
Total Return(e) | 8.35 | %(f)(h) | ||
Ratios to Average Net Assets: | ||||
Expenses, excluding expense reductions and including management fee waived and expenses reimbursed | .45 | %(i) | ||
Expenses, excluding interest expense, including expense reductions, management fee waived and expenses reimbursed(j) | .44 | %(i) | ||
Expenses, excluding expense reductions, management fee waived and expenses | .54 | %(i) | ||
Net investment income | 3.81 | %(i) | ||
| Supplemental Data: | ||||
Net assets, end of period (000) | $2,572 | |||
Portfolio turnover rate | 38.81 | % | ||
| (a) | Commencement of operations was 1/31/2011, SEC effective date and date shares first became available to the public was 2/1/2011. |
| (b) | Calculated using average shares outstanding during the period. |
| (c) | Amount is less than $.01. |
| (d) | The per share amount does not represent the net realized and unrealized gain (loss) as presented on the Statements of Operations for the period due to the timing of sales of Fund shares and the amount of per share realized and unrealized gains and losses at such time. |
| (e) | Total return assumes the reinvestment of all distributions. |
| (f) | Not annualized. |
| (g) | Total return for the period 1/31/2011 through 9/30/2011. |
| (h) | Total return for the period 2/1/2011 through 9/30/2011. |
| (i) | Annualized. |
| (j) | Interest expense relates to the liability for floating rate notes issued in conjunction with tender option bond trusts. |
See Notes to Financial Statements.
174
Financial Highlights (concluded)
INTERMEDIATE TAX FREE FUND
| Class P Shares | ||||||||||||||||||||
| Year Ended 9/30 | ||||||||||||||||||||
| 2011 | 2010 | 2009 | 2008 | 2007 | ||||||||||||||||
Per Share Operating Performance | ||||||||||||||||||||
Net asset value, beginning of year | $10.52 | $10.28 | $ 9.42 | $9.75 | $9.81 | |||||||||||||||
|
|
|
|
|
|
|
|
|
| |||||||||||
Investment operations: | ||||||||||||||||||||
Net investment income(a) | .37 | .36 | .36 | .36 | .34 | |||||||||||||||
Net realized and unrealized gain | (.03 | ) | .24 | .86 | (.33 | ) | (.06 | ) | ||||||||||||
|
|
|
|
|
|
|
|
|
| |||||||||||
Total from investment operations | .34 | .60 | 1.22 | .03 | .28 | |||||||||||||||
|
|
|
|
|
|
|
|
|
| |||||||||||
Distributions to shareholders from: | ||||||||||||||||||||
Net investment income | (.36 | ) | (.36 | ) | (.36 | ) | (.36 | ) | (.34 | ) | ||||||||||
|
|
|
|
|
|
|
|
|
| |||||||||||
Net asset value, end of year | $10.50 | $10.52 | $10.28 | $9.42 | $9.75 | |||||||||||||||
|
|
|
|
|
|
|
|
|
| |||||||||||
Total Return(b) | 3.41 | % | 5.99 | % | 13.27 | % | .29 | % | 2.91 | % | ||||||||||
Ratios to Average Net Assets: | ||||||||||||||||||||
Expenses, excluding expense | .89 | % | .86 | % | .65 | % | .46 | % | .47 | % | ||||||||||
Expenses, excluding interest expense, | .88 | % | .86 | % | .64 | % | .43 | % | .45 | % | ||||||||||
Expenses, excluding expense | .96 | % | .94 | % | .96 | % | 1.13 | % | 1.57 | % | ||||||||||
Net investment income | 3.60 | % | 3.56 | % | 3.73 | % | 3.73 | % | 3.49 | % | ||||||||||
| Supplemental Data: | ||||||||||||||||||||
Net assets, end of year (000) | $14 | $13 | $13 | $11 | $11 | |||||||||||||||
Portfolio turnover rate | 38.81 | % | 30.23 | % | 15.70 | % | 29.73 | % | 30.70 | % | ||||||||||
| (a) | Calculated using average shares outstanding during the year. |
| (b) | Total return assumes the reinvestment of all distributions. |
| (c) | Interest expense relates to the liability for floating rate notes issued in conjunction with tender option bond trusts. |
See Notes to Financial Statements.
175
Financial Highlights
AMT FREE MUNICIPAL BOND FUND
| Class A Shares | ||||
| 10/26/2010(a) to 9/30/2011 | ||||
Per Share Operating Performance | ||||
Net asset value, beginning of period | $15.00 | |||
|
| |||
Investment operations: | ||||
Net investment income(b) | .65 | |||
Net realized and unrealized gain | .05 | |||
|
| |||
Total from investment operations | .70 | |||
|
| |||
Distributions to shareholders from: | ||||
Net investment income | (.62 | ) | ||
|
| |||
Net asset value, end of period | $15.08 | |||
|
| |||
Total Return(c) | 4.90 | %(d) | ||
Ratios to Average Net Assets: | ||||
Expenses, excluding expense reductions and including management fee waived and expenses reimbursed | .50 | %(e) | ||
Expenses, excluding interest expense, including expense reductions, management fee waived and expenses reimbursed(f) | .50 | %(e) | ||
Expenses, excluding expense reductions, management fee waived and expenses reimbursed | 1.13 | %(e) | ||
Net investment income | 4.81 | %(e) | ||
| Supplemental Data: | ||||
Net assets, end of period (000) | $62,280 | |||
Portfolio turnover rate | 54.63 | % | ||
| (a) | Commencement of operations and SEC effective date was 10/26/2010 and date shares first became available to the public was 11/1/2010. |
| (b) | Calculated using average shares outstanding during the period. |
| (c) | Total return does not consider the effects of sales loads and assumes the reinvestment of all distributions. |
| (d) | Not annualized. |
| (e) | Annualized. |
| (f) | Interest expense relates to the liability for floating rate notes issued in conjunction with tender option bond trusts. |
See Notes to Financial Statements.
176
Financial Highlights (continued)
AMT FREE MUNICIPAL BOND FUND
| Class C Shares | ||||
| 10/26/2010(a) to 9/30/2011 | ||||
Per Share Operating Performance | ||||
Net asset value, beginning of period | $15.00 | |||
|
| |||
Investment operations: | ||||
Net investment income(b) | .54 | |||
Net realized and unrealized gain | .04 | |||
|
| |||
Total from investment operations | .58 | |||
|
| |||
Distributions to shareholders from: | ||||
Net investment income | (.51 | ) | ||
|
| |||
Net asset value, end of period | $15.07 | |||
|
| |||
Total Return(c) | 4.03 | %(d) | ||
Ratios to Average Net Assets: | ||||
Expenses, excluding expense reductions and including management fee waived and expenses reimbursed | 1.29 | %(e) | ||
Expenses, excluding interest expense, including expense reductions, management fee waived and expenses reimbursed(f) | 1.29 | %(e) | ||
Expenses, excluding expense reductions, management fee waived and expenses reimbursed | 1.84 | %(e) | ||
Net investment income | 3.97 | %(e) | ||
| Supplemental Data: | ||||
Net assets, end of period (000) | $2,532 | |||
Portfolio turnover rate | 54.63 | % | ||
| (a) | Commencement of operations and SEC effective date was 10/26/2010 and date shares first became available to the public was 11/1/2010. |
| (b) | Calculated using average shares outstanding during the period. |
| (c) | Total return does not consider the effects of sales loads and assumes the reinvestment of all distributions. |
| (d) | Not annualized. |
| (e) | Annualized. |
| (f) | Interest expense relates to the liability for floating rate notes issued in conjunction with tender option bond trusts. |
See Notes to Financial Statements.
177
Financial Highlights (continued)
AMT FREE MUNICIPAL BOND FUND
| Class F Shares | ||||
| 10/26/2010(a) to 9/30/2011 | ||||
Per Share Operating Performance | ||||
Net asset value, beginning of period | $15.00 | |||
|
| |||
Investment operations: | ||||
Net investment income(b) | .67 | |||
Net realized and unrealized gain | .05 | |||
|
| |||
Total from investment operations | .72 | |||
|
| |||
Distributions to shareholders from: | ||||
Net investment income | (.63 | ) | ||
|
| |||
Net asset value, end of period | $15.09 | |||
|
| |||
Total Return(c) | 5.04 | %(d) | ||
Ratios to Average Net Assets: | ||||
Expenses, excluding expense reductions and including management fee waived and expenses reimbursed | .40 | %(e) | ||
Expenses, excluding interest expense, including expense reductions, management fee waived and expenses reimbursed(f) | .39 | %(e) | ||
Expenses, excluding expense reductions, management fee waived and expenses reimbursed | .90 | %(e) | ||
Net investment income | 4.85 | %(e) | ||
| Supplemental Data: | ||||
Net assets, end of period (000) | $3,769 | |||
Portfolio turnover rate | 54.63 | % | ||
| (a) | Commencement of operations and SEC effective date was 10/26/2010 and date shares first became available to the public was 11/1/2010. |
| (b) | Calculated using average shares outstanding during the period. |
| (c) | Total return assumes the reinvestment of all distributions. |
| (d) | Not annualized. |
| (e) | Annualized. |
| (f) | Interest expense relates to the liability for floating rate notes issued in conjunction with tender option bond trusts. |
See Notes to Financial Statements.
178
Financial Highlights (concluded)
AMT FREE MUNICIPAL BOND FUND
| Class I Shares | ||||
| 10/26/2010(a) to 9/30/2011 | ||||
Per Share Operating Performance | ||||
Net asset value, beginning of period | $15.00 | |||
|
| |||
Investment operations: | ||||
Net investment income(b) | .66 | |||
Net realized and unrealized gain | .07 | |||
|
| |||
Total from investment operations | .73 | |||
|
| |||
Distributions to shareholders from: | ||||
Net investment income | (.65 | ) | ||
|
| |||
Net asset value, end of period | $15.08 | |||
|
| |||
Total Return(c) | 5.13 | %(d) | ||
Ratios to Average Net Assets: | ||||
Expenses, excluding expense reductions and including management fee waived and expenses reimbursed | .29 | %(e) | ||
Expenses, excluding interest expense, including expense reductions, management fee waived and expenses reimbursed(f) | .29 | %(e) | ||
Expenses, excluding expense reductions, management fee waived and expenses reimbursed | 2.12 | %(e) | ||
Net investment income | 4.91 | %(e) | ||
| Supplemental Data: | ||||
Net assets, end of period (000) | $11 | |||
Portfolio turnover rate | 54.63 | % | ||
| (a) | Commencement of operations and SEC effective date was 10/26/2010 and date shares first became available to the public was 11/1/2010. |
| (b) | Calculated using average shares outstanding during the period. |
| (c) | Total return assumes the reinvestment of all distributions. |
| (d) | Not annualized. |
| (e) | Annualized. |
| (f) | Interest expense relates to the liability for floating rate notes issued in conjunction with tender option bond trusts. |
See Notes to Financial Statements.
179
Financial Highlights
NATIONAL TAX FREE FUND
| Class A Shares | ||||||||||||||||||||
| Year Ended 9/30 | ||||||||||||||||||||
| 2011 | 2010 | 2009 | 2008 | 2007 | ||||||||||||||||
Per Share Operating Performance |
| |||||||||||||||||||
Net asset value, beginning of year | $10.84 | $10.62 | $ 9.71 | $11.12 | $11.52 | |||||||||||||||
|
|
|
|
|
|
|
|
|
| |||||||||||
Investment operations: | ||||||||||||||||||||
Net investment income(a) | .52 | .54 | .52 | .51 | .49 | |||||||||||||||
Net realized and unrealized gain | (.31 | ) | .21 | .90 | (1.41 | ) | (.40 | ) | ||||||||||||
|
|
|
|
|
|
|
|
|
| |||||||||||
Total from investment operations | .21 | .75 | 1.42 | (.90 | ) | .09 | ||||||||||||||
|
|
|
|
|
|
|
|
|
| |||||||||||
Distributions to shareholders from: | ||||||||||||||||||||
Net investment income | (.52 | ) | (.53 | ) | (.51 | ) | (.51 | ) | (.49 | ) | ||||||||||
|
|
|
|
|
|
|
|
|
| |||||||||||
Net asset value, end of year | $10.53 | $10.84 | $10.62 | $ 9.71 | $11.12 | |||||||||||||||
|
|
|
|
|
|
|
|
|
| |||||||||||
Total Return(b) | 2.15 | % | 7.34 | % | 15.40 | % | (8.41 | )% | .79 | % | ||||||||||
Ratios to Average Net Assets: | ||||||||||||||||||||
Expenses, excluding expense reductions and including | .83 | % | .86 | % | .92 | % | 1.05 | % | 1.18 | % | ||||||||||
Expenses, excluding interest expense, including expense reductions | .76 | % | .77 | % | .77 | % | .79 | % | .77 | % | ||||||||||
Expenses, excluding expense reductions and expenses reimbursed | .83 | % | .86 | % | .92 | % | 1.06 | % | 1.27 | % | ||||||||||
Net investment income | 5.12 | % | 5.12 | % | 5.49 | % | 4.77 | % | 4.34 | % | ||||||||||
| Supplemental Data: | ||||||||||||||||||||
Net assets, end of year (000) | $1,406,579 | $1,007,123 | $889,665 | $740,198 | $525,513 | |||||||||||||||
Portfolio turnover rate | 87.43 | % | 63.31 | % | 45.22 | % | 88.15 | % | 49.43 | % | ||||||||||
| (a) | Calculated using average shares outstanding during the year. |
| (b) | Total return does not consider the effects of sales loads and assumes the reinvestment of all distributions. |
| (c) | Interest expense relates to the liability for floating rate notes issued in conjunction with tender option bond trusts. |
See Notes to Financial Statements.
180
Financial Highlights (continued)
NATIONAL TAX FREE FUND
| Class B Shares | ||||||||||||||||||||
| Year Ended 9/30 | ||||||||||||||||||||
| 2011 | 2010 | 2009 | 2008 | 2007 | ||||||||||||||||
Per Share Operating Performance |
| |||||||||||||||||||
Net asset value, beginning of year | $10.90 | $10.68 | $ 9.75 | $11.16 | $11.56 | |||||||||||||||
|
|
|
|
|
|
|
|
|
| |||||||||||
Investment operations: | ||||||||||||||||||||
Net investment income(a) | .45 | .46 | .45 | .42 | .41 | |||||||||||||||
Net realized and unrealized gain | (.33 | ) | .21 | .91 | (1.41 | ) | (.40 | ) | ||||||||||||
|
|
|
|
|
|
|
|
|
| |||||||||||
Total from investment operations | .12 | .67 | 1.36 | (.99 | ) | .01 | ||||||||||||||
|
|
|
|
|
|
|
|
|
| |||||||||||
Distributions to shareholders from: | ||||||||||||||||||||
Net investment income | (.44 | ) | (.45 | ) | (.43 | ) | (.42 | ) | (.41 | ) | ||||||||||
|
|
|
|
|
|
|
|
|
| |||||||||||
Net asset value, end of year | $10.58 | $10.90 | $10.68 | $ 9.75 | $11.16 | |||||||||||||||
|
|
|
|
|
|
|
|
|
| |||||||||||
Total Return(b) | 1.26 | % | 6.48 | % | 14.48 | % | (9.08 | )% | .08 | % | ||||||||||
Ratios to Average Net Assets: | ||||||||||||||||||||
Expenses, excluding expense | 1.64 | % | 1.66 | % | 1.72 | % | 1.85 | % | 1.90 | % | ||||||||||
Expenses, excluding interest expense, including expense reductions | 1.57 | % | 1.57 | % | 1.57 | % | 1.58 | % | 1.49 | % | ||||||||||
Expenses, excluding expense | 1.64 | % | 1.66 | % | 1.72 | % | 1.86 | % | 1.99 | % | ||||||||||
Net investment income | 4.31 | % | 4.33 | % | 4.70 | % | 3.94 | % | 3.61 | % | ||||||||||
| Supplemental Data: | ||||||||||||||||||||
Net assets, end of year (000) | $9,190 | $16,143 | $18,540 | $18,032 | $23,502 | |||||||||||||||
Portfolio turnover rate | 87.43 | % | 63.31 | % | 45.22 | % | 88.15 | % | 49.43 | % | ||||||||||
| (a) | Calculated using average shares outstanding during the year. |
| (b) | Total return does not consider the effects of sales loads and assumes the reinvestment of all distributions. |
| (c) | Interest expense relates to the liability for floating rate notes issued in conjunction with tender option bond trusts. |
See Notes to Financial Statements.
181
Financial Highlights (continued)
NATIONAL TAX FREE FUND
| Class C Shares | ||||||||||||||||||||
| Year Ended 9/30 | ||||||||||||||||||||
| 2011 | 2010 | 2009 | 2008 | 2007 | ||||||||||||||||
Per Share Operating Performance | ||||||||||||||||||||
Net asset value, beginning of year | $10.86 | $10.63 | $ 9.73 | $11.15 | $11.54 | |||||||||||||||
|
|
|
|
|
|
|
|
|
| |||||||||||
Investment operations: | ||||||||||||||||||||
Net investment income(a) | .46 | .46 | .46 | .44 | .42 | |||||||||||||||
Net realized and unrealized gain | (.33 | ) | .23 | .89 | (1.41 | ) | (.39 | ) | ||||||||||||
|
|
|
|
|
|
|
|
|
| |||||||||||
Total from investment operations | .13 | .69 | 1.35 | (.97 | ) | .03 | ||||||||||||||
|
|
|
|
|
|
|
|
|
| |||||||||||
Distributions to shareholders from: | ||||||||||||||||||||
Net investment income | (.45 | ) | (.46 | ) | (.45 | ) | (.45 | ) | (.42 | ) | ||||||||||
|
|
|
|
|
|
|
|
|
| |||||||||||
Net asset value, end of year | $10.54 | $10.86 | $10.63 | $ 9.73 | $11.15 | |||||||||||||||
|
|
|
|
|
|
|
|
|
| |||||||||||
Total Return(b) | 1.38 | % | 6.69 | % | 14.58 | % | (9.01 | )% | .23 | % | ||||||||||
Ratios to Average Net Assets: | ||||||||||||||||||||
Expenses, excluding expense | 1.50 | % | 1.56 | % | 1.59 | % | 1.67 | % | 1.82 | % | ||||||||||
Expenses, excluding interest expense, including expense reductions | 1.43 | % | 1.47 | % | 1.45 | % | 1.41 | % | 1.41 | % | ||||||||||
Expenses, excluding expense | 1.50 | % | 1.56 | % | 1.59 | % | 1.68 | % | 1.91 | % | ||||||||||
Net investment income | 4.44 | % | 4.40 | % | 4.78 | % | 4.13 | % | 3.70 | % | ||||||||||
| Supplemental Data: | ||||||||||||||||||||
Net assets, end of year (000) | $158,714 | $181,209 | $133,922 | $80,301 | $51,244 | |||||||||||||||
Portfolio turnover rate | 87.43 | % | 63.31 | % | 45.22 | % | 88.15 | % | 49.43 | % | ||||||||||
| (a) | Calculated using average shares outstanding during the year. |
| (b) | Total return does not consider the effects of sales loads and assumes the reinvestment of all distributions. |
| (c) | Interest expense relates to the liability for floating rate notes issued in conjunction with tender option bond trusts. |
See Notes to Financial Statements.
182
Financial Highlights (continued)
NATIONAL TAX FREE FUND
| Class F Shares | ||||||||||||||||||||
| Year Ended 9/30 | 9/28/2007(a) 9/30/2007 | |||||||||||||||||||
| 2011 | 2010 | 2009 | 2008 | |||||||||||||||||
Per Share Operating Performance | ||||||||||||||||||||
Net asset value, beginning of period | $10.83 | $10.61 | $ 9.71 | $11.12 | $11.12 | |||||||||||||||
|
|
|
|
|
|
|
|
|
| |||||||||||
Investment operations: | ||||||||||||||||||||
Net investment income(b) | .53 | .55 | .53 | .52 | – | (c) | ||||||||||||||
Net realized and unrealized gain | (.31 | ) | .21 | .89 | (1.41 | ) | – | (c) | ||||||||||||
|
|
|
|
|
|
|
|
|
| |||||||||||
Total from investment operations | .22 | .76 | 1.42 | (.89 | ) | – | (c) | |||||||||||||
|
|
|
|
|
|
|
|
|
| |||||||||||
Distributions to shareholders from: | ||||||||||||||||||||
Net investment income | (.53 | ) | (.54 | ) | (.52 | ) | (.52 | ) | – | |||||||||||
|
|
|
|
|
|
|
|
|
| |||||||||||
Net asset value, end of period | $10.52 | $10.83 | $10.61 | $ 9.71 | $11.12 | |||||||||||||||
|
|
|
|
|
|
|
|
|
| |||||||||||
Total Return(d) | 2.24 | % | 7.43 | % | 15.44 | % | (8.32 | )% | .00 | % | ||||||||||
Ratios to Average Net Assets: | ||||||||||||||||||||
Expenses, excluding expense | .73 | % | .76 | % | .81 | % | .95 | % | .00 | %(e)(f) | ||||||||||
Expenses, excluding interest expense, including expense reductions | .66 | % | .66 | % | .67 | % | .69 | % | .00 | %(e)(f) | ||||||||||
Expenses, excluding expense | .73 | % | .76 | % | .81 | % | .97 | % | .00 | %(e)(f) | ||||||||||
Net investment income | 5.21 | % | 5.18 | % | 5.45 | % | 5.00 | % | .00 | %(e)(f) | ||||||||||
| Supplemental Data: | ||||||||||||||||||||
Net assets, end of period (000) | $73,983 | $62,200 | $28,791 | $2,310 | $10 | |||||||||||||||
Portfolio turnover rate | 87.43 | % | 63.31 | % | 45.22 | % | 88.15 | % | 49.43 | % | ||||||||||
| (a) | Commencement of operations was 9/28/2007, SEC effective date was 9/14/2007 and date shares first became available to the public was 10/1/2007. |
| (b) | Calculated using average shares outstanding during the period. |
| (c) | Amount is less than $.01. |
| (d) | Total return assumes the reinvestment of all distributions. |
| (e) | Not annualized. |
| (f) | Amount is less than .01%. |
| (g) | Interest expense relates to the liability for floating rate notes issued in conjunction with tender option bond trusts. |
See Notes to Financial Statements.
183
Financial Highlights (concluded)
NATIONAL TAX FREE FUND
| Class I Shares | ||||||||
| Year Ended 9/30/2011 | 7/26/2010(a) to 9/30/2010 | |||||||
Per Share Operating Performance | ||||||||
Net asset value, beginning of period | $10.84 | $10.59 | ||||||
|
|
|
| |||||
Investment operations: | ||||||||
Net investment income(b) | .55 | .10 | ||||||
Net realized and unrealized gain (loss) | (.32 | ) | .25 | |||||
|
|
|
| |||||
Total from investment operations | .23 | .35 | ||||||
|
|
|
| |||||
Distributions to shareholders from: | ||||||||
Net investment income | (.54 | ) | (.10 | ) | ||||
|
|
|
| |||||
Net asset value, end of period | $10.53 | $10.84 | ||||||
|
|
|
| |||||
Total Return(c) | 2.40 | % | 3.31 | %(d) | ||||
Ratios to Average Net Assets: | ||||||||
Expenses, excluding interest expense and including expense reductions(e) | .54 | % | .55 | %(f) | ||||
Expenses, excluding expense reductions | .61 | % | .64 | %(f) | ||||
Net investment income | 5.35 | % | 5.21 | %(f) | ||||
| Supplemental Data: | ||||||||
Net assets, end of period (000) | $11 | $10 | ||||||
Portfolio turnover rate | 87.43 | % | 63.31 | % | ||||
| (a) | Commencement of operations was 7/26/2010 and the SEC effective date was 4/30/2007. |
| (b) | Calculated using average shares outstanding during the period. |
| (c) | Total return assumes the reinvestment of all distributions. |
| (d) | Not annualized. |
| (e) | Interest expense relates to the liability for floating rate notes issued in conjunction with tender option bond trusts. |
| (f) | Annualized. |
See Notes to Financial Statements.
184
Financial Highlights
HIGH YIELD MUNICIPAL BOND FUND
| Class A Shares | ||||||||||||||||||||
| Year Ended 9/30 | ||||||||||||||||||||
| 2011 | 2010 | 2009 | 2008 | 2007 | ||||||||||||||||
Per Share Operating Performance |
| |||||||||||||||||||
Net asset value, beginning of year | $11.81 | $11.49 | $11.89 | $15.03 | $15.81 | |||||||||||||||
|
|
|
|
|
|
|
|
|
| |||||||||||
Investment operations: | ||||||||||||||||||||
Net investment income(a) | .69 | .67 | .72 | .75 | .75 | |||||||||||||||
Net realized and unrealized gain | (.77 | ) | .31 | (.37 | )(b) | (3.13 | ) | (.77 | ) | |||||||||||
|
|
|
|
|
|
|
|
|
| |||||||||||
Total from investment operations | (.08 | ) | .98 | .35 | (2.38 | ) | (.02 | ) | ||||||||||||
|
|
|
|
|
|
|
|
|
| |||||||||||
Distributions to shareholders from: | ||||||||||||||||||||
Net investment income | (.67 | ) | (.66 | ) | (.75 | ) | (.76 | ) | (.76 | ) | ||||||||||
|
|
|
|
|
|
|
|
|
| |||||||||||
Net asset value, end of year | $11.06 | $11.81 | $11.49 | $11.89 | $15.03 | |||||||||||||||
|
|
|
|
|
|
|
|
|
| |||||||||||
Total Return(c) | (.46 | )% | 8.88 | % | 4.14 | % | (16.33 | )% | (.23 | )% | ||||||||||
Ratios to Average Net Assets: | ||||||||||||||||||||
Expenses, excluding expense | .89 | % | .91 | % | 1.03 | % | 1.27 | % | 1.31 | % | ||||||||||
Expenses, excluding interest expense, including expense reductions and expenses reimbursed(d) | .82 | % | .80 | % | .84 | % | .79 | % | .67 | % | ||||||||||
Expenses, excluding expense reductions and expenses | .89 | % | .91 | % | 1.03 | % | 1.30 | % | 1.52 | % | ||||||||||
Net investment income | 6.24 | % | 5.88 | % | 7.13 | % | 5.50 | % | 4.75 | % | ||||||||||
| Supplemental Data: | ||||||||||||||||||||
Net assets, end of year (000) | $919,758 | $1,236,637 | $976,708 | $695,723 | $959,170 | |||||||||||||||
Portfolio turnover rate | 40.94 | % | 37.68 | % | 32.88 | % | 47.95 | % | 24.92 | % | ||||||||||
| (a) | Calculated using average shares outstanding during the year. |
| (b) | The per share amount does not represent the net realized and unrealized gain (loss) as presented on the Statements of Operations for the period due to the timing of sales of Fund shares and the amount of per share realized and unrealized gains and losses at such time. |
| (c) | Total return does not consider the effects of sales loads and assumes the reinvestment of all distributions. |
| (d) | Interest expense relates to the liability for floating rate notes issued in conjunction with tender option bond trusts. |
See Notes to Financial Statements.
185
Financial Highlights (continued)
HIGH YIELD MUNICIPAL BOND FUND
| Class B Shares | ||||||||||||||||||||
| Year Ended 9/30 | ||||||||||||||||||||
| 2011 | 2010 | 2009 | 2008 | 2007 | ||||||||||||||||
Per Share Operating Performance |
| |||||||||||||||||||
Net asset value, beginning of year | $11.82 | $11.51 | $11.91 | $15.03 | $15.81 | |||||||||||||||
|
| �� |
|
|
|
|
|
|
| |||||||||||
Investment operations: | ||||||||||||||||||||
Net investment income(a) | .61 | .59 | .66 | .70 | .68 | |||||||||||||||
Net realized and unrealized gain | (.77 | ) | .30 | (.39 | )(b) | (3.14 | ) | (.78 | ) | |||||||||||
|
|
|
|
|
|
|
|
|
| |||||||||||
Total from investment operations | (.16 | ) | .89 | .27 | (2.44 | ) | (.10 | ) | ||||||||||||
|
|
|
|
|
|
|
|
|
| |||||||||||
Distributions to shareholders from: | ||||||||||||||||||||
Net investment income | (.59 | ) | (.58 | ) | (.67 | ) | (.68 | ) | (.68 | ) | ||||||||||
|
|
|
|
|
|
|
|
|
| |||||||||||
Net asset value, end of year | $11.07 | $11.82 | $11.51 | $11.91 | $15.03 | |||||||||||||||
|
|
|
|
|
|
|
|
|
| |||||||||||
Total Return(c) | (1.19 | )% | 7.97 | % | 3.46 | % | (16.70 | )% | (.74 | )% | ||||||||||
Ratios to Average Net Assets: | ||||||||||||||||||||
Expenses, excluding expense | 1.66 | % | 1.68 | % | 1.78 | % | 1.74 | % | 1.77 | % | ||||||||||
Expenses, excluding interest expense, including expense reductions | 1.59 | % | 1.57 | % | 1.60 | % | 1.26 | % | 1.13 | % | ||||||||||
Expenses, excluding expense | 1.66 | % | 1.68 | % | 1.81 | % | 2.07 | % | 2.24 | % | ||||||||||
Net investment income | 5.51 | % | 5.15 | % | 6.52 | % | 5.10 | % | 4.29 | % | ||||||||||
| Supplemental Data: | ||||||||||||||||||||
Net assets, end of year (000) | $11 | $11 | $10 | $10 | $11 | |||||||||||||||
Portfolio turnover rate | 40.94 | % | 37.68 | % | 32.88 | % | 47.95 | % | 24.92 | % | ||||||||||
| (a) | Calculated using average shares outstanding during the year. |
| (b) | The per share amount does not represent the net realized and unrealized gain (loss) as presented on the Statements of Operations for the period due to the timing of sales of Fund shares and the amount of per share realized and unrealized gains and losses at such time. |
| (c) | Total return does not consider the effects of sales loads and assumes the reinvestment of all distributions. |
| (d) | Interest expense relates to the liability for floating rate notes issued in conjunction with tender option bond trusts. |
See Notes to Financial Statements.
186
Financial Highlights (continued)
HIGH YIELD MUNICIPAL BOND FUND
| Class C Shares | ||||||||||||||||||||
| Year Ended 9/30 | ||||||||||||||||||||
| 2011 | 2010 | 2009 | 2008 | 2007 | ||||||||||||||||
Per Share Operating Performance | ||||||||||||||||||||
Net asset value, beginning of year | $11.81 | $11.50 | $11.89 | $15.03 | $15.81 | |||||||||||||||
|
|
|
|
|
|
|
|
|
| |||||||||||
Investment operations: | ||||||||||||||||||||
Net investment income(a) | .62 | .59 | .66 | .68 | .67 | |||||||||||||||
Net realized and unrealized gain | (.77 | ) | .30 | (.37 | )(b) | (3.14 | ) | (.77 | ) | |||||||||||
|
|
|
|
|
|
|
|
|
| |||||||||||
Total from investment operations | (.15 | ) | .89 | .29 | (2.46 | ) | (.10 | ) | ||||||||||||
|
|
|
|
|
|
|
|
|
| |||||||||||
Distributions to shareholders from: | ||||||||||||||||||||
Net investment income | (.60 | ) | (.58 | ) | (.68 | ) | (.68 | ) | (.68 | ) | ||||||||||
|
|
|
|
|
|
|
|
|
| |||||||||||
Net asset value, end of year | $11.06 | $11.81 | $11.50 | $11.89 | $15.03 | |||||||||||||||
|
|
|
|
|
|
|
|
|
| |||||||||||
Total Return(c) | (1.11 | )% | 7.99 | % | 3.57 | % | (16.77 | )% | (.74 | )% | ||||||||||
Ratios to Average Net Assets: | ||||||||||||||||||||
Expenses, excluding expense reductions and including | 1.56 | % | 1.65 | % | 1.66 | % | 1.78 | % | 1.81 | % | ||||||||||
Expenses, excluding interest expense, including expense reductions | 1.48 | % | 1.55 | % | 1.48 | % | 1.30 | % | 1.17 | % | ||||||||||
Expenses, excluding expense reductions and expenses | 1.56 | % | 1.65 | % | 1.67 | % | 1.93 | % | 2.17 | % | ||||||||||
Net investment income | 5.59 | % | 5.14 | % | 6.55 | % | 5.00 | % | 4.25 | % | ||||||||||
| Supplemental Data: | ||||||||||||||||||||
Net assets, end of year (000) | $450,802 | $585,366 | $455,042 | $392,360 | $538,419 | |||||||||||||||
Portfolio turnover rate | 40.94 | % | 37.68 | % | 32.88 | % | 47.95 | % | 24.92 | % | ||||||||||
| (a) | Calculated using average shares outstanding during the year. |
| (b) | The per share amount does not represent the net realized and unrealized gain (loss) as presented on the Statements of Operations for the period due to the timing of sales of Fund shares and the amount of per share realized and unrealized gains and losses at such time. |
| (c) | Total return does not consider the effects of sales loads and assumes the reinvestment of all distributions. |
| (d) | Interest expense relates to the liability for floating rate notes issued in conjunction with tender option bond trusts. |
See Notes to Financial Statements.
187
Financial Highlights (continued)
HIGH YIELD MUNICIPAL BOND FUND
| Class F Shares | ||||||||||||||||||||
| Year Ended 9/30 | 9/28/2007(a) 9/30/2007 | |||||||||||||||||||
| 2011 | 2010 | 2009 | 2008 | |||||||||||||||||
Per Share Operating Performance | ||||||||||||||||||||
Net asset value, beginning of period | $11.82 | $11.50 | $11.90 | $15.03 | $15.03 | |||||||||||||||
|
|
|
|
|
|
|
|
|
| |||||||||||
Investment operations: | ||||||||||||||||||||
Net investment income(b) | .70 | .69 | .70 | .76 | – | (c) | ||||||||||||||
Net realized and unrealized gain | (.76 | ) | .30 | (.34 | )(d) | (3.13 | ) | – | (c) | |||||||||||
|
|
|
|
|
|
|
|
|
| |||||||||||
Total from investment operations | (.06 | ) | .99 | .36 | (2.37 | ) | – | (c) | ||||||||||||
|
|
|
|
|
|
|
|
|
| |||||||||||
Distributions to shareholders from: | ||||||||||||||||||||
Net investment income | (.69 | ) | (.67 | ) | (.76 | ) | (.76 | ) | – | |||||||||||
|
|
|
|
|
|
|
|
|
| |||||||||||
Net asset value, end of period | $11.07 | $11.82 | $11.50 | $11.90 | $15.03 | |||||||||||||||
|
|
|
|
|
|
|
|
|
| |||||||||||
Total Return(e) | (.35 | )% | 8.98 | % | 4.25 | % | (16.19 | )% | .00 | % | ||||||||||
Ratios to Average Net Assets: | ||||||||||||||||||||
Expenses, excluding expense reductions and including | .79 | % | .81 | % | .91 | % | 1.20 | % | .00 | %(f)(g) | ||||||||||
Expenses, excluding interest expense, including expense reductions | .72 | % | .71 | % | .73 | % | .72 | % | .00 | %(f)(g) | ||||||||||
Expenses, excluding expense reductions and expenses reimbursed | .79 | % | .81 | % | .91 | % | 1.20 | % | .00 | %(f)(g) | ||||||||||
Net investment income | 6.35 | % | 5.97 | % | 6.83 | % | 5.90 | % | .00 | %(f)(g) | ||||||||||
| Supplemental Data: | ||||||||||||||||||||
Net assets, end of period (000) | $175,052 | $215,479 | $112,500 | $4,513 | $10 | |||||||||||||||
Portfolio turnover rate | 40.94 | % | 37.68 | % | 32.88 | % | 47.95 | % | 24.92 | % | ||||||||||
| (a) | Commencement of operations was 9/28/2007, SEC effective date was 9/14/2007 and date shares first became available to the public was 10/1/2007. |
| (b) | Calculated using average shares outstanding during the period. |
| (c) | Amount is less than $.01. |
| (d) | The per share amount does not represent the net realized and unrealized gain (loss) as presented on the Statements of Operations for the period due to the timing of sales of Fund shares and the amount of per share realized and unrealized gains and losses at such time. |
| (e) | Total return assumes the reinvestment of all distributions. |
| (f) | Not annualized. |
| (g) | Amount is less than .01%. |
| (h) | Interest expense relates to the liability for floating rate notes issued in conjunction with tender option bond trusts. |
See Notes to Financial Statements.
188
Financial Highlights (continued)
HIGH YIELD MUNICIPAL BOND FUND
| Class I Shares | ||||||||
| Year Ended 9/30/2011 | 7/26/2010(a) to 9/30/2010 | |||||||
Per Share Operating Performance | ||||||||
Net asset value, beginning of period | $11.81 | $11.58 | ||||||
|
|
|
| |||||
Investment operations: | ||||||||
Net investment income(b) | .68 | .12 | ||||||
Net realized and unrealized gain (loss) | (.74 | ) | .23 | |||||
|
|
|
| |||||
Total from investment operations | (.06 | ) | .35 | |||||
|
|
|
| |||||
Distributions to shareholders from: | ||||||||
Net investment income | (.69 | ) | (.12 | ) | ||||
|
|
|
| |||||
Net asset value, end of period | $11.06 | $11.81 | ||||||
|
|
|
| |||||
Total Return(c) | (.28 | )% | 3.05 | %(d) | ||||
Ratios to Average Net Assets: | ||||||||
Expenses, excluding interest expense and including expense | .62 | % | .62 | %(f) | ||||
Expenses, excluding expense reductions | .70 | % | .72 | %(f) | ||||
Net investment income | 6.18 | % | 5.75 | %(f) | ||||
| Supplemental Data: | ||||||||
Net assets, end of period (000) | $2,258 | $112 | ||||||
Portfolio turnover rate | 40.94 | % | 37.68 | % | ||||
| (a) | Commencement of operations was 7/26/2010 and the SEC effective date was 4/30/2007. |
| (b) | Calculated using average shares outstanding during the period. |
| (c) | Total return does not consider the effects of sales loads and assumes the reinvestment of all distributions. |
| (d) | Not annualized. |
| (e) | Interest expense relates to the liability for floating rate notes issued in conjunction with tender option bond trusts. |
| (f) | Annualized. |
See Notes to Financial Statements.
189
Financial Highlights (concluded)
HIGH YIELD MUNICIPAL BOND FUND
| Class P Shares | ||||||||||||||||||||
| Year Ended 9/30 | ||||||||||||||||||||
| 2011 | 2010 | 2009 | 2008 | 2007 | ||||||||||||||||
Per Share Operating Performance | ||||||||||||||||||||
Net asset value, beginning of year | $11.82 | $11.50 | $11.90 | $15.04 | $15.82 | |||||||||||||||
|
|
|
|
|
|
|
|
|
| |||||||||||
Investment operations: | ||||||||||||||||||||
Net investment income(a) | .67 | .66 | .71 | .74 | .75 | |||||||||||||||
Net realized and unrealized gain | (.77 | ) | .30 | (.39 | )(b) | (3.13 | ) | (.77 | ) | |||||||||||
|
|
|
|
|
|
|
|
|
| |||||||||||
Total from investment operations | (.10 | ) | .96 | .32 | (2.39 | ) | (.02 | ) | ||||||||||||
|
|
|
|
|
|
|
|
|
| |||||||||||
Distributions to shareholders from: | ||||||||||||||||||||
Net investment income | (.65 | ) | (.64 | ) | (.72 | ) | (.75 | ) | (.76 | ) | ||||||||||
|
|
|
|
|
|
|
|
|
| |||||||||||
Net asset value, end of year | $11.07 | $11.82 | $11.50 | $11.90 | $15.04 | |||||||||||||||
|
|
|
|
|
|
|
|
|
| |||||||||||
Total Return(c) | (.65 | )% | 8.67 | % | 3.87 | % | (16.34 | )% | (.25 | )% | ||||||||||
Ratios to Average Net Assets: | ||||||||||||||||||||
Expenses, excluding expense | 1.11 | % | 1.12 | % | 1.26 | % | 1.35 | % | 1.32 | % | ||||||||||
Expenses, excluding interest expense, | 1.04 | % | 1.02 | % | 1.08 | % | .87 | % | .66 | % | ||||||||||
Expenses, excluding expense | 1.11 | % | 1.12 | % | 1.26 | % | 1.51 | % | 1.73 | % | ||||||||||
Net investment income | 6.07 | % | 5.71 | % | 7.04 | % | 5.46 | % | 4.77 | % | ||||||||||
| Supplemental Data: | ||||||||||||||||||||
Net assets, end of year (000) | $11 | $11 | $10 | $10 | $12 | |||||||||||||||
Portfolio turnover rate | 40.94 | % | 37.68 | % | 32.88 | % | 47.95 | % | 24.92 | % | ||||||||||
| (a) | Calculated using average shares outstanding during the year. |
| (b) | The per share amount does not represent the net realized and unrealized gain (loss) as presented on the Statements of Operations for the period due to the timing of sales of Fund shares and the amount of per share realized and unrealized gains and losses at such time. |
| (c) | Total return does not consider the effects of sales loads and assumes the reinvestment of all distributions. |
| (d) | Interest expense relates to the liability for floating rate notes issued in conjunction with tender option bond trusts. |
See Notes to Financial Statements.
190
Financial Highlights
CALIFORNIA TAX FREE FUND
| Class A Shares | ||||||||||||||||||||
| Year Ended 9/30 | ||||||||||||||||||||
| 2011 | 2010 | 2009 | 2008 | 2007 | ||||||||||||||||
Per Share Operating Performance | ||||||||||||||||||||
Net asset value, beginning of year | $10.24 | $10.17 | $ 9.38 | $10.57 | $10.91 | |||||||||||||||
|
|
|
|
|
|
|
|
|
| |||||||||||
Investment operations: | ||||||||||||||||||||
Net investment income(a) | .48 | .47 | .45 | .45 | .44 | |||||||||||||||
Net realized and unrealized gain | (.35 | ) | .07 | .80 | (1.18 | ) | (.34 | ) | ||||||||||||
|
|
|
|
|
|
|
|
|
| |||||||||||
Total from investment operations | .13 | .54 | 1.25 | (.73 | ) | .10 | ||||||||||||||
|
|
|
|
|
|
|
|
|
| |||||||||||
Distributions to shareholders from: | ||||||||||||||||||||
Net investment income | (.47 | ) | (.47 | ) | (.46 | ) | (.46 | ) | (.44 | ) | ||||||||||
|
|
|
|
|
|
|
|
|
| |||||||||||
Net asset value, end of year | $ 9.90 | $10.24 | $10.17 | $ 9.38 | $10.57 | |||||||||||||||
|
|
|
|
|
|
|
|
|
| |||||||||||
Total Return(b) | 1.56 | % | 5.52 | % | 13.92 | % | (7.16 | )% | .87 | % | ||||||||||
Ratios to Average Net Assets: | ||||||||||||||||||||
Expenses, excluding expense reductions and including | .85 | % | .84 | % | .91 | % | 1.18 | % | 1.29 | % | ||||||||||
Expenses, excluding interest expense, including expense reductions | .79 | % | .78 | % | .78 | % | .80 | % | .87 | % | ||||||||||
Expenses, excluding expense reductions and expenses | .85 | % | .84 | % | .91 | % | 1.18 | % | 1.30 | % | ||||||||||
Net investment income | 4.96 | % | 4.74 | % | 4.87 | % | 4.41 | % | 4.03 | % | ||||||||||
| Supplemental Data: | ||||||||||||||||||||
Net assets, end of year (000) | $150,423 | $166,247 | $159,768 | $144,165 | $147,893 | |||||||||||||||
Portfolio turnover rate | 36.60 | % | 47.68 | % | 34.04 | % | 49.17 | % | 50.77 | % | ||||||||||
| (a) | Calculated using average shares outstanding during the year. |
| (b) | Total return does not consider the effects of sales loads and assumes the reinvestment of all distributions. |
| (c) | Interest expense relates to the liability for floating rate notes issued in conjunction with tender option bond trusts. |
See Notes to Financial Statements.
191
Financial Highlights (continued)
CALIFORNIA TAX FREE FUND
| Class C Shares | ||||||||||||||||||||
| Year Ended 9/30 | ||||||||||||||||||||
| 2011 | 2010 | 2009 | 2008 | 2007 | ||||||||||||||||
Per Share Operating Performance | ||||||||||||||||||||
Net asset value, beginning of year | $10.25 | $10.17 | $ 9.39 | $10.58 | $10.92 | |||||||||||||||
|
|
|
|
|
|
|
|
|
| |||||||||||
Investment operations: | ||||||||||||||||||||
Net investment income(a) | .42 | .40 | .38 | .39 | .37 | |||||||||||||||
Net realized and unrealized gain (loss) | (.36 | ) | .08 | .80 | (1.18 | ) | (.34 | ) | ||||||||||||
|
|
|
|
|
|
|
|
|
| |||||||||||
Total from investment operations | .06 | .48 | 1.18 | (.79 | ) | .03 | ||||||||||||||
|
|
|
|
|
|
|
|
|
| |||||||||||
Distributions to shareholders from: | ||||||||||||||||||||
Net investment income | (.41 | ) | (.40 | ) | (.40 | ) | (.40 | ) | (.37 | ) | ||||||||||
|
|
|
|
|
|
|
|
|
| |||||||||||
Net asset value, end of year | $ 9.90 | $10.25 | $10.17 | $ 9.39 | $10.58 | |||||||||||||||
|
|
|
|
|
|
|
|
|
| |||||||||||
Total Return(b) | .80 | % | 4.88 | % | 13.13 | % | (7.73 | )% | .23 | % | ||||||||||
Ratios to Average Net Assets: | ||||||||||||||||||||
Expenses, excluding expense reductions and including expenses reimbursed | 1.50 | % | 1.55 | % | 1.60 | % | 1.79 | % | 1.92 | % | ||||||||||
Expenses, excluding interest expense, including expense reductions and expenses reimbursed(c) | 1.44 | % | 1.49 | % | 1.48 | % | 1.41 | % | 1.50 | % | ||||||||||
Expenses, excluding expense reductions and expenses reimbursed | 1.50 | % | 1.55 | % | 1.60 | % | 1.79 | % | 1.92 | % | ||||||||||
Net investment income | 4.32 | % | 4.02 | % | 4.14 | % | 3.79 | % | 3.40 | % | ||||||||||
| Supplemental Data: | ||||||||||||||||||||
Net assets, end of year (000) | $28,023 | $33,280 | $28,896 | $18,793 | $15,245 | |||||||||||||||
Portfolio turnover rate | 36.60 | % | 47.68 | % | 34.04 | % | 49.17 | % | 50.77 | % | ||||||||||
| (a) | Calculated using average shares outstanding during the year. |
| (b) | Total return does not consider the effects of sales loads and assumes the reinvestment of all distributions. |
| (c) | Interest expense relates to the liability for floating rate notes issued in conjunction with tender option bond trusts. |
See Notes to Financial Statements.
192
Financial Highlights (continued)
CALIFORNIA TAX FREE FUND
| Class F Shares | ||||||||||||||||||||
| Year Ended 9/30 | 9/28/2007(a) 9/30/2007 | |||||||||||||||||||
| 2011 | 2010 | 2009 | 2008 | |||||||||||||||||
Per Share Operating Performance | ||||||||||||||||||||
Net asset value, beginning of period | $10.24 | $10.17 | $ 9.38 | $10.57 | $10.57 | |||||||||||||||
|
|
|
|
|
| �� |
|
|
|
| ||||||||||
Investment operations: | ||||||||||||||||||||
Net investment income(b) | .49 | .48 | .46 | .45 | – | (c) | ||||||||||||||
Net realized and unrealized gain (loss) | (.35 | ) | .07 | .80 | (1.17 | ) | – | (c) | ||||||||||||
|
|
|
|
|
|
|
|
|
| |||||||||||
Total from investment operations | .14 | .55 | 1.26 | (.72 | ) | – | (c) | |||||||||||||
|
|
|
|
|
|
|
|
|
| |||||||||||
Distributions to shareholders from: | ||||||||||||||||||||
Net investment income | (.48 | ) | (.48 | ) | (.47 | ) | (.47 | ) | – | |||||||||||
|
|
|
|
|
|
|
|
|
| |||||||||||
Net asset value, end of period | $ 9.90 | $10.24 | $10.17 | $ 9.38 | $10.57 | |||||||||||||||
|
|
|
|
|
|
|
|
|
| |||||||||||
Total Return(d) | 1.65 | % | 5.62 | % | 14.06 | % | (7.07 | )% | .00 | % | ||||||||||
Ratios to Average Net Assets: | ||||||||||||||||||||
Expenses, excluding expense reductions and including expenses reimbursed | .75 | % | .74 | % | .79 | % | 1.05 | % | .00 | %(e)(f) | ||||||||||
Expenses, excluding interest expense, including expense reductions and expenses reimbursed(g) | .69 | % | .68 | % | .67 | % | .67 | % | .00 | %(e)(f) | ||||||||||
Expenses, excluding expense reductions and expenses reimbursed | .75 | % | .74 | % | .79 | % | 1.07 | % | .00 | %(e)(f) | ||||||||||
Net investment income | 5.06 | % | 4.81 | % | 4.84 | % | 4.48 | % | .00 | %(e)(f) | ||||||||||
| Supplemental Data: | ||||||||||||||||||||
Net assets, end of period (000) | $14,605 | $12,683 | $6,578 | $285 | $10 | |||||||||||||||
Portfolio turnover rate | 36.60 | % | 47.68 | % | 34.04 | % | 49.17 | % | 50.77 | % | ||||||||||
| (a) | Commencement of operations was 9/28/2007, SEC effective date was 9/14/2007 and date shares first became available to the public was 10/1/2007. |
| (b) | Calculated using average shares outstanding during the period. |
| (c) | Amount is less than $.01. |
| (d) | Total return assumes the reinvestment of all distributions. |
| (e) | Not annualized. |
| (f) | Amount is less than .01%. |
| (g) | Interest expense relates to the liability for floating rate notes issued in conjunction with tender option bond trusts. |
See Notes to Financial Statements.
193
Financial Highlights (concluded)
CALIFORNIA TAX FREE FUND
| Class I Shares | ||||
| 1/31/2011(a) to 9/30/2011 | ||||
Per Share Operating Performance | ||||
Net asset value, beginning of period | $9.24 | |||
|
| |||
Investment operations: | ||||
Net investment income(b) | – | (c) | ||
Net realized and unrealized loss | (.01 | ) | ||
|
| |||
Total from investment operations | (.01 | ) | ||
|
| |||
Net asset value on SEC Effective Date, 2/1/2011 | $9.23 | |||
|
| |||
Investment operations: | ||||
Net investment income(b) | .33 | |||
Net realized and unrealized gain | .67 | (d) | ||
|
| |||
Total from investment operations | 1.00 | |||
|
| |||
Distributions to shareholders from: | ||||
Net investment income | (.33 | ) | ||
|
| |||
Net asset value, end of period | $9.90 | |||
|
| |||
Total Return(e) | 10.89 | %(f)(g) | ||
Total Return(e) | 10.99 | %(f)(h) | ||
Ratios to Average Net Assets: | ||||
Expenses, excluding interest expense and including expense reductions(i) | .60 | %(j) | ||
Expenses, excluding expense reductions | .69 | %(j) | ||
Net investment income | 5.24 | %(j) | ||
| Supplemental Data: | ||||
Net assets, end of period (000) | $11 | |||
Portfolio turnover rate | 36.60 | % | ||
| (a) | Commencement of operations was 1/31/2011, SEC effective date and date shares first became available to the public was 2/1/2011. |
| (b) | Calculated using average shares outstanding during the period. |
| (c) | Amount is less than $.01. |
| (d) | The per share amount does not represent the net realized and unrealized gain (loss) as presented on the Statements of Operations for the period due to the timing of sales of Fund shares and the amount of per share realized and unrealized gains and losses at such time. |
| (e) | Total return assumes the reinvestment of all distributions. |
| (f) | Not annualized. |
| (g) | Total return for the period 1/31/2011 through 9/30/2011. |
| (h) | Total return for the period 2/1/2011 through 9/30/2011. |
| (i) | Interest expense relates to the liability for floating rate notes issued in conjunction with tender option bond trusts. |
| (j) | Annualized. |
See Notes to Financial Statements.
194
Financial Highlights
NEW JERSEY TAX FREE FUND
| Class A Shares | ||||||||||||||||||||
| Year Ended 9/30 | ||||||||||||||||||||
| 2011 | 2010 | 2009 | 2008 | 2007 | ||||||||||||||||
Per Share Operating Performance | ||||||||||||||||||||
Net asset value, beginning of year | $4.85 | $4.78 | $4.43 | $5.00 | $5.17 | |||||||||||||||
|
|
|
|
|
|
|
|
|
| |||||||||||
Investment operations: | ||||||||||||||||||||
Net investment income(a) | .21 | .21 | .21 | .21 | .21 | |||||||||||||||
Net realized and unrealized gain (loss) | (.16 | ) | .07 | .35 | (.56 | ) | (.17 | ) | ||||||||||||
|
|
|
|
|
|
|
|
|
| |||||||||||
Total from investment operations | .05 | .28 | .56 | (.35 | ) | .04 | ||||||||||||||
|
|
|
|
|
|
|
|
|
| |||||||||||
Distributions to shareholders from: | ||||||||||||||||||||
Net investment income | (.21 | ) | (.21 | ) | (.21 | ) | (.22 | ) | (.21 | ) | ||||||||||
|
|
|
|
|
|
|
|
|
| |||||||||||
Net asset value, end of year | $4.69 | $4.85 | $4.78 | $4.43 | $5.00 | |||||||||||||||
|
|
|
|
|
|
|
|
|
| |||||||||||
Total Return(b) | 1.23 | % | 6.13 | % | 13.13 | % | (7.36 | )% | .78 | % | ||||||||||
Ratios to Average Net Assets: | ||||||||||||||||||||
Expenses, excluding expense reductions and including expenses reimbursed | .85 | % | .83 | % | .81 | % | .90 | % | 1.14 | % | ||||||||||
Expenses, excluding interest expense, including expense reductions and expenses reimbursed | .82 | %(c) | .80 | %(c) | .81 | % | .82 | %(c) | .81 | %(c) | ||||||||||
Expenses, excluding expense reductions and expenses reimbursed | .85 | % | .83 | % | .81 | % | .90 | % | 1.21 | % | ||||||||||
Net investment income | 4.62 | % | 4.53 | % | 4.78 | % | 4.34 | % | 4.11 | % | ||||||||||
| Supplemental Data: | ||||||||||||||||||||
Net assets, end of year (000) | $113,783 | $125,722 | $128,778 | $114,704 | $129,106 | |||||||||||||||
Portfolio turnover rate | 23.14 | % | 32.22 | % | 20.68 | % | 32.16 | % | 37.64 | % | ||||||||||
| (a) | Calculated using average shares outstanding during the year. |
| (b) | Total return does not consider the effects of sales loads and assumes the reinvestment of all distributions. |
| (c) | Interest expense relates to the liability for floating rate notes issued in conjunction with tender option bond trusts. |
See Notes to Financial Statements.
195
Financial Highlights (continued)
NEW JERSEY TAX FREE FUND
| Class F Shares | ||||||||||||||||||||
| Year Ended 9/30 | 9/28/2007(a) 9/30/2007 | |||||||||||||||||||
| 2011 | 2010 | 2009 | 2008 | |||||||||||||||||
Per Share Operating Performance | ||||||||||||||||||||
Net asset value, beginning of period | $4.85 | $4.78 | $4.43 | $5.00 | $5.00 | |||||||||||||||
|
|
|
|
|
|
|
|
|
| |||||||||||
Investment operations: | ||||||||||||||||||||
Net investment income(b) | .22 | .22 | .21 | .21 | – | (c) | ||||||||||||||
Net realized and unrealized gain (loss) | (.17 | ) | .07 | .35 | (.56 | ) | – | (c) | ||||||||||||
|
|
|
|
|
|
|
|
|
| |||||||||||
Total from investment operations | .05 | .29 | .56 | (.35 | ) | – | (c) | |||||||||||||
|
|
|
|
|
|
|
|
|
| |||||||||||
Distributions to shareholders from: | ||||||||||||||||||||
Net investment income | (.21 | ) | (.22 | ) | (.21 | ) | (.22 | ) | – | |||||||||||
|
|
|
|
|
|
|
|
|
| |||||||||||
Net asset value, end of period | $4.69 | $4.85 | $4.78 | $4.43 | $5.00 | |||||||||||||||
|
|
|
|
|
|
|
|
|
| |||||||||||
Total Return(d) | 1.33 | % | 6.23 | % | 13.26 | % | (7.27 | )% | .00 | % | ||||||||||
Ratios to Average Net Assets: | ||||||||||||||||||||
Expenses, excluding expense reductions and including expenses reimbursed | .75 | % | .72 | % | .70 | % | .74 | % | .00 | %(e)(f) | ||||||||||
Expenses, excluding interest expense, including expense reductions and expenses reimbursed | .72 | %(g) | .70 | %(g) | .70 | % | .66 | %(g) | .00 | %(e)(f)(g) | ||||||||||
Expenses, excluding expense reductions and expenses reimbursed | .75 | % | .72 | % | .70 | % | .77 | % | .00 | %(e)(f) | ||||||||||
Net investment income | 4.70 | % | 4.61 | % | 4.73 | % | 4.41 | % | .00 | %(e)(f) | ||||||||||
| Supplemental Data: | ||||||||||||||||||||
Net assets, end of period (000) | $3,949 | $2,775 | $969 | $48 | $10 | |||||||||||||||
Portfolio turnover rate | 23.14 | % | 32.22 | % | 20.68 | % | 32.16 | % | 37.64 | % | ||||||||||
| (a) | Commencement of operations was 9/28/2007, SEC effective date was 9/14/2007 and date shares first became available to the public was 10/1/2007. |
| (b) | Calculated using average shares outstanding during the period. |
| (c) | Amount is less than $.01. |
| (d) | Total return assumes the reinvestment of all distributions. |
| (e) | Not annualized. |
| (f) | Amount is less than .01%. |
| (g) | Interest expense relates to the liability for floating rate notes issued in conjunction with tender option bond trusts. |
See Notes to Financial Statements.
196
Financial Highlights (concluded)
NEW JERSEY TAX FREE FUND
| Class I Shares | ||||
| 1/31/2011(a) to 9/30/2011 | ||||
Per Share Operating Performance | ||||
Net asset value, beginning of period | $4.42 | |||
|
| |||
Investment operations: | ||||
Net investment income(b) | – | (c) | ||
Net realized and unrealized gain | (.01 | ) | ||
|
| |||
Total from investment operations | (.01 | ) | ||
|
| |||
Net asset value on SEC Effective Date, 2/1/2011 | $4.41 | |||
|
| |||
Investment operations: | ||||
Net investment income(b) | .15 | |||
Net realized and unrealized gain | .28 | (d) | ||
|
| |||
Total from investment operations | .43 | |||
|
| |||
Distributions to shareholders from: | ||||
Net investment income | (.15 | ) | ||
|
| |||
Net asset value, end of period | $4.69 | |||
|
| |||
Total Return(e) | 9.79 | %(f)(g) | ||
Total Return(e) | 10.02 | %(f)(h) | ||
Ratios to Average Net Assets: | ||||
Expenses, excluding interest expense and including expense reductions(i) | .59 | %(j) | ||
Expenses, excluding expense reductions | .64 | %(j) | ||
Net investment income | 4.85 | %(j) | ||
| Supplemental Data: | ||||
Net assets, end of period (000) | $11 | |||
Portfolio turnover rate | 23.14 | % | ||
| (a) | Commencement of operations was 1/31/2011, SEC effective date and date shares first became available to the public was 2/1/2011. |
| (b) | Calculated using average shares outstanding during the period. |
| (c) | Amount is less than $.01. |
| (d) | The per share amount does not represent the net realized and unrealized gain (loss) as presented on the Statements of Operations for the period due to the timing of sales of Fund shares and the amount of per share realized and unrealized gains and losses at such time. |
| (e) | Total return assumes the reinvestment of all distributions. |
| (f) | Not annualized. |
| (g) | Total return for the period 1/31/2011 through 9/30/2011. |
| (h) | Total return for the period 2/1/2011 through 9/30/2011. |
| (i) | Interest expense relates to the liability for floating rate notes issued in conjunction with tender option bond trusts. |
| (j) | Annualized. |
See Notes to Financial Statements.
197
Financial Highlights
NEW YORK TAX FREE FUND
| Class A Shares | ||||||||||||||||||||
| Year Ended 9/30 | ||||||||||||||||||||
| 2011 | 2010 | 2009 | 2008 | 2007 | ||||||||||||||||
Per Share Operating Performance |
| |||||||||||||||||||
Net asset value, beginning of year | $10.96 | $10.78 | $ 9.71 | $10.96 | $11.27 | |||||||||||||||
|
|
|
|
|
|
|
|
|
| |||||||||||
Investment operations: | ||||||||||||||||||||
Net investment income(a) | .48 | .49 | .48 | .46 | .47 | |||||||||||||||
Net realized and unrealized gain (loss) | (.30 | ) | .17 | 1.06 | (1.24 | ) | (.31 | ) | ||||||||||||
|
|
|
|
|
|
|
|
|
| |||||||||||
Total from investment operations | .18 | .66 | 1.54 | (.78 | ) | .16 | ||||||||||||||
|
|
|
|
|
|
|
|
|
| |||||||||||
Distributions to shareholders from: | ||||||||||||||||||||
Net investment income | (.48 | ) | (.48 | ) | (.47 | ) | (.47 | ) | (.47 | ) | ||||||||||
|
|
|
|
|
|
|
|
|
| |||||||||||
Net asset value, end of year | $10.66 | $10.96 | $10.78 | $ 9.71 | $10.96 | |||||||||||||||
|
|
|
|
|
|
|
|
|
| |||||||||||
Total Return(b) | 1.85 | % | 6.37 | % | 16.49 | % | (7.37 | )% | 1.47 | % | ||||||||||
Ratios to Average Net Assets: | ||||||||||||||||||||
Expenses, excluding expense reductions and including expenses reimbursed | .85 | % | .85 | % | .87 | % | .99 | % | 1.01 | % | ||||||||||
Expenses, excluding interest expense, including expense reductions and expenses reimbursed(c) | .78 | % | .77 | % | .78 | % | .78 | % | .70 | % | ||||||||||
Expenses, excluding expense reductions and expenses reimbursed | .85 | % | .85 | % | .87 | % | 1.00 | % | 1.16 | % | ||||||||||
Net investment income | 4.64 | % | 4.55 | % | 4.90 | % | 4.36 | % | 4.20 | % | ||||||||||
| Supplemental Data: | ||||||||||||||||||||
Net assets, end of year (000) | $216,126 | $238,259 | $231,452 | $221,057 | $243,416 | |||||||||||||||
Portfolio turnover rate | 47.37 | % | 30.34 | % | 22.34 | % | 44.67 | % | 25.38 | % | ||||||||||
| (a) | Calculated using average shares outstanding during the year. |
| (b) | Total return does not consider the effects of sales loads and assumes the reinvestment of all distributions. |
| (c) | Interest expense relates to the liability for floating rate notes issued in conjunction with tender option bond trusts. |
See Notes to Financial Statements.
198
Financial Highlights (continued)
NEW YORK TAX FREE FUND
| Class C Shares | ||||||||||||||||||||
| Year Ended 9/30 | ||||||||||||||||||||
| 2011 | 2010 | 2009 | 2008 | 2007 | ||||||||||||||||
Per Share Operating Performance |
| |||||||||||||||||||
Net asset value, beginning of year | $10.95 | $10.76 | $ 9.70 | $10.96 | $11.27 | |||||||||||||||
|
|
|
|
|
|
|
|
|
| |||||||||||
Investment operations: | ||||||||||||||||||||
Net investment income(a) | .42 | .41 | .41 | .40 | .39 | |||||||||||||||
Net realized and unrealized gain (loss) | (.31 | ) | .19 | 1.06 | (1.25 | ) | (.30 | ) | ||||||||||||
|
|
|
|
|
|
|
|
|
| |||||||||||
Total from investment operations | .11 | .60 | 1.47 | (.85 | ) | .09 | ||||||||||||||
|
|
|
|
|
|
|
|
|
| |||||||||||
Distributions to shareholders from: | ||||||||||||||||||||
Net investment income | (.41 | ) | (.41 | ) | (.41 | ) | (.41 | ) | (.40 | ) | ||||||||||
|
|
|
|
|
|
|
|
|
| |||||||||||
Net asset value, end of year | $10.65 | $10.95 | $10.76 | $ 9.70 | $10.96 | |||||||||||||||
|
|
|
|
|
|
|
|
|
| |||||||||||
Total Return(b) | 1.19 | % | 5.74 | % | 15.69 | % | (8.02 | )% | .84 | % | ||||||||||
Ratios to Average Net Assets: | ||||||||||||||||||||
Expenses, excluding expense reductions and including expenses reimbursed | 1.50 | % | 1.54 | % | 1.55 | % | 1.63 | % | 1.67 | % | ||||||||||
Expenses, excluding interest expense, including expense reductions and expenses reimbursed(c) | 1.43 | % | 1.46 | % | 1.46 | % | 1.41 | % | 1.36 | % | ||||||||||
Expenses, excluding expense reductions and expenses reimbursed | 1.50 | % | 1.54 | % | 1.55 | % | 1.63 | % | 1.81 | % | ||||||||||
Net investment income | 3.99 | % | 3.85 | % | 4.21 | % | 3.72 | % | 3.53 | % | ||||||||||
| Supplemental Data: | ||||||||||||||||||||
Net assets, end of year (000) | $38,627 | $42,397 | $37,554 | $31,262 | $25,423 | |||||||||||||||
Portfolio turnover rate | 47.37 | % | 30.34 | % | 22.34 | % | 44.67 | % | 25.38 | % | ||||||||||
| (a) | Calculated using average shares outstanding during the year. |
| (b) | Total return does not consider the effects of sales loads and assumes the reinvestment of all distributions. |
| (c) | Interest expense relates to the liability for floating rate notes issued in conjunction with tender option bond trusts. |
See Notes to Financial Statements.
199
Financial Highlights (continued)
NEW YORK TAX FREE FUND
| Class F Shares | ||||||||||||||||||||
| Year Ended 9/30 | 9/28/2007(a) 9/30/2007 | |||||||||||||||||||
| 2011 | 2010 | 2009 | 2008 | |||||||||||||||||
Per Share Operating Performance |
| |||||||||||||||||||
Net asset value, beginning of period | $10.97 | $10.78 | $ 9.72 | $10.96 | $10.96 | |||||||||||||||
|
|
|
|
|
|
|
|
|
| |||||||||||
Investment operations: | ||||||||||||||||||||
Net investment income(b) | .49 | .50 | .48 | .48 | – | (c) | ||||||||||||||
Net realized and unrealized gain (loss) | (.30 | ) | .18 | 1.06 | (1.24 | ) | – | (c) | ||||||||||||
|
|
|
|
|
|
|
|
|
| |||||||||||
Total from investment operations | .19 | .68 | 1.54 | (.76 | ) | – | (c) | |||||||||||||
|
|
|
|
|
|
|
|
|
| |||||||||||
Distributions to shareholders from: | ||||||||||||||||||||
Net investment income | (.49 | ) | (.49 | ) | (.48 | ) | (.48 | ) | – | |||||||||||
|
|
|
|
|
|
|
|
|
| |||||||||||
Net asset value, end of period | $10.67 | $10.97 | $10.78 | $ 9.72 | $10.96 | |||||||||||||||
|
|
|
|
|
|
|
|
|
| |||||||||||
Total Return(d) | 1.95 | % | 6.57 | % | 16.51 | % | (7.18 | )% | .00 | % | ||||||||||
Ratios to Average Net Assets: | ||||||||||||||||||||
Expenses, excluding expense reductions and including expenses reimbursed | .75 | % | .75 | % | .77 | % | .82 | % | .00 | %(e)(f) | ||||||||||
Expenses, excluding interest expense, including expense reductions and expenses reimbursed(g) | .68 | % | .67 | % | .68 | % | .61 | % | .00 | %(e)(f) | ||||||||||
Expenses, excluding expense reductions and expenses reimbursed | .75 | % | .75 | % | .77 | % | .83 | % | .00 | %(e)(f) | ||||||||||
Net investment income | 4.73 | % | 4.64 | % | 4.81 | % | 4.43 | % | .00 | %(e)(f) | ||||||||||
| Supplemental Data: | ||||||||||||||||||||
Net assets, end of period (000) | $7,907 | $7,631 | $3,143 | $9 | $10 | |||||||||||||||
Portfolio turnover rate | 47.37 | % | 30.34 | % | 22.34 | % | 44.67 | % | 25.38 | % | ||||||||||
| (a) | Commencement of operations was 9/28/2007, SEC effective date was 9/14/2007 and date shares first became available to the public was 10/1/2007. |
| (b) | Calculated using average shares outstanding during the period. |
| (c) | Amount is less than $.01. |
| (d) | Total return assumes the reinvestment of all distributions. |
| (e) | Not annualized. |
| (f) | Amount is less than .01%. |
| (g) | Interest expense relates to the liability for floating rate notes issued in conjunction with tender option bond trusts. |
See Notes to Financial Statements.
200
Financial Highlights (concluded)
NEW YORK TAX FREE FUND
| Class I Shares | ||||
| 1/31/2011(a) to 9/30/2011 | ||||
Per Share Operating Performance | ||||
Net asset value, beginning of period | $10.10 | |||
|
| |||
Investment operations: | ||||
Net investment income(b) | – | (c) | ||
Net realized and unrealized loss | (.01 | ) | ||
|
| |||
Total from investment operations | (.01 | ) | ||
|
| |||
Net asset value on SEC Effective Date, 2/1/2011 | $10.09 | |||
|
| |||
Investment operations: | ||||
Net investment income(b) | .34 | |||
Net realized and unrealized gain | .58 | (d) | ||
|
| |||
Total from investment operations | .92 | |||
|
| |||
Distributions to shareholders from: | ||||
Net investment income | (.34 | ) | ||
|
| |||
Net asset value, end of period | $10.67 | |||
|
| |||
Total Return(e) | 9.12 | %(f)(g) | ||
Total Return(e) | 9.21 | %(f)(h) | ||
Ratios to Average Net Assets: | ||||
Expenses, excluding interest expense and including expense reductions(i) | .57 | %(j) | ||
Expenses, excluding expense reductions | .67 | %(j) | ||
Net investment income | 4.91 | %(j) | ||
| Supplemental Data: | ||||
Net assets, end of period (000) | $11 | |||
Portfolio turnover rate | 47.37 | % | ||
| (a) | Commencement of operations was 1/31/2011, SEC effective date and date shares first became available to the public was 2/1/2011. |
| (b) | Calculated using average shares outstanding during the period. |
| (c) | Amount is less than $.01. |
| (d) | The per share amount does not represent the net realized and unrealized gain (loss) as presented on the Statements of Operations for the period due to the timing of sales of Fund shares and the amount of per share realized and unrealized gains and losses at such time. |
| (e) | Total return assumes the reinvestment of all distributions. |
| (f) | Not annualized. |
| (g) | Total return for the period 1/31/2011 through 9/30/2011. |
| (h) | Total return for the period 2/1/2011 through 9/30/2011. |
| (i) | Interest expense relates to the liability for floating rate notes issued in conjunction with tender option bond trusts. |
| (j) | Annualized. |
See Notes to Financial Statements.
201
Notes to Financial Statements
1. ORGANIZATION
Lord Abbett Municipal Income Fund, Inc. (the “Company”) is registered under the Investment Company Act of 1940, as amended (the “Act”), as an open-end management investment company. The Company was organized as a Maryland corporation on December 27, 1983.
The Company consists of the following eight portfolios (separately, a “Fund” and collectively, the “Funds”) and their respective classes:
| Funds | Classes | |||
Lord Abbett Short Duration Tax Free Fund (“Short Duration”) | A,B,C,F and I | |||
Lord Abbett Intermediate Tax Free Fund (“Intermediate”) | A,B,C,F,I and P | |||
Lord Abbett AMT Free Municipal Bond Fund (“AMT Free”)* | A,C,F and I | |||
Lord Abbett National Tax-Free Income Fund (“National”) | A,B,C,F,I and P | |||
Lord Abbett High Yield Municipal Bond Fund (“High Yield”) | A,B,C,F,I and P | |||
Lord Abbett California Tax-Free Income Fund (“California”) | A,C,F,I and P | |||
Lord Abbett New Jersey Tax-Free Income Fund (“New Jersey”) | A,F,I and P | |||
Lord Abbett New York Tax-Free Income Fund (“New York”) | A,C,F,I and P | |||
| * | Commencement of operations and SEC effective date was October 26, 2010. The shares first became available to the public on November 1, 2010. |
Short Duration, Intermediate, AMT Free and National are diversified as defined in the Act. High Yield, California, New Jersey and New York are non-diversified as defined in the Act. Short Duration has not issued Class B shares and only Intermediate and High Yield have issued Class P shares. The Funds’ Class P shares are closed to substantially all investors, with certain exceptions as set forth in the Funds’ prospectus. The Funds no longer issue Class B shares for purchase. Effective January 31, 2011, Class I shares of Intermediate, California, New Jersey, and New York commenced operations.
The investment objective of each Fund (except for High Yield) is to seek the maximum amount of interest income exempt from federal income tax as is consistent with reasonable risk. The investment objective of High Yield is to seek a high level of income exempt from federal income tax. Each of California, New Jersey and New York also seeks as high a level of interest income exempt from the personal income tax of its corresponding state as is consistent with reasonable risk. In addition, New York seeks as high a level of interest income exempt from New York City personal income tax as is consistent with reasonable risk.
Each class has different expenses and dividends. A front-end sales charge is normally added to the net asset value (“NAV”) for Class A shares. There is no front-end sales charge in the case of Class B, C, F, I and P shares, although there may be a contingent deferred sales charge (“CDSC”) in certain cases as follows: Class A shares purchased without a sales charge and redeemed before the first day of the month in which the one-year anniversary of the purchase falls (subject to certain exceptions as set forth in each Fund’s prospectus); Class B shares redeemed before the sixth anniversary of purchase; and Class C shares redeemed before the first anniversary of purchase. Class B shares will automatically convert to Class A shares on the 25th day of the month (or, if the 25th day is not a business day, the next business day thereafter) following the eighth anniversary of the day on which the purchase order was accepted.
On November 19, 2010, National acquired the net assets of Georgia Series (“Georgia”) and Pennsylvania Series (“Pennsylvania”) of the Lord Abbett Municipal Income Trust (the “Trust”) and Lord Abbett Connecticut Tax-Free Income Fund (“Connecticut”), Lord Abbett Hawaii Tax-Free
202
Notes to Financial Statements (continued)
Income Fund (“Hawaii”) and Lord Abbett Missouri Tax-Free Income Fund (“Missouri”) of the Company (collectively, the “Acquired Funds”). Refer to Note 12 Reorganizations for additional information.
The preparation of the financial statements in conformity with accounting principles generally accepted in the United States of America requires management to make certain estimates and assumptions that affect the reported amounts of assets and liabilities and disclosure of contingent assets and liabilities at the date of the financial statements and the reported amounts of increases and decreases in net assets from operations during the reporting period. Actual results could differ from those estimates.
2. SIGNIFICANT ACCOUNTING POLICIES
| (a) | Investment Valuation–Securities are valued at the mean between the bid and asked prices on the basis of prices supplied by independent pricing services, which reflect broker/dealer supplied valuations and the independent pricing services’ own electronic data processing techniques. Exchange traded options and futures contracts are valued at the last sale price in the market where they are principally traded. Securities for which market quotations are not readily available are valued at fair value as determined by management and approved in good faith by the Board of Directors. Investments in open-end money market mutual funds are valued at their NAV as of the close of each business day. Short-term securities with 60 days or less remaining to maturity are valued using the amortized cost method, which approximates fair value. |
| (b) | Security Transactions–Security transactions are recorded as of the date that the securities are purchased or sold (trade date). Realized gains and losses on sales of portfolio securities are calculated using the identified-cost method. Realized and unrealized gains (losses) are allocated to each class of shares based upon the relative proportion of net assets at the beginning of the day. |
| (c) | Investment Income–Dividend income is recorded on the ex-dividend date. Interest income is recorded on the accrual basis as earned. Discounts are accreted and premiums are amortized using the effective interest method and are included in Interest and other income on the Statements of Operations. Investment income is allocated to each class of shares based upon the relative proportion of net assets at the beginning of the day. |
| (d) | Income Taxes–It is the policy of each Fund to meet the requirements of Subchapter M of the Internal Revenue Code applicable to regulated investment companies and to distribute substantially all taxable income and capital gains to its shareholders. Therefore, no income tax provision is required. |
Each Fund files U.S. federal and various state and local tax returns. No income tax returns are currently under examination. The statute of limitations on the Funds’ U.S. federal tax returns filed remains open for the fiscal years ended September 30, 2008 through September 30, 2011. The statutes of limitations on the Company’s state and local tax returns may remain open for an additional year depending upon the jurisdiction.
| (e) | Expenses–Expenses incurred by the Company that do not specifically relate to an individual fund are generally allocated to the Funds within the Company on a pro rata basis by relative net assets. Expenses, excluding class-specific expenses, are allocated to each class of shares |
203
Notes to Financial Statements (continued)
based upon the relative proportion of net assets at the beginning of the day. Class A, B, C, F and P shares bear their class-specific share of all expenses and fees relating to the Funds’ 12b-1 Distribution Plan. |
| (f) | Futures Contracts–Each Fund may purchase and sell futures contracts to enhance returns, to attempt to hedge some of its investment risk, or as a substitute position for holding the underlying asset on which the instrument is based. At the time of entering into a futures transaction, an investor is required to deposit and maintain a specified amount of cash or eligible securities called “initial margin.” Subsequent payments made or received by a Fund called “variation margin” are made on a daily basis as the market price of the futures contract fluctuates. Each Fund will record an unrealized gain (loss) based on the amount of variation margin. When a contract is closed, a realized gain (loss) is recorded equal to the difference between the opening and closing value of the contract. As of September 30, 2011, each Fund, except Short Duration, had open futures contracts. |
| (g) | When-Issued Municipal Bonds–Each Fund may purchase new issues of municipal bonds, which are generally offered on a when-issued basis, with delivery and payment normally taking place approximately one month after the purchase date. |
| (h) | Municipal Bonds Held in Trust–Each Fund may invest in leveraged residual certificates (“TOB Residuals”) issued by tender option bond trusts (“TOBs”). A TOB is established by a third party sponsor forming a special purpose entity into which a Fund, or an agent on behalf of the Fund, transfers municipal securities. A TOB typically issues two classes of beneficial interests: short-term floating rate certificates (trust certificates), which are sold to third party investors, and residual certificates, which are generally issued to a Fund which made the transfer or to affiliates of the Fund. Each Fund’s transfer of the municipal securities to a TOB is accounted for as a secured borrowing, therefore the municipal securities deposited into a TOB are presented as investments in a Fund’s Schedule of Investments and the proceeds from the transactions are reported as a liability for trust certificates on the Statement of Assets and Liabilities. Similarly, proceeds from residual certificates issued to affiliates, if any, from the transaction are included in the liability for trust certificates. Interest income from the underlying security is recorded by a Fund on an accrual basis. Interest expense incurred on the secured borrowing and other expenses related to remarketing, administration and trustee services to a TOB are reported as expenses of a Fund. The floating rate certificates have interest rates that generally reset weekly and their holders have the option to tender certificates to the TOB for redemption at par at each reset date. The residual interests held by a Fund include the right of each Fund (1) to cause the holders of a proportional share of floating rate certificates to tender their certificates at par and (2) to transfer a corresponding share of the municipal securities from the TOB to the Fund. The TOB may also be terminated without the consent of the Fund upon the occurrence of certain events as defined in the TOB agreements. Such termination events may include the bankruptcy or default of the municipal bond, a substantial downgrade in credit quality of the municipal bond, the inability of the TOB to obtain quarterly or annual renewal of the liquidity support agreement, a substantial decline in market value of the municipal bond or the inability to remarket the short-term floating rate certificates to third party investors. |
204
Notes to Financial Statements (continued)
The following is a summary of each Fund’s liability for trust certificates, range of interest rates for such certificates and the aggregate value of the underlying municipal securities transferred to TOBs as of September 30, 2011, as well as the average trust certificates outstanding for the fiscal year ended September 30, 2011:
| Fund | Liability for Trust Certificates | Interest Rate or Range of Interest Rates | Underlying Municipal Bonds Transferred to TOBs | Average Trust Certificates Outstanding | ||||||||||||
Short Duration | $ | 7,000,000 | .16% | $ | 14,402,710 | $ | 7,000,000 | |||||||||
Intermediate | 9,820,000 | .16%-.25% | 21,103,128 | 12,635,000 | ||||||||||||
AMT Free | 500,000 | – | 1,046,950 | 200,000 | ||||||||||||
National | 147,087,226 | .16%-.25% | 323,508,968 | 133,467,226 | ||||||||||||
High Yield | 133,580,000 | .16%-.29% | 284,741,496 | 153,955,890 | ||||||||||||
California | 14,475,000 | .16%-.25% | 30,915,795 | 14,475,000 | ||||||||||||
New Jersey | 5,310,000 | .16% | 11,051,582 | 5,310,000 | ||||||||||||
New York | 20,820,000 | .16%-.22% | 46,019,715 | 23,670,000 | ||||||||||||
Financial transactions executed through TOBs generally will underperform the market for fixed rate municipal bonds in a rising interest rate environment, but tend to outperform the market for fixed rate municipal bonds when interest rates decline or remain relatively stable. Should short-term interest rates rise, a Fund’s investment in TOB Residuals likely will adversely affect a Fund’s net investment income and distributions to shareholders. Fluctuations in the market value of municipal securities deposited into the TOB may adversely affect a Fund’s NAV per share.
While the Funds’ investment policies and restrictions expressly permit investments in inverse floating rate securities such as TOB Residuals, they generally do not allow the Funds to borrow money for purposes of making investments. The Funds’ management believes that the Funds’ restrictions on borrowings do not apply to the secured borrowings for TOB transactions.
| (i) | Fair Value Measurements–Fair value is defined as the price that each Fund would receive upon selling an investment or transferring a liability in an orderly transaction to an independent buyer in the principal or most advantageous market of the investment. A three-tier hierarchy is used to maximize the use of observable market data and minimize the use of unobservable inputs and to establish classification of fair value measurements for disclosure purposes. Inputs refer broadly to the assumptions that market participants would use in pricing the asset or liability, including assumptions about risk – for example, the risk inherent in a particular valuation technique used to measure fair value (such as a pricing model) and/or the risk inherent in the inputs to the valuation technique. Inputs may be observable or unobservable. Observable inputs reflect the assumptions market participants would use in pricing the asset or liability. Observable inputs are based on market data obtained from sources independent of the reporting entity. Unobservable inputs reflect the reporting entity’s own assumptions about the assumptions market participants would use in pricing the asset or liability. Unobservable inputs are based on the best information available in the circumstances. The three-tier hierarchy of inputs is summarized in the three broad Levels listed below: |
| • | Level 1 - unadjusted quoted prices in active markets for identical investments; |
| • | Level 2 - other significant observable inputs (including quoted prices for similar investments, interest rates, prepayment speeds, credit risk, etc.); and |
205
Notes to Financial Statements (continued)
| • | Level 3 - significant unobservable inputs (including each Fund’s own assumptions in determining the fair value of investments). |
The inputs or methodology used for valuing securities are not necessarily an indication of the risk associated with investing in those securities.
The following is a summary of the inputs used as of September 30, 2011 in valuing each Fund’s investments carried at fair value:
| Short Duration | ||||||||||||||||
| Investment Type* | Level 1 | Level 2 | Level 3 | Total | ||||||||||||
Municipal Bonds | $ | – | $ | 1,397,409,197 | $ | – | $ | 1,397,409,197 | ||||||||
Money Market Mutual Fund | – | – | – | – | ||||||||||||
Variable Rate Demand Notes | – | 435,880,050 | – | 435,880,050 | ||||||||||||
Total | $ | – | $ | 1,833,289,247 | $ | – | $ | 1,833,289,247 | ||||||||
Other Financial Instruments |
| |||||||||||||||
Futures Contracts | ||||||||||||||||
Assets | $ | – | $ | – | $ | – | $ | – | ||||||||
Liabilities | – | – | – | – | ||||||||||||
Total | $ | – | $ | – | $ | – | $ | – | ||||||||
| Intermediate | ||||||||||||||||
| Investment Type* | Level 1 | Level 2 | Level 3 | Total | ||||||||||||
Municipal Bonds | $ | – | $ | 2,336,938,939 | $ | 534,590 | $ | 2,337,473,529 | ||||||||
Money Market Mutual Fund | 1,775 | – | – | 1,775 | ||||||||||||
Variable Rate Demand Notes | – | 47,130,000 | – | 47,130,000 | ||||||||||||
Total | $ | 1,775 | $ | 2,384,068,939 | $ | 534,590 | $ | 2,384,605,304 | ||||||||
Other Financial Instruments |
| |||||||||||||||
Futures Contracts | ||||||||||||||||
Assets | $ | – | $ | – | $ | – | $ | – | ||||||||
Liabilities | (2,563,828 | ) | – | – | (2,563,828 | ) | ||||||||||
Total | $ | (2,563,828 | ) | $ | – | $ | – | $ | (2,563,828 | ) | ||||||
| AMT Free | ||||||||||||||||
| Investment Type* | Level 1 | Level 2 | Level 3 | Total | ||||||||||||
Municipal Bonds | $ | – | $ | 64,903,104 | $ | – | $ | 64,903,104 | ||||||||
Money Market Mutual Funds | – | – | – | – | ||||||||||||
Variable Rate Demand Notes | – | 2,420,000 | – | 2,420,000 | ||||||||||||
Total | $ | – | $ | 67,323,104 | $ | – | $ | 67,323,104 | ||||||||
Other Financial Instruments |
| |||||||||||||||
Futures Contracts | ||||||||||||||||
Assets | $ | – | $ | – | $ | – | $ | – | ||||||||
Liabilities | (183,910 | ) | – | – | (183,910 | ) | ||||||||||
Total | $ | (183,910 | ) | $ | – | $ | – | $ | (183,910 | ) | ||||||
206
Notes to Financial Statements (continued)
| National | ||||||||||||||||
| Investment Type* | Level 1 | Level 2 | Level 3 | Total | ||||||||||||
Municipal Bonds | $ | – | $ | 1,802,098,939 | $ | 534,590 | $ | 1,802,633,529 | ||||||||
Money Market Mutual Funds | 5,409 | – | – | 5,409 | ||||||||||||
Variable Rate Demand Notes | – | 3,800,000 | – | 3,800,000 | ||||||||||||
Total | $ | 5,409 | $ | 1,805,898,939 | $ | 534,590 | $ | 1,806,438,938 | ||||||||
Other Financial Instruments |
| |||||||||||||||
Futures Contracts | ||||||||||||||||
Assets | $ | – | $ | – | $ | – | $ | – | ||||||||
Liabilities | (5,764,261 | ) | – | – | (5,764,261 | ) | ||||||||||
Total | $ | (5,764,261 | ) | $ | – | $ | – | $ | (5,764,261 | ) | ||||||
| High Yield | ||||||||||||||||
| Investment Type* | Level 1 | Level 2 | Level 3 | Total | ||||||||||||
Municipal Bonds | $ | – | $ | 1,656,463,125 | $ | 1,269,652 | $ | 1,657,732,777 | ||||||||
Money Market Mutual Funds | 3,686 | – | – | 3,686 | ||||||||||||
Variable Rate Demand Notes | – | – | – | – | ||||||||||||
Total | $ | 3,686 | $ | 1,656,463,125 | $ | 1,269,652 | $ | 1,657,736,463 | ||||||||
Other Financial Instruments |
| |||||||||||||||
Futures Contracts | ||||||||||||||||
Assets | $ | – | $ | – | $ | – | $ | – | ||||||||
Liabilities | (9,360,835 | ) | – | – | (9,360,835 | ) | ||||||||||
Total | $ | (9,360,835 | ) | $ | – | $ | – | $ | (9,360,835 | ) | ||||||
| California | ||||||||||||||||
| Investment Type* | Level 1 | Level 2 | Level 3 | Total | ||||||||||||
Municipal Bonds | $ | – | $ | 203,246,617 | $ | – | $ | 203,246,617 | ||||||||
Money Market Mutual Funds | 26 | – | – | 26 | ||||||||||||
Variable Rate Demand Notes | – | – | – | – | ||||||||||||
Total | $ | 26 | $ | 203,246,617 | $ | – | $ | 203,246,643 | ||||||||
Other Financial Instruments |
| |||||||||||||||
Futures Contracts | ||||||||||||||||
Assets | $ | – | $ | – | $ | – | $ | – | ||||||||
Liabilities | (1,531,057 | ) | – | – | (1,531,057 | ) | ||||||||||
Total | $ | (1,531,057 | ) | $ | – | $ | – | $ | (1,531,057 | ) | ||||||
207
Notes to Financial Statements (continued)
| New Jersey | ||||||||||||||||
| Investment Type* | Level 1 | Level 2 | Level 3 | Total | ||||||||||||
Municipal Bonds | $ | – | $ | 120,271,856 | $ | – | $ | 120,271,856 | ||||||||
| Money Market Mutual Fund | 5 | – | – | 5 | ||||||||||||
Total | $ | 5 | $ | 120,271,856 | $ | – | $ | 120,271,861 | ||||||||
Other Financial Instruments |
| |||||||||||||||
Futures Contracts | ||||||||||||||||
Assets | $ | – | $ | – | $ | – | $ | – | ||||||||
Liabilities | (670,462 | ) | – | – | (670,462 | ) | ||||||||||
Total | $ | (670,462 | ) | $ | – | $ | – | $ | (670,462 | ) | ||||||
| New York | ||||||||||||||||
| Investment Type* | Level 1 | Level 2 | Level 3 | Total | ||||||||||||
Municipal Bonds | $ | – | $ | 281,483,559 | $ | – | $ | 281,483,559 | ||||||||
| Money Market Mutual Fund | 331 | – | – | 331 | ||||||||||||
Total | $ | 331 | $ | 281,483,559 | $ | – | $ | 281,483,890 | ||||||||
Other Financial Instruments |
| |||||||||||||||
Futures Contracts | ||||||||||||||||
Assets | $ | – | $ | – | $ | – | $ | – | ||||||||
Liabilities | (1,816,476 | ) | – | – | (1,816,476 | ) | ||||||||||
Total | $ | (1,816,476 | ) | $ | – | $ | – | $ | (1,816,476 | ) | ||||||
| * | See Schedule of Investments for fair values in each industry. |
The following is a reconciliation of investments with unobservable inputs (Level 3) that were used in determining fair value:
| Fund | Intermediate | National | High Yield | |||||||||
| Investment Type | Municipal Bonds | Municipal Bonds | Municipal Bonds | |||||||||
Balance as of October 1, 2010 | $ | – | $ | – | $ | – | ||||||
Accrued discounts/premiums | – | – | – | |||||||||
Realized gain (loss) | – | – | – | |||||||||
Change in unrealized appreciation/depreciation | (1,062,162 | ) | (1,062,162 | ) | (2,522,634 | ) | ||||||
Net purchase (sales) | – | – | – | |||||||||
Net transfers in or out of Level 3 | 1,596,752 | 1,596,752 | 3,792,286 | |||||||||
Balance as of September 30, 2011 | $ | 534,590 | $ | 534,590 | $ | 1,269,652 | ||||||
| (j) | Disclosures about Derivative Instruments and Hedging Activities–Each Fund, except Short Duration, entered into U.S. Treasury futures contracts during the fiscal year ended September 30, 2011 (as described in note 2(f)) to hedge against changes in interest rates. The Funds bear the risk of interest rates moving unexpectedly, in which case the Funds may not achieve the anticipated benefits of the futures contracts and realize a loss. There is minimal counterparty credit risk to the Funds since futures are exchange traded and the exchange’s clearinghouse, as counterparty to all exchange traded futures, guarantees futures against default. |
As of September 30, 2011, the Funds had interest rate futures contracts with cumulative net unrealized depreciation which are included in the Schedules of Investments. Only the current day’s variation margin is included in the Statements of Assets and Liabilities. The net realized
208
Notes to Financial Statements (continued)
gain/(loss) and change in unrealized appreciation/depreciation on futures contracts are included in the Statements of Operations under the captions Net realized gain (loss) on investments and futures contracts and Net change in unrealized appreciation/depreciation on investments and futures contracts, respectively.
The following is a summary of U.S. Treasury futures contracts as of and for the fiscal year ended September 30, 2011:
| Net Unrealized Depreciation as of September 30, 2011 | Net Realized Loss | Net Change in Unrealized Appreciation/ Depreciation | Average Number of Contracts* | |||||||||||||
Intermediate | $ | (2,563,828 | ) | $ | (1,745,302 | ) | $ | (2,726,519 | ) | 380 | ||||||
AMT Free | (183,910 | ) | (301,288 | ) | (183,910 | ) | 11 | |||||||||
National | (5,764,261 | ) | (4,573,013 | ) | (6,190,887 | ) | 970 | |||||||||
High Yield | (9,360,835 | ) | (237,238 | ) | (10,716,029 | ) | 1,653 | |||||||||
California | (1,531,057 | ) | (811,295 | ) | (1,675,282 | ) | 169 | |||||||||
New Jersey | (670,462 | ) | (518,035 | ) | (744,504 | ) | 88 | |||||||||
New York | (1,816,476 | ) | (1,599,811 | ) | (2,006,617 | ) | 233 | |||||||||
| * | Calculated based on the number of contracts for the fiscal year ended September 30, 2011. |
3. MANAGEMENT FEE AND OTHER TRANSACTIONS WITH AFFILIATES
Management Fee
The Company has a management agreement with Lord, Abbett & Co. LLC (“Lord Abbett”), pursuant to which Lord Abbett supplies each Fund with investment management services and executive and other personnel, provides office space and pays for ordinary and necessary office and clerical expenses relating to research and statistical work and supervision of each Fund’s investment portfolio.
The management fee for each of National, California, New Jersey and New York is based on each Fund’s average daily net assets at the following annual rate:
First $1 billion | .45% | |||
Next $1 billion | .40% | |||
Over $2 billion | .35% |
The management fee for each of Short Duration and Intermediate is based on each Fund’s average daily net assets at the following annual rate:
First $2 billion | .40% | |||
Next $3 billion | .375% | |||
Over $5 billion | .35% |
The management fee for each of AMT Free and High Yield is based on each Fund’s average daily net assets at the following annual rate:
First $1 billion | .50% | |||
Next $1 billion | .45% | |||
Over $2 billion | .40% |
209
Notes to Financial Statements (continued)
For the fiscal year ended September 30, 2011, the effective management fee, net of waivers, was at the following annualized rate of each Fund’s average daily net assets:
Effective Management Fee | ||||
Short Duration | .29% | |||
Intermediate | .33% | |||
AMT Free | .00% | |||
National | .43% | |||
High Yield | .48% | |||
California | .45% | |||
New Jersey | .45% | |||
New York | .45% | |||
In addition, Lord Abbett provides certain administrative services to each Fund pursuant to an Administrative Services Agreement in return for a fee at an annual rate of .04% of each Fund’s average daily net assets.
Effective February 1, 2011, Lord Abbett has contractually agreed to waive all or a portion of its management fee for Short Duration and Intermediate and, if necessary, reimburse each Fund’s other expenses to the extent necessary so that total net annual operating expenses for each class, excluding 12b-1 fees and interest related expenses, do not exceed an annualized rate of .39% and .45%, respectively. This agreement may be terminated only upon approval of the Fund’s Board of Directors.
For the period October 1, 2010 through January 31, 2011, Lord Abbett voluntarily agreed to waive all or a portion of its management fee for Short Duration and Intermediate and, if necessary, reimburse the Fund’s other expenses to the extent necessary so that total net annual operating expenses of each class, excluding 12b-1 fees and interest related expense, did not exceed an annualized rate of ..37% and .43%, respectively.
For the period October 26, 2010 through January 31, 2012, Lord Abbett has contractually agreed to waive all or a portion of its management fee for AMT Free and, if necessary, reimburse the Fund’s other expenses to the extent necessary so that total net annual operating expenses for each class, excluding 12b-1 fees and interest related expenses, do not exceed an annualized rate of .30%. This agreement may be terminated only upon approval of the Fund’s Board of Directors.
12b-1 Distribution Plan
Each Fund has adopted a distribution plan with respect to Class A, B, C, F and P shares pursuant to Rule 12b-1 under the Act, which provides for the payment of ongoing distribution and service fees to Lord Abbett Distributor LLC (the “Distributor”), an affiliate of Lord Abbett. The fees are accrued daily at annual rates based upon each Fund’s average daily net assets as follows:
| Fees | Class A | Class B | Class C(1) | Class F | Class P | |||||||||||||||
Service | .15% | .25% | .25% | – | .25% | |||||||||||||||
Distribution | .05% | .75% | .75% | .10% | .20% | |||||||||||||||
| (1) | The Rule 12b-1 fee each Fund pays on Class C shares is a blended rate based on 1.00% of each Fund’s average daily net assets attributable to Class C shares held for less than one year and .80% of each Fund’s average daily net assets attributable to Class C shares held for one year or more. All Class C shareholders of a Fund will bear Rule 12b-1 fees at the same rate. |
Class I shares do not have a distribution plan.
210
Notes to Financial Statements (continued)
Commissions
Distributor received the following commissions on sales of shares of the Funds, after concessions were paid to authorized dealers, for the fiscal year ended September 30, 2011:
| Distributor Commissions | Dealers’ Concessions | |||||||
Short Duration | $ | 103,220 | $ | 610,288 | ||||
Intermediate | 247,112 | 1,508,274 | ||||||
AMT Free | 10,534 | 59,167 | ||||||
National | 136,886 | 867,178 | ||||||
High Yield | 164,957 | 1,061,054 | ||||||
California | 10,951 | 68,588 | ||||||
New Jersey | 5,614 | 33,612 | ||||||
New York | 17,657 | 99,984 | ||||||
Distributor received the following amount of CDSCs for the fiscal year ended September 30, 2011:
| Class A | Class C | |||||||
Short Duration | $ | 488,692 | $ | 107,873 | ||||
Intermediate | 314,983 | 187,217 | ||||||
AMT Free | 603 | 24 | ||||||
National | 52,532 | 46,426 | ||||||
High Yield | 165,625 | 120,324 | ||||||
California | 891 | 4,105 | ||||||
New Jersey | 344 | – | ||||||
New York | 18,132 | 6,652 | ||||||
Two Directors and certain of the Company’s officers have an interest in Lord Abbett.
4. DISTRIBUTIONS AND CAPITAL LOSS CARRYFORWARDS
Dividends from net investment income, if any, are declared daily and paid monthly. Taxable net realized gains from investment transactions, reduced by allowable capital loss carryforwards, if any, are declared and distributed to shareholders at least annually. The capital loss carryforward amount, if any, is available to offset future net capital gains. Dividends and distributions to shareholders are recorded on the ex-dividend date. The amounts of dividends and distributions from net investment income and net realized capital gains are determined in accordance with federal income tax regulations, which may differ from accounting principles generally accepted in the United States of America. These book/tax differences are either considered temporary or permanent in nature. To the extent these differences are permanent in nature, such amounts are reclassified within the components of net assets based on their federal tax basis treatment; temporary differences do not require reclassification. Dividends and distributions, which exceed earnings and profits for tax purposes, are reported as a tax return of capital.
211
Notes to Financial Statements (continued)
The tax character of distributions paid during the fiscal years ended September 30, 2011 and 2010 were as follows.
| Short Duration | Intermediate | |||||||||||||||
| 9/30/2011 | 9/30/2010 | 9/30/2011 | 9/30/2010 | |||||||||||||
Distributions paid from: | ||||||||||||||||
Tax-exempt income | $ | 36,254,784 | $ | 27,140,905 | $ | 75,976,180 | $ | 51,370,767 | ||||||||
Total distributions paid | $ | 36,254,784 | $ | 27,140,905 | $ | 75,976,180 | $ | 51,370,767 | ||||||||
| AMT Free | National | |||||||||||||||
Period Ended 9/30/2011* | 9/30/2011 | 9/30/2010 | ||||||||||||||
Distributions paid from: | ||||||||||||||||
Tax-exempt income | $ | 1,507,013 | $ | 78,421,436 | $ | 54,875,745 | ||||||||||
Ordinary income | – | – | 941,201 | |||||||||||||
Total distributions paid | $ | 1,507,013 | $ | 78,421,436 | $ | 55,816,946 | ||||||||||
| High Yield | California | |||||||||||||||
| 9/30/2011 | 9/30/2010 | 9/30/2011 | 9/30/2010 | |||||||||||||
Distributions paid from: | ||||||||||||||||
Tax-exempt income | $ | 95,794,732 | $ | 96,945,720 | $ | 9,117,785 | $ | 9,028,752 | ||||||||
Ordinary income | 1,275,463 | 652,498 | – | 101,403 | ||||||||||||
Total distributions paid | $ | 97,070,195 | $ | 97,598,218 | $ | 9,117,785 | $ | 9,130,155 | ||||||||
| New Jersey | New York | |||||||||||||||
| 9/30/2011 | 9/30/2010 | 9/30/2011 | 9/30/2010 | |||||||||||||
Distributions paid from: | ||||||||||||||||
Tax-exempt income | $ | 5,301,017 | $ | 5,667,686 | $ | 11,873,846 | $ | 12,006,516 | ||||||||
Ordinary income | 76,137 | – | – | – | ||||||||||||
Total distributions paid | $ | 5,377,154 | $ | 5,667,686 | $ | 11,873,846 | $ | 12,006,516 | ||||||||
| * | For the period October 26, 2010 (commencement of operations) to September 30, 2011. |
As of September 30, 2011, the components of accumulated gains (losses) on a tax-basis were as follows:
| Short Duration | Intermediate | |||||||
Undistributed tax-exempt income–net | $ | 95,913 | $ | 10,561 | ||||
Undistributed long-term capital gains | 1,231,550 | – | ||||||
Total undistributed earnings | $ | 1,327,463 | $ | 10,561 | ||||
Capital loss carryforwards* | – | (4,771,620 | ) | |||||
Temporary differences | (56,244 | ) | (10,404,617 | ) | ||||
Unrealized gains–net | 31,036,209 | 109,280,962 | ||||||
Total accumulated gains–net | $ | 32,307,428 | $ | 94,115,286 | ||||
| AMT Free | National | |||||||
Undistributed tax-exempt income-net | $ | 34,015 | $ | 335,286 | ||||
Total undistributed earnings | 34,015 | 335,286 | ||||||
Capital loss carryforwards* | – | (47,732,223 | ) | |||||
Temporary differences | (556,805 | ) | (31,766,135 | ) | ||||
Unrealized gains–net | 3,180,704 | 42,653,942 | ||||||
Total accumulated gains (losses)–net | $ | 2,657,914 | $ | (36,509,130 | ) | |||
212
Notes to Financial Statements (continued)
| High Yield | California | |||||||
Capital loss carryforwards* | $ | (254,613,941 | ) | $ | (8,270,059 | ) | ||
Temporary differences | (50,471,305 | ) | (7,338,127 | ) | ||||
Unrealized gains (losses)–net | (113,209,661 | ) | 6,672,658 | |||||
Total accumulated losses–net | $ | (418,294,907 | ) | $ | (8,935,528 | ) | ||
| New Jersey | New York | |||||||
Capital loss carryforwards* | $ | (6,919,872 | ) | $ | (10,017,692 | ) | ||
Temporary differences | (4,430,595 | ) | (4,035,819 | ) | ||||
Unrealized gains–net | 2,637,589 | 7,921,670 | ||||||
Total accumulated losses–net | $ | (8,712,878 | ) | $ | (6,131,841 | ) | ||
| * | As of September 30, 2011, the capital loss carryforwards, along with the related expiration dates, were as follows: |
| 2012 | 2013 | 2014 | 2015 | 2016 | 2017 | 2018 | 2019 | Total | ||||||||||||||||||||||||||||
Intermediate | $26,684 | $63,298 | $16,132 | $140,520 | $25,504 | $ – | $870,134 | $3,629,348 | $4,771,620 | |||||||||||||||||||||||||||
National | 2,032,157 | 211,810 | 1,608,164 | 1,395,469 | 1,774,936 | 24,469,869 | 16,239,818 | – | 47,732,223 | |||||||||||||||||||||||||||
High Yield | – | – | 1,759,893 | 9,152,078 | 16,838,530 | 112,613,733 | 77,996,014 | 36,253,693 | 254,613,941 | |||||||||||||||||||||||||||
California | 777,657 | – | – | 429,137 | 3,345 | 1,405,669 | 5,151,330 | 502,921 | 8,270,059 | |||||||||||||||||||||||||||
New Jersey | 1,373,781 | – | 87,412 | – | – | – | 4,168,179 | 1,290,500 | 6,919,872 | |||||||||||||||||||||||||||
New York | – | – | 562,562 | – | – | 1,280,143 | 5,906,184 | 2,268,803 | 10,017,692 | |||||||||||||||||||||||||||
As of November 19, 2010 (the date National acquired the net assets of the Acquired Funds), the cumulative capital loss carryforwards of the Acquired Funds transferred into National were $12,052,941.
Certain losses incurred after October 31 (“Post-October Losses”) within the taxable year are deemed to arise on the first business day of the Fund’s next taxable year. The following Funds incurred and will elect to defer net capital losses during fiscal 2011 as follows:
| Post-October Losses | ||||
Intermediate | $ | 10,330,411 | ||
AMT Free | 556,668 | |||
National | 31,305,218 | |||
High Yield | 48,973,452 | |||
California | 6,784,695 | |||
New Jersey | 4,127,968 | |||
New York | 3,134,443 | |||
As of September 30, 2011, the aggregate unrealized security gains and losses based on cost for U.S. federal income tax purposes were as follows:
| Tax Cost | Gross Unrealized Gain | Gross Unrealized Loss | Net Unrealized | |||||||||||||
Short Duration | $ | 1,795,253,038 | $ | 31,801,853 | $ | (765,644 | ) | $ | 31,036,209 | |||||||
Intermediate | 2,265,504,342 | 119,051,827 | (9,770,865 | ) | 109,280,962 | |||||||||||
AMT Free | 63,642,400 | 3,298,411 | (117,707 | ) | 3,180,704 | |||||||||||
National | 1,616,697,770 | 82,078,191 | (39,424,249 | ) | 42,653,942 | |||||||||||
High Yield | 1,637,366,124 | 56,886,246 | (170,095,907 | ) | (113,209,661 | ) | ||||||||||
California | 182,098,985 | 10,167,201 | (3,494,543 | ) | 6,672,658 | |||||||||||
New Jersey | 112,324,272 | 6,290,538 | (3,652,949 | ) | 2,637,589 | |||||||||||
New York | 252,742,220 | 13,652,970 | (5,731,300 | ) | 7,921,670 | |||||||||||
213
Notes to Financial Statements (continued)
The difference between book-basis and tax-basis unrealized gains (losses) is attributable to the tax treatment of accretion on market discount, tender option bond trusts and other temporary adjustments.
Permanent items identified during the fiscal year ended September 30, 2011 have been reclassified among the components of net assets based on their tax basis treatment as follows:
Undistributed Excess of) Net Investment Income | Accumulated Net Realized Gain (Loss) | Paid-in Capital | ||||||||||
Short Duration | $ | 51,932 | $ | 1,390 | $ | (53,322 | ) | |||||
Intermediate | 42,202 | 44,533 | (86,735 | ) | ||||||||
AMT Free | 32,920 | 565 | (33,485 | ) | ||||||||
National | (294,179 | ) | 450,720 | (156,541 | ) | |||||||
High Yield | (259,758 | ) | 402,291 | (142,533 | ) | |||||||
California | (1,595 | ) | 36,585 | (34,990 | ) | |||||||
New Jersey | 8,825 | (8,825 | ) | – | ||||||||
New York | (4,883 | ) | 4,883 | – | ||||||||
The permanent differences are attributable to the tax treatment of accretion on market discount, certain expenses and the expiration of capital loss carryforwards.
On December 22, 2010, the Regulated Investment Company Modernization Act of 2010 (the “Modernization Act”) was signed by the President. The Modernization Act includes numerous provisions that generally become effective for taxable years beginning after the date of enactment. Management is currently assessing the impact of the Modernization Act as it relates to the Funds.
5. PORTFOLIO SECURITIES TRANSACTIONS
Purchases and sales of investment securities (excluding short-term investments) for the fiscal year ended September 30, 2011 were as follows:
| Purchases | Sales | |||||||
Short Duration | $ | 731,763,685 | $ | 719,929,650 | ||||
Intermediate | 1,215,320,764 | 793,757,602 | ||||||
AMT Free | 80,155,449 | 18,835,019 | ||||||
National | 1,480,566,100 | 1,597,833,864 | ||||||
High Yield | 722,116,032 | 1,150,388,965 | ||||||
California | 73,434,726 | 86,283,608 | ||||||
New Jersey | 27,779,095 | 35,604,648 | ||||||
New York | 134,633,051 | 157,340,168 | ||||||
There were no purchases or sales of U.S. Government securities for the fiscal year ended September 30, 2011.
6. ��DIRECTORS’ REMUNERATION
The Company’s officers and the two Directors who are associated with Lord Abbett do not receive any compensation from the Company for serving in such capacities. Outside Directors’ fees are allocated among all Lord Abbett-sponsored funds based on the net assets of each fund. There is an equity-based plan available to all outside Directors under which outside Directors must defer
214
Notes to Financial Statements (continued)
receipt of a portion of, and may elect to defer receipt of an additional portion of Directors’ fees. The deferred amounts are treated as though equivalent dollar amounts had been invested in the funds. Such amounts and earnings accrued thereon are included in Directors’ fees on the Statements of Operations and in Directors’ fees payable on the Statements of Assets and Liabilities and are not deductible for U.S. federal income tax purposes until such amounts are paid.
7. EXPENSE REDUCTIONS
The Company has entered into an arrangement with its transfer agent and custodian, whereby credits realized as a result of uninvested cash balances are used to reduce a portion of each Fund’s expenses.
8. LINE OF CREDIT
Short Duration, High Yield and certain other funds managed by Lord Abbett have available an unsecured revolving credit facility (“Facility”) from State Street Bank and Trust Company (“SSB”), to be used for temporary or emergency purposes as an additional source of liquidity to fund redemptions of investor shares. The Facility is renewed annually under terms that depend on market conditions at the time of the renewal. The amount available under the Facility is $200,000,000. The annual fee to maintain the Facility (of which each participating fund pays its pro rata share based on the net assets of each participating fund) is ..15% of the amount available under the Facility. This amount is included in Other expenses on the Funds’ Statements of Operations. In connection with the annual renewal period that commenced December 4, 2009, the Funds paid an upfront commitment fee of .05%, which was amortized through Other expenses on the Statements of Operations over the annual period of the Facility.
On November 22, 2010, Short Duration, High Yield and certain other funds managed by Lord Abbett entered into a short term extension of the Facility through February 2, 2011. On February 3, 2011, the Facility was renewed for an annual period by Short Duration, High Yield and certain other funds managed by Lord Abbett. The amount available under the Facility remained the same. The annual fee to maintain the Facility was reduced from .15% to .125% and the upfront commitment fee of ..05% was removed. Any borrowings under this Facility will bear interest at current market rates as set forth in the credit agreement. During the fiscal year ended September 30, 2011, a participating fund managed by Lord Abbett utilized the Facility and fully repaid its borrowings. As of September 30, 2011, there were no loans outstanding pursuant to this Facility.
9. CUSTODIAN AND ACCOUNTING AGENT
SSB is the Company’s custodian and accounting agent. SSB performs custodial, accounting and recordkeeping functions relating to portfolio transactions and calculating each Fund’s NAV.
10. INVESTMENT RISKS
Each Fund’s performance and the fair value of its investments will vary in response to changes in interest rates and other market factors. As interest rates rise, a Fund’s investments typically will lose value. This risk is usually greater for long-term bonds and particularly for inverse floaters than for shorter-term bonds. As a result, each Fund, to the extent it invests in long-term bonds and inverse floaters, is subject to such greater market risk.
215
Notes to Financial Statements (continued)
Additional risks that could reduce each Fund’s performance or increase volatility include call risk, credit risk, derivatives risk, extension risk, governmental risk, industry risk, liquidity risk, market and portfolio management risks, state and territory risks, and taxability risk. Credit risk varies among states based upon the economic and fiscal conditions of each state and the municipalities within the state.
There is the risk that an issuer of a municipal bond may fail to make timely payments of principal or interest to a Fund, a risk that is greater with municipal bonds rated below investment grade (sometimes called “lower rated bonds” or “junk bonds”). High Yield invests a significant portion of its assets in such bonds. AMT Free and National may invest up to 35% and all other Funds (excluding High Yield) may invest up to 20% of their respective assets in such bonds. Some issuers, particularly of junk bonds, may default as to principal and/or interest payments after a Fund purchases their securities. A default, or concerns in the market about an increase in risk of default or the deterioration in the creditworthiness of an issuer, may result in losses to the Fund. Junk bonds are considered predominantly speculative by traditional investment standards. In addition, the market for lower rated municipal bonds generally is less liquid than the market for higher rated bonds, subjecting them to greater price fluctuations which could result in losses.
Each of High Yield, California, New Jersey and New York is non-diversified, which means that it may invest a greater portion of its assets in a single issuer than a diversified fund. Thus, it may be exposed to greater risk.
Because each of California, New Jersey and New York focuses on a particular state or territory, each Fund’s performance may be more affected by local, state and regional factors than a Fund that invests in municipal bonds issued in many states. These factors may include, for example, economic or political developments, erosion of the tax base and the possibility of credit problems. In addition, downturns or developments in the U.S. economy or in foreign economies or significant world events may harm the performance of any of the Funds (including Short Duration, Intermediate, AMT Free, National, and High Yield), and may do so disproportionately as a result of the corresponding disproportionate impact of such occurrences on particular state, territory, or local economies.
Each Fund (except AMT Free and High Yield) may invest up to 20% of its net assets in private activity bonds (sometimes called “AMT paper”). AMT Free may not invest in AMT paper. High Yield may invest up to 100% of its net assets in AMT paper. The credit quality of such bonds usually is directly related to the credit standing of the private user of the facilities.
Each Fund may invest no more than 20% of its net assets in TOB Residuals, except High Yield, which may invest up to 100% of its net assets in TOB Residuals. A TOB Residual, sometimes referred to as an inverse floater or a residual interest bond (“RIB”), is a type of “derivative” debt instrument with a floating or variable interest rate that moves in the opposite direction of the interest rate on another specific fixed-rate security (“specific fixed-rate security”). Changes in the interest rate on the specific fixed-rate security inversely affect the residual interest paid on the TOB Residual, with the result that when interest rates rise, TOB Residuals’ interest payments are lowered and their value falls faster than securities similar to the specific fixed-rate security. When interest rates fall, not only do TOB Residuals generally provide interest payments that are higher than securities similar to the specific fixed-rate security, but their values generally also rise faster than such similar securities.
216
Notes to Financial Statements (continued)
In addition, loss may result from a Fund’s investments in certain derivative transactions such as futures contracts, swap transactions, interest rate caps, inverse floaters and similar transactions. These instruments may be leveraged so that small changes may produce disproportionate and substantial losses to the Fund. They also may increase a Fund’s interest rate risk.
Each Fund may purchase securities on a forward commitment or when-issued basis. Delivery and payment for such securities can take place a month or more after the transaction date. During this period such securities are subject to market fluctuations.
11. SUMMARY OF CAPITAL TRANSACTIONS
Transactions in shares of capital stock were as follows:
| Short Duration | Year Ended September 30, 2011 | Year Ended September 30, 2010 | ||||||||||||||
| Class A Shares | Shares | Amount | Shares | Amount | ||||||||||||
Shares sold | 39,424,502 | $ | 620,377,830 | 71,961,667 | $ | 1,125,197,733 | ||||||||||
Reinvestment of distributions | 980,563 | 15,407,656 | 814,851 | 12,777,127 | ||||||||||||
Shares reacquired | (45,428,357 | ) | (713,037,931 | ) | (27,886,434 | ) | (436,625,587 | ) | ||||||||
Increase (decrease) | (5,023,292 | ) | $ | (77,252,445 | ) | 44,890,084 | $ | 701,349,273 | ||||||||
| Class C Shares | ||||||||||||||||
Shares sold | 5,250,502 | $ | 82,606,872 | 10,868,156 | $ | 170,008,985 | ||||||||||
Reinvestment of distributions | 107,965 | 1,696,709 | 72,976 | 1,144,662 | ||||||||||||
Shares reacquired | (5,798,281 | ) | (91,023,998 | ) | (3,247,957 | ) | (50,910,605 | ) | ||||||||
Increase (decrease) | (439,814 | ) | $ | (6,720,417 | ) | 7,693,175 | $ | 120,243,042 | ||||||||
| Class F Shares | ||||||||||||||||
Shares sold | 19,278,675 | $ | 303,126,692 | 20,366,006 | $ | 318,836,715 | ||||||||||
Reinvestment of distributions | 218,750 | 3,438,004 | 110,667 | 1,737,795 | ||||||||||||
Shares reacquired | (14,382,150 | ) | (225,812,697 | ) | (8,945,443 | ) | (140,154,287 | ) | ||||||||
Increase | 5,115,275 | $ | 80,751,999 | 11,531,230 | $ | 180,420,223 | ||||||||||
| Class I Shares | ||||||||||||||||
Shares sold | 859,524 | $ | 13,530,756 | 190,275 | $ | 2,980,288 | ||||||||||
Reinvestment of distributions | 5,599 | 88,133 | 1,862 | 29,169 | ||||||||||||
Shares reacquired | (605,760 | ) | (9,559,153 | ) | (269,949 | ) | (4,195,948 | ) | ||||||||
Increase (decrease) | 259,363 | $ | 4,059,736 | (77,812 | ) | $ | (1,186,491 | ) | ||||||||
| Intermediate | Year Ended September 30, 2011 | Year Ended September 30, 2010 | ||||||||||||||
| Class A Shares | Shares | Amount | Shares | Amount | ||||||||||||
Shares sold | 63,027,315 | $ | 649,441,782 | 78,135,453 | $ | 803,639,988 | ||||||||||
Converted from Class B* | 35,278 | 360,887 | 29,352 | 301,127 | ||||||||||||
Reinvestment of distributions | 2,944,250 | 30,127,479 | 2,443,521 | 25,093,619 | ||||||||||||
Shares reacquired | (59,480,984 | ) | (604,834,882 | ) | (32,792,408 | ) | (335,909,095 | ) | ||||||||
Increase | 6,525,859 | $ | 75,095,266 | 47,815,918 | $ | 493,125,639 | ||||||||||
217
Notes to Financial Statements (continued)
| Intermediate | Year Ended September 30, 2011 | Year Ended September 30, 2010 | ||||||||||||||
| Class B Shares | Shares | Amount | Shares | Amount | ||||||||||||
Shares sold | 37,468 | $ | 380,027 | 267,161 | $ | 2,723,113 | ||||||||||
Reinvestment of distributions | 12,890 | 131,653 | 13,189 | 135,224 | ||||||||||||
Shares reacquired | (127,458 | ) | (1,292,579 | ) | (131,062 | ) | (1,342,093 | ) | ||||||||
Converted to Class A* | (35,312 | ) | (360,887 | ) | (29,378 | ) | (301,127 | ) | ||||||||
Increase (decrease) | (112,412 | ) | $ | (1,141,786 | ) | 119,910 | $ | 1,215,117 | ||||||||
| Class C Shares | ||||||||||||||||
Shares sold | 16,950,943 | $ | 174,446,587 | 23,263,855 | $ | 238,966,887 | ||||||||||
Reinvestment of distributions | 681,105 | 6,960,720 | 419,674 | 4,310,802 | ||||||||||||
Shares reacquired | (11,583,602 | ) | (117,445,031 | ) | (4,022,405 | ) | (41,213,101 | ) | ||||||||
Increase | 6,048,446 | $ | 63,962,276 | 19,661,124 | $ | 202,064,588 | ||||||||||
| Class F Shares | ||||||||||||||||
Shares sold | 45,156,440 | $ | 461,870,690 | 24,155,356 | $ | 249,071,167 | ||||||||||
Reinvestment of distributions | 631,744 | 6,462,834 | 287,251 | 2,963,585 | ||||||||||||
Shares reacquired | (22,800,469 | ) | (232,064,976 | ) | (5,344,090 | ) | (54,850,955 | ) | ||||||||
Increase | 22,987,715 | $ | 236,268,548 | 19,098,517 | $ | 197,183,797 | ||||||||||
| Period Ended September 30, 2011† | ||||||||
| Class I Shares | Shares | Amount | ||||||
Shares sold | 243,673 | $ | 2,516,668 | |||||
Reinvestment of distributions | 1,850 | 19,304 | ||||||
Shares reacquired | (579 | ) | (6,018 | ) | ||||
Increase | 244,944 | $ | 2,529,954 | |||||
| Year Ended September 30, 2011 | Year Ended September 30, 2010 | |||||||||||||||
| Class P Shares | Shares | Amount | Shares | Amount | ||||||||||||
Reinvestment of distributions | 45.581 | $ | 469 | 44 | $ | 448 | ||||||||||
Increase | 45.581 | $ | 469 | 44 | $ | 448 | ||||||||||
| AMT | Period Ended September 30, 2011†† | |||||||
| Class A Shares | Shares | Amount | ||||||
Shares sold | 4,597,265 | $ | 66,615,105 | |||||
Reinvestment of distributions | 32,339 | 470,929 | ||||||
Shares reacquired | (499,723 | ) | (7,263,033 | ) | ||||
Increase | 4,129,881 | $ | 59,823,001 | |||||
| Class C Shares | ||||||||
Shares sold | 186,329 | $ | 2,717,662 | |||||
Reinvestment of distributions | 1,478 | 21,699 | ||||||
Shares reacquired | (19,849 | ) | (292,045 | ) | ||||
Increase | 167,958 | $ | 2,447,316 | |||||
218
Notes to Financial Statements (continued)
| AMT | Period Ended September 30, 2011†† | |||||||
| Class F Shares | Shares | Amount | ||||||
Shares sold | 264,174 | $ | 3,898,933 | |||||
Reinvestment of distributions | 1,320 | 19,497 | ||||||
Shares reacquired | (15,663 | ) | (232,333 | ) | ||||
Increase | 249,831 | $ | 3,686,097 | |||||
| Class I Shares | ||||||||
Shares sold | 670 | $ | 10,055 | |||||
Reinvestment of distributions | 31 | 442 | ||||||
Increase | 701 | $ | 10,497 | |||||
| National | Year Ended September 30, 2011 | Year Ended September 30, 2010 | ||||||||||||||
| Class A Shares | Shares | Amount | Shares | Amount | ||||||||||||
Shares sold | 19,282,466 | $ | 199,147,184 | 21,235,201 | $ | 223,844,836 | ||||||||||
Converted from Class B* | 332,348 | 3,389,830 | 268,052 | 2,819,680 | ||||||||||||
Reinvestment of distributions | 5,045,526 | 51,645,948 | 3,540,613 | 37,287,828 | ||||||||||||
Shares reacquired | (38,999,284 | ) | (397,196,646 | ) | (15,911,806 | ) | (167,227,479 | ) | ||||||||
Shares issued in reorganizations (See Note 12) | 55,034,359 | 566,853,901 | – | – | ||||||||||||
Increase | 40,695,415 | $ | 423,840,217 | 9,132,060 | $ | 96,724,865 | ||||||||||
| Class B Shares | ||||||||||||||||
Shares sold | 21,915 | $ | 229,993 | 255,241 | $ | 2,679,663 | ||||||||||
Reinvestment of distributions | 35,193 | 362,553 | 51,910 | 548,897 | ||||||||||||
Shares reacquired | (339,361 | ) | (3,453,132 | ) | (295,533 | ) | (3,107,215 | ) | ||||||||
Converted to Class A* | (330,715 | ) | (3,389,830 | ) | (266,732 | ) | (2,819,680 | ) | ||||||||
Decrease | (612,968 | ) | $ | (6,250,416 | ) | (255,114 | ) | $ | (2,698,335 | ) | ||||||
| Class C Shares | ||||||||||||||||
Shares sold | 2,975,419 | $ | 30,940,944 | 6,142,749 | $ | 64,775,823 | ||||||||||
Reinvestment of distributions | 357,691 | 3,672,942 | 332,014 | 3,503,280 | ||||||||||||
Shares reacquired | (4,969,746 | ) | (50,492,778 | ) | (2,374,291 | ) | (24,977,085 | ) | ||||||||
Increase (decrease) | (1,636,636 | ) | $ | (15,878,892 | ) | 4,100,472 | $ | 43,302,018 | ||||||||
| Class F Shares | ||||||||||||||||
Shares sold | 3,623,729 | $ | 37,684,526 | 4,378,492 | $ | 46,071,765 | ||||||||||
Reinvestment of distributions | 141,747 | 1,451,505 | 69,845 | 738,606 | ||||||||||||
Shares reacquired | (4,750,839 | ) | (48,955,530 | ) | (1,420,273 | ) | (14,966,177 | ) | ||||||||
Shares issued in reorganizations | 2,276,678 | 23,427,016 | – | – | ||||||||||||
Increase | 1,291,315 | $ | 13,607,517 | 3,028,064 | $ | 31,844,194 | ||||||||||
219
Notes to Financial Statements (continued)
| National | Year Ended September 30, 2011 | Period Ended September 30, 2010†† † | ||||||||||||||
| Class I Shares | Shares | Amount | Shares | Amount | ||||||||||||
Shares sold | – | (a) | $ | 5 | 948 | $ | 10,040 | |||||||||
Reinvestment of distributions | 52 | 529 | 9 | 95 | ||||||||||||
Increase | 52 | $ | 534 | 957 | $ | 10,135 | ||||||||||
| High Yield | Year Ended September 30, 2011 | Year Ended September 30, 2010 | ||||||||||||||
| Class A Shares | Shares | Amount | Shares | Amount | ||||||||||||
Shares sold | 30,917,948 | $ | 342,129,561 | 49,032,325 | $ | 561,763,735 | ||||||||||
Reinvestment of distributions | 4,006,922 | 44,193,007 | 4,329,512 | 49,646,395 | ||||||||||||
Shares reacquired | (56,467,566 | ) | (628,270,128 | ) | (33,638,482 | ) | (384,155,980 | ) | ||||||||
Increase (decrease) | (21,542,696 | ) | $ | (241,947,560 | ) | 19,723,355 | $ | 227,254,150 | ||||||||
| Class B Shares | ||||||||||||||||
Reinvestment of distributions | 50.335 | $ | 551 | 47 | $ | 546 | ||||||||||
Increase | 50.335 | $ | 551 | 47 | $ | 546 | ||||||||||
| Class C Shares | ||||||||||||||||
Shares sold | 7,052,406 | $ | 78,668,082 | 17,136,723 | $ | 196,322,008 | ||||||||||
Reinvestment of distributions | 1,474,064 | 16,248,957 | 1,457,897 | 16,720,036 | ||||||||||||
Shares reacquired | (17,326,232 | ) | (191,361,792 | ) | (8,625,445 | ) | (98,750,374 | ) | ||||||||
Increase (decrease) | (8,799,762 | ) | $ | (96,444,753 | ) | 9,969,175 | $ | 114,291,670 | ||||||||
| Class F Shares | ||||||||||||||||
Shares sold | 10,507,162 | $ | 118,515,023 | 12,750,462 | $ | 146,435,065 | ||||||||||
Reinvestment of distributions | 476,246 | 5,243,587 | 203,669 | 2,352,688 | ||||||||||||
Shares reacquired | (13,399,408 | ) | (147,758,008 | ) | (4,502,095 | ) | (51,532,277 | ) | ||||||||
Increase (decrease) | (2,416,000 | ) | $ | (23,999,398 | ) | 8,452,036 | $ | 97,255,476 | ||||||||
| Period Ended September 30, 2010†† † | ||||||||||||||||
| Class I Shares | Shares | Amount | Shares | Amount | ||||||||||||
Shares sold | 798,002 | $ | 8,801,820 | 9,451 | $ | 110,040 | ||||||||||
Reinvestment of distributions | 255 | 2,832 | 38 | 455 | ||||||||||||
Shares reacquired | (603,681 | ) | (6,641,274 | ) | – | – | ||||||||||
Increase | 194,576 | $ | 2,163,378 | 9,489 | $ | 110,495 | ||||||||||
| Year Ended September 30, 2010 | ||||||||||||||||
| Class P Shares | Shares | Amount | Shares | Amount | ||||||||||||
Reinvestment of distributions | 56.070 | $ | 618 | 53.565 | $ | 618 | ||||||||||
Increase | 56.070 | $ | 618 | 53.565 | $ | 618 | ||||||||||
220
Notes to Financial Statements (continued)
| California | Year Ended September 30, 2011 | Year Ended September 30, 2010 | ||||||||||||||
| Class A Shares | Shares | Amount | Shares | Amount | ||||||||||||
Shares sold | 2,423,887 | $ | 23,327,288 | 3,110,445 | $ | 31,129,510 | ||||||||||
Reinvestment of distributions | 515,561 | 4,966,443 | 565,121 | 5,637,608 | ||||||||||||
Shares reacquired | (3,974,335 | ) | (38,144,863 | ) | (3,157,325 | ) | (31,605,448 | ) | ||||||||
Increase (decrease) | (1,034,887 | ) | $ | (9,851,132 | ) | 518,241 | $ | 5,161,670 | ||||||||
| Class C Shares | ||||||||||||||||
Shares sold | 384,782 | $ | 3,769,410 | 855,674 | $ | 8,542,699 | ||||||||||
Reinvestment of distributions | 68,375 | 659,141 | 85,771 | 856,096 | ||||||||||||
Shares reacquired | (870,943 | ) | (8,317,705 | ) | (534,095 | ) | (5,324,873 | ) | ||||||||
Increase (decrease) | (417,786 | ) | $ | (3,889,154 | ) | 407,350 | $ | 4,073,922 | ||||||||
| Class F Shares | ||||||||||||||||
Shares sold | 1,036,996 | $ | 9,973,539 | 853,766 | $ | 8,573,989 | ||||||||||
Reinvestment of distributions | 28,581 | 275,394 | 10,107 | 101,176 | ||||||||||||
Shares reacquired | (828,389 | ) | (7,925,464 | ) | (272,481 | ) | (2,710,812 | ) | ||||||||
Increase | 237,188 | $ | 2,323,469 | 591,392 | $ | 5,964,353 | ||||||||||
| Period Ended September 30, 2011† | ||||||||
| Class I Shares | Shares | Amount | ||||||
Shares sold | 1,087 | $ | 10,045 | |||||
Reinvestment of distributions | 38 | 363 | ||||||
Increase | 1,125 | $ | 10,408 | |||||
| New Jersey | Year Ended September 30, 2011 | Year Ended September 30, 2010 | ||||||||||||||
| Class A Shares | Shares | Amount | Shares | Amount | ||||||||||||
Shares sold | 2,872,430 | $ | 13,072,414 | 2,149,782 | $ | 10,207,473 | ||||||||||
Reinvestment of distributions | 825,069 | 3,774,629 | 878,593 | 4,158,086 | ||||||||||||
Shares reacquired | (5,390,367 | ) | (24,666,709 | ) | (4,041,804 | ) | (19,100,163 | ) | ||||||||
Decrease | (1,692,868 | ) | $ | (7,819,666 | ) | (1,013,429 | ) | $ | (4,734,604 | ) | ||||||
| Class F Shares | ||||||||||||||||
Shares sold | 1,113,446 | $ | 5,228,495 | 495,420 | $ | 2,363,892 | ||||||||||
Reinvestment of distributions | 17,327 | 79,168 | 5,483 | 26,118 | ||||||||||||
Shares reacquired | (861,712 | ) | (3,927,334 | ) | (131,315 | ) | (621,017 | ) | ||||||||
Increase | 269,061 | $ | 1,380,329 | 369,588 | $ | 1,768,993 | ||||||||||
| Period Ended September 30, 2011† | ||||||||
| Class I Shares | Shares | Amount | ||||||
Shares sold | 2,273 | $ | 10,047 | |||||
Reinvestment of distributions | 74 | 335 | ||||||
Increase | 2,347 | $ | 10,382 | |||||
221
Notes to Financial Statements (continued)
| New York | Year Ended September 30, 2011 | Year Ended September 30, 2010 | ||||||||||||||
| Class A Shares | Shares | Amount | Shares | Amount | ||||||||||||
Shares sold | 3,011,463 | $ | 31,640,785 | 3,113,795 | $ | 33,397,182 | ||||||||||
Reinvestment of distributions | 617,001 | 6,435,697 | 692,090 | 7,399,779 | ||||||||||||
Shares reacquired | (5,101,187 | ) | (53,078,147 | ) | (3,544,899 | ) | (37,809,622 | ) | ||||||||
Increase (decrease) | (1,472,723 | ) | $ | (15,001,665 | ) | 260,986 | $ | 2,987,339 | ||||||||
| Class C Shares | ||||||||||||||||
Shares sold | 565,408 | $ | 5,931,487 | 1,066,555 | $ | 11,379,204 | ||||||||||
Reinvestment of distributions | 72,121 | 751,188 | 74,554 | 796,259 | ||||||||||||
Shares reacquired | (883,981 | ) | (9,124,752 | ) | (757,153 | ) | (8,085,801 | ) | ||||||||
Increase (decrease) | (246,452 | ) | $ | (2,442,077 | ) | 383,956 | $ | 4,089,662 | ||||||||
| Class F Shares | ||||||||||||||||
Shares sold | 518,654 | $ | 5,506,570 | 586,905 | $ | 6,265,561 | ||||||||||
Reinvestment of distributions | 20,782 | 216,690 | 11,039 | 119,020 | ||||||||||||
Shares reacquired | (494,411 | ) | (5,089,971 | ) | (193,741 | ) | (2,071,457 | ) | ||||||||
Increase | 45,025 | $ | 633,289 | 404,203 | $ | 4,313,124 | ||||||||||
| Period Ended September 30, 2011† | ||||||||
| Class I Shares | Shares | Amount | ||||||
Shares sold | 994 | $ | 10,045 | |||||
Reinvestment of distributions | 33 | 339 | ||||||
Increase | 1,027 | $ | 10,384 | |||||
| * | Automatic conversion of Class B shares occurs on the 25th day of the month (or, if the 25th day is not a business day, the next business day thereafter) following the eighth anniversary of the day on which the purchase order was accepted. |
| (a) | Value is less than 1 share. |
| † | For the period January 31, 2011 (commencement of operations) to September 30, 2011. |
| †† | For the period October 26, 2010 (commencement of operations) to September 30, 2011. |
| ††† | For the period July 26, 2010 (commencement of operations) to September 30, 2010. |
12. REORGANIZATIONS
As of the close of business on November 19, 2010, Short Duration, Intermediate and High Yield were redomesticated from series of the Trust into corresponding newly organized series of the Company pursuant to a plan of redomestication approved by their shareholders on November 5, 2010. Each series maintained the same name, investment objective, policies and strategies that are identical to those of its respective predecessor Trust structure.
As of the close of business on November 19, 2010, National acquired the net assets of each of the funds listed below, pursuant to a plan of reorganization approved by each Acquired Fund’s shareholders on November 5, 2010. The acquisition was accomplished by a tax-free exchange of 57,311,037 shares (valued at $590,280,917) of National and 107,952,755 shares of the Acquired Funds outstanding on November 19, 2010. The Acquired Funds’ net assets at the date of the acquisition, including $4,356,765 of unrealized depreciation, $95,025 of undistributed net investment income, and $16,280,071 of accumulated net realized losses, were combined with those
222
Notes to Financial Statements (concluded)
of National. Total shares issued by National and total net assets of the Acquired Funds, including appreciation/(depreciation), undistributed (distributions in excess of) net investment income, and accumulated net realized losses were as follows:
| Acquired Fund | Shares Issued by National | Shares Exchanged | Net Unrealized (Depreciation) | Undistributed (Distributions in Excess of) Net Investment Income | Accumulated Net Realized Loss | Total Net Assets of the Acquired Funds | ||||||||||||||||||
Connecticut | 10,584,625 | 11,120,698 | $ | (1,481,652 | ) | $ | (7,831 | ) | $ | (4,837,006 | ) | $ | 109,014,889 | |||||||||||
Georgia | 12,059,536 | 23,467,055 | (954,682 | ) | 81,755 | (4,252,963 | ) | 124,205,487 | ||||||||||||||||
Hawaii | 11,246,528 | 24,242,654 | 476,365 | 452 | (2,758,620 | ) | 115,835,572 | |||||||||||||||||
Missouri | 14,956,054 | 31,401,203 | (2,009,392 | ) | 33,575 | (3,321,157 | ) | 154,045,213 | ||||||||||||||||
Pennsylvania | 8,464,294 | 17,721,145 | (387,404 | ) | (12,926 | ) | (1,110,325 | ) | 87,179,756 | |||||||||||||||
The total net assets of National immediately before the acquisition were $1,190,394,762. Total net assets of the Acquired Funds immediately before the acquisition were $590,280,917. Total net assets of National immediately after the acquisition were $1,780,675,679.
223
Report of Independent Registered Public Accounting Firm
To the Shareholders and Board of Directors of Lord Abbett Municipal Income Fund, Inc.:
We have audited the accompanying statements of assets and liabilities, including the schedules of investments, of Lord Abbett Municipal Income Fund, Inc. (the “Funds”) comprising Lord Abbett Short Duration Tax Free Fund, Lord Abbett Intermediate Tax Free Fund, Lord Abbett AMT Free Municipal Bond Fund, Lord Abbett National Tax-Free Income Fund, Lord Abbett High Yield Municipal Bond Fund, Lord Abbett California Tax-Free Income Fund, Lord Abbett New Jersey Tax-Free Income Fund, and Lord Abbett New York Tax-Free Income Fund as of September 30, 2011, and the related statements of operations for the year then ended, the statements of changes in net assets and the financial highlights for each of the periods presented. These financial statements and financial highlights are the responsibility of the Funds’ management. Our responsibility is to express an opinion on these financial statements and financial highlights based on our audits.
We conducted our audits in accordance with the standards of the Public Company Accounting Oversight Board (United States). Those standards require that we plan and perform the audits to obtain reasonable assurance about whether the financial statements and financial highlights are free of material misstatement. The Funds are not required to have, nor were we engaged to perform, an audit of their internal control over financial reporting. Our audits included consideration of internal control over financial reporting as a basis for designing audit procedures that are appropriate in the circumstances, but not for the purpose of expressing an opinion on the effectiveness of the Funds’ internal control over financial reporting. Accordingly, we express no such opinion. An audit also includes examining, on a test basis, evidence supporting the amounts and disclosures in the financial statements, assessing the accounting principles used and significant estimates made by management, as well as evaluating the overall financial statement presentation. Our procedures included confirmation of securities owned as of September 30, 2011, by correspondence with the custodian and brokers; where replies were not received from brokers, we performed other auditing procedures. We believe that our audits provide a reasonable basis for our opinion.
In our opinion, the financial statements and financial highlights referred to above present fairly, in all material respects, the financial position of each of the Funds constituting the Lord Abbett Municipal Income Fund, Inc. as of September 30, 2011, the results of their operations for the year then ended, and the changes in their net assets and the financial highlights for each of the periods presented, in conformity with accounting principles generally accepted in the United States of America.
DELOITTE & TOUCHE LLP
New York, New York
November 21, 2011
224
Basic Information About Management
The Board of Directors (the “Board”) is responsible for the management of the business and affairs of the Company in accordance with the laws of the State of Maryland. The Board appoints officers who are responsible for the day-to-day operations of the Company and who execute policies authorized by the Board. The Board also approves an investment adviser to the Company and continues to monitor the cost and quality of the services the investment adviser provides, and annually considers whether to renew the contract with the adviser. Generally, each Director holds office until his/her successor is elected and qualified or until his/her earlier resignation or removal, as provided in the Company’s organizational documents.
Lord, Abbett & Co. LLC (“Lord Abbett”), a Delaware limited liability company, is the Company’s investment adviser.
Interested Directors
The following Directors are associated with Lord Abbett and are “interested persons” of the Company as defined in the Act. Mr. Dow and Ms. Foster are officers and directors/trustees of each of the 13 Lord Abbett-sponsored funds, which consist of 55 portfolios or series.
Name, Address and Year of Birth | Current Position and Length of Service with the Company | Principal Occupation and Other Directorships During Past Five Years | ||
Robert S. Dow Lord, Abbett & Co. LLC 90 Hudson Street Jersey City, NJ 07302 (1945) | Director since 1989 and Chairman since 1996 | Principal Occupation: Senior Partner of Lord Abbett (since 2007) and was formerly Managing Partner (1996 - 2007) and Chief Investment Officer (1995 - 2007), joined Lord Abbett in 1972.
Other Directorships: None. | ||
Daria L. Foster Lord, Abbett & Co. LLC 90 Hudson Street Jersey City, NJ 07302 (1954) | Director and President since 2006 | Principal Occupation: Managing Partner of Lord Abbett (since 2007), and was formerly Director of Marketing and Client Service, joined Lord Abbett in 1990.
Other Directorships: None. | ||
Independent Directors
The following Independent Directors also are directors/trustees of each of the 13 Lord Abbett-sponsored funds, which consist of 55 portfolios or series.
Name, Address and Year of Birth | Current Position and Length of Service with the Company | Principal Occupation and Other Directorships During Past Five Years | ||
E. Thayer Bigelow Lord, Abbett & Co. LLC c/o Legal Dept. 90 Hudson Street Jersey City, NJ 07302 (1941) | Director since 1994 | Principal Occupation: Managing General Partner, Bigelow Media, LLC (since 2000); Senior Adviser, Time Warner Inc. (1998 - 2000).
Other Directorships: Currently serves as director of Crane Co. (since 1984) and Huttig Building Products Inc. (since 1998). Previously served as a director of R.H. Donnelley Inc. (2009 - 2010) and Adelphia Communications Inc. (2003 - 2007). | ||
225
Basic Information About Management (continued)
Name, Address and Year of Birth | Current Position and Length of Service with the Company | Principal Occupation and Other Directorships During Past Five Years | ||
Robert B. Calhoun, Jr. Lord, Abbett & Co. LLC c/o Legal Dept. 90 Hudson Street Jersey City, NJ 07302 (1942) | Director since 1998 | Principal Occupation: Senior Advisor of Monitor Clipper Partners, a private equity investment fund (since 1997); President of Clipper Asset Management Corp. (1991 - 2009).
Other Directorships: Previously served as a director of Interstate Bakeries Corp. (1991 - 2008). | ||
Evelyn E. Guernsey Lord, Abbett & Co. LLC c/o Legal Dept. 90 Hudson Street Jersey City, NJ 07302 (1955) | Director since 2011 | Principal Occupation: CEO, Americas of J.P. Morgan Asset Management (2004 - 2010).
Other Directorships: None. | ||
Julie A. Hill Lord, Abbett & Co. LLC c/o Legal Dept. 90 Hudson Street Jersey City, NJ 07302 (1946) | Director since 2004 | Principal Occupation: Owner and CEO of The Hill Company, a business consulting firm (since 1998).
Other Directorships: Currently serves as director of WellPoint, Inc., a health benefits company (since 1994). Previously served as a director of Resources Connection, Inc., a consulting firm (2004 - 2007). | ||
Franklin W. Hobbs Lord, Abbett & Co. LLC c/o Legal Dept. 90 Hudson Street Jersey City, NJ 07302 (1947) | Director since 2000 | Principal Occupation: Advisor of One Equity Partners, a private equity firm (since 2004).
Other Directorships: Currently serves as a director and Chairman of the Board of Ally Financial Inc., a financial services firm (since 2009) and as a director of Molson Coors Brewing Company (since 2002). | ||
Thomas J. Neff Lord, Abbett & Co. LLC c/o Legal Dept. 90 Hudson Street Jersey City, NJ 07302 (1937) | Director since 1982 | Principal Occupation: Chairman of Spencer Stuart (U.S.), an executive search consulting firm (since 1996).
Other Directorships: Currently serves as director of Ace, Ltd. (since 1997). Previously served as a director of Hewitt Associates, Inc. (2004 - 2010). | ||
James L.L. Tullis Lord, Abbett & Co. LLC c/o Legal Dept. 90 Hudson Street Jersey City, NJ 07302 (1947) | Director since 2006 | Principal Occupation: CEO of Tullis-Dickerson and Co. Inc., a venture capital management firm (since 1990).
Other Directorships: Currently serves as director of Crane Co. (since 1998). Previously served as a director of ViaCell, Inc. (2003 - 2007). | ||
226
Basic Information About Management (continued)
Officers
None of the officers listed below have received compensation from the Company. All of the officers of the Company also may be officers of the other Lord Abbett-sponsored funds and maintain offices at 90 Hudson Street, Jersey City, NJ 07302. Unless otherwise indicated, the position(s) and title(s) listed under the “Principal Occupation During Past Five Years” column indicate each officer’s position(s) and title(s) with Lord Abbett.
Name and Year of Birth | Current Position with the Company | Length of Service of Current | Principal Occupation During Past Five Years | |||
Robert S. Dow (1945) | Chief Executive Officer and Chairman | Elected in 1996 | Senior Partner of Lord Abbett (since 2007), and was formerly Managing Partner (1996 - 2007) and Chief Investment Officer (1995 - 2007), joined Lord Abbett in 1972. | |||
Daria L. Foster (1954) | President | Elected in 2006 | Managing Partner of Lord Abbett (since 2007), and was formerly Director of Marketing and Client Service, joined Lord Abbett in 1990. | |||
Robert I. Gerber (1954) | Executive Vice President | Elected in 2006 | Partner and Chief Investment Officer (since 2007), joined Lord Abbett in 1997 as Director of Taxable Fixed Income Management. | |||
Daniel S. Solender (1965) | Executive Vice President | Elected in 2006 | Partner and Director, joined Lord Abbett in 2006 and was formerly a Vice President and Portfolio Manager at Nuveen Investments (2003 - 2006). | |||
James W. Bernaiche (1956) | Chief Compliance Officer | Elected in 2004 | Partner and Chief Compliance Officer, joined Lord Abbett in 2001. | |||
Joan A. Binstock (1954) | Chief Financial Officer and Vice President | Elected in 1999 | Partner and Chief Operations Officer, joined Lord Abbett in 1999. | |||
Daphne Car (1982) | Vice President | Elected in 2010 | Portfolio Manager, joined Lord Abbett in 2004. | |||
John K. Forst (1960) | Vice President and Assistant Secretary | Elected in 2005 | Deputy General Counsel, joined Lord Abbett in 2004. | |||
227
Basic Information About Management (concluded)
Name and Year of Birth | Current Position with the Company | Length of Service of Current | Principal Occupation During Past Five Years | |||
Philip B. Herman (1977) | Vice President | Elected in 2010 | Portfolio Manager, joined Lord Abbett in 2007 and was formerly a Portfolio Manager at Lehman Brothers Asset Management/ Neuberger Berman (2004 - 2007). | |||
Lawrence H. Kaplan (1957) | Vice President and Secretary | Elected in 1997 | Partner and General Counsel, joined Lord Abbett in 1997. | |||
| A. Edward Oberhaus, III (1959) | Vice President | Elected in 1996 | Partner and Director, joined Lord Abbett in 1983. | |||
Thomas R. Phillips (1960) | Vice President and Assistant Secretary | Elected in 2008 | Partner and Deputy General Counsel, joined Lord Abbett in 2006. | |||
Lawrence B. Stoller (1963) | Vice President and Assistant Secretary | Elected in 2007 | Partner and Senior Deputy General Counsel, joined Lord Abbett in 2007 and was formerly an Executive Vice President and the General Counsel at Cohen & Steers Capital Management, Inc. (1999 - 2007). | |||
Daniel T. Vande Velde (1967) | Vice President | Elected in 2008 | Portfolio Manager, joined Lord Abbett in 2007 and was formerly a Portfolio Manager at McDonnell Investment Management (1997 - 2007). | |||
Bernard J. Grzelak (1971) | Treasurer | Elected in 2003 | Partner and Director of Fund Administration, joined Lord Abbett in 2003. | |||
Please call 888-522-2388 for a copy of the statement of additional information (“SAI”), which contains further information about the Company’s Directors. It is available free upon request.
228
Householding
The Company has adopted a policy that allows it to send only one copy of each Fund’s prospectus, proxy material, annual report and semiannual report to certain shareholders residing at the same “household.” This reduces Fund expenses, which benefits you and other shareholders. If you need additional copies or do not want your mailings to be “householded,” please call Lord Abbett at 888-522-2388 or send a written request with your name, the name of your fund or funds and your account number or numbers to Lord Abbett Family of Funds, P.O. Box 219336, Kansas City, MO 64121.
Proxy Voting Policies, Procedures and Records
A description of the policies and procedures that Lord Abbett uses to vote proxies related to each Fund’s portfolio securities, and information on how Lord Abbett voted each Fund’s proxies during the 12-month period ended June 30 are available without charge, upon request, (i) by calling 888-522-2388; (ii) on Lord Abbett’s Website at www.lordabbett.com; and (iii) on the Securities and Exchange Commission’s (“SEC”) Website at www.sec.gov.
Shareholder Reports and Quarterly Portfolio Disclosure
The Funds are required to file their complete schedule of portfolio holdings with the SEC for their first and third fiscal quarters on Form N-Q. Copies of the filings are available without charge, upon request on the SEC’s Website at www.sec.gov and may be available by calling Lord Abbett at 888-522-2388. You can also obtain copies of Form N-Q by visiting the SEC’s Public Reference Room in Washington, DC (information on the operation of the Public Reference Room may be obtained by calling 800-SEC-0330).
Tax Information
100% of the income distributions paid by each Fund, other than High Yield and New Jersey, during the fiscal year ended September 30, 2011 is tax-exempt dividend income.
The following percentages reflect the portion of the income distributions paid by the below mentioned Funds during the fiscal year ended September 30, 2011 that is tax-exempt dividend income:
Fund Name | ||||
High Yield | 98.7 | % | ||
New Jersey | 98.6 | % | ||
229


This report, when not used for the general information of shareholders of the Fund, is to be distributed only if preceded or accompanied by a current fund prospectus.
Lord Abbett mutual fund shares are distributed by LORD ABBETT DISTRIBUTOR LLC.
Lord Abbett Municipal Income Fund, Inc.
Lord Abbett Short Duration Tax Free Fund
Lord Abbett Intermediate Tax Free Fund
Lord Abbett AMT Free Municipal Bond Fund
Lord Abbett National Tax-Free Income Fund
Lord Abbett High Yield Municipal Bond Fund
Lord Abbett California Tax-Free Income Fund
Lord Abbett New Jersey Tax-Free Income Fund
Lord Abbett New York Tax-Free Income Fund
LATFI-2-0911
(11/11)
| Item 2: | Code of Ethics. |
| (a) | In accordance with applicable requirements, the Registrant adopted a Sarbanes-Oxley Code of Ethics on June 19, 2003 that applies to the principal executive officer and senior financial officers of the Registrant (“Code of Ethics”). The Code of Ethics was in effect during the fiscal year ended September 30, 2011 (the “Period”). |
| (b) | Not applicable. |
| (c) | The Registrant has not amended the Code of Ethics as described in Form N-CSR during the Period. |
| (d) | The Registrant has not granted any waiver, including an implicit waiver, from a provision of the Code of Ethics as described in Form N-CSR during the Period. |
| (e) | Not applicable. |
| (f) | See Item 12(a)(1) concerning the filing of the Code of Ethics. The Registrant will provide a copy of the Code of Ethics to any person without charge, upon request. To obtain a copy, please call Lord Abbett at 888-522-2388. |
| Item 3: | Audit Committee Financial Expert. |
| The Registrant’s board of directors has determined that each of the following independent directors who are members of the audit committee is an audit committee financial expert: E. Thayer Bigelow, Robert B. Calhoun Jr., and James L.L. Tullis. Each of these persons is independent within the meaning of the Form N-CSR. |
| Item 4: | Principal Accountant Fees and Services. |
| In response to sections (a), (b), (c) and (d) of Item 4, the aggregate fees billed to the Registrant for the fiscal years ended September 30, 2011 and 2010 by the Registrant’s principal accounting firm, Deloitte & Touche LLP, the member firms of Deloitte Touche Tohmatsu and their respective affiliates (collectively, “Deloitte”) were as follows: |
| Fiscal year ended: | ||||
| 2011 | 2010 | |||
Audit Fees {a} | $283,000 | $231,500 | ||
Audit-Related Fees | - 0 - | - 0 - | ||
| ||||
Total audit and audit-related fees | 283,000 | 231,500 | ||
| ||||
Tax Fees {b} | 45,724 | 38,426 | ||
All Other Fees | - 0 - | - 0 - | ||
| ||||
Total Fees | $328,724 | $269,926 | ||
| ||||
{a} Consists of fees for audits of the Registrant’s annual financial statements.
{b} Fees for the fiscal year ended September 30, 2011 and 2010 consist of fees for preparing the U.S. Income Tax Return for Regulated Investment Companies, New Jersey Corporation Business Tax Return, New Jersey Annual Report Form, U.S. Return of Excise Tax on Undistributed Income of Investment Companies, IRS Forms 1099-MISC and 1096 Annual Summary and Transmittal of U.S. Information Returns.
(e) (1) Pursuant to Rule 2-01(c) (7) of Regulation S-X, the Registrant’s Audit Committee has adopted pre-approval policies and procedures. Such policies and procedures generally provide that the Audit Committee must pre-approve:
| • | any audit, audit-related, tax, and other services to be provided to the Lord Abbett Funds, including the Registrant, and |
| • | any audit-related, tax, and other services to be provided to the Registrant’s investment adviser and any entity controlling, controlled by or under common control with the investment adviser that provides ongoing services to one or more Funds comprising the Registrant if the engagement relates directly to operations and financial reporting of a Fund, by the independent auditor to assure that the provision of such services does not impair the auditor’s independence. |
The Audit Committee has delegated pre-approval authority to its Chairman, subject to a fee limit of $10,000 per event, and not to exceed $25,000 annually. The Chairman will report any pre-approval decisions to the Audit Committee at its next scheduled meeting. Unless a type of service to be provided by the independent auditor has received general pre-approval, it must be pre-approved by the Audit Committee. Any proposed services exceeding pre-approved cost levels will require specific pre-approval by the Audit Committee.
(e) (2) The Registrant’s Audit Committee has approved 100% of the services described in this Item 4 (b) through (d).
(f) Not applicable.
(g) The aggregate non-audit fees billed by Deloitte for services rendered to the Registrant are shown above in the response to Item 4 (a), (b), (c) and (d) as “All Other Fees”.
The aggregate non-audit fees billed by Deloitte for services rendered to the Registrant’s investment adviser, Lord, Abbett & Co. LLC (“Lord Abbett”), for the fiscal years ended September 30, 2011 and 2010 were:
| Fiscal year ended: | ||||
| 2011 | 2010 | |||
All Other Fees {a} | $172,220 | $171,360 | ||
{a} Consist of fees for Independent Services Auditors’ Report on Controls Placed in Operation and Tests of Operating Effectiveness related to Lord Abbett’s Asset Management Services (“SAS 70 Report”).
The aggregate non-audit fees billed by Deloitte for services rendered to entities under the common control of Lord Abbett for the fiscal years ended September 30, 2011 and 2010 were:
| Fiscal year ended: | ||||
| 2011 | 2010 | |||
All Other Fees | $ - 0 - | $ - 0- | ||
(h) The Registrant’s Audit Committee has considered the provision of non-audit services that were rendered to the Registrant’s investment adviser, and any entity controlling, controlled by or under common control with the investment adviser that provides ongoing services to the Registrant, that were not pre-approved pursuant to Rule 2-01 (c)(7)(ii) of Regulation S-X and has determined that the provision of such services is compatible with maintaining Deloitte’s independence.
| Item 5: | Audit Committee of Listed Registrants. |
| Not applicable. |
| Item 6: | Investments. |
| Not applicable. |
| Item 7: | Disclosure of Proxy Voting Policies and Procedures for Closed-End Management Investment Companies. |
| Not applicable. |
| Item 8: | Portfolio Managers of Closed-End Management Investment Companies. |
| Not applicable. |
| Item 9: | Purchases of Equity Securities by Closed-End Management Investment Company and Affiliated Purchasers. |
| Not applicable. |
| Item 10: | Submission of Matters to a Vote of Security Holders. |
| Not applicable. |
| Item 11: | Controls and Procedures. |
| (a) | Based on their evaluation of the Registrant’s disclosure controls and procedures (as defined in Rule 30a-3(c) under the Investment Company Act of 1940) as of a date within 90 days prior to the filing date of this report, the Chief Executive Officer and Chief Financial Officer of the Registrant have concluded that such disclosure controls and procedures are reasonably designed and effective to ensure that material information relating to the Registrant, including its consolidated subsidiaries, is made known to them by others within those entities. |
| (b) | There were no changes in the Registrant’s internal control over financial reporting (as defined in Rule 30a-3(d) under the Investment Company Act of 1940) that occurred during the second fiscal quarter of the period covered by this report that have materially affected, or are reasonably likely to materially affect, the Registrant’s internal control over financial reporting. |
| Item 12: | Exhibits. |
| (a)(1) | Amendments to Code of Ethics – Not applicable. |
| (a)(2) | Certification of each principal executive officer and principal financial officer of the Registrant as required by Rule 30a-2 under the Investment Company Act of 1940 is attached hereto as a part of EX-99.CERT. |
| (a)(3) | Not applicable. |
| (b) | Certification of each principal executive officer and principal financial officer of the Registrant as required by Section 906 of the Sarbanes-Oxley Act of 2002 is provided as a part of EX-99.906CERT. |
SIGNATURES
Pursuant to the requirements of the Securities Exchange Act of 1934 and the Investment Company Act of 1940, the Registrant has duly caused this report to be signed on its behalf by the undersigned, thereunto duly authorized.
| LORD ABBETT MUNICIPAL INCOME FUND, INC. | ||
| By: | /s/ Robert S. Dow | |
| Robert S. Dow | ||
| Chief Executive Officer and Chairman | ||
Date: November 17, 2011
| By: | /s/ Joan A. Binstock | |
| Joan A. Binstock | ||
| Chief Financial Officer and Vice President |
Date: November 17, 2011
Pursuant to the requirements of the Securities Exchange Act of 1934 and the Investment Company Act of 1940, this report has been signed below by the following persons on behalf of the Registrant and in the capacities and on the dates indicated.
| By: | /s/ Robert S. Dow | |||||
| Robert S. Dow | ||||||
| Chief Executive Officer and Chairman | ||||||
| Date: November 17, 2011 | ||||||
| By: | /s/ Joan A. Binstock | |||||
| Joan A. Binstock | ||||||
| Chief Financial Officer and Vice President | ||||||
| Date: November 17, 2011 | ||||||