UNITED STATES
SECURITIES AND EXCHANGE COMMISSION
Washington, D.C. 20549
FORM N-CSR
CERTIFIED SHAREHOLDER REPORT OF REGISTERED MANAGEMENT
INVESTMENT COMPANIES
Investment Company Act file number: | | 811-03981 |
| |
Exact name of registrant as specified in charter: | | Prudential World Fund, Inc. |
| |
Address of principal executive offices: | | Gateway Center 3 100 Mulberry Street Newark, New Jersey 07102 |
| |
Name and address of agent for service: | | Jonathan D. Shain Gateway Center 3 100 Mulberry Street Newark, New Jersey 07102 |
| |
Registrant’s telephone number, including area code: | | 973-802-6469 |
| |
Date of fiscal year end: | | October 31, 2003 |
| |
Date of reporting period: | | October 31, 2003 |
Item 1 – Reports to Stockholders
[SHAREHOLDER REPORT TO BE INSERTED HERE IN THE EDGAR VERSION]
Jennison Global Growth Fund
Formerly known as Prudential Global Growth Fund
|
| OCTOBER 31, 2003 | | ANNUAL REPORT |

FUND TYPE
Global stock
OBJECTIVE
Long-term growth of capital
This report is not authorized for distribution to prospective investors unless preceded or accompanied by a current prospectus.
The views expressed in this report and information about the Fund’s portfolio holdings are for the period covered by this report and are subject to change thereafter.
JennisonDryden is a service mark of The Prudential Insurance Company of America.

Dear Shareholder,
December 16, 2003
As you may know, the mutual fund industry recently has been the subject of much media attention. There has been press coverage of Prudential, and recently, administrative complaints were filed against Prudential Securities* and some of its former brokers and branch managers in Massachusetts. As president of your Fund, I’d like to provide you with an update on the issues as they pertain to JennisonDryden mutual funds.
State and federal authorities have requested information regarding trading practices from many mutual fund companies across the nation. Our fund family has been cooperating with inquiries it has received, and at the same time, Prudential Financial, Inc. has been conducting its own internal review. This review encompasses the policies, systems, and procedures of our fund family, Prudential Financial’s investment units and its proprietary distribution channels, including the former Prudential Securities. The review also includes mutual fund trading activity by investment professionals who manage our funds.
Market timing
Prudential Investments LLC, the Fund’s investment manager, has actively discouraged disruptive market timing, and for years, our mutual fund prospectuses have identified and addressed this issue. Prudential Investments has established operating policies and procedures that are designed to detect and deter frequent trading activities that would be disruptive to the management of our mutual fund portfolios, and has rejected numerous orders placed by market timers in the past.
* Prudential Investments LLC, the manager of JennisonDryden mutual funds, and Prudential Investment Management Services LLC, the distributor of the funds, are part of the Investment Management segment of Prudential Financial, Inc. and are separate legal entities from the entity formerly known as Prudential Securities Incorporated, a retail brokerage firm. In February 2003, Prudential Financial and Wachovia Corporation announced they were combining their retail brokerage forces. The transaction was completed in July 2003. Wachovia Corporation has a 62% interest in the new firm, which is now known as Wachovia Securities LLC, and Prudential Financial owns the remaining 38%.
Late trading
The Securities and Exchange Commission requires that orders to purchase or redeem mutual fund shares be received either by the fund or by an intermediary (such as a broker, financial adviser, or 401(k) record keeper) before the time at which the fund calculates its net asset value (normally 4:00 p.m., Eastern time) if they are to receive that day’s price. The policies of our mutual funds do not make and have not made allowances for the practice known as “late trading”.
For more than 40 years we have offered investors quality investment products, financial guidance, and responsive customer service. Today we remain committed to this heritage and to the highest ethical principles in our investment practices.
Sincerely,

Judy A. Rice, President
Prudential World Fund, Inc./Jennison Global Growth Fund
| Prudential World Fund, Inc./Jennison Global Growth Fund | | 1 |
Your Fund’s Performance
Fund Objective
The investment objective of the Jennison Global Growth Fund (the Fund) is long-term growth of capital. There can be no assurance that the Fund will achieve its investment objective. Effective November 21, 2003, the Prudential Pacific Growth Fund, Inc. and the Prudential Europe Growth Fund, Inc. were merged into the Jennison Global Growth Fund, which is a series of Prudential World Fund, Inc.
|
| Cumulative Total Returns1 as of 10/31/03 | |
| | | One Year | | | Five Years | | | Ten Years | | | Since Inception2 | |
Class A | | 24.58 | % | | 8.02 | % | | 72.40 | % | | 123.58 | % |
|
Class B | | 23.95 | | | 4.64 | | | 61.32 | | | 444.11 | |
|
Class C | | 23.66 | | | 4.24 | | | N/A | | | 48.06 | |
|
Class Z | | 24.90 | | | 9.30 | | | N/A | | | 41.07 | |
|
MSCI World Index3 | | 23.71 | | | –0.92 | | | 82.78 | | | *** | |
|
Lipper Global Funds Avg.4 | | 23.59 | | | 17.23 | | | 107.19 | | | **** | |
|
| | | | | | | | | | | | | |
|
| Average Annual Total Returns1 as of 9/30/03 | |
| | | One Year | | | Five Years | | | Ten Years | | | Since Inception2 | |
Class A | | 21.37 | % | | 0.33 | % | | 4.93 | % | | 5.16 | % |
|
Class B | | 22.14 | | | 0.58 | | | 4.77 | | | 8.89 | |
|
Class C | | 24.53 | | | 0.45 | | | N/A | | | 3.54 | |
|
Class Z | | 28.10 | | | 1.61 | | | N/A | | | 3.75 | |
|
MSCI World Index3 | | 25.40 | | | 0.39 | | | 5.89 | | | *** | |
|
Lipper Global Funds Avg.4 | | 23.38 | | | 3.09 | | | 7.18 | | | **** | |
|
Past performance is not indicative of future results. Principal value and investment return will fluctuate so that an investor’s shares, when redeemed, may be worth more or less than their original cost. 1Source: Prudential Investments LLC and Lipper Inc. The cumulative total returns do not take into account applicable sales charges. The average annual total returns do take into account applicable sales charges. Without the distribution and service (12b-1) fee waiver of 0.05% for Class A shares annually, the returns would have been lower. The Fund charges a maximum front-end sales charge of 5% for Class A shares in most circumstances, and a 12b-1 fee of up to 0.30% annually. In some circumstances, Class A shares may not be subject to a front-end sales charge, but may be subject to a 1% contingent deferred sales charge (CDSC) for the first year. Class B shares are subject to a declining CDSC of 5%, 4%, 3%, 2%, 1%, and 1% for the first six years respectively after purchase, and a 12b-1 fee of 1% annually. Approximately seven years after purchase, Class B shares will automatically convert to Class A shares on a quarterly basis. Class C shares are subject to a front-end sales charge of 1%, a CDSC of 1% for shares redeemed within 18 months of purchase, and a 12b-1 fee of 1% annually. Class Z shares are not subject to a sales charge or 12b-1 fee. The returns in the tables do not reflect the deduction of taxes that a shareholder would pay on fund distributions or following the redemption of fund shares. 2Inception dates: Class A, 1/22/90; Class B, 5/15/84; Class C, 8/1/94; and Class Z, 3/1/96. 3The Morgan Stanley Capital International (MSCI) World Index is an unmanaged, weighted index of performance of approximately 1,500 securities listed on the stock exchanges of Australia, Canada, Europe, the Far East, and the United States. 4The Lipper Global Funds Average (Lipper Average) represents returns based on an average return of all funds in the
| 2 | | Visit our website at www.jennisondryden.com |
Lipper Global Funds category. Funds in the Lipper Global Funds category invest at least 25% of their portfolios in securities traded outside the United States and may own U.S. securities as well. Investors cannot invest directly in an index. The returns for the MSCI World Index and the Lipper Average would be lower if they included the effects of sales charges, operating expenses of a mutual fund, or taxes. Returns for the Lipper Average reflect the deduction of operating expenses of a mutual fund, but not sales charges or taxes. ***MSCI World Index Since Inception cumulative total returns as of 10/31/03 are 120.96% for Class A, 668.13% for Class B, 75.03% for Class C, and 42.28% for Class Z. MSCI World Index Since Inception average annual total returns as of 9/30/03 are 5.53% for Class A, 10.79% for Class B, 5.63% for Class C, and 3.97% for Class Z. ****Lipper Average Since Inception cumulative total returns as of 10/31/03 are 196.50% for Class A, 814.78% for Class B, 94.20% for Class C, and 57.59% for Class Z. Lipper Average Since Inception average annual total returns as of 9/30/03 are 7.45% for Class A, 11.38% for Class B, 6.71% for Class C, and 5.28% for Class Z.
| |
| Five Largest Holdings expressed as a percentage of net assets as of 10/31/03 | | | |
InterActiveCorp., Internet & Catalog Retail | | 2.9 | % |
|
Citigroup, Inc., Diversified Financial Services | | 2.4 | |
|
Exel PLC, Air Freight & Couriers | | 2.3 | |
|
Mitsubishi Corp., Trading Companies & Distributors | | 2.2 | |
|
Cosco Pacific, Ltd., Transportation Infrastructure | | 2.2 | |
|
Holdings are subject to change.
| |
| Five Largest Industries expressed as a percentage of net assets as of 10/31/03 | | | |
Pharmaceuticals | | 6.4 | % |
|
Commercial Banks | | 6.3 | |
|
Media | | 6.0 | |
|
Semiconductors & Semiconductor Equipment | | 5.7 | |
|
Capital Markets | | 5.5 | |
|
Industry weightings are subject to change.
| Prudential World Fund, Inc./Jennison Global Growth Fund | | 3 |
Investment Adviser’s Report
Market and performance overview
World stock markets began to rise sharply—in late March of 2003 in the United States, in early April elsewhere—as the speed and extent of U.S. military success in Iraq removed what investors appear to have believed to be the last significant impediment to global economic progress. Stocks continued to advance in this more benign environment as capital markets gradually reopened to the weakest firms, which had been starved of cash. Toward the end of the period, economic reports also gave the first hints that business spending on large-scale IT projects was starting up for the first time in three years. All the while, consumer spending remained firm and interest rates stayed low. These factors combined to make the second half of the Fund’s fiscal year a period of strong absolute returns. The Fund outperformed its Lipper peers over this period.
Perhaps the most striking feature of the latter six months of the Fund’s reporting period was the unusually wide performance gap in favor of the shares of the most financially and operationally leveraged firms over their healthier rivals. As a growth stock investor, the Fund tries to find the strongest firms in the areas where it invests. So it was a struggle for us throughout the period to keep pace with our benchmark MSCI World Index. We have great confidence in our portfolio, however, and expect that as the stock market refocuses on actual earnings results, our stocks will be strong relative performers.
We did have a number of notable stocks during the period. Cosco Pacific (see Comments on Largest Holdings) and China Merchants, two Hong Kong-based operators of container terminals, gained from the booming trans-Pacific and intra-Asian trade. Our specialty retail stocks, like Signet (jewelry), Tod’s (accessories), and Aoyama Trading (suits), did well, as did State Street and HSBC Holdings among our financial stocks. Mitsubishi Corp. (see Comments on Largest Holdings), a restructuring Japanese distribution company, was a stellar performer.
We also had disappointments. Kohl’s, a mid-priced apparel retailer, did poorly despite its expansion into the potentially attractive California market. And although energy prices remained high, as we expected, this did not translate into
expanded drilling for oil and gas. As a result, our oilfield services stocks were relatively weak. We have reduced exposure to both areas.
Looking ahead
It appears that the long-awaited pickup in business spending in the United States is finally underway. Overall U.S. economic activity will be stimulated somewhat by the dollar’s decline. Consumer spending remains resilient, but we continue to think that
| 4 | | Visit our website at www.jennisondryden.com |
the current cyclical upturn will be modest by historical standards. If we are correct, the dollar’s decline will have negative consequences for export-oriented industries in Europe and Japan. While ultimately this will likely lead to lower interest rates in Europe and faster restructuring of non-competitive firms abroad, in the short term overall growth should slow.
So although we do have business-cycle exposure in the portfolio, we continue to focus the portfolio in three areas: companies that can gain market share from rivals; areas of long-term structural change, like broadband and biotech; and beneficiaries of growth in world trade, especially in the rapidly developing economies of the Pacific Basin.
Jennison Global Growth Fund Management Team
The Portfolio of Investments following this report shows the size of the Fund’s positions at period-end.
| Prudential World Fund, Inc./Jennison Global Growth Fund | | 5 |
Comments on Largest Holdings
Holdings expressed as a percentage of the Fund’s net assets as of 10/31/03.
| 2.9% | InterActiveCorp./Internet & Catalog Retail, U.S. |
InterActiveCorp. is an interactive commerce company with a multi-brand strategy. The company comprises Expedia, Inc.; Hotels.com; HSN; Ticketmaster; Match.com; Entertainment Publications; Citysearch; Precision Response Corporation; LendingTree; and Hotwire.com.
| 2.4% | Citigroup, Inc./Diversified Financial Services, U.S. |
Citigroup, Inc. is a diversified financial services holding company that provides a broad range of financial services to consumer and corporate customers around the world. The company’s services include investment banking, retail brokerage, corporate banking, and cash management products and services.
| 2.3% | Exel PLC/Air Freight & Couriers, U.K. |
Exel, via its subsidiaries, provides industrial and distribution services. The company’s businesses encompass international air freight forwarding, contract distribution and logistics services, in addition to a range of environmental services, which encompass waste management and landfill operations. Exel has some 1,300 locations in over 120 countries.
| 2.2% | Mitsubishi Corp./Trading Companies & Distributors, Japan |
Mitsubishi Corporation is a general trading and distribution company. The company’s diversified businesses include new business initiatives, IT & electronics, fuels, metals, machinery, chemicals, living essentials, and professional services.
| 2.2% | Cosco Pacific, Ltd./Transportation Infrastructure, Hong Kong |
Cosco Pacific Limited, through its subsidiaries, provides shipping container leasing services worldwide. The company also operates container terminals and provides container handling, storage, transportation and management services, as well as depot handling and stevedoring services.
Holdings are subject to change.
| 6 | | Visit our website at www.jennisondryden.com |
Financial Statements
|
| OCTOBER 31, 2003 | | ANNUAL REPORT |
Jennison Global Growth Fund
Portfolio of Investments
as of October 31, 2003
| Shares | | Description | | Value (Note 1) |
| | | | | | |
LONG-TERM INVESTMENTS 98.3% | | | |
| |
COMMON STOCKS | | | |
| |
Australia 2.8% | | | |
|
| 451,200 | | Amcor, Ltd. | | $ | 2,721,266 |
| 505,131 | | BHP Billiton Ltd. | | | 4,200,632 |
| 129,015 | | CRA Ltd. | | | 3,263,493 |
| | | | |
|
|
| | | | | | 10,185,391 |
| | | | |
|
|
| |
Brazil 0.6% | | | |
|
| 96,300 | | Unibanco—Uniao de Bancos Brasileiros SA (ADR) | | | 2,129,193 |
| |
China 0.7% | | | |
|
| 8,708,100 | | China Oilfield Services, Ltd., Ser. H | | | 2,523,047 |
| |
Finland 0.9% | | | |
|
| 183,860 | | Nokia Oyj | | | 3,122,701 |
| |
France 2.0% | | | |
|
| 44,993 | | Total SA | | | 6,993,094 |
| |
Germany 2.2% | | | |
|
| 82,814 | | Deutsche Boerse AG | | | 4,603,693 |
| 94,200 | | SAP AG (ADR)(b) | | | 3,442,068 |
| | | | |
|
|
| | | | | | 8,045,761 |
| | | | |
|
|
| |
Hong Kong 2.2% | | | |
|
| 5,696,000 | | Cosco Pacific Ltd. | | | 7,738,234 |
| |
Ireland 1.2% | | | |
|
| 359,000 | | Anglo Irish Bank Corp. PLC | | | 4,311,097 |
| |
Israel 1.1% | | | |
|
| 67,800 | | Teva Pharmaceutical Industries, Ltd. (ADR)(b) | | | 3,857,142 |
| |
Italy 2.8% | | | |
|
| 232,400 | | Eni SpA | | | 3,690,454 |
| 246,284 | | Riunione Adriatica di Sicurta SpA | | | 3,847,941 |
| 67,645 | | Tod’s SpA(b) | | | 2,630,418 |
| | | | |
|
|
| | | | | | 10,168,813 |
| | | | |
|
|
| |
Japan 11.2% | | | |
|
| 318,300 | | Aoyama Trading Co. Ltd. | | | 5,906,508 |
| 70,000 | | Canon, Inc. | | | 3,387,456 |
See Notes to Financial Statements.
| 8 | | Visit our website at www.jennisondryden.com |
| Shares | | Description | | Value (Note 1) |
| | | | | | |
| 779,000 | | Mitsubishi Corp. | | $ | 8,085,132 |
| 273 | | Mitsubishi Tokyo Financial Group, Inc. | | | 1,961,796 |
| 1,214,000 | | Mitsui Mining & Smelting Co. Ltd. | | | 4,858,871 |
| 340 | | Sumitomo Mitsui Financial Group, Inc. | | | 1,710,283 |
| 688,000 | | Sumitomo Realty & Development Co. Ltd. | | | 6,383,408 |
| 1,258,000 | | Taisei Corp. | | | 4,371,274 |
| 1,052,700 | | Tokyo Gas Co. Ltd. | | | 3,610,023 |
| | | | |
|
|
| | | | | | 40,274,751 |
| | | | |
|
|
| |
Mexico 1.4% | | | |
|
| 152,300 | | Telefonos de Mexico SA de CV, Ser. L (ADR) | | | 4,896,445 |
| |
Netherlands 1.0% | | | |
|
| 176,300 | | ING Groep NV | | | 3,660,385 |
| |
South Korea 1.8% | | | |
|
| 16,700 | | Samsung Electronics Co. Ltd. | | | 6,632,024 |
| |
Spain 2.0% | | | |
|
| 981 | | Antena 3 Television SA(a) | | | 32,046 |
| 69,741 | | Banco Popular Espanol SA | | | 3,626,436 |
| 290,059 | | Telefonica SA | | | 3,607,972 |
| | | | |
|
|
| | | | | | 7,266,454 |
| | | | |
|
|
| |
Sweden 0.2% | | | |
|
| 12,100 | | Tele2 AB, Class A(a) | | | 608,812 |
| |
Switzerland 2.5% | | | |
|
| 55,200 | | Roche Holding AG (ADR) | | | 4,567,723 |
| 73,700 | | UBS AG | | | 4,525,705 |
| | | | |
|
|
| | | | | | 9,093,428 |
| | | | |
|
|
| |
Taiwan 1.6% | | | |
|
| 2,981,880 | | Taiwan Semiconductor Manufacturing Co., Ltd.(a) | | | 5,880,381 |
| |
United Kingdom 13.0% | | | |
|
| 86,000 | | AstraZeneca PLC (ADR)(b) | | | 4,100,480 |
| 281,300 | | Bunzl PLC | | | 2,195,818 |
| 225,200 | | EGG PLC(a) | | | 534,059 |
| 641,399 | | Exel PLC | | | 8,255,675 |
| 1,035,845 | | GKN PLC | | | 4,851,461 |
| 311,300 | | HSBC Holdings PLC | | | 4,675,102 |
| 143,500 | | Reckitt Benckiser PLC | | | 3,019,551 |
| 131,511 | | Royal Bank Scotland Group PLC(a) | | | 3,523,814 |
See Notes to Financial Statements.
| Prudential World Fund, Inc./Jennison Global Growth Fund | | 9 |
Portfolio of Investments
as of October 31, 2003 Cont’d.
| Shares | | Description | | Value (Note 1) |
| | | | | | |
| 2,780,400 | | Signet Group PLC | | $ | 4,883,333 |
| 1,101,600 | | Tesco PLC | | | 4,416,360 |
| 3,051,476 | | Vodafone Group PLC | | | 6,408,020 |
| | | | |
|
|
| | | | | | 46,863,673 |
| | | | |
|
|
| |
United States 47.1% | | | |
|
| 72,800 | | Air Products and Chemicals, Inc.(b) | | | 3,305,848 |
| 46,100 | | Allergan, Inc.(b) | | | 3,486,082 |
| 61,300 | | Ambac Financial Group, Inc.(b) | | | 4,336,362 |
| 40,400 | | American International Group, Inc. | | | 2,457,532 |
| 62,700 | | AmerisourceBergen Corp.(b) | | | 3,559,479 |
| 83,100 | | Amgen, Inc.(a) | | | 5,132,256 |
| 144,300 | | Bank of New York Co., Inc. (The) | | | 4,500,717 |
| 166,200 | | Bed, Bath & Beyond, Inc.(a) | | | 7,020,288 |
| 123,600 | | BJ Services Co.(a) | | | 4,055,316 |
| 73,400 | | Boise Cascade Corp.(b) | | | 2,058,870 |
| 73,300 | | Caremark Rx, Inc.(a)(b) | | | 1,836,165 |
| 56,000 | | CarMax, Inc.(a) | | | 1,764,560 |
| 230,900 | | Cisco Systems, Inc.(a) | | | 4,844,282 |
| 184,983 | | Citigroup, Inc. | | | 8,768,194 |
| 87,200 | | Clear Channel Communications, Inc.(b) | | | 3,559,504 |
| 31,100 | | Colgate-Palmolive Co. | | | 1,654,209 |
| 92,100 | | ComCast Corp., Class A Special(a)(b) | | | 3,004,302 |
| 113,700 | | Dell, Inc.(a)(b) | | | 4,106,844 |
| 171,600 | | General Electric Co. | | | 4,978,116 |
| 149,500 | | General Motors Corp., Class H(a) | | | 2,456,285 |
| 80,000 | | Gilead Sciences, Inc.(a) | | | 4,366,400 |
| 32,600 | | Goldman Sachs Group, Inc. (The) | | | 3,061,140 |
| 113,700 | | Intel Corp.(b) | | | 3,757,785 |
| 285,350 | | InterActiveCorp.(a)(b) | | | 10,475,198 |
| 99,100 | | International Paper Co. | | | 3,899,585 |
| 32,300 | | Kohl’s Corp.(a)(b) | | | 1,811,061 |
| 61,600 | | MedImmune, Inc.(a) | | | 1,642,256 |
| 73,100 | | Merrill Lynch & Co., Inc.(b) | | | 4,327,520 |
| 269,800 | | Microsoft Corp.(a) | | | 7,055,270 |
| 44,300 | | Northrop Grumman Corp.(b) | | | 3,960,420 |
| 48,900 | | Omnicom Group, Inc.(b) | | | 3,902,220 |
| 210,760 | | Pfizer, Inc. | | | 6,660,016 |
| 27,800 | | Procter & Gamble Co. (The) | | | 2,732,462 |
| 115,400 | | Smith International, Inc.(a) | | | 4,296,342 |
| 74,100 | | State Street Corp. | | | 3,879,876 |
| 131,500 | | Texas Instruments, Inc. | | | 3,802,980 |
| 65,200 | | UnitedHealth Group, Inc.(b) | | | 3,317,376 |
See Notes to Financial Statements.
| 10 | | Visit our website at www.jennisondryden.com |
| Shares | | Description | | Value (Note 1) | |
| | | | | | | |
| 144,600 | | Univision Communications, Inc., Class A(a)(b) | | $ | 4,909,170 | |
| 87,900 | | Viacom, Inc., Class B | | | 3,504,573 | |
| 105,000 | | Wal-Mart Stores, Inc. | | | 6,189,750 | |
| 125,100 | | Wendy’s International, Inc. | | | 4,634,955 | |
| | | | |
|
|
|
| | | | | | 169,071,566 | |
| | | | |
|
|
|
| | | Total long-term investments
(cost $282,041,624) | | | 353,322,392 | |
| | | | |
|
|
|
SHORT-TERM INVESTMENTS 20.2% | | | | |
| |
Mutual Fund 20.2% | | | | |
|
| | | Dryden Core Investment Fund - Taxable Money Market Series(c) | | | | |
| 72,483,820 | | (Note 3) (cost $72,483,820) | | | 72,483,820 | |
Principal Amount
(000) | | | | | |
| |
Repurchase Agreement | | | | |
|
| | | State Street Bank and Trust Co., dated | | | | |
| $34 | | 10/31/03, 0.05%, due 11/3/03(d) (cost $34,000) | | | 34,000 | |
| | | | |
|
|
|
| | | Total short-term investments
(cost $72,517,820) | | | 72,517,820 | |
| | | | |
|
|
|
| | | Total Investments 118.5%
(cost $354,559,444; Note 5) | | | 425,840,212 | |
| | | Liabilities in excess of other assets (18.5%) | | | (66,475,145 | ) |
| | | | |
|
|
|
| | | Net Assets 100% | | $ | 359,365,067 | |
| | | | |
|
|
|
| (a) | Non-income producing security. |
| (b) | Security or portion thereof, on loan, see Note 4. |
| (c) | Represents security, or portion thereof, purchased with cash collateral received for securities on loan. |
| (d) | Repurchase price of $34,000. Collateralized by $35,000 U.S. Treasury Notes with a rate of 3.50%, maturity date of 11/15/2006, and aggregate market value, including accrued interest, of $37,235. |
The following abbreviations are used in portfolio descriptions:
ADR—American Depositary Receipt.
See Notes to Financial Statements.
| Prudential World Fund, Inc./Jennison Global Growth Fund | | 11 |
Portfolio of Investments
as of October 31, 2003 Cont’d.
The industry classification of portfolio holdings and liabilities in excess of other assets shown as a percentage of net assets as of October 31, 2003 was as follows:
Short-Term Investments | | 20.2 | % |
Pharmaceuticals | | 6.3 | |
Commercial Banks | | 6.3 | |
Media | | 6.0 | |
Capital Markets | | 5.7 | |
Semiconductors & Semiconductor Equipment | | 5.5 | |
Specialty Retail | | 5.5 | |
Diversified Financial Services | | 4.7 | |
Metals & Mining | | 3.4 | |
Biotechnology | | 3.1 | |
Oil & Gas | | 3.0 | |
Insurance | | 3.0 | |
Energy Equipment & Services | | 3.0 | |
Software | | 2.9 | |
Internet & Catalog Retail | | 2.9 | |
Food & Staples Retailing | | 2.9 | |
Diversified Telecommunication Services | | 2.5 | |
Healthcare Providers & Services | | 2.4 | |
Air Freight & Couriers | | 2.3 | |
Trading Companies & Distributors | | 2.2 | |
Transportation Infrastructure | | 2.2 | |
Communications Equipment | | 2.2 | |
Household Products | | 2.1 | |
Wireless Telecommunication Services | | 1.8 | |
Real Estate | | 1.8 | |
Paper & Forest Products | | 1.7 | |
Industrial Conglomerates | | 1.4 | |
Auto Components | | 1.4 | |
Hotels, Restaurants & Leisure | | 1.3 | |
Construction & Engineering | | 1.2 | |
Computers & Peripherals | | 1.1 | |
Aerospace & Defense | | 1.1 | |
Gas Utilities | | 1.0 | |
Office Electronics | | 0.9 | |
Chemicals | | 0.9 | |
Containers & Packaging | | 0.8 | |
Textiles & Apparel | | 0.7 | |
Commercial Services & Supplies | | 0.6 | |
Multiline Retail | | 0.5 | |
| | |
|
|
| | | 118.5 | |
Liabilities in excess of other assets | | (18.5 | ) |
| | |
|
|
| | | 100.0 | % |
| | |
|
|
See Notes to Financial Statements.
| 12 | | Visit our website at www.jennisondryden.com |
Statements of Assets and Liabilities
|
| OCTOBER 31, 2003 | | ANNUAL REPORT |
Jennison Global Growth Fund
Statement of Assets and Liabilities
as of October 31, 2003
Assets | | | | |
|
Investments, at value, including securities on loan of $65,601,148
(cost $354,559,444) | | $ | 425,840,212 | |
Foreign currency, at value (cost $2,349,681) | | | 2,358,121 | |
Cash | | | 27,041 | |
Dividends and interest receivable | | | 389,763 | |
Receivable for investments sold | | | 445,882 | |
Receivable for Series shares sold | | | 174,388 | |
Foreign tax reclaim receivable | | | 146,543 | |
Other assets | | | 13,061 | |
| | |
|
|
|
Total assets | | | 429,395,011 | |
| | |
|
|
|
| |
Liabilities | | | | |
|
Payable to broker for collateral for securities on loan | | | 68,037,404 | |
Payable for Series shares reacquired | | | 677,782 | |
Accrued expenses | | | 647,114 | |
Payable for investments purchased | | | 341,087 | |
Management fee payable | | | 227,506 | |
Distribution fee payable | | | 99,051 | |
| | |
|
|
|
Total liabilities | | | 70,029,944 | |
| | |
|
|
|
| |
Net assets | | $ | 359,365,067 | |
| | |
|
|
|
Net assets were comprised of: | | | | |
Common stock, at par | | $ | 287,472 | |
Paid-in capital in excess of par | | | 457,812,379 | |
| | |
|
|
|
| | | | 458,099,851 | |
Undistributed net investment income | | | 1,082,198 | |
Accumulated net realized loss on investments and foreign currency transactions | | | (171,126,796 | ) |
Net unrealized appreciation on investments and foreign currencies | | | 71,309,814 | |
| | |
|
|
|
| |
Net assets, October 31, 2003 | | $ | 359,365,067 | |
| | |
|
|
|
See Notes to Financial Statements.
| 14 | | Visit our website at www.jennisondryden.com |
Class A | | | |
|
Net asset value and redemption price per share ($256,105,810 ÷ 20,128,415 shares of common stock issued and outstanding) | | $ | 12.72 |
Maximum sales charge (5% of offering price) | | | .67 |
| | |
|
|
Maximum offering price to public | | $ | 13.39 |
| | |
|
|
| |
Class B | | | |
|
Net asset value, offering price and redemption price per share ($53,834,056 ÷ 4,663,603 shares of common stock issued and outstanding) | | $ | 11.54 |
| | |
|
|
| |
Class C | | | |
|
Net asset value and redemption price per share ($13,053,225 ÷ 1,134,643 shares of common stock issued and outstanding) | | $ | 11.50 |
Sales charge (1% of offering price) | | | .12 |
| | |
|
|
Offering price to public | | $ | 11.62 |
| | |
|
|
| |
Class Z | | | |
|
Net asset value, offering price and redemption price per share ($36,371,976 ÷ 2,820,572 shares of common stock issued and outstanding) | | $ | 12.90 |
| | |
|
|
See Notes to Financial Statements.
| Prudential World Fund, Inc./Jennison Global Growth Fund | | 15 |
Statement of Operations
Year Ended October 31, 2003
Net Investment Income | | | | |
|
Income | | | | |
Dividends (net of foreign withholding taxes of $511,393) | | $ | 5,531,398 | |
Interest | | | 13,299 | |
Income from securities lending (net) | | | 273,452 | |
| | |
|
|
|
Total income | | | 5,818,149 | |
| | |
|
|
|
| |
Expenses | | | | |
Management fee | | | 2,508,601 | |
Distribution fee—Class A | | | 575,258 | |
Distribution fee—Class B | | | 441,319 | |
Distribution fee—Class C | | | 120,913 | |
Transfer agent’s fees and expenses | | | 1,104,000 | |
Reports to shareholders | | | 394,000 | |
Custodian’s fees and expenses | | | 312,000 | |
Registration fees | | | 55,000 | |
Audit fees | | | 39,000 | |
Legal fees and expenses | | | 38,000 | |
Directors’ fees | | | 10,000 | |
Miscellaneous | | | 19,156 | |
| | |
|
|
|
Total expenses | | | 5,617,247 | |
| | |
|
|
|
Net investment income | | | 200,902 | |
| | |
|
|
|
| |
Realized And Unrealized Gain (Loss) On Investments And Foreign Currency Transactions | | | | |
|
Net realized gain (loss) on: | | | | |
Investment transactions | | | (681,622 | ) |
Foreign currency transactions | | | 881,296 | |
Written option transactions | | | 2,190 | |
| | |
|
|
|
| | | | 201,864 | |
| | |
|
|
|
Net change in unrealized appreciation (depreciation) on: | | | | |
Investments | | | 73,919,235 | |
Foreign currencies | | | (15,441 | ) |
| | |
|
|
|
| | | | 73,903,794 | |
| | |
|
|
|
Net gain on investments and foreign currencies | | | 74,105,658 | |
| | |
|
|
|
Net Increase In Net Assets Resulting From Operations | | $ | 74,306,560 | |
| | |
|
|
|
See Notes to Financial Statements.
| 16 | | Visit our website at www.jennisondryden.com |
Statement of Changes in Net Assets
| |
| | | Year Ended October 31,
| |
| | | 2003 | | | 2002 | |
Increase (Decrease) In Net Assets | | | | | | | | |
|
Operations | | | | | | | | |
Net investment income (loss) | | $ | 200,902 | | | $ | (1,396,717 | ) |
Net realized gain (loss) on investments and foreign currency transactions | | | 201,864 | | | | (74,555,483 | ) |
Net change in unrealized appreciation (depreciation) on investments and foreign currencies | | | 73,903,794 | | | | 3,647,687 | |
| | |
|
|
| |
|
|
|
Net increase (decrease) in net assets resulting from operations | | | 74,306,560 | | | | (72,304,513 | ) |
| | |
|
|
| |
|
|
|
| | |
Series share transactions (net of share conversions) (Note 6) | | | | | | | | |
Net proceeds from shares sold | | | 65,971,140 | | | | 87,551,827 | |
Cost of shares reacquired | | | (120,626,072 | ) | | | (169,079,854 | ) |
| | |
|
|
| |
|
|
|
Net decrease in net assets from Series share transactions | | | (54,654,932 | ) | | | (81,528,027 | ) |
| | |
|
|
| |
|
|
|
Total increase (decrease) | | | 19,651,628 | | | | (153,832,540 | ) |
| | |
Net Assets | | | | | | | | |
|
Beginning of year | | | 339,713,439 | | | | 493,545,979 | |
| | |
|
|
| |
|
|
|
End of year(a) | | $ | 359,365,067 | | | $ | 339,713,439 | |
| | |
|
|
| |
|
|
|
(a) Includes undistributed net investment income of: | | $ | 1,082,198 | | | $ | — | |
| | |
|
|
| |
|
|
|
See Notes to Financial Statements.
| Prudential World Fund, Inc./Jennison Global Growth Fund | | 17 |
Notes to Financial Statements
Prudential World Fund, Inc. (the “Fund”) is registered under the Investment Company Act of 1940, as an open-end, diversified management investment company and currently consists of three series: Jennison Global Growth Fund (the “Series”), Strategic Partners International Value Fund and Jennison International Growth Fund, formerly known as Prudential Global Growth Fund, Prudential International Value Fund and Prudential International Growth Fund, respectively. The financial statements of the other series are not presented herein. The Series commenced investment operations in May, 1984.
The investment objective of the Series is to seek long-term capital growth, with income as a secondary objective, by investing in a diversified portfolio of securities consisting of marketable securities of U.S. and non-U.S. issuers.
Note 1. Accounting Policies
The following is a summary of significant accounting policies followed by the Fund, and the Series, in the preparation of its financial statements.
Securities Valuation: Securities listed on a securities exchange are valued at the last sale price on such exchange on the day of valuation or, if there was no sale on such day, at the mean between the last reported bid and asked prices or at the last bid price on such day in the absence of an asked price. Securities traded via Nasdaq are valued at the official closing price as provided by Nasdaq. Securities that are actively traded in the over-the-counter market, including listed securities for which the primary market is believed by Prudential Investments LLC (“PI or Manager”), in consultation with the subadviser, to be over-the-counter, are valued at market value using prices provided by an independent pricing agent or principal market maker (if available, otherwise a principal market maker or a primary market dealer). Options on securities and indices traded on an exchange are valued on their last sales price as of the close of trading on the applicable exchange or, if there was no sale, at the mean between the most recently quoted bid and asked prices on such exchange. Securities for which reliable market quotations are not readily available, or whose values have been affected by events occurring after the close of the security’s foreign market and before the Series’ normal pricing time, are valued at fair value in accordance with Board of Directors’ approved fair valuation procedures.
| 18 | | Visit our website at www.jennisondryden.com |
Investments in mutual funds are valued at the net asset value as of the close of the New York Stock Exchange on the date of valuation.
Short-term securities which mature in 60 days or less are valued at amortized cost which approximates market value. The amortized cost method involves valuing a security at its cost on the date of purchase and thereafter assuming a constant amortization to maturity of the difference between the principal amount due at maturity and cost. Short-term securities which mature in more than 60 days are valued based upon current market quotations.
Repurchase Agreements: In connection with transactions in repurchase agreements with U.S. financial institutions, it is the Series’ policy that its custodian or designated subcustodians under triparty repurchase agreements, as the case may be, take possession of the underlying collateral securities, the value of which exceeds the principal amount of the repurchase transaction including accrued interest. To the extent that any repurchase transaction exceeds one business day, the value of the collateral is marked-to-market on a daily basis to ensure the adequacy of the collateral. If the seller defaults and the value of the collateral declines or if bankruptcy proceedings are commenced with respect to the seller of the security, realization of the collateral by the Series may be delayed or limited.
Foreign Currency Translation: The books and records of the Series are maintained in U.S. dollars. Foreign currency amounts are translated into U.S. dollars on the following basis:
(i) market value of investment securities, other assets and liabilities—at the current rates of exchange;
(ii) purchases and sales of investment securities, income and expenses—at the rate of exchange prevailing on the respective dates of such transactions.
Although the net assets of the Series are presented at the foreign exchange rates and market values at the close of the period, the Series does not isolate that portion of the results of operations arising as a result of changes in the foreign exchange rates from the fluctuations arising from changes in the market prices of securities held at period end. Similarly, the Series does not isolate the effect of changes in foreign exchange rates from the fluctuations arising from changes in the market prices of long-term portfolio securities sold during the period. Accordingly, these realized foreign currency gains or losses are included in the reported net realized gains or losses on investment transactions.
| Prudential World Fund, Inc./Jennison Global Growth Fund | | 19 |
Notes to Financial Statements
Cont’d
Net realized gains or losses on foreign currency transactions represent net foreign exchange gains or losses from holdings of foreign currencies, currency gains or losses realized between the trade and settlement dates on security transactions, and the difference between the amounts of dividends, interest and foreign taxes recorded on the Series’ books and the U.S. dollar equivalent amounts actually received or paid. Net unrealized currency gains and losses from valuing foreign currency denominated assets and liabilities (other than investments) at period end exchange rates are reflected as a component of net unrealized appreciation (depreciation) on foreign currencies.
Foreign security and currency transactions may involve certain considerations and risks not typically associated with those of domestic origin as a result of, among other factors, the possibility of political and economic instability and the level of governmental supervision and regulation of foreign securities markets.
Options: The Series may either purchase or write options in order to hedge against adverse market movements or fluctuations in value caused by changes in prevailing interest rates or foreign currency exchange rates with respect to securities or currencies which the Series currently owns or intends to purchase. The Series’ principal reason for writing options is to realize, through receipt of premiums, greater current return than would be realized on the underlying security alone. When the Series purchases an option, it pays a premium and an amount equal to that premium is recorded as an asset. When the Series writes an option, it receives a premium and an amount equal to that premium is recorded as a liability. The asset or liability is adjusted daily to reflect the current market value of the options.
If an option expires unexercised, the Series realizes a gain or loss to the extent of the premium received or paid. If an option is exercised, the premium received or paid is recorded as an adjustment to the proceeds from the sale or the cost basis of the purchase in determining whether the Series has realized a gain or loss. The difference between the premium and the amount received or paid on effecting a closing purchase or sale transaction is also treated as a realized gain or loss. Gain or loss on purchased options is included in net realized gain or loss on investment transactions. Gain or loss on written options is presented separately as net realized gain or loss on written option transactions.
The Series, as writer of an option, has no control over whether the underlying securities or currencies may be sold (called) or purchased (put). As a result, the Series
| 20 | | Visit our website at www.jennisondryden.com |
bears the market risk of an unfavorable change in the price of the security or currency underlying the written option. The Series, as purchaser of an option, bears the risk of the potential inability of the counterparties to meet the terms of their contracts.
Options involve elements of both market and credit risk in excess of the amounts reflected on the Statement of Assets and Liabilities.
Securities Transactions and Net Investment Income: Securities transactions are recorded on the trade date. Realized gains or losses from investment and currency transactions are calculated on the identified cost basis. Dividend income is recorded on the ex-dividend date and interest income, including amortization of premium and accretion of discount on debt securities, as required, is recorded on an accrual basis. Expenses are recorded on an accrual basis which may require the use of certain estimates by management.
Net investment income or loss, (other than distribution fees, which are charged directly to the respective class) other than distribution fees, and unrealized and realized gains or losses are allocated daily to each class of shares based upon the relative proportion of net assets of each class at the beginning of the day.
Dividends and Distributions: The Series expects to pay dividends of net investment income and distributions of net realized capital and currency gains, if any, annually. Dividends and distributions, which are determined in accordance with federal income tax regulations and which may differ from generally accepted accounting principles, are recorded on the ex-dividend date. Permanent book/tax differences relating to income and gains are reclassified to paid-in capital when they arise.
Taxes: For federal income tax purposes, each series in the Fund is treated as a separate taxpaying entity. It is the Series’ policy to continue to meet the requirements of the Internal Revenue Code applicable to regulated investment companies and to distribute all of its taxable net income and capital gains, if any, to shareholders. Therefore, no federal income tax provision is required.
Withholding taxes on foreign dividends are recorded net of reclaimable amounts, at the time the related income is earned.
Securities Lending: The Series may lend its portfolio securities to broker-dealers. The loans are secured by collateral at least equal at all times to the market value of the securities loaned. Loans are subject to termination at the option of the borrower or the Series. Upon termination of the loan, the borrower will return to the lender securities identical to the loaned securities. Should the borrower of the securities fail financially,
| Prudential World Fund, Inc./Jennison Global Growth Fund | | 21 |
Notes to Financial Statements
Cont’d
the Series has the right to repurchase the securities using the collateral in the open market. The Series recognizes income, net of any rebate and securities lending agent fees, for lending its securities in the form of fees or interest on the investment of any cash received as collateral. The Series also continues to receive interest and dividends or amounts equivalent thereto, on the securities loaned and recognizes any unrealized gain or loss in the market price of the securities loaned that may occur during the term of the loan.
Note 2. Agreements
The Fund has a management agreement for the Series with PI. Pursuant to this agreement, PI has responsibility for all investment advisory services and supervises the subadvisor’s performance of such services. PI has entered into a subadvisory agreement with Jennison Associates LLC (“Jennison”). The subadvisory agreement provides that Jennison furnishes investment advisory services in connection with the management of the Series. In connection therewith, Jennison is obligated to keep certain books and records of the Series. PI pays for the services of Jennison, the cost of compensation of officers of the Series, occupancy and certain clerical and bookkeeping costs of the Series. The Series bears all other costs and expenses.
The management fee paid to PI is computed daily and payable monthly, at an annual rate of .75% of the Series’ average daily net assets.
The Fund has a distribution agreement with Prudential Investment Management Services LLC (“PIMS”), which acts as the distributor of the Class A, B, C and Z shares of the Series. The Series compensates PIMS for distributing and servicing the Series’ Class A, Class B and Class C shares, pursuant to plans of distribution, (the “Class A, B and C Plans”), regardless of expenses actually incurred by them. The distribution fees are accrued daily and payable monthly. No distribution or service fees are paid to PIMS as distributor for the Class Z shares of the Series.
Pursuant to the Class A Plan, the Series compensates PIMS with respect to Class A shares, for distribution-related activities at an annual rate of up to .30 of 1% of the average daily net assets of the Class A shares. Pursuant to the Class B and C Plans, the Series compensates PIMS for distribution-related activities at the annual rate of .75 of 1% of the average daily net assets of Class B shares up to the level of average daily net assets as of February 26, 1986, plus 1% of the average daily net assets in excess of
| 22 | | Visit our website at www.jennisondryden.com |
such level of the Class B shares, and 1% of average daily net assets of Class C shares. For the year ended October 31, 2003, PIMS contractually agreed to limit such fees to .25 of 1% of the average daily net assets of the Class A shares.
PIMS has advised the Series that for the year ended October 31, 2003, it received approximately $40,300 and $4,300 in front-end sales charges resulting from sales of Class A and Class C shares, respectively. From these fees, PIMS paid such sales charges to affiliated broker-dealers, which in turn paid commissions to salespersons and incurred other distribution costs.
PIMS has advised the Series that during the year ended October 31, 2003, it received approximately $88,300 and $500 in contingent deferred sales charges imposed upon certain redemptions by Class B and C shareholders, respectively.
PI, PIMS, and Jennison are indirect, wholly owned subsidiaries of Prudential Financial, Inc. (“Prudential”).
The Series, along with other affiliated registered investment companies (the “Funds”), is a party to a syndicated credit agreement (“SCA”) with a group of banks. The SCA provides for a commitment of $800 million and allows the Funds to increase the commitment to $1 billion, if necessary. Interest on any borrowings will be incurred at market rates. The Funds pay a commitment fee of .08 of 1% of the unused portion of the SCA. The commitment fee is accrued and allocated to the Funds pro rata based on net assets. The purpose of the SCA is to serve as an alternative source of funding for capital share redemptions. The expiration date of the SCA was May 2, 2003. On May 2, 2003, the SCA was renewed under the same terms and conditions (“May 2003 renewal”). The expiration date of the May 2003 renewal is April 30, 2004. The Series did not borrow any amounts pursuant to the SCA during the year ended October 31, 2003.
Note 3. Other Transactions With Affiliates
Prudential Mutual Fund Services LLC (“PMFS”), an affiliate of PI and an indirect, wholly-owned subsidiary of Prudential, serves as the Fund’s transfer agent and during the year ended October 31, 2003, the Series incurred fees of approximately $807,300 for the services of PMFS. As of October 31, 2003, approximately $62,800 of such fees were due to PMFS. Transfer agent fees and expenses in the Statement of Operations include certain out-of-pocket expenses paid to nonaffiliates, where applicable.
The Series pays networking fees to affiliated and unaffiliated broker/dealers. These networking fees are payments made to broker/dealers that clear mutual fund transactions through a national clearing system. The Series incurred approximately
| Prudential World Fund, Inc./Jennison Global Growth Fund | | 23 |
Notes to Financial Statements
Cont’d
$87,500 in total networking fees, of which the amount paid to Wachovia Securities LLC (“Wachovia”) and Prudential Securities Incorporated (“PSI”), affiliates of PI, was approximately $75,600 for the year ended October 31, 2003. Effective July 1, 2003, Prudential and Wachovia Corp. formed a joint venture (“Wachovia Securities, LLC”) whereby Prudential and Wachovia Corp. combined their brokerage business with Prudential holding a minority interest. Prior to July 1, 2003, PSI was an indirect, wholly-owned subsidiary of Prudential. As of October 31, 2003, approximately $5,800 of such fees were due to Wachovia. These amounts are included in transfer agent’s fees and expenses in the Statement of Operations.
PSI was the securities lending agent for the Series. Effective July 1, 2003, Prudential Investment Management, Inc. (“PIM”), an indirect, wholly-owned subsidiary of Prudential, became the Series’s securities lending agent. For the year ended October 31, 2003, PSI and PIM have been compensated approximately $56,000 and $9,400 for these services, respectively.
The Series invests in the Taxable Money Market Series (the “Portfolio”), a portfolio of Dryden Core Investment Fund, formerly Prudential Core Investment Fund, pursuant to an exemptive order received from the Securities and Exchange Commission. The Portfolio is a money market mutual fund registered under the Investment Company Act of 1940, as amended, and managed by PI. During the year ended October 31, 2003, the Series earned income from the Portfolio of approximately $54,800 and $273,500 by investing its excess cash and collateral received from securities lending, respectively.
Included in the realized gain (loss) on investments, in the Statement of Operations, for the year ended October 31, 2003, is an amount of approximately $54,000, reimbursed by PSI in connection with a securities lending error.
Note 4. Portfolio Securities
Purchases and sales of investment securities, other than short-term investments, for the year ended October 31, 2003 were $253,778,556 and $302,889,672, respectively.
| 24 | | Visit our website at www.jennisondryden.com |
Transactions in options written during the year ended October 31, 2003, were as follows:
| | | Number of
Contracts
| | | Premiums
Received
| |
Options outstanding as of October 31, 2002 | | — | | | | — | |
Options written | | 219 | | | $ | 2,190 | |
Options expired | | (219 | ) | | | (2,190 | ) |
| | |
|
| |
|
|
|
Options outstanding as of October 31, 2003 | | — | | | $ | — | |
| | |
|
| |
|
|
|
As of October 31, 2003, the Series had securities on loan with an aggregate market value of $65,601,148. The Series received $68,037,404 in cash as collateral for securities on loan which was used to purchase highly liquid short-term investments in accordance with Fund’s securities lending procedures.
Note 5. Tax Information
In order to present undistributed net investment income or loss and accumulated net realized gains or losses on the Statement of Assets and Liabilities that more closely represent their tax character, certain adjustments have been made to paid-in-capital in excess of par, undistributed net investment income or loss and accumulated net realized gain or loss on investments. For the year ended October 31, 2003, the adjustments were to increase accumulated net realized loss and undistributed net investment income by $881,296. Net investment income, net realized gains and net assets were not affected by this change.
As of October 31, 2003, the accumulated undistributed earnings on a tax basis were $1,082,198.
For federal income tax purposes, the Series had a capital loss carryforward as of October 31, 2003, of approximately $169,716,500, of which $95,156,900 expires in 2009, $73,669,800 expires in 2010 and $889,800 expires in 2011. Accordingly, no capital gains distribution is expected to be paid to shareholders until net gains have been realized in excess of such carryforward.
The United States federal income tax basis of the Series’ investments and the net unrealized appreciation as of October 31, 2003 were as follows:
Tax Basis
| | Appreciation
| | Depreciation
| | Other Cost Basis Adjustments
| | Total Net
Unrealized
Appreciation
|
| $355,969,790 | | $77,579,123 | | $7,708,701 | | $29,046 | | $69,899,468 |
| Prudential World Fund, Inc./Jennison Global Growth Fund | | 25 |
Notes to Financial Statements
Cont’d
The difference between book basis and tax basis is primarily attributable to the wash sales. The other cost basis adjustments are primarily attributable to appreciation of foreign currency and mark to market of receivables and payables.
Note 6. Capital
The Series offers Class A, Class B, Class C and Class Z shares. Class A shares are sold with a front-end sales charge of up to 5%. In some limited circumstances, Class A shares may not be subject to a front-end sales charge, but may be subject to a 1% contingent deferred sales charge for the fiscal year. Class B shares are sold with a contingent deferred sales charge which declines from 5% to zero depending
on the period of time the shares are held. Class C shares are sold with a front-end sales charge of 1% and a contingent deferred sales charge of 1% during the first 18 months. Class B shares will automatically convert to Class A shares on a quarterly basis approximately seven periods after purchase. A special exchange privilege is also available for shareholders who qualify to purchase Class A shares at net asset value. Class Z shares are not subject to any sales or redemption charge and are offered exclusively for sale to a limited group of investors.
There are 500 million authorized shares of $.01 par value common stock, divided equally into four classes, designated Class A, Class B, Class C and Class Z common stock.
Transactions in shares of common stock were as follows:
Class A
| | Shares
| | | Amount
| |
Year ended October 31, 2003: | | | | | | | |
Shares sold | | 3,904,829 | | | $ | 42,792,755 | |
Shares reacquired | | (7,306,255 | ) | | | (80,277,136 | ) |
| | |
|
| |
|
|
|
Net decrease in shares outstanding before conversion | | (3,401,426 | ) | | | (37,484,381 | ) |
Shares issued upon conversion from Class B | | 1,662,325 | | | | 18,348,560 | |
| | |
|
| |
|
|
|
Net decrease in shares outstanding | | (1,739,101 | ) | | $ | (19,135,821 | ) |
| | |
|
| |
|
|
|
Year ended October 31, 2002: | | | | | | | |
Shares sold | | 4,346,549 | | | $ | 52,196,038 | |
Shares reacquired | | (9,029,142 | ) | | | (107,379,582 | ) |
| | |
|
| |
|
|
|
Net decrease in shares outstanding before conversion | | (4,682,593 | ) | | | (55,183,544 | ) |
Shares issued upon conversion from Class B | | 1,634,990 | | | | 19,966,253 | |
| | |
|
| |
|
|
|
Net decrease in shares outstanding | | (3,047,603 | ) | | $ | (35,217,291 | ) |
| | |
|
| |
|
|
|
| 26 | | Visit our website at www.jennisondryden.com |
Class B
| | Shares
| | | Amount
| |
Year ended October 31, 2003: | | | | | | | |
Shares sold | | 547,053 | | | $ | 5,520,526 | |
Shares reacquired | | (1,663,518 | ) | | | (16,230,978 | ) |
| | |
|
| |
|
|
|
Net decrease in shares outstanding before conversion | | (1,116,465 | ) | | | (10,710,452 | ) |
Shares reacquired upon conversion into Class A | | (1,827,256 | ) | | | (18,348,560 | ) |
| | |
|
| |
|
|
|
Net decrease in shares outstanding | | (2,943,721 | ) | | $ | (29,059,012 | ) |
| | |
|
| |
|
|
|
Year ended October 31, 2002: | | | | | | | |
Shares sold | | 990,875 | | | $ | 11,070,227 | |
Shares reacquired | | (3,194,031 | ) | | | (33,784,498 | ) |
| | |
|
| |
|
|
|
Net decrease in shares outstanding before conversion | | (2,203,156 | ) | | | (22,714,271 | ) |
Shares reacquired upon conversion into Class A | | (1,787,584 | ) | | | (19,966,253 | ) |
| | |
|
| |
|
|
|
Net decrease in shares outstanding | | (3,990,740 | ) | | $ | (42,680,524 | ) |
| | |
|
| |
|
|
|
Class C
| | | | | | |
Year ended October 31, 2003: | | | | | | | |
Shares sold | | 328,437 | | | $ | 3,315,995 | |
Shares reacquired | | (537,080 | ) | | | (5,369,261 | ) |
| | |
|
| |
|
|
|
Net decrease in shares outstanding | | (208,643 | ) | | $ | (2,053,266 | ) |
| | |
|
| |
|
|
|
Year ended October 31, 2002: | | | | | | | |
Shares sold | | 694,302 | | | $ | 7,308,297 | |
Shares reacquired | | (774,969 | ) | | | (8,266,673 | ) |
| | |
|
| |
|
|
|
Net decrease in shares outstanding | | (80,667 | ) | | $ | (958,376 | ) |
| | |
|
| |
|
|
|
Class Z
| | | | | | |
Year ended October 31, 2003: | | | | | | | |
Shares sold | | 1,308,315 | | | $ | 14,341,864 | |
Shares reacquired | | (1,707,766 | ) | | | (18,748,697 | ) |
| | |
|
| |
|
|
|
Net decrease in shares outstanding | | (399,451 | ) | | $ | (4,406,833 | ) |
| | |
|
| |
|
|
|
Year ended October 31, 2002: | | | | | | | |
Shares sold | | 1,442,935 | | | $ | 16,977,265 | |
Shares reacquired | | (1,667,949 | ) | | | (19,649,101 | ) |
| | |
|
| |
|
|
|
Net decrease in shares outstanding | | (225,014 | ) | | $ | (2,671,836 | ) |
| | |
|
| |
|
|
|
Note 7. Plan of Reorganization
On November 21, 2003, Jennison Global Growth Fund acquired all of the net assets of Prudential Pacific Growth Fund, Inc. and the Prudential Europe Growth Fund, Inc. pursuant to a plan of reorganization approved by the Jennison Global Growth shareholders on November 20, 2003. The acquisition was accomplished by a tax-free exchange of Class A , Class B, Class C and Class Z shares.
| Prudential World Fund, Inc./Jennison Global Growth Fund | | 27 |
Financial Highlights
| | | Class A
| |
| | | Year Ended October 31, 2003 | |
|
Per Share Operating Performance(a): | | | | |
Net Asset Value, Beginning Of Year | | $ | 10.21 | |
| | |
|
|
|
Income From Investment Operations: | | | | |
Net investment income (loss) | | | .02 | |
Net realized and unrealized gain (loss) on investment and foreign currency transactions | | | 2.49 | |
| | |
|
|
|
Total from investment operations | | | 2.51 | |
| | |
|
|
|
Less Dividends and Distributions: | | | | |
Distributions in excess of net investment income | | | — | |
Distributions from net realized capital gains | | | — | |
| | |
|
|
|
Total dividends and distributions | | | — | |
| | |
|
|
|
Net asset value, end of year | | $ | 12.72 | |
| | |
|
|
|
Total Return(b): | | | 24.58 | % |
Ratios/Supplemental Data: | | | | |
Net assets, end of year (000) | | $ | 256,106 | |
Average net assets (000) | | $ | 230,103 | |
Ratios to average net assets: | | | | |
Operating expenses, including distribution and service (12b-1 fees)(c) | | | 1.59 | % |
Operating expenses, excluding distribution and service (12b-1 fees) | | | 1.34 | % |
Net investment income (loss) | | | .15 | % |
For Class A, B, C and Z shares: | | | | |
Portfolio turnover rate | | | 79 | % |
| (a) | Based on average shares outstanding. |
| (b) | Total return does not consider the effects of sales loads. Total return is calculated assuming a purchase of shares on the first day and a sale on the last day of each period reported and includes reinvestment of dividends and distributions. |
| (c) | The distributor of the Series has contractually agreed to reduce its distribution and service (12b-1) for Class A shares to .25 of 1% of the average net assets. |
See Notes to Financial Statements.
| 28 | | Visit our website at www.jennisondryden.com |
| Class A | |
|
| Year Ended October 31, | |
|
| 2002 | | | 2001 | | | 2000 | | | 1999 | |
|
| | | | | | | | | | | | | | | |
| $ | 12.23 | | | $ | 21.35 | | | $ | 21.19 | | | $ | 16.16 | |
|
|
| |
|
|
| |
|
|
| |
|
|
|
| | | | | | | | | | | | | | | |
| | (.01 | ) | | | .01 | | | | (.09 | ) | | | (.05 | ) |
| | (2.01 | ) | | | (5.83 | ) | | | 2.25 | | | | 5.82 | |
|
|
| |
|
|
| |
|
|
| |
|
|
|
| | (2.02 | ) | | | (5.82 | ) | | | 2.16 | | | | 5.77 | |
|
|
| |
|
|
| |
|
|
| |
|
|
|
| | | | | | | | | | | | | | | |
| | — | | | | — | | | | (.19 | ) | | | (.14 | ) |
| | — | | | | (3.30 | ) | | | (1.81 | ) | | | (.60 | ) |
|
|
| |
|
|
| |
|
|
| |
|
|
|
| | — | | | | (3.30 | ) | | | (2.00 | ) | | | (.74 | ) |
|
|
| |
|
|
| |
|
|
| |
|
|
|
| $ | 10.21 | | | $ | 12.23 | | | $ | 21.35 | | | $ | 21.19 | |
|
|
| |
|
|
| |
|
|
| |
|
|
|
| | (16.52 | )% | | | (30.87 | )% | | | 9.80 | % | | | 36.83 | % |
| | | | | | | | | | | | | | | |
| $ | 223,191 | | | $ | 304,777 | | | $ | 396,870 | | | $ | 339,620 | |
| $ | 284,046 | | | $ | 353,879 | | | $ | 415,035 | | | $ | 298,009 | |
| | | | | | | | | | | | | | | |
| | 1.46 | % | | | 1.37 | % | | | 1.27 | % | | | 1.32 | % |
| | 1.21 | % | | | 1.12 | % | | | 1.02 | % | | | 1.07 | % |
| | (.18 | )% | | | .06 | % | | | (.38 | )% | | | (.27 | )% |
| | | | | | | | | | | | | | | |
| | 67 | % | | | 72 | % | | | 82 | % | | | 59 | % |
See Notes to Financial Statements.
| Prudential World Fund, Inc./Jennison Global Growth Fund | | 29 |
Financial Highlights
Cont’d.
| | | Class B
| |
| | | Year Ended October 31, 2003 | |
|
Per Share Operating Performance(a): | | | | |
Net Asset Value, Beginning Of Year | | $ | 9.31 | |
| | |
|
|
|
Income From Investment Operations: | | | | |
Net investment loss | | | (.04 | ) |
Net realized and unrealized gain (loss) on investment and foreign currency transactions | | | 2.27 | |
| | |
|
|
|
Total from investment operations | | | 2.23 | |
| | |
|
|
|
Less Dividends and Distributions: | | | | |
Distributions in excess of net investment income | | | — | |
Distributions from net realized capital gains | | | — | |
| | |
|
|
|
Total dividends and distributions | | | — | |
| | |
|
|
|
Net asset value, end of year | | $ | 11.54 | |
| | |
|
|
|
Total Return(b): | | | 23.95 | % |
Ratios/Supplemental Data: | | | | |
Net assets, end of year (000) | | $ | 53,834 | |
Average net assets (000) | | $ | 58,843 | |
Ratios to average net assets: | | | | |
Operating expenses, including distribution and service (12b-1 fees) | | | 2.09 | % |
Operating expenses, excluding distribution and service (12b-1 fees) | | | 1.34 | % |
Net investment loss | | | (.37 | )% |
| (a) | Based on average shares outstanding. |
| (b) | Total return does not consider the effects of sales loads. Total return is calculated assuming a purchase of shares on the first day and a sale on the last day of each period reported and includes reinvestment of dividends and distributions. |
See Notes to Financial Statements.
| 30 | | Visit our website at www.jennisondryden.com |
| Class B | |
|
| Year Ended October 31, | |
|
| 2002 | | | 2001 | | | 2000 | | | 1999 | |
|
| | | | | | | | | | | | | | | |
| $ | 11.23 | | | $ | 20.00 | | | $ | 19.98 | | | $ | 15.26 | |
|
|
| |
|
|
| |
|
|
| |
|
|
|
| | | | | | | | | | | | | | | |
| | (.08 | ) | | | (.08 | ) | | | (.24 | ) | | | (.17 | ) |
| | (1.84 | ) | | | (5.39 | ) | | | 2.12 | | | | 5.51 | |
|
|
| |
|
|
| |
|
|
| |
|
|
|
| | (1.92 | ) | | | (5.47 | ) | | | 1.88 | | | | 5.34 | |
|
|
| |
|
|
| |
|
|
| |
|
|
|
| | | | | | | | | | | | | | | |
| | — | | | | — | | | | (.05 | ) | | | (.02 | ) |
| | — | | | | (3.30 | ) | | | (1.81 | ) | | | (.60 | ) |
|
|
| |
|
|
| |
|
|
| |
|
|
|
| | — | | | | (3.30 | ) | | | (1.86 | ) | | | (.62 | ) |
|
|
| |
|
|
| |
|
|
| |
|
|
|
| $ | 9.31 | | | $ | 11.23 | | | $ | 20.00 | | | $ | 19.98 | |
|
|
| |
|
|
| |
|
|
| |
|
|
|
| | (17.10 | )% | | | (31.27 | )% | | | 8.94 | % | | | 36.00 | % |
| | | | | | | | | | | | | | | |
| $ | 70,804 | | | $ | 130,201 | | | $ | 288,418 | | | $ | 310,458 | |
| $ | 109,004 | | | $ | 195,461 | | | $ | 355,100 | | | $ | 297,322 | |
| | | | | | | | | | | | | | | |
| | 2.00 | % | | | 2.00 | % | | | 1.96 | % | | | 1.99 | % |
| | 1.21 | % | | | 1.12 | % | | | 1.02 | % | | | 1.07 | % |
| | (.73 | )% | | | (.58 | )% | | | (1.07 | )% | | | (.96 | )% |
See Notes to Financial Statements.
| Prudential World Fund, Inc./Jennison Global Growth Fund | | 31 |
Financial Highlights
Cont’d.
| | | Class C
| |
| | | Year Ended
October 31, 2003 | |
|
Per Share Operating Performance(a): | | | | |
Net Asset Value, Beginning Of Year | | $ | 9.30 | |
| | |
|
|
|
Income From Investment Operations: | | | | |
Net investment income loss | | | (.06 | ) |
Net realized and unrealized gain (loss) on investment and foreign currency transactions | | | 2.26 | |
| | |
|
|
|
Total from investment operations | | | 2.20 | |
| | |
|
|
|
Less Dividends and Distributions: | | | | |
Distributions in excess of net investment income | | | — | |
Distributions from net realized capital gains | | | — | |
| | |
|
|
|
Total dividends and distributions | | | — | |
| | |
|
|
|
Net asset value, end of year | | $ | 11.50 | |
| | |
|
|
|
Total Return(b): | | | 23.66 | % |
Ratios/Supplemental Data: | | | | |
Net assets, end of year (000) | | $ | 13,053 | |
Average net assets (000) | | $ | 12,091 | |
Ratios to average net assets: | | | | |
Operating expenses, including distribution and service (12b-1 fees) | | | 2.34 | % |
Operating expenses, excluding distribution and service (12b-1 fees) | | | 1.34 | % |
Net investment loss | | | (.60 | )% |
| (a) | Based on average shares outstanding. |
| (b) | Total return does not consider the effects of sales loads. Total return is calculated assuming a purchase of shares on the first day and a sale on the last day of each period reported and includes reinvestment of dividends and distributions. |
See Notes to Financial Statements.
| 32 | | Visit our website at www.jennisondryden.com |
| Class C | |
|
| Year Ended October 31, | |
|
| 2002 | | | 2001 | | | 2000 | | | 1999 | |
|
| | | | | | | | | | | | | | | |
| $ | 11.24 | | | $ | 19.99 | | | $ | 19.97 | | | $ | 15.25 | |
|
|
| |
|
|
| |
|
|
| |
|
|
|
| | | | | | | | | | | | | | | |
| | (.10 | ) | | | (.09 | ) | | | (.24 | ) | | | (.18 | ) |
| | (1.84 | ) | | | (5.36 | ) | | | 2.11 | | | | 5.51 | |
|
|
| |
|
|
| |
|
|
| |
|
|
|
| | (1.94 | ) | | | (5.45 | ) | | | 1.87 | | | | 5.33 | |
|
|
| |
|
|
| |
|
|
| |
|
|
|
| | | | | | | | | | | | | | | |
| | — | | | | — | | | | (.04 | ) | | | (.01 | ) |
| | — | | | | (3.30 | ) | | | (1.81 | ) | | | (.60 | ) |
|
|
| |
|
|
| |
|
|
| |
|
|
|
| | — | | | | (3.30 | ) | | | (1.85 | ) | | | (.61 | ) |
|
|
| |
|
|
| |
|
|
| |
|
|
|
| $ | 9.30 | | | $ | 11.24 | | | $ | 19.99 | | | $ | 19.97 | |
|
|
| |
|
|
| |
|
|
| |
|
|
|
| | (17.26 | )% | | | (31.17 | )% | | | 8.89 | % | | | 35.94 | % |
| | | | | | | | | | | | | | | |
| $ | 12,490 | | | $ | 16,006 | | | $ | 21,377 | | | $ | 14,184 | |
| $ | 14,897 | | | $ | 18,330 | | | $ | 18,886 | | | $ | 11,866 | |
| | | | | | | | | | | | | | | |
| | 2.21 | % | | | 2.12 | % | | | 2.02 | % | | | 2.07 | % |
| | 1.21 | % | | | 1.12 | % | | | 1.02 | % | | | 1.07 | % |
| | (.92 | )% | | | (.68 | )% | | | (1.11 | )% | | | (1.02 | )% |
See Notes to Financial Statements.
| Prudential World Fund, Inc./Jennison Global Growth Fund | | 33 |
Financial Highlights
Cont’d.
| | | Class Z
| |
| | | Year Ended October 31, 2003 | |
|
Per Share Operating Performance(a): | | | | |
Net Asset Value, Beginning Of Year | | $ | 10.32 | |
| | |
|
|
|
Income From Investment Operations: | | | | |
Net investment income (loss) | | | .05 | |
Net realized and unrealized gain (loss) on investment and foreign currency transactions | | | 2.53 | |
| | |
|
|
|
Total from investment operations | | | 2.58 | |
| | |
|
|
|
Less Dividends and Distributions: | | | | |
Distributions in excess of net investment income | | | — | |
Distributions from net realized capital gains | | | — | |
| | |
|
|
|
Total dividends and distributions | | | — | |
| | |
|
|
|
Net asset value, end of year | | $ | 12.90 | |
| | |
|
|
|
Total Return(b): | | | 24.90 | % |
Ratios/Supplemental Data: | | | | |
Net assets, end of year (000) | | $ | 36,372 | |
Average net assets (000) | | $ | 33,443 | |
Ratios to average net assets: | | | | |
Expenses, including distribution and service (12b-1 fees) | | | 1.34 | % |
Expenses, excluding distribution and service (12b-1 fees) | | | 1.34 | % |
Net investment income (loss) | | | .40 | % |
| (a) | Based on average shares outstanding. |
| (b) | Total return does not consider the effects of sales loads. Total return is calculated assuming a purchase of shares on the first day and a sale on the last day of each period reported and includes reinvestment of dividends and distributions. |
See Notes to Financial Statements.
| 34 | | Visit our website at www.jennisondryden.com |
| Class Z | |
|
| Year Ended October 31, | |
|
| 2002 | | | 2001 | | | 2000 | | | 1999 | |
|
| | | | | | | | | | | | | | | |
| $ | 12.35 | | | $ | 21.46 | | | $ | 21.29 | | | $ | 16.23 | |
|
|
| |
|
|
| |
|
|
| |
|
|
|
| | | | | | | | | | | | | | | |
| | .01 | | | | .05 | | | | (.02 | ) | | | — | |
| | (2.04 | ) | | | (5.86 | ) | | | 2.23 | | | | 5.84 | |
|
|
| |
|
|
| |
|
|
| |
|
|
|
| | (2.03 | ) | | | (5.81 | ) | | | 2.21 | | | | 5.84 | |
|
|
| |
|
|
| |
|
|
| |
|
|
|
| | | | | | | | | | | | | | | |
| | — | | | | — | | | | (.23 | ) | | | (.18 | ) |
| | — | | | | (3.30 | ) | | | (1.81 | ) | | | (.60 | ) |
|
|
| |
|
|
| |
|
|
| |
|
|
|
| | — | | | | (3.30 | ) | | | (2.04 | ) | | | (.78 | ) |
|
|
| |
|
|
| |
|
|
| |
|
|
|
| $ | 10.32 | | | $ | 12.35 | | | $ | 21.46 | | | $ | 21.29 | |
|
|
| |
|
|
| |
|
|
| |
|
|
|
| | (16.50 | )% | | | (30.57 | )% | | | 9.97 | % | | | 37.25 | % |
| | | | | | | | | | | | | | | |
| $ | 33,228 | | | $ | 42,562 | | | $ | 70,956 | | | $ | 48,430 | |
| $ | 40,960 | | | $ | 54,387 | | | $ | 77,989 | | | $ | 42,312 | |
| | | | | | | | | | | | | | | |
| | 1.21 | % | | | 1.12 | % | | | 1.02 | % | | | 1.07 | % |
| | 1.21 | % | | | 1.12 | % | | | 1.02 | % | | | 1.07 | % |
| | .08 | % | | | .32 | % | | | (.08 | )% | | | (.02 | )% |
See Notes to Financial Statements.
| Prudential World Fund, Inc./Jennison Global Growth Fund | | 35 |
Report of Independent Auditors
To the Board of Directors and Shareholders of
Prudential World Fund, Inc.—Jennison Global Growth Fund
In our opinion, the accompanying statement of assets and liabilities, including the portfolio of investments, and the related statements of operations and of changes in net assets and the financial highlights present fairly, in all material respects, the financial position of Prudential World Fund, Inc.—Jennison Global Growth Fund, formerly Prudential Global Growth Fund, (the “Fund”, one of the portfolios constituting Prudential World Fund, Inc.) at October 31, 2003, the results of its operations for the year then ended, the changes in its net assets for each of the two years in the period then ended and the financial highlights for each of the five years in the period then ended, in conformity with accounting principles generally accepted in the United States of America. These financial statements and financial highlights (hereafter referred to as “financial statements”) are the responsibility of the Fund’s management; our responsibility is to express an opinion on these financial statements based on our audits. We conducted our audits of these financial statements in accordance with auditing standards generally accepted in the United States of America, which require that we plan and perform the audit to obtain reasonable assurance about whether the financial statements are free of material misstatement. An audit includes examining, on a test basis, evidence supporting the amounts and disclosures in the financial statements, assessing the accounting principles used and significant estimates made by management, and evaluating the overall financial statement presentation. We believe that our audits, which included confirmation of securities at October 31, 2003 by correspondence with the custodian and brokers, provide a reasonable basis for our opinion.
PricewaterhouseCoopers LLP
New York, New York
December 22, 2003
| 36 | | Visit our website at www.jennisondryden.com |
Supplemental Proxy Information
(Unaudited)
A special meeting of the Fund’s shareholders was held on September 12, 2003. The meeting was held for the following purposes:
1. To approve the election of nine (9) directors to the Board of Directors, as follows:
| | • | | Douglas H. McCorkindale |
The result of the proxy solicitation of the Series’ on the preceding matter was:
Matter
| | Votes For
| | Votes Against
| | Votes Withheld
| | Abstentions
|
David E.A. Carson | | 20,847,756 | | — | | 671,827 | | — |
Robert F. Gunia | | 20,855,668 | | — | | 663,915 | | — |
Robert E. La Blanc | | 20,844,142 | | — | | 675,441 | | — |
Douglas H.
McCorkindale | | 20,856,932 | | — | | 662,651 | | — |
Richard A. Redeker | | 20,851,620 | | — | | 667,963 | | — |
Judy A. Rice | | 20,855,206 | | — | | 664,377 | | — |
Robin B. Smith | | 20,854,724 | | — | | 664,859 | | — |
Stephen Stoneburn | | 20,856,445 | | — | | 663,138 | | — |
Clay T. Whitehead | | 20,854,966 | | — | | 664,617 | | — |
2. To approve amendments to the Fund’s Article of Incorporation.
The result of the proxy solicitation of the Series’ on the preceding matter was:
Matter
| | Votes For
| | Votes Against
| | Abstentions
| | Broker
Non-Votes
|
Amendments to the Fund’s Articles of Incorporation | | 14,669,737 | | 564,202 | | 566,324 | | 5,719,320 |
| Prudential World Fund, Inc./Jennison Global Growth Fund | | 37 |
Management of the Fund
(Unaudited)
Information pertaining to the Board of Directors is set forth below. Directors who are not deemed to be “interested persons” of the Fund, as defined in the 1940 Act are referred to as “Independent Directors.” Directors who are deemed to be “interested persons” of the Fund are referred to as “Interested Directors.” “Fund Complex”† consists of the Fund and any other investment companies managed by Prudential Investments LLC (“PI”).
Independent Directors2
David E.A. Carson (69), Director since 20033 Oversees 99 portfolios in Fund complex
Principal occupations (last 5 years): Director (January 2000 to May 2000), Chairman (January 1999 to December 1999), Chairman and Chief Executive Officer (January 1998 to December 1998) and President, Chairman and Chief Executive Officer of People’s Bank (1983-1997).
Other Directorships held:4 Director of United Illuminating and UIL Holdings (utility company), since 1993.
Robert E. La Blanc (69), Director since 19843 Oversees 119 portfolios in Fund complex
Principal occupations (last 5 years): President (since 1981) of Robert E. La Blanc Associates, Inc. (telecommunications); formerly General Partner at Salomon Brothers and Vice-Chairman of Continental Telecom; Trustee of Manhattan College.
Other Directorships held:4 Director of Storage Technology Corporation (since 1979) (technology), Chartered Semiconductor Manufacturing, Ltd. (since 1998); Titan Corporation (electronics) (since 1995), Computer Associates International, Inc. (since 2002) (software company); FiberNet Telecom Group, Inc. (since 2003) (telecom company); Director (since April 1999) of the High Yield Plus Fund, Inc.
Douglas H. McCorkindale (64), Director since 20033 Oversees 101 portfolios in Fund complex
Principal occupations (last 5 years): Chairman (since February 2001), Chief Executive Officer (since June 2000) and President (since September 1997) of Gannett Co. Inc. (publishing and media); formerly Vice Chairman (March 1984-May 2000) of Gannett Co., Inc.
Other Directorships held:4 Director of Gannett Co. Inc., Director of Continental Airlines, Inc. (since May 1993); Director of Lockheed Martin Corp. (aerospace and defense) (since May 2001); Director of The High Yield Plus Fund, Inc. (since 1996).
| 38 | | Visit our website at www.jennisondryden.com |
Richard A. Redeker (60), Director since 20033 Oversees 102 portfolios in Fund complex
Principal occupations (last 5 years): Management Consultant; formerly employee of Prudential Investments (October 1996-December 1998); Director of Invesmart, Inc. (since 2001) and Director of Penn Tank Lines, Inc. (since 1999).
Other Directorships held:4 None.
Robin B. Smith (64), Director since 19963 Oversees 109 portfolios in Fund complex
Principal occupations (last 5 years): Chairman of the Board (since January 2003) of Publishers Clearing House (direct marketing), formerly Chairman and Chief Executive Officer (August 1996-January 2003) of Publishers Clearing House.
Other Directorships held:4 Director of BellSouth Corporation (since 1992).
Stephen Stoneburn (60), Director since 19963 Oversees 107 portfolios in Fund complex
Principal occupations (last 5 years): President and Chief Executive Officer (since June 1996) of Quadrant Media Corp. (a publishing company); formerly President (June 1995-June 1996) of Argus Integrated Media, Inc.; Senior Vice President and Managing Director (January 1993-1995) of Cowles Business Media and Senior Vice President of Fairchild Publications, Inc. (1975-1989).
Other Directorships held:4 None
Clay T. Whitehead (65), Director since 19843 Oversees 106 portfolios in Fund complex
Principal occupations (last 5 years): President (since 1983) of National Exchange Inc. (new business development firm).
Other Directorships held:4 Director (since 2000) of the High Yield Plus Fund, Inc.
Interested Directors1
Judy A. Rice (55), President since 2003 and Director since 20003 Oversees 109 portfolios in Fund complex
Principal occupations (last 5 years): President, Chief Executive Officer, Chief Operating Officer and Officer-in-Charge (since 2003) of PI; Director, Officer-in-Charge, President, Chief Executive Officer and Chief Operating Officer (since May 2003) of American Skandia Advisory Services, Inc. and American Skandia Investment Services, Inc.; Director, Officer-in-Charge, President, Chief Executive Officer (since May 2003) of American Skandia Fund Services, Inc.; Vice President (since February 1999) of Prudential Investment Management Services LLC; President, Chief Executive Officer and Officer-in-Charge (since April 2003) of Prudential Mutual Fund Services LLC; formerly various positions to Senior Vice President (1992-1999) of Prudential Securities Incorporated (Prudential Securities); and various positions to Managing Director (1975-1992) of Salomon Smith Barney; Member of Board of Governors of the Money Management Institute.
Other Directorships held:4 None
Robert F. Gunia (57), Vice President and Director since 19963 Oversees 189 portfolios in Fund complex
Principal occupations (last 5 years): Chief Administrative Officer (since June 1999) of PI; Executive Vice President and Treasurer (since January 1996) of PI; President (since April 1999) of Prudential Investment Management Services LLC (PIMS); Corporate Vice President (since September 1997) of The Prudential Insurance Company of America (Prudential); Director, Executive Vice President and Chief Administrative Officer (since May 2003) of American Skandia Investment Services, Inc., American Skandia Advisory Services, Inc. and American Skandia Fund Services, Inc.; President (since April 1999) of Prudential Investment Management Services LLC;
| Prudential World Fund, Inc./Jennison Global Growth Fund | | 39 |
Executive Vice President (since March 1999) and Treasurer (since May 2000) of Prudential Mutual Fund Services LLC; formerly Senior Vice President (March 1987-May 1999) of Prudential Securities.
Other Directorships held:4 Vice President and Director (since May 1989) and Treasurer (since 1999) of The Asia Pacific Fund, Inc.
Information pertaining to the Officers of the Fund is set forth below.
Officers2
Marguerite E.H. Morrison (47), Chief Legal Officer since 2003 and Assistant Secretary since 20023
Principal occupations (last 5 years): Vice President and Chief Legal Officer—Mutual Funds and Unit Investment Trust (since August 2000) of Prudential; Senior Vice President and Secretary (since April 2003) of PI; Senior Vice President and Secretary (since May 2003) of American Skandia Investment Services, Inc., American Skandia Advisory Services, Inc. and American Skandia Fund Services, Inc.; Vice President and Assistant Secretary of PIMS (since October 2001), previously Senior Vice President and Assistant Secretary (February 2001-April 2003) of PI, Vice President and Associate General Counsel (December 1996-February 2001) of PI.
Maryanne Ryan (39), Anti-Money Laundering Compliance Officer since 20023
Principal occupations (last 5 years): Vice President, Prudential (since November 1998), First Vice President, Prudential Securities (March 1997-May 1998); Anti-Money Laundering Compliance Officer (since 2003) of American Skandia Investment Services, Inc., American Skandia Advisory Services, Inc. and American Skandia Marketing, Inc.
Jonathan D. Shain (45), Secretary since 20013
Principal occupations (last 5 years): Vice President and Corporate Counsel (since August 1998) of Prudential; Vice President and Assistant Secretary (since May 2003) of American Skandia Investment Services, Inc. and American Skandia Fund Services, Inc.; formerly Attorney with Fleet Bank, N.A. (January 1997-July 1998).
Grace C. Torres (44), Treasurer and Principal Financial and Accounting Officer since 19953
Principal occupations (last 5 years): Senior Vice President (since January 2000) of PI, Senior Vice President and Assistant Treasurer (since May 2003) of American Skandia Investment Services, Inc. and American Skandia Advisory Services, Inc.; formerly First Vice President (December 1996-January 2000) of PI and First Vice President (March 1993-1999) of Prudential Securities.
| 40 | | Visit our website at www.jennisondryden.com |
| † | The Fund Complex consists of all investment companies managed by PI. The Funds for which PI serves as manager include JennisonDryden Mutual Funds, Strategic Partners Funds, American Skandia Advisor Funds, Inc., The Prudential Variable Contract Accounts 2, 10, 11, The Target Portfolio Trust, The Prudential Series Fund, Inc., American Skandia Trust, and Prudential’s Gibraltar Fund. |
| 1 | “Interested” Director, as defined in the 1940 Act, by reason of employment with the Manager, (Prudential Investments LLC or PI), the Subadvisers (Prudential Investment Management, Inc. or PIM), (Bank of Ireland Asset Management (U.S.) Limited or BIAM) or (Jennison Associations LLC or Jennison) or the Distributor (Prudential Investment Management Services LLC or PIMS). |
| 2 | Unless otherwise noted, the address of the Directors and Officers is c/o: Prudential Investments LLC, Gateway Center Three, 100 Mulberry Street, Newark, NJ 07102. |
| 3 | There is no set term of office for Trustees and Officers. The Independent Directors have adopted a retirement policy, which calls for the retirement of Directors on December 31 of the year in which they reach the age of 75. The table shows the individuals length of service as Trustee and/or Officer. |
| 4 | This column includes only directorships of companies requested to register, or file reports with the SEC under the Securities and Exchange Act of 1934 (that is, “public companies”) or other investment companies registered under the 1940 Act. |
Additional information about the Fund’s Trustees is included in the Fund’s Statement of Additional Information which is available without charge, upon request, by calling (800) 521-7466 or (732) 482-7555 (Calling from outside the U.S.)
| Prudential World Fund, Inc./Jennison Global Growth Fund | | 41 |
Growth of a $10,000 Investment
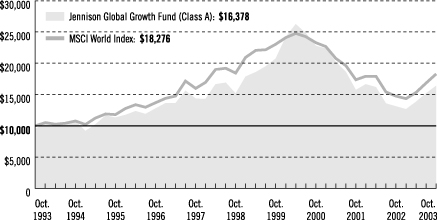
| |
| Average Annual Total Returns (With Sales Charges) as of 10/31/03 | | | | |
| | | One Year | | | Five Years | | | Ten Years | | | Since Inception | |
Class A | | 18.35 | % | | 0.52 | % | | 5.06 | % | | 5.62 | % |
|
Class B | | 18.95 | | | 0.76 | | | 4.90 | | | 9.21 | |
|
Class C | | 21.43 | | | 0.63 | | | N/A | | | 4.22 | |
|
Class Z | | 24.90 | | | 1.79 | | | N/A | | | 4.59 | |
|
| | | | | | | | | | | | | |
|
| Average Annual Total Returns (Without Sales Charges) as of 10/31/03 | |
| | | One Year | | | Five Years | | | Ten Years | | | Since Inception | |
Class A | | 24.58 | % | | 1.56 | % | | 5.60 | % | | 6.02 | % |
|
Class B | | 23.95 | | | 0.91 | | | 4.90 | | | 9.21 | |
|
Class C | | 23.66 | | | 0.83 | | | N/A | | | 4.33 | |
|
Class Z | | 24.90 | | | 1.79 | | | N/A | | | 4.59 | |
|
Past performance is not indicative of future results. Principal value and investment return will fluctuate so that an investor’s shares, when redeemed, may be worth more or less than their original cost. Source: Prudential Investments LLC and Lipper Inc. Inception dates: Class A, 1/22/90; Class B, 5/15/84; Class C, 8/1/94; and Class Z, 3/1/96.
The graph compares a $10,000 investment in the Jennison Global Growth Fund (Class A shares) with a similar investment in the MSCI World Index by portraying the initial account values at the beginning of the 10-year period for Class A shares (October 31, 1993) and the account values at the end of the current fiscal year (October 31, 2003) as measured on a quarterly basis. For purposes of the graph, and unless otherwise indicated, it has been assumed that (a) the maximum applicable front-end sales charge was deducted from the initial $10,000 investment in Class A shares; (b) all recurring fees (including management fees) were deducted; and (c) all dividends and distributions were reinvested. The line graph provides information for Class A shares only. As indicated in the tables provided earlier, performance for Class B, C, and Z shares will vary due to the
| | | Visit our website at www.jennisondryden.com |
differing charges and expenses applicable to each share class (as indicated in the following paragraphs). Without a distribution and service (12b-1) fee waiver of 0.05% annually for Class A shares through October 31, 2003, the returns shown in the graph and for Class A shares in the tables would have been lower.
The MSCI World Index is an unmanaged, weighted index of performance of approximately 1,500 securities listed on stock exchanges of Australia, Canada, Europe, the Far East, and the United States. The MSCI World Index’s total returns include the reinvestment of all dividends, but do not include the effects of sales charges, operating expenses of a mutual fund, or taxes. These returns would be lower if they included the effects of sales charges, operating expenses, or taxes. The securities that comprise the MSCI World Index may differ substantially from the securities in the Fund. The MSCI World Index is not the only index that may be used to characterize performance of global stock funds. Other indexes may portray different comparative performance. Investors cannot invest directly in an index.
The Fund charges a maximum front-end sales charge of 5% for Class A shares in most circumstances, and a 12b-1 fee of up to 0.30% annually. In some circumstances, Class A shares may not be subject to a front-end sales charge, but may be subject to a 1% contingent deferred sales charge (CDSC) for the first year. Class B shares are subject to a declining CDSC of 5%, 4%, 3%, 2%, 1%, and 1% respectively for the first six years after purchase, and a 12b-1 fee of 1% annually. Approximately seven years after purchase, Class B shares will automatically convert to Class A shares on a quarterly basis. Class C shares are subject to a front-end sales charge of 1%, a CDSC of 1% for shares redeemed within 18 months of purchase, and a 12b-1 fee of 1% annually. The returns in the graph and the tables do not reflect the deduction of taxes that a shareholder would pay on Fund distributions or following the redemption of Fund shares.
| Prudential World Fund, Inc./Jennison Global Growth Fund | | |
| | |
| n MAIL | | n TELEPHONE | | n WEBSITE |
Gateway Center Three 100 Mulberry Street Newark, NJ 07102 | | (800) 225-1852 | | www.jennisondryden.com |
| DIRECTORS |
| David E.A. Carson•Robert F. Gunia•Robert E. La Blanc•Douglas H. McCorkindale•Richard A. Redeker•Judy A. Rice•Robin B. Smith•Stephen D. Stoneburn•Clay T. Whitehead |
| |
| OFFICERS |
| Judy A. Rice, President•Robert F. Gunia, Vice President•Grace C. Torres, Treasurer and Principal Financial and Accounting Officer•Marguerite E.H. Morrison, Chief Legal Officer and Assistant Secretary•Jonathan D. Shain, Secretary•Maryanne Ryan, Anti-Money Laundering Compliance Officer |
| MANAGER | | Prudential Investments LLC | | Gateway Center Three
100 Mulberry Street
Newark, NJ 07102 |
|
| INVESTMENT ADVISOR | | Jennison Associates, LLC | | 466 Lexington Avenue
New York, NY 10017 |
|
| DISTRIBUTOR | | Prudential Investment
Management Services LLC | | Gateway Center Three
14th Floor 100 Mulberry Street
Newark, NJ 07102 |
|
| CUSTODIAN | | State Street Bank
and Trust Company | | One Heritage Drive
North Quincy, MA 02171 |
|
| TRANSFER AGENT | | Prudential Mutual Fund
Services LLC | | PO Box 8098
Philadelphia, PA 19101 |
|
| INDEPENDENT AUDITORS | | PricewaterhouseCoopers LLP | | 1177 Avenue of the
Americas
New York, NY 10036 |
|
| FUND COUNSEL | | Sullivan & Cromwell LLP | | 125 Broad Street
New York, NY 10004 |
| | |
| Jennison Global Growth Fund | | | | |
| Share Class | | | | A | | B | | C | | Z | | |
| | | | | | |
Nasdaq | | | | PRGAX | | PRGLX | | PRGCX | | PWGZX | | |
CUSIP | | | | 743969107 | | 743969206 | | 743969305 | | 743969404 | | |
| | | | | | | | | | | | | |
Mutual Funds:
| ARE NOT INSURED BY THE FDIC OR ANY FEDERAL GOVERNMENT AGENCY | | MAY LOSE VALUE | | ARE NOT A DEPOSIT OF OR GUARANTEED BY ANY BANK OR ANY BANK AFFILIATE |
| | |
| Jennison Global Growth Fund | | | | |
| | | Share Class | | A | | B | | C | | Z | | |
| | | | | | |
| | | Nasdaq | | PRGAX | | PRGLX | | PRGCX | | PWGZX | | |
| | | CUSIP | | 743969107 | | 743969206 | | 743969305 | | 743969404 | | |
| | | | | | | | | | | | | |
MF115E IFS-AO86520
Dryden International Equity Fund
Formerly known as Jennison International Growth Fund
|
OCTOBER 31, 2003 | | ANNUAL REPORT |

FUND TYPE
Global/International stock
OBJECTIVE
Long-term growth of capital
This report is not authorized for distribution to prospective investors unless preceded or accompanied by a current prospectus.
The views expressed in this report and information about the Fund’s portfolio holdings are for the period covered by this report and are subject to change thereafter.
JennisonDryden is a service mark of The Prudential Insurance Company of America.

Dear Shareholder,
December 16, 2003
As you may know, the mutual fund industry recently has been the subject of much media attention. There has been press coverage of Prudential, and recently, administrative complaints were filed against Prudential Securities* and some of its former brokers and branch managers in Massachusetts. As president of your Fund, I’d like to provide you with an update on the issues as they pertain to JennisonDryden mutual funds.
State and federal authorities have requested information regarding trading practices from many mutual fund companies across the nation. Our fund family has been cooperating with inquiries it has received, and at the same time, Prudential Financial, Inc. has been conducting its own internal review. This review encompasses the policies, systems, and procedures of our fund family, Prudential Financial’s investment units and its proprietary distribution channels, including the former Prudential Securities. The review also includes mutual fund trading activity by investment professionals who manage our funds.
Market timing
Prudential Investments LLC, the Fund’s investment manager, has actively discouraged disruptive market timing, and for years, our mutual fund prospectuses have identified and addressed this issue. Prudential Investments has established operating policies and procedures that are designed to detect and deter frequent trading activities that would be disruptive to the management of our mutual fund portfolios, and has rejected numerous orders placed by market timers in the past.
* Prudential Investments LLC, the manager of JennisonDryden mutual funds, and Prudential Investment Management Services LLC, the distributor of the funds, are part of the Investment Management segment of Prudential Financial, Inc. and are separate legal entities from the entity formerly known as Prudential Securities Incorporated, a retail brokerage firm. In February 2003, Prudential Financial and Wachovia Corporation announced they were combining their retail brokerage forces. The transaction was completed in July 2003. Wachovia Corporation has a 62% interest in the new firm, which is now known as Wachovia Securities LLC, and Prudential Financial owns the remaining 38%.
Late trading
The Securities and Exchange Commission requires that orders to purchase or redeem mutual fund shares be received either by the fund or by an intermediary (such as a broker, financial adviser, or 401(k) record keeper) before the time at which the fund calculates its net asset value (normally 4:00 p.m., Eastern time) if they are to receive that day’s price. The policies of our mutual funds do not make and have not made allowances for the practice known as “late trading”.
For more than 40 years we have offered investors quality investment products, financial guidance, and responsive customer service. Today we remain committed to this heritage and to the highest ethical principles in our investment practices.
Sincerely,

Judy A. Rice, President
Prudential World Fund, Inc./Dryden International Equity Fund
| Prudential World Fund, Inc./Dryden International Equity Fund | | 1 |
Your Fund’s Performance
Fund Objective
The investment objective of the Dryden International Equity Fund (the Fund) is long-term growth of capital. There can be no assurance that the Fund will achieve its investment objective. For the period covered by this Annual Report, Jennison Associates LLC (Jennison) was the investment adviser to the Fund. At the close of business December 8, 2003, Prudential Investment Management, Inc. (PIM) assumed day-to-day management responsibilities for the Fund from Jennison. PIM uses a core equity style of investing that combines active stock selection and risk management. The investment process is designed to outperform the general international equity market.
|
| Cumulative Total Returns1 as of 10/31/03 | |
| | | One Year | | | Three Years | | | Since Inception2 | |
Class A | | 29.41 | % | | –38.73 | % | | –51.60 | % |
|
Class B | | 28.34 | | | –40.08 | | | –52.90 | |
|
Class C | | 28.34 | | | -40.08 | | | –52.90 | |
|
Class Z | | 29.79 | | | –38.31 | | | –51.20 | |
|
MSCI EAFE® Index3 | | 27.03 | | | –17.24 | | | –25.89 | |
|
Lipper International Funds Avg.4 | | 24.51 | | | –18.64 | | | –28.95 | |
|
| | | | | | | | | | |
|
| Average Annual Total Returns1 as of 9/30/03 | |
| | | One Year | | | Three Years | | | Since Inception2 | |
Class A | | 24.65 | % | | –20.05 | % | | –20.92 | % |
|
Class B | | 25.09 | | | –20.18 | | | –20.87 | |
|
Class C | | 27.80 | | | –19.63 | | | –20.65 | |
|
Class Z | | 31.32 | | | –18.53 | | | –19.63 | |
|
MSCI EAFE® Index3 | | 26.01 | | | –8.71 | | | –9.56 | |
|
Lipper International Funds Avg.4 | | 22.94 | | | –10.06 | | | –11.34 | |
|
On December 8, 2003, after the end of the Fund’s fiscal year, investment advisor responsibilities transferred from Jennison Associates LLC to Prudential Investment Management, Inc. The data in the table above represents the Fund’s performance under Jennison’s management. Past performance is not indicative of future results. Principal value and investment return will fluctuate so that an investor’s shares, when redeemed, may be worth more or less than their original cost. 1Source: Prudential Investments LLC and Lipper Inc. The cumulative total returns do not take into account applicable sales charges. The average annual total returns do take into account applicable sales charges. Without the distribution and service (12b-1) fee waiver of 0.05% for Class A shares annually, the returns would have been lower. The Fund charges a maximum front-end sales charge of 5% for Class A shares in most circumstances, and a 12b-1 fee of up to 0.30% annually in most circumstances. In some circumstances, Class A shares may not be subject to a front-end sales charge, but may be subject to a 1% contingent deferred sales charge (CDSC) for the first year. Class B shares are subject to a declining CDSC of 5%, 4%, 3%, 2%, 1%, and 1% for the first six years respectively after purchase, and a 12b-1 fee of 1% annually. Approximately seven years after purchase, Class B shares will automatically convert to Class A shares on a quarterly basis. Class C shares are subject to a front-end sales charge of 1%, a CDSC of 1% for shares redeemed within 18 months of purchase, and a 12b-1 fee of 1% annually. Class Z shares are not subject to a sales
| 2 | | Visit our website at www.jennisondryden.com |
charge or 12b-1 fee. The returns in the tables above do not reflect the deduction of taxes that a shareholder would pay on fund distributions or following the redemption of fund shares. 2Inception date: 3/1/2000. 3The Morgan Stanley Capital International (MSCI) EAFE® Index is an unmanaged, weighted index of performance that reflects stock price movements of developed-country markets in Europe, Australasia, and the Far East. 4The Lipper International Funds Average (Lipper Average) represents returns based on an average return of all funds in the Lipper International Funds category. Funds in the Lipper International Funds category invest their assets in securities with primary trading markets outside the United States. Investors cannot invest directly in an index. The returns for the MSCI EAFE® Index and the Lipper Average would be lower if they included the effects of sales charges, operating expenses of a mutual fund, or taxes. Returns for the Lipper Average reflect the deduction of operating expenses of a mutual fund, but not sales charges or taxes.
| |
| Five Largest Holdings expressed as a percentage of net assets as of 10/31/03 | | | |
Reckitt Benckiser PLC, Household Products | | 3.4 | % |
|
Vodafone Group PLC, Wireless Telecommunication Services | | 2.9 | |
|
Nokia Oyj, Communications Equipment | | 2.8 | |
|
Nobel Biocare Holding AG, Healthcare Equipment & Supplies | | 2.6 | |
|
Nitto Denko Corp., Chemicals | | 2.6 | |
|
Holdings are subject to change.
| |
| Five Largest Industries expressed as a percentage of net assets as of 10/31/03 | | | |
Commercial Banks | | 17.2 | % |
|
Pharmaceuticals | | 8.2 | |
|
Oil & Gas | | 5.0 | |
|
Semiconductors & Semiconductor Equipment | | 4.2 | |
|
Specialty Retail | | 3.9 | |
|
Industry weightings are subject to change.
| Prudential World Fund, Inc./Dryden International Equity Fund | | 3 |
Investment Adviser’s Report
Market & performance overview
World stock markets began to rise sharply—in late March in the U.S., in early April elsewhere—as the speed and extent of U.S. military success in Iraq removed the last significant impediment to global economic progress from investors’ minds. Stocks continued to advance in this more benign environment as capital markets gradually reopened to the weakest firms, which had been starved of cash. Toward the end of the period, economic reports also gave the first hints that business spending on large-scale IT projects was starting up for the first time in three years. All the while, consumer spending remained firm and interest rates stayed low. These factors combined to make the second half of the Fund’s fiscal year a period of strong absolute stock returns.
Perhaps the most striking feature of the six months was the unusually wide performance gap in favor of the shares of the most financially and operationally geared firms over their healthier rivals. Despite this headwind, the international portfolio managed to add to the outperformance against the MSCI EAFE Index it achieved during the first half of the fiscal year and outperformed its Lipper peers over the one-year period.
Smaller companies outperformed
We made strong gains from our focus on smaller companies in the same three areas that yielded the first-half relative advance. Hong Kong-based industrial companies, including TechTronic (small appliances) and Johnson Electric (motors), were one source of strength. Telecommunications firms, especially Yahoo Japan (broadband services) and Colt Telecom (an alternative carrier), were another. Medical equipment, especially Nobel Biocare (dental implants) was a third. On the other hand, among the Fund’s detractors, only Porsche AG had a more than marginal effect on performance. We sold the position over the course of the year.
Tactical shift to large caps
During the past six months we have been gradually shifting our exposure away from these smaller companies toward larger-capitalization growth names. Smaller stocks have become relatively expensive in our opinion and we see better value in their larger brethren, which have been left behind so far in the recent market advance.
Jennison Associates LLC
The Portfolio of Investments following this report shows the size of the Fund’s positions at period-end.
| 4 | | Visit our website at www.jennisondryden.com |
Comments on Largest Holdings
Holdings expressed as a percentage of the Fund’s net assets as of 10/31/03.
| 3.4% | Reckitt Benckiser PLC/Household Products, U.K. |
Reckitt Benckiser manufactures and distributes a wide range of household, toiletry, pharmaceutical, and food products in several regions of the world.
| 2.9% | Vodafone Group PLC/Wireless Telecommunication Services, U.K. |
Vodafone provides a range of mobile telecommunication services, including voice and data communications. Vodafone has equity interests in 28 countries and partner networks in a further 7 countries with almost all the group’s mobile subsidiaries operating principally under the brand name Vodafone. In the United States their associated undertaking operates as Verizon Wireless.
| 2.8% | Nokia Oyj/Communications Equipment, Finland |
Nokia is a telecom company that designs and produces mobile phones. It also develops, makes, and markets remote controls, digital TV receivers, and digital music players, as well as indoor and outdoor antennas and other accessories. Nokia is a supplier of mobile, fixed broadband, and IP networks. The Company markets its products worldwide.
| 2.6% | Nobel Biocare Holding AG/Healthcare Equipment & Supplies, Switzerland |
Nobel Biocare develops and produces dental implants and dental prosthetics. Nobel sells under the brand names Branemark System, Steri-Oss/Replace, and Procera on the global market.
| 2.6% | Nitto Denko Corp./Chemicals, Japan |
Nitto Denko manufactures and markets a wide range of chemical products that are used as materials for industrial and electronic components. Its products include materials for sealants, semiconductors, and wrappings. Nitto Denko has a network of sales/manufacturing subsidiaries worldwide.
Holdings are subject to change.
See Notes to Financial Statements
| Prudential World Fund, Inc./Dryden International Equity Fund | | 5 |
Portfolio of Investments
as of October 31, 2003
| Shares | | Description | | Value (Note 1) |
| | | | | | |
| | | | | | |
LONG-TERM INVESTMENTS 92.7% |
|
COMMON STOCKS 92.6% |
| |
Australia 1.2% | | | |
|
| 111,800 | | BHP Billiton, Ltd. | | $ | 929,720 |
| |
Austria 1.8% | | | |
|
| 12,780 | | Erste Bank der oesterreichischen Sparkassen AG | | | 1,413,026 |
| |
Brazil 3.7% | | | |
|
| 61,100 | | Petroleo Brasileiro SA (ADR)(b) | | | 1,435,850 |
| 67,700 | | Unibanco—Uniao de Bancos Brasileiros SA (ADR)(b) | | | 1,496,847 |
| | | | |
|
|
| | | | | | 2,932,697 |
| |
Finland 2.8% | | | |
|
| 128,061 | | Nokia Oyj | | | 2,175,004 |
| |
France 3.8% | | | |
|
| 17,000 | | Sanofi-Synthélabo SA | | | 1,052,353 |
| 19,300 | | Societe Television Francaise 1 | | | 578,855 |
| 8,888 | | Total SA | | | 1,381,429 |
| | | | |
|
|
| | | | | | 3,012,637 |
| |
Germany 1.9% | | | |
|
| 7,700 | | Muenchener Rueckversicherungs-Gesellschaft AG | | | 918,309 |
| 3,910 | | SAP AG | | | 568,854 |
| | | | |
|
|
| | | | | | 1,487,163 |
| |
Hong Kong 4.0% | | | |
|
| 546,506 | | Esprit Holdings, Ltd. | | | 1,713,615 |
| 522,000 | | Techtronic Industries Co., Ltd. | | | 1,438,480 |
| | | | |
|
|
| | | | | | 3,152,095 |
| |
Ireland 1.5% | | | |
|
| 96,300 | | Anglo Irish Bank Corp. PLC | | | 1,156,431 |
| |
Israel 0.6% | | | |
|
| 7,700 | | Teva Pharmaceutical Industries, Ltd. (ADR)(b) | | | 438,053 |
| |
Italy 8.6% | | | |
|
| 636,600 | | Banca Nazionale del Lavoro SpA(a) | | | 1,450,493 |
| 94,490 | | Banca Popolare di Verona E Novara Scrl | | | 1,460,933 |
| 71,600 | | Eni SpA | | | 1,136,990 |
See Notes to Financial Statements
| 6 | | Visit our website at www.jennisondryden.com |
| Shares | | Description | | Value (Note 1) |
| | | | | | |
| |
Italy, cont’d | | | |
|
| 555,334 | | Telecom Italia SpA(a)(b) | | $ | 1,449,318 |
| 31,776 | | Tod’s SpA | | | 1,235,630 |
| | | | |
|
|
| | | | | | 6,733,364 |
| |
Japan 24.6% | | | |
|
| 69,800 | | Aoyama Trading Co., Ltd. | | | 1,295,238 |
| 18,000 | | Canon, Inc. | | | 871,060 |
| 14,400 | | Diamond City Co., Ltd. | | | 379,206 |
| 191,000 | | Mitsubishi Corp. | | | 1,982,362 |
| 175 | | Mitsubishi Tokyo Financial Group, Inc. | | | 1,257,561 |
| 268,000 | | Mitsui Mining & Smelting Co., Ltd. | | | 1,072,634 |
| 39,000 | | Nidec Copal Corp.(b) | | | 652,749 |
| 136,000 | | Nikko Exchange Traded Index Fund TOPIX | | | 1,298,950 |
| 38,500 | | Nitto Denko Corp. | | | 2,020,694 |
| 136,300 | | Nomura Exchange Traded Index Fund TOPIX | | | 1,301,815 |
| 45 | | Seria Co., Ltd.(a) | | | 225,133 |
| 83,000 | | Shionogi & Co., Ltd. | | | 1,392,960 |
| 109 | | Sumitomo Mitsui Financial Group, Inc. | | | 548,297 |
| 147,000 | | Sumitomo Realty & Development Co., Ltd. | | | 1,363,897 |
| 273,000 | | Taisei Corp. | | | 948,615 |
| 83 | | Yahoo Japan Corp.(a)(b) | | | 1,230,636 |
| 72,600 | | Yamaha Corp. | | | 1,462,764 |
| | | | |
|
|
| | | | | | 19,304,571 |
| |
Mexico 0.7% | | | |
|
| 626,300 | | Grupo Financiero BBVA Bancomer SA de CV (Class “B” Shares)(a) | | | 531,588 |
| |
Netherlands 5.2% | | | |
|
| 93,600 | | ASM International NV(a)(b) | | | 1,638,936 |
| 19,000 | | IHC Caland NV | | | 810,611 |
| 78,500 | | ING Groep NV | | | 1,629,837 |
| | | | |
|
|
| | | | | | 4,079,384 |
| |
South Korea 2.1% | | | |
|
| 4,100 | | Samsung Electronics Co., Ltd. | | | 1,628,221 |
| |
Spain 3.6% | | | |
|
| 207 | | Antena 3 Television, SA(a) | | | 6,914 |
| 23,425 | | Banco Popular Espanol, SA | | | 1,218,068 |
| 29,800 | | Gamesa Corporacion Tecnologica, SA | | | 806,477 |
| 61,148 | | Telefonica, SA | | | 760,605 |
| | | | |
|
|
| | | | | | 2,792,064 |
See Notes to Financial Statements
| Prudential World Fund, Inc./Dryden International Equity Fund | | 7 |
Portfolio of Investments
as of October 31, 2003 Cont’d
| Shares | | Description | | Value (Note 1) | |
| | | | | | | |
Switzerland 6.6% | | | | |
|
| 22,900 | | Nobel Biocare Holding AG | | $ | 2,032,164 | |
| 23,800 | | Roche Holdings AG | | | 1,969,446 | |
| 19,400 | | UBS AG | | | 1,191,298 | |
| | | | |
|
|
|
| | | | | | 5,192,908 | |
| |
United Kingdom 19.9% | | | | |
|
| 34,100 | | AstraZeneca PLC | | | 1,601,730 | |
| 201,400 | | Barclays PLC | | | 1,698,574 | |
| 443,200 | | COLT Telecom Group PLC(a) | | | 776,531 | |
| 123,500 | | Exel PLC | | | 1,589,612 | |
| 81,900 | | HSBC Holdings PLC | | | 1,229,974 | |
| 43,600 | | Man Group PLC | | | 1,072,071 | |
| 126,296 | | Reckitt Benckiser PLC | | | 2,657,541 | |
| 89,200 | | Smith & Nephew PLC | | | 708,780 | |
| 490,669 | | Tesco PLC | | | 1,967,112 | |
| 1,088,990 | | Vodafone Group PLC | | | 2,286,851 | |
| | | | |
|
|
|
| | | | | | 15,588,776 | |
| | | | |
|
|
|
| | | Total common stocks (cost $55,433,240) | | | 72,547,702 | |
| | | | |
|
|
|
RIGHTS 0.1% | | | | |
| |
Germany 0.1% | | | | |
|
| 7,700 | | Muenchener Rueckversicherungs-Gesellschaft AG (cost $0) | | | 62,927 | |
| | | | |
|
|
|
| | | Total long-term investments (cost $55,433,240) | | | 72,610,629 | |
| | | | |
|
|
|
SHORT-TERM INVESTMENTS 14.8% | | | | |
| |
Mutual Fund 14.8% | | | | |
|
| | | Dryden Core Investment Fund - Taxable Money Market Series(c) |
| 11,619,787 | | (Note 3) (cost $11,619,787) | | | 11,619,787 | |
| | | | |
|
|
|
| | | Total Investments 107.5%
(cost $67,053,027; Note 5) | | | 84,230,416 | |
| | | Liabilities in excess of other assets (7.5%) | | | (5,888,013 | ) |
| | | | |
|
|
|
| | | Net Assets 100% | | $ | 78,342,403 | |
| | | | |
|
|
|
| (a) | Non-income producing security. |
| (b) | Securities, or portion thereof, on loan, see Note 4. |
(c) Represents security, or portion thereof, purchased with cash collateral received for securities on loan.
ADR—American Depositary Receipt.
See Notes to Financial Statements.
| 8 | | Visit our website at www.jennisondryden.com |
The industry classification of portfolio holdings shown as a percentage of net assets as of October 31, 2003 was as follows:
Commercial Banks | | 17.2 | % |
Pharmaceuticals | | 8.2 | |
Oil & Gas | | 5.0 | |
Semiconductor & Semiconductor Equipment | | 4.2 | |
Specialty Retail | | 3.9 | |
Diversified Telecommunication Services | | 3.8 | |
Health Care Equipment & Supplies | | 3.5 | |
Household Products | | 3.4 | |
Exchange Traded Fund | | 3.3 | |
Wireless Telecommunication Services | | 2.9 | |
Capital Markets | | 2.9 | |
Communications Equipment | | 2.8 | |
Leisure Equipment & Products | | 2.7 | |
Chemicals | | 2.6 | |
Metals & Mining | | 2.6 | |
Food & Staples Retailing | | 2.5 | |
Trading Companies & Distributors | | 2.5 | |
Real Estate | | 2.2 | |
Diversified Financial Services | | 2.2 | |
Air Freight & Couriers | | 2.0 | |
Household Durables | | 1.8 | |
Internet Software & Services | | 1.6 | |
Textiles & Apparel | | 1.6 | |
Construction & Engineering | | 1.2 | |
Insurance | | 1.2 | |
Office Electronics | | 1.1 | |
Electrical Equipment | | 1.0 | |
Energy Equipment & Services | | 1.0 | |
Media | | 0.8 | |
Software | | 0.7 | |
Multiline Retail | | 0.3 | |
Cash & Equivalents | | 14.8 | |
| | |
|
|
| | | 107.5 | |
Liabilities in excess of other assets | | (7.5 | ) |
| | |
|
|
| | | 100.0 | % |
| | |
|
|
See Notes to Financial Statements.
| Prudential World Fund, Inc./Dryden International Equity Fund | | 9 |
Statement of Assets and Liabilities
as of October 31, 2003
Assets |
|
Investments, at value including securities on loan of $6,985,768 (cost $67,053,027) | | $ | 84,230,416 | |
Foreign currency, at value (cost $1,235,027) | | | 1,225,890 | |
Receivable for investments sold | | | 1,576,785 | |
Receivable for Series shares sold | | | 259,527 | |
Tax reclaims receivable | | | 45,047 | |
Dividends and interest receivable | | | 43,121 | |
Prepaid expenses and other assets | | | 714 | |
| | |
|
|
|
Total assets | | | 87,381,500 | |
| | |
|
|
|
|
Liabilities |
|
Payable to broker for collateral for securities on loan (Note 4) | | | 8,038,948 | |
Accrued expenses | | | 355,906 | |
Payable to custodian | | | 338,666 | |
Payable for Series shares reacquired | | | 199,337 | |
Management fee payable | | | 55,929 | |
Distribution fee payable | | | 50,311 | |
| | |
|
|
|
Total liabilities | | | 9,039,097 | |
| | |
|
|
|
| |
Net Assets | | $ | 78,342,403 | |
| | |
|
|
|
Net assets were comprised of: | | | | |
Common stock, at par | | $ | 164,953 | |
Paid-in capital in excess of par | | | 255,140,167 | |
| | |
|
|
|
| | | | 255,305,120 | |
Accumulated net realized loss on investments | | | (194,125,064 | ) |
Net unrealized appreciation on investments and foreign currencies | | | 17,162,347 | |
| | |
|
|
|
| |
Net assets, October 31, 2003 | | $ | 78,342,403 | |
| | |
|
|
|
See Notes to Financial Statements.
| 10 | | Visit our website at www.jennisondryden.com |
Class A | | | |
|
Net asset value and redemption price per share ($20,050,308 ÷ 4,140,769 shares of common stock issued and outstanding) | | $ | 4.84 |
Maximum sales charge (5% of offering price) | | | .25 |
| | |
|
|
Maximum offering price to public | | $ | 5.09 |
| | |
|
|
| |
Class B | | | |
|
Net asset value, offering price and redemption price per share ($40,587,364 ÷ 8,620,813 shares of common stock issued and outstanding) | | $ | 4.71 |
| | |
|
|
| |
Class C | | | |
|
Net asset value and redemption price per share ($14,006,083 ÷ 2,975,104 shares of common stock issued and outstanding) | | $ | 4.71 |
Sales charge (1% of offering price) | | | .05 |
| | |
|
|
Offering price to public | | $ | 4.76 |
| | |
|
|
| |
Class Z | | | |
|
Net asset value, offering price and redemption price per share ($3,698,648 ÷ 758,595 shares of common stock issued and outstanding) | | $ | 4.88 |
| | |
|
|
See Notes to Financial Statements.
| Prudential World Fund, Inc./Dryden International Equity Fund | | 11 |
Statement of Operations
Year Ended October 31, 2003
Net Investment Loss |
|
Income | | | | |
Dividends (net of foreign withholding taxes of $164,010) | | $ | 1,211,200 | |
Income from securities loaned, net | | | 13,592 | |
| | |
|
|
|
Total income | | | 1,224,792 | |
| | |
|
|
|
| |
Expenses | | | | |
Management fee | | | 596,893 | |
Distribution fee—Class A | | | 46,626 | |
Distribution fee—Class B | | | 353,994 | |
Distribution fee—Class C | | | 126,404 | |
Transfer agent’s fees and expenses | | | 332,000 | |
Custodian’s fees and expenses | | | 179,000 | |
Reports to shareholders | | | 106,000 | |
Audit fee | | | 39,000 | |
Legal fees and expenses | | | 36,000 | |
Registration fees | | | 20,000 | |
Directors’ fees | | | 7,000 | |
Miscellaneous | | | 6,229 | |
| | |
|
|
|
Total operating expenses | | | 1,849,146 | |
Loan interest expense (Note 7) | | | 13 | |
| | |
|
|
|
Total expenses | | | 1,849,159 | |
| | |
|
|
|
Net investment loss | | | (624,367 | ) |
| | |
|
|
|
|
Realized And Unrealized Gain (Loss) On Investments And Foreign Currency Transactions |
|
Net realized loss on: | | | | |
Investment transactions | | | (6,579,320 | ) |
Foreign currency transactions | | | (196,244 | ) |
| | |
|
|
|
| | | | (6,775,564 | ) |
| | |
|
|
|
| |
Net change in unrealized appreciation (depreciation) on: | | | | |
Investments | | | 25,527,945 | |
Foreign currencies | | | (17,295 | ) |
| | |
|
|
|
| | | | 25,510,650 | |
| | |
|
|
|
Net gain on investments and foreign currencies | | | 18,735,086 | |
| | |
|
|
|
Net Increase In Net Assets Resulting From Operations | | $ | 18,110,719 | |
| | |
|
|
|
See Notes to Financial Statements.
| 12 | | Visit our website at www.jennisondryden.com |
Statement of Changes in Net Assets
| |
| | | Year Ended October 31,
| |
| | | 2003 | | | 2002 | |
Increase (Decrease) In Net Assets |
|
Operations | | | | | | | | |
Net investment loss | | $ | (624,367 | ) | | $ | (1,062,825 | ) |
Net realized loss on investment and foreign currency transactions | | | (6,775,564 | ) | | | (48,161,809 | ) |
Net change in unrealized appreciation/depreciation on investments and foreign currencies | | | 25,510,650 | | | | 36,013,631 | |
| | |
|
|
| |
|
|
|
Net increase (decrease) in net assets resulting from operations | | | 18,110,719 | | | | (13,211,003 | ) |
| | |
|
|
| |
|
|
|
| | |
Series share transactions (net of conversions) (Note 6) | | | | | | | | |
Net proceeds from shares sold | | | 47,247,827 | | | | 65,511,488 | |
Cost of shares reacquired | | | (63,443,659 | ) | | | (89,611,659 | ) |
| | |
|
|
| |
|
|
|
Net decrease in net assets from Series share transactions | | | (16,195,832 | ) | | | (24,100,171 | ) |
| | |
|
|
| |
|
|
|
Total increase (decrease) | | | 1,914,887 | | | | (37,311,174 | ) |
|
Net Assets |
|
Beginning of year | | | 76,427,516 | | | | 113,738,690 | |
| | |
|
|
| |
|
|
|
End of year | | $ | 78,342,403 | | | $ | 76,427,516 | |
| | |
|
|
| |
|
|
|
See Notes to Financial Statements.
| Prudential World Fund, Inc./Dryden International Equity Fund | | 13 |
Notes to Financial Statements
Prudential World Fund, Inc. (the “Fund”) is registered under the Investment Company Act of 1940, as an open-end, diversified management investment company and currently consists of three series: Dryden International Equity Fund (the “Series”), Strategic Partners International Value Fund and Jennison Global Growth Fund, formerly known as Jennison International Growth Fund, Jennison International Value Fund and Prudential Global Growth Fund, respectively. These financial statements relate to the Dryden International Equity Fund. The financial statements of the other series are not presented herein. The Series commenced investment operations in March 2000. The investment objective of the Series is to achieve long-term growth of capital. The Series seeks to achieve its objective primarily through investment in equity-related securities of foreign issuers.
Note 1. Accounting Policies
The following is a summary of significant accounting policies followed by the Fund and the Series in the preparation of its financial statements.
Securities Valuation: Securities listed on a securities exchange are valued at the last sale price on such exchange on the day of valuation or, if there was no sale on such day, at the mean between the last reported bid and asked prices, or at the last bid price on such day in the absence of an asked price. Securities traded via Nasdaq are valued at the official closing prices as provided by Nasdaq. Securities that are actively traded in the over-the-counter market, including listed securities for which the primary market is believed by Prudential Investments LLC (“PI” or “Manager”), in consultation with the subadvisor, to be over-the-counter, are valued at market value using prices provided by an independent pricing agent or principal market maker. Futures contracts and options thereon traded on a commodities exchange or board of trade are valued at the last sale price at the close of trading on such exchange or board of trade or, if there was no sale on the applicable commodities exchange or board of trade on such day, at the mean between the most recently quoted prices on such exchange or board of trade or at the last bid price in the absence of an asked price. Prices may be obtained from independent pricing services which use information provided by market makers or estimates of market values obtained from yield data relating to investments or securities with similar characteristics. Securities for which reliable market quotations are not readily available, or whose values have been affected by events occurring after the close of the security’s foreign market and before the Series’ normal pricing time, are valued at fair value in accordance with Board of Directors’ approved fair valuation procedures.
| 14 | | Visit our website at www.jennisondryden.com |
Investments in mutual funds are valued at their net asset value as of the close of the New York Stock Exchange on the date of valuation.
Short-term securities which mature in 60 days or less are valued at amortized cost, which approximates market value. The amortized cost method includes valuing a security at its cost on the date of purchase and thereafter assuming a constant amortization to maturity of the difference between the principal amount due at maturity and cost. Short-term securities which mature in more than 60 days are valued at current market quotations.
Repurchase Agreements: In connection with transactions in repurchase agreements with United States financial institutions, it is the Fund’s policy that its custodian or designated subcustodians, under triparty repurchase agreements, as the case may be, take possession of the underlying collateral securities, the value of which exceeds the principal amount of the repurchase transaction including accrued interest. To the extent that any repurchase transaction exceeds one business day, the value of the collateral is marked to market on a daily basis to maintain the adequacy of the collateral. If the seller defaults and the value of the collateral declines or if bankruptcy proceedings are commenced with respect to the seller of the security, realization of the collateral by the Series may be delayed or limited.
Foreign Currency Translation: The books and records of the Series are maintained in U.S. dollars. Foreign currency amounts are translated into U.S. dollars on the following basis:
(i) market value of investment securities, other assets and liabilities—at the current rates of exchange.
(ii) purchases and sales of investment securities, income and expenses—at the rate of exchange prevailing on the respective dates of such transactions.
Although the net assets of the Series are presented at the foreign exchange rates and market values at the close of the fiscal year, the Series does not isolate that portion of the results of operations arising as a result of changes in the foreign exchange rates from the fluctuations arising from changes in the market prices of long-term portfolio securities held at the end of the fiscal year. Similarly, the Series does not isolate the effect of changes in foreign exchange rates from the fluctuations arising from changes in the market prices of long-term portfolio securities sold during the fiscal year. Accordingly, realized foreign currency gains or losses are included in the reported net realized gains or losses on investment transactions.
| Prudential World Fund, Inc./Dryden International Equity Fund | | 15 |
Notes to Financial Statements
Cont’d
Net realized gains or losses on foreign currency transactions represent net foreign exchange gains or losses from holdings of foreign currencies, currency gains or losses realized between the trade and settlement dates on security transactions, and the difference between the amounts of dividends, interest and foreign withholding taxes recorded on the Series’ books and the U.S. dollar equivalent amounts actually received or paid. Net unrealized currency gains or losses from valuing foreign currency denominated assets and liabilities (other than investments) at year end exchange rates are reflected as a component of net unrealized appreciation (depreciation) on foreign currencies.
Foreign security and currency transactions may involve certain considerations and risks not typically associated with those of domestic origin as a result of, among other factors, the possibility of political or economic instability, or the level of governmental supervision and regulation of foreign securities markets.
Securities Transactions and Net Investment Income: Securities transactions are recorded on the trade date. Realized gains or losses from investment and currency transactions are calculated on the identified cost basis. Dividend income is recorded on the ex-dividend date and interest income, including amortization of premium and accretion of discount on debt securities, as required, is recorded on an accrual basis. Expenses are recorded on the accrual basis which may require the use of certain estimates by management.
Net investment income or loss (other than distribution fees which are charged directly to the respective class) and unrealized and realized gains and losses are allocated daily to each class of shares based upon the relative proportion of net assets of each class at the beginning of the day.
Securities Lending: The Series may lend its portfolio securities to broker-dealers. The loans are secured by collateral at least equal at all times to the market value of the securities loaned. Loans are subject to termination at the option of the borrower or the Series. Upon termination of the loan, the borrower will return to the lender securities identical to the loaned securities. Should the borrower of the securities fail financially, the Series has the right to repurchase the securities using the collateral in the open market. The Series recognizes income, net of any rebate and securities lending agent fees, for lending its securities in the form of fees or interest on the investment of any cash received as collateral. The Series also continues to receive interest and dividends
| 16 | | Visit our website at www.jennisondryden.com |
or amounts equivalent thereto on the securities loaned and recognizes any unrealized gain or loss in the market price of the securities loaned that may occur during the term of the loan.
Dividends and Distributions: The Series expects to pay dividends of net investment income and distributions of net realized capital and currency gains, if any, annually. Dividends and distributions to shareholders, which are determined in accordance with federal income tax regulations and which may differ from generally accepted accounting principles, are recorded on the ex-dividend date.
Taxes: For federal income tax purposes, each series in the Fund is treated as a separate taxpaying entity. It is each Series’ policy to continue to meet the requirements of the Internal Revenue Code applicable to regulated investment companies and to distribute all of its taxable net investment income and capital gains, if any, to its shareholders. Therefore, no federal income tax provision is required.
Withholding taxes on foreign dividends are recorded net of reclaimable amounts, at the time the related income is earned.
Note 2. Agreements
The Fund has a management agreement for the Series with PI. Pursuant to this agreement, PI has responsibility for all investment advisory services and supervises the subadvisor’s performance of such services. PI has entered into a subadvisory agreement with Jennison Associates LLC (“Jennison”). The subadvisory agreement provides that Jennison furnishes investment advisory services in connection with the management of the Series. In connection therewith, Jennison is obligated to keep certain books and records of the Series. PI pays for the services of Jennison, the cost of compensation of officers of the Series, occupancy and certain clerical and bookkeeping costs of the Series. The Series bears all other costs and expenses.
The management fee paid to PI is computed daily and payable monthly, at an annual rate of .85 of 1% of the average daily net assets of the Series up to and including $300 million, .75 of 1% of the average daily net assets in excess of $300 million up to and including $1.5 billion and .70 of 1% of the Series’ average daily net assets over $1.5 billion.
The Series has a distribution agreement with Prudential Investment Management Services LLC (“PIMS”) which acts as the distributor of Class A, Class B, Class C and Class Z shares of the Series. The Series compensates PIMS for distributing and
| Prudential World Fund, Inc./Dryden International Equity Fund | | 17 |
Notes to Financial Statements
Cont’d
servicing the Series’ Class A, Class B and Class C shares, pursuant to a plan of distribution, (the “Class A, B and C Plans”), regardless of expenses actually incurred by PIMS. The distribution fees are accrued daily and payable monthly. No distribution or service fees are paid to PIMS as distributor for Class Z shares of the Series.
Pursuant to the Class A, B and C Plans, the Series compensates PIMS for distribution-related activities at an annual rate of up to .30 of 1%, 1% and 1% of the average daily net assets of the Class A, B and C shares, respectively. For the year ended October 31, 2003 PIMS contractually agreed to limit such fees to .25 of 1% of the average daily net assets of the Class A shares.
PIMS has advised the Series that they received approximately $24,300 and $4,600 in front-end sales charges resulting from sales of Class A and Class C shares, respectively, during the year ended October 31, 2003. From these fees, PIMS paid such sales charges to affiliated broker-dealers, which in turn paid commissions to salespersons and incurred other distribution costs.
PIMS has advised the Series that for the year ended October 31, 2003 it received approximately $164,200 and $26,500 in contingent deferred sales charges imposed upon certain redemptions by Class B and Class C shareholders, respectively.
PI, PIMS and Jennison are indirect, wholly-owned subsidiaries of Prudential Financial, Inc. (“Prudential”).
Note 3. Other Transactions with Affiliates
Prudential Mutual Fund Services LLC (“PMFS”), an affiliate of PI and an indirect, wholly-owned subsidiary of Prudential, serves as the Fund’s transfer agent. During the year ended October 31, 2003 the Series incurred fees of approximately $260,700 for the services of PMFS. As of October 31, 2003 approximately $20,000 of such fees were due to PMFS. Transfer agent fees and expenses in the Statement of Operations include certain out-of-pocket expenses paid to nonaffiliates, where applicable.
The Series pays networking fees to affiliated and unaffiliated broker/dealers. These networking fees are payments made to broker/dealers that clear mutual fund
| 18 | | Visit our website at www.jennisondryden.com |
transactions through a national clearing system. The Series incurred approximately $36,100 in total networking fees, of which the amount relating to the services of Wachovia Securities LLC (“Wachovia”) and Prudential Securities, Inc. (“PSI”), affiliates of PI, was approximately $34,600 for the year ended October 31, 2003. Effective July 1, 2003, Prudential and Wachovia Corp. formed a joint venture (“Wachovia Securities LLC”) whereby Prudential and Wachovia Corp. combined their brokerage business with Prudential holding a minority interest. Prior to July 1, 2003, PSI was an indirect, wholly-owned subsidiary of Prudential. As of October 31, 2003, approximately $3,200 of such fees were due to Wachovia. These amounts are included in transfer agent’s fees and expenses in the Statement of Operations.
PSI was the securities lending agent for the Series. Effective July 1, 2003, Prudential Investment Management, Inc. (“PIM”), an indirect, wholly-owned subsidiary of Prudential became the Series’ securities lending agent. For the year ended October 31, 2003, PSI and PIM have been compensated approximately $2,400 and $2,100 for these services, respectively.
The Series invests in the Taxable Money Market Series (the “Portfolio”), a portfolio of the Dryden Core Investment Fund, formerly Prudential Core Investment Fund, pursuant to an exemptive order received from the Securities and Exchange Commission. The Portfolio is a money market mutual fund registered under the Investment Company Act of 1940, as amended, and managed by PI. During the year ended October 31, 2003, the Series earned income of approximately $29,300 and $13,600, from the Portfolio, by investing its excess cash and collateral received from securities lending, respectively.
Note 4. Portfolio Securities
Purchases and sales of investment securities, other than short-term investments, for the year ended October 31, 2003 aggregated $105,810,571 and $126,793,676, respectively.
As of October 31, 2003, the Series had securities on loan with an aggregate market value of $6,985,768. The Series received $8,038,948 in cash as collateral for securities on loan which was used to purchase highly liquid short-term investments in accordance with the Series’ securities lending procedures.
Note 5. Distributions and Tax Information
Distributions to shareholders, which are determined in accordance with federal income tax regulations and which may differ from generally accepted accounting
| Prudential World Fund, Inc./Dryden International Equity Fund | | 19 |
Notes to Financial Statements
Cont’d
principles, are recorded on the ex-dividends date. In order to present undistributed net investment income (loss) and accumulated net realized gains (losses) on the Statement of Assets and Liabilities that more closely represent their tax character, certain adjustments have been made to paid-in-capital in excess of par, undistributed net investment income (loss) and accumulated net realized gain (loss) on investment. For the year ended October 31, 2003, the adjustments were to decrease paid-in capital in excess of par by $820,611, decrease accumulated net realized loss on investments by $196,244 and decrease undistributed net investment loss by $624,367 due to the difference in the treatment for book and tax purposes of certain transactions involving net operating losses, foreign currencies and other tax adjustments.
For the year ended October 31, 2003, the Series had no distributable earnings on a tax basis.
For federal income tax purposes, the Series had a capital loss carryforward as of October 31, 2003 of approximately $193,905,000 of which $13,222,000 expires in 2008, $120,080,000 expires in 2009, $49,177,000 expires in 2010 and $11,426,000 expires in 2011. Accordingly, no capital gains distribution is expected to be paid to shareholders until net gains have been realized in excess of such carryforward. It is uncertain whether the Series will be able to realize the full benefit prior to the expiration date.
The United States federal income tax basis of the Series’ investments and the net unrealized appreciation as of October 31, 2003 were as follows:
Tax Basis
| | Appreciation
| | Depreciation
| | Other Cost Basis Adjustments
| | Total Net Unrealized Appreciation
|
| $67,273,028 | | $17,254,620 | | $297,232 | | ($15,042) | | $16,942,346 |
The difference between book and tax basis is primarily attributable to deferred losses on wash sales. The other cost basis adjustments are primarily attributable to appreciation (depreciation) of foreign currency and mark to market of receivables and payables.
Note 6. Capital
The Series offers Class A, Class B, Class C and Class Z shares. Class A shares are sold with a front-end sales charge of up to 5%. In some limited circumstances, Class A
| 20 | | Visit our website at www.jennisondryden.com |
shares may not be subject to a front-end sales charge, but may be subject to a 1% contingent deferred sales charge for the first year. Class B shares are sold with a contingent deferred sales charge which declines from 5% to zero depending on the period of time the shares are held. Class C shares are sold with a front-end sales charge of 1% and a contingent deferred sales charge of 1% during the first 18 months. Class B shares will automatically convert to Class A shares on a quarterly basis approximately seven years after purchase. A special exchange privilege is also available for shareholders who qualified to purchase Class A shares at net asset value. Class Z shares are not subject to any sales or redemption charge and are offered exclusively for sale to a limited group of investors.
There are 500 million authorized shares of $.01 par value common stock, divided equally into four classes, designated Class A, Class B, Class C and Class Z common stock.
Transactions in shares of common stock were as follows:
Class A
| | Shares
| | | Amount
| |
Year ended October 31, 2003: | | | | | | | |
Shares sold | | 6,452,827 | | | $ | 25,523,495 | |
Shares reacquired | | (7,622,631 | ) | | | (30,448,210 | ) |
| | |
|
| |
|
|
|
Net increase (decrease) in shares outstanding before conversion | | (1,169,804 | ) | | | (4,924,715 | ) |
Shares issued upon conversion from Class B | | 119,808 | | | | 476,632 | |
| | |
|
| |
|
|
|
Net increase (decrease) in shares outstanding | | (1,049,996 | ) | | $ | (4,448,083 | ) |
| | |
|
| |
|
|
|
Year ended October 31, 2002: | | | | | | | |
Shares sold | | 5,760,989 | | | $ | 23,875,076 | |
Shares reacquired | | (7,260,271 | ) | | | (30,715,355 | ) |
| | |
|
| |
|
|
|
Net increase (decrease) in shares outstanding before conversion | | (1,499,282 | ) | | | (6,840,279 | ) |
Shares issued upon conversion from Class B | | 92,759 | | | | 396,172 | |
| | |
|
| |
|
|
|
Net increase (decrease) in shares outstanding | | (1,406,523 | ) | | $ | (6,444,107 | ) |
| | |
|
| |
|
|
|
| Prudential World Fund, Inc./Dryden International Equity Fund | | 21 |
Notes to Financial Statements
Cont’d
Class B
| | Shares
| | | Amount
| |
Year ended October 31, 2003: | | | | | | | |
Shares sold | | 1,419,278 | | | $ | 5,558,876 | |
Shares reacquired | | (2,787,406 | ) | | | (10,623,686 | ) |
| | |
|
| |
|
|
|
Net increase (decrease) in shares outstanding before conversion | | (1,368,128 | ) | | | (5,064,810 | ) |
Shares reacquired upon conversion into Class A | | (122,878 | ) | | | (476,632 | ) |
| | |
|
| |
|
|
|
Net increase (decrease) in shares outstanding | | (1,491,006 | ) | | $ | (5,541,442 | ) |
| | |
|
| |
|
|
|
Year ended October 31, 2002: | | | | | | | |
Shares sold | | 1,569,069 | | | $ | 6,533,010 | |
Shares reacquired | | (4,057,237 | ) | | | (17,047,487 | ) |
| | |
|
| |
|
|
|
Net increase (decrease) in shares outstanding before conversion | | (2,488,168 | ) | | | (10,514,477 | ) |
Shares reacquired upon conversion into Class A | | (94,269 | ) | | | (396,172 | ) |
| | |
|
| |
|
|
|
Net increase (decrease) in shares outstanding | | (2,582,437 | ) | | $ | (10,910,649 | ) |
| | |
|
| |
|
|
|
Class C
| | | | | | |
Year ended October 31, 2003: | | | | | | | |
Shares sold | | 2,460,812 | | | $ | 9,351,879 | |
Shares reacquired | | (3,280,089 | ) | | | (12,500,330 | ) |
| | |
|
| |
|
|
|
Net increase (decrease) in shares outstanding | | (819,277 | ) | | $ | (3,148,451 | ) |
| | |
|
| |
|
|
|
Year ended October 31, 2002: | | | | | | | |
Shares sold | | 3,700,300 | | | $ | 15,321,706 | |
Shares reacquired | | (5,465,127 | ) | | | (23,137,185 | ) |
| | |
|
| |
|
|
|
Net increase (decrease) in shares outstanding | | (1,764,827 | ) | | $ | (7,815,479 | ) |
| | |
|
| |
|
|
|
Class Z
| | | | | | |
Year ended October 31, 2003: | | | | | | | |
Shares sold | | 1,685,724 | | | $ | 6,813,577 | |
Shares reacquired | | (2,534,581 | ) | | | (9,871,433 | ) |
| | |
|
| |
|
|
|
Net increase (decrease) in shares outstanding | | (848,857 | ) | | $ | (3,057,856 | ) |
| | |
|
| |
|
|
|
Year ended October 31, 2002: | | | | | | | |
Shares sold | | 4,547,627 | | | $ | 19,781,696 | |
Shares reacquired | | (4,323,334 | ) | | | (18,711,632 | ) |
| | |
|
| |
|
|
|
Net increase (decrease) in shares outstanding | | 224,293 | | | $ | 1,070,064 | |
| | |
|
| |
|
|
|
Note 7. Borrowings
The Series, along with other affiliated registered investment companies (the “Funds”), is a party to a syndicated credit agreement (“SCA”) with a group of banks. The SCA provides for a commitment of $800 million and allows the Funds to increase the commitment to $1 billion, if necessary. Interest on any borrowings will be incurred at
| 22 | | Visit our website at www.jennisondryden.com |
market rates. The Funds pay a commitment fee of .08 of 1% of the unused portion of the SCA. The commitment fee is accrued and paid quarterly and is allocated to the Funds pro rata, based on net assets. The purpose of the SCA is to serve as an alternative source of funding for capital share redemptions. The expiration date of the SCA was May 2, 2003. On May 2, 2003, the SCA was renewed under the same terms and conditions (“May 2003 renewal”). The expiration date of the May 2003 renewal is April 30, 2004. The Series utilized the line of credit during the year ended October 31, 2003. The Series borrowed $295,000 for one day at an interest rate of 1.5513%.
Note 8. Subsequent Event
The Board of Directors have approved the change of subadvisor from Jennison to PIM effective December 8, 2003. PIM will be compensated at the same rate as Jennison had been.
| Prudential World Fund, Inc./Dryden International Equity Fund | | 23 |
Financial Highlights
| |
| | | Class A
| |
| | |
| | | Year Ended October 31,
| | | March 1,
2000(a)
Through
October 31,
2000 | |
| | | 2003 | | | 2002 | | | 2001 | | |
|
Per Share Operating Performance: | | | | | | | | | | | | | | | | |
Net Asset Value, Beginning Of Period | | $ | 3.74 | | | $ | 4.37 | | | $ | 7.91 | | | $ | 10.00 | |
| | |
|
|
| |
|
|
| |
|
|
| |
|
|
|
Loss From Investment Operations: | | | | | | | | | | | | | | | | |
Net investment loss | | | (.02 | ) | | | (.02 | ) | | | (.06 | ) | | | (— | )(d) |
Net realized and unrealized gain (loss) on investment and foreign currency transactions | | | 1.12 | | | | (.61 | ) | | | (3.48 | ) | | | (2.09 | ) |
| | |
|
|
| |
|
|
| |
|
|
| |
|
|
|
Total from investment operations | | | 1.10 | | | | (.63 | ) | | | (3.54 | ) | | | (2.09 | ) |
| | |
|
|
| |
|
|
| |
|
|
| |
|
|
|
Net asset value, end of period | | $ | 4.84 | | | $ | 3.74 | | | $ | 4.37 | | | $ | 7.91 | |
| | |
|
|
| |
|
|
| |
|
|
| |
|
|
|
Total Return(b): | | | 29.41 | % | | | (14.42 | )% | | �� | (44.68 | )% | | | (21.00 | )% |
Ratios/Supplemental Data: | | | | | | | | | | | | | | | | |
Net assets, end of period (000) | | $ | 20,050 | | | $ | 19,414 | | | $ | 28,860 | | | $ | 75,354 | |
Average net assets (000) | | $ | 18,650 | | | $ | 25,360 | | | $ | 47,713 | | | $ | 85,757 | |
Ratios to average net assets: | | | | | | | | | | | | | | | | |
Expenses, including distribution and service (12b-1) fees(e) | | | 2.13 | % | | | 1.88 | % | | | 1.73 | % | | | 1.56 | %(c) |
Expenses, excluding distribution and service (12b-1) fees | | | 1.88 | % | | | 1.63 | % | | | 1.48 | % | | | 1.31 | %(c) |
Net investment loss | | | (.36 | )% | | | (.56 | )% | | | (.86 | )% | | | (— | )(c) |
For Class A, B, C and Z shares: | | | | | | | | | | | | | | | | |
Portfolio turnover rate(f) | | | 157 | % | | | 108 | % | | | 63 | % | | | 61 | % |
| (a) | Commencement of investment operations. |
| (b) | Total return does not consider the effect of sales loads. Total return is calculated assuming a purchase of shares on the first day and a sale on the last day of each period reported and includes reinvestment of dividends and distributions. Total returns for periods less than one full year are not annualized. |
| (d) | Less than $.005 per share. |
| (e) | The distributor of the Series contractually agreed to limit its distribution and service (12b-1) fees to .25 of 1% of the average net assets of the Class A shares. |
| (f) | Portfolio turnover for periods less than one full year are not annualized. |
See Notes to Financial Statements
| 24 | | Visit our website at www.jennisondryden.com |
| |
| | | Class B
| |
| | |
| | | Year Ended October 31,
| | | March 1,
2000(a)
Through
October 31,
2000
| |
| | | 2003 | | | 2002 | | | 2001 | | |
|
Per Share Operating Performance: | | | | | | | | | | | | | | | | |
Net Asset Value, Beginning Of Period | | $ | 3.66 | | | $ | 4.32 | | | $ | 7.87 | | | $ | 10.00 | |
| | |
|
|
| |
|
|
| |
|
|
| |
|
|
|
Loss From Investment Operations: | | | | | | | | | | | | | | | | |
Net investment loss | | | (.05 | ) | | | (.07 | ) | | | (.11 | ) | | | (.05 | ) |
Net realized and unrealized gain (loss) on investment and foreign currency transactions | | | 1.10 | | | | (.59 | ) | | | (3.44 | ) | | | (2.08 | ) |
| | |
|
|
| |
|
|
| |
|
|
| |
|
|
|
Total from investment operations | | | 1.05 | | | | (.66 | ) | | | (3.55 | ) | | | (2.13 | ) |
| | |
|
|
| |
|
|
| |
|
|
| |
|
|
|
Net asset value, end of period | | $ | 4.71 | | | $ | 3.66 | | | $ | 4.32 | | | $ | 7.87 | |
| | |
|
|
| |
|
|
| |
|
|
| |
|
|
|
Total Return(b): | | | 28.34 | % | | | (15.05 | )% | | | (45.04 | )% | | | (21.40 | )% |
Ratios/Supplemental Data: | | | | | | | | | | | | | | | | |
Net assets, end of period (000) | | $ | 40,587 | | | $ | 37,059 | | | $ | 54,810 | | | $ | 131,919 | |
Average net assets (000) | | $ | 35,399 | | | $ | 49,086 | | | $ | 87,731 | | | $ | 147,626 | |
Ratios to average net assets: | | | | | | | | | | | | | | | | |
Expenses, including distribution and service (12b-1) fees | | | 2.88 | % | | | 2.63 | % | | | 2.48 | % | | | 2.31 | %(c) |
Expenses, excluding distribution and service (12b-1) fees | | | 1.88 | % | | | 1.63 | % | | | 1.48 | % | | | 1.31 | %(c) |
Net investment loss | | | (1.14 | )% | | | (1.30 | )% | | | (1.60 | )% | | | (.78 | )%(c) |
| (a) | Commencement of investment operations. |
| (b) | Total return does not consider the effect of sales loads. Total return is calculated assuming a purchase of shares on the first day and a sale on the last day of each period reported and includes reinvestment of dividends and distributions. Total returns for periods less than one full year are not annualized. |
See Notes to Financial Statements
| Prudential World Fund, Inc./Dryden International Equity Fund | | 25 |
Financial Highlights
Cont’d
| |
| | | Class C
| |
| | |
| | | Year Ended October 31,
| | | March 1,
2000(a)
Through
October 31,
2000 | |
| | | 2003 | | | 2002 | | | 2001 | | |
|
Per Share Operating Performance: | | | | | | | | | | | | | | | | |
Net Asset Value, Beginning Of Period | | $ | 3.66 | | | $ | 4.32 | | | $ | 7.87 | | | $ | 10.00 | |
| | |
|
|
| |
|
|
| |
|
|
| |
|
|
|
Loss From Investment Operations: | | | | | | | | | | | | | | | | |
Net investment loss | | | (.05 | ) | | | (.08 | ) | | | (.12 | ) | | | (.05 | ) |
Net realized and unrealized gain (loss) on investment and foreign currency transactions | | | 1.10 | | | | (.58 | ) | | | (3.43 | ) | | | (2.08 | ) |
| | |
|
|
| |
|
|
| |
|
|
| |
|
|
|
Total from investment operations | | | 1.05 | | | | (.66 | ) | | | (3.55 | ) | | | (2.13 | ) |
| | |
|
|
| |
|
|
| |
|
|
| |
|
|
|
Net asset value, end of period | | $ | 4.71 | | | $ | 3.66 | | | $ | 4.32 | | | $ | 7.87 | |
| | |
|
|
| |
|
|
| |
|
|
| |
|
|
|
Total Return(b): | | | 28.34 | % | | | (15.05 | )% | | | (45.04 | )% | | | (21.40 | )% |
Ratios/Supplemental Data: | | | | | | | | | | | | | | | | |
Net assets, end of period (000) | | $ | 14,006 | | | $ | 13,906 | | | $ | 24,004 | | | $ | 64,362 | |
Average net assets (000) | | $ | 12,640 | | | $ | 19,770 | | | $ | 41,057 | | | $ | 79,138 | |
Ratios to average net assets: | | | | | | | | | | | | | | | | |
Expenses, including distribution and service (12b-1) fees | | | 2.88 | % | | | 2.63 | % | | | 2.48 | % | | | 2.31 | %(c) |
Expenses, excluding distribution and service (12b-1) fees | | | 1.88 | % | | | 1.63 | % | | | 1.48 | % | | | 1.31 | %(c) |
Net investment loss | | | (1.14 | )% | | | (1.33 | )% | | | (1.61 | )% | | | (.74 | )%(c) |
| (a) | Commencement of investment operations. |
| (b) | Total return does not consider the effect of sales loads. Total return is calculated assuming a purchase of shares on the first day and a sale on the last day of each period reported and includes reinvestment of dividends and distributions. Total returns for periods less than one full year are not annualized. |
See Notes to Financial Statements
| 26 | | Visit our website at www.jennisondryden.com |
| |
| | | Class Z
| |
| | |
| | | Year Ended October 31,
| | | March 1,
2000(a)
Through
October 31, 2000 | |
| | | 2003 | | | 2002 | | | 2001 | | |
|
Per Share Operating Performance: | | | | | | | | | | | | | | | | |
Net Asset Value, Beginning Of Period | | $ | 3.76 | | | $ | 4.39 | | | $ | 7.92 | | | $ | 10.00 | |
| | |
|
|
| |
|
|
| |
|
|
| |
|
|
|
Income (Loss) From Investment Operations: | | | | | | | | | | | | | | | | |
Net investment income (loss) | | | (.01 | ) | | | (.02 | ) | | | (.06 | ) | | | .01 | |
Net realized and unrealized gain (loss) on investment and foreign currency transactions | | | 1.13 | | | | (.61 | ) | | | (3.47 | ) | | | (2.09 | ) |
| | |
|
|
| |
|
|
| |
|
|
| |
|
|
|
Total from investment operations | | | 1.12 | | | | (.63 | ) | | | (3.53 | ) | | | (2.08 | ) |
| | |
|
|
| |
|
|
| |
|
|
| |
|
|
|
Net asset value, end of period | | $ | 4.88 | | | $ | 3.76 | | | $ | 4.39 | | | $ | 7.92 | |
| | |
|
|
| |
|
|
| |
|
|
| |
|
|
|
Total Return(b): | | | 29.79 | % | | | (14.35 | )% | | | (44.50 | )% | | | (20.90 | )% |
Ratios/Supplemental Data: | | | | | | | | | | | | | | | | |
Net assets, end of period (000) | | $ | 3,699 | | | $ | 6,049 | | | $ | 6,065 | | | $ | 19,703 | |
Average net assets (000) | | $ | 3,533 | | | $ | 7,665 | | | $ | 13,805 | | | $ | 22,320 | |
Ratios to average net assets: | | | | | | | | | | | | | | | | |
Expenses, including distribution and service (12b-1) fees | | | 1.88 | % | | | 1.63 | % | | | 1.48 | % | | | 1.31 | %(c) |
Expenses, excluding distribution and service (12b-1) fees | | | 1.88 | % | | | 1.63 | % | | | 1.48 | % | | | 1.31 | %(c) |
Net investment income (loss) | | | (.31 | )% | | | (.22 | )% | | | (.59 | )% | | | .23 | %(c) |
| (a) | Commencement of investment operations. |
| (b) | Total return does not consider the effects of sales loads. Total return is calculated assuming a purchase of shares on the first day and a sale on the last day of each period reported and includes reinvestment of dividends and distributions. Total returns for periods less than one full year are not annualized. |
See Notes to Financial Statements
| Prudential World Fund, Inc./Dryden International Equity Fund | | 27 |
Report of Independent Auditors
To the Board of Directors and Shareholders of
Prudential World Fund, Inc.—Dryden International Equity Fund
In our opinion, the accompanying statement of assets and liabilities, including the portfolio of investments, and the related statements of operations and of changes in net assets and the financial highlights present fairly, in all material respects, the financial position of Prudential World Fund, Inc.—Dryden International Equity Fund, formerly Prudential Jennison International Growth Fund, (the “Fund”, one of the portfolios constituting Prudential World Fund, Inc.) at October 31, 2003, the results of its operations for the year then ended, the changes in its net assets for each of the two years in the period then ended and the financial highlights for each of the periods presented, in conformity with accounting principles generally accepted in the United States of America. These financial statements and financial highlights (hereafter referred to as “financial statements”) are the responsibility of the Fund’s management; our responsibility is to express an opinion on these financial statements based on our audits. We conducted our audits of these financial statements in accordance with auditing standards generally accepted in the United States of America, which require that we plan and perform the audit to obtain reasonable assurance about whether the financial statements are free of material misstatement. An audit includes examining, on a test basis, evidence supporting the amounts and disclosures in the financial statements, assessing the accounting principles used and significant estimates made by management, and evaluating the overall financial statement presentation. We believe that our audits, which included confirmation of securities at October 31, 2003 by correspondence with the custodian, provide a reasonable basis for our opinion.
PricewaterhouseCoopers LLP
New York, New York
December 22, 2003
| 28 | | Visit our website at www.jennisondryden.com |
Supplemental Proxy Information
(Unaudited)
A meeting of the Fund’s shareholders was held on September 12, 2003. The meeting was held for the following purposes:
| 1. | To approve the election of ten (10) directors to the Board of Directors, as follows: |
| | • | | Douglas H. McCorkindale |
The result of the proxy solicitation of The Funds on the preceding matter was:
| | | Director
| | Votes For
| | Votes
Against
| | Votes
Withheld
| | Abstentions
|
| | | David E.A. Carson | | 13,939,488 | | — | | 598,278 | | — |
| | | Robert F. Gunia | | 13,941,721 | | — | | 596,045 | | — |
| | | Robert E. La Blanc | | 13,928,524 | | — | | 609,242 | | — |
| | | Douglas H. McCorkindale | | 13,938,871 | | — | | 598,895 | | — |
| | | Stephen P. Munn | | 13,942,201 | | — | | 595,565 | | — |
| | | Richard A. Redeker | | 13,933,548 | | — | | 609,218 | | — |
| | | Judy A. Rice | | 13,942,037 | | — | | 595,729 | | — |
| | | Robin B. Smith | | 13,940,438 | | — | | 597,528 | | — |
| | | Stephen Stoneburn | | 13,941,179 | | — | | 596,587 | | — |
| | | Clay T. Whitehead | | 13,939,712 | | — | | 598,054 | | — |
| 2. | To approve amendments to the Fund’s Articles of Incorporation. |
The result of the proxy solicitation of The Funds on the preceding matter was:
| | | Matter
| | Votes For
| | Votes
Against
| | Abstentions
|
| | | Amendments to the Fund’s
Articles of Incorporation | | 7,010,716 | | 553,814 | | 339,408 |
| Prudential World Fund, Inc./Dryden International Equity Fund | | 29 |
Management of the Fund
(Unaudited)
Information pertaining to the Directors of the Fund is set forth below. Directors who are not deemed to be “interested persons” of the Fund, as defined in the 1940 Act are referred to as “Independent Directors.” Directors who are deemed to be “interested persons” of the Fund are referred to as “Interested Directors.” “Fund Complex”† consists of the Fund and any other investment companies managed by PI.
Independent Directors
David E.A. Carson (69), Director since 20033 Oversees 99 portfolios in Fund complex
Principal occupations (last 5 years): Director (January 2000 to May 2000), Chairman (January 1999 to December 1999), Chairman and Chief Executive Officer (January 1998 to December 1998) and President, Chairman and Chief Executive Officer of People’s Bank (1983-1997).
Other Directorships held:4 Director of United Illuminating and UIL Holdings (utility company), since 1993.
Robert E. La Blanc (69), Director since 19843 Oversees 119 portfolios in Fund complex
Principal occupations (last 5 years): President (since 1981) of Robert E. La Blanc Associates, Inc.
(telecommunications); formerly General Partner at Salomon Brothers and Vice-Chairman of Continental Telecom; Trustee of Manhattan College.
Other Directorships held:4 Director of Storage Technology Corporation (since 1979) (technology), Chartered
Semiconductor Manufacturing, Ltd. (since 1998); Titan Corporation (electronics) (since 1995), Computer Associates International, Inc. (since 2002) (software company); FiberNet Telecom Group, Inc. (since 2003) (telecom company); Director (since April 1999) of the High Yield Plus Fund, Inc.
Douglas H. McCorkindale (64), Director since 20033 Oversees 101 portfolios in Fund complex
Principal occupations (last 5 years): Chairman (since February 2001), Chief Executive Officer (since June 2000) and President (since September 1997) of Gannett Co. Inc. (publishing and media); formerly Vice Chairman (March 1984-May 2000) of Gannett Co., Inc.
Other Directorships held:4 Director of Gannett Co. Inc., Director of Continental Airlines, Inc. (since May 1993); Director of Lockheed Martin Corp. (aerospace and defense) (since May 2001); Director of The High Yield Plus Fund, Inc. (since 1996).
Richard A. Redeker (60), Director since 20033 Oversees 102 portfolios in Fund complex
Principal occupations (last 5 years): Management Consultant; formerly employee of Prudential Investments (October 1996-December 1998); Director of Invesmart, Inc. (since 2001) and Director of Penn Tank Lines, Inc. (since 1999).
Other Directorships held:4 None.
Robin B. Smith (64), Director since 19963 Oversees 109 portfolios in Fund complex
Principal occupations (last 5 years): Chairman of the Board (since January 2003) of Publishers Clearing House (direct marketing), formerly Chairman and Chief Executive Officer (August 1996-January 2003) of Publishers Clearing House.
Other Directorships held:4 Director of BellSouth Corporation (since 1992).
| 30 | | Visit our website at www.jennisondryden.com |
Stephen Stoneburn (60), Director since 19963 Oversees 107 portfolios in Fund complex
Principal occupations (last 5 years): President and Chief Executive Officer (since June 1996) of Quadrant Media Corp. (a publishing company); formerly President (June 1995-June 1996) of Argus Integrated Media, Inc.; Senior Vice President and Managing Director (January 1993-1995) of Cowles Business Media and Senior Vice President of Fairchild Publications, Inc. (1975-1989).
Other Directorships held:4 None
Clay T. Whitehead (65), Director since 19843 Oversees 106 portfolios in Fund complex
Principal occupations (last 5 years): President (since 1983) of National Exchange Inc. (new business development firm).
Other Directorships held:4 Director (since 2000) of the High Yield Plus Fund, Inc.
Interested Directors1
Judy A. Rice (55), President since 2003 and Director since 20003 Oversees 109 portfolios in Fund complex
Principal occupations (last 5 years): President, Chief Executive Officer, Chief Operating Officer and
Officer-in-Charge (since 2003) of PI; Director, Officer-in-Charge, President, Chief Executive Officer and Chief Operating Officer (since May 2003) of American Skandia Advisory Services, Inc. and American Skandia Investment Services, Inc.; Director, Officer-in-Charge, President, Chief Executive Officer (since May 2003) of American Skandia Fund Services, Inc.; Vice President (since February 1999) of Prudential Investment Management Services LLC; President, Chief Executive Officer and Officer-in-Charge (since April 2003) of Prudential Mutual Fund Services LLC; formerly various positions to Senior Vice President (1992-1999) of Prudential Securities Incorporated (Prudential Securities) and various positions to Managing Director (1975-1992) of Salomon Smith Barney; Member of Board of Governors of the Money Management Institute.
Other Directorships held:4 None
Robert F. Gunia (57), Vice President and Director since 19963 Oversees 189 portfolios in Fund complex
Principal occupations (last 5 years): Chief Administrative Officer (since June 1999) of PI; Executive Vice President and Treasurer (since January 1996) of PI; President (since April 1999) of Prudential Investment Management Services LLC (PIMS); Corporate Vice President (since September 1997) of The Prudential Insurance Company of America (Prudential); Director, Executive Vice President and Chief Administrative Officer (since May 2003) of American Skandia Investment Services, Inc., American Skandia Advisory Services, Inc. and American Skandia Fund Services, Inc.; President (since April 1999) of Prudential Investment Management Services LLC; Executive Vice President (since March 1999) and Treasurer (since May 2000) of Prudential Mutual Fund Services LLC; formerly Senior Vice President (March 1987-May 1999) of Prudential Securities.
Other Directorships held:4 Vice President and Director (since May 1989) and Treasurer (since 1999) of The Asia Pacific Fund, Inc.
| Prudential World Fund, Inc./Dryden International Equity Fund | | 31 |
Information pertaining to the Officers of the Fund is set forth below.
Officers2
Marguerite E.H. Morrison (47), Chief Legal Officer since 2003 and Assistant Secretary since 20023
Principal occupations (last 5 years): Vice President and Chief Legal Officer—Mutual Funds and Unit Investment Trust (since August 2000) of Prudential; Senior Vice President and Secretary (since April 2003) of PI; Senior Vice President and Secretary (since May 2003) of American Skandia Investment Services, Inc., American Skandia Advisory Services, Inc. and American Skandia Fund Services, Inc.; Vice President and Assistant Secretary of PIMS (since October 2001), previously Senior Vice President and Assistant Secretary (February 2001-April 2003) of PI, Vice President and Associate General Counsel (December 1996-February 2001) of PI.
Jonathan D. Shain (45), Secretary since 2001
Principal occupations (last 5 years): Vice President and Corporate Counsel (since August 1998) of Prudential; Vice President and Assistant Secretary (since May 2003) of American Skandia Investment Services, Inc. and American Skandia Fund Services, Inc.; formerly Attorney with Fleet Bank, N.A. (January 1997-July 1998).
Maryanne Ryan (39), Anti-Money Laundering Compliance Officer since 20023
Principal occupations (last 5 years): Vice President, Prudential (since November 1998), First Vice President, Prudential Securities (March 1997-May 1998); Anti-Money Laundering Compliance Officer (since 2003) of American Skandia Investment Services, Inc., American Skandia Advisory Services, Inc. and American Skandia Marketing, Inc.
Grace C. Torres (44), Treasurer and Principal Financial and Accounting Officer since 19953
Principal occupations (last 5 years): Senior Vice President (since January 2000) of PI, Senior Vice President and Assistant Treasurer (since May 2003) of American Skandia Investment Services, Inc. and American Skandia Advisory Services, Inc.; formerly First Vice President (December 1996-January 2000) of PI and First Vice President (March 1993-1999) of Prudential Securities.
| 1 | “Interested” Director, as defined in the 1940 Act, by reason of employment with the Manager, (Prudential Investments LLC or PI), the Subadvisers (Prudential Investment Management, Inc. or PIM), (Bank of Ireland Asset Management (U.S.) Limited or BIAM) or (Jennison Associates LLC or Jennison) or the Distributor (Prudential Investment Management Services LLC or PIMS). |
| 2 | Unless otherwise noted, the address of the Directors and Officers is c/o: Prudential Investments LLC, Gateway Center Three, 100 Mulberry Street, Newark, NJ 07102. |
| 3 | There is no set term of office for Directors and Officers. The Independent Trustees have adopted a retirement policy, which calls for the retirement of Directors on December 31 of the year in which they reach the age of 75. The table shows the individuals length of service as Director and/or Officer. |
| 4 | This column includes only directorships of companies requested to register, or file reports with the SEC under the Securities and Exchange Act of 1934 (that is, “public companies”) or other investment companies registered under the 1940 Act. |
| † | The Fund Complex consists of all investment companies managed by PI. The Funds for which PI serves as manager include JennisonDryden Mutual Funds, Strategic Partners Funds, American Skandia Advisor Funds, Inc., The Prudential Variable Contract Accounts 2, 10, 11, The Target Portfolio Trust, The Prudential Series Fund, Inc., American Skandia Trust, and Prudential’s Gibraltar Fund. |
Additional information about the Fund’s Directors is included in the Fund’s Statement of Additional Information which is available without charge, upon request, by calling (800) 521-7466 or (732) 482-7555 (Calling from outside the U.S.)
| 32 | | Visit our website at www.jennisondryden.com |
Growth of a $10,000 Investment
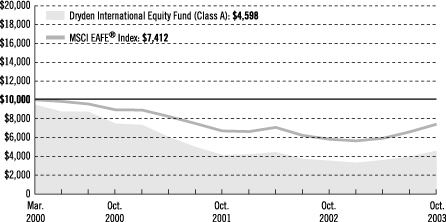
|
| Average Annual Total Returns (With Sales Charges) as of 10/31/03 | |
| | | One Year | | | Three Years | | | Since Inception | |
Class A | | 22.94 | % | | –16.51 | % | | –19.09 | % |
|
Class B | | 23.34 | | | –16.54 | | | –19.00 | |
|
Class C | | 26.06 | | | –15.97 | | | –18.78 | |
|
Class Z | | 29.79 | | | –14.87 | | | –17.76 | |
|
| | | | | | | | | | |
|
| Average Annual Total Returns (Without Sales Charges) as of 10/31/03 | |
| | | One Year | | | Three Years | | | Since Inception | |
Class A | | 29.41 | % | | –15.07 | % | | –17.95 | % |
|
Class B | | 28.34 | | | –15.69 | | | –18.55 | |
|
Class C | | 28.34 | | | –15.69 | | | –18.55 | |
|
Class Z | | 29.79 | | | –14.87 | | | –17.76 | |
|
The data in the table above represents the Fund’s performance under Jennison’s management. Past performance is not indicative of future results. Principal value and investment return will fluctuate so that an investor’s shares, when redeemed, may be worth more or less than their original cost. Source: Prudential Investments LLC and Lipper Inc. Inception date: 3/1/2000.
The graph compares a $10,000 investment in the Dryden International Equity Fund (Class A shares) with a similar investment in the MSCI EAFE® Index by portraying the initial account values at the commencement of operations of Class A shares (March 1, 2000) and the account values at the end of the current fiscal year (October 31, 2003) as measured on a quarterly basis. For purposes of the graph, and unless otherwise indicated, it has been assumed that (a) the maximum applicable front-end sales charge was deducted from the initial $10,000 investment in Class A shares; (b) all recurring fees (including management fees) were deducted; and (c) all dividends and distributions were reinvested. The line graph provides information for Class A shares only. As indicated in the tables provided earlier, performance for Class B, C, and Z shares will vary due to the
| | | Visit our website at www.jennisondryden.com |
differing charges and expenses applicable to each share class (as indicated in the following paragraphs). Without a distribution and service (12b-1) fee waiver of 0.05% for Class A shares through October 31, 2003, the returns shown in the graph and for Class A shares in the tables would have been lower.
The MSCI EAFE® Index is an unmanaged, weighted index of performance that reflects stock price movements of developed-country markets in Europe, Australasia, and the Far East. MSCI EAFE® Index’s total returns include the reinvestment of all dividends, but do not include the effects of sales charges, operating expenses of a mutual fund, or taxes. These returns would be lower if they included the effects of sales charges, operating expenses, or taxes. The securities that comprise the MSCI EAFE® Index may differ substantially from the securities in the Fund. The MSCI EAFE® Index is not the only index that may be used to characterize performance of global/international stock funds. Other indexes may portray different comparative performance. Investors cannot invest directly in an index.
The Fund charges a maximum front-end sales charge of 5% for Class A shares in most circumstances, and a 12b-1 fee of up to 0.30% annually. In some circumstances, Class A shares may not be subject to a front-end sales charge, but may be subject to a 1% contingent deferred sales charge (CDSC) for the first year. Class B shares are subject to a declining CDSC of 5%, 4%, 3%, 2%, 1%, and 1% respectively for the first six years after purchase and a 12b-1 fee of 1% annually. Approximately seven years after purchase, Class B shares will automatically convert to Class A shares on a quarterly basis. Class C shares are subject to a front-end sales charge of 1%, a CDSC of 1% for shares redeemed within 18 months of purchase, and a 12b-1 fee of 1% annually. The returns in the graph and the tables do not reflect the deduction of taxes that a shareholder would pay on Fund distributions or following the redemption of Fund shares.
| Prudential World Fund, Inc./Dryden International Equity Fund | | |
| | |
| n MAIL | | n TELEPHONE | | n WEBSITE |
Gateway Center Three 100 Mulberry Street Newark, NJ 07102 | | (800) 225-1852 | | www.jennisondryden.com |
| DIRECTORS |
| David E.A. Carson•Robert F. Gunia•Robert E. La Blanc•Douglas H. McCorkindale•Richard A. Redeker • Judy A. Rice•Robin B. Smith•Stephen D. Stoneburn•Clay T. Whitehead |
| |
| OFFICERS |
Judy A. Rice, President•Robert F. Gunia, Vice President•Grace C. Torres, Treasurer and Principal
Financial and Accounting Officer•Marguerite E.H. Morrison, Chief Legal Officer and Assistant Secretary• Jonathan D. Shain, Secretary•Maryanne Ryan, Anti-Money Laundering Compliance Officer |
| MANAGER | | Prudential Investments LLC | | Gateway Center Three
100 Mulberry Street
Newark, NJ 07102 |
|
| INVESTMENT ADVISOR | | Prudential Investment
Management, Inc. | | Gateway Center Two
100 Mulberry Street
Newark, NJ 07102 |
|
| DISTRIBUTOR | | Prudential Investment
Management Services LLC | | Gateway Center Three
14th Floor 100 Mulberry Street
Newark, NJ 07102 |
|
| CUSTODIAN | | State Street Bank
and Trust Company | | One Heritage Drive
North Quincy, MA 02171 |
|
| TRANSFER AGENT | | Prudential Mutual Fund
Services LLC | | PO Box 8098
Philadelphia, PA 19101 |
|
| INDEPENDENT AUDITORS | | PricewaterhouseCoopers LLP | | 1177 Avenue of the
Americas
New York, NY 10036 |
|
| FUND COUNSEL | | Sullivan & Cromwell LLP | | 125 Broad Street
New York, NY 10004 |
| | |
| Dryden International Equity Fund | | | | |
| Share Class | | | | A | | B | | C | | Z | | |
| | | | | | |
Nasdaq | | | | PJRAX | | PJRBX | | PJRCX | | PJIZX | | |
CUSIP | | | | 743969859 | | 743969867 | | 743969875 | | 743969883 | | |
| | | | | | | | | | | | | |
Mutual Funds:
| ARE NOT INSURED BY THE FDIC OR ANY FEDERAL GOVERNMENT AGENCY | | MAY LOSE VALUE | | ARE NOT A DEPOSIT OF OR GUARANTEED BY ANY BANK OR ANY BANK AFFILIATE |
| | | |
| Dryden International Equity Fund | | | | | | |
| | | Share Class | | A | | B | | C | | Z | | |
| | | | | | |
| | | Nasdaq | | PJRAX | | PJRBX | | PJRCX | | PJIZX | | |
| | | CUSIP | | 743969859 | | 743969867 | | 743969875 | | 743969883 | | |
| | | | | | | | | | | | | |
MF190E IFS-AO86509
ANNUAL REPORT
OCTOBER 31, 2003

STRATEGIC PARTNERS
INTERNATIONAL VALUE FUND
FUND TYPE
International stock
OBJECTIVE
Long-term growth of capital
This report is not authorized for distribution to prospective investors unless preceded or accompanied by a current prospectus.
The views expressed in this report and information about the Fund’s Portfolio holdings are for the period covered by this report and are subject to change therafter.
Dear Shareholder,
December 16, 2003
As you may know, the mutual fund industry recently has been the subject of much media attention. There has been press coverage of Prudential, and recently, administrative complaints were filed against Prudential Securities* and some of its former brokers and branch managers in Massachusetts. As president of your Fund, I’d like to provide you with an update on the issues as they pertain to Strategic Partners mutual funds.
State and federal authorities have requested information regarding trading practices from many mutual fund companies across the nation. Our fund family has been cooperating with inquiries it has received, and at the same time, Prudential Financial, Inc. has been conducting its own internal review. This review encompasses the policies, systems, and procedures of our fund family, Prudential Financial’s investment units and its proprietary distribution channels, including the former Prudential Securities. The review also includes mutual fund trading activity by investment professionals who manage our funds.
Market timing
Prudential Investments LLC, the Fund’s investment manager, has actively discouraged disruptive market timing, and for years, our mutual fund prospectuses have identified and addressed this issue. Prudential Investments has established operating policies and procedures that are designed to detect and deter frequent trading activities that would be disruptive to the management of our mutual fund portfolios, and has rejected numerous orders placed by market timers in the past.
* Prudential Investments LLC, the manager of Strategic Partners mutual funds, and Prudential Investment Management Services LLC, the distributor of the funds, are part of the Investment Management segment of Prudential Financial, Inc. and are separate legal entities from the entity formerly known as Prudential Securities Incorporated, a retail brokerage firm. In February 2003, Prudential Financial and Wachovia Corporation announced they were combining their retail brokerage forces. The transaction was completed in July 2003. Wachovia Corporation has a 62% interest in the new firm, which is now known as Wachovia Securities LLC, and Prudential Financial owns the remaining 38%.
Late trading
The Securities and Exchange Commission requires that orders to purchase or redeem mutual fund shares be received either by the fund or by an intermediary (such as a broker, financial adviser, or 401(k) record keeper) before the time at which the fund calculates its net asset value (normally 4:00 p.m., Eastern time) if they are to receive that day’s price. The policies of our mutual funds do not make and have not made allowances for the practice known as “late trading”.
For more than 40 years we have offered investors quality investment products, financial guidance, and responsive customer service. Today we remain committed to this heritage and to the highest ethical principles in our investment practices.
Sincerely,

Judy A. Rice, President
Prudential World Fund, Inc./Strategic Partners International Value Fund
| Prudential World Fund, Inc./Strategic Partners International Value Fund | | 1 |
Your Fund’s Performance
Fund Objective
The investment objective of the Strategic Partners International Value Fund (the Fund) is long-term growth of capital. There can be no assurance that the Fund will achieve its investment objective.
| | | | |
| Cumulative Total Returns1 as of 10/31/03 | | | | | | | | | | | |
| | | One Year | | | Five Years | | | Ten Years | | | Since Inception2 |
Class A | | 14.44 | % | | 1.82 | % | | N/A | | | 19.69% |
|
Class B | | 13.64 | | | –2.01 | | | N/A | | | 13.35 |
|
Class C | | 13.62 | | | –1.90 | | | N/A | | | 13.48 |
|
Class Z | | 14.76 | | | 3.07 | | | 64.57 | % | | 113.37 |
|
MSCI EAFE® Index3 | | 27.03 | | | –1.12 | | | 37.45 | | | *** |
|
Lipper International Funds Avg.4 | | 24.51 | | | 6.75 | | | 55.54 | | | **** |
|
| | | | | | | | | | | | |
| | | |
| Average Annual Total Returns1 as of 9/30/03 | | | | | | | | | |
| | | One Year | | | Five Years | | | Ten Years | | | Since Inception2 |
Class A | | 11.12 | % | | –0.22 | % | | N/A | | | 1.17% |
|
Class B | | 11.07 | | | –0.14 | | | N/A | | | 1.14 |
|
Class C | | 13.89 | | | –0.14 | | | N/A | | | 1.01 |
|
Class Z | | 17.20 | | | 1.06 | | | 5.11 | % | | 6.74 |
|
MSCI EAFE® Index3 | | 26.01 | | | 0.55 | | | 2.92 | | | *** |
|
Lipper International Funds Avg.4 | | 22.94 | | | 1.21 | | | 4.04 | | | **** |
|
Past performance is not indicative of future results. Principal value and investment return will fluctuate so that an investor’s shares, when redeemed, may be worth more or less than their original cost. 1Source: Prudential Investments LLC and Lipper Inc. The cumulative total returns do not take into account applicable sales charges. The average annual total returns do take into account applicable sales charges. Without the contractual distribution and service (12b-1) fee waiver of 0.05% for Class A shares annually, the returns would have been lower. The Fund charges a maximum front-end sales charge of 5% for Class A shares in most circumstances, and a 12b-1 fee of up to 0.30% annually in most circumstances. In some circumstances, Class A shares may not be subject to a front-end sales charge, but may be subject to a 1% contingent deferred sales charge (CDSC) for the first year. Class B shares are subject to a declining CDSC of 5%, 4%, 3%, 2%, 1%, and 1% for the first six years respectively after purchase, and a 12b-1 fee of 1% annually. Approximately seven years after purchase, Class B shares will automatically convert to Class A shares on a quarterly basis. Class C shares are subject to a front-end sales charge of 1%, a CDSC of 1% for shares redeemed within 18 months of purchase, and a 12b-1 fee of 1% annually. Class Z shares are not subject to a sales charge or 12b-1 fee. The returns in the tables above do not reflect the deduction of taxes that a shareholder would pay on fund distributions or following the redemption of fund shares. 2Inception dates: Class A, B, and C, 9/23/96; Class Z, 11/5/92. 3The Morgan Stanley Capital International (MSCI) EAFE® Index is an unmanaged, weighted index of performance that reflects stock price movements of developed-country markets in Europe, Australasia, and the Far East. 4The Lipper International Funds Average (Lipper Average) represents returns based on an average return of all funds in the Lipper International Funds category. Funds in the Lipper International Funds category invest their assets in securities with primary trading markets outside the United States. Investors cannot invest directly in an index. The returns for the MSCI EAFE® Index and the Lipper Average would be lower if they included the effects of sales charges,
| 2 | | Visit our website at www.strategicpartners.com |
operating expenses of a mutual fund, or taxes. Returns for the Lipper Average reflect the deduction of operating expenses of a mutual fund, but not sales charges or taxes. ***MSCI EAFE® Index Since Inception cumulative total returns as of 10/31/03 are 12.28% for Class A, B, and C, and 88.94% for Class Z. MSCI EAFE® Index Since Inception average annual total returns as of 9/30/03 are 0.79% for Class A, B, and C, and 5.42% for Class Z. **** Lipper Average Since Inception cumulative total returns as of 10/31/03 are 23.21% for Class A, B, and C, and 110.95% for Class Z. Lipper Average Since Inception average annual total returns as of 9/30/03 are 1.80% for Class A, B, and C, and 6.19% for Class Z.
| |
| Five Largest Holdings expressed as a percentage of net assets as of 10/31/03 | | | |
Nestlé SA, Food Products & Services | | 3.5 | % |
|
Canon, Inc., Electronics | | 3.5 | |
|
Total SA, Oil & Gas Services | | 3.4 | |
|
UBS AG, Banks | | 3.1 | |
|
Samsung Electronic Co., Ltd., Electronics | | 2.8 | |
|
Holdings are subject to change.
| |
| Five Largest Industries expressed as a percentage of net assets as of 10/31/03 | | | |
Banks | | 18.0 | % |
|
Electronics | | 11.7 | |
|
Telecommunications | | 11.3 | |
|
Drugs & Healthcare | | 10.0 | |
|
Food Products & Services | | 8.2 | |
|
| Industry | weightings are subject to change. |
| Prudential World Fund, Inc./Strategic Partners International Value Fund | | 3 |
Investment Adviser’s Report
Small-company and speculative stocks led a market rebound
Signs of economic recovery in the United States, strong growth in China, and some improvement in the economies of Japan and Europe led to a market rise that extended to all economic sectors. The 14.44% return on the Fund’s Class A shares over the 12 months ended October 31, 2003 represented a sharp upward bounce from the prior year and a good return by historical standards. In comparison, the stocks in the MSCI EAFE Index, representing the broad non-United States developed-country equity market, rose an average of less than 9% a year over the preceding 20 years. Nonetheless, the Class A shares of the Fund trailed the MSCI EAFE Index for this reporting period.
It is not unusual for shares of small companies to lead in a market rebound. The earnings of smaller firms are often more sensitive to disruption than those of large companies, which are more likely to have many customers and product lines. As a result, small-cap stocks typically perform poorly in a downturn and rebound when investors become more optimistic. In this reporting period, the small-cap advantage was exacerbated by a surprising level of investor speculation. Demand for shares of companies with no profits at all often exceeded the interest in firms with less volatile earnings. The Fund’s investment discipline focuses on large companies that have relatively established earnings trends and that also have low share prices as compared with the firms’ earnings prospects. On average over this reporting period, more than 80% of the Fund’s assets were invested in companies with market capitalizations of $15 billion or more, compared with about 58% for the MSCI EAFE Index. Returns for these less volatile large-cap stocks were considerably less than for the more speculative end of the market.
Another factor contributing to the Fund’s underperformance was the decline of the U.S. dollar over this reporting period. Given our portfolio’s emphasis on multinational companies, our larger holdings tend to have significant U.S. dollar exposure. The dramatic fall in the U.S. currency over the past year had a significant negative impact on the share prices of such companies. However, we feel that in many instances this negative effect was a short-term overreaction.
Performance of our financials was mixed
The Fund’s large commitment to the financial sector had detracted from its return in prior periods when falling equity markets reduced the value of banks’ and insurers’ investment portfolios. We continued to hold positions in companies that we expected to rebound when the overall equity markets recovered. We were rewarded with substantial advances by insurance companies in the portfolio ING Groep NV (Netherlands) and AXA (France). Low interest rates allowed borrowers that were
| 4 | | Visit our website at www.strategicpartners.com |
under stress to refinance their debt, improving the credit quality of banks’ loan portfolios. Most of the Fund’s bank holdings—including UBS (Switzerland, see Comments on Largest Holdings), ABN AMRO Holdings (Netherlands), HSBC Holdings (United Kingdom), and Deutsche Bank (Germany)—had significant advances. The largest contributor to the Fund’s return during the period was Banco Santander Central Hispano (Spain), whose large domestic business had been a concern to investors, but whose shares rose when the concerns abated.
However, other factors offset these advantages for some insurers that the Fund held. Lloyds TSB Group (United Kingdom), Allianz (Germany), and Swiss Re (Switzerland) were the largest detractors. We sold the Fund’s position in Allianz after a rights issue diluted the equity of existing shareholders. Lloyds is divesting its noncore businesses to focus on its strong areas. Swiss Re’s balance sheet is among the most highly rated of its peers, so we think that investors’ concerns about its financial strength were excessive. We think that Lloyds and Swiss Re shares were still attractive at their period-end prices, and we maintain positions in these stocks.
Defensive stocks were left behind
Investors often classify much of the market into cyclical stocks—those of companies that are relatively sensitive to the pace of economic growth, such as firms dependent on capital spending, discretionary consumer spending, and basic materials—and “defensive” noncyclical stocks. Many investors prefer defensive stocks when they expect a slowing economy and a shift to cyclical stocks in anticipation of a recovery.
We were uncertain about the pace of economic growth, so the Fund was focused on defensive consumer and healthcare stocks. Many of these fared poorly when investors turned more aggressively to cyclical stocks. For example, Unilever (United Kingdom) has global brands of household products such as Dove soap, Hellman’s mayonnaise, and Slim Fast meal substitutes. Although its cost-cutting program met its targets, its sales fell short and its share price fell. Other detractors from the Fund’s return during the reporting period included Ahold (Netherlands, grocery chains) and Heineken NV (Netherlands, brewer). (We sold the position in Ahold by period-end.) Even the Fund’s gain on Tesco (United Kingdom), a supermarket chain that is successfully expanding in the United Kingdom and Ireland with neighborhood stores, was modest compared with the overall market.
Another defensive industry that fared poorly was pharmaceuticals. Industrywide concerns about new product pipelines and the threat of price regulation drove share prices down. The Fund’s positions in Aventis (France) and Japan’s largest drug manufacturer, Takeda Chemical Industries (whose troubles were magnified
| Prudential World Fund, Inc./Strategic Partners International Value Fund | | 5 |
by its significant dollar-denominated sales), detracted from its return. Toward the end of the Fund’s reporting period, the sector was buoyed by Congress’ likely passage of legislation that would boost spending on drugs and treatments for as many as 41 million people. We believe that the Fund’s holdings in the sector represented good value at period-end prices.
Asian technology stocks performed well
Aside from Nokia (Finland), the global leader in handsets for wireless telecommunications, the Fund’s technology exposure was all in Japan and South Korea. Canon (Japan, see Comments on Largest Holdings) made one of the largest contributions to the Fund’s return.
Telecommunication services rebounded
At long last, the “3G” wireless telecommunications technologies were introduced and companies can get a return on the sizeable investments required to make the new services possible. Moreover, now that the infrastructure is built, expenses for capital investments have declined. The cost-cutting campaigns that many firms implemented also are reducing expenses. Investors are beginning to anticipate rising profits in the sector. The Fund saw substantial gains during the reporting period on its telecommunication services positions, including Vodafone (United Kingdom), Telefonica (Spain), Nippon Telephone & Telegraph (Japan), and Telecom Italia (Italy).
Strategic Partners International Value Fund Management Team
The Portfolio of Investments following this report shows the size of the Fund’s positions at period-end.
| 6 | | Visit our website at www.strategicpartners.com |
Comments on Largest Holdings
Holdings expressed as a percentage of the Fund’s net assets as of 10/31/03.
| 3.5% | Nestlé SA (Switzerland)/Food Products & Services |
Nestlé is the world’s largest food company, with leading brand franchises in beverages, milk products, prepared dishes, water, chocolate, pet food, and pharmaceuticals. In keeping with its policy of sustaining its margins, it raised prices in several product categories to reflect cost increases. Nestlé’s profit has continued to improve in 2003 despite the negative impact of the declining dollar on its revenue.
| 3.5% | Canon, Inc. (Japan)/Electronics |
Canon is the world leader in copiers and laser printers and also makes fax machines, cameras, and other optical equipment. Its sales and earnings have grown, on average, more than 5% and 16% a year respectively over the past 10 years. Canon raised its sales forecast for 2003 by 1% and its operating profit target by 15% because of strong sales of color laser printers and digital cameras. Its balance sheet has net cash equivalent to 10% of its market capitalization.
| 3.4% | Total SA (formerly TotalFinaElf SA) (France)/Oil & Gas Services |
Total is a leading global oil company. We like it because of its above-average growth in profits from development and production activities and its productivity improvements from the merger between TotalFina and Elf. It is divesting noncore businesses and using the cash to buy back stock. Its shares sell at a lower multiple of earnings than those of the largest oil companies, and we expect that gap to narrow.
| 3.1% | UBS AG(Switzerland)/Banks |
UBS is one of the world’s leading providers of private banking services and one of the largest global asset managers. The company has been profitable every quarter since 1998. Management has focused on keeping costs down and stemming bad loans. For the third quarter of 2003, UBS reported the highest quarterly profits since 2000. We believe that the group is shareholder-focused and uses its capital effectively. Between dividend distributions and share buybacks, more than 80% of its net profits since 1999 has been returned to shareholders to enhance its earnings per share.
| 2.8% | Samsung Electronic Co., Ltd. (South Korea)/Electronics |
Samsung Electronics is Korea’s largest manufacturer, with leading global positions in memory chips, liquid crystal display (LCD) flat screens for computers, CDMA-technology mobile telephone handsets, and color monitors. In recent years, Samsung has established itself as a quality brand and has taken market share from industry rivals. It has been forecast to generate over $7 billion of operating cash flow in 2003. Its share price is still at an attractive multiple of estimated 2004 earnings.
Holdings are subject to change.
| Prudential World Fund, Inc./Strategic Partners International Value Fund | | 7 |
Portfolio of Investments
as of October 31, 2003
| Shares | | Description | | Value (Note 1) |
| | | | | | |
LONG-TERM INVESTMENTS 99.4% | | | |
| |
COMMON STOCKS 99.3% | | | |
| |
Australia 2.7% | | | |
|
| 240,862 | | James Hardie Industries N.V. | | $ | 1,225,379 |
| 146,549 | | National Australia Bank, Ltd. | | | 3,180,866 |
| 371,693 | | News Corp., Ltd. | | | 3,309,871 |
| 267,177 | | Westpac Banking Corp., Ltd. | | | 3,061,643 |
| | | | |
|
|
| | | | | | 10,777,759 |
| |
Canada 0.5% | | | |
|
| 44,332 | | Royal Bank of Canada | | | 2,135,120 |
| |
Finland 1.4% | | | |
|
| 328,626 | | Nokia AB Oyj | | | 5,581,425 |
| |
France 8.4% | | | |
|
| 176,199 | | Aventis SA | | | 9,330,068 |
| 231,640 | | AXA | | | 4,389,289 |
| 84,214 | | France Telecom SA | | | 2,038,253 |
| 51,244 | | Lafarge SA | | | 3,669,583 |
| 86,884 | | Total SA Series B | | | 13,504,055 |
| | | | |
|
|
| | | | | | 32,931,248 |
| |
Germany 6.2% | | | |
|
| 132,613 | | Bayer AG | | | 3,186,542 |
| 175,562 | | Bayerische Motoren Werke (BMW) AG | | | 7,030,929 |
| 77,622 | | Deutsche Bank AG | | | 5,119,967 |
| 179,147 | | E.ON AG | | | 9,055,075 |
| | | | |
|
|
| | | | | | 24,392,513 |
| |
Hong Kong 3.6% | | | |
|
| 512,000 | | Cheung Kong Holdings, Ltd. | | | 4,269,029 |
| 186,000 | | Hong Kong Electric Holdings, Ltd. | | | 725,730 |
| 1,226,000 | | Johnson Electric Holdings, Ltd. | | | 1,586,631 |
| 1,072,000 | | Li & Fung, Ltd. | | | 1,801,460 |
| 409,000 | | Sun Hung Kai Properties, Ltd. | | | 3,436,554 |
| 407,500 | | Swire Pacific, Ltd. (Class A) | | | 2,487,284 |
| | | | |
|
|
| | | | | | 14,306,688 |
| |
Ireland 0.7% | | | |
|
| 145,514 | | CRH PLC | | | 2,613,523 |
See Notes to Financial Statements.
| 8 | | Visit our website at www.strategicpartners.com |
| Shares | | Description | | Value (Note 1) |
| | | | | | |
Italy 3.7% | | | |
|
| 486,327 | | Eni SpA | | $ | 7,722,751 |
| 2,681,328 | | Telecom Italia SpA | | | 6,997,764 |
| | | | |
|
|
| | | | | | 14,720,515 |
| |
Japan 15.6% | | | |
|
| 36,440 | | Acom Co., Ltd. | | | 1,630,826 |
| 284,000 | | Canon, Inc. | | | 13,743,394 |
| 44,800 | | Fanuc, Ltd. | | | 2,693,665 |
| 91,000 | | Fuji Photo Film Co., Ltd. | | | 2,681,948 |
| 204,900 | | Honda Motor Co., Ltd. | | | 8,089,016 |
| 62,700 | | Hoya Corp. | | | 5,674,853 |
| 390 | | Mitsubishi Tokyo Financial Group, Inc. | | | 2,802,565 |
| 1,941 | | Nippon Telegraph and Telephone Corp. | | | 8,669,041 |
| 512 | | NTT DoCoMo, Inc. | | | 1,108,437 |
| 129,000 | | Ricoh Co., Ltd. | | | 2,446,582 |
| 25,200 | | Rohm Co., Ltd. | | | 3,397,135 |
| 116,800 | | Shin-Etsu Chemical Co., Ltd. | | | 4,345,404 |
| 42,000 | | Shionogi & Co., Ltd. | | | 704,871 |
| 94,200 | | Takeda Chemical Industries, Ltd. | | | 3,333,224 |
| | | | |
|
|
| | | | | | 61,320,961 |
| |
Netherlands 9.8% | | | |
|
| 412,041 | | ABN AMRO Holdings N.V. | | | 8,645,908 |
| 52,612 | | Heineken N.V. | | | 1,877,657 |
| 482,274 | | ING Groep N.V. | | | 10,013,094 |
| 306,069 | | Koninklijke (Royal) Philips Electronics N.V. | | | 8,251,123 |
| 211,656 | | Koninklijke Ahold N.V. | | | 1,791,245 |
| 307,440 | | Reed Elsevier PLC | | | 3,423,883 |
| 111,737 | | TPG N.V. | | | 2,409,539 |
| 65,501 | | VNU N.V. | | | 1,994,997 |
| | | | |
|
|
| | | | | | 38,407,446 |
| |
Singapore 0.6% | | | |
|
| 289,000 | | United Overseas Bank, Ltd. | | | 2,257,618 |
| |
South Korea 4.2% | | | |
|
| 18,440 | | Korea Electric Power Corp. | | | 356,024 |
| 57,630 | | KT Corp. | | | 2,293,513 |
| 25,115 | | POSCO (ADR) | | | 2,928,492 |
| 27,439 | | Samsung Electronics Co., Ltd. (GDR) | | | 10,896,772 |
| | | | |
|
|
| | | | | | 16,474,801 |
See Notes to Financial Statements.
| Prudential World Fund, Inc./Strategic Partners International Value Fund | | 9 |
Portfolio of Investments
as of October 31, 2003 Cont’d.
| Shares | | Description | | Value (Note 1) |
| | | | | | |
Spain 3.4% | | | |
|
| 1,503 | | Antena 3 Television SA(a) | | $ | 49,083 |
| 828,670 | | Banco Santander Central Hispano SA | | | 7,947,464 |
| 444,171 | | Telefonica SA | | | 5,524,932 |
| | | | |
|
|
| | | | | | 13,521,479 |
| |
Switzerland 12.2% | | | |
|
| 62,911 | | Nestle SA | | | 13,850,926 |
| 204,140 | | Novartis AG | | | 7,781,275 |
| 87,400 | | Roche Holdings AG | | | 7,232,336 |
| 110,843 | | Swiss Reinsurance | | | 6,976,713 |
| 199,440 | | UBS AG | | | 12,247,037 |
| | | | |
|
|
| | | | | | 48,088,287 |
| |
United Kingdom 26.3% | | | |
|
| 1,184,668 | | Barclays PLC | | | 9,991,295 |
| 297,459 | | British America Tobacco PLC | | | 3,596,505 |
| 601,615 | | BT Group PLC | | | 1,893,788 |
| 570,188 | | Cadbury Schweppes PLC | | | 3,655,033 |
| 713,148 | | Centrica PLC | | | 2,232,774 |
| 606,605 | | Compass Group PLC | | | 3,497,310 |
| 498,446 | | Diageo PLC | | | 5,861,652 |
| 375,721 | | GlaxoSmithKline PLC | | | 8,046,250 |
| 606,772 | | Hilton Group PLC | | | 1,997,542 |
| 457,839 | | HSBC Holdings PLC | | | 6,875,824 |
| 547,867 | | Kingfisher PLC | | | 2,626,409 |
| 963,709 | | Lloyds TSB Group PLC | | | 6,692,730 |
| 233,846 | | Marks & Spencer Group PLC | | | 1,141,863 |
| 475,422 | | Prudential PLC | | | 3,688,941 |
| 218,644 | | Reed International PLC | | | 1,699,307 |
| 1,048,621 | | Shell Transport & Trading Co. PLC | | | 6,548,398 |
| 368,194 | | Smith & Nephew PLC (ADR) | | | 2,925,656 |
| 127,625 | | Smiths Group PLC | | | 1,519,260 |
| 1,321,841 | | Tesco PLC | | | 5,299,315 |
| 910,328 | | Unilever PLC | | | 7,762,519 |
| 4,843,697 | | Vodafone Group PLC | | | 10,171,638 |
| 274,594 | | Wolseley PLC | | | 3,365,482 |
See Notes to Financial Statements.
| 10 | | Visit our website at www.strategicpartners.com |
| Shares | | Description | | Value (Note 1) |
| | | | | | |
| 243,389 | | WPP Group PLC | | $ | 2,319,100 |
| | | | |
|
|
| | | | | | 103,408,591 |
| | | | |
|
|
| | | Total common stocks (cost $394,115,833) | | | 390,937,974 |
| | | | |
|
|
Principal Amount (000) | | | | |
| |
CONVERTIBLE BOND 0.1% | | | |
|
| $15 | | AXA, Zero Coupon, 12/21/04(a)
(Cost $222,988) | | | 256,757 |
| | | Total long-term investments
(cost $394,338,821) | | | 391,194,731 |
| | | | |
|
|
SHORT-TERM INVESTMENT 0.5% | | | |
| |
Repurchase Agreement | | | |
|
| | | Joint Repurchase Agreement Account, 1.07%, 11/3/03 | | | |
| 1,961 | | (cost $1,961,000; Note 6) | | | 1,961,000 |
| | | | |
|
|
| | | Total Investments 99.9%
(cost $396,299,821; Note 5) | | | 393,155,731 |
| | | Other assets in excess of liabilities 0.1% | | | 343,075 |
| | | | |
|
|
| | | Net Assets 100% | | $ | 393,498,806 |
| | | | |
|
|
| (a) | Non-income producing security. |
ADR—American Depository Receipt.
GDR—Global Depository Receipt.
See Notes to Financial Statements.
| Prudential World Fund, Inc./Strategic Partners International Value Fund | | 11 |
Portfolio of Investments
as of October 31, 2003 Cont’d.
The industry classification of portfolio holdings and other assets in excess of liabilities shown as a percentage of net assets as of October 31, 2003 was as follows:
Banks | | 18.0 | % |
Electronics | | 11.7 | |
Telecommunications | | 11.3 | |
Drugs & Healthcare | | 10.0 | |
Food Products & Services | | 8.2 | |
Oil & Gas Services | | 7.1 | |
Insurance | | 3.8 | |
Automotive | | 3.8 | |
Financial Services | | 3.6 | |
Media | | 3.3 | |
Utilities | | 3.1 | |
Leisure | | 2.1 | |
Beverages | | 2.0 | |
Real Estate | | 2.0 | |
Building Products | | 1.9 | |
Chemicals | �� | 1.9 | |
Distribution/Wholesale | | 1.3 | |
Diversified Manufacturing | | 1.1 | |
Retail | | 1.0 | |
Tobacco | | 0.9 | |
Steel & Metals | | 0.7 | |
Transport Services | | 0.6 | |
Repurchase Agreement | | 0.5 | |
| | |
|
|
| | | 99.9 | |
Other assets in excess of liabilities | | 0.1 | |
| | |
|
|
| | | 100.0 | % |
| | |
|
|
See Notes to Financial Statements.
| 12 | | Visit our website at www.strategicpartners.com |
ANNUAL REPORT
OCTOBER 31, 2003
STRATEGIC PARTNERS
INTERNATIONAL VALUE FUND
STATEMENT OF ASSETS AND LIABILITIES
Statement of Assets and Liabilities
as of October 31, 2003
Assets | | | | |
|
Investments, at value (cost $396,299,821) | | $ | 393,155,731 | |
Foreign currency, at value (cost $230,944) | | | 230,895 | |
Cash | | | 7,072 | |
Receivable for investments sold | | | 1,647,859 | |
Receivable for Series shares sold | | | 889,690 | |
Dividends and interest receivable | | | 525,296 | |
Foreign tax reclaim receivable | | | 493,891 | |
Other assets | | | 5,940 | |
| | |
|
|
|
Total assets | | | 396,956,374 | |
| | |
|
|
|
| |
Liabilities | | | | |
|
Payable for investments purchased | | | 2,238,552 | |
Payable for Series shares reacquired | | | 529,230 | |
Management fee payable | | | 329,653 | |
Accrued expenses | | | 316,078 | |
Distribution fee payable | | | 44,055 | |
| | |
|
|
|
Total liabilities | | | 3,457,568 | |
| | |
|
|
|
Net Assets | | $ | 393,498,806 | |
| | |
|
|
|
Net assets were comprised of: | | | | |
Common stock, at par | | $ | 244,439 | |
Paid-in capital in excess of par | | | 470,095,066 | |
| | |
|
|
|
| | | | 470,339,505 | |
Undistributed net investment income | | | 3,698,787 | |
Accumulated net realized loss on investments | | | (77,444,535 | ) |
Net unrealized depreciation on investments and foreign currencies | | | (3,094,951 | ) |
| | |
|
|
|
Net assets, October 31, 2003 | | $ | 393,498,806 | |
| | |
|
|
|
See Notes to Financial Statements.
| 14 | | Visit our website at www.strategicpartners.com |
Class A | | | |
|
Net asset value and redemption price per share ($41,889,610 ÷ 2,606,517 shares of common stock issued and outstanding) | | $ | 16.07 |
Maximum sales charge (5% of offering price) | | | .85 |
| | |
|
|
Maximum offering price to public | | $ | 16.92 |
| | |
|
|
| |
Class B | | | |
|
Net asset value, offering price and redemption price per share ($33,650,680 ÷ 2,159,551 shares of common stock issued and outstanding) | | $ | 15.58 |
| | |
|
|
| |
Class C | | | |
|
Net asset value and redemption price per share ($7,437,884 ÷ 476,868 shares of common stock issued and outstanding) | | $ | 15.60 |
Sales charge (1% of offering price) | | | .16 |
| | |
|
|
Offering price to public | | $ | 15.76 |
| | |
|
|
| |
Class Z | | | |
|
Net asset value, offering price and redemption price per share ($310,520,632 ÷ 19,200,987 shares of common stock issued and outstanding) | | $ | 16.17 |
| | |
|
|
See Notes to Financial Statements.
| Prudential World Fund, Inc./Strategic Partners International Value Fund | | 15 |
Statement of Operations
Year Ended October 31, 2003
Net Investment Income | | | | |
|
Income | | | | |
Dividends (net of foreign withholding taxes of $1,208,745) | | $ | 9,567,093 | |
Interest | | | 46,840 | |
| | |
|
|
|
Total income | | | 9,613,933 | |
| | |
|
|
|
| |
Expenses | | | | |
Management fee | | | 3,549,607 | |
Distribution fee—Class A | | | 101,185 | |
Distribution fee—Class B | | | 335,816 | |
Distribution fee—Class C | | | 69,885 | |
Transfer agent’s fees and expenses | | | 872,000 | |
Custodian’s fees and expenses | | | 400,000 | |
Reports to shareholders | | | 266,000 | |
Registration fees | | | 80,000 | |
Audit fee | | | 39,000 | |
Legal fees | | | 16,000 | |
Directors’ fees | | | 11,000 | |
Miscellaneous | | | 16,949 | |
| | |
|
|
|
Total operating expenses | | | 5,757,442 | |
Loan interest expense (Note 8) | | | 3,606 | |
| | |
|
|
|
Total expenses | | | 5,761,048 | |
| | |
|
|
|
Net investment income | | | 3,852,885 | |
| | |
|
|
|
| |
Realized And Unrealized Gain (Loss) On Investments And Foreign Currency Transactions | | | | |
|
Net realized gain (loss) on: | | | | |
Investment transactions | | | (34,299,151 | ) |
Foreign currency transactions | | | 125,794 | |
| | |
|
|
|
| | | | (34,173,357 | ) |
| | |
|
|
|
Net change in unrealized appreciation (depreciation) on: | | | | |
Investments | | | 82,968,521 | |
Foreign currencies | | | 15,121 | |
| | |
|
|
|
| | | | 82,983,642 | |
| | |
|
|
|
Net gain on investments and foreign currencies | | | 48,810,285 | |
| | |
|
|
|
Net Increase In Net Assets Resulting From Operations | | $ | 52,663,170 | |
| | |
|
|
|
See Notes to Financial Statements.
| 16 | | Visit our website at www.strategicpartners.com |
Statement of Changes in Net Assets
| |
| | | Year Ended October 31,
| |
| | | 2003 | | | 2002 | |
Increase (Decrease) In Net Assets | | | | | | | | |
|
Operations | | | | | | | | |
Net investment income | | $ | 3,852,885 | | | $ | 2,116,150 | |
Net realized loss on investment and foreign currency transactions | | | (34,173,357 | ) | | | (40,887,219 | ) |
Net change in unrealized appreciation (depreciation) on investments and foreign currencies | | | 82,983,642 | | | | (18,606,126 | ) |
| | |
|
|
| |
|
|
|
Net increase (decrease) in net assets resulting from operations | | | 52,663,170 | | | | (57,377,195 | ) |
| | |
|
|
| |
|
|
|
Dividends and distributions (Note 1) | | | | | | | | |
Dividends from net investment income | | | | | | | | |
Class A | | | (107,003 | ) | | | — | |
Class B | | | — | | | | — | |
Class C | | | — | | | | — | |
Class Z | | | (1,514,375 | ) | | | (466,174 | ) |
| | |
|
|
| |
|
|
|
| | | | (1,621,378 | ) | | | (466,174 | ) |
| | |
|
|
| |
|
|
|
Distributions from net realized capital gains | | | | | | | | |
Class A | | | — | | | | (2,397,272 | ) |
Class B | | | — | | | | (2,425,149 | ) |
Class C | | | — | | | | (495,578 | ) |
Class Z | | | — | | | | (13,929,255 | ) |
| | |
|
|
| |
|
|
|
| | | | — | | | | (19,247,254 | ) |
| | |
|
|
| |
|
|
|
Series share transactions (net of share conversions) (Note 7) | | | | | | | | |
Net proceeds from shares sold | | | 210,784,175 | | | | 796,892,186 | |
Net asset value of shares issued in reinvestment of dividends and distributions | | | 1,610,139 | | | | 19,394,241 | |
Cost of shares reacquired | | | (226,060,115 | ) | | | (809,545,413 | ) |
| | |
|
|
| |
|
|
|
Net increase (decrease) in net assets from Series share transactions | | | (13,665,801 | ) | | | 6,741,014 | |
| | |
|
|
| |
|
|
|
Total increase (decrease) | | | 37,375,991 | | | | (70,349,609 | ) |
| | |
Net Assets | | | | | | | | |
|
Beginning of year | | | 356,122,815 | | | | 426,472,424 | |
| | |
|
|
| |
|
|
|
End of year(a) | | $ | 393,498,806 | | | $ | 356,122,815 | |
| | |
|
|
| |
|
|
|
(a) Includes undistributed net investment income of: | | $ | 3,698,787 | | | $ | 1,417,769 | |
| | |
|
|
| |
|
|
|
See Notes to Financial Statements.
| Prudential World Fund, Inc./Strategic Partners International Value Fund | | 17 |
Notes to Financial Statements
Prudential World Fund, Inc. (the “Fund”) is registered under the Investment Company Act of 1940, as an open-end, diversified management investment company and currently consists of three series: Strategic Partners International Value Fund (the “Series”), formerly known as Prudential International Value Fund, Jennison Global Growth Fund, formerly known as Prudential Global Growth Fund, and the Dryden International Equity Fund, formerly known as the Prudential Jennison International Growth Fund. These financial statements relate to Strategic Partners International Value Fund. The financial statements of the other Series are not presented herein. The investment objective of the Series is to achieve long-term growth of capital. Income is a secondary objective. The Series seeks to achieve its objective primarily through investment in common stock and preferred stock of foreign companies of all sizes.
Note 1. Accounting Policies
The following is a summary of significant accounting policies followed by the Fund and the Series in the preparation of its financial statements.
Securities Valuation: Securities listed on a securities exchange are valued at the last sale price on such exchange on the day of valuation or, if there was no sale on such day, at the mean between the last reported bid and asked prices, or at the last bid price on such day in the absence of an asked price. Securities traded via Nasdaq are valued at the official closing price as provided by Nasdaq. Securities traded in the over-the-counter market, including securities listed on exchanges whose primary market is believed by Prudential Investments LLC, in consultation with the subadviser; to be over-the-counter, are valued at market value using prices provided by an independent pricing agent or principal market maker (if available, otherwise a principal market maker or a primary market dealer). Securities for which reliable market quotations are not readily available, or whose values have been affected by events occurring after the close of the security’s foreign market and before the Series’ normal pricing time, are valued at fair value in accordance with board of directors’ approved fair valuation procedures.
Short-term securities which mature in sixty days or less are valued at amortized cost which approximates market value. The amortized cost method involves valuing a security at its cost on the date of purchase and thereafter assuming a constant amortization to maturity of the difference between the principal amount due at maturity and the cost. Short-term securities which mature in more than sixty days are valued at current market quotations. Investments in mutual funds are valued at their net asset value as of the close of the New York Stock Exchange on the date of valuation.
| 18 | | Visit our website at www.strategicpartners.com |
Repurchase Agreements: In connection with transactions in repurchase agreements with United States financial institutions, it is the Fund’s policy that its custodian or designated subcustodians under triparty repurchase agreements, as the case may be, take possession of the underlying securities, the value of which exceeds the principal amount of the repurchase transaction including accrued interest. To the extent that any repurchase transaction exceeds one business day, the value of the collateral is marked to market on a daily basis to maintain the accuracy of the collateral. If the seller defaults and the value of the collateral declines or if bankruptcy proceedings are commenced with respect to the seller of the security, realization of the collateral by the Series may be delayed or limited.
Foreign Currency Translation: The books and records of the Series are maintained in U.S. dollars. Foreign currency amounts are translated into U.S. dollars on the following basis:
(i) market value of investment securities, other assets and liabilities—at the current rates of exchange.
(ii) purchases and sales of investment securities, income and expenses—at the rate of exchange prevailing on the respective dates of such transactions.
Although the net assets of the Series are presented at the foreign exchange rates and market values at the close of the fiscal year, the Series does not isolate that portion of the results of operations arising as a result of changes in the foreign exchange rates from the fluctuations arising from changes in the market prices of securities held at the end of the fiscal year. Similarly, the Series does not isolate the effect of changes in foreign exchange rates from the fluctuations arising from changes in the market prices of long-term portfolio securities sold during the fiscal year. Accordingly, these realized foreign currency gains (losses) are included in the reported net realized gains (losses) on investment transactions.
Net realized gains (losses) on foreign currency transactions represent net foreign exchange gains or losses from holdings of foreign currencies, currency gains or losses realized between the trade and settlement dates on security transactions, and the difference between the amounts of dividends, interest and foreign taxes recorded on the Series’ books and the U.S. dollar equivalent amounts actually received or paid. Net unrealized currency gains or losses from valuing foreign currency denominated assets and liabilities (other than investments) at year-end exchange rates are reflected as a component of net unrealized appreciation (depreciation) on investments and foreign currencies.
| Prudential World Fund, Inc./Strategic Partners International Value Fund | | 19 |
Notes to Financial Statements
Cont’d
Foreign security and currency transactions may involve certain considerations and risks not typically associated with those of domestic origin as a result of, among other factors, the possibility of political and economic instability and the level of governmental supervision and regulation of foreign securities markets.
Forward Currency Contracts: A forward currency contract is a commitment to purchase or sell a foreign currency at a future date at a negotiated forward rate. The Series enters into forward currency contracts in order to hedge its exposure to changes in foreign currency exchange rates on its foreign portfolio holdings or on specific receivables and payables denominated in a foreign currency. The contracts are valued daily at current exchange rates and any unrealized gain or loss is included in net unrealized appreciation or depreciation on foreign currencies. Gain or loss is realized on the settlement date of the contract equal to the difference between the settlement value of the original and renegotiated forward contracts. This gain or loss, if any, is included in net realized gain (loss) on foreign currency transactions. Risks may arise upon entering into these contracts from the potential inability of the counterparties to meet the terms of their contracts.
Forward currency contracts involve elements of both market and credit risk in excess of the amounts reflected on the Statement of Assets and Liabilities.
Securities Transactions and Net Investment Income: Securities transactions are recorded on the trade date. Realized gains or losses for investment and currency transactions are calculated on the identified cost basis. Dividend income is recorded on the ex-dividend date and interest income, including amortization of premium and accretion of discount on debt securities, as required, is recorded on an accrual basis. Expenses are recorded on the accrual basis which may require the use of certain estimates by management.
Net investment income (loss) (other than distribution fees which are charged directly to the respective class) and unrealized and realized gains or losses are allocated daily to each class of shares based upon the relative proportion of net assets of each class at the beginning of the day.
Dividends and Distributions: The Series expects to pay dividends of net investment income and distributions of net realized capital and currency gains, if any, annually. Dividends and distributions to shareholders, which are determined in accordance with federal income tax regulations and which may differ from generally accepted accounting principles, are recorded on the ex-dividend date.
| 20 | | Visit our website at www.strategicpartners.com |
Taxes: For federal income tax purposes, each series in the Fund is treated as a separate taxpaying entity. It is the Series’ policy to continue to meet the requirements of the Internal Revenue Code applicable to regulated investment companies and to distribute all of its taxable net income and capital gains, if any, to shareholders. Therefore, no federal income tax provision is required.
Withholding taxes on foreign dividends are recorded, net of reclaimable amounts, at the time the related income is earned.
Note 2. Agreements
The Fund has a management agreement for the Series with Prudential Investments LLC (“PI”). Pursuant to this agreement, PI has responsibility for all investment advisory services and supervises the subadvisor’s performance of such services. PI has entered into a subadvisory agreement with Bank of Ireland Asset Management (“BOI”). The subadvisory agreement provides that BOI furnishes investment advisory services in connection with the management of the Series. In connection therewith, BOI is obligated to keep certain books and records of the Series. PI pays for the services of BOI, the cost of compensation of officers of the Series, occupancy and certain clerical and bookkeeping costs of the Series. The Series bears all other costs and expenses.
The management fee paid to PI is computed daily and payable monthly at an annual rate of 1% of the average daily net assets up to $300 million and .95 of 1% of average daily net assets in excess of $300 million of the Series.
The Series has a distribution agreement with Prudential Investment Management Services LLC (“PIMS”) which acts as the distributor of the Class A, Class B, Class C and Class Z shares of the Series. The Series compensates PIMS for distributing and servicing the Series’ Class A, Class B and Class C shares, pursuant to plans of distribution (the “Class A, B and C Plans”), regardless of expenses actually incurred by PIMS. The distribution fees are accrued daily and payable monthly. No distribution or service fees are paid to PIMS as distributor of the Class Z shares of the Series.
Pursuant to the Class A, B and C Plans, the Series compensates PIMS for distribution-related activities at an annual rate of up to .30 of 1%, 1% and 1% of the average daily net assets of the Class A, B and C shares, respectively. For the year ended October 31, 2003, PIMS contractually agreed to limit such fees to .25 of 1% of the average daily net assets of the Class A shares.
| Prudential World Fund, Inc./Strategic Partners International Value Fund | | 21 |
Notes to Financial Statements
Cont’d
PIMS advised the Series that it has received approximately $19,700 and $3,000 in front-end sales charges resulting from sales of Class A and Class C shares, respectively, during the year ended October 31, 2003. From these fees, PIMS paid such sales charges to dealers, which in turn paid commissions to salespersons and incurred other distribution costs.
PIMS advised the Series that for the year ended October 31, 2003, it has received approximately $53,200 and $5,000 in contingent deferred sales charges imposed upon certain redemptions by Class B and Class C shareholders, respectively.
PI and PIMS are indirect, wholly-owned subsidiaries of Prudential Financial, Inc. (“Prudential”).
Note 3. Other Transactions with Affiliates
Prudential Mutual Fund Services LLC (“PMFS”) an affiliate of PI and an indirect, wholly-owned subsidiary of Prudential, serves as the Fund’s transfer agent. During the year ended October 31, 2003, the Series incurred fees of approximately $748,000 for the services of PMFS. As of October 31, 2003, approximately $57,000 of such fees were due to PMFS. Transfer agent fees and expenses in the Statement of Operations include certain out-of-pocket expenses paid to nonaffiliates, where applicable.
The Series pays networking fees to affiliated and unaffiliated broker/dealers. These networking fees are payments made to broker/dealers that clear mutual fund transactions through a national clearing system. The Series incurred approximately $54,700 in total networking fees, of which the amount relating to the services of Wachovia Securities, LLC (“Wachovia”) and Prudential Securities, Inc. (“PSI”), affiliates of PI were approximately $32,500 for the year ended October 31, 2003. Effective July 1, 2003, Prudential and Wachovia Corp. formed a joint venture (“Wachovia Securities, LLC”) whereby Prudential and Wachovia Corp. combined their brokerage businesses with Prudential holding a minority interest. Prior to July 1, 2003, PSI was an indirect, wholly-owned subsidiary of Prudential. As of October 31, 2003, approximately $2,500 of such fees were due to Wachovia. These amounts are included in transfer agent’s fees and expenses on the Statement of Operations.
| 22 | | Visit our website at www.strategicpartners.com |
Note 4. Portfolio Securities
Purchases and sales of portfolio securities of the Series, other than short-term investments, for the year ended October 31, 2003 aggregated $80,330,363 and $89,579,713, respectively.
Note 5. Distributions and Tax Information
In order to present undistributed net investment income (loss) and accumulated net realized gains (losses) on the Statement of Assets and Liabilities that more closely represent their tax character, certain adjustments have been made to undistributed net investment income (loss) and accumulated net realized gains (loss) on investments. For the year ended October 31, 2003, the adjustments were to increase accumulated net realized loss by $125,794, increase undistributed net investment income by $49,511 and increase paid in capital by $76,283 for differences in the treatment for book and tax purposes of certain transactions involving foreign securities, currencies and other tax adjustments.
For the year ended October 31, 2003 the tax character of dividends paid, as reflected in the Statement of Changes in Net Assets, was $1,621,378 of ordinary income.
For the year ended October 31, 2002 the tax character of dividends paid, as reflected in the Statement of Changes in Net Assets, was $466,174 of ordinary income and $19,247,254 of long-term capital gains.
As of October 31, 2003, the accumulated undistributed earnings on a tax basis was $3,779,474 of ordinary income.
For federal income tax purposes, the Series had a capital loss carryforward as of October 31, 2003 of approximately $67,869,000 of which $34,787,000 expires in 2010 and $33,082,000 expires in 2011. Accordingly, no capital gains distributions are expected to be paid to shareholders until net gains have been realized in excess of such carryforward.
The United States federal income tax basis of the Series’ investments and the net unrealized depreciation as of October 31, 2003 were as follows:
Tax Basis
| | Appreciation
| | Depreciation
| | Other Cost Adjustments
| | Total Net Unrealized Depreciation
|
| $405,895,398 | | $33,446,635 | | $46,186,302 | | $49,139 | | $12,690,528 |
The difference between book basis and tax basis was attributable to deferred losses on wash sale and other tax adjustments. The other cost basis adjustments are primarily attributable to depreciation of foreign currency and mark to market of receivables and payables.
| Prudential World Fund, Inc./Strategic Partners International Value Fund | | 23 |
Notes to Financial Statements
Cont’d
Note 6. Joint Repurchase Agreement Account
The Series, along with other affiliated registered investment companies, transfers uninvested cash balances into a single joint account, the daily aggregate balance of which is invested in one or more repurchase agreements collateralized by U.S. Treasury or federal agency obligations. As of October 31, 2003, the Series had a 0.85% undivided interest in the repurchase agreements in the joint account. The undivided interest for the Series represents $1,961,000 in the principal amount. As of such date, each repurchase agreement in the joint account and the collateral therefore were as follows:
Bear Stearns Securities Corp., 1.07%, in the principal amount of $77,172,000, repurchase price $77,178,881, due 11/03/03. The value of the collateral including accrued interest was $78,717,519.
Goldman Sachs & Co., 1.07%, in the principal amount of $77,173,000, repurchase price $77,179,881, due 11/03/03. The value of the collateral including accrued interest was $78,716,461.
Greenwich Capital Markets, Inc., 1.07% in the principal amount of $77,172,000, repurchase price $77,178,881, due 11/03/03. The value of the collateral including accrued interest was $78,719,220.
Note 7. Capital
The Series offers Class A, Class B, Class C and Class Z shares. Class A shares are sold with a front-end sales charge of up to 5%. In some limited circumstances, Class A shares may not be subject to a front-end sales charge, but may be subject to a 1% contingent deferred sales charge for the first year. Class B shares are sold with a contingent deferred sales charge which declines from 5% to zero depending on the period of time the shares are held. Class C shares are sold with a front-end sales charge of 1% and a contingent deferred sales charge of 1% during the first 18 months. Class B shares will automatically convert to Class A shares on a quarterly basis approximately seven years after purchase. A special exchange privilege is also available for shareholders who qualified to purchase Class A shares at net asset value. Class Z shares are not subject to any sales or redemption charge and are offered exclusively for sale to a limited group of investors.
| 24 | | Visit our website at www.strategicpartners.com |
There are 500 million authorized shares of $.01 par value common stock, divided equally into four classes, designated Class A, Class B, Class C and Class Z common stock. As of October 31, 2003, Prudential owned 293,555 Class Z shares.
Transactions in shares of common stock were as follows:
Class A
| | Shares
| | | Amount
| |
Year ended October 31, 2003: | | | | | | | |
Shares sold | | 4,601,050 | | | $ | 66,268,156 | |
Shares issued in reinvestment of dividends and distributions | | 7,341 | | | | 103,529 | |
Shares reacquired | | (5,020,691 | ) | | | (73,325,967 | ) |
| | |
|
| |
|
|
|
Net increase (decrease) in shares outstanding before conversion | | (412,300 | ) | | | (6,954,282 | ) |
Shares issued upon conversion from Class B | | 105,103 | | | | 1,468,997 | |
| | |
|
| |
|
|
|
Net increase (decrease) in shares outstanding | | (307,197 | ) | | $ | (5,485,285 | ) |
| | |
|
| |
|
|
|
Year ended October 31, 2002: | | | | | | | |
Shares sold | | 4,664,376 | | | $ | 75,081,728 | |
Shares issued in reinvestment of dividends and distributions | | 127,760 | | | | 2,220,484 | |
Shares reacquired | | (5,072,529 | ) | | | (82,501,605 | ) |
| | |
|
| |
|
|
|
Net increase (decrease) in shares outstanding before conversion | | (280,393 | ) | | | (5,199,393 | ) |
Shares issued upon conversion from Class B | | 113,009 | | | | 1,807,034 | |
| | |
|
| |
|
|
|
Net increase (decrease) in shares outstanding | | (167,384 | ) | | $ | (3,392,359 | ) |
| | |
|
| |
|
|
|
Class B
| | | | | | |
Year ended October 31, 2003: | | | | | | | |
Shares sold | | 294,371 | | | $ | 4,032,232 | |
Shares reacquired | | (771,800 | ) | | | (10,610,204 | ) |
| | |
|
| |
|
|
|
Net increase (decrease) in shares outstanding before conversion | | (477,429 | ) | | | (6,577,972 | ) |
Shares reacquired upon conversion into Class A | | (107,969 | ) | | | (1,468,997 | ) |
| | |
|
| |
|
|
|
Net increase (decrease) in shares outstanding | | (585,398 | ) | | $ | (8,046,969 | ) |
| | |
|
| |
|
|
|
Year ended October 31, 2002: | | | | | | | |
Shares sold | | 435,761 | | | $ | 6,815,124 | |
Shares issued in reinvestment of dividends and distributions | | 136,035 | | | | 2,319,402 | |
Shares reacquired | | (985,799 | ) | | | (15,343,842 | ) |
| | |
|
| |
|
|
|
Net increase (decrease) in shares outstanding before conversion | | (414,003 | ) | | | (6,209,316 | ) |
Shares reacquired upon conversion into Class A | | (115,606 | ) | | | (1,807,034 | ) |
| | |
|
| |
|
|
|
Net increase (decrease) in shares outstanding | | (529,609 | ) | | $ | (8,016,350 | ) |
| | |
|
| |
|
|
|
| Prudential World Fund, Inc./Strategic Partners International Value Fund | | 25 |
Notes to Financial Statements
Cont’d
Class C
| | Shares
| | | Amount
| |
Year ended October 31, 2003: | | | | | | | |
Shares sold | | 513,851 | | | $ | 7,040,899 | |
Shares reacquired | | (608,873 | ) | | | (8,338,190 | ) |
| | |
|
| |
|
|
|
Net increase (decrease) in shares outstanding | | (95,022 | ) | | $ | (1,297,291 | ) |
| | |
|
| |
|
|
|
Year ended October 31, 2002: | | | | | | | |
Shares sold | | 487,499 | | | $ | 7,181,876 | |
Shares issued in reinvestment of dividends and distributions | | 28,277 | | | | 482,684 | |
Shares reacquired | | (608,755 | ) | | | (9,226,588 | ) |
| | |
|
| |
|
|
|
Net increase (decrease) in shares outstanding | | (92,979 | ) | | $ | (1,562,028 | ) |
| | |
|
| |
|
|
|
Class Z
| | | | | | |
Year ended October 31, 2003: | | | | | | | |
Shares sold | | 9,362,691 | | | $ | 133,442,888 | |
Shares issued in reinvestment of dividends and distributions | | 106,400 | | | | 1,506,610 | |
Shares reacquired | | (9,297,500 | ) | | | (133,785,754 | ) |
| | |
|
| |
|
|
|
Net increase (decrease) in shares outstanding | | 171,591 | | | $ | 1,163,744 | |
| | |
|
| |
|
|
|
Year ended October 31, 2002: | | | | | | | |
Shares sold | | 42,669,909 | | | $ | 707,813,458 | |
Shares issued in reinvestment of dividends and distributions | | 823,591 | | | | 14,371,671 | |
Shares reacquired | | (42,079,768 | ) | | | (702,473,378 | ) |
| | |
|
| |
|
|
|
Net increase (decrease) in shares outstanding | | 1,413,732 | | | $ | 19,711,751 | |
| | |
|
| |
|
|
|
Note 8. Borrowings
The Series, along with other affiliated registered investment companies (the “Funds”), is a party to a syndicated credit agreement (“SCA”) with a group of banks. The SCA provides for a commitment of $800 million and allows the Funds to increase the commitment to $1 billion, if necessary. Interest on any borrowings will be incurred at market rates. The Funds pay a commitment fee of .08 of 1% of the unused portion of the SCA. The commitment fee is accrued and allocated to the Funds pro rata based on net assets. The purpose of the SCA is to serve as an alternative source of funding for capital share redemptions. The expiration date of the SCA was May 2, 2003. On May 2, 2003, the SCA was renewed under the same terms and conditions (“May 2003 renewal”). The expiration date of the May 2003 renewal is April 30, 2004.
The Series utilized the line of credit during the year ended October 31, 2003. The average daily balance for the 18 days the Series had debt outstanding during the year was approximately $4,420,000 at a weighted average interest rate of approximately 1.638%.
| 26 | | Visit our website at www.strategicpartners.com |
ANNUAL REPORT
OCTOBER 31, 2003
STRATEGIC PARTNERS
INTERNATIONAL VALUE FUND
FINANCIAL HIGHLIGHTS
Financial Highlights
| |
| | | Class A
| |
| | | Year Ended October 31, 2003(b) | |
|
Per Share Operating Performance: | | | | |
Net Asset Value, Beginning Of Year | | $ | 14.08 | |
| | |
|
|
|
Income From Investment Operations: | | | | |
Net investment income | | | .14 | |
Net realized and unrealized gain (loss) on investment and foreign currency transactions | | | 1.89 | |
| | |
|
|
|
Total from investment operations | | | 2.03 | |
| | |
|
|
|
Less Distributions: | | | | |
Dividends from net investment income | | | (.04 | ) |
Distributions from net realized capital gains | | | — | |
| | |
|
|
|
Total distributions | | | (.04 | ) |
| | |
|
|
|
Net asset value, end of year | | $ | 16.07 | |
| | |
|
|
|
Total Return(a) | | | 14.44 | % |
Ratios/Supplemental Data: | | | | |
Net assets, end of year (000) | | $ | 41,889 | |
Average net assets (000) | | $ | 40,463 | |
Ratios to average net assets: | | | | |
Expenses, including distribution and service (12b-1) fees(c) | | | 1.72 | % |
Expenses, excluding distribution and service (12b-1) fees | | | 1.47 | % |
Net investment income | | | .97 | % |
For Class A, B, C and Z shares: | | | | |
Portfolio turnover rate | | | 23 | % |
| (a) | Total return does not consider the effect of sales load. Total return is calculated assuming a purchase of shares on the first day and a sale on the last day of each year reported and includes reinvestment of dividends and distributions. |
| (b) | Calculated based upon average shares outstanding during the year. |
| (c) | The distributor of the Series contractually agreed to limit its distribution and services (12b-1) fees to .25 of 1% of the average daily net assets of the Class A shares. |
See Notes to Financial Statements.
| 28 | | Visit our website at www.strategicpartners.com |
|
| Class A | |
|
| Year Ended October 31, | |
|
| 2002(b) | | | 2001 | | | 2000(b) | | | 1999 | |
|
| | | | | | | | | | | | | | | |
| $ | 17.29 | | | $ | 22.08 | | | $ | 22.42 | | | $ | 18.33 | |
|
|
| |
|
|
| |
|
|
| |
|
|
|
| | | | | | | | | | | | | | | |
| | .07 | | | | .13 | | | | .19 | | | | .27 | |
| | (2.53 | ) | | | (4.01 | ) | | | .71 | | | | 3.97 | |
|
|
| |
|
|
| |
|
|
| |
|
|
|
| | (2.46 | ) | | | (3.88 | ) | | | .90 | | | | 4.24 | |
|
|
| |
|
|
| |
|
|
| |
|
|
|
| | | | | | | | | | | | | | | |
| | — | | | | — | | | | (.17 | ) | | | (.15 | ) |
| | (.75 | ) | | | (.91 | ) | | | (1.07 | ) | | | — | |
|
|
| |
|
|
| |
|
|
| |
|
|
|
| | (.75 | ) | | | (.91 | ) | | | (1.24 | ) | | | (.15 | ) |
|
|
| |
|
|
| |
|
|
| |
|
|
|
| $ | 14.08 | | | $ | 17.29 | | | $ | 22.08 | | | $ | 22.42 | |
|
|
| |
|
|
| |
|
|
| |
|
|
|
| | (15.07 | )% | | | (18.25 | )% | | | 3.92 | % | | | 23.30 | % |
| | | | | | | | | | | | | | | |
| $ | 41,011 | | | $ | 53,269 | | | $ | 72,185 | | | $ | 61,036 | |
| $ | 49,279 | | | $ | 63,061 | | | $ | 67,362 | | | $ | 52,732 | |
| | | | | | | | | | | | | | | |
| | 1.64 | % | | | 1.60 | % | | | 1.52 | % | | | 1.61 | % |
| | 1.39 | % | | | 1.35 | % | | | 1.27 | % | | | 1.36 | % |
| | .42 | % | | | .62 | % | | | .84 | % | | | 1.35 | % |
| | | | | | | | | | | | | | | |
| | 35 | % | | | 115 | % | | | 33 | % | | | 21 | % |
See Notes to Financial Statements.
| Prudential World Fund, Inc./Strategic Partners International Value Fund | | 29 |
Financial Highlights
Cont’d.
| |
| | | Class B
| |
| | | Year Ended October 31, 2003(b) | |
|
Per Share Operating Performance: | | | | |
Net asset Value, Beginning Of Year | | $ | 13.71 | |
| | |
|
|
|
Income From Investment Operations: | | | | |
Net investment income (loss) | | | .03 | |
Net realized and unrealized gain (loss) on investment and foreign currency transactions | | | 1.84 | |
| | |
|
|
|
Total from investment operations | | | 1.87 | |
| | |
|
|
|
Less Distributions: | | | | |
Dividends from net investment income | | | — | |
Distributions from net realized capital gains | | | — | |
| | |
|
|
|
Total distributions | | | — | |
| | |
|
|
|
Net asset value, end of year | | $ | 15.58 | |
| | |
|
|
|
Total Return(a): | | | 13.64 | % |
Ratios/Supplemental Data: | | | | |
Net assets, end of year (000) | | $ | 33,651 | |
Average net assets (000) | | $ | 33,581 | |
Ratios to average net assets: | | | | |
Expenses, including distribution and service (12b-1) fees | | | 2.47 | % |
Expenses, excluding distribution and service (12b-1) fees | | | 1.47 | % |
Net investment income (loss) | | | .20 | % |
| (a) | Total return does not consider the effect of sales load. Total return is calculated assuming a purchase of shares on the first day and a sale on the last day of each year reported and includes reinvestment of dividends and distributions. |
| (b) | Calculated based upon average shares outstanding during the year. |
See Notes to Financial Statements.
| 30 | | Visit our website at www.strategicpartners.com |
|
| Class B | |
|
| Year Ended October 31, | |
|
| 2002(b) | | | 2001 | | | 2000(b) | | | 1999 | |
|
| | | | | | | | | | | | | | | |
| $ | 16.99 | | | $ | 21.88 | | | $ | 22.23 | | | $ | 18.18 | |
|
|
| |
|
|
| |
|
|
| |
|
|
|
| | | | | | | | | | | | | | | |
| | (.05 | ) | | | (.03 | ) | | | .02 | | | | .12 | |
| | (2.48 | ) | | | (3.95 | ) | | | .71 | | | | 3.94 | |
|
|
| |
|
|
| |
|
|
| |
|
|
|
| | (2.53 | ) | | | (3.98 | ) | | | .73 | | | | 4.06 | |
|
|
| |
|
|
| |
|
|
| |
|
|
|
| | | | | | | | | | | | | | | |
| | — | | | | — | | | | (.01 | ) | | | (.01 | ) |
| | (.75 | ) | | | (.91 | ) | | | (1.07 | ) | | | — | |
|
|
| |
|
|
| |
|
|
| |
|
|
|
| | (.75 | ) | | | (.91 | ) | | | (1.08 | ) | | | (.01 | ) |
|
|
| |
|
|
| |
|
|
| |
|
|
|
| $ | 13.71 | | | $ | 16.99 | | | $ | 21.88 | | | $ | 22.23 | |
|
|
| |
|
|
| |
|
|
| |
|
|
|
| | (15.77 | )% | | | (18.93 | )% | | | 3.22 | % | | | 22.34 | % |
| | | | | | | | | | | | | | | |
| $ | 37,636 | | | $ | 55,620 | | | $ | 86,451 | | | $ | 101,043 | |
| $ | 49,420 | | | $ | 74,063 | | | $ | 99,106 | | | $ | 98,842 | |
| | | | | | | | | | | | | | | |
| | 2.39 | % | | | 2.35 | % | | | 2.27 | % | | | 2.36 | % |
| | 1.39 | % | | | 1.35 | % | | | 1.27 | % | | | 1.36 | % |
| | (.33 | )% | | | (.13 | )% | | | .07 | % | | | .59 | % |
See Notes to Financial Statements.
| Prudential World Fund, Inc./Strategic Partners International Value Fund | | 31 |
Financial Highlights
Cont’d.
| |
| | | Class C
| |
| | | Year Ended
October 31, 2003(b) | |
|
Per Share Operating Performance: | | | | |
Net Asset Value, Beginning Of Year | | $ | 13.73 | |
| | |
|
|
|
Income From Investment Operations: | | | | |
Net investment income (loss) | | | .03 | |
Net realized and unrealized gain (loss) on investment and foreign currency transactions | | | 1.84 | |
| | |
|
|
|
Total from investment operations | | | 1.87 | |
| | |
|
|
|
Less Distributions: | | | | |
Dividends from net investment income | | | — | |
Distributions from net realized capital gains | | | — | |
| | |
|
|
|
Total distributions | | | — | |
| | |
|
|
|
Net asset value, end of year | | $ | 15.60 | |
| | |
|
|
|
Total Return(a) | | | 13.62 | % |
Ratios/Supplemental Data: | | | | |
Net assets, end of year (000) | | $ | 7,438 | |
Average net assets (000) | | $ | 6,988 | |
Ratios to average net assets: | | | | |
Expenses, including distribution and service (12b-1) fees | | | 2.47 | % |
Expenses, excluding distribution and service (12b-1) fees | | | 1.47 | % |
Net investment income (loss) | | | .18 | % |
| (a) | Total return does not consider the effect of sales load. Total return is calculated assuming a purchase of shares on the first day and a sale on the last day of each year reported and includes reinvestment of dividends and distributions. |
| (b) | Calculated based upon average shares outstanding during the year. |
See Notes to Financial Statements.
| 32 | | Visit our website at www.strategicpartners.com |
|
| Class C | |
|
| Year Ended October 31, | |
|
| 2002(b) | | | 2001 | | | 2000(b) | | | 1999 | |
|
| | | | | | | | | | | | | | | |
| $ | 17.00 | | | $ | 21.88 | | | $ | 22.23 | | | $ | 18.18 | |
|
|
| |
|
|
| |
|
|
| |
|
|
|
| | | | | | | | | | | | | | | |
| | (.05 | ) | | | (.03 | ) | | | .02 | | | | .11 | |
| | (2.47 | ) | | | (3.94 | ) | | | .71 | | | | 3.95 | |
|
|
| |
|
|
| |
|
|
| |
|
|
|
| | (2.52 | ) | | | (3.97 | ) | | | .73 | | | | 4.06 | |
|
|
| |
|
|
| |
|
|
| |
|
|
|
| | | | | | | | | | | | | | | |
| | — | | | | — | | | | (.01 | ) | | | (.01 | ) |
| | (.75 | ) | | | (.91 | ) | | | (1.07 | ) | | | — | |
|
|
| |
|
|
| |
|
|
| |
|
|
|
| | (.75 | ) | | | (.91 | ) | | | (1.08 | ) | | | (.01 | ) |
|
|
| |
|
|
| |
|
|
| |
|
|
|
| $ | 13.73 | | | $ | 17.00 | | | $ | 21.88 | | | $ | 22.23 | |
|
|
| |
|
|
| |
|
|
| |
|
|
|
| | (15.70 | )% | | | (18.89 | )% | | | 3.22 | % | | | 22.34 | % |
| | | | | | | | | | | | | | | |
| $ | 7,850 | | | $ | 11,306 | | | $ | 17,755 | | | $ | 18,078 | |
| $ | 9,978 | | | $ | 14,599 | | | $ | 18,082 | | | $ | 15,815 | |
| | | | | | | | | | | | | | | |
| | 2.39 | % | | | 2.35 | % | | | 2.27 | % | | | 2.36 | % |
| | 1.39 | % | | | 1.35 | % | | | 1.27 | % | | | 1.36 | % |
| | (.34 | )% | | | (.15 | )% | | | .07 | % | | | .59 | % |
See Notes to Financial Statements.
| Prudential World Fund, Inc./Strategic Partners International Value Fund | | 33 |
Financial Highlights
Cont’d.
| |
| | | Class Z
| |
| | | Year Ended October 31, 2003(b) | |
|
Per Share Operating Performance: | | | | |
Net Asset Value, Beginning Of Year | | $ | 14.17 | |
| | |
|
|
|
Income From Investment Operations: | | | | |
Net investment income | | | .18 | |
Net realized and unrealized gain (loss) on investment and foreign currency transactions | | | 1.90 | |
| | |
|
|
|
Total from investment operations | | | 2.08 | |
| | |
|
|
|
Less Distributions: | | | | |
Dividends from net investment income | | | (.08 | ) |
Distributions from net realized capital gains | | | — | |
| | |
|
|
|
Total distributions | | | (.08 | ) |
| | |
|
|
|
Net asset value, end of year | | $ | 16.17 | |
| | |
|
|
|
Total Return(a) | | | 14.76 | % |
Ratios/Supplemental Data: | | | | |
Net assets, end of year (000) | | $ | 310,521 | |
Average net assets (000) | | $ | 276,808 | |
Ratios to average net assets: | | | | |
Expenses, including distribution and service (12b-1) fees | | | 1.47 | % |
Expenses, excluding distribution and service (12b-1) fees | | | 1.47 | % |
Net investment income | | | 1.22 | % |
| (a) | Total return does not consider the effect of sales load. Total return is calculated assuming a purchase of shares on the first day and a sale on the last day of each year reported and includes reinvestment of dividends and distributions. |
| (b) | Calculated based upon average shares outstanding during the year. |
See Notes to Financial Statements.
| 34 | | Visit our website at www.strategicpartners.com |
|
| Class Z | |
|
| Year Ended October 31, | |
|
| 2002(b) | | | 2001 | | | 2000(b) | | | 1999 | |
|
| | | | | | | | | | | | | | | |
| $ | 17.39 | | | $ | 22.15 | | | $ | 22.48 | | | $ | 18.38 | |
|
|
| |
|
|
| |
|
|
| |
|
|
|
| | | | | | | | | | | | | | | |
| | .11 | | | | .20 | | | | .25 | | | | .31 | |
| | (2.55 | ) | | | (4.05 | ) | | | .71 | | | | 3.99 | |
|
|
| |
|
|
| |
|
|
| |
|
|
|
| | (2.44 | ) | | | (3.85 | ) | | | .96 | | | | 4.30 | |
|
|
| |
|
|
| |
|
|
| |
|
|
|
| | | | | | | | | | | | | | | |
| | (.03 | ) | | | — | | | | (.22 | ) | | | (.20 | ) |
| | (.75 | ) | | | (.91 | ) | | | (1.07 | ) | | | — | |
|
|
| |
|
|
| |
|
|
| |
|
|
|
| | (.78 | ) | | | (.91 | ) | | | (1.29 | ) | | | (.20 | ) |
|
|
| |
|
|
| |
|
|
| |
|
|
|
| $ | 14.17 | | | $ | 17.39 | | | $ | 22.15 | | | $ | 22.48 | |
|
|
| |
|
|
| |
|
|
| |
|
|
|
| | (14.91 | )% | | | (18.08 | )% | | | 4.24 | % | | | 23.62 | % |
| | | | | | | | | | | | | | | |
| $ | 269,625 | | | $ | 306,278 | | | $ | 405,340 | | | $ | 353,292 | |
| $ | 308,825 | | | $ | 375,390 | | | $ | 391,289 | | | $ | 308,917 | |
| | | | | | | | | | | | | | | |
| | 1.39 | % | | | 1.35 | % | | | 1.27 | % | | | 1.36 | % |
| | 1.39 | % | | | 1.35 | % | | | 1.27 | % | | | 1.36 | % |
| | .68 | % | | | .89 | % | | | 1.09 | % | | | 1.59 | % |
See Notes to Financial Statements.
| Prudential World Fund, Inc./Strategic Partners International Value Fund | | 35 |
Report of Independent Auditors
To the Board of Directors and Shareholders of
Prudential World Fund, Inc.—Strategic Partners International Value Fund
In our opinion, the accompanying statement of assets and liabilities, including the portfolio of investments, and the related statements of operations and of changes in net assets and the financial highlights present fairly, in all material respects, the financial position of Prudential World Fund, Inc.—Strategic Partners International Value Fund, formerly Prudential World Fund, Inc.—Prudential International Value Fund, (the “Fund”, one of the portfolios constituting Prudential World Fund, Inc.) at October 31, 2003, the results of its operations for the year then ended, the changes in its net assets for each of the two years in the period then ended and the financial highlights for each of the five years in the period then ended, in conformity with accounting principles generally accepted in the United States of America. These financial statements and financial highlights (hereafter referred to as “financial statements”) are the responsibility of the Fund’s management; our responsibility is to express an opinion on these financial statements based on our audits. We conducted our audits of these financial statements in accordance with auditing standards generally accepted in the United States of America, which require that we plan and perform the audit to obtain reasonable assurance about whether the financial statements are free of material misstatement. An audit includes examining, on a test basis, evidence supporting the amounts and disclosures in the financial statements, assessing the accounting principles used and significant estimates made by management, and evaluating the overall financial statement presentation. We believe that our audits, which included confirmation of securities at October 31, 2003 by correspondence with the custodian and brokers, provide a reasonable basis for our opinion.
PricewaterhouseCoopers LLP
New York, New York
December 22, 2003
| 36 | | Visit our website at www.strategicpartners.com |
Federal Income Tax Information
(Unaudited)
We are required by the Internal Revenue Code to advise you within 60 days of the Series fiscal year end (October 31, 2003) as to the federal income tax status of dividends paid by the Series during such fiscal year. The Series paid ordinary income distributions for Class A and Class Z shares in the amount of $.04 and $.08 per share.
Further, we wish to advise you that 12.20% of the ordinary income dividends paid in the fiscal year ended October 31, 2003 qualified for the corporate dividends received deduction available to corporate taxpayers.
The Series has elected to give the benefit of foreign tax credits to its shareholders. Accordingly, shareholders who must report their gross income dividends and distributions in a federal income tax return will be entitled to a foreign tax credit, or an itemized deduction in computing their U.S. income tax liability. It is generally more advantageous to claim a credit rather than take a deduction. For the fiscal year ended October 31, 2003 the Series intends on passing through $1,224,179 of ordinary income distributions as a foreign tax credit.
The Series intends to designate the maximum amount of dividends qualified for the reduced tax rate under the Jobs and Growth Tax Relief Reconciliation Act of 2003, allowable.
In January 2004, you will be advised on IRS Form 1099 DIV or substitute 1099 DIV as to the federal tax status of the dividends and distributions received by you in calendar year 2003.
| Prudential World Fund, Inc./Strategic Partners International Value Fund | | 37 |
Supplemental Proxy Information
(Unaudited)
A meeting of the Fund’s shareholders was held on August 21, 2003. The meeting was held for the following purpose:
1. To approve the election of ten (10) directors to the Board of Directors, as follows:
| | • | | Douglas H. McCorkindale |
The result of the proxy solicitation of the Series’ on the preceding matter was:
Director
| | Votes For
| | Votes Against
| | Votes Withheld
| | Abstentions
|
David E.A. Carson | | 19,464,158 | | — | | 203,611 | | — |
Robert E. La Blanc | | 19,463,162 | | — | | 204,607 | | — |
Robert F. Gunia | | 19,464,033 | | — | | 203,736 | | — |
Douglas H.
McCorkindale | | 19,462,617 | | — | | 205,152 | | — |
Stephen P. Munn | | 19,465,108 | | — | | 202,661 | | — |
Richard A. Redeker | | 19,464,721 | | — | | 203,048 | | — |
Judy A. Rice | | 19,463,795 | | — | | 203,974 | | — |
Robin B. Smith | | 19,461,310 | | — | | 206,459 | | — |
Stephen Stoneburn | | 19,463,878 | | — | | 203,891 | | — |
Clay T. Whitehead | | 19,465,043 | | — | | 202,726 | | — |
2. To approve amendments to the Fund’s Articles of Incorporation.
The result of the proxy solicitation of the Series’ on the preceding matter was:
Matter
| | Votes For
| | Votes Against
| | Abstentions
|
Amendments to the Fund’s Articles of Incorporation | | 17,473,242 | | 168,577 | | 111,553 |
| 38 | | Visit our website at www.strategicpartners.com |
Management of the Fund
(Unaudited)
Information pertaining to the Directors of the Fund is set forth below. Directors who are not deemed to be “interested persons” of the Fund, as defined in the 1940 Act are referred to as “Independent Directors.” Directors who are deemed to be “interested persons” of the Fund are referred to as “Interested Directors.” “Fund Complex”† consists of the Fund and any other investment companies managed by Prudential Investments LLC (“PI”).
Independent Directors2
David E.A. Carson (69), Director since 20033 Oversees 99 portfolios in Fund complex
Principal occupations (last 5 years): Director (January 2000 to May 2000), Chairman (January 1999 to December 1999), Chairman and Chief Executive Officer (January 1998 to December 1998) and President, Chairman and Chief Executive Officer of People’s Bank (1983-1997).
Other Directorships held:4 Director of United Illuminating and UIL Holdings (utility company), since 1993.
Robert E. La Blanc (69), Director since 19843 Oversees 119 portfolios in Fund complex
Principal occupations (last 5 years): President (since 1981) of Robert E. La Blanc Associates, Inc. (telecommunications); formerly General Partner at Salomon Brothers and Vice-Chairman of Continental Telecom; Trustee of Manhattan College.
Other Directorships held:4 Director of Storage Technology Corporation (since 1979) (technology), Chartered Semiconductor Manufacturing, Ltd. (since 1998); Titan Corporation (electronics) (since 1995), Computer Associates International, Inc. (since 2002) (software company); FiberNet Telecom Group, Inc. (since 2003) (telecom company); Director (since April 1999) of the High Yield Plus Fund, Inc.
Douglas H. McCorkindale (64), Director since 20033 Oversees 101 portfolios in Fund complex
Principal occupations (last 5 years): Chairman (since February 2001), Chief Executive Officer (since June 2000) and President (since September 1997) of Gannett Co. Inc. (publishing and media); formerly Vice Chairman (March 1984-May 2000) of Gannett Co., Inc.
Other Directorships held:4 Director of Gannett Co. Inc., Director of Continental Airlines, Inc. (since May 1993); Director of Lockheed Martin Corp. (aerospace and defense) (since May 2001); Director of The High Yield Plus Fund, Inc. (since 1996).
Richard A. Redeker (60), Director since 20033 Oversees 102 portfolios in Fund complex
Principal occupations (last 5 years): Management Consultant; formerly employee of Prudential Investments (October 1996-December 1998); Director of Invesmart, Inc. (since 2001) and Director of Penn Tank Lines, Inc. (since 1999).
Other Directorships held:4 None.
Robin B. Smith (64), Director since 19963 Oversees 109 portfolios in Fund complex
Principal occupations (last 5 years): Chairman of the Board (since January 2003) of Publishers Clearing House (direct marketing), formerly Chairman and Chief Executive Officer (August 1996-January 2003) of Publishers Clearing House.
Other Directorships held:4 Director of BellSouth Corporation (since 1992).
| Prudential World Fund, Inc./Strategic Partners International Value Fund | | 39 |
Stephen Stoneburn (60), Director since 19963 Oversees 107 portfolios in Fund complex
Principal occupations (last 5 years): President and Chief Executive Officer (since June 1996) of Quadrant Media Corp. (a publishing company); formerly President (June 1995-June 1996) of Argus Integrated Media, Inc.; Senior Vice President and Managing Director (January 1993-1995) of Cowles Business Media and Senior Vice President of Fairchild Publications, Inc. (1975-1989).
Other Directorships held:4 None
Clay T. Whitehead (65), Director since 19843 Oversees 106 portfolios in Fund complex
Principal occupations (last 5 years): President (since 1983) of National Exchange Inc. (new business development firm).
Other Directorships held:4 Director (since 2000) of the High Yield Plus Fund, Inc.
Interested Trustees1
Judy A. Rice (55), President since 2003 and Director since 20003 Oversees 109 portfolios in Fund complex
Principal occupations (last 5 years): President, Chief Executive Officer, Chief Operating Officer and Officer-in-Charge (since 2003) of PI; Director, Officer-in-Charge, President, Chief Executive Officer and Chief Operating Officer (since May 2003) of American Skandia Advisory Services, Inc. and American Skandia Investment Services, Inc.; Director, Officer-in-Charge, President, Chief Executive Officer (since May 2003) of American Skandia Fund Services, Inc.; Vice President (since February 1999) of Prudential Investment Management Services LLC; President, Chief Executive Officer and Officer-in-Charge (since April 2003) of Prudential Mutual Fund Services LLC; formerly various positions to Senior Vice President (1992-1999) of Prudential Securities Incorporated (Prudential Securities); and various positions to Managing Director (1975-1992) of Salomon Smith Barney; Member of Board of Governors of the Money Management Institute.
Other Directorships held:4 None
Robert F. Gunia (57), Vice President and Director since 19963 Oversees 189 portfolios in Fund complex
Principal occupations (last 5 years): Chief Administrative Officer (since June 1999) of PI; Executive Vice President and Treasurer (since January 1996) of PI; President (since April 1999) of Prudential Investment Management Services LLC (PIMS); Corporate Vice President (since September 1997) of The Prudential Insurance Company of America (Prudential); Director, Executive Vice President and Chief Administrative Officer (since May 2003) of American Skandia Investment Services, Inc., American Skandia Advisory Services, Inc. and American Skandia Fund Services, Inc.; President (since April 1999) of Prudential Investment Management Services LLC; Executive Vice President (since March 1999) and Treasurer (since May 2000) of Prudential Mutual Fund Services LLC; formerly Senior Vice President (March 1987-May 1999) of Prudential Securities.
Other Directorships held:4 Vice President and Director (since May 1989) and Treasurer (since 1999) of The Asia Pacific Fund, Inc.
| 40 | | Visit our website at www.strategicpartners.com |
Information pertaining to the Officers of the Fund is set forth below.
Officers2
Marguerite E.H. Morrison (47), Chief Legal Officer since 2003 and Assistant Secretary since 20023
Principal occupations (last 5 years): Vice President and Chief Legal Officer—Mutual Funds and Unit Investment Trust (since August 2000) of Prudential; Senior Vice President and Secretary (since April 2003) of PI; Senior Vice President and Secretary (since May 2003) of American Skandia Investment Services, Inc., American Skandia Advisory Services, Inc. and American Skandia Fund Services, Inc.; Vice President and Assistant Secretary of PIMS (since October 2001), previously Senior Vice President and Assistant Secretary (February 2001-April 2003) of PI, Vice President and Associate General Counsel (December 1996-February 2001) of PI.
Maryanne Ryan (39), Anti-Money Laundering Compliance Officer since 20023
Principal occupations (last 5 years): Vice President, Prudential (since November 1998), First Vice President, Prudential Securities (March 1997-May 1998); Anti-Money Laundering Compliance Officer (since 2003) of American Skandia Investment Services, Inc., American Skandia Advisory Services, Inc. and American Skandia Marketing, Inc.
Jonathan D. Shain (45), Secretary since 20013
Principal occupations (last 5 years): Vice President and Corporate Counsel (since August 1998) of Prudential; Vice President and Assistant Secretary (since May 2003) of American Skandia Investment Services, Inc. and American Skandia Fund Services, Inc.; formerly Attorney with Fleet Bank, N.A. (January 1997-July 1998).
Grace C. Torres (44), Treasurer and Principal Financial and Accounting Officer since 19953
Principal occupations (last 5 years): Senior Vice President (since January 2000) of PI, Senior Vice President and Assistant Treasurer (since May 2003) of American Skandia Investment Services, Inc. and American Skandia Advisory Services, Inc.; formerly First Vice President (December 1996-January 2000) of PI and First Vice President (March 1993-1999) of Prudential Securities.
| † | The Fund Complex consists of all investment companies managed by PI. The Funds for which PI serves as manager include JennisonDryden Mutual Funds, Strategic Partners Funds, American Skandia Advisor Funds, Inc., The Prudential Variable Contract Accounts 2, 10, 11, The Target Portfolio Trust, The Prudential Series Fund, Inc., American Skandia Trust, and Prudential’s Gibraltar Fund. |
| 1 | “Interested” Director, as defined in the 1940 Act, by reason of employment with the Manager, (Prudential Investments LLC or PI), the Subadvisers (Prudential Investment Management, Inc. or PIM), (Bank of Ireland Asset Management (U.S.) Limited or BIAM) or (Jennison Associations LLC or Jennison) or the Distributor (Prudential Investment Management Services LLC or PIMS). |
| 2 | Unless otherwise noted, the address of the Directors and Officers is c/o: Prudential Investments LLC, Gateway Center Three, 100 Mulberry Street, Newark, NJ 07102. |
| 3 | There is no set term of office for Directors and Officers. The Independent Trustees have adopted a retirement policy, which calls for the retirement of Trustees on December 31 of the year in which they reach the age of 75. The table shows the individuals length of service as Trustee and/or Officer. |
| 4 | This column includes only directorships of companies requested to register, or file reports with the SEC under the Securities and Exchange Act of 1934 (that is, “public companies”) or other investment companies registered under the 1940 Act. |
Additional information about the Fund’s Trustees is included in the Fund’s Statement of Additional Information which is available without charge, upon request, by calling (800) 521-7466 or (732) 482-7555 (Calling from outside the U.S.)
| Prudential World Fund, Inc./Strategic Partners International Value Fund | | 41 |
Growth of a $10,000 Investment
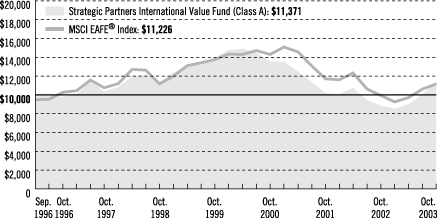
|
| Average Annual Total Returns (With Sales Charges) as of 10/31/03 | |
| | | One Year | | | Five Years | | | Ten Years | | | Since Inception | |
Class A | | 8.72 | % | | –0.66 | % | | N/A | | | 1.82 | % |
|
Class B | | 8.64 | | | –0.58 | | | N/A | | | 1.78 | |
|
Class C | | 11.49 | | | –0.58 | | | N/A | | | 1.65 | |
|
Class Z | | 14.76 | | | 0.61 | | | 5.11 | % | | 7.14 | |
|
| | | | | | | | | | | | | |
|
| Average Annual Total Returns (Without Sales Charges) as of 10/31/03 | |
| | | One Year | | | Five Years | | | Ten Years | | | Since Inception | |
Class A | | 14.44 | % | | 0.36 | % | | N/A | | | 2.56 | % |
|
Class B | | 13.64 | | | –0.41 | | | N/A | | | 1.78 | |
|
Class C | | 13.62 | | | –0.38 | | | N/A | | | 1.80 | |
|
Class Z | | 14.76 | | | 0.61 | | | 5.11 | % | | 7.14 | |
|
Past performance is not indicative of future results. Principal value and investment return will fluctuate so that an investor’s shares, when redeemed, may be worth more or less than their original cost. Source: Prudential Investments LLC and Lipper Inc. Inception dates: Class A, B, and C, 9/23/96; and Class Z, 11/5/92.
The graph compares a $10,000 investment in the Strategic Partners International Value Fund (Class A shares) with a similar investment in the MSCI EAFE® Index by portraying the initial account values at the commencement of operations of Class A shares (September 23, 1996) and the account values at the end of the current fiscal year (October 31, 2003) as measured on a quarterly basis. For purposes of the graph, and unless otherwise indicated, it has been assumed that (a) the maximum applicable front-end sales charge was deducted from the initial $10,000 investment in Class A shares; (b) all recurring fees (including management fees) were deducted; and (c) all dividends and distributions were reinvested. The line graph provides information for Class A shares only. As indicated in the tables provided earlier, performance for Class B, C, and Z shares will vary due to the differing charges and expenses applicable to each share class (as indicated in the following paragraphs).
| Visit our website at www.strategicpartners.com | | |
Without a contractual distribution and service (12b-1) fee waiver of 0.05% for Class A shares through October 31, 2003, the returns shown in the graph and for Class A shares in the tables would have been lower.
The MSCI EAFE® is an unmanaged, weighted index of performance that reflects stock price movements of developed-country markets in Europe, Australasia, and the Far East. The MSCI EAFE® Index’s total returns include the reinvestment of all dividends, but do not include the effects of sales charges, operating expenses of a mutual fund, or taxes. These returns would be lower if they included the effects of sales charges, operating expenses, or taxes. The securities that comprise the MSCI EAFE® Index may differ substantially from the securities in the Fund. The MSCI EAFE® Index is not the only index that may be used to characterize performance of international stock funds. Other indexes may portray different comparative performance. Investors cannot invest directly in an index.
The Fund charges a maximum front-end sales charge of 5% for Class A shares in most circumstances, and a 12b-1 fee of up to 0.30% annually. In some circumstances, Class A shares may not be subject to a front-end sales charge, but may be subject to a 1% contingent deferred sales charge (CDSC) for the first year. Class B shares are subject to a declining CDSC of 5%, 4%, 3%, 2%, 1%, and 1% respectively for the first six years after purchase and a 12b-1 fee of 1% annually. Approximately seven years after purchase, Class B shares will automatically convert to Class A shares on a quarterly basis. Class C shares are subject to a front-end sales charge of 1%, a CDSC of 1% for shares redeemed within 18 months of purchase, and a 12b-1 fee of 1% annually. The returns in the graph and the tables do not reflect the deduction of taxes that a shareholder would pay on Fund distributions or following the redemption of Fund shares.
| | | Prudential World Fund, Inc./Strategic Partners International Value Fund |
| | |
| n MAIL | | n TELEPHONE | | n WEBSITE |
Gateway Center Three 100 Mulberry Street Newark, NJ 07102 | | (800) 225-1852 | | www.strategicpartners.com |
| DIRECTORS |
David E.A. Carson•Robert F. Gunia•Robert E. La Blanc•Douglas H. McCorkindale •
Richard A. Redeker•Judy A. Rice•Robin B. Smith•Stephen D. Stoneburn•Clay T. Whitehead |
| |
| OFFICERS |
| Judy A. Rice, President•Robert F. Gunia, Vice President•Grace C. Torres, Treasurer and Principal Financial and Accounting Officer•Marguerite E.H. Morrison, Chief Legal Officer and Assistant Secretary•Jonathan D. Shain, Secretary•Maryanne Ryan, Anti-Money Laundering Compliance Officer |
| MANAGER | | Prudential Investments LLC | | Gateway Center Three
100 Mulberry Street
Newark, NJ 07102 |
|
| INVESTMENT ADVISER | | Bank of Ireland
Asset Management
(U.S.) Limited | | 75 Holly Hill Lane
Greenwich, CT 06830
|
|
| DISTRIBUTOR | | Prudential Investment
Management Services LLC | | Gateway Center Three
14th Floor
100 Mulberry Street
Newark, NJ 07102 |
|
| CUSTODIAN | | State Street Bank
and Trust Company | | One Heritage Drive
North Quincy, MA 02171 |
|
| TRANSFER AGENT | | Prudential Mutual Fund
Services LLC | | PO Box 8098
Philadelphia, PA 19101 |
|
| INDEPENDENT AUDITORS | | PricewaterhouseCoopers LLP | | 1177 Avenue of the
Americas
New York, NY 10036 |
|
| FUND COUNSEL | | Sullivan & Cromwell LLP | | 125 Broad Street
New York, NY 10004 |
| | |
| Strategic Partners International Value Fund | | | | |
| | | Share Class | | A | | B | | C | | Z | | |
| | | | | | |
| | | Nasdaq | | PISAX | | PISBX | | PCISX | | PISZX | | |
| | | | | | |
| | | CUSIP | | 743969503 | | 743969602 | | 743969701 | | 743969800 | | |
| | | | | | | | | | | | | |
Mutual Funds:
| ARE NOT INSURED BY THE FDIC OR ANY FEDERAL GOVERNMENT AGENCY | | MAY LOSE VALUE | | ARE NOT A DEPOSIT OF OR GUARANTEED BY ANY BANK OR ANY BANK AFFILIATE |

| | | |
| Strategic Partners International Value Fund | | | | | | |
| | | Share Class | | A | | B | | C | | Z | | |
| | | | | | |
| | | Nasdaq | | PISAX | | PISBX | | PCISX | | PISZX | | |
| | | CUSIP | | 743969503 | | 743969602 | | 743969701 | | 743969800 | | |
| | | | | | | | | | | | | |
MFSP115E3 IFS-AO86510
Item 2 – Code of Ethics – See Exhibit (a)
As of the end of the period covered by this report, the registrant has adopted a code of ethics (the “Section 406 Standards for Investment Companies — Ethical Standards for Principal Executive and Financial Officers”) that applies to the registrant’s Principal Executive Officer and Principal Financial Officer; the registrant’s Principal Financial Officer also serves as the Principal Accounting Officer.
The registrant hereby undertakes to provide any person, without charge, upon request, a copy of the code of ethics. To request a copy of the code of ethics, contact the registrant at (973) 802-6469, and ask for a copy of the Section 406 Standards for Investment Companies – Ethical Standards for Principal Executive and Financial Officers.
Item 3 – Audit Committee Financial Expert –
Stephen Munn had been designated as the Fund’s Audit Committee Financial Expert, however, he resigned as a Director of the Fund effective November 30, 2003 and the Fund’s board is in the process of selecting a new designee.
Item 4 – Principal Accountant Fees and Services – Not required in this filing
Item 5 – Reserved
Item 6 – Reserved
Item 7 – Disclosure of Proxy Voting Policies and Procedures for Closed-End Management Investment Companies – Not required in this filing
Item 8 – Reserved
Item 9 – Controls and Procedures
(a) It is the conclusion of the registrant’s principal executive officer and principal financial officer that the effectiveness of the registrant’s current disclosure controls and procedures (such disclosure controls and procedures having been evaluated within 90 days of the date of this filing) provide reasonable assurance that the information required to be disclosed by the registrant has been recorded, processed, summarized and reported within the time period specified in the Commission’s rules and forms and that the information required to be disclosed by the registrant has been accumulated and communicated to the registrant’s principal executive officer and principal financial officer in order to allow timely decisions regarding required disclosure.
(b) There have been no significant changes in the registrant’s internal controls or in other factors that could significantly affect these controls subsequent to the date of their evaluation, including any corrective actions with regard to significant deficiencies and material weaknesses.
Item 10 – Exhibits
(a) Code of Ethics – Attached hereto
(b) Certifications pursuant to Sections 302 and 906 of the Sarbanes-Oxley Act – Attached hereto
SIGNATURES
Pursuant to the requirements of the Securities Exchange Act of 1934 and the Investment Company Act of 1940, the registrant has duly caused this report to be signed on its behalf by the undersigned, thereunto duly authorized.
(Registrant) | | Prudential World Fund, Inc. |
| |
By (Signature and Title)* | | /s/ Jonathan D. Shain
|
| | | Jonathan D. Shain |
| | | Secretary |
| |
Date | | December 22, 2003 |
Pursuant to the requirements of the Securities Exchange Act of 1934 and the Investment Company Act of 1940, this report has been signed below by the following persons on behalf of the registrant and in the capacities and on the dates indicated.
By (Signature and Title)* | | /s/ Judy A. Rice
|
| | | Judy A. Rice |
| | | President and Principal Executive Officer |
| |
Date | | December 22, 2003 |
| |
By (Signature and Title)* | | /s/ Grace C. Torres
|
| | | Grace C. Torres |
| | | Treasurer and Principal Financial Officer |
| |
Date | | December 22, 2003 |
| * | Print the name and title of each signing officer under his or her signature. |