UNITED STATES
SECURITIES AND EXCHANGE COMMISSION
Washington, D.C. 20549
FORM N-CSR
CERTIFIED SHAREHOLDER REPORT OF REGISTERED MANAGEMENT
INVESTMENT COMPANIES
Investment Company Act file number: | 811-03981 | |
Exact name of registrant as specified in charter: | Prudential World Fund, Inc. | |
Address of principal executive offices: | Gateway Center 3, | |
| 100 Mulberry Street, | ||
| Newark, New Jersey 07102 | ||
Name and address of agent for service: | Deborah A. Docs | |
| Gateway Center 3, | ||
| 100 Mulberry Street, | ||
| Newark, New Jersey 07102 | ||
Registrant’s telephone number, including area code: | 973-367-7521 | |
Date of fiscal year end: | 10/31/2005 | |
Date of reporting period: | 10/31/2005 | |
Item 1 – Reports to Stockholders – [ INSERT REPORT ]

Jennison Global Growth Fund
| October 31, 2005 | ANNUAL REPORT |

FUND TYPE
Global stock
OBJECTIVE
Long-term growth of capital
This report is not authorized for distribution to prospective investors unless preceded or accompanied by a current prospectus.
The views expressed in this report and information about the Fund’s portfolio holdings are for the period covered by this report and are subject to change thereafter.
JennisonDryden is a registered trademark of The Prudential Insurance Company of America.

December 15, 2005
Dear Shareholder:
We hope you find the annual report for the Jennison Global Growth Fund, a series of Prudential World Fund, Inc., informative and useful. As a JennisonDryden mutual fund shareholder, you may be thinking about where you can find additional growth opportunities. You could invest in last year’s top-performing asset class and hope that history repeats itself or you could stay in cash while waiting for the “right moment” to invest.
Instead, we believe it is better to take advantage of developing domestic and global investment opportunities through a diversified portfolio of stock and bond mutual funds. A diversified asset allocation offers two potential advantages. It helps you manage downside risk by not being overly exposed to any particular asset class, plus it gives you a better opportunity to have at least some of your assets in the right place at the right time. Your financial professional can help you create a diversified investment plan that may include mutual funds covering all the basic asset classes and that reflects your personal investor profile and tolerance for risk.
JennisonDryden Mutual Funds gives you a wide range of choices that can help you make progress toward your financial goals. Our funds offer the experience, resources, and professional discipline of three leading asset managers. They are recognized and respected in the institutional market and by discerning investors for excellence in their respective strategies. JennisonDryden equity funds are advised by Jennison Associates LLC and Quantitative Management Associates LLC (QMA). Prudential Investment Management, Inc. (PIM) advises the JennisonDryden fixed income and money market funds. Jennison Associates, QMA, and PIM are registered investment advisers and Prudential Financial companies.
Thank you for choosing JennisonDryden Mutual Funds.
Sincerely,

Judy A. Rice, President
Jennison Global Growth Fund
| Jennison Global Growth Fund | 1 |
Your Fund’s Performance
Fund objective
The investment objective of the Jennison Global Growth Fund (the Fund) is long-term growth of capital. There can be no assurance that the Fund will achieve its investment objective.
Performance data quoted represent past performance. Past performance does not guarantee future results. The investment return and principal value of an investment will fluctuate, so that an investor’s shares, when redeemed, may be worth more or less than their original cost. Current performance may be lower or higher than the past performance data quoted. An investor may obtain performance data as of the most recent month-end by visiting our website at www.jennisondryden.com or by calling (800) 225-1852. The maximum initial sales charge is 5.50% (Class A shares).
| Cumulative Total Returns1 as of 10/31/05 | |||||||||||
| One Year | Five Years | Ten Years | Since Inception2 | ||||||||
Class A | 18.36 | % | –9.69 | % | 81.12 | % | 180.81% | ||||
Class B | 17.82 | –12.18 | 70.18 | 590.36 (575.93) | |||||||
Class C | 17.51 | –12.86 | 68.51 | 83.21 | |||||||
Class Z | 18.72 | –8.60 | N/A | 78.07 | |||||||
MSCI World Index3 | 13.27 | 0.65 | 98.94 | *** | |||||||
Lipper Global Large-Cap Growth Funds Avg.4 | 12.32 | –15.89 | 82.81 | **** | |||||||
| Average Annual Total Returns1 as of 9/30/05 | |||||||||||
| One Year | Five Years | Ten Years | Since Inception2 | ||||||||
Class A | 16.36 | % | –3.57 | % | 5.47 | % | 6.53% | ||||
Class B | 17.52 | –3.20 | 5.40 | 9.54 | |||||||
Class C | 21.21 | –3.18 | 5.30 | 5.73 | |||||||
Class Z | 23.46 | –2.26 | N/A | 6.37 | |||||||
MSCI World Index3 | 18.93 | 0.28 | 7.21 | *** | |||||||
Lipper Global Large-Cap Growth Funds Avg.4 | 18.03 | –4.10 | 6.12 | **** | |||||||
The cumulative total returns do not reflect the deduction of applicable sales charges. If reflected, the applicable sales charges would reduce the cumulative total returns performance quoted. Class A shares are subject to a maximum front-end sales charge of 5.50%. Under certain circumstances, Class A shares may be subject to a contingent deferred sales charge (CDSC) of 1%. Class B and Class C shares are subject to a maximum CDSC of 5% and 1% respectively. Class Z shares are not subject to a sales charge.
| 2 | Visit our website at www.jennisondryden.com |
1Source: Prudential Investments LLC and Lipper Inc. The average annual total returns take into account applicable sales charges. During certain periods shown, fee waivers and/or expense reimbursements were in effect. Without such fee waivers and expense reimbursements, the returns for the share classes would have been lower, as indicated in parentheses. Class A, Class B, and Class C shares are subject to an annual distribution and service (12b-1) fee of up to 0.30%, 1.00%, and 1.00% respectively. Approximately seven years after purchase, Class B shares will automatically convert to Class A shares on a quarterly basis. Class Z shares are not subject to a 12b-1 fee. The returns in the tables do not reflect the deduction of taxes that a shareholder would pay on Fund distributions or following the redemption of Fund shares.
2Inception dates: Class A, 1/22/90; Class B, 5/15/84; Class C, 8/1/94; and Class Z, 3/1/96.
3The Morgan Stanley Capital International (MSCI) World Index is an unmanaged, weighted index of performance that reflects the stock price movement in securities listed on the stock exchanges of Australia, Canada, Europe, the Far East, and the United States.
4The Lipper Global Large-Cap Growth Funds Average (Lipper Average) represents returns based on an average return of all funds in the Lipper Global Large-Cap Growth Funds category. Funds in the Lipper Average invest at least 75% of their equity assets in companies both inside and outside the United States with market capitalizations (on a three-year weighted basis) greater than the 500th largest company in the S&P/Citigroup World Broad Market Index (BMI). Large-cap growth funds typically have an above-average price-to-cash flow ratio, price-to-book ratio, and three-year sales-per-share growth value compared to the S&P/Citigroup World BMI.
Investors cannot invest directly in an index. The returns for the MSCI World Index and the Lipper Average would be lower if they included the effects of sales charges, operating expenses of a mutual fund, or taxes. Returns for the Lipper Average reflect the deduction of operating expenses of a mutual fund, but not sales charges or taxes.
***MSCI World Index Closest Month-End to Inception cumulative total returns as of 10/31/05 are 183.45% for Class A, 885.35% for Class B, 124.53% for Class C, and 82.52% for Class Z. MSCI World Index Closest Month-End to Inception average annual total returns as of 9/30/05 are 7.04% for Class A, 11.45% for Class B, 7.75% for Class C, and 6.75% for Class Z.
****Lipper Average Closest Month-End to Inception cumulative total returns as of 10/31/05 are 178.29% for Class A, 608.29% for Class B, 103.45% for Class C, and 69.50% for Class Z. Lipper Average Closest Month-End to Inception average annual total returns as of 9/30/05 are 6.85% for Class A, 9.69% for Class B, 6.71% for Class C, and 5.81% for Class Z.
| Five Largest Holdings expressed as a percentage of net assets as of 10/31/05 | |||
Total S.A., Oil, Gas & Consumable Fuels | 2.7 | % | |
Roche Holding AG-ADR, Pharmaceuticals | 2.5 | ||
Google, Inc. (Class A), Internet Software & Services | 2.2 | ||
TXU Corp., Independent Power Producers & Energy Traders | 2.0 | ||
UBS AG, Capital Markets | 2.0 |
Holdings are subject to change.
| Five Largest Industries expressed as a percentage of net assets as of 10/31/05 | |||
Commercial Banks | 9.5 | % | |
Oil, Gas & Consumable Fuels | 6.8 | ||
Pharmaceuticals | 6.0 | ||
Chemicals | 4.3 | ||
Food & Staples Retailing | 4.3 |
Industry weightings are subject to change.
| Jennison Global Growth Fund | 3 |
Investment Subadviser’s Report
Jennison Associates LLC
The investing environment turned favorable
The 12 months ended October 31, 2005, presented a strong market for global stocks and an improved environment for growth investing. The Fund not only reflected these advantages, but delivered substantial outperformance.
A stream of positive corporate earnings reports reflected an upward trend in global economic growth. In general, companies that reported positive results and outlooks were rewarded with rising share prices and those with disappointing performances traded lower. After a prolonged period in which markets clearly favored the value style, investors began to seek companies with the potential to deliver sustainable earnings growth instead of cyclical earnings. This was the turn that growth investors have long been awaiting.
Turning points and unexpected events marked the period
The latter part of the Fund’s fiscal year was marked by a series of disruptive events that included the London train bombings in early July and hurricanes Katrina and Rita in late August and mid-September. Although the economic fallout from the terrorist attacks was minimal, the Gulf Coast storms produced lingering economic effects, most immediately reflected in further sharp price rises in refined petroleum products and natural gas. The storm damage brought home the facts that energy prices are unlikely to fall soon and that U.S. consumers will therefore have less money to spend on other things. Industrial users of oil and gas also may be squeezed by higher prices and have begun to lower earnings guidance. Some observers expected the U.S. Federal Reserve to respond to these economic stresses by pausing in its sequence of interest-rate hikes, but instead it stayed with its well-articulated plan of tightening short-term rates in quarter-point increments.
The Asia Pacific region was dominated by news in China and Japan. Throughout the fiscal year we continued to see headlines suggesting decelerating growth in China. However, China added substantially to its stock of productive capacity in the past year, and the latest data show the Chinese economy to be stable or accelerating again. China’s revaluation of the yuan in mid-July was a significant change of policy, but the impact proved quite small. Elections in Japan demonstrated a surprisingly large mandate for Prime Minister Koizumi’s platform of structural reform. We believe that this is a significant positive development for the Japanese economy since it will no longer have to fight the headwind of misallocated government resources. Evidence also is growing that the Japanese economy is expanding again and may no longer face the deflation that has depressed its growth since the early 1990s.
| 4 | Visit our website at www.jennisondryden.com |
Europe faced the apparent demise of the European Union constitution and the German election stalemate, which maintained the status quo and dashed hopes that Europe would move to a more unified and market-driven economy. In addition, consumer activity in the United Kingdom slowed.
Positive contributions from most sectors and regions
Despite these events, global equity markets reacted with calm, ending the reporting period higher. Corporate profit growth remained healthy, reflecting revenue gains and sustained high profitability in most major sectors. This environment was favorable for our style of growth investing. Stock selection was particularly strong within the information technology sector, but the Fund’s holdings in the healthcare, energy, financials, industrials, and consumer discretionary sectors also outperformed the comparable sectors of the MSCI World Index. Holdings in the telecommunications services sector slightly underperformed. On a regional basis, strength was concentrated in the United States, Switzerland, and Japan.
Positions in Google and Apple Computer made significant contributions to the Fund’s return in the Information Technology sector. Google has had tremendous revenue growth from sponsored search queries. Apple Computer continues to experience robust revenue growth from iPod and Macintosh sales. Its shares were further lifted as the company expanded the iPod line with the introduction of the ultra-slim iPod Nano.
Holdings in the healthcare sector moved higher following positive earnings reports and promising clinical trial and/or regulatory developments. Leading contributors included Swiss pharmaceutical company Roche Holding, which has a substantial pipeline of cancer treatments and makes influenza vaccines that have been much in demand because of the threat of avian flu, and Swiss eye care company Alcon. Roche reported a series of clinical trial successes for its Avastin and Herceptin cancer drugs. Alcon received FDA approval for Restor, an implantable contact lens for cataract patients.
In the energy sector, rising commodity prices pushed up the share prices of oil producers Suncor Energy and Total, as well as drilling services company Schlumberger.
Chico’s was a leading consumer discretionary performer. It continued to post strong results on the heels of increased same-store sales and growth from an emerging brand, White House/Black Market.
The Fund’s Japanese stocks benefited from early signs of economic expansion and from the sweeping mandate for economic reform. Real estate developer Sumitomo Realty and Development benefited from this, as did distribution company Mitsubishi. Mitsubishi also has large energy holdings and exposure to China.
| Jennison Global Growth Fund | 5 |
Investment Subadviser’s Report (continued)
A small number of holdings detracted
Generic drug manufacturer IVAX was the principal detractor from the Fund’s return largely because it lost a patent challenge against Eli Lilly & Co. Since this removed an important driver of IVAX’s growth, we sold the position. Spanish-language broadcaster Univision Communications was hurt by disappointing advertising revenues; we sold our position. Mercury Interactive, which makes software to test Internet-based applications, also hurt performance. Investors were concerned about its slowing growth. Shares of Kingfisher, the leader in the U.K. home-improvement market, were weak following several disappointing earnings reports. In our view the company’s strategy of keeping prices low during the current consumer downturn to increase its market share is wise. This may reduce short-term profits, but we believe it may lead to a greater long-term advantage.
Looking ahead
The current expansion has proven remarkably resilient to shocks. Although we are optimistic that disruptions can be weathered without significantly weakening the long-term underpinnings of growth, we believe that added caution is warranted. Our primary focus remains identifying companies that have advantages such as strong management or unique products that can lead to above-average earnings growth.
As the reporting period ended, we reduced the Fund’s energy weighting because we believe that most of the short-term news about high energy prices has been priced into these stocks. Long term, energy prices may remain higher than most expect, and the position may be rebuilt. We believe that the impact of energy prices will be felt more acutely in the United States than elsewhere, potentially leading to a slowdown in consumer spending. Consequently, the Fund’s U.S. consumer discretionary exposure was reduced in favor of European and Japanese consumer discretionary stocks exhibiting what we believe to be compelling valuations and growth prospects. We have added to U.S. utilities and retain the Fund’s positioning among export-oriented industrial companies in Europe and to companies like Monsanto, which are not closely tied to the general business cycle. In Asia the Fund remains exposed to China through Hong Kong, but we are waiting for more clarity on the course of interest rates before increasing the weightings. The Fund is also overweight in Japan in anticipation of further economic growth that may result from continued political reform.
The Portfolio of Investments following this report shows the size of the Fund’s positions at period-end.
| 6 | Visit our website at www.jennisondryden.com |
Comments on Largest Holdings
Holdings expressed as a percentage of the Fund’s net assets as of 10/31/05.
| 2.7% | Total S.A./Oil, Gas & Consumable Fuels |
Total is France’s largest oil company. It is an integrated oil company that explores for, produces, refines, and markets crude oil and finished products in more than 100 countries. The company also operates a chain of service stations primarily in Europe and Africa. It has benefited from continued strength in crude oil prices.
| 2.5% | Roche Holding AG-ADR/Pharmaceuticals |
Roche is a Switzerland-based pharmaceutical company with a robust and promising portfolio of oncology drugs, and is also the manufacturer of the influenza vaccine Tamiflu.
| 2.2% | Google, Inc./Internet Software & Services |
Internet search engine Google has achieved tremendous growth through its sponsored search and branded advertising services.
| 2.0% | TXU Corp./Independent Power Producers & Energy Traders |
This Texas-based utility’s corporate restructuring has led to strong growth. We believe that TXU’s rapid corporate transformation will create an integrated energy merchant with superior earnings growth potential, free cash flow generation, and financial flexibility. As a power provider that generates 45% of its supply from coal-fired and nuclear plants, TXU stands to benefit from expanding margins as power prices are driven higher by natural gas prices while its production costs remain relatively low.
| 2.0% | UBS AG/Capital Markets |
UBS AG is a Switzerland-based global banking services firm, providing private wealth management, consumer banking services, investment banking, and asset management. UBS has benefited from increased activity in the capital markets.
Holdings are subject to change.
| Jennison Global Growth Fund | 7 |
Jennison Associates
A specialist in actively managed equity portfolios, Jennison Associates has proven expertise in growth, value, and blend styles across market capitalizations in the United States and abroad.
Jennison Associates has earned a reputation for excellence by fulfilling client needs for more than 35 years. Its approach combines internal fundamental research, a disciplined investment process, and the experience and judgment of its portfolio managers and analysts.
Jennison’s investment teams focus on specific product areas, with analysts organized by industry and sector. All of its investment professionals meet every morning to share information and insights, which ensures that Jennison’s clients benefit from the deep resources and experience of the entire organization.
A disciplined approach to investing has driven Jennison’s long-term record of success, leading to a loyal customer base that ranges from individual investors to many of today’s largest corporations and institutions.
| 8 | Visit our website at www.jennisondryden.com |
Fees and Expenses (Unaudited)
As a shareholder of the Fund, you incur two types of costs: (1) transaction costs, including sales charges (loads) on purchase payments and redemptions, as applicable, and (2) ongoing costs, including management fees, distribution and/or service (12b-1) fees, and other Fund expenses, as applicable. This example is intended to help you understand your ongoing costs (in dollars) of investing in the Fund and to compare these costs with the ongoing costs of investing in other mutual funds.
The example is based on an investment of $1,000 invested on May 1, 2005, at the beginning of the period, and held through the six-month period ended October 31, 2005.
The Fund’s transfer agent may charge additional fees to holders of certain accounts that are not included in the expenses shown in the table on the following page. These fees apply to Individual Retirement Accounts (IRAs) and Section 403(b) accounts. As of the close of the six-month period covered by the table, IRA fees included an annual maintenance fee of $15 per account (subject to a maximum annual maintenance fee of $25 for all accounts held by the same shareholder). Section 403(b) accounts are charged an annual $25 fiduciary maintenance fee. Some of the fees may vary in amount, or may be waived, based on your total account balance or the number of JennisonDryden or Strategic Partners Funds, including the Fund, that you own. You should consider the additional fees that were charged to your Fund account over the six-month period when you estimate the total ongoing expenses paid over the period and the impact of these fees on your ending account value, as these additional expenses are not reflected in the information provided in the expense table. Additional fees have the effect of reducing investment returns.
Actual Expenses
The first line for each share class in the table on the following page provides information about actual account values and actual expenses. You may use the information on this line, together with the amount you invested, to estimate the expenses that you paid over the period. Simply divide your account value by $1,000 (for example, an $8,600 account value ÷ $1,000 = 8.6), then multiply the result by the number on the first line under the heading “Expenses Paid During the Six-Month Period” to estimate the expenses you paid on your account during this period.
Hypothetical Example for Comparison Purposes
The second line for each share class in the table on the following page provides information about hypothetical account values and hypothetical expenses based on the Fund’s actual expense ratio and an assumed rate of return of 5% per year before expenses, which is not the Fund’s actual return. The hypothetical account values and
| Jennison Global Growth Fund | 9 |
Fees and Expenses (continued)
expenses may not be used to estimate the actual ending account balance or expenses you paid for the period. You may use this information to compare the ongoing costs of investing in the Fund and other funds. To do so, compare this 5% hypothetical example with the 5% hypothetical examples that appear in the shareholder reports of the other funds.
Please note that the expenses shown in the table are meant to highlight your ongoing costs only, and do not reflect any transactional costs such as sales charges (loads). Therefore the second line for each share class in the table is useful in comparing ongoing costs only, and will not help you determine the relative total costs of owning different funds. In addition, if these transactional costs were included, your costs would have been higher.
| Jennison Global Growth Fund | Beginning Account May 1, 2005 | Ending Account October 31, 2005 | Annualized Expense Ratio Based on the Six-Month Period | Expenses Paid During the Six- Month Period* | ||||||||||
| Class A | Actual | $ | 1,000.00 | $ | 1,138.03 | 1.45 | % | $ | 7.81 | |||||
| Hypothetical | $ | 1,000.00 | $ | 1,017.90 | 1.45 | % | $ | 7.38 | ||||||
| Class B | Actual | $ | 1,000.00 | $ | 1,135.30 | 1.95 | % | $ | 10.50 | |||||
| Hypothetical | $ | 1,000.00 | $ | 1,015.38 | 1.95 | % | $ | 9.91 | ||||||
| Class C | Actual | $ | 1,000.00 | $ | 1,133.89 | 2.20 | % | $ | 11.83 | |||||
| Hypothetical | $ | 1,000.00 | $ | 1,014.12 | 2.20 | % | $ | 11.17 | ||||||
| Class Z | Actual | $ | 1,000.00 | $ | 1,139.49 | 1.20 | % | $ | 6.47 | |||||
| Hypothetical | $ | 1,000.00 | $ | 1,019.16 | 1.20 | % | $ | 6.11 | ||||||
* Fund expenses (net of fee waivers or subsidies, if any) for each share class are equal to the annualized expense ratio for each share class (provided in the table), multiplied by the average account value over the period, multiplied by the 184 days in the six-month period ended October 31, 2005, and divided by the 365 days in the Fund’s fiscal year ended October 31, 2005 (to reflect the six-month period).
| 10 | Visit our website at www.jennisondryden.com |
Portfolio of Investments
as of October 31, 2005
| Shares | Description | Value (Note 1) | |||
LONG-TERM INVESTMENTS 99.2% | |||||
COMMON STOCKS | |||||
Austria 1.1% | |||||
| 47,200 | Erste Bank der Oesterreichischen Sparkassen AG | $ | 2,455,004 | ||
| 30,300 | Raiffeisen International Bank-Holding AG 144A(a) | 1,906,437 | |||
| 4,361,441 | |||||
France 5.7% | |||||
| 46,000 | Sanofi-Aventis | 3,682,602 | |||
| 74,700 | Schneider Electric SA | 6,136,893 | |||
| 42,553 | Total SA | 10,678,921 | |||
| 48,500 | Veolia Environnement | 2,018,678 | |||
| 22,517,094 | |||||
Germany 3.3% | |||||
| 109,500 | Metro AG | 4,955,262 | |||
| 79,300 | RWE AG | 5,043,625 | |||
| 42,654 | Siemens AG | 3,166,296 | |||
| 13,165,183 | |||||
Hong Kong 1.2% | |||||
| 236,300 | Cheung Kong Holdings Ltd. | 2,468,322 | |||
| 157,000 | Esprit Holdings Ltd. | 1,112,247 | |||
| 185,500 | Esprit Holdings Ltd. 144A | 1,314,151 | |||
| 4,894,720 | |||||
Ireland 1.7% | |||||
| 491,950 | Anglo Irish Bank Corp. PLC | 6,662,234 | |||
Italy 0.6% | |||||
| 93,867 | Eni SpA | 2,515,389 | |||
Japan 15.2% | |||||
| 86,300 | Credit Saison Co. Ltd. | 3,915,485 | |||
| 152,900 | JFE Holdings, Inc. | 4,749,670 | |||
| 316,000 | Mitsubishi Corp. | 6,145,025 | |||
| 311,000 | Mitsubishi Estate Co. Ltd. | 4,597,400 | |||
| 459 | Mitsubishi Tokyo Financial Group, Inc. | 5,768,919 | |||
| 365,000 | Mitsui & Co. Ltd. | 4,481,753 | |||
| 130,000 | Nishimatsuya Chain Co. Ltd. | 4,942,710 | |||
| 463,000 | Nissan Chemical Industries Ltd. | 5,393,441 | |||
| 541,400 | Nissan Motor Co. Ltd. | 5,675,848 | |||
See Notes to Financial Statements.
| Jennison Global Growth Fund | 11 |
Portfolio of Investments
as of October 31, 2005 Cont’d.
| Shares | Description | Value (Note 1) | |||
| 291,400 | Shizuoka Bank Ltd. (The) | $ | 3,060,116 | ||
| 447,000 | Sumitomo Realty & Development Co. Ltd. | 7,231,194 | |||
| 339,000 | Suruga Bank Ltd. (The) | 4,139,689 | |||
| 60,101,250 | |||||
Netherlands 0.7% | |||||
| 71,400 | TomTom NV 144A(a) | 2,749,346 | |||
Spain 2.8% | |||||
| 348,884 | Banco Bilbao Vizcaya Argentaria SA | 6,150,554 | |||
| 316,682 | Telefonica SA | 5,051,520 | |||
| 11,202,074 | |||||
Switzerland 7.6% | |||||
| 35,300 | Holcim Ltd. | 2,195,727 | |||
| 94,495 | Novartis AG | 5,082,583 | |||
| 71,400 | Novartis AG ADR(b) | 3,842,748 | |||
| 130,200 | Roche Holding AG ADR | 9,711,305 | |||
| 7,513 | Roche Holding AG | 1,122,274 | |||
| 92,462 | UBS AG | 7,852,475 | |||
| 29,807,112 | |||||
United Kingdom 8.3% | |||||
| 201,100 | BHP Billiton PLC | 2,956,149 | |||
| 643,700 | Cadbury Schweppes PLC | 6,334,800 | |||
| 897,200 | Kingfisher PLC | 3,366,664 | |||
| 108,540 | Royal Bank of Scotland Group PLC (The) | 3,004,700 | |||
| 78,300 | Royal Bank of Scotland Group PLC (The) 144A | 2,167,570 | |||
| 1,269,400 | Tesco PLC | 6,757,386 | |||
| 1,629,166 | Vodafone Group PLC | 4,274,986 | |||
| 376,000 | WPP Group PLC | 3,693,647 | |||
| 32,555,902 | |||||
United States 51.0% | |||||
| 179,700 | Adobe Systems, Inc. | 5,795,325 | |||
| 52,600 | Alcon, Inc. | 6,990,540 | |||
| 100,200 | American Express Co. | 4,986,954 | |||
| 79,800 | American International Group, Inc. | 5,171,040 | |||
| 75,900 | Amgen, Inc.(a)(b) | 5,750,184 | |||
| 95,100 | Apple Computer, Inc.(a) | 5,476,809 | |||
| 20,400 | AtheroGenics, Inc.(a)(b) | 306,000 | |||
| 321,000 | Charles Schwab Corp. (The) | 4,879,200 | |||
| 69,500 | Chico’s FAS, Inc.(a) | 2,748,030 | |||
See Notes to Financial Statements.
| 12 | Visit our website at www.jennisondryden.com |
| Shares | Description | Value (Note 1) | |||
| 54,200 | E.I. du Pont de Nemours & Co. | $ | 2,259,598 | ||
| 81,700 | Electronic Arts, Inc.(a)(b) | 4,647,096 | |||
| 85,600 | Federated Department Stores, Inc. | 5,253,272 | |||
| 163,100 | General Electric Co. | 5,530,721 | |||
| 43,600 | Gilead Sciences, Inc.(a) | 2,060,100 | |||
| 23,600 | Google, Inc., (Class A)(a)(b) | 8,782,504 | |||
| 68,400 | GTECH Holdings Corp. | 2,177,856 | |||
| 107,200 | Halliburton Co.(b) | 6,335,520 | |||
| 64,200 | Honeywell International, Inc. | 2,195,640 | |||
| 28,900 | Keryx Biopharmaceuticals, Inc.(a)(b) | 417,605 | |||
| 257,700 | Kroger Co. (The)(a) | 5,128,230 | |||
| 33,200 | Lehman Brothers Holdings, Inc. | 3,973,044 | |||
| 109,500 | Marvell Technology Group Ltd.(a) | 5,081,895 | |||
| 74,700 | Monsanto Co.(b) | 4,706,847 | |||
| 154,200 | Nexen, Inc. | 6,374,628 | |||
| 103,900 | PepsiCo, Inc.(b) | 6,138,412 | |||
| 48,200 | Phelps Dodge Corp. | 5,806,654 | |||
| 92,800 | Praxair, Inc.(b) | 4,585,248 | |||
| 110,003 | Procter & Gamble Co. (The) | 6,159,040 | |||
| 67,300 | QUALCOMM, Inc. | 2,675,848 | |||
| 35,000 | Schlumberger Ltd.(b) | 3,176,950 | |||
| 185,016 | Sprint Nextel Corp. | 4,312,723 | |||
| 124,800 | St. Jude Medical, Inc.(a) | 5,999,136 | |||
| 137,400 | Suncor Energy, Inc. | 7,368,762 | |||
| 96,800 | Target Corp. | 5,390,792 | |||
| 169,500 | Texas Instruments, Inc. | 4,839,225 | |||
| 76,900 | TXU Corp. | 7,747,675 | |||
| 194,000 | Tyco International Ltd.(b) | 5,119,660 | |||
| 121,800 | UCBH Holdings, Inc.(b) | 2,119,320 | |||
| 125,300 | UnitedHealth Group, Inc.(b) | 7,253,617 | |||
| 213,700 | Waste Management, Inc. | 6,306,287 | |||
| 46,100 | WellPoint, Inc.(a)(b) | 3,442,748 | |||
| 151,900 | Yahoo!, Inc.(a)(b) | 5,615,743 | |||
| 201,086,478 | |||||
Total long-term investments | 391,618,223 | ||||
See Notes to Financial Statements.
| Jennison Global Growth Fund | 13 |
Portfolio of Investments
as of October 31, 2005 Cont’d.
| Shares | Description | Value (Note 1) | ||||
SHORT-TERM INVESTMENTS 17.0% | ||||||
Mutual Fund | ||||||
| 67,029,349 | Dryden Core Investment Fund - Taxable Money Market Series(c)(d) | $ | 67,029,349 | |||
Total Investments 116.2% | 458,647,572 | |||||
Liabilities in excess of other assets (e) (16.2%) | (64,087,223 | ) | ||||
Net Assets 100.0% | $ | 394,560,349 | ||||
| ADR—American | Depositary Receipt |
144A Security was purchased pursuant to Rule 144A under the Securities Act of 1933 and may not be resold subject to that rule except to qualified institutional buyers. Unless otherwise noted 144A securities are deemed to be liquid.
| (a) | Non-income producing security. |
| (b) | All or a portion of security is on loan. The aggregate market value of such securities is $64,157,088; cash collateral of $64,901,710 (included in liabilities) was received with which the portfolio purchased highly liquid short-term investments. |
| (c) | Represents security, or portion thereof, purchased with cash collateral received for securities on loan. |
| (d) | Prudential Investments LLC, the manager of the Fund also serves as manager of the Dryden Core Investment Fund - Taxable Money Market Series. |
| (e) | Liabilities in excess of other assets include net unrealized depreciation on foreign currency contracts as follows: |
Forward Foreign currency exchange contracts outstanding at October 31, 2005
Foreign Currency Contract | Value at Settlement Date Payable | Current Value | Unrealized Depreciation | |||||||
Japanese Yen, | $ | 774,583 | $ | 768,195 | $ | (6,388 | ) | |||
See Notes to Financial Statements.
| 14 | Visit our website at www.jennisondryden.com |
The industry classification of portfolio holdings and liabilities in excess of other assets shown as a percentage of net assets as of October 31, 2005 was as follows:
Mutual Fund | 17.0 | % | |
Commercial Banks | 9.5 | ||
Oil, Gas & Consumable Fuels | 6.8 | ||
Pharmaceuticals | 5.9 | ||
Chemicals | 4.3 | ||
Food & Staples Retailing | 4.3 | ||
Capital Markets | 4.2 | ||
Internet Software & Services | 3.6 | ||
Real Estate | 3.6 | ||
Industrial Conglomerates | 3.5 | ||
Metals & Mining | 3.4 | ||
Specialty Retail | 3.4 | ||
Health Care Equipment & Supplies | 3.3 | ||
Health Care Providers & Services | 2.7 | ||
Multiline Retail | 2.7 | ||
Trading Companies & Distributors | 2.7 | ||
Software | 2.6 | ||
Semiconductors & Semiconductor Equipment | 2.5 | ||
Energy Equipment & Services | 2.4 | ||
Consumer Finance | 2.3 | ||
Household Durables | 2.3 | ||
Biotechnology | 2.2 | ||
Wireless Telecommunication Services | 2.2 | ||
Independent Power Producers & Energy Traders | 2.0 | ||
Multi-Utilities | 1.8 | ||
Beverages | 1.6 | ||
Commercial Services & Supplies | 1.6 | ||
Electrical Equipment | 1.6 | ||
Food Products | 1.6 | ||
Automobiles | 1.4 | ||
Computers & Peripherals | 1.4 | ||
Diversified Telecommunication Services | 1.3 | ||
Insurance | 1.3 | ||
Media | 0.9 | ||
Communications Equipment | 0.7 | ||
Construction Materials | 0.6 | ||
Hotels Restaurants & Leisure | 0.5 | ||
Aerospace & Defense | 0.5 | ||
| 116.2 | |||
Liabilities in excess of other assets | (16.2 | ) | |
| 100.0 | % | ||
See Notes to Financial Statements.
| Jennison Global Growth Fund | 15 |
Statement of Assets and Liabilities
as of October 31, 2005
Assets | ||||
Investments at value, including securities on loan of $64,157,088: | ||||
Unaffiliated investments (cost $308,989,760) | $ | 391,618,223 | ||
Affiliated investments (cost $67,029,349) | 67,029,349 | |||
Foreign currency, at value (cost $2,213,269) | 2,242,621 | |||
Dividends and interest receivable | 581,483 | |||
Receivable for investments sold | 525,390 | |||
Receivable for Series shares sold | 89,804 | |||
Prepaid expenses | 23,424 | |||
Total assets | 462,110,294 | |||
Liabilities | ||||
Payable to broker for collateral for securities on loan (Note 4) | 64,901,710 | |||
Payable for investments purchased | 768,195 | |||
Payable for Series shares reacquired | 727,828 | |||
Accrued expenses | 501,639 | |||
Transfer agent fee payable | 266,619 | |||
Management fee payable | 249,143 | |||
Distribution fee payable | 109,312 | |||
Deferred directors’ fees | 12,089 | |||
Payable to custodian | 7,022 | |||
Unrealized depreciation on forward currency contract | 6,388 | |||
Total liabilities | 67,549,945 | |||
Net Assets | $ | 394,560,349 | ||
Net assets were comprised of: | ||||
Common stock, at par | $ | 252,078 | ||
Paid-in capital in excess of par | 424,332,292 | |||
| 424,584,370 | ||||
Undistributed net investment income | 297,749 | |||
Accumulated net realized loss on investment and foreign currency transactions | (112,931,826 | ) | ||
Net unrealized appreciation on investments and foreign currencies | 82,610,056 | |||
Net assets, October 31, 2005 | $ | 394,560,349 | ||
See Notes to Financial Statements.
| 16 | Visit our website at www.jennisondryden.com |
Class A | |||
Net asset value and redemption price per share | |||
($317,065,448 ÷ 19,911,663 shares of common stock issued and outstanding) | $ | 15.92 | |
Maximum sales charge (5.50% of offering price) | .93 | ||
Maximum offering price to public | $ | 16.85 | |
Class B | |||
Net asset value, offering price and redemption price per share | |||
($50,937,201 ÷ 3,549,920 shares of common stock issued and outstanding) | $ | 14.35 | |
Class C | |||
Net asset value, offering price and redemption price per share | |||
($12,312,747 ÷ 865,159 shares of common stock issued and outstanding) | $ | 14.23 | |
Class Z | |||
Net asset value, offering price and redemption price per share | |||
($14,244,953 ÷ 881,094 shares of common stock issued and outstanding) | $ | 16.17 | |
See Notes to Financial Statements.
| Jennison Global Growth Fund | 17 |
Statement of Operations
Year Ended October 31, 2005
Net Investment Income | ||||
Income | ||||
Unaffiliated dividends (net of foreign withholding taxes of $544,078) | $ | 6,677,676 | ||
Affiliated income from securities loaned, net | 41,113 | |||
Affiliated dividend income | 23,964 | |||
Interest | 14 | |||
Total income | 6,742,767 | |||
Expenses | ||||
Management fee | 3,050,219 | |||
Distribution fee—Class A | 790,561 | |||
Distribution fee—Class B | 445,634 | |||
Distribution fee—Class C | 141,301 | |||
Transfer agent’s fees and expenses (including affiliated expenses of $860,600) (Note 3) | 1,301,000 | |||
Custodian’s fees and expenses | 310,000 | |||
Reports to shareholders | 117,000 | |||
Legal fees and expenses | 63,000 | |||
Registration fees | 35,000 | |||
Audit fee | 22,000 | |||
Directors’ fees | 18,000 | |||
Insurance | 14,000 | |||
Miscellaneous | 27,654 | |||
Total expenses | 6,335,369 | |||
Net investment income | 407,398 | |||
Realized And Unrealized Gain (Loss) On Investment And Foreign Currency Transactions | ||||
Net realized gain (loss) on: | ||||
Investment transactions | 34,302,647 | |||
Foreign currency transactions | (155,101 | ) | ||
| 34,147,546 | ||||
Net change in unrealized appreciation (depreciation) on: | ||||
Investments | 34,309,569 | |||
Foreign currencies | (113,618 | ) | ||
| 34,195,951 | ||||
Net gain on investment and foreign currency transactions | 68,343,497 | |||
Net Increase In Net Assets Resulting From Operations | $ | 68,750,895 | ||
See Notes to Financial Statements.
| 18 | Visit our website at www.jennisondryden.com |
Statement of Changes in Net Assets
| Year Ended October 31, | ||||||||
| 2005 | 2004 | |||||||
Increase (Decrease) In Net Assets | ||||||||
Operations | ||||||||
Net investment income (loss) | $ | 407,398 | $ | (721,101 | ) | |||
Net realized gain on investment and foreign currency transactions | 34,147,546 | 71,359,402 | ||||||
Net change in unrealized appreciation (depreciation) on investments and foreign currencies | 34,195,951 | (38,910,056 | ) | |||||
Net increase in net assets resulting from operations | 68,750,895 | 31,728,245 | ||||||
Dividends from net investment income (Note 1) | ||||||||
Class A | — | (862,951 | ) | |||||
Class B | — | — | ||||||
Class C | — | — | ||||||
Class Z | — | (219,096 | ) | |||||
| — | (1,082,047 | ) | ||||||
Series share transactions (net of share conversions) (Notes 6 and 7) | ||||||||
Net proceeds from shares sold(b) | 22,165,347 | 165,492,705 | ||||||
Net asset value of shares issued in reinvestment of dividends | — | 1,041,505 | ||||||
Cost of shares reacquired | (113,151,200 | ) | (139,750,168 | ) | ||||
Net increase (decrease) in net assets from Series share transactions | (90,985,853 | ) | 26,784,042 | |||||
Total increase (decrease) | (22,234,958 | ) | 57,430,240 | |||||
Net Assets | ||||||||
Beginning of year | 416,795,307 | 359,365,067 | ||||||
End of year(a) | $ | 394,560,349 | $ | 416,795,307 | ||||
(a) Includes undistributed net investment income of: | $ | 297,749 | $ | — | ||||
| (b) For | the year ended October 31, 2004, includes $127,577,448 for shares issued in connection with the acquisition of Prudential Pacific Growth, Inc. and Prudential Europe Growth, Inc. |
See Notes to Financial Statements.
| Jennison Global Growth Fund | 19 |
Notes to Financial Statements
Prudential World Fund, Inc. (the “Fund”) is registered under the Investment Company Act of 1940, as an open-end, diversified management investment company and currently consists of three series: Jennison Global Growth Fund (the “Series”), Strategic Partners International Value Fund and Jennison International Growth Fund, formerly known as Prudential Global Growth Fund, Prudential International Value Fund and Prudential International Growth Fund, respectively. The financial statements of the other series are not presented herein. The Series commenced investment operations in May 15, 1984.
The investment objective of the Series is to seek long-term capital growth, with income as a secondary objective, by investing in a diversified portfolio of securities consisting of marketable securities of U.S. and non-U.S. issuers.
Note 1. Accounting Policies
The following is a summary of significant accounting policies followed by the Fund, and the Series, in the preparation of its financial statements.
Securities Valuation: Securities listed on a securities exchange (other than options on securities and indices) are valued at the last sale price on such exchange on the day of valuation or, if there was no sale on such day, at the mean between the last reported bid and asked prices, or at the last bid price on such day in the absence of an asked price. Securities traded via Nasdaq are valued at the official closing price as provided by Nasdaq. Securities that are actively traded in the over-the-counter market, including listed securities for which the primary market is believed by Prudential Investments LLC (“PI or Manager”), in consultation with the subadviser(s); to be over-the-counter, are valued at market value using prices provided by an independent pricing agent or principal market maker. Futures contracts and options thereon traded on commodities exchange or board of trade are valued on their last sales price as of the close of trading on such exchange or board of trade on such day, at the mean between the most recently quoted bid and asked prices on such exchange or board of trade or at the last bid price in the abscense of an asked price. Securities for which market quotations are not readily available, or whose values have been effected by events occurring after the close of the security’s foreign market and before the fund’s normal pricing time, are valued at fair value in accordance with the Board of Directors’ approved fair valuation procedures. When determining the fair valuation of securities some of the factors influencing the valuation include, the nature of any restrictions on disposition of the securities; assessment of the general liquidity of the securities; the issuer’s financial condition and the markets in which it
| 20 | Visit our website at www.jennisondryden.com |
does business; the cost of the investment; the size of the holding and the capitalization of issuer; the prices of any recent transactions or bids/offers for such securities or any comparable securities; any available analyst media or other reports or information deemed reliable by the investment adviser regarding the issuer or the markets or industry in which it operates. Using fair value to price securities may result in a value that is different from a security’s most recent closing price and from the price used by other mutual funds to calculate their net asset values.
Investments in mutual funds are valued at the net asset value as of the close of the New York Stock Exchange on the date of valuation.
Short-term securities, which mature in sixty days or less, are valued at amortized cost, which approximates market value. The amortized cost method involves valuing a security at its cost on the date of purchase and thereafter assuming a constant amortization to maturity of the difference between the principal amount due at maturity and cost. Short-term securities which mature in more than sixty days are valued at current market quotations.
Foreign Currency Translation: The books and records of the Series are maintained in U.S. dollars. Foreign currency amounts are translated into U.S. dollars on the following basis:
(i) market value of investment securities, other assets and liabilities-at the current rates of exchange;
(ii) purchases and sales of investment securities, income and expenses-at the rate of exchange prevailing on the respective dates of such transactions.
Although the net assets of the Series are presented at the foreign exchange rates and market values at the close of the fiscal period, the Series does not isolate that portion of the results of operations arising as a result of changes in the foreign exchange rates from the fluctuations arising from changes in the market prices of long-term securities held at the end of the fiscal period. Similarly, the Series does not isolate the effect of changes in foreign exchange rates from the fluctuations arising from changes in the market prices of long-term portfolio securities sold during the fiscal period. Accordingly, realized foreign currency gains or losses are included in the reported net realized gains or losses on investment transactions.
Net realized gains or losses on foreign currency transactions represent net foreign exchange gains or losses from holdings of foreign currencies, currency gains or losses realized between the trade and settlement dates on security transactions, and the difference between the amounts of dividends, interest and foreign taxes recorded on
| Jennison Global Growth Fund | 21 |
Notes to Financial Statements
Cont’d
the Series’ books and the U.S. dollar equivalent amounts actually received or paid. Net unrealized currency gains and losses from valuing foreign currency denominated assets and liabilities (other than investments) at period end exchange rates are reflected as a component of net unrealized appreciation or depreciation on investments and foreign currencies.
Foreign security and currency transactions may involve certain considerations and risks not typically associated with those of domestic origin as a result of, among other factors, the possibility of political and economic instability and the level of governmental supervision and regulation of foreign securities markets.
Forward Currency Contracts: A forward currency contract is a commitment to purchase or sell a foreign currency at a future date at a negotiated forward rate. The Series enters into forward currency contracts in order to hedge its exposure to changes in foreign currency exchange rates on its foreign portfolio holdings or on specific receivables and payables denominated in a foreign currency. The contracts are valued daily at current exchange rates and any unrealized gain or loss is included in net unrealized appreciation or depreciation on foreign currencies. Gain or loss is realized on the settlement date of the contract equal to the difference between the settlement value of the original and renegotiated forward contracts. This gain or loss, if any, is included in net realized gain or loss on foreign currency transactions. Risks may arise upon entering into these contracts from the potential inability of the counterparties to meet the terms of their contracts.
Forward currency contracts involve elements of both market and credit risk in excess of the amounts reflected on the Statement of Assets and Liabilities.
Securities Lending: The Series may lend its portfolio securities to qualified institutions. The loans are secured by collateral at least equal at all times, to the market value of the securities loaned. The Series may bear the risk of delay in recovery of, or even loss of rights in, the securities loaned should the borrower of the securities fail financially. The Series receives compensation, net of any rebate, for lending its securities in the form of interest or dividends on the collateral received for the securities loaned, and any gain or loss in the market price of the securities loaned that may occur during the term of the loan.
Securities Transactions and Net Investment Income: Securities transactions are recorded on the trade date. Realized gains or losses from investment and currency
| 22 | Visit our website at www.jennisondryden.com |
transactions are calculated on the identified cost basis. Dividend income is recorded on the ex-dividend date, and interest income is recorded on an accrual basis. Expenses are recorded on the accrual basis.
Net investment income or loss, (other than distribution fees, which are charged directly to the respective class) unrealized and realized gains or losses are allocated daily to each class of shares based upon the relative proportion of net assets of each class at the beginning of the day.
Dividends and Distributions: The Series expects to pay dividends of net investment income and distributions of net realized capital and currency gains, if any, annually. Dividends and distributions, which are determined in accordance with federal income tax regulations and which may differ from generally accepted accounting principles, are recorded on the ex-dividend date. Permanent book/tax differences relating to income and gains are reclassified amongst undistributed net investment income, accumulated net realized gain or loss and to paid-in capital in excess of par, as appropriate.
Taxes: For federal income tax purposes, each series in the Fund is treated as a separate taxpaying entity. It is the Series’ policy to continue to meet the requirements of the Internal Revenue Code applicable to regulated investment companies and to distribute all of its taxable net income and capital gains, if any, to its shareholders. Therefore, no federal income tax provision is required.
Withholding taxes on foreign dividends are recorded net of reclaimable amounts, at the time the related income is earned.
Estimates: The preparation of these financial statements requires management to make estimates and assumptions that affect the reported amounts and disclosures in the financial statements. Actual results could differ from those estimates.
Note 2. Agreements
The Fund has a management agreement for the Series with PI. Pursuant to this agreement, PI has responsibility for all investment advisory services and supervises the subadvisor’s performance of such services. PI has entered into a subadvisory agreement with Jennison Associates LLC (“Jennison”). The subadvisory agreement provides that Jennison furnishes investment advisory services in connection with the management of the Series. In connection therewith, Jennison is obligated to keep certain books and records of the Series. PI pays for the services of Jennison, the cost of compensation of officers of the Series, occupancy and certain clerical and bookkeeping costs of the Series. The Series bears all other costs and expenses.
| Jennison Global Growth Fund | 23 |
Notes to Financial Statements
Cont’d
The management fee paid to PI is computed daily and payable monthly, at an annual rate of .75 of 1% of the Series’ average daily net assets up to and including $1 billion and .70 of 1% of the average daily net assets of the Series in excess of $1 billion. The effective management fee rate was .75 of 1% for the year ended October 31, 2005.
The Fund has a distribution agreement with Prudential Investment Management Services LLC (“PIMS”), which acts as the distributor of the Class A, B, C and Z shares of the Series. The Series compensates PIMS for distributing and servicing the Series’ Class A, Class B and Class C shares, pursuant to plans of distribution, (the “Class A, B and C Plans”), regardless of expenses actually incurred by PIMS. The distribution fees are accrued daily and payable monthly. No distribution or service fees are paid to PIMS as distributor for the Class Z shares of the Series.
Pursuant to the Class A Plan, the Series compensates PIMS, for distribution-related activities at an annual rate of up to .30 of 1% of the average daily net assets of the Class A shares. PIMS has contractually agreed to limit such fees to .25% on the average daily net assets of the Class A shares. Pursuant to the Class B and C Plans, the Series compensates PIMS for distribution-related activities at the annual rate of .75 of 1% of the average daily net assets of Class B shares up to the level of average daily net assets as of February 26,1986, plus 1% of the average daily net assets in excess of such level of the Class B shares, and 1% of average daily net assets of Class C shares.
PIMS has advised the Series that it received approximately $67,000 in front-end sales charges resulting from sales of Class A shares, during the year ended October 31, 2005. From these fees, PIMS paid such sales charges to affiliated broker-dealers, which in turn paid commissions to salespersons and incurred other distribution costs.
PI has advised the Series that it received approximately $86,000 and $900 in contingent deferred sales charges imposed upon certain redemptions by Class B and C shareholders, respectively, during the year ended October 31, 2005.
PI, PIMS, and Jennison are indirect, wholly-owned subsidiaries of Prudential Financial, Inc. (“Prudential”).
The Series, along with other affiliated registered investment companies (the “Funds”), is a party to a syndicated credit agreement (“SCA”) with two banks. The commitment under the credit agreement is $500 million. For the period from October 29, 2004
| 24 | Visit our website at www.jennisondryden.com |
through October 28, 2005, the Series paid a commitment fee of .075 of 1% of the unused portion of the agreement. Effective October 29, 2005, the Funds renewed the SCA with the banks. The Series pays a commitment fee of .0725 of 1% of the unused portion of the renewed SCA. The commitment fee is accrued daily and paid quarterly and is allocated to the Funds pro-rata based on net assets. The expiration date of the renewed SCA is October 28, 2006. The Series did not borrow any amounts pursuant to the SCA during the year ended October 31, 2005.
Note 3. Other Transactions With Affiliates
Prudential Mutual Fund Services LLC (“PMFS”), an affiliate of PI and an indirect, wholly-owned subsidiary of Prudential, serves as the Fund’s transfer agent. Transfer agent fees and expenses in the Statement of Operations include certain out-of-pocket expenses paid to non-affiliates, where applicable.
The Series pays networking fees to affiliated and unaffiliated broker/dealers. These networking fees are payments made to broker/dealers that clear mutual fund transactions through a national clearing system. For the year ended October 31, 2005, the Series incurred approximately $142,900 in total networking fees. These amounts are included in transfer agent’s fees and expenses in the Statement of Operations.
The Series invests in the Taxable Money Market Series (the “Portfolio”), a portfolio of Dryden Core Investment Fund, pursuant to an exemptive order received from the Securities and Exchange Commission. The Portfolio is a money market mutual fund registered under the Investment Company Act of 1940, as amended, and managed by PI.
For the year ended October 31, 2005, Wachovia earned $630 in brokerage commissions from portfolio transactions executed on behalf of the Series.
Prudential Investment Management, Inc., (“PIM”), an indirect, wholly-owned subsidiary of Prudential, is the Series’ security lending agent. For the year ended October 31, 2005, PIM has been compensated approximately $15,600 for this service.
Note 4. Portfolio Securities
Purchases and sales of investment securities, other than short-term investments, for the year ended October 31, 2005 aggregated $228,658,883 and $311,325,316, respectively.
As of October 31, 2005, the Series had securities on loan with an aggregate market value of $64,157,088. The Series received $64,901,710 in cash as collateral for
| Jennison Global Growth Fund | 25 |
Notes to Financial Statements
Cont’d
securities on loan which was used to purchase highly liquid short-term investments in accordance with Fund’s securities lending procedures.
Note 5. Distributions and Tax Information
Distributions to shareholders, which are determined in accordance with federal income tax regulations, which may differ from generally accepted accounting principles, are recorded on the ex-dividend date. In order to present accumulated net investment loss and accumulated net realized losses on investments and foreign currency transactions on the Statement of Assets and Liabilities that more closely represent their tax character, certain adjustments have been made to paid-in-capital in excess of par, accumulated net investment loss and accumulated net realized loss on investments and foreign currency transactions. For the year ended October 31, 2005, the adjustments were to increase undistributed net investment income and to increase accumulated net realized loss on investments and foreign currency transactions by $40,302. These differences are due to the treatment for book and tax purposes of certain transactions involving foreign currency transactions and tax adjustments pertaining to the treatment of passive foreign investment companies. Net investment income, net realized gains and net assets were not affected by this change.
For the fiscal year ended October 31, 2004, the tax character of dividends paid of $1,082,047 was ordinary income. There were no dividends paid for the fiscal year ended October 31, 2005.
As of October 31, 2005, the Series had accumulated undistributed ordinary income of $303,449.
The United States federal income tax basis of the Series’ investments and the net unrealized appreciation as of October 31, 2005 were as follows:
Tax Basis | Appreciation | Depreciation | Net | Other Cost Basis Adjustment | Total Net Unrealized Appreciation | |||||
| $376,246,953 | $87,039,089 | $4,638,470 | $82,400,619 | $(12,019) | $82,388,600 |
The difference between book basis and tax basis is primarily attributable to deferred losses on wash sales.
| 26 | Visit our website at www.jennisondryden.com |
For federal income tax purposes, the Series had a capital loss carryforward as of October 31, 2005, of approximately $112,704,000 of which $6,860,500 expires in 2008, $2,610,000 expires in 2009, $94,453,000 expires in 2010 and $8,780,500 expires in 2011. Approximately $32,108,500 of capital loss carryforward was used to offset net taxable gains realized in the fiscal year ended October 31, 2005.
Note 6. Capital
The Fund offers Class A, Class B, Class C and Class Z shares. Class A shares are sold with a front-end sales charge of up to 5.50%. All investors who purchase Class A shares in an amount of $1 million or more and sell these shares within 12 months of purchase are subject to a contingent deferred sales charge (CDSC) of 1%, including investors who purchase their shares through broker-dealers affiliated with Prudential Financial, Inc. Class B shares are sold with a contingent deferred sales charge which declines from 5% to zero depending on the period of time the shares are held. Class C shares purchased are not subject to a front-end sales charge and a contingent deferred sales charge (CDSC) of 1% for Class C shares will be effective during the 12 months from the date of purchase. Class B shares automatically convert to Class A shares on a quarterly basis approximately seven years after purchase. A special exchange privilege is also available for shareholders who qualified to purchase Class A shares at net asset value. Class Z shares are not subject to any sales or redemption charge and are offered exclusively for sale to a limited group of investors.
There are 500 million authorized shares of $.01 par value common stock, divided equally into four classes, designated Class A, Class B, Class C and Class Z common stock.
| Jennison Global Growth Fund | 27 |
Notes to Financial Statements
Cont’d
Transactions in shares of common stock were as follows:
Class A | Shares | Amount | |||||
Year ended October 31, 2005: | |||||||
Shares sold | 971,166 | $ | 14,347,084 | ||||
Shares reacquired | (5,506,808 | ) | (81,005,787 | ) | |||
Net increase (decrease) in shares outstanding before conversion | (4,535,642 | ) | (66,658,703 | ) | |||
Shares issued upon conversion from Class B | 1,003,902 | 14,925,795 | |||||
Net increase (decrease) in shares outstanding | (3,531,740 | ) | $ | (51,732,908 | ) | ||
Year ended October 31, 2004: | |||||||
Shares sold | 1,538,249 | $ | 20,512,794 | ||||
Shares issued in connection with reorganization (Note 7) | 6,721,815 | 82,815,672 | |||||
Shares issued in reinvestment of dividends | 67,011 | 822,896 | |||||
Shares reacquired | (6,359,527 | ) | (84,267,038 | ) | |||
Net increase (decrease) in shares outstanding before conversion | 1,967,548 | 19,884,324 | |||||
Shares issued upon conversion from Class B | 1,347,440 | 17,751,465 | |||||
Net increase (decrease) in shares outstanding | 3,314,988 | $ | 37,635,789 | ||||
Class B | |||||||
Year ended October 31, 2005: | |||||||
Shares sold | 281,884 | $ | 3,725,224 | ||||
Shares reacquired | (1,007,913 | ) | (13,378,818 | ) | |||
Net increase (decrease) in shares outstanding before conversion | (726,029 | ) | (9,653,594 | ) | |||
Shares reacquired upon conversion into Class A | (1,110,978 | ) | (14,925,795 | ) | |||
Net increase (decrease) in shares outstanding | (1,837,007 | ) | $ | (24,579,389 | ) | ||
Year ended October 31, 2004: | |||||||
Shares sold | 389,763 | $ | 4,673,326 | ||||
Shares issued in connection with reorganization (Note 7) | 3,009,169 | 33,720,649 | |||||
Shares reacquired | (1,191,791 | ) | (14,299,947 | ) | |||
Net increase (decrease) in shares outstanding before conversion | 2,207,141 | 24,094,028 | |||||
Shares reacquired upon conversion into Class A | (1,483,817 | ) | (17,751,465 | ) | |||
Net increase (decrease) in shares outstanding | 723,324 | $ | 6,342,563 | ||||
| 28 | Visit our website at www.jennisondryden.com |
Class C | Shares | Amount | |||||
Year ended October 31, 2005: | |||||||
Shares sold | 134,169 | $ | 1,757,997 | ||||
Shares reacquired | (618,785 | ) | (8,169,114 | ) | |||
Net increase (decrease) in shares outstanding | (484,616 | ) | $ | (6,411,117 | ) | ||
Year ended October 31, 2004: | |||||||
Shares sold | 193,525 | $ | 2,327,258 | ||||
Shares issued in connection with reorganization (Note 7) | 544,826 | 6,083,476 | |||||
Shares reacquired | (523,219 | ) | (6,278,087 | ) | |||
Net increase (decrease) in shares outstanding | 215,132 | $ | 2,132,647 | ||||
Class Z | |||||||
Year ended October 31, 2005: | |||||||
Shares sold | 157,315 | $ | 2,335,042 | ||||
Shares reacquired | (717,990 | ) | (10,597,481 | ) | |||
Net increase (decrease) in shares outstanding | (560,675 | ) | $ | (8,262,439 | ) | ||
Year ended October 31, 2004: | |||||||
Shares sold | 787,823 | $ | 10,401,879 | ||||
Shares issued in connection with reorganization (Note 7) | 398,158 | 4,957,651 | |||||
Shares issued in reinvestment of dividends | 17,616 | 218,609 | |||||
Shares reacquired | (2,582,400 | ) | (34,905,096 | ) | |||
Net increase (decrease) in shares outstanding | (1,378,803 | ) | $ | (19,326,957 | ) | ||
Note 7. Plan of Reorganization
On November 21, 2003, Jennison Global Growth Fund acquired all of the net assets of Prudential Pacific Growth Fund, Inc. and the Prudential Europe Growth Fund, Inc. pursuant to a plan of reorganization approved by the Jennison Global Growth Fund shareholders on November 20, 2003. The acquisition was accomplished by a tax-free exchange of Class A, Class B, Class C and Class Z shares.
Prudential Pacific Growth Fund, Inc. | Prudential Europe Growth Fund, Inc. | Jennison Global Growth Fund | Value | |||||||||
| Class A | 3,474,325 | Class A | 4,455,047 | Class A | 6,721,815 | $82,815,672 | ||||||
| B | 981,473 | B | 2,260,273 | B | 3,009,169 | 33,720,649 | ||||||
| C | 192,708 | C | 396,713 | C | 544,826 | 6,083,476 | ||||||
| Z | 52,978 | Z | 360,412 | Z | 398,158 | 4,957,651 | ||||||
The aggregate net assets including unrealized appreciation (depreciation) of the Prudential Pacific Growth Fund, Inc., the Prudential Europe Growth Fund, Inc. and the Jennison Global Growth Fund immediately before the acquisition were $36,184,191, $91,393,257 and $345,758,607, respectively.
| Jennison Global Growth Fund | 29 |
Notes to Financial Statements
Cont’d
The future utilization of the acquired capital loss carryforwards from Prudential Pacific Growth Fund, Inc. and Prudential Europe Growth Fund, Inc. in the amounts of $41,646,269 and $29,257,940, respectively, will be limited under certain conditions defined in the Internal Revenue Code of 1986, as amended.
| 30 | Visit our website at www.jennisondryden.com |
Financial Highlights
| OCTOBER 31, 2005 | ANNUAL REPORT |
Jennison Global Growth Fund
Financial Highlights
| Class A | ||||
| Year Ended October 31, 2005 | ||||
Per Share Operating Performance: | ||||
Net Asset Value, Beginning Of Year | $ | 13.45 | ||
Income (loss) from investment operations: | ||||
Net investment income (loss)(a) | .03 | |||
Net realized and unrealized gain (loss) on investment and foreign currency transactions | 2.44 | |||
Total from investment operations | 2.47 | |||
Less Dividends and Distributions: | ||||
Dividends from net investment income | — | |||
Distributions from net realized gains | — | |||
Total dividends and distributions | — | |||
Net asset value, end of year | $ | 15.92 | ||
Total Return(b): | 18.36 | % | ||
Ratios/Supplemental Data: | ||||
Net assets, end of year (000) | $ | 317,065 | ||
Average net assets (000) | $ | 316,224 | ||
Ratios to average net assets: | ||||
Expenses, including distribution and service (12b-1) fees(c) | 1.47 | % | ||
Expenses, excluding distribution and service (12b-1) fees | 1.22 | % | ||
Net investment income (loss) | .18 | % | ||
For Class A, B, C and Z shares: | ||||
Portfolio turnover rate | 57 | % | ||
| (a) | Calculated based upon average shares outstanding during the year. |
| (b) | Total return does not consider the effects of sales loads. Total return is calculated assuming a purchase of shares on the first day and a sale on the last day of each year reported, and includes reinvestment of dividends and distributions. |
| (c) | The distributor of the Series has contractually agreed to limit its distribution and service (12b-1) fees to .25 of 1% of the average daily net assets of the Class A shares. |
See Notes to Financial Statements.
| 32 | Visit our website at www.jennisondryden.com |
| Class A | ||||||||||||||
| Year Ended October 31, | ||||||||||||||
| 2004 | 2003 | 2002 | 2001 | |||||||||||
| $ | 12.72 | $ | 10.21 | $ | 12.23 | $ | 21.35 | |||||||
| (.01 | ) | .02 | (.01 | ) | .01 | |||||||||
| .78 | 2.49 | (2.01 | ) | (5.83 | ) | |||||||||
| .77 | 2.51 | (2.02 | ) | (5.82 | ) | |||||||||
| (.04 | ) | — | — | — | ||||||||||
| — | — | — | (3.30 | ) | ||||||||||
| (.04 | ) | — | — | (3.30 | ) | |||||||||
| $ | 13.45 | $ | 12.72 | $ | 10.21 | $ | 12.23 | |||||||
| 6.11 | % | 24.58 | % | (16.52 | )% | (30.87 | )% | |||||||
| $ | 315,214 | $ | 256,106 | $ | 223,191 | $ | 304,777 | |||||||
| $ | 327,615 | $ | 230,103 | $ | 284,046 | $ | 353,879 | |||||||
| 1.39 | % | 1.59 | % | 1.46 | % | 1.37 | % | |||||||
| 1.14 | % | 1.34 | % | 1.21 | % | 1.12 | % | |||||||
| (.06 | )% | .15 | % | (.18 | )% | .06 | % | |||||||
| 125 | % | 79 | % | 67 | % | 72 | % | |||||||
See Notes to Financial Statements.
| Jennison Global Growth Fund | 33 |
Financial Highlights
Cont’d
| Class B | ||||
| Year Ended October 31, 2005 | ||||
Per Share Operating Performance: | ||||
Net Asset Value, Beginning Of Year | $ | 12.18 | ||
Income (loss) from investment operations: | ||||
Net investment loss(a) | (.04 | ) | ||
Net realized and unrealized gain (loss) on investment and foreign currency transactions | 2.21 | |||
Total from investment operations | 2.17 | |||
Less Dividends and Distributions: | ||||
Distributions from net realized gains | — | |||
Total dividends and distributions | — | |||
Net asset value, end of year | $ | 14.35 | ||
Total Return(b): | 17.82 | % | ||
Ratios/Supplemental Data: | ||||
Net assets, end of year (000) | $ | 50,937 | ||
Average net assets (000) | $ | 59,418 | ||
Ratios to average net assets: | ||||
Expenses, including distribution and service (12b-1) fees | 1.97 | % | ||
Expenses, excluding distribution and service (12b-1) fees | 1.22 | % | ||
Net investment loss | (.28 | )% | ||
| (a) | Calculated based upon average shares outstanding during the year. |
| (b) | Total return does not consider the effects of sales loads. Total return is calculated assuming a purchase of shares on the first day and a sale on the last day of each year reported, and includes reinvestment of dividends and distributions. |
See Notes to Financial Statements.
| 34 | Visit our website at www.jennisondryden.com |
| Class B | ||||||||||||||
| Year Ended October 31, | ||||||||||||||
| 2004 | 2003 | 2002 | 2001 | |||||||||||
| $ | 11.54 | $ | 9.31 | $ | 11.23 | $ | 20.00 | |||||||
| (.07 | ) | (.04 | ) | (.08 | ) | (.08 | ) | |||||||
| .71 | 2.27 | (1.84 | ) | (5.39 | ) | |||||||||
| .64 | 2.23 | (1.92 | ) | (5.47 | ) | |||||||||
| — | — | — | (3.30 | ) | ||||||||||
| — | — | — | (3.30 | ) | ||||||||||
| $ | 12.18 | $ | 11.54 | $ | 9.31 | $ | 11.23 | |||||||
| 5.55 | % | 23.95 | % | (17.10 | )% | (31.27 | )% | |||||||
| $ | 65,603 | $ | 53,834 | $ | 70,804 | $ | 130,201 | |||||||
| $ | 75,607 | $ | 58,843 | $ | 109,004 | $ | 195,461 | |||||||
| 1.89 | % | 2.09 | % | 2.00 | % | 2.00 | % | |||||||
| 1.14 | % | 1.34 | % | 1.21 | % | 1.12 | % | |||||||
| (.55 | )% | (.37 | )% | (.73 | )% | (.58 | )% | |||||||
See Notes to Financial Statements.
| Jennison Global Growth Fund | 35 |
Financial Highlights
Cont’d
| Class C | ||||
| Year Ended October 31, 2005 | ||||
Per Share Operating Performance: | ||||
Net Asset Value, Beginning Of Year | $ | 12.11 | ||
Income (loss) from investment operations: | ||||
Net investment loss(a) | (.07 | ) | ||
Net realized and unrealized gain (loss) on investment and foreign currency transactions | 2.19 | |||
Total from investment operations | 2.12 | |||
Less Dividends and Distributions: | ||||
Distributions from net realized gains | — | |||
Total dividends and distributions | — | |||
Net asset value, end of year | $ | 14.23 | ||
Total Return(b): | 17.51 | % | ||
Ratios/Supplemental Data: | ||||
Net assets, end of year (000) | $ | 12,313 | ||
Average net assets (000) | $ | 14,130 | ||
Ratios to average net assets: | ||||
Expenses, including distribution and service (12b-1) fees | 2.22 | % | ||
Expenses, excluding distribution and service (12b-1) fees | 1.22 | % | ||
Net investment loss | (.54 | )% | ||
| (a) | Calculated based upon average shares outstanding during the year. |
| (b) | Total return does not consider the effects of sales loads. Total return is calculated assuming a purchase of shares on the first day and a sale on the last day of each year reported, and includes reinvestment of dividends and distributions. |
See Notes to Financial Statements.
| 36 | Visit our website at www.jennisondryden.com |
| Class C | ||||||||||||||
| Year Ended October 31, | ||||||||||||||
| 2004 | 2003 | 2002 | 2001 | |||||||||||
| $ | 11.50 | $ | 9.30 | $ | 11.24 | $ | 19.99 | |||||||
| (.10 | ) | (.06 | ) | (.10 | ) | (.09 | ) | |||||||
| .71 | 2.26 | (1.84 | ) | (5.36 | ) | |||||||||
| .61 | 2.20 | (1.94 | ) | (5.45 | ) | |||||||||
| — | — | — | (3.30 | ) | ||||||||||
| — | — | — | (3.30 | ) | ||||||||||
| $ | 12.11 | $ | 11.50 | $ | 9.30 | $ | 11.24 | |||||||
| 5.30 | % | 23.66 | % | (17.26 | )% | (31.17 | )% | |||||||
| $ | 16,343 | $ | 13,053 | $ | 12,490 | $ | 16,006 | |||||||
| $ | 17,682 | $ | 12,091 | $ | 14,897 | $ | 18,330 | |||||||
| 2.14 | % | 2.34 | % | 2.21 | % | 2.12 | % | |||||||
| 1.14 | % | 1.34 | % | 1.21 | % | 1.12 | % | |||||||
| (.81 | )% | (.60 | )% | (.92 | )% | (.68 | )% | |||||||
See Notes to Financial Statements.
| Jennison Global Growth Fund | 37 |
Financial Highlights
Cont’d
| Class Z | ||||
| Year Ended October 31, 2005 | ||||
Per Share Operating Performance: | ||||
Net Asset Value, Beginning Of Year | $ | 13.62 | ||
Income (loss) from investment operations: | ||||
Net investment income(a) | .07 | |||
Net realized and unrealized gain (loss) on investment and foreign currency transactions | 2.48 | |||
Total from investment operations | 2.55 | |||
Less Dividends and Distributions: | ||||
Dividends from net investment income | — | |||
Distributions from net realized gains | — | |||
Total dividends and distributions | — | |||
Net asset value, end of year | $ | 16.17 | ||
Total Return(b): | 18.72 | % | ||
Ratios/Supplemental Data: | ||||
Net assets, end of year (000) | $ | 14,245 | ||
Average net assets (000) | $ | 16,923 | ||
Ratios to average net assets: | ||||
Expenses, including distribution and service (12b-1) fees | 1.22 | % | ||
Expenses, excluding distribution and service (12b-1) fees | 1.22 | % | ||
Net investment income | .47 | % | ||
| (a) | Calculated based upon average shares outstanding during the year. |
| (b) | Total return is calculated assuming a purchase of shares on the first day and a sale on the last day of each year reported, and includes reinvestment of dividends and distributions. |
See Notes to Financial Statements.
| 38 | Visit our website at www.jennisondryden.com |
| Class Z | ||||||||||||||
| Year Ended October 31, | ||||||||||||||
| 2004 | 2003 | 2002 | 2001 | |||||||||||
| $ | 12.90 | $ | 10.32 | $ | 12.35 | $ | 21.46 | |||||||
| .01 | .05 | .01 | .05 | |||||||||||
| .79 | 2.53 | (2.04 | ) | (5.86 | ) | |||||||||
| .80 | 2.58 | (2.03 | ) | (5.81 | ) | |||||||||
| (.08 | ) | — | — | — | ||||||||||
| — | — | — | (3.30 | ) | ||||||||||
| (.08 | ) | — | — | (3.30 | ) | |||||||||
| $ | 13.62 | $ | 12.90 | $ | 10.32 | $ | 12.35 | |||||||
| 6.32 | % | 24.90 | % | (16.50 | )% | (30.57 | )% | |||||||
| $ | 19,635 | $ | 36,372 | $ | 33,228 | $ | 42,562 | |||||||
| $ | 24,872 | $ | 33,443 | $ | 40,960 | $ | 54,387 | |||||||
| 1.14 | % | 1.34 | % | 1.21 | % | 1.12 | % | |||||||
| 1.14 | % | 1.34 | % | 1.21 | % | 1.12 | % | |||||||
| .10 | % | .40 | % | .08 | % | .32 | % | |||||||
See Notes to Financial Statements.
| Jennison Global Growth Fund | 39 |
Report of Independent Registered Public Accounting Firm
The Board of Directors and Shareholders of
Prudential World Fund, Inc.—Jennison Global Growth Fund:
We have audited the accompanying statement of assets and liabilities of the Prudential World Fund, Inc.—Jennison Global Growth Fund (one of the portfolios constituting the Prudential World Fund, Inc., hereafter referred to as the “Fund”), including the portfolio of investments, as of October 31, 2005, and the related statement of operations for the year then ended, and the statement of changes in net assets and the financial highlights for each of years in the two-year period then ended. These financial statements and financial highlights are the responsibility of the Fund’s management. Our responsibility is to express an opinion on these financial statements and financial highlights based on our audits. The financial highlights for the years presented prior to the year ended October 31, 2004, were audited by another independent registered public accounting firm, whose report dated December 22, 2003, expressed an unqualified opinion thereon.
We conducted our audits in accordance with the standards of the Public Company Accounting Oversight Board (United States). Those standards require that we plan and perform the audit to obtain reasonable assurance about whether the financial statements and financial highlights are free of material misstatement. An audit includes examining, on a test basis, evidence supporting the amounts and disclosures in the financial statements. Our procedures included confirmation of securities owned as of October 31, 2005, by correspondence with the custodian and brokers. An audit also includes assessing the accounting principles used and significant estimates made by management, as well as evaluating the overall financial statement presentation. We believe that our audits provide a reasonable basis for our opinion.
In our opinion, the financial statements and financial highlights referred to above present fairly, in all material respects, the financial position of the Fund as of October 31, 2005, and the results of its operations for the year then ended, and the changes in its net assets and the financial highlights for each of the years in the two-year period then ended, in conformity with U.S. generally accepted accounting principles.
KPMG LLP
New York, New York
December 23, 2005
| 40 | Visit our website at www.jennisondryden.com |
Management of the Fund
(Unaudited)
Information pertaining to the Directors of the Fund is set forth below. Directors who are not deemed to be “interested persons” of the Fund, as defined in the Investment Company Act of 1940 as amended, (the 1940 Act) are referred to as “Independent Directors.” Directors who are deemed to be “interested persons” of the Fund are referred to as “Interested Directors.” “Fund Complex”† consists of the Fund and any other investment companies managed by PI.
Independent Directors(2)
Linda W. Bynoe (53), Director since 2005(3) Oversees 88 portfolios in Fund complex
Principal occupations (last 5 years): President and Chief Executive Officer (since March 1995) of Telemat Ltd. (management consulting); formerly Vice President at Morgan Stanley & Co.
Other Directorships held:(4) Director of Dynegy Inc. (energy services) (since September 2002) and Simon Property Group, Inc. (real estate investment trust) (since May 2003); Director (since August 2005) of The High Yield Plus Fund, Inc.
David E.A. Carson (71), Director since 2003(3) Oversees 92 portfolios in Fund complex
Principal occupations (last 5 years): Formerly Director (January 2000-May 2000), Chairman (January 1999- December 1999), Chairman and Chief Executive Officer (January 1998-December 1998) and President, Chairman and Chief Executive Officer (1983-1997) of People’s Bank.
Other Directorships held:(4) Director (since 2004) of The High Yield Plus Fund, Inc.
Robert E. La Blanc (71), Director since 2003(3) Oversees 89 portfolios in Fund complex
Principal occupations (last 5 years): President (since 1981) of Robert E. La Blanc Associates, Inc. (telecommunications).
Other Directorships held:(4) Director of Chartered Semiconductor Manufacturing, Ltd. (since 1998); Computer Associates International, Inc. (since 2002) (software company); FiberNet Telecom Group, Inc. (since 2003) (telecom company); Director (since April 1999) of The High Yield Plus Fund, Inc.
Douglas H. McCorkindale (66), Director since 1998(3) Oversees 89 portfolios in Fund complex
Principal occupations (last 5 years): Chairman (since February 2001) of Gannett Co., Inc. (publishing and media); formerly Chief Executive Officer (June 2000-July 2005), President (September 1997-July 2005) and Vice Chairman (March 1984-May 2000) of Gannett Co., Inc.
Other Directorships held:(4) Director of Gannett Co., Inc., Director of Continental Airlines, Inc. (since May 1993); Director of Lockheed Martin Corp. (aerospace and defense) (since May 2001); Director of The High Yield Plus Fund, Inc. (since 1996).
Richard A. Redeker (62), Director since 1998(3) Oversees 89 portfolios in Fund complex
Principal occupations (last 5 years): Management Consultant; Director of Invesmart, Inc. (since 2001) and Director of Penn Tank Lines, Inc. (since 1999).
Other Directorships held:(4) Director (since January 2005) of The High Yield Plus Fund, Inc.
| Jennison Global Growth Fund | 41 |
Robin B. Smith (66), Director since 1998(3) Oversees 90 portfolios in Fund complex
Principal occupations (last 5 years): Chairman of the Board (since January 2003) of Publishers Clearing House (direct marketing); formerly Chairman and Chief Executive Officer (August 1996-January 2003) of Publishers Clearing House.
Other Directorships held:(4) Director of BellSouth Corporation (since 1992); Director (since January 2005) of The High Yield Plus Fund, Inc.
Stephen G. Stoneburn (62), Director since 2003(3) Oversees 89 portfolios in Fund complex
Principal occupations (last 5 years): President and Chief Executive Officer (since June 1996) of Quadrant Media Corp. (a publishing company); formerly President (June 1995-June 1996) of Argus Integrated Media, Inc.; Senior Vice President and Managing Director (January 1993-1995) of Cowles Business Media and Senior Vice President of Fairchild Publications, Inc. (1975-1989).
Other Directorships held:(4) Director (since January 2005) of The High Yield Plus Fund, Inc.
Clay T. Whitehead (67), Director since 1998(3) Oversees 90 portfolios in Fund complex
Principal occupations (last 5 years): President (since 1983) of National Exchange Inc. (new business development firm).
Other Directorships held:(4) Director (since 2000) of The High Yield Plus Fund, Inc.
Interested Directors(1)
Judy A. Rice (57), President since 2003 and Director since 2000(3) Oversees 89 portfolios in Fund complex
Principal occupations (last 5 years): President, Chief Executive Officer, Chief Operating Officer and Officer-in-Charge (since February 2003) of Prudential Investments LLC; Vice President (since February 1999) of Prudential Investment Management Services LLC; President, Chief Executive Officer and Officer-in-Charge (since April 2003) of Prudential Mutual Fund Services LLC; formerly Executive Vice President (September 1999-February 2003) of PI; Member of Board of Governors of the Money Management Institute.
Other Directorships held:(4) Director (since August 2005) of The High Yield Plus Fund, Inc.
Robert F. Gunia (59), Vice President and Director since 1998(3) Oversees 157 portfolios in Fund complex
Principal occupations (last 5 years): Chief Administrative Officer (since September 1999) and Executive Vice President (since December 1996) of PI; President (since April 1999) of Prudential Investment Management Services LLC; Executive Vice President (since March 1999) and Treasurer (since May 2000) of Prudential Mutual Fund Services LLC.
Other Directorships held:(4) Vice President and Director (since May 1989) and Treasurer (since 1999) of The Asia Pacific Fund, Inc.; Vice President (since 2004) and Director (since August 2005) of The High Yield Plus Fund, Inc.
Information pertaining to the Officers of the Fund who are not also Directors is set forth below.
Officers(2)
Kathryn L. Quirk (52), Chief Legal Officer since 2005(3)
Principal occupations (last 5 years): Vice President and Corporate Counsel (since September 2004) of Prudential; Executive Vice President, Chief Legal Officer and Secretary (since July 2005) of PI and Prudential Mutual Fund Services LLC; formerly Managing Director, General Counsel, Chief Compliance Officer, Chief Risk Officer and Corporate Secretary (1997-2002) of Zurich Scudder Investments, Inc.
| 42 | Visit our website at www.jennisondryden.com |
Deborah A. Docs (47), Secretary since 2004(3)
Principal occupations (last 5 years): Vice President and Corporate Counsel (since January 2001) of Prudential; Vice President (since December 1996) and Assistant Secretary (since March 1999) of Prudential Investments LLC; formerly Vice President and Assistant Secretary (May 2003-June 2005) of American Skandia Investment Services, Inc.
Jonathan D. Shain (47), Assistant Secretary since 2005(3)
Principal occupations (last 5 years): Vice President and Corporate Counsel (since August 1998) of Prudential; Vice President and Assistant Secretary (since May 2001) of Prudential Investments LLC; Vice President and Assistant Secretary (since February 2001) of PMFS; formerly Vice President and Assistant Secretary (May 2003-June 2005) of American Skandia Investment Services, Inc.
Marina Belaya (38), Assistant Secretary since 2005(3)
Principal occupations (last 5 years): Vice President and Corporate Counsel (since April 2005) of Prudential; formerly Associate (September 2002-March 2005) at Schutle, Roth & Zabel LLP.
Claudia DiGiacomo (31), Assistant Secretary since 2005(3)
Principal occupations (last 5 years): Vice President and Corporate Counsel (since January 2005) of Prudential; Associate at Sidley Austin Brown & Wood LLP (1999-2004).
Lee D. Augsburger (46), Chief Compliance Officer since 2004(3)
Principal occupations (last 5 years): Senior Vice President and Chief Compliance Officer (since April 2003) of Prudential Investments LLC; Vice President (since November 2000) and Chief Compliance Officer (since October 2000) of Prudential Investment Management, Inc.; Chief Compliance Officer and Senior Vice President (since May 2003) of American Skandia Investment Services, Inc.; Chief Compliance Officer (since October 2004) of Quantitative Management Associates LLC.
Maryanne Ryan (41), Anti-Money Laundering Compliance Officer since 2002(3)
Principal occupations (last 5 years): Anti-Money Laundering Officer and Vice President (since April 2002) of Pruco Securities, LLC. Vice President and Bank Secrecy Act Officer (since July 2004) of Prudential Trust Company; Anti-Money Laundering Officer (since April 2003) of Prudential Investments LLC.
Grace C. Torres (46), Treasurer and Principal Financial and Accounting Officer since 1998(3)
Principal occupations (last 5 years): Assistant Treasurer (since March 1999) and Senior Vice President (since September 1999) of Prudential Investments LLC; Assistant Treasurer (since May 2003) and Vice President (since June 2005) of American Skandia Investment Services, Inc.; Senior Vice President and Assistant Treasurer (since May 2003) of American Skandia Advisory Services, Inc.; formerly Senior Vice President (May 2003-June 2005) of American Skandia Investment Services, Inc.
Jack Benintende (41), Acting Treasurer since 2005(3)
Vice President (since June 2000) within Prudential Mutual Fund Administration; Assistant Treasurer (since September 2004) of The High Yield Plus Fund, Inc.; formerly Assistant Treasurer (2000-October 2004) of Aberdeen Asia-Pacific Income Fund, Inc. and Aberdeen Australia Equity Fund, Inc.; Senior manager within the investment management practice of PricewaterhouseCoopers LLP (May 1994 through June 2000).
| Jennison Global Growth Fund | 43 |
| (1) | “Interested” Director, as defined in the 1940 Act, by reason of employment with the Manager, the Subadviser(s) or the Distributor. |
| (2) | Unless otherwise noted, the address of the Directors and Officers is c/o: Prudential Investments LLC, Gateway Center Three, 100 Mulberry Street, Newark, NJ 07102. |
| (3) | There is no set term of office for Directors and Officers. The Independent Directors have adopted a retirement policy, which calls for the retirement of Directors on December 31 of the year in which they reach the age of 75. The table shows the individuals length of service as Director and/or Officer. |
| (4) | This column includes only directorships of companies required to register, or file reports with the SEC under the Securities and Exchange Act of 1934 (that is, “public companies”) or other investment companies registered under the 1940 Act. |
| † | The Fund Complex consists of all investment companies managed by PI. The Funds for which PI serves as manager include JennisonDryden Mutual Funds, Strategic Partners Funds, The Prudential Variable Contract Accounts 2, 10, 11, The Target Portfolio Trust, The Prudential Series Fund, Inc., American Skandia Trust and Prudential’s Gibraltar Fund. |
| 44 | Visit our website at www.jennisondryden.com |
Approval of Advisory Agreements
The Board of Directors (the “Board”) of Prudential World Fund, Inc. oversees the management of Jennison Global Growth Fund (the “Fund”), and, as required by law, determines annually whether to renew the Fund’s management agreement with Prudential Investments LLC (“PI”) and the Fund’s subadvisory agreement with Jennison Associates LLC (“Jennison”). In considering the renewal of the agreements, the Board, including a majority of the Independent Directors, met on May 24, 2005 and June 23, 2005 and approved the renewal of the agreements through July 31, 2006, after concluding that renewal of the agreements was in the best interests of the Fund and its shareholders.
In advance of the meetings, the Board received materials relating to the agreements, and had the opportunity to ask questions and request further information in connection with their consideration. Among other things, the Board considered performance and expense comparisons with other mutual funds in relevant Peer Universes and Peer Groups. The mutual funds included in each Peer Universe or Peer Group were objectively determined solely by Lipper Inc. (“Lipper”), an independent provider of mutual fund data. Peer Universes and Peer Groups are mutual funds grouped according to investment style. If the quartile refers to performance, then a fund in the first quartile is among the best performers. If the quartile refers to expenses, then a fund in the first quartile has among the lowest expenses.
In approving the agreements, the Board, including the Independent Directors advised by independent legal counsel, considered the factors they deemed relevant, including the nature, quality and extent of services provided, the performance of the Fund, the profitability of PI and its affiliates, expenses and fees, and the potential for economies of scale that may be shared with the Fund and its shareholders. In their deliberations, the Directors did not identify any single factor that was dispositive and each Director attributed different weights to the various factors. In connection with their deliberations, the Board considered information provided by PI throughout the year at regular Board meetings, presentations from portfolio managers and other information, as well as information furnished at or in advance of the meetings on May 24, 2005 and June 23, 2005.
The Directors determined that the overall arrangements between the Fund and PI, which serves as the Fund’s investment manager pursuant to a management agreement, and between PI and Jennison, which serves as the Fund’s subadviser pursuant to the terms of a subadvisory agreement with PI, are fair and reasonable in light of the services performed, fees charged, and such other matters as the Directors considered relevant in the exercise of their business judgment.
| Jennison Global Growth Fund |
Approval of Advisory Agreements (continued)
Several of the material factors and conclusions that formed the basis for the Directors reaching their determinations to approve the continuance of the agreements are separately discussed below.
Nature, Quality and Extent of Services
The Board received and considered information regarding the nature and extent of services provided to the Fund by PI and Jennison. The Board considered the services provided by PI, including but not limited to the oversight of the subadviser for the Fund, as well as the provision of recordkeeping, compliance, and other services to the Fund. With respect to PI’s oversight of the subadviser, the Board noted that PI’s Strategic Investment Research Group (“SIRG”), which is a business unit of PI, is responsible for monitoring and reporting to PI’s senior management on the performance and operations of the subadviser. The Board also considered that PI pays the salaries of all of the officers and non-independent Directors of the Fund. The Board also considered the investment subadvisory services provided by Jennison, as well as adherence to the Fund’s investment restrictions and compliance with applicable Fund policies and procedures.
The Board reviewed the qualifications, backgrounds and responsibilities of PI’s senior management responsible for the oversight of the Fund and Jennison, and also reviewed the qualifications, backgrounds and responsibilities of Jennison’s portfolio managers who are responsible for the day-to-day management of the Fund’s portfolio. The Board was provided with information pertaining to PI’s and Jennison’s organizational structure, senior management, investment operations, and other relevant information pertaining to both PI and Jennison. The Board also noted that it received favorable compliance reports from the Fund’s Chief Compliance Officer (CCO) as to both PI and Jennison. The Board noted that Jennison is affiliated with PI.
The Board concluded that it was satisfied with the nature, extent and quality of the investment management services provided by PI and the subadvisory services provided to the Fund by Jennison, and that there was a reasonable basis on which to conclude that the Fund benefits from the services provided by PI and Jennison under the management and subadvisory agreements.
Performance of Jennison Global Growth Fund
The Board received and considered information about the Fund’s historical performance, noting that the Fund had achieved gross performance that was in the third quartile over a one-year period ended December 31, 2004, and performance
| Visit our website at www.jennisondryden.com |
that was in the fourth quartile over three-year and five-year periods ended December 31, 2004 in relation to the group of comparable funds in a Peer Universe. Over the same time periods, the Fund achieved net performance that was in the third quartile over one-year and three-year time periods, and gross performance that was in the fourth quartile over a five-year period. Gross performance does not reflect the impact of expense or fee waivers, or subsidies, while net performance does reflect the impact of waivers or subsidy arrangements.
In addition, the Board noted that the Fund underperformed over similar time periods when compared against the appropriate benchmark index, the MSCI World Index. While expressing the view that the Fund’s performance was disappointing, the Board noted that PI had taken steps to address performance issues by placing the Fund on its “watch list” for close monitoring. As a result, the Board concluded that it was reasonable to approve the management and subadvisory agreements and to continue to monitor the steps being taken to improve performance.
Fees and Expenses
The Board considered the management fee for the Fund as compared to the management fee charged by PI to other funds and accounts and the fee charged by other advisers to comparable mutual funds as provided by Lipper.
The Fund’s l management fee of 0.750% ranked in the first quartile in its Peer Group. The Board concluded that the management and subadvisory fees are reasonable.
Costs of Services and Profits Realized by PI
The Board was provided with information on the profitability of PI and its affiliates in serving as the Fund’s investment manager. The Board discussed with PI the methodology utilized in assembling the information regarding profitability and considered its reasonableness. The Board recognized that it is difficult to make comparisons of profitability from fund management contracts because comparative information is not generally publicly available and is affected by numerous factors, including the structure of the particular adviser, the types of funds it manages, its business mix, numerous assumptions regarding allocations and the adviser’s capital structure and cost of capital. The Board did not separately consider the profitability of the subadviser, an affiliate of PI, as its profitability was reflected in the profitability report for PI. Taking these factors into account, the Board concluded that the profitability of PI and its affiliates in relation to the services rendered was not unreasonable.
| Jennison Global Growth Fund |
Approval of Advisory Agreements (continued)
Economies of Scale
The Board noted that the management fee schedule for the Fund includes breakpoints, which have the effect of decreasing the fee rate as assets increase, but at the current level of assets, the Fund does not realize the effect of those rate reductions. The Board received and discussed information concerning whether PI realizes economies of scale as the Fund’s assets grow beyond current levels. The Board took note that the Fund’s fee structure would result in benefits to Fund shareholders when (and if) assets reach the levels at which the fee rate is reduced. These benefits will accrue whether or not PI is then realizing any economies of scale.
Other Benefits to PI and Jennison
The Board considered potential ancillary benefits that might be received by PI and Jennison and their affiliates as a result of their relationship with the Fund. The Board concluded that potential benefits to be derived by PI included brokerage commissions received by affiliates of PI, transfer agency fees received by the Fund’s transfer agent (which is affiliated with PI), as well as reputational or other intangible benefits resulting from PI’s association with the Fund. The Board concluded that the potential benefits to be derived by Jennison included the ability to use soft dollar credits, brokerage commissions received by affiliates of Jennison, as well as the potential benefits consistent with those generally resulting from an increase in assets under management, specifically potential access to additional research resources and reputational benefits. The Board concluded that the benefits derived by PI and Jennison were consistent with the types of benefits generally derived by investment managers and subadvisers to mutual funds.
| Visit our website at www.jennisondryden.com |
Growth of a $10,000 Investment
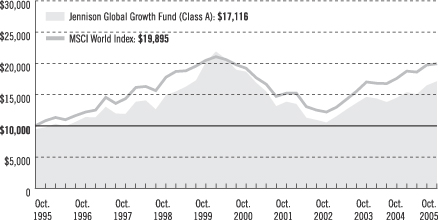
| Average Annual Total Returns (With Sales Charges) as of 10/31/05 | |||||||||||
| One Year | Five Years | Ten Years | Since Inception | ||||||||
Class A | 11.85 | % | –3.12 | % | 5.52 | % | 6.38% | ||||
Class B | 12.82 | –2.72 | 5.46 | 9.42 (9.31) | |||||||
Class C | 16.51 | –2.72 | 5.36 | 5.53 | |||||||
Class Z | 18.72 | –1.78 | N/A | 6.15 | |||||||
| Average Annual Total Returns (Without Sales Charges) as of 10/31/05 | |||||||||||
| One Year | Five Years | Ten Years | Since Inception | ||||||||
Class A | 18.36 | % | –2.02 | % | 6.12 | % | 6.76% | ||||
Class B | 17.82 | –2.56 | 5.46 | 9.42 (9.31) | |||||||
Class C | 17.51 | –2.72 | 5.36 | 5.53 | |||||||
Class Z | 18.72 | –1.78 | N/A | 6.15 | |||||||
Performance data quoted represent past performance. Past performance does not guarantee future results. The investment return and principal value of an investment will fluctuate, so that an investor’s shares, when redeemed, may be worth more or less than their original cost. Current performance may be lower or higher than the past performance data quoted. An investor may obtain performance data as of the most recent month-end by visiting our website at www.jennisondryden.com or by calling (800) 225-1852. The maximum initial sales charge is 5.50%.
The returns in the graph and the tables do not reflect the deduction of taxes that a shareholder would pay on Fund distributions or following the redemption of Fund shares.
| Visit our website at www.jennisondryden.com |
Source: Prudential Investments LLC and Lipper Inc.
Inception dates: Class A, 1/22/90; Class B, 5/15/84; Class C, 8/1/94; and Class Z, 3/1/96.
The graph compares a $10,000 investment in the Jennison Global Growth Fund (Class A shares) with a similar investment in the MSCI World Index by portraying the initial account values at the beginning of the 10-year period for Class A shares (October 31, 1995) and the account values at the end of the current fiscal year (October 31, 2005) as measured on a quarterly basis. For purposes of the graph, and unless otherwise indicated, it has been assumed that (a) the maximum applicable front-end sales charge was deducted from the initial $10,000 investment in Class A shares; (b) all recurring fees (including management fees) were deducted; and (c) all dividends and distributions were reinvested. The line graph provides information for Class A shares only. As indicated in the tables provided earlier, performance for Class B, Class C, and Class Z shares will vary due to the differing charges and expenses applicable to each share class (as indicated in the following paragraphs). Without a distribution and service (12b-1) fee waiver of 0.05% annually for Class A shares through October 31, 2005, the returns shown in the graph and for Class A shares in the tables would have been lower.
The MSCI World Index is an unmanaged, weighted index of performance that reflects the stock price movement in securities listed on stock exchanges of Australia, Canada, Europe, the Far East, and the United States. The MSCI World Index’s total returns include the reinvestment of all dividends, but do not include the effects of sales charges, operating expenses of a mutual fund, or taxes. These returns would be lower if they included the effects of sales charges, operating expenses, or taxes. The securities that comprise the MSCI World Index may differ substantially from the securities in the Fund. The MSCI World Index is not the only index that may be used to characterize performance of global stock funds. Other indexes may portray different comparative performance. Investors cannot invest directly in an index.
Class A shares are subject to a maximum front-end sales charge of 5.50%, a 12b-1 fee of up to 0.30% annually, and all investors who purchase Class A shares in an amount of $1 million or more and sell these shares within 12 months of purchase are subject to a contingent deferred sales charge (CDSC) of 1%, in certain circumstances. Class B shares are subject to a declining CDSC of 5%, 4%, 3%, 2%, 1%, and 1% respectively for the first six years after purchase and a 12b-1 fee of 1% annually. Approximately seven years after purchase, Class B shares will automatically convert to Class A shares on a quarterly basis. Class C shares purchased are not subject to a front-end sales charge, but charge a CDSC of 1% for Class C shares sold within 12 months from the date of purchase and an annual 12b-1 fee of 1%. Class Z shares are not subject to a sales charge or 12b-1 fees. The returns in the graph and tables reflect the share class expense structure in effect at the close of the fiscal period.
| Jennison Global Growth Fund |
| n MAIL | n TELEPHONE | n WEBSITE | ||
Gateway Center Three 100 Mulberry Street Newark, NJ 07102 | (800) 225-1852 | www.jennisondryden.com |
| PROXY VOTING |
| The Board of Directors of the Fund has delegated to the Fund’s investment subadviser the responsibility for voting any proxies and maintaining proxy recordkeeping with respect to the Fund. A description of these proxy voting policies and procedures is available without charge, upon request, by calling (800) 225-1852 or by visiting the Securities and Exchange Commission’s (the Commission) website at www.sec.gov. Information regarding how the Fund voted proxies relating to portfolio securities during the most recent 12-month period ended June 30, 2005, is available on the Fund’s website at www.jennisondryden.com and on the Commission’s website at www.sec.gov. |
| DIRECTORS |
| Linda W. Bynoe • David E.A. Carson • Robert F. Gunia • Robert E. La Blanc • Douglas H. McCorkindale • Richard A. Redeker • Judy A. Rice • Robin B. Smith • Stephen G. Stoneburn • Clay T. Whitehead |
| OFFICERS |
| Judy A. Rice, President • Robert F. Gunia, Vice President • Grace C. Torres, Treasurer and Principal Financial and Accounting Officer • Jack Benintende, Acting Treasurer • Deborah A. Docs, Secretary • Jonathan D. Shain, Assistant Secretary • Claudia DiGiacomo, Assistant Secretary • Marina Belaya, Assistant Secretary • Maryanne Ryan, Anti-Money Laundering Compliance Officer • Lee D. Augsburger, Chief Compliance Officer |
| MANAGER | Prudential Investments LLC | Gateway Center Three 100 Mulberry Street Newark, NJ 07102 | ||
| INVESTMENT SUBADVISER | Jennison Associates, LLC | 466 Lexington Avenue New York, NY 10017 | ||
| DISTRIBUTOR | Prudential Investment Management Services LLC | Gateway Center Three 100 Mulberry Street Newark, NJ 07102 | ||
| CUSTODIAN | The Bank of New York | One Wall Street New York, NY 10286 | ||
| TRANSFER AGENT | Prudential Mutual Fund Services LLC | PO Box 8098 Philadelphia, PA 19176 | ||
| INDEPENDENT REGISTERED PUBLIC ACCOUNTING FIRM | KPMG LLP | 345 Park Avenue New York, NY 10154 | ||
| FUND COUNSEL | Sullivan & Cromwell LLP | 125 Broad Street New York, NY 10004 | ||
| An investor should consider the investment objectives, risks, charges, and expenses of the Fund carefully before investing. The prospectus for the Fund contains this and other information about the Fund. An investor may obtain a prospectus by visiting our website at www.jennisondryden.com or by calling (800) 225-1852. The prospectus should be read carefully before investing. |
| E-DELIVERY |
To receive your mutual fund documents on-line, go to www.icsdelivery.com/prudential/funds website address. |
| SHAREHOLDER COMMUNICATIONS WITH DIRECTORS |
| Shareholders can communicate directly with the Board of Directors by writing to the Chair of the Board, Jennison Global Growth Fund, PO Box 13964, Philadelphia, PA 19176. Shareholders can communicate directly with an individual Director by writing to the same address. Communications are not screened before being delivered to the addressee. |
| AVAILABILITY OF PORTFOLIO SCHEDULE |
| The Fund files its complete schedule of portfolio holdings with the Securities and Exchange Commission (the Commission) for the first and third quarters of each fiscal year on Form N-Q. The Fund’s Forms N-Q are available on the Commission’s website at www.sec.gov. The Fund’s Forms N-Q may also be reviewed and copied at the Commission’s Public Reference Room in Washington, D.C. Information on the operation and location of the Public Reference Room may be obtained by calling (800) SEC-0330 (732-0330). The Fund will provide a full list of its portfolio holdings on its website (www.jennisondryden.com) as of the end of each month within approximately 30 days after the end of the month. |
| The Fund’s Statement of Additional Information contains additional information about the Fund’s Directors and is available without charge, upon request, by calling (800) 225-1852. |
Mutual Funds:
| ARE NOT INSURED BY THE FDIC OR ANY FEDERAL GOVERNMENT AGENCY | MAY LOSE VALUE | ARE NOT A DEPOSIT OF OR GUARANTEED BY ANY BANK OR ANY BANK AFFILIATE |

| Jennison Global Growth Fund | ||||||||||||
| Share Class | A | B | C | Z | ||||||||
NASDAQ | PRGAX | PRGLX | PRGCX | PWGZX | ||||||||
CUSIP | 743969107 | 743969206 | 743969305 | 743969404 | ||||||||
MF115E IFS-A112579 Ed. 12/2005
ANNUAL REPORT
OCTOBER 31, 2005
STRATEGIC PARTNERS
INTERNATIONAL VALUE FUND
FUND TYPE
International stock
OBJECTIVE
Long-term growth of capital

This report is not authorized for distribution to prospective investors unless preceded or accompanied by a current prospectus.
The views expressed in this report and information about the Fund’s portfolio holdings are for the period covered by this report and are subject to change thereafter.

December 15, 2005
Dear Shareholder:
We hope you find the annual report for the Strategic Partners International Value Fund, a Series of the Prudential World Fund, Inc., informative and useful. As a Strategic Partners mutual fund shareholder, you may be thinking about where you can find additional growth opportunities. You could invest in last year’s top-performing asset class and hope history repeats itself or you could stay in cash while waiting for the “right moment” to invest.
Instead, we believe it is better to take advantage of developing domestic and global investment opportunities through a diversified portfolio of stock and bond mutual funds. A diversified asset allocation offers two potential advantages. It helps you manage downside risk by not being overly exposed to any particular asset class, plus it gives you a better opportunity to have at least some of your assets in the right place at the right time. Your financial professional can help you create a diversified investment plan that may include mutual funds covering all the basic asset classes and that reflects your personal investment profile and tolerance for risk.
Strategic Partners Mutual Funds gives you a wide range of choices that can help you make progress toward your financial goals. Our funds feature leading asset managers not just from a single company but from the entire investment industry.
Thank you for choosing Strategic Partners Mutual Funds.
Sincerely,

Judy A. Rice, President
Strategic Partners International Value Fund
| Strategic Partners International Value Fund | 1 |
Your Fund’s Performance
Fund objective
The investment objective of the Strategic Partners International Value Fund (the Fund) is long-term growth of capital through investment in equity securities of foreign issuers. There can be no assurance that the Fund will achieve its investment objective.
Performance data quoted represent past performance. Past performance does not guarantee future results. The investment return and principal value of an investment will fluctuate, so that an investor’s shares, when redeemed, may be worth more or less than their original cost. Current performance may be lower or higher than the past performance data quoted. An investor may obtain performance data as of the most recent month-end by visiting our website at www.strategicpartners.com or by calling (800) 225-1852. The maximum initial sales charge is 5.50% (Class A shares).
| Cumulative Total Returns1 as of 10/31/05 | ||||||||||||
| One Year | Five Years | Ten Years | Since Inception2 | |||||||||
Class A | 20.71 | % | 10.09 | % | N/A | 65.82 | % | |||||
Class B | 19.77 | 5.93 | N/A | 54.73 | ||||||||
Class C | 19.81 | 6.02 | N/A | 54.86 | ||||||||
Class Z | 20.97 | 11.37 | 89.77 | % | 197.06 (196.66) | |||||||
MSCI EAFE® Index3 | 18.09 | 16.15 | 75.87 | *** | ||||||||
Lipper International Large-Cap Core Funds Avg.4 | 16.80 | 3.47 | 77.98 | **** | ||||||||
| Average Annual Total Returns1 as of 9/30/05 | ||||||||||||
| One Year | Five Years | Ten Years | Since Inception2 | |||||||||
Class A | 20.94 | % | 1.06 | % | N/A | 5.41 | % | |||||
Class B | 22.00 | 1.23 | N/A | 5.27 | ||||||||
Class C | 26.04 | 1.44 | N/A | 5.28 | ||||||||
Class Z | 28.29 | 2.44 | 6.68 | % | 9.02 | |||||||
MSCI EAFE® Index3 | 25.79 | 3.16 | 5.83 | *** | ||||||||
Lipper International Large-Cap Core Funds Avg.4 | 24.07 | 0.48 | 5.86 | **** | ||||||||
The cumulative total returns do not reflect the deduction of applicable sales charges. If reflected, the applicable sales charges would reduce the cumulative total returns performance quoted. Class A shares are subject to a maximum front-end sales charge of 5.50%. Under certain circumstances, Class A shares may be subject to a contingent deferred sales charge (CDSC) of 1%. Class B and Class C shares are subject to a maximum CDSC of 5% and 1% respectively. Class Z shares are not subject to a sales charge.
| 2 | Visit our website at www.strategicpartners.com |
1Source: Prudential Investments LLC and Lipper Inc. The average annual total returns take into account applicable sales charges. During certain periods shown, fee waivers and/or expense reimbursements were in effect. Without such fee waivers and expense reimbursements, the returns for the share classes would have been lower, as indicated in parentheses. Class A, Class B, and Class C shares are subject to an annual distribution and service (12b-1) fee of up to 0.30%, 1.00%, and 1.00% respectively. Approximately seven years after purchase, Class B shares will automatically convert to Class A shares on a quarterly basis. Class Z shares are not subject to a 12b-1 fee. The returns in the tables do not reflect the deduction of taxes that a shareholder would pay on Fund distributions or following the redemption of Fund shares.
2Inception dates: Class A, Class B, and Class C, 9/23/96; Class Z, 11/5/92.
3The Morgan Stanley Capital International Europe, Australasia, and Far East Index (MSCI EAFE® Index) is an unmanaged, weighted index of performance that reflects stock price movements of developed-country markets in Europe, Australasia, and the Far East.
4The Lipper International Large-Cap Core Funds Average (Lipper Average) represents returns based on an average return of all funds in the Lipper International Large-Cap Core Funds category. Funds in the Lipper Average invest at least 75% of their equity assets in companies strictly outside of the United States with market capitalizations (on a three-year weighted basis) greater than the 250th largest company in the S&P/Citigroup World ex-U.S. Broad Market Index (BMI). Large-cap core funds typically have an average price-to-cash flow ratio, price-to-book ratio, and three-year sales-per-share growth value compared with the S&P/Citigroup World ex-U.S. BMI.
Investors cannot invest directly in an index. The returns for the MSCI EAFE® Index and the Lipper Average would be lower if they included the effects of sales charges, operating expenses, or taxes. Returns for the Lipper Average reflect the deduction of operating expenses of a mutual fund, but not sales charges or taxes.
***MSCI EAFE® Index Closest Month-End to Inception cumulative total returns as of 10/31/05 are 57.57% for Class A, Class B, and Class C, and 165.15% for Class Z. MSCI EAFE® Index Closest Month-End to Inception average annual total returns as of 9/30/05 are 5.53% for Class A, Class B, and Class C, and 8.09% for Class Z.
****Lipper Average Closest Month-End to Inception cumulative total returns as of 10/31/05 are 59.10% for Class A, Class B, and Class C, and 182.85% for Class Z. Lipper Average Closest Month-End to Inception average annual total returns as of 9/30/05 are 5.43% for Class A, Class B, and Class C, and 8.35% for Class Z.
| Five Largest Holdings expressed as a percentage of net assets as of 10/31/05 | |||
Toyota Motor Corp., Automobiles | 2.3 | % | |
UBS AG, Commercial Banks | 2.2 | ||
Lloyds TSB Group PLC, Commercial Banks | 1.8 | ||
Barclays PLC, Commercial Banks | 1.7 | ||
America Movil SA de CV, Series L, Wireless Telecommunication Services | 1.6 |
Holdings are subject to change.
| Five Largest Industries expressed as a percentage of net assets as of 10/31/05 | |||
Commercial Banks | 17.2 | % | |
Oil & Gas | 11.3 | ||
Pharmaceuticals | 8.2 | ||
Automobiles | 6.3 | ||
Diversified Telecommunications | 5.6 |
Industry weightings are subject to change.
| Strategic Partners International Value Fund | 3 |
Investment Subadviser’s Report
A very strong year
It was a good year for international stocks generally, and the Fund had an even better year, outpacing both the MSCI EAFE Index and the Lipper International Large-Cap Core Funds Average. The Fund benefited from its emphases on the stocks of smaller companies and firms in emerging-market countries.
The MSCI EAFE Index substantially outperformed the U.S. stock market, but the factors that drove its performance were similar. For the most part, differences in national or regional markets reflected the concentrations of industries in those regions. Market performance was broad, with all sectors posting positive returns and weakness concentrated in the information technology and telecommunication services industries. Both of these industries are sensitive to the level of corporate investment in new technology. The strongest sectors were those reflecting broad economic development, such as industrials and financials. Sectors where there also were limitations on supply—energy and materials—were the market leaders, with substantially higher returns than the others.
The Fund had new managers
Very early in the reporting period, Bank of Ireland Asset Management was replaced by a pairing of LSV Asset Management and Thornburg Investment Management, Inc. The decision to replace Bank of Ireland was made when four senior investment professionals left the firm.
LSV and Thornburg were selected in part because their styles complemented each another. LSV uses a quantitative deep value investment strategy and maintains a relatively large portfolio. Thornburg uses traditional analysis of business fundamentals and a relative value strategy to select a portfolio with fewer and larger individual stock positions. Whereas LSV has no emerging-market exposure, Thornburg may invest as much as 30% of its investable assets in emerging-market countries. We expect the Fund’s resulting overall exposure to have a somewhat lower average market capitalization than the MSCI EAFE Index (a bias to smaller-cap stocks) and an exposure to emerging-market stocks. Emerging markets are not included in the benchmark MSCI EAFE Index. The combination of two different investing styles should result in lower volatility than either would separately. The Fund’s new portfolio contrasts with Bank of Ireland’s focus on the largest companies in the Fund’s universe (“mega caps”).
Emphasis on smaller caps helped relative performance
The emphasis on smaller firms helped the Fund’s performance in this reporting period, particularly in the materials and industrials sectors and within Finland and
| 4 | Visit our website at www.strategicpartners.com |
Germany. Both asset managers contributed to the smaller-cap focus. It is characteristic of LSV’s style, whereas it was a current emphasis by Thornburg.
Emerging-market countries were particularly strong
The Fund benefited from the emerging-market exposure provided by Thornburg as this market segment had particularly high returns. Significant contributions came from positions in Korean firms Samsung Electronics and POSCO (steel), and the Brazilian iron ore company Companhia Vale de Rio Doce.
Diversification meant missing some opportunities
The Fund’s investments in Continental Europe and Japan, taken together, made a positive contribution to its return, but trailed the market average. There were some declining positions in Denmark and Switzerland. The Fund’s relative performance also suffered from the absence of any investments in New Zealand, which had a strong materials-driven market.
The Portfolio of Investments following this report shows the size of the Fund’s positions at period-end.
| Strategic Partners International Value Fund | 5 |
Strategic Partners Research-Based Funds
Strategic policy development
| • | We provide style-consistent funds advised by institutional asset managers in a mutual fund format. |
| • | We analyze the investment strategies of different asset managers and how they have performed in various economic and market environments. |
| • | We select managers with an intensive review process that includes long-term risk-adjusted performance, consistent adherence to investment style, organizational resources and structure, key personnel tenure compliance, and reputation. |
| • | We often match managers that have different substyles, with the aim of increasing diversification, reducing risk, and improving style consistency. |
Continuing oversight
| • | We monitor changes in personnel, practices, and performance at the various asset management companies. Each fund’s performance is reviewed quarterly. Managers may be changed or new portions added to a fund if we think it will improve the fund’s performance. |
| 6 | Visit our website at www.strategicpartners.com |
Fees and Expenses (Unaudited)
As a shareholder of the Fund, you incur two types of costs: (1) transaction costs, including sales charges (loads) on purchase payments and redemptions, as applicable, and (2) ongoing costs, including management fees, distribution and/or service (12b-1) fees, and other Fund expenses, as applicable. This example is intended to help you understand your ongoing costs (in dollars) of investing in the Fund and to compare these costs with the ongoing costs of investing in other mutual funds.
The example is based on an investment of $1,000 invested on May 1, 2005, at the beginning of the period, and held through the six-month period ended October 31, 2005.
The Fund’s transfer agent may charge additional fees to holders of certain accounts that are not included in the expenses shown in the table on the following page. These fees apply to Individual Retirement Accounts (IRAs) and Section 403(b) accounts. As of the close of the six-month period covered by the table, IRA fees included an annual maintenance fee of $15 per account (subject to a maximum annual maintenance fee of $25 for all accounts held by the same shareholder). Section 403(b) accounts are charged an annual $25 fiduciary maintenance fee. Some of the fees may vary in amount, or may be waived, based on your total account balance or the number of JennisonDryden or Strategic Partners Funds, including the Fund, that you own. You should consider the additional fees that were charged to your Fund account over the six-month period when you estimate the total ongoing expenses paid over the period and the impact of these fees on your ending account value, as these additional expenses are not reflected in the information provided in the expense table. Additional fees have the effect of reducing investment returns.
Actual Expenses
The first line for each share class in the table on the following page provides information about actual account values and actual expenses. You may use the information on this line, together with the amount you invested, to estimate the expenses that you paid over the period. Simply divide your account value by $1,000 (for example, an $8,600 account value ÷ $1,000 = 8.6), then multiply the result by the number on the first line under the heading “Expenses Paid During the Six-Month Period” to estimate the expenses you paid on your account during this period.
Hypothetical Example for Comparison Purposes
The second line for each share class in the table on the following page provides information about hypothetical account values and hypothetical expenses based on the Fund’s actual expense ratio and an assumed rate of return of 5% per year before expenses, which is not the Fund’s actual return. The hypothetical account values and
| Strategic Partners International Value Fund | 7 |
Fees and Expenses (continued)
expenses may not be used to estimate the actual ending account balance or expenses you paid for the period. You may use this information to compare the ongoing costs of investing in the Fund and other funds. To do so, compare this 5% hypothetical example with the 5% hypothetical examples that appear in the shareholder reports of the other funds.
Please note that the expenses shown in the table are meant to highlight your ongoing costs only, and do not reflect any transactional costs such as sales charges (loads). Therefore the second line for each share class in the table is useful in comparing ongoing costs only, and will not help you determine the relative total costs of owning different funds. In addition, if these transactional costs were included, your costs would have been higher.
| Strategic Partners International Value Fund | Beginning Account Value May 1, 2005 | Ending Account October 31, 2005 | Annualized Expense Ratio Based on the Six-Month Period | Expenses Paid During the Six- Month Period* | ||||||||||
| Class A | Actual | $ | 1,000.00 | $ | 1,105.11 | 1.62 | % | $ | 8.60 | |||||
| Hypothetical | $ | 1,000.00 | $ | 1,017.04 | 1.62 | % | $ | 8.24 | ||||||
| Class B | Actual | $ | 1,000.00 | $ | 1,100.82 | 2.37 | % | $ | 12.55 | |||||
| Hypothetical | $ | 1,000.00 | $ | 1,013.26 | 2.37 | % | $ | 12.03 | ||||||
| Class C | Actual | $ | 1,000.00 | $ | 1,100.72 | 2.37 | % | $ | 12.55 | |||||
| Hypothetical | $ | 1,000.00 | $ | 1,013.26 | 2.37 | % | $ | 12.03 | ||||||
| Class Z | Actual | $ | 1,000.00 | $ | 1,106.01 | 1.37 | % | $ | 7.27 | |||||
| Hypothetical | $ | 1,000.00 | $ | 1,018.30 | 1.37 | % | $ | 6.97 | ||||||
* Fund expenses (net of fee waivers or subsidies, if any) for each share class are equal to the annualized expense ratio for each share class (provided in the table), multiplied by the average account value over the period, multiplied by the 184 days in the six-month period ended October 31, 2005, and divided by the 365 days in the Fund’s fiscal year ended October 31, 2005 (to reflect the six-month period).
| 8 | Visit our website at www.strategicpartners.com |
Portfolio of Investments
as of October 31, 2005
| Shares | Description | Value (Note 1) | |||
LONG-TERM INVESTMENTS 97.1% | |||||
COMMON STOCKS 96.7% | |||||
Australia 2.2% | |||||
| 171,288 | Bluescope Steel, Ltd. | $ | 1,090,768 | ||
| 356,182 | CSR, Ltd. | 779,977 | |||
| 350,768 | David Jones, Ltd. | 597,121 | |||
| 144,135 | Santos, Ltd. | 1,182,565 | |||
| 42,668 | Suncorp-Metway, Ltd. | 616,098 | |||
| 379,203 | Telstra Corp., Ltd. | 1,195,717 | |||
| 5,462,246 | |||||
Austria 0.3% | |||||
| 5,295 | Boehler-Uddeholm AG | 802,743 | |||
Belgium 0.5% | |||||
| 38,328 | Dexia | 827,734 | |||
| 18,100 | Fortis | 515,184 | |||
| 1,342,918 | |||||
Bermuda 0.3% | |||||
| 211,647 | Orient Overseas International, Ltd. | 677,878 | |||
Brazil 1.2% | |||||
| 74,377 | Empresa Brasileira de Aeronautica SA (ADR) | 2,885,084 | |||
Canada 3.2% | |||||
| 52,300 | Canadian Natural Resources, Ltd. | 2,138,318 | |||
| 96,172 | Rogers Communications, Inc. (Class B) | 3,794,442 | |||
| 102,566 | Shaw Communications, Inc. (Class B) | 2,071,119 | |||
| 8,003,879 | |||||
China 1.5% | |||||
| 902,700 | China Construction Bank (Class H)(a) | 273,648 | |||
| 5,352,034 | China Petroleum and Chemical Corp. (Class H) | 2,161,248 | |||
| 1,136,900 | China Shenhua Energy Co., Ltd. (Class H)(a) | 1,246,585 | |||
| 3,681,481 | |||||
Denmark 2.5% | |||||
| 6,465 | Danisco A/S | 412,689 | |||
| 26,845 | Danske Bank A/S | 841,729 | |||
| 48,579 | Novo Nordisk A/S | 2,488,610 | |||
| 46,700 | TDC A/S | 2,613,589 | |||
| 6,356,617 | |||||
See Notes to Financial Statements.
| Strategic Partners International Value Fund | 9 |
Portfolio of Investments
as of October 31, 2005 Cont’d.
| Shares | Description | Value (Note 1) | |||
Finland 0.7% | |||||
| 57,600 | Rautaruukki Oyj | $ | 1,176,284 | ||
| 39,159 | Sampo Oyj | 600,705 | |||
| 1,776,989 | |||||
France 6.9% | |||||
| 29,923 | BNP Paribas SA | 2,268,222 | |||
| 27,645 | Bouygues SA | 1,364,010 | |||
| 43,345 | Carrefour SA | 1,927,227 | |||
| 5,603 | Ciments Francais SA | 634,224 | |||
| 7,696 | CNP Assurances | 535,411 | |||
| 17,855 | Compagnie Generale des Etablissements Michelin (Class B) | 963,781 | |||
| 5,400 | Natexis Banques Populaires | 812,190 | |||
| 19,518 | PSA Peugoet Citroen SA | 1,185,941 | |||
| 8,805 | Renault Regie Nationale | 762,408 | |||
| 41,694 | Sanofi-Aventis | 3,337,874 | |||
| 8,066 | Societe Generale | 920,753 | |||
| 71,483 | Suez SA | 1,936,115 | |||
| 2,217 | Total SA Series B | 556,368 | |||
| 17,204,524 | |||||
Germany 6.4% | |||||
| 12,437 | Adidas-Salomon AG | 2,086,569 | |||
| 29,677 | BASF AG | 2,139,319 | |||
| 25,121 | Bayerische Motoren Werke (BMW) AG | 1,089,847 | |||
| 23,397 | Deutsche Bank AG | 2,190,776 | |||
| 21,687 | Deutsche Boerse AG | 2,040,277 | |||
| 44,200 | Deutsche Telekom AG (Reg’d.) | 781,330 | |||
| 49,408 | Fraport AG | 2,502,343 | |||
| 21,242 | MAN AG | 985,968 | |||
| 16,400 | Salzgitter AG | 717,785 | |||
| 52,519 | ThyssenKrupp AG | 1,066,227 | |||
| 22,719 | TUI AG | 441,359 | |||
| 16,041,800 | |||||
Guernsey 0.7% | |||||
| 63,294 | Amdocs, Ltd.(a) | 1,675,392 | |||
Hong Kong 1.9% | |||||
| 1,088,558 | Chaoda Modern Agriculture Holdings, Ltd. | 411,906 | |||
| 684,412 | China Merchants Holdings International Co., Ltd. | 1,329,890 | |||
| 79,000 | Citic Pacific, Ltd. | 205,470 | |||
See Notes to Financial Statements.
| 10 | Visit our website at www.strategicpartners.com |
| Shares | Description | Value (Note 1) | |||
| 909,881 | CNOOC, Ltd. | $ | 592,329 | ||
| 680,348 | Hong Kong Exchanges & Clearing, Ltd. | 2,285,730 | |||
| 5,366 | Shanghai Industrial Holdings, Ltd. | 9,574 | |||
| 4,834,899 | |||||
India 0.2% | |||||
| 23,968 | ICICI Bank, Ltd. (ADR) | 566,843 | |||
Ireland 0.3% | |||||
| 11,000 | Allied Irish Banks PLC | 232,284 | |||
| 32,300 | Irish Life & Permanent PLC | 562,068 | |||
| 794,352 | |||||
Israel 1.6% | |||||
| 54,600 | Check Point Software Technologies, Ltd.(a) | 1,220,856 | |||
| 75,300 | Teva Pharmaceutical Industries, Ltd. (ADR) | 2,870,436 | |||
| 4,091,292 | |||||
Italy 1.2% | |||||
| 72,700 | Banca Popolare Italiana | 532,784 | |||
| 40,205 | Benetton Group SpA | 427,148 | |||
| 62,801 | Eni SpA | 1,682,900 | |||
| 60,700 | IFIL-Investments SpA | 249,700 | |||
| 2,892,532 | |||||
Japan 17.4% | |||||
| 37,373 | Alpine Electronics, Inc. | 564,953 | |||
| 48,025 | Alps Electric Co., Inc. | 763,993 | |||
| 42,853 | Asahi Breweries, Ltd. | 535,678 | |||
| 135,000 | Bank of Yokohama, Ltd. (The) | 1,099,166 | |||
| 64,859 | Chichibu Onoda Cement | 234,389 | |||
| 29,554 | CMK Corp. | 494,627 | |||
| 192,714 | Cosmo Oil Co., Ltd. | 937,707 | |||
| 192,714 | Denki Kagaku Kogyo Kabushiki Kaisha | 706,361 | |||
| 73,946 | FamilyMart Co., Ltd. | 2,199,934 | |||
| 293,618 | Fukuoka, Bank of | 2,281,770 | |||
| 88,661 | Hitachi Koki Co., Ltd. | 1,206,638 | |||
| 229,656 | Hitachi, Ltd. | 1,414,163 | |||
| 46,547 | Hokkaido Electric Power Co., Inc. | 963,059 | |||
| 104,053 | Hokuetsu Paper Mills, Ltd. | 536,930 | |||
| 40,413 | Honda Motor Co., Ltd. | 2,247,580 | |||
| 46,855 | Hosiden Corp. | 453,055 | |||
| 100,359 | Japan Securities Finance Co., Ltd. | �� | 1,160,713 | ||
See Notes to Financial Statements.
| Strategic Partners International Value Fund | 11 |
Portfolio of Investments
as of October 31, 2005 Cont’d.
| Shares | Description | Value (Note 1) | |||
| 120,677 | Kaken Pharmaceutical Co., Ltd. | $ | 856,458 | ||
| 2,000 | Kurabo Industries, Ltd. | 6,802 | |||
| 238,300 | Marubeni Corp. | 1,116,845 | |||
| 164 | Millea Holdings, Inc. | 2,966,972 | |||
| 167,778 | Mitsubishi Chemical Holdings, Corp.(a) | 1,043,478 | |||
| 431 | Nippon Telegraph and Telephone Corp. | 2,060,185 | |||
| 32,016 | Nipro Corp. | 483,315 | |||
| 132,930 | Nissan Motor Co., Ltd. | 1,393,591 | |||
| 182,247 | NSK, Ltd. | 1,063,207 | |||
| 56,644 | Okasan Holdings, Inc. | 340,486 | |||
| 314,007 | Osaka Gas Co., Inc. | 1,148,126 | |||
| 108,979 | Rengo Co., Ltd. | 589,783 | |||
| 49,500 | Secom Co., Ltd. | 2,469,798 | |||
| 42,251 | Sumitomo Osaka Cement Co., Ltd. | 119,331 | |||
| 107,731 | Sumitomo Trust & Banking Co., Ltd. (The) | 917,149 | |||
| 16,519 | Takefuji Corp. | 1,156,080 | |||
| 100,359 | Tanabe Seiyaku Co., Ltd. | 966,470 | |||
| 16,600 | Tohoku Electric Power Co., Inc. | 338,672 | |||
| 27,830 | Tostem Corp. | 472,896 | |||
| 123,566 | Toyota Motor Corp. | 5,729,814 | |||
| 40,020 | Uny Co., Ltd. | 498,819 | |||
| 43,538,993 | |||||
Liechtenstein 0.3% | |||||
| 4,741 | Verwaltungs-und Privat-Bank AG | 748,279 | |||
Mexico 2.5% | |||||
| 152,313 | America Movil SA de CV Series L (ADR) | 3,998,216 | |||
| 456,099 | Wal-Mart de Mexico SA de CV Series V | 2,220,129 | |||
| 6,218,345 | |||||
Netherlands 4.1% | |||||
| 38,974 | ABN AMRO Holding NV | 921,557 | |||
| 61,157 | Euronext NV | 2,598,259 | |||
| 79,548 | ING Groep NV | 2,292,790 | |||
| 49,700 | Royal Dutch Shell PLC (Class A) | 1,532,555 | |||
| 32,140 | Schlumberger, Ltd. | 2,917,348 | |||
| 10,262,509 | |||||
Norway 1.2% | |||||
| 11,200 | Norsk Hydro ASA | 1,120,456 | |||
| 188,650 | Tanderg ASA | 1,855,379 | |||
| 2,975,835 | |||||
See Notes to Financial Statements.
| 12 | Visit our website at www.strategicpartners.com |
| Shares | Description | Value (Note 1) | |||
Portugal 0.2% | |||||
| 132,930 | EDP-Energias de Portugal SA | $ | 375,972 | ||
Russia 0.6% | |||||
| 28,400 | LUKOILl (ADR) | 1,562,000 | |||
Singapore 0.9% | |||||
| 461,960 | MobileOne, Ltd. | 546,216 | |||
| 337,941 | Neptune Orient Lines, Ltd. | 608,516 | |||
| 855,567 | Singapore Telecommunications, Ltd. | 1,178,778 | |||
| 2,333,510 | |||||
South Korea 3.4% | |||||
| 29,920 | Hyundai Motor Co. | 2,211,340 | |||
| 39,721 | Kookmin Bank | 2,259,898 | |||
| 3,345 | Samsung Electronics Co., Ltd. | 1,780,966 | |||
| 65,762 | Shinhan Financial Group Co., Ltd. | 2,204,055 | |||
| 8,456,259 | |||||
Spain 3.3% | |||||
| 49,441 | Banco Santander Central Hispano SA | 630,447 | |||
| 10,300 | Compania Espanola de Petroleos SA | 493,762 | |||
| 75,000 | Endesa SA | 1,865,088 | |||
| 15,159 | Promotora De Informaciones SA | 277,960 | |||
| 62,247 | Repsol YPF SA | 1,853,062 | |||
| 63,216 | Sogecable SA(a) | 2,402,389 | |||
| 17,978 | Union Fenosa SA | 594,662 | |||
| 8,117,370 | |||||
Sweden 1.0% | |||||
| 19,848 | Billerud | 227,449 | |||
| 183,786 | Nordbea Bank AB | 1,800,285 | |||
| 31,043 | Skanska AB (Class B) | 434,683 | |||
| 2,462,417 | |||||
Switzerland 7.6% | |||||
| 2,217 | Ciba Specialty Chemiclas AG (Reg’d.) | 127,327 | |||
| 1,909 | Georg Fischer AG (Reg’d.)(a) | 590,756 | |||
| 3,879 | Givaudan SA | 2,500,057 | |||
| 45,348 | Logitech International SA (Reg’d.)(a) | 1,718,114 | |||
| 44,043 | Novartis AG | 2,368,932 | |||
| 2,463 | Rieter Holdings AG | 702,977 | |||
| 18,225 | Roche Holding AG (ADR) | 2,722,407 | |||
See Notes to Financial Statements.
| Strategic Partners International Value Fund | 13 |
Portfolio of Investments
as of October 31, 2005 Cont’d.
| Shares | Description | Value (Note 1) | |||
| 1,200 | Sulzer AG | $ | 577,035 | ||
| 1,800 | Swisscom AG | 592,624 | |||
| 3,500 | Syngenta Ag(a) | 375,150 | |||
| 63,622 | UBS AG | 5,403,195 | |||
| 7,156 | Zurich Financial Services AG (Reg’d.)(a) | 1,220,463 | |||
| 18,899,037 | |||||
United Kingdom 22.6% | |||||
| 63,800 | Alliance & Leicester PLC | 941,802 | |||
| 13,600 | AstraZeneca PLC | 609,743 | |||
| 421,921 | Barclays PLC | 4,182,079 | |||
| 52,150 | Boots Group PLC | 568,602 | |||
| 64,800 | BP PLC | 715,703 | |||
| 53,216 | BP PLC (ADR) | 3,533,542 | |||
| 183,355 | Bradford & Bingley PLC | 1,128,582 | |||
| 167,717 | British Aerospace PLC | 981,119 | |||
| 531,164 | BT Group PLC | 2,002,540 | |||
| 184,251 | Burberry Group PLC | 1,250,686 | |||
| 251,972 | Cadbury Schweppes PLC | 2,479,706 | |||
| 152,940 | Commercial Union PLC | 1,805,594 | |||
| 75,916 | Cowie Group PLC | 774,650 | |||
| 68,300 | Dairy Crest Group PLC | 544,614 | |||
| 304,464 | Dixons Group PLC | 776,017 | |||
| 111,565 | FirstGroup PLC | 647,701 | |||
| 131,100 | GKN PLC | 645,670 | |||
| 141,607 | GlaxoSmithKline | 3,681,964 | |||
| 121,293 | HBOS PLC | 1,791,576 | |||
| 54,900 | Kelda Group PLC | 676,324 | |||
| 299,538 | Legal & General Group PLC | 568,620 | |||
| 547,789 | Lloyds TSB Group PLC | 4,479,488 | |||
| 122,278 | Mitchells & Butler PLC | 785,107 | |||
| 56,300 | Next PLC | 1,329,344 | |||
| 221,098 | Northern Foods PLC | 588,972 | |||
| 225,469 | Northumbrian Water Group PLC | 947,815 | |||
| 470,025 | Old Mutual PLC | 1,096,086 | |||
| 452,500 | Pilkington PLC | 1,227,417 | |||
| 85,400 | Royal Bank of Scotland Group PLC | 2,364,110 | |||
| 86,200 | Royal Dutch Shell PLC (Class B) | 2,811,938 | |||
| 175,536 | Scottish Power PLC | 1,718,163 | |||
| 259,641 | Shanks Group PLC | 719,218 | |||
| 80,657 | Tate & Lyle PLC | 661,706 | |||
| 335,085 | Tesco PLC | 1,783,749 | |||
| 141,488 | TT Electronics PLC | 368,137 | |||
See Notes to Financial Statements.
| 14 | Visit our website at www.strategicpartners.com |
| Shares | Description | Value (Note 1) | |||
| 32,580 | Viridian Group PLC | $ | 449,223 | ||
| 86,629 | Vodafone Group PLC (ADR) | 2,274,878 | |||
| 67,843 | Willis Group Holdings, Ltd. | 2,519,689 | |||
| 56,431,874 | |||||
Total common stocks | 241,473,869 | ||||
PREFERRED STOCKS 0.4% | |||||
Germany 0.4% | |||||
| 6,650 | Fresenius AG | 934,048 | |||
Total long-term investments | 242,407,917 | ||||
SHORT-TERM INVESTMENTS 2.2% | |||||
Money Market Mutual Fund 2.2% | |||||
| 5,659,845 | Dryden Core Investment Fund - Taxable Money Market Series,(b) | 5,659,845 | |||
Total Investments(c) 99.3% | 248,067,762 | ||||
Other assets in excess of liabilities(d) 0.7% | 1,654,633 | ||||
Net Assets 100% | $ | 249,722,395 | |||
ADR—American Depositary Receipt.
| (a) | Non-income producing security. |
| (b) | Prudential Investments LLC, the manager of the Fund also serves as manager of the Dryden Core Investment Fund-Taxable Money Market Series. |
| (c) | As of October 31, 2005, 58 securities representing $66,421,556 and 26.8% of the total market value were fair valued in accordance with the policies adopted by the Board of Directors. |
See Notes to Financial Statements.
| Strategic Partners International Value Fund | 15 |
Portfolio of Investments
as of October 31, 2005 Cont’d.
| (d) | Other assets in excess of liabilities include net unrealized appreciation (depreciation) on foreign currency contracts as follows: |
Forward Foreign currency exchange contracts outstanding at October 31, 2005:
Foreign Currency Contract | Value at Settlement Date | Current Value | Unrealized Appreciation/ (Depreciation) | |||||||
Bought: | ||||||||||
Pound Sterling 3,400,000 expiring 12/05/05 | $ | 5,912,872 | $ | 6,015,722 | $ | 102,850 | ||||
Pound Sterling 4,100,000 expiring 12/05/05 | 7,557,161 | 7,254,253 | (302,908 | ) | ||||||
Mexican Peso 33,100,000 expiring 12/06/05 | 3,034,748 | 3,052,945 | 18,197 | |||||||
Sold: | ||||||||||
Euro Currency 3,300,000 expiring 12/02/05 | 4,089,954 | 3,961,749 | 128,205 | |||||||
Euro Currency 4,600,000 expiring 04/04/06 | 5,587,758 | 5,561,207 | 26,551 | |||||||
Pound Sterling 10,300,000 expiring 12/05/05 | 18,538,455 | 18,224,099 | 314,356 | |||||||
Mexican Peso 91,100,000 expiring 12/06/05 | 8,138,079 | 8,393,293 | (255,214 | ) | ||||||
| $ | 32,037 | |||||||||
See Notes to Financial Statements.
| 16 | Visit our website at www.strategicpartners.com |
The industry classification of portfolio holdings and other assets in excess of liabilities shown as a percentage of net assets as of October 31, 2005 was as follows:
Commercial Banks | 17.2 | % | |
Oil & Gas | 11.3 | ||
Pharmaceuticals | 8.2 | ||
Automobiles | 6.3 | ||
Diversified Telecommunications | 5.6 | ||
Insurance | 5.2 | ||
Other Financial Services | 4.6 | ||
Retail | 4.0 | ||
Media | 3.9 | ||
Food Products | 3.4 | ||
Electric Utilities | 3.3 | ||
Construction Materials | 3.3 | ||
Chemicals | 2.8 | ||
Wireless Telecommunicaton Services | 2.7 | ||
Electronic Equipment | 2.6 | ||
Diversified manufacturing | 2.4 | ||
Steel & Metals | 2.4 | ||
Money Market Mutual Fund | 2.2 | ||
Aerospace/Defense | 1.5 | ||
Office Electronics | 1.4 | ||
Transportation | 1.1 | ||
Airport Develop/Maintenance | 1.0 | ||
Water Utilities | 0.7 | ||
Paper & Related Products | 0.5 | ||
Import/Export | 0.4 | ||
Dialysis Centers | 0.4 | ||
Non-Hazardous Waste Disposal | 0.3 | ||
Beverages | 0.2 | ||
Travel Services | 0.2 | ||
Agricultural Operations | 0.2 | ||
| 99.3 | |||
Other assets in excess of liabilities. | 0.7 | ||
| 100.0 | % | ||
See Notes to Financial Statements.
| Strategic Partners International Value Fund | 17 |
Statement of Assets and Liabilities
as of October 31, 2005
Assets | ||||
Investments, at value | ||||
Unaffiliated Investments, at value (cost $211,279,873) | $ | 242,407,917 | ||
Affiliate Investments, at value (cost $5,659,845) | 5,659,845 | |||
Foreign currency, at value (cost $2,754,957) | 2,732,570 | |||
Receivable for Series shares sold | 518,834 | |||
Unrealized appreciation on forward currency contracts | 590,159 | |||
Dividends and interest receivable | 460,591 | |||
Foreign tax reclaim receivable | 232,904 | |||
Receivable for investments sold | 223,561 | |||
Other assets | 2,495 | |||
Total assets | 252,828,876 | |||
Liabilities | ||||
Payable for Series shares reacquired | 1,302,135 | |||
Payable for investments purchased | 463,168 | |||
Unrealized depreciation on forward currency contracts | 558,122 | |||
Accrued expenses | 364,832 | |||
Management fee payable | 202,238 | |||
Transfer agent fee payable | 138,000 | |||
Distribution fee payable | 39,937 | |||
Withholding tax payable | 33,444 | |||
Deferred directors’ fees | 4,605 | |||
Total liabilities | 3,106,481 | |||
Net Assets | $ | 249,722,395 | ||
Net assets were comprised of: | ||||
Common stock, at par | $ | 114,149 | ||
Paid-in capital in excess of par | 228,990,971 | |||
| 229,105,120 | ||||
Undistributed net investment income | 5,717,574 | |||
Accumulated net realized loss on investments and foreign currency transactions | (16,225,609 | ) | ||
Net unrealized appreciation on investments and foreign currencies | 31,125,310 | |||
Net assets October 31, 2005 | $ | 249,722,395 | ||
See Notes to Financial Statements.
| 18 | Visit our website at www.strategicpartners.com |
Class A | |||
Net asset value and redemption price per share | |||
$61,346,866 ÷ 2,803,599 shares of common stock issued and outstanding | $ | 21.88 | |
Maximum sales charge (5.50% of offering price) | 1.27 | ||
Maximum offering price to public | $ | 23.15 | |
Class B | |||
Net asset value, offering price and redemption price per share $18,978,155 ÷ 895,562 shares of common stock issued and outstanding | $ | 21.19 | |
Class C | |||
Net asset value, offering price and redemption price per share $12,719,667 ÷ 599,649 shares of common stock issued and outstanding | $ | 21.21 | |
Class Z | |||
Net asset value, offering price and redemption price per share $156,677,707 ÷ 7,116,095 shares of common stock issued and outstanding | $ | 22.02 | |
See Notes to Financial Statements.
| Strategic Partners International Value Fund | 19 |
Statement of Operations
Year Ended October 31, 2005
Net Investment Income | ||||
Income | ||||
Unaffiliated dividends (net of foreign withholding taxes of $1,073,808) | $ | 9,874,463 | ||
Affiliate dividends | 175,172 | |||
Total income | 10,049,635 | |||
Expenses | ||||
Management fee | 3,577,108 | |||
Distribution fee—Class A | 149,348 | |||
Distribution fee—Class B | 230,916 | |||
Distribution fee—Class C | 132,934 | |||
Transfer agent’s fees and expenses (including affiliate expense of $612,000) | 627,000 | |||
Custodian’s fees and expenses | 472,000 | |||
Reports to shareholders | 76,000 | |||
Registration fees | 67,000 | |||
Legal fees | 36,000 | |||
Audit fee | 22,000 | |||
Directors’ fees | 19,000 | |||
Miscellaneous | 45,833 | |||
Total operating expenses | 5,455,139 | |||
Loan interest expense (Note 7) | 4,274 | |||
Less: Expense subsidy (Note 2) | (9,265 | ) | ||
Total expenses | 5,450,148 | |||
Net investment income | 4,599,487 | |||
Realized And Unrealized Gain (Loss) On Investments and Foreign Currency Transactions | ||||
Net realized gain on: | ||||
Investment transactions | 84,030,562 | |||
Foreign currency transactions | 1,275,361 | |||
| 85,305,923 | ||||
Net change in unrealized depreciation on: | ||||
Investments | (21,743,223 | ) | ||
Foreign currencies | (47,038 | ) | ||
| (21,790,261 | ) | |||
Net gain on investments and foreign currencies | 63,515,662 | |||
Net Increase In Net Assets Resulting From Operations | $ | 68,115,149 | ||
See Notes to Financial Statements.
| 20 | Visit our website at www.strategicpartners.com |
Statement of Changes in Net Assets
| Year Ended October 31, | ||||||||
| 2005 | 2004 | |||||||
Increase (Decrease) In Net Assets | ||||||||
Operations | ||||||||
Net investment income | $ | 4,599,487 | $ | 4,214,034 | ||||
Net realized gain (loss) on investment and foreign currency transactions | 85,305,923 | (76,912 | ) | |||||
Net change in unrealized appreciation (depreciation) on investments and foreign currencies | (21,790,261 | ) | 52,012,763 | |||||
Net increase in net assets resulting from operations | 68,115,149 | 56,149,885 | ||||||
Dividends (Note 1) | ||||||||
Dividends from net investment income | ||||||||
Class A | (526,469 | ) | (355,438 | ) | ||||
Class B | (57,515 | ) | (53,585 | ) | ||||
Class C | (28,274 | ) | (11,814 | ) | ||||
Class Z | (3,534,518 | ) | (3,395,621 | ) | ||||
| (4,146,776 | ) | (3,816,458 | ) | |||||
Series share transactions (Net of share conversions) (Note 6) | ||||||||
Net proceeds from shares sold(b) | 113,014,644 | 147,161,713 | ||||||
Net asset value of shares issued in reinvestment of dividends and distributions | 4,105,182 | 3,788,558 | ||||||
Cost of shares reacquired | (321,270,560 | ) | (206,877,748 | ) | ||||
Net decrease in net assets from Series share transactions | (204,150,734 | ) | (55,927,477 | ) | ||||
Total decrease | (140,182,361 | ) | (3,594,050 | ) | ||||
Net Assets | ||||||||
Beginning of year | 389,904,756 | 393,498,806 | ||||||
End of year(a) | $ | 249,722,395 | $ | 389,904,756 | ||||
(a) Includes undistributed net investment income of: | $ | 5,717,574 | $ | 3,989,502 | ||||
| (b) For | the year ended October 31, 2004, includes $18,252,977 for shares issued in connection with the acquisition of the Strategic Partners Style Specific Funds—Strategic Partners International Equity Fund. |
See Notes to Financial Statements.
| Strategic Partners International Value Fund | 21 |
Notes to Financial Statements
Prudential World Fund, Inc. (the “Fund”), is registered under the Investment Company Act of 1940 as an open-end diversified management investment company and currently consists of three series: Strategic Partners International Value Fund (the “Series”), Jennison Global Growth Fund, and the Dryden International Equity Fund. These financial statements relate to Strategic Partners International Value Fund. The financial statements of the other Series are not presented herein. The investment objective of the Series is to achieve long-term growth of capital. Income is a secondary objective. The Series seeks to achieve its objective primarily through investment in common stock and preferred stock of foreign companies of all sizes.
Note 1. Accounting Policies
The following is a summary of significant accounting policies followed by the Fund and the Series in the preparation of its financial statements.
Securities Valuation: Securities listed on a securities exchange (other than options on securities and indices) are valued at the last sale price on such exchange on the day of valuation or, if there was no sale on such day, at the mean between the last reported bid and ask prices, or at the last bid price on such day in the absence of an asked price. Securities traded via Nasdaq are valued at the Nasdaq official closing price (NOCP) on the day of valuation, or if there was no NOCP, at the last sale price. Securities that are actively traded in the over-the-counter market, including listed securities for which the primary market is believed by Prudential Investments LLC (“PI” or “Manager”), in consultation with the subadviser(s), to be over-the-counter, are valued at market value using prices provided by an independent pricing agent or principal market maker. Options on securities and indices traded on an exchange are valued at the last sale price as of the close of trading on the applicable exchange or, if there was no sale, at the mean between the most recently quoted bid and asked prices on such exchange. Futures contracts and options thereon traded on a commodities exchange or board of trade are valued at the last sale price at the close of trading on such exchange or board of trade or, if there was no sale on the applicable commodities exchange or board of trade on such day, at the mean between the most recently quoted bid and asked prices on such exchange or board of trade or at the last bid price in the absence of an asked price. Securities for which reliable market quotations are not readily available, or whose values have been affected by events occurring after the close of the security’s foreign market and before the Funds’ normal pricing time, are valued at fair value in accordance with the Board of Directors’ approved fair valuation procedures. When determining the fair valuation of securities some of the factors influencing the valuation include, the nature of any
| 22 | Visit our website at www.strategicpartners.com |
restrictions on disposition of the securities; assessment of the general liquidity of the securities; the issuer’s financial condition and the markets in which it does business; the cost of the investment; the size of the holding and the capitalization of issuer; the prices of any recent transactions or bids/offers for such securities or any comparable securities; any available analyst media or other reports or information deemed reliable by the investment adviser regarding the issuer or the markets or industry in which it operates. Using fair value to price securities may result in a value that is different from a security’s most recent closing price and from the price used by other mutual funds to calculate their net asset values.
Short-term securities which mature in 60 days or less are valued at amortized cost, which approximates market value. The amortized cost method involves valuing a security at its cost on the date of purchase and thereafter assuming a constant amortization to maturity of the difference between the principal amount due at maturity and cost. Short-term securities which mature in more than 60 days are valued at current market quotations.
Foreign Currency Translation: The books and records of the Series are maintained in U.S. dollars. Foreign currency amounts are translated into U.S. dollars on the following basis:
(i) market value of investment securities, other assets and liabilities—at the current rates of exchange.
(ii) Purchases and sales of investment securities, income and expenses—at the rates of exchange prevailing on the respective dates of such transactions.
Although the net assets of the Series are presented at the foreign exchange rates and market values at the close of the fiscal period, the Series does not isolate that portion of the results of operations arising as a result of changes in the foreign exchange rates from the fluctuations arising from changes in the market prices of long-term securities held at the end of the fiscal period. Similarly, the Series does not isolate the effect of changes in foreign exchange rates from the fluctuations arising from changes in the market prices of long-term portfolio securities sold during the fiscal period. Accordingly, realized foreign currency gains or losses are included in the reported net realized gains or losses on investment transactions.
Net realized gains or losses on foreign currency transactions represent net foreign exchange gains or losses from the holding of foreign currencies, currency gains or losses realized between the trade date and settlement date on securities transactions, and the difference between the amounts of dividends, interest and foreign withholding taxes recorded on the Series’ books and the U.S. dollar equivalent amounts actually received or paid. Net unrealized currency gains or losses from
| Strategic Partners International Value Fund | 23 |
Notes to Financial Statements
Cont’d
valuing foreign currency denominated assets and liabilities (other than investments) at period end exchange rates are reflected as a component of net unrealized appreciation (depreciation) on investments and foreign currencies.
Foreign security and currency transactions may involve certain considerations and risks not typically associated with those of domestic origin as a result of, among other factors, the possibility of political and economic instability or the level of governmental supervision and regulation of foreign securities markets.
Forward Currency Contracts: A forward currency contract is a commitment to purchase or sell a foreign currency at a future date at a negotiated forward rate. The Series enters into forward currency contracts in order to hedge its exposure to changes in foreign currency exchange rates on its foreign portfolio holdings or specific receivables and payables denominated in a foreign currency. The contracts are valued daily at current exchange rates and any unrealized gain or loss is included in net unrealized appreciation or depreciation on foreign currencies. Gain or loss is realized on the settlement date of the contract equal to the difference between the settlement value of the original and renegotiated forward contracts. This gain or loss, if any, is included in net realized gain (loss) on foreign currency transactions. Risks may arise upon entering into these contracts from the potential inability of the counterparties to meet the terms of their contracts.
Forward currency contracts involve elements of both market and credit risk in excess of the amounts reflected on the Statement of Assets and Liabilities.
Securities Transactions and Net Investment Income: Securities transactions are recorded on the trade date. Realized and unrealized gains or losses on sales of securities are calculated on the identified cost basis. Dividend income is recorded on the ex-dividend date and interest income, including amortization of premium and accretion of discount on debt securities, as required, is recorded on an accrual basis. Expenses are recorded on the accrual basis. Net investment income or loss, (other than distribution fees which are charged directly to the respective class) and unrealized and realized gains or losses are allocated daily to each class of shares based upon the relative proportion of net assets of each class at the beginning of the day.
Dividends and Distributions: The Series expects to pay dividends of net investment income and distributions of net realized capital gains, if any, annually. Dividends and
| 24 | Visit our website at www.strategicpartners.com |
distributions to shareholders, which are determined in accordance with federal income tax regulations and which may differ from generally accepted accounting principles, are recorded on the ex-dividend date. Permanent book/tax differences relating to income and gains are reclassified amongst undistributed net investment income, accumulated net realized gain or loss and paid-in capital in excess of par, as appropriate.
Taxes: For federal income tax purposes, each series in the Fund is treated as a separate taxpaying entity. It is the Series’ policy to continue to meet the requirements of the Internal Revenue Code applicable to regulated investment companies and to distribute all of its taxable net income and capital gains, if any, to shareholders. Therefore, no federal income tax provision is required.
Withholding taxes on foreign dividends are recorded, net of reclaimable amounts, at the time the related income is earned.
Estimates: The preparation of the financial statements requires management to make estimates and assumptions that affect the reported amounts and disclosures in the financial statements. Actual results could differ from those estimates.
Note 2. Agreements
The Fund has a management agreement for the Series with Prudential Investments LLC (“PI”). Pursuant to this agreement, PI has responsibility for all investment advisory services and supervises the subadvisor’s performance of such services. PI has entered into subadvisory agreements with LSV Asset Management (“LSV”) and Thornburg Investment Management (“Thornburg”) for the Series.
The subadvisory agreements provide that LSV and Thornburg furnish investment advisory services in connection with the management of the Series. In connection therewith, LSV and Thornburg are obligated to keep certain books and records of the Series. PI pays for the services of the subadvisors, the cost of compensation of officers of the Series, occupancy and certain clerical and bookkeeping costs of the Series. The Fund bears all other costs and expenses.
The management fee paid to PI is computed daily and payable monthly at an annual rate of 1% of the average daily net assets up to $300 million and .95 of 1% of average daily net assets in excess of $300 million of the Series. The effective management fee rate as of October 31, 2005 was .99%.
Effective August 1, 2005, PI has voluntarily agreed to reimburse the Series in order to limit operating expenses (excluding interest, taxed and brokerage commissions) to
| Strategic Partners International Value Fund | 25 |
Notes to Financial Statements
Cont’d
1.61%, 2.36%, 2.36% and 1.36% of the average daily net assets of the Class A, B, C and Z shares, respectively.
The Series has a distribution agreement with Prudential Investment Management Services LLC (“PIMS”), which acts as the distributor of the Class A, Class B, Class C and Class Z shares of the Series. The Series compensates PIMS for distributing and servicing the Series’ Class A, Class B and Class C shares pursuant to plans of distribution (the “Class A, B and C Plans”), regardless of expenses actually incurred by PIMS. The distribution fees are accrued daily and payable monthly. No distribution or service fees are paid to PIMS as distributor of the Class Z shares of the Series.
Pursuant to the Class A, B and C Plans, the Series compensates PIMS for distribution-related activities at an annual rate of up to .30 of 1%, 1% and 1% of the average daily net assets of the Class A, B and C shares, respectively. For the year ended October 31, 2005, PIMS contractually agreed to limit such fee to .25 of 1% of the average daily net assets of the Class A shares.
PIMS has advised the Series that it received approximately $49,100 in front-end sales charges resulting from sales of Class A shares, during the year ended October 31, 2005. From these fees, PIMS paid such sales charges to broker-dealers, which in turn paid commissions to salespersons and incurred other distribution costs.
PIMS advised the Series that for the year ended October 31, 2005, it received approximately $31,000 and $1,900 in contingent deferred sales charges imposed upon certain redemptions by Class B and Class C shareholders, respectively.
PI and PIMS are indirect, wholly-owned subsidiaries of Prudential Financial, Inc. (“Prudential”).
Note 3. Other Transactions with Affiliates
Prudential Mutual Fund Services LLC (“PMFS”), an affiliate of PI and an indirect, wholly owned subsidiary of Prudential, serves as the Fund’s transfer agent. The transfer agent fees and expenses in the Statement of Operations also include certain out-of-pocket expenses paid to non-affiliates, where applicable.
| 26 | Visit our website at www.strategicpartners.com |
The Fund pays networking fees to affiliated and unaffiliated broker/dealers. These networking fees are payments made to broker/dealers that clear mutual fund transactions through a national clearing system. For the year ended October 31, 2005, the Fund incurred approximately $61,200 in total networking fees. These amounts are including in transfer agent’s fees and expenses in the Statement of Operations.
The Fund invests in the Taxable Money Market Series, a portfolio of Dryden Core Investment Fund, formerly Prudential Core Investment Fund, pursuant to an exemptive order received from the Securities and Exchange Commission. The Taxable Money Market Series is a money market mutual fund registered under the Investment Company Act of 1940, as amended, and managed by PI.
Note 4. Portfolio Securities
Purchases and sales of investment securities, other than short-term investments, for the year ended October 31, 2005 were $418,003,825 and $548,529,992, respectively.
Note 5. Distributions and Tax Information
In order to present undistributed net investment income (loss) and accumulated net realized gains (losses) on the Statement of Assets and Liabilities that more closely represent their tax character, certain adjustments have been made to undistributed net investment income (loss) and accumulated net realized gains (loss) on investments. For the year ended October 31, 2005, the adjustments were to decrease accumulated net realized gain of $16,704,010, and increase paid-in capital in excess of par of $15,428,649 and undistributed net investment income by $1,275,361 primarily due to the differences in the treatment for book and tax purposes of certain transaction, involving redemption in-kind transactions, foreign securities and currencies gains.
For the years ended October 31, 2005 and October 31, 2004, the tax character of dividends paid, as reflected in the Statement of Changes in Net Assets of $4,146,776 and $3,816,458 respectively, was ordinary income.
As of October 31, 2005, the accumulated undistributed earnings on a tax basis was $5,788,507 of ordinary income.
For federal income tax purposes, the Series had a capital loss carryforward as of October 31, 2005 of approximately $15,418,000, of which $3,326,000 expires in 2010, $9,597,000 expires in 2011 and $2,495,000 expires in 2012. Approximately $62,178,000 of the Series’ capital loss carryforward was used to offset net taxable gains realized in the fiscal year ended October 31, 2005.
| Strategic Partners International Value Fund | 27 |
Notes to Financial Statements
Cont’d
The United States federal income tax basis of the Series’ investments and the net unrealized appreciation as of October 31, 2005 were as follows:
Tax Basis | Appreciation | Depreciation | Total | Other | Total Net | |||||
| $217,747,681 | $35,601,293 | $5,281,212 | $30,320,081 | $(34,771) | $30,285,310 |
The difference between book basis and tax basis was attributable to deferred losses on wash sale and other tax adjustments. The other cost basis adjustments are primarily attributable to depreciation of foreign currency and mark to market of receivables and payables.
Note 6. Capital
The Fund offers Class A, Class B, Class C and Class Z shares. Class A shares are sold with a front-end sales charge of up to 5.50%. All investors who purchase Class A shares in an amount of $1 million or more and sell these shares within 12 months of purchase are subject to a contingent deferred sales charge (“CDSC”) of 1%, including investors who purchase their shares through broker-dealers affiliated with Prudential. Class B shares are sold with a CDSC which declines from 5% to zero depending upon the period of time the shares are held. Class C shares are sold with a CDSC of 1% during the first 12 months from the date of purchase. Class B shares will automatically convert to Class A shares on a quarterly basis approximately seven years after purchase. A special exchange privilege is also available for shareholders who qualify to purchase Class A shares at net asset value. Class Z shares are not subject to any sales or redemption charge and are offered exclusively for sale to a limited group of investors.
There are 500 million authorized shares of $.01 par value common stock, divided equally into four classes, designated Class A, Class B, Class C and Class Z common stock.
| 28 | Visit our website at www.strategicpartners.com |
Transactions in shares of common stock were as follows:
Class A | Shares | Amount | |||||
Year ended October 31, 2005: | |||||||
Shares sold | 591,328 | $ | 12,172,121 | ||||
Shares issued in reinvestment of dividends and distributions | 25,412 | 492,479 | |||||
Shares reacquired | (1,243,275 | ) | (25,297,301 | ) | |||
Net increase (decrease) in shares outstanding before conversion | (626,535 | ) | (12,632,701 | ) | |||
Shares issued upon conversion from Class B | 394,832 | 8,068,864 | |||||
Net increase (decrease) in shares outstanding | (231,703 | ) | $ | (4,563,837 | ) | ||
Year ended October 31, 2004: | |||||||
Shares sold | 812,342 | $ | 14,261,765 | ||||
Shares issued in connection with reorganization | 262,056 | 4,858,696 | |||||
Shares issued in reinvestment of dividends and distributions | 20,706 | 336,257 | |||||
Shares reacquired | (1,395,105 | ) | (24,626,866 | ) | |||
Net increase (decrease) in shares outstanding before conversion | (300,001 | ) | (5,170,148 | ) | |||
Shares issued upon conversion from Class B | 728,786 | 12,969,203 | |||||
Net increase (decrease) in shares outstanding | 428,785 | $ | 7,799,055 | ||||
Class B | |||||||
Year ended October 31, 2005: | |||||||
Shares sold | 211,140 | $ | 4,180,370 | ||||
Shares issued in reinvestment of dividends and distributions | 2,873 | 54,295 | |||||
Shares reacquired | (374,361 | ) | (7,417,792 | ) | |||
Net increase (decrease) in shares outstanding before conversion | (160,348 | ) | (3,183,127 | ) | |||
Shares reacquired upon conversion into Class A | (406,074 | ) | (8,068,864 | ) | |||
Net increase (decrease) in shares outstanding | (566,422 | ) | $ | (11,251,991 | ) | ||
Year ended October 31, 2004: | |||||||
Shares sold | 250,642 | $ | 4,304,989 | ||||
Shares issued in connection with reorganization | 333,631 | 6,026,255 | |||||
Shares issued in reinvestment of dividends and distributions | 3,207 | 50,805 | |||||
Shares reacquired | (534,931 | ) | (9,164,707 | ) | |||
Net increase (decrease) in shares outstanding before conversion | 52,549 | 1,217,342 | |||||
Shares reacquired upon conversion into Class A | (750,116 | ) | (12,969,203 | ) | |||
Net increase (decrease) in shares outstanding | (697,567 | ) | $ | (11,751,861 | ) | ||
| Strategic Partners International Value Fund | 29 |
Notes to Financial Statements
Cont’d
Class C | Shares | Amount | |||||
Year ended October 31, 2005: | |||||||
Shares sold | 146,397 | $ | 2,923,171 | ||||
Shares issued in reinvestment of dividends and distributions | 1,399 | 26,461 | |||||
Shares reacquired | (283,010 | ) | (5,650,636 | ) | |||
Net increase (decrease) in shares outstanding | (135,214 | ) | $ | (2,701,004 | ) | ||
Year ended October 31, 2004: | |||||||
Shares sold | 109,865 | $ | 1,903,861 | ||||
Shares issued in connection with reorganization | 407,663 | 7,368,026 | |||||
Shares issued in reinvestment of dividends and distributions | 691 | 10,968 | |||||
Shares reacquired | (260,224 | ) | (4,485,944 | ) | |||
Net increase (decrease) in shares outstanding | 257,995 | $ | 4,796,911 | ||||
Class Z | |||||||
Year ended October 31, 2005: | |||||||
Shares sold | 4,589,691 | $ | 93,738,982 | ||||
Shares issued in reinvestment of dividends and distributions | 181,498 | 3,531,947 | |||||
Shares reacquired | (13,701,289 | ) | (282,904,831 | ) | |||
Net increase (decrease) in shares outstanding | (8,930,100 | ) | $ | (185,633,902 | ) | ||
Year ended October 31, 2004: | |||||||
Shares sold | 6,116,252 | $ | 108,438,121 | ||||
Shares issued in reinvestment of dividends and distributions | 208,008 | 3,390,528 | |||||
Shares reacquired | (9,479,052 | ) | (168,600,231 | ) | |||
Net increase (decrease) in shares outstanding | (3,154,792 | ) | $ | (56,771,582 | ) | ||
Note 7. Borrowings
The Series, along with other affiliated registered investment companies (the “Funds”), is a party to a syndicated credit agreement (“SCA”) with two banks. The commitment under the credit agreement was $500 million. The Funds paid a commitment fee of .075% of 1% of the unused portion of the agreement. The expiration of the SCA was October 28, 2005. Effective October 29, 2005, the Funds renewed the SCA with the banks. The commitment under the renewed SCA continued to be $500 million. The Funds pays a commitment fee of .725 of 1% of the unused portion of the renewed SCA. Interest on any borrowing under the SCA would be incurred at market rates. The commitment fee is accrued daily and paid quarterly and is allocated to the Funds pro-rata based on net assets. The purpose of the SCA is to serve as an alternative source of funding for capital share redemption. The expiration date of the renewed SCA will be October 27, 2006.
| 30 | Visit our website at www.strategicpartners.com |
The Fund utilized the line of credit during for the year ended October 31, 2005. The average daily balance for the 33 days the Fund had debt outstanding during the year was approximately $1,336,000 at a weighted average interest rate of approximately 3.49%.
Note 8. Plan of Reorganization
On March 5, 2004, the Strategic Partners International Value Fund acquired all of the net assets of the Strategic Partners Style Specific Funds—Strategic Partners International Equity Fund pursuant to a plan of reorganization approved by the Strategic Partners International Value Fund shareholders on December 19, 2003. The acquisition was accomplished by a tax-free exchange of Class A, Class B and Class C shares.
Strategic Partners Style | Strategic Partners | Value | ||||||
Class A | 571,226 | Class A | 262,056 | $4,858,696 | ||||
Class B | 725,076 | Class B | 333,631 | 6,026,255 | ||||
Class C | 886,950 | Class C | 407,663 | 7,368,026 | ||||
The aggregate net assets of the Strategic Partners Style Specific Funds—Strategic Partners International Equity Fund and the Strategic Partners International Value Fund immediately before the acquisition were $18,252,977 and $450,914,546, respectively.
The future utilization of the acquired capital loss carryforward from the Strategic Partners Style Specific Funds—Strategic Partners International Equity Fund in the amount of $7,233,033 will be limited under certain conditions defined in the Internal Revenue Code of 1986, as amended.
Note 9. In-Kind Redemption
During the fiscal year ended October 31, 2005, shareholders redeemed fund shares in exchange for Series’ portfolio securities valued at $148,897,793. The Fund realized a gain of $15,428,649 related to the in-kind redemption transactions. This gain is not taxable for Federal Income Tax purposes.
| Strategic Partners International Value Fund | 31 |
Financial Highlights
| Class A | ||||
| Year Ended October 31, 2005(b) | ||||
Per Share Operating Performance: | ||||
Net Asset Value, Beginning Of Year | $ | 18.29 | ||
Income (Loss) from investment operations | ||||
Net investment income | .24 | |||
Net realized and unrealized gain (loss) on investment and foreign currency transactions | 3.53 | |||
Total from investment operations | 3.77 | |||
Less Dividends and Distributions | ||||
Dividends from net investment income | (.18 | ) | ||
Distributions from net realized gains | — | |||
Total dividends and distributions | (.18 | ) | ||
Net asset value, end of year | $ | 21.88 | ||
Total Return(a): | 20.71 | % | ||
Ratios/Supplemental Data: | ||||
Net assets, end of year (000) | $ | 61,347 | ||
Average net assets (000) | $ | 59,739 | ||
Ratios to average net assets: | ||||
Expenses, including distribution and service (12b-1) fees(c) | 1.62 | %(d) | ||
Expenses, excluding distribution and service (12b-1) fees | 1.37 | %(d) | ||
Net investment income | 1.15 | %(d) | ||
For Class A, B, C and Z shares: | ||||
Portfolio turnover rate | 121 | % | ||
| (a) | Total return does not consider the effects of sales loads. Total return is calculated assuming a purchase of shares on the first day and a sale on the last day of each year reported, and includes reinvestment of dividends and distributions. |
| (b) | Calculated based upon average shares outstanding during the year. |
| (c) | The distributor of the Series contractually agreed to limit its distribution and service (12b-1) fees to .25 of 1% on the average daily net assets of Class A shares. |
| (d) | Effective August 1, 2005, the Manager of the Series has voluntarily agreed to reimburse the Series in order to limit operating expenses (excluding interest, taxed and brokerage commissions) to 1.61% of the average daily net assets of the Class A shares. If the Manager had not reimbursed the Series, the annual expenses (both including and excluding distribution and service (12b-1) fees and net investment income ratios would be 1.62%, 1.37% and 1.15%, respectively, for the year ended October 31, 2005. |
See Notes to Financial Statements.
| 32 | Visit our website at www.strategicpartners.com |
| Class A | ||||||||||||||
| Year Ended October 31, | ||||||||||||||
| 2004(b) | 2003(b) | 2002(b) | 2001 | |||||||||||
| $ | 16.07 | $ | 14.08 | $ | 17.29 | $ | 22.08 | |||||||
| .16 | .14 | .07 | .13 | |||||||||||
| 2.20 | 1.89 | (2.53 | ) | (4.01 | ) | |||||||||
| 2.36 | 2.03 | (2.46 | ) | (3.88 | ) | |||||||||
| (.14 | ) | (.04 | ) | — | — | |||||||||
| — | — | (.75 | ) | (.91 | ) | |||||||||
| (.14 | ) | (.04 | ) | (.75 | ) | (.91 | ) | |||||||
| $ | 18.29 | $ | 16.07 | $ | 14.08 | $ | 17.29 | |||||||
| 14.77 | % | 14.44 | % | (15.07 | )% | (18.25 | )% | |||||||
| $ | 55,530 | $ | 41,889 | $ | 41,011 | $ | 53,269 | |||||||
| $ | 49,953 | $ | 40,463 | $ | 49,279 | $ | 63,061 | |||||||
| 1.61 | % | 1.72 | % | 1.64 | % | 1.60 | % | |||||||
| 1.36 | % | 1.47 | % | 1.39 | % | 1.35 | % | |||||||
| .90 | % | .97 | % | .42 | % | .62 | % | |||||||
| 24 | % | 23 | % | 35 | % | 115 | % | |||||||
See Notes to Financial Statements.
| Strategic Partners International Value Fund | 33 |
Financial Highlights
Cont’d
| Class B | ||||
| Year Ended October 31, 2005(b) | ||||
Per Share Operating Performance: | ||||
Net Asset Value, Beginning Of Year | $ | 17.73 | ||
Income (Loss) from investment operations | ||||
Net investment income (loss) | .08 | |||
Net realized and unrealized gain (loss) on investment and foreign currency transactions | 3.42 | |||
Total from investment operations | 3.50 | |||
Less Dividends and Distributions | ||||
Dividends from net investment income | (.04 | ) | ||
Distributions from net realized gains | — | |||
Total dividends and distributions | (.04 | ) | ||
Net asset value, end of year | $ | 21.19 | ||
Total Return(a): | 19.77 | % | ||
Ratios/Supplemental Data: | ||||
Net assets, end of year (000) | $ | 18,978 | ||
Average net assets (000) | $ | 23,092 | ||
Ratios to average net assets: | ||||
Expenses, including distribution and service (12b-1) fees | 2.37 | %(c) | ||
Expenses, excluding distribution and service (12b-1) fees | 1.37 | %(c) | ||
Net investment income (loss) | .38 | %(c) | ||
| (a) | Total return does not consider the effects of sales loads. Total return is calculated assuming a purchase of shares on the first day and a sale on the last day of each year reported, and includes reinvestment of dividends and distributions. |
| (b) | Calculated based upon average shares outstanding during the year. |
| (c) | Effective August 1, 2005, the Manager of the Series has voluntarily agreed to reimburse the Series in order to limit operating expenses (excluding interest, taxed and brokerage commissions) to 2.36% of the average daily net assets of the Class B shares. If the Manager had not reimbursed the Series, the annual expenses (both including and excluding distribution and service (12b-1) fees and net investment income ratios would be 2.37%, 1.37% and 0.38%, respectively, for the year ended October 31, 2005. |
See Notes to Financial Statements.
| 34 | Visit our website at www.strategicpartners.com |
| Class B | ||||||||||||||
| Year Ended October 31, | ||||||||||||||
| 2004(b) | 2003(b) | 2002(b) | 2001 | |||||||||||
| $ | 15.58 | $ | 13.71 | $ | 16.99 | $ | 21.88 | |||||||
| .03 | .03 | (.05 | ) | (.03 | ) | |||||||||
| 2.15 | 1.84 | (2.48 | ) | (3.95 | ) | |||||||||
| 2.18 | 1.87 | (2.53 | ) | (3.98 | ) | |||||||||
| (.03 | ) | — | — | — | ||||||||||
| — | — | (.75 | ) | (.91 | ) | |||||||||
| (.03 | ) | — | (.75 | ) | (.91 | ) | ||||||||
| $ | 17.73 | $ | 15.58 | $ | 13.71 | $ | 16.99 | |||||||
| 13.98 | % | 13.64 | % | (15.77 | )% | (18.93 | )% | |||||||
| $ | 25,917 | $ | 33,651 | $ | 37,636 | $ | 55,620 | |||||||
| $ | 33,863 | $ | 33,581 | $ | 49,420 | $ | 74,063 | |||||||
| 2.36 | % | 2.47 | % | 2.39 | % | 2.35 | % | |||||||
| 1.36 | % | 1.47 | % | 1.39 | % | 1.35 | % | |||||||
| .15 | % | .20 | % | (.33 | )% | (.13 | )% | |||||||
See Notes to Financial Statements.
| Strategic Partners International Value Fund | 35 |
Financial Highlights
Cont’d
| Class C | ||||
| Year Ended October 31, 2005(b) | ||||
Per Share Operating Performance: | ||||
Net Asset Value, Beginning Of Year | $ | 17.74 | ||
Income (Loss) from investment operations | ||||
Net investment income (loss) | .08 | |||
Net realized and unrealized gain (loss) on investment and foreign currency transactions | 3.43 | |||
Total from investment operations | 3.51 | |||
Less Dividends and Distributions | ||||
Dividends from net investment income | (.04 | ) | ||
Distributions from net realized gains | — | |||
Total dividends and distributions | (.04 | ) | ||
Net asset value, end of year | $ | 21.21 | ||
Total Return(a): | 19.81 | % | ||
Ratios/Supplemental Data: | ||||
Net assets, end of year (000) | $ | 12,720 | ||
Average net assets (000) | $ | 13,293 | ||
Ratios to average net assets: | ||||
Expenses, including distribution and service (12b-1) fees | 2.37 | %(c) | ||
Expenses, excluding distribution and service (12b-1) fees | 1.37 | %(c) | ||
Net investment income (loss) | .40 | %(c) | ||
| (a) | Total return does not consider the effects of sales loads. Total return is calculated assuming a purchase of shares on the first day and a sale on the last day of each year reported, and includes reinvestment of dividends and distributions. |
| (b) | Calculated based upon average shares outstanding during the year. |
| (c) | Effective August 1, 2005, the Manager of the Series has voluntarily agreed to reimburse the Series in order to limit operating expenses (excluding interest, taxed and brokerage commissions) to 2.36% of the average daily net assets of the Class C shares. If the Manager had not reimbursed the Series, the annual expenses (both including and excluding distribution and service (12b-1) fees and net investment income ratios would be 2.37%, 1.37% and 0.40%, respectively, for the year ended October 31, 2005. |
See Notes to Financial Statements.
| 36 | Visit our website at www.strategicpartners.com |
| Class C | ||||||||||||||
| Year Ended October 31, | ||||||||||||||
| 2004(b) | 2003(b) | 2002(b) | 2001 | |||||||||||
| $ | 15.60 | $ | 13.73 | $ | 17.00 | $ | 21.88 | |||||||
| .06 | .03 | (.05 | ) | (.03 | ) | |||||||||
| 2.11 | 1.84 | (2.47 | ) | (3.94 | ) | |||||||||
| 2.17 | 1.87 | (2.52 | ) | (3.97 | ) | |||||||||
| (.03 | ) | — | — | — | ||||||||||
| — | — | (.75 | ) | (.91 | ) | |||||||||
| (.03 | ) | — | (.75 | ) | (.91 | ) | ||||||||
| $ | 17.74 | $ | 15.60 | $ | 13.73 | $ | 17.00 | |||||||
| 13.90 | % | 13.62 | % | (15.70 | )% | (18.89 | )% | |||||||
| $ | 13,040 | $ | 7,438 | $ | 7,850 | $ | 11,306 | |||||||
| $ | 11,763 | $ | 6,988 | $ | 9,978 | $ | 14,599 | |||||||
| 2.36 | % | 2.47 | % | 2.39 | % | 2.35 | % | |||||||
| 1.36 | % | 1.47 | % | 1.39 | % | 1.35 | % | |||||||
| .33 | % | .18 | % | (.34 | )% | (.15 | )% | |||||||
See Notes to Financial Statements.
| Strategic Partners International Value Fund | 37 |
Financial Highlights
Cont’d
| Class Z | ||||
| Year Ended October 31, 2005(b) | ||||
Per Share Operating Performance: | ||||
Net Asset Value, Beginning Of Year | $ | 18.41 | ||
Income (Loss) from investment operations | ||||
Net investment income | .29 | |||
Net realized and unrealized gain (loss) on investment and foreign currency transactions | 3.54 | |||
Total from investment operations | 3.83 | |||
Less Dividends and Distributions | ||||
Dividends from net investment income | (.22 | ) | ||
Distributions from net realized gains | — | |||
Total dividends and distributions | (.22 | ) | ||
Net asset value, end of year | $ | 22.02 | ||
Total Return(a): | 20.97 | % | ||
Ratios/Supplemental Data: | ||||
Net assets, end of year (000) | $ | 156,678 | ||
Average net assets (000) | $ | 264,624 | ||
Ratios to average net assets: | ||||
Expenses, including distribution and service (12b-1) fees | 1.37 | %(c) | ||
Expenses, excluding distribution and service (12b-1) fees | 1.37 | %(c) | ||
Net investment income | 1.43 | %(c) | ||
| (a) | Total return is calculated assuming a purchase of shares on the first day and sale on the last day of each year reported, and includes reinvestment of dividends and distributions. |
| (b) | Calculated based upon average shares outstanding during the year. |
| (c) | Effective August 1, 2005, the Manager of the Series has voluntarily agreed to reimburse the Series in order to limit operating expenses (excluding interest, taxed and brokerage commissions) to 1.36% of the average daily net assets of the Class Z shares. If the Manager had not reimbursed the Series, the annual expenses (both including and excluding distribution and service (12b-1) fees and net investment income ratios would be 1.37%, 1.37% and 1.43%, respectively, for the year ended October 31, 2005. |
See Notes to Financial Statements.
| 38 | Visit our website at www.strategicpartners.com |
| Class Z | ||||||||||||||
| Year Ended October 31, | ||||||||||||||
| 2004(b) | 2003(b) | 2002(b) | 2001 | |||||||||||
| $ | 16.17 | $ | 14.17 | $ | 17.39 | $ | 22.15 | |||||||
| .20 | .18 | .11 | .20 | |||||||||||
| 2.22 | 1.90 | (2.55 | ) | (4.05 | ) | |||||||||
| 2.42 | 2.08 | (2.44 | ) | (3.85 | ) | |||||||||
| (.18 | ) | (.08 | ) | (.03 | ) | — | ||||||||
| — | — | (.75 | ) | (.91 | ) | |||||||||
| (.18 | ) | (.08 | ) | (.78 | ) | (.91 | ) | |||||||
| $ | 18.41 | $ | 16.17 | $ | 14.17 | $ | 17.39 | |||||||
| 15.09 | % | 14.76 | % | (14.91 | )% | (18.08 | )% | |||||||
| $ | 295,418 | $ | 310,521 | $ | 269,625 | $ | 306,278 | |||||||
| $ | 334,003 | $ | 276,808 | $ | 308,825 | $ | 375,390 | |||||||
| 1.36 | % | 1.47 | % | 1.39 | % | 1.35 | % | |||||||
| 1.36 | % | 1.47 | % | 1.39 | % | 1.35 | % | |||||||
| 1.10 | % | 1.22 | % | .68 | % | .89 | % | |||||||
See Notes to Financial Statements.
| Strategic Partners International Value Fund | 39 |
Report of Independent Registered Public Accounting Firm
The Board of Directors and Shareholders of
Prudential World Fund, Inc.—Strategic Partners International Value Fund:
We have audited the accompanying statement of assets and liabilities of the Prudential World Fund, Inc.—Strategic Partners International Value Fund (one of the portfolios constituting the Prudential World Fund, Inc., hereafter referred to as the “Fund”), including the portfolio of investments, as of October 31, 2005, and the related statement of operations for the year then ended, and the statement of changes in net assets and the financial highlights for each of years in the two-year period then ended. These financial statements and financial highlights are the responsibility of the Fund’s management. Our responsibility is to express an opinion on these financial statements and financial highlights based on our audits. The financial highlights for the years presented prior to the year ended October 31, 2004, were audited by another independent registered public accounting firm, whose report dated December 22, 2003, expressed an unqualified opinion thereon.
We conducted our audits in accordance with the standards of the Public Company Accounting Oversight Board (United States). Those standards require that we plan and perform the audit to obtain reasonable assurance about whether the financial statements and financial highlights are free of material misstatement. An audit includes examining, on a test basis, evidence supporting the amounts and disclosures in the financial statements. Our procedures included confirmation of securities owned as of October 31, 2005, by correspondence with the custodian and brokers. An audit also includes assessing the accounting principles used and significant estimates made by management, as well as evaluating the overall financial statement presentation. We believe that our audits provide a reasonable basis for our opinion.
In our opinion, the financial statements and financial highlights referred to above present fairly, in all material respects, the financial position of the Fund as of October 31, 2005, and the results of its operations for the year then ended, and the changes in its net assets and the financial highlights for each of the years in the two-year period then ended, in conformity with U.S. generally accepted accounting principles.

New York, New York
December 23, 2005
| 40 | Visit our website at www.strategicpartners.com |
Federal Income Tax Information
(Unaudited)
We are required by the Internal Revenue Code to advise you within 60 days of the Series fiscal year end (October 31, 2005) as to the federal income tax status of dividends paid by the Series during such fiscal year. The Series paid ordinary income distributions for Class A, Class B, Class C and Class Z shares in the amount of $.18, $.04, $.04 and $.22 per share, respectively.
For the fiscal year ended October 31, 2005, the series designated 100.0% as qualified dividend income for the reduced tax rate under the jobs and Growth Tax Relief Reconciliation Act of 2003.
The Series has elected to give the benefit of foreign tax credits to its shareholders. Accordingly, shareholders who must report their gross income dividends and distributions in a federal income tax return will be entitled to a foreign tax credit, or an itemized deduction in computing their U.S. income tax liability. It is generally more advantageous to claim a credit rather than take a deduction. For the fiscal year ended October 31, 2005 the Series intends on passing through $1,133,539 of ordinary income distributions as a foreign tax credit from recognized foreign source income of $10,199,046.
In January 2006, you will be advised on IRS Form 1099 DIV or substitute 1099 DIV as to the federal tax status of the dividends and distributions received by you in calendar year 2005.
| Strategic Partners International Value Fund | 41 |
Management of the Fund
(Unaudited)
Information pertaining to the Directors of the Fund is set forth below. Directors who are not deemed to be “interested persons” of the Fund, as defined in the Investment Company Act of 1940 as amended, (the 1940 Act) are referred to as “Independent Directors.” Directors who are deemed to be “interested persons” of the Fund are referred to as “Interested Directors.” “Fund Complex”† consists of the Fund and any other investment companies managed by PI.
Independent Directors(2)
Linda W. Bynoe (53), Director since 2005(3) Oversees 88 portfolios in Fund complex
Principal occupations (last 5 years): President and Chief Executive Officer (since March 1995) of Telemat Ltd. (management consulting); formerly Vice President at Morgan Stanley & Co.
Other Directorships held:(4) Director of Dynegy Inc. (energy services) (since September 2002) and Simon Property Group, Inc. (real estate investment trust) (since May 2003); Director (since August 2005) of The High Yield Plus Fund, Inc.
David E.A. Carson (71), Director since 2003(3) Oversees 92 portfolios in Fund complex
Principal occupations (last 5 years): Formerly Director (January 2000-May 2000), Chairman (January 1999- December 1999), Chairman and Chief Executive Officer (January 1998-December 1998) and President, Chairman and Chief Executive Officer (1983-1997) of People’s Bank.
Other Directorships held:(4) Director (since 2004) of The High Yield Plus Fund, Inc.
Robert E. La Blanc (71), Director since 1984(3) Oversees 89 portfolios in Fund complex
Principal occupations (last 5 years): President (since 1981) of Robert E. La Blanc Associates, Inc. (telecommunications).
Other Directorships held:(4) Director of Chartered Semiconductor Manufacturing, Ltd. (since 1998); Computer Associates International, Inc. (since 2002) (software company); FiberNet Telecom Group, Inc. (since 2003) (telecom company); Director (since April 1999) of The High Yield Plus Fund, Inc.
Douglas H. McCorkindale (66), Director since 2003(3) Oversees 89 portfolios in Fund complex
Principal occupations (last 5 years): Chairman (since February 2001) of Gannett Co., Inc. (publishing and media); formerly Chief Executive Officer (June 2000-July 2005), President (September 1997-July 2005) and Vice Chairman (March 1984-May 2000) of Gannett Co., Inc.
Other Directorships held:(4) Director of Gannett Co., Inc., Director of Continental Airlines, Inc. (since May 1993); Director of Lockheed Martin Corp. (aerospace and defense) (since May 2001); Director of The High Yield Plus Fund, Inc. (since 1996).
Richard A. Redeker (62), Director since 2003(3) Oversees 89 portfolios in Fund complex
Principal occupations (last 5 years): Management Consultant; Director of Invesmart, Inc. (since 2001) and Director of Penn Tank Lines, Inc. (since 1999).
Other Directorships held:(4) Director (since January 2005) of The High Yield Plus Fund, Inc.
| 42 | Visit our website at www.strategicpartners.com |
Robin B. Smith (66), Director since 1996(3) Oversees 90 portfolios in Fund complex
Principal occupations (last 5 years): Chairman of the Board (since January 2003) of Publishers Clearing House (direct marketing); formerly Chairman and Chief Executive Officer (August 1996-January 2003) of Publishers Clearing House.
Other Directorships held:(4) Director of BellSouth Corporation (since 1992); Director (since January 2005) of The High Yield Plus Fund, Inc.
Stephen G. Stoneburn (62), Director since 1996(3) Oversees 89 portfolios in Fund complex
Principal occupations (last 5 years): President and Chief Executive Officer (since June 1996) of Quadrant Media Corp. (a publishing company); formerly President (June 1995-June 1996) of Argus Integrated Media, Inc.; Senior Vice President and Managing Director (January 1993-1995) of Cowles Business Media and Senior Vice President of Fairchild Publications, Inc. (1975-1989).
Other Directorships held:(4) Director (since January 2005) of The High Yield Plus Fund, Inc.
Clay T. Whitehead (67), Director since 1984(3) Oversees 90 portfolios in Fund complex
Principal occupations (last 5 years): President (since 1983) of National Exchange Inc. (new business development firm).
Other Directorships held:(4) Director (since 2000) of The High Yield Plus Fund, Inc.
Interested Directors(1)
Judy A. Rice (57), President since 2003 and Director since 2000(3) Oversees 89 portfolios in Fund complex
Principal occupations (last 5 years): President, Chief Executive Officer, Chief Operating Officer and Officer-in-Charge (since February 2003) of Prudential Investments LLC; Vice President (since February 1999) of Prudential Investment Management Services LLC; President, Chief Executive Officer and Officer-in-Charge (since April 2003) of Prudential Mutual Fund Services LLC; formerly Executive Vice President (September 1999-February 2003) of PI; Member of Board of Governors of the Money Management Institute.
Other Directorships held:(4) Director (since August 2005) of The High Yield Plus Fund, Inc.
Robert F. Gunia (59), Vice President and Director since 1996(3) Oversees 157 portfolios in Fund complex
Principal occupations (last 5 years): Chief Administrative Officer (since September 1999) and Executive Vice President (since December 1996) of PI; President (since April 1999) of Prudential Investment Management Services LLC; Executive Vice President (since March 1999) and Treasurer (since May 2000) of Prudential Mutual Fund Services LLC.
Other Directorships held:(4) Vice President and Director (since May 1989) and Treasurer (since 1999) of The Asia Pacific Fund, Inc.; Vice President (since 2004) and Director (since August 2005) of The High Yield Plus Fund, Inc.
Information pertaining to the Officers of the Fund who are not also Directors is set forth below.
Officers(2)
Kathryn L. Quirk (52), Chief Legal Officer since 2005(3)
Principal occupations (last 5 years): Vice President and Corporate Counsel (since September 2004) of Prudential; Executive Vice President, Chief Legal Officer and Secretary (since July 2005) of PI and Prudential Mutual Fund Services LLC; formerly Managing Director, General Counsel, Chief Compliance Officer, Chief Risk Officer and Corporate Secretary (1997-2002) of Zurich Scudder Investments, Inc.
| Strategic Partners International Value Fund | 43 |
Deborah A. Docs (47), Secretary since 2005(3)
Principal occupations (last 5 years): Vice President and Corporate Counsel (since January 2001) of Prudential; Vice President (since December 1996) and Assistant Secretary (since March 1999) of Prudential Investments LLC; formerly Vice President and Assistant Secretary (May 2003-June 2005) of American Skandia Investment Services, Inc.
Jonathan D. Shain (47), Assistant Secretary since 2005(3)
Principal occupations (last 5 years): Vice President and Corporate Counsel (since August 1998) of Prudential; Vice President and Assistant Secretary (since May 2001) of Prudential Investments LLC; Vice President and Assistant Secretary (since February 2001) of PMFS; formerly Vice President and Assistant Secretary (May 2003-June 2005) of American Skandia Investment Services, Inc.
Marina Belaya (38), Assistant Secretary since 2005(3)
Principal occupations (last 5 years): Vice President and Corporate Counsel (since April 2005) of Prudential; formerly Associate (September 2002-March 2005) at Schutle, Roth & Zabel LLP.
Claudia DiGiacomo (31), Assistant Secretary since 2005(3)
Principal occupations (last 5 years): Vice President and Corporate Counsel (since January 2005) of Prudential; Associate at Sidley Austin Brown & Wood LLP (1999-2004).
Lee D. Augsburger (46), Chief Compliance Officer since 2004(3)
Principal occupations (last 5 years): Senior Vice President and Chief Compliance Officer (since April 2003) of Prudential Investments LLC; Vice President (since November 2000) and Chief Compliance Officer (since October 2000) of Prudential Investment Management, Inc.; Chief Compliance Officer and Senior Vice President (since May 2003) of American Skandia Investment Services, Inc.; Chief Compliance Officer (since October 2004) of Quantitative Management Associates LLC.
Maryanne Ryan (41), Anti-Money Laundering Compliance Officer since 2002(3)
Principal occupations (last 5 years): Anti-Money Laundering Officer and Vice President (since April 2002) of Pruco Securities, LLC. Vice President and Bank Secrecy Act Officer (since July 2004) of Prudential Trust Company; Anti-Money Laundering Officer (since April 2003) of Prudential Investments LLC.
Grace C. Torres (46), Treasurer and Principal Financial and Accounting Officer since 1995(3)
Principal occupations (last 5 years): Assistant Treasurer (since March 1999) and Senior Vice President (since September 1999) of Prudential Investments LLC; Assistant Treasurer (since May 2003) and Vice President (since June 2005) of American Skandia Investment Services, Inc.; Senior Vice President and Assistant Treasurer (since May 2003) of American Skandia Advisory Services, Inc.; formerly Senior Vice President (May 2003-June 2005) of American Skandia Investment Services, Inc.
Jack Benintende (41), Acting Treasurer since 2005
Vice President (since June 2000) within Prudential Mutual Fund Administration; Assistant Treasurer (since September 2004) of The High Yield Plus Fund, Inc.; formerly Assistant Treasurer (2000-October 2004) of Aberdeen Asia-Pacific Income Fund, Inc. and Aberdeen Australia Equity Fund, Inc.; Senior manager within the investment management practice of PricewaterhouseCoopers LLP (May 1994 through June 2000).
| (1) | “Interested” Director, as defined in the 1940 Act, by reason of employment with the Manager the Subadviser or the Distributor. |
| (2) | Unless otherwise noted, the address of the Directors and Officers is c/o: Prudential Investments LLC, Gateway Center Three, 100 Mulberry Street, Newark, NJ 07102. |
| 44 | Visit our website at www.strategicpartners.com |
| (3) | There is no set term of office for Directors and Officers. The Independent Directors have adopted a retirement policy, which calls for the retirement of Directors on December 31 of the year in which they reach the age of 75. The table shows the individuals length of service as Director and/or Officer. |
| (4) | This column includes only directorships of companies required to register, or file reports with the SEC under the Securities and Exchange Act of 1934 (that is, “public companies”) or other investment companies registered under the 1940 Act. |
| † | The Fund Complex consists of all investment companies managed by PI. The Funds for which PI serves as manager include JennisonDryden Mutual Funds, Strategic Partners Funds, The Prudential Variable Contract Accounts 2, 10, 11, The Target Portfolio Trust, The Prudential Series Fund, Inc., American Skandia Trust and Prudential’s Gibraltar Fund. |
| Strategic Partners International Value Fund | 45 |
Approval of Advisory Agreements
The Board of Directors (the “Board”) of Prudential World Fund, Inc. oversees the management of the Strategic Partners International Value Fund (the “Fund”), and, as required by law, determines annually whether to renew the Fund’s management agreement with Prudential Investments LLC (“PI”) and the Fund’s subadvisory agreement with Quantitative Management Associates LLC (“QMA”). In considering the renewal of the agreements, the Board, including a majority of the Independent Directors, met on May 24, 2005 and June 23, 2005 and approved the renewal of the agreements through July 31, 2006, after concluding that renewal of the agreements was in the best interests of the Fund and its shareholders.
In advance of the meetings, the Board received materials relating to the agreements, and had the opportunity to ask questions and request further information in connection with their consideration. Among other things, the Board considered performance and expense comparisons with other mutual funds in relevant Peer Universes and Peer Groups. The mutual funds included in each Peer Universe or Peer Group were objectively determined solely by Lipper Inc. (“Lipper”), an independent provider of mutual fund data. Peer Universes and Peer Groups are mutual funds grouped according to investment style. If the quartile refers to performance, then a fund in the first quartile is among the best performers. If the quartile refers to expenses, then a fund in the first quartile has among the lowest expenses.
In approving the agreements, the Board, including the Independent Directors advised by independent legal counsel, considered factors they deemed relevant, including the nature, quality and extent of services provided, the performance of the Fund, the profitability of PI and its affiliates, expenses and fees, and the potential for economies of scale that may be shared with the Fund and its shareholders. In their deliberations, the Directors did not identify any single factor that was dispositive and each Director attributed different weights to the various factors. In connection with their deliberations, the Board considered information provided by PI throughout the year at regular Board meetings, presentations from portfolio managers and other information, as well as information furnished at or in advance of the meetings on May 24, 2005 and June 23, 2005.
The Directors determined that the overall arrangements between the Fund and PI, which serves as the Fund’s investment manager pursuant to a management agreement, and between PI and each of LSV Asset Management (“LSV”) and Thornburg Investment Management, Inc. (“Thornburg”), which serve as the Fund’s subadvisers pursuant to the terms of subadvisory agreements with PI, are fair and reasonable in light of the services performed, fees charged, and such other matters as the Directors considered relevant in the exercise of their business judgment.
| Strategic Partners International Value Fund |
Approval of Advisory Agreements (continued)
Several of the material factors and conclusions that formed the basis for the Directors reaching their determinations to approve the continuance of the agreements are separately discussed below.
Nature, Quality and Extent of Services
The Board received and considered information regarding the nature and extent of services provided to the Fund by PI and each of LSV and Thornburg. The Board considered the services provided by PI, including but not limited to the oversight of LSV and Thornburg as subadvisers for the Fund, as well as the provision of recordkeeping, compliance, and other services to the Fund. With respect to PI’s oversight of the subadvisers, the Board noted that PI’s Strategic Investment Research Group (“SIRG”), which is a business unit of PI, is responsible for screening and recommending new subadvisers when appropriate, as well as monitoring and reporting to the Board on the performance and operations of the subadvisers. The Board also considered that PI pays the salaries of all of the officers and non-independent Directors of the Fund. The Board also considered the investment subadvisory services provided by each of LSV and Thornburg, as well as adherence to the Fund’s investment restrictions and compliance with applicable Fund policies and procedures. The Board considered PI’s evaluation of the subadvisers, as well as PI’s recommendation based on its review of the subadvisers, to renew the subadvisory agreements.
The Board reviewed the qualifications, backgrounds and responsibilities of PI’s senior management responsible for the oversight of the Fund and LSV and Thornburg, and also reviewed the qualifications, backgrounds and responsibilities of the LSV and Thornburg portfolio managers who are responsible for the day-to-day management of the Fund’s portfolio. The Board was provided with information pertaining to PI’s, LSV’s and Thornburg’s respective organizational structures, senior management, investment operations, and other relevant information. The Board also noted that it received favorable compliance reports from the Fund’s Chief Compliance Officer (CCO) as to each of PI, LSV and Thornburg.
The Board concluded that it was satisfied with the nature, extent and quality of the investment management services provided by PI and the subadvisory services provided to the Fund by LSV and Thornburg, and that there was a reasonable basis on which to conclude that the Fund benefits from the services provided by each of PI, LSV and Thornburg under the management and subadvisory agreements.
Performance of Strategic Partners International Value Fund
The Board received and considered information about the Fund’s historical performance, noting that the Fund had achieved performance that was in the fourth
| Visit our website at www.strategicpartners.com |
quartile over one-year and three-year time periods ended December 31, 2004, and performance that was in the second quartile over a five-year time period ended December 31, 2004 in relation to the group of comparable funds in a Peer Universe. In addition, the Fund had underperformed when compared against the appropriate benchmark index, the MSCI EAFE Index, over the same time periods. While expressing the view that the Fund’s performance had been disappointing, the Board noted that PI had taken steps to address the performance issues by replacing the previous subadviser and that the Fund’s one-year and three-year performance was not attributable to LSV or Thornburg, each of which had only served as subadviser to the Fund since December 14, 2004. In light of this, the Board concluded that it was reasonable to allow LSV and Thornburg to create a performance record against which LSV and Thornburg should be evaluated to approve the continuance of the management and subadvisory agreements and to continue to monitor the situation.
Fees and Expenses
The Board considered the management fee for the Fund as compared to the management fee charged by PI to other funds and accounts and the fee charged by other advisers to comparable mutual funds as provided by Lipper.
The Fund’s management fee of 0.985% ranked in the second quartile in its Peer Group. The Board accepted PI’s recommendation to reduce the management fee earned on Fund assets from 0.95% on assets above $300 million to 0.95% on assets above $300 million to $1 billion, and 0.90% on all assets over $1 billion. The Board concluded that the management and subadvisory fees are reasonable.
Costs of Services and Profits Realized by PI
The Board was provided with information on the profitability of PI and its affiliates in serving as the Fund’s investment manager. The Board discussed with PI the methodology utilized in assembling the information regarding profitability and considered its reasonableness. The Board recognized that it is difficult to make comparisons of profitability from fund management contracts because comparative information is not generally publicly available and is affected by numerous factors, including the structure of the particular adviser, the types of funds it manages, its business mix, numerous assumptions regarding allocations and the adviser’s capital structure and cost of capital. Taking these factors into account, the Board concluded that the profitability of PI and its affiliates in relation to the services rendered was not unreasonable.
| Strategic Partners International Value Fund |
Approval of Advisory Agreements (continued)
The Board considered information about the profitability of LSV or Thornburg, but concluded that the level of a subadviser’s profitability may not be as significant given the arm’s length nature of the process by which the subadvisory fee rates were negotiated by PI, LSV and Thornburg, as well as the fact that PI compensates the subadvisers out of its management fee.
Economies of Scale
The Board noted that the management fee schedule for the Fund includes breakpoints, which have the effect of decreasing the fee rate as assets increase, but at the current level of assets the Fund does not realize the effect of those rate reductions. The Board received and discussed information concerning whether PI realizes economies of scale as the Fund’s assets grow beyond current levels. The Board took note that the Fund’s fee structure would result in benefits to Fund shareholders when (and if) assets reach the levels at which the fee rate is reduced. These benefits will accrue whether or not PI is then realizing any economies of scale.
Other Benefits to PI, LSV and Thornburg
The Board considered potential ancillary benefits that might be received by PI, LSV and Thornburg and their affiliates as a result of their relationship with the Fund. The Board concluded that potential benefits to be derived by PI included brokerage commissions received by affiliates of PI, transfer agency fees received by the Fund’s transfer agent (which is affiliated with PI), as well as reputational or other intangible benefits resulting from PI’s association with the Funds. The Board concluded that the potential benefits to be derived by LSV and Thornburg included their ability to use soft dollar credits, brokerage commissions received by affiliates of LSV and Thornburg, as well as the potential benefits consistent with those generally resulting from an increase in assets under management, specifically potential access to additional research resources and reputational benefits. The Board concluded that the benefits derived by PI, LSV and Thornburg were consistent with the types of benefits generally derived by investment managers and subadvisers to mutual funds.
| Visit our website at www.strategicpartners.com |
Growth of a $10,000 Investment
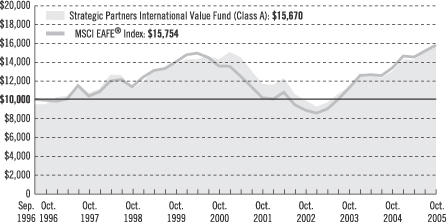
| Average Annual Total Returns (With Sales Charges) as of 10/31/05 | |||||||||||
| One Year | Five Years | Ten Years | Since Inception | ||||||||
Class A | 14.07 | % | 0.79 | % | N/A | 5.06% | |||||
Class B | 14.77 | 0.97 | N/A | 4.91 | |||||||
Class C | 18.81 | 1.18 | N/A | 4.92 | |||||||
Class Z | 20.97 | 2.18 | 6.62 | % | 8.74 (8.73) | ||||||
| Average Annual Total Returns (Without Sales Charges) as of 10/31/05 | |||||||||||
| One Year | Five Years | Ten Years | Since Inception | ||||||||
Class A | 20.71 | % | 1.94 | % | N/A | 5.71% | |||||
Class B | 19.77 | 1.16 | N/A | 4.91 | |||||||
Class C | 19.81 | 1.18 | N/A | 4.92 | |||||||
Class Z | 20.97 | 2.18 | 6.62 | % | 8.74 (8.73) | ||||||
Performance data quoted represent past performance. Past performance does not guarantee future results. The investment return and principal value of an investment will fluctuate, so that an investor’s shares, when redeemed, may be worth more or less than their original cost. Current performance may be lower or higher than the past performance data quoted. An investor may obtain performance data as of the most recent month-end by visiting our website at www.strategicpartners.com or by calling (800) 225-1852. The maximum initial sales charge is 5.50%.
The returns in the graph and the tables do not reflect the deduction of taxes that a shareholder would pay on Fund distributions or following the redemption of Fund shares.
| Visit our website at www.strategicpartners.com |
Source: Prudential Investments LLC and Lipper Inc.
Inception dates: Class A, Class B, and Class C, 9/23/96; Class Z, 11/5/92.
The graph compares a $10,000 investment in the Strategic Partners International Value Fund (Class A shares) with a similar investment in the MSCI EAFE® Index by portraying the initial account values at the commencement of operations of Class A shares (September 23, 1996) and the account values at the end of the current fiscal year (October 31, 2005) as measured on a quarterly basis. For purposes of the graph, and unless otherwise indicated, it has been assumed that (a) the maximum applicable front-end sales charge was deducted from the initial $10,000 investment in Class A shares; (b) all recurring fees (including management fees) were deducted; and (c) all dividends and distributions were reinvested. The line graph provides information for Class A shares only. As indicated in the tables provided earlier, performance for Class B, Class C, and Class Z shares will vary due to the differing charges and expenses applicable to each share class (as indicated in the following paragraphs). Without a contractual distribution and service (12b-1) fee waiver of 0.05% for Class A shares through October 31, 2005, the returns shown in the graph and for Class A shares in the tables would have been lower.
The MSCI EAFE® Index is an unmanaged, weighted index of performance that reflects stock price movements of developed-country markets in Europe, Australasia, and the Far East. The MSCI EAFE® Index’s total returns include the reinvestment of all dividends, but do not include the effects of sales charges, operating expenses of a mutual fund, or taxes. These returns would be lower if they included the effects of sales charges, operating expenses, or taxes. The securities that comprise the MSCI EAFE® Index may differ substantially from the securities in the Fund. The MSCI EAFE® Index is not the only index that may be used to characterize performance of international stock funds. Other indexes may portray different comparative performance. Investors cannot invest directly in an index.
Class A shares are subject to a maximum front-end sales charge of 5.50%, a 12b-1 fee of up to 0.30% annually, and all investors who purchase Class A shares in an amount of $1 million or more and sell these shares within 12 months of purchase are subject to a contingent deferred sales charge (CDSC) of 1%, in certain circumstances. Class B shares are subject to a declining CDSC of 5%, 4%, 3%, 2%, 1%, and 1% respectively for the first six years after purchase and a 12b-1 fee of 1% annually. Approximately seven years after purchase, Class B shares will automatically convert to Class A shares on a quarterly basis. Class C shares purchased are not subject to a front-end sales charge, but charge a CDSC of 1% for Class C shares sold within 12 months from the date of purchase and an annual 12b-1 fee of 1%. Class Z shares are not subject to a sales charge or 12b-1 fees. The returns in the graph and tables reflect the share class expense structure in effect at the close of the fiscal period.
| Strategic Partners International Value Fund |
| n MAIL | n TELEPHONE | n WEBSITE | ||
Gateway Center Three 100 Mulberry Street Newark, NJ 07102 | (800) 225-1852 | www.strategicpartners.com |
| PROXY VOTING |
| The Board of Directors of the Fund has delegated to the Fund’s investment subadvisers the responsibility for voting any proxies and maintaining proxy recordkeeping with respect to the Fund. A description of these proxy voting policies and procedures is available without charge, upon request, by calling (800) 225-1852 or by visiting the Securities and Exchange Commission’s (the Commission) website at www.sec.gov. Information regarding how the Fund voted proxies relating to portfolio securities during the most recent 12-month period ended June 30, 2005, is available on the Fund’s website at www.strategicpartners.com and on the Commission’s website at www.sec.gov. |
| DIRECTORS |
| Linda W. Bynoe • David E.A. Carson • Robert F. Gunia • Robert E. La Blanc • Douglas H. McCorkindale • Richard A. Redeker • Judy A. Rice • Robin B. Smith • Stephen G. Stoneburn • Clay T. Whitehead |
| OFFICERS |
| Judy A. Rice, President • Robert F. Gunia, Vice President • Grace C. Torres, Treasurer and Principal Financial and Accounting Officer • Jack Benintende, Acting Treasurer • Deborah A. Docs, Secretary • Jonathan D. Shain, Assistant Secretary • Claudia DiGiacomo, Assistant Secretary • Marina Belaya, Assistant Secretary • Maryanne Ryan, Anti-Money Laundering Compliance Officer • Lee D. Augsburger, Chief Compliance Officer |
| MANAGER | Prudential Investments LLC | Gateway Center Three 100 Mulberry Street Newark, NJ 07102 | ||
| INVESTMENT SUBADVISERS | LSV Asset Management Thornburg Investment Management, Inc. | One North Wacker Drive Suite 4000 Chicago, IL 60606 119 East Marcy Street Santa Fe, NM 87501 | ||
| DISTRIBUTOR | Prudential Investment Management Services LLC | Gateway Center Three 100 Mulberry Street Newark, NJ 07102 | ||
| CUSTODIAN | ||||
| Through November 6, 2005: | State Street Bank and Trust Company | One Heritage Drive North Quincy, MA 02171 | ||
| Effective November 7, 2005: | PFPC Trust Company | 400 Bellevue Parkway Wilmington, DE 19809 | ||
| TRANSFER AGENT | Prudential Mutual Fund Services LLC | PO Box 8098 Philadelphia, PA 19176 | ||
| INDEPENDENT REGISTERED PUBLIC ACCOUNTING FIRM | KPMG LLP | 345 Park Avenue New York, NY 10154 | ||
| FUND COUNSEL | Sullivan & Cromwell LLP | 125 Broad Street New York, NY 10004 | ||
| An investor should consider the investment objectives, risks, charges, and expenses of the Fund carefully before investing. The prospectus for the Fund contains this and other information about the Fund. An investor may obtain a prospectus by visiting our website at www.strategicpartners.com or by calling (800) 225-1852. The prospectus should be read carefully before investing. |
| E-DELIVERY |
| To receive your mutual fund documents on-line, go to www.icsdelivery.com/prudential/funds and enroll. Instead of receiving printed documents by mail, you will receive notification via e-mail when new materials are available. You can cancel your enrollment or change your e-mail address at any time by clicking on the change/cancel enrollment option at the icsdelivery website address. |
| SHAREHOLDER COMMUNICATIONS WITH DIRECTORS |
| Shareholders can communicate directly with the Board of Directors by writing to the Chair of the Board, Strategic Partners International Value Fund, PO Box 13964, Philadelphia, PA 19176. Shareholders can communicate directly with an individual Director by writing to the same address. Communications are not screened before being delivered to the addressee. |
| AVAILABILITY OF PORTFOLIO SCHEDULE |
| The Fund files its complete schedule of portfolio holdings with the Securities and Exchange Commission (the Commission) for the first and third quarters of each fiscal year on Form N-Q. The Fund’s Forms N-Q are available on the Commission’s website at www.sec.gov. The Fund’s Forms N-Q may also be reviewed and copied at the Commission’s Public Reference Room in Washington, D.C. Information on the operation and location of the Public Reference Room may be obtained by calling (800) SEC-0330 (732-0330). The Fund will provide a full list of its portfolio holdings on its website (www.strategicpartners.com) as of the end of each fiscal quarter approximately 60 days after the end of the fiscal quarter. |
| The Fund’s Statement of Additional Information contains additional information about the Fund’s Directors and is available without charge, upon request, by calling (800) 225-1852. |
Mutual Funds:
| ARE NOT INSURED BY THE FDIC OR ANY FEDERAL GOVERNMENT AGENCY | MAY LOSE VALUE | ARE NOT A DEPOSIT OF OR GUARANTEED BY ANY BANK OR ANY BANK AFFILIATE |

| Strategic Partners International Value Fund | ||||||||||||
| Share Class | A | B | C | Z | ||||||||
NASDAQ | PISAX | PISBX | PCISX | PISZX | ||||||||
CUSIP | 743969503 | 743969602 | 743969701 | 743969800 | ||||||||
MFSP115E IFS-A112585 Ed. 12/2005

Dryden International Equity Fund
OCTOBER 31, 2005 | ANNUAL REPORT |

FUND TYPE
Global/International stock
OBJECTIVE
Long-term growth of capital
This report is not authorized for distribution to prospective investors unless preceded or accompanied by a current prospectus.
The views expressed in this report and information about the Fund’s portfolio holdings are for the period covered by this report and are subject to change thereafter.
JennisonDryden is a registered trademark of The Prudential Insurance Company of America.

December 15, 2005
Dear Shareholder:
We hope you find the annual report for the Dryden International Equity Fund, a series of Prudential World Fund, Inc., informative and useful. As a JennisonDryden mutual fund shareholder, you may be thinking about where you can find additional growth opportunities. You could invest in last year’s top-performing asset class and hope that history repeats itself or you could stay in cash while waiting for the “right moment” to invest.
Instead, we believe it is better to take advantage of developing domestic and global investment opportunities through a diversified portfolio of stock and bond mutual funds. A diversified asset allocation offers two potential advantages. It helps you manage downside risk by not being overly exposed to any particular asset class, plus it gives you a better opportunity to have at least some of your assets in the right place at the right time. Your financial professional can help you create a diversified investment plan that may include mutual funds covering all the basic asset classes and that reflects your personal investor profile and tolerance for risk.
JennisonDryden Mutual Funds gives you a wide range of choices that can help you make progress toward your financial goals. Our funds offer the experience, resources, and professional discipline of three leading asset managers. They are recognized and respected in the institutional market and by discerning investors for excellence in their respective strategies. JennisonDryden equity funds are advised by Jennison Associates LLC and Quantitative Management Associates LLC (QMA). Prudential Investment Management, Inc. (PIM) advises the JennisonDryden fixed income and money market funds. Jennison Associates, QMA, and PIM are registered investment advisers and Prudential Financial companies.
Thank you for choosing JennisonDryden Mutual Funds.
Sincerely,

Judy A. Rice, President
Dryden International Equity Fund
| Dryden International Equity Fund | 1 |
Your Fund’s Performance
Fund objective
The investment objective of the Dryden International Equity Fund (the Fund) is long-term growth of capital. There can be no assurance that the Fund will achieve its investment objective.
Performance data quoted represent past performance. Past performance does not guarantee future results. The investment return and principal value of an investment will fluctuate, so that an investor’s shares, when redeemed, may be worth more or less than their original cost. Current performance may be lower or higher than the past performance data quoted. An investor may obtain performance data as of the most recent month-end by visiting our website at www.jennisondryden.com or by calling (800) 225-1852. The maximum initial sales charge is 5.50% (Class A shares).
| Cumulative Total Returns1 as of 10/31/05 | |||||||||
| One Year | Five Years | Since Inception2 | |||||||
Class A | 20.13 | % | –12.57 | % | –30.93 | % | |||
Class B | 19.08 | –15.92 | –33.91 | ||||||
Class C | 19.08 | –15.92 | –33.91 | ||||||
Class Z | 20.40 | –11.72 | –30.17 | ||||||
MSCI EAFE® Index3 | 18.09 | 16.15 | 4.01 | ||||||
Lipper International Multi-Cap Growth Funds Avg.4 | 17.54 | 2.22 | –18.84 | ||||||
| Average Annual Total Returns1 as of 9/30/05 | |||||||||
| One Year | Five Years | Since Inception2 | |||||||
Class A | 19.84 | % | –4.51 | % | –6.92 | % | |||
Class B | 20.92 | –4.35 | –6.84 | ||||||
Class C | 24.92 | –4.16 | –6.67 | ||||||
Class Z | 27.04 | –3.24 | –5.79 | ||||||
MSCI EAFE® Index3 | 25.79 | 3.16 | 1.24 | ||||||
Lipper International Multi-Cap Growth Funds Avg.4 | 25.12 | –0.46 | –3.67 | ||||||
The cumulative total returns do not reflect the deduction of applicable sales charges. If reflected, the applicable sales charges would reduce the cumulative total returns performance quoted. Class A shares are subject to a maximum front-end sales charge of 5.50%. Under certain circumstances, Class A shares may be subject to a contingent deferred sales charge (CDSC) of 1%. Class B and Class C shares are subject to a maximum CDSC of 5% and 1% respectively. Class Z shares are not subject to a sales charge.
| 2 | Visit our website at www.jennisondryden.com |
1Source: Prudential Investments LLC and Lipper Inc. The average annual total returns take into account applicable sales charges. During certain periods shown, fee waivers and/or expense reimbursements were in effect. Without such fee waivers and expense reimbursements, the returns for the share classes would have been lower. Class A, Class B, and Class C shares are subject to an annual distribution and service (12b-1) fee of up to 0.30%, 1.00%, and 1.00% respectively. Approximately seven years after purchase, Class B shares will automatically convert to Class A shares on a quarterly basis. Class Z shares are not subject to a 12b-1 fee. The returns in the tables do not reflect the deduction of taxes that a shareholder would pay on Fund distributions or following the redemption of Fund shares.
2Inception date: 3/1/2000. The Since Inception returns for the MSCI EAFE® Index and the Lipper International Multi-Cap Growth Funds Average (Lipper Average) are measured from the closest month-end to inception date, and not from the Fund’s actual inception date.
3The Morgan Stanley Capital International Europe, Australasia, and Far East (MSCI EAFE®) Index is an unmanaged, weighted index of performance that reflects stock price movements of developed-country markets in Europe, Australasia, and the Far East.
4The Lipper Average represents returns based on an average return of all funds in the Lipper International Multi-Cap Growth Funds category. Funds in the Lipper Average invest in a variety of market-capitalization ranges without concentrating 75% of their equity assets in any one market-capitalization range over an extended period of time. Multi-cap funds typically have 25% to 75% of their assets invested in companies strictly outside of the United States with market capitalizations (on a three-year weighted basis) greater than the 250th largest company in the S&P/Citigroup World ex-U.S. Broad Market Index. Multi-cap growth funds typically have an above-average price-to-cash flow ratio, price-to-book ratio, and three-year sales-per-share growth value compared with the S&P/Citigroup World ex-U.S. Broad Market Index.
Investors cannot invest directly in an index. The returns for the MSCI EAFE® Index and the Lipper Average would be lower if they included the effects of sales charges, operating expenses of a mutual fund, or taxes. Returns for the Lipper Average reflect the deduction of operating expenses, but not sales charges or taxes.
| Five Largest Holdings in Long-Term Portfolio expressed as a percentage of net assets as of 10/31/05 | |||
Vodafone Air Touch PLC, Diversified Telecommunication Services | 1.9 | % | |
HSBC Holdings PLC, Banks | 1.7 | ||
Total SA, Oil, Gas & Consumable Fuels | 1.7 | ||
Toyota Motor Corp., Automobiles | 1.7 | ||
GlaxoSmithKline PLC, Pharmaceuticals | 1.6 |
Holdings are subject to change.
| Five Largest Industries in Long-Term Portfolio expressed as a percentage of net assets as of 10/31/05 | |||
Banks | 14.6 | % | |
Oil, Gas & Consumable Fuels | 8.8 | ||
Pharmaceuticals | 4.8 | ||
Diversified Financials | 4.6 | ||
Trading Companies & Distributors | 4.6 |
Industry weightings are subject to change.
| Dryden International Equity Fund | 3 |
Investment Subadviser’s Report
Quantitative Management Associates LLC
Over the 12 months ended October 31, 2005, the Fund’s Class A shares performed better than the MSCI EAFE Index and the Lipper International Multi-Cap Growth Funds Average, a measure of comparable funds’ performance.
The Dryden International Equity Fund is actively managed with the objective of long-term growth of capital. To meet this objective, we invest in both rapidly growing and slowly growing companies. This limits our exposure to any particular style of investing and can reduce the Fund’s volatility relative to the Index. When selecting the stocks of more rapidly growing companies, we place a heavier emphasis on signals about their future growth prospects. We call these signals “news.” For example, we believe upward revisions in the earnings forecasts of Wall Street analysts characterize many good news situations. We emphasize attractive valuation for slowly growing stocks, and invest more heavily in stocks that are cheaply priced relative to the firms’ earnings prospects and book value.
The MSCI EAFE Index substantially outperformed the U.S. stock market, but the factors that drove performance in both markets were similar. By and large, differences in national or regional markets reflected industry concentrations. Market performance was broad, with all sectors posting positive returns and weakness concentrated in the information technology and telecommunication services industries. Both of these industries are sensitive to the level of corporate investment in upgrading technology. The strongest sectors were those reflecting broad economic development such as industrials and financials. Sectors where there also were limitations on supply—energy and materials—were the market leaders, with substantially higher returns than the others.
During the reporting period, the Fund’s holdings in every country market had double-digit gains. Its Japanese stocks rose about 26%. Holdings in Australia and the United Kingdom gained 21% and 17% respectively. Recent U.S. dollar strength somewhat limited the performance of international equities for dollar-based investors. For example, the U.S. dollar gained 10% versus the Japanese yen and 6% versus the euro.
By design, our portfolio construction process seeks to limit exposure (deviations from the benchmark) to risk factors such as country, sector, industry, market capitalization, and growth or value “styles.” Consequently, the bulk of the portfolio’s outperformance of the benchmark came from security selection. However, the portfolio did benefit slightly from small underweights in the bottom-performing telecommunication services and information technology sectors in favor of the top-performing energy and materials sectors. The impact of other factors such as country and style allocation was minimal. Individual security selection added most value in
| 4 | Visit our website at www.jennisondryden.com |
Continental Europe and Japan. In Continental Europe, an overweight in energy producer/marketer Fortum (+60%) and an underweight in Telecom Italia (–9%) added meaningfully to the Fund’s outperformance of the Index. Within Japan, most of the Fund’s value added came in the industrials sector, particularly from overweights in Komatsu (+100%) and Mitsubishi (+78%).
The Portfolio of Investments following this report shows the size of the Fund’s positions at period-end.
| Dryden International Equity Fund | 5 |
Quantitative Management Associates LLC (QMA)
Quantitative Management Associates LLC (QMA), a Prudential Financial company, has been managing assets for institutional and retail clients since 1975. It offers a broad array of investments that include U.S. equity, international equity, and asset allocation funds. QMA uses a disciplined investment process, based upon fundamental data, driven by its quantitative models. It incorporates into its investment process insights gained from its original research and from the seasoned judgment of its portfolio managers and analysts.
Within the JennisonDryden fund family, QMA offers core equity, value equity, equity index, and asset allocation funds.
Core equity funds
QMA manages core equity mutual funds that are designed to outperform a specific index while maintaining similar risk, and are based on the principles of behavioral finance. The Dryden Large Cap Core Equity and Small Cap Core Equity Funds also strive to maximize after-tax returns.
Value equity fund
QMA manages the Dryden Strategic Value Fund, a diversified portfolio of attractively priced out-of-favor stocks selected from a broad market index.
Equity index fund
QMA manages the Dryden Stock Index Fund, which is designed to track the performance of the S&P 500 Index.
Asset allocation funds
QMA manages the Dryden Active Allocation Fund, which is designed to outperform a blend of the S&P 500 and Lehman Brothers U.S. Aggregate Bond indexes. QMA uses a proprietary quantitative model, coupled with the seasoned judgment of investment professionals, to determine the appropriate allocation of stocks and bonds. QMA manages the Fund’s equity segment with the same investment process used in the Dryden core equity funds. Prudential Fixed Income manages the bond segment of the Fund.
QMA oversees the JennisonDryden asset allocation funds in consultation with Ibbotson Associates. The funds consist of JennisonDryden mutual funds in proportions that reflect a targeted level of risk.
| 6 | Visit our website at www.jennisondryden.com |
Fees and Expenses (Unaudited)
As a shareholder of the Fund, you incur two types of costs: (1) transaction costs, including sales charges (loads) on purchase payments and redemptions, as applicable, and (2) ongoing costs, including management fees, distribution and/or service (12b-1) fees, and other Fund expenses, as applicable. This example is intended to help you understand your ongoing costs (in dollars) of investing in the Fund and to compare these costs with the ongoing costs of investing in other mutual funds.
The example is based on an investment of $1,000 invested on May 1, 2005, at the beginning of the period, and held through the six-month period ended October 31, 2005.
The Fund’s transfer agent may charge additional fees to holders of certain accounts that are not included in the expenses shown in the table on the following page. These fees apply to Individual Retirement Accounts (IRAs) and Section 403(b) accounts. As of the close of the six-month period covered by the table, IRA fees included an annual maintenance fee of $15 per account (subject to a maximum annual maintenance fee of $25 for all accounts held by the same shareholder). Section 403(b) accounts are charged an annual $25 fiduciary maintenance fee. Some of the fees may vary in amount, or may be waived, based on your total account balance or the number of JennisonDryden or Strategic Partners Funds, including the Fund, that you own. You should consider the additional fees that were charged to your Fund account over the six-month period when you estimate the total ongoing expenses paid over the period and the impact of these fees on your ending account value, as these additional expenses are not reflected in the information provided in the expense table. Additional fees have the effect of reducing investment returns.
Actual Expenses
The first line for each share class in the table on the following page provides information about actual account values and actual expenses. You may use the information on this line, together with the amount you invested, to estimate the expenses that you paid over the period. Simply divide your account value by $1,000 (for example, an $8,600 account value ÷ $1,000 = 8.6), then multiply the result by the number on the first line under the heading “Expenses Paid During the Six-Month Period” to estimate the expenses you paid on your account during this period.
Hypothetical Example for Comparison Purposes
The second line for each share class in the table on the following page provides information about hypothetical account values and hypothetical expenses based on the Fund’s actual expense ratio and an assumed rate of return of 5% per year before expenses, which is not the Fund’s actual return. The hypothetical account values and
| Dryden International Equity Fund | 7 |
Fees and Expenses (continued)
expenses may not be used to estimate the actual ending account balance or expenses you paid for the period. You may use this information to compare the ongoing costs of investing in the Fund and other funds. To do so, compare this 5% hypothetical example with the 5% hypothetical examples that appear in the shareholder reports of the other funds.
Please note that the expenses shown in the table are meant to highlight your ongoing costs only, and do not reflect any transactional costs such as sales charges (loads). Therefore the second line for each share class in the table is useful in comparing ongoing costs only, and will not help you determine the relative total costs of owning different funds. In addition, if these transactional costs were included, your costs would have been higher.
| Dryden International Equity Fund | Beginning Account Value May 1, 2005 | Ending Account October 31, 2005 | Annualized Expense Ratio Based on the Six-Month Period | Expenses Paid During the Six- Month Period* | ||||||||||
| Class A | Actual | $ | 1,000.00 | $ | 1,090.89 | 1.48 | % | $ | 7.80 | |||||
| Hypothetical | $ | 1,000.00 | $ | 1,017.74 | 1.48 | % | $ | 7.53 | ||||||
| Class B | Actual | $ | 1,000.00 | $ | 1,085.70 | 2.23 | % | $ | 11.72 | |||||
| Hypothetical | $ | 1,000.00 | $ | 1,013.96 | 2.23 | % | $ | 11.32 | ||||||
| Class C | Actual | $ | 1,000.00 | $ | 1,085.70 | 2.23 | % | $ | 11.72 | |||||
| Hypothetical | $ | 1,000.00 | $ | 1,013.96 | 2.23 | % | $ | 11.32 | ||||||
| Class Z | Actual | $ | 1,000.00 | $ | 1,091.80 | 1.23 | % | $ | 6.49 | |||||
| Hypothetical | $ | 1,000.00 | $ | 1,019.00 | 1.23 | % | $ | 6.26 | ||||||
* Fund expenses (net of fee waivers or subsidies, if any) for each share class are equal to the annualized expense ratio for each share class (provided in the table), multiplied by the average account value over the period, multiplied by the 184 days in the six-month period ended October 31, 2005, and divided by the 365 days in the Fund’s fiscal year ended October 31, 2005 (to reflect the six-month period).
| 8 | Visit our website at www.jennisondryden.com |
Portfolio of Investments
as of October 31, 2005
| Shares | Description | Value (Note1) | |||
LONG-TERM INVESTMENTS 96.6% | |||||
COMMON STOCKS | |||||
Australia 4.6% | |||||
| 69,162 | Australia and New Zealand Banking Group, Ltd. | $ | 1,221,030 | ||
| 92,075 | BHP Billiton PLC | 1,428,134 | |||
| 160,483 | BlueScope Steel, Ltd. | 1,021,958 | |||
| 63,463 | Boral, Ltd. | 360,885 | |||
| 32,845 | Centro Properties Trust | 146,477 | |||
| 26,242 | Commonwealth Bank of Australia | 764,152 | |||
| 91,196 | Computershare, Ltd. | 449,077 | |||
| 14,417 | CSL, Ltd. | 405,640 | |||
| 222,318 | CSR, Ltd. | 486,836 | |||
| 24,015 | DCA Group, Ltd. | 69,263 | |||
| 160,252 | General Property Trust | 460,861 | |||
| 87,142 | Macquarie Airports | 196,253 | |||
| 69,791 | Macquarie Infrastructure Group | 179,571 | |||
| 42,934 | Mirvac Group | 122,782 | |||
| 28,758 | National Australian Bank, Ltd. | 711,385 | |||
| 60,195 | Qantas Airways, Ltd. | 154,330 | |||
| 20,049 | QBE Insurance Group, Ltd. | 267,598 | |||
| 3,369 | Rio Tinto, Ltd. | 142,465 | |||
| 61,700 | Santos, Ltd. | 506,220 | |||
| 142,157 | Stockland Trust | 650,991 | |||
| 4,701 | Suncorp-Metway, Ltd. | 67,879 | |||
| 183,069 | Telstra Corp., Ltd. | 577,258 | |||
| 6,924 | Wesfarmers, Ltd. | 185,320 | |||
| 81,285 | Westpac Banking Corp. | 1,263,520 | |||
| 53,765 | Woolworths, Ltd. | 657,052 | |||
| 12,496,937 | |||||
Austria 0.6% | |||||
| 3,935 | Boehler-Uddeholm AG | 596,563 | |||
| 10,536 | OMV AG | 568,210 | |||
| 7,048 | Telekom Austria AG | 146,043 | |||
| 4,481 | Voestalpine AG | 373,179 | |||
| 1,683,995 | |||||
Belgium 0.8% | |||||
| 3,748 | Belgacom SA | 125,591 | |||
| 156 | D’ieteren SA | 39,691 | |||
| 51,679 | Dexia | 1,116,065 | |||
| 15,306 | Fortis | 435,658 | |||
See Notes to Financial Statements.
| Dryden International Equity Fund | 9 |
Portfolio of Investments
as of October 31, 2005 Cont’d.
| Shares | Description | Value (Note1) | |||
| 6,553 | KBC Group | $ | 534,035 | ||
| 2,251,040 | |||||
Bermuda 0.2% | |||||
| 56,000 | Li & Fung, Ltd. | 120,169 | |||
| 108,103 | Orient Overseas International, Ltd. | 344,838 | |||
| 465,007 | |||||
Denmark 1.2% | |||||
| 69 | A P Moller - Maersk A/S | 623,843 | |||
| 6,035 | Danisco A/S | 385,241 | |||
| 22,132 | Danske Bank A/S | 693,952 | |||
| 801 | DSV A/S | 78,080 | |||
| 20,771 | Novo Nordisk SA | 1,064,059 | |||
| 7,323 | TDC A/S | 409,835 | |||
| 3,255,010 | |||||
Finland 1.2% | |||||
| 11,324 | Kesko Oyj (Class “B” Shares) | 311,325 | |||
| 49,844 | Nokia Oyj | 829,130 | |||
| 49,864 | Rautaruukki Oyj | 1,018,303 | |||
| 50,028 | Sampo Oyj (Class “A” Shares) | 767,439 | |||
| 6,571 | YIT-Yhtyma Oyj(a) | 252,945 | |||
| 3,179,142 | |||||
France 9.3% | |||||
| 2,887 | Air France-KLM | 48,508 | |||
| 7,940 | Alcatel SA | 93,349 | |||
| 36,744 | AXA SA | 1,063,908 | |||
| 35,300 | BNP Paribas SA | 2,675,812 | |||
| 28,306 | Bouygues SA | 1,396,626 | |||
| 4,909 | Business Objects SA(a) | 167,848 | |||
| 22,280 | Carrefour SA | 990,626 | |||
| 7,139 | CNP Assurances | 496,661 | |||
| 15,444 | Compagnie de Saint-Gobain | 845,856 | |||
| 12,624 | Compagnie Generale des Etablissements Michelin (Class “B” Shares) | 681,422 | |||
| 18,364 | Credit Agricole SA | 538,105 | |||
| 8,421 | Euronext NV | 357,767 | |||
| 50,638 | France Telecom SA | 1,315,699 | |||
| 3,766 | Lafarge SA | 309,617 | |||
| 1,293 | Pernod-Ricard SA | 226,086 | |||
| 4,725 | PSA Peugeot Citroen | 287,098 | |||
| 6,204 | Publicis Groupe | 205,211 | |||
See Notes to Financial Statements.
| 10 | Visit our website at www.jennisondryden.com |
| Shares | Description | Value (Note1) | |||
| 13,749 | Renault SA | $ | 1,190,501 | ||
| 14,784 | Safran SA | 294,117 | |||
| 37,677 | Sanofi-Aventis | 3,016,291 | |||
| 5,707 | Schneider Electric SA | 468,852 | |||
| 13,748 | Societe Generale | 1,569,369 | |||
| 33,195 | Suez SA | 899,087 | |||
| 18,881 | Total SA | 4,738,297 | |||
| 8,256 | Vinci SA | 645,116 | |||
| 33,003 | Vivendi Universal SA | 1,039,440 | |||
| 25,561,269 | |||||
Germany 6.7% | |||||
| 4,118 | Adidas-Salomon AG | 690,685 | |||
| 10,370 | Allianz AG | 1,459,538 | |||
| 31,771 | BASF AG | 2,286,084 | |||
| 4,645 | Bayer AG | 161,103 | |||
| 11,403 | Continental AG | 871,204 | |||
| 13,613 | DaimlerChrysler AG(a) | 680,152 | |||
| 31,433 | Deutsche Bank AG | 2,937,202 | |||
| 12,224 | Deutsche Boerse AG | 1,149,722 | |||
| 26,512 | Deutsche Post AG | 592,255 | |||
| 48,670 | Deutsche Telekom AG | 860,347 | |||
| 23,021 | E.ON AG | 2,085,494 | |||
| 11,460 | Man AG | 531,104 | |||
| 5,676 | Muenchener Rueckversicherungs - Gesellschaft AG | 665,956 | |||
| 3,089 | Puma AG Rudolf Dassler Sport | 779,275 | |||
| 5,938 | RWE AG | 377,668 | |||
| 4,029 | SAP AG | 689,663 | |||
| 4,732 | Siemens AG | 351,266 | |||
| 12,752 | Suedzucker AG | 268,363 | |||
| 27,853 | ThyssenKrupp AG | 566,467 | |||
| 15,615 | TUI AG | 303,538 | |||
| 18,307,086 | |||||
Greece 0.6% | |||||
| 1,302 | Cosmote Mobile Telecommunications SA | 26,745 | |||
| 32,164 | Intracom SA | 213,550 | |||
| 23,458 | National Bank of Greece SA | 914,244 | |||
| 10,600 | OPAP SA | 305,902 | |||
| 1,500 | Piraeus Bank SA | 30,381 | |||
| 1,545 | Titan Cement Co. | 52,808 | |||
| 1,543,630 | |||||
See Notes to Financial Statements.
| Dryden International Equity Fund | 11 |
Portfolio of Investments
as of October 31, 2005 Cont’d.
| Shares | Description | Value (Note1) | |||
Hong Kong 1.5% | |||||
| 103,000 | Cheung Kong Holdings, Ltd. | $ | 1,075,908 | ||
| 145,188 | China Merchants Holdings International Co., Ltd. | 283,057 | |||
| 28,000 | CLP Holdings, Ltd. | 160,754 | |||
| 42,000 | Henderson Land Development Co., Ltd. | 187,934 | |||
| 242,652 | Hong Kong Exchanges and Clearing, Ltd. | 813,655 | |||
| 74,000 | Hopewell Holdings, Ltd. | 180,990 | |||
| 35,000 | Kerry Properties, Ltd. | 87,754 | |||
| 124,000 | Sun Hung Kai Properties, Ltd. | 1,176,888 | |||
| 13,000 | Swire Pacific, Ltd. (Class “A” Shares) | 116,965 | |||
| 382 | Techtronic Industries Co., Ltd. | 940 | |||
| 16,000 | Wharf Holdings | 54,812 | |||
| 4,139,657 | |||||
Ireland 1.2% | |||||
| 50,525 | Allied Irish Banks PLC(a) | 1,066,922 | |||
| 109,744 | Bank of Ireland(a) | 1,661,134 | |||
| 11,853 | CRH PLC(a) | 296,179 | |||
| 21,478 | Depfa Bank PLC | 334,882 | |||
| 3,409 | Irish Life & Permanent PLC(a) | 60,057 | |||
| 3,419,174 | |||||
Italy 2.9% | |||||
| 172,748 | Banca Intesa SpA | 806,382 | |||
| 34,106 | Banca Nazionale del Lavoro (BNL)(a) | 109,952 | |||
| 16,047 | Banca Popolare di Milano Scrl | 152,891 | |||
| 7,773 | Banche Popolari Unite Scrl | 164,513 | |||
| 13,546 | Banco Popolare di Verona E Novara Scrl | 250,007 | |||
| 25,595 | Benetton Group SpA | 271,928 | |||
| 245,050 | Capitalia SpA | 1,278,245 | |||
| 73,331 | Enel SpA | 591,457 | |||
| 106,415 | ENI SpA | 2,851,643 | |||
| 8,356 | Italcementi SpA | 136,995 | |||
| 26,241 | Mediaset SpA | 288,069 | |||
| 14,389 | Riunione Adriatica di Sicurta SpA | 327,129 | |||
| 13,840 | Snam Rete Gas SpA | 75,966 | |||
| 100,661 | Telecom Italia Mobile SpA | 243,326 | |||
| 53,336 | UniCredito Italiano SpA | 297,710 | |||
| 7,846,213 | |||||
See Notes to Financial Statements.
| 12 | Visit our website at www.jennisondryden.com |
| Shares | Description | Value (Note1) | |||
Japan 23.4% | |||||
| 13,080 | Acom Co., Ltd. | $ | 850,059 | ||
| 6,300 | Advantest Corp. | 456,897 | |||
| 4,150 | Aiful Corp. | 310,411 | |||
| 30,975 | Alps Electric Co., Ltd. | 492,758 | |||
| 4,100 | Aoyama Trading Co., Ltd. | 123,452 | |||
| 30,647 | Asahi Breweries, Ltd. | 383,099 | |||
| 71,000 | Asahi Kasei Corp. | 380,048 | |||
| 139,882 | Bank of Fukuoka, Ltd.(The) | 1,087,054 | |||
| 11,000 | Bank of Yokohama, Ltd.(The) | 89,562 | |||
| 50,000 | Bridgestone Corp. | 1,021,280 | |||
| 51,263 | Canon, Inc. | 2,713,309 | |||
| 27,000 | Central Glass Co., Ltd. | 150,222 | |||
| 36,000 | Chiba Bank, Ltd.(The) | 320,446 | |||
| 6,000 | Chiyoda Corp. | 103,609 | |||
| 33,600 | Chubu Electric Power Co., Inc. | 832,654 | |||
| 4,000 | Dai Nippon Printing Co., Ltd. | 65,457 | |||
| 53,000 | Dai Nippon Screen Manufacturing Co., Ltd. | 326,300 | |||
| 6,100 | Daito Trust Construction Co., Ltd. | 302,248 | |||
| 26,000 | Daiwa Securities Group, Inc. | 213,577 | |||
| 41 | KDDI Corp. | 234,967 | |||
| 120,286 | Denki Kagaku Kogyo K K | 440,888 | |||
| 8,100 | Denso Corp. | 230,597 | |||
| 54 | East Japan Railway Co. | 320,839 | |||
| 4,000 | Eisai Co., Ltd. | 156,653 | |||
| 28,554 | FamilyMart Co., Ltd. | 849,498 | |||
| 63 | Fuji Television Network, Inc. | 139,906 | |||
| 84,000 | Fujikura, Ltd. | 543,762 | |||
| 32,000 | Fujitsu, Ltd. | 211,726 | |||
| 6,000 | Hankyu Department Stores, Inc. | 48,004 | |||
| 12,553 | Hokkaido Electric Power Co., Inc. | 259,722 | |||
| 34,087 | Honda Motor Co., Ltd. | 1,895,758 | |||
| 4,100 | Hoya Corp. | 143,600 | |||
| 12,300 | Hoya Corp.(a) | 425,814 | |||
| 9,800 | Ibiden Co., Ltd. | 397,086 | |||
| 3,600 | Isetan Co., Ltd. | 64,849 | |||
| 42,000 | Itochu Corp. | 287,875 | |||
| 135 | Japan Tobacco, Inc. | 2,134,240 | |||
| 32,900 | JFE Holdings, Inc. | 1,022,003 | |||
| 16,670 | JS Group Corp. | 283,262 | |||
| 323 | Kaken Pharmaceutical Co., Ltd. | 2,292 | |||
| 7,000 | Kaneka Corp. | 86,686 | |||
See Notes to Financial Statements.
| Dryden International Equity Fund | 13 |
Portfolio of Investments
as of October 31, 2005 Cont’d.
| Shares | Description | Value (Note1) | |||
| 40,700 | Kansai Electric Power Co., Inc.(The) | $ | 895,085 | ||
| 25,000 | Kawasaki Kisen Kaisha, Ltd. | 156,265 | |||
| 2,000 | Keyence Corp. | 460,203 | |||
| 83,000 | Kobe Steel, Ltd. | 245,226 | |||
| 73,000 | Komatsu, Ltd. | 972,704 | |||
| 75,000 | Kubota Corp. | 545,634 | |||
| 6,400 | Kyocera Corp. | 415,082 | |||
| 40,200 | Kyushu Electric Power Co., Inc. | 862,554 | |||
| 21,000 | Makita Corp. | 487,473 | |||
| 185,222 | Marubeni Corp. | 868,084 | |||
| 67,000 | Matsushita Electric Industrial Co., Ltd. | 1,227,805 | |||
| 111,956 | Mitsubishi Chemical, Inc.(a) | 696,299 | |||
| 60,500 | Mitsubishi Corp. | 1,176,500 | |||
| 12,000 | Mitsubishi Electric Corp. | 71,942 | |||
| 80,000 | Mitsubishi Gas Chemical Co., Inc. | 544,903 | |||
| 86,000 | Mitsubishi Heavy Industries, Ltd. | 324,968 | |||
| 74,000 | Mitsubishi Rayon Co., Ltd. | 343,998 | |||
| 98 | Mitsubishi Tokyo Financial Group, Inc. | 1,241,511 | |||
| 99,000 | Mitsui & Co., Ltd. | 1,215,599 | |||
| 56,000 | Mitsui Chemicals, Inc. | 335,491 | |||
| 82,000 | Mitsui O.S.K. Lines, Ltd. | 579,232 | |||
| 6,000 | Mitsui Trust Holdings, Inc. | 72,284 | |||
| 372 | Mizuho Financial Group, Inc. | 2,483,384 | |||
| 28,000 | NGK SPARK PLUG Co., Ltd. | 449,906 | |||
| 26,000 | NHK Spring Co., Ltd. | 204,352 | |||
| 2,100 | Nidec Corp.(a) | 116,356 | |||
| 2,100 | Nidec Corp. | 123,207 | |||
| 5,000 | Nippon Electric Glass Co., Ltd. | 95,714 | |||
| 4,000 | Nippon Meat Packers, Inc. | 44,393 | |||
| 48,000 | Nippon Oil Corp. | 409,916 | |||
| 35,000 | Nippon Shokubai Co., Ltd. | 379,300 | |||
| 68,000 | Nippon Steel Corp. | 242,950 | |||
| 499 | Nippon Telegraph and Telephone Corp. | 2,385,226 | |||
| 86,000 | Nippon Yusen Kabushiki Kaisha | 520,308 | |||
| 136,070 | Nissan Motor Co., Ltd. | 1,426,510 | |||
| 18,700 | Nisshin Seifun Group, Inc. | 190,448 | |||
| 1,450 | Nitori Co., Ltd. | 109,847 | |||
| 113,753 | NSK, Ltd. | 663,621 | |||
| 7,000 | NTN Corp. | 47,527 | |||
| 133 | NTT Data Corp. | 463,766 | |||
| 229 | NTT DoCoMo, Inc. | 395,469 | |||
| 34,000 | Obayashi Corp. | 249,132 | |||
| 20,000 | Oji Paper Co., Ltd. | 101,464 | |||
See Notes to Financial Statements.
| 14 | Visit our website at www.jennisondryden.com |
| Shares | Description | Value (Note1) | |||
| 2,500 | ORIX Corp. | $ | 468,770 | ||
| 234,993 | Osaka Gas Co., Ltd. | 859,221 | |||
| 14,050 | Promise Co., Ltd. | 887,775 | |||
| 16,000 | Ricoh Co., Ltd. | 254,258 | |||
| 1,900 | Sankyo Co., Ltd. | 100,469 | |||
| 31,000 | Sanwa Shutter Corp. | 192,638 | |||
| 1,500 | Sega Sammy Holdings, Inc. | 53,990 | |||
| 1,500 | Sega Sammy Holdings, Inc.(a) | 53,975 | |||
| 7,000 | Seino Transportation Co., Ltd. | 64,638 | |||
| 21,000 | Sekisui Chemical Co., Ltd. | 132,866 | |||
| 43,000 | Sekisui House, Ltd. | 535,492 | |||
| 16,000 | Shimizu Corp. | 108,545 | |||
| 3,300 | Shin-Etsu Chemical Co., Ltd. | 158,216 | |||
| 7,000 | Shionogi & Co., Ltd. | 85,123 | |||
| 8,000 | Shiseido Co., Ltd. | 128,329 | |||
| 25,000 | Sumitomo Chemical Co., Ltd. | 147,546 | |||
| 97,000 | Sumitomo Corp. | 1,084,340 | |||
| 16,000 | Sumitomo Electric Industries, Ltd. | 210,542 | |||
| 32,000 | Sumitomo Heavy Industries, Ltd. | 224,073 | |||
| 207,000 | Sumitomo Metal Industries, Ltd. | 716,655 | |||
| 51 | Sumitomo Mitsui Financial Group, Inc. | 471,008 | |||
| 118,749 | Sumitomo Osaka Cement Co., Ltd. | 335,387 | |||
| 136,269 | Sumitomo Trust & Banking Co., Ltd.(The) | 1,160,103 | |||
| 141 | Taiheiyo Cement Corp. | 510 | |||
| 23,000 | Taisei Corp. | 102,132 | |||
| 10,000 | Taisho Pharmaceutical Co., Ltd. | 179,964 | |||
| 7,400 | Takeda Chemical Industries, Ltd. | 405,617 | |||
| 11,141 | Takefuji Corp. | 779,702 | |||
| 62,641 | Tanabe Seiyaku Co., Ltd. | 603,240 | |||
| 10,800 | TDK Corp. | 728,198 | |||
| 30,000 | Teijin, Ltd. | 178,651 | |||
| 15,700 | Tohoku Electric Power Co., Inc. | 320,311 | |||
| 8,000 | Tokuyama Corp. | 79,473 | |||
| 15,100 | Tokyo Electric Power Co., Inc.(The) | 375,450 | |||
| 11,800 | Tokyo Electron, Ltd. | 593,183 | |||
| 18,000 | Toyo Suisan Kaisha, Ltd. | 312,131 | |||
| 6,900 | Toyota Industries Corp. | 231,812 | |||
| 100,534 | Toyota Motor Corp. | 4,661,811 | |||
| 14,980 | UNY Co., Ltd. | 186,714 | |||
| 25 | West Japan Railway Co. | 88,639 | |||
| 3,200 | Yamada Denki Co., Ltd. | 282,645 | |||
| 14,800 | Yamaha Corp. | 261,785 | |||
| 6,900 | Yamaha Motor Co., Ltd. | 148,199 | |||
| 64,198,233 | |||||
See Notes to Financial Statements.
| Dryden International Equity Fund | 15 |
Portfolio of Investments
as of October 31, 2005 Cont’d.
| Shares | Description | Value (Note1) | |||
Netherlands 2.9% | |||||
| 24,706 | ABN AMRO Holding NV | $ | 584,184 | ||
| 84,114 | Aegon NV | 1,265,122 | |||
| 30,925 | Buhrmann NV | 341,713 | |||
| 3,899 | Corio NV | 221,396 | |||
| 5,338 | European Aeronautic Defence and Space Co. | 184,883 | |||
| 75,956 | ING Groep NV | 2,189,262 | |||
| 44,125 | James Hardie Industries NV | 281,585 | |||
| 15,195 | Koninklijke DSM NV | 545,404 | |||
| 9,704 | TNT NV | 228,990 | |||
| 26,318 | Unilever NV | 1,851,448 | |||
| 904 | Wereldhave NV | 87,430 | |||
| 7,346 | Wolters Kluwer NV | 136,195 | |||
| 7,917,612 | |||||
New Zealand 0.3% | |||||
| 70,573 | Fletcher Building, Ltd. | 388,267 | |||
| 9,075 | Sky Network Television, Ltd.(a) | 39,308 | |||
| 71,242 | Telecom Corporation of New Zealand, Ltd. | 291,157 | |||
| 718,732 | |||||
Norway 1.1% | |||||
| 126,409 | DBN NOR ASA | 1,291,801 | |||
| 11,795 | Norsk Hydro ASA | 1,179,980 | |||
| 2,851 | Orkla ASA | 99,891 | |||
| 8,690 | Statoil ASA | 194,303 | |||
| 10,350 | Tandberg ASA | 101,793 | |||
| 12,300 | Yara International ASA | 202,721 | |||
| 3,070,489 | |||||
Portugal 0.3% | |||||
| 5,109 | Banco BPI SA | 21,736 | |||
| 13,631 | Banco Comercial Portugues, SA | 34,469 | |||
| 175,829 | Energias de Portugal SA | 497,305 | |||
| 9,414 | Jeronimo Martins SGPS SA | 135,612 | |||
| 7,586 | Portugal Telecom SGPS SA | 68,550 | |||
| 757,672 | |||||
Singapore 0.8% | |||||
| 2,000 | Fraser & Neave, Ltd. | 19,873 | |||
| 1,000 | Haw Par Corp., Ltd. | 3,014 | |||
| 28,000 | Jardine Cycle & Carriage, Ltd. | 174,119 | |||
See Notes to Financial Statements.
| 16 | Visit our website at www.jennisondryden.com |
| Shares | Description | Value (Note1) | |||
| 64,000 | Keppel Corp., Ltd. | $ | 439,113 | ||
| 260,059 | Neptune Orient Lines, Ltd. | 468,278 | |||
| 36,000 | Overseas-Chinese Banking Corp., Ltd. | 134,031 | |||
| 45,000 | Singapore Airlines, Ltd. | 298,027 | |||
| 1,000 | Singapore Petroleum Co., Ltd. | 2,847 | |||
| 50,000 | Singapore Post, Ltd. | 33,653 | |||
| 397,033 | Singapore Telecommunications, Ltd. | 547,022 | |||
| 7,500 | United Overseas Bank, Ltd. | 61,230 | |||
| 2,181,207 | |||||
Spain 4.3% | |||||
| 4,246 | Acerinox, SA | 55,619 | |||
| 3,293 | Altadis, SA | 139,706 | |||
| 68,390 | Banco Bilbao Vizcaya Argentaria, SA | 1,205,663 | |||
| 169,067 | Banco Santander Central Hispano SA | 2,155,862 | |||
| 4,651 | Corporacion Mapfre SA | 81,436 | |||
| 53,417 | Endesa, SA | 1,328,367 | |||
| 15,222 | Grupo Ferrovial SA | 1,123,758 | |||
| 22,491 | Iberdrola SA | 602,161 | |||
| 9,304 | Industria de Diseno Tectil SA (Inditex) | 275,303 | |||
| 1,857 | Metrovacesa SA | 128,747 | |||
| 24,600 | Promotora de Informaciones SA | 451,073 | |||
| 70,354 | Repsol YPF SA | 2,094,406 | |||
| 20,000 | Sogecable SA(a) | 760,058 | |||
| 54,753 | Telefonica SA | 873,387 | |||
| 16,241 | Union Fenosa SA | 537,208 | |||
| 11,812,754 | |||||
Sweden 1.8% | |||||
| 18,652 | Billerud AB | 213,743 | |||
| 9,328 | Eniro AB | 101,916 | |||
| 12,250 | Hennes & Mauritz AB (Class “B” Shares) | 397,677 | |||
| 10,714 | Nordea Bank | 104,950 | |||
| 37,987 | Skandinaviska Enskilda Banken AB (Class “A” Shares)(a) | 708,428 | |||
| 23,157 | Skanska AB | 324,258 | |||
| 4,004 | SSAB Svenskt Stal AB (Class “A” Shares) | 119,424 | |||
| 2,700 | Svenska Cellulosa AB (Class “B” Shares) | 91,042 | |||
| 4,700 | Svenska Handelbanken AB (Class “A” Shares) | 107,129 | |||
| 5,000 | Swedish Match AB | 56,827 | |||
| 246,797 | Telefonaktiebolaget LM Erisson (Class “B” Shares) | 805,837 | |||
| 54,175 | TeliaSonera AB | 264,657 | |||
| 40,320 | Volvo AB (Class “B” Shares) | 1,658,311 | |||
| 4,954,199 | |||||
See Notes to Financial Statements.
| Dryden International Equity Fund | 17 |
Portfolio of Investments
as of October 31, 2005 Cont’d.
| Shares | Description | Value (Note1) | |||
Switzerland 7.6% | |||||
| 1,383 | Ciba Special Chemicals | $ | 79,429 | ||
| 9,717 | Clariant AG | 129,625 | |||
| 43,617 | Credit Suisse Group | 1,926,543 | |||
| 1,685 | Givaudan AG | 1,086,001 | |||
| 3,548 | Holcim, Ltd. | 220,692 | |||
| 20,957 | Logitech International(a) | 794,004 | |||
| 9,893 | Nestle SA-Reg | 2,946,379 | |||
| 362 | Nobel Biocare Holding AG | 83,456 | |||
| 61,885 | Novartis AG | 3,328,595 | |||
| 1,651 | Rieter Holding AG | 471,220 | |||
| 16,061 | Roche Holdings AG | 2,399,154 | |||
| 2,642 | Straumann Holding AG | 615,753 | |||
| 1,474 | Sulzer AG | 708,792 | |||
| 3,440 | Swatch Group AG | 97,783 | |||
| 4,963 | Swiss Re | 335,075 | |||
| 2,816 | Swisscom AG | 927,127 | |||
| 1,735 | Syngenta AG | 185,967 | |||
| 41,173 | UBS AG(a) | 3,496,679 | |||
| 5,937 | Zurich Financial Services AG | 1,012,562 | |||
| 20,844,836 | |||||
United Kingdom 23.3% | |||||
| 32,194 | Anglo American PLC | 951,625 | |||
| 47,384 | Arriva PLC | 483,510 | |||
| 55,035 | AstraZeneca PLC | 2,467,453 | |||
| 141,716 | Aviva PLC | 1,673,090 | |||
| 5,772 | BAA PLC | 62,678 | |||
| 104,083 | BAE Systems PLC | 608,872 | |||
| 286,168 | Barclays PLC | 2,836,506 | |||
| 34,674 | Barratt Developments PLC | 464,288 | |||
| 7,592 | Bellway PLC | 116,842 | |||
| 14,347 | Berkeley Group Holdings PLC | 220,930 | |||
| 109,600 | BHP Billiton PLC | 1,611,108 | |||
| 15,306 | Boots Group PLC | 166,885 | |||
| 298,387 | BP PLC | 3,295,635 | |||
| 38,584 | BP PLC ADR | 2,561,977 | |||
| 95,081 | British Airways PLC(a) | 508,247 | |||
| 29,925 | British American Tobacco PLC | 658,385 | |||
| 65,902 | British Sky Broadcasting PLC | 594,899 | |||
| 545,916 | BT Group PLC | 2,058,165 | |||
| 68,582 | Cadbury Schweppes PLC | 674,931 | |||
See Notes to Financial Statements.
| 18 | Visit our website at www.jennisondryden.com |
| Shares | Description | Value (Note1) | |||
| 3,270 | Carnival PLC | $ | 166,055 | ||
| 12,009 | Centrica PLC | 50,749 | |||
| 38,819 | COLT Telecom Group PLC(a) | 39,337 | |||
| 16,437 | Diageo PLC | 242,931 | |||
| 137,994 | DSG International PLC | 351,720 | |||
| 13,848 | Enterprise Inns PLC | 191,064 | |||
| 58,756 | Firstgroup PLC | 341,115 | |||
| 47,078 | Friends Provident PLC | 146,866 | |||
| 35,805 | George Wimpey PLC | 259,204 | |||
| 166,163 | GlaxoSmithKline PLC | 4,320,468 | |||
| 15,527 | Hanson PLC | 157,339 | |||
| 120,832 | HBOS PLC | 1,784,773 | |||
| 25,951 | Henderson Group PLC(a) | 28,192 | |||
| 302,412 | HSBC Holdings PLC | 4,755,882 | |||
| 104,386 | Imperial Chemical Industries PLC | 531,196 | |||
| 23,080 | Imperial Tobacco Group PLC | 661,798 | |||
| 5,343 | Inchcape PLC | 194,817 | |||
| 78,347 | Kelda Group PLC | 965,176 | |||
| 29,818 | Kesa Electricals PLC | 126,667 | |||
| 312,297 | Kingfisher PLC(a) | 1,171,867 | |||
| 323,587 | Legal & General Group PLC | 614,275 | |||
| 232,974 | Lloyds TSB Group PLC | 1,905,127 | |||
| 86,783 | Mitchells & Butlers PLC | 557,207 | |||
| 39,576 | Persimmon PLC | 603,829 | |||
| 219,243 | Pilkington PLC | 594,704 | |||
| 16,336 | Reckitt Benckiser PLC | 493,576 | |||
| 49,150 | Resolution PLC | 515,885 | |||
| 19,594 | Rio Tinto PLC | 747,039 | |||
| 67,461 | Royal & Sun Alliance Insurance Group PLC | 114,929 | |||
| 26,877 | Royal Bank of Scotland Group PLC(The) | 744,033 | |||
| 568 | Royal Dutch Shell | 17,604 | |||
| 78,103 | Royal Dutch Shell PLC (Class “A” Shares) | 2,408,397 | |||
| 116,840 | Royal Dutch Shell PLC (Class “B” Shares) | 3,811,461 | |||
| 41,920 | SABMiller PLC | 790,958 | |||
| 12,871 | Scottish & Southern Energy PLC | 223,261 | |||
| 67,392 | Scottish Power PLC | 659,642 | |||
| 17,313 | Severn Trent PLC | 293,264 | |||
| 17,520 | Smiths Group PLC | 282,970 | |||
| 77,935 | Stagecoach Group PLC | 147,946 | |||
| 82,889 | Tate & Lyle PLC | 680,019 | |||
| 39,965 | Taylor Woodrow PLC | 221,411 | |||
| 315,927 | Tesco PLC | 1,681,772 | |||
| 4,713 | Tomkins PLC | 21,960 | |||
See Notes to Financial Statements.
| Dryden International Equity Fund | 19 |
Portfolio of Investments
as of October 31, 2005 Cont’d.
| Shares | Description | Value (Note1) | |||
| 4,775 | Trinity Mirror PLC | $ | 50,288 | ||
| 20,072 | Unilever PLC | 203,573 | |||
| 30,238 | United Utilities PLC | 333,706 | |||
| 1,942,295 | Vodafone Air Touch PLC | 5,096,646 | |||
| 39,071 | Vodafone Group PLC ADR | 1,026,004 | |||
| 17,171 | Whitbread PLC | 285,692 | |||
| 10,007 | William Hill PLC | 94,673 | |||
| 9,005 | WPP Group PLC | 88,461 | |||
| 63,813,554 | |||||
Total long-term investments | 264,417,448 | ||||
Principal | |||||
SHORT-TERM INVESTMENTS 0.2% | |||||
U.S. GOVERNMENT SECURITIES 0.1% | |||||
United States | |||||
| $350 | United States Treasury Bill(b)(c) | 348,467 | |||
Shares | |||||
Mutual Fund 0.1% | |||||
| 149,361 | Dryden Core Investment Fund - Taxable Money Market Series(d) | 149,361 | |||
Total short-term investments | 497,828 | ||||
Total Investments(e) 96.8% | 264,915,276 | ||||
Other assets in excess of liabilities(f) 3.2% | 8,862,301 | ||||
Net Assets 100% | $ | 273,777,577 | |||
| ADR—American | Depositary Receipt. |
| (a) | Non-income producing security. |
| (b) | Rate quoted represents yield-to-maturity as of purchase date. |
| (c) | All or portion of security segregated as collateral for financial futures contracts. |
| (d) | Prudential Investments LLC, the manager of the Series also serves as the manager of the Dryden Core Investment Fund—Taxable Money Market Series. |
| (e) | As of October 31, 2005, 175 securities representing $83,144,133 and 31.4% of the total market value were fair valued in accordance with the policies adopted by the Board of Directors. |
See Notes to Financial Statements.
| 20 | Visit our website at www.jennisondryden.com |
| (f) | Other assets in excess of liabilities included net unrealized appreciation (depreciation) on financial futures as follows: |
Open future contracts outstanding at October 31, 2005 were:
| Number of Contracts | Type | Expiration Date | Value at October 31, 2005 | Value at Trade Date | Unrealized (Depreciation) | |||||||||
| Long Positions: | ||||||||||||||
| 2 | Hang Seng Stock Index | Nov. 05 | $ | 185,550 | $ | 186,052 | $ | (502 | ) | |||||
| 30 | FTSE 100 Index | Dec. 05 | 2,826,256 | 2,845,831 | (19,575 | ) | ||||||||
| 17 | Share Price Index 200 | Dec. 05 | 1,416,720 | 1,428,332 | (11,612 | ) | ||||||||
| 35 | DJ Euro Stoxx 50 Index | Dec. 05 | 1,390,503 | 1,397,920 | (7,417 | ) | ||||||||
| 42 | Nikkei 225 Index | Dec. 05 | 2,873,850 | 2,680,075 | 193,775 | |||||||||
| $ | 154,669 | |||||||||||||
The industry classification of portfolio holdings shown as percentage of net assets as of October 31, 2005 was as follows:
Banks | 14.6 | % | |
Oil, Gas & Consumable Fuels | 8.8 | ||
Pharmaceuticals | 4.8 | ||
Diversified Financials | 4.6 | ||
Trading Companies & Distributors | 4.6 | ||
Communications Equipment | 4.1 | ||
Insurance | 4.1 | ||
Diversified Telecommunication Services | 3.4 | ||
Building Products | 3.3 | ||
Electric Utilities | 3.2 | ||
Manufacturing | 3.1 | ||
Chemicals | 3.0 | ||
Food Products | 2.8 | ||
Metals & Mining | 2.8 | ||
Automobiles | 2.6 | ||
Real Estate Investment Trust | 2.4 | ||
Specialty Retail | 2.2 | ||
Auto Components | 1.9 | ||
Health Care Provider Services | 1.9 | ||
Office Electronics | 1.8 | ||
Real Estate | 1.6 | ||
Transportation Infrastructure | 1.3 | ||
Household Durables | 1.1 | ||
Machinery | 1.1 | ||
Media | 1.1 | ||
Food & Drug Retailing | 1.0 | ||
Textiles & Apparel | 1.0 | ||
Industrial Conglomerates | 0.9 | ||
Airlines | 0.8 | ||
Electronic Equipment & Instruments | 0.8 |
See Notes to Financial Statements.
| Dryden International Equity Fund | 21 |
Portfolio of Investments
as of October 31, 2005 Cont’d.
Electrical Equipment | 0.7 | % | |
Beverages | 0.6 | ||
Software | 0.6 | ||
Water Utilities | 0.6 | ||
Energy | 0.5 | ||
Marine | 0.5 | ||
Aerospace & Defense | 0.4 | ||
Construction Materials | 0.3 | ||
Hotels Restaurants & Leisure | 0.3 | ||
Tobacco | 0.3 | ||
Household Products | 0.2 | ||
Leisure Equipment & Products | 0.2 | ||
Paper & Forest Products | 0.2 | ||
Semiconductor Equipment & Product | 0.2 | ||
Construction & Engineering | 0.1 | ||
Multi-line Retail | 0.1 | ||
Mutual Fund | 0.1 | ||
Road & Rail | 0.1 | ||
U.S. Government Securities | 0.1 | ||
Trucking & Shipping | 0.0 | ||
Total Investments | 96.8 | ||
Other assets in excess of liabilities | 3.2 | ||
| 100.0 | % | ||
See Notes to Financial Statements.
| 22 | Visit our website at www.jennisondryden.com |
Financial Statements
| OCTOBER 31, 2005 | ANNUAL REPORT |
Dryden International Equity Fund
Statement of Assets and Liabilities
as of October 31, 2005
Assets | ||||
Investments, at value: | ||||
Unaffiliated investments (cost $239,830,572) | $ | 264,765,915 | ||
Affiliated investments (cost $149,361) | 149,361 | |||
Foreign currency, at value (cost $7,158,611) | 8,044,742 | |||
Cash | 551,677 | |||
Receivable for Series shares sold | 2,961,283 | |||
Dividends and interest receivable | 1,034,104 | |||
Received from broker—variation margin | 145,240 | |||
Receivable for investments sold | 72,322 | |||
Prepaid expenses | 6,791 | |||
Total assets | 277,731,435 | |||
Liabilities | ||||
Payable for Series shares reacquired | 3,022,798 | |||
Payable for investments purchased | 368,630 | |||
Management fee payable | 198,446 | |||
Accrued expenses | 155,064 | |||
Transfer agent fee payable | 151,914 | |||
Distribution fee payable | 55,605 | |||
Deferred directors' fees | 1,401 | |||
Total liabilities | 3,953,858 | |||
Net Assets | $ | 273,777,577 | ||
Net assets were comprised of: | ||||
Common stock, at par | $ | 401,149 | ||
Paid-in capital in excess of par | 416,134,678 | |||
| 416,535,827 | ||||
Undistributed net investment income | 473,484 | |||
Accumulated net realized loss on investment and foreign currency transactions | (168,293,835 | ) | ||
Net unrealized appreciation on investments and foreign currencies | 25,062,101 | |||
Net assets, October 31, 2005 | $ | 273,777,577 | ||
See Notes to Financial Statements.
| 24 | Visit our website at www.jennisondryden.com |
Class A | |||
Net asset value and redemption price per share | |||
($38,322,787 ÷ 5,606,239 shares of common stock issued and outstanding) | $ | 6.84 | |
Maximum sales charge (5.50% of offering price) | .40 | ||
Maximum offering price to public | $ | 7.24 | |
Class B | |||
Net asset value, offering price and redemption price per share | |||
($42,877,536 ÷ 6,504,473 shares of common stock issued and outstanding) | $ | 6.59 | |
Class C | |||
Net asset value, offering price and redemption price per share | |||
($12,779,420 ÷ 1,938,662 shares of common stock issued and outstanding) | $ | 6.59 | |
Class Z | |||
Net asset value, offering price and redemption price per share | |||
($179,797,834 ÷ 26,065,547 shares of common stock issued and outstanding) | $ | 6.90 | |
See Notes to Financial Statements.
| Dryden International Equity Fund | 25 |
Statement of Operations
Year Ended October 31, 2005
Net Investment Income | ||||
Income | ||||
Unaffiliated dividends (net of foreign withholding taxes of $353,573) | $ | 3,515,270 | ||
Affiliated dividend income | 13,797 | |||
Interest | 9,610 | |||
Total income | 3,538,677 | |||
Expenses | ||||
Management fee | 1,199,342 | |||
Distribution fee—Class A | 75,442 | |||
Distribution fee—Class B | 441,595 | |||
Distribution fee—Class C | 136,996 | |||
Transfer agent's fees and expenses (including affiliated expenses of $318,300) | 326,000 | |||
Custodian’s fees and expenses | 262,000 | |||
Reports to shareholders | 73,000 | |||
Registration fees | 55,000 | |||
Legal fees and expenses | 25,000 | |||
Audit fee | 22,000 | |||
Directors’ fees | 16,000 | |||
Insurance | 3,000 | |||
Miscellaneous | 41,796 | |||
Total expenses | 2,677,171 | |||
Less: Expense subsidy (Note 2) | (159,346 | ) | ||
Net expenses | 2,517,825 | |||
Net investment income | 1,020,852 | |||
Realized And Unrealized Gain (Loss) On Investments, Futures And Foreign Currency Transactions | ||||
Net realized gain on: | ||||
Investment transactions | 7,490,019 | |||
Foreign currency transactions | (216,991 | ) | ||
Financial futures transactions | 597,452 | |||
| 7,870,480 | ||||
Net change in unrealized appreciation (depreciation) on: | ||||
Investments | 12,009,701 | |||
Foreign currencies | (78,246 | ) | ||
Financial futures contracts | 148,099 | |||
| 12,079,554 | ||||
Net gain on investment and foreign currency transactions | 19,950,034 | |||
Net Increase In Net Assets Resulting From Operations | $ | 20,970,886 | ||
See Notes to Financial Statements.
| 26 | Visit our website at www.jennisondryden.com |
Statement of Changes in Net Assets
| Year Ended October 31, | ||||||||
| 2005 | 2004 | |||||||
Increase (Decrease) In Net Assets | ||||||||
Operations | ||||||||
Net investment income | $ | 1,020,852 | $ | 126,899 | ||||
Net realized gain on investment and foreign currency transactions | 7,870,480 | 17,861,914 | ||||||
Net change in unrealized appreciation (depreciation) on investments and foreign currencies | 12,079,554 | (4,179,800 | ) | |||||
Net increase in net assets resulting from operations | 20,970,886 | 13,809,013 | ||||||
Dividends from net investment income (Note 1) | ||||||||
Class A | (236,028 | ) | — | |||||
Class B | (127,690 | ) | — | |||||
Class C | (41,462 | ) | — | |||||
Class Z | (170,252 | ) | — | |||||
| (575,432 | ) | — | ||||||
Series share transactions (net of share conversions) (Note 6) | ||||||||
Net proceeds from shares sold | 200,114,155 | 29,624,483 | ||||||
Net asset value of shares issued in reinvestment of dividends | 549,984 | — | ||||||
Cost of shares reacquired | (38,187,242 | ) | (30,870,673 | ) | ||||
Net increase (decrease) in net assets from Series share transactions | 162,476,897 | (1,246,190 | ) | |||||
Total increase | 182,872,351 | 12,562,823 | ||||||
Net Assets | ||||||||
Beginning of year | 90,905,226 | 78,342,403 | ||||||
End of year(a) | $ | 273,777,577 | $ | 90,905,226 | ||||
(a) Includes undistributed net investment income of: | $ | 473,484 | $ | 245,055 | ||||
See Notes to Financial Statements.
| Dryden International Equity Fund | 27 |
Notes to Financial Statements
Prudential World Fund, Inc. (the “Fund”) is registered under the Investment Company Act of 1940, as an open-end, diversified management investment company and currently consists of three series: Dryden International Equity Fund (the “Series”), Strategic Partners International Value Fund and Jennison Global Growth Fund. These financial statements relate to the Dryden International Equity Fund. The financial statements of the other series are not presented herein. The Series commenced investment operations in March 2000. The investment objective of the Series is to achieve long-term growth of capital. The Series seeks to achieve its objective primarily through investment in equity-related securities of foreign issuers.
Note 1. Accounting Policies
The following is a summary of significant accounting policies followed by the Fund and the Series in the preparation of its financial statements.
Securities Valuation: Securities listed on a securities exchange (other than options on securities and indices) are valued at the last sale price on such exchange on the day of valuation or, if there was no sale on such day, at the mean between the last reported bid and ask prices, or at the last bid price on such day in the absence of an asked price. Securities traded via Nasdaq are valued at the Nasdaq official closing price (NOCP) on the day of valuation, or if there was no NOCP, at the last sale price. Securities that are actively traded in the over-the-counter market, including listed securities for which the primary market is believed by Prudential Investments LLC (“PI” or “Manager”), in consultation with the subadvisers, to be over-the-counter, are valued at market value using prices provided by an independent pricing agent or principal market maker. Options on securities and indices traded on an exchange are valued at the last sale price as of the close of trading on the applicable exchange or, if there was no sale, at the mean between the most recently quoted bid and asked prices on such exchange. Futures contracts and options thereon traded on a commodities exchange or board of trade are valued at the last sale price at the close of trading on such exchange or board of trade or, if there was no sale on the applicable commodities exchange or board of trade on such day, at the mean between the most recently quoted bid and asked prices on such exchange or board of trade or at the last bid price in the absence of an asked price. Prices may be obtained from independent pricing services which use information provided by market makers or estimates of market values obtained from yield data relating to investments or securities with similar characteristics. Securities for which reliable market quotations
| 28 | Visit our website at www.jennisondryden.com |
are not readily available, or whose values have been affected by events occurring after the close of the security’s foreign market and before the Funds’ normal pricing time, are valued at fair value in accordance with the Board of Directors approved fair valuation procedures. When determining the fair valuation of securities some of the factors influencing the valuation include, the nature of any restrictions on disposition of the securities; assessment of the general liquidity of the securities; the issuer’s financial condition and the markets in which it does business; the cost of the investment; the size of the holding and the capitalization of issuer; the prices of any recent transactions or bids/offers for such securities or any comparable securities; any available analyst media or other reports or information deemed reliable by the investment adviser regarding the issuer or the markets or industry in which it operates. Using fair value to price securities may result in a value that is different from a security’s most recent closing price and from the price used by other mutual funds to calculate their net asset values. As of October 31, 2005, the Series was valued in accordance with such procedures.
Investments in mutual funds are valued at their net asset value as of the close of the New York Stock Exchange on the date of valuation.
Short-term securities which mature in 60 days or less are valued at amortized cost, which approximates market value. The amortized cost method includes valuing a security at its cost on the date of purchase and thereafter assuming a constant amortization to maturity of the difference between the principal amount due at maturity and cost. Short-term securities that mature in more than 60 days are valued at current market quotations.
Repurchase Agreements: In connection with transactions in repurchase agreements with United States financial institutions, it is the Fund’s policy that its custodian or designated subcustodians, under triparty repurchase agreements, as the case may be, take possession of the underlying collateral securities, the value of which exceeds the principal amount of the repurchase transaction including accrued interest. To the extent that any repurchase transaction exceeds one business day, the value of the collateral is marked to market on a daily basis to maintain the adequacy of the collateral. If the seller defaults and the value of the collateral declines, or if bankruptcy proceedings are commenced with respect to the seller of the security, realization of the collateral by the Series may be delayed or limited.
| Dryden International Equity Fund | 29 |
Notes to Financial Statements
Cont’d
Foreign Currency Translation: The books and records of the Series are maintained in U.S. dollars. Foreign currency amounts are translated into U.S. dollars on the following basis:
(i) market value of investment securities, other assets and liabilities-at the current rates of exchange.
(ii) purchases and sales of investment securities, income and expenses-at the rate of exchange prevailing on the respective dates of such transactions.
Although the net assets of the Series are presented at the foreign exchange rates and market values at the close of the fiscal period, the Series does not isolate that portion of the results of operations arising as a result of changes in the foreign exchange rates from the fluctuations arising from changes in the market prices of long-term portfolio securities held at the end of the fiscal period. Similarly, the Series does not isolate the effect of changes in foreign exchange rates from the fluctuations arising from changes in the market prices of long-term portfolio securities sold during the fiscal period. Accordingly, realized foreign currency gains or losses are included in the reported net realized gains or losses on investment transactions.
Net realized gains or losses on foreign currency transactions represent net foreign exchange gains or losses from holdings of foreign currencies, currency gains or losses realized between the trade and settlement dates on security transactions, and the difference between the amounts of dividends, interest and foreign withholding taxes recorded on the Series’ books and the U.S. dollar equivalent amounts actually received or paid. Net unrealized currency gains or losses from valuing foreign currency denominated assets and liabilities (other than investments) at period end exchange rates are reflected as a component of net unrealized appreciation (depreciation) on foreign currencies.
Foreign security and currency transactions may involve certain considerations and risks not typically associated with those of domestic origin as a result of, among other factors, the possibility of political or economic instability, or the level of governmental supervision and regulation of foreign securities markets.
Securities Transactions and Net Investment Income: Securities transactions are recorded on the trade date. Realized and unrealized gains or losses from security and currency transactions are calculated on the identified cost basis. Dividend income is
| 30 | Visit our website at www.jennisondryden.com |
recorded on the ex-dividend date and interest income is recorded on an accrual basis. Expenses are recorded on the accrual basis.
Net investment income or loss (other than distribution fees which are charged directly to the respective class) and unrealized and realized gains or losses are allocated daily to each class of shares based upon the relative proportion of net assets of each class at the beginning of the day.
Financial Futures Contracts: A financial futures contract is an agreement to purchase (long) or sell (short) an agreed amount of securities at a set price for delivery on a future date. Upon entering into a financial futures contract, the Fund is required to pledge to the broker an amount of cash and/or other assets equal to a certain percentage of the contract amount. This amount is known as the “initial margin.” Subsequent payments, known as “variation margin,” are made or received by the Fund each day, depending on the daily fluctuations in the value of the underlying security. Such variation margin is recorded for financial statement purposes on a daily basis as unrealized gain or loss. When the contract expires or is closed, the gain or loss is realized and is presented in the Statement of Operations as net realized gain or loss on financial futures transactions.
The Fund invests in financial futures contracts in order to hedge its existing portfolio securities, or securities the Fund intends to purchase, against fluctuations in value caused by changes in prevailing interest rates or market conditions. Should interest rates move unexpectedly, the Fund may not achieve the anticipated benefits of the financial futures contracts and may realize a loss. The use of futures transactions involves the risk of imperfect correlation in movements in the price of futures contracts, interest rates and the underlying hedged assets.
Financial futures contracts involve elements of both market and credit risk in excess of the amounts reflected on the Statement of Assets and Liabilities.
Dividends and Distributions: The Series expects to pay dividends of net investment income and distributions of net realized capital and currency gains, if any, annually. Dividends and distributions to shareholders, which are determined in accordance with federal income tax regulations which may differ from generally accepted accounting principles, are recorded on the ex-dividend date.
Taxes: For federal income tax purposes, each series in the Fund is treated as a separate taxpaying entity. It is each Series’ policy to continue to meet the requirements of the Internal Revenue Code applicable to regulated investment
| Dryden International Equity Fund | 31 |
Notes to Financial Statements
Cont’d
companies and to distribute all of its taxable net investment income and capital gains, if any, to its shareholders. Therefore, no federal income tax provision is required.
Withholding taxes on foreign dividends are recorded net of reclaimable amounts, at the time the related income is earned.
Estimates: The preparation of the financial statements requires management to make estimates and assumptions that affect the reported amounts and disclosures in the financial statements. Actual results could differ from those estimates.
Note 2. Agreements
The Fund has a management agreement for the Series with PI. Pursuant to this agreement, PI has responsibility for all investment advisory services and supervises the subadviser’s performance of such services. PI entered into a subadvisory agreement with Quantitative Management Associates LLC (QMA) The subadvisory agreement provides that QMA furnishes investment advisory services in connection with the management of the Series. In connection therewith, QMA is obligated to keep certain books and records of the Series. PI pays for the services of QMA, the cost of compensation of officers of the Series, occupancy and certain clerical and bookkeeping costs of the Series. The Series bears all other costs and expenses.
The management fee paid to PI is computed daily and payable monthly, at an annual rate of .85 of 1% of the average daily net assets of the Series up to and including $300 million, .75 of 1% of the average daily net assets in excess of $300 million up to and including $1.5 billion and .70 of 1% of the Series’ average daily net assets over $1.5 billion. Effective February 15, 2005, PI contractually agreed to subsidize and or cap the annual operating expenses so that annual operation expenses (exclusive of distribution and service (12b-1) fees) do not exceed 1.25% of the Series net assets. The effective management fee was .85% for the year ended October 31, 2005.
The Series has a distribution agreement with Prudential Investment Management Services LLC (“PIMS”) which acts as the distributor of Class A, Class B, Class C and Class Z shares of the Series. The Series compensates PIMS for distributing and servicing the Series’ Class A, Class B and Class C shares, pursuant to a plan of distribution, (the “Class A, B and C Plans”), regardless of expenses actually incurred by PIMS. The distribution fees are accrued daily and payable monthly. No distribution or service fees are paid to PIMS as distributor for Class Z shares of the Series.
| 32 | Visit our website at www.jennisondryden.com |
Pursuant to the Class A, B and C Plans, the Series compensates PIMS for distribution related activities at an annual rate of up to .30 of 1%, 1% and 1% of the average daily net assets of the Class A, B, and C shares, respectively. For the year ended October 31, 2005, PIMS contractually agreed to limit such fees to .25 of 1% of the average daily net assets of the Class A shares.
PIMS has advised the Series that they received approximately $76,200 in front-end sales charges resulting from sales of Class A shares during the year ended October 31, 2005. From these fees, PIMS paid such sales charges to broker-dealers, which in turn paid commissions to salespersons and incurred other distribution costs.
PIMS has advised the Series that for the year ended October 31, 2005 it received approximately $95,200 and $600 in contingent deferred sales charges imposed upon certain redemptions by Class B and Class C shareholders, respectively.
PI, QMA and PIMS are indirect, wholly-owned subsidiaries of Prudential Financial, Inc. (“Prudential”).
The Series, along with other affiliated registered investment companies (the “Funds”), is a party to a syndicated credit agreement (”SCA”) with two banks. For the period October 29, 2004 through October 28, 2005, the SCA provided for a commitment of $500 million. Interest on any borrowings under the SCA was to be incurred at market rates. The Funds paid a commitment fee of .075 of 1% of the unused portion of the SCA. The commitment fee was accrued daily and paid quarterly and allocated to the Funds pro-rata based on net assets. The purpose of the SCA is to serve as an alternative source of funding for capital share redemptions. The expiration date of the SCA was October 28, 2005. Effective October 29, 2005, the Funds entered into a revised credit agreement with two banks. The commitment under the revised credit agreement continues to be $500 million. The Funds paid a commitment fee of .0725 of 1% of the unused portion of the revised credit agreement. The expiration of the revised SCA is October 27, 2006. The Fund did not borrow any amounts pursuant to the SCA during the year ended October 31, 2005.
Note 3. Other Transactions with Affiliates
Prudential Mutual Fund Services LLC (“PMFS”), an affiliate of PI and an indirect, wholly-owned subsidiary of Prudential, serves as the Fund’s transfer agent. Transfer agent fees and expenses in the Statement of Operations include certain out-of-pocket expenses paid to non-affiliates, where applicable.
The Series pays networking fees to affiliated and unaffiliated broker/dealers. These networking fees are payments made to broker/dealers that clear mutual fund
| Dryden International Equity Fund | 33 |
Notes to Financial Statements
Cont’d
transactions through a national clearing system. For the year ended October 31, 2005, the Series incurred approximately $70,500 in total networking fees. These amounts are included in transfer agent’s fees and expenses in the Statement of Operations.
The Series invests in the Taxable Money Market Series (the “Portfolio”), a portfolio of Dryden Core Investment Fund, pursuant to an exemptive order received from the Securities and Exchange Commission. The Portfolio is a money market mutual fund registered under the Investment Company Act of 1940, as amended, and managed by PI.
Note 4. Portfolio Securities
Purchases and sales of investment securities, other than short-term investments, for the year ended October 31, 2005 aggregated $214,340,096 and $57,145,289, respectively.
Note 5. Distributions and Tax Information
Distributions to shareholders, which are determined in accordance with federal income tax regulations and which may differ from generally accepted accounting principles, are recorded on the ex-dividends date. In order to present undistributed net investment income (loss) and accumulated net realized gains (losses) on the Statement of Assets and Liabilities that more closely represent their tax character, certain adjustments have been made to paid-in-capital in excess of par, undistributed net investment income (loss) and accumulated net realized gain (loss) on investment. For the year ended October 31, 2005, the adjustments were to decrease accumulated net realized loss on investments and decrease undistributed net investment income by $216,991 due to the difference in the treatment for book and tax purposes of certain transactions involving, foreign currencies and other tax adjustments.
As of October 31, 2005, the Series had undistributed ordinary income on a tax basis of $1,104,174.
For the year ended October 31, 2005, the tax character of dividends paid as reflected in the Statement of Changes in Net Assets was $575,432.
For federal income tax purposes, the Series had a capital loss carryforward as of October 31, 2005, of approximately $167,990,000 of which $107,387,000 expires in
| 34 | Visit our website at www.jennisondryden.com |
2009, $49,177,000 expires in 2010 and $11,426,000 expires in 2011. Accordingly, no capital gains distribution is expected to be paid to shareholders until net gains have been realized in excess of such carryforward. It is uncertain whether the Series will be able to realize the full benefit prior to the expiration date. In addition, the Fund utilized approximately $8,314,000 of its capital loss carryforward to offset net taxable gains realized in the fiscal year ended October 31, 2005.
The United States federal income tax basis of the Series’ investments and the net unrealized appreciation as of October 31, 2005 was as follows:
Tax Basis | Appreciation | Depreciation | Total | Other Cost Basis | Total Net Appreciation | |||||
| $240,718,780 | $27,570,995 | ($3,374,499) | 24,196,496 | ($67,017) | $24,129,479 |
The difference between book and tax basis is primarily attributable to deferred losses on wash sales, and market to market of open passive foreign investment companies.
The other cost basis adjustment is primarily attributable to depreciation of foreign currency, market to market of receivables and payables.
Note 6. Capital
The Series offers Class A, Class B, Class C and Class Z shares. Class A shares are sold with a front-end sales charge of up to 5.50%. All investors who purchase Class A shares in an amount of $1 million or more and sell these shares within 12 months of purchase are subject to a contingent deferred sales charge (CDSC) of 1%, including investors who purchase their shares through broker-dealers affiliated with Prudential. Class B shares are sold with a contingent deferred sales charge which declines from 5% to zero depending on the period of time the shares are held. Class C shares are sold with a contingent deferred sales charge of 1% during the first 12 months. Class B shares will automatically convert to Class A shares on a quarterly basis approximately seven years after purchase. A special exchange privilege is also available for shareholders who qualify to purchase Class A shares at net asset value. Class Z shares are not subject to any sales or redemption charge and are offered exclusively for sale to a limited group of investors.
There are 500 million authorized shares of $.01 par value common stock, divided equally into four classes, designated Class A, Class B, Class C and Class Z common stock.
| Dryden International Equity Fund | 35 |
Notes to Financial Statements
Cont’d
Transactions in shares of common stock were as follows:
Class A | Shares | Amount | |||||
Year ended October 31, 2005: | |||||||
Shares sold | 3,075,587 | $ | 19,889,669 | ||||
Shares issued in reinvestment of dividends | 36,937 | 225,314 | |||||
Shares reacquired | (1,572,361 | ) | (10,149,806 | ) | |||
Net increase (decrease) in shares outstanding before conversion | 1,540,163 | 9,965,177 | |||||
Shares issued upon conversion from Class B | 221,923 | 1,443,849 | |||||
Net increase (decrease) in shares outstanding | 1,762,086 | $ | 11,409,026 | ||||
Year ended October 31, 2004: | |||||||
Shares sold | 1,347,315 | $ | 7,229,559 | ||||
Shares reacquired | (1,738,594 | ) | (9,162,357 | ) | |||
Net increase (decrease) in shares outstanding before conversion | (391,279 | ) | (1,932,798 | ) | |||
Shares issued upon conversion from Class B | 94,663 | 507,267 | |||||
Net increase (decrease) in shares outstanding | (296,616 | ) | $ | (1,425,531 | ) | ||
Class B | |||||||
Year ended October 31, 2005: | |||||||
Shares sold | 967,336 | $ | 5,983,249 | ||||
Shares issued in reinvestment of dividends | 19,844 | 117,479 | |||||
Shares reacquired | (1,868,303 | ) | (11,619,512 | ) | |||
Net increase (decrease) in shares outstanding before conversion | (881,123 | ) | (5,518,784 | ) | |||
Shares reacquired upon conversion into Class A | (229,320 | ) | (1,443,849 | ) | |||
Net increase (decrease) in shares outstanding | (1,110,443 | ) | $ | (6,962,633 | ) | ||
Year ended October 31, 2004: | |||||||
Shares sold | 969,690 | $ | 5,012,244 | ||||
Shares reacquired | (1,877,866 | ) | (9,705,381 | ) | |||
Net increase (decrease) in shares outstanding before conversion | (908,176 | ) | (4,693,137 | ) | |||
Shares reacquired upon conversion into Class A | (97,721 | ) | (507,267 | ) | |||
Net increase (decrease) in shares outstanding | (1,005,897 | ) | $ | (5,200,404 | ) | ||
Class C | |||||||
Year ended October 31, 2005: | |||||||
Shares sold | 506,522 | $ | 3,138,890 | ||||
Shares issued in reinvestment of dividends | 6,489 | 38,417 | |||||
Shares reacquired | (1,037,995 | ) | (6,454,396 | ) | |||
Net increase (decrease) in shares outstanding | (524,984 | ) | $ | (3,277,089 | ) | ||
Year ended October 31, 2004: | |||||||
Shares sold | 1,059,382 | $ | 5,515,749 | ||||
Shares reacquired | (1,570,840 | ) | (8,158,518 | ) | |||
Net increase (decrease) in shares outstanding | (511,458 | ) | $ | (2,642,769 | ) | ||
| 36 | Visit our website at www.jennisondryden.com |
Class Z | Shares | Amount | |||||
Year ended October 31, 2005: | |||||||
Shares sold* | 25,273,059 | $ | 171,102,347 | ||||
Shares issued in reinvestment of dividends | 27,443 | 168,774 | |||||
Shares reacquired | (1,454,474 | ) | (9,963,528 | ) | |||
Net increase (decrease) in shares outstanding | 23,846,028 | $ | 161,307,593 | ||||
Year ended October 31, 2004: | |||||||
Shares sold | 2,175,647 | $ | 11,866,931 | ||||
Shares reacquired | (714,723 | ) | (3,844,417 | ) | |||
Net increase (decrease) in shares outstanding | 1,460,924 | $ | 8,022,514 | ||||
| * | Includes 22,671,236 shares allotted pursuant to a subscription in kind transaction for $153,711,660 |
Note 7. Subsequent Events
On December 1, 2005 the Board of Directors of the Fund declared the following dividends per share. Payable on December 6, 2005 to shareholders of record on December 5, 2005.
| Class A | Class Z | |||||
Ordinary Income | $ | 0.03927 | $ | 0.05347 | ||
| Dryden International Equity Fund | 37 |
Financial Highlights
| Class A | ||||
| Year Ended October 31, 2005 | ||||
Per Share Operating Performance: | ||||
Net Asset Value, Beginning Of Year | $ | 5.75 | ||
Income (loss) from investment operations: | ||||
Net investment income (loss) | .06 | |||
Net realized and unrealized gain (loss) on investment and foreign currency transactions | 1.09 | |||
Total from investment operations | 1.15 | |||
Less Dividends: | ||||
Dividends from net investment income | (.06 | ) | ||
Net asset value, end of year | $ | 6.84 | ||
Total Return(a): | 20.13 | % | ||
Ratios/Supplemental Data: | ||||
Net assets, end of year (000) | $ | 38,323 | ||
Average net assets (000) | $ | 30,177 | ||
Ratios to average net assets: | ||||
Expenses, including distribution and service (12b-1) fees(b) | 1.57 | %(c) | ||
Expenses, excluding distribution and service (12b-1) fees | 1.32 | %(c) | ||
Net investment income (loss) | 1.13 | %(c) | ||
For Class A, B, C and Z shares: | ||||
Portfolio turnover rate | 41 | % | ||
| (a) | Total return does not consider the effects of sales loads. Total return is calculated assuming a purchase of shares on the first day and a sale on the last day of each year reported, and includes reinvestment of dividends and distributions. |
| (b) | The distributor of the Series has contractually agreed to limit its distribution and service (12b-1) fees to .25 of 1% of the average daily net assets of the Class A shares. |
| (c) | Net of expense subsidy. If the investment manager had not subsidized expenses, the expense ratios (both including and excluding distribution and service (12b-1) fees and the net investment income ratios would have been 1.68%, 1.43% and 1.02%, respectively for the year ended October 31, 2005. |
See Notes to Financial Statements.
| 38 | Visit our website at www.jennisondryden.com |
| Class A | ||||||||||||||
| Year Ended October 31, | ||||||||||||||
| 2004 | 2003 | 2002 | 2001 | |||||||||||
| $ | 4.84 | $ | 3.74 | $ | 4.37 | $ | 7.91 | |||||||
| .03 | (.02 | ) | (.02 | ) | (.06 | ) | ||||||||
| .88 | 1.12 | (.61 | ) | (3.48 | ) | |||||||||
| .91 | 1.10 | (.63 | ) | (3.54 | ) | |||||||||
| — | — | — | — | |||||||||||
| $ | 5.75 | $ | 4.84 | $ | 3.74 | $ | 4.37 | |||||||
| 18.80 | % | 29.41 | % | (14.42 | )% | (44.68 | )% | |||||||
| $ | 22,103 | $ | 20,050 | $ | 19,414 | $ | 28,860 | |||||||
| $ | 20,760 | $ | 18,650 | $ | 25,360 | $ | 47,713 | |||||||
| 2.02 | % | 2.13 | % | 1.88 | % | 1.73 | % | |||||||
| 1.77 | % | 1.88 | % | 1.63 | % | 1.48 | % | |||||||
| .64 | % | (.36 | )% | (.56 | )% | (.86 | )% | |||||||
| 100 | % | 157 | % | 108 | % | 63 | % | |||||||
See Notes to Financial Statements.
| Dryden International Equity Fund | 39 |
Financial Highlights
Cont’d
| Class B | ||||
| Year Ended October 31, 2005 | ||||
Per Share Operating Performance: | ||||
Net Asset Value, Beginning Of Year | $ | 5.55 | ||
Income (loss) from investment operations: | ||||
Net investment income (loss) | .02 | |||
Net realized and unrealized gain (loss) on investment and foreign currency transactions | 1.04 | |||
Total from investment operations | 1.06 | |||
Less Dividends: | ||||
Dividends from net investment income | (.02 | ) | ||
Net asset value, end of year | $ | 6.59 | ||
Total Return(a): | 19.08 | % | ||
Ratios/Supplemental Data: | ||||
Net assets, end of year (000) | $ | 42,878 | ||
Average net assets (000) | $ | 44,159 | ||
Ratios to average net assets: | ||||
Expenses, including distribution and service (12b-1) fees | 2.32 | %(b) | ||
Expenses, excluding distribution and service (12b-1) fees | 1.32 | %(b) | ||
Net investment income (loss) | .37 | %(b) | ||
| (a) | Total return does not consider the effects of sales loads. Total return is calculated assuming a purchase of shares on the first day and a sale on the last day of each year reported, and includes reinvestment of dividends and distributions. |
| (b) | Net of expense subsidy. If the investment manager had not subsidized expenses, the expense ratios (both including and excluding distribution and service (12b-1) fees and the net investment income ratios would have been 2.43%, 1.43% and .28%, respectively for the year ended October 31, 2005. |
See Notes to Financial Statements.
| 40 | Visit our website at www.jennisondryden.com |
| Class B | ||||||||||||||
| Year Ended October 31, | ||||||||||||||
| 2004 | 2003 | 2002 | 2001 | |||||||||||
| $ | 4.71 | $ | 3.66 | $ | 4.32 | $ | 7.87 | |||||||
| (.01 | ) | (.05 | ) | (.07 | ) | (.11 | ) | |||||||
| .85 | 1.10 | (.59 | ) | (3.44 | ) | |||||||||
| .84 | 1.05 | (.66 | ) | (3.55 | ) | |||||||||
| — | — | — | — | |||||||||||
| $ | 5.55 | $ | 4.71 | $ | 3.66 | $ | 4.32 | |||||||
| 17.83 | % | 28.34 | % | (15.05 | )% | (45.04 | )% | |||||||
| $ | 42,252 | $ | 40,587 | $ | 37,059 | $ | 54,810 | |||||||
| $ | 42,334 | $ | 35,399 | $ | 49,086 | $ | 87,731 | |||||||
| 2.77 | % | 2.88 | % | 2.63 | % | 2.48 | % | |||||||
| 1.77 | % | 1.88 | % | 1.63 | % | 1.48 | % | |||||||
| (.11 | )% | (1.14 | )% | (1.30 | )% | (1.60 | )% | |||||||
See Notes to Financial Statements.
| Dryden International Equity Fund | 41 |
Financial Highlights
Cont’d
| Class C | ||||
| Year Ended October 31, 2005 | ||||
Per Share Operating Performance: | ||||
Net Asset Value, Beginning Of Year | $ | 5.55 | ||
Income (loss) from investment operations: | ||||
Net investment income (loss) | .02 | |||
Net realized and unrealized gain (loss) on investment and foreign currency transactions | 1.04 | |||
Total from investment operations | 1.06 | |||
Less Dividends: | ||||
Dividends from net investment income | (.02 | ) | ||
Net asset value, end of year | $ | 6.59 | ||
Total Return(a): | 19.08 | % | ||
Ratios/Supplemental Data: | ||||
Net assets, end of year (000) | $ | 12,779 | ||
Average net assets (000) | $ | 13,700 | ||
Ratios to average net assets: | ||||
Expenses, including distribution and service (12b-1) fees | 2.32 | %(b) | ||
Expenses, excluding distribution and service (12b-1) fees | 1.32 | %(b) | ||
Net investment income (loss) | .37 | %(b) | ||
| (a) | Total return does not consider the effects of sales loads. Total return is calculated assuming a purchase of shares on the first day and a sale on the last day of each year reported, and includes reinvestment of dividends and distributions. |
| (b) | Net of expense subsidy. If the investment manager had not subsidized expenses, the expense ratios (both including and excluding distribution and service (12b-1) fees and the net investment income ratios would have been 2.43%, 1.43% and .28%, respectively for the year ended October 31, 2005. |
See Notes to Financial Statements.
| 42 | Visit our website at www.jennisondryden.com |
| Class C | ||||||||||||||
| Year Ended October 31, | ||||||||||||||
| 2004 | 2003 | 2002 | 2001 | |||||||||||
| $ | 4.71 | $ | 3.66 | $ | 4.32 | $ | 7.87 | |||||||
| (.01 | ) | (.05 | ) | (.08 | ) | (.12 | ) | |||||||
| .85 | 1.10 | (.58 | ) | (3.43 | ) | |||||||||
| .84 | 1.05 | (.66 | ) | (3.55 | ) | |||||||||
| — | — | — | — | |||||||||||
| $ | 5.55 | $ | 4.71 | $ | 3.66 | $ | 4.32 | |||||||
| 17.83 | % | 28.34 | % | (15.05 | )% | (45.04 | )% | |||||||
| $ | 13,669 | $ | 14,006 | $ | 13,906 | $ | 24,004 | |||||||
| $ | 13,956 | $ | 12,640 | $ | 19,770 | $ | 41,057 | |||||||
| 2.77 | % | 2.88 | % | 2.63 | % | 2.48 | % | |||||||
| 1.77 | % | 1.88 | % | 1.63 | % | 1.48 | % | |||||||
| (.12 | )% | (1.14 | )% | (1.33 | )% | (1.61 | )% | |||||||
See Notes to Financial Statements.
| Dryden International Equity Fund | 43 |
Financial Highlights
Cont’d
| Class Z | ||||
| Year Ended October 31, 2005 | ||||
Per Share Operating Performance: | ||||
Net Asset Value, Beginning Of Year | $ | 5.80 | ||
Income (loss) from investment operations: | ||||
Net investment income (loss) | .05 | |||
Net realized and unrealized gain (loss) on investment and foreign currency transactions | 1.12 | |||
Total from investment operations | 1.17 | |||
Less Dividends: | ||||
Dividends from net investment income | (.07 | ) | ||
Net asset value, end of year | $ | 6.90 | ||
Total Return(a): | 20.40 | % | ||
Ratios/Supplemental Data: | ||||
Net assets, end of year (000) | $ | 179,798 | ||
Average net assets (000) | $ | 53,026 | ||
Ratios to average net assets: | ||||
Expenses, including distribution and service (12b-1) fees | 1.32 | %(b) | ||
Expenses, excluding distribution and service (12b-1) fees | 1.32 | %(b) | ||
Net investment income (loss) | .88 | %(b) | ||
| (a) | Total return is calculated assuming a purchase of shares on the first day and a sale on the last day of each year reported, and includes reinvestment of dividends and distributions. |
| (b) | Net of expense subsidy. If the investment manager had not subsidized expenses, the expense ratios (both including and excluding distribution and service (12b-1) fees and the net investment income ratios would have been 1.43%, 1.43% and .73%, respectively for the year ended October 31, 2005. |
See Notes to Financial Statements.
| 44 | Visit our website at www.jennisondryden.com |
| Class Z | ||||||||||||||
| Year Ended October 31, | ||||||||||||||
| 2004 | 2003 | 2002 | 2001 | |||||||||||
| $ | 4.88 | $ | 3.76 | $ | 4.39 | $ | 7.92 | |||||||
| .03 | (.01 | ) | (.02 | ) | (.06 | ) | ||||||||
| .89 | 1.13 | (.61 | ) | (3.47 | ) | |||||||||
| .92 | 1.12 | (.63 | ) | (3.53 | ) | |||||||||
| — | — | — | — | |||||||||||
| $ | 5.80 | $ | 4.88 | $ | 3.76 | $ | 4.39 | |||||||
| 18.85 | % | 29.79 | % | (14.35 | )% | (44.50 | )% | |||||||
| $ | 12,881 | $ | 3,699 | $ | 6,049 | $ | 6,065 | |||||||
| $ | 7,103 | $ | 3,533 | $ | 7,665 | $ | 13,805 | |||||||
| 1.77 | % | 1.88 | % | 1.63 | % | 1.48 | % | |||||||
| 1.77 | % | 1.88 | % | 1.63 | % | 1.48 | % | |||||||
| .81 | % | (.31 | )% | (.22 | )% | (.59 | )% | |||||||
See Notes to Financial Statements.
| Dryden International Equity Fund | 45 |
Report of Independent Registered Public
Accounting Firm
The Board of Directors and Shareholders of Prudential World Fund, Inc.—Dryden International Equity Fund:
We have audited the accompanying statement of assets and liabilities of the Prudential World Fund, Inc.—Dryden International Equity Fund (one of the portfolios constituting the Prudential World Fund, Inc., hereafter referred to as the “Fund”), including the portfolio of investments, as of October 31, 2005, and the related statement of operations for the year then ended, and the statement of changes in net assets and the financial highlights for each of years in the two-year period then ended. These financial statements and financial highlights are the responsibility of the Fund’s management. Our responsibility is to express an opinion on these financial statements and financial highlights based on our audits. The financial highlights for the years presented prior to the year ended October 31, 2004, were audited by another independent registered public accounting firm, whose report dated December 22, 2003, expressed an unqualified opinion thereon.
We conducted our audits in accordance with the standards of the Public Company Accounting Oversight Board (United States). Those standards require that we plan and perform the audit to obtain reasonable assurance about whether the financial statements and financial highlights are free of material misstatement. An audit includes examining, on a test basis, evidence supporting the amounts and disclosures in the financial statements. Our procedures included confirmation of securities owned as of October 31, 2005, by correspondence with the custodian and brokers or by other appropriate auditing procedures where replies from brokers were not received. An audit also includes assessing the accounting principles used and significant estimates made by management, as well as evaluating the overall financial statement presentation. We believe that our audits provide a reasonable basis for our opinion.
In our opinion, the financial statements and financial highlights referred to above present fairly, in all material respects, the financial position of the Fund as of October 31, 2005, and the results of its operations for the year then ended, and the changes in its net assets and the financial highlights for each of the years in the two-year period then ended, in conformity with U.S. generally accepted accounting principles.
KPMG LLP
New York, New York
December 29, 2005
| 46 | Visit our website at www.jennisondryden.com |
Federal Income Tax Information
(Unaudited)
As required by the Internal Revenue Code, we wish to advise you as to the federal status of dividends paid by the Series during its fiscal year ended October 31, 2005.
During the fiscal year ended October 31, 2005, the Series paid dividends taxable as ordinary income of $0.06 for Class A shares, $0.017 for Class B and C shares respectively, and $0.074 for Class Z shares.
For the fiscal year ended October 31, 2005, the Series designated 100.0% as qualified dividend income for the reduced tax rate under the Jobs and Growth Tax Reconciliation Act of 2003.
The Series has elected to give the benefit of foreign tax credits to its shareholders. Accordingly, shareholders who must report their gross income dividends and distributions in a federal tax return will be entitled to a foreign tax credit, or an itemized deduction, in computing their U.S. income tax liability. It is generally more advantageous to claim a credit rather than to take a deduction. For the fiscal year ended October 31, 2005, the Fund intends on passing through $360,963 of ordinary income distributions as a foreign tax credit based on foreign source income of $3,797,914.
For purposes of preparing your federal income tax return, however, you should report the amounts as reflected on the appropriate Form 1099-DIV or substitute Form 1099-DIV which you should receive in January 2006.
| Dryden International Equity Fund | 47 |
Management of the Fund
(Unaudited)
Information pertaining to the Directors of the Fund is set forth below. Directors who are not deemed to be “interested persons” of the Fund, as defined in the Investment Company Act of 1940 as amended, (the 1940 Act) are referred to as “Independent Directors.” Directors who are deemed to be “interested persons” of the Fund are referred to as “Interested Directors.” “Fund Complex”† consists of the Fund and any other investment companies managed by PI.
Independent Directors(2)
Linda W. Bynoe (53), Director since 2005(3) Oversees 88 portfolios in Fund complex
Principal occupations (last 5 years): President and Chief Executive Officer (since March 1995) of Telemat Ltd. (management consulting); formerly Vice President at Morgan Stanley & Co.
Other Directorships held:(4) Director of Dynegy Inc. (energy services) (since September 2002) and Simon Property Group, Inc. (real estate investment trust) (since May 2003); Director (since August 2005) of The High Yield Plus Fund, Inc.
David E.A. Carson (71), Director since 2003(3) Oversees 92 portfolios in Fund complex
Principal occupations (last 5 years): Formerly Director (January 2000-May 2000), Chairman (January 1999- December 1999), Chairman and Chief Executive Officer (January 1998-December 1998) and President, Chairman and Chief Executive Officer (1983-1997) of People’s Bank.
Other Directorships held:(4) Director (since 2004) of The High Yield Plus Fund, Inc.
Robert E. La Blanc (71), Director since 1984(3) Oversees 89 portfolios in Fund complex
Principal occupations (last 5 years): President (since 1981) of Robert E. La Blanc Associates, Inc. (telecommunications).
Other Directorships held:(4) Director of Chartered Semiconductor Manufacturing, Ltd. (since 1998); Computer Associates International, Inc. (since 2002) (software company); FiberNet Telecom Group, Inc. (since 2003) (telecom company); Director (since April 1999) of The High Yield Plus Fund, Inc.
Douglas H. McCorkindale (66), Director since 2003(3) Oversees 89 portfolios in Fund complex
Principal occupations (last 5 years): Chairman (since February 2001) of Gannett Co., Inc. (publishing and media); formerly Chief Executive Officer (June 2000-July 2005), President (September 1997-July 2005) and Vice Chairman (March 1984-May 2000) of Gannett Co., Inc.
Other Directorships held:(4) Director of Gannett Co., Inc., Director of Continental Airlines, Inc. (since May 1993); Director of Lockheed Martin Corp. (aerospace and defense) (since May 2001); Director of The High Yield Plus Fund, Inc. (since 1996).
Richard A. Redeker (62), Director since 2003(3) Oversees 89 portfolios in Fund complex
Principal occupations (last 5 years): Management Consultant; Director of Invesmart, Inc. (since 2001) and Director of Penn Tank Lines, Inc. (since 1999).
Other Directorships held:(4) Director (since January 2005) of The High Yield Plus Fund, Inc.
| 48 | Visit our website at www.jennisondryden.com |
Robin B. Smith (66), Director since 1996(3) Oversees 90 portfolios in Fund complex
Principal occupations (last 5 years): Chairman of the Board (since January 2003) of Publishers Clearing House (direct marketing); formerly Chairman and Chief Executive Officer (August 1996-January 2003) of Publishers Clearing House.
Other Directorships held:(4) Director of BellSouth Corporation (since 1992); Director (since January 2005) of The High Yield Plus Fund, Inc.
Stephen G. Stoneburn (62), Director since 1996(3) Oversees 89 portfolios in Fund complex
Principal occupations (last 5 years): President and Chief Executive Officer (since June 1996) of Quadrant Media Corp. (a publishing company); formerly President (June 1995-June 1996) of Argus Integrated Media, Inc.; Senior Vice President and Managing Director (January 1993-1995) of Cowles Business Media and Senior Vice President of Fairchild Publications, Inc. (1975-1989).
Other Directorships held:(4) Director (since January 2005) of The High Yield Plus Fund, Inc.
Clay T. Whitehead (67), Director since 1984(3) Oversees 90 portfolios in Fund complex
Principal occupations (last 5 years): President (since 1983) of National Exchange Inc. (new business development firm).
Other Directorships held:(4) Director (since 2000) of The High Yield Plus Fund, Inc.
Interested Directors(1)
Judy A. Rice (57), President since 2003 and Director since 2000(3) Oversees 89 portfolios in Fund complex
Principal occupations (last 5 years): President, Chief Executive Officer, Chief Operating Officer and Officer-in-Charge (since February 2003) of Prudential Investments LLC; Vice President (since February 1999) of Prudential Investment Management Services LLC; President, Chief Executive Officer and Officer-in-Charge (since April 2003) of Prudential Mutual Fund Services LLC; formerly Executive Vice President (September 1999-February 2003) of PI; Member of Board of Governors of the Money Management Institute.
Other Directorships held:(4) Director (since August 2005) of The High Yield Plus Fund, Inc.
Robert F. Gunia (58), Vice President and Director since 1996(3) Oversees 160 portfolios in Fund complex
Principal occupations (last 5 years): Chief Administrative Officer (since September 1999) and Executive Vice President (since December 1996) of Prudential Investments LLC; President (since April 1999) of Prudential Investment Management Services LLC; Executive Vice President (since March 1999) and Treasurer (since May 2000) of Prudential Mutual Fund Services LLC.
Other Directorships held:(4) Vice President and Director (since May 1989) and Treasurer (since 1999) of The Asia Pacific Fund, Inc.; Vice President (since 2004) and Director (since August 2005) of The High Yield Plus Fund, Inc.
Information pertaining to the Officers of the Fund who are not also Directors is set forth below.
Officers(2)
Kathryn L. Quirk (52), Chief Legal Officer since 2005(3)
Principal occupations (last 5 years): Vice President and Corporate Counsel (since September 2004) of Prudential; Executive Vice President, Chief Legal Officer and Secretary (since July 2005) of Prudential Investments LLC and Prudential Mutual Fund Services LLC; formerly Managing Director, General Counsel, Chief Compliance Officer, Chief Risk Officer and Corporate Secretary (1997-2002) of Zurich Scudder Investments, Inc.
| Dryden International Equity Fund | 49 |
Deborah A. Docs (47), Secretary since 2005(3)
Principal occupations (last 5 years): Vice President and Corporate Counsel (since January 2001) of Prudential; Vice President (since December 1996) and Assistant Secretary (since March 1999) of Prudential Investments LLC; formerly Vice President and Assistant Secretary (May 2003-June 2005) of American Skandia Investment Services, Inc.
Jonathan D. Shain (47), Assistant Secretary since 2005(3)
Principal occupations (last 5 years): Vice President and Corporate Counsel (since August 1998) of Prudential; Vice President and Assistant Secretary (since May 2001) of Prudential Investments LLC; Vice President and Assistant Secretary (since February 2001) of PMFS; formerly Vice President and Assistant Secretary (May 2003-June 2005) of American Skandia Investment Services, Inc.
Marina Belaya (38), Assistant Secretary since 2005(3)
Principal occupations (last 5 years): Vice President and Corporate Counsel (since April 2005) of Prudential; formerly Associate (September 2002-March 2005) at Schutle, Roth & Zabel LLP.
Claudia DiGiacomo (31), Assistant Secretary since 2005(3)
Principal occupations (last 5 years): Vice President and Corporate Counsel (since January 2005) of Prudential; Associate at Sidley Austin Brown & Wood LLP (1999-2004).
Lee D. Augsburger (46), Chief Compliance Officer since 2004(3)
Principal occupations (last 5 years): Senior Vice President and Chief Compliance Officer (since April 2003) of Prudential Investments LLC; Vice President (since November 2000) and Chief Compliance Officer (since October 2000) of Prudential Investment Management, Inc.; Chief Compliance Officer and Senior Vice President (since May 2003) of American Skandia Investment Services, Inc.; Chief Compliance Officer (since October 2004) of Quantitative Management Associates LLC.
Maryanne Ryan (41), Anti-Money Laundering Compliance Officer since 2002(3)
Principal occupations (last 5 years): Anti-Money Laundering Officer and Vice President (since April 2002) of Pruco Securities, LLC. Vice President and Bank Secrecy Act Officer (since July 2004) of Prudential Trust Company; Anti-Money Laundering Officer (since April 2003) of Prudential Investments LLC.
Grace C. Torres (46), Treasurer and Principal Financial and Accounting Officer since 1995(3)
Principal occupations (last 5 years): Assistant Treasurer (since March 1999) and Senior Vice President (since September 1999) of Prudential Investments LLC; Assistant Treasurer (since May 2003) and Vice President (since June 2005) of American Skandia Investment Services, Inc.; Senior Vice President and Assistant Treasurer (since May 2003) of American Skandia Advisory Services, Inc.; formerly Senior Vice President (May 2003-June 2005) of American Skandia Investment Services, Inc.
Jack Benintende (41), Acting Treasurer since 2005
Vice President (since June 2000) within Prudential Mutual Fund Administration; Assistant Treasurer (since September 2004) of The High Yield Plus Fund, Inc.; formerly Assistant Treasurer (2000-October 2004) of Aberdeen Asia-Pacific Income Fund, Inc. and Aberdeen Australia Equity Fund, Inc.; Senior manager within the investment management practice of PricewaterhouseCoopers LLP (May 1994 through June 2000).
| (1) | “Interested” Director, as defined in the 1940 Act, by reason of employment with the Manager the Subadviser or the Distributor. |
| (2) | Unless otherwise noted, the address of the Directors and Officers is c/o: Prudential Investments LLC, Gateway Center Three, 100 Mulberry Street, Newark, NJ 07102. |
| 50 | Visit our website at www.jennisondryden.com |
| (3) | There is no set term of office for Directors and Officers. The Independent Directors have adopted a retirement policy, which calls for the retirement of Directors on December 31 of the year in which they reach the age of 75. The table shows the individuals length of service as Director and/or Officer. |
| (4) | This column includes only directorships of companies required to register, or file reports with the SEC under the Securities and Exchange Act of 1934 (that is, “public companies”) or other investment companies registered under the 1940 Act. |
| † | The Fund Complex consists of all investment companies managed by PI. The Funds for which PI serves as manager include JennisonDryden Mutual Funds, Strategic Partners Funds, The Prudential Variable Contract Accounts 2, 10, 11, The Target Portfolio Trust, The Prudential Series Fund, Inc., American Skandia Trust and Prudential’s Gibraltar Fund. |
| Dryden International Equity Fund | 51 |
Approval of Advisory Agreements
The Board of Directors (the “Board”) of Prudential World Fund, Inc. oversees the management of the Dryden International Equity Fund (the “Fund”), and, as required by law, determines annually whether to renew the Fund’s management agreement with Prudential Investments LLC (“PI”) and the Fund’s subadvisory agreement with Quantitative Management Associates LLC (“QMA”). In considering the renewal of the agreements, the Board, including a majority of the Independent Directors, met on May 24, 2005 and June 23, 2005 and approved the renewal of the agreements through July 31, 2006, after concluding that renewal of the agreements was in the best interests of the Fund and its shareholders.
In advance of the meetings, the Board received materials relating to the agreements, and had the opportunity to ask questions and request further information in connection with their consideration. Among other things, the Board considered performance and expense comparisons with other mutual funds in relevant Peer Universes and Peer Groups. The mutual funds included in each Peer Universe or Peer Group were objectively determined solely by Lipper Inc. (“Lipper”), an independent provider of mutual fund data. Peer Universes and Peer Groups are mutual funds grouped according to investment style. If the quartile refers to performance, then a fund in the first quartile is among the best performers. If the quartile refers to expenses, then a fund in the first quartile has among the lowest expenses.
In approving the agreements, the Board, including the Independent Directors advised by independent legal counsel, considered the factors they deemed relevant, including the nature, quality and extent of services provided, the performance of the Fund, the profitability of PI and its affiliates, expenses and fees, and the potential for economies of scale that may be shared with the Fund and its shareholders. In their deliberations, the Directors did not identify any single factor that was dispositive and each Director attributed different weights to the various factors. In connection with their deliberations, the Board considered information provided by PI throughout the year at regular Board meetings, presentations from portfolio managers and other information, as well as information furnished at or in advance of the meetings on May 24, 2005 and June 23, 2005.
The Directors determined that the overall arrangements between the Fund and PI, which serves as the Fund’s investment manager pursuant to a management agreement, and between PI and QMA, which serves as the Fund’s subadviser pursuant to the terms of a subadvisory agreement with PI, are fair and reasonable in light of the services performed, fees charged, and such other matters as the Directors considered relevant in the exercise of their business judgment.
| Dryden International Equity Fund |
Approval of Advisory Agreements (continued)
Several of the material factors and conclusions that formed the basis for the Directors reaching their determinations to approve the continuance of the agreements are separately discussed below.
Nature, Quality and Extent of Services
The Board received and considered information regarding the nature and extent of services provided to the Fund by PI and QMA. The Board considered the services provided by PI, including but not limited to the oversight of the subadviser for the Fund, as well as the provision of recordkeeping, compliance, and other services to the Fund. With respect to PI’s oversight of the subadviser, the Board noted that PI’s Strategic Investment Research Group (“SIRG”), which is a business unit of PI, is responsible for monitoring and reporting to PI’s senior management on the performance and operations of the subadviser. The Board also considered that PI pays the salaries of all of the officers and non-independent Directors of the Fund. The Board also considered the investment subadvisory services provided by QMA, as well as adherence to the Fund’s investment restrictions and compliance with applicable Fund policies and procedures.
The Board reviewed the qualifications, backgrounds and responsibilities of PI’s senior management responsible for the oversight of the Fund and QMA, and also reviewed the qualifications, backgrounds and responsibilities of QMA’s portfolio managers who are responsible for the day-to-day management of the Fund’s portfolio. The Board was provided with information pertaining to PI’s and QMA’s organizational structure, senior management, investment operations, and other relevant information pertaining to both PI and QMA. The Board also noted that it received favorable compliance reports from the Fund’s Chief Compliance Officer (CCO) as to both PI and QMA. The Board noted that QMA is affiliated with PI.
The Board concluded that it was satisfied with the nature, extent and quality of the investment management services provided by PI and the subadvisory services provided to the Fund by QMA, and that there was a reasonable basis on which to conclude that the Fund benefits from the services provided by PI and QMA under the management and subadvisory agreements.
Performance of Dryden International Equity Fund
The Board received and considered information about the Fund’s historical performance, noting that the Fund had achieved performance that was in the first quartile over a one-year period ended December 31, 2004 and performance that was
| Visit our website at www.jennisondryden.com |
in the second quartile over a three-year period ended December 31, 2004 in relation to the group of comparable funds in a Peer Universe. In addition, the Board noted that the Fund outperformed over these same time periods when compared against the appropriate benchmark index, the MSCI EAFE Index. The Board determined that the Fund’s performance was satisfactory.
Fees and Expenses
The Board considered the management fee for the Fund as compared to the management fee charged by PI to other funds and accounts and the fee charged by other advisers to comparable mutual funds as provided by Lipper.
The Fund’s management fee of 0.850% ranked in the second quartile in its Peer Group. The Board noted that PI had agreed in February 2005 to subsidize or otherwise cap Fund operating expenses at 1.50%, which was below the median of 1.85% for the Peer Group. The Board accepted PI’s recommendation to continue the current voluntary expense cap of 1.50%. The Board concluded that the management and subadvisory fees are reasonable.
Costs of Services and Profits Realized by PI
The Board was provided with information on the profitability of PI and its affiliates in serving as the Fund’s investment manager. The Board discussed with PI the methodology utilized in assembling the information regarding profitability and considered its reasonableness. The Board recognized that it is difficult to make comparisons of profitability from fund management contracts because comparative information is not generally publicly available and is affected by numerous factors, including the structure of the particular adviser, the types of funds it manages, its business mix, numerous assumptions regarding allocations and the adviser’s capital structure and cost of capital. The Board did not separately consider the profitability of the subadviser, an affiliate of PI, as its profitability was reflected in the profitability report for PI. Taking these factors into account, the Board concluded that the profitability of PI and its affiliates in relation to the services rendered was not unreasonable.
Economies of Scale
The Board noted that the management fee schedule for the Fund includes breakpoints, which have the effect of decreasing the fee rate as assets increase, but at the current level of assets, the Fund does not realize the effect of those rate reductions.
| Dryden International Equity Fund |
Approval of Advisory Agreements (continued)
The Board received and discussed information concerning whether PI realizes economies of scale as the Fund’s assets grow beyond current levels. The Board took note that the Fund’s fee structure would result in benefits to Fund shareholders when (and if) assets reach the levels at which the fee rate is reduced. These benefits will accrue whether or not PI is then realizing any economies of scale.
Other Benefits to PI and QMA
The Board considered potential ancillary benefits that might be received by PI and QMA and their affiliates as a result of their relationship with the Fund. The Board concluded that potential benefits to be derived by PI included brokerage commissions received by affiliates of PI, transfer agency fees received by the Fund’s transfer agent (which is affiliated with PI), as well as reputational or other intangible benefits resulting from PI’s association with the Fund. The Board concluded that the potential benefits to be derived by QMA included the ability to use soft dollar credits, brokerage commissions received by affiliates of QMA, as well as the potential benefits consistent with those generally resulting from an increase in assets under management, specifically potential access to additional research resources and reputational benefits. The Board concluded that the benefits derived by PI and QMA were consistent with the types of benefits generally derived by investment managers and subadvisers to mutual funds.
| Visit our website at www.jennisondryden.com |
Growth of a $10,000 Investment
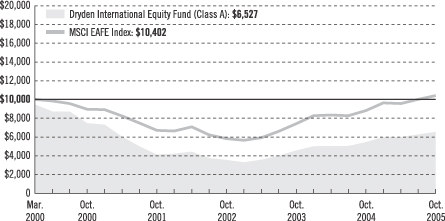
| Average Annual Total Returns (With Sales Charges) as of 10/31/05 | |||||||||
| One Year | Five Years | Since Inception | |||||||
Class A | 13.52 | % | –3.75 | % | –7.25 | % | |||
Class B | 14.08 | –3.60 | –7.21 | ||||||
Class C | 18.08 | –3.41 | –7.04 | ||||||
Class Z | 20.40 | –2.46 | –6.14 | ||||||
| Average Annual Total Returns (Without Sales Charges) as of 10/31/05 | |||||||||
| One Year | Five Years | Since Inception | |||||||
Class A | 20.13 | % | –2.65 | % | –6.32 | % | |||
Class B | 19.08 | –3.41 | –7.04 | ||||||
Class C | 19.08 | –3.41 | –7.04 | ||||||
Class Z | 20.40 | –2.46 | –6.14 | ||||||
Performance data quoted represent past performance. Past performance does not guarantee future results. The investment return and principal value of an investment will fluctuate, so that an investor’s shares, when redeemed, may be worth more or less than their original cost. Current performance may be lower or higher than the past performance data quoted. An investor may obtain performance data as of the most recent month-end by visiting our website at www.jennisondryden.com or by calling (800) 225-1852. The maximum initial sales charge is 5.50%.
The returns in the graph and the tables do not reflect the deduction of taxes that a shareholder would pay on Fund distributions or following the redemption of Fund shares.
| Visit our website at www.jennisondryden.com |
Source: Prudential Investments LLC and Lipper Inc.
Inception date: 3/1/2000.
The graph compares a $10,000 investment in the Dryden International Equity Fund (Class A shares) with a similar investment in the MSCI EAFE® Index by portraying the initial account values at the commencement of operations of Class A shares (March 1, 2000) and the account values at the end of the current fiscal year (October 31, 2005) as measured on a quarterly basis. For purposes of the graph, and unless otherwise indicated, it has been assumed that (a) the maximum applicable front-end sales charge was deducted from the initial $10,000 investment in Class A shares; (b) all recurring fees (including management fees) were deducted; and (c) all dividends and distributions were reinvested. The line graph provides information for Class A shares only. As indicated in the tables provided earlier, performance for Class B, Class C, and Class Z shares will vary due to the differing charges and expenses applicable to each share class (as indicated in the following paragraphs). Without a distribution and service (12b-1) fee waiver of 0.05% for Class A shares through October 31, 2005, the returns shown in the graph and for Class A shares in the tables would have been lower.
The MSCI EAFE® Index is an unmanaged, weighted index of performance that reflects stock price movements of developed-country markets in Europe, Australasia, and the Far East. MSCI EAFE® Index’s total returns include the reinvestment of all dividends, but do not include the effects of sales charges, operating expenses of a mutual fund, or taxes. These returns would be lower if they included the effects of sales charges, operating expenses, or taxes. The securities that comprise the MSCI EAFE® Index may differ substantially from the securities in the Fund. The MSCI EAFE® Index is not the only index that may be used to characterize performance of global/international stock funds. Other indexes may portray different comparative performance. Investors cannot invest directly in an index.
Class A shares are subject to a maximum front-end sales charge of 5.50%, a 12b-1 fee of up to 0.30% annually, and investors who purchase Class A shares in an amount of $1 million or more and sell these shares within 12 months of purchase are subject to a contingent deferred sales charge (CDSC) of 1%, in certain circumstances. Class B shares are subject to a declining CDSC of 5%, 4%, 3%, 2%, 1%, and 1% respectively for the first six years after purchase and a 12b-1 fee of 1% annually. Approximately seven years after purchase, Class B shares will automatically convert to Class A shares on a quarterly basis. Class C shares purchased are not subject to a front-end sales charge, but charge a CDSC of 1% for Class C shares sold within 12 months from the date of purchase and an annual 12b-1 fee of 1%. Class Z shares are not subject to a sales charge or 12b-1 fees. The returns in the graph and tables reflect the share class expense structure in effect at the close of the fiscal period.
| Dryden International Equity Fund |
| n MAIL | n TELEPHONE | n WEBSITE | ||
Gateway Center Three 100 Mulberry Street Newark, NJ 07102 | (800) 225-1852 | www.jennisondryden.com |
| PROXY VOTING |
| The Board of Directors of the Fund has delegated to the Fund’s investment subadviser the responsibility for voting any proxies and maintaining proxy recordkeeping with respect to the Fund. A description of these proxy voting policies and procedures is available without charge, upon request, by calling (800) 225-1852 or by visiting the Securities and Exchange Commission’s (the Commission) website at www.sec.gov. Information regarding how the Fund voted proxies relating to portfolio securities during the most recent 12-month period ended June 30, 2005, is available on the Fund’s website at www.jennisondryden.com and on the Commission’s website at www.sec.gov. |
| DIRECTORS |
| Linda W. Bynoe • David E.A. Carson • Robert F. Gunia • Robert E. La Blanc • Douglas H. McCorkindale • Richard A. Redeker • Judy A. Rice • Robin B. Smith • Stephen G. Stoneburn • Clay T. Whitehead |
| OFFICERS |
| Judy A. Rice, President • Robert F. Gunia, Vice President • Grace C. Torres, Treasurer and Principal Financial and Accounting Officer • Jack Benintende, Acting Treasurer • Deborah A. Docs, Secretary • Jonathan D. Shain, Assistant Secretary • Claudia DiGiacomo, Assistant Secretary • Marina Belaya, Assistant Secretary • Maryanne Ryan, Anti-Money Laundering Compliance Officer • Lee D. Augsburger, Chief Compliance Officer |
| MANAGER | Prudential Investments LLC | Gateway Center Three 100 Mulberry Street Newark, NJ 07102 | ||
| INVESTMENT SUBADVISER | Quantitative Management Associates LLC | Gateway Center Two 100 Mulberry Street Newark, NJ 07102 | ||
| DISTRIBUTOR | Prudential Investment Management Services LLC | Gateway Center Three 100 Mulberry Street Newark, NJ 07102 | ||
| CUSTODIAN | The Bank of New York | One Wall Street New York, NY 10286 | ||
| TRANSFER AGENT | Prudential Mutual Fund Services LLC | PO Box 8098 Philadelphia, PA 19176 | ||
| INDEPENDENT REGISTERED PUBLIC ACCOUNTING FIRM | KPMG LLP | 345 Park Avenue New York, NY 10154 | ||
| FUND COUNSEL | Sullivan & Cromwell LLP | 125 Broad Street New York, NY 10004 | ||
| An investor should consider the investment objectives, risks, charges, and expenses of the Fund carefully before investing. The prospectus for the Fund contains this and other information about the Fund. An investor may obtain a prospectus by visiting our website at www.jennisondryden.com or by calling (800) 225-1852. The prospectus should be read carefully before investing. |
| E-DELIVERY |
To receive your mutual fund documents on-line, go to www.icsdelivery.com/prudential/funds and enroll. Instead of receiving printed documents by mail, you will receive notification via e-mail when new materials are available. You can cancel your enrollment or change your e-mail address at any time by clicking on the change/cancel enrollment option at the icsdelivery website address. |
| SHAREHOLDER COMMUNICATIONS WITH DIRECTORS |
| Shareholders can communicate directly with the Board of Directors by writing to the Chair of the Board, Dryden International Equity Fund, PO Box 13964, Philadelphia, PA 19176. Shareholders can communicate directly with an individual Director by writing to the same address. Communications are not screened before being delivered to the addressee. |
| AVAILABILITY OF PORTFOLIO SCHEDULE |
| The Fund files its complete schedule of portfolio holdings with the Securities and Exchange Commission (the Commission) for the first and third quarters of each fiscal year on Form N-Q. The Fund’s Forms N-Q are available on the Commission’s website at www.sec.gov. The Fund’s Forms N-Q may also be reviewed and copied at the Commission’s Public Reference Room in Washington, D.C. Information on the operation and location of the Public Reference Room may be obtained by calling (800) SEC-0330 (732-0330). The Fund will provide a full list of its portfolio holdings on its website (www.jennisondryden.com) as of the end of each month within approximately 30 days after the end of the month. |
| The Fund’s Statement of Additional Information contains additional information about the Fund’s Directors and is available without charge, upon request, by calling (800) 225-1852. |
Mutual Funds:
| ARE NOT INSURED BY THE FDIC OR ANY FEDERAL GOVERNMENT AGENCY | MAY LOSE VALUE | ARE NOT A DEPOSIT OF OR GUARANTEED BY ANY BANK OR ANY BANK AFFILIATE |

| Dryden International Equity Fund | ||||||||||||
| Share Class | A | B | C | Z | ||||||||
NASDAQ | PJRAX | PJRBX | PJRCX | PJIZX | ||||||||
CUSIP | 743969859 | 743969867 | 743969875 | 743969883 | ||||||||
MF190E IFS-A112573 Ed. 12/2005
Item 2 – Code of Ethics – See Exhibit (a)
As of the end of the period covered by this report, the registrant has adopted a code of ethics (the “Section 406 Standards for Investment Companies – Ethical Standards for Principal Executive and Financial Officers”) that applies to the registrant’s Principal Executive Officer and Principal Financial Officer; the registrant’s Principal Financial Officer also serves as the Principal Accounting Officer.
The registrant hereby undertakes to provide any person, without charge, upon request, a copy of the code of ethics. To request a copy of the code of ethics, contact the registrant 973-367-7521, and ask for a copy of the Section 406 Standards for Investment Companies - Ethical Standards for Principal Executive and Financial Officers.
Item 3 – Audit Committee Financial Expert –
The registrant’s Board has determined that Mr. David Carson, member of the Board’s Audit Committee is an “audit committee financial expert,” and that he is “independent,” for purposes of this Item.
Item 4 – Principal Accountant Fees and Services –
(a) Audit Fees
For the fiscal years ended October 31, 2005 and October 31, 2004, KPMG LLP (“KPMG”), the Registrant’s principal accountant, billed the Registrant $66,200 and $66,200, respectively, for professional services rendered for the audit of the Registrant’s annual financial statements or services that are normally provided in connection with statutory and regulatory filings.
(b) Audit-Related Fees
None.
(c) Tax Fees
None.
(d) All Other Fees
None.
(e) (1) Audit Committee Pre-Approval Policies and Procedures
THE PRUDENTIAL MUTUAL FUNDS
AUDIT COMMITTEE POLICY
on
Pre-Approval of Services Provided by the Independent Accountants
The Audit Committee of each Prudential Mutual Fund is charged with the responsibility to monitor the independence of the Fund’s independent accountants. As part of this responsibility, the Audit Committee must pre-approve any independent accounting firm’s engagement to render audit and/or permissible non-audit services, as required by law. In evaluating a proposed engagement of the independent accountants, the Audit Committee will assess the effect that the engagement might reasonably be expected to have on the accountant’s independence. The Committee’s evaluation will be based on:
| • | a review of the nature of the professional services expected to be provided, |
| • | a review of the safeguards put into place by the accounting firm to safeguard independence, and |
| • | periodic meetings with the accounting firm. |
Policy for Audit and Non-Audit Services Provided to the Funds
On an annual basis, the scope of audits for each Fund, audit fees and expenses, and audit-related and non-audit services (and fees proposed in respect thereof) proposed to be performed by the Fund’s independent accountants will be presented by the Treasurer and the independent accountants to the Audit Committee for review and, as appropriate, approval prior to the initiation of such services. Such presentation shall be accompanied by confirmation by both the Treasurer and the independent accountants that the proposed services will not adversely affect the independence of the independent accountants. Proposed services shall be described in sufficient detail to enable the Audit Committee to assess the appropriateness of such services and fees, and the compatibility of the provision of such services with the auditor’s independence. The Committee shall receive periodic reports on the progress of the audit and other services which are approved by the Committee or by the Committee Chair pursuant to authority delegated in this Policy.
The categories of services enumerated under “Audit Services”, “Audit-related Services”, and “Tax Services” are intended to provide guidance to the Treasurer and the independent accountants as to those categories of services which the Committee believes are generally consistent with the independence of the independent accountants and which the Committee (or the Committee Chair) would expect upon the presentation of specific proposals to pre-approve. The enumerated categories are not intended as an exclusive list of audit, audit-related or tax services which the Committee (or the Committee Chair) would consider for pre-approval.
Audit Services
The following categories of audit services are considered to be consistent with the role of the Fund’s independent accountants:
| • | Annual Fund financial statement audits |
| • | Seed audits (related to new product filings, as required) |
| • | SEC and regulatory filings and consents |
Audit-related Services
The following categories of audit-related services are considered to be consistent with the role of the Fund’s independent accountants:
| • | Accounting consultations |
| • | Fund merger support services |
| • | Agreed Upon Procedure Reports |
| • | Attestation Reports |
| • | Other Internal Control Reports |
Individual audit-related services that fall within one of these categories and are not presented to the Audit Committee as part of the annual pre-approval process will be subject to pre-approval by the Committee Chair (or any other Committee member on whom this responsibility has been delegated) so long as the estimated fee for those services does not exceed $50,000.
Tax Services
The following categories of tax services are considered to be consistent with the role of the Fund’s independent accountants:
| • | Tax compliance services related to the filing or amendment of the following: |
| • | Federal, state and local income tax compliance; and, |
| • | Sales and use tax compliance |
| • | Timely RIC qualification reviews |
| • | Tax distribution analysis and planning |
| • | Tax authority examination services |
| • | Tax appeals support services |
| • | Accounting methods studies |
| • | Fund merger support services |
| • | Tax consulting services and related projects |
Individual tax services that fall within one of these categories and are not presented to the Audit Committee as part of the annual pre-approval process will be subject to pre-approval by the Committee Chair (or any other Committee member on whom this responsibility has been delegated) so long as the estimated fee for those services does not exceed $50,000.
Other Non-audit Services
Certain non-audit services that the independent accountants are legally permitted to render will be subject to pre-approval by the Committee or by one or more Committee members to whom the Committee has delegated this authority and who will report to the full Committee any pre- approval
decisions made pursuant to this Policy. Non-audit services presented for pre-approval pursuant to this paragraph will be accompanied by a confirmation from both the Treasurer and the independent accountants that the proposed services will not adversely affect the independence of the independent accountants.
Proscribed Services
The Fund’s independent accountants will not render services in the following categories of non-audit services:
| • | Bookkeeping or other services related to the accounting records or financial statements of the Fund |
| • | Financial information systems design and implementation |
| • | Appraisal or valuation services, fairness opinions, or contribution-in-kind reports |
| • | Actuarial services |
| • | Internal audit outsourcing services |
| • | Management functions or human resources |
| • | Broker or dealer, investment adviser, or investment banking services |
| • | Legal services and expert services unrelated to the audit |
| • | Any other service that the Public Company Accounting Oversight Board determines, by regulation, is impermissible. |
Pre-approval of Non-Audit Services Provided to Other Entities Within the Prudential Fund Complex
Certain non-audit services provided to Prudential Investments LLC or any of its affiliates that also provide ongoing services to the Prudential Mutual Funds will be subject to pre-approval by the Audit Committee. The only non-audit services provided to these entities that will require pre-approval are those related directly to the operations and financial reporting of the Funds. Individual projects that are not presented to the Audit Committee as part of the annual pre-approval process, will be subject to pre-approval by the Committee Chair (or any other Committee member on whom this responsibility has been delegated) so long as the estimated fee for those services does not exceed $50,000. Services presented for pre-approval pursuant to this paragraph will be accompanied by a confirmation from both the Treasurer and the independent accountants that the proposed services will not adversely affect the independence of the independent accountants.
Although the Audit Committee will not pre-approve all services provided to Prudential Investments LLC and its affiliates, the Committee will receive an annual report from the Fund’s independent accounting firm showing the aggregate fees for all services provided to Prudential Investments and its affiliates.
(e) (2) Percentage of services referred to in 4(b)- (4)(d) that were approved by the audit committee –
Not applicable.
(f) Percentage of hours expended attributable to work performed by other than full time employees of principal accountant if greater than 50%.
Not applicable.
(g) Non-Audit Fees
Not applicable to Registrant for the fiscal years 2005 and 2004. The aggregate non-audit fees billed by KPMG for services rendered to the registrant’s investment adviser and any entity controlling, controlled by, or under common control with the investment adviser that provides ongoing services to the registrant for the fiscal year 2005 was $51,000. The aggregate non-audit fees billed by KPMG for services rendered to the registrant’s investment adviser and any entity controlling, controlled by, or under common control with the investment adviser that provides ongoing services to the registrant for the fiscal year 2004 was $33,500.
(h) Principal Accountants Independence
Not applicable as KPMG has not provided non-audit services to the registrant’s investment adviser and any entity controlling, controlled by, or under common control with the investment adviser that provides ongoing services to the registrant that were not pre-approved pursuant to Rule 2-01(c)(7)(ii) of Regulation S-X.
Item 5 – Audit Committee of Listed Registrants – Not applicable.
Item 6 – Schedule of Investments – The schedule is included as part of the report to shareholders filed under Item 1 of this Form.
Item 7 – Disclosure of Proxy Voting Policies and Procedures for Closed-End Management Investment Companies – Not applicable.
Item 8 – Portfolio Managers of Closed-End Management Investment Companies – Not applicable.
Item 9 – Purchases of Equity Securities by Closed-End Management Investment Company and Affiliated Purchasers – Not applicable.
Item 10 – Submission of Matters to a Vote of Security Holders – Not applicable.
Item 11 – Controls and Procedures
| (a) | It is the conclusion of the registrant’s principal executive officer and principal financial officer that the effectiveness of the registrant’s current disclosure controls and procedures (such disclosure controls and procedures having been evaluated within 90 days of the date of this filing) provide reasonable assurance that the information required to be disclosed by the registrant has been recorded, processed, summarized and reported within the time period specified in the Commission’s rules and forms and that the information required to be disclosed by the registrant has been accumulated and communicated to the registrant’s principal executive officer and principal financial officer in order to allow timely decisions regarding required disclosure. |
| (b) | There has been no significant change in the registrant’s internal control over financial reporting that occurred during the registrant’s most recent fiscal half-year of the period covered by this report that has materially affected, or is likely to materially affect, the registrant’s internal control over financial reporting. |
Item 12 – Exhibits
| (a) | (1) Code of Ethics – Attached hereto as Exhibit EX-99.CODE-ETH |
| (2) | Certifications pursuant to Section 302 of the Sarbanes-Oxley Act – Attached hereto as Exhibit EX-99.CERT. |
| (3) | Any written solicitation to purchase securities under Rule 23c-1. – Not applicable. |
| (b) | Certifications pursuant to Section 906 of the Sarbanes-Oxley Act – Attached hereto as Exhibit EX-99.906CERT. |
SIGNATURES
Pursuant to the requirements of the Securities Exchange Act of 1934 and the Investment Company Act of 1940, the registrant has duly caused this report to be signed on its behalf by the undersigned, thereunto duly authorized.
(Registrant) | Prudential World Fund, Inc. | |
By (Signature and Title)* | /s/ Deborah A. Docs | |
Deborah A. Docs | ||
Secretary | ||
Date | December 22, 2005 | |
| Pursuant to the requirements of the Securities Exchange Act of 1934 and the Investment Company Act of 1940, this report has been signed below by the following persons on behalf of the registrant and in the capacities and on the dates indicated. | ||
By (Signature and Title)* | /s/ Judy A. Rice | |
Judy A. Rice | ||
President and Principal Executive Officer | ||
Date | December 22, 2005 | |
By (Signature and Title)* | /s/ Jack Benintende | |
Jack Benintende | ||
Acting Treasurer and Principal Financial Officer | ||
Date | December 22, 2005 | |
| * | Print the name and title of each signing officer under his or her signature. |