UNITED STATES
SECURITIES AND EXCHANGE COMMISSION
Washington, D.C. 20549
FORM N-CSR
CERTIFIED SHAREHOLDER REPORT OF REGISTERED MANAGEMENT
INVESTMENT COMPANIES
| | |
| Investment Company Act file number: | | 811-03981 |
| |
| Exact name of registrant as specified in charter: | | Prudential World Fund, Inc. |
| |
| Address of principal executive offices: | | Gateway Center 3, |
| | 100 Mulberry Street, |
| | Newark, New Jersey 07102 |
| |
| Name and address of agent for service: | | Deborah A. Docs |
| | Gateway Center 3, |
| | 100 Mulberry Street, |
| | Newark, New Jersey 07102 |
| |
| Registrant’s telephone number, including area code: | | 800-225-1852 |
| |
| Date of fiscal year end: | | 10/31/2008 |
| |
| Date of reporting period: | | 10/31/2008 |
Item 1 – Reports to Stockholders


| | |
| OCTOBER 31, 2008 | | ANNUAL REPORT |
Dryden International Equity Fund
FUND TYPE
Global/International stock
OBJECTIVE
Long-term growth of capital
This report is not authorized for distribution to prospective investors unless preceded or accompanied by a current prospectus.
The views expressed in this report and information about the Fund’s portfolio holdings are for the period covered by this report and are subject to change thereafter.
JennisonDryden, Dryden, Prudential Financial and the Rock Prudential logo are registered service marks of The Prudential Insurance Company of America, Newark, NJ, and its affiliates.

December 15, 2008
Dear Shareholder:
We hope you find the annual report for the Dryden International Equity Fund informative and useful. Because market volatility climbed sharply in 2008, we understand that this is a difficult time to be an investor. While it is impossible to predict what the future holds, we continue to believe a prudent response to uncertainty is to maintain a diversified portfolio, including stock and bond mutual funds consistent with your tolerance for risk, time horizon, and financial goals.
A diversified asset allocation offers two potential advantages: it limits your exposure to any particular asset class, plus it provides a better opportunity to invest some of your assets in the right place at the right time. Your financial professional can help you create a diversified investment plan that may include mutual funds covering all the basic asset classes and that reflects your personal investor profile and risk tolerance. Keep in mind that diversification and asset allocation strategies do not assure a profit or protect against loss in declining markets.
JennisonDryden Mutual Funds give you a wide range of choices that can help you make progress toward your financial goals. Our funds offer the experience, resources, and professional discipline of four leading asset managers. JennisonDryden equity funds are advised by Jennison Associates LLC, Quantitative Management Associates LLC (QMA), or PREI® (Prudential Real Estate Investors). Prudential Investment Management, Inc. (PIM) advises the JennisonDryden fixed income and money market funds through its unit Prudential Fixed Income Management. Jennison Associates, QMA, and PIM are registered investment advisers and Prudential Financial companies. PREI is a unit of PIM.
Thank you for choosing JennisonDryden Mutual Funds.
Sincerely,

Judy A. Rice, President
Dryden International Equity Fund
| | |
| Dryden International Equity Fund | | 1 |
Your Fund’s Performance
Fund objective
The investment objective of the Dryden International Equity Fund is long-term growth of capital. There can be no assurance that the Fund will achieve its investment objective.
Performance data quoted represent past performance. Past performance does not guarantee future results. The investment return and principal value of an investment will fluctuate, so that an investor’s shares, when redeemed, may be worth more or less than their original cost. Current performance may be lower or higher than the past performance data quoted. An investor may obtain performance data as of the most recent month-end by visiting our website at www.jennisondryden.com or by calling (800) 225-1852. Class A and Class L shares have a maximum initial sales charge of 5.50% and 5.75%, respectively. Gross operating expenses: Class A, 1.45%; Class B, 2.15%; Class C, 2.15%; Class F, 1.90%; Class L, 1.65%; Class M, 2.15%; Class X, 2.15%; Class Z, 1.15%. Net operating expenses apply to: Class A, 1.43%; Class B, 2.15%; Class C, 2.15%; Class F, 1.90%; Class L, 1.65%; Class M, 2.15%; Class X, 2.15%; Class Z, 1.15%, after contractual reduction through 2/28/2008 for Class A.
| | | | | | | | | |
| Cumulative Total Returns as of 10/31/08 | | | | | | | | | |
| | | One Year | | | Five Years | | | Since Inception1 | |
Class A | | –51.87 | % | | 7.52 | % | | –47.96 | % |
Class B | | –52.22 | | | 3.46 | | | –51.27 | |
Class C | | –52.22 | | | 3.46 | | | –51.27 | |
Class F | | –52.10 | | | N/A | | | –43.43 | |
Class L | | –52.07 | | | N/A | | | –43.68 | |
Class M | | –52.22 | | | N/A | | | –44.14 | |
Class X | | –52.22 | | | N/A | | | –44.14 | |
Class Z | | –51.77 | | | 8.61 | | | –47.00 | |
MSCI EAFE® ND Index2 | | –46.62 | | | 19.32 | | | ** | |
Lipper International Multi-Cap Growth Funds Avg.3 | | –49.95 | | | 16.93 | | | *** | |
| | | | | | | | | |
| Average Annual Total Returns4 as of 9/30/08 | | | | | | | | | |
| | | One Year | | | Five Years | | | Since Inception1 | |
Class A | | –38.78 | % | | 7.02 | % | | –5.11 | % |
Class B | | –38.81 | | | 7.32 | | | –5.20 | |
Class C | | –36.39 | | | 7.43 | | | –5.22 | |
Class F | | –38.62 | | | N/A | | | –17.73 | |
Class L | | –39.17 | | | N/A | | | –21.57 | |
Class M | | –39.42 | | | N/A | | | –21.43 | |
Class X | | –39.42 | | | N/A | | | –21.43 | |
Class Z | | –35.11 | | | 8.47 | | | –4.29 | |
MSCI EAFE® ND Index2 | | –30.50 | | | 9.69 | | | ** | |
Lipper International Multi-Cap Growth Funds Avg.3 | | –31.59 | | | 9.50 | | | *** | |
| | |
| 2 | | Visit our website at www.jennisondryden.com |
The cumulative total returns do not reflect the deduction of applicable sales charges. If reflected, the applicable sales charges would reduce the cumulative total returns performance quoted. The average annual total returns assume the payment of the maximum applicable sales charge. Class A and Class L shares are subject to a maximum front-end sales charge of 5.50% and 5.75%, respectively. Under certain circumstances, Class A shares may be subject to a contingent deferred sales charge (CDSC) of 1%. Class B, Class C, Class F, Class L, Class M, and Class X shares are subject to a maximum CDSC of 5%, 1%, 5%, 1%, 6%, and 6%, respectively. Class Z shares are not subject to a sales charge.
Source: Prudential Investments LLC and Lipper Inc. Performance figures may reflect fee waivers and/or expense reimbursements. In the absence of such fee waivers and/or expense reimbursements, total returns would be lower.
1Inception dates: Class A, Class B, Class C, and Class Z, 3/1/00; Class F, 12/18/06; Class L, Class M, and Class X, 3/19/07. The Since Inception returns for the MSCI EAFE® ND Index and the Lipper International Multi-Cap Growth Funds Average (Lipper Average) are measured from the closest month-end to inception date, and not from the Fund’s actual inception date.
2The Morgan Stanley Capital International Europe, Australasia, and Far East (MSCI EAFE® ND) Index is an unmanaged, weighted index of performance that reflects stock price movements of developed-country markets in Europe, Australasia, and the Far East. The ND version of the MSCI EAFE Index reflects the impact of the maximum withholding taxes on reinvested dividends.
3The Lipper Average represents returns based on an average return of all funds in the Lipper International Multi-Cap Growth Funds category. Funds in the Lipper Average invest in a variety of market-capitalization ranges without concentrating 75% of their equity assets in any one market-capitalization range over an extended period of time. Multi-cap funds typically have 25% to 75% of their assets invested in companies strictly outside of the United States with market capitalizations (on a three-year weighted basis) greater than the 250th largest company in the S&P Developed ex-U.S. Broad Market Index (BMI). Multi-cap growth funds typically have an above-average price-to-cash flow ratio, price-to-book ratio, and three-year sales-per-share growth value compared with the S&P Developed ex-U.S. BMI.
4The average annual total returns take into account applicable sales charges. Class A, Class B, Class C, Class F, Class L, Class M, and Class X shares are subject to an annual distribution and service (12b-1) fee of up to 0.30%, 1.00%, 1.00%, 0.75%, 0.50%, 1.00%, and 1.00%, respectively. Approximately seven years after purchase, Class B and Class F shares will automatically convert to Class A shares on a quarterly basis. Class Z shares are not subject to a 12b-1 fee. The returns in the tables do not reflect the deduction of taxes that a shareholder would pay on Fund distributions or following the redemption of Fund shares.
**MSCI EAFE® ND Index Closest Month-End to Inception cumulative total returns as of 10/31/08 are –11.57% for Class A, Class B, Class C, and Class Z; –37.23% for Class F; and –39.69% for Class L, Class M, and Class X. MSCI EAFE® ND Index Closest Month-End to Inception average annual total returns as of 9/30/08 are 1.20% for Class A, Class B, Class C, and Class Z; –12.83% for Class F; and –17.04% for Class L, Class, M, and Class X.
***Lipper International Multi-Cap Growth Funds Average Closest Month-End to Inception cumulative total returns as of 10/31/08 are –29.00% for Class A, Class B, Class C, and Class Z; –37.71% for Class F; and –39.73% for Class L, Class M, and Class X. Lipper International Multi-Cap Growth Funds Average Closest Month-End to Inception average annual total returns as of 9/30/08 are –1.29% for Class A, Class B, Class C, and Class Z; –12.03% for Class F; and –15.72% for Class L, Class, M, and Class X.
| | |
| Dryden International Equity Fund | | 3 |
Your Fund’s Performance (continued)
Investors cannot invest directly in an index. The returns for the MSCI EAFE® ND Index and the Lipper Average would be lower if they included the effects of sales charges, operating expenses of a mutual fund, or taxes. Returns for the Lipper Average reflect the deduction of operating expenses, but not sales charges or taxes.
| | | |
Five Largest Holdings in Long-Term Portfolio expressed as a percentage of net assets
as of 10/31/08 | | | |
BP PLC, Oil, Gas & Consumable Fuels | | 2.1 | % |
Novartis AG, Pharmaceuticals | | 2.0 | |
Vodafone Group PLC, Wireless Telecommunication Services | | 1.8 | |
Nestle SA, Food Products | | 1.6 | |
E.ON AG, Electric Utilities | | 1.5 | |
Holdings are subject to change.
| | | |
Five Largest Industries in Long-Term Portfolio expressed as a percentage of net assets
as of 10/31/08 | |
Commercial Banks | | 13.8 | % |
Oil, Gas & Consumable Fuels | | 8.8 | |
Pharmaceuticals | | 8.7 | |
Insurance | | 5.2 | |
Metals & Mining | | 5.0 | |
Industry weightings are subject to change.
| | |
| 4 | | Visit our website at www.jennisondryden.com |
Strategy and Performance Overview
How did the Fund perform?
The Dryden International Equity Fund’s Class A shares declined 51.87% for the 12-month reporting period ended October 31, 2008, trailing the 46.62% return of the benchmark MSCI EAFE ND Index (the Index) and the 49.95% decline of the Lipper International Multi-Cap Growth Funds Average.
What were conditions like in the international stock markets?
The MSCI EAFE® Index, a gauge of equity markets of economically developed nations excluding the United States and Canada, declined significantly during the reporting period. International equities were buffeted by investor fears of a global economic recession. As the credit crisis spread more aggressively through the United Kingdom and Europe, financials and real estate markets suffered and Asian markets tumbled. Subsequently, commodity-producing nations in emerging markets were severely affected by plunging demand for energy and materials.
During the reporting period, a series of dramatic events shook the foundation of the financial world. In March, the Federal Reserve intervened to facilitate the sale of the faltering securities firm Bear Stearns, which had been immobilized by liquidity problems. In September, investors saw an extraordinary and alarming series of events: the U.S. government’s takeover of the country’s two largest mortgage providers, Fannie Mae and Freddie Mac, and the world’s largest insurer, AIG; the failure of the investment bank Lehman Brothers; the distressed sales of the commercial banking franchises of Washington Mutual and Wachovia; Bank of America’s agreement in principle to acquire Merrill Lynch; and the conversion of the two remaining global investment banks, Goldman Sachs and Morgan Stanley, to commercial banks.
The hurricane winds of the credit crisis headed toward other markets abroad, particularly in the UK and Europe. In both areas, government interventions were required to support large distressed lending and real estate entities. International markets were further roiled by anxiety over the effectiveness of an approximately $700 billion U.S. bailout plan in order to rescue its financial institutions. Amid these events, the Federal Reserve lowered the target rate for overnight lending between banks to 1.0%. The Bank of England lowered its rate by half a percentage point to 4.50%, while the European Central Bank lowered its rate by 50 basis points to 3.75%.
The lack of available credit drove a sharp increase in the cost of borrowing short-term funds, including overnight money and commercial paper. Correspondingly, Treasury bonds and bills benefited from an extreme flight to quality across all maturities. The ongoing correction in the housing market and the associated debt deflation
| | |
| Dryden International Equity Fund | | 5 |
Strategy and Performance Overview (continued)
significantly impeded economic activity. The price of oil plunged from a peak of more than $145 per barrel in early July to well under $70 by the end of October on lower near-term demand in the weakening global economy.
All sectors in the MSCI EAFE Index declined. Some defensive sectors (stocks of companies that tend to remain stable throughout the business cycle) showed slight resilience to market pressure. Healthcare and consumer staples posted the least negative declines, although in the double digits. Energy tanked, dropping almost 40%, due to low demand and a strengthening dollar, and utilities also declined. Consumer discretionary and telecommunications services dropped more than 40%. Industrials and information technology tumbled more than 50%. Materials crumbled due to demand shrinkage for construction projects in China and other emerging economies. Financials was the worst performing sector in the Index, plunging nearly 60%. In precious metals, gold and silver headed lower. As for stock-specific styles, value declined more than growth.
The credit crisis stunted economic growth across continents. In the UK and Europe, economic woes included rising bank bailouts, declining housing markets, and weakness in manufacturing and other sectors. The heaviest weighted countries in the region posted negative returns.
Markets suffered across the Pacific region. Japan sank into recession. Automotive and electronic manufacturers reduced exports to the U.S., China, and other markets abroad. Hong Kong declined on cooling Chinese economic growth. Singapore retreated deeply into negative territory. In emerging markets, Brazil, Russia, India, and China (also referred to as the BRIC group) incurred severe hits. A meltdown in the Russian markets occurred when investors fled due to its military activities in neighboring Georgia and falling energy prices.
How is the Fund managed?
Quantitative Management Associates LLC (QMA) tries to outperform the Index by actively managing the Fund via a quantitative process that evaluates 1,000 stocks. Investing in both rapidly and slowly growing companies limits the Fund’s exposure to any particular style of investing and may reduce its volatility relative to the Index. When selecting stocks of more rapidly growing companies, QMA places a heavier emphasis on “news” or signals about their future growth prospects. For example, upward revisions in earnings forecasts by Wall Street analysts are used as an indication of good news. For slowly growing companies, QMA emphasizes attractive valuations and invests more heavily in stocks that are priced cheaply relative to their firms’ earnings prospects and book values.
| | |
| 6 | | Visit our website at www.jennisondryden.com |
Among rapidly growing companies, which stocks contributed most and detracted most from the Fund’s return?
Among rapidly growing companies, Nintendo (–49%), Vestas Wind Systems (–54%), and Alstom (–58%) were some of the largest detractors from the Fund’s return. Fast Retailing (+84%), Lion Corp. (+41%), and Kissei Pharmaceutical (+26%) were among the few stocks that contributed positively.
Among slowly growing companies, which stocks contributed most and detracted most from the Fund’s return?
Among slowly growing companies, Royal Bank of Scotland (–87%), Banco Santander (–49%), and ING (–78%) were some of the largest detractors from the Fund’s return. Tokyo Electric Power (+14%), Acom (+73%), and FamilyMart (+38%) were among the few stocks that contributed positively.
The Portfolio of Investments following this report shows the size of the Fund’s positions at period-end.
| | |
| Dryden International Equity Fund | | 7 |
Fees and Expenses (Unaudited)
As a shareholder of the Fund, you incur two types of costs: (1) transaction costs, including sales charges (loads) on purchase payments and redemptions, as applicable, and (2) ongoing costs, including management fees, distribution and/or service (12b-1) fees, and other Fund expenses, as applicable. This example is intended to help you understand your ongoing costs (in dollars) of investing in the Fund and to compare these costs with the ongoing costs of investing in other mutual funds.
The example is based on an investment of $1,000 invested on May 1, 2008, at the beginning of the period, and held through the six-month period ended October 31, 2008. The example is for illustrative purposes only; you should consult the Prospectus for information on initial and subsequent minimum investment requirements.
The Fund’s transfer agent may charge additional fees to holders of certain accounts that are not included in the expenses shown in the table on the following page. These fees apply to individual retirement accounts (IRAs) and Section 403(b) accounts. As of the close of the six-month period covered by the table, IRA fees included an annual maintenance fee of $15 per account (subject to a maximum annual maintenance fee of $25 for all accounts held by the same shareholder). Section 403(b) accounts are charged an annual $25 fiduciary maintenance fee. Some of the fees may vary in amount, or may be waived, based on your total account balance or the number of JennisonDryden funds, including the Fund, that you own. You should consider the additional fees that were charged to your Fund account over the six-month period when you estimate the total ongoing expenses paid over the period and the impact of these fees on your ending account value, as these additional expenses are not reflected in the information provided in the expense table. Additional fees have the effect of reducing investment returns.
Actual Expenses
The first line for each share class in the table on the following page provides information about actual account values and actual expenses. You may use the information on this line, together with the amount you invested, to estimate the expenses that you paid over the period. Simply divide your account value by $1,000 (for example, an $8,600 account value ÷ $1,000 = 8.6), then multiply the result by the number on the first line under the heading “Expenses Paid During the Six-Month Period” to estimate the expenses you paid on your account during this period.
Hypothetical Example for Comparison Purposes
The second line for each share class in the table on the following page provides information about hypothetical account values and hypothetical expenses based on the Fund’s actual expense ratio and an assumed rate of return of 5% per year before expenses, which is not the Fund’s actual return. The hypothetical account values and expenses may
| | |
| 8 | | Visit our website at www.jennisondryden.com |
not be used to estimate the actual ending account balance or expenses you paid for the period. You may use this information to compare the ongoing costs of investing in the Fund and other funds. To do so, compare this 5% hypothetical example with the 5% hypothetical examples that appear in the shareholder reports of the other funds.
Please note that the expenses shown in the table are meant to highlight your ongoing costs only and do not reflect any transactional costs such as sales charges (loads). Therefore, the second line for each share class in the table is useful in comparing ongoing costs only and will not help you determine the relative total costs of owning different funds. In addition, if these transactional costs were included, your costs would have been higher.
| | | | | | | | | | | | | | |
Dryden International
Equity Fund | | Beginning Account
Value
May 1, 2008 | | Ending Account
Value October 31, 2008 | | Annualized
Expense Ratio
Based on the
Six-Month Period | | | Expenses Paid
During the
Six-Month Period* |
| | | | | | | | | | | | | | |
| Class A | | Actual | | $ | 1,000.00 | | $ | 553.60 | | 1.44 | % | | $ | 5.62 |
| | | Hypothetical | | $ | 1,000.00 | | $ | 1,017.90 | | 1.44 | % | | $ | 7.30 |
| | | | | | | | | | | | | | |
| Class B | | Actual | | $ | 1,000.00 | | $ | 551.40 | | 2.14 | % | | $ | 8.35 |
| | | Hypothetical | | $ | 1,000.00 | | $ | 1,014.38 | | 2.14 | % | | $ | 10.84 |
| | | | | | | | | | | | | | |
| Class C | | Actual | | $ | 1,000.00 | | $ | 552.10 | | 2.14 | % | | $ | 8.35 |
| | | Hypothetical | | $ | 1,000.00 | | $ | 1,014.38 | | 2.14 | % | | $ | 10.84 |
| | | | | | | | | | | | | | |
| Class F | | Actual | | $ | 1,000.00 | | $ | 552.60 | | 1.89 | % | | $ | 7.38 |
| | | Hypothetical | | $ | 1,000.00 | | $ | 1,015.63 | | 1.89 | % | | $ | 9.58 |
| | | | | | | | | | | | | | |
| Class L | | Actual | | $ | 1,000.00 | | $ | 552.50 | | 1.64 | % | | $ | 6.40 |
| | | Hypothetical | | $ | 1,000.00 | | $ | 1,016.89 | | 1.64 | % | | $ | 8.31 |
| | | | | | | | | | | | | | |
| Class M | | Actual | | $ | 1,000.00 | | $ | 551.40 | | 2.14 | % | | $ | 8.35 |
| | | Hypothetical | | $ | 1,000.00 | | $ | 1,014.38 | | 2.14 | % | | $ | 10.84 |
| | | | | | | | | | | | | | |
| Class X | | Actual | | $ | 1,000.00 | | $ | 551.40 | | 2.14 | % | | $ | 8.35 |
| | | Hypothetical | | $ | 1,000.00 | | $ | 1,014.38 | | 2.14 | % | | $ | 10.84 |
| | | | | | | | | | | | | | |
| Class Z | | Actual | | $ | 1,000.00 | | $ | 554.30 | | 1.14 | % | | $ | 4.45 |
| | | Hypothetical | | $ | 1,000.00 | | $ | 1,019.41 | | 1.14 | % | | $ | 5.79 |
| | | | | | | | | | | | | | |
* Fund expenses (net of fee waivers or subsidies, if any) for each share class are equal to the annualized expense ratio for each share class (provided in the table), multiplied by the average account value over the period, multiplied by the 184 days in the six-month period ended October 31, 2008, and divided by the 366 days in the Fund’s fiscal year ended October 31, 2008 (to reflect the six-month period). Expenses presented in the table include the expenses of any underlying portfolios in which the Fund may invest.
| | |
| Dryden International Equity Fund | | 9 |
Portfolio of Investments
as of October 31, 2008
| | | | | |
| Shares | | Description | | Value (Note 1) |
| | | | | |
LONG-TERM INVESTMENTS 97.8% | | | |
COMMON STOCKS 97.5% | | | |
| |
Australia 5.2% | | | |
| 32,435 | | Australia & New Zealand Banking Group, Ltd. | | $ | 380,219 |
| 151,171 | | AWB, Ltd. | | | 264,383 |
| 344,030 | | BHP Billiton, Ltd. | | | 6,609,235 |
| 97,252 | | Boart Longyear Group | | | 28,217 |
| 344,874 | | Challenger Financial Services Group, Ltd. | | | 380,267 |
| 57,596 | | Computershare, Ltd. | | | 325,619 |
| 47,688 | | Downer EDI, Ltd. | | | 154,870 |
| 581,531 | | Goodman Fielder, Ltd. | | | 645,360 |
| 449,487 | | Goodman Group | | | 283,592 |
| 162,738 | | Incitec Pivot, Ltd. | | | 436,305 |
| 579,649 | | ING Industrial Fund | | | 131,551 |
| 24,329 | | JB Hi-Fi, Ltd. | | | 142,814 |
| 44,290 | | Macquarie Group, Ltd. | | | 878,672 |
| 993,192 | | Macquarie Communications Infrastructure Group | | | 1,301,811 |
| 136,557 | | Macquarie Office Trust | | | 26,267 |
| 258,990 | | Mirvac Group | | | 169,530 |
| 169,742 | | National Australia Bank, Ltd. | | | 2,754,251 |
| 10,535 | | Nufarm, Ltd. | | | 76,248 |
| 45,814 | | Origin Energy, Ltd. | | | 480,464 |
| 349,046 | | Pacific Brands, Ltd. | | | 234,153 |
| 248,143 | | Qantas Airways, Ltd. | | | 403,049 |
| 30,666 | | Rio Tinto, Ltd. | | | 1,586,438 |
| 117,780 | | TABCORP Holdings, Ltd. | | | 539,977 |
| 74,021 | | Tatts Group, Ltd. | | | 123,959 |
| 164,786 | | Telstra Corp., Ltd. | | | 453,590 |
| 27,441 | | Wesfarmers, Ltd.-PPS | | | 396,112 |
| 109,112 | | Wesfarmers, Ltd. | | | 1,568,109 |
| 172,135 | | Westpac Banking Corp. | | | 2,361,784 |
| 24,929 | | Woodside Petroleum, Ltd. | | | 704,371 |
| 118,224 | | Woolworths, Ltd. | | | 2,203,889 |
| | | | | |
| | | | | 26,045,106 |
| |
Austria 0.6% | | | |
| 45,366 | | Atrium European Real Estate Ltd.(a) | | | 206,267 |
| 8,113 | | Erste Bank der Oesterreichischen Sparkassen AG | | | 216,293 |
| 128,292 | | IMMOFINANZ AG | | | 143,098 |
| 37,424 | | OMV AG | | | 1,197,939 |
| 1,938 | | Rhi AG(a) | | | 30,330 |
| 16,971 | | Verbund - Oesterreichische Elektrizitaetswirtschafts AG (Class A) | | | 802,840 |
See Notes to Financial Statements.
| | |
| Dryden International Equity Fund | | 11 |
Portfolio of Investments
as of October 31, 2008 continued
| | | | | |
| Shares | | Description | | Value (Note 1) |
| | | | | |
COMMON STOCKS (Continued) | | | |
| |
Austria (cont’d.) | | | |
| 12,961 | | Voestalpine AG | | $ | 316,306 |
| | | | | |
| | | | | 2,913,073 |
| |
Belgium 0.6% | | | |
| 13,126 | | Belgacom SA | | | 449,101 |
| 513 | | Colruyt SA NPV | | | 115,300 |
| 91,071 | | Dexia SA | | | 484,390 |
| 226,123 | | Fortis | | | 261,980 |
| 37,789 | | KBC Groep NV | | | 1,624,636 |
| 1,440 | | Tessenderlo Chemie NV | | | 56,965 |
| | | | | |
| | | | | 2,992,372 |
| |
Denmark 1.0% | | | |
| 4,050 | | D/S Norden | | | 122,751 |
| 122,532 | | Danske Bank A/S | | | 1,813,879 |
| 10,100 | | East Asiatic Co., Ltd. A/S | | | 344,395 |
| 5,867 | | FLSmidth & Co. A/S | | | 218,830 |
| 13,475 | | Novo Nordisk A/S (Class B) | | | 722,303 |
| 36,087 | | Vestas Wind Systems A/S(a) | | | 1,478,126 |
| | | | | |
| | | | | 4,700,284 |
| |
Finland 1.3% | | | |
| 29,312 | | Fortum Oyj | | | 720,374 |
| 9,035 | | Kone Oyj (Class B) | | | 202,170 |
| 32,760 | | Konecranes Oyj | | | 556,707 |
| 333,585 | | Nokia Oyj | | | 5,109,923 |
| | | | | |
| | | | | 6,589,174 |
| |
France 10.7% | | | |
| 21,433 | | Air France-KLM | | | 308,800 |
| 41,129 | | Alstom SA | | | 2,038,506 |
| 115,323 | | AXA SA | | | 2,203,137 |
| 55,898 | | BNP Paribas | | | 4,035,911 |
| 21,201 | | Casino Guichard Perrachon SA | | | 1,482,013 |
| 36,006 | | Cie de Saint-Gobain | | | 1,389,358 |
| 103,584 | | Credit Agricole SA | | | 1,498,552 |
| 209,632 | | European Aeronautic Defence and Space Co. NV | | | 3,486,760 |
| 159,877 | | France Telecom SA | | | 4,031,394 |
| 22,931 | | GDF Suez SA | | | 1,020,743 |
| 14,800 | | Lafarge SA | | | 978,393 |
See Notes to Financial Statements.
| | |
| 12 | | Visit our website at www.jennisondryden.com |
| | | | | |
| Shares | | Description | | Value (Note 1) |
| | | | | |
COMMON STOCKS (Continued) | | | |
| |
France (cont’d.) | | | |
| 10,690 | | Lagardere SCA | | $ | 425,035 |
| 71,410 | | Peugeot SA | | | 1,905,567 |
| 6,576 | | PPR | | | 419,092 |
| 11,510 | | Rallye SA | | | 233,126 |
| 52,900 | | Renault SA | | | 1,621,269 |
| 113,156 | | Sanofi-Aventis SA | | | 7,169,243 |
| 37,967 | | Schneider Electric SA | | | 2,275,653 |
| 84,910 | | SCOR SE | | | 1,391,135 |
| 34,034 | | Societe Generale | | | 1,855,025 |
| 3,745 | | Technip SA | | | 112,145 |
| 134,064 | | Total SA | | | 7,375,327 |
| 7,638 | | Unibail-Rodamco | | | 1,145,584 |
| 2,756 | | Vallourec | | | 308,284 |
| 124,487 | | Vivendi | | | 3,253,981 |
| 27,072 | | Wendel | | | 1,293,467 |
| | | | | |
| | | | | 53,257,500 |
| |
Germany 8.7% | | | |
| 37,035 | | Allianz SE | | | 2,786,863 |
| 102,696 | | BASF SE | | | 3,447,593 |
| 36,469 | | Bayer AG | | | 2,039,835 |
| 28,938 | | Bayerische Motoren Werke (BMW) AG | | | 734,739 |
| 153,034 | | Commerzbank AG | | | 1,646,174 |
| 48,945 | | Daimler AG | | | 1,681,517 |
| 77,081 | | Deutsche Bank AG | | | 2,929,391 |
| 5,284 | | Deutsche Boerse AG | | | 415,306 |
| 75,745 | | Deutsche Post AG | | | 829,556 |
| 194,411 | | E.ON AG | | | 7,440,275 |
| 46,753 | | Hannover Rueckversicherung AG | | | 1,159,758 |
| 45,204 | | Hypo Real Estate Holding AG | | | 288,706 |
| 48,943 | | K+S AG | | | 1,903,270 |
| 43,956 | | MAN AG | | | 2,134,744 |
| 16,521 | | Muenchener Rueckversicherungs-Gesellschaft AG | | | 2,188,522 |
| 4,040 | | Porsche AG | | | 356,240 |
| 31,732 | | RWE AG | | | 2,638,763 |
| 14,102 | | Salzgitter AG | | | 927,374 |
| 73,522 | | SAP AG | | | 2,595,075 |
| 49,608 | | Siemens AG | | | 2,980,020 |
| 72,690 | | ThyssenKrupp AG | | | 1,362,115 |
| 1,148 | | Volkswagen AG | | | 694,856 |
See Notes to Financial Statements.
| | |
| Dryden International Equity Fund | | 13 |
Portfolio of Investments
as of October 31, 2008 continued
| | | | | |
| Shares | | Description | | Value (Note 1) |
| | | | | |
COMMON STOCKS (Continued) | | | |
| |
Germany (cont’d.) | | | |
| 3,583 | | Wincor Nixdorf AG | | $ | 155,632 |
| | | | | |
| | | | | 43,336,324 |
| |
Greece 0.3% | | | |
| 74,809 | | OPAP SA | | | 1,633,431 |
| |
Hong Kong 2.1% | | | |
| 263,000 | | BOC Hong Kong Holdings, Ltd. | | | 301,117 |
| 127,000 | | Cheung Kong Infrastructure Holdings, Ltd. | | | 465,193 |
| 64,000 | | Chinese Estates Holdings, Ltd. | | | 49,172 |
| 312,100 | | Esprit Holdings, Ltd. | | | 1,773,383 |
| 75,000 | | Great Eagle Holdings, Ltd. | | | 86,101 |
| 291,000 | | Henderson Land Development Co., Ltd. | | | 1,052,370 |
| 370,000 | | HongKong Electric Holdings, Ltd. | | | 1,994,256 |
| 337,000 | | HongKong Land Holdings, Ltd. | | | 896,420 |
| 106,000 | | Hutchison Telecommunications International Ltd.(a) | | | 114,517 |
| 351,000 | | Hutchison Whampoa, Ltd. | | | 1,896,758 |
| 123,000 | | Hysan Development Co., Ltd. | | | 192,872 |
| 26,000 | | Jardine Matheson Holdings, Ltd. | | | 611,000 |
| 58,500 | | Orient Overseas International, Ltd. | | | 104,466 |
| 91,000 | | Pacific Basin Shipping, Ltd. | | | 48,726 |
| 275,000 | | Wharf Holdings, Ltd. | | | 548,686 |
| 333,000 | | Wheelock & Co., Ltd. | | | 498,851 |
| | | | | |
| | | | | 10,633,888 |
| |
Ireland 0.1% | | | |
| 47,743 | | Allied Irish Banks PLC | | | 254,310 |
| |
Italy 3.8% | | | |
| 7,016 | | Banco Popolare Societa Cooperative | | | 87,524 |
| 716,468 | | Enel SpA | | | 4,793,358 |
| 174,795 | | ENI SpA | | | 4,172,037 |
| 307,216 | | Fiat SpA | | | 2,437,724 |
| 264,845 | | IFIL - Investments SpA | | | 821,094 |
| 161,222 | | Intesa Sanpaolo SpA | | | 478,528 |
| 19,931 | | Italcementi SpA | | | 138,690 |
| 28,484 | | Prysmian SpA | | | 345,541 |
| 52,476 | | Snam Rete Gas SpA | | | 265,641 |
| 798,566 | | Telecom Italia Spa | | | 917,366 |
| 2,050,620 | | Telecom Italia SpA - RNC(a) | | | 1,725,648 |
See Notes to Financial Statements.
| | |
| 14 | | Visit our website at www.jennisondryden.com |
| | | | | |
| Shares | | Description | | Value (Note 1) |
| | | | | |
COMMON STOCKS (Continued) | | | |
| |
Italy (cont’d.) | | | |
| 1,162,161 | | UniCredito Italiano SpA | | $ | 2,844,996 |
| | | | | |
| | | | | 19,028,147 |
| |
Japan 23.1% | | | |
| 60,000 | | 77 Bank Ltd. (The) | | | 282,687 |
| 33,100 | | Aisin Seiki Co., Ltd. | | | 585,721 |
| 124,000 | | Amada Co., Ltd. | | | 569,444 |
| 21,600 | | Asahi Breweries, Ltd. | | | 356,534 |
| 62,000 | | Asahi Glass Co., Ltd. | | | 389,594 |
| 73,600 | | Astellas Pharma, Inc. | | | 2,964,516 |
| 296 | | Central Japan Railway Co. | | | 2,431,512 |
| 608,000 | | Chuo Mitsui Trust Holdings, Inc. | | | 2,398,798 |
| 65,300 | | Credit Saison Co., Ltd. | | | 692,996 |
| 36,600 | | DCM Japan Holdings Co., Ltd. | | | 268,246 |
| 31,100 | | Denso Corp. | | | 606,157 |
| 7,700 | | Don Quijote Co., Ltd. | | | 139,629 |
| 68,900 | | Electric Power Development Co., Ltd. | | | 2,051,352 |
| 36,400 | | Fast Retailing Co., Ltd. | | | 3,880,534 |
| 286 | | Fuji Television Network, Inc. | | | 342,423 |
| 19,000 | | Fujikura, Ltd. | | | 54,453 |
| 489,000 | | Fujitsu, Ltd. | | | 1,922,652 |
| 46,000 | | Hachijuni Bank, Ltd. (The) | | | 225,716 |
| 20,700 | | Heiwa Corp. | | | 142,055 |
| 121,000 | | Hitachi, Ltd. | | | 568,101 |
| 107,000 | | Hokuhoku Financial Group, Inc. | | | 211,733 |
| 137,400 | | Honda Motor Co., Ltd. | | | 3,416,505 |
| 12,700 | | Hosiden Corp. | | | 133,374 |
| 96 | | Inpex Holdings, Inc. | | | 557,318 |
| 16,300 | | Isetan Mitsukoshi Holdings, Ltd. | | | 153,537 |
| 213,000 | | Isuzu Motors, Ltd. | | | 374,227 |
| 38,000 | | IT Holdings Corp.(a) | | | 410,170 |
| 485,000 | | ITOCHU Corp. | | | 2,563,104 |
| 86,400 | | JFE Holdings, Inc. | | | 2,204,529 |
| 83,000 | | JGC Corp. | | | 889,755 |
| 253,000 | | Kajima Corp. | | | 731,787 |
| 75,000 | | Kamigumi Co., Ltd. | | | 596,668 |
| 174,000 | | Kawasaki Kisen Kaisha, Ltd. | | | 689,368 |
| 644 | | KDDI Corp. | | | 3,858,550 |
| 46,000 | | Kinden Corp. | | | 384,087 |
| 149,000 | | Kirin Holdings Co., Ltd. | | | 1,647,971 |
See Notes to Financial Statements.
| | |
| Dryden International Equity Fund | | 15 |
Portfolio of Investments
as of October 31, 2008 continued
| | | | | |
| Shares | | Description | | Value (Note 1) |
| | | | | |
COMMON STOCKS (Continued) | | | |
| |
Japan (cont’d.) | | | |
| 524 | | KK daVinci Holdings(a) | | $ | 42,488 |
| 59,500 | | Komatsu, Ltd. | | | 654,123 |
| 17,000 | | Komori Corp. | | | 194,363 |
| 28,900 | | Konami Corp. | | | 522,826 |
| 27,500 | | Konica Minolta Holdings, Inc. | | | 180,601 |
| 21,100 | | Lawson, Inc. | | | 1,031,291 |
| 73,600 | | Leopalace21 Corp. | | | 547,820 |
| 23,000 | | Lintec Corp. | | | 269,094 |
| 27,000 | | Lion Corp. | | | 176,915 |
| 60,900 | | Makita Corp. | | | 1,104,262 |
| 288,222 | | Marubeni Corp. | | | 1,119,756 |
| 406,000 | | Mazda Motor Corp. | | | 900,434 |
| 24,800 | | Mediceo Paltac Holdings Co., Ltd. | | | 268,717 |
| 116,500 | | Mitsubishi Corp. | | | 1,952,756 |
| 162,000 | | Mitsubishi Electric Corp. | | | 1,004,291 |
| 147,000 | | Mitsubishi Gas Chemical Co., Inc. | | | 540,916 |
| 351,000 | | Mitsubishi Heavy Industries, Ltd. | | | 1,125,432 |
| 98,000 | | Mitsubishi Tanabe Pharma Corp. | | | 1,031,417 |
| 203,800 | | Mitsubishi UFJ Financial Group, Inc. | | | 1,280,714 |
| 59,000 | | Mitsui & Co., Ltd. | | | 571,681 |
| 300,000 | | Mitsui O.S.K. Lines, Ltd. | | | 1,566,574 |
| 21,400 | | Mitsumi Electric Co., Ltd. | | | 281,468 |
| 665 | | Mizuho Financial Group, Inc. | | | 1,623,798 |
| 6,700 | | Nichi-iko Pharmaceutical Co., Ltd. | | | 141,602 |
| 17,000 | | Nichirei Corp. | | | 72,118 |
| 88,000 | | Nikon Corp. | | | 1,240,196 |
| 15,800 | | Nintendo Co., Ltd. | | | 5,076,671 |
| 205,000 | | Nippon Electric Glass Co., Ltd. | | | 1,233,073 |
| 21,000 | | Nippon Meat Packers, Inc. | | | 288,037 |
| 427,000 | | Nippon Oil Corp. | | | 1,752,735 |
| 319,000 | | Nippon Sheet Glass Co., Ltd. | | | 1,043,257 |
| 42,000 | | Nippon Shokubai Co., Ltd. | | | 243,394 |
| 491,000 | | Nippon Steel Corp. | | | 1,652,664 |
| 939 | | Nippon Telegraph & Telephone Corp. | | | 3,831,799 |
| 543,000 | | Nippon Yusen KK | | | 2,625,774 |
| 614,600 | | Nissan Motor Co., Ltd. | | | 3,052,348 |
| 24,000 | | Nisshinbo Industries, Inc. | | | 139,496 |
| 38,100 | | NOK Corp. | | | 362,750 |
| 55,300 | | Nomura Real Estate Holdings, Inc. | | | 1,083,406 |
| 39,753 | | NSK, Ltd. | | | 162,248 |
See Notes to Financial Statements.
| | |
| 16 | | Visit our website at www.jennisondryden.com |
| | | | | |
| Shares | | Description | | Value (Note 1) |
| | | | | |
COMMON STOCKS (Continued) | | | |
| |
Japan (cont’d.) | | | |
| 57,000 | | Onward Holdings Co., Ltd. | | $ | 416,902 |
| 327,000 | | Panasonic Corp. | | | 5,265,923 |
| 11,000 | | Pioneer Corp. | | | 32,630 |
| 2,260 | | Resona Holdings, Inc. | | | 2,369,902 |
| 121,000 | | Ricoh Co., Ltd. | | | 1,302,204 |
| 9,600 | | Sankyo Co., Ltd. | | | 427,137 |
| 127,000 | | Sanwa Holdings Corp. | | | 421,332 |
| 60 | | Sapporo Hokuyo Holdings, Inc. | | | 258,766 |
| 866 | | SBI Holdings, Inc. | | | 103,921 |
| 10,300 | | Seiko Epson Corp. | | | 154,691 |
| 72,000 | | Sekisui House, Ltd. | | | 721,983 |
| 47,200 | | Seven & I Holdings Co., Ltd. | | | 1,325,280 |
| 3,270 | | SFCG Co., Ltd. | | | 35,782 |
| 86,000 | | Shimadzu Corp. | | | 588,467 |
| 6,800 | | Shin-Etsu Chemical Co., Ltd. | | | 361,457 |
| 50,000 | | Shionogi & Co., Ltd. | | | 850,982 |
| 11,500 | | Showa Shell Sekiyu K.K. | | | 93,947 |
| 19,800 | | Sony Corp. | | | 469,267 |
| 9,500 | | Stanley Electric Co., Ltd. | | | 119,438 |
| 10,600 | | Sumisho Computer Systems Corp. | | | 165,512 |
| 258,200 | | Sumitomo Corp. | | | 2,271,654 |
| 42 | | Sumitomo Mitsui Financial Group, Inc. | | | 168,372 |
| 28,300 | | Suzuken Co., Ltd. | | | 604,674 |
| 37,000 | | Takeda Chemical Industries, Ltd. | | | 1,838,353 |
| 44,150 | | Takefuji Corp. | | | 354,952 |
| 21,500 | | Terumo Corp. | | | 896,055 |
| 31,800 | | Tokio Marine Holdings, Inc. | | | 980,899 |
| 39,700 | | Tokyo Electric Power Co., Inc. (The) | | | 1,124,324 |
| 281,000 | | Tokyo Tatemono Co., Ltd. | | | 1,157,498 |
| 45,000 | | Tokyu Land Corp. | | | 127,352 |
| 97,000 | | Toppan Printing Co., Ltd. | | | 713,234 |
| 113,000 | | Tosoh Corp. | | | 225,329 |
| 34,800 | | Toyota Boshoku Corp. | | | 310,412 |
| 135,534 | | Toyota Motor Corp. | | | 5,292,728 |
| 6,500 | | UNI-CHARM Corp. | | | 466,206 |
| 14,900 | | Yamaha Motor Co., Ltd. | | | 164,734 |
| 22,400 | | Yamato Kogyo Co., Ltd. | | | 529,396 |
| 46,000 | | Yaskawa Electric Corp. | | | 201,866 |
| | | | | |
| | | | | 114,602,669 |
See Notes to Financial Statements.
| | |
| Dryden International Equity Fund | | 17 |
Portfolio of Investments
as of October 31, 2008 continued
| | | | | |
| Shares | | Description | | Value (Note 1) |
| | | | | |
COMMON STOCKS (Continued) | | | |
| |
Luxembourg 0.5% | | | |
| 95,878 | | ArcelorMittal | | $ | 2,493,731 |
| |
Netherlands 1.7% | | | |
| 274,495 | | Aegon NV | | | 1,140,573 |
| 8,979 | | Akzo Nobel NV | | | 373,222 |
| 12,745 | | Heineken Holding NV | | | 386,919 |
| 365,508 | | ING Groep NV | | | 3,428,596 |
| 25,902 | | Koninklijke Ahold NV | | | 278,068 |
| 84,927 | | Koninklijke DSM NV | | | 2,365,082 |
| 11,981 | | Randstad Holdings NV | | | 232,884 |
| | | | | |
| | | | | 8,205,344 |
| |
Norway 1.0% | | | |
| 274,009 | | DnB NOR ASA | | | 1,587,974 |
| 65,900 | | Petroleum Geo-Services ASA(a) | | | 328,143 |
| 74,350 | | StatoilHydro ASA | | | 1,495,448 |
| 78,750 | | Yara International ASA | | | 1,645,261 |
| | | | | |
| | | | | 5,056,826 |
| |
Portugal 0.5% | | | |
| 256,292 | | Banco BPI SA | | | 528,189 |
| 75,352 | | Banco Espirito Santo SA | | | 717,442 |
| 62,411 | | Jeronimo Martins SGPS SA | | | 318,497 |
| 177,407 | | Portugal Telecom SGPS SA | | | 1,166,811 |
| | | | | |
| | | | | 2,730,939 |
| |
Singapore 1.0% | | | |
| 70,000 | | DBS Group Holdings, Ltd. | | | 534,345 |
| 10,000 | | Jardine Strategic Holdings, Ltd. | | | 119,400 |
| 156,000 | | SembCorp Marine, Ltd. | | | 193,858 |
| 167,000 | | Singapore Petroleum Co., Ltd. | | | 238,165 |
| 158,000 | | United Overseas Bank, Ltd. | | | 1,428,439 |
| 1,285,000 | | Wilmar International, Ltd. | | | 2,222,244 |
| | | | | |
| | | | | 4,736,451 |
| |
Spain 4.6% | | | |
| 26,921 | | ACS Actividades de Construccion y Servicios SA | | | 999,544 |
| 268,684 | | Banco Bilbao Vizcaya Argentaria SA | | | 3,118,434 |
| 663,965 | | Banco Santander SA | | | 7,180,891 |
| 9,296 | | Banco Santander SA | | | 102,142 |
See Notes to Financial Statements.
| | |
| 18 | | Visit our website at www.jennisondryden.com |
| | | | | |
| Shares | | Description | | Value (Note 1) |
| | | | | |
COMMON STOCKS (Continued) | | | |
| |
Spain (cont’d.) | | | |
| 9,032 | | Corporacion Financiera | | $ | 266,075 |
| 49,070 | | Gas Natural SDG SA | | | 1,510,270 |
| 179,725 | | Iberdrola SA | | | 1,300,733 |
| 362,509 | | Mapfre SA | | | 1,153,696 |
| 120,331 | | Repsol YPF SA | | | 2,288,203 |
| 277,149 | | Telefonica SA | | | 5,131,400 |
| | | | | |
| | | | | 23,051,388 |
| |
Sweden 1.3% | | | |
| 55,371 | | Alfa Laval AB | | | 399,718 |
| 71,400 | | Atlas Copco AB (Class A) | | | 598,847 |
| 56,300 | | Boliden AB | | | 135,417 |
| 29,800 | | Eniro AB | | | 69,046 |
| 2,847 | | Hennes & Mauritz AB (Class B) | | | 102,092 |
| 109,000 | | Investor AB (Class B) | | | 1,643,872 |
| 10,376 | | Oriflame Cosmetics SA | | | 324,162 |
| 145,187 | | Skandinaviska Enskilda Banken AB (Class A) | | | 1,438,900 |
| 92,800 | | Swedbank AB (Class A) | | | 766,892 |
| 52,225 | | Swedish Match AB | | | 725,242 |
| 15,400 | | Trelleborg AB (Class B) | | | 92,060 |
| | | | | |
| | | | | 6,296,248 |
| |
Switzerland 8.2% | | | |
| 14,311 | | ABB, Ltd. | | | 187,776 |
| 3,228 | | Actelion Ltd.(a) | | | 170,528 |
| 72,185 | | Credit Suisse Group AG | | | 2,699,277 |
| 336 | | Galenica AG | | | 101,596 |
| 429 | | Lindt & Spruengli AG | | | 922,917 |
| 210,541 | | Nestle SA | | | 8,187,306 |
| 200,568 | | Novartis AG | | | 10,180,433 |
| 6,167 | | Pargesa Holding SA | | | 472,406 |
| 4,978 | | Petroplus Holdings AG | | | 132,539 |
| 21,482 | | Roche Holding AG | | | 3,285,175 |
| 47,629 | | Swatch Group AG (The) | | | 1,363,865 |
| 5,655 | | Swiss Life Holding | | | 509,550 |
| 64,952 | | Swiss Reinsurance Co. | | | 2,708,737 |
| 1,434 | | Swisscom AG | | | 438,175 |
| 6,989 | | Syngenta AG | | | 1,306,477 |
| 19,207 | | Synthes, Inc. | | | 2,478,518 |
| 31,082 | | UBS AG | | | 527,377 |
See Notes to Financial Statements.
| | |
| Dryden International Equity Fund | | 19 |
Portfolio of Investments
as of October 31, 2008 continued
| | | | | |
| Shares | | Description | | Value (Note 1) |
| | | | | |
COMMON STOCKS (Continued) | | | |
| |
Switzerland (cont’d.) | | | |
| 24,910 | | Zurich Financial Services AG | | $ | 5,053,682 |
| | | | | |
| | | | | 40,726,334 |
| |
United Kingdom 21.2% | | | |
| 36,969 | | 3i Group PLC | | | 322,462 |
| 146,043 | | AstraZeneca PLC | | | 6,189,076 |
| 216,554 | | Aviva PLC | | | 1,291,746 |
| 365,471 | | BAE Systems PLC | | | 2,054,297 |
| 41,306 | | Balfour Beatty PLC | | | 166,920 |
| 846,213 | | Barclays PLC | | | 2,425,738 |
| 116,838 | | BHP Billiton PLC | | | 1,983,971 |
| 1,280,723 | | BP PLC | | | 10,439,782 |
| 39,244 | | Brit Insurance Holdings PLC | | | 115,414 |
| 56,679 | | British American Tobacco PLC | | | 1,554,664 |
| 26,974 | | British Land Co., PLC | | | 268,973 |
| 875,806 | | BT Group PLC | | | 1,645,679 |
| 352,384 | | Centrica PLC | | | 1,731,550 |
| 96,441 | | Charter International PLC | | | 628,589 |
| 74,689 | | Close Brothers Group PLC | | | 649,895 |
| 17,463 | | Cookson Group PLC | | | 56,529 |
| 224,618 | | Diageo PLC | | | 3,427,783 |
| 71,983 | | Drax Group PLC | | | 668,885 |
| 72,799 | | G4S PLC | | | 220,486 |
| 338,644 | | GlaxoSmithKline PLC | | | 6,510,072 |
| 78,171 | | GUS PLC | | | 431,111 |
| 606,162 | | HBOS PLC | | | 992,546 |
| 507,232 | | Home Retail Group PLC | | | 1,616,685 |
| 506,712 | | HSBC Holdings PLC | | | 6,001,601 |
| 175,513 | | Imperial Tobacco Group PLC | | | 4,704,011 |
| 19,363 | | Inchcape PLC | | | 24,689 |
| 48,031 | | International Power PLC | | | 171,831 |
| 158,598 | | Invensys PLC(a) | | | 397,701 |
| 1,145,177 | | Legal & General Group PLC | | | 1,317,058 |
| 865,685 | | Lloyds TSB Group PLC | | | 2,797,983 |
| 125,473 | | Logica PLC | | | 139,682 |
| 40,995 | | Millennium & Copthorne Hotels PLC | | | 139,725 |
| 147,309 | | Mondi PLC | | | 534,637 |
| 117,600 | | National Grid PLC | | | 1,324,776 |
| 21,050 | | Next PLC | | | 357,787 |
| 610,152 | | Old Mutual PLC | | | 494,083 |
See Notes to Financial Statements.
| | |
| 20 | | Visit our website at www.jennisondryden.com |
| | | | | |
| Shares | | Description | | Value (Note 1) |
| | | | | |
COMMON STOCKS (Continued) | | | |
| |
United Kingdom (cont’d.) | | | |
| 214,706 | | Prudential PLC | | $ | 1,078,540 |
| 104,382 | | Reckitt Benckiser Group PLC | | | 4,415,334 |
| 93,500 | | Rio Tinto PLC | | | 4,367,582 |
| 2,080,886 | | Royal Bank of Scotland Group PLC | | | 2,292,129 |
| 193,969 | | Royal Dutch Shell PLC (Class A) | | | 5,329,244 |
| 269,534 | | Royal Dutch Shell PLC (Class B) | | | 7,307,537 |
| 83,621 | | RSA Insurance Group PLC | | | 185,959 |
| 77,473 | | Scottish & Southern Energy PLC | | | 1,518,602 |
| 28,947 | | Shire Ltd. | | | 379,310 |
| 45,695 | | Smith & Nephew PLC | | | 418,398 |
| 20,849 | | Southern Cross Healthcare, Ltd. | | | 31,901 |
| 33,300 | | Standard Life PLC | | | 128,905 |
| 459,912 | | Taylor Wimpey PLC | | | 75,050 |
| 328,974 | | Tesco PLC | | | 1,802,483 |
| 81,231 | | Trinity Mirror PLC | | | 45,633 |
| 126,408 | | Unilever PLC | | | 2,839,858 |
| 4,652,536 | | Vodafone Group PLC | | | 8,950,148 |
| 49,875 | | William Hill PLC | | | 153,350 |
| 54,669 | | WPP Group PLC | | | 327,016 |
| 55,210 | | Yell Group PLC | | | 54,794 |
| | | | | |
| | | | | 105,500,190 |
| | | | | |
| | Total common stocks
(cost $767,431,662) | | | 484,783,729 |
| | | | | |
PREFERRED STOCKS 0.3% |
|
Germany 0.2% |
| 7,850 | | Bayerische Motoren Werke (BMW) AG | | | 156,538 |
| 3,784 | | RWE AG | | | 235,286 |
| 10,140 | | Volkswagen AG | | | 643,208 |
| | | | | |
| | | | | 1,035,032 |
|
Italy 0.1% |
| 42,429 | | Istituto Finanziario Industriale SpA(a) | | | 370,443 |
| | | | | |
| | Total preferred stocks
(cost $3,156,594) | | | 1,405,475 |
| | | | | |
See Notes to Financial Statements.
| | |
| Dryden International Equity Fund | | 21 |
Portfolio of Investments
as of October 31, 2008 continued
| | | | | |
| Shares | | Description | | Value (Note 1) |
| | | | | |
RIGHTS | | | | | |
| | |
Belgium | | | | | |
| 96,203 | | Fortis (cost $0)(a) | | $ | 0 |
| | | | | |
| | Total long-term investments
(cost $770,588,256) | | | 486,189,204 |
| | | | | |
| | |
Principal
Amount (000) | | | | |
SHORT-TERM INVESTMENTS 0.8% | | | |
United States Government Security 0.5% | | | |
| |
United States | | | |
| $ 2,500 | | United States Treasury Bills, .25%, 12/18/2008(b)(c)
(cost $2,499,184) | | | 2,498,647 |
| | | | | |
| | |
| Shares | | | | |
| |
Affiliated Money Market Mutual Fund 0.3% | | | |
| 1,380,836 | | Dryden Core Investment Fund - Taxable Money Market Series(d)
(cost $1,380,836) | | | 1,380,836 |
| | | | | |
| | Total short-term investments
(cost $3,880,020) | | | 3,879,483 |
| | | | | |
| | Total Investments(f) 98.6%
(cost $774,468,276; Note 5) | | | 490,068,687 |
| | Other assets in excess of liabilities(e) 1.4% | | | 6,957,570 |
| | | | | |
| | Net Assets 100.0% | | $ | 497,026,257 |
| | | | | |
The following abbreviation was used in portfolio descriptions:
PPS—Partially Protected Shares
| (a) | Non-income producing security. |
| (b) | Rate quoted represents yield-to-maturity as of purchase date. |
| (c) | All or portion of security segregated as collateral for financial futures contracts. |
| (d) | Prudential Investments LLC, the manager of the Fund also serves as the manager of the Dryden Core Investment Fund - Taxable Money Market Series. |
See Notes to Financial Statements.
| | |
| 22 | | Visit our website at www.jennisondryden.com |
| (e) | Other assets in excess of liabilities included net unrealized depreciation on financial futures as follows: |
Open future contracts outstanding at October 31, 2008:
| | | | | | | | | | | | | | |
Number of
Contracts | | Type | | Expiration
Date | | Value at
October 31,
2008 | | Value at
Trade
Date | | Unrealized
Appreciation
(Depreciation) | |
| | Long Positions: | | | | | | | | | | | | |
| 3 | | Hang Seng Stock Index | | Nov. 08 | | $ | 269,611 | | $ | 242,648 | | $ | 26,963 | |
| 94 | | Nikkei 225 | | Dec. 08 | | | 4,199,450 | | | 4,721,759 | | | (522,309 | ) |
| 134 | | DJ Euro Stoxx 50 Index | | Dec. 08 | | | 4,426,873 | | | 4,648,432 | | | (221,559 | ) |
| 13 | | SPI 200 Futures Index | | Dec. 08 | | | 871,689 | | | 1,038,702 | | | (167,013 | ) |
| 39 | | FTSE 100 Index | | Dec. 08 | | | 2,748,145 | | | 2,776,390 | | | (28,245 | ) |
| | | | | | | | | | | | | | |
| | | | | | | | | | | | $ | (912,163 | ) |
| | | | | | | | | | | | | | |
| (f) | As of October 31, 2008, 361 securities representing $482,885,771 and 97.2% of the total market value was fair valued in accordance with the policies adopted by the Board of Directors. |
The industry classification of portfolio holdings and other assets in excess of liabilities shown as a percentage of net assets as of October 31, 2008 was as follows:
| | | |
Commercial Banks | | 13.8 | % |
Oil, Gas & Consumable Fuels | | 8.8 | |
Pharmaceuticals | | 8.7 | |
Insurance | | 5.2 | |
Metals & Mining | | 5.0 | |
Automobiles | | 4.7 | |
Electric Utilities | | 4.1 | |
Diversified Telecommunication Services | | 4.0 | |
Food Products | | 3.1 | |
Chemicals | | 2.7 | |
Wireless Telecommunication Services | | 2.6 | |
Food & Staples Retailing | | 2.2 | |
Software | | 1.7 | |
Trading Companies & Distributors | | 1.7 | |
Machinery | | 1.7 | |
Capital Markets | | 1.6 | |
Diversified Financial Services | | 1.6 | |
Household Durables | | 1.5 | |
Electrical Equipment | | 1.5 | |
Industrial Conglomerates | | 1.4 | |
Multi-Utilities | | 1.4 | |
Real Estate Management & Development | | 1.3 | |
Beverages | | 1.2 | |
Specialty Retail | | 1.2 | |
Aerospace & Defense | | 1.1 | |
See Notes to Financial Statements.
| | |
| Dryden International Equity Fund | | 23 |
Portfolio of Investments
as of October 31, 2008 continued
| | | |
Communications Equipment | | 1.0 | % |
Household Products | | 1.0 | |
Marine | | 1.0 | |
Media | | 0.9 | |
Health Care Equipment & Supplies | | 0.7 | |
Building Products | | 0.7 | |
Construction & Engineering | | 0.7 | |
Independent Power Producers & Energy Traders | | 0.6 | |
Electronic Equipment & Instruments | | 0.6 | |
Hotels, Restaurants & Leisure | | 0.5 | |
Computers & Peripherals | | 0.5 | |
Road & Rail | | 0.5 | |
Tobacco | | 0.5 | |
U.S Government Security | | 0.5 | |
Auto Components | | 0.4 | |
Leisure Equipment & Products | | 0.4 | |
Real Estate Investment Trusts (REITs) | | 0.4 | |
Textiles, Apparel & Luxury Goods | | 0.4 | |
Transportation Infrastructure | | 0.4 | |
Gas Utilities | | 0.4 | |
Internet & Catalog Retail | | 0.3 | |
Affiliated Money Market Mutual Fund | | 0.3 | |
Office Electronics | | 0.3 | |
Construction Materials | | 0.2 | |
Commercial Services & Supplies | | 0.2 | |
Consumer Finance | | 0.2 | |
Multiline Retail | | 0.2 | |
Air Freight & Logistics | | 0.2 | |
Health Care Providers & Services | | 0.2 | |
IT Services | | 0.2 | |
Airlines | | 0.1 | |
Paper & Forest Products | | 0.1 | |
Personal Products | | 0.1 | |
Professional Services | | 0.1 | |
Energy Equipment & Services | | 0.1 | |
Distributors | | 0.1 | |
| | | |
| | 98.6 | |
Other assets in excess of liabilities | | 1.4 | |
| | | |
| | 100.0 | % |
| | | |
See Notes to Financial Statements.
| | |
| 24 | | Visit our website at www.jennisondryden.com |
Financial Statements
| | |
| OCTOBER 31, 2008 | | ANNUAL REPORT |
Dryden International Equity Fund
Statement of Assets and Liabilities
as of October 31, 2008
| | | | |
Assets | | | | |
Investments, at value: | | | | |
Unaffiliated investments (cost $773,087,440) | | $ | 488,687,851 | |
Affiliated investments (cost $1,380,836) | | | 1,380,836 | |
Foreign currency, at value (cost $1,644,128) | | | 1,625,427 | |
Receivables for investments sold | | | 15,469,736 | |
Dividends receivable | | | 1,719,835 | |
Foreign tax reclaim receivable | | | 1,460,019 | |
Receivable for Series shares sold | | | 195,610 | |
Due from broker—variation margin | | | 189,370 | |
Prepaid expenses | | | 44,609 | |
| | | | |
Total assets | | | 510,773,293 | |
| | | | |
| |
Liabilities | | | | |
Payable for investments purchased | | | 11,623,018 | |
Payable for Series shares reacquired | | | 953,922 | |
Accrued expenses | | | 465,749 | |
Management fee payable | | | 363,707 | |
Affiliated transfer agent fee payable | | | 187,953 | |
Distribution fee payable | | | 133,643 | |
Deferred directors’ fees | | | 12,302 | |
Payable to custodian | | | 6,742 | |
| | | | |
Total liabilities | | | 13,747,036 | |
| | | | |
| |
Net Assets | | $ | 497,026,257 | |
| | | | |
| | | | | |
Net assets were comprised of: | | | | |
Common stock, at par | | $ | 1,038,232 | |
Paid-in capital in excess of par | | | 984,049,362 | |
| | | | |
| | | 985,087,594 | |
Undistributed net investment income | | | 16,092,486 | |
Accumulated net realized loss on investments and foreign currency transactions | | | (218,798,858 | ) |
Net unrealized depreciation on investments and foreign currencies | | | (285,354,965 | ) |
| | | | |
Net assets, October 31, 2008 | | $ | 497,026,257 | |
| | | | |
See Notes to Financial Statements.
| | |
| 26 | | Visit our website at www.jennisondryden.com |
| | | |
Class A | | | |
Net asset value and redemption price per share
($246,233,578 ÷ 51,342,254 shares of common stock issued and outstanding) | | $ | 4.80 |
Maximum sales charge (5.50% of offering price) | | | .28 |
| | | |
Maximum offering price to public | | $ | 5.08 |
| | | |
| |
Class B | | | |
Net asset value, offering price and redemption price per share
($11,205,088 ÷ 2,431,120 shares of common stock issued and outstanding) | | $ | 4.61 |
| | | |
| |
Class C | | | |
Net asset value, offering price and redemption price per share
($28,857,903 ÷ 6,264,191 shares of common stock issued and outstanding) | | $ | 4.61 |
| | | |
| |
Class F | | | |
Net asset value, offering price and redemption price per share
($8,170,844 ÷ 1,770,325 shares of common stock issued and outstanding) | | $ | 4.62 |
| | | |
| |
Class L | | | |
Net asset value and redemption price per share
($12,620,533 ÷ 2,633,213 shares of common stock issued and outstanding) | | $ | 4.79 |
Maximum sales charge (5.75% of offering price) | | | .29 |
| | | |
Maximum offering price to public | | $ | 5.08 |
| | | |
| |
Class M | | | |
Net asset value, offering price and redemption price per share
($11,467,031 ÷ 2,488,140 shares of common stock issued and outstanding) | | $ | 4.61 |
| | | |
| |
Class X | | | |
Net asset value, offering price and redemption price per share
($8,597,026 ÷ 1,865,334 shares of common stock issued and outstanding) | | $ | 4.61 |
| | | |
| |
Class Z | | | |
Net asset value, offering price and redemption price per share
($169,874,254 ÷ 35,028,639 shares of common stock issued and outstanding) | | $ | 4.85 |
| | | |
See Notes to Financial Statements.
| | |
| Dryden International Equity Fund | | 27 |
Statement of Operations
Year Ended October 31, 2008
| | | | |
Net Investment Income | | | | |
Income | | | | |
Unaffiliated dividends (net of foreign withholding taxes of $3,253,833) | | $ | 29,908,203 | |
Interest | | | 113,226 | |
Affiliated dividend income | | | 47,557 | |
| | | | |
Total income | | | 30,068,986 | |
| | | | |
| |
Expenses | | | | |
Management fee | | | 7,028,532 | |
Distribution fee—Class A | | | 1,234,770 | |
Distribution fee—Class B | | | 227,836 | |
Distribution fee—Class C | | | 551,045 | |
Distribution fee—Class F | | | 137,304 | |
Distribution fee—Class L | | | 124,695 | |
Distribution fee—Class M | | | 343,141 | |
Distribution fee—Class X | | | 178,614 | |
Transfer agent’s fees and expenses (including affiliated expense of $1,033,200) | | | 2,169,000 | |
Custodian’s fees and expenses | | | 452,000 | |
Reports to shareholders | | | 390,000 | |
Registration fees | | | 100,000 | |
Legal fees and expenses | | | 40,000 | |
Directors’ fees | | | 37,000 | |
Audit fee | | | 28,000 | |
Insurance | | | 19,000 | |
Loan interest expense (Note 7) | | | 6,190 | |
Miscellaneous | | | 48,245 | |
| | | | |
Total expenses | | | 13,115,372 | |
| | | | |
Net investment income | | | 16,953,614 | |
| | | | |
| |
Realized And Unrealized Loss On Investments, Futures And Foreign Currency Transactions | | | | |
Net realized loss on: | | | | |
Investment transactions | | | (46,029,116 | ) |
Foreign currency transactions | | | (193,098 | ) |
Financial futures transactions | | | (8,994,599 | ) |
| | | | |
| | | (55,216,813 | ) |
| | | | |
Net change in unrealized appreciation (depreciation) on: | | | | |
Investments | | | (529,497,151 | ) |
Foreign currencies | | | (546,653 | ) |
Financial futures contracts | | | (2,188,305 | ) |
| | | | |
| | | (532,232,109 | ) |
| | | | |
Net loss on investments and foreign currency transactions | | | (587,448,922 | ) |
| | | | |
Net Decrease In Net Assets Resulting From Operations | | $ | (570,495,308 | ) |
| | | | |
See Notes to Financial Statements.
| | |
| 28 | | Visit our website at www.jennisondryden.com |
Statement of Changes in Net Assets
| | | | | | | | |
| | | Year Ended October 31, | |
| | | 2008 | | | 2007 | |
Increase (Decrease) In Net Assets | | | | | | | | |
Operations | | | | | | | | |
Net investment income | | $ | 16,953,614 | | | $ | 14,623,033 | |
Net realized gain (loss) on investments and foreign currency transactions | | | (55,216,813 | ) | | | 181,490,323 | |
Net change in unrealized appreciation (depreciation) on investments and foreign currencies | | | (532,232,109 | ) | | | 9,386,930 | |
| | | | | | | | |
Net increase (decrease) in net assets resulting from operations | | | (570,495,308 | ) | | | 205,500,286 | |
| | | | | | | | |
Dividends from net investment income (Note 1) | | | | | | | | |
Class A | | | (7,314,517 | ) | | | (1,073,236 | ) |
Class B | | | (199,992 | ) | | | (374,594 | ) |
Class C | | | (472,516 | ) | | | (114,787 | ) |
Class F | | | (224,776 | ) | | | — | |
Class L | | | (345,613 | ) | | | — | |
Class M | | | (386,635 | ) | | | — | |
Class X | | | (157,564 | ) | | | — | |
Class Z | | | (5,444,485 | ) | | | (4,300,460 | ) |
| | | | | | | | |
| | | (14,546,098 | ) | | | (5,863,077 | ) |
| | | | | | | | |
Dividends from net realized gains (Note 1) | | | | | | | | |
Class A | | | (18,226,674 | ) | | | — | |
Class B | | | (1,047,055 | ) | | | — | |
Class C | | | (2,473,843 | ) | | | — | |
Class F | | | (880,589 | ) | | | — | |
Class L | | | (1,091,678 | ) | | | — | |
Class M | | | (2,024,217 | ) | | | — | |
Class X | | | (824,920 | ) | | | — | |
Class Z | | | (11,586,026 | ) | | | — | |
| | | | | | | | |
| | | (38,155,002 | ) | | | — | |
| | | | | | | | |
| | |
Series share transactions (Net of share conversions) (Note 6) | | | | | | | | |
Net proceeds from shares sold | | | 105,324,246 | | | | 165,224,236 | |
Net asset value of shares issued in connection with merger (Note 8) | | | — | | | | 638,140,587 | |
Net asset value of shares issued in reinvestment of dividends | | | 50,789,048 | | | | 5,775,611 | |
Cost of shares reacquired | | | (212,287,955 | ) | | | (203,229,861 | ) |
| | | | | | | | |
Net increase (decrease) in net assets from Series share transactions | | | (56,174,661 | ) | | | 605,910,573 | |
| | | | | | | | |
Total increase (decrease) | | | (679,371,069 | ) | | | 805,547,782 | |
| | |
Net Assets | | | | | | | | |
Beginning of year | | | 1,176,397,326 | | | | 370,849,544 | |
| | | | | | | | |
End of year(a) | | $ | 497,026,257 | | | $ | 1,176,397,326 | |
| | | | | | | | |
(a) Includes undistributed net investment income of: | | $ | 16,092,486 | | | $ | 13,689,008 | |
| | | | | | | | |
See Notes to Financial Statements.
| | |
| Dryden International Equity Fund | | 29 |
Notes to Financial Statements
Prudential World Fund, Inc. (the “Fund”) is registered under the Investment Company Act of 1940, as an open-end, diversified management investment company and currently consists of three series: Dryden International Equity Fund (the “Series”), Dryden International Value Fund and Jennison Global Infrastructure Fund. These financial statements relate to the Dryden International Equity Fund. The financial statements of the other series are not presented herein. The Series commenced investment operations in March 2000. The investment objective of the Series is to achieve long-term growth of capital. The Series seeks to achieve its objective primarily through investment in equity-related securities of foreign issuers.
Note 1. Accounting Policies
The following is a summary of significant accounting policies followed by the Fund and the Series in the preparation of its financial statements.
Securities Valuation: Securities listed on a securities exchange (other than options on securities and indices) are valued at the last sale price on such exchange on the day of valuation or, if there was no sale on such day, at the mean between the last reported bid and asked prices, or at the last bid price on such day in the absence of an asked price. Securities traded via Nasdaq are valued at the official closing price provided by Nasdaq. Securities that are actively traded in the over-the-counter market, including listed securities for which the primary market is believed by Prudential Investments LLC (“PI” or “Manager”), in consultation with the subadvisers, to be over-the-counter, are valued at market value using prices provided by an independent pricing agent or principal market maker. Options on securities and indices traded on an exchange are valued at the last sale price as of the close of trading on the applicable exchange or, if there was no sale, at the mean between the most recently quoted bid and asked prices on such exchange. Futures contracts and options thereon traded on a commodities exchange or board of trade are valued at the last sale price at the close of trading on such exchange or board of trade or, if there was no sale on the applicable commodities exchange or board of trade on such day, at the mean between the most recently quoted bid and asked prices on such exchange or board of trade or at the last bid price in the absence of an asked price. Prices may be obtained from independent pricing services which use information provided by market makers or estimates of market values obtained from yield data relating to investments or securities with similar characteristics. Securities for which reliable market quotations are not readily available, or whose values have been
| | |
| 30 | | Visit our website at www.jennisondryden.com |
affected by events occurring after the close of the security’s foreign market and before the Funds’ normal pricing time, are valued at fair value in accordance with the Board of Directors’ approved fair valuation procedures. When determining the fair valuation of securities some of the factors influencing the valuation include, the nature of any restrictions on disposition of the securities; assessment of the general liquidity of the securities; the issuer’s financial condition and the markets in which it does business; the cost of the investment; the size of the holding and the capitalization of issuer; the prices of any recent transactions or bids/offers for such securities or any comparable securities; any available analyst media or other reports or information deemed reliable by the investment adviser regarding the issuer or the markets or industry in which it operates. Using fair value to price securities may result in a value that is different from a security’s most recent closing price and from the price used by other mutual funds to calculate their net asset values.
Investments in mutual funds are valued at their net asset value as of the close of the New York Stock Exchange on the date of valuation.
Short-term securities which mature in 60 days or less are valued at amortized cost, which approximates market value. The amortized cost method includes valuing a security at its cost on the date of purchase and thereafter assuming a constant amortization to maturity of the difference between the principal amount due at maturity and cost. Short-term debt securities that mature in more than 60 days are valued at current market quotations.
Foreign Currency Translation: The books and records of the Series are maintained in U.S. dollars. Foreign currency amounts are translated into U.S. dollars on the following basis:
(i) market value of investment securities, other assets and liabilities-at the current rates of exchange.
(ii) purchases and sales of investment securities, income and expenses-at the rate of exchange prevailing on the respective dates of such transactions.
The Series does not isolate that portion of the results of operations arising as a result of changes in the foreign exchange rates from the fluctuations arising from changes in the market prices of long term securities held at the end of the fiscal year. Similarly, the Series does not isolate the effect of changes in foreign exchange rates from the fluctuations arising from changes in the market prices of portfolio securities sold during the fiscal year. Accordingly, realized foreign currency gains or losses are included in the reported net realized gains or losses on investment transactions.
| | |
| Dryden International Equity Fund | | 31 |
Notes to Financial Statements
continued
Net realized gains or losses on foreign currency transactions represent net foreign exchange gains or losses from holdings of foreign currencies, currency gains or losses realized between the trade and settlement dates on security transactions, and the difference between the amounts of dividends, interest and foreign withholding taxes recorded on the Series’ books and the U.S. dollar equivalent amounts actually received or paid. Net unrealized currency gains or losses from valuing foreign currency denominated assets and liabilities (other than investments) at fiscal year end exchange rates are reflected as a component of net unrealized appreciation (depreciation) on foreign currencies.
Foreign security and currency transactions may involve certain considerations and risks not typically associated with those of domestic origin as a result of, among other factors, the possibility of political or economic instability, or the level of governmental supervision and regulation of foreign securities markets.
Securities Transactions and Net Investment Income: Securities transactions are recorded on the trade date. Realized gains or losses from security and currency transactions are calculated on the identified cost basis. Dividend income is recorded on the ex-dividend date and interest income is recorded on an accrual basis. Expenses are recorded on the accrual basis.
Net investment income or loss (other than distribution fees which are charged directly to the respective class) and unrealized and realized gains or losses are allocated daily to each class of shares based upon the relative proportion of net assets of each class at the beginning of the day.
Financial Futures Contracts: A financial futures contract is an agreement to purchase (long) or sell (short) an agreed amount of securities at a set price for delivery on a future date. Upon entering into a financial futures contract, the Series is required to pledge to the broker an amount of cash and/or other assets equal to a certain percentage of the contract amount. This amount is known as the “initial margin.” Subsequent payments, known as “variation margin,” are made or received by the Series each day, depending on the daily fluctuations in the value of the underlying security. Such variation margin is recorded for financial statement purposes on a daily basis as unrealized gain or loss. When the contract expires or is closed, the gain or loss is realized and is presented in the Statement of Operations as net realized gain or loss on financial futures transactions. The Series invest in financial futures contracts in
| | |
| 32 | | Visit our website at www.jennisondryden.com |
order to hedge its existing portfolio securities, or securities the Series intends to purchase, against fluctuations in value caused by changes in prevailing interest rates or market conditions. Should interest rates move unexpectedly, the Series may not achieve the anticipated benefits of the financial futures contracts and may realize a loss. The use of futures transactions involves the risk of imperfect correlation in movements in the price of futures contracts, interest rates and the underlying hedged assets.
Financial futures contracts involve elements of both market and credit risk in excess of the amounts reflected on the Statement of Assets and Liabilities.
Dividends and Distributions: The Series expects to pay dividends of net investment income and distributions of net realized capital and currency gains, if any, annually. Dividends and distributions to shareholders, which are determined in accordance with federal income tax regulations which may differ from generally accepted accounting principles, are recorded on the ex-dividend date.
Taxes: For federal income tax purposes, each Series in the Fund is treated as a separate taxpaying entity. It is each Series’ policy to continue to meet the requirements of the Internal Revenue Code applicable to regulated investment companies and to distribute all of its taxable net investment income and capital gains, if any, to its shareholders. Therefore, no federal income tax provision is required.
Withholding taxes on foreign dividends are recorded net of reclaimable amounts, at the time the related income is earned.
Estimates: The preparation of the financial statements requires management to make estimates and assumptions that affect the reported amounts and disclosures in the financial statements. Actual results could differ from those estimates.
Note 2. Agreements
The Fund has a management agreement for the Series with PI. Pursuant to this agreement, PI has responsibility for all investment advisory services and supervises the subadviser’s performance of such services. PI entered into a subadvisory agreement with Quantitative Management Associates LLC (QMA). The subadvisory agreement provides that QMA furnishes investment advisory services in connection with the management of the Series. In connection therewith, QMA is obligated to keep certain books and records of the Series. PI pays for the services of QMA, the cost of compensation of officers of the Series, occupancy and certain clerical and bookkeeping costs of the Series. The Series bears all other costs and expenses.
| | |
| Dryden International Equity Fund | | 33 |
Notes to Financial Statements
continued
The management fee paid to PI is computed daily and payable monthly, at an annual rate of .85 of 1% of the average daily net assets of the Series up to and including $300 million, .75 of 1% of the average daily net assets in excess of $300 million up to and including $1.5 billion and .70 of 1% of the Series’ average daily net assets over $1.5 billion. Through June 30, 2008, PI contractually agreed to subsidize and or cap the annual operating expenses so that annual operating expenses (exclusive of distribution and service (12b-1) fees) do not exceed 1.25% of the Series average net assets. The effective management fee was .78% for the year ended October 31, 2008.
The Series has a distribution agreement with Prudential Investment Management Services LLC (“PIMS”) which acts as the distributor of Class A, Class B, Class C, Class F, Class L, Class M, Class X, and Class Z shares of the Series. The Series compensates PIMS for distributing and servicing the Series’ Class A, Class B, Class C, Class F, Class L, Class M and Class X shares, pursuant to a plan of distribution, (the “Class A, B, C, F, L, M and X Plans”), regardless of expenses actually incurred by PIMS. The distribution fees are accrued daily and payable monthly. No distribution or service fees are paid to PIMS as distributor for Class Z shares of the Series.
Pursuant to the Class A, B, C, F, L, M and X Plans, the Series compensates PIMS for distribution related activities at an annual rate of up to .30 of 1%, 1%, 1%, .75 of 1%, .50 of 1%, 1%, and 1% of the average daily net assets of the Class A, B, C, F, L, M, and X shares, respectively. For the year ended October 31, 2008, PIMS contractually agreed to limit such fees to .25 of 1% of the average daily net assets of the Class A shares through February 29, 2008.
PIMS has advised the Series that they received approximately $210,200 in front-end sales charges resulting from sales of Class A shares during the year ended October 31, 2008. From these fees, PIMS paid such sales charges to broker-dealers, which in turn paid commissions to salespersons and incurred other distribution costs.
PIMS has advised the Series that for the year ended October 31, 2008 it received approximately $1,400, $42,100, $6,300, $21,500, $49,700 and $15,600 in contingent deferred sales charges imposed upon redemptions by certain Class A, Class B, Class C, Class F, Class M, and Class X shareholders, respectively.
PI, QMA and PIMS are indirect, wholly-owned subsidiaries of Prudential Financial, Inc. (“Prudential”).
| | |
| 34 | | Visit our website at www.jennisondryden.com |
Note 3. Other Transactions with Affiliates
Prudential Mutual Fund Services LLC (“PMFS”), an affiliate of PI and an indirect, wholly-owned subsidiary of Prudential, serves as the Series’ transfer agent. Transfer agent’s fees and expenses in the Statement of Operations include certain out-of-pocket expenses paid to non-affiliates, where applicable.
The Series pays networking fees to affiliated and unaffiliated broker/dealers, including fees relating to the services of First Clearing, LLC (“First Clearing”), an affiliate of Pl. These networking fees are payments made to broker/dealers that clear mutual fund transactions through a national clearing system. For the year ended October 31, 2008, the Series incurred approximately $295,200 in total networking fees, of which approximately $149,000 was paid to First Clearing. These amounts are included in transfer agents’s fees and expenses on the Statement of Operations.
The Series invests in the Taxable Money Market Series (“Portfolio”), a portfolio of the Dryden Core Investment Fund. The Portfolio is a money market mutual fund registered under the Investment Company Act of 1940, as amended, and managed by PI.
Note 4. Portfolio Securities
Purchases and sales of investment securities, other than short-term investments, for the year ended October 31, 2008 aggregated $651,469,581 and $740,861,197, respectively.
Note 5. Distributions and Tax Information
Distributions to shareholders, which are determined in accordance with federal income tax regulations and which may differ from generally accepted accounting principles, are recorded on the ex-dividends date. In order to present undistributed net investment income, accumulated net realized loss on investments and foreign currency transactions and paid-in capital in excess of par on the Statement of Assets and Liabilities that more closely represent their tax character, certain adjustments have been made to paid-in-capital in excess of par, undistributed net investment income and accumulated net realized loss on investments and foreign currency transactions. For the year ended October 31, 2008, the adjustments were to decrease undistributed net investment income by $4,038, increase accumulated net realized loss on investments and foreign currency transactions by $4,058,093 and increase paid-in-capital in excess of par by $4,062,131, due to the difference in the treatment for book and tax purposes of certain transactions involving foreign currencies, passive foreign investment companies, reclassification of redemptions utilized as distributions and other book to tax adjustments. Net investment income, net realized loss and net assets were not affected by this change.
| | |
| Dryden International Equity Fund | | 35 |
Notes to Financial Statements
continued
As of October 31, 2008, the Series had undistributed ordinary income of $16,164,019 on a tax basis.
For the years ended October 31, 2008 and October 31, 2007, the tax character of dividends paid as reflected in the Statement of Changes in Net Assets were $14,546,098 and $5,863,077, respectively, from ordinary income. In addition, for the year ended October 31, 2008, the Fund paid long term capital gains of $38,155,002 which are taxable as such.
As of October 31, 2008, the Series had a capital loss carryforward for tax purposes of approximately $217,424,000 of which $78,028,000 expires in 2009, $72,865,000 expires in 2010, $11,426,000 expires in 2011 and $55,105,000 expires in 2016.
The United States federal income tax basis of the Series’ investments and the net unrealized depreciation as of October 31, 2008 was as follows:
| | | | | | | | | | |
Tax Basis of
Investments | | Appreciation | | Depreciation | | Net
Unrealized
Depreciation | | Other Cost
Basis
Adjustments | | Total Net
Unrealized
Depreciation |
| $776,390,877 | | $13,942,297 | | $(300,264,487) | | $(286,322,190) | | $(466,861) | | $(286,789,051) |
The difference between book and tax basis is primarily attributable to deferred losses on wash sales and mark to market of open passive foreign investment companies. The other cost basis adjustments are primarily attributable to appreciation (depreciation) of foreign currency and mark-to-market of receivables and payables.
Management has analyzed the Series’ tax positions taken on federal income tax returns for all open tax years and has concluded that as of October 31, 2008, no provision for income tax would be required in the Series’ financial statements. The Series’ federal and state income tax excise returns for tax years for which the applicable statutes of limitations have not expired are subject to examination by the internal Revenue Service and state departments of revenue.
Note 6. Capital
The Series offers Class A, B, C, F, L, M, X and Z shares. Class A and L shares are sold with a front-end sales charge of up to 5.50% and 5.75%, respectively. All investors who purchase Class A and L shares in an amount of $1 million or more and sell these
| | |
| 36 | | Visit our website at www.jennisondryden.com |
shares within 12 months of purchase are subject to a contingent deferred sales charge (CDSC) of 1%, including investors who purchase their shares through broker-dealers affiliated with Prudential. Class B and F shares are sold with a contingent deferred sales charge which declines from 5% to zero depending on the period of time the shares are held. Class B and F shares will automatically convert to Class A shares on a quarterly basis approximately seven years after purchase. Class C shares are sold with a contingent deferred sales charge of 1% during the first 12 months. Class M and X shares are sold with a contingent deferred sales charge which declines from 6% to zero depending on the period of time the shares are held. Class M and X shares will automatically convert to Class A shares on a quarterly basis approximately eight and ten years after purchase, respectively. A special exchange privilege is also available for shareholders who qualify to purchase Class A shares at net asset value. Class Z shares are not subject to any sales or redemption charge and are offered exclusively for sale to a limited group of investors.
There are 1 billion authorized shares of $.01 par value common stock divided as follows:
| | |
Share Class | | Authorized Share Capital
of Each Share Class |
A and Z | | 225,000,000 |
B and C | | 150,000,000 |
X | | 100,000,000 |
F, L and M | | 50,000,000 |
| | | | | | | |
Class A | | Shares | | | Amount | |
Year ended October 31, 2008: | | | | | | | |
Shares sold | | 2,709,690 | | | $ | 22,634,760 | |
Shares issued in reinvestment of dividends | | 2,610,576 | | | | 24,121,298 | |
Shares reacquired | | (11,645,109 | ) | | | (91,054,214 | ) |
| | | | | | | |
Net increase (decrease) in shares outstanding before conversion | | (6,324,843 | ) | | | (44,298,156 | ) |
Shares issued upon conversion from Class B, F, M and X | | 4,495,399 | | | | 37,294,619 | |
| | | | | | | |
Net increase (decrease) in shares outstanding | | (1,829,444 | ) | | $ | (7,003,537 | ) |
| | | | | | | |
Year ended October 31, 2007: | | | | | | | |
Shares sold | | 4,699,322 | | | $ | 44,139,225 | |
Shares issued in connection with the merger | | 43,788,390 | | | | 387,365,365 | |
Shares issued in reinvestment of dividends | | 116,682 | | | | 1,026,803 | |
Shares reacquired | | (8,396,573 | ) | | | (79,714,451 | ) |
| | | | | | | |
Net increase (decrease) in shares outstanding before conversion | | 40,207,821 | | | | 352,816,942 | |
Shares issued upon conversion from Class B, F, M and X | | 5,103,337 | | | | 48,076,680 | |
| | | | | | | |
Net increase (decrease) in shares outstanding | | 45,311,158 | | | $ | 400,893,622 | |
| | | | | | | |
| | |
| Dryden International Equity Fund | | 37 |
Notes to Financial Statements
continued
| | | | | | | |
Class B | | | | | | |
Year ended October 31, 2008: | | | | | | | |
Shares sold | | 348,687 | | | $ | 2,819,993 | |
Shares issued in reinvestment of dividends | | 130,229 | | | | 1,162,854 | |
Shares reacquired | | (718,532 | ) | | | (5,470,446 | ) |
| | | | | | | |
Net increase (decrease) in shares outstanding before conversion | | (239,616 | ) | | | (1,487,599 | ) |
Shares reacquired upon conversion into Class A | | (589,276 | ) | | | (4,771,597 | ) |
| | | | | | | |
Net increase (decrease) in shares outstanding | | (828,892 | ) | | $ | (6,259,196 | ) |
| | | | | | | |
Year ended October 31, 2007: | | | | | | | |
Shares sold | | 973,069 | | | $ | 8,834,305 | |
Shares issued in connection with the merger | | 479,552 | | | | 4,137,461 | |
Shares issued in reinvestment of dividends | | 40,426 | | | | 344,432 | |
Shares reacquired | | (1,149,863 | ) | | | (10,210,931 | ) |
| | | | | | | |
Net increase (decrease) in shares outstanding before conversion | | 343,184 | | | | 3,105,267 | |
Shares reacquired upon conversion into Class A | | (2,720,990 | ) | | | (24,322,099 | ) |
| | | | | | | |
Net increase (decrease) in shares outstanding | | (2,377,806 | ) | | $ | (21,216,832 | ) |
| | | | | | | |
Class C | | | | | | |
Year ended October 31, 2008: | | | | | | | |
Shares sold | | 377,612 | | | $ | 3,025,201 | |
Shares issued in reinvestment of dividends | | 311,077 | | | | 2,777,913 | |
Shares reacquired | | (1,858,419 | ) | | | (14,172,836 | ) |
| | | | | | | |
Net increase (decrease) in shares outstanding | | (1,169,730 | ) | | $ | (8,369,722 | ) |
| | | | | | | |
Year ended October 31, 2007: | | | | | | | |
Shares sold | | 771,512 | | | $ | 7,021,256 | |
Shares issued in connection with the merger | | 6,424,357 | | | | 55,305,505 | |
Shares issued in reinvestment of dividends | | 12,234 | | | | 104,237 | |
Shares reacquired | | (1,456,891 | ) | | | (13,392,767 | ) |
| | | | | | | |
Net increase (decrease) in shares outstanding | | 5,751,212 | | | $ | 49,038,231 | |
| | | | | | | |
Class F | | | | | | |
Year ended October 31, 2008: | | | | | | | |
Shares sold | | 2,157 | | | $ | 17,909 | |
Shares issued in reinvestment of dividends | | 121,734 | | | | 1,087,084 | |
Shares reacquired | | (435,182 | ) | | | (3,364,771 | ) |
| | | | | | | |
Net increase (decrease) in shares outstanding before conversion | | (311,291 | ) | | | (2,259,778 | ) |
Shares reacquired upon conversion into Class A | | (759,491 | ) | | | (6,110,171 | ) |
| | | | | | | |
Net increase (decrease) in shares outstanding | | (1,070,782 | ) | | $ | (8,369,949 | ) |
| | | | | | | |
December 18, 2006* through October 31, 2007: | | | | | | | |
Shares sold | | 2,043 | | | $ | 43,477 | |
Shares issued in connection with the merger | | 4,458,745 | | | | 38,141,130 | |
Shares reacquired | | (587,102 | ) | | | (5,339,701 | ) |
| | | | | | | |
Net increase (decrease) in shares outstanding before conversion | | 3,873,686 | | | | 32,844,906 | |
Shares reacquired upon conversion into Class A | | (1,032,579 | ) | | | (9,334,747 | ) |
| | | | | | | |
Net increase (decrease) in shares outstanding | | 2,841,107 | | | $ | 23,510,159 | |
| | | | | | | |
| | |
| 38 | | Visit our website at www.jennisondryden.com |
| | | | | | | |
Class L | | | | | | |
Year ended October 31, 2008: | | | | | | | |
Shares sold | | 12,228 | | | $ | 110,917 | |
Shares issued in reinvestment of dividends | | 151,189 | | | | 1,398,500 | |
Shares reacquired | | (817,259 | ) | | | (6,320,098 | ) |
| | | | | | | |
Net increase (decrease) in shares outstanding | | (653,842 | ) | | $ | (4,810,681 | ) |
| | | | | | | |
March 19, 2007* through October 31, 2007: | | | | | | | |
Shares sold | | 17,164 | | | $ | 153,156 | |
Shares issued in connection with the merger | | 4,065,903 | | | | 36,281,032 | |
Shares reacquired | | (796,012 | ) | | | (7,692,330 | ) |
| | | | | | | |
Net increase (decrease) in shares outstanding | | 3,287,055 | | | $ | 28,741,858 | |
| | | | | | | |
Class M | | | | | | |
Year ended October 31, 2008: | | | | | | | |
Shares sold | | 80,564 | | | $ | 678,489 | |
Shares issued in reinvestment of dividends | | 251,945 | | | | 2,249,872 | |
Shares reacquired | | (1,408,540 | ) | | | (11,215,334 | ) |
| | | | | | | |
Net increase (decrease) in shares outstanding before conversion | | (1,076,031 | ) | | | (8,286,973 | ) |
Shares reacquired upon conversion into Class A | | (3,196,971 | ) | | | (25,657,868 | ) |
| | | | | | | |
Net increase (decrease) in shares outstanding | | (4,273,002 | ) | | $ | (33,944,841 | ) |
| | | | | | | |
March 19, 2007* through October 31, 2007: | | | | | | | |
Shares sold | | 80,560 | | | $ | 820,336 | |
Shares issued in connection with the merger | | 9,740,447 | | | | 84,013,342 | |
Shares reacquired | | (1,558,695 | ) | | | (14,616,030 | ) |
| | | | | | | |
Net increase (decrease) in shares outstanding before conversion | | 8,262,312 | | | | 70,217,648 | |
Shares reacquired upon conversion into Class A | | (1,501,170 | ) | | | (14,103,100 | ) |
| | | | | | | |
Net increase (decrease) in shares outstanding | | 6,761,142 | | | $ | 56,114,548 | |
| | | | | | | |
Class X | | | | | | |
Year ended October 31, 2008: | | | | | | | |
Shares sold | | 17,642 | | | $ | 150,944 | |
Shares issued in reinvestment of dividends | | 108,194 | | | | 966,172 | |
Shares reacquired | | (660,861 | ) | | | (5,104,885 | ) |
| | | | | | | |
Net increase (decrease) in shares outstanding before conversion | | (535,025 | ) | | | (3,987,769 | ) |
Shares reacquired upon conversion into Class A | | (118,987 | ) | | | (754,983 | ) |
| | | | | | | |
Net increase (decrease) in shares outstanding | | (654,012 | ) | | $ | (4,742,752 | ) |
| | | | | | | |
March 19, 2007* through October 31, 2007: | | | | | | | |
Shares sold | | 42,707 | | | $ | 416,726 | |
Shares issued in connection with the merger | | 2,941,125 | | | | 25,373,808 | |
Shares reacquired | | (430,786 | ) | | | (4,045,067 | ) |
| | | | | | | |
Net increase (decrease) in shares outstanding before conversion | | 2,553,046 | | | | 21,745,467 | |
Shares reacquired upon conversion into Class A | | (33,700 | ) | | | (316,734 | ) |
| | | | | | | |
Net increase (decrease) in shares outstanding | | 2,519,346 | | | $ | 21,428,733 | |
| | | | | | | |
| | |
| Dryden International Equity Fund | | 39 |
Notes to Financial Statements
continued
| | | | | | | |
Class Z | | | | | | |
Year ended October 31, 2008: | | | | | | | |
Shares sold | | 9,842,191 | | | $ | 75,886,033 | |
Shares issued in reinvestment of dividends | | 1,826,755 | | | | 17,025,355 | |
Shares reacquired | | (10,016,650 | ) | | | (75,585,371 | ) |
| | | | | | | |
Net increase (decrease) in shares outstanding | | 1,652,296 | | | $ | 17,326,017 | |
| | | | | | | |
Year ended October 31, 2007: | | | | | | | |
Shares sold | | 10,977,676 | | | $ | 103,795,755 | |
Shares issued in connection with the merger | | 844,417 | | | | 7,522,944 | |
Shares issued in reinvestment of dividends | | 484,796 | | | | 4,300,139 | |
Shares reacquired | | (7,183,685 | ) | | | (68,218,584 | ) |
| | | | | | | |
Net increase (decrease) in shares outstanding | | 5,123,204 | | | $ | 47,400,254 | |
| | | | | | | |
Note 7. Borrowing
The Fund, along with other affiliated registered investment companies (the “Funds”), is a party to a Syndicated Credit Agreement (“SCA”) with two banks. The SCA provides for a commitment of $500 million. Interest on any borrowings under the SCA is incurred at contracted market rates and a commitment fee for the unused amount is accrued daily and paid quarterly. Effective October 24, 2008, the Funds renewed SCA with the banks. The commitment under the renewed SCA continues to be $500 million. The Funds pay a commitment fee of .13 of 1% of the unused portion of the renewed SCA. The expiration date of the renewed SCA will be October 23, 2009. For the period from October 26, 2007 through October 23, 2008, the Funds paid a commitment fee of ..06 of 1% of the unused portion of the agreement. The purpose of the SCA is to provide an alternative source of temporary funding for capital share redemptions. The Series utilized the line of credit during the year ended October 31, 2008. The average daily balance for the days the Series had loans outstanding during the year was approximately $1,637,000 for 37 days at a weighted average interest rate of 3.68%.
Note 8. Reorganization
On December 15, 2006, Dryden International Equity Fund acquired all of the net assets of the Jennison Global Growth Fund, Inc., pursuant to a plan of reorganization approved by the Jennison Global Growth Fund, Inc. shareholders on December 11,
| | |
| 40 | | Visit our website at www.jennisondryden.com |
2006. The acquisition was accomplished by a tax-free issue of Class A, Class C, Class F and Class Z shares for the corresponding classes of Jennison Global Growth Fund, Inc. During the acquisition the Series renamed Class B shares of Jennison Global Growth and issued Class F shares of Dryden International Equity Fund.
On March 16, 2007, Dryden International Equity Fund acquired all of the net assets of the Strategic Partners International Growth Fund pursuant to a plan of reorganization approved by the Strategic Partners International Growth Fund shareholders on December 29, 2006. The acquisition was accomplished by a tax-free issue of Class A, Class B, Class C, Class L, Class M and Class X shares for the corresponding classes of Strategic Partners International Growth Fund.
| | | | | | | | | |
| Merged Funds | | Acquiring Fund |
| Jennison Global Growth Fund | | Dryden International Equity Fund |
Class | | Shares | | Class | | Shares | | Value |
| A | | 17,883,946 | | A | | 39,754,913 | | $ | 351,369,984 |
| B | | 2,162,099 | | F | | 4,458,745 | | | 38,141,130 |
| C | | 713,686 | | C | | 1,455,002 | | | 12,450,845 |
| Z | | 377,958 | | Z | | 844,417 | | | 7,522,944 |
| |
| SP International Growth Fund | | Dryden International Equity Fund |
| Class | | Shares | | Class | | Shares | | Value |
| A | | 2,035,463 | | A | | 4,033,477 | | $ | 35,995,381 |
| B | | 243,730 | | B | | 479,552 | | | 4,137,461 |
| C | | 2,517,110 | | C | | 4,969,355 | | | 42,854,660 |
| L | | 2,062,990 | | L | | 4,065,903 | | | 36,281,032 |
| M | | 4,948,802 | | M | | 9,740,447 | | | 84,013,342 |
| X | | 1,493,777 | | X | | 2,941,125 | | | 25,373,808 |
The aggregate net assets and unrealized appreciation/(depreciation) of the Merged funds immediately before the acquisition were:
| | | | | | |
| | | Total Net
Assets | | Unrealized
Appreciation |
Jennison Global Growth Fund | | $ | 409,484,903 | | $ | 107,261,144 |
SP International Growth Fund | | | 228,655,684 | | | 56,235,689 |
The Series acquired capital loss carryforward due to the reorganization with Jennison Global Growth Fund and SP International Growth Fund in the amounts of $50,010,130 and $93,730,145, respectively (amounts included in Note 5). The future utilization of the acquired capital loss carryforward may be limited under certain conditions defined in the Internal Revenue Code of 1986, as amended.
| | |
| Dryden International Equity Fund | | 41 |
Notes to Financial Statements
continued
Note 9. New Accounting Pronouncements
On September 20, 2006, the FASB released Statement of Financial Accounting Standards No. 157 “Fair Value Measurements” (“FAS 157”). FAS 157 establishes an authoritative definition of fair value, sets out a framework for measuring fair value, and requires additional disclosures about fair-value measurements. The application of FAS 157 is required for fiscal years beginning after November 15, 2007 and interim periods within those fiscal years. At this time, management is evaluating the implications of FAS 157 and its impact, if any, in the financial statements has not yet been determined.
In addition, in March 2008, the FASB released Statement of Financial Accounting Standards No. 161, “Disclosures about Derivative Instruments and Hedging Activities” (“FAS 161”). FAS 161 requires qualitative disclosures about objectives and strategies for using derivatives, quantitative disclosures about fair value amounts of and gains and losses on derivative instruments, and disclosures about credit-risk-related contingent features in derivative agreements. The application of FAS 161 is required for fiscal years beginning after November 15, 2008 and interim periods within those fiscal years. At this time, management is evaluating the implications of FAS 161 and its impact on the financial statements has not yet been determined.
On September 12, 2008, the FASB issued FASB Staff Position (“FSP”) No. FAS 133-1 and FASB Interpretation Number (“FIN”) 45-4 (“FSP 133-1”), Disclosures about Credit Derivatives and Certain Guarantees: An Amendment of FASB Statement No. 133 and FASB Interpretation No. 45; and Clarification of the Effective Date of FASB Statement No. 161. The FSP is intended to improve disclosures about credit derivatives by requiring more information about the potential adverse effects of changes in credit risk on the financial position, financial performance, and cash flows of the sellers of credit derivatives. It amends FASB Statement No. 133, Accounting for Derivative Instruments and Hedging Activities, to require disclosures by sellers of credit derivatives, including credit derivatives embedded in hybrid instruments. The FSP also amends FIN 45, Guarantor’s Accounting and Disclosure Requirements for Guarantees, Including Indirect Guarantees of Indebtedness to Others, to require an additional disclosure about the current status of the payment/performance risk of a guarantee. FSP 133-1 and FIN 45-4 is effective for reporting periods (annual or interim) ending after November 15, 2008. Management of the Fund is currently assessing the impact of adopting FSP No. FAS 133-1 and FIN 45-4.
| | |
| 42 | | Visit our website at www.jennisondryden.com |
Financial Highlights
| | |
| OCTOBER 31, 2008 | | ANNUAL REPORT |
Dryden International Equity Fund
Financial Highlights
| | | | |
| | | Class A | |
| | | Year Ended
October 31, 2008(c) | |
Per Share Operating Performance: | | | | |
Net Asset Value, Beginning Of Year | | $ | 10.49 | |
| | | | |
Income (loss) from investment operations: | | | | |
Net investment income | | | .16 | |
Net realized and unrealized gain (loss) on investment and foreign currency transactions | | | (5.37 | ) |
| | | | |
Total from investment operations | | | (5.21 | ) |
| | | | |
Less Dividends: | | | | |
Dividends from net investment income | | | (.14 | ) |
Distributions from net realized gains | | | (.34 | ) |
| | | | |
Total dividends and distributions | | | (.48 | ) |
| | | | |
Net asset value, end of year | | $ | 4.80 | |
| | | | |
Total Return(a): | | | (51.87 | )% |
Ratios/Supplemental Data: | | | | |
Net assets, end of year (000) | | $ | 246,234 | |
Average net assets (000) | | $ | 438,831 | |
Ratios to average net assets(e): | | | | |
Expenses, including distribution and service (12b-1) fees(d) | | | 1.43 | % |
Expenses, excluding distribution and service (12b-1) fees | | | 1.15 | % |
Net investment income (loss) | | | 1.94 | % |
For Class A, B, C, F, L, M, X and Z shares: | | | | |
Portfolio turnover rate | | | 74 | % |
| (a) | Total return does not consider the effects of sales loads. Total return is calculated assuming a purchase of a share on the first day and a sale on the last day of each year reported, and includes reinvestment of dividends. Total return may reflect adjustments to conform to generally accepted accounting principles. |
| (b) | Net of expense subsidy. If the investment manager had not subsidized expenses, the expense ratios (both including and excluding distribution and service (12b-1) fees) and the net investment income ratios would have been 1.68%, 1.43% and 1.02%, respectively for the year ended October 31, 2005. |
| (c) | Calculated based on average shares outstanding during the year. |
| (d) | The distributor of the series has contractually agreed to limit its distribution and service (12b-1) fees to .25 of 1% of the average daily net assets of the Class A shares through February 29, 2008. |
| (e) | Does not include the expenses of the underlying funds in which the Series invests. |
See Notes to Financial Statements.
| | |
| 44 | | Visit our website at www.jennisondryden.com |
| | | | | | | | | | | | | | |
| Class A | |
| Year Ended October 31, | |
| 2007(c) | | | 2006 | | | 2005 | | | 2004 | |
| | | | | | | | | | | | | | |
| $ | 8.54 | | | $ | 6.84 | | | $ | 5.75 | | | $ | 4.84 | |
| | | | | | | | | | | | | | | |
| | | | | | | | | | | | | | |
| | .16 | | | | .08 | | | | .06 | | | | .03 | |
| | 1.92 | | | | 1.66 | | | | 1.09 | | | | .88 | |
| | | | | | | | | | | | | | | |
| | 2.08 | | | | 1.74 | | | | 1.15 | | | | .91 | |
| | | | | | | | | | | | | | | |
| | | | | | | | | | | | | | |
| | (.13 | ) | | | (.04 | ) | | | (.06 | ) | | | — | |
| | — | | | | — | | | | — | | | | — | |
| | | | | | | | | | | | | | | |
| | (.13 | ) | | | (.04 | ) | | | (.06 | ) | | | .00 | |
| | | | | | | | | | | | | | | |
| $ | 10.49 | | | $ | 8.54 | | | $ | 6.84 | | | $ | 5.75 | |
| | | | | | | | | | | | | | | |
| | 24.68 | % | | | 25.55 | % | | | 20.13 | % | | | 18.80 | % |
| | | | | | | | | | | | | | |
| $ | 557,878 | | | $ | 67,123 | | | $ | 38,323 | | | $ | 22,103 | |
| $ | 438,194 | | | $ | 52,174 | | | $ | 30,177 | | | $ | 20,760 | |
| | | | | | | | | | | | | | |
| | 1.34 | % | | | 1.40 | % | | | 1.57 | %(b) | | | 2.02 | % |
| | 1.09 | % | | | 1.15 | % | | | 1.32 | %(b) | | | 1.77 | % |
| | 1.60 | % | | | 1.23 | % | | | 1.13 | %(b) | | | .64 | % |
| | | | | | | | | | | | | | |
| | 114 | % | | | 60 | % | | | 41 | % | | | 100 | % |
See Notes to Financial Statements.
| | |
| Dryden International Equity Fund | | 45 |
Financial Highlights
continued
| | | | |
| | | Class B | |
| | | Year Ended
October 31, 2008(c) | |
Per Share Operating Performance: | | | | |
Net Asset Value, Beginning Of Year | | $ | 10.09 | |
| | | | |
Income (loss) from investment operations: | | | | |
Net investment income (loss) | | | .09 | |
Net realized and unrealized gain (loss) on investment and foreign currency transactions | | | (5.16 | ) |
| | | | |
Total from investment operations | | | (5.07 | ) |
| | | | |
Less Dividends: | | | | |
Dividends from net investment income | | | (.07 | ) |
Distributions from net realized gains | | | (.34 | ) |
| | | | |
Total dividends and distributions | | | (.41 | ) |
| | | | |
Net asset value, end of year | | $ | 4.61 | |
| | | | |
Total Return(a): | | | (52.22 | )% |
Ratios/Supplemental Data: | | | | |
Net assets, end of year (000) | | $ | 11,205 | |
Average net assets (000) | | $ | 22,786 | |
Ratios to average net assets(d): | | | | |
Expenses, including distribution and service (12b-1) fees | | | 2.15 | % |
Expenses, excluding distribution and service (12b-1) fees | | | 1.15 | % |
Net investment income (loss) | | | 1.17 | % |
| (a) | Total return does not consider the effects of sales loads. Total return is calculated assuming a purchase of a share on the first day and a sale on the last day of each year reported, and includes reinvestment of dividends. Total return may reflect adjustments to conform to generally accepted accounting principles. |
| (b) | Net of expense subsidy. If the investment manager had not subsidized expenses, the expense ratios (both including and excluding distribution and service (12b-1) fees) and the net investment income ratios would have been 2.43%, 1.43% and .28%, respectively for the year ended October 31, 2005. |
| (c) | Calculated based on average shares outstanding during the year. |
| (d) | Does not include the expenses of the underlying funds in which the Series invests. |
See Notes to Financial Statements.
| | |
| 46 | | Visit our website at www.jennisondryden.com |
| | | | | | | | | | | | | | |
| Class B | |
| Year Ended October 31, | |
| 2007(c) | | | 2006 | | | 2005 | | | 2004 | |
| | | | | | | | | | | | | | |
| $ | 8.22 | | | $ | 6.59 | | | $ | 5.55 | | | $ | 4.71 | |
| | | | | | | | | | | | | | | |
| | | | | | | | | | | | | | |
| | .06 | | | | .04 | | | | .02 | | | | (.01 | ) |
| | 1.88 | | | | 1.59 | | | | 1.04 | | | | .85 | |
| | | | | | | | | | | | | | | |
| | 1.94 | | | | 1.63 | | | | 1.06 | | | | .84 | |
| | | | | | | | | | | | | | | |
| | | | | | | | | | | | | | |
| | (.07 | ) | | | — | | | | (.02 | ) | | | — | |
| | — | | | | — | | | | — | | | | — | |
| | | | | | | | | | | | | | | |
| | (.07 | ) | | | — | | | | (.02 | ) | | | — | |
| | | | | | | | | | | | | | | |
| $ | 10.09 | | | $ | 8.22 | | | $ | 6.59 | | | $ | 5.55 | |
| | | | | | | | | | | | | | | |
| | 23.73 | % | | | 24.73 | % | | | 19.08 | % | | | 17.83 | % |
| | | | | | | | | | | | | | |
| $ | 32,905 | | | $ | 46,330 | | | $ | 42,878 | | | $ | 42,252 | |
| $ | 39,205 | | | $ | 45,041 | | | $ | 44,159 | | | $ | 42,334 | |
| | | | | | | | | | | | | | |
| | 2.09 | % | | | 2.15 | % | | | 2.32 | %(b) | | | 2.77 | % |
| | 1.09 | % | | | 1.15 | % | | | 1.32 | %(b) | | | 1.77 | % |
| | .67 | % | | | .46 | % | | | .37 | %(b) | | | (.11 | )% |
See Notes to Financial Statements.
| | |
| Dryden International Equity Fund | | 47 |
Financial Highlights
continued
| | | | |
| | | Class C | |
| | | Year Ended
October 31, 2008(c) | |
Per Share Operating Performance: | | | | |
Net Asset Value, Beginning Of Year | | $ | 10.09 | |
| | | | |
Income (loss) from investment operations: | | | | |
Net investment income (loss) | | | .09 | |
Net realized and unrealized gain (loss) on investment and foreign currency transactions | | | (5.16 | ) |
| | | | |
Total from investment operations | | | (5.07 | ) |
| | | | |
Less Dividends: | | | | |
Dividends from net investment income | | | (.07 | ) |
Distributions from net realized gains | | | (.34 | ) |
| | | | |
Total dividends and distributions | | | (.41 | ) |
| | | | |
Net asset value, end of year | | $ | 4.61 | |
| | | | |
Total Return(a): | | | (52.22 | )% |
Ratios/Supplemental Data: | | | | |
Net assets, end of year (000) | | $ | 28,858 | |
Average net assets (000) | | $ | 55,111 | |
Ratios to average net assets(d): | | | | |
Expenses, including distribution and service (12b-1) fees | | | 2.15 | % |
Expenses, excluding distribution and service (12b-1) fees | | | 1.15 | % |
Net investment income (loss) | | | 1.19 | % |
| (a) | Total return does not consider the effects of sales loads. Total return is calculated assuming a purchase of a share on the first day and a sale on the last day of each year reported, and includes reinvestment of dividends. Total return may reflect adjustments to conform to generally accepted accounting principles. |
| (b) | Net of expense subsidy. If the investment manager had not subsidized expenses, the expense ratios (both including and excluding distribution and service (12b-1) fees) and the net investment income ratios would have been 2.43%, 1.43% and .28%, respectively for the year ended October 31, 2005. |
| (c) | Calculated based on average shares outstanding during the year. |
| (d) | Does not include the expenses of the underlying funds in which the Series invests. |
See Notes to Financial Statements.
| | |
| 48 | | Visit our website at www.jennisondryden.com |
| | | | | | | | | | | | | | |
| Class C | |
| Year Ended October 31, | |
| 2007(c) | | | 2006 | | | 2005 | | | 2004 | |
| | | | | | | | | | | | | | |
| $ | 8.22 | | | $ | 6.59 | | | $ | 5.55 | | | $ | 4.71 | |
| | | | | | | | | | | | | | | |
| | | | | | | | | | | | | | |
| | .10 | | | | .04 | | | | .02 | | | | (.01 | ) |
| | 1.84 | | | | 1.59 | | | | 1.04 | | | | .85 | |
| | | | | | | | | | | | | | | |
| | 1.94 | | | | 1.63 | | | | 1.06 | | | | .84 | |
| | | | | | | | | | | | | | | |
| | | | | | | | | | | | | | |
| | (.07 | ) | | | — | | | | (.02 | ) | | | — | |
| | — | | | | — | | | | — | | | | — | |
| | | | | | | | | | | | | | | |
| | (.07 | ) | | | .00 | | | | (.02 | ) | | | .00 | |
| | | | | | | | | | | | | | | |
| $ | 10.09 | | | $ | 8.22 | | | $ | 6.59 | | | $ | 5.55 | |
| | | | | | | | | | | | | | | |
| | 23.73 | % | | | 24.73 | % | | | 19.08 | % | | | 17.83 | % |
| | | | | | | | | | | | | | |
| $ | 75,010 | | | $ | 13,825 | | | $ | 12,779 | | | $ | 13,669 | |
| $ | 53,765 | | | $ | 13,478 | | | $ | 13,700 | | | $ | 13,956 | |
| | | | | | | | | | | | | | |
| | 2.09 | % | | | 2.15 | % | | | 2.32 | %(b) | | | 2.77 | % |
| | 1.09 | % | | | 1.15 | % | | | 1.32 | %(b) | | | 1.77 | % |
| | 1.03 | % | | | .47 | % | | | .37 | %(b) | | | (.12 | )% |
See Notes to Financial Statements.
| | |
| Dryden International Equity Fund | | 49 |
Financial Highlights
continued
| | | | | | | | |
| | | Class F | |
| | | Year Ended
October 31, 2008(d) | | | December 18, 2006(a)
through
October 31, 2007(d) | |
Per Share Operating Performance: | | | | | | | | |
Net Asset Value, Beginning Of Period | | $ | 10.11 | | | $ | 8.56 | |
| | | | | | | | |
Income from investment operations: | | | | | | | | |
Net investment income | | | .11 | | | | .09 | |
Net realized and unrealized gain (loss) on investment and foreign currency transactions | | | (5.17 | ) | | | 1.46 | |
| | | | | | | | |
Total from investment operations | | | (5.06 | ) | | | 1.55 | |
| | | | | | | | |
Less Dividends: | | | | | | | | |
Dividends from net investment income | | | (.09 | ) | | | — | |
Distributions from net realized gains | | | (.34 | ) | | | — | |
| | | | | | | | |
Total dividends and distributions | | | (0.43 | ) | | | — | |
| | | | | | | | |
Net asset value, end of period | | $ | 4.62 | | | $ | 10.11 | |
| | | | | | | | |
Total Return(b): | | | (52.10 | )% | | | 18.11 | % |
Ratios/Supplemental Data: | | | | | | | | |
Net assets, end of period (000) | | $ | 8,171 | | | $ | 28,728 | |
Average net assets (000) | | $ | 18,310 | | | $ | 33,219 | |
Ratios to average net assets(e): | | | | | | | | |
Expenses, including distribution and service (12b-1) fees | | | 1.90 | % | | | 1.84 | %(c) |
Expenses, excluding distribution and service (12b-1) fees | | | 1.15 | % | | | 1.09 | %(c) |
Net investment income | | | 1.37 | % | | | 1.13 | %(c) |
| (a) | Inception date of Class F shares. |
| (b) | Total return does not consider the effects of sales loads. Total return is calculated assuming a purchase of a share on the first day and a sale on the last day of each period reported, and includes reinvestment of dividends. Total return may reflect adjustments to conform to generally accepted accounting principles. Total returns for periods less that a full year are not annualized. |
| (d) | Calculated based on average shares outstanding during the period. |
| (e) | Does not include the expenses of the underlying funds in which the Series invests. |
See Notes to Financial Statements.
| | |
| 50 | | Visit our website at www.jennisondryden.com |
| | | | | | | | |
| | | Class L | |
| | | Year Ended
October 31, 2008(d) | | | March 19, 2007(a)
through
October 31, 2007(d) | |
Per Share Operating Performance: | | | | | | | | |
Net Asset Value, Beginning Of Period | | $ | 10.48 | | | $ | 8.92 | |
| | | | | | | | |
Income from investment operations: | | | | | | | | |
Net investment income | | | .14 | | | | .11 | |
Net realized and unrealized gain (loss) on investment and foreign currency transactions | | | (5.38 | ) | | | 1.45 | |
| | | | | | | | |
Total from investment operations | | | (5.24 | ) | | | 1.56 | |
| | | | | | | | |
Less Dividends: | | | | | | | | |
Dividends from net investment income | | | (.11 | ) | | | — | |
Distributions from net realized gains | | | (.34 | ) | | | — | |
| | | | | | | | |
Total dividends and distributions | | | (0.45 | ) | | | — | |
| | | | | | | | |
Net asset value, end of period | | $ | 4.79 | | | $ | 10.48 | |
| | | | | | | | |
Total Return(b): | | | (52.07 | )% | | | 17.49 | % |
Ratios/Supplemental Data: | | | | | | | | |
Net assets, end of period (000) | | $ | 12,621 | | | $ | 34,433 | |
Average net assets (000) | | $ | 24,942 | | | $ | 35,182 | |
Ratios to average net assets(e): | | | | | | | | |
Expenses, including distribution and service (12b-1) fees | | | 1.65 | % | | | 1.59 | %(c) |
Expenses, excluding distribution and service (12b-1) fees | | | 1.15 | % | | | 1.09 | %(c) |
Net investment income | | | 1.68 | % | | | 1.82 | %(c) |
| (a) | Inception date of Class L shares. |
| (b) | Total return does not consider the effects of sales loads. Total return is calculated assuming a purchase of a share on the first day and a sale on the last day of each period reported, and includes reinvestment of dividends. Total return may reflect adjustments to conform to generally accepted accounting principles. Total returns for periods less that a full year are not annualized. |
| (d) | Calculated based on average shares outstanding during the period. |
| (e) | Does not include the expenses of the underlying funds in which the Series invests. |
See Notes to Financial Statements.
| | |
| Dryden International Equity Fund | | 51 |
Financial Highlights
continued
| | | | | | | | |
| | | Class M | |
| | | Year Ended
October 31, 2008(d) | | | March 19, 2007(a)
through
October 31, 2007(d) | |
Per Share Operating Performance: | | | | | | | | |
Net Asset Value, Beginning Of Period | | $ | 10.09 | | | $ | 8.63 | |
| | | | | | | | |
Income from investment operations: | | | | | | | | |
Net investment income | | | .07 | | | | .08 | |
Net realized and unrealized gain (loss) on investment and foreign currency transactions | | | (5.14 | ) | | | 1.38 | |
| | | | | | | | |
Total from investment operations | | | (5.07 | ) | | | 1.46 | |
| | | | | | | | |
Less Dividends: | | | | | | | | |
Dividends from net investment income | | | (.07 | ) | | | — | |
Distributions from net realized gains | | | (.34 | ) | | | — | |
| | | | | | | | |
Total dividends and distributions | | | (0.41 | ) | | | — | |
| | | | | | | | |
Net asset value, end of period | | $ | 4.61 | | | $ | 10.09 | |
| | | | | | | | |
Total Return(b): | | | (52.22 | )% | | | 16.92 | % |
Ratios/Supplemental Data: | | | | | | | | |
Net assets, end of period (000) | | $ | 11,467 | | | $ | 68,244 | |
Average net assets (000) | | $ | 34,319 | | | $ | 76,639 | |
Ratios to average net assets(e): | | | | | | | | |
Expenses, including distribution and service (12b-1) fees | | | 2.15 | % | | | 2.09 | %(c) |
Expenses, excluding distribution and service (12b-1) fees | | | 1.15 | % | | | 1.09 | %(c) |
Net investment income | | | .92 | % | | | 1.41 | %(c) |
| (a) | Inception date of Class M shares. |
| (b) | Total return does not consider the effects of sales loads. Total return is calculated assuming a purchase of a share on the first day and a sale on the last day of each period reported, and includes reinvestment of dividends. Total return may reflect adjustments to conform to generally accepted accounting principles. Total returns for periods less that a full year are not annualized. |
| (d) | Calculated based on average shares outstanding during the period. |
| (e) | Does not include the expenses of the underlying funds in which the Series invests. |
See Notes to Financial Statements.
| | |
| 52 | | Visit our website at www.jennisondryden.com |
| | | | | | | | |
| | | Class X | |
| | | Year Ended
October 31, 2008(d) | | | March 19, 2007(a)
through
October 31, 2007(d) | |
Per Share Operating Performance: | | | | | | | | |
Net Asset Value, Beginning Of Period | | $ | 10.09 | | | $ | 8.63 | |
| | | | | | | | |
Income from investment operations: | | | | | | | | |
Net investment income | | | .09 | | | | .08 | |
Net realized and unrealized gain (loss) on investment and foreign currency transactions | | | (5.16 | ) | | | 1.38 | |
| | | | | | | | |
Total from investment operations | | | (5.07 | ) | | | 1.46 | |
| | | | | | | | |
Less Dividends: | | | | | | | | |
Dividends from net investment income | | | (.07 | ) | | | — | |
Distributions from net realized gains | | | (.34 | ) | | | — | |
| | | | | | | | |
Total dividends and distributions | | | (0.41 | ) | | | — | |
| | | | | | | | |
Net asset value, end of period | | $ | 4.61 | | | $ | 10.09 | |
| | | | | | | | |
Total Return(b): | | | (52.22 | )% | | | 16.92 | % |
Ratios/Supplemental Data: | | | | | | | | |
Net assets, end of period (000) | | $ | 8,597 | | | $ | 25,428 | |
Average net assets (000) | | $ | 17,864 | | | $ | 25,351 | |
Ratios to average net assets(e): | | | | | | | | |
Expenses, including distribution and service
(12b-1) fees | | | 2.15 | % | | | 2.09 | %(c) |
Expenses, excluding distribution and service
(12b-1) fees | | | 1.15 | % | | | 1.09 | %(c) |
Net investment income | | | 1.18 | % | | | 1.30 | %(c) |
| (a) | Inception date of Class X shares. |
| (b) | Total return does not consider the effects of sales loads. Total return is calculated assuming a purchase of a share on the first day and a sale on the last day of each period reported, and includes reinvestment of dividends. Total return may reflect adjustments to conform to generally accepted accounting principles. Total returns for periods less that a full year are not annualized. |
| (d) | Calculated based on average shares outstanding during the period. |
| (e) | Does not include the expenses of the underlying funds in which the Series invests. |
See Notes to Financial Statements.
| | |
| Dryden International Equity Fund | | 53 |
Financial Highlights
continued
| | | | |
| | | Class Z | |
| | | Year Ended
October 31, 2008(c) | |
Per Share Operating Performance: | | | | |
Net Asset Value, Beginning Of Year | | $ | 10.60 | |
| | | | |
Income (loss) from investment operations: | | | | |
Net investment income (loss) | | | .18 | |
Net realized and unrealized gain (loss) on investment and foreign currency transactions | | | (5.43 | ) |
| | | | |
Total from investment operations | | | (5.25 | ) |
| | | | |
Less Dividends: | | | | |
Dividends from net investment income | | | (.16 | ) |
Distributions from net realized gains | | | (.34 | ) |
| | | | |
Total dividends and distributions | | | (.50 | ) |
| | | | |
Net asset value, end of year | | $ | 4.85 | |
| | | | |
Total Return(a): | | | (51.77 | )% |
Ratios/Supplemental Data: | | | | |
Net assets, end of year (000) | | $ | 169,874 | |
Average net assets (000) | | $ | 285,097 | |
Ratios to average net assets(d): | | | | |
Expenses, including distribution and service (12b-1) fees | | | 1.15 | % |
Expenses, excluding distribution and service (12b-1) fees | | | 1.15 | % |
Net investment income (loss) | | | 2.22 | % |
| (a) | Total return does not consider the effects of sales loads. Total return is calculated assuming a purchase of a share on the first day and a sale on the last day of each year reported, and includes reinvestment of dividends. Total return may reflect adjustments to conform to generally accepted accounting principles. |
| (b) | Net of expense subsidy. If the investment manager had not subsidized expenses, the expense ratios (both including and excluding distribution and service (12b-1) fees) and the net investment income ratios would have been 1.43%, 1.43% and .73%, respectively for the year ended October 31, 2005. |
| (c) | Calculated based on average shares outstanding during the year. |
| (d) | Does not include the expenses of the underlying funds in which the Series invests. |
See Notes to Financial Statements.
| | |
| 54 | | Visit our website at www.jennisondryden.com |
| | | | | | | | | | | | | | |
| Class Z | |
| Year Ended October 31, | |
| 2007(c) | | | 2006 | | | 2005 | | | 2004 | |
| | | | | | | | | | | | | | |
| $ | 8.62 | | | $ | 6.90 | | | $ | 5.80 | | | $ | 4.88 | |
| | | | | | | | | | | | | | | |
| | | | | | | | | | | | | | |
| | .16 | | | | .12 | | | | .05 | | | | .03 | |
| | 1.97 | | | | 1.65 | | | | 1.12 | | | | .89 | |
| | | | | | | | | | | | | | | |
| | 2.13 | | | | 1.77 | | | | 1.17 | | | | .92 | |
| | | | | | | | | | | | | | | |
| | | | | | | | | | | | | | |
| | (.15 | ) | | | (.05 | ) | | | (.07 | ) | | | — | |
| | — | | | | — | | | | — | | | | — | |
| | | | | | | | | | | | | | | |
| | (.15 | ) | | | (.05 | ) | | | (.07 | ) | | | .00 | |
| | | | | | | | | | | | | | | |
| $ | 10.60 | | | $ | 8.62 | | | $ | 6.90 | | | $ | 5.80 | |
| | | | | | | | | | | | | | | |
| | 25.05 | % | | | 25.86 | % | | | 20.40 | % | | | 18.85 | % |
| | | | | | | | | | | | | | |
| $ | 353,771 | | | $ | 243,572 | | | $ | 179,798 | | | $ | 12,881 | |
| $ | 301,553 | | | $ | 214,969 | | | $ | 53,026 | | | $ | 7,103 | |
| | | | | | | | | | | | | | |
| | 1.09 | % | | | 1.15 | % | | | 1.32 | %(b) | | | 1.77 | % |
| | 1.09 | % | | | 1.15 | % | | | 1.32 | %(b) | | | 1.77 | % |
| | 1.73 | % | | | 1.48 | % | | | .88 | %(b) | | | .81 | % |
See Notes to Financial Statements.
| | |
| Dryden International Equity Fund | | 55 |
Report of Independent Registered Public Accounting Firm
The Board of Directors and Shareholders
Prudential World Fund, Inc.—Dryden International Equity Fund:
We have audited the accompanying statement of assets and liabilities of the Prudential World Fund, Inc.—Dryden International Equity Fund (one of the portfolios constituting the Prudential World Fund, Inc., hereafter referred to as the “Fund”), including the portfolio of investments, as of October 31, 2008, and the related statement of operations for the year then ended, the statement of changes in net assets for each of the years in the two-year period then ended, and the financial highlights for each of years in the five-year period then ended. These financial statements and financial highlights are the responsibility of the Fund’s management. Our responsibility is to express an opinion on these financial statements and financial highlights based on our audits.
We conducted our audits in accordance with the standards of the Public Company Accounting Oversight Board (United States). Those standards require that we plan and perform the audit to obtain reasonable assurance about whether the financial statements and financial highlights are free of material misstatement. An audit includes examining, on a test basis, evidence supporting the amounts and disclosures in the financial statements. Our procedures included confirmation of securities owned as of October 31, 2008, by correspondence with the custodian and brokers or by other appropriate auditing procedures where replies from brokers were not received. An audit also includes assessing the accounting principles used and significant estimates made by management, as well as evaluating the overall financial statement presentation. We believe that our audits provide a reasonable basis for our opinion.
In our opinion, the financial statements and financial highlights referred to above present fairly, in all material respects, the financial position of the Fund as of October 31, 2008, and the results of its operations for the year then ended, the changes in its net assets for each of the years in the two-year period then ended and the financial highlights for each of the years in the five-year period then ended, in conformity with U.S. generally accepted accounting principles.

New York, New York
December 23, 2008
| | |
| 56 | | Visit our website at www.jennisondryden.com |
Tax Information
(Unaudited)
We are required by Internal Revenue Code to advise you within 60 days of the Series’ fiscal year end (October 31, 2008) as to the federal tax status of dividends and distributions paid by the Series during such fiscal year. Accordingly, we are advising you in the fiscal year ended October 31, 2008, the Fund paid dividends of $0.14 per share for Class A, $0.07 per share for Class B and C shares, $0.09 per share for Class F shares, $0.11 per share for Class L shares, $0.07 for Class M and X shares and $0.16 per share for Class Z shares, from ordinary income, respectively. Additionally, the Fund paid distributions of $0.34 of long-term capital gains. For federal income tax purposes, dividends from net investment income and distributions from short-term capital gains are taxable as ordinary income. Long-term capital gain distributions are taxable as such.
We wish to advise you that 14.98% of the ordinary income dividends paid in the fiscal year ended October 30, 2008 qualified for the corporate dividend received deduction available to corporate taxpayers.
For the fiscal year ended October 31, 2008, the Series designated 100% of the ordinary income dividends as qualified for the reduced tax rate under The Job and Growth Tax Relief Reconciliation Act of 2003.
For the fiscal year ended October 31, 2008, the Series intends on passing through $3,242,443 of ordinary income distributions as a foreign tax credit from recognized foreign source income of $29,908,203.
In January 2009, you will be advised on IRS Form 1099DIV or Substitute Form 1099DIV as to the federal tax status of dividends and distributions received by you in calendar year 2008.
| | |
| Dryden International Equity Fund | | 57 |
MANAGEMENT OF THE FUND
(Unaudited)
Information about Fund Directors/Trustees (referred to herein as “Board Members”) and Fund Officers is set forth below. Board Members who are not deemed to be “interested persons,” as defined in the 1940 Act, are referred to as “Independent Board Members.” Board Members who are deemed to be “interested persons” are referred to as “Interested Board Members.” The Board Members are responsible for the overall supervision of the operations of the Fund and perform the various duties imposed on the directors or trustees of investment companies by the 1940 Act.
Independent Board Members
| | | | |
Name, Address, Age Position(s) Portfolios Overseen (1) | | Principal Occupation(s) During Past Five Years | | Other Directorships Held |
Kevin J. Bannon (56) Board Member Portfolios Overseen: 62 | | Managing Director (since April 2008) of Highmount Capital LLC (registered investment adviser); formerly Executive Vice President and Chief Investment Officer (April 1993-August 2007) of Bank of New York Company; President (May 2003-May 2007) of BNY Hamilton Family of Mutual Funds. | | Director of Urstadt Biddle Properties (since September 2008) |
| | | |
Linda W. Bynoe (56) Board Member Portfolios Overseen: 62 | | President and Chief Executive Officer (since March 1995) of Telemat Ltd. (management consulting); formerly Vice President at Morgan Stanley Co (broker-dealer). | | Director of Simon Property Group, Inc. (real estate investment trust) (since May 2003); Director of Anixter International (communication products distributor) (since January 2006); Director of Northern Trust Corporation (banking) (since April 2006). |
| | | |
David E.A. Carson (74) Board Member Portfolios Overseen: 62 | | Director (since May 2008) of Liberty Bank; Director (since October 2007) of ICI Mutual Insurance Company; formerly President, Chairman and Chief Executive Officer of People’s Bank (1987 – 2000). | | None. |
| | | |
Michael S. Hyland, CFA (63) Board Member Portfolios Overseen: 62 | | Independent Consultant (since February 2005); formerly Senior Managing Director (July 2001-February 2005) of Bear Stearns Co, Inc.; Global Partner, INVESCO (1999-2001); Managing Director and President Salomon Brothers Asset Management (1989-1999). | | None. |
| | | |
Robert E. La Blanc (74) Board Member Portfolios Overseen: 62 | | President (since 1981) of Robert E. La Blanc Associates, Inc. (telecommunications). | | Director of CA, Inc. (since 2002) (software company); FiberNet Telecom Group, Inc. (since 2003) (telecom company). |
Visit our website at www.jennisondryden.com
| | | | |
| | | |
Douglas H. McCorkindale (69) Board Member Portfolios Overseen: 62 | | Formerly Chairman (February 2001-June 2006), Chief Executive Officer (June 2000-July 2005), President (September 1997-July 2005) and Vice Chairman (March 1984-May 2000) of Gannett Co. Inc. (publishing and media). | | Director of Continental Airlines, Inc. (since May 1993); Director of Lockheed Martin Corp. (aerospace and defense) (since May 2001). |
| | | |
Stephen P. Munn (66) Board Member Portfolios Overseen: 62 | | Lead Director (since 2007) and formerly Chairman (1993-2007) of Carlisle Companies Incorporated (manufacturer of industrial products). | | None. |
| | | |
Richard A. Redeker (65) Board Member Portfolios Overseen: 62 | | Retired Mutual Fund Executive (36 years); Management Consultant; Director of Penn Tank Lines, Inc. (since 1999). | | None. |
| | | |
Robin B. Smith (69) Board Member & Independent Chair Portfolios Overseen: 62 | | Chairman of the Board (since January 2003) of Publishers Clearing House (direct marketing); formerly Chairman and Chief Executive Officer (August 1996-January 2003) of Publishers Clearing House. | | Formerly Director of BellSouth Corporation (telecommunications) (1992-2006). |
| | | |
Stephen G. Stoneburn (65) Board Member Portfolios Overseen: 62 | | President and Chief Executive Officer (since June 1996) of Quadrant Media Corp. (publishing company); formerly President (June 1995-June 1996) of Argus Integrated Media, Inc.; Senior Vice President and Managing Director (January 1993-1995) of Cowles Business Media; Senior Vice President of Fairchild Publications, Inc (1975-1989). | | None. |
Interested Board Members |
Judy A. Rice (60) Board Member & President Portfolios Overseen: 62 | | President, Chief Executive Officer, Chief Operating Officer and Officer-In-Charge (since February 2003) of Prudential Investments LLC; President, Chief Executive Officer and Officer-In-Charge (since April 2003) of Prudential Mutual Fund Services LLC; formerly Vice President (February 1999-April 2006) of Prudential Investment Management Services LLC; formerly President, Chief Executive Officer, Chief Operating Officer and Officer-In-Charge (May 2003-June 2005) and Director (May 2003-March 2006) and Executive Vice President (June 2005-March 2006) of AST Investment Services, Inc.; Member of Board of Governors of the Investment Company Institute. | | None. |
Dryden International Equity Fund
| | | | |
| | | |
Robert F. Gunia (62) Board Member & Vice President Portfolios Overseen: 146 | | Chief Administrative Officer (since September 1999) and Executive Vice President (since December 1996) of Prudential Investments LLC; President (since April 1999) of Prudential Investment Management Services LLC; Executive Vice President (since March 1999) and Treasurer (since May 2000) of Prudential Mutual Fund Services LLC; Chief Administrative Officer, Executive Vice President and Director (since May 2003) of AST Investment Services, Inc. | | Director (since May 1989) of The Asia Pacific Fund, Inc. and Vice President (since January 2007) of The Greater China Fund, Inc. |
1 | The year that each individual joined the Fund’s Board is as follows: |
Linda W. Bynoe, 2005; David E.A. Carson, 2003; Robert E. La Blanc, 1984; Douglas H. McCorkindale, 2003; Richard A. Redeker, 2003; Robin B. Smith, 1996; Stephen G. Stoneburn, 1996; Kevin J. Bannon, 2008; Michael S. Hyland, 2008; Stephen P. Munn, 2008; Judy A. Rice, Board Member since 2000 and President since 2003; Robert F. Gunia, Board Member since 1996 and Vice President since 1999.
Visit our website at www.jennisondryden.com
Fund Officers (a)(1)
| | |
Name, Address and Age Position with Fund | | Principal Occupation(s) During Past Five Years |
Kathryn L. Quirk (56) Chief Legal Officer | | Vice President and Corporate Counsel (since September 2004) of Prudential; Executive Vice President, Chief Legal Officer and Secretary (since July 2005) of PI and Prudential Mutual Fund Services LLC; Vice President and Corporate Counsel (since June 2005) and Secretary (since February 2006) of AST Investment Services, Inc.; formerly Senior Vice President and Assistant Secretary (November 2004-August 2005) of PI; formerly Assistant Secretary (June 2005-February 2006) of AST Investment Services, Inc.; formerly Managing Director, General Counsel, Chief Compliance Officer, Chief Risk Officer and Corporate Secretary (1997-2002) of Zurich Scudder Investments, Inc. |
| | |
Deborah A. Docs (50) Secretary | | Vice President and Corporate Counsel (since January 2001) of Prudential; Vice President (since December 1996) and Assistant Secretary (since March 1999) of PI; formerly Vice President and Assistant Secretary (May 2003-June 2005) of AST Investment Services, Inc. |
| | |
Jonathan D. Shain (50) Assistant Secretary | | Vice President and Corporate Counsel (since August 1998) of Prudential; Vice President and Assistant Secretary (since May 2001) of PI; Vice President and Assistant Secretary (since February 2001) of PMFS; formerly Vice President and Assistant Secretary (May 2003-June 2005) of AST Investment Services, Inc. |
| | |
Claudia DiGiacomo (34) Assistant Secretary | | Vice President and Corporate Counsel (since January 2005) of Prudential; Vice President and Assistant Secretary of PI (since December 2005); Associate at Sidley Austin LLP (1999-2004). |
| | |
John P. Schwartz (37) Assistant Secretary | | Vice President and Corporate Counsel (since April 2005) of Prudential; Vice President and Assistant Secretary of PI (since December 2005); Associate at Sidley Austin LLP (1997-2005). |
| | |
Andrew R. French (46) Assistant Secretary | | Director and Corporate Counsel (since May 2006) of Prudential; Vice President and Assistant Secretary (since January 2007) of PI; Vice President and Assistant Secretary (since January 2007) of PMFS; formerly Senior Legal Analyst of Prudential Mutual Fund Law Department (1997-2006). |
| | |
Timothy J. Knierim (49) Chief Compliance Officer | | Chief Compliance Officer of Prudential Investment Management, Inc. (PIM) (since July 2007); formerly Chief Risk Officer of PIM and PI (2002-2007) and formerly Chief Ethics Officer of PIM and PI (2006-2007). |
| | |
Valerie M. Simpson (50) Deputy Chief Compliance Officer | | Chief Compliance Officer (since April 2007) of PI and AST Investment Services, Inc.; formerly Vice President-Financial Reporting (June 1999-March 2006) for Prudential Life and Annuities Finance. |
| | |
Theresa C. Thompson (46) Deputy Chief Compliance Officer | | Vice President, Mutual Fund Compliance, PI (since April 2004); and Director, Compliance, PI (2001 - 2004). |
Dryden International Equity Fund
| | |
| | |
Noreen M. Fierro (44) Anti-Money Laundering Compliance Officer | | Vice President, Corporate Compliance (since May 2006) of Prudential; formerly Corporate Vice President, Associate General Counsel (April 2002-May 2005) of UBS Financial Services, Inc., in their Money Laundering Prevention Group; Senior Manager (May 2005-May 2006) of Deloitte Financial Advisory Services, LLP, in their Forensic and Dispute Services, Anti-Money Laundering Group. |
| | |
Grace C. Torres (49) Treasurer and Principal Financial and Accounting Officer | | Assistant Treasurer (since March 1999) and Senior Vice President (since September 1999) of PI; Assistant Treasurer (since May 2003) and Vice President (since June 2005) of AST Investment Services, Inc.; Senior Vice President and Assistant Treasurer (since May 2003) of Prudential Annuities Advisory Services, Inc.; formerly Senior Vice President (May 2003-June 2005) of AST Investment Services, Inc. |
| | |
M. Sadiq Peshimam (44) Assistant Treasurer | | Vice President (since 2005) and Director (2000-2005) within Prudential Mutual Fund Administration. |
| | |
Peter Parrella (50) Assistant Treasurer | | Vice President (since 2007) and Director (2004-2007) within Prudential Mutual Fund Administration; formerly Tax Manager at SSB Citi Fund Management LLC (1997-2004). |
(a) | Excludes interested Board Members who also serve as President or Vice President. |
1 | The year that each individual became an officer of the Fund is as follows: |
Kathryn L. Quirk, 2005; Deborah A. Docs, 2005; Jonathan D. Shain, 2005; Claudia DiGiacomo, 2005; John P. Schwartz, 2006; Andrew R. French, 2006; Timothy J. Knierim, 2007; Valerie M. Simpson, 2007; Theresa C. Thompson, 2008; Noreen M. Fierro, 2006; Grace C. Torres, 1995; Sadiq Peshimam, 2006; Peter Parrella, 2007.
Explanatory Notes
| | • | | Board Members are deemed to be “Interested,” as defined in the 1940 Act, by reason of their affiliation with Prudential Investments LLC and/or an affiliate of Prudential Investments LLC. |
| | • | | Unless otherwise noted, the address of all Board Members and Officers is c/o Prudential Investments LLC, Gateway Center Three, 100 Mulberry Street, Newark, New Jersey 07102. |
| | • | | There is no set term of office for Board Members or Officers. The Board Members have adopted a retirement policy, which calls for the retirement of Board Members on December 31st of the year in which they reach the age of 75. |
| | • | | “Other Directorships Held” includes only directorships of companies required to register or file reports with the SEC under the Securities Exchange Act of 1934 (that is, “public companies”) or other investment companies registered under the 1940 Act. |
| | • | | “Portfolios Overseen” includes all investment companies managed by Prudential Investments LLC. The investment companies for which PI serves as manager include the JennisonDryden Funds, Strategic Partners Funds, The Prudential Variable Contract Accounts, The Target Portfolio Trust, The Prudential Series Fund, The High Yield Income Fund, Inc., The High Yield Plus Fund, Inc., Nicholas-Applegate Fund, Inc., Prudential’s Gibraltar Fund, Inc. and the Advanced Series Trust. |
Visit our website at www.jennisondryden.com
Approval of Advisory Agreements
The Board of Directors (the “Board”) of Prudential World Fund, Inc. oversees the management of the Dryden International Equity Fund (the “Fund”) and, as required by law, determines annually whether to renew the Fund’s management agreement with Prudential Investments LLC (“PI”) and the Fund’s subadvisory agreement with Quantitative Management Associates LLC (“QMA”). In considering the renewal of the agreements, the Board, including all of the Independent Directors, met on June 3-5, 2008 and approved the renewal of the agreements through July 31, 2009, after concluding that renewal of the agreements was in the best interests of the Fund and its shareholders.
In advance of the meetings, the Board received materials relating to the agreements, and had the opportunity to ask questions and request further information in connection with their consideration. Among other things, the Board considered comparisons with other mutual funds in relevant Peer Universes and Peer Groups. The mutual funds included in each Peer Universe or Peer Group were objectively determined solely by Lipper Inc., an independent provider of mutual fund data. The comparisons placed the Fund in various quartiles over one-, three- and five-year periods ending December 31, 2007, with the first quartile being the best 25% of the mutual funds (for performance, the best performing mutual funds and, for expenses, the lowest cost mutual funds).
In approving the agreements, the Board, including the Independent Directors advised by independent legal counsel, considered the factors they deemed relevant, including the nature, quality and extent of services provided, the performance of the Fund, the profitability of PI and its affiliates, expenses and fees, and the potential for economies of scale that may be shared with the Fund and its shareholders. In their deliberations, the Directors did not identify any single factor which alone was responsible for the Board’s decision to approve the agreements with respect to the Fund. In connection with their deliberations, the Board considered information provided by PI throughout the year at regular Board meetings, presentations from portfolio managers and other information, as well as information furnished at or in advance of the meetings on June 3-5, 2008.
The Directors determined that the overall arrangements between the Fund and PI, which serves as the Fund’s investment manager pursuant to a management agreement, and between PI and QMA, which serves as the Fund’s subadviser pursuant to the terms of a subadvisory agreement with PI, are fair and reasonable in light of the services performed, fees charged and such other matters as the Directors considered relevant in the exercise of their business judgment.
| | |
| Dryden International Equity Fund | | |
Approval of Advisory Agreements (continued)
The material factors and conclusions that formed the basis for the Directors’ reaching their determinations to approve the continuance of the agreements are separately discussed below.
Nature, Quality, and Extent of Services
The Board received and considered information regarding the nature and extent of services provided to the Fund by PI and QMA. The Board considered the services provided by PI, including but not limited to the oversight of the subadviser for the Fund, as well as the provision of fund recordkeeping, compliance, and other services to the Fund. With respect to PI’s oversight of the subadviser, the Board noted that PI’s Strategic Investment Research Group (“SIRG”), which is a business unit of PI, is responsible for monitoring and reporting to PI’s senior management on the performance and operations of the subadviser. The Board also considered that PI pays the salaries of all of the officers and non-independent Directors of the Fund. The Board also considered the investment subadvisory services provided by QMA, as well as adherence to the Fund’s investment restrictions and compliance with applicable Fund policies and procedures. The Board considered PI’s evaluation of the subadviser, as well as PI’s recommendation, based on its review of the subadviser, to renew the subadvisory agreement.
The Board reviewed the qualifications, backgrounds and responsibilities of PI’s senior management responsible for the oversight of the Fund and QMA, and also reviewed the qualifications, backgrounds and responsibilities of QMA’s portfolio managers who are responsible for the day-to-day management of the Fund’s portfolio. The Board was provided with information pertaining to PI’s and QMA’s organizational structure, senior management, investment operations, and other relevant information pertaining to both PI and QMA. The Board also noted that it received favorable compliance reports from the Fund’s Chief Compliance Officer (“CCO”) as to both PI and QMA. The Board noted that QMA is affiliated with PI.
The Board concluded that it was satisfied with the nature, extent and quality of the investment management services provided by PI and the subadvisory services provided to the Fund by QMA, and that there was a reasonable basis on which to conclude that the Fund benefits from the services provided by PI and QMA under the management and subadvisory agreements.
Performance of Dryden International Equity Fund
The Board received and considered information about the Fund’s historical performance. The Board considered that the Fund’s gross performance in relation to its Peer Universe (the Lipper International Multi-Cap Core Funds Performance
| | |
| | Visit our website at www.jennisondryden.com |
Universe)1 was in the first quartile over the five-year period, the third quartile over the three-year period, and was in the fourth quartile over the one-year period. The Board also noted that the Fund underperformed its benchmark index over the one-year period, but outperformed the benchmark index over the three- and five-year periods. The Board concluded that, in light of the Fund’s competitive performance over longer periods, it would be in the interest of the Fund and its shareholders for the Fund to renew the agreements.
Fees and Expenses
The Board considered the Fund’s actual management fees (which reflects any subsidies, expense caps or waivers) ranked in the Expense Group’s first quartile and that the Fund’s total expenses ranked in the second quartile. The Board concluded that the management and subadvisory fees are reasonable in light of the services provided.
Costs of Services and Profits Realized by PI
The Board was provided with information on the profitability of PI and its affiliates in serving as the Fund’s investment manager. The Board discussed with PI the methodology utilized in assembling the information regarding profitability and considered its reasonableness. The Board recognized that it is difficult to make comparisons of profitability from fund management contracts because comparative information is not generally publicly available and is affected by numerous factors, including the structure of the particular adviser, the types of funds it manages, its business mix, numerous assumptions regarding allocations and the adviser’s capital structure and cost of capital. The Board did not separately consider the profitability of the subadviser, an affiliate of PI, as its profitability was reflected in the profitability report for PI. Taking these factors into account, the Board concluded that the profitability of PI and its affiliates in relation to the services rendered was not unreasonable.
Economies of Scale
The Board received and discussed information concerning whether PI realizes economies of scale as the Fund’s assets grow beyond current levels. The Board noted that the management fee schedule for the Fund includes breakpoints, which have the effect of decreasing the fee rate as assets increase, but at the current level of assets the Fund does not realize the effect of those rate reductions. The Board took note that the Fund’s fee structure would result in benefits to Fund shareholders when (and if) assets
1 | Although Lipper classifies the Fund in its International Multi-Cap Growth Funds Performance Universe, the International Multi-Cap Core Funds Performance Universe was utilized because PI believes that the funds included in this Universe provide a more appropriate basis for Fund performance comparisons. |
| | |
| Dryden International Equity Fund | | |
Approval of Advisory Agreements (continued)
reach the levels at which the fee rate is reduced. These benefits will accrue whether or not PI is then realizing any economies of scale.
Other Benefits to PI and QMA
The Board considered potential ancillary benefits that might be received by PI and QMA and their affiliates as a result of their relationship with the Fund. The Board concluded that potential benefits to be derived by PI included brokerage commissions received by affiliates of PI, transfer agency fees received by the Fund’s transfer agent (which is affiliated with PI), and benefits to the reputation as well as other intangible benefits resulting from PI’s association with the Fund. The Board concluded that the potential benefits to be derived by QMA included its ability to use soft dollar credits, brokerage commissions received by affiliates of QMA, as well as the potential benefits consistent with those generally resulting from an increase in assets under management, specifically, potential access to additional research resources and benefits to the reputation. The Board concluded that the benefits derived by PI and QMA were consistent with the types of benefits generally derived by investment managers and subadvisers to mutual funds.
After full consideration of these factors, the Board concluded that the approval of the agreements was in the best interest of the Fund and its shareholders.
| | |
| | Visit our website at www.jennisondryden.com |
Growth of a $10,000 Investment
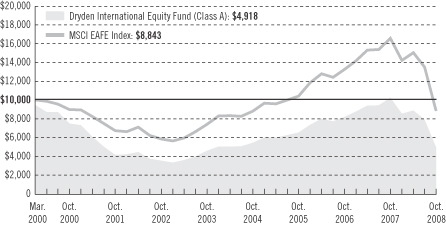
| | | | | | | | | |
| Average Annual Total Returns (With Sales Charges) as of 10/31/08 | |
| | | One Year | | | Five Years | | | Since Inception | |
Class A | | –54.51 | % | | 0.32 | % | | –7.86 | % |
Class B | | –54.51 | | | 0.49 | | | –7.96 | |
Class C | | –52.68 | | | 0.68 | | | –7.96 | |
Class F | | –54.39 | | | N/A | | | –27.75 | |
Class L | | –54.82 | | | N/A | | | –32.30 | |
Class M | | –54.97 | | | N/A | | | –32.22 | |
Class X | | –54.97 | | | N/A | | | –32.22 | |
Class Z | | –51.77 | | | 1.67 | | | –7.06 | |
| | | | | | | | | |
| Average Annual Total Returns (Without Sales Charges) as of 10/31/08 | |
| | | One Year | | | Five Years | | | Since Inception | |
Class A | | –51.87 | % | | 1.46 | % | | –7.26 | % |
Class B | | –52.22 | | | 0.68 | | | –7.96 | |
Class C | | –52.22 | | | 0.68 | | | –7.96 | |
Class F | | –52.10 | | | N/A | | | –26.23 | |
Class L | | –52.07 | | | N/A | | | –29.79 | |
Class M | | –52.22 | | | N/A | | | –30.14 | |
Class X | | –52.22 | | | N/A | | | –30.14 | |
Class Z | | –51.77 | | | 1.67 | | | –7.06 | |
Performance data quoted represent past performance. Past performance does not guarantee future results. The investment return and principal value of an investment will fluctuate, so that an investor’s shares, when redeemed, may be worth more or less than their original cost. Current performance may be lower or higher than the past performance data quoted. An investor may obtain performance data as of the most recent month-end by visiting our website at www.jennisondryden.com or by
| | |
| | Visit our website at www.jennisondryden.com |
calling (800) 225-1852. The maximum initial sales charge is 5.50%. Gross operating expenses: Class A, 1.45%; Class B, 2.15%; Class C, 2.15%; Class F, 1.90%; Class L, 1.65%; Class M, 2.15%; Class X, 2.15%; Class Z, 1.15%. Net operating expenses apply to: Class A, 1.43%; Class B, 2.15%; Class C, 2.15%; Class F, 1.90%; Class L, 1.65%; Class M, 2.15%; Class X, 2.15%; Class Z, 1.15%, after contractual reduction through 2/28/2008 for Class A.
The returns in the graph and the tables do not reflect the deduction of taxes that a shareholder would pay on Fund distributions or following the redemption of Fund shares.
Source: Prudential Investments LLC and Lipper Inc.
Inception dates: Class A, Class B, Class C, and Class Z, 3/1/00; Class F, 12/18/06; Class L, Class M, and Class X, 3/19/07.
The graph compares a $10,000 investment in the Dryden International Equity Fund (Class A shares) with a similar investment in the MSCI EAFE® Index by portraying the initial account values at the commencement of operations of Class A shares (March 1, 2000) and the account values at the end of the current fiscal year (October 31, 2008) as measured on a quarterly basis. For purposes of the graph, and unless otherwise indicated, it has been assumed that (a) the maximum applicable front-end sales charge was deducted from the initial $10,000 investment in Class A shares; (b) all recurring fees (including management fees) were deducted; and (c) all dividends and distributions were reinvested. The line graph provides information for Class A shares only. As indicated in the tables provided earlier, performance for Class B, Class C, Class F, Class L, Class M, Class X, and Class Z shares will vary due to the differing charges and expenses applicable to each share class (as indicated in the following paragraphs). Without the distribution and service (12b-1) fee waiver of 0.05% for Class A shares in effect through October 31, 2008, the returns shown in the graph and for Class A shares in the tables would have been lower.
The MSCI EAFE® Index is an unmanaged, weighted index of performance that reflects stock price movements of developed-country markets in Europe, Australasia, and the Far East. The MSCI EAFE® Index’s total returns include the reinvestment of all dividends, but do not include the effects of sales charges, operating expenses of a mutual fund, or taxes. These returns would be lower if they included the effects of sales charges, operating expenses, or taxes. The securities that comprise the MSCI EAFE® Index may differ substantially from the securities in the Fund. The MSCI EAFE® Index is not the only index that may be used to characterize performance of global/international stock funds. Other indexes may portray different comparative performance. Investors cannot invest directly in an index.
Class A and Class L shares are subject to a maximum front-end sales charge of 5.50%, and 5.75%, respectively, a 12b-1 fee of up to 0.30% and 0.50%, respectively annually, and all investors who purchase Class A and Class L shares in an amount of $1 million or more and sell these shares within 12 months of purchase are subject to a contingent deferred sales charge (CDSC) of 1%. Class B and Class F shares are subject to a declining CDSC of 5%, 4%, 3%, 2%, 1%, and 1%, respectively for the first six years after purchase and 12b-1 fees of 1% and 0.75%, respectively, annually. Approximately seven years after purchase, Class B and Class F shares will automatically convert to Class A shares on a quarterly basis. Class C shares are not subject to a front-end sales charge, but charge a CDSC of 1% for Class C shares sold within 12 months from the date of purchase and an annual 12b-1 fee of 1%. Class M and Class X shares purchased are not subject to a front-end sales charge, but charge a CDSC of 6% and a 12b-1 fee of 1%. The CDSC for Class M and Class X shares decreases by 1% annually to 2% in the fifth and sixth years after purchase, 1% in the seventh year and 0% in the eighth year after purchase. Class M and Class X shares convert to Class A shares approximately eight years after purchase. The returns in the graph and tables reflect the share class expense structure in effect at the close of the fiscal period. The returns in the graph and the tables do not reflect the deduction of taxes that a shareholder would pay on Fund distributions or following the redemption of Fund shares.
| | |
| Dryden International Equity Fund | | |
| | | | |
| n MAIL | | n TELEPHONE | | n WEBSITE |
Gateway Center Three 100 Mulberry Street Newark, NJ 07102 | | (800) 225-1852 | | www.jennisondryden.com |
|
| PROXY VOTING |
| The Board of Directors of the Fund has delegated to the Fund’s investment subadviser the responsibility for voting any proxies and maintaining proxy recordkeeping with respect to the Fund. A description of these proxy voting policies and procedures is available without charge, upon request, by calling (800) 225-1852 or by visiting the Securities and Exchange Commission’s website at www.sec.gov. Information regarding how the Fund voted proxies relating to portfolio securities during the most recent 12-month period ended June 30 is available on the Fund’s website and on the Commission’s website. |
|
| DIRECTORS |
| Kevin J. Bannon • Linda W. Bynoe • David E.A. Carson • Robert F. Gunia • Michael S. Hyland • Robert E. La Blanc • Douglas H. McCorkindale • Stephen P. Munn • Richard A. Redeker • Judy A. Rice • Robin B. Smith • Stephen G. Stoneburn |
|
| OFFICERS |
| Judy A. Rice, President • Robert F. Gunia, Vice President • Grace C. Torres, Treasurer and Principal Financial and Accounting Officer • Kathryn L. Quirk, Chief Legal Officer • Deborah A. Docs, Secretary • Timothy J. Knierim, Chief Compliance Officer • Valerie M. Simpson, Deputy Chief Compliance Officer • Theresa C. Thompson, Deputy Chief Compliance Officer • Noreen M. Fierro, Anti-Money Laundering Compliance Officer • Jonathan D. Shain, Assistant Secretary • Claudia DiGiacomo, Assistant Secretary • John P. Schwartz, Assistant Secretary • Andrew R. French, Assistant Secretary • M. Sadiq Peshimam, Assistant Treasurer • Peter Parrella, Assistant Treasurer |
| | | | |
| MANAGER | | Prudential Investments LLC | | Gateway Center Three
100 Mulberry Street
Newark, NJ 07102 |
|
| INVESTMENT SUBADVISER | | Quantitative Management
Associates LLC | | Gateway Center Two
100 Mulberry Street
Newark, NJ 07102 |
|
| DISTRIBUTOR | | Prudential Investment
Management Services LLC | | Gateway Center Three
100 Mulberry Street
Newark, NJ 07102 |
|
| CUSTODIAN | | The Bank of New York Mellon | | One Wall Street
New York, NY 10286 |
|
| TRANSFER AGENT | | Prudential Mutual Fund
Services LLC | | PO Box 9658
Providence, RI 02940 |
|
| INDEPENDENT REGISTERED PUBLIC ACCOUNTING FIRM | | KPMG LLP | | 345 Park Avenue
New York, NY 10154 |
|
| FUND COUNSEL | | Sullivan & Cromwell LLP | | 125 Broad Street
New York, NY 10004 |
|
| An investor should consider the investment objectives, risks, charges, and expenses of the Fund carefully before investing. The prospectus for the Fund contains this and other information about the Fund. An investor may obtain a prospectus by visiting our website at www.jennisondryden.com or by calling (800) 225-1852. The prospectus should be read carefully before investing. |
|
| E-DELIVERY |
To receive your mutual fund documents on-line, go to www.icsdelivery.com/prudential/funds and enroll. Instead of receiving printed documents by mail, you will receive notification via
e-mail when new materials are available. You can cancel your enrollment or change your
e-mail address at any time by clicking on the change/cancel enrollment option at the icsdelivery website address. |
|
| SHAREHOLDER COMMUNICATIONS WITH DIRECTORS |
| Shareholders can communicate directly with the Board of Directors by writing to the Chair of the Board, Dryden International Equity Fund, Prudential Investments, Attn: Board of Directors, 100 Mulberry Street, Gateway Center Three, Newark, NJ 07102. Shareholders can communicate directly with an individual Director by writing to the same address. Communications are not screened before being delivered to the addressee. |
|
| AVAILABILITY OF PORTFOLIO SCHEDULE |
| The Fund files its complete schedule of portfolio holdings with the Securities and Exchange Commission for the first and third quarters of each fiscal year on Form N-Q. The Fund’s Forms N-Q are available on the Commission’s website at www.sec.gov. The Fund’s Forms N-Q may also be reviewed and copied at the Commission’s Public Reference Room in Washington, D.C. Information on the operation and location of the Public Reference Room may be obtained by calling (202) 551-8090. The Fund’s schedule of portfolio holdings is also available on the Fund’s website as of the end of each fiscal quarter. |
|
| The Fund’s Statement of Additional Information contains additional information about the Fund’s Directors and is available without charge, upon request, by calling (800) 225-1852. |
Mutual Funds:
| | | | |
| ARE NOT INSURED BY THE FDIC OR ANY FEDERAL GOVERNMENT AGENCY | | MAY LOSE VALUE | | ARE NOT A DEPOSIT OF OR GUARANTEED BY ANY BANK OR ANY BANK AFFILIATE |

| | | | | | | | | | | | | | | | | | | | |
| Dryden International Equity Fund | | | | | | | | | | | | | | |
| | | Share Class | | A | | B | | C | | F | | L | | M | | X | | Z | | |
| | NASDAQ | | PJRAX | | PJRBX | | PJRCX | | N/A | | DEILX | | DEIMX | | DEIQX | | PJIZX | | |
| | CUSIP | | 743969859 | | 743969867 | | 743969875 | | 743969842 | | 743969834 | | 743969826 | | 743969818 | | 743969883 | | |
| | | | | | | | | | | | | | | | | | | | |
MF190E IFS-A159554 Ed. 12/2008


| | |
| OCTOBER 31, 2008 | | ANNUAL REPORT |
Dryden International Value Fund
FUND TYPE
International stock
OBJECTIVE
Long-term growth of capital
This report is not authorized for distribution to prospective investors unless preceded or accompanied by a current prospectus.
The views expressed in this report and information about the Fund’s portfolio holdings are for the period covered by this report and are subject to change thereafter.
JennisonDryden, Dryden, Prudential Financial and the Rock Prudential logo are registered service marks of The Prudential Insurance Company of America, Newark, NJ, and its affiliates.

December 15, 2008
Dear Shareholder:
We hope you find the annual report for the Dryden International Value Fund informative and useful. Because market volatility climbed sharply in 2008, we understand that this is a difficult time to be an investor. While it is impossible to predict what the future holds, we continue to believe a prudent response to uncertainty is to maintain a diversified portfolio, including stock and bond mutual funds consistent with your tolerance for risk, time horizon, and financial goals.
A diversified asset allocation offers two potential advantages: it limits your exposure to any particular asset class, plus it provides a better opportunity to invest some of your assets in the right place at the right time. Your financial professional can help you create a diversified investment plan that may include mutual funds covering all the basic asset classes and that reflects your personal investor profile and risk tolerance. Keep in mind that diversification and asset allocation strategies do not assure a profit or protect against loss in declining markets.
JennisonDryden Mutual Funds give you a wide range of choices that can help you make progress toward your financial goals. Our funds offer the experience, resources, and professional discipline of four leading asset managers. JennisonDryden equity funds are advised by Jennison Associates LLC, Quantitative Management Associates LLC (QMA), or PREI® (Prudential Real Estate Investors). Prudential Investment Management, Inc. (PIM) advises the JennisonDryden fixed income and money market funds through its unit Prudential Fixed Income Management. Jennison Associates, QMA, and PIM are registered investment advisers and Prudential Financial companies. PREI is a unit of PIM.
Thank you for choosing JennisonDryden Mutual Funds.
Sincerely,

Judy A. Rice, President
Dryden International Value Fund
| | |
| Dryden International Value Fund | | 1 |
Your Fund’s Performance
Fund objective
The investment objective of the Dryden International Value Fund is long-term growth of capital through investment in equity securities of foreign issuers. There can be no assurance that the Fund will achieve its investment objective.
Performance data quoted represent past performance. Past performance does not guarantee future results. The investment return and principal value of an investment will fluctuate, so that an investor’s shares, when redeemed, may be worth more or less than their original cost. Current performance may be lower or higher than the past performance data quoted. An investor may obtain performance data as of the most recent month-end by visiting our website at www.jennisondryden.com or by calling (800) 225-1852. The maximum initial sales charge is 5.50% (Class A shares). Gross operating expenses: Class A, 1.61%; Class B, 2.31%; Class C, 2.31%; Class Z, 1.31%. Net operating expenses apply to: Class A, 1.56%; Class B, 2.31%; Class C, 2.31%; Class Z, 1.31%, after contractual reduction through 2/28/2010.
| | | | | | | | | |
| Cumulative Total Returns as of 10/31/08 | |
| | | One Year | | | Five Years | | | Ten Years | |
Class A | | –48.33 | % | | 21.65 | % | | 23.86 | % |
Class B | | –48.74 | | | 17.03 | | | 14.68 | |
Class C | | –48.74 | | | 17.02 | | | 14.80 | |
Class Z | | –48.23 | | | 22.98 | | | 26.76 | |
MSCI EAFE® ND Index1 | | –46.62 | | | 19.32 | | | 17.98 | |
Lipper International Large-Cap Core Funds Avg.2 | | –47.80 | | | 13.41 | | | 13.75 | |
| | | | | | | | | |
| Average Annual Total Returns3 as of 9/30/08 | |
| | | One Year | | | Five Years | | | Ten Years | |
Class A | | –35.66 | % | | 8.66 | % | | 4.66 | % |
Class B | | –35.37 | | | 8.92 | | | 4.45 | |
Class C | | –33.02 | | | 9.05 | | | 4.46 | |
Class Z | | –31.73 | | | 10.15 | | | 5.51 | |
MSCI EAFE® ND Index1 | | –30.50 | | | 9.69 | | | 5.02 | |
Lipper International Large-Cap Core Funds Avg.2 | | –30.65 | | | 8.68 | | | 4.50 | |
The cumulative total returns do not reflect the deduction of applicable sales charges. If reflected, the applicable sales charges would reduce the cumulative total returns performance quoted. Class A shares are subject to a maximum front-end sales charge of 5.50%. Under certain circumstances, Class A shares may be subject to a contingent deferred sales charge (CDSC) of 1%. Class B and Class C shares are subject to a maximum CDSC of 5% and 1%, respectively. Class Z shares are not subject to a sales charge.
| | |
| 2 | | Visit our website at www.jennisondryden.com |
Source: Prudential Investments LLC and Lipper Inc. Performance figures may reflect fee waivers and/or expense reimbursements. In the absence of such fee waivers and/or expense reimbursements, total returns would be lower.
1The Morgan Stanley Capital International Europe, Australasia, and Far East Index (MSCI EAFE® ND Index) is an unmanaged, weighted index of performance that reflects stock price movements of developed-country markets in Europe, Australasia, and the Far East. The ND version of the MSCI EAFE Index reflects the impact of the maximum withholding taxes on reinvested dividends.
2The Lipper International Large-Cap Core Funds Average (Lipper Average) represents returns based on an average return of all funds in the Lipper International Large-Cap Core Funds category. Funds in the Lipper Average invest at least 75% of their equity assets in companies strictly outside of the United States with market capitalizations (on a three-year weighted basis) greater than the 250th largest company in the S&P Developed ex-U.S. Broad Market Index (BMI). Large-cap core funds typically have an average price-to-cash flow ratio, price-to-book ratio, and three-year sales-per-share growth value compared with the S&P Developed ex-U.S. BMI.
3The average annual total returns take into account applicable sales charges. Class A, Class B, and Class C shares are subject to an annual distribution and service (12b-1) fee of up to 0.30%, 1.00%, and 1.00%, respectively. Approximately seven years after purchase, Class B shares will automatically convert to Class A shares on a quarterly basis. Class Z shares are not subject to a 12b-1 fee. The returns in the tables do not reflect the deduction of taxes that a shareholder would pay on Fund distributions or following the redemption of Fund shares.
Investors cannot invest directly in an index. The returns for the MSCI EAFE® ND Index and the Lipper Average would be lower if they included the effects of sales charges, operating expenses, or taxes. Returns for the Lipper Average reflect the deduction of operating expenses of a mutual fund, but not sales charges or taxes.
| | | |
| Five Largest Holdings expressed as a percentage of net assets as of 10/31/08 | | | |
Teva Pharmaceutical Industries Ltd., Pharmaceuticals | | 2.3 | % |
Toyota Motor Corp., Automobile Manufacturers | | 2.1 | |
Novo Nordisk A/S, Pharmaceuticals | | 2.0 | |
Nestle SA, Food & Beverages | | 2.0 | |
Roche Holding AG, Pharmaceuticals | | 1.9 | |
Holdings reflect only long-term investments and are subject to change.
| | | |
| Five Largest Industries expressed as a percentage of net assets as of 10/31/08 | | | |
Telecommunications | | 13.3 | % |
Pharmaceuticals | | 11.0 | |
Oil, Gas & Consumable Fuels | | 9.9 | |
Financial—Bank & Trust | | 7.1 | |
Insurance | | 6.7 | |
Industry weightings reflect only long-term investments and are subject to change.
| | |
| Dryden International Value Fund | | 3 |
Strategy and Performance Overview
How did the Fund perform?
The Dryden International Value Fund’s Class A shares declined 48.33% for the 12-month reporting period ended October 31, 2008, trailing the 46.62% decline of the benchmark MSCI EAFE Index (the Index) and the 47.80% decline of the Lipper International Large-Cap Core Funds Average.
What were conditions like in the international stock markets?
The MSCI EAFE Index, a gauge of equity markets of economically developed nations excluding the United States and Canada, declined sharply during the reporting period. In sharp contrast to gains reached during the previous year. International equities were buffeted by investor fears of a global economic recession. As the credit crisis spread more aggressively through the United Kingdom and Europe, financials and real estate markets suffered and Asian markets tumbled. Subsequently, commodity-producing nations in emerging markets were severely affected by plunging demand for energy and materials.
During the reporting period, a series of dramatic events shook the foundation of the financial world. In March, the Federal Reserve intervened to facilitate the sale of the faltering securities firm Bear Stearns, which had been immobilized by liquidity problems. In September, investors saw an extraordinary and alarming series of events: the U.S. government’s takeover of the country’s two largest mortgage providers, Fannie Mae and Freddie Mac, and the world’s largest insurer, AIG; the failure of the investment bank Lehman Brothers; the distressed sales of the commercial banking franchises of Washington Mutual and Wachovia; Bank of America’s agreement in principle to acquire Merrill Lynch; and the conversion of the two remaining global investment banks, Goldman Sachs and Morgan Stanley, to commercial banks.
The hurricane winds of the credit crisis headed toward other markets abroad, particularly in the UK and Europe. In both areas, government interventions were required to support large distressed lending and real estate entities. International markets were further roiled by anxiety over the effectiveness of an approximately $700 billion U.S. bailout plan in order to rescue its financial institutions. Amid these events, the Federal Reserve lowered the target rate for overnight lending between banks to 1.0%. The Bank of England lowered its rate by half a percentage point to 4.5%, while the European Central Bank lowered its rate by 50 basis points to 3.75%.
The lack of available credit drove a sharp increase in the cost of borrowing short-term funds, including overnight money and commercial paper. Correspondingly, Treasury bonds and bills benefited from an extreme flight to quality across all maturities. The ongoing correction in the housing market and the associated debt deflation
| | |
| 4 | | Visit our website at www.jennisondryden.com |
significantly impeded economic activity. The price of oil plunged from a peak of more than $145 per barrel in early July to well under $70 by the end of October on lower near-term demand in the weakening global economy.
All sectors in the Index declined. Some defensive sectors (stocks of companies that tend to remain stable throughout the business cycle) showed slight resilience to market pressure. Healthcare and consumer staples posted the least negative declines, although in the double digits. Energy tanked, dropping almost 40%, due to low demand and a strengthening dollar, and utilities also declined. Consumer discretionary and telecommunications services dropped more than 40%. Industrials and information technology tumbled more than 50%. Materials crumbled due to demand shrinkage for construction projects in China and other emerging economies. Financials was the worst performing sector in the Index, plunging nearly 60%. In precious metals, gold and silver headed lower. As for stock-specific styles, value declined more than growth.
The credit crisis stunted economic growth across continents. In the UK and Europe, economic woes included rising bank bailouts, declining housing markets, and weakness in manufacturing and other sectors. The heaviest weighted countries in the region posted negative returns.
Markets suffered across the Pacific region. Japan sank into recession. Automotive and electronic manufacturers reduced exports to the U.S., China, and other markets abroad. Hong Kong declined on cooling Chinese economic growth. Singapore retreated deeply into negative territory. In emerging markets, Brazil, Russia, India, and China (also referred to as the BRIC group) incurred severe hits. A meltdown in the Russian markets occurred when investors fled due to its military activities in neighboring Georgia and falling energy prices.
How is the Fund managed?
The Fund is managed by LSV Asset Management and Thornburg Investment Management, who were selected in part because of their complementary investment styles. LSV uses a quantitative, deep-value investment strategy and maintains a relatively large number of stocks in its portfolio. Thornburg uses traditional analysis of business fundamentals and a relative value strategy to select a portfolio with fewer and larger individual stock positions than LSV. Whereas LSV has no emerging market exposure, Thornburg may invest as much as 30% of its assets in that area. Emerging market stocks are not included in the Index.
| | |
| Dryden International Value Fund | | 5 |
Strategy and Performance Overview (continued)
What impact did the LSV strategy have on the Fund’s performance?
The LSV portion of the Portfolio underperformed the Index. During the reporting period, equity investors were more concerned with recent news and speculation than with specific information about company fundamentals and valuation levels. LSV’s quantitative models, however, focus on companies that are traded at low valuations, determined by a stock’s earnings-to-price ratio, which is the inverse of the price-to-earnings ratio or P/E. LSV also uses other fundamentally based multiples to indicate a company’s potential near-term improvement. Investor behavior during the reporting period did not reward LSV’s deep-value approach.
What impact did Thornburg’s strategy have on the Fund’s performance?
Thornburg’s slight outperformance relative to the Index for the period was largely due to favorable sector allocations and style factors. A slight bias toward larger cap stocks and the manager’s relative focus on value (i.e., the growth–like end of the value investing spectrum) helped performance, as small caps underperformed large cap stocks and growth outperformed value in non-U.S. markets.
Overall, asset selection and country positioning detracted from relative results. An overweight to the Canadian market along with stock selection in financials, services, capital equipment and materials detracted from relative performance. Positions in telecommunications (Nokia, China Mobile, Telefonica), insurance (AXA, Swiss Re), banking (National Bank of Greece), and diversified financial services (Hong Kong Exchange, UBS, ING) companies detracted significantly as the credit crisis expanded globally and accelerated toward the end of the period. Top detractors in other industries included Nintendo, Carlsberg, and BASF. Contributors to performance included holdings Potash Corp and NTT Docomo.
| | |
| 6 | | Visit our website at www.jennisondryden.com |
Fees and Expenses (Unaudited)
As a shareholder of the Fund, you incur two types of costs: (1) transaction costs, including sales charges (loads) on purchase payments and redemptions, as applicable, and (2) ongoing costs, including management fees, distribution and/or service (12b-1) fees, and other Fund expenses, as applicable. This example is intended to help you understand your ongoing costs (in dollars) of investing in the Fund and to compare these costs with the ongoing costs of investing in other mutual funds.
The example is based on an investment of $1,000 invested on May 1, 2008, at the beginning of the period, and held through the six-month period ended October 31, 2008. The example is for illustrative purposes only; you should consult the Prospectus for information on initial and subsequent minimum investment requirements.
The Fund’s transfer agent may charge additional fees to holders of certain accounts that are not included in the expenses shown in the table on the following page. These fees apply to individual retirement accounts (IRAs) and Section 403(b) accounts. As of the close of the six-month period covered by the table, IRA fees included an annual maintenance fee of $15 per account (subject to a maximum annual maintenance fee of $25 for all accounts held by the same shareholder). Section 403(b) accounts are charged an annual $25 fiduciary maintenance fee. Some of the fees may vary in amount, or may be waived, based on your total account balance or the number of JennisonDryden funds, including the Fund, that you own. You should consider the additional fees that were charged to your Fund account over the six-month period when you estimate the total ongoing expenses paid over the period and the impact of these fees on your ending account value, as these additional expenses are not reflected in the information provided in the expense table. Additional fees have the effect of reducing investment returns.
Actual Expenses
The first line for each share class in the table on the following page provides information about actual account values and actual expenses. You may use the information on this line, together with the amount you invested, to estimate the expenses that you paid over the period. Simply divide your account value by $1,000 (for example, an $8,600 account value ÷ $1,000 = 8.6), then multiply the result by the number on the first line under the heading “Expenses Paid During the Six-Month Period” to estimate the expenses you paid on your account during this period.
Hypothetical Example for Comparison Purposes
The second line for each share class in the table on the following page provides information about hypothetical account values and hypothetical expenses based on the Fund’s actual expense ratio and an assumed rate of return of 5% per year before expenses, which is not the Fund’s actual return. The hypothetical account values and
| | |
| Dryden International Value Fund | | 7 |
Fees and Expenses (continued)
expenses may not be used to estimate the actual ending account balance or expenses you paid for the period. You may use this information to compare the ongoing costs of investing in the Fund and other funds. To do so, compare this 5% hypothetical example with the 5% hypothetical examples that appear in the shareholder reports of the other funds.
Please note that the expenses shown in the table are meant to highlight your ongoing costs only and do not reflect any transactional costs such as sales charges (loads). Therefore, the second line for each share class in the table is useful in comparing ongoing costs only and will not help you determine the relative total costs of owning different funds. In addition, if these transactional costs were included, your costs would have been higher.
| | | | | | | | | | | | | | |
Dryden International
Value Fund | | Beginning Account
Value
May 1, 2008 | | Ending Account
Value
October 31, 2008 | | Annualized
Expense Ratio
Based on the
Six-Month Period | | | Expenses Paid
During the
Six-Month Period* |
| | | | | | | | | | | | | | |
| Class A | | Actual | | $ | 1,000.00 | | $ | 590.90 | | 1.59 | % | | $ | 6.36 |
| | | Hypothetical | | $ | 1,000.00 | | $ | 1,017.14 | | 1.59 | % | | $ | 8.06 |
| | | | | | | | | | | | | | |
| Class B | | Actual | | $ | 1,000.00 | | $ | 586.20 | | 2.34 | % | | $ | 9.33 |
| | | Hypothetical | | $ | 1,000.00 | | $ | 1,013.37 | | 2.34 | % | | $ | 11.84 |
| | | | | | | | | | | | | | |
| Class C | | Actual | | $ | 1,000.00 | | $ | 588.50 | | 2.34 | % | | $ | 9.34 |
| | | Hypothetical | | $ | 1,000.00 | | $ | 1,013.37 | | 2.34 | % | | $ | 11.84 |
| | | | | | | | | | | | | | |
| Class Z | | Actual | | $ | 1,000.00 | | $ | 591.40 | | 1.34 | % | | $ | 5.36 |
| | | Hypothetical | | $ | 1,000.00 | | $ | 1,018.40 | | 1.34 | % | | $ | 6.80 |
* Fund expenses (net of fee waivers or subsidies, if any) for each share class are equal to the annualized expense ratio for each share class (provided in the table), multiplied by the average account value over the period, multiplied by the 184 days in the six-month period ended October 31, 2008, and divided by the 366 days in the Fund's fiscal year ended October 31, 2008 (to reflect the six-month period). Expenses presented in the table include the expenses of any underlying portfolios in which the Fund may invest.
| | |
| 8 | | Visit our website at www.jennisondryden.com |
Portfolio of Investments
as of October 31, 2008
| | | | | |
| Shares | | Description | | Value (Note 1) |
| | | | | |
LONG-TERM INVESTMENTS 94.0% |
COMMON STOCKS |
|
Australia 1.5% |
| 129,488 | | BlueScope Steel Ltd. | | $ | 380,847 |
| 149,300 | | Centennial Coal Co. Ltd. | | | 351,089 |
| 97,400 | | CSR Ltd. | | | 141,573 |
| 159,100 | | Foster’s Group Ltd. | | | 608,206 |
| 186,200 | | Pacific Brands Ltd. | | | 124,910 |
| 400,200 | | Qantas Airways Ltd. | | | 650,030 |
| 61,800 | | Tabcorp Holdings Ltd. | | | 283,329 |
| | | | | |
| | | | | 2,539,984 |
|
Austria 0.2% |
| 14,700 | | Voestalpine AG | | | 358,745 |
| |
Belgium 0.1% | | | |
| 32,200 | | AGFA-Gevaert NV* | | | 134,769 |
| 9,428 | | Dexia SA | | | 50,146 |
| 27,500 | | Fortis SA/NV | | | 31,861 |
| | | | | |
| | | | | 216,776 |
|
Brazil 1.1% |
| 53,477 | | Empresa Brasileira de Aeronautica SA, ADR | | | 1,118,739 |
| 70,300 | | Redecard SA | | | 762,868 |
| | | | | |
| | | | | 1,881,607 |
|
Canada 4.6% |
| 43,200 | | Canadian National Railway Co. | | | 1,875,238 |
| 31,100 | | Canadian Natural Resources Ltd. | | | 1,569,321 |
| 18,200 | | Canadian Oil Sands Trust | | | 488,333 |
| 11,900 | | Potash Corp. of Saskatchewan, Inc. | | | 1,014,594 |
| 95,344 | | Rogers Communications, Inc. (Class B Stock) | | | 2,767,847 |
| | | | | |
| | | | | 7,715,333 |
|
China 2.7% |
| 688,800 | | China Life Insurance Co. Ltd. (Class H Stock) | | | 1,840,745 |
| 546,304 | | China Merchants Bank Co. Ltd. (Class H Stock) | | | 836,964 |
| 199,204 | | China Mobile Ltd. | | | 1,753,656 |
| 623,701 | | Country Garden Holdings Co. Ltd. | | | 110,792 |
| | | | | |
| | | | | 4,542,157 |
See Notes to Financial Statements.
| | |
| Dryden International Value Fund | | 9 |
Portfolio of Investments
as of October 31, 2008 continued
| | | | | |
| Shares | | Description | | Value (Note 1) |
| | | | | |
COMMON STOCKS (Continued) |
|
Denmark 3.7% |
| 19,400 | | Carlsberg A/S (Class B Stock) | | $ | 763,750 |
| 24,445 | | Danske Bank A/S | | | 361,867 |
| 46,900 | | H. Lundbeck A/S | | | 837,849 |
| 64,182 | | Novo Nordisk A/S (Class B Stock) | | | 3,440,359 |
| 21,944 | | Vestas Wind Systems A/S* | | | 898,827 |
| | | | | |
| | | | | 6,302,652 |
|
Finland 2.7% |
| 70,814 | | Fortum Oyj | | | 1,740,329 |
| 144,000 | | Nokia Oyj | | | 2,205,822 |
| 20,000 | | Rautaruukki Oyj | | | 326,402 |
| 29,000 | | TietoEnator Oyj | | | 321,625 |
| | | | | |
| | | | | 4,594,178 |
| |
France 11.5% | | | |
| 10,749 | | Air Liquide | | | 927,586 |
| 510 | | Arkema | | | 11,650 |
| 104,200 | | AXA SA | | | 1,990,643 |
| 45,300 | | BNP Paribas | | | 3,270,721 |
| 3,700 | | Ciments Francais SA | | | 268,644 |
| 12,400 | | Compagnie Generale des Establissements Michelin (Class B Stock) | | | 638,241 |
| 23,100 | | Credit Agricole SA | | | 334,188 |
| 88,099 | | France Telecom SA | | | 2,221,469 |
| 36,200 | | Groupe Danone | | | 2,015,649 |
| 31,033 | | LVMH Moet Hennessy Louis Vuitton SA | | | 2,065,060 |
| 20,000 | | Natixis SA | | | 44,291 |
| 17,718 | | PSA Peugeot Citroen SA | | | 472,803 |
| 7,200 | | Rallye SA | | | 145,830 |
| 8,005 | | Renault SA | | | 245,336 |
| 45,900 | | Safran SA | | | 582,543 |
| 30,200 | | Sanofi-Aventis SA | | | 1,913,386 |
| 4,300 | | Societe Generale | | | 234,372 |
| 8,600 | | Thales SA | | | 345,076 |
| 20,400 | | Total SA | | | 1,122,275 |
| 9,100 | | Valeo SA | | | 158,514 |
| 17,600 | | Vivendi | | | 460,049 |
| | | | | |
| | | | | 19,468,326 |
See Notes to Financial Statements.
| | |
| 10 | | Visit our website at www.jennisondryden.com |
| | | | | |
| Shares | | Description | | Value (Note 1) |
| | | | | |
COMMON STOCKS (Continued) |
| |
Germany 5.5% | | | |
| 34,200 | | BASF SE | | $ | 1,129,067 |
| 15,900 | | DaimlerChrysler AG | | | 539,011 |
| 19,500 | | Deutsche Bank AG | | | 728,460 |
| 17,600 | | Deutsche Lufthansa AG | | | 243,762 |
| 44,004 | | E.ON AG | | | 1,649,044 |
| 9,100 | | Hannover Rueckversicherung AG | | | 225,277 |
| 21,000 | | Heidelberger Druckmaschinen AG | | | 196,831 |
| 20,100 | | MTU Aero Engines Holding AG | | | 387,707 |
| 10,400 | | Muenchener Rueckversicherungs AG | | | 1,350,125 |
| 6,300 | | Norddeutsche Affinerie AG | | | 201,246 |
| 52,666 | | SAP AG | | | 1,843,901 |
| 40,000 | | ThyssenKrupp AG | | | 757,623 |
| | | | | |
| | | | | 9,252,054 |
| |
Greece 1.2% | | | |
| 67,044 | | National Bank of Greece SA | | | 1,472,842 |
| 23,262 | | OPAP SA | | | 507,918 |
| | | | | |
| | | | | 1,980,760 |
| |
Guernsey 0.9% | | | |
| 65,194 | | Amdocs Ltd.* | | | 1,470,777 |
| |
Hong Kong 1.4% | | | |
| 1,001,826 | | Chaoda Modern Agriculture Holdings Ltd. | | | 705,813 |
| 261,100 | | CITIC Pacific Ltd. | | | 212,343 |
| 112,848 | | Hong Kong Exchanges and Clearing Ltd. | | | 1,144,371 |
| 124,847 | | Orient Overseas International Ltd. | | | 222,945 |
| | | | | |
| | | | | 2,285,472 |
| |
Ireland 0.3% | | | |
| 43,400 | | Allied Irish Banks PLC | | | 231,176 |
| 62,300 | | Bank of Ireland | | | 183,956 |
| 32,900 | | Irish Life & Permanent PLC | | | 103,537 |
| | | | | |
| | | | | 518,669 |
| |
Israel 2.4% | | | |
| 92,200 | | Teva Pharmaceutical Industries Ltd., ADR | | | 3,953,536 |
See Notes to Financial Statements.
| | |
| Dryden International Value Fund | | 11 |
Portfolio of Investments
as of October 31, 2008 continued
| | | | | |
| Shares | | Description | | Value (Note 1) |
| | | | | |
COMMON STOCKS (Continued) |
| |
Italy 2.0% | | | |
| 30,300 | | Banco Popolare Scarl | | $ | 377,991 |
| 63,300 | | ENI SpA | | | 1,510,855 |
| 14,100 | | Finmeccanica SpA | | | 174,871 |
| 11,700 | | Fondiaria SAI SpA | | | 219,806 |
| 22,100 | | Indesit Co. SpA | | | 180,056 |
| 175,997 | | Intesa Sanpaolo SpA | | | 644,130 |
| 194,700 | | Telecom Italia SpA | | | 223,665 |
| | | | | |
| | | | | 3,331,374 |
| |
Japan 13.9% | | | |
| 33,973 | | Alpine Electronics, Inc. | | | 298,856 |
| 54,025 | | Alps Electric Co. Ltd. | | | 297,203 |
| 97,300 | | Asahi Kasei Corp. | | | 365,985 |
| 14,800 | | Astellas Pharma, Inc. | | | 596,126 |
| 139,214 | | Cosmo Oil Co. Ltd. | | | 296,146 |
| 175,214 | | Denki Kagaku Kogyo Kabushiki Kaisha | | | 388,178 |
| 27,000 | | Fanuc Ltd. | | | 1,798,974 |
| 184,000 | | Fuji Heavy Industries Ltd. | | | 647,251 |
| 21,500 | | Hitachi Information Systems Ltd. | | | 398,981 |
| 68,726 | | Honda Motor Co. Ltd. | | | 1,708,899 |
| 92,683 | | Komatsu Ltd. | | | 1,018,926 |
| 203,600 | | Kurabo Industries Ltd. | | | 289,242 |
| 49,000 | | Kyowa Exeo Corp. | | | 480,427 |
| 132,200 | | Marubeni Corp. | | | 513,603 |
| 38,000 | | Matsushita Electric Industrial Co. Ltd. | | | 611,942 |
| 78 | | Mitsubishi Chemical Holdings Corp. | | | 315 |
| 34,900 | | Mitsubishi Corp. | | | 584,989 |
| 19,000 | | Mitsui & Co. Ltd. | | | 184,101 |
| 22,700 | | Nifco, Inc. | | | 333,638 |
| 6,996 | | Nintendo Co. Ltd. | | | 2,247,873 |
| 251,000 | | Nippon Light Metal Co. Ltd. | | | 237,160 |
| 114,200 | | Nippon Oil Corp. | | | 468,764 |
| 67,000 | | Nippon Shokubai Co. Ltd. | | | 388,271 |
| 340 | | Nippon Telegraph & Telephone Corp. | | | 1,387,446 |
| 186,500 | | Nissan Motor Co. Ltd. | | | 926,233 |
| 900 | | NTT DoCoMo, Inc. | | | 1,427,354 |
| 19,900 | | Omron Corp. | | | 284,116 |
| 7 | | Osaka Gas Co. Ltd. | | | 25 |
| 64,500 | | Ricoh Co. Ltd. | | | 694,150 |
| 146,000 | | Sanwa Holdings Corp. | | | 484,365 |
See Notes to Financial Statements.
| | |
| 12 | | Visit our website at www.jennisondryden.com |
| | | | | |
| Shares | | Description | | Value (Note 1) |
| | | | | |
COMMON STOCKS (Continued) |
| |
Japan (cont’d.) | | | |
| 27,400 | | Sumitomo Corp. | | $ | 241,066 |
| 251 | | Sumitomo Osaka Cement Co. Ltd. | | | 394 |
| 1 | | Takefuji Corp. | | | 8 |
| 90,866 | | Toyota Motor Corp. | | | 3,548,401 |
| 74,000 | | Yokohama Rubber Co. Ltd. (The) | | | 363,100 |
| | | | | |
| | | | | 23,512,508 |
|
Liechtenstein 0.2% |
| 2,900 | | Verwaltungs und Privat Bank AG | | | 402,296 |
|
Mexico 1.7% |
| 42,813 | | America Movil SAB de CV (Class L Stock), ADR | | | 1,324,634 |
| 560,098 | | Wal-Mart de Mexico SAB de CV (Class V Stock) | | | 1,506,073 |
| | | | | |
| | | | | 2,830,707 |
|
Netherlands 2.0% |
| 39,600 | | Aegon NV | | | 164,545 |
| 11,700 | | CSM NV | | | 216,654 |
| 57,300 | | ING Groep NV, ADR | | | 537,495 |
| 17,500 | | Koninklijke DSM NV | | | 487,347 |
| 31,400 | | OCE NV | | | 145,310 |
| 26,200 | | Royal Dutch Shell PLC (Class A Stock) | | | 726,185 |
| 21,479 | | Schlumberger Ltd. | | | 1,109,390 |
| | | | | |
| | | | | 3,386,926 |
|
New Zealand 0.2% |
| 590,300 | | Air New Zealand Ltd. | | | 315,607 |
|
Norway 0.7% |
| 64,600 | | DnB NOR ASA | | | 374,379 |
| 38,900 | | Norsk Hydro ASA | | | 162,535 |
| 33,539 | | StatoilHydro ASA | | | 674,591 |
| | | | | |
| | | | | 1,211,505 |
|
Russia 1.2% |
| 63,300 | | OAO Gazprom, ADR | | | 1,257,771 |
| 175,491 | | Rosneft Oil Co., GDR | | | 807,259 |
| | | | | |
| | | | | 2,065,030 |
See Notes to Financial Statements.
| | |
| Dryden International Value Fund | | 13 |
Portfolio of Investments
as of October 31, 2008 continued
| | | | | |
| Shares | | Description | | Value (Note 1) |
| | | | | |
COMMON STOCKS (Continued) |
|
Singapore 0.8% |
| 282,970 | | MobileOne Ltd. | | $ | 251,913 |
| 248,141 | | Neptune Orient Lines Ltd. | | | 209,582 |
| 106,400 | | Singapore Airlines Ltd. | | | 815,185 |
| | | | | |
| | | | | 1,276,680 |
|
Spain 3.2% |
| 59,500 | | Banco Bilbao Vizcaya Argentaria SA | | | 690,576 |
| 121,100 | | Banco Santander Central Hispano SA | | | 1,309,717 |
| 19,333 | | Banco Santander SA | | | 212,426 |
| 39,000 | | Repsol YPF SA | | | 741,620 |
| 127,300 | | Telefonica SA | | | 2,356,953 |
| | | | | |
| | | | | 5,311,292 |
|
Sweden 1.7% |
| 44,700 | | Electrolux AB (Class B Stock) | | | 411,518 |
| 54,608 | | Hennes & Mauritz AB (Class B Stock) | | | 1,958,211 |
| 66,600 | | Nordea Bank AB | | | 533,808 |
| | | | | |
| | | | | 2,903,537 |
|
Switzerland 10.3% |
| 9,400 | | Baloise Holding AG | | | 502,566 |
| 2,017 | | Ciba Holding AG | | | 83,964 |
| 54,600 | | Clariant AG* | | | 338,730 |
| 37,300 | | Credit Suisse Group AG | | | 1,394,791 |
| 1,200 | | Georg Fischer AG* | | | 269,070 |
| 1,599 | | Givaudan SA | | | 1,089,582 |
| 69,138 | | Logitech International SA* | | | 1,030,745 |
| 84,900 | | Nestle SA | | | 3,301,506 |
| 31,933 | | Novartis AG | | | 1,620,856 |
| 2,263 | | Rieter Holding AG | | | 392,128 |
| 20,625 | | Roche Holding AG | | | 3,154,116 |
| 52,250 | | Swiss Reinsurance | | | 2,179,017 |
| 3,800 | | Swisscom AG | | | 1,161,133 |
| 4,600 | | Zurich Financial Services AG | | | 933,237 |
| | | | | |
| | | | | 17,451,441 |
|
United Kingdom 16.3% |
| 580,400 | | ARM Holdings PLC | | | 904,917 |
| 50,900 | | AstraZeneca PLC | | | 2,157,063 |
See Notes to Financial Statements.
| | |
| 14 | | Visit our website at www.jennisondryden.com |
| | | | | |
| Shares | | Description | | Value (Note 1) |
| | | | | |
COMMON STOCKS (Continued) |
|
United Kingdom (cont’d.) |
| 79,500 | | Aviva PLC | | $ | 474,218 |
| 193,571 | | Barclays PLC | | | 554,887 |
| 127,000 | | Beazley Group PLC | | | 216,518 |
| 296,400 | | BP PLC | | | 2,416,097 |
| 166,655 | | Bradford & Bingley PLC | | | — |
| 120,000 | | Brit Insurance Holdings PLC | | | 352,913 |
| 414,700 | | BT Group PLC | | | 779,240 |
| 72,773 | | Carnival PLC | | | 1,600,387 |
| 59,600 | | Centrica PLC | | | 292,863 |
| 62,100 | | Dairy Crest Group PLC | | | 310,266 |
| 25,900 | | Drax Group PLC | | | 240,670 |
| 145,600 | | GKN PLC | | | 279,192 |
| 37,300 | | GlaxoSmithKline PLC | | | 717,053 |
| 122,934 | | HBOS PLC | | | 201,294 |
| 59,200 | | IMI PLC | | | 263,098 |
| 272,238 | | Legal & General Group PLC | | | 313,098 |
| 229,499 | | Lloyds TSB Group PLC | | | 741,764 |
| 88,000 | | Marston’s PLC | | | 134,644 |
| 21,788 | | NEXT PLC | | | 370,330 |
| 200,998 | | Northern Foods PLC | | | 157,243 |
| 283,100 | | Old Mutual PLC | | | 229,246 |
| 60,491 | | Reckitt Benckiser Group PLC | | | 2,558,755 |
| 269,200 | | Royal & Sun Alliance Insurance Group PLC | | | 598,656 |
| 183,885 | | Royal Bank of Scotland Group PLC | | | 202,552 |
| 78,400 | | Royal Dutch Shell PLC (Class B Stock) | | | 2,125,560 |
| 67,218 | | SABMiller PLC | | | 1,067,675 |
| 212,300 | | Smith & Nephew PLC | | | 1,943,888 |
| 4,900 | | Spectris PLC | | | 39,331 |
| 114,300 | | Standard Chartered PLC | | | 1,889,038 |
| 47,000 | | Tate & Lyle PLC | | | 279,414 |
| 117,300 | | Tomkins PLC | | | 215,304 |
| 128,588 | | TT Electronics PLC | | | 97,924 |
| 409,900 | | Vodafone Group PLC | | | 788,530 |
| 103,925 | | Vodafone Group PLC, ADR | | | 2,002,635 |
| | | | | |
| | | | | 27,516,263 |
| | | | | |
| | TOTAL COMMON STOCKS
(cost $224,605,438) | | | 158,596,192 |
| | | | | |
See Notes to Financial Statements.
| | |
| Dryden International Value Fund | | 15 |
Portfolio of Investments
as of October 31, 2008 continued
| | | | | |
| Shares | | Description | | Value (Note 1) |
| | | | | |
RIGHTS* | | | |
| | |
Belgium | | | | | |
| 27,500 | | Fortis SA Coupon 42
(cost $0) | | $ | — |
| | | | | |
| | TOTAL LONG-TERM INVESTMENTS
(cost $224,605,438) | | | 158,596,192 |
| | | | | |
SHORT-TERM INVESTMENT 3.3% | | | |
| |
AFFILIATED MONEY MARKET MUTUAL FUND | | | |
| 5,578,811 | | Dryden Core Investment Fund - Taxable Money Market Series
(cost $5,578,811; Note 3)(a) | | | 5,578,811 |
| | | | | |
| | TOTAL INVESTMENTS(b) 97.3%
(cost $230,184,249; Note 5) | | | 164,175,003 |
| | Other assets in excess of liabilities(c) 2.7% | | | 4,613,367 |
| | | | | |
| | NET ASSETS 100% | | $ | 168,788,370 |
| | | | | |
The following abbreviations are used in Portfolio descriptions:
ADR—American Depositary Receipt
GDR—Global Depositary Receipt
CHF—Swiss Franc
EUR—Euro
GBP—British Pound
MXN—Mexican Peso
| * | Non-income producing security. |
| (a) | Prudential Investments LLC, the manager of the Portfolio also serves as manager of the Dryden Core Investment Fund-Taxable Money Market Series. |
| (b) | As of October 31, 2008, 179 securities representing $135,583,710 and 80.3% of market value were fair valued in accordance with the policies adopted by the Board of Directors. |
| (c) | Other assets in excess of liabilities includes net unrealized appreciation (depreciation) on forward foreign currency exchange contracts as follows: |
See Notes to Financial Statements.
| | |
| 16 | | Visit our website at www.jennisondryden.com |
Forward foreign currency exchange contracts outstanding at October 31, 2008:
| | | | | | | | | | | | | |
Purchase Contracts | | Notional
Amount
(000) | | Value at
Settlement Date
Payable | | Current
Value | | Unrealized
Depreciation | |
Euro, | | | | | | | | | | | | | |
Expiring 12/19/08 | | EUR | 5,841 | | $ | 8,098,390 | | $ | 7,434,491 | | $ | (663,899 | ) |
Mexican Peso, | | | | | | | | | | | | | |
Expiring 12/08/08 | | MXN | 23,571 | | | 2,256,720 | | | 1,811,781 | | | (444,939 | ) |
| | | | | | | | | | | | | |
| | | | | $ | 10,355,110 | | $ | 9,246,272 | | $ | (1,108,838 | ) |
| | | | | | | | | | | | | |
| | | | |
Sale Contracts | | Notional
Amount
(000) | | Value at
Settlement Date
Receivable | | Current
Value | | Unrealized
Appreciation | |
British Pound, | | | | | | | | | | | | | |
Expiring 12/29/08 | | GBP | 2,893 | | $ | 5,210,716 | | $ | 4,640,825 | | $ | 569,891 | |
Euro, | | | | | | | | | | | | | |
Expiring 12/19/08 | | EUR | 13,808 | | | 20,265,101 | | | 17,574,631 | | | 2,690,470 | |
Mexican Peso, | | | | | | | | | | | | | |
Expiring 12/08/08 | | MXN | 50,317 | | | 4,787,262 | | | 3,867,682 | | | 919,580 | |
Swiss Franc, | | | | | | | | | | | | | |
Expiring 12/23/08 | | CHF | 1,264 | | | 1,210,415 | | | 1,090,967 | | | 119,448 | |
| | | | | | | | | | | | | |
| | | | | $ | 31,473,494 | | $ | 27,174,105 | | $ | 4,299,389 | |
| | | | | | | | | | | | | |
The industry classification of investments and other assets in excess of liabilities shown as a percentage of net assets as October 31, 2008 were as follows:
| | | |
Telecommunications | | 13.3 | % |
Pharmaceuticals | | 11.0 | |
Oil, Gas & Consumable Fuels | | 9.9 | |
Financial—Bank & Trust | | 7.1 | |
Insurance | | 6.7 | |
Food & Beverage | | 4.8 | |
Automobile Manufacturers | | 4.8 | |
Affiliated Money Market Mutual Fund | | 3.3 | |
Chemicals | | 3.0 | |
Entertainment & Leisure | | 2.4 | |
Retail & Merchandising | | 2.4 | |
Utilities | | 2.2 | |
Banks | | 2.0 | |
Electronic Components & Equipment | | 2.0 | |
Consumer Products & Services | | 1.6 | |
Aerospace | | 1.5 | |
See Notes to Financial Statements.
| | |
| Dryden International Value Fund | | 17 |
Portfolio of Investments
as of October 31, 2008 continued
| | | |
Industry (cont’d.) | | | |
Diversified Financials | | 1.5 | % |
Computer Services & Software | | 1.5 | |
Diversified Operations | | 1.3 | |
Automotive Parts | | 1.3 | |
Airlines | | 1.3 | |
Machinery & Equipment | | 1.2 | |
Transportation | | 1.2 | |
Medical Supplies & Equipment | | 1.2 | |
Metals & Mining | | 1.1 | |
Real Estate | | 0.7 | |
Computer Hardware | | 0.6 | |
Building Materials | | 0.6 | |
Financial Services | | 0.5 | |
Semiconductor Components | | 0.5 | |
Electronic Components | | 0.5 | |
Office Equipment | | 0.5 | |
Beverages | | 0.5 | |
Diversified Financial Services | | 0.4 | |
Appliances | | 0.3 | |
Business Services | | 0.3 | |
Gaming | | 0.3 | |
Diversified Manufacturing | | 0.3 | |
Multimedia | | 0.3 | |
Commercial Banks | | 0.2 | |
Steel Producers/Products | | 0.2 | |
Environmental Services | | 0.2 | |
Gas Distribution | | 0.2 | |
Clothing & Apparel | | 0.2 | |
Distribution/Wholesale | | 0.1 | |
Independent Power Producers & Energy Traders | | 0.1 | |
Conglomerates | | 0.1 | |
Miscellaneous Manufacturing | | 0.1 | |
| | | |
| | 97.3 | |
Other assets in excess of liabilities | | 2.7 | |
| | | |
| | 100.0 | % |
| | | |
See Notes to Financial Statements.
| | |
| 18 | | Visit our website at www.jennisondryden.com |
Financial Statements
| | |
| OCTOBER 31, 2008 | | ANNUAL REPORT |
Dryden International Value Fund
Statement of Assets and Liabilities
as of October 31, 2008
| | | | |
Assets | | | | |
Investments, at value: | | | | |
Unaffiliated Investments (cost $224,605,438) | | $ | 158,596,192 | |
Affiliated Investments (cost $5,578,811) | | | 5,578,811 | |
Foreign currency, at value (cost $308,751) | | | 301,577 | |
Cash | | | 40,643 | |
Unrealized appreciation on foreign currency forward contracts | | | 4,299,389 | |
Foreign tax reclaim receivable | | | 897,904 | |
Dividends receivable | | | 496,458 | |
Receivable for Series shares sold | | | 209,542 | |
Receivable for investments sold | | | 147,284 | |
Prepaid expenses | | | 4,356 | |
| | | | |
Total assets | | | 170,572,156 | |
| | | | |
| |
Liabilities | | | | |
Unrealized depreciation on foreign currency forward contracts | | | 1,108,838 | |
Payable for Series shares reacquired | | | 256,193 | |
Accrued expenses and other liabilities | | | 180,015 | |
Management fee payable | | | 150,969 | |
Affiliated transfer agent fee payable | | | 58,150 | |
Distribution fee payable | | | 20,602 | |
Payable for investments purchased | | | 6,343 | |
Deferred directors’ fee | | | 2,676 | |
| | | | |
Total liabilities | | | 1,783,786 | |
| | | | |
| |
Net Assets | | $ | 168,788,370 | |
| | | | |
| | | | | |
Net assets were comprised of: | | | | |
Common stock, at par | | $ | 110,391 | |
Paid-in capital in excess of par | | | 231,294,578 | |
| | | | |
| | | 231,404,969 | |
Undistributed net investment income | | | 3,821,294 | |
Accumulated net realized loss on investment and foreign currency transactions | | | (3,583,841 | ) |
Net unrealized depreciation on investments and foreign currencies | | | (62,854,052 | ) |
| | | | |
Net assets, October 31, 2008 | | $ | 168,788,370 | |
| | | | |
See Notes to Financial Statements.
| | |
| 20 | | Visit our website at www.jennisondryden.com |
| | | |
Class A: | | | |
Net asset value and redemption price per share
($40,579,571 ÷ 2,656,263 shares of common stock issued and outstanding) | | $ | 15.28 |
Maximum sales charge (5.5% of offering price) | | | 0.89 |
| | | |
Offering price per share | | $ | 16.17 |
| | | |
| |
Class B: | | | |
Net asset value, offering and redemption price per share
($5,143,442 ÷ 352,834 shares of common stock issued and outstanding) | | $ | 14.58 |
| | | |
| |
Class C: | | | |
Net asset value, offering and redemption price per share
($7,355,188 ÷ 503,835 shares of common stock issued and outstanding) | | $ | 14.60 |
| | | |
| |
Class Z: | | | |
Net asset value, offering and redemption price per share
($115,710,169 ÷ 7,526,198 shares of common stock issued and outstanding) | | $ | 15.37 |
| | | |
See Notes to Financial Statements.
| | |
| Dryden International Value Fund | | 21 |
Statement of Operations
Year Ended October 31, 2008
| | | | |
Net Investment Income | | | | |
Investment Income | | | | |
Unaffiliated dividend income (net of foreign withholding tax of $938,040) | | $ | 9,244,475 | |
Affiliated dividend income | | | 233,642 | |
Interest income | | | 24,450 | |
| | | | |
Total income | | | 9,502,567 | |
| | | | |
| |
Expenses | | | | |
Management fees | | | 2,822,995 | |
Distribution fee—Class A | | | 179,045 | |
Distribution fee—Class B | | | 107,299 | |
Distribution fee—Class C | | | 135,712 | |
Transfer agent’s fees and expenses (including affiliated expense of $389,000) | | | 448,000 | |
Custodian’s fees and expenses | | | 243,000 | |
Registration fees | | | 55,000 | |
Reports to shareholders | | | 45,000 | |
Audit fee | | | 26,000 | |
Directors’ fees | | | 19,000 | |
Legal fees | | | 13,000 | |
Insurance fees | | | 6,000 | |
Interest expense (Note 7) | | | 183 | |
Miscellaneous | | | 29,970 | |
| | | | |
Total expenses | | | 4,130,204 | |
| | | | |
Net investment income | | | 5,372,363 | |
| | | | |
| |
Realized And Unrealized Gain (Loss) On Investment And Foreign Currency Transactions | | | | |
Net realized loss on: | | | | |
Investment transactions | | | (1,437,238 | ) |
Foreign currency transactions | | | (1,591,281 | ) |
| | | | |
| | | (3,028,519 | ) |
| | | | |
Net change in unrealized appreciation (depreciation) on: | | | | |
Investments | | | (172,120,748 | ) |
Foreign currencies | | | 3,187,522 | |
| | | | |
| | | (168,933,226 | ) |
| | | | |
Net Loss on investments and foreign currency transactions | | | (171,961,745 | ) |
| | | | |
Net Decrease In Net Assets Resulting From Operations | | $ | (166,589,382 | ) |
| | | | |
See Notes to Financial Statements.
| | |
| 22 | | Visit our website at www.jennisondryden.com |
Statement of Changes in Net Assets
| | | | | | | | |
| | | Year Ended October 31, | |
| | | 2008 | | | 2007 | |
Increase (Decrease) In Net Assets | | | | | | | | |
Operations | | | | | | | | |
Net investment income | | $ | 5,372,363 | | | $ | 5,929,421 | |
Net realized gain (loss) on investment and foreign currency transactions | | | (3,028,519 | ) | | | 42,441,319 | |
Net change in unrealized appreciation (depreciation) on investments and foreign currencies | | | (168,933,226 | ) | | | 42,936,926 | |
| | | | | | | | |
Net increase (decrease) in net assets resulting from operations | | | (166,589,382 | ) | | | 91,307,666 | |
| | | | | | | | |
Dividends and Distributions (Note 1) | | | | | | | | |
Dividends from net investment income | | | | | | | | |
Class A | | | (1,029,202 | ) | | | (84,431 | ) |
Class B | | | (71,859 | ) | | | — | |
Class C | | | (79,781 | ) | | | — | |
Class Z | | | (3,130,329 | ) | | | (666,603 | ) |
| | | | | | | | |
| | | (4,311,171 | ) | | | (751,034 | ) |
| | | | | | | | |
Distributions from net realized gains | | | | | | | | |
Class A | | | (10,771,229 | ) | | | (3,720,197 | ) |
Class B | | | (1,960,514 | ) | | | (844,448 | ) |
Class C | | | (2,176,658 | ) | | | (765,891 | ) |
Class Z | | | (27,044,284 | ) | | | (8,886,383 | ) |
| | | | | | | | |
| | | (41,952,685 | ) | | | (14,216,919 | ) |
| | | | | | | | |
| | |
Series share transactions (Net of share conversions) (Note 6) | | | | | | | | |
Net proceeds from shares sold | | | 80,225,479 | | | | 105,826,182 | |
Net asset value of shares issued in reinvestment of dividends and distributions | | | 44,896,631 | | | | 14,525,629 | |
Cost of shares reacquired | | | (103,746,498 | ) | | | (121,825,308 | ) |
| | | | | | | | |
Net increase (decrease) in net assets from Series share transactions | | | 21,375,612 | | | | (1,473,497 | ) |
| | | | | | | | |
Total increase (decrease) | | | (191,477,626 | ) | | | 74,866,216 | |
| | |
Net Assets | | | | | | | | |
Beginning of year | | | 360,265,996 | | | | 285,399,780 | |
| | | | | | | | |
End of year(a) | | $ | 168,788,370 | | | $ | 360,265,996 | |
| | | | | | | | |
(a) Includes undistributed net investment income of: | | $ | 3,821,294 | | | $ | 4,125,714 | |
| | | | | | | | |
See Notes to Financial Statements.
| | |
| Dryden International Value Fund | | 23 |
Notes to Financial Statements
Prudential World Fund, Inc. (the “Fund”), is registered under the Investment Company Act of 1940 as an open-end diversified management investment company and currently consists of two series: Dryden International Value Fund (the “Series”) and the Dryden International Equity Fund. These financial statements relate to Dryden International Value Fund. The financial statements of the other series are not presented herein. The investment objective of the Series is long-term growth of capital through investment in equity securities of foreign issuers.
Note 1. Accounting Policies
The following is a summary of significant accounting policies followed by the Fund and the Series in the preparation of its financial statements.
Securities Valuation: Securities listed on a securities exchange (other than options on securities and indices) are valued at the last sale price on such exchange on the day of valuation or, if there was no sale on such day, at the mean between the last reported bid and ask prices, or at the last bid price on such day in the absence of an asked price. Securities traded via Nasdaq are valued at the Nasdaq official closing price (NOCP) on the day of valuation, or if there was no NOCP, at the last sale price. Securities that are actively traded in the over-the-counter market, including listed securities for which the primary market is believed by Prudential Investments LLC (“PI” or “Manager”), in consultation with the subadvisor(s), to be over-the-counter, are valued at market value using prices provided by an independent pricing agent or principal market maker. Options on securities and indices traded on an exchange are valued at the last sale price as of the close of trading on the applicable exchange or, if there was no sale, at the mean between the most recently quoted bid and asked prices on such exchange. Futures contracts and options thereon traded on a commodities exchange or board of trade are valued at the last sale price at the close of trading on such exchange or board of trade or, if there was no sale on the applicable commodities exchange or board of trade on such day, at the mean between the most recently quoted bid and asked prices on such exchange or board of trade or at the last bid price in the absence of an asked price. Securities for which reliable market quotations are not readily available, or whose values have been affected by events occurring after the close of the security’s foreign market and before the Funds’ normal pricing time, are valued at fair value in accordance with the Board of Directors’ approved fair valuation procedures. When determining the fair valuation of securities some of the factors influencing the valuation include, the nature of any
| | |
| 24 | | Visit our website at www.jennisondryden.com |
restrictions on disposition of the securities; assessment of the general liquidity of the securities; the issuer’s financial condition and the markets in which it does business; the cost of the investment; the size of the holding and the capitalization of issuer; the prices of any recent transactions or bids/offers for such securities or any comparable securities; any available analyst media or other reports or information deemed reliable by the investment advisor regarding the issuer or the markets or industry in which it operates. Using fair value to price securities may result in a value that is different from a security’s most recent closing price and from the price used by other mutual funds to calculate their net asset values.
Investments in mutual funds are valued at the net asset value as of the close of the New York Stock Exchange on the date of valuation.
Securities Lending: The Fund may lend its portfolio securities to broker-dealers. The loans are secured by collateral at least equal at all times to the market value of the securities loaned. Loans are subject to termination at the option of the borrower or the Fund. Upon termination of the loan, the borrower will return to the lender securities identical to the loaned securities. Should the borrower of the securities fail financially, the Fund has the right to repurchase the securities using the collateral in the open market. The fund recognizes income, net of any rebate and securities lend agent fees, for lending its securities in the form of fees or interest on the investment of any cash received as collateral. The Fund also continues to receive interest and dividends or amounts equivalent thereto, on the securities loaned and recognizes and unrealized gain or loss in the market price of the securities loaned that may occur during the term of the loan.
Foreign Currency Translation: The books and records of the Series are maintained in U.S. dollars. Foreign currency amounts are translated into U.S. dollars on the following basis:
(i) market value of investment securities, other assets and liabilities—at the current rates of exchange.
(ii) Purchases and sales of investment securities, income and expenses—at the rates of exchange prevailing on the respective dates of such transactions.
Although the net assets of the Series are presented at the foreign exchange rates and market values at the close of the fiscal period, the Series does not isolate that portion of the results of operations arising as a result of changes in the foreign exchange rates from the fluctuations arising from changes in the market prices of long-term securities held at the end of the fiscal period. Similarly, the Series does not isolate the effect of changes in foreign exchange rates from the fluctuations arising from changes in the
| | |
| Dryden International Value Fund | | 25 |
Notes to Financial Statements
continued
market prices of long-term portfolio securities sold during the fiscal period. Accordingly, realized foreign currency gains or losses are included in the reported net realized gains or losses on investment transactions.
Net realized gains or losses on foreign currency transactions represent net foreign exchange gains or losses from the holding of foreign currencies, currency gains or losses realized between the trade date and settlement date on securities transactions, and the difference between the amounts of dividends, interest and foreign withholding taxes recorded on the Series’ books and the U.S. dollar equivalent amounts actually received or paid. Net unrealized currency gains or losses from valuing foreign currency denominated assets and liabilities (other than investments) at period end exchange rates are reflected as a component of net unrealized appreciation (depreciation) on investments and foreign currencies.
Foreign security and currency transactions may involve certain considerations and risks not typically associated with those of domestic origin as a result of, among other factors, the possibility of political and economic instability or the level of governmental supervision and regulation of foreign securities markets.
Forward Currency Contracts: A forward currency contract is a commitment to purchase or sell a foreign currency at a future date at a negotiated forward rate. The Series enters into forward currency contracts in order to hedge its exposure to changes in foreign currency exchange rates on its foreign portfolio holdings or specific receivables and payables denominated in a foreign currency. The contracts are valued daily at current exchange rates and any unrealized gain or loss is included in net unrealized appreciation or depreciation on foreign currencies. Gain or loss is realized on the settlement date of the contract equal to the difference between the settlement value of the original and renegotiated forward contracts. This gain or loss, if any, is included in net realized gain (loss) on foreign currency transactions. Risks may arise upon entering into these contracts from the potential inability of the counterparties to meet the terms of their contracts. Forward currency contracts involve elements of both market and credit risk in excess of the amounts reflected on the Statement of Assets and Liabilities.
Securities Transactions and Net Investment Income: Securities transactions are recorded on the trade date. Realized and unrealized gains or losses on sales of securities are calculated on the identified cost basis. Dividend income is recorded on the ex-dividend date and interest income, including amortization of premium and
| | |
| 26 | | Visit our website at www.jennisondryden.com |
accretion of discount on debt securities, as required, is recorded on an accrual basis. Expenses are recorded on the accrual basis. Net investment income or loss, (other than distribution fees which are charged directly to the respective class) and unrealized and realized gains or losses are allocated daily to each class of shares based upon the relative proportion of net assets of each class at the beginning of the day.
Dividends and Distributions: The Series expects to pay dividends of net investment income and distributions of net realized capital gains, if any, annually. Dividends and distributions to shareholders, which are determined in accordance with federal income tax regulations and which may differ from generally accepted accounting principles, are recorded on the ex-dividend date. Permanent book/tax differences relating to income and gains are reclassified amongst undistributed net investment income, accumulated net realized gain or loss and paid-in capital in excess of par, as appropriate.
Taxes: For federal income tax purposes, each series in the Fund is treated as a separate taxpaying entity. It is the Series’ policy to continue to meet the requirements of the Internal Revenue Code applicable to regulated investment companies and to distribute all of its taxable net income and capital gains, if any, to shareholders. Therefore, no federal income tax provision is required.
Withholding taxes on foreign dividends are recorded, net of reclaimable amounts, at the time the related income is earned.
Estimates: The preparation of the financial statements requires management to make estimates and assumptions that affect the reported amounts and disclosures in the financial statements. Actual results could differ from those estimates.
Note 2. Agreements
The Fund has a management agreement for the Series with PI. Pursuant to this agreement, PI has responsibility for all investment advisory services and supervises the subadvisor’s performance of such services. PI has entered into subadvisory agreements with LSV Asset Management (“LSV”) and Thornburg Investment Management (“Thornburg”) for the Series.
The subadvisory agreements provide that LSV and Thornburg furnish investment advisory services in connection with the management of the Series. In connection therewith, LSV and Thornburg are obligated to keep certain books and records of the Series. PI pays for the services of the subadvisors, the compensation of officers of the Series, occupancy and certain clerical and bookkeeping costs of the Series. The Fund bears all other costs and expenses.
| | |
| Dryden International Value Fund | | 27 |
Notes to Financial Statements
continued
The management fee paid to PI is computed daily and payable monthly at an annual rate of 1% of the average daily net assets up to $300 million, .95 of 1% of the next $700 million of average daily net assets and .90 of 1% of average daily net assets in excess of $1 billion of the Series. The effective management fee rate as of October 31, 2008 was 1.00%.
The Series has a distribution agreement with Prudential Investment Management Services LLC (“PIMS”), which acts as the distributor of the Class A, Class B, Class C and Class Z shares of the Series. The Series compensates PIMS for distributing and servicing the Series’ Class A, Class B and Class C shares pursuant to plans of distribution (the “Class A, B and C Plans”), regardless of expenses actually incurred by PIMS. The distribution fees are accrued daily and payable monthly. No distribution or service fees are paid to PIMS as distributor of the Class Z shares of the Series.
Pursuant to the Class A, B and C Plans, the Series compensates PIMS for distribution-related activities at an annual rate of up to .30 of 1%, 1% and 1% of the average daily net assets of the Class A, B and C shares, respectively. For the year ended October 31, 2008, PIMS contractually agreed to limit such fee to .25 of 1% of the average daily net assets of the Class A shares.
PIMS has advised the Series that it received approximately $89,400 in front-end sales charges resulting from sales of Class A shares, during the year ended October 31, 2008. From these fees, PIMS paid such sales charges to broker-dealers, which in turn paid commissions to salespersons and incurred other distribution costs.
PIMS advised the Series that for the year ended October 31, 2008, it received approximately $14,400 and $300 in contingent deferred sales charges imposed upon certain redemptions by Class B and Class C shareholders, respectively.
PI and PIMS are indirect, wholly-owned subsidiaries of Prudential Financial, Inc. (“Prudential”).
Note 3. Other Transactions with Affiliates
Prudential Mutual Fund Services LLC (“PMFS”), an affiliate of PI and an indirect, wholly owned subsidiary of Prudential, serves as the Fund’s transfer agent. The transfer agent fees and expenses in the Statement of Operations also include certain out-of-pocket expenses paid to non-affiliates, where applicable.
| | |
| 28 | | Visit our website at www.jennisondryden.com |
The Fund pays networking fees to affiliated and unaffiliated broker/dealers, including fees related to the services of First Clearing, LLC (“First Clearing”), an affiliate of PI. These networking fees are payments made to broker/dealers that clear mutual fund transactions through a national clearing system. For the year ended October 31, 2008, the Fund incurred approximately $61,500 in total networking fees, of which $36,200 was paid to First Clearing. These amounts are included in transfer agent’s fees and expenses in the Statement of Operations.
The Fund invests in the Taxable Money Market Series (the “Portfolio”), a portfolio of Dryden Core Investment Fund. The Portfolio is a money market mutual fund registered under the Investment Company Act of 1940, as amended, and managed by PI.
Note 4. Portfolio Securities
Purchases and sales of investment securities, other than short-term investments, for the year ended October 31, 2008 were $76,704,299 and $102,691,462, respectively.
Note 5. Distributions and Tax Information
Distributions to shareholders, which are determined in accordance with federal income tax regulations, which may differ from generally accepted accounting principles, are recorded on the ex-dividend date. In order to present undistributed net investment income and accumulated net realized loss on investments and foreign currency transactions on the Statement of Assets and Liabilities that more closely represent their tax character, certain adjustments have been made to undistributed net investment income and accumulated net realized loss on investments and foreign currency transactions. For the tax year ended October 31, 2008 the adjustments were to decrease undistributed net investment income and accumulated net realized loss on investments and foreign currency transactions by $1,365,612 due to differences in the treatment for book and tax purposes of foreign currency gains and losses, investments in passive foreign investment companies and a redesignation of distributions paid. Net investment income, net realized loss and net assets were not affected by this change.
For the year ended October 31, 2008, the tax character of dividends and distributions paid as reflected in the Statement of Changes in Net Assets were $16,583,094 from ordinary income and $29,680,762 from long-term capital gains. For the year ended October 31, 2007, the tax character of dividends and distributions paid as reflected in
| | |
| Dryden International Value Fund | | 29 |
Notes to Financial Statements
continued
the Statement of Changes in Net Assets were $751,034 from ordinary income and $14,216,919 from long-term capital gains. For federal income tax purposes, dividends from net investment income and distributions from short-term capital gains are taxable as ordinary income. Long-term capital gain distributions are taxable as such.
As of October 31, 2008, accumulated undistributed earnings on a tax basis were $7,014,509 from ordinary income. This differs from the amount shown on the Statement of Assets and Liabilities primarily due to cumulative timing differences between financial and tax reporting.
At October 31, 2008, for federal income tax purposes, the Series had a capital loss carryforward of approximately $2,965,000 of which $1,156,000 expires in 2010, $334,000 expires in 2011 and $1,475,000 expires in 2016. No capital gain distributions are expected to be paid to shareholders until net gains have been realized in excess of such carryforward. It is uncertain whether the Series will be able to realize the full benefit prior to the expiration date.
The federal income tax basis of the Series’ investments and the net unrealized appreciation as of October 31, 2008 was as follows:
| | | | | | |
Tax basis | | Appreciation | | Depreciation | | Net Unrealized
Depreciation |
| $230,802,950 | | $11,034,649 | | $(77,662,596) | | $(66,627,947) |
The difference between book basis and tax basis was primarily attributable to deferred losses on wash sales and investments in passive foreign investment companies.
Management has analyzed the Series‘ tax positions taken on federal income tax returns for all open tax years and has concluded that as of October 31, 2008, no provisions for income tax would be required in the Series’ financial statements. The Series’ federal and state income and federal excise tax returns for tax years for which the applicable statuses of limitations have not expired are subject to examination by the Internal Revenue Service and state departments of revenue.
Note 6. Capital
The Fund offers Class A, Class B, Class C and Class Z shares. Class A shares are sold with a front-end sales charge of up to 5.50%. All investors who purchase Class A shares in an amount of $1 million or more and sell these shares within 12 months of purchase are
| | |
| 30 | | Visit our website at www.jennisondryden.com |
subject to a contingent deferred sales charge (“CDSC”) of 1%, including investors who purchase their shares through broker-dealers affiliated with Prudential. Class B shares are sold with a CDSC which declines from 5% to zero depending upon the period of time the shares are held. Class C shares are sold with a CDSC of 1% during the first 12 months from the date of purchase. Class B shares will automatically convert to Class A shares on a quarterly basis approximately seven years after purchase. A special exchange privilege is also available for shareholders who qualify to purchase Class A shares at net asset value. Class Z shares are not subject to any sales or redemption charge and are offered exclusively for sale to a limited group of investors.
There are 500 million authorized shares of $.01 par value common stock, divided equally into four classes, designated Class A, Class B, Class C and Class Z common stock.
Transactions in shares of common stock were as follows:
| | | | | | | |
Class A | | Shares | | | Amount | |
Year ended October 31, 2008: | | | | | | | |
Shares sold | | 534,161 | | | $ | 13,934,334 | |
Shares issued in reinvestment of dividends and distributions | | 383,603 | | | | 10,859,810 | |
Shares reacquired | | (1,085,975 | ) | | | (25,465,778 | ) |
| | | | | | | |
Net increase (decrease) in shares outstanding before conversion | | (168,211 | ) | | | (671,634 | ) |
Shares issued upon conversion from Class B | | 149,006 | | | | 3,699,495 | |
| | | | | | | |
Net increase (decrease) in shares outstanding | | (19,205 | ) | | $ | 3,027,861 | |
| | | | | | | |
Year ended October 31, 2007: | | | | | | | |
Shares sold | | 509,561 | | | $ | 15,096,601 | |
Shares issued in reinvestment of dividends and distributions | | 129,319 | | | | 3,497,301 | |
Shares reacquired | | (860,411 | ) | | | (25,963,618 | ) |
| | | | | | | |
Net increase (decrease) in shares outstanding before conversion | | (221,531 | ) | | | (7,369,716 | ) |
Shares issued upon conversion from Class B | | 194,536 | | | | 5,558,092 | |
| | | | | | | |
Net increase (decrease) in shares outstanding | | (26,995 | ) | | $ | (1,811,624 | ) |
| | | | | | | |
Class B | | | | | | |
Year ended October 31, 2008: | | | | | | | |
Shares sold | | 47,216 | | | $ | 1,186,275 | |
Shares issued in reinvestment of dividends and distributions | | 68,544 | | | | 1,865,077 | |
Shares reacquired | | (104,809 | ) | | | (2,383,037 | ) |
| | | | | | | |
Net increase (decrease) in shares outstanding before conversion | | 10,951 | | | | 668,315 | |
Shares reacquired upon conversion into Class A | | (155,432 | ) | | | (3,699,495 | ) |
| | | | | | | |
Net increase (decrease) in shares outstanding | | (144,481 | ) | | $ | (3,031,180 | ) |
| | | | | | | |
Year ended October 31, 2007: | | | | | | | |
Shares sold | | 100,519 | | | $ | 2,818,139 | |
Shares issued in reinvestment of dividends and distributions | | 30,063 | | | | 785,125 | |
Shares reacquired | | (160,949 | ) | | | (4,465,536 | ) |
| | | | | | | |
Net increase (decrease) in shares outstanding before conversion | | (30,367 | ) | | | (862,272 | ) |
Shares reacquired upon conversion into Class A | | (201,681 | ) | | | (5,558,092 | ) |
| | | | | | | |
Net increase (decrease) in shares outstanding | | (232,048 | ) | | $ | (6,420,364 | ) |
| | | | | | | |
| | |
| Dryden International Value Fund | | 31 |
Notes to Financial Statements
continued
| | | | | | | |
Class C | | Shares | | | Amount | |
Year ended October 31, 2008: | | | | | | | |
Shares sold | | 54,845 | | | $ | 1,366,860 | |
Shares issued in reinvestment of dividends and distributions | | 76,310 | | | | 2,078,683 | |
Shares reacquired | | (174,727 | ) | | | (3,830,369 | ) |
| | | | | | | |
Net increase (decrease) in shares outstanding | | (43,572 | ) | | $ | (384,826 | ) |
| | | | | | | |
Year ended October 31, 2007: | | | | | | | |
Shares sold | | 71,193 | | | $ | 2,020,334 | |
Shares issued in reinvestment of dividends and distributions | | 27,352 | | | | 715,272 | |
Shares reacquired | | (158,776 | ) | | | (4,438,393 | ) |
| | | | | | | |
Net increase (decrease) in shares outstanding | | (60,231 | ) | | $ | (1,702,787 | ) |
| | | | | | | |
Class Z | | | | | | |
Year ended October 31, 2008: | | | | | | | |
Shares sold | | 2,658,072 | | | $ | 63,738,010 | |
Shares issued in reinvestment of dividends and distributions | | 1,058,869 | | | | 30,093,061 | |
Shares reacquired | | (3,036,949 | ) | | | (72,067,314 | ) |
| | | | | | | |
Net increase (decrease) in shares outstanding | | 679,992 | | | $ | 21,763,757 | |
| | | | | | | |
Year ended October 31, 2007: | | | | | | | |
Shares sold | | 2,903,901 | | | $ | 85,891,108 | |
Shares issued in reinvestment of dividends and distributions | | 351,107 | | | | 9,527,931 | |
Shares reacquired | | (2,901,435 | ) | | | (86,957,761 | ) |
| | | | | | | |
Net increase (decrease) in shares outstanding | | 353,573 | | | $ | 8,461,278 | |
| | | | | | | |
Note 7. Borrowings
The Fund, along with other affiliated registered investment companies (the “Funds”), is a party to a Syndicated Credit Agreement (“SCA”) with two banks. The SCA provides for a commitment of $500 million. Interest on any borrowings under the SCA is incurred at contracted market rates and a commitment fee for the unused amount is accrued daily and paid quarterly. Effective October 24, 2008, the Funds renewed the SCA with the banks. The commitment under the renewed SCA continues to be $500 million. The Funds pay a commitment fee of .13 of 1% of the unused portion of the renewed SCA. The expiration date of the renewed SCA will be October 23, 2009. For the period from October 26, 2007 through October 23, 2008, the Funds paid a commitment fee of .06 of 1% of the unused portion of the agreement. The purpose of the SCA is to provide an alternative source of temporary funding for capital share redemptions.
| | |
| 32 | | Visit our website at www.jennisondryden.com |
The Series utilized the line of credit during for the year ended October 31, 2008. The average daily balance for the 4 days the Series had debt outstanding during the period was approximately $650,000 at a weighted average interest rate of approximately 2.54%.
Note 8. New Accounting Pronouncements
On September 20, 2006, the Financial Accounting Standards Board (“FASB”) released Statement of Financial Accounting Standards No. 157 “Fair Value Measurements” (“FAS 157”). FAS 157 establishes an authoritative definition of fair value, sets out a framework for measuring fair value, and requires additional disclosures about fair-value measurements. The application of FAS 157 is required for fiscal years beginning after November 15, 2007 and interim periods within those fiscal years. At this time, management is evaluating the implications of FAS 157 and its impact, if any, in the financial statements has not yet been determined.
In March 2008, FASB released Statement of Financial Accounting Standards No. 161, Disclosures about Derivative Instruments and Hedging Activities (“FAS 161”). FAS 161 requires qualitative disclosures about objectives and strategies for using derivatives, quantitative disclosures about fair value amounts of gains and losses on derivative instruments, and disclosures about credit-risk-related contingent features in derivative agreements. The application of FAS 161 is required for any reporting period beginning after November 15, 2008. At this time, management is evaluating the implications of FAS 161 and its impact on the financial statements has not yet been determined.
On September 12, 2008, the FASB issued FASB Staff Position (“FSP”) No. FAS 133-1 and FASB Interpretation Number (“FIN”) 45-4 (“FSP 133-1”), Disclosures about Credit Derivatives and Certain Guarantees: An Amendment of FASB Statement No. 133 and FASB Interpretation No. 45; and Clarification of the Effective Date of FASB Statement No. 161. The FSP is intended to improve disclosures about credit derivatives by requiring more information about the potential adverse effects of changes in credit risk on the financial position, financial performance, and cash flows of the sellers of credit derivatives. It amends FASB Statement No. 133, Accounting for Derivative Instruments and Hedging Activities, to require disclosures by sellers of credit derivatives, including credit derivatives embedded in hybrid instruments. The FSP also amends FIN 45, Guarantor’s Accounting and Disclosure Requirements for Guarantees, Including Indirect Guarantees of Indebtedness to Others, to require an additional disclosure about the current status of the payment/performance risk of a guarantee. FSP 133-1 and FIN 45-4 is effective for reporting periods (annual or interim) ending after November 15, 2008. Management of the Fund is currently assessing the impact of adopting FSP No. FAS 133-1 and FIN 45-4.
| | |
| Dryden International Value Fund | | 33 |
Financial Highlights
| | | | |
| | | Class A | |
| | | Year Ended
October 31, 2008(b) | |
Per Share Operating Performance: | | | | |
Net Asset Value, Beginning Of Year | | $ | 34.10 | |
| | | | |
Income (loss) from investment operations: | | | | |
Net investment income | | | .44 | |
Net realized and unrealized gain (loss) on investment and foreign currency transactions | | | (14.93 | ) |
| | | | |
Total from investment operations | | | (14.49 | ) |
| | | | |
Less Dividends and Distributions: | | | | |
Dividends from net investment income | | | (.38 | ) |
Distributions from net realized gains | | | (3.95 | ) |
| | | | |
Total dividends and distributions | | | (4.33 | ) |
| | | | |
Net asset value, end of year | | $ | 15.28 | |
| | | | |
Total Return(a): | | | (48.33 | )% |
Ratios/Supplemental Data: | | | | |
Net assets, end of year (000) | | $ | 40,580 | |
Average net assets (000) | | $ | 71,618 | |
Ratios to average net assets(e): | | | | |
Expenses, including distribution and service (12b-1) fees(c) | | | 1.56 | % |
Expenses, excluding distribution and service (12b-1) fees | | | 1.31 | % |
Net investment income | | | 1.79 | % |
For Class A, B, C and Z shares: | | | | |
Portfolio turnover rate | | | 27 | % |
| (a) | These total returns do not consider the effect of sales load. Total return is calculated assuming a purchase of a share on the first day and a sale on the last day of each year reported and includes reinvestment of dividends and distributions. Total returns may reflect adjustments to conform to generally accepted accounting principles. |
| (b) | Calculations are based on the average daily number of shares outstanding. |
| (c) | The distributor of the Fund has contractually agreed through February 28, 2010, to limit its distribution and service (12b-1) fees to .25 of 1% of the average daily assets of the Class A shares. |
| (d) | Effective August 1, 2005, the Manager of the Fund voluntarily agreed to reimburse the Series in order to limit operating expenses (excluding interest, taxes and brokerage commissions) to 1.61% of the average daily net assets of the Class A shares. If the Manager had not reimbursed the Series, the annual expenses (both including and excluding distribution and service (12b-1) fees) and net investment income ratios would be 1.62%, 1.37% and 1.15%, respectively, for the year ended October 31, 2005. |
| (e) | Does not include expenses of the underlying portfolio in which the Series invests. |
See Notes to Financial Statements.
| | |
| 34 | | Visit our website at www.jennisondryden.com |
| | | | | | | | | | | | | | |
| Class A | |
| Year Ended October 31, | |
| 2007(b) | | | 2006(b) | | | 2005(b) | | | 2004(b) | |
| | | | | | | | | | | | | | |
| $ | 27.12 | | | $ | 21.88 | | | $ | 18.29 | | | $ | 16.07 | |
| | | | | | | | | | | | | | | |
| | | | | | | | | | | | | | |
| | .51 | | | | .45 | | | | .24 | | | | .16 | |
|
7.85 |
| | | 5.61 | | | | 3.53 | | | | 2.20 | |
| | | | | | | | | | | | | | | |
| | 8.36 | | | | 6.06 | | | | 3.77 | | | | 2.36 | |
| | | | | | | | | | | | | | | |
| | | | | | | | | | | | | | |
| | (.03 | ) | | | (.50 | ) | | | (.18 | ) | | | (.14 | ) |
| | (1.35 | ) | | | (.32 | ) | | | — | | | | — | |
| | | | | | | | | | | | | | | |
| | (1.38 | ) | | | (.82 | ) | | | (.18 | ) | | | (.14 | ) |
| | | | | | | | | | | | | | | |
| $ | 34.10 | | | $ | 27.12 | | | $ | 21.88 | | | $ | 18.29 | |
| | | | | | | | | | | | | | | |
| | 32.15 | % | | | 28.59 | % | | | 20.71 | % | | | 14.77 | % |
| | | | | | | | | | | | | | |
| $ | 91,221 | | | $ | 73,289 | | | $ | 61,347 | | | $ | 55,530 | |
| $ | 84,344 | | | $ | 67,590 | | | $ | 59,739 | | | $ | 49,953 | |
| | | | | | | | | | | | | | |
| | 1.57 | % | | | 1.65 | % | | | 1.62 | %(d) | | | 1.61 | % |
| | 1.32 | % | | | 1.40 | % | | | 1.37 | %(d) | | | 1.36 | % |
| | 1.74 | % | | | 1.83 | % | | | 1.15 | %(d) | | | .90 | % |
| | | | | | | | | | | | | | |
| | 44 | % | | | 48 | % | | | 121 | % | | | 24 | % |
See Notes to Financial Statements.
| | |
| Dryden International Value Fund | | 35 |
Financial Highlights
continued
| | | | |
| | | Class B | |
| | | Year Ended
October 31, 2008(b) | |
Per Share Operating Performance: | | | | |
Net Asset Value, Beginning Of Year | | $ | 32.73 | |
| | | | |
Income (loss) from investment operations: | | | | |
Net investment income | | | .24 | |
Net realized and unrealized gain (loss) on investment and foreign currency transactions | | | (14.29 | ) |
| | | | |
Total from investment operations | | | (14.05 | ) |
| | | | |
Less Dividends and Distributions: | | | | |
Dividends from net investment income | | | (0.15 | ) |
Distributions from net realized gains | | | (3.95 | ) |
| | | | |
Total dividends and distributions | | | (4.10 | ) |
| | | | |
Net asset value, end of year | | $ | 14.58 | |
| | | | |
Total Return(a): | | | (48.74 | )% |
Ratios/Supplemental Data: | | | | |
Net assets, end of year (000) | | $ | 5,143 | |
Average net assets (000) | | $ | 10,730 | |
Ratios to average net assets(d): | | | | |
Expenses, including distribution and service (12b-1) fees | | | 2.31 | % |
Expenses, excluding distribution and service (12b-1) fees | | | 1.31 | % |
Net investment income | | | 1.01 | % |
| (a) | These total returns do not consider the effect of sales load. Total return is calculated assuming a purchase of a share on the first day and a sale on the last day of each year reported and includes reinvestment of dividends and distributions. Total returns may reflect adjustments to conform to generally accepted accounting principles. |
| (b) | Calculations are based on the average daily number of shares outstanding. |
| (c) | Effective August 1, 2005, the Manager of the Fund voluntarily agreed to reimburse the Series in order to limit operating expenses (excluding interest, taxes and brokerage commissions) to 2.36% of the average daily net assets of the Class B shares. If the Manager had not reimbursed the Series, the annual expenses (both including and excluding distribution and service (12b-1) fees) and net investment income ratios would be 2.37%, 1.37% and 0.38%, respectively, for the year ended October 31, 2005. |
| (d) | Does not include expenses of the underlying portfolio in which the Series invests. |
See Notes to Financial Statements.
| | |
| 36 | | Visit our website at www.jennisondryden.com |
| | | | | | | | | | | | | | |
| Class B | |
| Year Ended October 31, | |
| 2007(b) | | | 2006(b) | | | 2005(b) | | | 2004(b) | |
| | | | | | | | | | | | | | |
| $ | 26.24 | | | $ | 21.19 | | | $ | 17.73 | | | $ | 15.58 | |
| | | | | | | | | | | | | | | |
| | | | | | | | | | | | | | |
| | .24 | | | | .19 | | | | .08 | | | | .03 | |
|
7.60 |
| | | 5.49 | | | | 3.42 | | | | 2.15 | |
| | | | | | | | | | | | | | | |
| | 7.84 | | | | 5.68 | | | | 3.50 | | | | 2.18 | |
| | | | | | | | | | | | | | | |
| | | | | | | | | | | | | | |
| | — | | | | (.31 | ) | | | (.04 | ) | | | (.03 | ) |
| | (1.35 | ) | | | (.32 | ) | | | — | | | | — | |
| | | | | | | | | | | | | | | |
| | (1.35 | ) | | | (.63 | ) | | | (.04 | ) | | | (.03 | ) |
| | | | | | | | | | | | | | | |
| $ | 32.73 | | | $ | 26.24 | | | $ | 21.19 | | | $ | 17.73 | |
| | | | | | | | | | | | | | | |
| | 31.17 | % | | | 27.51 | % | | | 19.77 | % | | | 13.98 | % |
| | | | | | | | | | | | | | |
| $ | 16,279 | | | $ | 19,141 | | | $ | 18,978 | | | $ | 25,917 | |
| $ | 16,627 | | | $ | 19,346 | | | $ | 23,092 | | | $ | 33,863 | |
| | | | | | | | | | | | | | |
| | 2.32 | % | | | 2.40 | % | | | 2.37 | %(c) | | | 2.36 | % |
| | 1.32 | % | | | 1.40 | % | | | 1.37 | %(c) | | | 1.36 | % |
| | .84 | % | | | .78 | % | | | .38 | %(c) | | | .15 | % |
See Notes to Financial Statements.
| | |
| Dryden International Value Fund | | 37 |
Financial Highlights
continued
| | | | |
| | | Class C | |
| | | Year Ended
October 31, 2008(b) | |
Per Share Operating Performance: | | | | |
Net Asset Value, Beginning Of Year | | $ | 32.77 | |
| | | | |
Income (loss) from investment operations: | | | | |
Net investment income | | | .24 | |
Net realized and unrealized gain (loss) on investment and foreign currency transactions | | | (14.31 | ) |
| | | | |
Total from investment operations | | | (14.07 | ) |
| | | | |
Less Dividends and Distributions: | | | | |
Dividends from net investment income | | | (0.15 | ) |
Distributions from net realized gains | | | (3.95 | ) |
| | | | |
Total dividends and distributions | | | (4.10 | ) |
| | | | |
Net asset value, end of year | | $ | 14.60 | |
| | | | |
Total Return(a): | | | (48.74 | )% |
Ratios/Supplemental Data: | | | | |
Net assets, end of year (000) | | $ | 7,355 | |
Average net assets (000) | | $ | 13,571 | |
Ratios to average net assets(d): | | | | |
Expenses, including distribution and service (12b-1) fees | | | 2.31 | % |
Expenses, excluding distribution and service (12b-1) fees | | | 1.31 | % |
Net investment income | | | 1.04 | % |
| (a) | These total returns do not consider the effect of sales load. Total return is calculated assuming a purchase of a share on the first day and a sale on the last day of each year reported and includes reinvestment of dividends and distributions. Total returns may reflect adjustments to conform to generally accepted accounting principles. |
| (b) | Calculations are based on the average daily number of shares outstanding. |
| (c) | Effective August 1, 2005, the Manager of the Fund voluntarily agreed to reimburse the Series in order to limit operating expenses (excluding interest, taxes and brokerage commissions) to 2.36% of the average daily net assets of the Class C shares. If the Manager had not reimbursed the Series, the annual expenses (both including and excluding distribution and service (12b-1) fees) and net investment income ratios would be 2.37%, 1.37% and 0.40%, respectively, for the year ended October 31, 2005. |
| (d) | Does not include expenses of the underlying portfolio in which the Series invests. |
See Notes to Financial Statements.
| | |
| 38 | | Visit our website at www.jennisondryden.com |
| | | | | | | | | | | | | | |
| Class C | |
| Year Ended October 31, | |
| 2007(b) | | | 2006(b) | | | 2005(b) | | | 2004(b) | |
| | | | | | | | | | | | | | |
| $ | 26.27 | | | $ | 21.21 | | | $ | 17.74 | | | $ | 15.60 | |
| | | | | | | | | | | | | | | |
| | | | | | | | | | | | | | |
| | .27 | | | | .23 | | | | .08 | | | | .06 | |
|
7.58 |
| | | 5.46 | | | | 3.43 | | | | 2.11 | |
| | | | | | | | | | | | | | | |
| | 7.85 | | | | 5.69 | | | | 3.51 | | | | 2.17 | |
| | | | | | | | | | | | | | | |
| | | | | | | | | | | | | | |
| | — | | | | (.31 | ) | | | (.04 | ) | | | (.03 | ) |
| | (1.35 | ) | | | (.32 | ) | | | — | | | | — | |
| | | | | | | | | | | | | | | |
| | (1.35 | ) | | | (.63 | ) | | | (.04 | ) | | | (.03 | ) |
| | | | | | | | | | | | | | | |
| $ | 32.77 | | | $ | 26.27 | | | $ | 21.21 | | | $ | 17.74 | |
| | | | | | | | | | | | | | | |
| | 31.17 | % | | | 27.53 | % | | | 19.81 | % | | | 13.90 | % |
| | | | | | | | | | | | | | |
| $ | 17,938 | | | $ | 15,962 | | | $ | 12,720 | | | $ | 13,040 | |
| $ | 16,297 | | | $ | 14,909 | | | $ | 13,293 | | | $ | 11,763 | |
| | | | | | | | | | | | | | |
| | 2.32 | % | | | 2.40 | % | | | 2.37 | %(c) | | | 2.36 | % |
| | 1.32 | % | | | 1.40 | % | | | 1.37 | %(c) | | | 1.36 | % |
| | .94 | % | | | .98 | % | | | .40 | %(c) | | | .33 | % |
See Notes to Financial Statements.
| | |
| Dryden International Value Fund | | 39 |
Financial Highlights
continued
| | | | |
| | | Class Z | |
| | | Year Ended
October 31, 2008(b) | |
Per Share Operating Performance: | | | | |
Net Asset Value, Beginning of Year | | $ | 34.30 | |
| | | | |
Income (loss) from investment operations: | | | | |
Net investment income | | | .50 | |
Net realized and unrealized gain (loss) on investment and foreign currency transactions | | | (15.02 | ) |
| | | | |
Total from investment operations | | | (14.52 | ) |
| | | | |
Less Dividends and Distributions: | | | | |
Dividends from net investment income | | | (.46 | ) |
Distributions from net realized gains | | | (3.95 | ) |
| | | | |
Total dividends and distributions | | | (4.41 | ) |
| | | | |
Net asset value, end of year | | $ | 15.37 | |
| | | | |
Total Return(a): | | | (48.23 | )% |
Ratios/Supplemental Data: | | | | |
Net assets, end of year (000) | | $ | 115,710 | |
Average net assets (000) | | $ | 186,380 | |
Ratios to average net assets(d): | | | | |
Expenses, including distribution and service (12b-1) fees | | | 1.31 | % |
Expenses, excluding distribution and service (12b-1) fees | | | 1.31 | % |
Net investment income | | | 2.06 | % |
| (a) | These total returns do not consider the effect of sales load. Total return is calculated assuming a purchase of a share on the first day and a sale on the last day of each year reported and includes reinvestment of dividends and distributions. Total returns may reflect adjustments to conform to generally accepted accounting principles. |
| (b) | Calculations are based on the average daily number of shares outstanding. |
| (c) | Effective August 1, 2005, the Manager of the Fund voluntarily agreed to reimburse the Series in order to limit operating expenses (excluding interest, taxes and brokerage commissions) to 1.36% of the average daily net assets of the Class Z shares. If the Manager had not reimbursed the Series, the annual expenses (both including and excluding distribution and service (12b-1) fees) and net investment income ratios would be 1.37%, 1.37% and 1.43%, respectively, for the year ended October 31, 2005. |
| (d) | Does not include expenses of the underlying portfolio in which the Series invests. |
See Notes to Financial Statements.
| | |
| 40 | | Visit our website at www.jennisondryden.com |
| | | | | | | | | | | | | | |
| Class Z | |
| Year Ended October 31, | |
| 2007(b) | | | 2006(b) | | | 2005(b) | | | 2004(b) | |
| | | | | | | | | | | | | | |
| $ | 27.26 | | | $ | 22.02 | | | $ | 18.41 | | | $ | 16.17 | |
| | | | | | | | | | | | | | | |
| | | | | | | | | | | | | | |
| | .60 | | | | .28 | | | | .29 | | | | .20 | |
|
7.89 |
| | | 5.84 | | | | 3.54 | | | | 2.22 | |
| | | | | | | | | | | | | | | |
| | 8.49 | | | | 6.12 | | | | 3.83 | | | | 2.42 | |
| | | | | | | | | | | | | | | |
| | | | | | | | | | | | | | |
| | (.10 | ) | | | (.56 | ) | | | (.22 | ) | | | (.18 | ) |
| | (1.35 | ) | | | (.32 | ) | | | — | | | | — | |
| | | | | | | | | | | | | | | |
| | (1.45 | ) | | | (.88 | ) | | | (.22 | ) | | | (.18 | ) |
| | | | | | | | | | | | | | | |
| $ | 34.30 | | | $ | 27.26 | | | $ | 22.02 | | | $ | 18.41 | |
| | | | | | | | | | | | | | | |
| | 32.50 | % | | | 28.78 | % | | | 20.97 | % | | | 15.09 | % |
| | | | | | | | | | | | | | |
| $ | 234,828 | | | $ | 177,008 | | | $ | 156,678 | | | $ | 295,418 | |
| $ | 206,798 | | | $ | 170,067 | | | $ | 264,624 | | | $ | 334,003 | |
| | | | | | | | | | | | | | |
| | 1.32 | % | | | 1.40 | % | | | 1.37 | %(c) | | | 1.36 | % |
| | 1.32 | % | | | 1.40 | % | | | 1.37 | %(c) | | | 1.36 | % |
| | 2.02 | % | | | 1.13 | % | | | 1.43 | %(c) | | | 1.10 | % |
See Notes to Financial Statements.
| | |
| Dryden International Value Fund | | 41 |
Report of Independent Registered Public
Accounting Firm
The Board of Directors and Shareholders of
Prudential World Fund, Inc.—Dryden International Value Fund:
We have audited the accompanying statement of assets and liabilities of the Prudential World Fund, Inc.—Dryden International Value Fund (one of the portfolios constituting the Prudential World Fund, Inc., hereafter referred to as the “Fund”), including the portfolio of investments, as of October 31, 2008, and the related statement of operations for the year then ended, the statement of changes in net assets for each of the years in the two-year period then ended, and the financial highlights for each of years in the five-year period then ended. These financial statements and financial highlights are the responsibility of the Fund’s management. Our responsibility is to express an opinion on these financial statements and financial highlights based on our audits.
We conducted our audits in accordance with the standards of the Public Company Accounting Oversight Board (United States). Those standards require that we plan and perform the audit to obtain reasonable assurance about whether the financial statements and financial highlights are free of material misstatement. An audit includes examining, on a test basis, evidence supporting the amounts and disclosures in the financial statements. Our procedures included confirmation of securities owned as of October 31, 2008, by correspondence with the custodian and brokers or by other appropriate auditing procedures where replies from brokers were not received. An audit also includes assessing the accounting principles used and significant estimates made by management, as well as evaluating the overall financial statement presentation. We believe that our audits provide a reasonable basis for our opinion.
In our opinion, the financial statements and financial highlights referred to above present fairly, in all material respects, the financial position of the Fund as of October 31, 2008, and the results of its operations for the year then ended, the changes in its net assets for each of the years in the two-year period then ended and the financial highlights for each of the years in the five-year period then ended, in conformity with U.S. generally accepted accounting principles.

New York, New York
December 23, 2008
| | |
| 42 | | Visit our website at www.jennisondryden.com |
Tax Information
(Unaudited)
We are required by Internal Revenue Code to advise you within 60 days of the Series’ fiscal year end (October 31, 2008) as to the federal tax status of dividends and distributions paid by the Series during such fiscal year. We are advising you in the fiscal year ended October 31, 2008, the Series paid dividends from net investment income of $0.38, $0.15, $0.15 and $0.46 per share from Class A, B, C and Z shares, respectively. In addition, the Series paid $1.15 per share of short-term capital gains and $2.80 per share of long-term capital gains for Class A, B, C and Z shares. For federal income tax purposes, dividends from net investment income and distributions from short-term capital gains are taxable as ordinary income. Long-term capital gain distributions are taxable as such.
For the fiscal year ended October 31, 2008, the Series designated 50.87% of the ordinary income dividends as qualified for the reduced tax rate under The Job and Growth Tax Relief Reconciliation Act of 2003.
The Series designates 99.56% of ordinary income dividends as short-term capital gain dividends (QSTCG) under the American Jobs Creation Act of 2004.
For the fiscal year ended October 31, 2008, the Series intends on passing through $931,000 of ordinary income distributions as a foreign tax credit from recognized foreign source income of $10,142,638.
In January 2009, you will be advised on IRS Form 1099DIV or Substitute Form 1099DIV as to the federal tax status of dividends and distributions received by you in calendar year 2008.
| | |
| Dryden International Value Fund | | 43 |
MANAGEMENT OF THE FUND
(Unaudited)
Information about Fund Directors/Trustees (referred to herein as “Board Members”) and Fund Officers is set forth below. Board Members who are not deemed to be “interested persons,” as defined in the 1940 Act, are referred to as “Independent Board Members.” Board Members who are deemed to be “interested persons” are referred to as “Interested Board Members.” The Board Members are responsible for the overall supervision of the operations of the Fund and perform the various duties imposed on the directors or trustees of investment companies by the 1940 Act.
Independent Board Members
| | | | |
Name, Address, Age Position(s) Portfolios Overseen (1) | | Principal Occupation(s) During Past Five Years | | Other Directorships Held |
Kevin J. Bannon (56) Board Member Portfolios Overseen: 62 | | Managing Director (since April 2008) of Highmount Capital LLC (registered investment adviser); formerly Executive Vice President and Chief Investment Officer (April 1993-August 2007) of Bank of New York Company; President (May 2003-May 2007) of BNY Hamilton Family of Mutual Funds. | | Director of Urstadt Biddle Properties (since September 2008) |
| | | |
Linda W. Bynoe (56) Board Member Portfolios Overseen: 62 | | President and Chief Executive Officer (since March 1995) of Telemat Ltd. (management consulting); formerly Vice President at Morgan Stanley Co (broker- dealer). | | Director of Simon Property Group, Inc. (real estate investment trust) (since May 2003); Director of Anixter International (communication products distributor) (since January 2006); Director of Northern Trust Corporation (banking) (since April 2006). |
| | | |
David E.A. Carson (74) Board Member Portfolios Overseen: 62 | | Director (since May 2008) of Liberty Bank; Director (since October 2007) of ICI Mutual Insurance Company; formerly President, Chairman and Chief Executive Officer of People’s Bank (1987 – 2000). | | None. |
| | | |
Michael S. Hyland, CFA (63) Board Member Portfolios Overseen: 62 | | Independent Consultant (since February 2005); formerly Senior Managing Director (July 2001-February 2005) of Bear Stearns Co, Inc.; Global Partner, INVESCO (1999-2001); Managing Director and President Salomon Brothers Asset Management (1989-1999). | | None. |
| | | |
Robert E. La Blanc (74) Board Member Portfolios Overseen: 62 | | President (since 1981) of Robert E. La Blanc Associates, Inc. (telecommunications). | | Director of CA, Inc. (since 2002) (software company); FiberNet Telecom Group, Inc. (since 2003) (telecom company). |
Visit our website at www.jennisondryden.com
| | | | |
| | | |
Douglas H. McCorkindale (69) Board Member Portfolios Overseen: 62 | | Formerly Chairman (February 2001-June 2006), Chief Executive Officer (June 2000-July 2005), President (September 1997-July 2005) and Vice Chairman (March 1984-May 2000) of Gannett Co. Inc. (publishing and media). | | Director of Continental Airlines, Inc. (since May 1993); Director of Lockheed Martin Corp. (aerospace and defense) (since May 2001). |
| | | |
Stephen P. Munn (66) Board Member Portfolios Overseen: 62 | | Lead Director (since 2007) and formerly Chairman (1993-2007) of Carlisle Companies Incorporated (manufacturer of industrial products). | | None. |
| | | |
Richard A. Redeker (65) Board Member Portfolios Overseen: 62 | | Retired Mutual Fund Executive (36 years); Management Consultant; Director of Penn Tank Lines, Inc. (since 1999). | | None. |
| | | |
Robin B. Smith (69) Board Member & Independent Chair Portfolios Overseen: 62 | | Chairman of the Board (since January 2003) of Publishers Clearing House (direct marketing); formerly Chairman and Chief Executive Officer (August 1996-January 2003) of Publishers Clearing House. | | Formerly Director of BellSouth Corporation (telecommunications) (1992-2006). |
| | | |
Stephen G. Stoneburn (65) Board Member Portfolios Overseen: 62 | | President and Chief Executive Officer (since June 1996) of Quadrant Media Corp. (publishing company); formerly President (June 1995-June 1996) of Argus Integrated Media, Inc.; Senior Vice President and Managing Director (January 1993-1995) of Cowles Business Media; Senior Vice President of Fairchild Publications, Inc (1975-1989). | | None. |
Interested Board Members
| | | | |
| | | |
Judy A. Rice (60) Board Member & President Portfolios Overseen: 62 | | President, Chief Executive Officer, Chief Operating Officer and Officer-In-Charge (since February 2003) of Prudential Investments LLC; President, Chief Executive Officer and Officer-In-Charge (since April 2003) of Prudential Mutual Fund Services LLC; formerly Vice President (February 1999-April 2006) of Prudential Investment Management Services LLC; formerly President, Chief Executive Officer, Chief Operating Officer and Officer-In-Charge (May 2003-June 2005) and Director (May 2003-March 2006) and Executive Vice President (June 2005-March 2006) of AST Investment Services, Inc.; Member of Board of Governors of the Investment Company Institute. | | None. |
Dryden International Value Fund
| | | | |
| | | |
Robert F. Gunia (62) Board Member & Vice President Portfolios Overseen: 146 | | Chief Administrative Officer (since September 1999) and Executive Vice President (since December 1996) of Prudential Investments LLC; President (since April 1999) of Prudential Investment Management Services LLC; Executive Vice President (since March 1999) and Treasurer (since May 2000) of Prudential Mutual Fund Services LLC; Chief Administrative Officer, Executive Vice President and Director (since May 2003) of AST Investment Services, Inc. | | Director (since May 1989) of The Asia Pacific Fund, Inc. and Vice President (since January 2007) of The Greater China Fund, Inc. |
1 | The year that each individual joined the Fund’s Board is as follows: |
Linda W. Bynoe, 2005; David E.A. Carson, 2003; Robert E. La Blanc, 1984; Douglas H. McCorkindale, 2003; Richard A. Redeker, 2003; Robin B. Smith, 1996; Stephen G. Stoneburn, 1996; Kevin J. Bannon, 2008; Michael S. Hyland, 2008; Stephen P. Munn, 2008; Judy A. Rice, Board Member since 2000 and President since 2003; Robert F. Gunia, Board Member since 1996 and Vice President since 1999.
Visit our website at www.jennisondryden.com
Fund Officers (a)(1)
| | |
Name, Address and Age Position with Fund | | Principal Occupation(s) During Past Five Years |
Kathryn L. Quirk (56) Chief Legal Officer | | Vice President and Corporate Counsel (since September 2004) of Prudential; Executive Vice President, Chief Legal Officer and Secretary (since July 2005) of PI and Prudential Mutual Fund Services LLC; Vice President and Corporate Counsel (since June 2005) and Secretary (since February 2006) of AST Investment Services, Inc.; formerly Senior Vice President and Assistant Secretary (November 2004-August 2005) of PI; formerly Assistant Secretary (June 2005-February 2006) of AST Investment Services, Inc.; formerly Managing Director, General Counsel, Chief Compliance Officer, Chief Risk Officer and Corporate Secretary (1997-2002) of Zurich Scudder Investments, Inc. |
| | |
Deborah A. Docs (50) Secretary | | Vice President and Corporate Counsel (since January 2001) of Prudential; Vice President (since December 1996) and Assistant Secretary (since March 1999) of PI; formerly Vice President and Assistant Secretary (May 2003-June 2005) of AST Investment Services, Inc. |
| | |
Jonathan D. Shain (50) Assistant Secretary | | Vice President and Corporate Counsel (since August 1998) of Prudential; Vice President and Assistant Secretary (since May 2001) of PI; Vice President and Assistant Secretary (since February 2001) of PMFS; formerly Vice President and Assistant Secretary (May 2003-June 2005) of AST Investment Services, Inc. |
| | |
Claudia DiGiacomo (34) Assistant Secretary | | Vice President and Corporate Counsel (since January 2005) of Prudential; Vice President and Assistant Secretary of PI (since December 2005); Associate at Sidley Austin LLP (1999-2004). |
| | |
John P. Schwartz (37) Assistant Secretary | | Vice President and Corporate Counsel (since April 2005) of Prudential; Vice President and Assistant Secretary of PI (since December 2005); Associate at Sidley Austin LLP (1997-2005). |
| | |
Andrew R. French (46) Assistant Secretary | | Director and Corporate Counsel (since May 2006) of Prudential; Vice President and Assistant Secretary (since January 2007) of PI; Vice President and Assistant Secretary (since January 2007) of PMFS; formerly Senior Legal Analyst of Prudential Mutual Fund Law Department (1997-2006). |
| | |
Timothy J. Knierim (49) Chief Compliance Officer | | Chief Compliance Officer of Prudential Investment Management, Inc. (PIM) (since July 2007); formerly Chief Risk Officer of PIM and PI (2002-2007) and formerly Chief Ethics Officer of PIM and PI (2006-2007). |
| | |
Valerie M. Simpson (50) Deputy Chief Compliance Officer | | Chief Compliance Officer (since April 2007) of PI and AST Investment Services, Inc.; formerly Vice President-Financial Reporting (June 1999-March 2006) for Prudential Life and Annuities Finance. |
| | |
Theresa C. Thompson (46) Deputy Chief Compliance Officer | | Vice President, Mutual Fund Compliance, PI (since April 2004); and Director, Compliance, PI (2001 - 2004). |
Dryden International Value Fund
| | |
| | |
Noreen M. Fierro (44) Anti-Money Laundering Compliance Officer | | Vice President, Corporate Compliance (since May 2006) of Prudential; formerly Corporate Vice President, Associate General Counsel (April 2002-May 2005) of UBS Financial Services, Inc., in their Money Laundering Prevention Group; Senior Manager (May 2005-May 2006) of Deloitte Financial Advisory Services, LLP, in their Forensic and Dispute Services, Anti-Money Laundering Group. |
| | |
Grace C. Torres (49) Treasurer and Principal Financial and Accounting Officer | | Assistant Treasurer (since March 1999) and Senior Vice President (since September 1999) of PI; Assistant Treasurer (since May 2003) and Vice President (since June 2005) of AST Investment Services, Inc.; Senior Vice President and Assistant Treasurer (since May 2003) of Prudential Annuities Advisory Services, Inc.; formerly Senior Vice President (May 2003-June 2005) of AST Investment Services, Inc. |
| | |
M. Sadiq Peshimam (44) Assistant Treasurer | | Vice President (since 2005) and Director (2000-2005) within Prudential Mutual Fund Administration. |
| | |
Peter Parrella (50) Assistant Treasurer | | Vice President (since 2007) and Director (2004-2007) within Prudential Mutual Fund Administration; formerly Tax Manager at SSB Citi Fund Management LLC (1997-2004). |
(a) | Excludes interested Board Members who also serve as President or Vice President. |
1 | The year that each individual became an officer of the Fund is as follows: |
Kathryn L. Quirk, 2005; Deborah A. Docs, 2005; Jonathan D. Shain, 2005; Claudia DiGiacomo, 2005; John P. Schwartz, 2006; Andrew R. French, 2006; Timothy J. Knierim, 2007; Valerie M. Simpson, 2007; Theresa C. Thompson, 2008; Noreen M. Fierro, 2006; Grace C. Torres, 1995; Sadiq Peshimam, 2006; Peter Parrella, 2007.
Explanatory Notes
| | • | | Board Members are deemed to be “Interested,” as defined in the 1940 Act, by reason of their affiliation with Prudential Investments LLC and/or an affiliate of Prudential Investments LLC. |
| | • | | Unless otherwise noted, the address of all Board Members and Officers is c/o Prudential Investments LLC, Gateway Center Three, 100 Mulberry Street, Newark, New Jersey 07102. |
| | • | | There is no set term of office for Board Members or Officers. The Board Members have adopted a retirement policy, which calls for the retirement of Board Members on December 31st of the year in which they reach the age of 75. |
| | • | | “Other Directorships Held” includes only directorships of companies required to register or file reports with the SEC under the Securities Exchange Act of 1934 (that is, “public companies”) or other investment companies registered under the 1940 Act. |
| | • | | “Portfolios Overseen” includes all investment companies managed by Prudential Investments LLC. The investment companies for which PI serves as manager include the JennisonDryden Funds, Strategic Partners Funds, The Prudential Variable Contract Accounts, The Target Portfolio Trust, The Prudential Series Fund, The High Yield Income Fund, Inc., The High Yield Plus Fund, Inc., Nicholas-Applegate Fund, Inc., Prudential’s Gibraltar Fund, Inc. and the Advanced Series Trust. |
Visit our website at www.jennisondryden.com
Approval of Advisory Agreement
The Board of Directors (the “Board”) of Prudential World Fund, Inc. oversees the management of Dryden International Value Fund (formerly, Strategic Partners International Value Fund) (the “Fund”) and, as required by law, determines annually whether to renew the Fund’s management agreement with Prudential Investments LLC (“PI”) and the Fund’s subadvisory agreements with LSV Asset Management (“LSV”) and Thornburg Investment Management, Inc. (“Thornburg”). In considering the renewal of the agreements, the Board, including all of the Independent Directors, met on June 3-5, 2008 and approved the renewal of the agreements through July 31, 2009, after concluding that renewal of the agreements was in the best interests of the Fund and its shareholders.
In advance of the meetings, the Board received materials relating to the agreements, and had the opportunity to ask questions and request further information in connection with their consideration. Among other things, the Board considered comparisons with other mutual funds in relevant Peer Universes and Peer Groups. The mutual funds included in each Peer Universe or Peer Group were objectively determined solely by Lipper Inc., an independent provider of mutual fund data. The comparisons placed the Fund in various quartiles over one-, three-, five-, and ten-year periods ending December 31, 2007, with the first quartile being the best 25% of the mutual funds (for performance, the best performing mutual funds and, for expenses, the lowest cost mutual funds).
In approving the agreements, the Board, including the Independent Directors advised by independent legal counsel, considered the factors they deemed relevant, including the nature, quality and extent of services provided, the performance of the Fund, the profitability of PI and its affiliates, expenses and fees, and the potential for economies of scale that may be shared with the Fund and its shareholders. In their deliberations, the Directors did not identify any single factor which alone was responsible for the Board’s decision to approve the agreements with respect to the Fund. In connection with their deliberations, the Board considered information provided by PI throughout the year at regular Board meetings, presentations from portfolio managers and other information, as well as information furnished at or in advance of the meetings on June 3-5, 2008.
The Directors determined that the overall arrangements between the Fund and PI, which serves as the Fund’s investment manager pursuant to a management agreement, and between PI and each of LSV and Thornburg, which serve as the Fund’s subadvisers pursuant to the terms of subadvisory agreements with PI, are fair and reasonable in light of the services performed, fees charged and such other matters as the Directors considered relevant in the exercise of their business judgment.
| | |
| Dryden International Value Fund | | |
Approval of Advisory Agreement (continued)
The material factors and conclusions that formed the basis for the Directors’ reaching their determinations to approve the continuance of the agreements are separately discussed below.
Nature, Quality, and Extent of Services
The Board received and considered information regarding the nature and extent of services provided to the Fund by PI, LSV and Thornburg. The Board considered the services provided by PI, including but not limited to the oversight of the subadvisers for the Fund, as well as the provision of fund recordkeeping, compliance, and other services to the Fund. With respect to PI’s oversight of the subadvisers, the Board noted that PI’s Strategic Investment Research Group (“SIRG”), which is a business unit of PI, is responsible for screening and recommending new subadvisers when appropriate, as well as monitoring and reporting to the Board on the performance and operations of the subadvisers. The Board also considered that PI pays the salaries of all of the officers and non-independent Directors of the Fund. The Board also considered the investment subadvisory services provided by LSV and Thornburg, as well as adherence to the Fund’s investment restrictions and compliance with applicable Fund policies and procedures. The Board considered PI’s evaluations of the subadvisers, as well as PI’s recommendation, based on its review of each subadviser, to renew the subadvisory agreements.
The Board reviewed the qualifications, backgrounds and responsibilities of PI’s senior management responsible for the oversight of the Fund and LSV and Thornburg, and also reviewed the qualifications, backgrounds and responsibilities of the LSV and Thornburg portfolio managers who are responsible for the day-to-day management of the Fund’s portfolio. The Board was provided with information pertaining to PI’s and LSV’s and Thornburg’s organizational structure, senior management, investment operations, and other relevant information pertaining to PI, LSV and Thornburg. The Board also noted that it received favorable compliance reports from the Fund’s Chief Compliance Officer (“CCO”) as to each of PI and LSV and Thornburg.
The Board concluded that it was satisfied with the nature, extent and quality of the investment management services provided by PI and the subadvisory services provided to the Fund by LSV and Thornburg, and that there was a reasonable basis on which to conclude that the Fund benefits from the services provided by PI and LSV and Thornburg under the management and subadvisory agreements.
Performance of Dryden International Value Fund
The Board received and considered information about the Fund’s historical performance. The Board considered that the Fund’s gross performance in relation to
| | |
| | Visit our website at www.jennisondryden.com |
its Peer Universe (the Lipper International Large-Cap Core Funds and International Multi-Cap Core Funds Performance Universe)1 was in the first quartile over the one- and three-year periods and in the second quartile over the five- and ten-year periods. The Board also noted that the Fund outperformed its benchmark index over all periods. The Board concluded that, in light of the Fund’s competitive performance, it would be in the interest of the Fund and its shareholders for the Fund to renew the agreements.
Fees and Expenses
The Board considered that the Fund’s actual management fees (which reflects any subsidies, waivers or expense caps) ranked in the Expense Group’s second quartile, although the Fund’s total expenses ranked in the Expense Group’s fourth quartile. The Board considered that the Fund's actual management fees (which reflects any subsidies, waivers or expense caps) ranked in the Expense Group's second quartile, although the Fund's total expenses ranked in the Expense Group's fourth quartile. The Board noted that the Fund's total expenses were only 6.5 basis points higher than the Expense Group median and that the Fund's actual operating expenses were significantly below the cap on annual operating expenses of 1.36% (exclusive of 12b-1 fees and certain other fees). Although the Board concurred with PI's recommendation to discontinue the existing cap at this time, it decided to continue evaluating strategic alternatives to reduce the Fund's total expenses. The Board concluded that the management and subadvisory fees are reasonable in light of the services provided.
Costs of Services and Profits Realized by PI
The Board was provided with information on the profitability of PI and its affiliates in serving as the Fund’s investment manager. The Board discussed with PI the methodology utilized in assembling the information regarding profitability and considered its reasonableness. The Board recognized that it is difficult to make comparisons of profitability from fund management contracts because comparative information is not generally publicly available and is affected by numerous factors, including the structure of the particular adviser, the types of funds it manages, its business mix, numerous assumptions regarding allocations and the adviser’s capital structure and cost of capital. Taking these factors into account, the Board concluded that the profitability of PI and its affiliates in relation to the services rendered was not unreasonable.
1Although Lipper classifies the Fund in its International Large-Cap Core Funds Performance Universe, the International Large-Cap Core Funds and Multi-Cap Core Funds Performance Universe was utilized because PI believes that the funds included in this Universe provide a more appropriate basis for Fund performance comparisons.
| | |
| Dryden International Value Fund | | |
Approval of Advisory Agreement (continued)
The Board considered information about the profitability of LSV or Thornburg, but concluded that the level of a subadviser’s profitability may not be as significant given the arm’s length nature of the process by which the subadvisory fee rates were negotiated by PI, LSV and Thornburg as well as the fact that PI compensates the subadvisers out of its management fee.
Economies of Scale
The Board received and discussed information concerning whether PI realizes economies of scale as the Fund’s assets grow beyond current levels. The Board noted that the management fee schedule for the Fund includes breakpoints, which have the effect of decreasing the fee rate as assets increase, but at the current level of assets the Fund does not realize the effect of those rate reductions. The Board took note that the Fund’s fee structure would result in benefits to Fund shareholders when (and if) assets reach the levels at which the fee rate is reduced. These benefits will accrue whether or not PI is then realizing any economies of scale.
Other Benefits to PI, LSV and Thornburg
The Board considered potential ancillary benefits that might be received by PI, LSV and Thornburg and their affiliates as a result of their relationship with the Fund. The Board concluded that potential benefits to be derived by PI included brokerage commissions received by affiliates of PI, transfer agency fees received by the Fund’s transfer agent (which is affiliated with PI), and benefits to the reputation as well as other intangible benefits resulting from PI’s association with the Fund. The Board concluded that the potential benefits to be derived by LSV and Thornburg included their ability to use soft dollar credits, brokerage commissions received by affiliates of LSV or Thornburg, as well as the potential benefits consistent with those generally resulting from an increase in assets under management, specifically, potential access to additional research resources and benefits to the reputation. The Board concluded that the benefits derived by PI and LSV and Thornburg were consistent with the types of benefits generally derived by investment managers and subadvisers to mutual funds.
After full consideration of these factors, the Board concluded that the approval of the agreements was in the interest of the Fund and its shareholders.
| | |
| | Visit our website at www.jennisondryden.com |
Growth of a $10,000 Investment
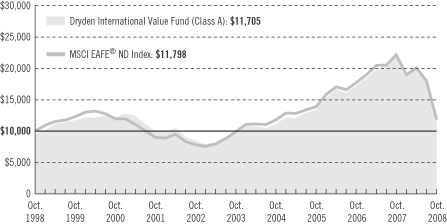
| | | | | | | | | |
| Average Annual Total Returns (With Sales Charges) as of 10/31/08 | |
| | | One Year | | | Five Years | | | Ten Years | |
Class A | | –51.17 | % | | 2.83 | % | | 1.59 | % |
Class B | | –50.97 | | | 3.03 | | | 1.38 | |
Class C | | –49.19 | | | 3.19 | | | 1.39 | |
Class Z | | –48.23 | | | 4.22 | | | 2.40 | |
| | | | | | | | | |
| Average Annual Total Returns (Without Sales Charges) as of 10/31/08 | |
| | | One Year | | | Five Years | | | Ten Years | |
Class A | | –48.33 | % | | 4.00 | % | | 2.16 | % |
Class B | | –48.74 | | | 3.20 | | | 1.38 | |
Class C | | –48.74 | | | 3.19 | | | 1.39 | |
Class Z | | –48.23 | | | 4.22 | | | 2.40 | |
Performance data quoted represent past performance. Past performance does not guarantee future results. The investment return and principal value of an investment will fluctuate, so that an investor’s shares, when redeemed, may be worth more or less than their original cost. Current performance may be lower or higher than the past performance data quoted. An investor may obtain performance data as of the most recent month-end by visiting our website at www.jennisondryden.com or by calling (800) 225-1852. The maximum initial sales charge is 5.50%. Gross operating expenses: Class A, 1.61%; Class B, 2.31%; Class C, 2.31%; Class Z, 1.31%. Net operating expenses apply to: Class A, 1.56%; Class B, 2.31%; Class C, 2.31%; Class Z, 1.31%, after contractual reduction through 2/28/2010.
The returns in the graph and the tables do not reflect the deduction of taxes that a shareholder would pay on Fund distributions or following the redemption of Fund shares.
| | |
| | Visit our website at www.jennisondryden.com |
Source: Prudential Investments LLC and Lipper Inc.
The graph compares a $10,000 investment in the Dryden International Value Fund (Class A shares) with a similar investment in the MSCI EAFE® ND Index by portraying the initial account values at the beginning of the 10-year period for Class A shares (October 31, 1998) and the account values at the end of the current fiscal year (October 31, 2008) as measured on a quarterly basis. For purposes of the graph, and unless otherwise indicated, it has been assumed that (a) the maximum applicable front-end sales charge was deducted from the initial $10,000 investment in Class A shares; (b) all recurring fees (including management fees) were deducted; and (c) all dividends and distributions were reinvested. The line graph provides information for Class A shares only. As indicated in the tables provided earlier, performance for Class B, Class C, and Class Z shares will vary due to the differing charges and expenses applicable to each share class (as indicated in the following paragraphs). Without the contractual distribution and service (12b-1) fee waiver of 0.05% for Class A shares in effect through February 28, 2010, the returns shown in the graph and for Class A shares in the tables would have been lower.
The MSCI EAFE® ND Index is an unmanaged, weighted index of performance that reflects stock price movements of developed-country markets in Europe, Australasia, and the Far East. The MSCI EAFE® ND Index’s total returns include the reinvestment of all dividends, but do not include the effects of sales charges, operating expenses of a mutual fund, or taxes. These returns would be lower if they included the effects of sales charges, operating expenses, or taxes. The securities that comprise the MSCI EAFE® ND Index may differ substantially from the securities in the Fund. The MSCI EAFE® ND Index is not the only index that may be used to characterize performance of international stock funds. Other indexes may portray different comparative performance. Investors cannot invest directly in an index.
Class A shares are subject to a maximum front-end sales charge of 5.50%, a 12b-1 fee of up to 0.30% annually, and all investors who purchase Class A shares in an amount of $1 million or more and sell these shares within 12 months of purchase are subject to a contingent deferred sales charge (CDSC) of 1%, in certain circumstances. Class B shares are subject to a declining CDSC of 5%, 4%, 3%, 2%, 1%, and 1%, respectively, for the first six years after purchase and a 12b-1 fee of 1% annually. Approximately seven years after purchase, Class B shares will automatically convert to Class A shares on a quarterly basis. Class C shares purchased are not subject to a front-end sales charge, but charge a CDSC of 1% for Class C shares sold within 12 months from the date of purchase, and an annual 12b-1 fee of 1%. Class Z shares are not subject to a sales charge or 12b-1 fees. The returns in the graph and tables reflect the share class expense structure in effect at the close of the fiscal period.
| | |
| Dryden International Value Fund | | |
| | | | |
| n MAIL | | n TELEPHONE | | n WEBSITE |
Gateway Center Three 100 Mulberry Street Newark, NJ 07102 | | (800) 225-1852 | | www.jennisondryden.com |
|
| PROXY VOTING |
| The Board of Directors of the Fund has delegated to the Fund’s investment subadvisers the responsibility for voting any proxies and maintaining proxy recordkeeping with respect to the Fund. A description of these proxy voting policies and procedures is available without charge, upon request, by calling (800) 225-1852 or by visiting the Securities and Exchange Commission’s website at www.sec.gov. Information regarding how the Fund voted proxies relating to portfolio securities during the most recent 12-month period ended June 30 is available on the Fund’s website and on the Commission’s website. |
|
| DIRECTORS |
Kevin J. Bannon • Linda W. Bynoe • David E.A. Carson • Robert F. Gunia • Michael S. Hyland •
Robert E. La Blanc • Douglas H. McCorkindale • Stephen P. Munn • Richard A. Redeker •
Judy A. Rice • Robin B. Smith • Stephen G. Stoneburn |
|
| OFFICERS |
| Judy A. Rice, President • Robert F. Gunia, Vice President • Grace C. Torres, Treasurer and Principal Financial and Accounting Officer • Kathryn L. Quirk, Chief Legal Officer • Deborah A. Docs, Secretary • Timothy J. Knierim, Chief Compliance Officer • Valerie M. Simpson, Deputy Chief Compliance Officer • Theresa C. Thompson, Deputy Chief Compliance Officer • Noreen M. Fierro, Anti-Money Laundering Compliance Officer • Jonathan D. Shain, Assistant Secretary • Claudia DiGiacomo, Assistant Secretary • John P. Schwartz, Assistant Secretary • Andrew R. French, Assistant Secretary • M. Sadiq Peshimam, Assistant Treasurer • Peter Parrella, Assistant Treasurer |
| | | | |
| MANAGER | | Prudential Investments LLC | | Gateway Center Three
100 Mulberry Street
Newark, NJ 07102 |
|
| INVESTMENT SUBADVISERS | | LSV Asset Management
Thornburg Investment
Management, Inc. | | One North Wacker Drive
Suite 4000 Chicago, IL 60606 119 East Marcy Street Santa Fe, NM 87501 |
|
| DISTRIBUTOR | | Prudential Investment
Management Services LLC | | Gateway Center Three
100 Mulberry Street
Newark, NJ 07102 |
|
| CUSTODIAN | | PFPC Trust Company | | 400 Bellevue Parkway
Wilmington, DE 19809 |
|
| TRANSFER AGENT | | Prudential Mutual Fund
Services LLC | | PO Box 9658
Providence, RI 02940 |
|
| INDEPENDENT REGISTERED PUBLIC ACCOUNTING FIRM | | KPMG LLP | | 345 Park Avenue
New York, NY 10154 |
|
| FUND COUNSEL | | Sullivan & Cromwell LLP | | 125 Broad Street
New York, NY 10004 |
|
An investor should consider the investment objectives, risks, charges, and expenses of the Fund carefully before investing. The prospectus for the Fund contains this and other information about the Fund. An investor may obtain a prospectus by visiting our website at www.jennisondryden.com or by calling (800) 225-1852. The prospectus should be read carefully before investing. |
|
| E-DELIVERY |
| To receive your mutual fund documents on-line, go to www.icsdelivery.com/prudential/funds and enroll. Instead of receiving printed documents by mail, you will receive notification via e-mail when new materials are available. You can cancel your enrollment or change your e-mail address at any time by clicking on the change/cancel enrollment option at the icsdelivery website address. |
|
| SHAREHOLDER COMMUNICATIONS WITH DIRECTORS |
| Shareholders can communicate directly with the Board of Directors by writing to the Chair of the Board, Dryden International Value Fund, Prudential Investments, Attn: Board of Directors, 100 Mulberry Street, Gateway Center Three, Newark, NJ 07102. Shareholders can communicate directly with an individual Director by writing to the same address. Communications are not screened before being delivered to the addressee. |
|
| AVAILABILITY OF PORTFOLIO SCHEDULE |
| The Fund files its complete schedule of portfolio holdings with the Securities and Exchange Commission for the first and third quarters of each fiscal year on Form N-Q. The Fund’s Forms N-Q are available on the Commission’s website at www.sec.gov. The Fund’s Forms N-Q may also be reviewed and copied at the Commission’s Public Reference Room in Washington, D.C. Information on the operation and location of the Public Reference Room may be obtained by calling (202) 551-8090. The Fund’s schedule of portfolio holdings is also available on the Fund’s website as of the end of each fiscal quarter. |
|
| The Fund’s Statement of Additional Information contains additional information about the Fund’s Directors and is available without charge, upon request, by calling (800) 225-1852. |
Mutual Funds:
| | | | |
| ARE NOT INSURED BY THE FDIC OR ANY FEDERAL GOVERNMENT AGENCY | | MAY LOSE VALUE | | ARE NOT A DEPOSIT OF OR GUARANTEED BY ANY BANK OR ANY BANK AFFILIATE |

| | | | | | | | | | | | |
| Dryden International Value Fund | | | | |
| | | Share Class | | A | | B | | C | | Z | | |
| | NASDAQ | | PISAX | | PISBX | | PCISX | | PISZX | | |
| | CUSIP | | 743969503 | | 743969602 | | 743969701 | | 743969800 | | |
| | | | | | | | | | | | |
MF115E IFS-A159557 Ed. 12/2008

Item 2 – Code of Ethics — See Exhibit (a)
As of the end of the period covered by this report, the registrant has adopted a code of ethics (the “Section 406 Standards for Investment Companies – Ethical Standards for Principal Executive and Financial Officers”) that applies to the registrant’s Principal Executive Officer and Principal Financial Officer; the registrant’s Principal Financial Officer also serves as the Principal Accounting Officer.
The registrant hereby undertakes to provide any person, without charge, upon request, a copy of the code of ethics. To request a copy of the code of ethics, contact the registrant 800-225-1852, and ask for a copy of the Section 406 Standards for Investment Companies - Ethical Standards for Principal Executive and Financial Officers.
Item 3 – Audit Committee Financial Expert –
The registrant’s Board has determined that Mr. David E. A. Carson, member of the Board’s Audit Committee is an “audit committee financial expert,” and that he is “independent,” for purposes of this Item.
Item 4 – Principal Accountant Fees and Services –
(a) Audit Fees
For the fiscal years ended October 31, 2008 and October 31, 2007, KPMG LLP (“KPMG”), the Registrant’s principal accountant, billed the Registrant $54,984 and $52,324, respectively, for professional services rendered for the audit of the Registrant’s annual financial statements or services that are normally provided in connection with statutory and regulatory filings.
(b) Audit-Related Fees
None.
(c) Tax Fees
None.
(d) All Other Fees
None.
(e) (1) Audit Committee Pre-Approval Policies and Procedures
THE PRUDENTIAL MUTUAL FUNDS
AUDIT COMMITTEE POLICY
on
Pre-Approval of Services Provided by the Independent Accountants
The Audit Committee of each Prudential Mutual Fund is charged with the responsibility to monitor the independence of the Fund’s independent accountants. As part of this responsibility, the Audit Committee must pre-approve any independent accounting firm’s engagement to render audit and/or permissible non-audit services, as required by law. In evaluating a proposed engagement of the independent accountants, the Audit Committee will assess the effect that the engagement might reasonably be expected to have on the accountant’s independence. The Committee’s evaluation will be based on:
| | • | | a review of the nature of the professional services expected to be provided, |
| | • | | a review of the safeguards put into place by the accounting firm to safeguard independence, and |
| | • | | periodic meetings with the accounting firm. |
Policy for Audit and Non-Audit Services Provided to the Funds
On an annual basis, the scope of audits for each Fund, audit fees and expenses, and audit-related and non-audit services (and fees proposed in respect thereof) proposed to be performed by the Fund’s independent accountants will be presented by the Treasurer and the independent accountants to the Audit Committee for review and, as appropriate, approval prior to the initiation of such services. Such presentation shall be accompanied by confirmation by both the Treasurer and the independent accountants that the proposed services will not adversely affect the independence of the independent accountants. Proposed services shall be described in sufficient detail to enable the Audit Committee to assess the appropriateness of such services and fees, and the compatibility of the provision of such services with the auditor’s independence. The Committee shall receive periodic reports on the progress of the audit and other services which are approved by the Committee or by the Committee Chair pursuant to authority delegated in this Policy.
The categories of services enumerated under “Audit Services”, “Audit-related Services”, and “Tax Services” are intended to provide guidance to the Treasurer and the independent accountants as to those categories of services which the Committee believes are generally consistent with the independence of the independent accountants and which the Committee (or the Committee Chair) would expect upon the presentation of specific proposals to pre-approve. The enumerated categories are not intended as an exclusive list of audit, audit-related or tax services, which the Committee (or the Committee Chair) would consider for pre-approval.
Audit Services
The following categories of audit services are considered to be consistent with the role of the Fund’s independent accountants:
| | • | | Annual Fund financial statement audits |
| | • | | Seed audits (related to new product filings, as required) |
| | • | | SEC and regulatory filings and consents |
Audit-related Services
The following categories of audit-related services are considered to be consistent with the role of the Fund’s independent accountants:
| | • | | Accounting consultations |
| | • | | Fund merger support services |
| | • | | Agreed Upon Procedure Reports |
| | • | | Other Internal Control Reports |
Individual audit-related services that fall within one of these categories and are not presented to the Audit Committee as part of the annual pre-approval process will be subject to pre-approval by the Committee Chair (or any other Committee member on whom this responsibility has been delegated) so long as the estimated fee for those services does not exceed $50,000.
Tax Services
The following categories of tax services are considered to be consistent with the role of the Fund’s independent accountants:
| | • | | Tax compliance services related to the filing or amendment of the following: |
| | • | | Federal, state and local income tax compliance; and, |
| | • | | Sales and use tax compliance |
| | • | | Timely RIC qualification reviews |
| | • | | Tax distribution analysis and planning |
| | • | | Tax authority examination services |
| | • | | Tax appeals support services |
| | • | | Accounting methods studies |
| | • | | Fund merger support services |
| | • | | Tax consulting services and related projects |
Individual tax services that fall within one of these categories and are not presented to the Audit Committee as part of the annual pre-approval process will be subject to pre-approval by the Committee Chair (or any other Committee member on whom this responsibility has been delegated) so long as the estimated fee for those services does not exceed $50,000.
Other Non-audit Services
Certain non-audit services that the independent accountants are legally permitted to render will be subject to pre-approval by the Committee or by one or more Committee members to whom the Committee has delegated this authority and who will report to the full Committee any pre-approval decisions made pursuant to this Policy. Non-audit services presented for pre-approval pursuant to this paragraph will be accompanied by a confirmation from both the Treasurer and the independent accountants that the proposed services will not adversely affect the independence of the independent accountants.
Proscribed Services
The Fund’s independent accountants will not render services in the following categories of non-audit services:
| | • | | Bookkeeping or other services related to the accounting records or financial statements of the Fund |
| | • | | Financial information systems design and implementation |
| | • | | Appraisal or valuation services, fairness opinions, or contribution-in-kind reports |
| | • | | Internal audit outsourcing services |
| | • | | Management functions or human resources |
| | • | | Broker or dealer, investment adviser, or investment banking services |
| | • | | Legal services and expert services unrelated to the audit |
| | • | | Any other service that the Public Company Accounting Oversight Board determines, by regulation, is impermissible. |
Pre-approval of Non-Audit Services Provided to Other Entities Within the Prudential Fund Complex
Certain non-audit services provided to Prudential Investments LLC or any of its affiliates that also provide ongoing services to the Prudential Mutual Funds will be subject to pre-approval by the Audit Committee. The only non-audit services provided to these entities that will require pre-approval are those related directly to the operations and financial reporting of the Funds. Individual projects that are not presented to the Audit Committee as part of the annual pre-approval process will be subject to pre-approval by the Committee Chair (or any other Committee member on whom this responsibility has been delegated) so long as the estimated fee for those services does not exceed $50,000. Services presented for pre-approval pursuant to this paragraph will be accompanied by a confirmation from both the Treasurer and the independent accountants that the proposed services will not adversely affect the independence of the independent accountants.
Although the Audit Committee will not pre-approve all services provided to Prudential Investments LLC and its affiliates, the Committee will receive an annual report from the Fund’s independent accounting firm showing the aggregate fees for all services provided to Prudential Investments and its affiliates.
(e) (2) Percentage of services referred to in 4(b) – 4(d) that were approved by the audit committee –
Not applicable.
(f) Percentage of hours expended attributable to work performed by other than full time employees of principal accountant if greater than 50%.
The percentage of hours expended on the principal accountant’s engagement to audit the registrant’s financial statements for the most recent fiscal year that were attributed to work performed by persons other than the principal accountant’s full-time, permanent employees was 0%.
(g) Non-Audit Fees
Not applicable to Registrant for the fiscal years 2008 and 2007. The aggregate non-audit fees billed by KPMG for services rendered to the registrant’s investment adviser and any entity controlling, controlled by, or under common control with the investment adviser that provides ongoing services to the registrant for the fiscal years 2008 and 2007 was $0 and $44,700, respectively.
(h) Principal Accountant’s Independence
Not applicable as KPMG has not provided non-audit services to the registrant’s investment adviser and any entity controlling, controlled by, or under common control with the investment adviser that provides ongoing services to the registrant that were not pre-approved pursuant to Rule 2-01(c)(7)(ii) of Regulation S-X.
| Item 5 | – Audit Committee of Listed Registrants – Not applicable. |
| Item 6 | – Schedule of Investments – The schedule is included as part of the report to shareholders filed under Item 1 of this Form. |
| Item 7 | – Disclosure of Proxy Voting Policies and Procedures for Closed-End Management Investment Companies – Not applicable. |
| Item 8 | – Portfolio Managers of Closed-End Management Investment Companies – Not applicable. |
| Item 9 | – Purchases of Equity Securities by Closed-End Management Investment Company and Affiliated Purchasers – Not applicable. |
| Item 10 | – Submission of Matters to a Vote of Security Holders – Not applicable. |
| Item 11 | – Controls and Procedures |
| | (a) | It is the conclusion of the registrant’s principal executive officer and principal financial officer that the effectiveness of the registrant’s current disclosure controls and procedures (such disclosure controls and procedures having been evaluated within 90 days of the date of this filing) provide reasonable assurance that the information required to be disclosed by the registrant has been recorded, processed, summarized and reported within the time period specified in the Commission’s rules and forms and that the information required to be disclosed by the registrant has been accumulated and communicated to the registrant’s principal executive officer and principal financial officer in order to allow timely decisions regarding required disclosure. |
| | (b) | There has been no significant change in the registrant’s internal control over financial reporting that occurred during the registrant’s most recent fiscal quarter of the period covered by this report that has materially affected, or is likely to materially affect, the registrant’s internal control over financial reporting. |
| | (a) | (1) Code of Ethics – Attached hereto as Exhibit EX-99.CODE-ETH |
| | (2) | Certifications pursuant to Section 302 of the Sarbanes-Oxley Act – Attached hereto as Exhibit EX-99.CERT. |
| | (3) | Any written solicitation to purchase securities under Rule 23c-1. – Not applicable. |
| | (b) | Certifications pursuant to Section 906 of the Sarbanes-Oxley Act – Attached hereto as Exhibit EX-99.906CERT. |
SIGNATURES
Pursuant to the requirements of the Securities Exchange Act of 1934 and the Investment Company Act of 1940, the registrant has duly caused this report to be signed on its behalf by the undersigned, thereunto duly authorized.
(Registrant) Prudential World Fund, Inc.
| | |
| By (Signature and Title)* | | /s/ Deborah A. Docs |
| | Deborah A. Docs |
| | Secretary |
|
| Date December 19, 2008 |
Pursuant to the requirements of the Securities Exchange Act of 1934 and the Investment Company Act of 1940, this report has been signed below by the following persons on behalf of the registrant and in the capacities and on the dates indicated.
| | |
| By (Signature and Title)* | | /s/ Judy A. Rice |
| | Judy A. Rice |
| | President and Principal Executive Officer |
|
| Date December 19, 2008 |
| |
| By (Signature and Title)* | | /s/ Grace C. Torres |
| | Grace C. Torres |
| | Treasurer and Principal Financial Officer |
|
| Date December 19, 2008 |
| * | Print the name and title of each signing officer under his or her signature. |