UNITED STATES
SECURITIES AND EXCHANGE COMMISSION
Washington, D.C. 20549
FORM N-CSR
CERTIFIED SHAREHOLDER REPORT OF REGISTERED
MANAGEMENT INVESTMENT COMPANIES
| Investment Company Act file number: | 811-03981 | |
| Exact name of registrant as specified in charter: | Prudential World Fund, Inc. | |
| Address of principal executive offices: | Gateway Center 3, 100 Mulberry Street, Newark, New Jersey 07102 | |
| Name and address of agent for service: | Deborah A. Docs Gateway Center 3, 100 Mulberry Street, Newark, New Jersey 07102 | |
| Registrant’s telephone number, including area code: | 800-225-1852 | |
| Date of fiscal year end: | 10/31/2010 | |
| Date of reporting period: | 10/31/2010 | |
Item 1 – Reports to Stockholders

| ANNUAL REPORT | OCTOBER 31, 2010 |
Prudential International Equity Fund
Fund Type International stock
Objective Long-term growth of capital | This report is not authorized for distribution to prospective investors unless preceded or accompanied by a current prospectus.
The views expressed in this report and information about the Fund’s portfolio holdings are for the period covered by this report and are subject to change thereafter.
Prudential Investments, Prudential, the Prudential logo and the Rock symbol are service marks of Prudential Financial, Inc. and its related entities, registered in many jurisdictions worldwide. |
| To enroll in e-delivery, go to www.prudentialfunds.com/edelivery |

December 15, 2010
Dear Shareholder:
We hope you find the annual report for the Prudential International Equity Fund informative and useful. Because of ongoing market volatility, we understand that this is a difficult time to be an investor. While it is impossible to predict what the future holds, we continue to believe a prudent response to uncertainty is to maintain a diversified portfolio, including stock and bond mutual funds consistent with your tolerance for risk, time horizon, and financial goals.
A diversified asset allocation offers two potential advantages: It limits your exposure to any particular asset class; plus it provides a better opportunity to invest some of your assets in the right place at the right time. Your financial professional can help you create a diversified investment plan that may include mutual funds covering all the basic asset classes and that reflects your personal investor profile and risk tolerance. Keep in mind that diversification and asset allocation strategies do not assure a profit or protect against loss in declining markets.
Prudential Investments® provides a wide range of mutual funds to choose from that can help you make progress toward your financial goals. Our funds offer the experience, resources, and professional discipline of Prudential Financial’s affiliated asset managers. Most of Prudential Investments’ equity funds are advised by Jennison Associates LLC, Quantitative Management Associates LLC (QMA), or Prudential Real Estate Investors. Prudential Investment Management, Inc. (PIM) advises the Prudential Investments fixed income and money market funds through its Prudential Fixed Income unit. Jennison Associates, QMA, and PIM are registered investment advisers and Prudential Financial companies. Prudential Real Estate Investors is a unit of PIM.
Thank you for choosing the Prudential Investments family of mutual funds.
Sincerely,

Judy A. Rice, President
Prudential International Equity Fund
| Prudential International Equity Fund | 1 |
Your Fund’s Performance
Performance data quoted represent past performance. Past performance does not guarantee future results. The investment return and principal value of an investment will fluctuate, so that an investor’s shares, when redeemed, may be worth more or less than their original cost. Current performance may be lower or higher than the past performance data quoted. An investor may obtain performance data as of the most recent month-end by visiting our website at www.prudentialfunds.com or by calling (800) 225-1852. Class A and Class L shares have a maximum initial sales charge of 5.50% and 5.75%, respectively. Gross operating expenses: Class A, 1.57%; Class B, 2.27%; Class C, 2.27%; Class F, 2.02%; Class L, 1.77%; Class M, 2.27%; Class X, 2.27%; Class Z, 1.27%. Net operating expenses: Class A, 1.57%; Class B, 2.27%; Class C, 2.27%; Class F, 2.02%; Class L, 1.77%; Class M, 2.27%; Class X, 2.27%; Class Z, 1.27%.
| Cumulative Total Returns (Without Sales Charges) as of 10/31/10 | ||||||||||||||||
| One Year | Five Years | Ten Years | Since Inception | |||||||||||||
Class A | 8.78 | % | 2.16 | % | –10.68 | % | — | |||||||||
Class B | 8.11 | –1.30 | –17.01 | — | ||||||||||||
Class C | 8.11 | –1.29 | –17.00 | — | ||||||||||||
Class F | 8.35 | N/A | N/A | –23.97% (12/18/06) | ||||||||||||
Class L | 8.59 | N/A | N/A | –23.87 (3/19/07) | ||||||||||||
Class M | 8.11 | N/A | N/A | –25.23 (3/19/07) | ||||||||||||
Class X | 8.11 | N/A | N/A | –25.23 (3/19/07) | ||||||||||||
Class Z | 8.98 | 3.35 | –8.76 | — | ||||||||||||
MSCI EAFE ND Index | 8.36 | 17.66 | 36.66 | — | ||||||||||||
Lipper Average | 10.34 | 16.07 | 30.60 | — | ||||||||||||
| Average Annual Total Returns (With Sales Charges) as of 9/30/10 | ||||||||||||||||
| One Year | Five Years | Ten Years | Since Inception | |||||||||||||
Class A | –3.54 | % | –2.03 | % | –2.73 | % | — | |||||||||
Class B | –3.63 | –1.82 | –2.91 | — | ||||||||||||
Class C | 0.37 | –1.64 | –2.91 | — | ||||||||||||
Class F | –3.58 | N/A | N/A | –8.44% (12/18/06) | ||||||||||||
Class L | –3.96 | N/A | N/A | –9.97 (3/19/07) | ||||||||||||
Class M | –4.63 | N/A | N/A | –9.68 (3/19/07) | ||||||||||||
Class X | –4.63 | N/A | N/A | –9.92 (3/19/07) | ||||||||||||
Class Z | 2.14 | –0.67 | –1.97 | — | ||||||||||||
MSCI EAFE ND Index | 3.27 | 1.97 | 2.56 | — | ||||||||||||
Lipper Average | 3.88 | 1.66 | 1.77 | — | ||||||||||||
| 2 | Visit our website at www.prudentialfunds.com |
| Average Annual Total Returns (With Sales Charges) as of 10/31/10 | ||||||||||||||||
| One Year | Five Years | Ten Years | Since Inception | |||||||||||||
Class A | 2.79 | % | –0.70 | % | –1.68 | % | — | |||||||||
Class B | 3.11 | –0.44 | –1.85 | — | ||||||||||||
Class C | 7.11 | –0.26 | –1.85 | — | ||||||||||||
Class F | 3.35 | N/A | N/A | –7.28% (12/18/06) | ||||||||||||
Class L | 2.35 | N/A | N/A | –8.76 (3/19/07) | ||||||||||||
Class M | 2.11 | N/A | N/A | –8.42 (3/19/07) | ||||||||||||
Class X | 2.11 | N/A | N/A | –8.66 (3/19/07) | ||||||||||||
Class Z | 8.98 | 0.66 | –0.91 | — | ||||||||||||
| Average Annual Total Returns (Without Sales Charges) as of 10/31/10 | ||||||||||||||||
| One Year | Five Years | Ten Years | Since Inception | |||||||||||||
Class A | 8.78% | 0.43% | –1.12% | — | ||||||||||||
Class B | 8.11 | –0.26 | –1.85 | — | ||||||||||||
Class C | 8.11 | –0.26 | –1.85 | — | ||||||||||||
Class F | 8.35 | N/A | N/A | –6.83% (12/18/06) | ||||||||||||
Class L | 8.59 | N/A | N/A | –7.25 (3/19/07) | ||||||||||||
Class M | 8.11 | N/A | N/A | –7.71 (3/19/07) | ||||||||||||
Class X | 8.11 | N/A | N/A | –7.71 (3/19/07) | ||||||||||||
Class Z | 8.98 | 0.66 | –0.91 | — | ||||||||||||
Growth of a $10,000 Investment
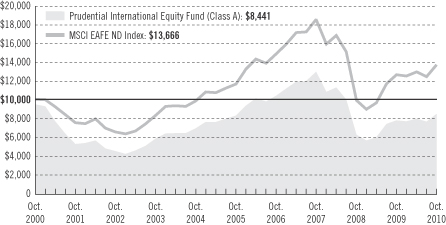
The graph compares a $10,000 investment in the Prudential International Equity Fund (Class A shares) with a similar investment in the MSCI EAFE ND Index by portraying the initial account values at the beginning of the 10-year period for Class A shares (October 31, 2000) and the account values at the end of the current fiscal year
(October 31, 2010) as measured on a quarterly basis. For purposes of the graph, and unless otherwise indicated,
| Prudential International Equity Fund | 3 |
Your Fund’s Performance (continued)
it has been assumed that (a) the maximum applicable front-end sales charge was deducted from the initial $10,000 investment in Class A shares; (b) all recurring fees (including management fees) were deducted; and (c) all dividends and distributions were reinvested. The line graph provides information for Class A shares only. As indicated in the tables provided earlier, performance for Class B, Class C, Class F, Class L, Class M, Class X, and Class Z shares will vary due to the differing charges and expenses applicable to each share class (as indicated in the following paragraphs). Without the distribution and service (12b-1) fee waiver of 0.05% for Class A shares in effect through October 31, 2010, the returns shown in the graph and for Class A shares in the tables would have been lower.
Source: Prudential Investments LLC and Lipper Inc. Performance figures may reflect fee waivers and/or expense reimbursements. In the absence of such fee waivers and/or expense reimbursements, total returns would be lower.
Inception returns are provided for any share class with less than 10 calendar years of returns. The Since Inception returns for the MSCI EAFE ND Index and the Lipper International Large-Cap Core Funds Average are measured from the closest month-end to inception date, and not from the Fund’s actual inception date.
The average annual total returns take into account applicable sales charges. Class A and Class L shares are subject to a maximum front-end sales charge of 5.50%, and 5.75%, respectively, a 12b-1 fee of up to 0.30% and 0.50%, respectively annually, and all investors who purchase Class A and Class L shares in an amount of $1 million or more and sell these shares within 12 months of purchase are subject to a contingent deferred sales charge (CDSC) of 1%. Class B and Class F shares are subject to a declining CDSC of 5%, 4%, 3%, 2%, 1%, and 1%, respectively for the first six years after purchase and 12b-1 fees of 1% and 0.75%, respectively, annually. Approximately seven years after purchase, Class B and Class F shares will automatically convert to Class A shares on a quarterly basis. Class C shares are not subject to a front-end sales charge, but charge a CDSC of 1% for Class C shares sold within 12 months from the date of purchase and an annual 12b-1 fee of 1%. Class M and Class X shares purchased are not subject to a front-end sales charge, but charge a CDSC of 6% and a 12b-1 fee of 1%. The CDSC for Class M and Class X shares decreases by 1% annually to 2% in the fifth and sixth years after purchase, 1% in the seventh year and 0% in the eighth year after purchase. Class M and Class X shares convert to Class A shares approximately eight years after purchase. The returns in the graph and tables reflect the share class expense structure in effect at the close of the fiscal period. The returns in the graph and the tables do not reflect the deduction of taxes that a shareholder would pay on Fund distributions or following the redemption of Fund shares.
Benchmark Definitions
Morgan Stanley Capital International Europe, Australasia, and Far East ND Index
The Morgan Stanley Capital International Europe, Australasia, and Far East Net Dividend (MSCI EAFE ND) Index is an unmanaged, weighted index of performance that reflects stock price movements of developed-country markets in Europe, Australasia, and the Far East. The ND version of the MSCI EAFE Index reflects the impact of the maximum withholding taxes on reinvested dividends. MSCI EAFE ND Index Closest Month-End to Inception cumulative total returns as of 10/31/10 are –13.14% for Class F, and –16.54% for Class L, Class M, and Class X. MSCI EAFE ND Index Closest Month-End to Inception average annual total returns as of 9/30/10 are –4.59% for Class F, and –5.99% for Class L, Class M, and Class X.
Lipper International Large-Cap Core Funds Average
The Lipper International Large-Cap Core Funds Average (Lipper Average) represents returns based on an average return of all funds in the Lipper International Large-Cap Core Funds category. Funds in the Lipper Average invest
| 4 | Visit our website at www.prudentialfunds.com |
at least 75% of their equity assets in companies strictly outside of the United States with market capitalizations (on a three-year weighted basis) greater than the 250th largest company in the S&P Developed ex-U.S. Broad Market Index (BMI). Large-Cap Core funds typically have an average price-to-cash flow ratio, price-to-book ratio, and three-year sales-per-share growth value compared with the S&P Developed ex-U.S. BMI. Lipper Average Closest Month-End to Inception cumulative total returns as of 10/31/10 are –13.83% for Class F, and –16.72% for Class L, Class M, and Class X. Lipper Average Closest Month-End to Inception average annual total returns as of 9/30/10 are –4.91% for Class F, and –6.19% for Class L, Class M, and Class X.
Investors cannot invest directly in an index or average. The returns for the MSCI EAFE ND Index and the Lipper Average would be lower if they included the effects of sales charges, operating expenses of a mutual fund, or taxes. Returns for the Lipper Average reflect the deduction of operating expenses, but not sales charges or taxes.
Five Largest Holdings in Long-Term Portfolio expressed as a percentage of net assets as of 10/31/10 | ||||
Novartis AG, Pharmaceuticals | 1.5 | % | ||
Total SA, Oil, Gas & Consumable Fuels | 1.5 | |||
Nestle SA, Food Products | 1.5 | |||
Telefonica SA, Diversified Telecommunication Services | 1.4 | |||
GlaxoSmithKline PLC, Pharmaceuticals | 1.4 |
Holdings are subject to change.
Five Largest Industries in Long-Term Portfolio expressed as a percentage of net assets as of 10/31/10 |
| |||
Commercial Banks | 13.0 | % | ||
Oil, Gas & Consumable Fuels | 8.1 | |||
Pharmaceuticals | 7.2 | |||
Metals & Mining | 6.1 | |||
Insurance | 4.2 | |||
Industry weightings are subject to change.
| Prudential International Equity Fund | 5 |
Strategy and Performance Overview
How did the Fund perform?
The Prudential International Equity Fund’s Class A shares gained 8.78% for the 12-month reporting period ended October 31, 2010, outperforming the 8.36% gain of the Morgan Stanley Capital International Europe, Australasia, and Far East Net Dividend Index (MSCI EAFE ND Index). However, the Fund’s Class A shares underperformed the 10.34% gain of the Lipper International Large-Cap Core Funds Average.
How is the Fund managed?
Quantitative Management Associates LLC (QMA) tries to outperform the MSCI EAFE ND Index by actively managing the Fund via a quantitative process that evaluates more than 1,000 stocks. Investing in shares of both slowly and rapidly growing companies limits the Fund’s exposure to any particular style of investing and may reduce its volatility relative to the MSCI EAFE ND Index.
When selecting stocks of slowly growing companies, QMA emphasizes attractive valuations and invests more heavily in shares that are priced cheaply relative to their firms’ earnings prospects and book values. When selecting stocks of more rapidly growing companies, QMA places a heavier emphasis on “news” or signals about their future growth prospects. For example, upward revisions in earnings forecasts by Wall Street analysts are used as an indication of good news.
As part of its strategy, the Fund seeks to remain fully invested. In order to accomplish this and to efficiently manage the Fund, QMA utilizes futures contracts based on equity market indexes to provide liquidity for the Fund. The futures contracts are used to equitize cash that has accrued, enabling the Fund to efficiently process large cash flows without requiring it to maintain large cash positions. During the reporting period, the Fund’s exposure to futures contracts did not have a material impact on its performance.
How did international stock markets perform?
Equity markets of economically developed nations, excluding the United States and Canada, posted an 8.36% gain overall in U.S. dollar terms for the 12-month reporting period, according to the MSCI EAFE ND Index. However, there was a huge disparity in the performance of the constituent markets, ranging from a 49.45% loss for Greece to a 30.74% gain for Singapore. This difference in performance was indicative of the contrasting economical and fiscal conditions that existed among nations whose stock markets are included in the MSCI EAFE ND Index.
A sovereign-debt crisis that began in Greece in late 2009 spread to other debt-laden nations that participate in the euro during 2010, especially Portugal and Spain. The worst flare-up in the crisis occurred in May. In that month, the European Union, with
| 6 | Visit our website at www.prudentialfunds.com |
Strategy and Performance Overview (continued)
help from the International Monetary Fund, announced a lending and support package of nearly $1 trillion to aid the weaker regional economies. The European Central Bank (ECB) also began to buy bonds of troubled European nations from banks to help stabilize fixed income markets. While these steps were welcomed by investors, nations most deeply affected by the sovereign-debt crisis still faced severe fiscal and economic challenges. Therefore, stock markets of Greece, Portugal, Ireland, and Spain, all of which participate in the 16-nation euro zone, posted losses for the reporting period.
Meanwhile, economical and fiscal conditions were far more favorable in Singapore, Denmark, and Sweden, which helped their stock markets score double-digit gains for the reporting period. Others gainers included euro zone nations Germany, France, and the Netherlands, which enjoyed better economical and fiscal situations than the four previously mentioned countries on the geographic edge of the euro bloc.
How did the sectors of the international stock markets perform?
The 10 sectors turned in a mixed performance for the reporting period in U.S. dollar terms. Four of the sectors scored double-digit gains, including materials, consumer discretionary, industrials, and consumer staples. Three sectors posted single-digit gains, including telecommunications services, information technology, and healthcare. The remaining sectors suffered losses, including utilities, financials, and energy.
Among slowly growing companies, which stocks or related-group of stocks contributed most and detracted most from the Fund’s return?
Among slowly growing companies, a few of the largest contributors to the Fund’s return were Vodafone, KONE, and Nestle, all of which registered significant gains for the reporting period. Some of the largest detractors were BP, BBVA, and E.ON, all of which suffered considerable losses for the period.
Among rapidly growing companies, which stocks or related-group of stocks contributed most and detracted most from the Fund’s return?
Among rapidly growing companies, a few of the largest contributors to the Fund’s return were shares of Genting Singapore, Dongfeng Motor, and Novo Nordisk, all of which registered sharp gains for the reporting period. A few of the largest detractors were shares of JSR, Credit Agricole, and Toyota Motor, all of which suffered double-digit losses for the reporting period.
| Prudential International Equity Fund | 7 |
Fees and Expenses (Unaudited)
As a shareholder of the Fund, you incur two types of costs: (1) transaction costs, including sales charges (loads) on purchase payments and redemptions, as applicable, and (2) ongoing costs, including management fees, distribution and/or service (12b-1) fees, and other Fund expenses, as applicable. This example is intended to help you understand your ongoing costs (in dollars) of investing in the Fund and to compare these costs with the ongoing costs of investing in other mutual funds.
The example is based on an investment of $1,000 invested on May 1, 2010, at the beginning of the period, and held through the six-month period ended October 31, 2010. The example is for illustrative purposes only; you should consult the Prospectus for information on initial and subsequent minimum investment requirements.
The Fund’s transfer agent may charge additional fees to holders of certain accounts that are not included in the expenses shown in the table on the following page. These fees apply to individual retirement accounts (IRAs) and Section 403(b) accounts. As of the close of the six-month period covered by the table, IRA fees included an annual maintenance fee of $15 per account (subject to a maximum annual maintenance fee of $25 for all accounts held by the same shareholder). Section 403(b) accounts are charged an annual $25 fiduciary maintenance fee. Some of the fees may vary in amount, or may be waived, based on your total account balance or the number of Prudential Investments funds, including the Fund, that you own. You should consider the additional fees that were charged to your Fund account over the six-month period when you estimate the total ongoing expenses paid over the period and the impact of these fees on your ending account value, as these additional expenses are not reflected in the information provided in the expense table. Additional fees have the effect of reducing investment returns.
Actual Expenses
The first line for each share class in the table on the following page provides information about actual account values and actual expenses. You may use the information on this line, together with the amount you invested, to estimate the expenses that you paid over the period. Simply divide your account value by $1,000 (for example, an $8,600 account value ÷ $1,000 = 8.6), then multiply the result by the number on the first line under the heading “Expenses Paid During the Six-Month Period” to estimate the expenses you paid on your account during this period.
Hypothetical Example for Comparison Purposes
The second line for each share class in the table on the following page provides information about hypothetical account values and hypothetical expenses based on the Fund’s actual expense ratio and an assumed rate of return of 5% per year before
| 8 | Visit our website at www.prudentialfunds.com |
expenses, which is not the Fund’s actual return. The hypothetical account values and expenses may not be used to estimate the actual ending account balance or expenses you paid for the period. You may use this information to compare the ongoing costs of investing in the Fund and other funds. To do so, compare this 5% hypothetical example with the 5% hypothetical examples that appear in the shareholder reports of the other funds.
Please note that the expenses shown in the table are meant to highlight your ongoing costs only and do not reflect any transactional costs such as sales charges (loads). Therefore, the second line for each share class in the table is useful in comparing ongoing costs only and will not help you determine the relative total costs of owning different funds. In addition, if these transactional costs were included, your costs would have been higher.
| Prudential International Equity Fund | Beginning Account Value May 1, 2010 | Ending Account October 31, 2010 | Annualized Expense Ratio Based on the Six-Month Period | Expenses Paid During the Six-Month Period* | ||||||||||||||
| Class A | Actual | $ | 1,000.00 | $ | 1,067.50 | 1.72 | % | $ | 8.96 | |||||||||
| Hypothetical | $ | 1,000.00 | $ | 1,016.53 | 1.72 | % | $ | 8.74 | ||||||||||
| Class B | Actual | $ | 1,000.00 | $ | 1,064.50 | 2.42 | % | $ | 12.59 | |||||||||
| Hypothetical | $ | 1,000.00 | $ | 1,013.01 | 2.42 | % | $ | 12.28 | ||||||||||
| Class C | Actual | $ | 1,000.00 | $ | 1,064.50 | 2.42 | % | $ | 12.59 | |||||||||
| Hypothetical | $ | 1,000.00 | $ | 1,013.01 | 2.42 | % | $ | 12.28 | ||||||||||
| Class F | Actual | $ | 1,000.00 | $ | 1,064.50 | 2.17 | % | $ | 11.29 | |||||||||
| Hypothetical | $ | 1,000.00 | $ | 1,014.27 | 2.17 | % | $ | 11.02 | ||||||||||
| Class L | Actual | $ | 1,000.00 | $ | 1,065.60 | 1.92 | % | $ | 10.00 | |||||||||
| Hypothetical | $ | 1,000.00 | $ | 1,015.53 | 1.92 | % | $ | 9.75 | ||||||||||
| Class M | Actual | $ | 1,000.00 | $ | 1,064.50 | 2.42 | % | $ | 12.59 | |||||||||
| Hypothetical | $ | 1,000.00 | $ | 1,013.01 | 2.42 | % | $ | 12.28 | ||||||||||
| Class X | Actual | $ | 1,000.00 | $ | 1,064.50 | 2.42 | % | $ | 12.59 | |||||||||
| Hypothetical | $ | 1,000.00 | $ | 1,013.01 | 2.42 | % | $ | 12.28 | ||||||||||
| Class Z | Actual | $ | 1,000.00 | $ | 1,066.90 | 1.42 | % | $ | 7.40 | |||||||||
| Hypothetical | $ | 1,000.00 | $ | 1,018.05 | 1.42 | % | $ | 7.22 | ||||||||||
* Fund expenses (net of fee waivers or subsidies, if any) for each share class are equal to the annualized expense ratio for each share class (provided in the table), multiplied
| Prudential International Equity Fund | 9 |
Fees and Expenses (continued)
by the average account value over the period, multiplied by the 184 days in the six- month period ended October 31, 2010, and divided by the 365 days in the Fund’s fiscal year ended October 31, 2010 (to reflect the six-month period). Expenses presented in the table include the expenses of any underlying portfolios in which the Fund may invest.
| 10 | Visit our website at www.prudentialfunds.com |
Portfolio of Investments
as of October 31, 2010
| Shares | Description | Value (Note 1) | ||||
LONG-TERM INVESTMENTS 99.3% |
| |||||
COMMON STOCKS 98.6% |
| |||||
Australia 7.1% |
| |||||
| 114,774 | Australia & New Zealand Banking Group Ltd. | $ | 2,789,302 | |||
| 28,665 | Bendigo and Adelaide Bank Ltd. | 254,112 | ||||
| 56,220 | BHP Billiton Ltd. | 2,308,540 | ||||
| 65,367 | Caltex Australia Ltd. | 744,029 | ||||
| 106,054 | Coca-Cola Amatil Ltd. | 1,264,279 | ||||
| 32,557 | Commonwealth Bank of Australia | 1,559,476 | ||||
| 482,173 | Fairfax Media Ltd.(b) | 684,851 | ||||
| 2,500 | Flight Centre Ltd. | 55,883 | ||||
| 399,307 | Fortescue Metals Group Ltd.(a) | 2,444,625 | ||||
| 116,780 | Goodman Fielder Ltd. | 169,871 | ||||
| 24,071 | GPT Group | 65,785 | ||||
| 306,741 | GPT Group(a) | — | ||||
| 100,681 | National Australia Bank Ltd. | 2,510,911 | ||||
| 96,523 | OneSteel Ltd. | 255,282 | ||||
| 1,250,658 | OZ Minerals Ltd. | 1,917,248 | ||||
| 25,011 | Rio Tinto Ltd. | 2,025,860 | ||||
| 437,095 | SP AusNet | 398,184 | ||||
| 585,712 | Stockland | 2,162,971 | ||||
| 157,991 | TABCORP Holdings Ltd. | 1,142,126 | ||||
| 9,020 | Wesfarmers Ltd. - PPS | 295,018 | ||||
| 56,720 | Westfield Group | 687,832 | ||||
| 61,565 | Westpac Banking Corp. | 1,368,942 | ||||
| 17,489 | Woolworths Ltd. | 485,672 | ||||
| 25,590,799 | ||||||
Austria 0.1% |
| |||||
| 2,956 | Erste Group Bank AG | 133,423 | ||||
| 97,528 | Immofinanz Immobilien Anlagen(a)(b) | 384,145 | ||||
| 517,568 | ||||||
Belgium 0.9% |
| |||||
| 10,915 | AGFA-Gevaert NV(a) | 63,653 | ||||
| 7,651 | Delhaize Group SA | 534,459 | ||||
| 45,111 | KBC Groep NV(a) | 1,962,372 | ||||
| 13,578 | Umicore | 639,129 | ||||
| 3,199,613 | ||||||
See Notes to Financial Statements.
| Prudential International Equity Fund | 11 |
Portfolio of Investments
as of October 31, 2010 continued
| Shares | Description | Value (Note 1) | ||||
COMMON STOCKS (Continued) |
| |||||
Brazil 1.1% |
| |||||
| 3,200 | Banco Do Brasil SA, ADR | $ | 62,400 | |||
| 6,000 | Centrais Eletricas Brasileiras SA (Class B Stock), ADR | 98,100 | ||||
| 25,000 | Centrais Eletricas Brasileiras SA, ADR | 349,250 | ||||
| 2,100 | Cia de Bebidas DAS Americas, ADR | 292,404 | ||||
| 5,000 | Cia de Saneamento Basico Do Estado de Sao Paulo, ADR | 229,800 | ||||
| 10,000 | Cia Energetica de Minas Gerais, ADR | 178,400 | ||||
| 17,900 | Petroleo Brasileiro SA, ADR | 610,748 | ||||
| 36,400 | Petroleo Brasileiro SA (Class A Stock), ADR | 1,135,316 | ||||
| 68,800 | Tele Norte Leste Participacoes SA, ADR | 1,055,392 | ||||
| 4,011,810 | ||||||
Chile 0.3% |
| |||||
| 11,000 | Banco Santander Chile, ADR | 1,019,040 | ||||
| 4,000 | Cia Cervecerias Unidas SA, ADR | 225,000 | ||||
| 1,244,040 | ||||||
China 2.0% |
| |||||
| 310,000 | Anta Sports Products Ltd. | 639,897 | ||||
| 325,000 | Bank of Communications Co. Ltd. (Class H Stock) | 355,136 | ||||
| 102,000 | China Communications Construction Co. Ltd. (Class H Stock) | 97,509 | ||||
| 137,500 | China Merchants Bank Co. Ltd. (Class H Stock) | 390,260 | ||||
| 126,000 | China Minsheng Banking Corp. Ltd. (Class H Stock) | 117,202 | ||||
| 254,000 | China Petroleum & Chemical Corp. (Class H Stock) | 239,541 | ||||
| 248,000 | CSR Corp. Ltd. (Class H Stock) | 252,439 | ||||
| 476,000 | China Zhongwang Holdings Ltd. | 283,712 | ||||
| 588,000 | Country Garden Holdings Co. | 207,853 | ||||
| 1,264,000 | Dongfeng Motor Group Co. Ltd. (Class H Stock) | 2,739,584 | ||||
| 12,000 | Enn Energy Holdings Ltd. | 36,071 | ||||
| 112,500 | KWG Property Holding Ltd. | 89,115 | ||||
| 184,000 | Longfor Properties Co. Ltd. | 219,103 | ||||
| 408,000 | PICC Property & Casualty Co. Ltd. (Class H Stock)(a) | 602,163 | ||||
| 20,800 | Tencent Holdings Ltd. | 476,310 | ||||
| 40,000 | Weichai Power Co. Ltd. (Class H Stock) | 525,335 | ||||
| 7,271,230 | ||||||
Denmark 1.4% |
| |||||
| 23,334 | Carlsberg A/S (Class B Stock) | 2,551,973 | ||||
| 3,044 | Coloplast A/S (Class B Stock)(b) | 376,942 | ||||
| 19,818 | Novo Nordisk A/S (Class B Stock) | 2,086,066 | ||||
| 5,014,981 | ||||||
See Notes to Financial Statements.
| 12 | Visit our website at www.prudentialfunds.com |
| Shares | Description | Value (Note 1) | ||||
COMMON STOCKS (Continued) | ||||||
Finland 1.8% |
| |||||
| 30,618 | Fortum Oyj | $ | 868,055 | |||
| 55,541 | Kone Oyj (Class B Stock) | 2,976,142 | ||||
| 26,376 | Pohjola Bank PLC | 333,881 | ||||
| 28,023 | Sampo Oyj (Class A Stock) | 785,123 | ||||
| 108,394 | Stora ENSO Oyj (Class R Stock) | 1,077,166 | ||||
| 5,221 | Wartsila Oyj | 366,238 | ||||
| 6,406,605 | ||||||
France 9.7% |
| |||||
| 22,878 | BNP Paribas | 1,673,285 | ||||
| 6,433 | Bouygues SA | 283,513 | ||||
| 15,011 | Bureau Veritas SA | 1,109,388 | ||||
| 22,647 | Cap Gemini SA | 1,155,376 | ||||
| 9,222 | Casino Guichard Perrachon SA | 866,379 | ||||
| 1,282 | Christian Dior SA | 185,478 | ||||
| 49,617 | Cie de Saint-Gobain | 2,317,564 | ||||
| 3,132 | Cie Generale des Etablissements Michelin (Class B Stock) | 249,125 | ||||
| 5,126 | Dassault Systemes SA | 393,177 | ||||
| 683 | Eurazeo | 51,903 | ||||
| 34,662 | France Telecom SA | 832,913 | ||||
| 4,964 | GDF Suez | 198,148 | ||||
| 2,069 | Gecina SA | 251,106 | ||||
| 5,175 | JCDecaux SA(a) | 151,579 | ||||
| 2,574 | LVMH Moet Hennessy Louis Vuitton SA | 403,391 | ||||
| 387,608 | Natixis(a) | 2,377,470 | ||||
| 1,838 | Neopost SA | 152,696 | ||||
| 7,849 | PPR SA | 1,286,882 | ||||
| 23,765 | Renault SA(a) | 1,320,572 | ||||
| 55,201 | Safran SA | 1,750,169 | ||||
| 65,875 | Sanofi-Aventis SA | 4,600,770 | ||||
| 19,455 | Schneider Electric SA | 2,761,917 | ||||
| 1,108 | Societe BIC SA | 98,310 | ||||
| 40,713 | Societe Generale | 2,437,998 | ||||
| 1,513 | Sodexo | 98,467 | ||||
| 10,957 | STMicroelectronics NV | 95,831 | ||||
| 98,622 | Total SA | 5,359,429 | ||||
| 9,217 | Vinci SA | 492,350 | ||||
| 78,010 | Vivendi SA | 2,225,243 | ||||
| 35,180,429 | ||||||
See Notes to Financial Statements.
| Prudential International Equity Fund | 13 |
Portfolio of Investments
as of October 31, 2010 continued
| Shares | Description | Value (Note 1) | ||||
COMMON STOCKS (Continued) | ||||||
Germany 7.9% |
| |||||
| 7,623 | Adidas AG | $ | 497,279 | |||
| 25,034 | Allianz SE | 3,137,220 | ||||
| 62,034 | BASF SE | 4,513,824 | ||||
| 7,584 | Bayerische Motoren Werke AG | 543,712 | ||||
| 31,138 | Daimler AG(a) | 2,055,527 | ||||
| 49,967 | Deutsche Bank AG | 2,880,532 | ||||
| 67,806 | Deutsche Post AG | 1,264,597 | ||||
| 95,501 | E.ON AG | 2,990,679 | ||||
| 41,049 | Hannover Rueckversicherung AG | 2,076,760 | ||||
| 4,031 | Henkel AG & Co. KGaA | 200,206 | ||||
| 120,740 | Infineon Technologies AG(a) | 950,473 | ||||
| 9,837 | Linde AG | 1,416,356 | ||||
| 29,246 | RWE AG | 2,096,298 | ||||
| 13,624 | SAP AG | 710,506 | ||||
| 25,332 | Siemens AG | 2,893,917 | ||||
| 3,427 | TUI AG(a) | 40,037 | ||||
| 1,076 | Volkswagen AG | 141,312 | ||||
| 28,409,235 | ||||||
Greece 0.4% |
| |||||
| 44,557 | OPAP SA | 840,300 | ||||
| 37,353 | Public Power Corp. SA | 626,458 | ||||
| 1,466,758 | ||||||
Hong Kong 2.5% |
| |||||
| 51,100 | ASM Pacific Technology Ltd. | 460,815 | ||||
| 55,000 | Belle International Holdings Ltd. | 99,339 | ||||
| 44,200 | Cheung Kong Holdings Ltd. | 672,872 | ||||
| 30,000 | China Resources Enterprise Ltd. | 126,754 | ||||
| 63,000 | China Yurun Food Group Ltd. | 245,051 | ||||
| 23,000 | Hang Lung Properties, Ltd. | 112,608 | ||||
| 81,100 | Hysan Development Co. Ltd. | 313,362 | ||||
| 291,900 | Link REIT (The) | 900,037 | ||||
| 182,300 | Orient Overseas International Ltd. | 1,598,102 | ||||
| 144,800 | Sands China Ltd.(a) | 315,706 | ||||
| 11,000 | Sun Hung Kai Properties Ltd. | 188,460 | ||||
| 88,600 | Swire Pacific Ltd. (Class A Stock) | 1,257,345 | ||||
| 228,700 | Wharf Holdings Ltd. | 1,501,800 | ||||
| 150,900 | Wheelock & Co. Ltd. | 528,551 | ||||
| 252,400 | Wynn Macau Ltd.(a) | 558,121 | ||||
See Notes to Financial Statements.
| 14 | Visit our website at www.prudentialfunds.com |
| Shares | Description | Value (Note 1) | ||||
COMMON STOCKS (Continued) | ||||||
Hong Kong (cont’d.) |
| |||||
| 39,500 | Yue Yuen Industrial Holdings Ltd. | $ | 141,667 | |||
| 9,020,590 | ||||||
India 0.5% |
| |||||
| 2,213 | Larsen & Toubro Ltd., GDR | 101,013 | ||||
| 4,000 | State Bank of India, GDR | 560,960 | ||||
| 43,000 | Tata Motors Ltd., ADR(b) | 1,209,160 | ||||
| 5,000 | Wipro Ltd., ADR | 71,400 | ||||
| 1,942,533 | ||||||
Israel 0.2% |
| |||||
| 25,996 | Bank Hapoalim BM(a) | 117,913 | ||||
| 7,370 | Teva Pharmaceutical Industries Ltd. | 383,755 | ||||
| 3,400 | Teva Pharmaceutical Industries Ltd., ADR | 176,460 | ||||
| 678,128 | ||||||
Italy 2.6% |
| |||||
| 532,092 | ENEL SpA | 3,038,188 | ||||
| 94,578 | ENI SpA | 2,131,161 | ||||
| 270,903 | Snam Rete Gas SpA | 1,467,647 | ||||
| 1,026,127 | Telecom Italia SpA | 1,573,845 | ||||
| 1,010,423 | Telecom Italia SpA-RSP | 1,237,557 | ||||
| 9,448,398 | ||||||
Japan 19.7% |
| |||||
| 19,100 | 77 Bank Ltd. (The) | 90,195 | ||||
| 52,700 | AEON Co. Ltd. | 620,848 | ||||
| 37,100 | Aisin Seiki Co. Ltd. | 1,165,052 | ||||
| 10,000 | Ajinomoto Co., Inc. | 95,439 | ||||
| 214,700 | Aozora Bank Ltd. | 360,190 | ||||
| 100,200 | Asahi Kasei Corp. | 588,972 | ||||
| 89 | Central Japan Railway Co. | 673,555 | ||||
| 145,000 | Chuo Mitsui Trust Holdings, Inc. | 524,357 | ||||
| 4,700 | Coca-Cola West Co. Ltd. | 71,899 | ||||
| 135,000 | Cosmo Oil Co. Ltd. | 364,049 | ||||
| 19,800 | Daicel Chemical Industries Ltd. | 137,790 | ||||
| 150,000 | Daido Steel Co. Ltd. | 764,260 | ||||
| 63,600 | Dena Co. Ltd. | 1,645,523 | ||||
| 57,200 | Denso Corp. | 1,780,614 | ||||
| 20,000 | Fanuc Ltd. | 2,895,489 | ||||
See Notes to Financial Statements.
| Prudential International Equity Fund | 15 |
Portfolio of Investments
as of October 31, 2010 continued
| Shares | Description | Value (Note 1) | ||||
COMMON STOCKS (Continued) | ||||||
Japan (cont’d.) |
| |||||
| 612,100 | Fuji Electric Holdings Co. Ltd. | $ | 1,460,460 | |||
| 128,000 | Fuji Heavy Industries Ltd. | 885,995 | ||||
| 37,500 | Fujifilm Holdings Corp. | 1,251,243 | ||||
| 280,100 | Fujitsu Ltd. | 1,914,440 | ||||
| 272,500 | Fukuoka Financial Group, Inc. | 1,059,929 | ||||
| 15,800 | Gunma Bank Ltd. (The) | 79,324 | ||||
| 550,100 | Hitachi Ltd. | 2,488,336 | ||||
| 28,000 | Hitachi Metals Ltd. | 319,075 | ||||
| 700 | Idemitsu Kosan Co. Ltd. | 58,892 | ||||
| 98 | Inpex Holdings, Inc. | 509,668 | ||||
| 548,700 | Isuzu Motors Ltd. | 2,113,794 | ||||
| 380,150 | JX Holdings, Inc. | 2,234,509 | ||||
| 18,500 | Kamigumi Co. Ltd. | 144,607 | ||||
| 476,000 | Kawasaki Kisen Kaisha Ltd. | 1,857,388 | ||||
| 727,000 | Kobe Steel Ltd. | 1,599,093 | ||||
| 127,500 | Kuraray Co. Ltd. | 1,826,861 | ||||
| 10,300 | Kyocera Corp. | 1,027,824 | ||||
| 178,722 | Marubeni Corp. | 1,123,814 | ||||
| 14,700 | Maruichi Steel Tube Ltd. | 291,004 | ||||
| 49,100 | Medipal Holdings Corp. | 573,555 | ||||
| 210,400 | Mitsubishi Chemical Holdings Corp. | 1,085,075 | ||||
| 57,400 | Mitsubishi Corp. | 1,380,254 | ||||
| 256,000 | Mitsubishi Electric Corp. | 2,401,889 | ||||
| 14,000 | Mitsubishi Gas Chemical Co., Inc. | 86,641 | ||||
| 47,300 | Mitsubishi UFJ Financial Group, Inc. | 220,424 | ||||
| 44,800 | Mitsui & Co. Ltd. | 704,262 | ||||
| 311,000 | Mitsui Chemicals, Inc. | 912,091 | ||||
| 491,000 | Mitsui Mining & Smelting Co. Ltd. | 1,494,905 | ||||
| 106,000 | Mitsui OSK Lines, Ltd. | 679,707 | ||||
| 518,900 | Mizuho Financial Group, Inc. | 754,459 | ||||
| 7,300 | Murata Manufacturing Co. Ltd. | 410,495 | ||||
| 96,900 | NHK Spring Co. Ltd. | 822,452 | ||||
| 36,100 | Nippon Steel Corp. | 113,499 | ||||
| 53,500 | Nippon Telegraph & Telephone Corp. | 2,430,005 | ||||
| 184,800 | Nishi-Nippon City Bank Ltd. (The) | 505,232 | ||||
| 351,000 | Nisshin Steel Co. Ltd. | 632,472 | ||||
| 5,300 | Nisshinbo Holdings, Inc. | 53,678 | ||||
| 7,100 | Nitori Holdings Ltd. | 624,680 | ||||
| 18,300 | Nitto Denko Corp. | 684,516 | ||||
| 27,700 | NSK Ltd. | 209,979 | ||||
| 3,280 | OBIC Co. Ltd. | 605,701 | ||||
See Notes to Financial Statements.
| 16 | Visit our website at www.prudentialfunds.com |
| Shares | Description | Value (Note 1) | ||||
COMMON STOCKS (Continued) | ||||||
Japan (cont’d.) |
| |||||
| 5,340 | ORIX Corp. | $ | 487,083 | |||
| 220,000 | Resona Holdings, Inc.(b) | 1,755,188 | ||||
| 3,100 | Rinnai Corp. | 188,766 | ||||
| 97,100 | Sapporo Hokuyo Holdings, Inc. | 400,611 | ||||
| 23,300 | Sega Sammy Holdings, Inc. | 380,467 | ||||
| 27,200 | Sekisui Chemical Co. Ltd. | 173,063 | ||||
| 27,400 | Sekisui House Ltd. | 257,758 | ||||
| 792,700 | Shinsei Bank Ltd.(a)(b) | 630,456 | ||||
| 8,200 | SMC Corp. | 1,253,386 | ||||
| 43,800 | Softbank Corp. | 1,409,743 | ||||
| 290,600 | Sojitz Corp. | 534,470 | ||||
| 157,200 | Sumitomo Corp. | 1,992,594 | ||||
| 70,100 | Sumitomo Electric Industries Ltd. | 894,653 | ||||
| 23,500 | Sumitomo Metal Mining Co. Ltd. | 373,220 | ||||
| 40,900 | Sumitomo Mitsui Financial Group, Inc. | 1,225,933 | ||||
| 23,700 | Sumitomo Trust & Banking Co. Ltd. (The) | 129,883 | ||||
| 16,000 | Suzuken Co. Ltd. | 503,243 | ||||
| 45,000 | Taiheiyo Cement Corp.(a) | 48,652 | ||||
| 9,000 | Tokyo Electron Ltd. | 508,326 | ||||
| 209,600 | Tokyo Gas Co. Ltd. | 987,180 | ||||
| 29,000 | Toyota Industries Corp. | 818,069 | ||||
| 35,434 | Toyota Motor Corp. | 1,258,926 | ||||
| 35,500 | Toyota Tsusho Corp. | 551,007 | ||||
| 21,600 | Unicharm Corp. | 825,401 | ||||
| 81 | West Japan Railway Co. | 300,768 | ||||
| 5,074 | Yahoo! Japan Corp. | 1,775,616 | ||||
| 1,430 | Yamada Denki Co. Ltd. | 92,940 | ||||
| 5,000 | Yamaha Motor Co. Ltd.(a) | 76,799 | ||||
| 71,244,660 | ||||||
Mexico 0.5% |
| |||||
| 16,400 | America Movil SAB de CV (Ser. L), ADR | 939,064 | ||||
| 69,400 | Cemex SAB de CV, ADR(a) | 608,638 | ||||
| 10,000 | Telefonos de Mexico SAB de CV (Ser. L), ADR | 154,800 | ||||
| 1,702,502 | ||||||
Netherlands 5.6% |
| |||||
| 3,525 | Akzo Nobel NV | 209,295 | ||||
| 33,658 | ASML Holding NV | 1,110,706 | ||||
| 7,209 | Heineken Holding NV | 310,438 | ||||
See Notes to Financial Statements.
| Prudential International Equity Fund | 17 |
Portfolio of Investments
as of October 31, 2010 continued
| Shares | Description | Value (Note 1) | ||||
COMMON STOCKS (Continued) | ||||||
Netherlands (cont’d.) |
| |||||
| 10,770 | Heineken NV | $ | 545,927 | |||
| 214,724 | ING Groep NV(a) | 2,292,214 | ||||
| 180,391 | Koninklijke Ahold NV | 2,493,121 | ||||
| 91,290 | Koninklijke KPN NV | 1,524,698 | ||||
| 24,631 | Koninklijke Philips Electronics NV | 744,940 | ||||
| 148,727 | Royal Dutch Shell PLC (Class A Stock) | 4,828,242 | ||||
| 127,205 | Royal Dutch Shell PLC (Class B Stock) | 4,073,503 | ||||
| 71,162 | Unilever NV | 2,110,129 | ||||
| 20,243,213 | ||||||
Norway 0.5% |
| |||||
| 98,809 | DnB NOR ASA | 1,356,460 | ||||
| 15,071 | Statoil ASA | 329,130 | ||||
| 1,685,590 | ||||||
Portugal 0.7% |
| |||||
| 585,109 | EDP - Energias de Portugal SA | 2,238,674 | ||||
| 22,116 | Jeronimo Martins SGPS SA | 331,821 | ||||
| 2,570,495 | ||||||
Russia 0.8% |
| |||||
| 17,500 | Gazprom OAO, ADR | 383,600 | ||||
| 5,000 | LUKOIL OAO, ADR | 279,250 | ||||
| 59,117 | MMC Norilsk Nickel, ADR | 1,102,532 | ||||
| 10,218 | Sistema JSFC, GDR | 263,624 | ||||
| 33,000 | Surgutneftegas OJSC, ADR | 319,770 | ||||
| 10,000 | Tatneft, ADR | 316,000 | ||||
| 7,500 | Uralkali, GDR | 185,625 | ||||
| 2,850,401 | ||||||
Singapore 1.8% |
| |||||
| 159,500 | Fraser and Neave Ltd. | 768,972 | ||||
| 1,569,000 | Genting Singapore PLC(a) | 2,630,557 | ||||
| 50,000 | Olam International Ltd. | 120,915 | ||||
| 99,500 | Oversea-Chinese Banking Corp. Ltd. | 692,648 | ||||
| 107,400 | SembCorp Industries Ltd. | 380,045 | ||||
| 105,400 | SembCorp Marine Ltd. | 374,596 | ||||
| 171,300 | UOL Group Ltd. | 602,190 | ||||
| 162,600 | Wilmar International Ltd. | 804,018 | ||||
| 6,373,941 | ||||||
See Notes to Financial Statements.
| 18 | Visit our website at www.prudentialfunds.com |
| Shares | Description | Value (Note 1) | ||||
COMMON STOCKS (Continued) | ||||||
South Africa 0.3% |
| |||||
| 17,500 | AngloGold Ashanti Ltd., ADR(b) | $ | 824,425 | |||
| 14,600 | Gold Fields Ltd., ADR | 230,242 | ||||
| 1,054,667 | ||||||
South Korea 0.9% |
| |||||
| 30,000 | LG Display Co. Ltd., ADR(b) | 516,300 | ||||
| 9,500 | POSCO, ADR | 987,430 | ||||
| 3,000 | Samsung Electronics Co. Ltd., GDR | 993,112 | ||||
| 8,700 | Shinhan Financial Group Co. Ltd., ADR(b) | 676,599 | ||||
| 3,173,441 | ||||||
Spain 3.6% |
| |||||
| 175,104 | Banco Bilbao Vizcaya Argentaria SA | 2,303,070 | ||||
| 80,170 | Banco Popular Espanol SA(b) | 518,518 | ||||
| 172,100 | Banco Santander Central Hispano SA | 2,211,103 | ||||
| 69,080 | Criteria CaixaCorp SA | 390,065 | ||||
| 5,604 | Enagas | 123,508 | ||||
| 48,982 | Gas Natural SDG SA | 717,185 | ||||
| 42,022 | Iberdrola SA | 354,428 | ||||
| 4,000 | Inditex SA | 334,090 | ||||
| 40,303 | Repsol YPF SA | 1,117,674 | ||||
| 185,865 | Telefonica SA | 5,018,554 | ||||
| 13,088,195 | ||||||
Sweden 2.1% |
| |||||
| 58,246 | Atlas Copco AB (Class A Stock) | 1,217,301 | ||||
| 53,321 | Hennes & Mauritz AB (H&M) (Class B Stock) | 1,879,105 | ||||
| 985 | Modern Times Group AB (Class B Stock) | 70,649 | ||||
| 95,734 | Nordea Bank AB | 1,054,132 | ||||
| 21,558 | Scania AB (Class B Stock) | 458,293 | ||||
| 21,937 | Securitas AB (Class B Stock) | 239,907 | ||||
| 290,700 | Skandinaviska Enskilda Banken (Class A Stock) | 2,252,173 | ||||
| 4,558 | SKF AB (Class B Stock) | 117,709 | ||||
| 11,291 | Tele2 AB (Class B Stock) | 248,483 | ||||
| 7,537,752 | ||||||
Switzerland 6.4% |
| |||||
| 7,539 | Credit Suisse Group AG | 311,428 | ||||
| 97,613 | Nestle SA | 5,346,619 | ||||
| 95,918 | Novartis AG | 5,560,817 | ||||
See Notes to Financial Statements.
| Prudential International Equity Fund | 19 |
Portfolio of Investments
as of October 31, 2010 continued
| Shares | Description | Value (Note 1) | ||||
COMMON STOCKS (Continued) | ||||||
Switzerland (cont’d.) |
| |||||
| 26,589 | Roche Holding AG | $ | 3,904,385 | |||
| 589 | Sika AG | 1,167,166 | ||||
| 20,457 | Swatch Group AG (The) | 1,421,939 | ||||
| 196,521 | UBS AG(a) | 3,327,107 | ||||
| 8,847 | Zurich Financial Services AG | 2,165,787 | ||||
| 23,205,248 | ||||||
Taiwan 0.7% |
| |||||
| 31,300 | AU Optronics Corp., ADR(a) | 313,939 | ||||
| 169,600 | Taiwan Semiconductor Manufacturing Co. Ltd., ADR(b) | 1,850,336 | ||||
| 93,400 | United Microelectronics Corp., ADR | 288,606 | ||||
| 2,452,881 | ||||||
Thailand 0.1% |
| |||||
| 143,500 | CP ALL PCL | 213,000 | ||||
United Kingdom 16.4% |
| |||||
| 392,647 | 3i Group PLC | 1,884,967 | ||||
| 29,110 | Anglo American PLC | 1,356,427 | ||||
| 88,081 | AstraZeneca PLC | 4,416,893 | ||||
| 243,454 | Aviva PLC | 1,552,991 | ||||
| 37,405 | Babcock International Group PLC | 347,630 | ||||
| 73,242 | BAE Systems PLC | 404,540 | ||||
| 71,002 | Barclays PLC | 312,414 | ||||
| 8,030 | BG Group PLC | 156,398 | ||||
| 15,005 | BHP Billiton PLC | 532,200 | ||||
| 578,246 | BP PLC | 3,945,282 | ||||
| 96,759 | British American Tobacco | 3,690,014 | ||||
| 312,214 | BT Group PLC | 768,929 | ||||
| 31,804 | Cape PLC | 188,302 | ||||
| 128,805 | Diageo PLC | 2,377,634 | ||||
| 253,542 | GlaxoSmithKline PLC | 4,960,498 | ||||
| 429,708 | HSBC Holdings PLC | 4,469,354 | ||||
| 70,307 | Imperial Tobacco Group PLC | 2,252,014 | ||||
| 74,145 | Investec PLC | 591,896 | ||||
| 376,850 | Kingfisher PLC | 1,435,953 | ||||
| 1,602,569 | �� | Legal & General Group PLC | 2,578,162 | |||
| 3,080,278 | Lloyds Banking Group PLC(a) | 3,402,679 | ||||
| 58,801 | Next PLC | 2,152,934 | ||||
| 505,818 | Old Mutual PLC | 1,052,842 | ||||
| 102,957 | Prudential PLC | 1,040,161 | ||||
See Notes to Financial Statements.
| 20 | Visit our website at www.prudentialfunds.com |
| Shares | Description | Value (Note 1) | ||||
COMMON STOCKS (Continued) | ||||||
United Kingdom (cont’d.) |
| |||||
| 43,292 | Reckitt Benckiser Group PLC | $ | 2,421,683 | |||
| 168,783 | Rexam PLC | 859,222 | ||||
| 34,818 | Rio Tinto PLC | 2,251,722 | ||||
| 6,474 | Standard Chartered PLC | 187,297 | ||||
| 23,477 | Tesco PLC | 160,575 | ||||
| 23,608 | Unilever PLC | 680,534 | ||||
| 2,587,910 | Vodafone Group PLC | 7,043,272 | ||||
| 59,475,419 | ||||||
Total common stocks | 356,274,122 | |||||
EXCHANGE TRADED FUND 0.5% |
| |||||
United States 0.5% |
| |||||
| 43,000 | iShares MSCI Emerging Markets Index Fund | 1,983,590 | ||||
PREFERRED STOCKS 0.2% |
| |||||
Germany 0.2% |
| |||||
| 4,512 | Henkel AG & Co. KGaA | 266,140 | ||||
| 4,107 | RWE AG | 278,205 | ||||
Total preferred stocks | 544,345 | |||||
RIGHT |
| |||||
Belgium |
| |||||
| 10,915 | AGFA-Gevaert NV(a) | 3,661 | ||||
Total long-term investments | 358,805,718 | |||||
| Principal Amount (000) | ||||||
SHORT-TERM INVESTMENTS 2.4% |
| |||||
United States Government Security 0.1% |
| |||||
| $500 | U.S. Treasury Bills 0.150%, 12/16/10(c)(d) | 499,916 | ||||
See Notes to Financial Statements.
| Prudential International Equity Fund | 21 |
Portfolio of Investments
as of October 31, 2010 continued
| Shares | Description | Value (Note 1) | ||||
SHORT-TERM INVESTMENTS (Continued) | ||||||
Affiliated Money Market Mutual Fund 2.3% |
| |||||
| 8,325,875 | Prudential Investment Portfolios 2 - Prudential Core Taxable | $ | 8,325,875 | |||
Total short-term investments | 8,825,791 | |||||
Total Investments 101.7% | 367,631,509 | |||||
Liabilities in excess of other assets(g) (1.7%) | (6,132,941 | ) | ||||
Net Assets 100.0% | $ | 361,498,568 | ||||
The following abbreviations are used in the portfolio descriptions:
ADR—American Depositary Receipt.
GDR—Global Depositary Receipt.
PPS—Partially Protected Shares.
REIT—Real Estate Investment Trust.
| (a) | Non-income producing security. |
| (b) | All or a portion of security is on loan. The aggregate market value of such securities, including those sold and pending settlement, is $7,897,330; cash collateral of $8,324,382 (included in liabilities) was received with which the Fund purchased highly liquid short-term investments. |
| (c) | Rate quoted represents yield-to-maturity as of purchase date. |
| (d) | Represents security, or a portion thereof, segregated as collateral for financial futures contracts. |
| (e) | Prudential Investments LLC, the manager of the Fund, also serves as manager of the Prudential Investment Portfolios 2-Prudential Core Taxable Money Market Fund. |
| (f) | Represents security, or a portion thereof, purchased with cash collateral received for securities on loan. |
| (g) | Liabilities in excess of other assets include net unrealized appreciation (depreciation) on financial futures contracts as follows: |
Open futures contracts outstanding at October 31, 2010:
| Number of Contracts | Type | Expiration Date | Value at October 31, 2010 | Value at Trade Date | Unrealized Appreciation (Depreciation) | |||||||||||||||
| Long Positions: | ||||||||||||||||||||
| 4 | SPI 200 Futures Index | Dec. 2010 | $ | 455,196 | $ | 451,749 | $ | 3,447 | ||||||||||||
| 7 | MSCI Taiwan Index | Nov. 2010 | 205,730 | 206,045 | (315 | ) | ||||||||||||||
| 15 | FTSE 100 Index | Dec. 2010 | 1,360,643 | 1,333,458 | 27,185 | |||||||||||||||
| 38 | DJ Euro Stoxx 50 Index | Dec. 2010 | 1,501,510 | 1,457,460 | 44,050 | |||||||||||||||
| $ | 74,367 | |||||||||||||||||||
See Notes to Financial Statements.
| 22 | Visit our website at www.prudentialfunds.com |
Various inputs are used in determining the value of the Fund’s investments. These inputs are summarized in the three broad levels listed below.
Level 1—quoted prices in active markets for identical securities, generally for stocks and mutual funds with daily NAVs
Level 2—other significant observable inputs (including quoted prices for similar securities, interest rates, prepayment speeds, credit risk, etc. and amortized cost), generally for foreign stocks priced through vendor modeling tools and debt securities
Level 3—significant unobservable inputs (including the Fund’s own assumptions in determining the fair value of investments)
The following is a summary of the inputs used as of October 31, 2010 in valuing the Fund’s assets carried at fair value:
| Level 1 | Level 2 | Level 3 | ||||||||||
Investments in Securities | ||||||||||||
Common Stocks | ||||||||||||
Australia | $ | 25,590,799 | $ | — | $ | — | ||||||
Austria | 517,568 | — | — | |||||||||
Belgium | 3,199,613 | — | — | |||||||||
Brazil | 4,011,810 | — | — | |||||||||
Chile | 1,244,040 | — | — | |||||||||
China | 7,271,230 | — | — | |||||||||
Denmark | 5,014,981 | — | — | |||||||||
Finland | 6,406,605 | — | — | |||||||||
France | 35,180,429 | — | — | |||||||||
Germany | 28,409,235 | — | — | |||||||||
Greece | 1,466,758 | — | — | |||||||||
Hong Kong | 9,020,590 | — | — | |||||||||
India | 1,942,533 | — | — | |||||||||
Israel | 678,128 | — | — | |||||||||
Italy | 9,448,398 | — | — | |||||||||
Japan | 71,244,660 | — | — | |||||||||
Mexico | 1,702,502 | — | — | |||||||||
Netherlands | 20,243,213 | — | — | |||||||||
Norway | 1,685,590 | — | — | |||||||||
Portugal | 2,570,495 | — | — | |||||||||
Russia | 2,850,401 | — | — | |||||||||
Singapore | 6,373,941 | — | — | |||||||||
South Africa | 1,054,667 | — | — | |||||||||
South Korea | 3,173,441 | — | — | |||||||||
Spain | 13,088,195 | — | — | |||||||||
Sweden | 7,537,752 | — | — | |||||||||
See Notes to Financial Statements.
| Prudential International Equity Fund | 23 |
Portfolio of Investments
as of October 31, 2010 continued
| Level 1 | Level 2 | Level 3 | ||||||||||
Common Stocks (continued): | ||||||||||||
Switzerland | $ | 23,205,248 | $ | — | $ | — | ||||||
Taiwan | 2,452,881 | — | — | |||||||||
Thailand | 213,000 | — | — | |||||||||
United Kingdom | 59,475,419 | — | — | |||||||||
Exchange Traded Fund | ||||||||||||
United States | 1,983,590 | — | — | |||||||||
Preferred Stocks | ||||||||||||
Germany | 544,345 | — | — | |||||||||
Right | ||||||||||||
Belgium | 3,661 | |||||||||||
Affiliated Money Market Mutual Fund | 8,325,875 | — | — | |||||||||
United States Government Security | — | 499,916 | — | |||||||||
Other Financial Instruments* | ||||||||||||
Futures Contracts | 74,367 | — | — | |||||||||
Total | $ | 367,205,960 | $ | 499,916 | $ | — | ||||||
| * | Other financial instruments are derivative instruments not reflected in the Portfolio of Investments, such as futures, forwards and swap contracts, which are valued at the unrealized appreciation/depreciation on the instrument. |
Fair value of Level 2 investments at October 31, 2009 was $566,483,973. $372,089,631 was transferred out of Level 2 into Level 1 at October 31, 2010 as a result of using third-party vendor modeling tools due to the lack of any significant market movements between the time at which the Series valued its securities and the earlier closing of foreign markets.
It is the Series’ policy to recognize transfers in and transfers out at the fair value as of the beginning of period.
The industry classification of portfolio holdings and liabilities in excess of other assets shown as a percentage of net assets as of October 31, 2010 were as follows:
Commercial Banks | 13.0 | % | ||
Oil, Gas & Consumable Fuels | 8.1 | |||
Pharmaceuticals | 7.2 | |||
Metals & Mining | 6.1 | |||
Insurance | 4.2 | |||
Diversified Telecommunication Services | 4.1 | |||
Chemicals | 3.7 | |||
Machinery | 3.3 | |||
Automobiles | 3.1 | |||
Electric Utilities | 3.1 | |||
Wireless Telecommunication Services | 2.7 | |||
Food Products | 2.6 | |||
Capital Markets | 2.5 | |||
Affiliated Money Market Mutual Fund (including 2.3% of collateral received for securities on loan) | 2.3 | |||
Beverages | 2.1 |
See Notes to Financial Statements.
| 24 | Visit our website at www.prudentialfunds.com |
Electrical Equipment | 2.1 | % | ||
Electronic Equipment & Instruments | 1.7 | |||
Food & Staples Retailing | 1.7 | |||
Real Estate Management & Development | 1.7 | |||
Semiconductors & Semiconductor Equipment | 1.7 | |||
Trading Companies & Distributors | 1.7 | |||
Hotels, Restaurants & Leisure | 1.6 | |||
Tobacco | 1.6 | |||
Auto Components | 1.3 | |||
Industrial Conglomerates | 1.3 | |||
Household Products | 1.2 | |||
Specialty Retail | 1.2 | |||
Marine | 1.1 | |||
Multiline Retail | 1.1 | |||
Real Estate Investment Trusts (REITs) | 1.1 | |||
Gas Utilities | 0.9 | |||
Media | 0.9 | |||
Textiles, Apparel & Luxury Goods | 0.9 | |||
Diversified Financial Services | 0.8 | |||
Multi-Utilities | 0.7 | |||
Aerospace | 0.6 | |||
Building Products | 0.6 | |||
Exchange Traded Fund | 0.6 | |||
Internet Software & Services | 0.6 | |||
Computers & Peripherals | 0.5 | |||
Internet & Catalog Retail | 0.5 | |||
IT Services | 0.5 | |||
Air Freight & Logistics | 0.4 | |||
Healthcare Providers & Services | 0.3 | |||
Paper & Forest Products | 0.3 | |||
Professional Services | 0.3 | |||
Road & Rail | 0.3 | |||
Software | 0.3 | |||
Commercial Services & Supplies | 0.2 | |||
Construction & Engineering | 0.2 | |||
Construction Materials | 0.2 | |||
Containers & Packaging | 0.2 | |||
Real Estate Investment Trusts | 0.2 | |||
Consumer Finance | 0.1 | |||
Healthcare Equipment & Supplies | 0.1 | |||
Leisure Equipment & Products | 0.1 | |||
United States Government Security | 0.1 | |||
Water Utilities | 0.1 | |||
| 101.7 | ||||
Liabilities in excess of other assets | (1.7 | ) | ||
| 100.0 | % | |||
See Notes to Financial Statements.
| Prudential International Equity Fund | 25 |
Portfolio of Investments
as of October 31, 2010 continued
The Fund invested in derivative instruments during the reporting period. The primary types of risk associated with these derivative instruments are equity risk. The effect of such derivative instruments on the Fund’s financial position and financial performance as reflected in the Statement of Assets and Liabilities and Statement of Operations is presented in the summary below.
Fair values of derivative instruments as of October 31, 2010 as presented in the Statement of Assets and Liabilities:
Derivatives not designated | Asset Derivatives | Liability Derivatives | ||||||||||
Balance | Fair Value | Balance | Fair Value | |||||||||
| Equity contracts | Due from broker— variation margin | $ | 74,682 | * | Due from broker— variation margin | $ | 315 | * | ||||
| Equity contracts | Unaffiliated Investments | 3,661 | — | — | ||||||||
Total | $ | 78,343 | $ | 315 | ||||||||
| * | Includes cumulative appreciation/depreciation on futures contracts as reported in the Portfolio of Investments. Only unsettled variation margin receivable (payable) is reported within the Statement of Assets and Liabilities. |
The effects of derivative instruments on the Statement of Operations for the year ended October 31, 2010 are as follows:
Amount of Realized Gain or (Loss) on Derivatives Recognized in Income | ||||||||||||||||
Derivatives not designated as hedging | Futures | Warrants | Rights | Total | ||||||||||||
Equity contracts | $ | (35,335 | ) | $ | 3,873 | $ | 728,841 | $ | 697,379 | |||||||
Change in Unrealized Appreciation or (Depreciation) on Derivatives Recognized in Income | ||||||||||||
Derivatives not designated as hedging | Futures | Rights | Total | |||||||||
Equity contracts | $ | 311,048 | $ | (102,870 | ) | $ | 208,178 | |||||
For the year ended October 31, 2010, the average value at trade date for futures contracts was $8,028,818.
See Notes to Financial Statements.
| 26 | Visit our website at www.prudentialfunds.com |
Financial Statements
| OCTOBER 31, 2010 | ANNUAL REPORT |
Prudential International Equity Fund
Statement of Assets and Liabilities
as of October 31, 2010
Assets | ||||
Investments at value, including securities on loan of $7,897,330 | ||||
Unaffiliated investments (cost $304,996,351) | $ | 359,305,634 | ||
Affiliated investments (cost $8,325,875) | 8,325,875 | |||
Foreign currency, at value (cost $780,664) | 784,459 | |||
Foreign tax reclaim receivable | 1,357,905 | |||
Dividends receivable | 675,577 | |||
Receivable for investments sold | 601,636 | |||
Receivable for Series shares sold | 182,978 | |||
Due from broker—variation margin | 15,402 | |||
Prepaid expenses | 6,317 | |||
Total assets | 371,255,783 | |||
Liabilities | ||||
Payable to broker for collateral for securities on loan (Note 3) | 8,324,382 | |||
Payable for Series shares reacquired | 542,451 | |||
Accrued expenses | 392,699 | |||
Management fee payable | 255,160 | |||
Distribution fee payable | 108,531 | |||
Loan payable | 69,000 | |||
Affiliated transfer agent fee payable | 56,886 | |||
Deferred directors’ fees | 8,106 | |||
Total liabilities | 9,757,215 | |||
Net assets | $ | 361,498,568 | ||
Net assets were comprised of: | ||||
Common stock, at par | $ | 588,048 | ||
Paid-in capital in excess of par | 569,108,829 | |||
| 569,696,877 | ||||
Undistributed net investment income | 5,112,695 | |||
Accumulated net realized loss on investment and foreign currency transactions | (267,842,917 | ) | ||
Net unrealized appreciation on investments and foreign currencies | 54,531,913 | |||
Net assets, October 31, 2010 | $ | 361,498,568 | ||
See Notes to Financial Statements.
| 28 | Visit our website at www.prudentialfunds.com |
Class A | ||||
Net asset value and redemption price per share | $ | 6.17 | ||
Maximum sales charge (5.50% of offering price) | 0.36 | |||
Maximum offering price to public | $ | 6.53 | ||
Class B | ||||
Net asset value, offering price and redemption price per share | $ | 5.94 | ||
Class C | ||||
Net asset value, offering price and redemption price per share | $ | 5.94 | ||
Class F | ||||
Net asset value, offering price and redemption price per share | $ | 5.94 | ||
Class L | ||||
Net asset value, offering price and redemption price per share | $ | 6.17 | ||
Maximum sales charge (5.75% of offering price) | 0.38 | |||
Maximum offering price to public | $ | 6.55 | ||
Class M | ||||
Net asset value, offering price and redemption price per share | $ | 5.94 | ||
Class X | ||||
Net asset value, offering price and redemption price per share | $ | 5.94 | ||
Class Z | ||||
Net asset value, offering price and redemption price per share | $ | 6.22 | ||
See Notes to Financial Statements.
| Prudential International Equity Fund | 29 |
Statement of Operations
Year Ended October 31, 2010
Net Investment Income | ||||
Income | ||||
Unaffiliated dividend (net of foreign withholding taxes of $1,159,379) | $ | 14,324,669 | ||
Affiliated income from securities loaned, net | 13,433 | |||
Interest | 7,864 | |||
Affiliated dividend income | 2,432 | |||
Total income | 14,348,398 | |||
Expenses | ||||
Management fee | 3,803,410 | |||
Distribution fee—Class A | 772,581 | |||
Distribution fee—Class B | 92,448 | |||
Distribution fee—Class C | 269,724 | |||
Distribution fee—Class F | 30,474 | |||
Distribution fee—Class L | 56,075 | |||
Distribution fee—Class M | 44,409 | |||
Distribution fee—Class X | 40,194 | |||
Transfer agent’s fees and expenses (including affiliated expense of $548,400) (Note 3) | 1,315,000 | |||
Custodian’s fees and expenses | 330,000 | |||
Reports to shareholders | 213,000 | |||
Registration fees | 75,000 | |||
Legal fees and expenses | 56,000 | |||
Audit fee | 29,000 | |||
Directors’ fees | 25,000 | |||
Insurance | 12,000 | |||
Loan interest expense (Note 8) | 1,799 | |||
Miscellaneous | 65,916 | |||
Total expenses | 7,232,030 | |||
Net investment income | 7,116,368 | |||
Realized And Unrealized Gain (Loss) On Investments, Futures And Foreign Currency Transactions |
| |||
Net realized loss on: | ||||
Investment transactions | (24,893,807 | ) | ||
Foreign currency transactions | (431,185 | ) | ||
Financial futures transactions | (35,335 | ) | ||
| (25,360,327 | ) | |||
Net change in unrealized appreciation (depreciation) on: | ||||
Investments | 30,887,292 | |||
Foreign currencies | (21,125 | ) | ||
Financial futures contracts | 311,048 | |||
| 31,177,215 | ||||
Net gain on investments and foreign currencies | 5,816,888 | |||
Net Increase In Net Assets Resulting From Operations | $ | 12,933,256 | ||
See Notes to Financial Statements.
| 30 | Visit our website at www.prudentialfunds.com |
Statement of Changes in Net Assets
| Year Ended October 31, | ||||||||
| 2010 | 2009 | |||||||
Increase (Decrease) In Net Assets | ||||||||
Operations | ||||||||
Net investment income | $ | 7,116,368 | $ | 8,785,844 | ||||
Net realized loss on investment and foreign currency transactions | (25,360,327 | ) | (203,760,871 | ) | ||||
Net change in unrealized appreciation (depreciation) on investments and foreign currencies | 31,177,215 | 308,709,663 | ||||||
Net increase in net assets resulting from operations | 12,933,256 | 113,734,636 | ||||||
Dividends and distributions (Note 1) | ||||||||
Dividends from net investment income | ||||||||
Class A | (4,729,701 | ) | (8,495,865 | ) | ||||
Class B | (120,437 | ) | (243,083 | ) | ||||
Class C | (351,530 | ) | (707,927 | ) | ||||
Class F | (73,250 | ) | (192,959 | ) | ||||
Class L | (189,123 | ) | (383,035 | ) | ||||
Class M | (75,237 | ) | (258,869 | ) | ||||
Class X | (67,157 | ) | (200,563 | ) | ||||
Class Z | (4,587,489 | ) | (6,584,652 | ) | ||||
| (10,193,924 | ) | (17,066,953 | ) | |||||
Series share transactions (Net of share conversions) (Note 6) | �� | |||||||
Net proceeds from shares sold | 46,181,096 | 73,397,047 | ||||||
Net asset value of shares issued in reinvestment of dividends | 9,997,085 | 16,444,537 | ||||||
Cost of shares reacquired | (277,348,125 | ) | (108,323,489 | ) | ||||
Net decrease in net assets from Series share transactions | (221,169,944 | ) | (18,481,905 | ) | ||||
Capital Contributions (Note 6) | ||||||||
Proceeds from regulatory settlement | 4,717,145 | — | ||||||
Total increase (decrease) | (213,713,467 | ) | 78,185,778 | |||||
Net Assets: | ||||||||
Beginning of year | 575,212,035 | 497,026,257 | ||||||
End of year (a) | $ | 361,498,568 | $ | 575,212,035 | ||||
(a) Includes undistributed net investment income of: | $ | 5,112,695 | $ | 8,308,500 | ||||
See Notes to Financial Statements.
| Prudential International Equity Fund | 31 |
Notes to Financial Statements
Prudential World Fund, Inc. (the “Fund”) is registered under the Investment Company Act of 1940, as amended, as an open-end, diversified management investment company and currently consists of two series: Prudential International Equity Fund (the “Series”) and Prudential International Value Fund. These financial statements relate to the Prudential International Equity Fund. The financial statements of the other series are not presented herein. The Series commenced investment operations in March 2000. The investment objective of the Series is to achieve long-term growth of capital. The Series seeks to achieve its objective primarily through investment in equity-related securities of foreign issuers.
Note 1. Accounting Policies
The following is a summary of significant accounting policies followed by the Fund and the Series in the preparation of its financial statements.
Securities Valuation: Securities listed on a securities exchange (other than options on securities and indices) are valued at the last sale price on such exchange on the day of valuation or, if there was no sale on such day, at the mean between the last reported bid and asked prices, or at the last bid price on such day in the absence of an asked price. Securities traded via NASDAQ are valued at the NASDAQ official closing price (“NOCP”) on the day of valuation, or if there was no NOCP, at the last sale price. Securities that are actively traded in the over-the-counter market, including listed securities for which the primary market is believed by Prudential Investments LLC (“PI” or “Manager”), in consultation with the subadvisers, to be over-the-counter, are valued at market value using prices provided by an independent pricing agent or principal market maker. Options on securities and indices traded on an exchange are valued at the last sale price as of the close of trading on the applicable exchange or, if there was no sale, at the mean between the most recently quoted bid and asked prices on such exchange. Futures contracts and options thereon traded on a commodities exchange or board of trade are valued at the last sale price at the close of trading on such exchange or board of trade or, if there was no sale on the applicable commodities exchange or board of trade on such day, at the mean between the most recently quoted bid and asked prices on such exchange or board of trade or at the last bid price in the absence of an asked price. Prices may be obtained from independent pricing services which use information provided by market makers or estimates of market values obtained from yield data relating to investments or securities with similar characteristics. Securities for which reliable market quotations
| 32 | Visit our website at www.prudentialfunds.com |
are not readily available, or whose values have been affected by events occurring after the close of the security’s foreign market and before the Fund’s normal pricing time, are valued at fair value in accordance with the Board of Directors’ approved fair valuation procedures. When determining the fair valuation of securities some of the factors influencing the valuation include, the nature of any restrictions on disposition of the securities; assessment of the general liquidity of the securities; the issuer’s financial condition and the markets in which it does business; the cost of the investment; the size of the holding and the capitalization of issuer; the prices of any recent transactions or bids/offers for such securities or any comparable securities; any available analyst media or other reports or information deemed reliable by the investment adviser regarding the issuer or the markets or industry in which it operates. Using fair value to price securities may result in a value that is different from a security’s most recent closing price and from the price used by other mutual funds to calculate their net asset values.
Investments in open end, non exchange-traded mutual funds are valued at their net asset value as of the close of the New York Stock Exchange on the date of valuation.
Short-term debt securities of sufficient credit quality, which mature in 60 days or less, are valued at amortized cost, which approximates market value. The amortized cost method includes valuing a security at its cost on the date of purchase and thereafter assuming a constant amortization to maturity of the difference between the principal amount due at maturity and cost. Short-term debt securities, which mature in more than 60 days, are valued at fair value.
Securities Lending: The Series may lend its portfolio securities to broker-dealers. The loans are secured by collateral, at least equal, at all times to the market value of the securities loaned. Loans are subject to termination at the option of the borrower or the Series. Upon termination of the loan, the borrower will return to the lender securities identical to the loaned securities. Should the borrower of the securities fail financially, the Series has the right to repurchase the securities using the collateral in the open market. The Series recognizes income, net of any rebate and securities lending agent fees, for lending its securities in the form of fees or interest on the investment of any cash received as collateral. The Series also continues to receive interest and dividends or amounts equivalent thereto, on the securities loaned and recognizes any unrealized gain or loss in the market price of the securities loaned that may occur during the term of the loan.
| Prudential International Equity Fund | 33 |
Notes to Financial Statements
continued
Foreign Currency Translation: The books and records of the Series are maintained in U.S. dollars. Foreign currency amounts are translated into U.S. dollars on the following basis:
(i) market value of investment securities, other assets and liabilities-at the current rates of exchange.
(ii) purchases and sales of investment securities, income and expenses-at the rate of exchange prevailing on the respective dates of such transactions.
The Series does not isolate that portion of the results of operations arising as a result of changes in the foreign exchange rates from the fluctuations arising from changes in the market prices of long term securities held at the end of the fiscal year. Similarly, the Series does not isolate the effect of changes in foreign exchange rates from the fluctuations arising from changes in the market prices of portfolio securities sold during the fiscal year. Accordingly, realized foreign currency gains or losses are included in the reported net realized gains or losses on investment transactions.
Net realized gains or losses on foreign currency transactions represent net foreign exchange gains or losses from holdings of foreign currencies, currency gains or losses realized between the trade and settlement dates on security transactions, and the difference between the amounts of dividends, interest and foreign withholding taxes recorded on the Series’ books and the U.S. dollar equivalent amounts actually received or paid. Net unrealized currency gains or losses from valuing foreign currency denominated assets and liabilities (other than investments) at fiscal year end exchange rates are reflected as a component of net unrealized appreciation (depreciation) on foreign currencies.
Foreign security and currency transactions may involve certain considerations and risks not typically associated with those of domestic origin as a result of, among other factors, the possibility of political or economic instability, or the level of governmental supervision and regulation of foreign securities markets.
Securities Transactions and Net Investment Income: Securities transactions are recorded on the trade date. Realized gains or losses from security and currency transactions are calculated on the identified cost basis. Dividend income is recorded on the ex-dividend date and interest income is recorded on an accrual basis. Expenses are recorded on the accrual basis.
| 34 | Visit our website at www.prudentialfunds.com |
Net investment income or loss (other than distribution fees which are charged directly to the respective class) and unrealized and realized gains or losses are allocated daily to each class of shares based upon the relative proportion of net assets of each class at the beginning of the day.
Financial Futures Contracts: A financial futures contract is an agreement to purchase (long) or sell (short) an agreed amount of securities at a set price for delivery on a future date. Upon entering into a financial futures contract, the Series is required to pledge to the broker an amount of cash and/or other assets equal to a certain percentage of the contract amount. This amount is known as the “initial margin.” Subsequent payments, known as “variation margin,” are made or received by the Series each day, depending on the daily fluctuations in the value of the underlying security. Such variation margin is recorded for financial statement purposes on a daily basis as unrealized gain or loss. When the contract expires or is closed, the gain or loss is realized and is presented in the Statement of Operations as net realized gain or loss on financial futures transactions. The Series invest in financial futures contracts in order to hedge its existing portfolio securities, or securities the Series intends to purchase, against fluctuations in value caused by changes in prevailing interest rates, value of equities or foreign currency exchange rates. Should interest rates move unexpectedly, the Series may not achieve the anticipated benefits of the financial futures contracts and may realize a loss. The use of futures transactions involves the risk of imperfect correlation in movements in the price of futures contracts, interest rates and the underlying hedged assets.
Financial futures contracts involve elements of both market and credit risk in excess of the amounts reflected on the Statement of Assets and Liabilities.
Dividends and Distributions: The Series expects to pay dividends of net investment income and distributions of net realized capital and currency gains, if any, annually. Dividends and distributions to shareholders, which are determined in accordance with federal income tax regulations which may differ from generally accepted accounting principles, are recorded on the ex-dividend date.
Taxes: For federal income tax purposes, each Series in the Fund is treated as a separate taxpaying entity. It is each Series’ policy to continue to meet the requirements of the Internal Revenue Code applicable to regulated investment companies and to distribute all of its taxable net investment income and capital gains, if any, to its shareholders. Therefore, no federal income tax provision is required.
Withholding taxes on foreign dividends are recorded net of reclaimable amounts, at the time the related income is earned.
| Prudential International Equity Fund | 35 |
Notes to Financial Statements
continued
Estimates: The preparation of the financial statements requires management to make estimates and assumptions that affect the reported amounts and disclosures in the financial statements. Actual results could differ from those estimates.
Note 2. Agreements
The Fund has a management agreement for the Series with PI. Pursuant to this agreement, PI has responsibility for all investment advisory services and supervises the subadviser’s performance of such services. PI entered into a subadvisory agreement with Quantitative Management Associates LLC (QMA). The subadvisory agreement provides that QMA furnishes investment advisory services in connection with the management of the Series. In connection therewith, QMA is obligated to keep certain books and records of the Series. PI pays for the services of QMA, the cost of compensation of officers of the Series, occupancy and certain clerical and bookkeeping costs of the Series. The Series bears all other costs and expenses.
The management fee paid to PI is computed daily and payable monthly, at an annual rate of .85% of the average daily net assets of the Series up to and including $300 million, .75% of the average daily net assets in excess of $300 million up to and including $1.5 billion and .70% of the Series’ average daily net assets over $1.5 billion. The effective management fee was .81% for the year ended October 31, 2010.
The Series has a distribution agreement with Prudential Investment Management Services LLC (“PIMS”) which acts as the distributor of Class A, Class B, Class C, Class F, Class L, Class M, Class X, and Class Z shares of the Series. The Series compensates PIMS for distributing and servicing the Series’ Class A, Class B, Class C, Class F, Class L, Class M and Class X shares, pursuant to a plan of distribution, (the “Class A, B, C, F, L, M and X Plans”), regardless of expenses actually incurred by PIMS. The distribution fees are accrued daily and payable monthly. No distribution or service fees are paid to PIMS as distributor for Class Z shares of the Series.
Pursuant to the Class A, B, C, F, L, M and X Plans, the Series compensates PIMS for distribution related activities at an annual rate of up to .30%, 1%, 1%, ..75%, .50%, 1%, and 1% of the average daily net assets of the Class A, B, C, F, L, M, and X shares, respectively.
PIMS has advised the Series that they received $79,765 in front-end sales charges resulting from sales of Class A shares during the year ended October 31, 2010. From
| 36 | Visit our website at www.prudentialfunds.com |
these fees, PIMS paid such sales charges to broker-dealers, which in turn paid commissions to salespersons and incurred other distribution costs.
PIMS has advised the Series that for the year ended October 31, 2010 it received $397, $21,132, $2,477, $3,218 , $3,155 and $2,153 in contingent deferred sales charges imposed upon redemptions by certain Class A, Class B, Class C, Class F, Class M, and Class X shareholders, respectively.
PI, QMA and PIMS are indirect, wholly-owned subsidiaries of Prudential Financial, Inc. (“Prudential”).
Note 3. Other Transactions with Affiliates
Prudential Mutual Fund Services LLC (“PMFS”), an affiliate of PI and an indirect, wholly-owned subsidiary of Prudential, serves as the Series’ transfer agent. Transfer agent’s fees and expenses in the Statement of Operations include certain out-of-pocket expenses paid to non-affiliates, where applicable.
The Series pays networking fees to affiliated and unaffiliated broker/dealers, including fees relating to the services of Wells Fargo Advisors, LLC (“Wells Fargo”), an affiliate of Pl through December 31, 2009. These networking fees are payments made to broker/dealers that clear mutual fund transactions through a national clearing system. For the year ended October 31, 2010, the Series incurred approximately $225,800 in total networking fees, of which approximately $19,800 was paid to Wells Fargo through December 31, 2009. These amounts are included in transfer agents’s fees and expenses on the Statement of Operations.
Prudential Investment Management, Inc. (“PIM”), an indirect, wholly-owned subsidiary of Prudential, is the Series’ security lending agent. For the year ended October 31, 2010, PIM has been compensated approximately $4,200 for these services.
The Series invests in the Prudential Core Taxable Money Market Fund (the “Core Fund”), a portfolio of the Prudential Investment Portfolios 2 registered under the Investment Company Act of 1940, as amended, and managed by PI. Earnings from the Core Fund are disclosed on the Statement of Operations as affiliated dividend income.
Note 4. Portfolio Securities
Purchases and sales of investment securities, other than short-term investments, for the year ended October 31, 2010 aggregated $436,141,769 and $479,790,567, respectively.
| Prudential International Equity Fund | 37 |
Notes to Financial Statements
continued
Note 5. Distributions and Tax Information
Distributions to shareholders, which are determined in accordance with federal income tax regulations and which may differ from generally accepted accounting principles, are recorded on the ex-dividend date. In order to present undistributed net investment income, accumulated net realized loss on investment and foreign currency transactions and paid-in capital in excess of par on the Statement of Assets and Liabilities that more closely represent their tax character, certain adjustments have been made to undistributed net investment income, accumulated net realized loss on investment and foreign currency transactions and paid-in capital in excess of par. For the fiscal year ended October 31, 2010, the adjustments were to decrease undistributed net investment income by $118,249, to decrease accumulated net realized loss on investments and foreign currency transactions by $102,546,464 and to decrease paid-in capital in excess of par by $102,428,215, due to the differences in the treatment for book and tax purposes of certain transactions involving foreign securities and currencies, investments in Passive Foreign Investment Companies, expiration of capital loss carryforward, redemption-in-kind and other book to tax adjustments. Net investment income, net realized loss and net assets were not affected by this change.
As of October 31, 2010, the Series had undistributed ordinary income of $6,025,645 on a tax basis.
For the fiscal year ended October 31, 2010 and the fiscal year ended October 31, 2009 the tax character of dividends paid as reflected in the Statement of Changes in Net Assets were $10,193,924 and $17,066,953 of ordinary income, respectively.
The United States federal income tax basis of the Series’ investments and the net unrealized appreciation as of October 31, 2010 were as follows:
Tax Basis | Appreciation | Depreciation | Net | Other Cost | Total Net | |||||
| $323,124,661 | $52,927,787 | $(8,420,939) | $44,506,848 | $222,630 | $44,729,478 |
The difference between book basis and tax basis were primarily attributable to deferred losses on wash sales and investments in Passive Foreign Investment
| 38 | Visit our website at www.prudentialfunds.com |
Companies. The other cost basis adjustments are primarily attributable to appreciation (depreciation) of foreign currency and mark-to-market of receivables and payables.
For federal income tax purposes, the Series has a capital loss carryforward as of October 31, 2010 of approximately $258,945,000 of which $11,426,000 expires in 2011, $55,105,000 expires in 2016, $184,077,000 expires in 2017 and $8,337,000 expires in 2018. Accordingly, no capital gains distribution is expected to be paid to shareholders until net gains have been realized in excess of such carryforward. It is uncertain whether the Fund will be able to realize the full benefit prior to expiration dates. During the fiscal year ended October 31, 2010, approximately $72,865,000 of the capital loss carryforward expired unused.
Management has analyzed the Series’ tax positions taken on federal income tax returns for all open tax years and has concluded that as of October 31, 2010, no provision for income tax would be required in the Series’ financial statements. The Series’ federal and state income tax excise returns for tax years for which the applicable statutes of limitations have not expired are subject to examination by the internal Revenue Service and state departments of revenue.
Note 6. Capital
The Series offers Class A, B, C, F, L, M, X and Z shares. Class A and L shares are sold with a front-end sales charge of up to 5.50% and 5.75%, respectively. All investors who purchase Class A and L shares in an amount of $1 million or more and sell these shares within 12 months of purchase are subject to a contingent deferred sales charge (CDSC) of 1%, including investors who purchase their shares through broker-dealers affiliated with Prudential. Class B and F shares are sold with a contingent deferred sales charge which declines from 5% to zero depending on the period of time the shares are held. Class B and F shares will automatically convert to Class A shares on a quarterly basis approximately seven years after purchase. Class C shares are sold with a contingent deferred sales charge of 1% during the first 12 months. Class M and X shares are sold with a contingent deferred sales charge which declines from 6% to zero depending on the period of time the shares are held. Class M and X shares will automatically convert to Class A shares on a quarterly basis approximately eight and ten years after purchase, respectively. A special exchange privilege is also available for shareholders who qualify to purchase Class A shares at net asset value. Class Z shares are not subject to any sales or redemption charge and are offered exclusively for sale to a limited group of investors.
There are 1 billion authorized shares of $.01 par value common stock, divided equally into eight classes, designated Class A, Class B, Class C, Class F, Class L, Class M, Class X and Class Z common stock.
| Prudential International Equity Fund | 39 |
Notes to Financial Statements
continued
For the year ended October 31, 2010 the Series received $4,717,145 related to the settlement of regulatory proceedings involving allegations of improper trading. The amounts relating to an affiliate and a third party were $4,493,246 and $223,899, respectively. The total amount is presented in the Series’ statement of changes in net assets. The Series was not involved in the proceedings or the calculation of the payment.
Transactions in shares of common stock were as follows:
Class A | Shares | Amount | ||||||
Year ended October 31, 2010: | ||||||||
Shares sold | 1,468,501 | $ | 8,439,334 | |||||
Shares issued in reinvestment of dividends | 784,260 | 4,572,227 | ||||||
Shares reacquired | (9,136,119 | ) | (52,354,816 | ) | ||||
Net increase (decrease) in shares outstanding before conversion | (6,883,358 | ) | (39,343,255 | ) | ||||
Shares issued upon conversion from Class B, F, M and X | 1,243,082 | 7,112,292 | ||||||
Net increase (decrease) in shares outstanding | (5,640,276 | ) | $ | (32,230,963 | ) | |||
Year ended October 31, 2009: | ||||||||
Shares sold | 2,009,357 | $ | 9,567,580 | |||||
Shares issued in reinvestment of dividends | 1,757,472 | 7,961,349 | ||||||
Shares reacquired | (9,646,158 | ) | (45,051,592 | ) | ||||
Net increase (decrease) in shares outstanding before conversion | (5,879,329 | ) | (27,522,663 | ) | ||||
Shares issued upon conversion from Class B, F, M and X | 2,392,167 | 11,305,239 | ||||||
Net increase (decrease) in shares outstanding | (3,487,162 | ) | $ | (16,217,424 | ) | |||
Class B | ||||||||
Year ended October 31, 2010: | ||||||||
Shares sold | 212,889 | $ | 1,182,667 | |||||
Shares issued in reinvestment of dividends | 20,600 | 116,386 | ||||||
Shares reacquired | (361,347 | ) | (1,987,158 | ) | ||||
Net increase (decrease) in shares outstanding before conversion | (127,858 | ) | (688,105 | ) | ||||
Shares reacquired upon conversion into Class A | (124,226 | ) | (674,212 | ) | ||||
Net increase (decrease) in shares outstanding | (252,084 | ) | $ | (1,362,317 | ) | |||
Year ended October 31, 2009: | ||||||||
Shares sold | 255,895 | $ | 1,165,887 | |||||
Shares issued in reinvestment of dividends | 52,248 | 229,892 | ||||||
Shares reacquired | (449,135 | ) | (1,984,539 | ) | ||||
Net increase (decrease) in shares outstanding before conversion | (140,992 | ) | (588,760 | ) | ||||
Shares reacquired upon conversion into Class A | (495,244 | ) | (2,234,431 | ) | ||||
Net increase (decrease) in shares outstanding | (636,236 | ) | $ | (2,823,191 | ) | |||
| 40 | Visit our website at www.prudentialfunds.com |
Class C | Shares | Amount | ||||||
Year ended October 31, 2010: | ||||||||
Shares sold | 166,469 | $ | 907,807 | |||||
Shares issued in reinvestment of dividends | 59,737 | 336,914 | ||||||
Shares reacquired | (1,018,733 | ) | (5,562,982 | ) | ||||
Net increase (decrease) in shares outstanding | (792,527 | ) | $ | (4,318,261 | ) | |||
Year ended October 31, 2009: | ||||||||
Shares sold | 286,313 | $ | 1,343,637 | |||||
Shares issued in reinvestment of dividends | 152,369 | 668,901 | ||||||
Shares reacquired | (1,424,303 | ) | (6,485,180 | ) | ||||
Net increase (decrease) in shares outstanding | (985,621 | ) | $ | (4,472,642 | ) | |||
Class F | ||||||||
Year ended October 31, 2010: | ||||||||
Shares sold | 131 | $ | 690 | |||||
Shares issued in reinvestment of dividends | 12,651 | 71,355 | ||||||
Shares reacquired | (203,435 | ) | (1,123,341 | ) | ||||
Net increase (decrease) in shares outstanding before conversion | (190,653 | ) | (1,051,296 | ) | ||||
Shares reacquired upon conversion into Class A | (184,350 | ) | (996,186 | ) | ||||
Net increase (decrease) in shares outstanding | (375,003 | ) | $ | (2,047,482 | ) | |||
Year ended October 31, 2009: | ||||||||
Shares sold | 88 | $ | 3,278 | |||||
Shares issued in reinvestment of dividends | 43,255 | 189,888 | ||||||
Shares reacquired | (257,755 | ) | (1,126,509 | ) | ||||
Net increase (decrease) in shares outstanding before conversion | (214,412 | ) | (933,343 | ) | ||||
Shares reacquired upon conversion into Class A | (616,155 | ) | (2,809,644 | ) | ||||
Net increase (decrease) in shares outstanding | (830,567 | ) | $ | (3,742,987 | ) | |||
Class L | ||||||||
Year ended October 31, 2010: | ||||||||
Shares sold | 10,093 | $ | 59,754 | |||||
Shares issued in reinvestment of dividends | 31,646 | 184,815 | ||||||
Shares reacquired | (411,930 | ) | (2,361,389 | ) | ||||
Net increase (decrease) in shares outstanding | (370,191 | ) | $ | (2,116,820 | ) | |||
Year ended October 31, 2009: | ||||||||
Shares sold | 14,999 | $ | 77,524 | |||||
Shares issued in reinvestment of dividends | 82,737 | 375,628 | ||||||
Shares reacquired | (592,276 | ) | (2,726,637 | ) | ||||
Net increase (decrease) in shares outstanding | (494,540 | ) | $ | (2,273,485 | ) | |||
| Prudential International Equity Fund | 41 |
Notes to Financial Statements
continued
Class M | Shares | Amount | ||||||
Year ended October 31, 2010: | ||||||||
Shares sold | 16,379 | $ | 91,988 | |||||
Shares issued in reinvestment of dividends | 12,151 | 68,651 | ||||||
Shares reacquired | (166,265 | ) | (916,746 | ) | ||||
Net increase (decrease) in shares outstanding before conversion | (137,735 | ) | (756,107 | ) | ||||
Shares reacquired upon conversion into Class A | (550,701 | ) | (3,062,454 | ) | ||||
Net increase (decrease) in shares outstanding | (688,436 | ) | $ | (3,818,561 | ) | |||
Year ended October 31, 2009: | ||||||||
Shares sold | 20,146 | $ | 87,325 | |||||
Shares issued in reinvestment of dividends | 55,502 | 244,211 | ||||||
Shares reacquired | (495,555 | ) | (2,164,815 | ) | ||||
Net increase (decrease) in shares outstanding before conversion | (419,907 | ) | (1,833,279 | ) | ||||
Shares reacquired upon conversion into Class A | (876,961 | ) | (3,992,545 | ) | ||||
Net increase (decrease) in shares outstanding | (1,296,868 | ) | $ | (5,825,824 | ) | |||
Class X | ||||||||
Year ended October 31, 2010: | ||||||||
Shares sold | 5,982 | $ | 33,503 | |||||
Shares issued in reinvestment of dividends | 11,154 | 63,022 | ||||||
Shares reacquired | (144,467 | ) | (804,626 | ) | ||||
Net increase (decrease) in shares outstanding before conversion | (127,331 | ) | (708,101 | ) | ||||
Shares reacquired upon conversion into Class A | (428,007 | ) | (2,379,440 | ) | ||||
Net increase (decrease) in shares outstanding | (555,338 | ) | $ | (3,087,541 | ) | |||
Year ended October 31, 2009: | ||||||||
Shares sold | 28,389 | $ | 134,934 | |||||
Shares issued in reinvestment of dividends | 44,577 | 196,141 | ||||||
Shares reacquired | (375,394 | ) | (1,659,860 | ) | ||||
Net increase (decrease) in shares outstanding before conversion | (302,428 | ) | (1,328,785 | ) | ||||
Shares reacquired upon conversion into Class A | (491,114 | ) | (2,268,619 | ) | ||||
Net increase (decrease) in shares outstanding | (793,542 | ) | $ | (3,597,404 | ) | |||
| 42 | Visit our website at www.prudentialfunds.com |
Class Z | Shares | Amount | ||||||
Year ended October 31, 2010: | ||||||||
Shares sold | 6,103,057 | $ | 35,465,353 | |||||
Shares issued in reinvestment of dividends | 779,543 | 4,583,715 | ||||||
Shares reacquired | (39,124,251 | ) | (212,237,067 | ) | ||||
Net increase (decrease) in shares outstanding | (32,241,651 | ) | $ | (172,187,999 | ) | |||
Year ended October 31, 2009: | ||||||||
Shares sold | 12,836,654 | $ | 61,016,882 | |||||
Shares issued in reinvestment of dividends | 1,439,502 | 6,578,527 | ||||||
Shares reacquired | (9,854,550 | ) | (47,124,357 | ) | ||||
Net increase (decrease) in shares outstanding | 4,421,606 | $ | 20,471,052 | |||||
Note 7. In-Kind Redemption
During the year ended October 31, 2010, shareholders redeemed fund shares in exchange for fund’s portfolio securities valued at $168,617,337. The Fund realized a loss of $28,278,878 related to the in-kind redemption transactions.
Note 8. Borrowing
The Fund, along with other affiliated registered investment companies (the “Funds”), is a party to a Syndicated Credit Agreement (“SCA”) with two banks. The SCA provides for a commitment of $500 million. Interest on any borrowings under the SCA is incurred at contracted market rates and a commitment fee for the unused amount is accrued daily and paid quarterly. The Funds pay a commitment fee of .15% of the unused portion of the renewed SCA. The expiration date of the SCA has been extended from October 20, 2010 through December 17, 2010 under the same terms. Effective December 17, 2010 the Fund, along with the Funds entered into a new Syndicated Credit Agreement (“New SCA”) with a group of banks. The New SCA provides for a commitment of $750 million. The Funds will pay an annualized commitment fee of 0.10% of the unused portion of the New SCA. The expiration date of the New SCA is December 16, 2011. Interest on any borrowings under the New SCA will be incurred at contracted market rates and a commitment fee for the unused amount is accrued daily and paid quarterly. The purpose of the SCA is to provide an alternative source of temporary funding for capital share redemptions.
The Fund utilized the SCA during the year ended October 31, 2010. The balance for the 91 days the Series had an outstanding balance was $485,495 at an interest rate of 1.45%. At October 31, 2010, the Fund had an outstanding loan amount of $69,000.
| Prudential International Equity Fund | 43 |
Notes to Financial Statements
continued
Note 9. Ownership
As of October 31, 2010, approximately 28% of the fund was owned by two institutional shareholders for the beneficial interest of their underlying account holders.
Note 10. Notice of Dividends to Shareholders
The Fund declared ordinary income dividends on December 8, 2010 to shareholders of record on December 9, 2010. The ex-dividend date was December 10, 2010. The per share amounts declared were as follows:
| Ordinary Income | ||||
Class A | $ | 0.09806 | ||
Class B, C, M and X | $ | 0.05986 | ||
Class F | $ | 0.07378 | ||
Class L | $ | 0.08653 | ||
Class Z | $ | 0.11532 | ||
| Special Ordinary Income | ||||
Class A, B, C, F, L, M, X and Z | $ | 0.01246 | ||
Note 11. New Accounting Pronouncement
In January 2010, the Financial Accounting Standards Board issued Accounting Standards Update (“ASU”) No. 2010-06 “Improving Disclosures about Fair Value Measurements”. ASU 2010-06 will require reporting entities to make new disclosures about purchases, sales, issuances, and settlements in the roll forward of activity in Level 3 fair value measurements. The new and revised disclosures are effective for interim and annual reporting periods beginning after December 15, 2010. At this time, management is evaluating the implications of ASU No. 2010-06 and its impact on the financial statements has not been determined.
| 44 | Visit our website at www.prudentialfunds.com |
Financial Highlights
| Class A Shares | ||||||||||||||||||||
| Year Ended October 31, | ||||||||||||||||||||
| 2010(a) | 2009(a) | 2008(a) | 2007(a) | 2006 | ||||||||||||||||
| Per Share Operating Performance: | ||||||||||||||||||||
| Net Asset Value, Beginning Of Year | $5.77 | $4.80 | $10.49 | $8.54 | $6.84 | |||||||||||||||
| Income (loss) from investment operations: | ||||||||||||||||||||
| Net investment income | .08 | .08 | .16 | .16 | .08 | |||||||||||||||
| Net realized and unrealized gain (loss) on investment and foreign currency transactions | .36 | 1.06 | (5.37 | ) | 1.92 | 1.66 | ||||||||||||||
| Total from investment operations | .44 | 1.14 | (5.21 | ) | 2.08 | 1.74 | ||||||||||||||
| Less Dividends and Distributions: | ||||||||||||||||||||
| Dividends from net investment income | (.10 | ) | (.17 | ) | (.14 | ) | (.13 | ) | (.04 | ) | ||||||||||
| Distributions from net realized gains | - | - | (.34 | ) | - | - | ||||||||||||||
| Total dividends and distributions | (.10 | ) | (.17 | ) | (.48 | ) | (.13 | ) | (.04 | ) | ||||||||||
| Capital Contributions | .06 | - | - | - | - | |||||||||||||||
| Net asset value, end of year | $6.17 | $5.77 | $4.80 | $10.49 | $8.54 | |||||||||||||||
| Total Return(b): | 8.78% | 24.65% | (51.87 | )% | 24.68% | 25.55% | ||||||||||||||
| Ratios/Supplemental Data: | ||||||||||||||||||||
| Net assets, end of year (000) | $260,555 | $275,993 | $246,234 | $557,878 | $67,123 | |||||||||||||||
| Average net assets (000) | $257,553 | $240,744 | $438,831 | $438,194 | $52,174 | |||||||||||||||
| Ratios to average net assets(c): | ||||||||||||||||||||
| Expenses, including distribution and service (12b-1) fees(d) | 1.57% | 1.54% | 1.43% | 1.34% | 1.40% | |||||||||||||||
| Expenses, excluding distribution and service (12b-1) fees | 1.27% | 1.24% | 1.15% | 1.09% | 1.15% | |||||||||||||||
| Net investment income | 1.35% | 1.75% | 1.94% | 1.60% | 1.23% | |||||||||||||||
| For Class A, B, C, F, L, M, X and Z shares: | ||||||||||||||||||||
| Portfolio turnover rate | 96% | 76% | 74% | 114% | 60% | |||||||||||||||
(a) Calculated based on average shares outstanding during the year.
(b) Total return does not consider the effects of sales loads. Total return is calculated assuming a purchase of a share on the first day and a sale on the last day of each year reported, and includes reinvestment of dividends and distributions. Total return may reflect adjustments to conform to generally accepted accounting principles.
(c) Does not include expenses of the underlying portfolios in which the Series invests.
(d) The distributor of the series has contractually agreed to limit its distribution and service (12b-1) fees to .25% of the average daily net assets of the Class A shares through February 28, 2008.
See Notes to Financial Statements.
| Prudential International Equity Fund | 45 |
Financial Highlights
continued
| Class B Shares | ||||||||||||||||||||
| Year Ended October 31, | ||||||||||||||||||||
| 2010(a) | 2009(a) | 2008(a) | 2007(a) | 2006 | ||||||||||||||||
| Per Share Operating Performance: | ||||||||||||||||||||
| Net Asset Value, Beginning Of Year | $5.56 | $4.61 | $10.09 | $8.22 | $6.59 | |||||||||||||||
| Income (loss) from investment operations: | ||||||||||||||||||||
| Net investment income | .04 | .05 | .09 | .06 | .04 | |||||||||||||||
| Net realized and unrealized gain (loss) on investment and foreign currency transactions | .35 | 1.02 | (5.16 | ) | 1.88 | 1.59 | ||||||||||||||
| Total from investment operations | .39 | 1.07 | (5.07 | ) | 1.94 | 1.63 | ||||||||||||||
| Less Dividends and Distributions: | ||||||||||||||||||||
| Dividends from net investment income | (.07 | ) | (.12 | ) | (.07 | ) | (.07 | ) | - | |||||||||||
| Distributions from net realized gains | - | - | (.34 | ) | - | - | ||||||||||||||
| Total dividends and distributions | (.07 | ) | (.12 | ) | (.41 | ) | (.07 | ) | - | |||||||||||
| Capital Contributions | .06 | - | - | - | - | |||||||||||||||
| Net asset value, end of year | $5.94 | $5.56 | $4.61 | $10.09 | $8.22 | |||||||||||||||
| Total Return(b): | 8.11% | 23.82% | (52.22 | )% | 23.73% | 24.73% | ||||||||||||||
| Ratios/Supplemental Data: | ||||||||||||||||||||
| Net assets, end of year (000) | $9,160 | $9,976 | $11,205 | $32,905 | $46,330 | |||||||||||||||
| Average net assets (000) | $9,246 | $9,229 | $22,786 | $39,205 | $45,041 | |||||||||||||||
| Ratios to average net assets(c): | ||||||||||||||||||||
| Expenses, including distribution and service (12b-1) fees | 2.27% | 2.24% | 2.15% | 2.09% | 2.15% | |||||||||||||||
| Expenses, excluding distribution and service (12b-1) fees | 1.27% | 1.24% | 1.15% | 1.09% | 1.15% | |||||||||||||||
| Net investment income | .66% | 1.06% | 1.17% | .67% | .46% | |||||||||||||||
(a) Calculated based on average shares outstanding during the year.
(b) Total return does not consider the effects of sales loads. Total return is calculated assuming a purchase of a share on the first day and a sale on the last day of each year reported, and includes reinvestment of dividends and distributions. Total return may reflect adjustments to conform to generally accepted accounting principles.
(c) Does not include expenses of the underlying portfolios in which the Series invests.
See Notes to Financial Statements.
| 46 | Visit our website at www.prudentialfunds.com |
| Class C Shares | ||||||||||||||||||||
| Year Ended October 31, | ||||||||||||||||||||
| 2010(a) | 2009(a) | 2008(a) | 2007(a) | 2006 | ||||||||||||||||
| Per Share Operating Performance: | ||||||||||||||||||||
| Net Asset Value, Beginning Of Year | $5.56 | $4.61 | $10.09 | $8.22 | $6.59 | |||||||||||||||
| Income (loss) from investment operations: | ||||||||||||||||||||
| Net investment income | .04 | .05 | .09 | .10 | .04 | |||||||||||||||
| Net realized and unrealized gain (loss) on investment and foreign currency transactions | .35 | 1.02 | (5.16 | ) | 1.84 | 1.59 | ||||||||||||||
| Total from investment operations | .39 | 1.07 | (5.07 | ) | 1.94 | 1.63 | ||||||||||||||
| Less Dividends and Distributions: | ||||||||||||||||||||
| Dividends from net investment income | (.07 | ) | (.12 | ) | (.07 | ) | (.07 | ) | - | |||||||||||
| Distributions from net realized gains | - | - | (.34 | ) | - | - | ||||||||||||||
| Total dividends and distributions | (.07 | ) | (.12 | ) | (.41 | ) | (.07 | ) | - | |||||||||||
| Capital Contributions | .06 | - | - | - | - | |||||||||||||||
| Net asset value, end of year | $5.94 | $5.56 | $4.61 | $10.09 | $8.22 | |||||||||||||||
| Total Return(b): | 8.11% | 23.83% | (52.22 | )% | 23.73% | 24.73% | ||||||||||||||
| Ratios/Supplemental Data: | ||||||||||||||||||||
| Net assets, end of year (000) | $26,625 | $29,326 | $28,858 | $75,010 | $13,825 | |||||||||||||||
| Average net assets (000) | $26,974 | $26,677 | $55,111 | $53,765 | $13,478 | |||||||||||||||
| Ratios to average net assets(c): | ||||||||||||||||||||
| Expenses, including distribution and service (12b-1) fees | 2.27% | 2.24% | 2.15% | 2.09% | 2.15% | |||||||||||||||
| Expenses, excluding distribution and service (12b-1) fees | 1.27% | 1.24% | 1.15% | 1.09% | 1.15% | |||||||||||||||
| Net investment income | .66% | 1.06% | 1.19% | 1.03% | 0.47% | |||||||||||||||
(a) Calculated based on average shares outstanding during the year.
(b) Total return does not consider the effects of sales loads. Total return is calculated assuming a purchase of a share on the first day and a sale on the last day of each year reported, and includes reinvestment of dividends and distributions. Total return may reflect adjustments to conform to generally accepted accounting principles.
(c) Does not include expenses of the underlying portfolios in which the Series invests.
See Notes to Financial Statements.
| Prudential International Equity Fund | 47 |
Financial Highlights
continued
| Class F Shares | ||||||||||||||||
| Year Ended October 31, | December 18, 2006(e) through October 31, | |||||||||||||||
| 2010(a) | 2009(a) | 2008(a) | 2007(a) | |||||||||||||
| Per Share Operating Performance: | ||||||||||||||||
| Net Asset Value, Beginning Of Period | $5.56 | $4.62 | $10.11 | $8.56 | ||||||||||||
| Income (loss) from investment operations: | ||||||||||||||||
| Net investment income | .05 | .06 | .11 | .09 | ||||||||||||
| Net realized and unrealized gain (loss) on investment and foreign currency transactions | .35 | 1.01 | (5.17 | ) | 1.46 | |||||||||||
| Total from investment operations | .40 | 1.07 | (5.06 | ) | 1.55 | |||||||||||
| Less Dividends and Distributions: | ||||||||||||||||
| Dividends from net investment income | (.08 | ) | (.13 | ) | (.09 | ) | - | |||||||||
| Distributions from net realized gains | - | - | (.34 | ) | - | |||||||||||
| Total dividends and distributions | (.08 | ) | (.13 | ) | (.43 | ) | - | |||||||||
| Capital Contributions | .06 | - | - | - | ||||||||||||
| Net asset value, end of period | $5.94 | $5.56 | $4.62 | $10.11 | ||||||||||||
| Total Return(b): | 8.35% | 24.04% | (52.10 | )% | 18.11% | |||||||||||
| Ratios/Supplemental Data: | ||||||||||||||||
| Net assets, end of period (000) | $3,355 | $5,226 | $8,171 | $28,728 | ||||||||||||
| Average net assets (000) | $4,064 | $5,769 | $18,310 | $33,219 | ||||||||||||
| Ratios to average net assets(c): | ||||||||||||||||
| Expenses, including distribution and service (12b-1) fees | 2.02% | 1.99% | 1.90% | 1.84% | (d) | |||||||||||
| Expenses, excluding distribution and service (12b-1) fees | 1.27% | 1.24% | 1.15% | 1.09% | (d) | |||||||||||
| Net investment income | .95% | 1.35% | 1.37% | 1.13% | (d) | |||||||||||
(a) Calculated based on average shares outstanding during the period.
(b) Total return does not consider the effects of sales loads. Total return is calculated assuming a purchase of a share on the first day and a sale on the last day of each period reported, and includes reinvestment of dividends and distributions. Total return may reflect adjustments to conform to generally accepted accounting principles. Total returns for periods less than one full year are not annualized.
(c) Does not include expenses of the underlying portfolios in which the Series invests.
(d) Annualized.
(e) Inception date of Class F shares.
See Notes to Financial Statements.
| 48 | Visit our website at www.prudentialfunds.com |
| Class L Shares | ||||||||||||||||
| Year Ended October 31, | March 19, 2007(e) through October 31, | |||||||||||||||
| 2010(a) | 2009(a) | 2008(a) | 2007(a) | |||||||||||||
| Per Share Operating Performance: | ||||||||||||||||
| Net Asset Value, Beginning Of Period | $5.77 | $4.79 | $10.48 | $8.92 | ||||||||||||
| Income (loss) from investment operations: | ||||||||||||||||
| Net investment income | .07 | .07 | .14 | .11 | ||||||||||||
| Net realized and unrealized gain (loss) on investment and foreign currency transactions | .36 | 1.06 | (5.38 | ) | 1.45 | |||||||||||
| Total from investment operations | .43 | 1.13 | (5.24 | ) | 1.56 | |||||||||||
| Less Dividends and Distributions: | ||||||||||||||||
| Dividends from net investment income | (.09 | ) | (.15 | ) | (.11 | ) | - | |||||||||
| Distributions from net realized gains | - | - | (.34 | ) | - | |||||||||||
| Total dividends and distributions | (.09 | ) | (.15 | ) | (.45 | ) | - | |||||||||
| Capital Contributions | .06 | - | - | - | ||||||||||||
| Net asset value, end of period | $6.17 | $5.77 | $4.79 | $10.48 | ||||||||||||
| Total Return(b): | 8.59% | 24.49% | (52.07 | )% | 17.49% | |||||||||||
| Ratios/Supplemental Data: | ||||||||||||||||
| Net assets, end of period (000) | $10,919 | $12,342 | $12,621 | $34,433 | ||||||||||||
| Average net assets (000) | $11,216 | $11,250 | $24,942 | $35,182 | ||||||||||||
| Ratios to average net assets(c): | ||||||||||||||||
| Expenses, including distribution and service (12b-1) fees | 1.77% | 1.74% | 1.65% | 1.59% | (d) | |||||||||||
| Expenses, excluding distribution and service (12b-1) fees | 1.27% | 1.24% | 1.15% | 1.09% | (d) | |||||||||||
| Net investment income | 1.16% | 1.56% | 1.68% | 1.82% | (d) | |||||||||||
(a) Calculations are based on average shares outstanding during the period.
(b) Total return does not consider the effects of sales loads. Total return is calculated assuming a purchase of a share on the first day and a sale on the last day of each period reported, and includes reinvestment of dividends and distributions. Total return may reflect adjustments to conform to generally accepted accounting principles. Total returns for periods less than one full year are not annualized.
(c) Does not include expenses of the underlying portfolios in which the Series invests.
(d) Annualized.
(e) Inception date of Class L shares.
See Notes to Financial Statements.
| Prudential International Equity Fund | 49 |
Financial Highlights
continued
| Class M Shares | ||||||||||||||||
| Year Ended October 31, | March 19, 2007(e) through October 31, | |||||||||||||||
| 2010(a) | 2009(a) | 2008(a) | 2007(a) | |||||||||||||
| Per Share Operating Performance: | ||||||||||||||||
| Net Asset Value, Beginning Of Period | $5.56 | $4.61 | $10.09 | $8.63 | ||||||||||||
| Income (loss) from investment operations: | ||||||||||||||||
| Net investment income | .04 | .05 | .07 | .08 | ||||||||||||
| Net realized and unrealized gain (loss) on investment and foreign currency transactions | .35 | 1.02 | (5.14 | ) | 1.38 | |||||||||||
| Total from investment operations | .39 | 1.07 | (5.07 | ) | 1.46 | |||||||||||
| Less Dividends and Distributions: | ||||||||||||||||
| Dividends from net investment income | (.07 | ) | (.12 | ) | (.07 | ) | - | |||||||||
| Distributions from net realized gains | - | - | (.34 | ) | - | |||||||||||
| Total dividends and distributions | (.07 | ) | (.12 | ) | (.41 | ) | - | |||||||||
| Capital Contributions | .06 | - | - | - | ||||||||||||
| Net asset value, end of period | $5.94 | $5.56 | $4.61 | $10.09 | ||||||||||||
| Total Return(b): | 8.11% | 23.82% | (52.22)% | 16.92% | ||||||||||||
| Ratios/Supplemental Data: | ||||||||||||||||
| Net assets, end of period (000) | $2,985 | $6,622 | $11,467 | $68,244 | ||||||||||||
| Average net assets (000) | $4,441 | $7,957 | $34,319 | $76,639 | ||||||||||||
| Ratios to average net assets(c): | ||||||||||||||||
| Expenses, including distribution and service (12b-1) fees | 2.27% | 2.24% | 2.15% | 2.09% | (d) | |||||||||||
| Expenses, excluding distribution and service (12b-1) fees | 1.27% | 1.24% | 1.15% | 1.09% | (d) | |||||||||||
| Net investment income | .68% | 1.09% | .92% | 1.41% | (d) | |||||||||||
(a) Calculated based on average shares outstanding during the period.
(b) Total return does not consider the effects of sales loads. Total return is calculated assuming a purchase of a share on the first day and a sale on the last day of each period reported, and includes reinvestment of dividends and distributions. Total return may reflect adjustments to conform to generally accepted accounting principles. Total returns for periods less than one full year are not annualized.
(c) Does not include expenses of the underlying portfolios in which the Series invests.
(d) Annualized.
(e) Inception date of Class M shares.
See Notes to Financial Statements.
| 50 | Visit our website at www.prudentialfunds.com |
| Class X Shares | ||||||||||||||||
| Year Ended October 31, | March 19, 2007(e) through October 31, | |||||||||||||||
| 2010(a) | 2009(a) | 2008(a) | 2007(a) | |||||||||||||
| Per Share Operating Performance: | ||||||||||||||||
| Net Asset Value, Beginning Of Period | $5.56 | $4.61 | $10.09 | $8.63 | ||||||||||||
| Income (loss) from investment operations: | ||||||||||||||||
| Net investment income | .04 | .05 | .09 | .08 | ||||||||||||
| Net realized and unrealized gain (loss) on investment and foreign currency transactions | .35 | 1.02 | (5.16 | ) | 1.38 | |||||||||||
| Total from investment operations | .39 | 1.07 | (5.07 | ) | 1.46 | |||||||||||
| Less Dividends and Distributions: | ||||||||||||||||
| Dividends from net investment income | (.07 | ) | (.12 | ) | (.07 | ) | - | |||||||||
| Distributions from net realized gains | - | - | (.34 | ) | - | |||||||||||
| Total dividends and distributions | (.07 | ) | (.12 | ) | (.41 | ) | - | |||||||||
| Capital Contributions | .06 | - | - | - | ||||||||||||
| Net asset value, end of period | $5.94 | $5.56 | $4.61 | $10.09 | ||||||||||||
| Total Return(b): | 8.11% | 23.82% | (52.22)% | 16.92% | ||||||||||||
| Ratios/Supplemental Data: | ||||||||||||||||
| Net assets, end of period (000) | $3,067 | $5,957 | $8,597 | $25,428 | ||||||||||||
| Average net assets (000) | $4,020 | $6,611 | $17,864 | $25,351 | ||||||||||||
| Ratios to average net assets(c): | ||||||||||||||||
| Expenses, including distribution and service (12b-1) fees | 2.27% | 2.24% | 2.15% | 2.09% | (d) | |||||||||||
| Expenses, excluding distribution and service (12b-1) fees | 1.27% | 1.24% | 1.15% | 1.09% | (d) | |||||||||||
| Net investment income | .66% | 1.10% | 1.18% | 1.30% | (d) | |||||||||||
(a) Calculated based on average shares outstanding during the period.
(b) Total return does not consider the effects of sales loads. Total return is calculated assuming a purchase of a share on the first day and a sale on the last day of each period reported, and includes reinvestment of dividends and distributions. Total return may reflect adjustments to conform to generally accepted accounting principles. Total returns for periods less than one full year are not annualized.
(c) Does not include expenses of the underlying portfolios in which the Series invests.
| (d) | Annualized. |
| (e) | Inception date of Class X shares. |
See Notes to Financial Statements.
| Prudential International Equity Fund | 51 |
Financial Highlights
continued
| Class Z Shares | ||||||||||||||||||||
| Year Ended October 31, | ||||||||||||||||||||
| 2010(a) | 2009(a) | 2008(a) | 2007(a) | 2006 | ||||||||||||||||
| Per Share Operating Performance: | ||||||||||||||||||||
| Net Asset Value, Beginning Of Year | $5.82 | $4.85 | $10.60 | $8.62 | $6.90 | |||||||||||||||
| Income (loss) from investment operations: | ||||||||||||||||||||
| Net investment income | .13 | .10 | .18 | .16 | .12 | |||||||||||||||
| Net realized and unrealized gain (loss) on investment and foreign currency transactions | .33 | 1.06 | (5.43 | ) | 1.97 | 1.65 | ||||||||||||||
| Total from investment operations | .46 | 1.16 | (5.25 | ) | 2.13 | 1.77 | ||||||||||||||
| Less Dividends and Distributions: | ||||||||||||||||||||
| Dividends from net investment income | (.12 | ) | (.19 | ) | (.16 | ) | (.15 | ) | (.05 | ) | ||||||||||
| Distributions from net realized gains | - | - | (.34 | ) | - | - | ||||||||||||||
| Total dividends and distributions | (.12 | ) | (.19 | ) | (.50 | ) | (.15 | ) | (.05 | ) | ||||||||||
| Capital Contributions | .06 | - | - | - | - | |||||||||||||||
| Net asset value, end of year | $6.22 | $5.82 | $4.85 | $10.60 | $8.62 | |||||||||||||||
| Total Return(b): | 8.98% | 24.95% | (51.77)% | 25.05% | 25.86% | |||||||||||||||
| Ratios/Supplemental Data: | ||||||||||||||||||||
| Net assets, end of year (000) | $44,833 | $229,771 | $169,874 | $353,771 | $243,572 | |||||||||||||||
| Average net assets (000) | $149,685 | $184,038 | $285,097 | $301,553 | $214,969 | |||||||||||||||
| Ratios to average net assets(c): | ||||||||||||||||||||
| Expenses, including distribution and service (12b-1) fees | 1.27% | 1.24% | 1.15% | 1.09% | 1.15% | |||||||||||||||
| Expenses, excluding distribution and service (12b-1) fees | 1.27% | 1.24% | 1.15% | 1.09% | 1.15% | |||||||||||||||
| Net investment income | 2.12% | 2.05% | 2.22% | 1.73% | 1.48% | |||||||||||||||
(a) Calculated based on average shares outstanding during the year.
(b) Total return is calculated assuming a purchase of a share on the first day and a sale on the last day of each year reported, and includes reinvestment of dividends and distributions. Total return may reflect adjustments to conform to generally accepted accounting principles.
(c) Does not include expenses of the underlying portfolios in which the Series invests.
See Notes to Financial Statements.
| 52 | Visit our website at www.prudentialfunds.com |
Report of Independent Registered Public
Accounting Firm
The Board of Directors and Shareholders
Prudential World Fund, Inc.:
We have audited the accompanying statement of assets and liabilities of Prudential International Equity Fund (formerly Dryden International Equity Fund) (one of the series constituting Prudential World Fund, Inc., hereafter referred to as the “Fund”), including the portfolio of investments, as of October 31, 2010, and the related statement of operations for the year then ended, the statement of changes in net assets for each of the years in the two-year period then ended and the financial highlights for each of the years in the five-year period then ended. These financial statements and financial highlights are the responsibility of the Fund’s management. Our responsibility is to express an opinion on these financial statements and financial highlights based on our audits.
We conducted our audits in accordance with the standards of the Public Company Accounting Oversight Board (United States). Those standards require that we plan and perform the audit to obtain reasonable assurance about whether the financial statements and financial highlights are free of material misstatement. An audit includes examining, on a test basis, evidence supporting the amounts and disclosures in the financial statements. Our procedures included confirmation of securities owned as of October 31, 2010, by correspondence with the custodian, transfer agent and brokers or by other appropriate auditing procedures when replies from brokers were not received. An audit also includes assessing the accounting principles used and significant estimates made by management, as well as evaluating the overall financial statement presentation. We believe that our audits provide a reasonable basis for our opinion.
In our opinion, the financial statements and financial highlights referred to above present fairly, in all material respects, the financial position of the Fund as of October 31, 2010, and the results of its operations for the year then ended, the changes in its net assets for each of the years in the two-year period then ended and the financial highlights for each of the years in the five-year period then ended, in conformity with U.S. generally accepted accounting principles.

New York, New York
December 20, 2010
| Prudential International Equity Fund | 53 |
Tax Information
(Unaudited)
We are required by Internal Revenue Code of 1986, as amended (“the Code”), to advise you within 60 days of the Series’ fiscal year end (October 31, 2010) as to the federal tax status of dividends paid by the Series during such fiscal year. We are advising you in the fiscal year ended October 31, 2010, the Series paid ordinary income dividends of $0.10 per share for Class A, $0.07 per share for Class B, C, M and X, $0.08 per share for Class F, $0.09 per share for Class L and $0.12 per share for Class Z, respectively, which are taxable as such.
For the fiscal year ended October 31, 2010, the Series designates the maximum amount allowable, but not less than 100% of the ordinary income dividends paid during the fiscal year as qualified dividend income in accordance with Section 854 of the Internal Revenue Code.
For the fiscal year ended October 31, 2010, the Series made an election to pass through the maximum amount of the portion of the ordinary income dividends paid derived from foreign source income as well as any foreign taxes paid by the Series in accordance with Section 853 of the Internal Revenue Code of the following amounts: $1,049,446 foreign tax credit from recognized foreign source income of $15,441,174.
In January 2011, you will be advised on IRS Form 1099 DIV or substitute 1099 DIV as to the federal tax status of distributions received by you in calendar year 2010.
| 54 | Visit our website at www.prudentialfunds.com |
MANAGEMENT OF THE FUND
(Unaudited)
Information about Fund Directors/Trustees (referred to herein as “Board Members”) and Fund Officers is set forth below. Board Members who are not deemed to be “interested persons,” as defined in the 1940 Act, are referred to as “Independent Board Members.” Board Members who are deemed to be “interested persons” are referred to as “Interested Board Members.” The Board Members are responsible for the overall supervision of the operations of the Fund and perform the various duties imposed on the directors or trustees of investment companies by the 1940 Act.
| Independent Board Members (1) | ||||
Name, Address, Age Position(s) Portfolios Overseen | Principal Occupation(s) During Past Five Years | Other Directorships Held | ||
Kevin J. Bannon (58) Board Member Portfolios Overseen: 58 |
Managing Director (since April 2008) and Chief Investment Officer (since October 2008) of Highmount Capital LLC (registered investment adviser); formerly Executive Vice President and Chief Investment Officer (April 1993-August 2007) of Bank of New York Company; President (May 2003-May 2007) of BNY Hamilton Family of Mutual Funds. |
Director of Urstadt Biddle Properties (since September 2008). | ||
Linda W. Bynoe (58) Board Member Portfolios Overseen: 58 |
President and Chief Executive Officer (since March 1995) and formerly Chief Operating Officer (December 1989- February 1995) of Telemat Ltd. (management consulting); formerly Vice President (January 1985-June 1989) at Morgan Stanley & Co (broker-dealer). |
Director of Simon Property Group, Inc. (retail real estate) (since May 2003); Anixter International, Inc. (communication products distributor) (since January 2006); Director of Northern Trust Corporation (financial services) (since April 2006); Trustee of Equity Residential (residential real estate) (since December 2009); formerly Director of Dynegy Inc. (power generation) (September 2002-May 2006), CitiStreet Funds, Inc. (mutual funds) (May 1993-February 2005), AM-CH, Inc. (restaurant holding company) (November 2004-February 2005). | ||
Michael S. Hyland, CFA (65) Board Member Portfolios Overseen: 58 |
Independent Consultant (since February 2005); formerly Senior Managing Director (July 2001-February 2005) of Bear Stearns & Co, Inc.; Global Partner, INVESCO (1999-2001); Managing Director and President of Salomon Brothers Asset Management (1989-1999). |
None. | ||
Prudential International Equity Fund
Douglas H. McCorkindale (71) Board Member Portfolios Overseen: 58 |
Formerly Chairman (February 2001-June 2006), Chief Executive Officer (June 2000-July 2005), President (September 1997-July 2005) and Vice Chairman (March 1984-May 2000) of Gannett Co. Inc. (publishing and media). |
Director of Continental Airlines, Inc. (since May 1993); Director of Lockheed Martin Corp. (aerospace and defense) (since May 2001). | ||
Stephen P. Munn (68) Board Member Portfolios Overseen: 58 |
Lead Director (since 2007) and formerly Chairman (1993-2007) of Carlisle Companies Incorporated (manufacturer of industrial products). |
Lead Director (since 2007) of Carlisle Companies Incorporated (manufacturer of industrial products). | ||
Richard A. Redeker (67) Board Member Portfolios Overseen: 58 |
Retired Mutual Fund Senior Executive (42 years); Management Consultant; Independent Directors Council (organization of 2,800 Independent Mutual Fund Directors)-Executive Committee, Chair of Policy Steering Committee, Governing Council. |
None. | ||
Robin B. Smith (71) Board Member & Independent Chair Portfolios Overseen: 58 |
Chairman of the Board (since January 2003) of Publishers Clearing House (direct marketing); formerly Chairman and Chief Executive Officer (August 1996-January 2003) of Publishers Clearing House. |
Formerly Director of BellSouth Corporation (telecommunications) (1992-2006). | ||
Stephen G. Stoneburn (67) Board Member Portfolios Overseen: 58 |
President and Chief Executive Officer (since June 1996) of Quadrant Media Corp. (publishing company); formerly President (June 1995-June 1996) of Argus Integrated Media, Inc.; Senior Vice President and Managing Director (January 1993-1995) of Cowles Business Media; Senior Vice President of Fairchild Publications, Inc (1975-1989). |
None. |
Visit our website at www.prudentialfunds.com
| Interested Board Members (1) | ||||
Name, Address, Age Position(s) Portfolios Overseen | Principal Occupation(s) During Past Five Years | Other Directorships Held | ||
Judy A. Rice (62) Board Member & President Portfolios Overseen: 58 |
President, Chief Executive Officer, Chief Operating Officer and Officer-In-Charge (since February 2003) of Prudential Investments LLC; President, Chief Executive Officer and Officer-In-Charge (since April 2003) of Prudential Mutual Fund Services LLC; Executive Vice President (since December 2008) of Prudential Investment Management Services LLC; Member of the Board of Directors of Jennison Associates LLC (since November 2010); formerly Vice President (February 1999-April 2006) of Prudential Investment Management Services LLC; formerly President, Chief Executive Officer, Chief Operating Officer and Officer-In-Charge (May 2003-June 2005) and Director (May 2003-March 2006) and Executive Vice President (June 2005-March 2006) of AST Investment Services, Inc.; Member of Board of Governors of the Investment Company Institute. |
None. | ||
Scott E. Benjamin (37) Board Member & Vice President Portfolios Overseen: 58 |
Executive Vice President (since June 2009) of Prudential Investments LLC and Prudential Investment Management Services LLC; Executive Vice President (since September 2009) of AST Investment Services, Inc.; Senior Vice President of Product Development and Marketing, Prudential Investments (since February 2006); Vice President of Product Development and Product Management, Prudential Investments (2003-2006). |
None. | ||
| 1 | The year that each individual joined the Fund’s Board is as follows: |
Linda W. Bynoe, 2005; David E.A. Carson, 2003; Robert E. La Blanc, 1984; Douglas H. McCorkindale, 2003; Richard A. Redeker, 2003; Robin B. Smith, 1996; Stephen G. Stoneburn, 1996; Kevin J. Bannon, 2008; Michael S. Hyland, 2008; Stephen P. Munn, 2008; Judy A. Rice, Board Member since 2000 and President since 2003.
Prudential International Equity Fund
Fund Officers (a)(1) | ||
Name, Address and Age Position with Fund | Principal Occupation(s) During Past Five Years | |
Kathryn L. Quirk (58) Chief Legal Officer |
Vice President and Corporate Counsel (since September 2004) of Prudential; Executive Vice President, Chief Legal Officer and Secretary (since July 2005) of PI and Prudential Mutual Fund Services LLC; Vice President and Corporate Counsel (since June 2005) and Secretary (since February 2006) of AST Investment Services, Inc.; formerly Senior Vice President and Assistant Secretary (November 2004-August 2005) of PI; formerly Assistant Secretary (June 2005-February 2006) of AST Investment Services, Inc.; formerly Managing Director, General Counsel, Chief Compliance Officer, Chief Risk Officer and Corporate Secretary (1997-2002) of Zurich Scudder Investments, Inc. | |
Deborah A. Docs (52) Secretary |
Vice President and Corporate Counsel (since January 2001) of Prudential; Vice President (since December 1996) and Assistant Secretary (since March 1999) of PI; formerly Vice President and Assistant Secretary (May 2003-June 2005) of AST Investment Services, Inc. | |
Jonathan D. Shain (52) Assistant Secretary |
Vice President and Corporate Counsel (since August 1998) of Prudential; Vice President and Assistant Secretary (since May 2001) of PI; Vice President and Assistant Secretary (since February 2001) of PMFS; formerly Vice President and Assistant Secretary (May 2003-June 2005) of AST Investment Services, Inc. | |
Claudia DiGiacomo (36) Assistant Secretary |
Vice President and Corporate Counsel (since January 2005) of Prudential; Vice President and Assistant Secretary of PI (since December 2005); Associate at Sidley Austin Brown & Wood LLP (1999-2004). | |
John P. Schwartz (39) Assistant Secretary |
Vice President and Corporate Counsel (since April 2005) of Prudential; Vice President and Assistant Secretary of PI (since December 2005); Associate at Sidley Austin Brown & Wood LLP (1997-2005). | |
Andrew R. French (48) Assistant Secretary |
Vice President and Corporate Counsel (since February 2010) of Prudential; formerly Director and Corporate Counsel (2006-2010) of Prudential; Vice President and Assistant Secretary (since January 2007) of PI; Vice President and Assistant Secretary (since January 2007) of PMFS; formerly Senior Legal Analyst of Prudential Mutual Fund Law Department (1997-2006). | |
Timothy J. Knierim (51) Chief Compliance Officer |
Chief Compliance Officer of Prudential Investment Management, Inc. (since July 2007); formerly Chief Risk Officer of PIM and PI (2002-2007) and formerly Chief Ethics Officer of PIM and PI (2006-2007). | |
Valerie M. Simpson (52) Deputy Chief Compliance Officer |
Chief Compliance Officer (since April 2007) of PI and AST Investment Services, Inc.; formerly Vice President-Financial Reporting (June 1999-March 2006) for Prudential Life and Annuities Finance. | |
Theresa C. Thompson (48) Deputy Chief Compliance Officer |
Vice President, Compliance, PI (since April 2004); and Director, Compliance, PI (2001-2004). | |
Visit our website at www.prudentialfunds.com
Noreen M. Fierro (46) Anti-Money Laundering Compliance Officer |
Vice President, Corporate Compliance (since May 2006) of Prudential; formerly Corporate Vice President, Associate General Counsel (April 2002-May 2005) of UBS Financial Services, Inc., in their Money Laundering Prevention Group; Senior Manager (May 2005-May 2006) of Deloitte Financial Advisory Services, LLP, in their Forensic and Dispute Services, Anti-Money Laundering Group. | |
Grace C. Torres (51) Treasurer and Principal Financial and Accounting Officer |
Assistant Treasurer (since March 1999) and Senior Vice President (since September 1999) of PI; Assistant Treasurer (since May 2003) and Vice President (since June 2005) of AST Investment Services, Inc.; Senior Vice President and Assistant Treasurer (since May 2003) of Prudential Annuities Advisory Services, Inc.; formerly Senior Vice President (May 2003-June 2005) of AST Investment Services, Inc. | |
M. Sadiq Peshimam (46) Assistant Treasurer |
Vice President (since 2005) of Prudential Investments LLC. | |
Peter Parrella (52) Assistant Treasurer |
Vice President (since 2007) and Director (2004-2007) within Prudential Mutual Fund Administration; formerly Tax Manager at SSB Citi Fund Management LLC (1997-2004). |
| (a) | Excludes Ms. Rice and Mr. Benjamin, interested Board Members who also serve as President and Vice President, respectively. |
| (1) | The year that each individual became an officer of the Fund is as follows: |
Kathryn L. Quirk, 2005; Deborah A. Docs, 2005; Jonathan D. Shain, 2005; Claudia DiGiacomo, 2005; John P. Schwartz, 2006; Andrew R. French, 2006; Timothy J. Knierim, 2007; Valerie M. Simpson, 2007; Theresa C. Thompson, 2008; Noreen M. Fierro, 2006; Grace C. Torres, 1995; Sadiq Peshimam, 2006; Peter Parrella, 2007.
Explanatory Notes to Tables:
| • | Board Members are deemed to be “Interested,” as defined in the 1940 Act, by reason of their affiliation with Prudential Investments LLC and/or an affiliate of Prudential Investments LLC. |
| • | Unless otherwise noted, the address of all Board Members and Officers is c/o Prudential Investments LLC, Gateway Center Three, 100 Mulberry Street, Newark, New Jersey 07102-4077. |
| • | There is no set term of office for Board Members or Officers. The Board Members have adopted a retirement policy, which calls for the retirement of Board Members on December 31 of the year in which they reach the age of 75. |
| • | “Other Directorships Held” includes only directorships of companies required to register or file reports with the Commission under the Securities Exchange Act of 1934, as amended (the “Exchange Act”) (that is, “public companies”) or other investment companies registered under the 1940 Act. |
| • | “Portfolios Overseen” includes all investment companies managed by Prudential Investments LLC. The investment companies for which PI serves as manager include the Prudential Investments Mutual Funds, The Prudential Variable Contract Accounts, Target Mutual Funds, The Prudential Series Fund, Prudential’s Gibraltar Fund, Inc. and the Advanced Series Trust. |
Prudential International Equity Fund
Approval of Advisory Agreements
The Fund’s Board of Directors
The Board of Directors (the “Board”) of Prudential International Equity Fund (the “Fund”)1 consists of 10 individuals, eight of whom are not “interested persons” of the Fund, as defined in the Investment Company Act of 1940, as amended (the “1940 Act”) (the “Independent Directors”). The Board is responsible for the oversight of the Fund and its operations, and performs the various duties imposed on the directors of investment companies by the 1940 Act. The Independent Directors have retained independent legal counsel to assist them in connection with their duties. The Chair of the Board is an Independent Director. The Board has established three standing committees: the Audit Committee, the Nominating and Governance Committee, and the Investment Committee. Each committee is chaired by, and composed of, Independent Directors.
Annual Approval of the Fund’s Advisory Agreements
As required under the 1940 Act, the Board determines annually whether to renew the Fund’s management agreement with Prudential Investments LLC (“PI”) and the Fund’s subadvisory agreement with Quantitative Management Associates LLC (“QMA”). In considering the renewal of the agreements, the Board, including all of the Independent Directors, met on June 21-23, 2010 and approved the renewal of the agreements through July 31, 2011, after concluding that the renewal of the agreements was in the best interests of the Fund and its shareholders.
In advance of the meetings, the Board requested and received materials relating to the agreements, and had the opportunity to ask questions and request further information in connection with their consideration. Among other things, the Board considered comparative fee information from PI and QMA. Also, the Board considered comparisons with other mutual funds in relevant Peer Universes and Peer Groups. The mutual funds included in each Peer Universe or Peer Group were objectively determined by Lipper Inc. (“Lipper”), an independent provider of mutual fund data. To the extent that PI deems appropriate, and for reasons addressed in detail with the Board, PI may provide supplemental data compiled by Lipper for the Board’s consideration. The comparisons placed the Fund in various quartiles over the one-, three-, and five-year periods ending December 31, 2009, with the first quartile being the best 25% of the mutual funds (for performance, the best performing mutual funds and, for expenses, the lowest cost mutual funds).
In approving the agreements, the Board, including the Independent Directors advised by independent legal counsel, considered the factors it deemed relevant, including
| 1 | Prudential International Equity Fund is a series of Prudential World Fund, Inc. |
Prudential International Equity Fund
Approval of Advisory Agreements (continued)
the nature, quality and extent of services provided by PI and the subadviser, the performance of the Fund, the profitability of PI and its affiliates, expenses and fees, and the potential for economies of scale that may be shared with the Fund and its shareholders as the Fund’s assets grow. In their deliberations, the Directors did not identify any single factor which alone was responsible for the Board’s decision to approve the agreements with respect to the Fund. In connection with its deliberations, the Board considered information provided by PI throughout the year at regular Board meetings, presentations from portfolio managers and other information, as well as information furnished at or in advance of the meetings on June 21-23, 2010.
The Directors determined that the overall arrangements between the Fund and PI, which serves as the Fund’s investment manager pursuant to a management agreement, and between PI and QMA, which serves as the Fund’s subadviser pursuant to the terms of a subadvisory agreement with PI, are in the interest of the Fund and its shareholders in light of the services performed, fees charged and such other matters as the Directors considered relevant in the exercise of their business judgment.
The material factors and conclusions that formed the basis for the Directors’ reaching their determinations to approve the continuance of the agreements are separately discussed below.
Nature, Quality, and Extent of Services
The Board received and considered information regarding the nature, quality and extent of services provided to the Fund by PI and QMA. The Board considered the services provided by PI, including but not limited to the oversight of the subadviser for the Fund, as well as the provision of fund recordkeeping, compliance, and other services to the Fund. With respect to PI’s oversight of the subadviser, the Board noted that PI’s Strategic Investment Research Group (“SIRG”), which is a business unit of PI, is responsible for monitoring and reporting to PI’s senior management on the performance and operations of the subadviser. The Board also considered that PI pays the salaries of all of the officers and non-independent Directors of the Fund. The Board also considered the investment subadvisory services provided by QMA, as well as adherence to the Fund’s investment restrictions and compliance with applicable Fund policies and procedures. The Board considered PI’s evaluation of the subadviser, as well as PI’s recommendation, based on its review of the subadviser, to renew the subadvisory agreement.
The Board reviewed the qualifications, backgrounds and responsibilities of PI’s senior management responsible for the oversight of the Fund and QMA, and also reviewed
Visit our website at www.prudentialfunds.com
the qualifications, backgrounds and responsibilities of QMA’s portfolio managers who are responsible for the day-to-day management of the Fund’s portfolio. The Board was provided with information pertaining to PI’s and QMA’s organizational structure, senior management, investment operations, and other relevant information pertaining to both PI and QMA. The Board also noted that it received favorable compliance reports from the Fund’s Chief Compliance Officer (“CCO”) as to both PI and QMA. The Board noted that QMA is affiliated with PI.
The Board concluded that it was satisfied with the nature, extent and quality of the investment management services provided by PI and the subadvisory services provided to the Fund by QMA, and that there was a reasonable basis on which to conclude that the Fund benefits from the services provided by PI and QMA under the management and subadvisory agreements.
Performance of the Fund
The Board received and considered information about the Fund’s historical performance. The Board considered that the Fund’s gross performance in relation to its Peer Universe (the Lipper International Large-Cap Core Funds Performance Universe) was in the third quartile over the one-year period and in the fourth quartile over the three- and five-year periods. The Board also noted that the Fund underperformed its benchmark index for all periods. The Board considered PI’s assertion that essentially all of the Fund’s underperformance came from security selection, particularly among slower-growing stocks. The Board noted its concern with the Fund’s short-term and long-term performance record, and requested that PI and QMA report back to the Board with their views on strategic alternatives to address the Fund’s performance at the third quarter Board meeting scheduled for September 2010. The Board also instructed SIRG to provide quarterly updates on Fund performance. The Board noted that the Fund’s performance had improved, with the Fund ranking in the second quartile during the first quarter of 2010. The Board concluded that it was reasonable to renew the agreements, subject to its continued close scrutiny of the Fund’s performance and its consideration of PI’s and QMA’s presentation on strategic alternatives to address the Fund’s performance.
Fees and Expenses
The Board considered the Fund’s actual management fees (which reflects any subsidies, expense caps or waivers) ranked in the Expense Group’s second quartile and that the Fund’s total expenses ranked in the third quartile. The Board considered that the Fund’s total expenses were 6.5 basis points higher than the median for all funds included in the Expense Group. The Board concluded that the management fees and total expenses were reasonable in light of the services provided.
Prudential International Equity Fund
Approval of Advisory Agreements (continued)
Costs of Services and Profits Realized by PI
The Board was provided with information on the profitability of PI and its affiliates in serving as the Fund’s investment manager. The Board discussed with PI the methodology utilized in assembling the information regarding profitability and considered its reasonableness. The Board recognized that it is difficult to make comparisons of profitability from fund management contracts because comparative information is not generally publicly available and is affected by numerous factors, including the structure of the particular adviser, the types of funds it manages, its business mix, numerous assumptions regarding allocations and the adviser’s capital structure and cost of capital. The Board did not separately consider the profitability of the subadviser, an affiliate of PI, as its profitability was reflected in the profitability report for PI. Taking these factors into account, the Board concluded that the profitability of PI and its affiliates in relation to the services rendered was not unreasonable.
Economies of Scale
The Board noted that the management fee schedule for the Fund includes breakpoints, which have the effect of decreasing the fee rate as assets increase, and that at its current level of assets the Fund’s effective fee rate reflected some of those rate reductions. The Board received and discussed information concerning whether PI realizes economies of scale as the Fund’s assets grow beyond current levels. The Board took note that the Fund’s fee structure currently results in benefits to Fund shareholders whether or not PI realizes any economies of scale.
Other Benefits to PI and QMA
The Board considered potential ancillary benefits that might be received by PI and QMA and their affiliates as a result of their relationship with the Fund. The Board concluded that potential benefits to be derived by PI included brokerage commissions received by affiliates of PI, transfer agency fees received by the Fund’s transfer agent (which is affiliated with PI), and benefits to the reputation as well as other intangible benefits resulting from PI’s association with the Fund. The Board concluded that the potential benefits to be derived by QMA included its ability to use soft dollar credits, brokerage commissions received by affiliates of QMA, as well as the potential benefits consistent with those generally resulting from an increase in assets under management, specifically, potential access to additional research resources and benefits to the reputation. The Board concluded that the benefits derived by PI and QMA were consistent with the types of benefits generally derived by investment managers and subadvisers to mutual funds.
After full consideration of these factors, the Board concluded that the approval of the agreements was in the best interest of the Fund and its shareholders.
Visit our website at www.prudentialfunds.com
| n MAIL | n TELEPHONE | n WEBSITE | ||
Gateway Center Three 100 Mulberry Street Newark, NJ 07102 | (800) 225-1852 | www.prudentialfunds.com |
| PROXY VOTING |
| The Board of Directors of the Fund has delegated to the Fund’s investment subadviser the responsibility for voting any proxies and maintaining proxy recordkeeping with respect to the Fund. A description of these proxy voting policies and procedures is available without charge, upon request, by calling (800) 225-1852 or by visiting the Securities and Exchange Commission’s website at www.sec.gov. Information regarding how the Fund voted proxies relating to portfolio securities during the most recent 12-month period ended June 30 is available on the Fund’s website and on the Commission’s website. |
| DIRECTORS |
| Kevin J. Bannon • Scott E. Benjamin • Linda W. Bynoe • Michael S. Hyland • Douglas H. McCorkindale • Stephen P. Munn • Richard A. Redeker • Judy A. Rice • Robin B. Smith • Stephen G. Stoneburn |
| OFFICERS |
| Judy A. Rice, President • Scott E. Benjamin, Vice President • Grace C. Torres, Treasurer and Principal Financial and Accounting Officer • Kathryn L. Quirk, Chief Legal Officer • Deborah A. Docs, Secretary • Timothy J. Knierim, Chief Compliance Officer • Valerie M. Simpson, Deputy Chief Compliance Officer • Theresa C. Thompson, Deputy Chief Compliance Officer • Noreen M. Fierro, Anti-Money Laundering Compliance Officer • Jonathan D. Shain, Assistant Secretary • Claudia DiGiacomo, Assistant Secretary • John P. Schwartz, Assistant Secretary • Andrew R. French, Assistant Secretary • M. Sadiq Peshimam, Assistant Treasurer • Peter Parrella, Assistant Treasurer |
| MANAGER | Prudential Investments LLC | Gateway Center Three 100 Mulberry Street Newark, NJ 07102 | ||
| ||||
| INVESTMENT SUBADVISER | Quantitative Management Associates LLC | Gateway Center Two 100 Mulberry Street Newark, NJ 07102 | ||
| ||||
| DISTRIBUTOR | Prudential Investment Management Services LLC | Gateway Center Three 100 Mulberry Street | ||
| ||||
| CUSTODIAN | The Bank of New York Mellon | One Wall Street New York, NY 10286 | ||
| ||||
| TRANSFER AGENT | Prudential Mutual Fund Services LLC | PO Box 9658 Providence, RI 02940 | ||
| ||||
| INDEPENDENT REGISTERED PUBLIC ACCOUNTING FIRM | KPMG LLP | 345 Park Avenue New York, NY 10154 | ||
| ||||
| FUND COUNSEL | Sullivan & Cromwell LLP | 125 Broad Street New York, NY 10004 | ||
| An investor should consider the investment objectives, risks, charges, and expenses of the Fund carefully before investing. The prospectus for the Fund contains this and other information about the Fund. An investor may obtain a prospectus by visiting our website at www.prudentialfunds.com or by calling (800) 225-1852. The prospectus should be read carefully before investing. |
| E-DELIVERY |
| To receive your mutual fund documents online, go to www.prudentialfunds.com/edelivery and enroll. Instead of receiving printed documents by mail, you will receive notification via e-mail when new materials are available. You can cancel your enrollment or change your e-mail address at any time by visiting the website address above. |
| SHAREHOLDER COMMUNICATIONS WITH DIRECTORS |
| Shareholders can communicate directly with the Board of Directors by writing to the Chair of the Board, Prudential International Equity Fund, Prudential Investments, Attn: Board of Directors, 100 Mulberry Street, Gateway Center Three, Newark, NJ 07102. Shareholders can communicate directly with an individual Director by writing to the same address. Communications are not screened before being delivered to the addressee. |
| AVAILABILITY OF PORTFOLIO SCHEDULE |
| The Fund files its complete schedule of portfolio holdings with the Securities and Exchange Commission for the first and third quarters of each fiscal year on Form N-Q. The Fund’s Forms N-Q are available on the Commission’s website at www.sec.gov. The Fund’s Forms N-Q may also be reviewed and copied at the Commission’s Public Reference Room in Washington, D.C. Information on the operation and location of the Public Reference Room may be obtained by calling (202) 551-8090. The Fund’s schedule of portfolio holdings is also available on the Fund’s website as of the end of each fiscal quarter. |
| The Fund’s Statement of Additional Information contains additional information about the Fund’s Directors and is available without charge, upon request, by calling (800) 225-1852. |
Mutual Funds:
| ARE NOT INSURED BY THE FDIC OR ANY FEDERAL GOVERNMENT AGENCY | MAY LOSE VALUE | ARE NOT A DEPOSIT OF OR GUARANTEED BY ANY BANK OR ANY BANK AFFILIATE |

| Prudential International Equity Fund | ||||||||||||||||||||
| Share Class | A | B | C | F | L | M | X | Z | ||||||||||||
NASDAQ | PJRAX | PJRBX | PJRCX | N/A | DEILX | DEIMX | DEIQX | PJIZX | ||||||||||||
CUSIP | 743969859 | 743969867 | 743969875 | 743969842 | 743969834 | 743969826 | 743969818 | 743969883 | ||||||||||||
MF190E 0192559-00001-00

| ANNUAL REPORT | OCTOBER 31, 2010 |
Prudential International Value Fund
Fund Type International stock
Objective Long-term growth of capital
| This report is not authorized for distribution to prospective investors unless preceded or accompanied by a current prospectus.
The views expressed in this report and information about the Fund’s portfolio holdings are for the period covered by this report and are subject to change thereafter.
Prudential Investments, Prudential, the Prudential logo and the Rock symbol are service marks of Prudential Financial, Inc. and its related entities, registered in many jurisdictions worldwide.
|
| To enroll in e-delivery, go to www.prudentialfunds.com/edelivery |

December 15, 2010
Dear Shareholder:
We hope you find the annual report for the Prudential International Value Fund informative and useful. Because of ongoing market volatility, we understand that this is a difficult time to be an investor. While it is impossible to predict what the future holds, we continue to believe a prudent response to uncertainty is to maintain a diversified portfolio, including stock and bond mutual funds consistent with your tolerance for risk, time horizon, and financial goals.
A diversified asset allocation offers two potential advantages: It limits your exposure to any particular asset class; plus it provides a better opportunity to invest some of your assets in the right place at the right time. Your financial professional can help you create a diversified investment plan that may include mutual funds covering all the basic asset classes and that reflects your personal investor profile and risk tolerance. Keep in mind that diversification and asset allocation strategies do not assure a profit or protect against loss in declining markets.
Prudential Investments® provides a wide range of mutual funds to choose from that can help you make progress toward your financial goals. Our funds offer the experience, resources, and professional discipline of Prudential Financial’s affiliated asset managers. Most of Prudential Investments’ equity funds are advised by Jennison Associates LLC, Quantitative Management Associates LLC (QMA), or Prudential Real Estate Investors. Prudential Investment Management, Inc. (PIM) advises the Prudential Investments fixed income and money market funds through its Prudential Fixed Income unit. Jennison Associates, QMA, and PIM are registered investment advisers and Prudential Financial companies. Prudential Real Estate Investors is a unit of PIM.
Thank you for choosing the Prudential Investments family of mutual funds.
Sincerely,

Judy A. Rice, President
Prudential International Value Fund
| Prudential International Value Fund | 1 |
Your Fund’s Performance
Performance data quoted represent past performance. Past performance does not guarantee future results. The investment return and principal value of an investment will fluctuate, so that an investor’s shares, when redeemed, may be worth more or less than their original cost. Current performance may be lower or higher than the past performance data quoted. An investor may obtain performance data as of the most recent month-end by visiting our website at www.prudentialfunds.com or by calling (800) 225-1852. The maximum initial sales charge is 5.50% (Class A shares). Gross operating expenses: Class A, 1.71%; Class B, 2.41%; Class C, 2.41%; Class Z, 1.41%. Net operating expenses: Class A, 1.66%; Class B, 2.41%; Class C, 2.41%; Class Z, 1.41%, after contractual reduction through 2/29/2012.
| Cumulative Total Returns (Without Sales Charges) as of 10/31/10 | ||||||||||||
| One Year | Five Years | Ten Years | ||||||||||
Class A | 10.68 | % | 22.47 | % | 34.83 | % | ||||||
Class B | 9.92 | 17.84 | 24.82 | |||||||||
Class C | 9.91 | 17.88 | 24.97 | |||||||||
Class Z | 11.01 | 23.96 | 38.04 | |||||||||
MSCI EAFE® ND Index | 8.36 | 17.66 | 36.66 | |||||||||
Lipper Average | 10.34 | 16.07 | 30.60 | |||||||||
| Average Annual Total Returns (With Sales Charges) as of 9/30/10 | ||||||||||||
| One Year | Five Years | Ten Years | ||||||||||
Class A | –1.35 | % | 1.61 | % | 1.91 | % | ||||||
Class B | –1.44 | 1.80 | 1.69 | |||||||||
Class C | 2.61 | 1.97 | 1.70 | |||||||||
Class Z | 4.64 | 3.00 | 2.72 | |||||||||
MSCI EAFE® ND Index | 3.27 | 1.97 | 2.56 | |||||||||
Lipper Average | 3.88 | 1.66 | 1.77 | |||||||||
| Average Annual Total Returns (With Sales Charges) as of 10/31/10 | ||||||||||||
| One Year | Five Years | Ten Years | ||||||||||
Class A | 4.59 | % | 2.97 | % | 2.45 | % | ||||||
Class B | 4.92 | 3.18 | 2.24 | |||||||||
Class C | 8.91 | 3.34 | 2.25 | |||||||||
Class Z | 11.01 | 4.39 | 3.28 | |||||||||
| 2 | Visit our website at www.prudentialfunds.com |
| Average Annual Total Returns (Without Sales Charges) as of 10/31/10 | ||||||||||||
| One Year | Five Years | Ten Years | ||||||||||
Class A | 10.68 | % | 4.14 | % | 3.03 | % | ||||||
Class B | 9.92 | 3.34 | 2.24 | |||||||||
Class C | 9.91 | 3.34 | 2.25 | |||||||||
Class Z | 11.01 | 4.39 | 3.28 | |||||||||
Growth of a $10,000 Investment
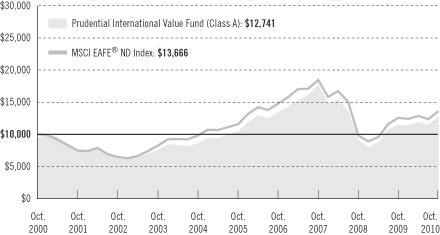
The graph compares a $10,000 investment in the Prudential International Value Fund (Class A shares) with a similar investment in the MSCI EAFE® ND Index by portraying the initial account values at the beginning of the 10-year period for Class A shares (October 31, 2000) and the account values at the end of the current fiscal year (October 31, 2010) as measured on a quarterly basis. For purposes of the graph, and unless otherwise indicated, it has been assumed that (a) the maximum applicable front-end sales charge was deducted from the initial $10,000 investment in Class A shares; (b) all recurring fees (including management fees) were deducted; and (c) all dividends and distributions were reinvested. The line graph provides information for Class A shares only. As indicated in the tables provided earlier, performance for Class B, Class C, and Class Z shares will vary due to the differing charges and expenses applicable to each share class (as indicated in the following paragraphs). Without the contractual distribution and service (12b-1) fee waiver of 0.05% for Class A shares in effect through February 29, 2012, the returns shown in the graph and for Class A shares in the tables would have been lower.
Source: Prudential Investments LLC and Lipper Inc. Performance figures may reflect fee waivers and/or expense reimbursements. In the absence of such fee waivers and/or expense reimbursements, total returns would be lower.
The average annual total returns take into account applicable sales charges. Class A shares are subject to a maximum front-end sales charge of 5.50%, a 12b-1 fee of up to 0.30% annually, and all investors who purchase Class A shares in an amount of $1 million or more and sell these shares within 12 months of purchase are
| Prudential International Value Fund | 3 |
Your Fund’s Performance (continued)
subject to a contingent deferred sales charge (CDSC) of 1%, in certain circumstances. Class B shares are subject to a declining CDSC of 5%, 4%, 3%, 2%, 1%, and 1%, respectively, for the first six years after purchase and a 12b-1 fee of 1% annually. Approximately seven years after purchase, Class B shares will automatically convert to Class A shares on a quarterly basis. Class C shares purchased are not subject to a front-end sales charge, but charge a CDSC of 1% for Class C shares sold within 12 months from the date of purchase, and an annual 12b-1 fee of 1%. Class Z shares are not subject to a sales charge or 12b-1 fees. The returns in the graph and tables reflect the share class expense structure in effect at the close of the fiscal period.
Benchmark Definitions
Morgan Stanley Capital International Europe, Australasia, and Far East ND Index
The Morgan Stanley Capital International Europe, Australasia, and Far East Index (MSCI EAFE® ND Index) is an unmanaged, weighted index of performance that reflects stock price movements of developed-country markets in Europe, Australasia, and the Far East. The ND version of the MSCI EAFE Index reflects the impact of the maximum withholding taxes on reinvested dividends.
Lipper International Large-Cap Core Funds Average
The Lipper International Large-Cap Core Funds Average (Lipper Average) represents returns based on an average return of all funds in the Lipper International Large-Cap Core Funds category. Funds in the Lipper Average invest at least 75% of their equity assets in companies strictly outside of the U.S. with market capitalizations (on a three-year weighted basis) above Lipper’s international large-cap floor. International large-cap core funds typically have average characteristics compared to their large-cap-specific subset of the MSCI EAFE Index.
Investors cannot invest directly in an index or average. The returns for the MSCI EAFE® ND Index and the Lipper Average would be lower if they included the effects of sales charges, operating expenses, or taxes. Returns for the Lipper Average reflect the deduction of operating expenses of a mutual fund, but not sales charges or taxes.
Five Largest Holdings expressed as a percentage of net assets as of 10/31/10 | ||||
Novartis AG, Pharmaceuticals | 2.1 | % | ||
LVMH Moet Hennessy Louis Vuitton SA, Diversified Operations | 1.5 | |||
BNP Paribas, Financial—Bank & Trust | 1.4 | |||
Volkswagen AG (PRFC Shares), Automobile Manufacturers | 1.4 | |||
Novo Nordisk A/S (Class B Stock), Pharmaceuticals | 1.3 |
Holdings reflect only long-term investments and are subject to change.
Five Largest Industries expressed as a percentage of net assets as of 10/31/10 | ||||
Pharmaceuticals | 9.5 | % | ||
Oil, Gas & Consumable Fuels | 8.6 | |||
Financial—Bank & Trust | 8.2 | |||
Telecommunications | 6.6 | |||
Insurance | 6.0 |
Industry weightings reflect only long-term investments and are subject to change.
| 4 | Visit our website at www.prudentialfunds.com |
Strategy and Performance Overview
How did the Fund perform?
For the 12-month reporting period ended October 31, 2010, the Prudential International Value Fund’s Class A shares posted a 10.68% return, outperforming the 8.36% return of the Morgan Stanley Capital International Europe, Australasia, and Far East Net Dividend Index (MSCI EAFE ND Index). The Fund also outperformed the 10.34% return of the Lipper International Large-Cap Core Funds Average.
How is the Fund managed?
LSV Asset Management (LSV) and Thornburg Investment Management, Inc. (Thornburg) are co-managers of the Fund. The Fund combines the distinct investment approaches of LSV International Value (deep value) and Thornburg International (relative value/core).
LSV’s active quantitative investment strategy is based on the firm’s research into value investing and behavioral finance. They believe that superior investment performance can be achieved by exploiting behavioral biases exhibited by other investors, including the tendency to extrapolate the past too far into the future, wrongly equating a good company with a good investment irrespective of price, ignoring statistical evidence and developing a “mindset” about a company. The objective of LSV’s purely quantitative modeling approach is to pick undervalued stocks with near-term appreciation potential.
Thornburg’s value-based investment approach seeks promising companies trading at a discount to what the investment manager believes is a company’s intrinsic value. The strategy looks to reduce portfolio total risk by exposing the portfolio to traditional, relative, and/or deep value stocks. The investment process utilizes quantitative screens to identify attractively valued stocks (using metrics such as price/earnings, price/forward earnings, and price to cash/flow) poised for fundamental improvement, such as earnings surprises or earnings revisions, relative to peers. Management then performs fundamental research, including visits with company management, peers, competitors, and suppliers, on companies deemed attractive by the screening process. However, Thornburg does reserve the right to circumvent the screening process and often does, in their search for value. The result of their fundamental analysis is an estimate of a company’s intrinsic value, which is compared to current valuations to identify attractive opportunities.
What were market conditions like for international stocks?
The Morgan Stanley Capital International Europe Australasia and Far East Index (MSCI EAFE Index), which measures developed markets, performance (excluding the United States and Canada), ended the reporting period with a net gain of 8.36%. The global economy continued to recover, boosted by stimulus efforts enacted in 2009 by a
| Prudential International Value Fund | 5 |
Strategy and Performance Overview (continued)
range of governments. Major central banks kept interest rates low as liquidity continued to flow into the global economy. A promising development was a strong rise in manufacturing activity.
The first quarter of 2010, the Index was virtually flat with a net return of nearly 1%, with the majority of countries in the Index showing losses. During the second quarter, fears about fiscal stability emanating from the euro zone debt crisis, and concerns about policy missteps, caused investors to sell off riskier assets. Subsequently, tighter financial conditions loomed as the euro’s slide and proposed austerity measures helped stall the rally in international equities. While this flight toward quality hit European markets most severely, all advanced nations were affected, as were emerging markets. Furthermore, slower growth in China over inflation fears negatively affected equities and heightened investors’ sensitivity to overall economic signals.
However, toward the end of the reporting period, international equities staged a widespread robust recovery as investors overcame their risk-aversion anxiety that had driven dismal returns in the second quarter. These results buoyed investor optimism over recent sovereign debt issues in the euro zone along with a conviction that a sluggish U.S. economy would not impede global growth. Both MSCI stock-style indexes rose. The MSCI-EAFE Growth Index experienced a 12.5% gain, exceeding the 5.2% gain for the Value Index.
Sector performance in the MSCI-EAFE Index, priced in U.S. dollars, was mixed. Four sectors experienced double-digit gains, while three sectors ended the reporting period in single digits, and three in low to moderate declines. Materials, supported by mining and metals, rose roughly 18%. Consumer discretionary recorded a double-digit gain, with durables and apparel and consumer services showing strength. Industrials followed closely on a very robust capital goods industry. Consumer staples rose in the low double digits supported by gains in the food and household goods industries. Telecommunication services rose as the wireless industry experienced stronger returns. Information technology, led by semiconductors, turned in a respectable gain. Healthcare was modest, and utilities tipped into nominally negative territory. Energy declined on weakness in the fuel industries. The financials sector declined the most pressured by losses in banks and diversified financial services.
What impact did the LSV strategy have on the Fund’s performance?
In the beginning of the reporting period, the rally in riskier assets from the third quarter of 2009 stalled as stocks entered into a correction. The LSV portion struggled out of the gate, underperformed for the first two months of the period, and then outperformed for the remainder of the period.
| 6 | Visit our website at www.prudentialfunds.com |
Moreover, growth stocks outperformed value stocks in international markets. Underperformance by companies with low price-to-book valuation multiples, particularly in the financial sector, pulled down value stocks. LSV was overweight in financial stocks, and concentrated in those with the most attractive valuations, which further detracted from relative performance early in the period.
During the rest of the period, beginning in January 2010, LSV outperformed the Index, as equity markets vacillated between risk-friendly rallies and risk-averse corrections. However, LSV’s deep value strategy could not compensate for its slow start, and this muted its overall performance for the reporting period.
What impact did Thornburg’s strategy have on the Fund’s performance?
The Thornburg portion of the Portfolio displayed consistent outperformance during the entire period. As a relative value/core strategy, Thornburg benefited from the tailwinds of higher value stocks outperforming lower value stocks and also from growth-style stocks outperforming value stocks in markets outside of the U.S. Overall, Thornburg handily outperformed the Index for the period. Allocations to countries not in the Index significantly boosted performance. Holdings in companies in Canada, Mexico, and South Korea helped performance, as these markets individually outperformed the return of the Index. Additionally, stock selection in the United Kingdom (UK) and Germany further enhanced relative performance, as Thornburg made good stock selections in the UK consumer discretionary sector and also among stocks of German automakers.
From time to time, Thornburg uses derivatives in the form of currency forwards as a hedging tool for risk management purposes. Thornburg does not expect a significant portion of the performance to come from currency hedging strategies. For the period ending October 31, 2010, currency hedging detracted slightly from results as Fund hedged on the Euro, British Pound, Brazilian Real and Mexican Peso. The main hedge was earlier in the period, as the fund’s hedge against the Mexican Peso detracted from results.
| Prudential International Value Fund | 7 |
Fees and Expenses (Unaudited)
As a shareholder of the Fund, you incur two types of costs: (1) transaction costs, including sales charges (loads) on purchase payments and redemptions, as applicable, and (2) ongoing costs, including management fees, distribution and/or service (12b-1) fees, and other Fund expenses, as applicable. This example is intended to help you understand your ongoing costs (in dollars) of investing in the Fund and to compare these costs with the ongoing costs of investing in other mutual funds.
The example is based on an investment of $1,000 invested on May 1, 2010, at the beginning of the period, and held through the six-month period ended October 31, 2010. The example is for illustrative purposes only; you should consult the Prospectus for information on initial and subsequent minimum investment requirements.
The Fund’s transfer agent may charge additional fees to holders of certain accounts that are not included in the expenses shown in the table on the following page. These fees apply to individual retirement accounts (IRAs) and Section 403(b) accounts. As of the close of the six-month period covered by the table, IRA fees included an annual maintenance fee of $15 per account (subject to a maximum annual maintenance fee of $25 for all accounts held by the same shareholder). Section 403(b) accounts are charged an annual $25 fiduciary maintenance fee. Some of the fees may vary in amount, or may be waived, based on your total account balance or the number of Prudential Investments funds, including the Fund, that you own. You should consider the additional fees that were charged to your Fund account over the six-month period when you estimate the total ongoing expenses paid over the period and the impact of these fees on your ending account value, as these additional expenses are not reflected in the information provided in the expense table. Additional fees have the effect of reducing investment returns.
Actual Expenses
The first line for each share class in the table on the following page provides information about actual account values and actual expenses. You may use the information on this line, together with the amount you invested, to estimate the expenses that you paid over the period. Simply divide your account value by $1,000 (for example, an $8,600 account value ÷ $1,000 = 8.6), then multiply the result by the number on the first line under the heading “Expenses Paid During the Six-Month Period” to estimate the expenses you paid on your account during this period.
Hypothetical Example for Comparison Purposes
The second line for each share class in the table on the following page provides information about hypothetical account values and hypothetical expenses based on the Fund’s actual expense ratio and an assumed rate of return of 5% per year before expenses, which is not the Fund’s actual return. The hypothetical account values and
| 8 | Visit our website at www.prudentialfunds.com |
expenses may not be used to estimate the actual ending account balance or expenses you paid for the period. You may use this information to compare the ongoing costs of investing in the Fund and other funds. To do so, compare this 5% hypothetical example with the 5% hypothetical examples that appear in the shareholder reports of the other funds.
Please note that the expenses shown in the table are meant to highlight your ongoing costs only and do not reflect any transactional costs such as sales charges (loads). Therefore, the second line for each share class in the table is useful in comparing ongoing costs only and will not help you determine the relative total costs of owning different funds. In addition, if these transactional costs were included, your costs would have been higher.
| Prudential International Value Fund | Beginning Account Value May 1, 2010 | Ending Account Value October 31, 2010 | Annualized Expense Ratio Based on the Six-Month Period | Expenses Paid During the Six-Month Period* | ||||||||||||||
| Class A | Actual | $ | 1,000.00 | $ | 1,069.60 | 1.73 | % | $ | 9.02 | |||||||||
| Hypothetical | $ | 1,000.00 | $ | 1,016.48 | 1.73 | % | $ | 8.79 | ||||||||||
| Class B | Actual | $ | 1,000.00 | $ | 1,066.00 | 2.48 | % | $ | 12.91 | |||||||||
| Hypothetical | $ | 1,000.00 | $ | 1,012.70 | 2.48 | % | $ | 12.58 | ||||||||||
| Class C | Actual | $ | 1,000.00 | $ | 1,065.90 | 2.48 | % | $ | 12.91 | |||||||||
| Hypothetical | $ | 1,000.00 | $ | 1,012.70 | 2.48 | % | $ | 12.58 | ||||||||||
| Class Z | Actual | $ | 1,000.00 | $ | 1,071.40 | 1.48 | % | $ | 7.73 | |||||||||
| Hypothetical | $ | 1,000.00 | $ | 1,017.74 | 1.48 | % | $ | 7.53 | ||||||||||
* Fund expenses (net of fee waivers or subsidies, if any) for each share class are equal to the annualized expense ratio for each share class (provided in the table), multiplied by the average account value over the period, multiplied by the 184 days in the six-month period ended October 31, 2010, and divided by the 365 days in the Fund’s fiscal year ended October 31, 2010 (to reflect the six-month period). Expenses presented in the table include the expenses of any underlying portfolios in which the Fund may invest.
| Prudential International Value Fund | 9 |
Portfolio of Investments
as of October 31, 2010
| Shares | Description | Value (Note 1) | ||||
LONG-TERM INVESTMENTS 97.5% |
| |||||
COMMON STOCKS 97.5% |
| |||||
Australia 4.6% |
| |||||
| 69,400 | Bendigo and Adelaide Bank Ltd. | $ | 615,224 | |||
| 49,152 | BHP Billiton Ltd. | 2,018,309 | ||||
| 129,488 | BlueScope Steel Ltd. | 253,045 | ||||
| 174,200 | Challenger Financial Services Group Ltd. | 784,931 | ||||
| 120,800 | Downer EDI Ltd. | 599,929 | ||||
| 534,100 | Emeco Holdings Ltd. | 465,627 | ||||
| 255,400 | Goodman Fielder Ltd. | 371,512 | ||||
| 196,700 | Metcash Ltd. | 841,998 | ||||
| 50,700 | National Australia Bank Ltd. | 1,264,421 | ||||
| 228,600 | OneSteel Ltd. | 604,596 | ||||
| 186,200 | Pacific Brands Ltd.* | 197,895 | ||||
| 147,778 | Tabcorp Holdings Ltd. | 1,068,296 | ||||
| 285,900 | Telstra Corp. Ltd. | 747,740 | ||||
| 9,833,523 | ||||||
Austria 0.5% |
| |||||
| 17,500 | OMV AG | 653,854 | ||||
| 12,000 | Voestalpine AG | 475,748 | ||||
| 1,129,602 | ||||||
Belgium 0.7% |
| |||||
| 69,000 | AGFA-Gevaert NV* | 402,385 | ||||
| 15,300 | Delhaize Group | 1,068,779 | ||||
| 9,876 | Dexia NV/SA* | 43,972 | ||||
| 1,515,136 | ||||||
Bermuda 0.4% |
| |||||
| 29,960 | Seadrill Ltd. | 907,507 | ||||
Brazil 1.8% |
| |||||
| 180,360 | BM&FBOVESPA SA | 1,504,149 | ||||
| 29,917 | Embraer-Empresa Brasileira de Aeronautica SA, ADR | 863,105 | ||||
| 54,700 | Natura Cosmeticos SA | 1,563,501 | ||||
| 3,930,755 | ||||||
Canada 2.3% |
| |||||
| 26,670 | Canadian National Railway Co. | 1,727,444 | ||||
| 41,500 | Canadian Natural Resources Ltd. | 1,510,830 | ||||
See Notes to Financial Statements.
| Prudential International Value Fund | 11 |
Portfolio of Investments
as of October 31, 2010 continued
| Shares | Description | Value (Note 1) | ||||
COMMON STOCKS (Continued) |
| |||||
Canada (cont’d.) |
| |||||
| 7,520 | Potash Corp. of Saskatchewan, Inc. | $ | 1,091,077 | |||
| 17,100 | Thomson Reuters Corp. | 653,049 | ||||
| 4,982,400 | ||||||
China 2.6% |
| |||||
| 40,415 | China Life Insurance Co. Ltd. (Class H Stock) | 177,015 | ||||
| 635,474 | China Merchants Bank Co. Ltd. (Class H Stock) | 1,803,635 | ||||
| 180,000 | Industrial & Commercial Bank of China Asia Ltd. | 666,473 | ||||
| 2,403,000 | Industrial & Commercial Bank of China Ltd. (Class H Stock) | 1,934,491 | ||||
| 271,199 | Sinopharm Group Co. (Class H Stock) | 1,065,378 | ||||
| 5,646,992 | ||||||
Denmark 2.1% | ||||||
| 16,200 | Danske Bank A/S* | 430,843 | ||||
| 28,700 | H. Lundbeck A/S | 573,132 | ||||
| 27,365 | Novo Nordisk A/S (Class B Stock) | 2,880,473 | ||||
| 20,216 | Vestas Wind Systems A/S* | 645,179 | ||||
| 4,529,627 | ||||||
Finland 0.5% | ||||||
| 56,700 | Nokia Oyj | 612,384 | ||||
| 29,000 | Tieto Oyj | 554,580 | ||||
| 1,166,964 | ||||||
France 10.2% | ||||||
| 11,946 | Air Liquide SA | 1,545,270 | ||||
| 27,100 | AXA SA | 493,351 | ||||
| 41,113 | BNP Paribas | 3,006,984 | ||||
| 11,400 | Casino Guichard Perrachon SA | 1,070,996 | ||||
| 5,600 | Ciments Francais SA | 514,646 | ||||
| 76,000 | Credit Agricole SA | 1,245,529 | ||||
| 20,900 | France Telecom SA | 502,218 | ||||
| 25,433 | Lafarge SA | 1,453,436 | ||||
| 9,000 | Lagardere SCA | 383,868 | ||||
| 20,075 | LVMH Moet Hennessy Louis Vuitton SA | 3,146,105 | ||||
| 19,124 | Publicis Groupe SA | 952,620 | ||||
| 10,200 | Rallye SA | 397,855 | ||||
| 9,800 | Renault SA* | 544,566 | ||||
| 27,700 | Sanofi-Aventis SA | 1,934,593 | ||||
| 18,300 | SCOR SE | 450,056 | ||||
See Notes to Financial Statements.
| 12 | Visit our website at www.prudentialfunds.com |
| Shares | Description | Value (Note 1) | ||||
COMMON STOCKS (Continued) |
| |||||
France (cont’d.) | ||||||
| 4,300 | Societe Generale | $ | 257,495 | |||
| 12,500 | Thales SA | 509,663 | ||||
| 34,700 | Total SA | 1,885,707 | ||||
| 56,700 | Vivendi | 1,617,373 | ||||
| 21,912,331 | ||||||
Germany 8.4% | ||||||
| 12,200 | Allianz SE | 1,528,884 | ||||
| 6,900 | Aurubis AG | 354,944 | ||||
| 15,300 | BASF SE | 1,113,285 | ||||
| 37,600 | Deutsche Bank AG | 2,167,590 | ||||
| 39,800 | E.ON AG | 1,246,364 | ||||
| 27,828 | Fresenius Medical Care AG & Co. KGaA | 1,772,728 | ||||
| 9,100 | Hannover Rueckversicherung AG | 460,389 | ||||
| 7,600 | MTU Aero Engines Holding AG | 459,074 | ||||
| 5,600 | Muenchener Rueckversicherungs-Gesellschaft AG | 875,670 | ||||
| 6,000 | Rheinmetall AG | 432,240 | ||||
| 15,500 | RWE AG | 1,111,011 | ||||
| 46,539 | SAP AG | 2,427,057 | ||||
| 7,300 | Suedzucker AG | 172,723 | ||||
| 17,300 | ThyssenKrupp AG | 636,630 | ||||
| 19,317 | Volkswagen AG (PRFC Shares) | 2,903,640 | ||||
| 2,400 | Vossloh AG | 279,586 | ||||
| 17,941,815 | ||||||
Guernsey 0.5% | ||||||
| 37,544 | Amdocs Ltd.* | 1,151,850 | ||||
Hong Kong 2.8% | ||||||
| 662,720 | Chaoda Modern Agriculture Holdings Ltd. | 540,350 | ||||
| 1,057,117 | CNOOC Ltd. | 2,190,266 | ||||
| 110,148 | Hong Kong Exchanges and Clearing Ltd. | 2,424,286 | ||||
| 122,500 | Kingboard Chemical Holdings Ltd. | 595,807 | ||||
| 88,000 | Yue Yuen Industrial Holdings Ltd. | 315,614 | ||||
| 6,066,323 | ||||||
Ireland 0.5% | ||||||
| 43,400 | Allied Irish Banks PLC* | 20,356 | ||||
| 62,300 | Bank of Ireland* | 46,216 | ||||
See Notes to Financial Statements.
| Prudential International Value Fund | 13 |
Portfolio of Investments
as of October 31, 2010 continued
| Shares | Description | Value (Note 1) | ||||
COMMON STOCKS (Continued) |
| |||||
Ireland (cont’d.) | ||||||
| 23,700 | Covidien PLC | $ | 944,919 | |||
| 32,900 | Irish Life & Permanent Group Holdings PLC* | 69,602 | ||||
| 1,081,093 | ||||||
Israel 1.7% | ||||||
| 131,500 | Bank Hapoalim BM* | 596,461 | ||||
| 9,400 | Elbit Systems Ltd. | 502,385 | ||||
| 48,214 | Teva Pharmaceutical Industries Ltd., ADR | 2,502,307 | ||||
| 3,601,153 | ||||||
Italy 2.8% | ||||||
| 30,300 | Banco Popolare Scarl | 162,889 | ||||
| 281,600 | Enel SpA | 1,607,905 | ||||
| 67,100 | ENI SpA | 1,511,989 | ||||
| 32,100 | Finmeccanica SpA | 448,111 | ||||
| 11,700 | Fondiaria-SAI SpA | 138,985 | ||||
| 309,980 | Intesa Sanpaolo SpA | 1,090,446 | ||||
| 617,900 | Telecom Italia SpA | 947,718 | ||||
| 5,908,043 | ||||||
Japan 15.5% | ||||||
| 2,400 | Aeon Credit Service Co. Ltd. | 27,618 | ||||
| 17,673 | Alpine Electronics, Inc. | 221,379 | ||||
| 15 | Alps Electric Co. Ltd. | 134 | ||||
| 24,000 | Aoyama Trading Co. Ltd. | 390,406 | ||||
| 23,900 | Astellas Pharma, Inc. | 889,233 | ||||
| 31,697 | Canon, Inc. | 1,465,302 | ||||
| 20,600 | Circle K Sunkus Co. Ltd. | 292,348 | ||||
| 47,400 | COMSYS Holdings Corp. | 421,163 | ||||
| 669 | Dai-ichi Life Insurance Co. Ltd. (The) | 811,413 | ||||
| 9,697 | Fanuc Ltd. | 1,403,878 | ||||
| 80,000 | Fukuoka Financial Group, Inc. | 311,172 | ||||
| 18,400 | Fuyo General Lease Co. Ltd. | 522,709 | ||||
| 45,600 | Heiwa Corp. | 574,604 | ||||
| 27,000 | Hitachi Capital Corp. | 359,687 | ||||
| 19,700 | Itochu Techno-Solutions Corp. | 672,008 | ||||
| 122,194 | JX Holdings, Inc. | 718,252 | ||||
| 160 | KDDI Corp. | 861,936 | ||||
| 27,800 | Keihin Corp. | 592,482 | ||||
| 94,645 | Komatsu Ltd. | 2,319,373 | ||||
See Notes to Financial Statements.
| 14 | Visit our website at www.prudentialfunds.com |
| Shares | Description | Value (Note 1) | ||||
COMMON STOCKS (Continued) |
| |||||
Japan (cont’d.) | ||||||
| 13,600 | Konami Corp. | $ | 239,652 | |||
| 105,600 | Kurabo Industries Ltd. | 162,724 | ||||
| 43,000 | Kyorin Holdings, Inc. | 671,157 | ||||
| 54,000 | Kyowa Exeo Corp. | 475,780 | ||||
| 209,000 | Marubeni Corp. | 1,314,204 | ||||
| 17,300 | Miraca Holdings, Inc. | 622,602 | ||||
| 12,400 | Mitsubishi Corp. | 298,173 | ||||
| 329,800 | Mitsubishi UFJ Financial Group, Inc. | 1,536,908 | ||||
| 18,900 | Mitsui & Co. Ltd. | 297,111 | ||||
| 524,700 | Mizuho Financial Group, Inc. | 762,892 | ||||
| 32,800 | Namco Bandai Holdings, Inc. | 302,443 | ||||
| 113,000 | Nichirei Corp. | 492,892 | ||||
| 48,000 | Nippon Shokubai Co. Ltd. | 453,337 | ||||
| 23,000 | Nippon Telegraph & Telephone Corp. | 1,044,675 | ||||
| 166,000 | Nishi-Nippon City Bank Ltd. (The) | 453,834 | ||||
| 62,000 | Nissan Shatai Co. Ltd. | 482,316 | ||||
| 600 | NTT DoCoMo, Inc. | 1,010,314 | ||||
| 7,200 | Sankyo Co. Ltd. | 383,845 | ||||
| 105,000 | Sankyu, Inc. | 441,034 | ||||
| 83,000 | Sanwa Holdings Corp. | 237,231 | ||||
| 10,500 | Seiko Epson Corp. | 167,410 | ||||
| 43,000 | Seino Holdings Co. Ltd. | 262,371 | ||||
| 19,200 | Shimachu Co. Ltd. | 394,403 | ||||
| 54,000 | Shizuoka Gas Co. Ltd. | 316,739 | ||||
| 118,900 | Sumitomo Corp. | 1,507,121 | ||||
| 37,700 | Sumitomo Mitsui Financial Group, Inc. | 1,130,016 | ||||
| 24,000 | Sumitomo Trust & Banking Co. Ltd. (The) | 131,527 | ||||
| 31,500 | Takeda Pharmaceutical Co. Ltd. | 1,475,767 | ||||
| 111,000 | Toagosei Co. Ltd. | 486,927 | ||||
| 35,200 | Toppan Forms Co. Ltd. | 312,763 | ||||
| 53,270 | Toyota Motor Corp. | 1,892,618 | ||||
| 23,500 | Toyota Tsusho Corp. | 364,751 | ||||
| 61,000 | Yokohama Rubber Co. Ltd. (The) | 305,493 | ||||
| 33,286,127 | ||||||
Luxembourg 0.7% |
| |||||
| 44,300 | ArcelorMittal | 1,423,970 | ||||
See Notes to Financial Statements.
| Prudential International Value Fund | 15 |
Portfolio of Investments
as of October 31, 2010 continued
| Shares | Description | Value (Note 1) | ||||
COMMON STOCKS (Continued) |
| |||||
Mexico 1.5% | ||||||
| 27,013 | America Movil SAB de CV (Class L Stock), ADR | $ | 1,546,765 | |||
| 611,956 | Wal-Mart de Mexico SAB de CV (Class V Stock) | 1,675,098 | ||||
| 3,221,863 | ||||||
Netherlands 3.3% | ||||||
| 39,600 | Aegon NV* | 250,996 | ||||
| 30,000 | Brit Insurance Holdings NV* | 502,339 | ||||
| 12,257 | CSM NV | 388,101 | ||||
| 157,600 | ING Groep NV, CVA* | 1,682,406 | ||||
| 41,100 | Koninklijke Ahold NV | 568,029 | ||||
| 17,500 | Koninklijke DSM NV | 935,782 | ||||
| 17,566 | Koninklijke Philips Electronics NV | 531,266 | ||||
| 7,400 | Nutreco NV | 538,452 | ||||
| 23,469 | Schlumberger Ltd. | 1,640,248 | ||||
| 7,037,619 | ||||||
New Zealand 0.3% | ||||||
| 590,300 | Air New Zealand Ltd. | 607,522 | ||||
Norway 0.4% | ||||||
| 43,600 | DnB NOR ASA | 598,545 | ||||
| 15,500 | Statoil ASA | 338,499 | ||||
| 937,044 | ||||||
Singapore 0.2% | ||||||
| 235,970 | M1 Ltd. | 404,739 | ||||
South Korea 0.8% | ||||||
| 10,943 | Hyundai Motor Co. | 1,653,241 | ||||
Spain 3.4% | ||||||
| 60,459 | Banco Bilbao Vizcaya Argentaria SA | 795,192 | ||||
| 42,000 | Banco Espanol de Credito SA | 421,175 | ||||
| 155,100 | Banco Santander SA | 1,992,690 | ||||
| 42,800 | Repsol YPF SA | 1,186,920 | ||||
| 102,900 | Telefonica SA | 2,778,410 | ||||
| 7,174,387 | ||||||
See Notes to Financial Statements.
| 16 | Visit our website at www.prudentialfunds.com |
| Shares | Description | Value (Note 1) | ||||
COMMON STOCKS (Continued) |
| |||||
Sweden 1.9% | ||||||
| 66,700 | Boliden AB | $ | 1,132,362 | |||
| 58,416 | Hennes & Mauritz AB (Class B Stock) | 2,058,660 | ||||
| 11,700 | Meda AB | 96,162 | ||||
| 11,700 | NCC AB (Class B Stock) | 249,601 | ||||
| 34,900 | Svenska Cellulosa AB SCA (Class B Stock) | 541,292 | ||||
| 4,078,077 | ||||||
Switzerland 6.6% | ||||||
| 9,400 | Baloise Holding AG | 868,787 | ||||
| 29,784 | Clariant AG* | 503,639 | ||||
| 27,100 | Credit Suisse Group AG | 1,119,470 | ||||
| 1,200 | Georg Fischer AG* | 514,608 | ||||
| 25,633 | Julius Baer Group Ltd. | 1,082,054 | ||||
| 41,938 | Logitech International SA* | 795,247 | ||||
| 34,800 | Nestle SA | 1,906,123 | ||||
| 77,067 | Novartis AG | 4,467,936 | ||||
| 13,400 | Swiss Reinsurance Co. Ltd. | 644,093 | ||||
| 1,310 | Swisscom AG | 547,270 | ||||
| 2,900 | Verwaltungs-und Privat-Bank AG | 315,035 | ||||
| 5,300 | Zurich Financial Services AG | 1,297,464 | ||||
| 14,061,726 | ||||||
Turkey 0.5% | ||||||
| 180,700 | Turkiye Garanti Bankasi A/S | 1,108,628 | ||||
United Kingdom 19.5% | ||||||
| 166,400 | ARM Holdings PLC | 968,676 | ||||
| 40,200 | AstraZeneca PLC | 2,015,862 | ||||
| 128,300 | Aviva PLC | 818,424 | ||||
| 182,100 | BAE Systems PLC | 1,005,798 | ||||
| 180,281 | Barclays PLC | 793,250 | ||||
| 158,557 | Beazley PLC | 306,657 | ||||
| 67,844 | BG Group PLC | 1,321,375 | ||||
| 168,300 | BP PLC | 1,148,285 | ||||
| 58,896 | British American Tobacco PLC | 2,246,066 | ||||
| 109,752 | British Sky Broadcasting Group PLC | 1,242,466 | ||||
| 441,200 | BT Group PLC | 1,086,599 | ||||
| 87,740 | Cairn Energy PLC* | 542,540 | ||||
| 47,873 | Carnival PLC | 2,063,491 | ||||
| 62,100 | Dairy Crest Group PLC | 368,572 | ||||
See Notes to Financial Statements.
| Prudential International Value Fund | 17 |
Portfolio of Investments
as of October 31, 2010 continued
| Shares | Description | Value (Note 1) | ||||
COMMON STOCKS (Continued) |
| |||||
United Kingdom (cont’d.) | ||||||
| 91,800 | Davis Service Group PLC | $ | 611,627 | |||
| 88,700 | Drax Group PLC | 541,086 | ||||
| 219,700 | DS Smith PLC | 591,776 | ||||
| 63,400 | GlaxoSmithKline PLC | 1,240,408 | ||||
| 208,700 | Home Retail Group PLC | 732,363 | ||||
| 36,500 | IMI PLC | 461,748 | ||||
| 116,000 | Intermediate Capital Group PLC | 600,000 | ||||
| 381,716 | Kingfisher PLC | 1,454,494 | ||||
| 422,600 | Legal & General Group PLC | 679,865 | ||||
| 260,700 | Logica PLC | 540,967 | ||||
| 103,100 | Marston’s PLC | 166,360 | ||||
| 66,200 | Meggitt PLC | 350,157 | ||||
| 152,500 | Melrose PLC | 688,361 | ||||
| 18,400 | NEXT PLC | 673,696 | ||||
| 200,998 | Northern Foods PLC | 152,179 | ||||
| 344,400 | Old Mutual PLC | 716,856 | ||||
| 68,634 | Pearson PLC | 1,049,724 | ||||
| 30,291 | Reckitt Benckiser Group PLC | 1,694,428 | ||||
| 88,700 | Royal Dutch Shell PLC (Class B Stock) | 2,840,452 | ||||
| 211,587 | RSA Insurance Group PLC | 444,140 | ||||
| 39,618 | SABMiller PLC | 1,284,563 | ||||
| 88,600 | Smith & Nephew PLC | 779,410 | ||||
| 23,541 | Spectris PLC | 425,872 | ||||
| 74,309 | Standard Chartered PLC | 2,149,803 | ||||
| 62,077 | Tate & Lyle PLC | 499,338 | ||||
| 338,079 | Tesco PLC | 2,312,348 | ||||
| 120,000 | Thomas Cook Group PLC | 347,840 | ||||
| 107,000 | Tullett Prebon PLC | 678,951 | ||||
| 409,900 | Vodafone Group PLC | 1,115,586 | ||||
| 41,752,459 | ||||||
United States 0.5% | ||||||
| 25,990 | Southern Copper Corp. | 1,112,372 | ||||
Total common stocks | 209,164,888 | |||||
See Notes to Financial Statements.
| 18 | Visit our website at www.prudentialfunds.com |
| Units | Description | Value (Note 1) | ||||
RIGHTS* | ||||||
Belgium | ||||||
| 7,200 | AGFA-Gevaert NV, expiring 11/04/10 | $ | 2,415 | |||
United Kingdom |
| |||||
| 9,288 | Standard Chartered PLC - NPR, expiring 11/05/10 | 78,209 | ||||
Total rights | 80,624 | |||||
Total long-term investments | 209,245,512 | |||||
| Shares | ||||||
SHORT-TERM INVESTMENT 1.6% | ||||||
Affiliated Money Market Mutual Fund | ||||||
| 3,465,829 | Prudential Investment Portfolios 2 - Prudential Core Taxable | 3,465,829 | ||||
Total Investments 99.1% | 212,711,341 | |||||
Other assets in excess of liabilities(b) 0.9% | 1,827,367 | |||||
Net Assets 100% | $ | 214,538,708 | ||||
The following abbreviations are used in the Portfolio descriptions:
ADR—American Depositary Receipt
CVA—Certificate Van Aandelen
NPR—Nil Paid Rights
PRFC—Preference Shares
AUD—Australian Dollar
EUR—Euro
GBP—British Pound
JPY—Japanese Yen
MXN—Mexican Peso
SEK—Swedish Krona
| * | Non-income producing security. |
| (a) | Prudential Investments LLC, the manager of the Portfolio, also serves as manager of the Prudential Investment Portfolios 2 - Prudential Core Taxable Money Market Fund. |
| (b) | Other assets in excess of liabilities includes net unrealized appreciation (depreciation) on forward foreign currency exchange contracts as follows: |
See Notes to Financial Statements.
| Prudential International Value Fund | 19 |
Portfolio of Investments
as of October 31, 2010 continued
Forward foreign currency exchange contracts outstanding at October 31, 2010:
Purchase Contracts | Counterparty | Notional Amount (000) | Value at Settlement Date Payable | Current Value | Unrealized Appreciation | |||||||||||||||||
Australian Dollar, | UBS Securities | AUD | 2 | $ | 1,779 | $ | 1,780 | $ | 1 | |||||||||||||
British Pound, | Morgan Stanley | GBP | 2,099 | 3,235,334 | 3,362,207 | 126,873 | ||||||||||||||||
Euro, | State Street Bank | EUR | 3,727 | 5,069,202 | 5,181,414 | 112,212 | ||||||||||||||||
Japanese Yen, | UBS Securities | JPY | 2,615 | 32,475 | 32,495 | 20 | ||||||||||||||||
Swedish Krona, | UBS Securities | SEK | 38 | 5,737 | 5,751 | 14 | ||||||||||||||||
| $ | 8,344,527 | $ | 8,583,647 | $ | 239,120 | |||||||||||||||||
Sale Contracts | Counterparty | Notional Amount (000) | Value at Settlement Date Receivable | Current Value | Unrealized Depreciation | |||||||||||||||||
British Pound, | Morgan Stanley | GBP | 1,118 | $ | 1,625,253 | $ | 1,791,169 | $ | (165,916 | ) | ||||||||||||
Expiring 11/18/10 | Morgan Stanley | GBP | 981 | 1,415,849 | 1,571,038 | (155,189 | ) | |||||||||||||||
Euro, | State Street Bank | EUR | 3,727 | 4,793,476 | 5,181,414 | (387,938 | ) | |||||||||||||||
Mexican Peso, | State Street Bank | MXN | 29,296 | 2,210,767 | 2,367,497 | (156,730 | ) | |||||||||||||||
Expiring 11/30/10 | State Street Bank | MXN | 5,872 | 473,042 | 474,539 | (1,497 | ) | |||||||||||||||
| $ | 10,518,387 | $ | 11,385,657 | $ | (867,270 | ) | ||||||||||||||||
The industry classification of investments and other assets in excess of liabilities shown as a percentage of net assets as of October 31, 2010 were as follows:
Pharmaceuticals | 9.5 | % | ||
Oil, Gas & Consumable Fuels | 8.6 | |||
Financial—Bank & Trust | 8.2 | |||
Telecommunications | 6.6 | |||
Insurance | 6.0 | |||
Food & Beverage | 5.2 | |||
Banks | 5.0 | |||
Metals & Mining | 3.7 |
See Notes to Financial Statements.
| 20 | Visit our website at www.prudentialfunds.com |
| Industry (cont’d.) | ||||
Automobile Manufacturers | 3.6 | % | ||
Diversified Financial Services | 3.0 | |||
Retail & Merchandising | 2.8 | |||
Computer Services & Software | 2.5 | |||
Media & Entertainment | 2.4 | |||
Chemicals | 2.3 | |||
Entertainment & Leisure | 2.2 | |||
Utilities | 1.9 | |||
Aerospace | 1.7 | |||
Affiliated Money Market Mutual Fund | 1.6 | |||
Diversified Operations | 1.6 | |||
Electronic Components & Equipment | 1.5 | |||
Transportation | 1.1 | |||
Machinery—Construction & Mining | 1.1 | |||
Tobacco | 1.0 | |||
Building Materials | 1.0 | |||
Distribution/Wholesale | 1.0 | |||
Retail | 1.0 | |||
Consumer Products & Services | 0.9 | |||
Healthcare—Services | 0.8 | |||
Office Equipment | 0.8 | |||
Cosmetics & Toiletries | 0.7 | |||
Construction & Engineering | 0.7 | |||
Financial Services | 0.7 | |||
Commercial Services | 0.7 | |||
Automotive Parts | 0.6 | |||
Oil & Gas | 0.6 | |||
Business Services | 0.6 | |||
Beverages | 0.6 | |||
Forest & Paper Products | 0.6 | |||
Miscellaneous Manufacturing | 0.5 | |||
Healthcare Products | 0.5 | |||
Semiconductors | 0.4 | |||
Advertising | 0.4 | |||
Medical Supplies & Equipment | 0.4 | |||
Airlines | 0.3 | |||
Commercial Banks | 0.3 | |||
Agriculture | 0.3 | |||
Independent Power Producers & Energy Traders | 0.2 | |||
Aerospace/Defense | 0.2 | |||
Diversified Manufacturing | 0.2 | |||
Machinery & Equipment | 0.2 | |||
Gas Distribution | 0.2 | |||
Apparel | 0.1 | |||
Toys | 0.1 | |||
Electronics | 0.1 | |||
Engineering & Construction | 0.1 |
See Notes to Financial Statements.
| Prudential International Value Fund | 21 |
Portfolio of Investments
as of October 31, 2010 continued
| Industry (cont’d.) | ||||
Clothing & Apparel | 0.1 | % | ||
Food | 0.1 | |||
| 99.1 | ||||
Other assets in excess of liabilities | 0.9 | |||
| 100.0 | % | |||
Various inputs are used in determining the value of the Fund's investments. These inputs are summarized in the three broad levels listed below.
Level 1—quoted prices in active markets for identical securities, generally for stocks and mutual funds with daily NAVs
Level 2—other significant observable inputs (including quoted prices for similar securities, interest rates, prepayment speeds, credit risk, etc., and amortized cost), generally for foreign stocks priced through vendor modeling tools and debt securities
Level 3—significant unobservable inputs (including the Fund’s own assumptions in determining the fair value of investments)
The following is a summary of the inputs used as of October 31, 2010 in valuing the Fund's assets carried at fair value:
| Level 1 | Level 2 | Level 3 | ||||||||||
Investments in Securities | ||||||||||||
Common Stocks: | ||||||||||||
Australia | $ | 9,833,523 | $ | — | $ | — | ||||||
Austria | 1,129,602 | — | — | |||||||||
Belgium | 1,515,136 | — | — | |||||||||
Bermuda | 907,507 | — | — | |||||||||
Brazil | 3,930,755 | — | — | |||||||||
Canada | 4,982,400 | — | — | |||||||||
China | 5,646,992 | — | — | |||||||||
Denmark | 4,529,627 | — | — | |||||||||
Finland | 1,166,964 | — | — | |||||||||
France | 21,912,331 | — | — | |||||||||
Germany | 17,941,815 | — | — | |||||||||
Guernsey | 1,151,850 | — | — | |||||||||
Hong Kong | 6,066,323 | — | — | |||||||||
Ireland | 1,081,093 | — | — | |||||||||
See Notes to Financial Statements.
| 22 | Visit our website at www.prudentialfunds.com |
| Level 1 | Level 2 | Level 3 | ||||||||||
Israel | $ | 3,601,153 | $ | — | $ | — | ||||||
Italy | 5,908,043 | — | — | |||||||||
Japan | 33,286,127 | — | — | |||||||||
Luxembourg | 1,423,970 | — | — | |||||||||
Mexico | 3,221,863 | — | — | |||||||||
Netherlands | 7,037,619 | — | — | |||||||||
New Zealand | 607,522 | — | — | |||||||||
Norway | 937,044 | — | — | |||||||||
Singapore | 404,739 | — | — | |||||||||
South Korea | 1,653,241 | — | — | |||||||||
Spain | 7,174,387 | — | — | |||||||||
Sweden | 4,078,077 | — | — | |||||||||
Switzerland | 14,061,726 | — | — | |||||||||
Turkey | 1,108,628 | — | — | |||||||||
United Kingdom | 41,752,459 | — | — | |||||||||
United States | 1,112,372 | — | — | |||||||||
Rights: | ||||||||||||
Belgium | 2,415 | — | — | |||||||||
United Kingdom | 78,209 | — | — | |||||||||
Affiliated Money Market Mutual Fund | 3,465,829 | — | — | |||||||||
Other Financial Instruments* | ||||||||||||
Foreign Forward Currency Exchange Contracts | — | (628,150 | ) | — | ||||||||
Total | $ | 212,711,341 | $ | (628,150 | ) | $ | — | |||||
| * | Other financial instruments are derivative instruments not reflected in the Schedule of Investments, such as futures, forwards and swap contracts, which are valued at the unrealized appreciation/depreciation on the instrument. |
The Fair Value of Level 2 investments at 10/31/09 was $160,882,467. $142,432,806 was transferred out of Level 2 into Level 1 at 10/31/10 as a result of no longer using third-party vendor modeling tools due to the lack of significant market movements between the time at which the Fund valued its securities and the earlier closing of foreign markets.
It is the Fund’s policy to recognize transfers in and transfers out at the fair value as of the beginning of the period.
The Fund invested in various derivative instruments during the reporting period. The primary types of risk associated with these derivative instruments were equity risk and foreign exchange risk. The effect of such derivative instruments on the Fund’s financial position and financial performance as reflected in the Statement of Assets and Liabilities and Statement of Operations is presented in the following summary.
See Notes to Financial Statements.
| Prudential International Value Fund | 23 |
Portfolio of Investments
as of October 31, 2010 continued
Fair values of derivative instruments as of October 31, 2010 as presented in the Statement of Assets and Liabilities:
Derivatives not accounted for | Asset Derivatives | Liability Derivatives | ||||||||||
Balance | Fair Value | Balance | Fair Value | |||||||||
| Foreign exchange contracts | Unrealized appreciation on foreign currency forward contracts | $ | 239,120 | Unrealized depreciation on foreign currency forward contracts | $ | 867,270 | ||||||
| Equity contracts | Unaffiliated investments | 80,624 | — | — | ||||||||
Total | $ | 319,744 | $ | 867,270 | ||||||||
The effects of derivative instruments on the Statement of Operations for the year ended October 31, 2010 are as follows:
Amount of Realized Gain or (Loss) on Derivatives Recognized in Income | ||||||||||||||||
Derivatives not accounted | Rights | Warrants | Forward Currency Contracts | Total | ||||||||||||
Foreign exchange contracts | $ | — | $ | — | $ | 91,429 | $ | 91,429 | ||||||||
Equity contracts | (493,548 | ) | 4,966 | — | (488,582 | ) | ||||||||||
Total | $ | (493,548 | ) | $ | 4,966 | $ | 91,429 | $ | (397,153 | ) | ||||||
Change in Unrealized Appreciation or (Depreciation) on Derivatives Recognized in Income | ||||||||||||
Derivatives not accounted for as hedging | Rights | Forward Currency Contracts | Total | |||||||||
Foreign exchange contracts | $ | — | $ | (592,480 | ) | $ | (592,480 | ) | ||||
Equity contracts | 59,238 | — | 59,238 | |||||||||
Total | $ | 59,238 | $ | (592,480 | ) | $ | (533,242 | ) | ||||
For the year ended October 31, 2010, the Series’ average volume of derivative activities are as follows:
| Forward Currency Contracts-Purchased (Value at Settlement Date Payable) | Forward Currency Contracts-Sold (Value at Settlement Date Receivable) | |||||
| $ | 3,106,749 | $ | 9,011,123 | |||
See Notes to Financial Statements.
| 24 | Visit our website at www.prudentialfunds.com |
Financial Statements
| OCTOBER 31, 2010 | ANNUAL REPORT |
Prudential International Value Fund
Statement of Assets and Liabilities
as of October 31, 2010
Assets | ||||
Investments at value: | ||||
Unaffiliated investments (cost $190,405,666) | $ | 209,245,512 | ||
Affiliated investments (cost $3,465,829) | 3,465,829 | |||
Cash | 1,080,654 | |||
Foreign currency, at value (cost $614,780) | 619,229 | |||
Dividends and interest receivable | 1,122,497 | |||
Receivable for Series shares sold | 492,351 | |||
Unrealized appreciation on foreign currency forward contracts | 239,120 | |||
Receivable for investments sold | 169,955 | |||
Prepaid expenses | 3,494 | |||
Total assets | 216,438,641 | |||
Liabilities | ||||
Unrealized depreciation on foreign currency forward contracts | 867,270 | |||
Payable for investments purchased | 510,912 | |||
Advisory fee payable | 180,006 | |||
Accrued expenses | 171,342 | |||
Payable for Series shares redeemed | 110,293 | |||
Affiliated transfer agent fee payable | 39,390 | |||
Distribution fee payable | 18,031 | |||
Deferred directors’ fee | 2,689 | |||
Total liabilities | 1,899,933 | |||
Net assets | $ | 214,538,708 | ||
Net assets were comprised of: | ||||
Common stock, at par value | $ | 105,470 | ||
Paid-in capital in excess of par | 223,650,576 | |||
| 223,756,046 | ||||
Undistributed net investment income | 2,707,642 | |||
Accumulated net realized loss on investment and foreign currency transactions | (30,211,423 | ) | ||
Net unrealized appreciation on investments and foreign currencies | 18,286,443 | |||
Net assets, October 31, 2010 | $ | 214,538,708 | ||
See Notes to Financial Statements.
| 26 | Visit our website at www.prudentialfunds.com |
Class A: | ||||
Net asset value and redemption price per share | $ | 20.29 | ||
Maximum sales charge (5.5% of offering price) | 1.18 | |||
Offering price per share | $ | 21.47 | ||
Class B: | ||||
Net asset value, offering price and redemption price per share | $ | 19.37 | ||
Class C: | ||||
Net asset value, offering price and redemption price per share | $ | 19.40 | ||
Class Z: | ||||
Net asset value, offering price and redemption price per share | $ | 20.42 | ||
See Notes to Financial Statements.
| Prudential International Value Fund | 27 |
Statement of Operations
Year Ended October 31, 2010
Net Investment Income | ||||
Investment Income | ||||
Unaffiliated dividend income (net of foreign withholding tax of $507,759) | $ | 5,464,998 | ||
Affiliated dividend income | 7,427 | |||
Total income | 5,472,425 | |||
Expenses | ||||
Advisory fee | 1,937,242 | |||
Distribution fee—Class A | 111,566 | |||
Distribution fee—Class B | 33,145 | |||
Distribution fee—Class C | 67,604 | |||
Transfer agent’s fee and expenses (including affiliated expense of $235,900) | 311,000 | |||
Custodian’s fees and expenses | 248,000 | |||
Registration fees | 51,000 | |||
Reports to shareholders | 49,000 | |||
Legal fees and expenses | 45,000 | |||
Audit fees | 29,000 | |||
Directors’ fees | 18,000 | |||
Insurance fees | 4,000 | |||
Interest expense (Note 7) | 809 | |||
Miscellaneous | 44,899 | |||
Total expenses | 2,950,265 | |||
Net investment income | 2,522,160 | |||
Realized And Unrealized Gain (Loss) On Investment And Foreign Currency Transactions | ||||
Net realized gain (loss) on: | ||||
Investment transactions | (810,406 | ) | ||
Foreign currency transactions | 156,018 | |||
| (654,388 | ) | |||
Net change in unrealized appreciation (depreciation) on: | ||||
Investments | 20,189,375 | |||
Foreign currencies | (657,838 | ) | ||
| 19,531,537 | ||||
Net gain on investments and foreign currencies | 18,877,149 | |||
Net Increase In Net Assets Resulting From Operations | $ | 21,399,309 | ||
See Notes to Financial Statements.
| 28 | Visit our website at www.prudentialfunds.com |
Statement of Changes in Net Assets
| Year Ended October 31, 2010 | Year Ended October 31, 2009 | |||||||
Increase (Decrease) in Net Assets | ||||||||
Operations | ||||||||
Net investment income | $ | 2,522,160 | $ | 2,391,271 | ||||
Net realized loss on investment and foreign currency transactions | (654,388 | ) | (24,543,371 | ) | ||||
Net change in unrealized appreciation (depreciation) on investments and foreign currencies | 19,531,537 | 61,608,958 | ||||||
Net increase in net assets resulting from operations | 21,399,309 | 39,456,858 | ||||||
Dividends and Distributions (Note 1) | ||||||||
Dividends from net investment income | ||||||||
Class A | (304,699 | ) | (1,642,073 | ) | ||||
Class B | (1,944 | ) | (143,838 | ) | ||||
Class C | (3,666 | ) | (227,424 | ) | ||||
Class Z | (1,196,167 | ) | (5,093,509 | ) | ||||
| (1,506,476 | ) | (7,106,844 | ) | |||||
Series share transactions (Net of share conversions) (Note 6) | ||||||||
Net proceeds from shares sold | 37,559,143 | 89,972,236 | ||||||
Net asset value of shares issued in reinvestment of dividends and distributions | 1,495,770 | 6,958,242 | ||||||
Cost of shares reacquired | (38,267,943 | ) | (104,539,835 | ) | ||||
Net decrease in net assets from Series share transactions | 786,970 | (7,609,357 | ) | |||||
Capital Contributions (Note 6) | ||||||||
Proceeds from regulatory settlement | 329,878 | — | ||||||
Total increase | 21,009,681 | 24,740,657 | ||||||
Net Assets | ||||||||
Beginning of year | 193,529,027 | 168,788,370 | ||||||
End of year(a) | $ | 214,538,708 | $ | 193,529,027 | ||||
(a) Includes undistributed net investment income of: | $ | 2,707,642 | $ | 1,535,940 | ||||
See Notes to Financial Statements.
| Prudential International Value Fund | 29 |
Notes to Financial Statements
Prudential World Fund, Inc. (the “Fund”), is registered under the Investment Company Act of 1940 as an open-end diversified management investment company and currently consists of two series: Prudential International Value Fund (the “Series”) and the Prudential International Equity Fund. These financial statements relate to Prudential International Value Fund. The financial statements of the other Series are not presented herein. The investment objective of the Series is to achieve long-term growth of capital. The Series seeks to achieve its objective primarily through investment in common stock and preferred stock of foreign companies of all sizes.
Note 1. Accounting Policies
The following is a summary of significant accounting policies followed by the Fund and the Series in the preparation of its financial statements.
Securities Valuation: Securities listed on a securities exchange (other than options on securities and indices) are valued at the last sale price on such exchange on the day of valuation or, if there was no sale on such day, at the mean between the last reported bid and ask prices, or at the last bid price on such day in the absence of an asked price. Securities traded via NASDAQ are valued at the NASDAQ official closing price (NOCP) on the day of valuation, or if there was no NOCP, at the last sale price. Securities that are actively traded in the over-the-counter market, including listed securities for which the primary market is believed by Prudential Investments LLC (“PI” or “Manager”), in consultation with the subadvisor(s), to be over-the-counter, are valued at market value using prices provided by an independent pricing agent or principal market maker. Options on securities and indices traded on an exchange are valued at the last sale price as of the close of trading on the applicable exchange or, if there was no sale, at the mean between the most recently quoted bid and asked prices on such exchange. Futures contracts and options thereon traded on a commodities exchange or board of trade are valued at the last sale price at the close of trading on such exchange or board of trade or, if there was no sale on the applicable commodities exchange or board of trade on such day, at the mean between the most recently quoted bid and asked prices on such exchange or board of trade or at the last bid price in the absence of an asked price. Securities for which market quotations are not readily available, or whose values have been affected by events occurring after the close of the security’s foreign market and before the Funds’ normal pricing time, are valued at fair value in accordance with the Board of Directors’ approved fair valuation procedures. When determining the fair valuation of
| 30 | Visit our website at www.prudentialfunds.com |
securities some of the factors influencing the valuation include, the nature of any restrictions on disposition of the securities; assessment of the general liquidity of the securities; the issuer’s financial condition and the markets in which it does business; the cost of the investment; the size of the holding and the capitalization of issuer; the prices of any recent transactions or bids/offers for such securities or any comparable securities; any available analyst media or other reports or information deemed reliable by the investment advisor regarding the issuer or the markets or industry in which it operates. Using fair value to price securities may result in a value that is different from a security’s most recent closing price and from the price used by other mutual funds to calculate their net asset values.
Short-term securities of sufficient credit quality, which mature in 60 days or less, are valued at amortized cost, which approximates market value. The amortized cost method involves valuing a security at its cost on the date of purchase and thereafter assuming a constant amortization to maturity of the difference between the principal amount due at maturity and cost. Short-term securities which mature in more than 60 days are valued at fair value.
Securities Lending: The Fund may lend its portfolio securities to broker-dealers. The loans are secured by collateral at least equal at all times to the market value of the securities loaned. Loans are subject to termination at the option of the borrower or the Fund. Upon termination of the loan, the borrower will return to the lender securities identical to the loaned securities. Should the borrower of the securities fail financially, the Fund has the right to repurchase the securities using the collateral in the open market. The Fund recognizes income, net of any rebate and securities lending agent fees, for lending its securities in the form of fees or interest on the investment of any cash received as collateral. The Fund also continues to receive interest and dividends or amounts equivalent thereto, on the securities loaned and recognizes any unrealized gain or loss in the market price of the securities loaned that may occur during the term of the loan.
Foreign Currency Translation: The books and records of the Series are maintained in U.S. dollars. Foreign currency amounts are translated into U.S. dollars on the following basis:
(i) market value of investment securities, other assets and liabilities—at the current rates of exchange.
(ii) Purchases and sales of investment securities, income and expenses—at the rates of exchange prevailing on the respective dates of such transactions.
| Prudential International Value Fund | 31 |
Notes to Financial Statements
continued
Although the net assets of the Series are presented at the foreign exchange rates and market values at the close of the fiscal period, the Series does not isolate that portion of the results of operations arising as a result of changes in the foreign exchange rates from the fluctuations arising from changes in the market prices of long-term securities held at the end of the fiscal period. Similarly, the Series does not isolate the effect of changes in foreign exchange rates from the fluctuations arising from changes in the market prices of long-term portfolio securities sold during the fiscal period. Accordingly, realized foreign currency gains or losses are included in the reported net realized gains or losses on investment transactions.
Net realized gains or losses on foreign currency transactions represent net foreign exchange gains or losses from the holding of foreign currencies, currency gains or losses realized between the trade date and settlement date on securities transactions, and the difference between the amounts of dividends, interest and foreign withholding taxes recorded on the Series’ books and the U.S. dollar equivalent amounts actually received or paid. Net unrealized currency gains or losses from valuing foreign currency denominated assets and liabilities (other than investments) at period end exchange rates are reflected as a component of net unrealized appreciation (depreciation) on investments and foreign currencies.
Foreign security and currency transactions may involve certain considerations and risks not typically associated with those of domestic origin as a result of, among other factors, the possibility of political and economic instability or the level of governmental supervision and regulation of foreign securities markets.
Forward Currency Contracts: A forward currency contract is a commitment to purchase or sell a foreign currency at a future date at a negotiated forward rate. The Series enters into forward currency contracts in order to hedge its exposure to changes in foreign currency exchange rates on its foreign portfolio holdings or specific receivables and payables denominated in a foreign currency. The contracts are valued daily at current exchange rates and any unrealized gain or loss is included in net unrealized appreciation or depreciation on foreign currencies. Gain or loss is realized on the settlement date of the contract equal to the difference between the settlement value of the original and negotiated forward contracts. This gain or loss, if any, is included in net realized gain (loss) on foreign currency transactions. Risks may arise upon entering into these contracts from the potential inability of the counterparties to meet the terms of their contracts. Forward currency contracts
| 32 | Visit our website at www.prudentialfunds.com |
involve elements of both market and credit risk in excess of the amounts reflected on the Statement of Assets and Liabilities.
Securities Transactions and Net Investment Income: Securities transactions are recorded on the trade date. Realized and unrealized gains or losses on sales of securities are calculated on the identified cost basis. Dividend income is recorded on the ex-dividend date and interest income, including amortization of premium and accretion of discount on debt securities, as required, is recorded on an accrual basis. Expenses are recorded on the accrual basis. Net investment income or loss, (other than distribution fees which are charged directly to the respective class) and unrealized and realized gains or losses are allocated daily to each class of shares based upon the relative proportion of net assets of each class at the beginning of the day.
Dividends and Distributions: The Series expects to pay dividends of net investment income and distributions of net realized capital gains, if any, annually. Dividends and distributions to shareholders, which are determined in accordance with federal income tax regulations and which may differ from generally accepted accounting principles, are recorded on the ex-dividend date. Permanent book/tax differences relating to income and gains are reclassified amongst undistributed net investment income, accumulated net realized gain or loss and paid-in capital in excess of par, as appropriate.
Taxes: For federal income tax purposes, each series in the Fund is treated as a separate taxpaying entity. It is the Series’ policy to continue to meet the requirements of the Internal Revenue Code applicable to regulated investment companies and to distribute all of its taxable net income and capital gains, if any, to shareholders. Therefore, no federal income tax provision is required.
Withholding taxes on foreign dividends are recorded, net of reclaimable amounts, at the time the related income is earned.
Estimates: The preparation of the financial statements requires management to make estimates and assumptions that affect the reported amounts and disclosures in the financial statements. Actual results could differ from those estimates.
Note 2. Agreements
The Fund has a management agreement for the Series with Prudential Investments LLC (“PI”). Pursuant to this agreement, PI has responsibility for all investment advisory
| Prudential International Value Fund | 33 |
Notes to Financial Statements
continued
services and supervises the subadvisor’s performance of such services. PI has entered into subadvisory agreements with LSV Asset Management (“LSV”) and Thornburg Investment Management (“Thornburg”) for the Series.
The subadvisory agreements provide that LSV and Thornburg furnish investment advisory services in connection with the management of the Series. In connection therewith, LSV and Thornburg are obligated to keep certain books and records of the Series. PI pays for the services of the subadvisors, the compensation of officers of the Series, occupancy and certain clerical and bookkeeping costs of the Series. The Series bears all other costs and expenses.
The management fee paid to PI is computed daily and payable monthly at an annual rate of 1% of the average daily net assets up to $300 million, 0.95% of the next $700 million of average daily net assets and 0.90% of average daily net assets in excess of $1 billion of the Series. The effective management fee rate as of October 31, 2010 was 1.00%.
The Series has a distribution agreement with Prudential Investment Management Services LLC (“PIMS”), which acts as the distributor of the Class A, Class B, Class C and Class Z shares of the Series. The Series compensates PIMS for distributing and servicing the Series’ Class A, Class B and Class C shares pursuant to plans of distribution (the “Class A, B and C Plans”), regardless of expenses actually incurred by PIMS. The distribution fees are accrued daily and payable monthly. No distribution or service fees are paid to PIMS as distributor of the Class Z shares of the Series.
Pursuant to the Class A, B and C Plans, the Series compensates PIMS for distribution related activities at an annual rate of up to 0.30%, 1% and 1% of the average daily net assets of the Class A, B and C shares, respectively. For the year ended October 31, 2010, PIMS contractually agreed to limit such fee to 0.25% of the average daily net assets of the Class A shares.
PIMS has advised the Series that it received $42,077 in front-end sales charges resulting from sales of Class A shares, during the year ended October 31, 2010. From these fees, PIMS paid such sales charges to broker-dealers, which in turn paid commissions to salespersons and incurred other distribution costs.
| 34 | Visit our website at www.prudentialfunds.com |
PIMS advised the Series that for the year ended October 31, 2010, it received $391, $6,699 and $98 in contingent deferred sales charges imposed upon certain redemptions by Class A, Class B and Class C shareholders, respectively.
PI and PIMS are indirect, wholly-owned subsidiaries of Prudential Financial, Inc. (“Prudential”).
Note 3. Other Transactions with Affiliates
Prudential Mutual Fund Services LLC (“PMFS”), an affiliate of PI and an indirect, wholly owned subsidiary of Prudential, serves as the Series’ transfer agent. The transfer agent fees and expenses in the Statement of Operations also include certain out-of-pocket expenses paid to non-affiliates, where applicable.
The Series pays networking fees to affiliated and unaffiliated broker/dealers, including fees related to the services of Wells Fargo, LLC (“Wells Fargo”), an affiliate of PI through December 31, 2009. These networking fees are payments made to broker/dealers that clear mutual fund transactions through a national clearing system. For the year ended October 31, 2010, the Series incurred approximately $48,000 in total networking fees, of which $5,100 was paid to Wells Fargo through December 31, 2009. These amounts are included in transfer agent’s fees and expenses in the Statement of Operations.
The Series invests in the Prudential Core Taxable Money Market Fund (the “Core Fund”), a portfolio of Prudential Investment Portfolios 2 registered under the Investment Company Act of 1940, as amended, and managed by PI. Earnings from the Core Fund are disclosed on the Statement of Operations as affiliated dividend income.
Note 4. Portfolio Securities
Purchases and sales of investment securities, other than short-term investments, for the year ended October 31, 2010 were $77,998,746 and $76,018,734, respectively.
Note 5. Distributions and Tax Information
Distributions to shareholders, which are determined in accordance with federal income tax regulations, which may differ from generally accepted accounting principles, are recorded on the ex-dividend date. In order to present undistributed net investment income, accumulated net realized loss on investment and foreign currency transactions and paid-in capital in excess of par on the Statement of Assets
| Prudential International Value Fund | 35 |
Notes to Financial Statements
continued
and Liabilities that more closely represent their tax character, certain adjustments have been made to undistributed net investment income, accumulated net realized loss on investment and foreign currency transactions and paid-in capital in excess of par. For the tax year ended October 31, 2010 the adjustments were to increase undistributed net investment income by $156,018, decrease accumulated net realized loss on investment and foreign currency transactions by $1,000,396 and decrease paid-in-capital in excess of par by $1,156,414 due to differences in the treatment for book and tax purposes of certain transactions involving foreign securities and currencies and the expiration of a capital loss carryforward. Net investment income, net realized loss and net assets were not affected by this change.
For the year ended October 31, 2010, the tax character of dividends paid as reflected in the Statement of Changes in Net Assets was $1,506,476 from ordinary income. For the year ended October 31, 2009, the tax character of dividends paid as reflected in the Statement of Changes in Net Assets was $7,106,844 from ordinary income.
As of October 31, 2010, the accumulated undistributed earnings on a tax basis was $2,082,181 from ordinary income. This differs from the amount shown on the Statement of Assets and Liabilities primarily due to cumulative timing differences between financial and tax reporting.
At October 31, 2010, for federal income tax purposes, the Series had a capital loss carryforward of approximately $28,672,000 of which $334,000 expires in 2011, $1,475,000 expires in 2016, $25,886,000 expires in 2017 and $977,000 expires in 2018. As of October 31, 2010, approximately $1,156,000 of the capital loss carryforward was written off due to expiration. No capital gain distributions are expected to be paid to shareholders until net gains have been realized in excess of such carryforward. It is uncertain whether the Series will be able to realize the full benefit prior to the expiration date.
The federal income tax basis of the Series’ investments and the net unrealized appreciation as of October 31, 2010 was as follows:
Tax Basis | Appreciation | Depreciation | Net | |||
$195,410,429 | $39,219,883 | $(21,918,971) | $17,300,912 |
| 36 | Visit our website at www.prudentialfunds.com |
The difference between book basis and tax basis was primarily attributable to deferred losses on wash sales and mark-to-market of open passive foreign investment companies.
Management has analyzed the Series‘ tax positions taken on federal income tax returns for all open tax years and has concluded that as of October 31, 2010, no provisions for income tax would be required in the Series’ financial statements. The Series’ federal and state income and federal excise tax returns for tax years for which the applicable statuses of limitations have not expired are subject to examination by the Internal Revenue Service and state departments of revenue.
Note 6. Capital
The Series offers Class A, Class B, Class C and Class Z shares. Class A shares are sold with a front-end sales charge of up to 5.50%. All investors who purchase Class A shares in an amount of $1 million or more and sell these shares within 12 months of purchase are subject to a contingent deferred sales charge (“CDSC”) of 1%, including investors who purchase their shares through broker-dealers affiliated with Prudential. Class B shares are sold with a CDSC which declines from 5% to zero depending upon the period of time the shares are held. Class C shares are sold with a CDSC of 1% during the first 12 months from the date of purchase. Class B shares will automatically convert to Class A shares on a quarterly basis approximately seven years after purchase. A special exchange privilege is also available for shareholders who qualify to purchase Class A shares at net asset value. Class Z shares are not subject to any sales or redemption charge and are offered exclusively for sale to a limited group of investors.
There are 250 million authorized shares of $.01 par value common stock, divided equally into four classes, designated Class A, Class B, Class C and Class Z common stock.
For the year ended October 31, 2010, the Series received $329,878 related to an affiliate’s settlement of regulatory proceedings involving allegations of improper trading. This amount is presented in the Series’ Statement of Changes in Net Assets. The Series was not involved in the proceedings or the calculation of the payment.
| Prudential International Value Fund | 37 |
Notes to Financial Statements
continued
Transactions in shares of common stock were as follows:
Class A | Shares | Amount | ||||||
Year ended October 31, 2010: | ||||||||
Shares sold | 250,295 | $ | 4,667,067 | |||||
Shares issued in reinvestment of dividends and distributions | 15,329 | 295,084 | ||||||
Shares reacquired | (527,727 | ) | (9,884,143 | ) | ||||
Net increase (decrease) in shares outstanding before conversion | (262,103 | ) | (4,921,992 | ) | ||||
Shares issued upon conversion from Class B | 18,751 | 346,361 | ||||||
Net increase (decrease) in shares outstanding | (243,352 | ) | $ | (4,575,631 | ) | |||
Year ended October 31, 2009: | ||||||||
Shares sold | 271,957 | $ | 4,200,845 | |||||
Shares issued in reinvestment of dividends and distributions | 107,354 | 1,528,724 | ||||||
Shares reacquired | (647,455 | ) | (9,738,556 | ) | ||||
Net increase (decrease) in shares outstanding before conversion | (268,144 | ) | (4,008,987 | ) | ||||
Shares issued upon conversion from Class B | 102,271 | 1,546,674 | ||||||
Net increase (decrease) in shares outstanding | (165,873 | ) | $ | (2,462,313 | ) | |||
Class B | ||||||||
Year ended October 31, 2010: | ||||||||
Shares sold | 25,281 | $ | 452,751 | |||||
Shares issued in reinvestment of dividends and distributions | 98 | 1,815 | ||||||
Shares reacquired | (63,830 | ) | (1,130,992 | ) | ||||
Net increase (decrease) in shares outstanding before conversion | (38,451 | ) | (676,426 | ) | ||||
Shares reacquired upon conversion into Class A | (19,560 | ) | (346,361 | ) | ||||
Net increase (decrease) in shares outstanding | (58,011 | ) | $ | (1,022,787 | ) | |||
Year ended October 31, 2009: | ||||||||
Shares sold | 20,969 | $ | 316,488 | |||||
Shares issued in reinvestment of dividends and distributions | 9,668 | 132,452 | ||||||
Shares reacquired | (58,961 | ) | (820,037 | ) | ||||
Net increase (decrease) in shares outstanding before conversion | (28,324 | ) | (371,097 | ) | ||||
Shares reacquired upon conversion into Class A | (106,823 | ) | (1,546,674 | ) | ||||
Net increase (decrease) in shares outstanding | (135,147 | ) | $ | (1,917,771 | ) | |||
| 38 | Visit our website at www.prudentialfunds.com |
Class C | Shares | Amount | ||||||
Year ended October 31, 2010: | ||||||||
Shares sold | 28,606 | $ | 505,699 | |||||
Shares issued in reinvestment of dividends and distributions | 193 | 3,567 | ||||||
Shares reacquired | (101,874 | ) | (1,808,306 | ) | ||||
Net increase (decrease) in shares outstanding | (73,075 | ) | $ | (1,299,040 | ) | |||
Year ended October 31, 2009: | ||||||||
Shares sold | 28,014 | $ | 411,304 | |||||
Shares issued in reinvestment of dividends and distributions | 15,331 | 210,341 | ||||||
Shares reacquired | (122,156 | ) | (1,753,074 | ) | ||||
Net increase (decrease) in shares outstanding | (78,811 | ) | $ | (1,131,429 | ) | |||
Class Z | ||||||||
Year ended October 31, 2010: | ||||||||
Shares sold | 1,740,604 | $ | 31,933,626 | |||||
Shares issued in reinvestment of dividends and distributions | 61,869 | 1,195,304 | ||||||
Shares reacquired | (1,357,924 | ) | (25,444,502 | ) | ||||
Net increase (decrease) in shares outstanding | 444,549 | $ | 7,684,428 | |||||
Year ended October 31, 2009: | ||||||||
Shares sold | 5,597,370 | $ | 85,043,599 | |||||
Shares issued in reinvestment of dividends and distributions | 355,964 | 5,086,725 | ||||||
Shares reacquired | (6,135,702 | ) | (92,228,168 | ) | ||||
Net increase (decrease) in shares outstanding | (182,368 | ) | $ | (2,097,844 | ) | |||
Note 7. Borrowings
The Series, along with other affiliated registered investment companies (the “Funds”), is a party to a Syndicated credit Agreement (“SCA”) with two banks. The SCA provides for a commitment of $500 million. Interest on any borrowings under the SCA would be incurred at contracted market rates and a commitment fee for the unused amount is accrued daily and paid quarterly. The Funds pay an annualized commitment fee of 0.15% of the unused portion of the SCA. The expiration date of the SCA has been extended from October 20, 2010 to December 17, 2010 under the same terms. Effective December 17, 2010, the Series, along with the Funds entered into a new Syndicated Credit Agreement (“New SCA”) with a group of banks. The New SCA provides for a commitment of $750 million. The Funds will pay an annualized commitment fee of 0.10% of the unused portion of the New SCA. The expiration date of the New SCA is December 16, 2011. Interest on any borrowings under the New SCA will be incurred at contracted market rates and a commitment fee for the unused amount is accrued daily and paid quarterly. The purpose of the SCA is to provide an alternative source of temporary funding for capital share redemptions.
| Prudential International Value Fund | 39 |
Notes to Financial Statements
continued
The Series utilized the line of credit during for the year ended October 31, 2010. The average daily balance for the 51 days the Series had debt outstanding during the period was approximately $399,508 at a weighted average interest rate of approximately 1.43%.
8. Notice of Dividends to Shareholders
The Series declared ordinary income dividends on November 30, 2010 to shareholders of record on December 1, 2010. The ex-dividend date was December 2, 2010. The per share amounts declared were as follows:
| Ordinary Income | ||||
Class A | $ | 0.1693 | ||
Class B | $ | 0.0363 | ||
Class C | $ | 0.0363 | ||
Class Z | $ | 0.2163 | ||
Note 9. New Accounting Pronouncements
In January 2010, the Financial Accounting Standards Board (“FASB”) issued Accounting Standards Update (“ASU”) No. 2010-06 “Improving Disclosures about Fair Value Measurements”. ASU 2010-06 will require reporting entities to make new disclosures about purchases, sales, issuances, and settlements in the roll forward of activity in Level 3 fair value measurements. The new and revised disclosures are effective for interim and annual reporting periods beginning after December 15, 2010. At this time, management is evaluating the implications of ASU No. 2010-06 and its impact on the financial statements has not been determined.
| 40 | Visit our website at www.prudentialfunds.com |
Financial Highlights
| Class A Shares | ||||||||||||||||||||
| Year Ended October 31, | ||||||||||||||||||||
| 2010(b) | 2009(b) | 2008(b) | 2007(b) | 2006(b) | ||||||||||||||||
| Per Share Operating Performance: | ||||||||||||||||||||
| Net Asset Value, Beginning of Year | $18.45 | $15.28 | $34.10 | $27.12 | $21.88 | |||||||||||||||
| Income (loss) from investment operations: | ||||||||||||||||||||
| Net investment income | .22 | .20 | .44 | .51 | .45 | |||||||||||||||
| Net realized and unrealized gain (loss) on investments | 1.71 | 3.59 | (14.93 | ) | 7.85 | 5.61 | ||||||||||||||
| Total from investment operations | 1.93 | 3.79 | (14.49 | ) | 8.36 | 6.06 | ||||||||||||||
| Less Dividends and Distributions: | ||||||||||||||||||||
| Dividends from net investment income | (.12 | ) | (.62 | ) | (.38 | ) | (.03 | ) | (.50 | ) | ||||||||||
| Distributions from net realized gains | - | - | (3.95 | ) | (1.35 | ) | (.32 | ) | ||||||||||||
| Total dividends and distributions | (.12 | ) | (.62 | ) | (4.33 | ) | (1.38 | ) | (.82 | ) | ||||||||||
| Capital Contributions | .03 | - | - | - | - | |||||||||||||||
| Net Asset Value, end of year | $20.29 | $18.45 | $15.28 | $34.10 | $27.12 | |||||||||||||||
| Total Return(a): | 10.68% | 26.03% | (48.33)% | 32.15% | 28.59% | |||||||||||||||
| Ratios/Supplemental Data: | ||||||||||||||||||||
| Net assets, end of year (000) | $45,598 | $45,945 | $40,580 | $91,221 | $73,289 | |||||||||||||||
| Average net assets (000) | $44,626 | $39,582 | $71,618 | $84,344 | $67,590 | |||||||||||||||
| Ratios to average net assets(d): | ||||||||||||||||||||
| Expenses, including distribution and service (12b-1) fees (c) | 1.66% | 1.65% | 1.56% | 1.57% | 1.65% | |||||||||||||||
| Expenses, excluding distribution and service (12b-1) fees | 1.41% | 1.40% | 1.31% | 1.32% | 1.40% | |||||||||||||||
| Net investment income | 1.17% | 1.30% | 1.79% | 1.74% | 1.83% | |||||||||||||||
| For Class A, B, C and Z shares: | ||||||||||||||||||||
| Portfolio turnover rate | 40% | 40% | 27% | 44% | 48% | |||||||||||||||
(a) These total returns do not consider the effect of sales load. Total return is calculated assuming a purchase of a share on the first day and a sale on the last day of each year reported and includes reinvestment of dividends and distributions. Total returns may reflect adjustments to conform to generally accepted accounting principles.
(b) Calculations are based on the average daily number of shares outstanding.
(c) The distributor of the Fund has contractually agreed to limit its distribution and service (12b-1) fees to 0.25% of the average daily assets of the Class A shares.
(d) Does not include expenses of the underlying portfolio in which the Series invests.
See Notes to Financial Statements.
| Prudential International Value Fund | 41 |
Financial Highlights
continued
| Class B Shares | ||||||||||||||||||||
| Year Ended October 31, | ||||||||||||||||||||
| 2010(b) | 2009(b) | 2008(b) | 2007(b) | 2006(b) | ||||||||||||||||
| Per Share Operating Performance: | ||||||||||||||||||||
| Net Asset Value, Beginning of Year | $17.64 | $14.58 | $32.73 | $26.24 | $21.19 | |||||||||||||||
| Income (loss) from investment operations: | ||||||||||||||||||||
| Net investment income | .08 | .08 | .24 | .24 | .19 | |||||||||||||||
| Net realized and unrealized gain (loss) on investments | 1.63 | 3.45 | (14.29 | ) | 7.60 | 5.49 | ||||||||||||||
| Total from investment operations | 1.71 | 3.53 | (14.05 | ) | 7.84 | 5.68 | ||||||||||||||
| Less Dividends and Distributions: | ||||||||||||||||||||
| Dividends from net investment income | (.01 | ) | (.47 | ) | (.15 | ) | - | (.31 | ) | |||||||||||
| Distributions from net realized gains | - | - | (3.95 | ) | (1.35 | ) | (.32 | ) | ||||||||||||
| Total dividends and distributions | (.01 | ) | (.47 | ) | (4.10 | ) | (1.35 | ) | (.63 | ) | ||||||||||
| Capital Contributions | .03 | - | - | - | - | |||||||||||||||
| Net Asset Value, end of year | $19.37 | $17.64 | $14.58 | $32.73 | $26.24 | |||||||||||||||
| Total Return(a): | 9.86% | 25.11% | (48.74)% | 31.17% | 27.51% | |||||||||||||||
| Ratios/Supplemental Data: | ||||||||||||||||||||
| Net assets, end of year (000) | $3,093 | $3,839 | $5,143 | $16,279 | $19,141 | |||||||||||||||
| Average net assets (000) | $3,314 | $3,985 | $10,730 | $16,627 | $19,346 | |||||||||||||||
| Ratios to average net assets(c): | ||||||||||||||||||||
| Expenses, including distribution and service (12b-1) fees | 2.41% | 2.40% | 2.31% | 2.32% | 2.40% | |||||||||||||||
| Expenses, excluding distribution and service (12b-1) fees | 1.41% | 1.40% | 1.31% | 1.32% | 1.40% | |||||||||||||||
| Net investment income | .43% | .58% | 1.01% | .84% | .78% | |||||||||||||||
(a) These total returns do not consider the effect of sales load. Total return is calculated assuming a purchase of a share on the first day and a sale on the last day of each year reported and includes reinvestment of dividends and distributions. Total returns may reflect adjustments to conform to generally accepted accounting principles.
(b) Calculations are based on the average daily number of shares outstanding.
(c) Does not include expenses of the underlying portfolio in which the Series invests.
See Notes to Financial Statements.
| 42 | Visit our website at www.prudentialfunds.com |
| Class C Shares | ||||||||||||||||||||
| Year Ended October 31, | ||||||||||||||||||||
| 2010(b) | 2009(b) | 2008(b) | 2007(b) | 2006(b) | ||||||||||||||||
| Per Share Operating Performance: | ||||||||||||||||||||
| Net Asset Value, Beginning of Year | $17.66 | $14.60 | $32.77 | $26.27 | $21.21 | |||||||||||||||
| Income (loss) from investment operations: | ||||||||||||||||||||
| Net investment income | .07 | .08 | .24 | .27 | .23 | |||||||||||||||
| Net realized and unrealized gain (loss) on investments | 1.65 | 3.45 | (14.31 | ) | 7.58 | 5.46 | ||||||||||||||
| Total from investment operations | 1.72 | 3.53 | (14.07 | ) | 7.85 | 5.69 | ||||||||||||||
| Less Dividends and Distributions: | ||||||||||||||||||||
| Dividends from net investment income | (.01 | ) | (.47 | ) | (.15 | ) | - | (.31 | ) | |||||||||||
| Distributions from net realized gains | - | - | (3.95 | ) | (1.35 | ) | (.32 | ) | ||||||||||||
| Total dividends and distributions | (.01 | ) | (.47 | ) | (4.10 | ) | (1.35 | ) | (.63 | ) | ||||||||||
| Capital Contributions | .03 | - | - | - | - | |||||||||||||||
| Net asset value, end of year | $19.40 | $17.66 | $14.60 | $32.77 | $26.27 | |||||||||||||||
| Total Return(a): | 9.91% | 25.08% | (48.74)% | 31.17% | 27.53% | |||||||||||||||
| Ratios/Supplemental Data: | ||||||||||||||||||||
| Net assets, end of year (000) | $6,828 | $7,507 | $7,355 | $17,938 | $15,962 | |||||||||||||||
| Average net assets (000) | $6,760 | $6,807 | $13,571 | $16,297 | $14,909 | |||||||||||||||
| Ratios to average net assets(c): | ||||||||||||||||||||
| Expenses, including distribution and service (12b-1) fees | 2.41% | 2.40% | 2.31% | 2.32% | 2.40% | |||||||||||||||
| Expenses, excluding distribution and service (12b-1) fees | 1.41% | 1.40% | 1.31% | 1.32% | 1.40% | |||||||||||||||
| Net investment income | .42% | .58% | 1.04% | .94% | .98% | |||||||||||||||
(a) These total returns do not consider the effect of sales load. Total return is calculated assuming a purchase of a share on the first day and a sale on the last day of each year reported and includes reinvestment of dividends and distributions. Total returns may reflect adjustments to conform to generally accepted accounting principles.
(b) Calculations are based on the average daily number of shares outstanding.
(c) Does not include expenses of the underlying portfolio in which the Series invests.
See Notes to Financial Statements.
| Prudential International Value Fund | 43 |
Financial Highlights
continued
| Class Z Shares | ||||||||||||||||||||
| Year Ended October 31, | ||||||||||||||||||||
| 2010(b) | 2009(b) | 2008(b) | 2007(b) | 2006(b) | ||||||||||||||||
| Per Share Operating Performance: | ||||||||||||||||||||
| Net Asset Value, Beginning of Year | $18.55 | $15.37 | $34.30 | $27.26 | $22.02 | |||||||||||||||
| Income (loss) from investment operations: | ||||||||||||||||||||
| Net investment income | .26 | .24 | .50 | .60 | .28 | |||||||||||||||
| Net realized and unrealized gain (loss) on investments | 1.74 | 3.62 | (15.02 | ) | 7.89 | 5.84 | ||||||||||||||
| Total from investment operations | 2.00 | 3.86 | (14.52 | ) | 8.49 | 6.12 | ||||||||||||||
| Less Dividends and Distributions: | ||||||||||||||||||||
| Dividends from net investment income | (.16 | ) | (.68 | ) | (.46 | ) | (.10 | ) | (.56 | ) | ||||||||||
| Distributions from net realized gains | - | - | (3.95 | ) | (1.35 | ) | (.32 | ) | ||||||||||||
| Total dividends and distributions | (.16 | ) | (.68 | ) | (4.41 | ) | (1.45 | ) | (.88 | ) | ||||||||||
| Capital contributions | .03 | - | - | - | - | |||||||||||||||
| Net asset value, end of year | $20.42 | $18.55 | $15.37 | $34.30 | $27.26 | |||||||||||||||
| Total Return(a): | 11.01% | 26.41% | (48.23)% | 32.50% | 28.78% | |||||||||||||||
| Ratios/Supplemental Data: | ||||||||||||||||||||
| Net assets, end of year (000) | $159,020 | $136,238 | $115,710 | $234,828 | $177,008 | |||||||||||||||
| Average net assets (000) | $139,023 | $115,310 | $186,380 | $206,798 | $170,067 | |||||||||||||||
| Ratios to average net assets(c): | ||||||||||||||||||||
| Expenses, including distribution and service (12b-1) fees | 1.41% | 1.40% | 1.31% | 1.32% | 1.40% | |||||||||||||||
| Expenses, excluding distribution and service (12b-1) fees | 1.41% | 1.40% | 1.31% | 1.32% | 1.40% | |||||||||||||||
| Net investment income | 1.41% | 1.58% | 2.06% | 2.02% | 1.13% | |||||||||||||||
(a) These total returns do not consider the effect of sales load. Total return is calculated assuming a purchase of a share on the first day and a sale on the last day of each year reported and includes reinvestment of dividends and distributions. Total returns may reflect adjustments to conform to generally accepted accounting principles.
(b) Calculations are based on the average daily number of shares outstanding.
(c) Does not include expenses of the underlying portfolio in which the Series invests.
See Notes to Financial Statements.
| 44 | Visit our website at www.prudentialfunds.com |
Report of Independent Registered Public
Accounting Firm
The Board of Directors and Shareholders
Prudential World Fund, Inc.:
We have audited the accompanying statement of assets and liabilities of Prudential International Value Fund (formerly Dryden International Value Fund) (one of the series constituting Prudential World Fund, Inc., hereafter referred to as the “Fund”), including the portfolio of investments, as of October 31, 2010, and the related statement of operations for the year then ended, the statement of changes in net assets for each of the years in the two-year period then ended and the financial highlights for each of the years in the five-year period then ended. These financial statements and financial highlights are the responsibility of the Fund’s management. Our responsibility is to express an opinion on these financial statements and financial highlights based on our audits.
We conducted our audits in accordance with the standards of the Public Company Accounting Oversight Board (United States). Those standards require that we plan and perform the audit to obtain reasonable assurance about whether the financial statements and financial highlights are free of material misstatement. An audit includes examining, on a test basis, evidence supporting the amounts and disclosures in the financial statements. Our procedures included confirmation of securities owned as of October 31, 2010, by correspondence with the custodian, transfer agent and brokers or by other appropriate auditing procedures when replies from brokers were not received. An audit also includes assessing the accounting principles used and significant estimates made by management, as well as evaluating the overall financial statement presentation. We believe that our audits provide a reasonable basis for our opinion.
In our opinion, the financial statements and financial highlights referred to above present fairly, in all material respects, the financial position of the Fund as of October 31, 2010, and the results of its operations for the year then ended, the changes in its net assets for each of the years in the two-year period then ended and the financial highlights for each of the years in the five-year period then ended, in conformity with U.S. generally accepted accounting principles.
New York, New York
December 20, 2010
| Prudential International Value Fund | 45 |
Tax Information
(Unaudited)
We are required by Internal Revenue Code of 1986, as amended (“the Code”), to advise you within 60 days of the Series’ fiscal year end (October 31, 2010) as to the federal tax status of dividends paid by the Series during such fiscal year. We are advising you in the fiscal year ended October 31, 2010, the Series paid ordinary income dividends of $0.12, $0.01, $0.01 and $0.16 per share from Class A, B, C and Z shares, respectively.
For the fiscal year ended October 31, 2010, the Series designates the maximum amount allowable, but not less than 100% of the ordinary income dividends paid during the year as qualified dividend income in accordance with Section 854 of the Internal Revenue Code.
For the fiscal year ended October 31, 2010, the Series made an election to pass through the maximum amount of the portion of the ordinary income dividends paid derived from foreign source income as well as any foreign taxes paid by the Series in accordance with Section 853 of the Internal Revenue Code of the following amounts: $507,759 foreign tax credit from recognized foreign source income of $5,836,045.
In January 2011, you will be advised on IRS Form 1099DIV or Substitute Form 1099DIV as to the federal tax status of dividends and distributions received by you in calendar year 2010.
| 46 | Visit our website at www.prudentialfunds.com |
MANAGEMENT OF THE FUND
(Unaudited)
Information about Fund Directors/Trustees (referred to herein as “Board Members”) and Fund Officers is set forth below. Board Members who are not deemed to be “interested persons,” as defined in the 1940 Act, are referred to as “Independent Board Members.” Board Members who are deemed to be “interested persons” are referred to as “Interested Board Members.” The Board Members are responsible for the overall supervision of the operations of the Fund and perform the various duties imposed on the directors or trustees of investment companies by the 1940 Act.
| Independent Board Members (1) | ||||
Name, Address, Age Portfolios Overseen | Principal Occupation(s) During Past Five Years | Other Directorships Held | ||
Kevin J. Bannon (58) Board Member Portfolios Overseen: 58 | Managing Director (since April 2008) and Chief Investment Officer (since October 2008) of Highmount Capital LLC (registered investment adviser); formerly Executive Vice President and Chief Investment Officer (April 1993-August 2007) of Bank of New York Company; President (May 2003-May 2007) of BNY Hamilton Family of Mutual Funds. | Director of Urstadt Biddle Properties (since September 2008). | ||
Linda W. Bynoe (58) Board Member Portfolios Overseen: 58 | President and Chief Executive Officer (since March 1995) and formerly Chief Operating Officer (December 1989- February 1995) of Telemat Ltd. (management consulting); formerly Vice President (January 1985-June 1989) at Morgan Stanley & Co (broker-dealer). | Director of Simon Property Group, Inc. (retail real estate) (since May 2003); Anixter International, Inc. (communication products distributor) (since January 2006); Director of Northern Trust Corporation (financial services) (since April 2006); Trustee of Equity Residential (residential real estate) (since December 2009); formerly Director of Dynegy Inc. (power generation) (September 2002-May 2006), CitiStreet Funds, Inc. (mutual funds) (May 1993-February 2005), AM- CH, Inc. (restaurant holding company) (November 2004-February 2005). | ||
Michael S. Hyland, CFA (65) Board Member Portfolios Overseen: 58 | Independent Consultant (since February 2005); formerly Senior Managing Director (July 2001-February 2005) of Bear Stearns & Co, Inc.; Global Partner, INVESCO (1999-2001); Managing Director and President of Salomon Brothers Asset Management (1989-1999). | None. | ||
Prudential International Value Fund
Douglas H. McCorkindale (71) Board Member Portfolios Overseen: 58 | Formerly Chairman (February 2001-June 2006), Chief Executive Officer (June 2000-July 2005), President (September 1997-July 2005) and Vice Chairman (March 1984-May 2000) of Gannett Co. Inc. (publishing and media). | Director of Continental Airlines, Inc. (since May 1993); Director of Lockheed Martin Corp. (aerospace and defense) (since May 2001). | ||
Stephen P. Munn (68) Board Member Portfolios Overseen: 58 | Lead Director (since 2007) and formerly Chairman (1993-2007) of Carlisle Companies Incorporated (manufacturer of industrial products). | Lead Director (since 2007) of Carlisle Companies Incorporated (manufacturer of industrial products). | ||
| Richard A. Redeker (67) Board Member Portfolios Overseen: 58 | Retired Mutual Fund Senior Executive (42 years); Management Consultant; Independent Directors Council (organization of 2,800 Independent Mutual Fund Directors)-Executive Committee, Chair of Policy Steering Committee, Governing Council. | None. | ||
Robin B. Smith (71) Board Member & Independent Chair Portfolios Overseen: 58 | Chairman of the Board (since January 2003) of Publishers Clearing House (direct marketing); formerly Chairman and Chief Executive Officer (August 1996-January 2003) of Publishers Clearing House. | Formerly Director of BellSouth Corporation (telecommunications) (1992-2006). | ||
Stephen G. Stoneburn (67) Board Member Portfolios Overseen: 58 | President and Chief Executive Officer (since June 1996) of Quadrant Media Corp. (publishing company); formerly President (June 1995-June 1996) of Argus Integrated Media, Inc.; Senior Vice President and Managing Director (January 1993-1995) of Cowles Business Media; Senior Vice President of Fairchild Publications, Inc (1975-1989). | None. |
Visit our website at www.prudentialfunds.com
| Interested Board Members (1) | ||||
Name, Address, Age Portfolios Overseen | Principal Occupation(s) During Past Five Years | Other Directorships Held | ||
Judy A. Rice (62) Board Member & President Portfolios Overseen: 58 | President, Chief Executive Officer, Chief Operating Officer and Officer-In-Charge (since February 2003) of Prudential Investments LLC; President, Chief Executive Officer and Officer-In-Charge (since April 2003) of Prudential Mutual Fund Services LLC; Executive Vice President (since December 2008) of Prudential Investment Management Services LLC; Member of the Board of Directors of Jennison Associates LLC (since November 2010); formerly Vice President (February 1999-April 2006) of Prudential Investment Management Services LLC; formerly President, Chief Executive Officer, Chief Operating Officer and Officer-In-Charge (May 2003-June 2005) and Director (May 2003-March 2006) and Executive Vice President (June 2005-March 2006) of AST Investment Services, Inc.; Member of Board of Governors of the Investment Company Institute. | None. | ||
| Scott E. Benjamin (37) Board Member & Vice President | Executive Vice President (since June 2009) of Prudential Investments LLC and Prudential Investment Management | None. | ||
| Portfolios Overseen: 58 | Services LLC; Executive Vice President (since September 2009) of AST Investment Services, Inc.; Senior Vice President of Product Development and Marketing, Prudential Investments (since February 2006); Vice President of Product Development and Product Management, Prudential Investments (2003-2006). | |||
| 1 | The year that each individual joined the Fund’s Board is as follows: |
Linda W. Bynoe, 2005; David E.A. Carson, 2003; Robert E. La Blanc, 1984; Douglas H. McCorkindale, 2003; Richard A. Redeker, 2003; Robin B. Smith, 1996; Stephen G. Stoneburn, 1996; Kevin J. Bannon, 2008; Michael S. Hyland, 2008; Stephen P. Munn, 2008; Judy A. Rice, Board Member since 2000 and President since 2003.
Prudential International Value Fund
| Fund Officers (a)(1) | ||
| Name, Address and Age Position with Fund | Principal Occupation(s) During Past Five Years | |
| Kathryn L. Quirk (58) Chief Legal Officer | Vice President and Corporate Counsel (since September 2004) of Prudential; Executive Vice President, Chief Legal Officer and Secretary (since July 2005) of PI and Prudential Mutual Fund Services LLC; Vice President and Corporate Counsel (since June 2005) and Secretary (since February 2006) of AST Investment Services, Inc.; formerly Senior Vice President and Assistant Secretary (November 2004-August 2005) of PI; formerly Assistant Secretary (June 2005-February 2006) of AST Investment Services, Inc.; formerly Managing Director, General Counsel, Chief Compliance Officer, Chief Risk Officer and Corporate Secretary (1997-2002) of Zurich Scudder Investments, Inc. | |
| Deborah A. Docs (52) Secretary | Vice President and Corporate Counsel (since January 2001) of Prudential; Vice President (since December 1996) and Assistant Secretary (since March 1999) of PI; formerly Vice President and Assistant Secretary (May 2003-June 2005) of AST Investment Services, Inc. | |
| Jonathan D. Shain (52) Assistant Secretary | Vice President and Corporate Counsel (since August 1998) of Prudential; Vice President and Assistant Secretary (since May 2001) of PI; Vice President and Assistant Secretary (since February 2001) of PMFS; formerly Vice President and Assistant Secretary (May 2003-June 2005) of AST Investment Services, Inc. | |
| Claudia DiGiacomo (36) Assistant Secretary | Vice President and Corporate Counsel (since January 2005) of Prudential; Vice President and Assistant Secretary of PI (since December 2005); Associate at Sidley Austin Brown & Wood LLP (1999-2004). | |
| John P. Schwartz (39) Assistant Secretary | Vice President and Corporate Counsel (since April 2005) of Prudential; Vice President and Assistant Secretary of PI (since December 2005); Associate at Sidley Austin Brown & Wood LLP (1997-2005). | |
| Andrew R. French (48) Assistant Secretary | Vice President and Corporate Counsel (since February 2010) of Prudential; formerly Director and Corporate Counsel (2006-2010) of Prudential; Vice President and Assistant Secretary (since January 2007) of PI; Vice President and Assistant Secretary (since January 2007) of PMFS; formerly Senior Legal Analyst of Prudential Mutual Fund Law Department (1997-2006). | |
| Timothy J. Knierim (51) Chief Compliance Officer | Chief Compliance Officer of Prudential Investment Management, Inc. (since July 2007); formerly Chief Risk Officer of PIM and PI (2002-2007) and formerly Chief Ethics Officer of PIM and PI (2006-2007). | |
| Valerie M. Simpson (52) Deputy Chief Compliance Officer | Chief Compliance Officer (since April 2007) of PI and AST Investment Services, Inc.; formerly Vice President-Financial Reporting (June 1999-March 2006) for Prudential Life and Annuities Finance. | |
| Theresa C. Thompson (48) Deputy Chief Compliance Officer | Vice President, Compliance, PI (since April 2004); and Director, Compliance, PI (2001-2004). |
Visit our website at www.prudentialfunds.com
Noreen M. Fierro (46) Anti-Money Laundering Compliance Officer | Vice President, Corporate Compliance (since May 2006) of Prudential; formerly Corporate Vice President, Associate General Counsel (April 2002-May 2005) of UBS Financial Services, Inc., in their Money Laundering Prevention Group; Senior Manager (May 2005-May 2006) of Deloitte Financial Advisory Services, LLP, in their Forensic and Dispute Services, Anti-Money Laundering Group. | |
Grace C. Torres (51) Treasurer and Principal Financial and Accounting Officer | Assistant Treasurer (since March 1999) and Senior Vice President (since September 1999) of PI; Assistant Treasurer (since May 2003) and Vice President (since June 2005) of AST Investment Services, Inc.; Senior Vice President and Assistant Treasurer (since May 2003) of Prudential Annuities Advisory Services, Inc.; formerly Senior Vice President (May 2003-June 2005) of AST Investment Services, Inc. | |
| M. Sadiq Peshimam (46) Assistant Treasurer | Vice President (since 2005) of Prudential Investments LLC. | |
| Peter Parrella (52) Assistant Treasurer | Vice President (since 2007) and Director (2004-2007) within Prudential Mutual Fund Administration; formerly Tax Manager at SSB Citi Fund Management LLC (1997-2004). |
| (a) | Excludes Ms. Rice and Mr. Benjamin, interested Board Members who also serve as President and Vice President, respectively. |
| (1) | The year that each individual became an officer of the Fund is as follows: |
Kathryn L. Quirk, 2005; Deborah A. Docs, 2005; Jonathan D. Shain, 2005; Claudia DiGiacomo, 2005; John P. Schwartz, 2006; Andrew R. French, 2006; Timothy J. Knierim, 2007; Valerie M. Simpson, 2007; Theresa C. Thompson, 2008; Noreen M. Fierro, 2006; Grace C. Torres, 1995; Sadiq Peshimam, 2006; Peter Parrella, 2007.
Explanatory Notes to Tables:
| • | Board Members are deemed to be “Interested,” as defined in the 1940 Act, by reason of their affiliation with Prudential Investments LLC and/or an affiliate of Prudential Investments LLC. |
| • | Unless otherwise noted, the address of all Board Members and Officers is c/o Prudential Investments LLC, Gateway Center Three, 100 Mulberry Street, Newark, New Jersey 07102-4077. |
| • | There is no set term of office for Board Members or Officers. The Board Members have adopted a retirement policy, which calls for the retirement of Board Members on December 31 of the year in which they reach the age of 75. |
| • | “Other Directorships Held” includes only directorships of companies required to register or file reports with the Commission under the Securities Exchange Act of 1934, as amended (the “Exchange Act”) (that is, “public companies”) or other investment companies registered under the 1940 Act. |
| • | “Portfolios Overseen” includes all investment companies managed by Prudential Investments LLC. The investment companies for which PI serves as manager include the Prudential Investments Mutual Funds, The Prudential Variable Contract Accounts, Target Mutual Funds, The Prudential Series Fund, Prudential’s Gibraltar Fund, Inc. and the Advanced Series Trust. |
Prudential International Value Fund
Approval of Advisory Agreements
The Fund’s Board of Directors
The Board of Directors (the “Board”) of Prudential International Value Fund (the “Fund”)1 consists of 10 individuals, eight of whom are not “interested persons” of the Fund, as defined in the Investment Company Act of 1940, as amended (the “1940 Act”) (the “Independent Directors”). The Board is responsible for the oversight of the Fund and its operations, and performs the various duties imposed on the directors of investment companies by the 1940 Act. The Independent Directors have retained independent legal counsel to assist them in connection with their duties. The Chair of the Board is an Independent Director. The Board has established three standing committees: the Audit Committee, the Nominating and Governance Committee, and the Investment Committee. Each committee is chaired by, and composed of, Independent Directors.
Annual Approval of the Fund’s Advisory Agreements
As required under the 1940 Act, the Board determines annually whether to renew the Fund’s management agreement with Prudential Investments LLC (“PI”) and the Fund’s subadvisory agreements with each of LSV Asset Management (“LSV”) and Thornburg Investment Management, Inc. (“Thornburg”). In considering the renewal of the agreements, the Board, including all of the Independent Directors, met on June 21-23, 2010 and approved the renewal of the agreements through July 31, 2011, after concluding that the renewal of the agreements was in the best interests of the Fund and its shareholders.
In advance of the meetings, the Board requested and received materials relating to the agreements, and had the opportunity to ask questions and request further information in connection with its consideration. Among other things, the Board considered comparative fee information from PI, LSV and Thornburg. Also, the Board considered comparisons with other mutual funds in relevant Peer Universes and Peer Groups. The mutual funds included in each Peer Universe or Peer Group were objectively determined by Lipper Inc. (“Lipper”), an independent provider of mutual fund data. To the extent that PI deems appropriate, and for reasons addressed in detail with the Board, PI may provide supplemental data compiled by Lipper for the Board’s consideration. The comparisons placed the Fund in various quartiles over the one-, three-, five-, and 10-year periods ending December 31, 2009, with the first quartile being the best 25% of the mutual funds (for performance, the best performing mutual funds and, for expenses, the lowest cost mutual funds).
In approving the agreements, the Board, including the Independent Directors advised by independent legal counsel, considered the factors it deemed relevant, including
| 1 | Prudential International Value Fund is a series of Prudential World Fund, Inc. |
Prudential International Value Fund
Approval of Advisory Agreements (continued)
the nature, quality and extent of services provided by PI and each subadviser, the performance of the Fund, the profitability of PI and its affiliates, expenses and fees, and the potential for economies of scale that may be shared with the Fund and its shareholders as the Fund’s assets grow. In their deliberations, the Directors did not identify any single factor which alone was responsible for the Board’s decision to approve the agreements with respect to the Fund. In connection with its deliberations, the Board considered information provided by PI throughout the year at regular Board meetings, presentations from portfolio managers and other information, as well as information furnished at or in advance of the meetings on June 21-23, 2010.
The Directors determined that the overall arrangements between the Fund and PI, which serves as the Fund’s investment manager pursuant to a management agreement, and between PI and each of LSV and Thornburg, which serve as the Fund’s subadvisers pursuant to the terms of subadvisory agreements with PI, are in the interest of the Fund and its shareholders in light of the services performed, fees charged and such other matters as the Directors considered relevant in the exercise of their business judgment.
The material factors and conclusions that formed the basis for the Directors’ reaching their determinations to approve the continuance of the agreements are separately discussed below.
Nature, Quality, and Extent of Services
The Board received and considered information regarding the nature, quality and extent of services provided to the Fund by PI, LSV and Thornburg. The Board considered the services provided by PI, including but not limited to the oversight of the subadvisers for the Fund, as well as the provision of fund recordkeeping, compliance, and other services to the Fund. With respect to PI’s oversight of the subadvisers, the Board noted that PI’s Strategic Investment Research Group (“SIRG”), which is a business unit of PI, is responsible for screening and recommending new subadvisers when appropriate, as well as monitoring and reporting to the Board on the performance and operations of the subadvisers. The Board also considered that PI pays the salaries of all of the officers and non-independent Directors of the Fund. The Board also considered the investment subadvisory services provided by LSV and Thornburg, as well as adherence to the Fund’s investment restrictions and compliance with applicable Fund policies and procedures. The Board considered PI’s evaluations of the subadvisers, as well as PI’s recommendation, based on its review of each subadviser, to renew the subadvisory agreements.
The Board reviewed the qualifications, backgrounds and responsibilities of PI’s senior management responsible for the oversight of the Fund and LSV and Thornburg, and
Visit our website at www.prudentialfunds.com
also reviewed the qualifications, backgrounds and responsibilities of the LSV and Thornburg portfolio managers who are responsible for the day-to-day management of the Fund’s portfolio. The Board was provided with information pertaining to PI’s and LSV’s and Thornburg’s organizational structure, senior management, investment operations, and other relevant information pertaining to PI, LSV and Thornburg. The Board also noted that it received favorable compliance reports from the Fund’s Chief Compliance Officer (“CCO”) as to each of PI and LSV and Thornburg.
The Board concluded that it was satisfied with the nature, extent and quality of the investment management services provided by PI and the subadvisory services provided to the Fund by LSV and Thornburg, and that there was a reasonable basis on which to conclude that the Fund benefits from the services provided by PI and LSV and Thornburg under the management and subadvisory agreements.
Performance of the Fund
The Board received and considered information about the Fund’s historical performance. The Board considered that the Fund’s gross performance in relation to its Peer Universe (a blend of the Lipper International Large-Cap Core Funds and International Multi-Cap Core Funds Performance Universes)2 was in the second quartile over the one-, five-, and 10-year periods, and was in the third quartile over the three-year period. The Board also noted that the Fund outperformed its benchmark index over all periods. The Board concluded that, in light of the Fund’s competitive performance, it would be in the interest of the Fund and its shareholders for the Fund to renew the agreements.
Fees and Expenses
The Board considered that the Fund’s actual management fees (which reflect any subsidies, waivers or expense caps) ranked in the Expense Group’s second quartile, and that the Fund’s total expenses ranked in the Expense Group’s third quartile. The Board noted that the Fund’s total expenses were 2.6 basis points higher than the Expense Group median. The Board concluded that the management fees and total expenses were reasonable in light of the services provided.
Costs of Services and Profits Realized by PI
The Board was provided with information on the profitability of PI and its affiliates in serving as the Fund’s investment manager. The Board discussed with PI the methodology utilized in assembling the information regarding profitability and
| 2 | Although Lipper classifies the Fund in its International Large-Cap Core Funds Performance Universe, the International Large-Cap Core Funds and International Multi-Cap Core Funds Performance Universes were utilized because PI believes that the funds included in these Universes provide a more appropriate basis for Fund performance comparisons. |
Prudential International Value Fund
Approval of Advisory Agreements (continued)
considered its reasonableness. The Board recognized that it is difficult to make comparisons of profitability from fund management contracts because comparative information is not generally publicly available and is affected by numerous factors, including the structure of the particular adviser, the types of funds it manages, its business mix, numerous assumptions regarding allocations and the adviser’s capital structure and cost of capital. Taking these factors into account, the Board concluded that the profitability of PI and its affiliates in relation to the services rendered was not unreasonable.
The Board considered information about the profitability of LSV or Thornburg, but concluded that the level of a subadviser’s profitability may not be as significant given the arm’s length nature of the process by which the subadvisory fee rates were negotiated by PI, LSV and Thornburg as well as the fact that PI compensates the subadvisers out of its management fee.
Economies of Scale
The Board received and discussed information concerning whether PI realizes economies of scale as the Fund’s assets grow beyond current levels. The Board noted that the management fee schedule for the Fund includes breakpoints, which have the effect of decreasing the fee rate as assets increase, but at the current level of assets the Fund does not realize the effect of those rate reductions. The Board took note that the Fund’s fee structure would result in benefits to Fund shareholders when (and if) assets reach the levels at which the fee rate is reduced. These benefits will accrue whether or not PI is then realizing any economies of scale.
Other Benefits to PI, LSV and Thornburg
The Board considered potential ancillary benefits that might be received by PI, LSV and Thornburg and their affiliates as a result of their relationship with the Fund. The Board concluded that potential benefits to be derived by PI included brokerage commissions received by affiliates of PI, transfer agency fees received by the Fund’s transfer agent (which is affiliated with PI), and benefits to the reputation as well as other intangible benefits resulting from PI’s association with the Fund. The Board concluded that the potential benefits to be derived by LSV and Thornburg included their ability to use soft dollar credits, brokerage commissions received by affiliates of LSV or Thornburg, as well as the potential benefits consistent with those generally resulting from an increase in assets under management, specifically, potential access to additional research resources and benefits to the reputation. The Board concluded that the benefits derived by PI and LSV and Thornburg were consistent with the types of benefits generally derived by investment managers and subadvisers to mutual funds.
After full consideration of these factors, the Board concluded that the approval of the agreements was in the interest of the Fund and its shareholders.
Visit our website at www.prudentialfunds.com
| n MAIL | n TELEPHONE | n WEBSITE | ||
Gateway Center Three 100 Mulberry Street Newark, NJ 07102 | (800) 225-1852 | www.prudentialfunds.com |
| PROXY VOTING |
| The Board of Directors of the Fund has delegated to the Fund’s investment subadvisers the responsibility for voting any proxies and maintaining proxy recordkeeping with respect to the Fund. A description of these proxy voting policies and procedures is available without charge, upon request, by calling (800) 225-1852 or by visiting the Securities and Exchange Commission’s website at www.sec.gov. Information regarding how the Fund voted proxies relating to portfolio securities during the most recent 12-month period ended June 30 is available on the Fund’s website and on the Commission’s website. |
| DIRECTORS |
| Kevin J. Bannon • Scott E. Benjamin • Linda W. Bynoe • Michael S. Hyland • Douglas H. McCorkindale • Stephen P. Munn • Richard A. Redeker • Judy A. Rice • Robin B. Smith • Stephen G. Stoneburn |
| OFFICERS |
| Judy A. Rice, President • Scott E. Benjamin, Vice President • Grace C. Torres, Treasurer and Principal Financial and Accounting Officer • Kathryn L. Quirk, Chief Legal Officer • Deborah A. Docs, Secretary • Timothy J. Knierim, Chief Compliance Officer • Valerie M. Simpson, Deputy Chief Compliance Officer • Theresa C. Thompson, Deputy Chief Compliance Officer • Noreen M. Fierro, Anti-Money Laundering Compliance Officer • Jonathan D. Shain, Assistant Secretary • Claudia DiGiacomo, Assistant Secretary • John P. Schwartz, Assistant Secretary • Andrew R. French, Assistant Secretary • M. Sadiq Peshimam, Assistant Treasurer • Peter Parrella, Assistant Treasurer |
| MANAGER | Prudential Investments LLC | Gateway Center Three 100 Mulberry Street Newark, NJ 07102 | ||
| ||||
| INVESTMENT SUBADVISERS | LSV Asset Management Thornburg Investment | 155 North Wacker Drive 46th Floor Chicago, IL 60606 2300 North Ridgetop Road Santa Fe, NM 87506 | ||
| ||||
| DISTRIBUTOR | Prudential Investment Management Services LLC | Gateway Center Three 100 Mulberry Street Newark, NJ 07102 | ||
| ||||
| CUSTODIAN | PFPC Trust Company | 301 Bellevue Parkway Wilmington, DE 19809 | ||
| ||||
| TRANSFER AGENT | Prudential Mutual Fund Services LLC | PO Box 9658 Providence, RI 02940 | ||
| ||||
| INDEPENDENT REGISTERED PUBLIC ACCOUNTING FIRM | KPMG LLP | 345 Park Avenue New York, NY 10154 | ||
| ||||
| FUND COUNSEL | Sullivan & Cromwell LLP | 125 Broad Street New York, NY 10004 | ||
An investor should consider the investment objectives, risks, charges, and expenses of the Fund carefully before investing. The prospectus for the Fund contains this and other information about the Fund. An investor may obtain a prospectus by visiting our website at www.prudentialfunds.com or by calling (800) 225-1852. The prospectus should be read carefully before investing. |
| E-DELIVERY |
| To receive your mutual fund documents online, go to www.prudentialfunds.com/edelivery and enroll. Instead of receiving printed documents by mail, you will receive notification via e-mail when new materials are available. You can cancel your enrollment or change your e-mail address at any time by visiting the website address above. |
| SHAREHOLDER COMMUNICATIONS WITH DIRECTORS |
| Shareholders can communicate directly with the Board of Directors by writing to the Chair of the Board, Prudential International Value Fund, Prudential Investments, Attn: Board of Directors, 100 Mulberry Street, Gateway Center Three, Newark, NJ 07102. Shareholders can communicate directly with an individual Director by writing to the same address. Communications are not screened before being delivered to the addressee. |
| AVAILABILITY OF PORTFOLIO SCHEDULE |
| The Fund files its complete schedule of portfolio holdings with the Securities and Exchange Commission for the first and third quarters of each fiscal year on Form N-Q. The Fund’s Forms N-Q are available on the Commission’s website at www.sec.gov. The Fund’s Forms N-Q may also be reviewed and copied at the Commission’s Public Reference Room in Washington, D.C. Information on the operation and location of the Public Reference Room may be obtained by calling (202) 551-8090. The Fund’s schedule of portfolio holdings is also available on the Fund’s website as of the end of each fiscal quarter. |
| The Fund’s Statement of Additional Information contains additional information about the Fund’s Directors and is available without charge, upon request, by calling (800) 225-1852. |
Mutual Funds:
| ARE NOT INSURED BY THE FDIC OR ANY FEDERAL GOVERNMENT AGENCY | MAY LOSE VALUE | ARE NOT A DEPOSIT OF OR GUARANTEED BY ANY BANK OR ANY BANK AFFILIATE |

| Prudential International Value Fund | ||||||||||||
| Share Class | A | B | C | Z | ||||||||
NASDAQ | PISAX | PISBX | PCISX | PISZX | ||||||||
CUSIP | 743969503 | 743969602 | 743969701 | 743969800 | ||||||||
MF115E 0192549-00001-00
Item 2 – Code of Ethics – See Exhibit (a)
As of the end of the period covered by this report, the registrant has adopted a code of ethics (the “Section 406 Standards for Investment Companies – Ethical Standards for Principal Executive and Financial Officers”) that applies to the registrant’s Principal Executive Officer and Principal Financial Officer; the registrant’s Principal Financial Officer also serves as the Principal Accounting Officer.
The registrant hereby undertakes to provide any person, without charge, upon request, a copy of the code of ethics. To request a copy of the code of ethics, contact the registrant 800-225-1852, and ask for a copy of the Section 406 Standards for Investment Companies – Ethical Standards for Principal Executive and Financial Officers.
Item 3 – Audit Committee Financial Expert –
The registrant’s Board has determined that Mr. Stephen P. Munn, member of the Board’s Audit Committee is an “audit committee financial expert,” and that he is “independent,” for purposes of this Item.
Item 4 – Principal Accountant Fees and Services –
(a) Audit Fees
For the fiscal years ended October 31, 2010 and October 31, 2009, KPMG LLP (“KPMG”), the Registrant’s principal accountant, billed the Registrant $57,500 and $54,984, respectively, for professional services rendered for the audit of the Registrant’s annual financial statements or services that are normally provided in connection with statutory and regulatory filings.
(b) Audit-Related Fees
Not applicable for the fiscal year ended October 31, 2010. During the fiscal year ended October 31, 2009, KPMG, the Registrant’s principal accountant, billed the Registrant $3,115 for professional services rendered in connection with agreed upon procedures performed related to a custody conversion.
(c) Tax Fees
None.
(d) All Other Fees
None.
(e) (1) Audit Committee Pre-Approval Policies and Procedures
THE PRUDENTIAL MUTUAL FUNDS
AUDIT COMMITTEE POLICY
on
Pre-Approval of Services Provided by the Independent Accountants
The Audit Committee of each Prudential Mutual Fund is charged with the responsibility to monitor the independence of the Fund’s independent accountants. As part of this responsibility, the Audit Committee must pre-approve any independent accounting firm’s engagement to render audit and/or permissible non-audit services, as required by law. In evaluating a proposed engagement of the independent accountants, the Audit Committee will assess the effect that the engagement might reasonably be expected to have on the accountant’s independence. The Committee’s evaluation will be based on:
| • | a review of the nature of the professional services expected to be provided, |
| • | a review of the safeguards put into place by the accounting firm to safeguard independence, and |
| • | periodic meetings with the accounting firm. |
Policy for Audit and Non-Audit Services Provided to the Funds
On an annual basis, the scope of audits for each Fund, audit fees and expenses, and audit-related and non-audit services (and fees proposed in respect thereof) proposed to be performed by the Fund’s independent accountants will be presented by the Treasurer and the independent accountants to the Audit Committee for review and, as appropriate, approval prior to the initiation of such services. Such presentation shall be accompanied by confirmation by both the Treasurer and the independent accountants that the proposed services will not adversely affect the independence of the independent accountants. Proposed services shall be described in sufficient detail to enable the Audit Committee to assess the appropriateness of such services and fees, and the compatibility of the provision of such services with the auditor’s independence. The Committee shall receive periodic reports on the progress of the audit and other services which are approved by the Committee or by the Committee Chair pursuant to authority delegated in this Policy.
The categories of services enumerated under “Audit Services”, “Audit-related Services”, and “Tax Services” are intended to provide guidance to the Treasurer and the independent accountants as to those categories of services which the Committee believes are generally consistent with the independence of the independent accountants and which the Committee (or the Committee Chair) would expect upon the presentation of specific proposals to pre-approve. The enumerated categories are not intended as an exclusive list of audit, audit-related or tax services, which the Committee (or the Committee Chair) would consider for pre-approval.
Audit Services
The following categories of audit services are considered to be consistent with the role of the Fund’s independent accountants:
| • | Annual Fund financial statement audits |
| • | Seed audits (related to new product filings, as required) |
| • | SEC and regulatory filings and consents |
Audit-related Services
The following categories of audit-related services are considered to be consistent with the role of the Fund’s independent accountants:
| • | Accounting consultations |
| • | Fund merger support services |
| • | Agreed Upon Procedure Reports |
| • | Attestation Reports |
| • | Other Internal Control Reports |
Individual audit-related services that fall within one of these categories and are not presented to the Audit Committee as part of the annual pre-approval process will be subject to pre-approval by the Committee Chair (or any other Committee member on whom this responsibility has been delegated) so long as the estimated fee for those services does not exceed $50,000.
Tax Services
The following categories of tax services are considered to be consistent with the role of the Fund’s independent accountants:
| • | Tax compliance services related to the filing or amendment of the following: |
| • | Federal, state and local income tax compliance; and, |
| • | Sales and use tax compliance |
| • | Timely RIC qualification reviews |
| • | Tax distribution analysis and planning |
| • | Tax authority examination services |
| • | Tax appeals support services |
| • | Accounting methods studies |
| • | Fund merger support services |
| • | Tax consulting services and related projects |
Individual tax services that fall within one of these categories and are not presented to the Audit Committee as part of the annual pre-approval process will be subject to pre-approval by the Committee Chair (or any other Committee member on whom this responsibility has been delegated) so long as the estimated fee for those services does not exceed $50,000.
Other Non-audit Services
Certain non-audit services that the independent accountants are legally permitted to render will be subject to pre-approval by the Committee or by one or more Committee members to whom the Committee has delegated this authority and who will report to the full Committee any pre-approval
decisions made pursuant to this Policy. Non-audit services presented for pre-approval pursuant to this paragraph will be accompanied by a confirmation from both the Treasurer and the independent accountants that the proposed services will not adversely affect the independence of the independent accountants.
Proscribed Services
The Fund’s independent accountants will not render services in the following categories of non-audit services:
| • | Bookkeeping or other services related to the accounting records or financial statements of the Fund |
| • | Financial information systems design and implementation |
| • | Appraisal or valuation services, fairness opinions, or contribution-in-kind reports |
| • | Actuarial services |
| • | Internal audit outsourcing services |
| • | Management functions or human resources |
| • | Broker or dealer, investment adviser, or investment banking services |
| • | Legal services and expert services unrelated to the audit |
| • | Any other service that the Public Company Accounting Oversight Board determines, by regulation, is impermissible. |
Pre-approval of Non-Audit Services Provided to Other Entities Within the Prudential Fund Complex
Certain non-audit services provided to Prudential Investments LLC or any of its affiliates that also provide ongoing services to the Prudential Mutual Funds will be subject to pre-approval by the Audit Committee. The only non-audit services provided to these entities that will require pre-approval are those related directly to the operations and financial reporting of the Funds. Individual projects that are not presented to the Audit Committee as part of the annual pre-approval process will be subject to pre-approval by the Committee Chair (or any other Committee member on whom this responsibility has been delegated) so long as the estimated fee for those services does not exceed $50,000. Services presented for pre-approval pursuant to this paragraph will be accompanied by a confirmation from both the Treasurer and the independent accountants that the proposed services will not adversely affect the independence of the independent accountants.
Although the Audit Committee will not pre-approve all services provided to Prudential Investments LLC and its affiliates, the Committee will receive an annual report from the Fund’s independent accounting firm showing the aggregate fees for all services provided to Prudential Investments and its affiliates.
(e) (2) Percentage of services referred to in 4(b) – 4(d) that were approved by the audit committee –
One hundred percent of the services described in Item 4(b) was approved by the audit committee.
(f) Percentage of hours expended attributable to work performed by other than full time employees of principal accountant if greater than 50%.
The percentage of hours expended on the principal accountant’s engagement to audit the registrant’s financial statements for the most recent fiscal year that were attributed to work performed by persons other than the principal accountant’s full-time, permanent employees was 0%.
(g) Non-Audit Fees
Not applicable to Registrant for the fiscal years 2010 and 2009. The aggregate non-audit fees billed by KPMG for services rendered to the registrant’s investment adviser and any entity controlling, controlled by, or under common control with the investment adviser that provides ongoing services to the registrant for the fiscal years 2010 and 2009 was $0 and $0, respectively.
(h) Principal Accountant’s Independence
Not applicable as KPMG has not provided non-audit services to the registrant’s investment adviser and any entity controlling, controlled by, or under common control with the investment adviser that provides ongoing services to the registrant that were not pre-approved pursuant to Rule 2-01(c)(7)(ii) of Regulation S-X.
Item 5 – Audit Committee of Listed Registrants – Not applicable.
Item 6 – Schedule of Investments – The schedule is included as part of the report to shareholders filed under Item 1 of this Form.
Item 7 – Disclosure of Proxy Voting Policies and Procedures for Closed-End Management Investment Companies – Not applicable.
Item 8 – Portfolio Managers of Closed-End Management Investment Companies – Not applicable.
Item 9 – Purchases of Equity Securities by Closed-End Management Investment Company and Affiliated Purchasers – Not applicable.
Item 10 – Submission of Matters to a Vote of Security Holders – Not applicable.
Item 11 – Controls and Procedures
| (a) | It is the conclusion of the registrant’s principal executive officer and principal financial officer that the effectiveness of the registrant’s current disclosure controls and procedures (such disclosure controls and procedures having been evaluated within 90 days of the date of this filing) provide reasonable assurance that the information required to be disclosed by the registrant has been recorded, processed, summarized and reported within the time period specified in the Commission’s rules and forms and that the information required to be disclosed by the registrant has been accumulated and communicated to the registrant’s principal executive officer and principal financial officer in order to allow timely decisions regarding required disclosure. |
| (b) | There has been no significant change in the registrant’s internal control over financial reporting that occurred during the registrant’s most recent fiscal quarter of the period covered by this report that has materially affected, or is likely to materially affect, the registrant’s internal control over financial reporting. |
Item 12 – Exhibits
| (a) | (1) | Code of Ethics – Attached hereto as Exhibit EX-99.CODE-ETH | ||
| (2) | Certifications pursuant to Section 302 of the Sarbanes-Oxley Act – Attached hereto as Exhibit EX-99.CERT. | |||
| (3) | Any written solicitation to purchase securities under Rule 23c-1. – Not applicable. | |||
| (b) | Certifications pursuant to Section 906 of the Sarbanes-Oxley Act – Attached hereto as Exhibit EX-99.906CERT. | |||
SIGNATURES
Pursuant to the requirements of the Securities Exchange Act of 1934 and the Investment Company Act of 1940, the registrant has duly caused this report to be signed on its behalf by the undersigned, thereunto duly authorized.
| Registrant: | Prudential World Fund, Inc. |
| By: | /S/ DEBORAH A. DOCS | |
| Deborah A. Docs | ||
| Secretary | ||
| Date: | December 21, 2010 | |
Pursuant to the requirements of the Securities Exchange Act of 1934 and the Investment Company Act of 1940, this report has been signed below by the following persons on behalf of the registrant and in the capacities and on the dates indicated.
| By: | /S/ JUDY A. RICE | |
| Judy A. Rice | ||
| President and Principal Executive Officer | ||
| Date: | December 21, 2010 | |
| By: | /S/ GRACE C. TORRES | |
| Grace C. Torres | ||
| Treasurer and Principal Financial Officer | ||
| Date: | December 21, 2010 | |